
Third Quarter 2008
Financial Review
October 22, 2008

Forward-Looking Statements
and Non-GAAP Financial Information
The forward-looking statements, as defined in the applicable federal securities laws, being made today are subject to risks
and uncertainties. TSFG’s actual results may differ materially from those set forth in such forward-looking statements.
These statements include, but are not limited to, factors that may affect TSFG’s return goals, loan growth, loan sales,
customer funding growth, expense control, income tax rate, expected financial results for acquisitions, noninterest income,
adequacy of capital and future capital levels, factors that will affect credit quality and the net interest margin, effectiveness
of hedging strategies, risks and effects of changes in interest rates, effects of future economic conditions, and market
performance. Reference is made to TSFG’s reports filed with the Securities and Exchange Commission for a discussion of
factors that may cause such differences to occur. TSFG undertakes no obligation to release revisions to these forward-
looking statements or reflect events or circumstances after today’s presentation.
This presentation contains certain non-GAAP measures that exclude the impact of certain nonoperating items. TSFG
management uses these non-GAAP, or operating measures, in its analysis of TSFG’s performance. TSFG believes
presentations of financial measures excluding the impact of certain items provide useful supplemental information and
better reflect its core operating activities. Management uses operating measures, in particular, to analyze on a consistent
basis and over a longer period of time, the performance of which it considers to be its core operations.
Operating measures adjust GAAP information to exclude the effects of nonoperating items, such as gains or losses on
certain asset sales, early extinguishment of debt, employment contract buyouts, impairment charges, and other
nonoperating expenses. The limitations associated with utilizing operating measures are the risk that persons might
disagree as to the appropriateness of items comprising these measures and different companies might calculate these
measures differently. Management compensates for these limitations by providing detailed reconciliations between GAAP
and operating measures. These disclosures should not be considered an alternative to GAAP results. A reconciliation of
GAAP results and non-GAAP measures is provided in the Quarterly Financial Data Supplement on our web site,
www.thesouthgroup.com, in the Investor Relations section under Quarterly Earnings.

3Q08 Highlights
Maintained capital position with a 7.94% tangible
equity ratio
Continued proactive actions to resolve problem loans
Built allowance for credit losses to 1.97%
Improved liquidity position
Announced retirement of Mack Whittle as Chairman,
President & CEO by end of 2008
3Q08 Financial Results
8%
42%
54%
Effective tax rate
$(0.40)
$(22.6)
(49.3)
84.6
35.3
88.9
28.6
$95.6
3Q08
Exceeded NCOs by $9.2 million;
increased allowance to 1.97%
73.3
63.8
Provision for credit losses
41.3
45.8
Pre-tax, pre-provision
operating income*
$(0.20)
$(0.22)
Per diluted share*
(32.0)
(17.9)
Pre-tax operating loss*
$(14.5)
$(10.3)
Operating loss*
Higher loan collection, FDIC insurance,
and lower loan origination salary
deferrals
80.1
84.7
Operating noninterest
expenses*
Higher customer fee and wealth mgmt
income offset by lower mortgage
banking and OREO losses
28.6
30.3
Operating noninterest
income*
$100.2
2Q08
3Q08 NIM declined 16 bps to 3.08%
$92.7
Net interest income
Comments for 3Q08
1Q08
* Excludes non-operating items. Net loss totaled $25.0 million for 3Q08, $10.9 million for 2Q08, and $201.3 million for 1Q08. Net loss per diluted share totaled $(0.43) for 3Q08, $(0.23) for 2Q08, and $(2.78) for 1Q08. For non-operating items, see slide 15 for non-operating noninterest income and slide 16 for non-operating noninterest expenses. Reconciliations of GAAP to non-GAAP measures are provided on page 15 of the Quarterly Financial Data Supplement for 3Q08 available in the Investor Relations section of TSFG’s web site, www.thesouthgroup.com.
$ in millions, except per share data
Credit Quality Results
Residential construction and housing-related loans continue to be primary
stress
NCOs $75.4 million, or 2.87% of average loans annualized
$28.1 million related to loan sales and loans transferred to held for sale
$17.6 million from the recognition of previously-established specific
reserves on impaired loans as charge-offs
Provision of $84.6 million, a $20.8 million increase from 2Q08
Exceeds NCOs by $9.2 million
Built reserve to 1.97% (from 1.85% at 6/30/08)
Coverage of NPLs relatively unchanged at 0.84 times
NPAs increased to 2.83% of loans and foreclosed property
Ratio is 2.62%, excluding NPLs held for sale of $22.6 million
NPLs held for investment increased to $240.1 million, up from $220.2
million at 6/30/08
Loan sales:
$39.4
23.3
$16.1
Sales
Price
$71.7
45.8
$25.9
Legal
Balance
$22.6
22.6
$ --
Nonaccrual
Loans HFS
$28.1
$4.2
Total
20.6
1.9
Pending sale
$7.5
$2.3
Loans sold
3Q08
NCOs
Pre-Q3
NCOs
$ in millions
Loan and Credit Quality Composition
0.84%
$47.0
2.09%
$ 219
$10,476
Total, 6/30/08
1.16%
$147.4
$75.4
2.30%
$ 238
100%
$10,300
Total Loans HFI
4.64%
11.9
6.9
5.92%
36
6%
610
Mortgage**
1.69%
9.1
3.4
0.10%
1
6%
680
Indirect – sales
finance
0.71%
3.6
2.6
0.68%
5
8%
784
Home equity
2.16%
0.94%
9.03%
1.87%
1.05%
0.58%
0.97%
NAL %
of O/S
Balance
1.1
78.1
12.5
4.9
1.7
$24.5
YTD Net
Charge-
offs
$25.0
0.0
44.6
2.5
1.9
0.8
$12.7
QTD Net
Charge-
offs
1.14%
1.84%
1.76%
0.27%
1.15%
0.79%
0.44%
30-day
past due
%
22
20%
2,084
Completed
income property
11
6%
601
Commercial
development
$10,276
100
1,410
1,207
$ 2,824
Outstanding
Balance
1%
14%
12%
27%
% of O/S
Balance
1
Other**
7
Owner-occupied
CRE
$28
C&I
127
Residential
construction
$ 222
Nonaccrual
Loans HFI*
Total, 3/31/08
As of September 30, 2008, $ in millions
HFI = Held for Investment; 30-day past due % of outstanding balance excludes nonaccrual loans.
* Nonaccrual loans exclude nonaccrual loans held for sale of $22.6 million.
** Mortgage includes Consumer Lot Loans. Other includes Direct Retail and Unsecured Lines.
See page 9 of the Quarterly Financial Data Supplement for Commercial Real Estate loans by product type and by
geography. Commercial Development includes Commercial A&D and Commercial Construction. Residential
Construction includes Residential A&D, Residential Construction, Residential Condo, and Undeveloped Land.
Residential Construction by Geography
2.40%
$20.9
13.18%
$96
47%
$729
Total FL, 6/30/08
1.33%
$22.3
8.47%
$131
$1,550
Overall Total, 6/30/08
0.45%
$3.5
$2.5
2.14%
$10
34%
$485
Total SC, 9/30/08
0.29%
$0.8
2.93%
$15
32%
$499
Total SC, 6/30/08
0.52%
$0.6
6.43%
$21
21%
$322
Total NC, 6/30/08
1.87%
$70.2
$39.4
15.47%
$96
44%
$619
Total FL, 9/30/08
2.41%
$9.8
12.80%
$103
50%
$806
Total FL, 3/31/08
1.76%
$78.1
$44.6
9.03%
$127
100%
$1,410
Overall Total,
9/30/08
1.58%
$11.2
8.23%
$134
$1,628
Overall Total, 3/31/08
3.63%
$4.4
$2.7
6.93%
$21
22%
$306
Total NC,9/30/08
27.18%
12.36%
19.70%
10.63%
NAL %
of O/S
Balance
21.7
3.5
27.7
$17.3
YTD Net
Charge-
offs
11.2
1.1
16.2
$10.9
QTD Net
Charge-
offs
0.00%
3.12%
1.12%
2.43%
30-day
past due
%
39
14%
196
FL residential A&D
11
6%
90
FL residential
construction
65
$268
Outstanding
Balance
5%
19%
% of
Resid.
Constr.
17
FL residential
condo
$ 29
FL undeveloped
land
Residential Construction:
Nonaccrual
Loans
HFI*
As of September 30, 2008, $ in millions
30-day past due % of outstanding balance excludes nonaccrual loans.
* Nonaccrual loans exclude nonaccrual loans held for sale of $20 million.
Commercial Nonaccruals – Net Balance
$195
127
11
22
7
$28
9/30/08
Nonaccrual
Loan
Balance
$165
108
10
20
6
$21
Net Balance
Less
Specific
Reserve
67%
$30
$53
$248
Total Commercial
67%
76%
76%
67%
56%
Net Balance
as % of
Unpaid
Principal
2
4
26
Completed income
property
1
2
13
Commercial
development
163
8
$38
Unpaid
Principal (1)
36
1
$10
Cumulative
Net Charge-
offs (2)
19
Residential
construction
1
Owner-occupied
CRE
$7
C&I
9/30/08
Specific
Reserve (3)
$ in millions
-
=
-
=
(1) Outstanding balance at default
(2) Typically charge-down at nonaccrual to approximately 80% of most recent appraised value
(3) Additional specific reserves are established as necessary based on estimated holding period and current market and economic conditions;
recognized as charge-offs when realized. However, these amounts do not include the qualitative components within the overall allowance for
credit loans.
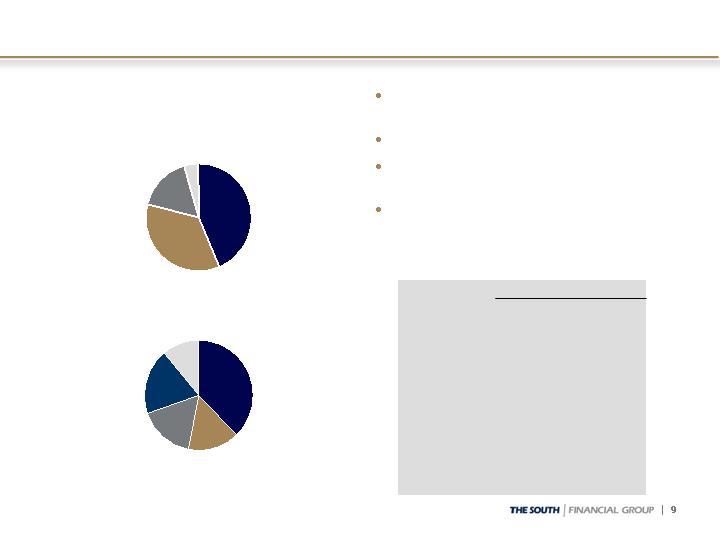
Home Equity Lines/Loans
SC, $343
43.6%
FL, $276
35.3%
NC, $131
16.7%
As of September 30, 2008, $ in millions
Originated by TSFG sales force
in-market; no broker loans
Strong FICO scores
Conservative LTV position and
usage amounts
Not pushed as a growth product
Home Equity Portfolio = HE Line and HE Loan portfolios
Geography based on customer address
Other, $34
4.4%
Summary Statistics
NA
NA
55%
WAvg Util %
70%
55%
45%
730
730
$784
Total
67%
71%
Orig WAvg
LTV %
20%
67%
2ndLien %
80%
33%
1stLien %
693
740
Jul 08 FICO
699
737
Orig FICO
$190
$594
Balance $
Loans
Lines
2008, $87
11.1%
2007, $152
19.3%
2006, $129
16.5%
2004 or before
$296
37.7%
2005, $120
15.4%
By Vintage
Total Home Equity Portfolio, $784
By Geography
Mortgage Banking Portfolio
Remains a small portion of
entire portfolio
$610 million
6% of total loans HFI
NAL increase of $7.7
million from Q2 to Q3
Increases from higher risk
portions of the portfolio
(Lot Loans and
Construction Perm)
Balances continue to
decline in both Lot Loans
and Construction Perm
products
As of September 30, 2008, $ in millions
Construction Perm:
$113.8
$113.3
$95.7
$78.8
Balance
0.38%
2.91%
5.86%
1.70%
30-89 DPD
0.00%
0.00%
0.00%
0.00%
90+ DPD
2.62%
4.11%
9.85%
15.98%
NAL %
$3.0
$4.7
$9.4
$12.6
NAL $
Lot Loans:
$311.4
$291.4
$266.2
$249.1
Balance
2.92%
5.34%
2.09%
3.84%
30-89 DPD
0.78%
1.03%
2.00%
2.34%
90+ DPD
1.92%
2.89%
4.07%
6.12%
NAL %
$6.0
$8.4
$10.8
$15.2
NAL $
SIVA* Alt-A:
$3.9
1.56%
1.87%
6.22%
$251.8
1Q08
$2.7
1.06%
1.17%
7.52%
$254.9
4Q07
$8.1
$8.3
NAL $
3.04%
2.94%
NAL %
0.69%
2.21%
90+ DPD
0.90%
1.89%
30-89 DPD
$267.9
$282.3
Balance
2Q08
3Q08
Mortgage Portfolio = Mortgage, Consumer Lot Loans, and Construction Perm products (excludes HE Loan)
* SIVA = Stated Income Verified Assets

Capital Position
$9.42
$9.63
Tangible book value
(assuming preferred stock
conversion)
8.61%
11.43%
9.71%
9.81%
12.54%
11.05%
7.94%
6/30/08
Actual
Capital in Excess of Well
Capitalized Minimum
$726
$277
$682
$965
$472
$920
$394
Pre-tax $
assuming 35%
tax rate **
5%
10%
6%
5%
10%
6%
TSFG target
6-6.5%
Well
Capitalized
Minimum
8.54%
11.55%
9.82%
9.70%
12.64%
11.14%
7.94%
9/30/08
Actual*
$180
Total risk-based
$472
Leverage
CAROLINA FIRST BANK
$443
Tier 1 risk-based
$307
Total risk-based
$627
Leverage
$598
Tier 1 risk-based
$256
Tangible equity to tangible
assets
THE SOUTH FINANCIAL
GROUP
After-tax
$
$ in millions
* Estimated
** For illustrative purposes only

Net Interest Income and Margin
0.02
0.5
Full-quarter impact of preferred stock offering
--
0.8
One additional day in quarter
(0.03)
(1.1)
Increase in nonaccrual interest reversals
(0.10)
(3.2)
Change in funding mix
(0.05)
(1.6)
Other, net
3.08%
$ 96.9
THIRD QUARTER 2008
Estimated impact from:
$101.5
Net
Interest
Income (FTE)
3.24%
SECOND QUARTER 2008
Net
Interest
Margin
$ in millions
4Q08 HEADWIND: Expect pressure from levels and/or pricing of customer funding,
maturing interest rate swaps, short-term movements in 3-month LIBOR, and recent cuts in
the Federal Funds target rate.

Customer Funding
25.3%
372
1,468
1,840
Time deposits < $100,000
(16.5)%
(357)
2,163
1,806
Money market
(0.8)%
(61)
7,496
7,435
Customer deposits
2.8%
15
537
552
Customer sweep accounts
Customer deposits:
(0.6)%
3.0%
(0.7)%
(3.2)%
(7.6)%
LQ %
Change
(36)
1,127
1,091
Interest-bearing
(1)
151
150
Savings accounts
45
1,480
1,525
Time deposits $100,000 or
more
$(46)
$8,033
$7,987
Total customer funding
$ (84)
$ Change
$1,107
6/30/08
Balance
$1,023
9/30/08
Balance
Noninterest-bearing
$ in millions
Customer funding reflects total deposits excluding brokered deposits plus customer
sweeps.
Wholesale Borrowings
29%
2%
19%
2%
--
2%
3%
1%
Actual
% of Total Assets
By Maturity
$4,713
40%
$3,984
$1,771
$959
$767
$487
Total wholesale
borrowings
--
25%
2,574
998
954
622
--
Brokered CDs
--
20%
19
--
5
14
--
Commercial paper
633
20%
298
298
--
--
--
FHLB advances
275
200
--
$ --
> 1 year
20%
20%
20%
20%
Policy
limit
275
226
480
$112
Total
--
453
3,627
$ --
Unused
capacity
--
26
--
Repurchase
agreements
--
375
$ 112
Over-
night
--
105
$ --
2 days
to 3
mos.
--
Other*
--
Fed Reserve and
T,T&L
$ --
Fed funds
purchased
4 to 12
mos.
As of September 30, 2008, $ in millions
* No parent company ($207 million) or bank ($68 million) exposure to capital markets
rollover risk for trust preferred securities and related obligations until 2033 for parent
company and 2012 for bank-level

Noninterest Income
$ Change
$(4.3)
--
(2.6)
(1.7)
(0.1)
(0.8)
(0.4)
--
(1.0)
0.1
0.1
$ 0.4
3Q08 vs.
2Q08
(0.1)
0.9
0.8
0.9
Merchant processing income, net
0.2
(0.2)
--
(0.8)
Gain/(loss) on real estate
$27.9
--
(0.7)
28.6
2.9
(0.2)
2.9
0.9
7.2
$14.8
3Q08
Non-operating items:
0.2
--
0.2
Gain/(loss) on certain derivative
activities
(0.3)
3.2
2.9
Bank-owned life insurance
(1.9)
1.9
--
Gain, Visa IPO share redemption
$ 1.3
$30.9
$32.2
Total noninterest income
0.1
7.0
7.1
Wealth management income*
0.4
1.5
1.9
Mortgage banking income
0.4
2.6
3.0
Other
1.7
28.6
30.3
Operating noninterest income
1.5
0.4
1.9
Gain/(loss) on securities
$ 0.8
2Q08 vs.
1Q08
$13.6
1Q08
$14.4
2Q08
Customer fee income*
$ in millions
*Together, over 70% of operating noninterest income

Noninterest Expenses
0.4
0.8
8.6
9.0
9.8
Occupancy
(0.2)
0.9
(3.0)
(3.2)
(2.3)
FAS 91 Salary Deferral (included in Salaries)
$ Change
$93.4
--
--
(0.1)
4.6
88.9
20.5
4.6
3.0
4.1
$46.9
3Q08
Non-operating items:
0.1
1.0
3.5
3.6
Professional fees
1.6
(0.7)
(0.9)
0.7
Other*
$(180.6)
$5.8
$268.2
$87.6
Total noninterest expenses
(188.4)
(0.6)
2.3
4.6
1.5
0.3
1.2
$1.1
2Q08 vs.
1Q08
--
188.4
--
Goodwill impairment
1.9
1.0
2.2
Loan collection and monitoring
0.6
2.1
2.4
FDIC insurance
(1.8)
20.8
22.3
Other
4.2
80.1
84.7
Operating noninterest expenses
--
0.5
(0.1)
(Gain) loss on early
extinguishment of debt
2.3
--
2.3
Employment contracts
$1.7
3Q08 vs.
2Q08
$44.1
1Q08
$45.2
2Q08
Salaries and employee benefits
$ in millions
* Other includes BankAtlantic conversion costs of $0.7 million for 2Q08 and Visa-related litigation recovery of
$(0.9) million for 1Q08.

Efficiency Improvement Project
Three fundamental objectives:
Increase revenue
Improve our customers’ experience
Manage expenses
Emphasis on improving the customer experience by
improving workflows, policies, and procedures
Specific examples include back office branch
operations, lending process redesign, centralized
procurement function
Outstanding commitment across the organization
Management support at the highest level
Started with 40 business leaders throughout company
Engage employees in on-going idea generation
Timing
Initial launch 4Q08 based on Phase I Analysis
1Q09 complete opportunity sizing
12-18 months to realize benefits

Current as of 10/21/08