Exhibit 99.3

First Quarter 2009
Financial Review
April 22, 2009

Forward-Looking Statements
and Non-GAAP Financial Information
The forward-looking statements, as defined in the applicable federal securities laws, being made today are subject to
risks and uncertainties. TSFG’s actual results may differ materially from those set forth in such forward-looking
statements. These statements include, but are not limited to, factors that may affect TSFG’s return goals, loan growth,
loan sales, customer funding growth, expense control, income tax rate, expected financial results for acquisitions,
noninterest income, adequacy of capital and future capital levels, factors that will affect credit quality and the net
interest margin, effectiveness of hedging strategies, risks and effects of changes in interest rates, effects of general
economic and financial market conditions, and market performance. Reference is made to TSFG’s reports filed with the
Securities and Exchange Commission for a discussion of factors that may cause such differences to occur. TSFG
undertakes no obligation to release revisions to these forward-looking statements or reflect events or circumstances
after today’s presentation.
This presentation contains certain non-GAAP measures, such as results excluding the impact of certain nonoperating
items and separation of the loan portfolio into core and non-core loans (based on TSFG’s ability to build/expand
banking relationships). TSFG management uses these non-GAAP, or operating measures, in its analysis of TSFG’s
performance. TSFG believes presentations of financial measures excluding the impact of certain items provide useful
supplemental information and better reflect its core operating activities. Management uses operating measures, in
particular, to analyze on a consistent basis and over a longer period of time, the performance of which it considers to be
its core operations. Operating measures adjust GAAP information to exclude the effects of nonoperating items, such as
gains or losses on certain asset sales, early extinguishment of debt, employment contract buyouts, impairment charges,
and other nonoperating expenses.
The limitations associated with utilizing operating measures are the risk that persons might disagree as to the
appropriateness of items comprising these measures and different companies might calculate these measures
differently. Management compensates for these limitations by providing detailed reconciliations between GAAP and
operating measures. These disclosures should not be considered an alternative to GAAP results. A reconciliation of GAAP
results and non-GAAP measures is provided in the Quarterly Financial Data Supplement on our web site,
www.thesouthgroup.com, in the Investor Relations section under Quarterly Earnings.

1Q09 Financial Overview
Net loss driven by continued credit stress, primarily in residential construction
and mortgage
Strong tangible common equity ratio of 6.05%, or 7.51% reflecting conversion
of Mandatorily Convertible Preferred Stock (mandatory by May 1, 2011)
Continued proactive and realistic approach to credit
Built allowance for credit losses to 2.84%
Recognized NCOs of $109.1 million
Net interest margin of 2.83%, down 14 bps linked quarter, as anticipated
Contraction in December/January following 4Q08 Fed funds rate cuts
NIM expanded in February/March to the 2.90% range
Expect gradual increase as higher cost CDs renew and loan repricing efforts
continue
Refocusing on core relationship loans
Segregated portfolio into core relationship loans and non-core loans based
on our ability to build/expand banking relationships
Plan to grow core and decrease non-core
Linked-quarter, core grew 0.3% while non-core declined 8.6%
Controlled operating noninterest expenses, down $2.5 million (2.7%) linked-
quarter or $6.0 million (7.1%) excluding credit-related expenses and FDIC
insurance premiums
1Q09 also include Project NOW expenses of $1.3 million
Maintained overall liquidity position
Core deposits up 2.8% linked-quarter
1Q09 Operating Results
$6.5 million included for value of 2.5 million shares
issued as inducement for early conversion of
preferred
9.4
16.4
Preferred stock dividends
10%
40%
Effective tax rate
$(1.08)
$(88.6)
(120.5)
142.6
22.1
89.6
26.7
$85.0
1Q09
Exceeded NCOs by $33.6 million; increased
allowance to 2.84%
122.9
Provision for credit losses
28.0
Pre-tax, pre-provision
operating income*
$(1.01)
Per diluted share*
(94.9)
Pre-tax operating loss*
$(75.0)
Operating loss available to
common shareholders*
Measures to improve efficiency and streamline cost
structure (12/08 staff reductions, Project NOW, and
other expense initiatives)
92.1
Operating noninterest
expenses*
Lower customer spending in weak economy with
fewer customer transactions; seasonally lower
28.5
Operating noninterest
income*
$91.6
4Q08
1Q09 NIM declined 14 bps to 2.83% reflecting Fed
rate cuts and credit-related pressures; outlook
improving
Net interest income
Comments
* Excludes non-operating items. Net loss available to common shareholders totaled $90.8 million for 1Q09 and $319.4 million for 4Q08. Net loss per
diluted share totaled $(1.10) for 1Q09 and $(4.29) for 4Q08. See slide 23 for non-operating items, including a 4Q08 goodwill impairment charge of
$237.6 million. Reconciliations of GAAP to non-GAAP measures are provided on page 15 of the Quarterly Financial Data Supplement for 1Q09 available
in the Investor Relations section of TSFG’s web site, www.thesouthgroup.com.
$ in millions, except per share data
1Q09 – Unusual Items
X
(1.3)
Increase in FDIC insurance premiums
X
(1.9)
Loss on nonperforming loans HFS and OREO on final
resolution of those assets
Included in:
(6.5)
(1.3)
$1.1
(0.7)
$(2.9)
Pre-Tax
Amount
Increase to preferred stock dividends for value of
shares issued as inducement for early conversion
Non-Operating Items:
Operating Items:
X
Gain on certain derivative activities, up from a $0.3
loss for 4Q08, due to hedge ineffectiveness
X
Costs associated with Project NOW
X
Noninterest
Income
X
Noninterest
Expenses
Loss on repurchase of auction rate securities as
discussed in Form 10-K
Loss on securities, includes anticipated $2.5 million
for recognition of OTTI on a real estate investment
$ in millions
OTTI = Other Than Temporary Impairment
HFS = Held for Sale
OREO = Other real estate Owned

Initiatives Underway
Measure success with internal segmentation of “core/non-core” loans
Linked-quarter, core grew 0.3% while non-core declined 8.6%
Improve loan pricing (Project NOW workstream)
Completed training with commercial sales teams
Clarify target customers and methods of delivering value
Showing early results through improved loan yields through the use of loan
floors on 36% of new production in 1Q09
Noninterest expense control
Linked-quarter, down $2.5 million or $6.0 million excluding credit-related
expenses and FDIC insurance premiums
December 2008 staff reductions; FTEs down 3% linked-quarter
No merit increases for all employees for 1 year
50% reduction in 401K contribution match
Corporate campus evaluation; recommendation to Board expected in May
Phase 1 of Project NOW underway
8 workstreams, each with employee “owner”
Anticipated annual pre-tax operating benefits of $18-$20 million (revenue
improvements of $12-$13 million and expense savings of $5-$7 million);
approximately $10-$11 million on track for realization in second half of 2009
1Q09 noninterest expenses included associated costs of $1.3 million
New leadership in mortgage
Added Tom Holland as Director of Mortgage to take advantage of current
mortgage opportunities
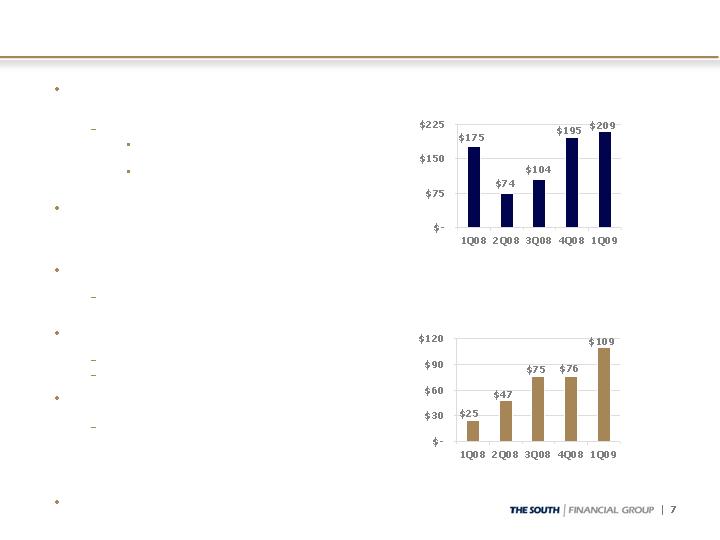
Credit Quality Overview
Residential construction and housing-related
loans continue to be primary stress across
entire footprint
Reduction since 3/31/08:
Residential construction down $393
million, or 24%
Lot loans and construction perm
down $159 million, or 39%
Recession showing signs of impacting CRE,
C&I and consumer loan categories, but not at
the pace or severity of residential
construction impact
NCOs $109.1 million, or 4.36% of average
loans annualized
Cumulative losses incurred during cycle
(1Q08 to 1Q09) of $332 million
Provision of $142.6 million, a $19.7 million
increase from 4Q08
Exceeds NCOs by $33.6 million
Built reserve to 2.84%
NPAs increased to 5.08% of loans
and foreclosed property
Commercial NALs carried at 63%
after deducting specific reserves vs.
67% at 12/31/08*
Limited loan sale activity in 1Q09
Gross Nonaccrual Loan Inflows
$ in millions
Net Charge-Offs
$ in millions
* See slide 28 in the Appendix.
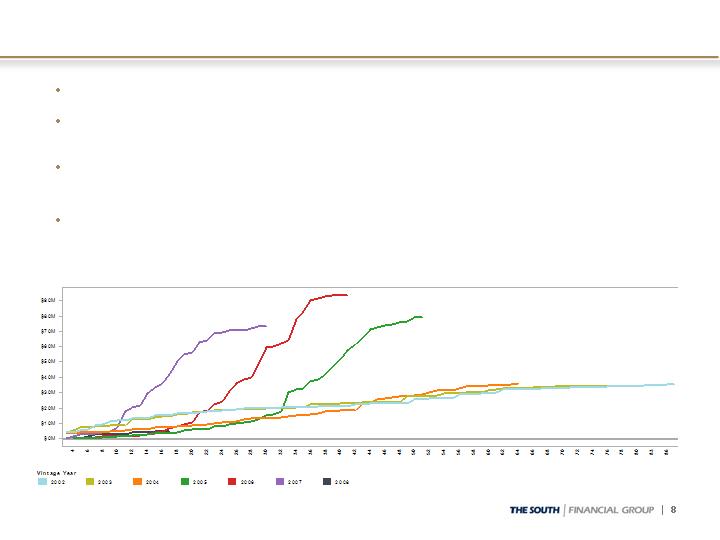
Cumulative Commercial Losses by Vintage
Time to Default*
* Reflects # of months between origination date and earliest default date
2007
2006
2005
$ in millions
Cumulative
Loss $
Vintages shown below reflect commercial portfolio (including residential construction)
2005 to 2007 Vintages: Weaker performance with earlier defaults, higher cumulative
losses, and higher nonaccrual loans
New Chief Credit Officer hired 1Q07; risk management processes changed in 2nd half
of 2007; significant number of new senior risk management leaders recruited during
late 2007/early 2008
Currently 2008 vintage appears to be on a similar curve as pre-2005

Commercial Portfolio By Vintage
* Specific Reserves of $67 million at 3/31/09 allocated to these NALs
$ in millions
Difference in vintages
evident when look at
cycle to date losses and
NALs
“Pre 2005” and
“After mid-2007”:
Consistent and
more stable
“2005 to mid-
2007”: Weaker
C&I-related appear
relatively consistent
across all vintages
Income properties
stable across vintages
except for FL “2005 to
mid-2007”
FL Residential ADC for
“2005 to mid-2007”:
Weakest
performing
Balance, net of
nonaccruals, of
$219.6 million
represents 43% of
$507 million start
of cycle balance
Have addressed
over half of start
of cycle balance
*
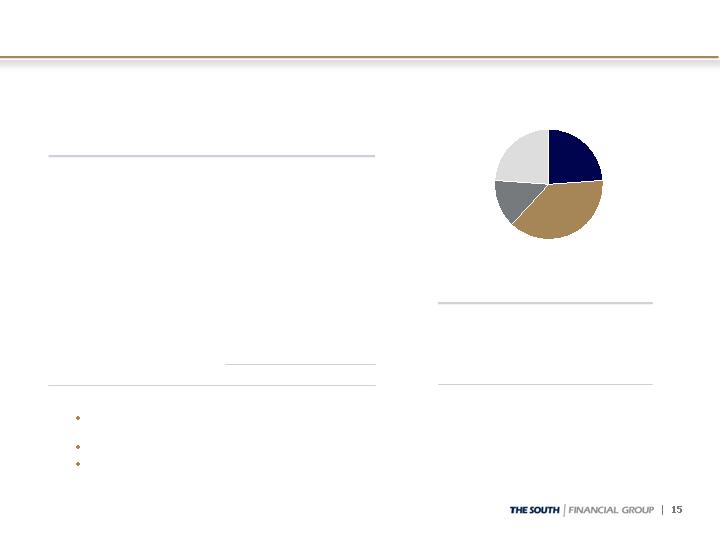
Loan and Credit Quality Composition
2.22%
$76.1
3.43%
$349
$10,192
12/31/08
1.16%
$75.4
2.31%
$238
$10,300
9/30/08
1.99%
$109.1
4.24%
$423
100%
$9,987
Total Loans HFI
7.44%
26.3
9.90%
53
5%
535
Mortgage**
1.62%
4.8
0.09%
1
6%
574
Indirect – sales finance
0.90%
3.2
0.77%
6
8%
813
Home equity
2.09%
0.16%
14.65%
8.17%
3.24%
1.50%
1.58%
NAL %
of O/S
Balance
$47.0
1.4
32.6
1.9
13.4
3.4
$22.1
QTD Net
Charge-
offs
0.84%
1.50%
4.99%
1.50%
1.32%
0.69%
1.23%
30-day
past due
%
72
22%
2,202
Completed income
property
49
6%
606
Commercial
development
$10,476
91
1,235
1,285
$ 2,646
Outstanding
Balance
1%
12%
13%
27%
% of O/S
Balance
--
Other**
19
Owner-occupied CRE
$42
C&I
181
Residential construction
$219
Nonaccrual
Loans
HFI*
6/30/08
As of March 31, 2009, $ in millions
HFI = Held for Investment; 30-day past due % of outstanding balance excludes nonaccrual loans. See page 9 of the Quarterly Financial Data Supplement
for Commercial Real Estate loans by product type and by geography. Commercial Development includes Commercial A&D and Commercial Construction.
Residential Construction includes Residential A&D, Residential Construction, Residential Condo, and Undeveloped Land.
* Nonaccrual loans exclude nonaccrual loans held for sale of $12.8 million.
** Mortgage includes Consumer Lot Loans. Other includes Direct Retail and Unsecured Lines.
Mortgage Banking Portfolio
Remains a small portion of
entire portfolio
$535 million
5% of total loans HFI
NALs decrease of $6 million
from 4Q08 to 1Q09
$15 million of Lot Loan charge-
offs (or 88% of total)
concentrated in 4
developments where
originations departed from
product model; current
expectations for remaining loan
losses in these developments of
$8-$10 million
Reduced balances in Lot Loans
and Construction Perm
products by $159 million
(39%) in last year
Mortgage restructured loans of
$3 million (excluded from
NALs) from working with
borrowers to do loan
modifications
$ in millions
Mortgage Portfolio = Mortgage, Consumer Lot Loans, and Construction Perm products (excludes HE Loan)
* SIVA = Stated Income Verified Assets
$ 9.4
$ 12.6
$ 12.8
$ 10.2
NAL $
$ 10.8
$ 15.2
$ 29.9
$ 21.8
NAL $
$ 8.1
$ 8.3
$ 16.3
$ 20.9
NAL $
$ 1.0
20.02%
0.00%
5.22%
$ 64.0
$ 8.9
13.20%
1.84%
6.34%
$225.5
$ 1.8
5.59%
3.41%
7.90%
$290.7
4Q08
$ 0.1
9.85%
0.00%
5.86%
$ 95.7
$ 1.6
4.07%
2.00%
2.09%
$266.2
$ 2.1
3.04%
0.69%
0.90%
$267.9
2Q08
Construction Perm:
$ 78.8
$ 47.4
Balance
1.70%
2.60%
30-89 DPD
0.00%
0.00%
90+ DPD
15.98%
21.90%
NAL %
$ 2.2
$ 3.5
NCO $
Lot Loans:
$249.1
$198.0
Balance
3.84%
5.95%
30-89 DPD
2.34%
0.16%
90+ DPD
6.12%
11.00%
NAL %
$ 0.9
$ 17.1
NCO $
SIVA* Alt-A:
$ 2.0
$ 5.6
NCO $
2.94%
7.25%
NAL %
2.21%
0.51%
90+ DPD
1.89%
8.67%
30-89 DPD
$282.3
$289.3
Balance
3Q08
1Q09
Loan Growth: Core vs. Non-Core
(8.1%)
(142)
1,763
1,621
Commercial and small business
CORE RELATIONSHIP LOANS
(2.0%)
(8.6%)
12.5%
(13.1%)
(10.5%)
0.3%
(1.9%)
7.9%
%
Growth
(230)
2,685
2,455
Total Non-Core
NON-CORE LOANS
$(205)
8
(29)
(67)
25
(23)
$ 48
$
Growth
7,507
7,532
Total Core
$10,192
$9,987
Total Loans
636
569
Indirect – sales finance
222
193
Lot loans
1,202
1,179
Consumer and mortgage
72
$6,353
3/31/09
Balance
64
$6,305
12/31/08
Balance
Other consumer and mortgage
Commercial and small business
Trend
$ in millions
Capital Position
10.95%
11.02%
TCE plus reserves to risk-
weighted assets
9.30%
8.99%
TCE plus reserves to risk-
weighted assets
Assuming conversion of Mandatorily Convertible Preferred:**
7.51%
7.84%
Tangible common equity to
tangible assets
$8.59
$9.40
Common tangible book value per
share
9.49%
12.59%
10.88%
11.22%
14.35%
12.86%
6.05%
12/31/08
Actual
$501
$202
$471
$734
$407
$704
Capital in Excess of Well
Capitalized Minimum
After-tax $
5%
10%
6%
5%
10%
6%
Well
Capitalized
Minimum
8.79%
11.75%
10.10%
10.55%
13.53%
12.10%
6.05%
3/31/09
Actual*
Total risk-based
Leverage
CAROLINA FIRST BANK
Tier 1 risk-based
Total risk-based
Leverage
Tier 1 risk-based
Tangible common equity
(TCE) to tangible assets
THE SOUTH FINANCIAL GROUP
$ in millions
* Estimated
** Assumes full conversion of $190 million of Mandatorily Convertible Preferred at $6.50 per common share fixed conversion ratio (automatically
converts into common stock on May 1, 2011) and excludes CPP Preferred

Capital Position
Tangible common equity to tangible assets of 6.05%
Does not include Mandatorily Convertible Preferred Stock (MCPS) of $190 million,
or 7.51% reflecting conversion
View as key lever to increase common equity since automatically converts on May
1, 2011 at fixed price of $6.50; conversion is assumed when looking at common
tangible book value per share
Approximately $60 million has already converted to date
1Q09 dividends include $6.5 million for value of 2.5 million shares issued as an
inducement in lieu of discounted remaining dividends for early conversion of $45
million
TSFG participation in Capital Purchase Program (U.S. Treasury Investment)
Received $347 million on December 5, 2008
Quarterly dividend of $5.2 million, including accretion of warrants
Contributed to ability to originate loans to customers
In 1Q09, originated approximately 3,714 new loans and renewals of existing
credits totaling approximately $796 million ($732 million for commercial and
$64 million for consumer)
April 2009 repurchase of $25 million of REIT preferred at 66% of par
Modest capital impact since limited capital credit (40% for Tier 2 in 2009; steps
down 20% annually)
Funding replaced through non-capital wholesale sources; expect annual earnings
benefit of approximately $700,000 based on current rates (REIT preferred yield of
350 bps over 3 month LIBOR)
$8.1 million net non-operating gain (non-taxable) in 2Q09 which benefits tangible
equity
Net Interest Income and Margin
(0.05)
(1.6)
Increase in nonperforming
loans and charge-offs
(0.11)
(3.2)
Loan repricing not fully
offset by deposit repricing
--
(1.1)
Lower earning assets
--
(1.5)
2 fewer days in quarter
(0.02)
(0.5)
Maturing prime-based
swaps
0.04
1.2
CPP preferred stock
2.83%
$86.2
FIRST QUARTER 2009
Estimated impact from:
$92.9
Net
Interest
Income
(FTE)
2.97%
FOURTH QUARTER 2008
Net
Interest
Margin
$ in millions
NIM contraction in December/January following 4Q08 Fed fund rate cuts then gradual
improvement for February/March as deposits repriced downward
Expect pressures related to credit issues to continue
Expect favorable impacts from downward repricing of CDs, improved loan and deposit
pricing, and reduction of non-core (lower margin) loans
Customer CDs/IRAs By Maturity Date
3.89%
745
Beyond 4Q09
3.87%
448
4Q09
3.41%
1,175
3Q09
3.11%
$758
2Q09
Avg.
Yield
%
Balance
$
Maturing in
2Q09
24%
3Q09
38%
4Q09
14%
Beyond 4Q09
24%
NIM Roll forward
Customer Funding
2.8 %
115
4,144
4,259
Core deposits
(6.5)%
(122)
1,864
1,742
Time deposits < $100,000
3.0 %
55
1,834
1,889
Money market
(1.5)%
(112)
7,497
7,385
Customer deposits
(21.5)%
(106)
493
387
Customer sweep accounts
Customer deposits:
(2.7)%
(7.1)%
6.8 %
1.9 %
2.6 %
LQ %
Change
20
1,079
1,099
Interest-bearing
13
190
203
Savings accounts
(105)
1,489
1,384
Time deposits $100,000 or
more
$(218)
$7,990
$7,772
Total customer funding
$ 27
$
Change
$1,041
12/31/08
Balance
$1,068
3/31/09
Balance
Noninterest-bearing
$ in millions
Growth in lower-cost core deposit accounts, up 2.8%
Decline in CDs with focus on more rational but still competitive pricing
Customer deposits reflect seasonal decrease in public funds, down $52 million
Wholesale Borrowings
By Maturity
$3,942
$3,730
$1,562
$2,168
Total wholesale
borrowings
--
1,843
694
1,149
Brokered CDs
--
--
--
--
Commercial paper
881
468
404
64
FHLB advances
264
200
--
$ --
> 1 year
264
200
758
$197
Total
--
1,037
2,024
$ --
Unused
Secured
capacity
--
Repurchase
agreements
758
$ 197
1 year or
less
Other
Fed Reserve and
T,T&L
Fed funds
purchased
As of March 31, 2009, $ in millions
$4.4 billion
at 12/31/08
Strong parent company
liquidity position
Parent company cash of
$194 million at 3/31/09
No debt maturities until
2033
Expected annual dividends
of $40 million (preferred
and common)
Cash sufficient to satisfy
all fixed obligations over
the next 5 years; provides
subsidiary bank capital
support as needed
Parent Company Liquidity
Secured borrowing capacity decline due to revised Federal Reserve collateral
requirements (impacting all borrowers), partially offset by increases in free securities
and FHLB capacity

Operating Noninterest Income
(0.3)
0.2
1.5
1.0
1.2
Mortgage banking income
$ Change
$(1.7)
(1.3)
1.4
(1.4)
(0.1)
0.3
$(0.8)
1Q09 vs.
4Q08
(0.3)
0.9
0.7
0.6
Merchant processing income, net
$26.7
2.3
1.1
2.5
6.6
$12.4
1Q09
1.1
--
(0.3)
Gain/(loss) on certain derivative
activities
(0.7)
3.2
3.9
Bank-owned life insurance
(0.4)
7.0
6.3
Wealth management income
(0.3)
2.6
3.6
Other
$(2.1)
$28.8
$28.4
Operating noninterest income*
$(1.2)
1Q09 vs.
1Q08
$13.6
1Q08
$13.2
4Q08
Customer fee income
$ in millions
Together, customer fee and wealth mgmt income comprise approximately 70% of
operating noninterest income
Reflect lower customer spending in weak economy with fewer customer transactions
1Q09 deposit service charges seasonally weaker
* Excludes non-operating items. Total noninterest income was $23.7 million for 1Q09, $30.0 million for 4Q08, and $31.1 million for 1Q08. See slide 27
for non-operating items. Reconciliations of GAAP to non-GAAP measures are provided on page 15 of the Quarterly Financial Data Supplement for 1Q09
available in the Investor Relations section of TSFG’s web site, www.thesouthgroup.com.
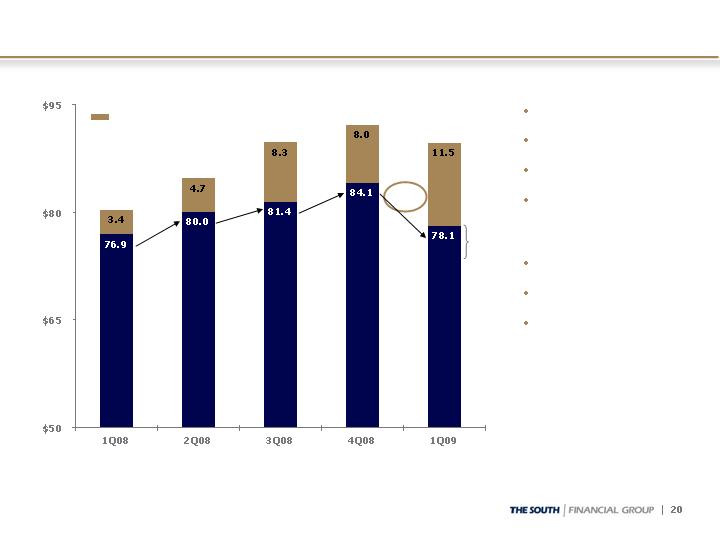
Operating Noninterest Expenses
8.1
3.5
3.4
8.0
11.5
Credit-related and FDIC insurance
2.6
1.3
2.1
3.4
4.7
FDIC insurance
(0.1)
0.4
0.2
(0.3)
0.1
(Gain) loss on sale of OREO
(2.4)
(4.2)
14.2
16.0
11.8
Other
1.3
1.0
--
0.3
1.3
Costs for Project NOW
1.4
(1.0)
15.0
17.4
16.4
Occupancy and FF&E
1.0
--
3.5
4.5
4.5
Professional fees
1.2
(6.0)
76.9
84.1
78.1
Operating, excl. credit-related & FDIC
1.8
1.5
--
0.3
1.8
Loss on nonperforming loans HFS
3.8
0.3
1.1
4.6
4.9
Loan and foreclosed asset
1.2
0.2
(3.0)
(2.0)
(1.8)
FAS 91 Salary Deferral (incl. in Salaries)
$ Change
$89.6
$44.1
1Q09
$9.3
$(0.1)
1Q09 vs.
1Q08
$(2.5)
$80.3
$92.1
Operating noninterest expenses*
$(1.8)
1Q09 vs.
4Q08
$44.2
1Q08
$45.9
4Q08
Salaries and employee benefits
$ in millions
* Excludes non-operating items. Total noninterest expense were $90.2 million for 1Q09, $342.1 million for 4Q08, and $268.4 million for 1Q08. See
slide 27 for non-operating items. Reconciliations of GAAP to non-GAAP measures are provided on page 15 of the Quarterly Financial Data Supplement
for 1Q09 available in the Investor Relations section of TSFG’s web site, www.thesouthgroup.com.
Credit-related costs* and FDIC insurance
Noninterest Expense Control
* Credit–related costs include loan and foreclosed asset expense, loss on nonperforming loans held for sale, and gain/loss on sale of OREO.
For non-operating items, see slide 28 and reconciliations of GAAP to non-GAAP measures provided on page 15 of the Quarterly Financial Data available
on TSFG’s web site, www.thesouthgroup.com, in the Investor Relations section.
$80.3
$84.7
$89.7
$92.1
$ in millions
+$3.1
+$2.7
Operating Noninterest Expenses
- $6.0
$89.6
+$1.4
Includes
$1.3 for
Project
NOW
costs
2,430
2,505
2,535
2,572
2,485
# Employees (FTEs):
Expense Reductions
12/08 staff
reductions
No merit pay
increases
Reduction in 401K
contribution
Project NOW
efficiencies
Headwinds
FDIC insurance;
special assessment
Loan and foreclosed
asset expense
Non-operating
charges related to
corporate campus
under construction

Expectations for 2009
Operating environment and results will remain challenging for all of 2009
Credit losses remain elevated second quarter and begin to decline slowly in second
half of the year; provisioning depends on continuing economic developments
Near-term pressure on margin in first half of year, followed by expansion of margin
as pricing initiatives on both the loan and deposit side begin to show results
Continued headwinds from loan collection costs and FDIC insurance
Potential one-time charges arising from ultimate corporate campus decision
Continue to evaluate the realizability of the net deferred tax asset throughout 2009
for both book and regulatory purposes
Run-off of non-core loan portfolio, partially offset by growth in lending to core
customers; similar to 1Q09 levels for non-core in each quarter over remainder of
2009
Positive impact from Project NOW and other expense initiatives
Potential for FDIC deposit transactions if market overlap promotes efficiency and
product set improves customer funding measures
Focus on cross sell; customer satisfaction; other measures that support our strategic
positioning

1Q09 Non-Operating Items
Non-operating noninterest expenses:
Non-operating noninterest income:
--
(1.1)
--
Loss on derivative collateral
--
1.9
--
Gain on VISA IPO share redemption
$(4.29)
$(319.4)
$(343.4)
--
(9.6)
(237.6)
(1.8)
--
1.6
$(94.9)
4Q08
(0.5)
0.1
(Gain) loss on early extinguishment of debt
--
(0.7)
Loss on repurchase of auction rate securities
$(2.78)
$(201.4)
$(217.8)
0.8
--
(188.4)
0.4
$(32.0)
1Q08
$(90.8)
Net loss (GAAP) available to common
shareholders
$(124.1)
Pre-tax (GAAP)
$(120.5)
Pre-tax operating loss
--
Visa-related litigation
$(1.10)
Per diluted share
--
Goodwill impairment
--
Employment contracts and severance
(3.0)
1Q09
Gain (loss) on securities
Reconciliations of GAAP to non-GAAP measures are provided on page 15 of the Quarterly Financial Data Supplement for 1Q09 available in the Investor
Relations section of TSFG’s web site, www.thesouthgroup.com.
$ in millions, except per share data
Credit Quality Trends - Commercial
4.93%
$24.5
11.24%
$142
$1,263
4Q08
1.76%
$44.6
9.03%
$127
$1,410
3Q08
1.45%
$2.6
4.85%
$29
$608
4Q08
0.27%
$2.5
1.87%
$11
$601
3Q08
1.32%
$10.3
2.67%
$59
$2,203
4Q08
1.15%
$1.9
1.05%
$22
$2,084
3Q08
1.19%
$1.8
1.17%
$15
$1,271
4Q08
0.79%
$0.8
0.58%
$ 7
$1,207
3Q08
1.01%
$17.6
1.32%
$36
$2,723
4Q08
0.44%
$12.7
0.97%
$28
$2,824
3Q08
1Q09
1Q09
1Q09
1Q09
1Q09
14.65%
8.17%
3.24%
1.50%
1.58%
NAL % of
O/S
Balance
$32.6
$1.9
$13.4
$3.4
$22.1
QTD Net
Charge-offs
4.99%
1.50%
1.32%
0.69%
1.23%
30-day past
due %
$72
$2,202
Completed income
$49
$606
Commercial
development
$1,235
$1,285
$ 2,646
Outstanding
Balance
$19
Owner-occupied CRE
$42
C&I
$181
Residential construction
Nonaccrual
Loans HFI
$ in millions
HFI = Held for Investment; 30-day past due % of outstanding balance excludes nonaccrual loans.

Credit Quality Trends - Consumer
1.50%
$1.4
0.16%
$ --
$91
1Q09
Other**
3.04%
$0.4
0.26%
$ --
$95
4Q08
9.46%
$11.7
10.17%
$59
$580
4Q08
4.64%
$5.1
5.92%
$36
$610
3Q08
1.42%
$2.4
1.01%
$8
$813
4Q08
0.71%
$2.6
0.68%
$5
$784
3Q08
2.21%
$5.0
0.11%
$1
$636
4Q08
1.69%
$3.4
0.10%
$1
$680
3Q08
3Q08
1Q09
1Q09
1Q09
7.44%
$26.3
9.90%
$53
$535
Mortgage**
1.62%
$4.8
0.09%
$1
$574
Indirect–sales
finance*
0.90%
$3.2
0.77%
$6
$813
Home equity
0.94%
NAL % of
O/S
Balance
$1.9
QTD Net
Charge-offs
1.84%
30-day past
due %
$100
Outstanding
Balance
$ 1
Nonaccrual
Loans HFI
$ in millions
HFI = Held for Investment; 30-day past due % of outstanding balance excludes nonaccrual loans.
* Ceased production in Florida in 5/08; effective 1/09, offered only through full relationship dealerships in NC and SC
** Mortgage includes Consumer Lot Loans. Other includes Direct Retail and Unsecured Lines.
Residential Construction by Geography
4.93%
$24.5
11.24%
$142
$1,263
12/31/08
1.76%
$44.6
9.03%
$127
$1,410
9/30/08
4.19%
$3.4
6.20%
$28
37%
$450
Total SC, 3/31/09
5.35%
$2.0
4.85%
$22
35%
$439
12/31/08
2.10%
$3.9
10.45%
$30
23%
$290
12/31/08
6.63%
$22.5
25.20%
$132
42%
$521
Total FL, 3/31/09
6.13%
$18.6
16.94%
$90
42%
$534
12/31/08
4.99%
$32.6
14.65%
$181
100%
$1,235
Overall Total,
3/31/09
1.33%
$22.3
8.47%
$131
$1,550
6/30/08
3.09%
$6.7
8.20%
$21
21%
$264
Total NC, 3/31/09
17.08%
38.78%
17.23%
29.75%
NAL %
of O/S
Balance
--
3.2
8.0
$11.3
QTD Net
Charge-
offs
11.74%
5.20%
1.03%
8.87%
30-day
past due
%
26
12%
151
FL residential A&D
22
5%
56
FL residential
construction
78
$236
Outstanding
Balance
6%
19%
% of
Resid.
Constr.
13
FL residential condo
$71
FL undeveloped land
FL Residential Construction:
Nonaccrual
Loans HFI
As of March 31, 2009, $ in millions
30-day past due % of outstanding balance excludes nonaccrual loans.
See slide 27 for detail for NC and SC.
Residential Construction by Geography
SC Residential Construction:
--%
1.5
10.50%
10
8%
94
SC residential condo
2.60%
0.2
5.45%
4
6%
76
SC residential
construction
10.35%
1.7
7.33%
12
13%
162
SC residential A&D
0.08%
$ --
1.65%
$ 2
10%
$118
SC undeveloped land
4.19%
$3.4
6.20%
$28
37%
$450
Total SC, 3/31/09
5.35%
$2.0
4.85%
$22
35%
$439
12/31/08
3.09%
$6.7
8.20%
$21
21%
$264
Total NC, 3/31/09
2.10%
$3.9
10.43%
$30
23%
$290
12/31/08
2.16%
19.46%
9.02%
0.54%
NAL %
of O/S
Balance
--
2.6
4.0
$0.1
QTD Net
Charge-
offs
--%
1.06%
4.18%
1.95%
30-day
past due
%
14
12%
158
NC residential A&D
7
3%
35
NC residential
construction
11
$60
Outstanding
Balance
1%
5%
% of
Resid.
Constr.
--
NC residential condo
$ --
NC undeveloped land
NC Residential Construction:
Nonaccrual
Loans HFI
As of March 31, 2009, $ in millions
30-day past due % of outstanding balance excludes nonaccrual loans.
Commercial Nonaccruals – Net Balance
$363
181
49
72
19
$42
3/31/09
Nonaccrual
Loan
Balance
$296
153
34
60
16
$33
Net
Balance
Less
Specific
Reserve
63%
$67
$108
$471
Total Commercial
63%
60%
67%
69%
55%
Net
Balance
as % of
Unpaid
Principal
12
17
89
Completed
income property
15
7
56
Commercial
development
242
24
$60
Unpaid
Principal1
61
5
$18
Cumulative
Net
Charge-
offs2
28
Residential
construction
3
Owner-occupied
CRE
$9
C&I
3/31/09
Specific
Reserve3
$ in millions
-
=
-
=
1 Outstanding balance at default
2 Typically charge-down at nonaccrual to approximately 80% of most recent appraised value
3 Additional specific reserves are established as necessary based on estimated disposal costs, estimated holding period and current market and
economic conditions; recognized as charge-offs when realized. However, these amounts do not include the qualitative components within the
overall allowance for credit loans.
67% at
12/31/08
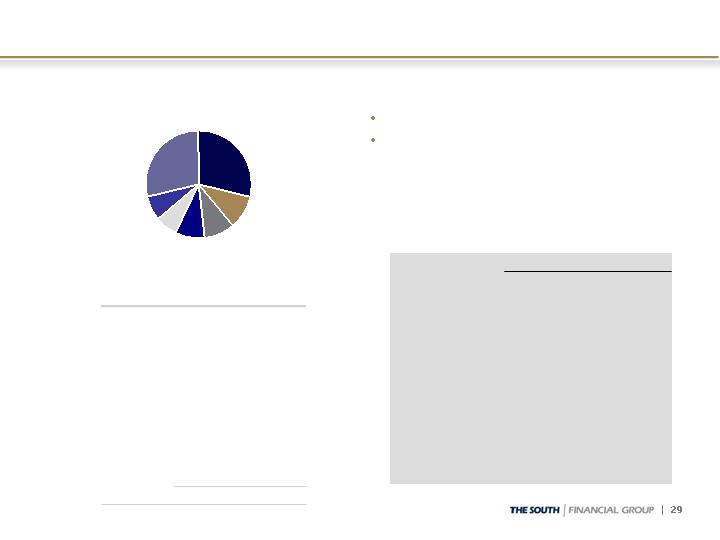
Indirect – Sales Finance
As of March 31, 2009, $ in millions
In 5/08, ceased production in Florida
Effective 1/09, offered only through
full relationship dealerships in NC and
SC
Toyota
29%
Summary Statistics
66%
70%
61%
New %
34%
30%
39%
Used %
$711
$479
$232
3/08 Balance
66%
34%
693
722
$574
Total
70%
60%
Foreign %
30%
40%
Domestic %
687
700
Current FICO
717
729
Orig FICO
$336
$238
3/09 Balance
FL
NC/SC
30-day Past Dues, By Auto Make (Top 10)
Total, $574 million or 6% of loans
By Auto Make
2.43%
16
Hyundai
2.27%
13
Scion
1.77%
$474
Top 10
1.41%
17
Jeep
1.92%
22
Nissan
1.60%
39
Dodge
1.58%
42
Ford
1.64%
51
Kia
2.15%
52
Chevrolet
1.66%
55
Honda
1.74%
$167
Toyota
30-day %
O/S$
Honda
10%
Ford
7%
Other
29%
Chevrolet
9%
Dodge
7%
Kia
9%
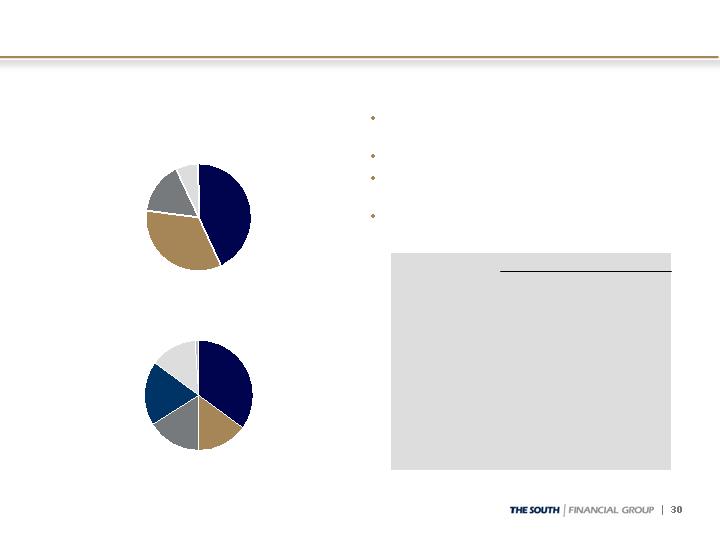
Home Equity Lines/Loans
SC, $350
43%
FL, $279
34%
NC, $132
16%
As of March 31, 2009, $ in millions
Originated by TSFG sales force in-
market; no broker loans
Strong FICO scores
Conservative LTV position and usage
amounts
Not pushed as a growth product
Home Equity Portfolio = HE Line and HE Loan portfolios
Geography based on customer address
Other, $52
7%
Summary Statistics
NA
NA
70%
WAvg Util %
70%
56%
44%
720
728
$813
Total
66%
70%
Orig WAvg LTV
%
17%
66%
2ndLien %
83%
34%
1stLien %
703
725
Current FICO
710
731
Orig FICO
$172
$641
Balance $
Loans
Lines
2008, $118
14%
2007, $155
19%
2006, $127
16%
2004 or before
$284, 35%
2005, $121
15%
By Vintage
Total, $813 million or 8% of loans
By Geography
2009, $8
1%

Current as of 4/21/09