Second Quarter 2009
Financial Review
July 22, 2009

Forward-Looking Statements
and Non-GAAP Financial Information
We caution you that this presentation contains certain forward-looking statements within the meaning of Section 27A of the Securities Act of 1933, as
amended, and Section 21E of the Securities Exchange Act of 1934, as amended, including certain plans, expectations, goals, projections, and
statements, which are subject to numerous assumptions, risks, and uncertainties. The use of words such as "anticipates", "estimates", "expects",
“illustrates”, "intends", "plans", and "believes", among others, generally identify forward-looking statements. However, these words are not the
exclusive means of identifying such statements. Forward-looking statements can be identified by the fact that they do not relate strictly to historical
or current facts.
Actual results could differ materially from those contained or implied by such statements for a variety of factors including: loan deterioration could be
worse than expected due to a number of factors such as the underlying value of the collateral could prove less valuable than otherwise assumed and
assumed cash flows may be worse than expected; changes in economic conditions; movements in interest rates; competitive pressures on product
pricing and services; success and timing of other business strategies; the nature, extent, and timing of governmental actions and reforms, including
existing and potential future restrictions and limitations imposed in connection with the Troubled Asset Relief Program’s voluntary Capital Purchase
Plan or otherwise under the Emergency Economic Stabilization Act of 2008; and the relative success of anticipated capital actions.
Additional factors that could cause results to differ materially from those described above can be found in TSFG’s 2008 Annual Report on Form 10-K,
including in the discussion under "Risk Factors", and documents subsequently filed by TSFG with the Securities and Exchange Commission.
Reference is made to TSFG’s reports filed with the Securities and Exchange Commission for a discussion of factors that may cause such differences to
occur. TSFG undertakes no obligation to release revisions to these forward-looking statements or reflect events or circumstances after today’s
presentation.
This presentation contains certain non-GAAP measures, such as results excluding the impact of certain nonoperating items. TSFG management uses
these non-GAAP, or operating measures, in its analysis of TSFG’s performance. TSFG believes presentations of financial measures excluding the impact
of certain items provide useful supplemental information and better reflect its core operating activities. Management uses operating measures, in
particular, to analyze on a consistent basis and over a longer period of time, the performance of which it considers to be its core operations.
Operating measures adjust GAAP information to exclude the effects of nonoperating items, such as gains or losses on certain asset sales, early
extinguishment of debt, employment contract buyouts, impairment charges, and other nonoperating expenses.
The limitations associated with utilizing operating measures are the risk that persons might disagree as to the appropriateness of items comprising
these measures and different companies might calculate these measures differently. Management compensates for these limitations by providing
detailed reconciliations between GAAP and operating measures. These disclosures should not be considered an alternative to GAAP results. A
reconciliation of GAAP results and non-GAAP measures is provided in the Quarterly Financial Data Supplement on our web site,
www.thesouthgroup.com, in the Investor Relations section under Quarterly Earnings.

2Q09 Financial Overview
Net loss available to common shareholders of $(111.5) million, or $(101.9) million
operating loss
Smaller, more focused balance sheet from sales and reductions of non-core loans
and securities (total assets down $697 million linked-quarter to $12.6 billion)
Period-end core deposit growth of 2.4% linked-quarter (representing growth in each
of the last 3 quarters)
Net interest margin improved by 13 bps linked quarter to 2.96%
Operating noninterest income increased 3.7% linked-quarter, driven primarily by
increases in mortgage banking income
Continued reductions in controllable operating noninterest expenses, although
credit-related costs and FDIC insurance increased
Loan loss reserve increased to 3.11% of total loans
Successful execution of the first phase of our capital plan with a 6/30/09 Tier 1
capital ratio of 12.36% and tangible common equity ratio of 6.07%, or 7.60%
reflecting conversion of the convertible preferred
Period-end common shares increased to 160.2 million due to the issuance of 75
million common shares in June offering (additional 10 million in July from
underwriters’ over-allotment)
Capital Plan: Update
API completed 7/1/09 ($3.1
million); other sales in process
Expect $15 million
Sale of Ancillary Businesses
Completed in June; automatically
converts to common upon
shareholder approval (expected in
3Q09)
$94.5 million
Privately negotiated Mandatory Convertible
Exchange1
Requires shareholder approval
referenced above
Expect $95.5 million
Public Tender for Mandatory Convertible
Exchange2
Requires shareholder approval
referenced above
Expect $20 - $30
million
Exchange Common for Hybrid Securities2
$75 million completed in June and
$10 million in July (underwriters’
over-allotment)
$85 million gross
proceeds
Common Equity Issuance
Tier 1 Common
Impact
Status/Timing
Description
1
2
3
1 Participants received contingent mandatorily convertible preferred shares that automatically convert, subject to certain limitations, into 24 million shares of common stock upon shareholder approval of common shares issued upon conversion and an increase in authorized shares (shareholder meeting expected to be held 3Q09)
² Subject to shareholder approval to increase authorized shares
4
5
Additional Capital Actions
Moved $150 million to Carolina First Bank to bolster bank-level capital ratios
Preferred dividend savings of approximately $35 million on mandatory convertible exchanges
Reduction in non-core loans and securities of approximately $700 million during 2Q09; estimated
Tier 1 Common benefit (using SCAP 4% requirement) of more than $20 million
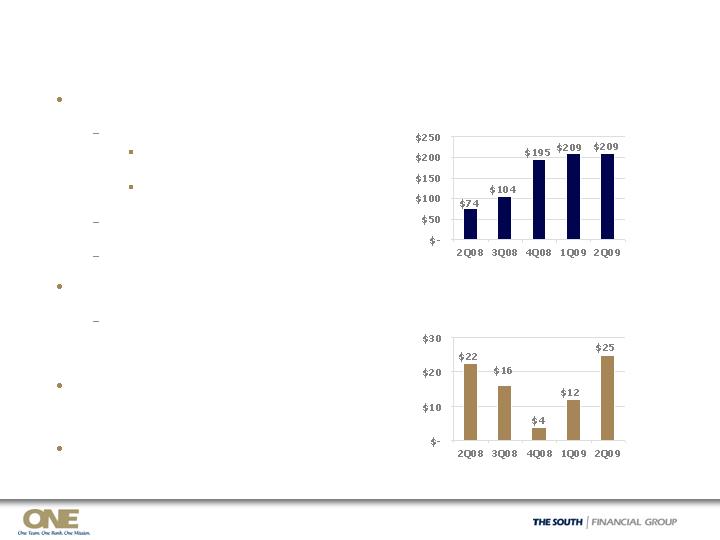
Asset Quality Overview
6/30/09 NPAs of $560.7 million, a $47.8
million increase linked-quarter
Commercial NALs:
Declined approximately $50
million in FL
Increased by $98 million in SC
and NC as expected
Lot loans and consumer NALs
declined for the 2nd quarter in a row
OREO up by $20 million
2Q09 NCOs $120.6 million, or 4.91% of
average loans annualized
2Q09 proceeds from problem loan
sales of $25 million (vs. $12 million
for 1Q09)
2Q09 provision of $131.3 million; loan
loss reserve increased to 3.11% at
6/30/09
Proactive revaluation of OREO carrying
values to reflect market declines
Gross Nonaccrual Loan Inflows
$ in millions
Proceeds from Problem Loan Sales
$ in millions

Loan and Credit Quality Composition
2.22%
$76.1
3.43%
$349
$10,192
12/31/08
1.16%
1.99%
1.86%
1.28%
4.64%
2.01%
3.54%
2.71%
4.68%
0.88%
0.91%
1.37%
30-Day
Past
Due %
$229.7
2.2
37.5
7.7
8.0
85.1
16.4
28.6
5.2
$39.0
YTD Net
Charge-
Offs
$109.1
4.24%
$423
$9,987
3/31/09
$75.4
$120.6
0.9
11.2
4.5
3.1
52.5
14.4
15.2
1.8
$17.0
QTD Net
Charge-
Offs
2.31%
$238
$10,300
9/30/08
4.99%
$465
100%
$9,306
Total Loans HFI
9.68%
49
6%
505
Mortgage1
0.23%
1
3%
286
Indirect – sales finance
0.61%
5
9%
811
Home equity
0.09%
16.55%
6.95%
3.64%
1.84%
3.15%
NAL %
of O/S
Balance
78
23%
2,135
Completed income
property
40
6%
585
Commercial
development
87
1,153
1,315
$ 2,429
O/S
Balance
1%
12%
14%
26%
% of
O/S
Balance
--
Other1
24
Owner-occupied CRE
$77
C&I
191
Residential construction
Nonaccrual
Loans HFI
As of June 30, 2009, $ in millions
HFI = Held for Investment; 30-day past due % of outstanding balance excludes nonaccrual loans. Commercial Development includes Commercial A&D
and Commercial Construction. Residential Construction includes Residential A&D, Residential Construction, Residential Condo, and Undeveloped Land.
1 Mortgage includes Consumer Lot Loans of $178 million. Other includes Direct Retail and Unsecured Lines.
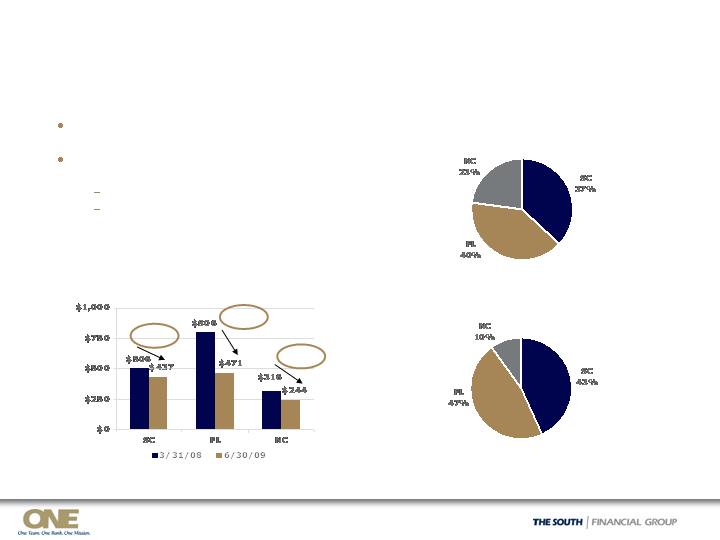
Residential Construction
BY GEOGRAPHY:
Outstanding
Performing Loans1
Nonaccrual Loans
Decline in Outstanding Balance
$ in millions
1 Reflects outstanding loan balances net of nonaccrual loans
Reduced $476 million, or 29%, since 3/31/08
Nonaccrual loans increased 5% linked-quarter
($10 million)
FL down $42 million
Coastal SC up $44 million
As of June 30, 2009
- 14%
- 42%
- 23%
$962 million
$191 million
Mortgage Banking Portfolio
NALs decrease of $4 million
linked-quarter; second
consecutive qtr of declines
Decline in Lot Loan charge-
offs as nearing end of
“cleanup” in 4 developments
where originations departed
from product model
Reduced balances in Lot Loans
and Construction Perm by
$209 million (49%) since Y/E
2007
Mortgage restructured loans
of $10.6 million (excluded
from NALs) from working with
borrowers to do loan
modifications
$ in millions
1 SIVA = Stated Income Verified Assets
$ 3.5
$ 10.2
21.90%
0.00%
2.60%
$ 47.4
$ 17.1
$ 21.8
11.00%
0.16%
5.95%
$198.0
$ 5.6
$ 20.9
7.25%
0.51%
8.67%
$289.3
1Q09
$ 12.6
$ 12.8
$ 10.0
NAL $
$ 15.2
$ 29.9
$ 20.8
NAL $
$ 8.3
$ 16.3
$ 18.0
NAL $
$ 1.0
20.02%
0.00%
5.22%
$ 64.0
$ 8.9
13.20%
1.84%
6.34%
$225.5
$ 1.8
5.59%
3.41%
7.90%
$290.7
4Q08
Construction Perm:
$ 78.8
$ 38.2
Balance
1.70%
4.07%
30-89 DPD
0.00%
0.00%
90+ DPD
15.98%
26.17%
NAL %
$ 2.2
$ 1.7
NCO $
Lot Loans:
$249.1
$178.2
Balance
3.84%
4.86%
30-89 DPD
2.34%
0.27%
90+ DPD
6.12%
11.68%
NAL %
$ 0.9
$ 6.5
NCO $
SIVA1Alt-A:
$ 2.0
$ 3.1
NCO $
2.94%
6.26%
NAL %
2.21%
2.73%
90+ DPD
1.89%
1.68%
30-89 DPD
$282.3
$288.4
Balance
3Q08
2Q09
Completed Income Property Portfolio
SC, $795
37%
FL, $862
40%
NC, $395
19%
As of June 30, 2009
Well-diversified by property type
Granular exposures, with average loan
size of $0.5 million; weighted average
time to maturity of 37.8 months
Some performance weakening due to
economic conditions
Other, $83
4%
0.3%
0.4
Office
3.1%
11.2
Other
2.1%
1.4
Medical
1.3%
5.1
Retail
3.6%
2.9%
4.1%
4.6%
6.3%
7.4%
NAL %
of O/S
Balance
$77.7
Total
8.0
Mixed Use
8.8
Industrial
11.2
Hotel
12.9
Residential 1-4 fam.
$18.7
Multi-Family
NALs
Residential
$204, 9%
Retail
$398, 19%
Mixed Use
$275, 13%
By Property Type
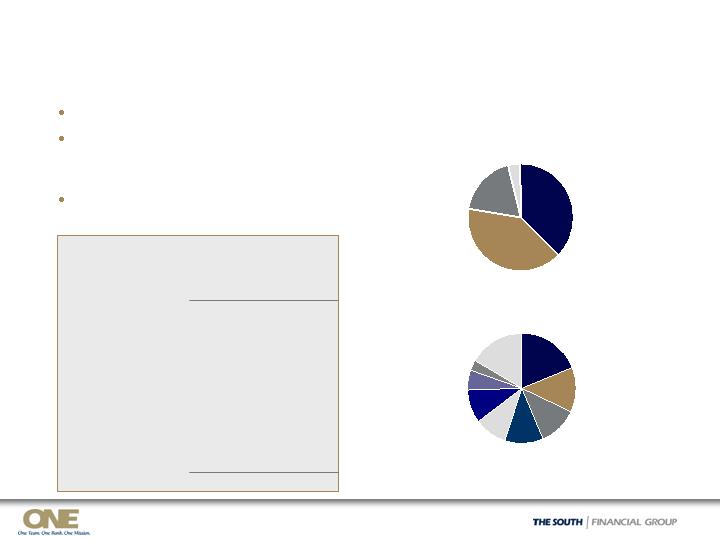
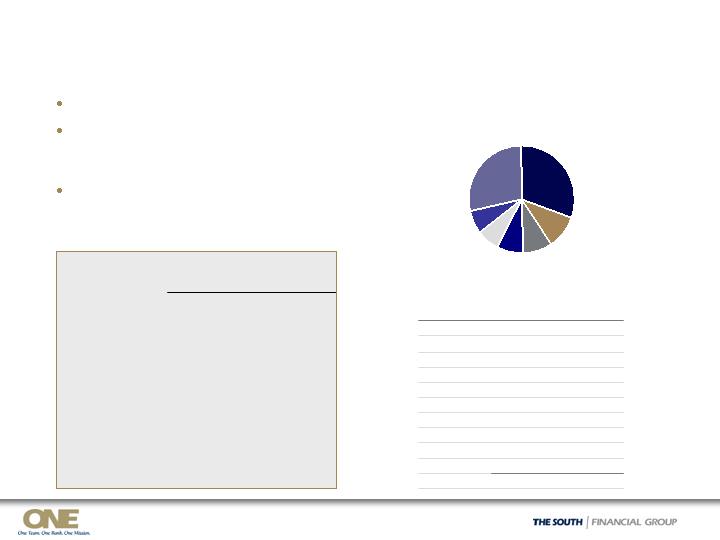
Total $2,135 million, or 23% of loans
By Geography
Multi-Family
$251, 12%
Hotel
$243, 11%
Industrial
$213, 10%
Office
$127, 6%
Other
$357, 17%
Medical
$67, 3%
Nonaccrual Loans
By Property Type
$ in millions
Shared National Credits
Plan to reduce non-core SNCs
Exiting deals when restructured
Amendments to reduce
commitments and improve
credit dynamics
In 2Q09, liquidated or entered into
contracts to sell approximately $90
million for a loss of $4.4 million
Lead agent banks based on # of
commitments
Top 3:
Bank of America, 37%
Wachovia, 28%
JPMorgan, 5%
TSFG is not lead agent on any
SNCs
1 Excludes approximately $25 million in loans held for sale at June 30, 2009, subsequently liquidated in July
Committed:
Outstanding:1
SNCs, Period-End
$1,233
982
$251
$722
601
$121
1Q09
$(128)
$1,105
Total
(128)
854
Non-core
$ --
$251
Core
$(123)
$599
Total
(121)
480
Non-core
$ (2)
$119
Core
$
Change
2Q09
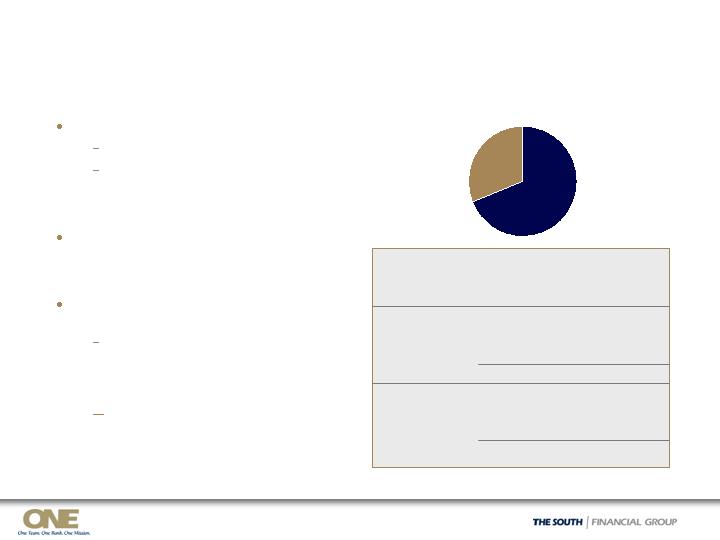
SNCs Outstanding, $599 million1
By Category
As of June 30, 2009, $ in millions
C&I, $412
69%
CRE, $187
31%
Other Real Estate Owned
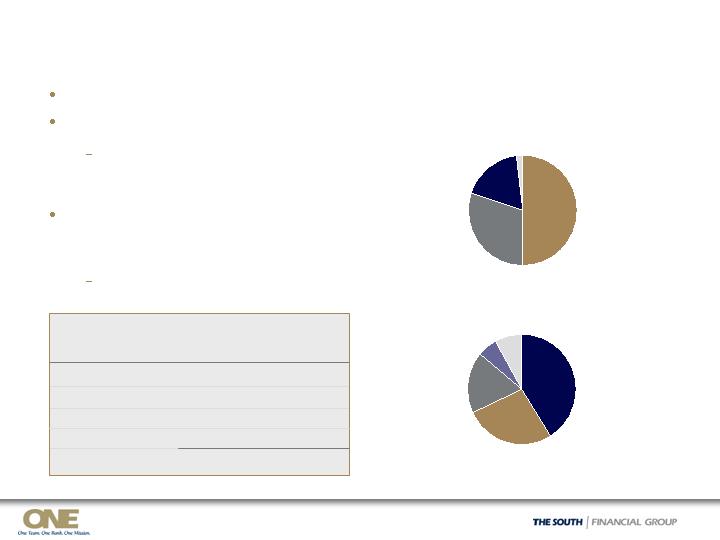
OREO, $93.9 million1
By Geography
As of June 30, 2009
2Q09 losses on OREO of $12.9 million
In 2Q09, sold $12.4 million with losses
on sale of $2.7 million
$1.8 million of the losses were on
one residential subdivision valued
and foreclosed 12 months ago
In view of market changes, proactively
revalued OREO older than 12 months
and also changed policy to 70% of
appraised value vs. previous 80%
Resulted in $10.2 million loss in
OREO write-downs during 2Q09
(12)
(3)
(8)
- OREO sales
OREO Flows
44
32
27
+ Additions
(10)
--
--
- Write downs
$94
$74
$45
Ending balance
$26
4Q08
$74
$45
Beginning balance
2Q09
1Q09
# of Months in OREO
FL, 50%
NC, 30%
SC, 18%
Other, 2%
0-3 mos,
41%
Note: Numbers may not add due to rounding 1 Based on $ balances in OREO; geography reflects property zip code
3-6 mos,
27%
6-9 mos, 18%
9-12 mos, 6%
>12 mos,
8%
$ in millions
2Q09 Operating Results
$(1.08)
$(1.12)
Per diluted share1
OREO reappraisals/policy change to write properties
down to 70% of appraised value; loss on sale of loans
2.0
22.4
OREO/LHFS losses
Exceeded NCOs by $10.7 million; allowance at 3.11%
142.6
131.3
Provision for credit losses
$14 million for the value of common shares issued as
inducement for early conversion (vs. $6.5 million 1Q09)
16.4
21.8
Preferred stock dividends and
other
40%
39%
Effective tax rate
91.0
$(101.9)
(130.5)
0.8
23.2
90.4
27.7
$85.9
2Q09
22.1
Pre-tax, pre-provision operating
income1
24.1
Pre-tax, pre-credit operating
income1
Issuance of 75 million shares on June 24, 2009
82.2
Weighted avg. shares
(120.5)
Pre-tax operating loss1
$(88.6)
Operating loss available to
common shareholders1
$4.2 million increase from loan collection and foreclosed
asset/FDIC insurance; all other down $1.4 million
87.6
Operating noninterest expenses,
excluding OREO/LHFS losses1
Higher mortgage banking income
26.7
Operating noninterest income1
$85.0
1Q09
2Q09 NIM increased 13 bp to 2.96%
Net interest income
Comments
1 Excludes non-operating items. Net loss available to common shareholders totaled $(111.5) million for 2Q09 and $(90.8) million for 1Q09. Net loss per
diluted share totaled $(1.23) for 2Q09 and $(1.10) for 1Q09. See slide 23 for non-operating items. Reconciliations of GAAP to non-GAAP measures
are provided on page 15 of the Quarterly Financial Data Supplement for 2Q09 available in the Investor Relations section of TSFG’s web site,
www.thesouthgroup.com.
In millions, except per share data
2Q09 – Unusual Items
X
(9.5)
Loss on nonmortgage loans HFS ($4.4 for SNC sales, $0.5 gain for
indirect loan sale, and $5.5 on write down and transfer of 1 loan to
OREO)
X
(2.5)
Goodwill impairment related to non-banking subsidiaries
X
(0.8)
Severance charges, including amounts for 72 FTEs to be eliminated
effective 3Q09 (notified in June)
X
(5.7)
FDIC special assessment
X
(17.4)
Impairment of long-lived assets (corporate campus $15.9,
branch/office closings $0.9, airplane $0.6)
X
3.0
Net gain on extinguishment of debt ($8.3 gain on repurchase of
REIT preferred stock; $5.4 loss on early repo termination)
Included in:
(14.0)
$(12.9)
$ 4.6
Pre-Tax
Amount
Inducement for early conversion of preferred stock, compared to
$6.5 million in 1Q09 (EPS purposes only; no capital impact)
Non-Operating Items:
Operating Items:
X
Loss on OREO, including policy change to write down all OREO to
70% of appraised value
X
Noninterest
Income
Noninterest
Expenses
Gain on securities, net of other than temporary impairment of $0.8
$ in millions
OREO = Other Real Estate Owned; HFS = Held for Sale; SNC = Shared National Credits
Capital Position
7.43%
5.31%
5.64%
Tier 1 common to risk-weighted
assets
11.93%
9.81%
9.30%
TCE plus reserves to risk-
weighted assets
8.79%
11.75%
10.10%
10.55%
13.53%
12.10%
6.05%
3/31/09
Actual
10.37%
13.74%
12.45%
7.88%
6/30/09
Pro Forma2
5%
10%
6%
5%
10%
6%
Well
Capitalized
Minimum
9.17%
12.55%
11.01%
10.30%
13.65%
12.36%
6.07%
6/30/09
Actual1
Total risk-based
Leverage
CAROLINA FIRST BANK
Tier 1 risk-based
Total risk-based
Leverage
Tier 1 risk-based
Tangible common equity (TCE) to
tangible assets
THE SOUTH FINANCIAL GROUP
$ in millions
1 Estimated
2 Reflects the issuance of 10 million common shares from underwriters’ over-allotment (net proceeds of $9.45 million), conversion of
Series 2009 preferred into 24 million common shares ($94.5 million), conversion of remaining $95.5 million of Series 2008 Preferred
into common, and exchange of $25 million of hybrid capital instruments into common
Smaller, More Focused Balance Sheet
$1,014
$13,602
$13,285
$12,588
Total assets
$3,750
1,280
2,130
2,685
$7,507
4Q08
(765)
2,455
1,920
Total non-core loans HFI
(180)
2,124
1,950
Securities
$(555)
$3,730
$3,195
Wholesale borrowings
52
1,174
1,332
Other
$(121)
Change
vs. YE ‘08
$7,532
1Q09
$7,386
Total core loans HFI
2Q09
$ in millions
Period-End Assets
2Q09 Reductions of Non-Core Assets
Approximately $25 million in HFS at 6/30/09
for transactions that closed in July
$(4.4) million
$90 million
Non-core loans – Liquidation of
Shared National Credits
Closed in June
$0.5 million
$230 million
Non-core loans – Sale of indirect
auto loans
$5.4 million
Gain/(loss)
Terminated $75 million in long-term
repurchase agreements (4.3% rate) for a
loss of $5.4 million
$120 million
Securities – Government agencies
(3.6% yield)
Approx.
Amount
Comments
Description
Net Interest Income and Margin
Repricing Opportunity – Customer CDs
2.28%
236
1Q10
3.54%
904
Beyond 1Q10
3.15%
660
4Q09
3.37%
1,171
3Q09
Avg.
Yield
%
Balance
$
Maturing in
Continued Growth in Core Deposits1
$ in billions
+2.4
+2.8
+1.8
-10.5
-1.3
% LQ
Growth
0.02
--
Sale of securities
0.06
2.0
Change in wholesale
funding rate and volume;
other
0.08
2.5
Change in customer
funding rate and volume
0.02
0.6
Decrease in nonaccrual
loan interest reversals
--
0.7
1 add’l day in quarter
--
(3.6)
Lower earning assets
(0.05)
(1.4)
Increase in nonperforming
assets and charge-offs
2.96%
$87.0
2ndQUARTER 2009
Estimated impact from:
$86.2
Net
Interest
Income
(FTE)
2.83%
1stQUARTER 2009
Net
Interest
Margin
$ in millions
NIM Roll forward
1 Core deposits equal total deposits less both brokered deposits and time deposits
Wholesale Borrowings
By Maturity
$4,033
$3,195
$2,015
$1,180
Total wholesale
borrowings
--
2,057
948
1,109
Brokered CDs
293
762
703
59
FHLB advances
239
125
--
$ --
> 1 year
239
125
12
$ --
Total
--
1,011
2,729
$ --*
Unused
Secured
capacity
--
Repurchase
agreements
12
$ --
1 year or
less
Other
Fed Reserve and
T,T&L
Fed funds purchased
As of June 30, 2009, $ in millions
$3.9 billion
at 3/31/09
Strong parent company
liquidity position
Parent company cash of
$105 million at 6/30/09
No debt maturities until
2033
Cash sufficient to satisfy
dividend requirements
through early 2012
subject to further
subsidiary bank capital
support as needed
Parent Company Liquidity
*Excludes $150 million in excess cash at Federal Reserve at June 30, 2009

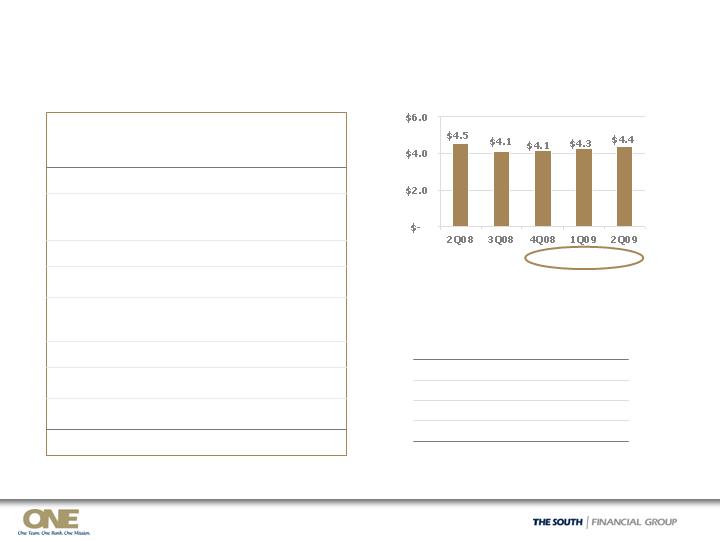
Operating Noninterest Income
0.2
0.8
1.8
1.2
2.0
Mortgage banking income
$ Change
$1.0
0.4
--
0.1
0.2
(1.1)
$0.6
2Q09 vs.
1Q09
(0.1)
0.8
0.6
0.8
Merchant processing income, net
$27.7
2.7
1.1
2.6
5.5
$13.0
2Q09
0.9
0.2
1.1
Gain/(loss) on certain derivative
activities
(0.3)
2.9
2.5
Bank-owned life insurance
(1.6)
7.1
6.6
Wealth management income
(0.3)
3.0
2.3
Other
$(2.6)
$30.3
$26.7
Operating noninterest income1
$(1.4)
2Q09 vs.
2Q08
$14.4
2Q08
$12.4
1Q09
Customer fee income
$ in millions
Mortgage banking income drove the increase for 2Q09; benefited from recent mortgage
leadership changes and higher mortgage loan originations (up 68% linked-quarter)
Customer fee, wealth management, and mortgage banking income comprise approximately 75%
of operating noninterest income
1 Excludes non-operating items. Total noninterest income was $32.3 million for 2Q09, $23.7 million for 1Q09, and $32.2 million for 2Q08. See slide 23
for non-operating items. Reconciliations of GAAP to non-GAAP measures are provided on page 15 of the Quarterly Financial Data Supplement for 2Q09
available in the Investor Relations section of TSFG’s web site, www.thesouthgroup.com.
- $6.0
Staff reductions; 95 FTE
reductions in 3Q09, including 23
FTEs associated with API
With 3Q09 reductions,
down 10% since Y/E 2008
and below Y/E 2004 level
No merit pay increases
Project NOW efficiencies
Took additional actions to
reduce cost base:
Market corporate campus for
sale
Closed 3 branch/2 other
office locations 2Q09
Sale of corporate airplane
Sale of retirement plan
administration business (API)
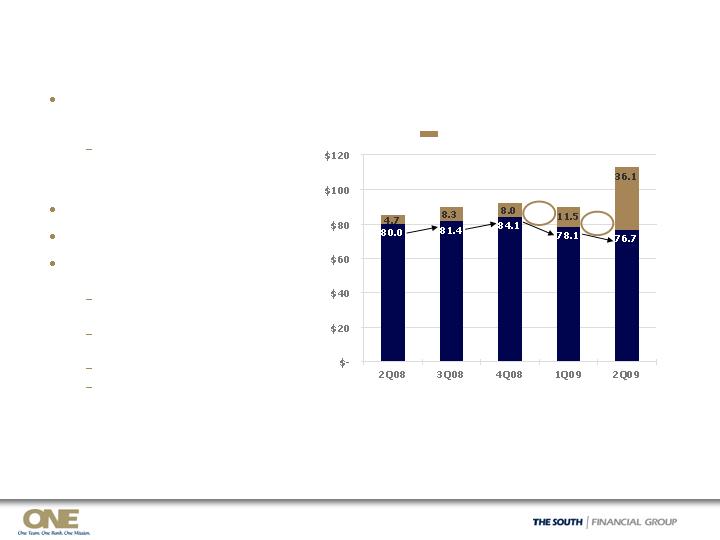
Credit-related costs2 and FDIC insurance
Noninterest Expense Control
1 Excludes non-operating items. Total noninterest expenses were $87.6 million for 2Q08, $94.2 million for 3Q08, $342.1 million for 4Q08, $90.2 million
for 1Q09, and $136.2 million for 2Q09. See slide 24 in the Appendix for reconciliations of GAAP to non-GAAP measures.
2 Credit–related costs include loan and foreclosed asset expense, loss on nonmortgage loans held for sale, and gain/loss on OREO.
$112.8
$84.7
$89.7
$92.1
$ in millions
Operating Noninterest Expenses1
$89.6
+$1.4
2,250
Pro Forma with Eliminations Effective 3Q09
2,572
2,535
2,505
2,430
2,345
# Employees (FTEs):
+$2.7
- $1.4

Expectations for 2009
Operating environment and results will remain challenging for remainder of 2009
Credit losses remain elevated in third quarter and begin to decline slowly; provisioning
depends on continuing economic developments
Potential expansion of margin due to pricing initiatives on both the loan and deposit side,
partially offset by lower indirect loans and overall credit impact
Net interest income will be impacted by non-core loan reductions
Continued expense headwinds from loan collection costs and FDIC insurance
Positive impact from Project NOW and other expense initiatives
Increase in weighted average shares outstanding to reflect Capital Plan actions
Continue to evaluate the realizability of the net deferred tax asset throughout 2009 for both
book and regulatory purposes
Run-off of non-core loan portfolio, partially offset by growth in lending to core customers;
similar to 1Q09 non-core run-off levels per quarter over remainder of 2009
Potential for FDIC transactions with appropriate loss-sharing arrangements if market overlap;
promotes efficiency and improves customer funding
Focus on cross sell, customer satisfaction, and other measures that support our strategic
positioning
2Q09 Execution of Strategic Actions
Strengthened capital position; raised $85 million in new common equity
Capital Plan well underway to fortify balance sheet with Tier 1 common
Capital
Reduced residential construction, lot loan, SNC, and indirect auto exposures
Increased loan loss reserve to 3.11% at 6/30/09
Continued recognition of loan and OREO losses (cycle-to-date NCOs $453 million)
Reduced controllable operating expenses
Reduced FTEs to 2,345 at 6/30/09; with add’l 95 3Q09, down 10% since Y/E ‘08
Closed 5 branches/offices, corporate campus for sale, airplane sale, API sale
Defined “who we are,” “how we compete,” and “how we measure success”
Strong management team in place; aligned management goals to strategy
Improved net interest margin to 2.96%, up 13 bps linked-quarter
Period-end core deposit growth, up 5% ($217 million) since Y/E ‘08
Credit
Vision
Balance Sheet
Management
Net Interest
Margin
Noninterest
Expense
Noninterest
Income
Reduced exposure to non-core loan categories by $534 million ($1.9 billion)
Reduced total assets by $697 million ($12.6 billion)
Strengthened liquidity – no overnight borrowings at 6/30/09
New leadership in mortgage drove 4% linked-quarter noninterest income
increase; mortgage originations up 68% linked-quarter
2Q09 Non-Operating Items
0.1
0.1
3.0
(Gain) loss on early extinguishment of debt
(2.3)
--
(0.8)
Employment contracts and severance
--
--
(2.5)
Goodwill impairment
--
--
(5.7)
FDIC special assessment
--
--
(17.4)
Impairment of long-lived assets
Non-operating noninterest expenses:
Non-operating noninterest income:
$(1.10)
$(90.8)
$(124.1)
--
(0.7)
(3.0)
$(120.5)
1Q09
--
--
Loss on repurchase of auction rate securities
$(0.23)
$(16.8)
$(19.0)
(0.7)
1.9
$(17.9)
2Q08
$(111.5)
Net loss (GAAP) available to common shareholders
$(149.3)
Pre-tax loss (GAAP)
$(130.5)
Pre-tax operating loss
--
Branch acquisition and conversion costs
$(1.23)
Per diluted share
4.6
2Q09
Gain (loss) on securities
Reconciliations of GAAP to non-GAAP measures are provided on page 15 of the Quarterly Financial Data Supplement for 1Q09
available in the Investor Relations section of TSFG’s web site, www.thesouthgroup.com.
$ in millions, except per share data
Reconciliations of GAAP to Non-GAAP Measures
$90.2
0.7
--
--
(0.1)
--
--
--
--
$89.6
1Q09
$87.6
--
--
0.7
(0.1)
2.3
--
--
--
$84.7
2Q08
$94.2
--
--
--
(0.1)
4.6
--
--
--
$89.7
3Q08
$342.1
--
1.1
--
1.7
9.6
237.6
--
--
$92.1
4Q08
$136.2
--
--
--
(3.0)
0.8
2.5
5.7
17.4
$112.8
2Q09
(Gain) loss on early extinguishment of debt
FDIC special assessment
Impairment of long-lived assets
Branch acquisition and conversion cost
Loss on derivative collateral
Employment contracts and severance
Goodwill impairment
Loss on repurchase of auction rate securities
Noninterest Expense:
Total noninterest expense
Operating noninterest expense
$ in millions
Credit Quality Trends - Commercial
4.99%
$32.6
14.65%
$181
$1,235
1Q09
4.93%
$24.5
11.24%
$142
$1,263
4Q08
1.50%
$1.9
8.17%
$49
$606
1Q09
1.45%
$2.6
4.85%
$29
$608
4Q08
1.32%
$13.4
3.24%
$72
$2,202
1Q09
1.32%
$10.3
2.67%
$59
$2,203
4Q08
0.69%
$3.4
1.50%
$19
$1,285
1Q09
1.19%
$1.8
1.17%
$15
$1,271
4Q08
1.23%
$22.1
1.58%
$42
$2,646
1Q09
1.01%
$17.6
1.32%
$36
$2,723
4Q08
2Q09
2Q09
2Q09
2Q09
2Q09
16.55%
6.95%
3.64%
1.84%
3.15%
NAL % of
O/S
Balance
$52.5
$14.4
$15.2
$1.8
$17.0
QTD Net
Charge-offs
2.71%
4.68%
0.88%
0.91%
1.37%
30-day past
due %
$78
$2,135
Completed income
$40
$585
Commercial development
$1,153
$1,315
$ 2,429
Outstanding
Balance
$24
Owner-occupied CRE
$77
C&I
$191
Residential construction
Nonaccrual
Loans HFI
$ in millions
HFI = Held for Investment; 30-day past due % of outstanding balance excludes nonaccrual loans.

Credit Quality Trends - Consumer
1.28%
$0.9
0.09%
$ --
$87
2Q09
Other2
1.50%
$1.4
0.16%
$ --
$91
1Q09
7.44%
$26.3
9.90%
$53
$535
1Q09
9.46%
$11.7
10.17%
$59
$580
4Q08
0.90%
$3.2
0.77%
$6
$813
1Q09
1.42%
$2.4
1.01%
$8
$813
4Q08
1.62%
$4.8
0.09%
$1
$574
1Q09
2.21%
$5.0
0.11%
$1
$636
4Q08
4Q08
2Q09
2Q09
2Q09
4.64%
$11.2
9.68%
$49
$505
Mortgage2
3.54%
$3.1
0.23%
$1
$286
Indirect–sales finance1
2.01%
$4.5
0.61%
$5
$811
Home equity
0.26%
NAL % of
O/S
Balance
$0.4
QTD Net
Charge-offs
3.04%
30-day
past due %
$95
Outstanding
Balance
$ --
Nonaccrual
Loans HFI
$ in millions
HFI = Held for Investment; 30-day past due % of outstanding balance excludes nonaccrual loans.
1 Sold approximately $230 million in June 2009
2 Mortgage includes Consumer Lot Loans. Other includes Direct Retail and Unsecured Lines.
Residential Construction by Geography
$85.1
$13.0
$10.4
$61.7
4.1
7.6
17.3
$32.7
YTD Net
Charge-
Offs
4.99%
$32.6
14.65%
$181
$1,235
3/31/09
4.93%
$24.5
11.24%
$142
$1,263
12/31/08
1.33%
$9.6
18.76%
$82
38%
$437
Total SC, 6/30/09
4.19%
$3.4
6.20%
$28
37%
$450
3/31/09
3.09%
$6.7
8.20%
$21
21%
$264
3/31/09
3.49%
$39.2
19.17%
$90
41%
$472
Total FL, 6/30/09
6.63%
$22.5
25.20%
$132
42%
$521
3/31/09
2.71%
$52.5
16.55%
$191
100%
$1,153
Overall Total,
6/30/09
1.76%
$44.6
9.03%
$127
$1,410
9/30/08
3.67%
$3.7
7.57%
$19
21%
$244
Total NC, 6/30/09
22.87%
30.71%
9.92%
22.24%
NAL %
of O/S
Balance
4.1
4.3
9.4
$21.4
QTD Net
Charge-
offs
1.22%
5.38%
3.31%
4.09%
30-day
past due
%
15
13%
153
FL residential A&D
14
4%
44
FL residential
construction
78
$197
O/S
Balance
7%
17%
% of
Resid.
Constr.
18
FL residential condo
$44
FL undeveloped land
FL Residential Construction:
Nonaccrual
Loans HFI
As of June 30, 2009, $ in millions
30-day past due % of outstanding balance excludes nonaccrual loans; see slide 28 for detail for NC and SC
Residential Construction by Geography
$3.4
$9.6
4.4
1.0
4.2
$ --
$6.7
$3.7
--
1.1
2.0
$0.6
QTD Net
Charge-
offs
SC Residential Construction:
0.08%
5.9
48.27%
42
7%
87
SC residential condo
0.83%
1.2
11.26%
8
7%
76
SC residential
construction
1.00%
5.9
18.75%
30
14%
157
SC residential A&D
3.02%
$ --
1.60%
$ 2
10%
$117
SC undeveloped land
1.33%
$13.0
18.76%
$82
38%
$437
Total SC, 6/30/09
4.19%
6.20%
$28
37%
$450
3/31/09
3.67%
$10.4
7.57%
$19
21%
$244
Total NC, 6/30/09
3.09%
8.20%
$21
21%
$264
3/31/09
1.87%
16.16%
8.83%
1.88%
NAL %
of O/S
Balance
--
3.7
6.0
$0.7
YTD Net
Charge-
offs
2.78%
-- %
5.12%
1.43%
30-day
past due
%
14
13%
153
NC residential A&D
4
2%
23
NC residential
construction
11
$57
O/S
Balance
1%
5%
% of
Resid.
Constr.
--
NC residential condo
$ 1
NC undeveloped land
NC Residential Construction:
Nonaccrual
Loans HFI
As of June 30, 2009, $ in millions
30-day past due % of outstanding balance excludes nonaccrual loans.
Commercial Nonaccruals – Net Balance
$410
191
40
78
24
$77
6/30/09
Nonaccrual
Loan
Balance
$340
164
36
66
21
$53
Net
Balance
Less
Specific
Reserve
62%
$70
$139
$549
Total Commercial
63%
63%
64%
68%
54%
Net
Balance
as % of
Unpaid
Principal
12
25
102
Completed income
property
5
16
57
Commercial
development
261
30
$98
Unpaid
Principal1
70
6
$22
Cumulative
Net
Charge-
offs2
27
Residential
construction
3
Owner-occupied
CRE
$23
C&I
6/30/09
Specific
Reserve3
$ in millions
-
=
-
=
Note: Numbers may not add due to rounding.
1 Outstanding balance at default
2 Typically charge-down at nonaccrual to approximately 80% of most recent appraised value
3 Additional specific reserves are established as necessary based on estimated disposal costs, estimated holding period and current market
and economic conditions; recognized as charge-offs when realized. However, these amounts do not include the qualitative components
within the overall allowance for credit loans.
63% at
3/31/09
Indirect – Sales Finance Portfolio
As of June 30, 2009, $ in millions
In 5/08, ceased production in Florida
Effective 1/09, offered only through
full relationship dealerships in NC and
SC
In 6/09, sold $230 million of indirect
loans to a third party financial
institution for a small gain
Toyota
31%
Summary Statistics
69%
71%
66%
New %
31%
29%
34%
Used %
$728
$484
$244
6/08 Balance
68%
32%
659
711
$286
Total
71%
62%
Foreign %
29%
38%
Domestic %
658
661
Current FICO
708
718
Orig FICO
$180
$106
6/09 Balance
FL
NC/SC
30-day Past Dues, By Auto Make (Top 10)
Total $286 million, or 3% of loans
By Auto Make
3.70%
8
Hyundai
4.97%
7
Scion
3.77%
$239
Top 10
4.12%
8
Jeep
3.96%
12
Nissan
4.46%
19
Dodge
4.34%
19
Ford
3.06%
24
Kia
5.18%
25
Chevrolet
2.98%
29
Honda
3.40%
$88
Toyota
30-day %
O/S$
Honda
10%
Ford
7%
Other
28%
Chevrolet
9%
Dodge
7%
Kia
8%
Home Equity Lines/Loans Portfolio
SC, $340
42%
FL, $276
34%
NC, $129
16%
As of June 30, 2009, $ in millions
Originated by TSFG sales force in-
market; no broker loans
Strong FICO scores
Conservative LTV position and usage
amounts
Not pushed as a growth product
Home Equity Portfolio = HE Line and HE Loan portfolios
Geography based on customer address
Other, $66
8%
Summary Statistics
NA
NA
71%
WAvg Util %1
69%
56%
44%
720
729
$811
Total
66%
70%
Orig WAvg LTV %
17%
65%
2ndLien %
83%
35%
1stLien %
703
724
Current FICO
709
732
Orig FICO
$161
$650
Balance $
Loans
Lines
2008, $117
14%
2007, $151
19%
2006, $123
15%
2004 or before
$277, 34%
2005, $120
15%
By Vintage
Total $811 million, or 9% of loans
By Geography
2009, $23
3%
1 Includes HE lines with balances greater than zero
Current as of 7/21/09