Exhibit 99.3
Third Quarter 2009
Financial Review – Preliminary Results
October 21, 2009

Forward-Looking Statements
and Non-GAAP Financial Information
We caution you that this presentation contains certain forward-looking statements within the meaning of Section 27A of the Securities Act of 1933, as
amended, and Section 21E of the Securities Exchange Act of 1934, as amended, including certain plans, expectations, goals, projections, and
statements, which are subject to numerous assumptions, risks, and uncertainties. The use of words such as "anticipates", "estimates", "expects",
“illustrates”, "intends", "plans", and "believes", among others, generally identify forward-looking statements. However, these words are not the
exclusive means of identifying such statements. Forward-looking statements can be identified by the fact that they do not relate strictly to historical
or current facts.
Actual results could differ materially from those contained or implied by such statements for a variety of factors including: loan deterioration could be
worse than expected due to a number of factors such as the underlying value of the collateral could prove less valuable than otherwise assumed and
assumed cash flows may be worse than expected; changes in economic conditions; movements in interest rates; competitive pressures on product
pricing and services; success and timing of other business strategies; the nature, extent, and timing of governmental actions and reforms, including
existing and potential future restrictions and limitations imposed in connection with the Troubled Asset Relief Program’s voluntary Capital Purchase
Plan or otherwise under the Emergency Economic Stabilization Act of 2008; and the relative success of anticipated capital actions.
Additional factors that could cause results to differ materially from those described above can be found in TSFG’s 2008 Annual Report on Form 10-K,
including in the discussion under "Risk Factors", and documents subsequently filed by TSFG with the Securities and Exchange Commission.
Reference is made to TSFG’s reports filed with the Securities and Exchange Commission for a discussion of factors that may cause such differences to
occur. TSFG undertakes no obligation to release revisions to these forward-looking statements or reflect events or circumstances after today’s
presentation.
This presentation contains certain non-GAAP measures, such as results excluding the impact of certain nonoperating items. TSFG management uses
these non-GAAP, or operating measures, in its analysis of TSFG’s performance. TSFG believes presentations of financial measures excluding the impact
of certain items provide useful supplemental information and better reflect its core operating activities. Management uses operating measures, in
particular, to analyze on a consistent basis and over a longer period of time, the performance of which it considers to be its core operations.
Operating measures adjust GAAP information to exclude the effects of nonoperating items, such as gains or losses on certain asset sales, early
extinguishment of debt, employment contract buyouts, impairment charges, and other nonoperating expenses.
The limitations associated with utilizing operating measures are the risk that persons might disagree as to the appropriateness of items comprising
these measures and different companies might calculate these measures differently. Management compensates for these limitations by providing
detailed reconciliations between GAAP and operating measures. These disclosures should not be considered an alternative to GAAP results. A
reconciliation of GAAP results and non-GAAP measures is provided in the Quarterly Financial Data Supplement on our web site,
www.thesouthgroup.com, in the Investor Relations section under Quarterly Results.

3Q09 Financial Overview
Preliminary net loss available to common shareholders of $(340.8) million, or $(1.95) per
diluted share, pending completion of TSFG’s goodwill impairment analysis
Recognized a $200 million non-cash charge to establish a deferred tax asset valuation
allowance, which decreased tangible common equity but does not impact TSFG’s regulatory
capital
Continued aggressive actions in addressing credit issues
Nonperforming loan balances declined to $432 million (down 7% LQ) with NPAs down 3%
Accelerated sale of problem loans, with sales proceeds of approximately $83 million on
unpaid principal balance of $163 million
NCOs increased to $169 million (up $48 million LQ); includes $60 million related to
accelerated 3Q09 sales and resolutions of problem loans
Loan loss reserve increased to 3.89% of total loans (up from 3.11% at 6/30); provision
exceeded NCOs by $56 million
Continued reductions of non-core loans (down $295 million LQ or $1.1 billion YTD)
Period-end core deposit growth of 4.1% LQ (growth in each of the last 4 quarters)
Execution of capital plan raising a net $280 million in Tier 1 common since mid-June
Net interest margin 2.93%, down 3 bps LQ, primarily due to proactive liquidity positioning
Continued reductions in controllable operating noninterest expenses, excluding credit-related
expenses and FDIC, down $5.3 million, or 6.9% LQ
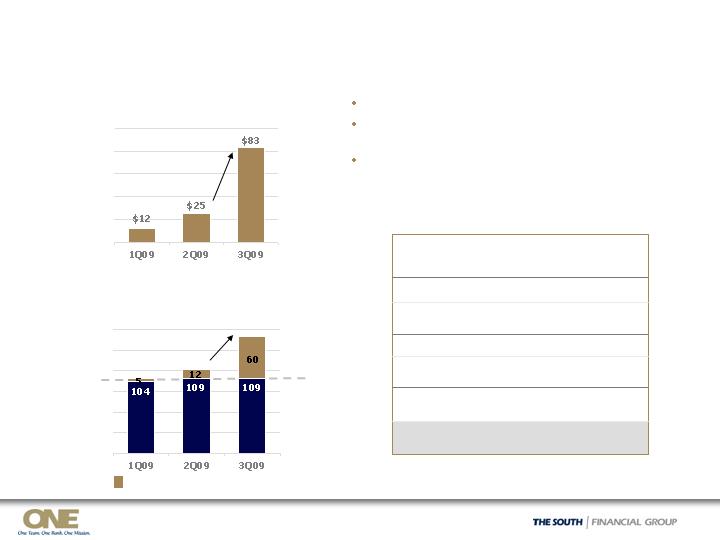
Operating pre-tax, pre-provision income, excluding gains/losses on nonmortgage loans held for
sale and losses on OREO, of $22.1 million, compared to $23.2 million for 2Q09
Period-end common shares increased to 215.4 million due to the issuance of 55 million shares
associated with capital actions
June 2009 Capital Plan: Update
85
Pre-plan Shares O/S (6/18/09)
tbd
Approx. $20 -
$30 million
tbd
Exchange Common for Hybrid
Securities
Completed 9/09 with 95% exchanged
$ 91 (gross)
$ 90 (net)
21
Public Tender for Mandatory
Convertible Exchange
Announced range $300-$315 million
(gross)
$287 (gross)
$280 (net)
130
Steps Completed - 9/30/091
215
--
24
85
Common
Shares
Issued
(In millions)
API 7/09 ($3.1 million); Koss Olinger
9/09 ($3.3 million); Merchant
processing 9/09 ($9.9 million)
$ 16
Sale of Ancillary Businesses
Completed 6/09; automatically
converted to common upon shareholder
approval in 9/09
$ 94.5
Privately negotiated Mandatory
Convertible Exchange
Common Shares O/S (9/30/09)
$75 million 6/09 and $10 million 7/09
(underwriters’ over-allotment)
$ 85 (gross)
$ 79 (net)
Common Equity Issuance
Tier 1
Common
Impact
($ in millions)
Status/Timing
Description
1
2
3
4
5
1 Additional Capital Actions (not included above)
Preferred dividend savings of ~ $35 million for Mandatory Convertible Preferred Stock exchanges
Common dividend savings of ~ $11 million (through 2010) from elimination of $0.01 quarterly cash dividend
Reduction in non-core loans of approximately $830 million during 2Q09 and 3Q09 (compared to $500 million
included in June 2009 Capital Plan); estimated Tier 1 Common benefit (using 4% level) of more than $30 million
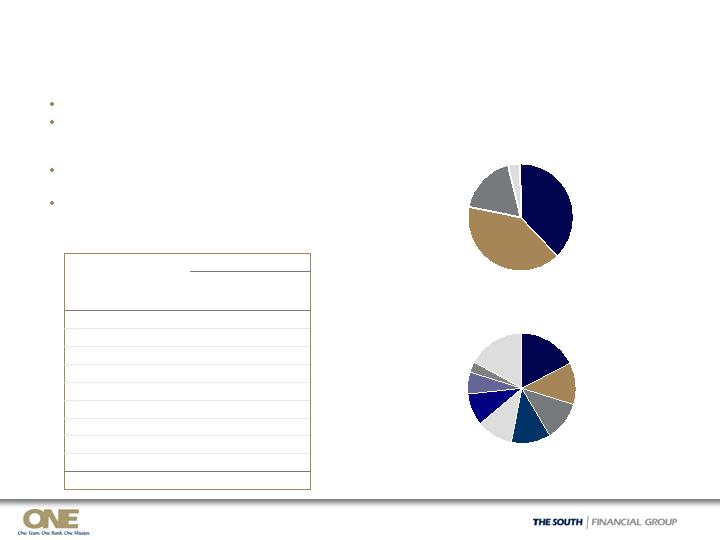
Asset Quality Overview
Nonaccrual loans down 7% to LQ $431.8
million
Slight decline in inflows for last 3
quarters
Mortgage NALs down for the third
consecutive quarter
Specific reserves, which represent likely
losses on existing NALs, are down $21
million
Should be a positive near-term
indicator for commercial losses
30-day past dues down $4.2 million;
increase of 5 bp to 1.91% due to smaller
portfolio size
Florida Commercial past dues down
$20 million; below YE 2008 levels
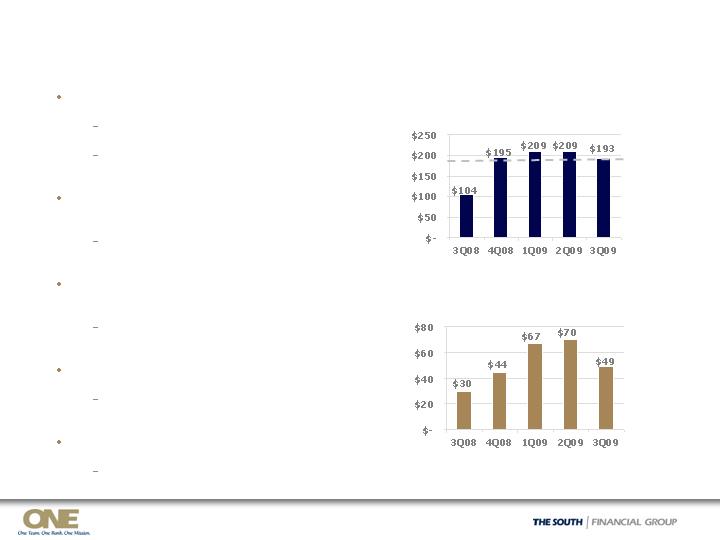
3Q09 NCOs of $168.6 million, or 7.31% of
average loans annualized
Includes $60 million for related to
sales of problem loans
3Q09 provision of $224.2 million; loan loss
reserve increased to 3.89% at 9/30/09
Exceeded NCOs by $56 million
Nonaccrual Loan Inflows
$ in millions
Specific Allowance for Impaired Loans
$ in millions

Loan and Credit Quality Composition
30-Day Past Due
2.22%
1.99%
1.86%
1.91%
1.35%
3.78%
1.00%
3.76%
5.00%
1.45%
1.54%
0.95%
1.23%
%
--
--
Change
from
2Q09
$109.1
4.24%
$423
$9,987
3/31/09
$398.3
2.8
47.1
13.1
10.4
142.4
26.1
44.5
13.2
$98.7
YTD Net
Charge-
Offs
$120.6
4.99%
$465
$9,306
6/30/09
$76.1
$168.6
0.6
9.5
5.4
2.5
57.4
9.7
15.9
8.0
$59.6
QTD Net
Charge-
Offs
3.43%
$349
$10,192
12/31/08
4.87%
$432
100%
$8,874
Total Loans HFI
9.11%
42
5%
464
Mortgage1
0.37%
1
3%
259
Indirect – Sales finance
0.75%
6
9%
803
Home equity
0.12%
14.33%
9.81%
3.86%
2.76%
2.66%
NAL %
of O/S
Balance
82
24%
2,123
Completed income
property
57
7%
583
Commercial
development
86
1,036
1,270
$ 2,250
O/S
Balance
1%
12%
14%
25%
% of
O/S
Balance
--
Other1
35
Owner-occupied CRE
$60
C&I
148
Residential construction
Nonaccrual
Loans HFI
As of Sept. 30, 2009, $ in millions
HFI = Held for Investment; 30-day past due % of outstanding balance excludes nonaccrual loans. Commercial Development includes Commercial A&D
and Commercial Construction. Residential Construction includes Residential A&D, Residential Construction, Residential Condo, and Undeveloped Land.
1 Mortgage includes Consumer Lot Loans of $161 million. Other includes Direct Retail and Unsecured Lines.

Net Charge-offs by Portfolio
$168.6
8.5
9.5
83.0
8.0
$ 59.6
3Q09
$120.6
8.5
11.2
82.1
1.8
$ 17.0
2Q09
Includes $60 million for 3Q09 sales
and resolutions of problem loans
$ 48.0
Total Net Charge-offs
2nd consecutive quarterly decline in all
3 mortgage categories, due to
working through problematic lot loans
(1.7)
Mortgage
$32 million from 3 ADC relationships;
one resolved via sale
0.9
Commercial real estate
--
6.2
$ 42.6
$
Change
Approximately 60% from home equity
Principally small business and CRE-
related
Includes $20 million for one SNC in
the residential A&D business sold
during 3Q09
Additional $8 million from 2 large CRE
related customers
Includes $7 million from opportunistic
SNC sales
Comments
Consumer
Owner-occupied CRE
C&I
$ in millions
Targeted Loan Sales
Proceeds from
Problem Loan Sales1
Net Charge-Offs
Loan Sales Increased 3Q09 NCOs
1 Includes note sales and short sales (includes potential
problem loans).
$ in millions
$169
$121
$109
NCOs related to problem loan sales
3Q09 Problem Loan Sales
Summary1
$ in millions
(19.8)
Less :
Cumulative Pre-Sale NCOs
$ 59.7
Additional 3Q09 NCOs Upon
Sale
(83.1)
Less:
Sales Proceeds
142.8
Book Balance2
51%
Sales Proceeds as % Legal
Balance
$ 162.6
Unpaid Principal Balance
3Q09
Loan
Sales
1 Includes sale of 2 largest Residential ADC problem loans
2 Does not reflect 6/30/09 Specific Reserves of
approximately $23 million
Centralized loan sale process gaining traction
Improvement in buyer interest and market
liquidity
Plan to continue to take advantage of market
to move problem loans aggressively
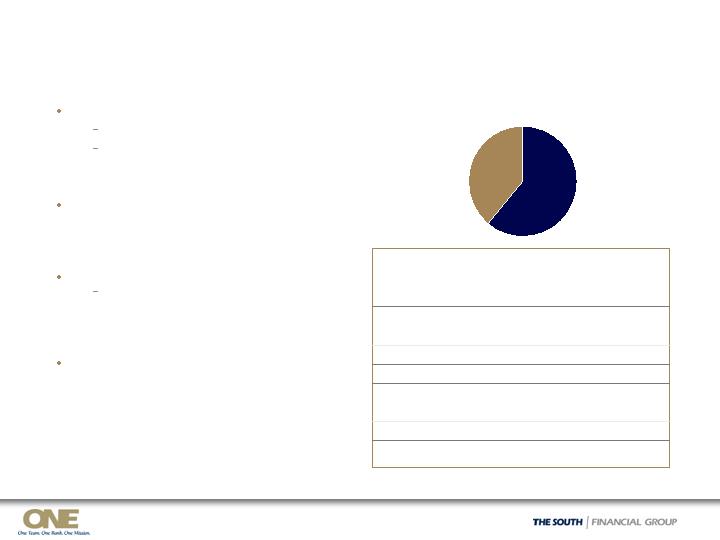
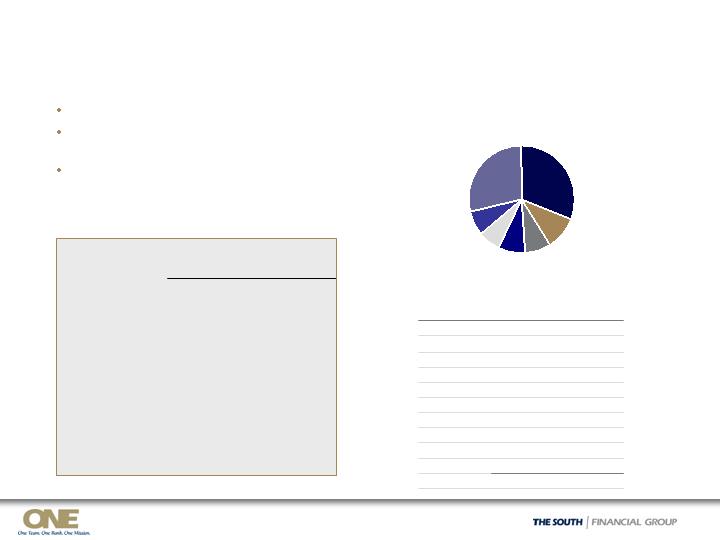
Completed Income Property Portfolio
SC, $809
38%
FL, $842
40%
NC, $389
18%
As of September 30, 2009, $ in millions
Well-diversified by property type
Granular exposures, with average loan size of
$0.5 million; weighted average time to maturity
of 37.2 months
Stable performance with exception of Office
category
Potential weakening on horizon, with an increase
in downgrades noted
Other, $83
4%
9/30/09
3.9%
3.3%
0.7%
1.3%
2.1%
3.7%
6.8%
5.7%
5.5%
6.6%
NAL %
of O/S
Balance
0.3%
9.1
Office
4.6%
13.6
Hotel
3.1%
12.2
Other
2.1%
0.4
Medical
1.3%
4.7
Retail
3.6%
2.9%
4.1%
6.3%
7.4%
6/30/09
NAL %
$81.9
Total
5.5
Mixed Use
8.4
Industrial
11.7
Residential 1-4 fam.
$16.3
Multi-Family
NAL $
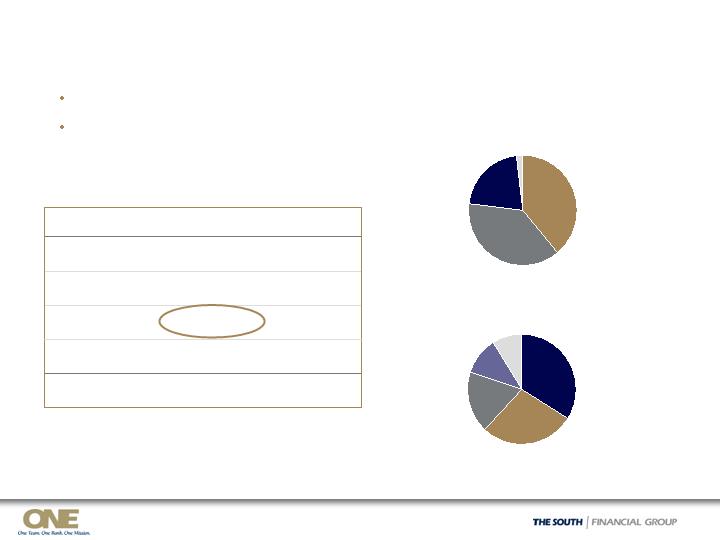
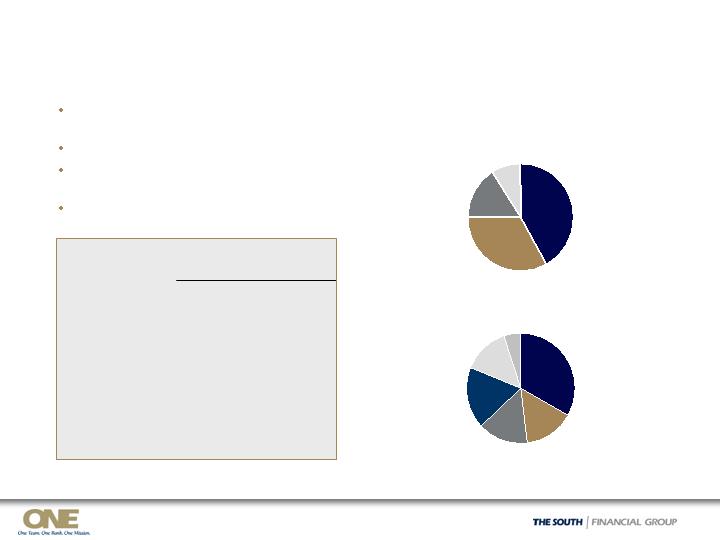
Residential
$204, 10%
Retail
$372, 17%
Mixed Use
$262, 12%
By Property Type
Total $2,123 million, or 24% of loans
By Geography
Multi-Family
$247, 12%
Hotel
$247, 12%
Industrial
$226, 11%
Office
$134, 6%
Other
$368, 17%
Medical
$63, 3%
Nonaccrual Loans By Property Type
Shared National Credits
Plan to reduce non-core SNCs
Exiting deals when restructured
Amendments to reduce
commitments and improve credit
dynamics
In 3Q09, sold SNC potential problem
loans with sales proceeds of
approximately $37 million on an
unpaid principal balance of $62 million
SNC exam:
Downgrades noted during exam,
increasing potential problem
loans; only one addition to NAL
resulting from exam
Secondary market pricing continuing
to improve and availability of
exit/restructure credit also improved
Committed:
Outstanding:
SNCs, Period-End
$1,105
854
$251
$599
480
$119
2Q09
$(43)
$1,062
Total
(68)
786
Non-core
$ 25
$276
Core
$(84)
$515
Total
(97)
383
Non-core
$ 13
$132
Core
$
Change
3Q09
SNCs Outstanding, $515 million1
By Category
As of September 30, 2009, $ in millions
C&I, $316
61%
CRE, $199
39%
Mortgage Banking Portfolio
Continued improvement in
mortgage portfolio
NALs decrease of $7
million linked-quarter
across all mortgage
categories; third
consecutive quarter of
declines in total
Decline in net loan
charge-offs across all
mortgage categories
Reduced balances in Lot
Loans and Construction
Perm by $242 million
(57%) since Y/E 2007
Mortgage restructured loans
of $9.3 million (excluded
from NALs) from working
with borrowers to do loan
modifications
$ in millions
1 SIVA = Stated Income Verified Assets
$ 1.7
$ 10.0
26.17%
0.00%
4.07%
$ 38.2
$ 6.5
$ 20.8
11.68%
0.27%
4.86%
$178.2
$ 3.1
$ 18.0
6.26%
2.73%
1.68%
$288.4
2Q09
$ 3.5
$ 10.2
21.90%
0.00%
2.60%
$ 47.4
$ 17.1
$ 21.8
11.00%
0.16%
5.95%
$198.0
$ 5.6
$ 20.9
7.25%
0.51%
8.67%
$289.3
1Q09
$ 1.0
$ 12.8
20.02%
0.00%
5.22%
$ 64.0
$ 8.9
$ 29.9
13.20%
1.84%
6.34%
$225.5
$ 1.8
$ 16.3
5.59%
3.41%
7.90%
$290.7
4Q08
$ 9.9
NAL $
$ 16.4
NAL $
$ 15.9
NAL $
Construction Perm:
$ 22.2
Balance
3.69%
30-89 DPD
0.00%
90+ DPD
44.5%
NAL %
$ 1.0
NCO $
Lot Loans:
$161.2
Balance
3.43%
30-89 DPD
0.24%
90+ DPD
10.18%
NAL %
$ 5.6
NCO $
SIVA1Alt-A:
$ 2.9
NCO $
5.69%
NAL %
2.31%
90+ DPD
1.54%
30-89 DPD
$280.1
Balance
3Q09
Other Real Estate Owned
OREO, $111.7 million1
By Geography
As of September 30, 2009
Accelerating pace of OREO sales
Carrying value of approximately 53% of
original loan amount
$94
(10)
(12)
44
$74
2Q09
$74
--
(3)
32
$45
1Q09
(8)
(28)
- OREO sales
27
48
+ Additions
--
(2)
- Write downs
$45
$112
Ending balance
$94
3Q09
$26
Beg. balance
4Q08
# of Months in OREO
FL, 39%
NC, 38%
SC, 21%
Other, 2%
0-3 mos,
34%
Note: Numbers may not add due to rounding 1 Based on $ balances in OREO; geography reflects property zip code
3-6 mos,
28%
6-9 mos,
18%
9-12 mos,
11%
>12 mos,
9%
OREO Flows
$ in million
3Q09 Operating Results
91.0
$ 21.8
$ (59.6)
$(130.5)
131.3
0.8
22.4
23.2
90.4
27.7
$ 85.9
2Q09
In 2Q09, OREO reappraisals/policy change to write
properties down to 70% of appraised value
4.3
OREO/LHFS losses
Exceeded NCOs by $56 million; allowance at 3.89%
224.2
Provision for credit losses
$11.9 million for the value of common shares issued as
inducement for early conversion (vs. $14 million 2Q09)
$ 17.3
Preferred stock dividends and
other
In 3Q09, recorded $200 million non-cash valuation
allowance for deferred tax assets
$ 123.3
Income tax expense (benefit)
174.4
$(206.4)
17.8
22.1
84.4
26.5
$ 80.0
3Q09
Pre-tax, pre-provision operating
income1
Pre-tax, pre-credit operating
income1
Issuance of shares associated with capital actions
Weighted avg. shares
Pre-tax operating loss1
Declines in most categories, expenses related to
ancillary businesses sold, and FTEs down 6.4% LQ
Operating noninterest expenses,
excluding OREO/LHFS losses1
Higher customer fee income; lower mortgage banking
income and revenues from ancillary businesses sold
Operating noninterest income1
$792 million decline in avg. earning assets (reductions
of non-core loans); 3Q09 NIM of 2.93%, down 3 bps
Net interest income
Comments
1 Excludes non-operating items. Preliminary net loss available to common shareholders totaled $(340.8) million pending completion of TSFG’s goodwill
impairment analysis for 3Q09 and $(111.5) million for 2Q09. Preliminary net loss per diluted share totaled $(1.95) for 3Q09 and $(1.23) for 2Q09.
See slide 14 for non-operating items. Reconciliations of GAAP to non-GAAP measures are provided on page 15, 3Q09 Quarterly Financial Data
Supplement available in the Investor Relations section of TSFG’s web site, www.thesouthgroup.com.
In millions, except per share data
3Q09 – Unusual Items
$ (123.3)
Valuation allowance for DTA (income tax expense)
Recorded income tax expense, which includes $200 million non-
cash charge to establish a valuation allowance for the deferred
tax assets (net DTA at 9/30/09 of $3.6 million)
Pending
Pending
Goodwill impairment
3Q09 analysis for $202 million of goodwill as of 9/30/09 related
to Carolina First banking segment (SC and NC banking
operations) pending; expect to complete prior to filing of 10-Q
X
$ (0.7)
Impairment of long-lived assets (closing office locations)
X
$ (0.3)
Loss on securities
Included in:
(11.9)
$ 7.2
$
Amount
Inducement for early conversion of preferred stock
Compared to $14.0 million in 2Q09 and $6.5 million in 1Q09
(EPS purposes only; no capital impact)
$4.65 million of Series 2008 Preferred outstanding as of 9/30/09
Non-Operating Items:
Operating Items:
X
Noninterest
Income
Noninterest
Expenses
Gain on sale of ancillary businesses
Included gain on sale of merchant processing portfolio of $7.6
million less loss on sale of Koss Olinger of $0.3 million
$ in millions
Capital Position
9.30%
9.81%
9.75%
TCE plus reserves to risk-
weighted assets
6.05%
6.07%
5.25%
Tangible common equity (TCE) to
tangible assets
9.17%
12.55%
11.01%
10.30%
13.65%
12.36%
5.31%
6/30/09
5.64%
5.59%
Tier 1 common to risk-weighted
assets
8.34%
11.70%
10.14%
9.22%
12.49%
11.19%
9/30/091
5%
10%
6%
5%
10%
6%
Well
Capitalized
Minimum
8.79%
11.75%
10.10%
10.55%
13.53%
12.10%
3/31/09
Total risk-based
Leverage
CAROLINA FIRST BANK
Tier 1 risk-based
Total risk-based
Leverage
Tier 1 risk-based
THE SOUTH FINANCIAL GROUP
1 Estimated for calculation of regulatory ratios

Smaller, More Focused Balance Sheet
(714)
3,845
3,513
3,302
3,131
Customer CDs/Sweeps
Funding:1
15.7%
16.0%
15.5%
18.0%
% Securities to Assets
(517)
3,750
3,730
3,195
3,233
Wholesale borrowings
35.3%
37.0%
40.2%
41.6%
Core deposits as % of total
funding
$4,540
$12,301
1,209
2,218
1,624
$7,250
3Q09
$395
$4,145
$4,259
$4,361
Core deposits
Assets:
$(1,301)
$13,602
$13,285
$12,588
Total assets
1,280
2,130
2,685
$7,507
4Q08
(1,061)
2,455
1,920
Total non-core loans HFI
88
2,124
1,950
Securities
(71)
1,174
1,332
Other
$(257)
Change
vs. YE ‘08
$7,532
1Q09
$7,386
Total core loans HFI
2Q09
$ in millions
Period-End Assets
1 Core deposits includes total deposits less certificates of deposit. Wholesale borrowings include borrowings plus brokered deposits less
customer sweep accounts. Total funding equals total deposits plus borrowings.
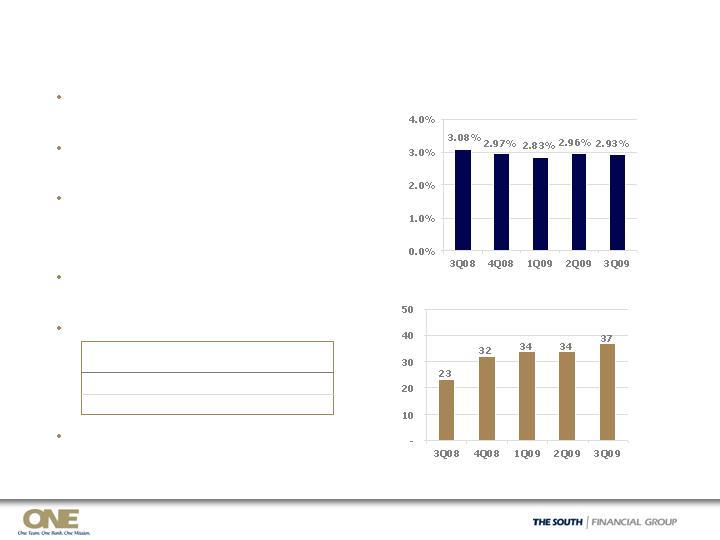
3Q09 NIM of 2.93%, down 3 bps, due to
liquidity positioning offsetting customer
funds improvement
Improvement in customer funding costs of
23 bps from core deposit growth, better
deposit mix, and disciplined pricing
Proactive liquidity positioning resulted in a
32 basis point increase on wholesale
borrowing costs (or 9 bp negative NIM
impact) related to lengthening maturities
and higher excess cash balances
3Q09 net yield on core loans of 4.60% vs.
3.87% for non-core loans, excluding the
impact of hedging instruments
Positive repricing on customer CDs:
Downward pressure from swaps/floors with
a $855 million notional amount and 2.16%
3Q09 average spread, maturing over 4Q09
Net Interest Margin
Net Interest Margin (FTE)
1 Reflects the impact of the carry of nonaccrual loan
balances and interest reversals
bp
2.73%
2,189
Beyond 4Q09
3.11%
661
4Q09
Avg.
Yield %
Balance $
Maturing in
Credit-related Impact on NIM1
Liquidity
By Maturity
$3,987
$3,233
$2,313
$920
Total wholesale borrowings
--
2,099
1,196
903
Brokered CDs
139
762
753
9
FHLB advances
239
125
--
$ --
> 1 year
239
125
8
$ --
Total
--
1,201
2,647
$ --
Unused
Secured
Capacity
--
Repurchase agreements
--
8
$ --
1 year or
less
Other
Fed Reserve and T,T&L
Fed funds purchased
As of September 30, 2009, $ in millions
$4.0 billion
at 6/30/09
Wholesale Borrowings
Lengthening maturities
No overnight or TAF borrowings at 9/30/09
Includes $278 million in excess cash at Federal Reserve at 9/30/09
Parent company cash of $60 million at 9/30/09, which covers obligations through mid 2012

Operating Noninterest Income
(1.6)
(0.8)
1.0
0.2
(0.6)
Customer swap income, net
0.2
(0.9)
0.9
2.0
1.1
Mortgage banking income
$ Change
$(1.2)
(0.9)
0.5
0.2
(0.2)
(0.2)
$ 1.1
3Q09 vs.
2Q09
(0.3)
0.9
0.8
0.6
Merchant processing income, net
$26.5
1.6
1.6
2.8
5.3
$14.1
3Q09
1.8
(0.2)
1.1
Gain/(loss) on hedging derivative
activities
(0.1)
2.9
2.6
Bank-owned life insurance
(1.9)
7.2
5.5
Wealth management income
(0.3)
1.9
2.5
Other
$(2.9)
$29.4
$27.7
Operating noninterest income1
$(0.7)
3Q09 vs.
3Q08
$14.8
3Q08
$13.0
2Q09
Customer fee income
$ in millions
Decline in mortgage banking income from lower mortgage originations and a reduction from sales
of ancillary businesses (by approximately $1 million, which also reduced noninterest expenses by
a similar amount)
Customer fee, wealth management, and mortgage banking income comprise approximately 77%
of operating noninterest income
1 Excludes non-operating items. Total noninterest income was $33.5 million for 3Q09, $32.3 million for 2Q09, and $28.7 million for 3Q08. See slide 24
for non-operating items. Reconciliations of GAAP to non-GAAP measures are provided on page 15 of the Quarterly Financial Data Supplement for 3Q09
available in the Investor Relations section of TSFG’s web site, www.thesouthgroup.com.
Down 12%
since YE
2008
-6.0
Credit-related costs2 and FDIC insurance
All Other (down $12.7, or 15% YTD)
Continuing Noninterest Expense Control
1 Excludes non-operating items. Total noninterest expenses were $94.2 million for 3Q08, $342.1 million for 4Q08, $90.2 million for 1Q09, $136.2
million for 2Q09, and $89.5 million for 3Q09. See slide 25 in the Appendix for reconciliations of GAAP to non-GAAP measures.
2 Credit–related costs include loan and foreclosed asset expense, gain/loss on nonmortgage loans held for sale, and gain/loss on OREO.
$112.8
$88.8
$89.7
$92.1
Operating Noninterest Expenses1
$ in millions
$89.6
+2.7
-1.4
# of Employees (FTEs)
-5.3
Lowest level of FTEs in 5 years (2,324 at 9/30/04)

Outlook
Operating environment and results will remain challenging heading into 2010
Continued progress in execution of strategic actions
Credit losses related to residential construction exposures begin to decline slowly;
provisioning and total NCOs will depend upon continuing economic developments, particularly
in completed income property and C&I portfolios
Focus on accelerating problem and potential problem loan sales as market liquidity and pricing
improves in order to accelerate return to profitability
Stable margin due to pricing initiatives on both the loan and deposit side, partially offset by
overall credit impact, maturing swaps/floors, and liquidity positioning
Net interest income will be impacted by non-core loan reductions, partially offset by increasing
level of investment securities up to $2.35 billion range in 4Q09
Continued focus on reducing controllable noninterest expense in order to combat expense
headwinds from loan collection cost (which acceleration of resolution through loan sales would
reduce) and FDIC insurance
Increase in weighted average shares outstanding to reflect Capital Plan actions
Continued strategic reduction in non-core loan portfolio, to be offset by growth in lending to
core customers when loan demand returns
Focus on cross sell, customer satisfaction, and other measures that support our strategic
positioning
3Q09 Execution of Strategic Actions
9/30/09 tangible common equity ratio of 5.25% reflects 154 bps decline for DTA
valuation allowance; June capital plan substantially complete, which raised a net $210
million (~55 million common shares) in Tier 1 common since 6/30/09
Strengthened liquidity – lengthened maturities, higher excess cash at Federal Reserve
Capital/
Liquidity
Accelerated resolution of problem loans through 3Q09 loan sales and resolutions with
$83 million of net proceeds on legal balance of $163 million; NCOs increased to $168.6
million, including $60 million for sales and resolutions of problem loans
Decline in nonperforming loan balances to $432 million (down 7%)
Increased loan loss reserve to 3.89% at 9/30/09
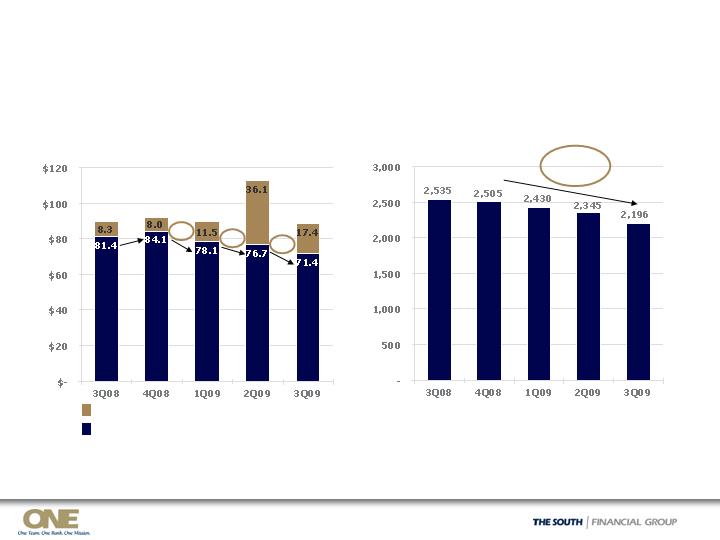
Reduced controllable operating expenses; excluding impact of credit-related/FDIC,
declined $5.3 million, or 6.9%, LQ across most categories
Reduced FTEs to 2,196 at 9/30/09; down 12% since Y/E 2008
Net interest margin of 2.93%, down 3 bps LQ, primarily due to liquidity positioning
Improved customer funding costs from enhanced deposit mix, disciplined pricing, and
downward pricing of CDs upon renewal
Net interest income decreased $5.9 million from lower average earning assets
Reduced exposure to non-core loan categories by $295 million ($1.1 billion YTD
reduction to $1.6 billion at 9/30/09)
Increased core deposits as % total funding to 42% from 35% at Y/E 2008
Period-end core deposit growth, up 4.1% LQ, with growth in last 4 quarters
Increased income from service charges on deposit accounts
Decline in mortgage banking income from lower originations
Hired leadership for new SBA lending unit
Credit
Balance Sheet
Management
Net Interest
Margin
Noninterest
Expenses
Noninterest
Income

3Q09 Non-Operating Items
--
--
7.2
Gain on sale of ancillary businesses
$(1.95)
$(340.8)
$(200.2)
--
--
Pending
--
(0.7)
(0.3)
$(206.4)
3Q09
0.1
3.0
Gain on early extinguishment of debt
(4.6)
(0.8)
Employment contracts and severance
--
(2.5)
Goodwill impairment
--
(5.7)
FDIC special assessment
--
(17.4)
Impairment of long-lived assets
Non-operating noninterest expenses:
Non-operating noninterest income:
$(0.43)
$(31.2)
$(54.5)
(0.7)
$(49.3)
3Q08
$(111.5)
Net loss (GAAP) available to common shareholders
$(149.3)
Pre-tax loss (GAAP)
$(130.5)
Pre-tax operating loss
$(1.23)
Per diluted share
4.6
2Q09
Gain (loss) on securities
Reconciliations of GAAP to non-GAAP measures are provided on page 15 of the Quarterly Financial Data Supplement for 3Q09
available in the Investor Relations section of TSFG’s web site, www.thesouthgroup.com.
$ in millions, except per share data
Reconciliations of GAAP to Non-GAAP Measures
--
0.3
1.8
9.5
--
Loss on nonmortgage loans held for sale
3.0
3.4
4.7
6.5
6.2
Regulatory assessments
4.5
4.6
4.9
7.2
6.8
Loan collection and foreclosed asset expense
0.8
(0.3)
0.1
12.9
4.4
Loss (gain) on OREO
$81.4
$84.1
$78.1
$76.7
$71.4
Operating noninterest expense, excluding credit-
related costs and FDIC insurance
$89.5
--
--
--
--
--
--
0.7
88.8
3Q09
$90.2
0.7
--
(0.1)
--
--
--
--
89.6
1Q09
$94.2
--
--
(0.1)
4.6
--
--
--
89.7
3Q08
$342.1
--
1.1
1.7
9.6
237.6
--
--
92.1
4Q08
$136.2
--
--
(3.0)
0.8
2.5
5.7
17.4
112.8
2Q09
(Gain) loss on early extinguishment of debt
FDIC special assessment
Impairment of long-lived assets
Loss on derivative collateral
Employment contracts and severance
Goodwill impairment
Loss on repurchase of auction rate securities
Noninterest Expense:
Total noninterest expense
Operating noninterest expense
$ in millions
Reconciliations of GAAP to Non-GAAP Measures
4.60%
$85.0
$7,327.2
Core
Loans
3.87%
$17.7
$1,819.5
Non-Core
Loans
$9,146.7
Avg. loans held for investment, 3Q09
4.46%
$102.7
(9.9)
$112.7
Total
Loan interest income, excluding the impact of
hedging instruments
Less: Positive impact of hedging instruments
Net yield on loans, excluding the impact of
hedging instruments (annualized):
Loan interest income, excluding hedging
instruments as % avg. loans held for
investment, 3Q09
Loan interest income, 3Q09
$ in millions
Credit Quality Trends - Commercial
2.71%
$52.5
16.55%
$191
$1,153
2Q09
4.99%
$32.6
14.65%
$181
$1,235
1Q09
4.68%
$14.4
6.95%
$40
$585
2Q09
1.50%
$1.9
8.17%
$49
$606
1Q09
0.88%
$15.2
3.64%
$78
$2,135
2Q09
1.32%
$13.4
3.24%
$72
$2,202
1Q09
0.91%
$1.8
1.84%
$24
$1,315
2Q09
0.69%
$3.4
1.50%
$19
$1,285
1Q09
1.37%
$17.0
3.15%
$77
$2,429
2Q09
1.23%
$22.1
1.58%
$42
$2,646
1Q09
3Q09
3Q09
3Q09
3Q09
3Q09
14.33%
9.81%
3.86%
2.76%
2.66%
NAL % of
O/S
Balance
$57.4
$9.7
$15.9
$8.0
$59.6
QTD Net
Charge-offs
5.00%
1.45%
1.54%
0.95%
1.23%
30-day past
due %
$82
$2,123
Completed income
$57
$583
Commercial development
$1,036
$1,270
$ 2,250
Outstanding
Balance
$35
Owner-occupied CRE
$60
C&I
$148
Residential construction
Nonaccrual
Loans HFI
$ in millions
HFI = Held for Investment; 30-day past due % of outstanding balance excludes nonaccrual loans.

Credit Quality Trends - Consumer
1.35%
$0.6
0.12%
$ --
$86
3Q09
Other2
1.28%
$0.9
0.09%
$ --
$87
2Q09
4.64%
$11.2
9.68%
$49
$505
2Q09
7.44%
$26.3
9.90%
$53
$535
1Q09
2.01%
$4.5
0.61%
$5
$811
2Q09
0.90%
$3.2
0.77%
$6
$813
1Q09
3.54%
$3.1
0.23%
$1
$286
2Q09
1.62%
$4.8
0.09%
$1
$574
1Q09
1Q09
3Q09
3Q09
3Q09
3.78%
$9.5
9.11%
$42
$464
Mortgage2
3.76%
$2.5
0.37%
$1
$259
Indirect–sales finance1
1.00%
$5.4
0.75%
$6
$803
Home equity
0.16%
NAL % of
O/S
Balance
$1.4
QTD Net
Charge-offs
1.50%
30-day
past due %
$91
Outstanding
Balance
$ --
Nonaccrual
Loans HFI
$ in millions
HFI = Held for Investment; 30-day past due % of outstanding balance excludes nonaccrual loans
1 Sold approximately $230 million in June 2009
2 Mortgage includes Consumer Lot Loans. Other includes Direct Retail and Unsecured Lines.
Residential Construction by Geography
$142.4
$42.7
$8.8
$90.9
4.3
10.4
31.3
$44.9
YTD Net
Charge-
Offs
2.71%
$52.5
16.55%
$191
$1,153
6/30/09
4.99%
$32.6
14.65%
$181
$1,235
3/31/09
6.61%
$29.7
11.17%
$44
39%
$397
Total SC, 9/30/09
1.33%
$9.6
18.76%
$82
38%
$437
6/30/09
3.67%
$3.7
7.57%
$19
21%
$244
6/30/09
4.27%
$29.2
21.11%
$88
40%
$418
Total FL, 9/30/09
3.49%
$39.2
19.17%
$90
41%
$472
6/30/09
5.00%
$57.4
14.33%
$148
100%
$1,036
Overall Total,
9/30/09
4.93%
$24.5
11.24%
$142
$1,263
12/31/08
3.49%
$(1.6)
7.22%
$16
21%
$221
Total NC, 9/30/09
17.11%
38.8%
10.89%
24.61%
NAL %
of O/S
Balance
0.2
2.8
14.0
$12.2
QTD Net
Charge-
offs
0.06%
2.15%
8.02%
4.19%
30-day
past due
%
12
11%
115
FL residential A&D
18
5%
47
FL residential
construction
75
$181
O/S
Balance
7%
17%
% of
Resid.
Constr.
13
FL residential condo
$45
FL undeveloped land
FL Residential Construction:
Nonaccrual
Loans HFI
As of Sept. 30, 2009, $ in millions
30-day past due % of outstanding balance excludes nonaccrual loans; see slide 30 for detail for NC and SC
Residential Construction by Geography
$9.6
$29.7
0.1
12.3
12.8
$ 4.6
$3.7
$(1.6)
--
(1.4)
(0.5)
$0.3
QTD Net
Charge-
offs
SC Residential Construction:
-- %
6.0
34.53%
26
7%
74
SC residential condo
-- %
13.5
3.92%
3
7%
78
SC residential
construction
13.65%
18.7
10.95%
15
13%
136
SC residential A&D
7.05%
$ 4.5
0.65%
$ 1
11%
$109
SC undeveloped land
6.61%
$42.7
11.17%
$44
38%
$397
Total SC, 9/30/09
1.33%
18.76%
$82
38%
$437
6/30/09
3.49%
$8.8
7.22%
$16
21%
$221
Total NC, 9/30/09
3.67%
7.57%
$ 19
21%
$244
6/30/09
0.71%
7.33%
9.28%
2.99%
NAL %
of O/S
Balance
0.1
2.3
5.5
$0.9
YTD Net
Charge-
offs
-- %
3.51%
5.06%
-- %
30-day
past due
%
13
13%
140
NC residential A&D
1
2%
18
NC residential
construction
11
$52
O/S
Balance
1%
5%
% of
Resid.
Constr.
--
NC residential condo
$ 2
NC undeveloped land
NC Residential Construction:
Nonaccrual
Loans HFI
30-day past due % of outstanding balance excludes nonaccrual loans.
As of Sept. 30, 2009, $ in millions
Commercial Nonaccruals – Net Balance
$382
148
57
82
35
$60
9/30/09
Nonaccrual
Loan
Balance
$333
131
44
71
32
$55
Net
Balance
Less
Specific
Reserve
61%
$49
$161
$543
Total Commercial
60%
53%
64%
74%
62%
Net
Balance
as % of
Unpaid
Principal
10
29
111
Completed income
property
13
26
83
Commercial
development
218
44
$88
Unpaid
Principal1
70
8
$28
Cumulative
Net
Charge-
offs2
17
Residential
construction
3
Owner-occupied
CRE
$5
C&I
9/30/09
Specific
Reserve3
$ in millions
-
=
-
=
Note: Numbers may not add due to rounding.
1 Outstanding balance at default
2 Typically charge-down at nonaccrual to approximately 80% of most recent appraised value
3 Additional specific reserves are established as necessary based on estimated disposal costs, estimated holding period and current market
and economic conditions; recognized as charge-offs when realized. However, these amounts do not include the qualitative components
within the overall allowance for credit loans.
62% at
6/30/09
Indirect – Sales Finance Portfolio
As of September 30, 2009, $ in millions
In 5/08, ceased production in Florida
Effective 1/09, offered only through
relationship dealerships in NC and SC
In 6/09, sold $230 million of indirect loans
to a third party financial institution for a
small gain
Toyota
32%
Summary Statistics
69%
71%
66%
New %
31%
29%
34%
Used %
$681
$429
$252
9/08 Balance
68%
32%
660
711
$259
Total
71%
62%
Foreign %
29%
38%
Domestic %
657
665
Current FICO
707
719
Orig FICO
$156
$103
9/09 Balance
FL
NC/SC
30-day Past Dues, By Auto Make (Top 10)
Total $259 million, or 3% of loans
By Auto Make
4.79%
7
Hyundai
5.62%
6
Scion
4.20%
$217
Top 10
3.37%
7
Jeep
4.60%
11
Nissan
4.81%
18
Dodge
4.09%
18
Ford
3.98%
21
Kia
5.57%
22
Chevrolet
3.45%
25
Honda
3.87%
$82
Toyota
30-day %
O/S$
Honda
10%
Ford
7%
Other
28%
Chevrolet
8%
Dodge
7%
Kia
8%
Home Equity Lines/Loans Portfolio
SC, $331
42%
FL, $261
33%
NC, $127
16%
As of September 30, 2009, $ in millions
Originated in-market by TSFG sales force;
no broker loans
Strong FICO scores
Conservative LTV position and usage
amounts
Not pushed as a growth product
Home Equity Portfolio = HE Line and HE Loan portfolios
Geography based on customer address
Other, $76
9%
Summary Statistics
NA
NA
71%
WAvg Util %1
69%
56%
44%
721
729
$795
Total
65%
70%
Orig WAvg LTV %
16%
66%
2ndLien %
84%
34%
1stLien %
704
725
Current FICO
710
733
Orig FICO
$154
$641
Balance $
Loans
Lines
2008, $113
14%
2007, $146
18%
2006, $122
15%
2004 or before
$262, 33%
2005, $116
15%
By Vintage
Total $795 million, or 9% of loans
By Geography
2009, $36
5%
1 Includes HE lines with balances greater than zero
Current as of 10/20/09