UNITED STATES
SECURITIES AND EXCHANGE COMMISSION
Washington, D.C. 20549
FORM N-CSR
CERTIFIED SHAREHOLDER REPORT OF REGISTERED MANAGEMENT
INVESTMENT COMPANIES
Investment Company Act file number | 811-4765 |
| |
| Dreyfus New York AMT-Free Municipal Bond Fund | |
| (Exact name of Registrant as specified in charter) | |
| | |
| c/o The Dreyfus Corporation 200 Park Avenue New York, New York 10166 | |
| (Address of principal executive offices) (Zip code) | |
| | |
| John Pak, Esq. 200 Park Avenue New York, New York 10 166 | |
| (Name and address of agent for service) | |
|
Registrant's telephone number, including area code: | (212) 922-6000 |
| |
Date of fiscal year end: | 11/30 | |
Date of reporting period: | 11/30/14 | |
| | | | | | | |
FORM N-CSR
Item 1. Reports to Stockholders.
|
| Dreyfus |
| New York AMT-Free |
| Municipal Bond Fund |
ANNUAL REPORT November 30, 2014

Save time. Save paper. View your next shareholder report online as soon as it’s available. Log into www.dreyfus.com and sign up for Dreyfus eCommunications. It’s simple and only takes a few minutes.
The views expressed in this report reflect those of the portfolio manager only through the end of the period covered and do not necessarily represent the views of Dreyfus or any other person in the Dreyfus organization. Any such views are subject to change at any time based upon market or other conditions and Dreyfus disclaims any responsibility to update such views.These views may not be relied on as investment advice and, because investment decisions for a Dreyfus fund are based on numerous factors, may not be relied on as an indication of trading intent on behalf of any Dreyfus fund.

| | Contents |
| | THE FUND |
| 2 | A Letter from the President |
| 3 | Discussion of Fund Performance |
| 6 | Fund Performance |
| 8 | Understanding Your Fund’s Expenses |
| 8 | Comparing Your Fund’s Expenses With Those of Other Funds |
| 9 | Statement of Investments |
| 22 | Statement of Assets and Liabilities |
| 23 | Statement of Operations |
| 24 | Statement of Changes in Net Assets |
| 26 | Financial Highlights |
| 30 | Notes to Financial Statements |
| 40 | Report of Independent Registered Public Accounting Firm |
| 41 | Important Tax Information |
| 42 | Information About the Renewal of the Fund’s Management Agreement |
| 47 | Board Members Information |
| 49 | Officers of the Fund |
| | FOR MORE INFORMATION |
| | Back Cover |
Dreyfus
New York AMT-Free
Municipal Bond Fund
The Fund
A LETTER FROM THE PRESIDENT
Dear Shareholder:
We are pleased to present this annual report for Dreyfus New York AMT-Free Municipal Bond Fund, covering the 12-month period from December 1, 2013, through November 30, 2014. For information about how the fund performed during the reporting period, as well as general market perspectives, we provide a Discussion of Fund Performance on the pages that follow.
Municipal bonds generally gained ground for the reporting period overall despite bouts of heightened volatility at the end of 2013, when a more moderately accommodative monetary policy and accelerating economic growth caused long-term interest rates to rise. Long-term interest rates moderated early in 2014 due to global geopolitical and economic concerns, driving prices of long-term securities higher, and favorable supply-and-demand dynamics helped keep yields low when economic growth resumed. Meanwhile, improving economic fundamentals enabled many states and municipalities to shore up their fiscal conditions.
While we remain cautiously optimistic regarding the municipal bond market’s prospects, we believe that selectivity is likely to become more important to investment success. Long-term rates could rise if, as we anticipate, the economy continues to accelerate and inflationary pressures rise. On the other hand, intensifying geopolitical turmoil and other factors could dampen the potentially adverse effects of a stronger domestic economic recovery, and rising investor demand for tax-advantaged investments may continue to support municipal bond prices.As always, we encourage you to discuss our observations with your financial adviser to assess their potential impact on your investments.
Thank you for your continued confidence and support.

J. Charles Cardona
President
The Dreyfus Corporation
December 15, 2014
2
DISCUSSION OF FUND PERFORMANCE
For the period of December 1, 2013, through November 30, 2014, as provided by Thomas Casey and Daniel Rabasco, Portfolio Managers
Fund and Market Performance Overview
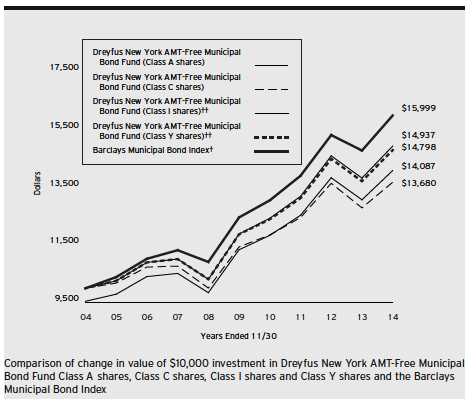
For the 12-month period ended November 30, 2014, Dreyfus NewYork AMT-Free Municipal Bond Fund’s Class A shares produced a total return of 7.76%, Class C shares returned 6.93%, Class I shares returned 8.03%, and Class Y shares returned 7.89%.1 In comparison, the Barclays Municipal Bond Index (the “Index”), the fund’s benchmark index, which is composed of bonds issued nationally and not solely within New York, achieved a total return of 8.23% for the same period.2
Municipal bonds rallied over the reporting period amid moderating long-term interest rates and favorable supply-and-demand dynamics. The fund lagged its benchmark, mainly due to weakness among higher quality securities and Puerto Rico bonds.
The Fund’s Investment Approach
The fund seeks to maximize current income exempt from federal, New York state, and New York city income taxes to the extent consistent with the preservation of capital. To pursue its goal, the fund normally invests substantially all of its assets in municipal bonds that provide income exempt from federal, New York state, and NewYork city personal income taxes.The fund also seeks to provide income exempt from the federal alternative minimum tax. The fund will invest at least 70% of its assets in investment-grade municipal bonds or the unrated equivalent as determined by Dreyfus. For additional yield, the fund may invest up to 30% of its assets in municipal bonds rated below investment grade (“high yield” or “junk” bonds) or the unrated equivalent as determined by Dreyfus. Under normal market conditions, the dollar-weighted average maturity of the fund’s portfolio is expected to exceed 10 years, but the fund may invest in individual securities of any maturity.
In managing the fund, we focus on identifying undervalued sectors and securities, and we minimize the use of interest rate forecasting.We select municipal bonds by using fundamental credit analysis to estimate the relative value and attractiveness of
The Fund 3
DISCUSSION OF FUND PERFORMANCE (continued)
various sectors and securities and to exploit pricing inefficiencies in the municipal bond market.We actively trade among various sectors, such as pre-refunded, general obligation, and revenue, based on their apparent relative values.
Economic and Technical Forces Buoyed Municipal Bonds
Municipal bonds rallied early in the reporting period as long-term interest rates moderated and bond prices rebounded amid concerns about economic weakness in international markets and harsh winter weather in the United States. These developments contributed to a domestic economic contraction during the first quarter of 2014.
The economic recovery got back on track as U.S. GDP rebounded at a 4.6% annualized rate during the second quarter of the year and an estimated 3.9% for the third quarter.While accelerating economic growth typically sends inflation and interest rates higher, favorable supply-and-demand dynamics kept interest rates low. Less refinancing activity produced a limited supply of newly issued tax-exempt securities, while demand intensified from investors seeking higher after-tax income. Longer term and lower rated securities fared particularly well in this environment.
The economic rebound resulted in better underlying credit conditions for New York. The state and city participated fully in the national economic recovery with support from a resurgent financial services industry.
Fund Strategies Produced Mixed Results
Although the fund participated substantially in the municipal bond market’s rally, its relative performance was tempered by its holdings of Puerto Rico bonds, which are exempt from federal and New York state income taxes. Puerto Rico bonds were hurt by concerns surrounding the U.S. territory’s troubled economy and unfunded pension liabilities. We took advantage of periodic bouts of market strength to sell the fund’s Puerto Rico positions. In addition, the fund’s higher quality holdings, including bonds backed by waterworks and education facilities, lagged market averages.
The fund achieved better results from our interest rate strategies, as a relatively long average duration and a focus on longer maturities captured the benefits of falling long-term interest rates. Likewise, underweighted exposure to lower yielding, shorter
4
maturity bonds bolstered relative performance. Our security selection strategy also proved particularly effective among lower rated revenue bonds including those backed by airports and the state’s settlement of litigation with U.S. tobacco companies. Finally, bonds issued by the City of New York fared well as credit conditions improved.
Maintaining a Constructive Investment Posture
The U.S. economic recovery has gained momentum, but disappointing global growth has kept interest rates low. Meanwhile, municipal bond market fundamentals have remained strong in the recovering economy. Although the supply of newly issued municipal bonds recently began to increase, we expect any additional issuance to be absorbed by robust investor demand.Therefore, we have maintained the fund’s focus on generating competitive levels of current income, including an emphasis on longer dated, higher quality revenue bonds.
December 15, 2014
Bond funds are subject generally to interest rate, credit, liquidity, and market risks, to varying degrees, all of which are more fully described in the fund’s prospectus. Generally, all other factors being equal, bond prices are inversely related to interest-rate changes, and rate increases can cause price declines.
The amount of public information available about municipal securities is generally less than that for corporate equities or bonds. Special factors, such as legislative changes, and state and local economic and business developments, may adversely affect the yield and/or value of the fund’s investments in municipal securities. Other factors include the general conditions of the municipal securities market, the size of the particular offering, the maturity of the obligation, and the rating of the issue. Changes in economic, business, or political conditions relating to a particular municipal project, municipality, or state in which the fund invests may have an impact on the fund’s share price.
|
| 1 Total return includes reinvestment of dividends and any capital gains paid, and does not take into consideration the |
| maximum initial sales charge in the case of Class A shares, or the applicable contingent deferred sales charge imposed |
| on redemptions in the case of Class C shares. Had these charges been reflected, returns would have been lower. Class |
| I and ClassY are not subject to any initial or deferred sales charge. Past performance is no guarantee of future results. |
| Share price, yield, and investment return fluctuate such that upon redemption, fund shares may be worth more or less |
| than their original cost. Income may be subject to state and local taxes for non-NewYork residents. Capital gains, if |
| any, are fully taxable. |
| 2 SOURCE: LIPPER INC. — Reflects reinvestment of dividends and, where applicable, capital gain distributions. |
| The Barclays Municipal Bond Index is a widely accepted, unmanaged and geographically unrestricted total return |
| performance benchmark for the long-term, investment-grade, tax-exempt bond market. Index returns do not reflect the |
| fees and expenses associated with operating a mutual fund. |
The Fund 5
FUND PERFORMANCE
| |
| † | Source: Lipper Inc. |
| †† | The total return figures presented for Class I shares of the fund reflect the performance of the fund’s Class A shares |
| | for the period prior to 12/15/08 (the inception date for Class I shares), not reflecting the applicable sales charges for |
| | Class A shares. |
| | The total return figures presented for ClassY shares of the fund reflect the performance of the fund’s Class A shares for the |
| | period prior to 7/1/13 (the inception date for ClassY shares), not reflecting the applicable sales charges for Class A shares. |
Past performance is not predictive of future performance.
The above graph compares a $10,000 investment made in each of the Class A, Class C, Class I and Class Y shares of Dreyfus New York AMT-Free Municipal Bond Fund on 11/30/04 to a $10,000 investment made in the Barclays Municipal Bond Index (the “Index”) on that date. All dividends and capital gain distributions are reinvested.
The fund invests primarily in New York municipal securities and the fund’s performance shown in the line graph above takes into account the maximum initial sales charge on Class A shares and all other applicable fees and expenses on all classes.The Index is not limited to investments principally in New York municipal obligations and does not take into account charges, fees and other expenses.The Index, unlike the fund, is an unmanaged total return performance benchmark for the long-term, investment-grade, geographically unrestricted tax-exempt bond market, calculated by using municipal bonds selected to be representative of the municipal market overall.These factors can contribute to the Index potentially outperforming or underperforming the fund. Unlike a mutual fund, the Index is not subject to charges, fees and other expenses. Investors cannot invest directly in any index. Further information relating to fund performance, including expense reimbursements, if applicable, is contained in the Financial Highlights section of the prospectus and elsewhere in this report.
6
| | | | | | | |
| Average Annual Total Returns as of 11/30/14 | | | | | | |
| | Inception | | | | | | |
| | Date | 1 | Year | 5 Years | | 10 Years | |
| Class A shares | | | | | | | |
| with maximum sales charge (4.5%) | 12/31/86 | 2.93 | % | 3.48 | % | 3.49 | % |
| without sales charge | 12/31/86 | 7.76 | % | 4.44 | % | 3.97 | % |
| Class C shares | | | | | | | |
| with applicable redemption charge † | 9/11/95 | 5.93 | % | 3.65 | % | 3.18 | % |
| without redemption | 9/11/95 | 6.93 | % | 3.65 | % | 3.18 | % |
| Class I shares | 12/15/08 | 8.03 | % | 4.67 | % | 4.09 | %†† |
| Class Y shares | 7/1/13 | 7.89 | % | 4.50 | %†† | 4.00 | %†† |
| Barclays Municipal Bond Index | | 8.23 | % | 5.12 | % | 4.81 | % |
Past performance is not predictive of future performance.The fund’s performance shown in the graph and table does not reflect the deduction of taxes that a shareholder would pay on fund distributions or the redemption of fund shares. In addition to the performance of Class A shares shown with and without a maximum sales charge, the fund’s performance shown in the table takes into account all other applicable fees and expenses on all classes.
| |
| † | The maximum contingent deferred sales charge for Class C shares is 1% for shares redeemed within one year of the |
| | date of purchase. |
| †† | The total return performance figures presented for Class I shares of the fund reflect the performance of the fund’s |
| | Class A shares for the period prior to 12/15/08 (the inception date for Class I shares), not reflecting the applicable |
| | sales charges for Class A shares. |
| | The total return performance figures presented for ClassY shares of the fund reflect the performance of the fund’s |
| | Class A shares for the period prior to 7/1/13 (the inception date for ClassY shares), not reflecting the applicable |
| | sales charges for Class A shares. |
The Fund 7
UNDERSTANDING YOUR FUND’S EXPENSES (Unaudited)
As a mutual fund investor, you pay ongoing expenses, such as management fees and other expenses. Using the information below, you can estimate how these expenses affect your investment and compare them with the expenses of other funds.You also may pay one-time transaction expenses, including sales charges (loads) and redemption fees, which are not shown in this section and would have resulted in higher total expenses. For more information, see your fund’s prospectus or talk to your financial adviser.
Review your fund’s expenses
The table below shows the expenses you would have paid on a $1,000 investment in Dreyfus New York AMT-Free Municipal Bond Fund from June 1, 2014 to November 30, 2014. It also shows how much a $1,000 investment would be worth at the close of the period, assuming actual returns and expenses.
Expenses and Value of a $1,000 Investment
assuming actual returns for the six months ended November 30, 2014
| | | | | | | | |
| | | Class A | | Class C | | Class I | | Class Y |
| Expenses paid per $1,000† | $ | 4.67 | $ | 8.55 | $ | 3.40 | $ | 4.00 |
| Ending value (after expenses) | $ | 1,023.00 | $ | 1,018.40 | $ | 1,024.30 | $ | 1,022.30 |
COMPARING YOUR FUND’S EXPENSES
WITH THOSE OF OTHER FUNDS (Unaudited)
Using the SEC’s method to compare expenses
The Securities and Exchange Commission (SEC) has established guidelines to help investors assess fund expenses. Per these guidelines, the table below shows your fund’s expenses based on a $1,000 investment, assuming a hypothetical 5% annualized return. You can use this information to compare the ongoing expenses (but not transaction expenses or total cost) of investing in the fund with those of other funds. All mutual fund shareholder reports will provide this information to help you make this comparison. Please note that you cannot use this information to estimate your actual ending account balance and expenses paid during the period.
Expenses and Value of a $1,000 Investment
assuming a hypothetical 5% annualized return for the six months ended November 30, 2014
| | | | | | | | |
| | | Class A | | Class C | | Class I | | Class Y |
| Expenses paid per $1,000† | $ | 4.66 | $ | 8.54 | $ | 3.40 | $ | 4.00 |
| Ending value (after expenses) | $ | 1,020.46 | $ | 1,016.60 | $ | 1,021.71 | $ | 1,021.11 |
|
| † Expenses are equal to the fund’s annualized expense ratio of .92% for Class A, 1.69% for Class C, .67% for |
| Class I and .79% for ClassY, multiplied by the average account value over the period, multiplied by 183/365 (to |
| reflect the one-half year period). |
8
STATEMENT OF INVESTMENTS
November 30, 2014
| | | | | |
| Long-Term Municipal | Coupon | Maturity | Principal | | |
| Investments—100.3% | Rate (%) | Date | Amount ($) | | Value ($) |
| New York—97.7% | | | | | |
| Albany Industrial Development | | | | | |
| Agency, Civic Facility Revenue | | | | | |
| (Saint Peter’s Hospital of the | | | | | |
| City of Albany Project) | 5.25 | 11/15/27 | 4,500,000 | | 4,935,825 |
| Build New York City Resource | | | | | |
| Corporation, Revenue (The New | | | | | |
| York Methodist Hospital Project) | 5.00 | 7/1/29 | 650,000 | | 738,484 |
| Hempstead Local Development | | | | | |
| Corporation, Revenue (Molloy | | | | | |
| College Project) | 5.70 | 7/1/29 | 4,865,000 | | 5,337,878 |
| Hudson Yards Infrastructure | | | | | |
| Corporation, Hudson Yards | | | | | |
| Senior Revenue | 5.75 | 2/15/47 | 2,500,000 | | 2,878,200 |
| JPMorgan Chase Putters/Drivers | | | | | |
| Trust (Series 3803) | | | | | |
| Non-recourse (New York State | | | | | |
| Dormitory Authority, Revenue | | | | | |
| (The Rockefeller University)) | 5.00 | 7/1/18 | 4,000,000 | a,b | 4,550,120 |
| JPMorgan Chase Putters/Drivers | | | | | |
| Trust (Series 4377) | | | | | |
| Non-recourse (New York City | | | | | |
| Transitional Finance | | | | | |
| Authority, Future Tax Secured | | | | | |
| Subordinate Revenue) | 5.00 | 5/1/21 | 10,000,000 | a,b | 11,276,500 |
| Long Island Power Authority, | | | | | |
| Electric System General Revenue | 6.00 | 5/1/33 | 3,000,000 | | 3,514,800 |
| Long Island Power Authority, | | | | | |
| Electric System General | | | | | |
| Revenue (Insured; National | | | | | |
| Public Finance Guarantee | | | | | |
| Corp.) (Prerefunded) | 5.00 | 6/1/16 | 2,375,000 | c | 2,542,865 |
| Metropolitan Transportation | | | | | |
| Authority, Dedicated | | | | | |
| Tax Fund Revenue | 5.00 | 11/15/23 | 7,500,000 | d | 9,143,475 |
| Metropolitan Transportation | | | | | |
| Authority, Dedicated | | | | | |
| Tax Fund Revenue | 5.00 | 11/15/27 | 3,000,000 | d | 3,580,650 |
| Metropolitan Transportation | | | | | |
| Authority, Transportation | | | | | |
| Revenue | 5.00 | 11/15/23 | 4,000,000 | d | 4,807,240 |
The Fund 9
STATEMENT OF INVESTMENTS (continued)
| | | | | |
| Long-Term Municipal | Coupon | Maturity | Principal | | |
| Investments (continued) | Rate (%) | Date | Amount ($) | | Value ($) |
| New York (continued) | | | | | |
| Metropolitan Transportation | | | | | |
| Authority, Transportation Revenue | 5.00 | 11/15/25 | 1,000,000 | d | 1,110,780 |
| Metropolitan Transportation | | | | | |
| Authority, Transportation Revenue | 5.00 | 11/15/28 | 2,500,000 | d | 2,896,925 |
| Metropolitan Transportation | | | | | |
| Authority, Transportation Revenue | 6.50 | 11/15/28 | 2,000,000 | d | 2,414,100 |
| Metropolitan Transportation | | | | | |
| Authority, Transportation Revenue | 5.00 | 11/15/30 | 5,000,000 | d | 5,811,250 |
| Metropolitan Transportation | | | | | |
| Authority, Transportation Revenue | 5.00 | 11/15/32 | 5,000,000 | d | 5,717,000 |
| Metropolitan Transportation | | | | | |
| Authority, Transportation Revenue | 5.00 | 11/15/34 | 3,000,000 | d | 3,321,060 |
| Metropolitan Transportation | | | | | |
| Authority, Transportation Revenue | 5.00 | 11/15/41 | 1,755,000 | d | 1,952,683 |
| Metropolitan Transportation | | | | | |
| Authority, Transportation Revenue | 5.00 | 11/15/43 | 6,210,000 | d | 6,903,657 |
| Metropolitan Transportation | | | | | |
| Authority, Transportation Revenue | 5.25 | 11/15/44 | 2,000,000 | d | 2,298,620 |
| Monroe County Industrial | | | | | |
| Development Corporation, | | | | | |
| Revenue (University of | | | | | |
| Rochester Project) | 5.00 | 7/1/25 | 2,420,000 | | 2,777,628 |
| Monroe County Industrial | | | | | |
| Development Corporation, | | | | | |
| Revenue (University of | | | | | |
| Rochester Project) | 5.00 | 7/1/43 | 1,000,000 | | 1,121,880 |
| Nassau County Local Economic | | | | | |
| Assistance Corporation, | | | | | |
| Revenue (Winthrop-University | | | | | |
| Hospital Association Project) | 5.00 | 7/1/42 | 1,000,000 | | 1,068,930 |
| New York City, | | | | | |
| GO | 5.00 | 8/1/21 | 730,000 | | 753,236 |
| New York City, | | | | | |
| GO | 5.00 | 8/1/22 | 440,000 | | 453,961 |
| New York City, | | | | | |
| GO | 5.25 | 9/1/25 | 1,000,000 | | 1,139,790 |
| New York City, | | | | | |
| GO | 5.00 | 8/1/26 | 3,565,000 | | 4,115,258 |
10
| | | | | |
| Long-Term Municipal | Coupon | Maturity | Principal | | |
| Investments (continued) | Rate (%) | Date | Amount ($) | | Value ($) |
| New York (continued) | | | | | |
| New York City, | | | | | |
| GO | 5.00 | 8/1/28 | 4,000,000 | | 4,653,320 |
| New York City, | | | | | |
| GO | 5.00 | 8/1/29 | 5,000,000 | | 5,736,600 |
| New York City, | | | | | |
| GO | 5.00 | 8/1/31 | 4,000,000 | | 4,691,160 |
| New York City, | | | | | |
| GO | 5.00 | 10/1/32 | 730,000 | | 842,946 |
| New York City Educational | | | | | |
| Construction Fund, Revenue | 6.50 | 4/1/25 | 3,960,000 | | 5,037,358 |
| New York City Housing Development | | | | | |
| Corporation, Capital Fund | | | | | |
| Program Revenue (New York City | | | | | |
| Housing Authority Program) | | | | | |
| (Insured; National Public | | | | | |
| Finance Guarantee Corp.) | | | | | |
| (Prerefunded) | 5.00 | 7/1/15 | 3,465,000 | c | 3,564,861 |
| New York City Industrial | | | | | |
| Development Agency, PILOT | | | | | |
| Revenue (Yankee Stadium | | | | | |
| Project) (Insured; Assured | | | | | |
| Guaranty Corp.) | 7.00 | 3/1/49 | 5,000,000 | | 6,066,850 |
| New York City Municipal Water | | | | | |
| Finance Authority, Water and | | | | | |
| Sewer System Second General | | | | | |
| Resolution Revenue | 5.00 | 6/15/31 | 3,000,000 | | 3,417,630 |
| New York City Municipal Water | | | | | |
| Finance Authority, Water and | | | | | |
| Sewer System Second General | | | | | |
| Resolution Revenue | 5.00 | 6/15/34 | 2,000,000 | | 2,306,900 |
| New York City Municipal Water | | | | | |
| Finance Authority, Water and | | | | | |
| Sewer System Second General | | | | | |
| Resolution Revenue | 5.25 | 6/15/40 | 2,975,000 | | 3,356,008 |
| New York City Municipal Water | | | | | |
| Finance Authority, Water and | | | | | |
| Sewer System Second General | | | | | |
| Resolution Revenue | 5.50 | 6/15/40 | 2,500,000 | | 2,880,925 |
The Fund 11
STATEMENT OF INVESTMENTS (continued)
| | | | | |
| Long-Term Municipal | Coupon | Maturity | Principal | | |
| Investments (continued) | Rate (%) | Date | Amount ($) | | Value ($) |
| New York (continued) | | | | | |
| New York City Municipal Water | | | | | |
| Finance Authority, Water and | | | | | |
| Sewer System Second General | | | | | |
| Resolution Revenue | 5.00 | 6/15/45 | 4,000,000 | | 4,436,320 |
| New York City Transitional Finance | | | | | |
| Authority, Future Tax Secured | | | | | |
| Revenue | 5.00 | 11/1/22 | 4,000,000 | | 4,174,920 |
| New York City Transitional Finance | | | | | |
| Authority, Future Tax Secured | | | | | |
| Revenue | 5.00 | 11/1/25 | 3,565,000 | | 3,719,543 |
| New York City Transitional Finance | | | | | |
| Authority, Future Tax Secured | | | | | |
| Revenue | 5.00 | 11/1/28 | 2,695,000 | | 2,804,336 |
| New York City Transitional Finance | | | | | |
| Authority, Future Tax Secured | | | | | |
| Subordinate Revenue | 5.00 | 11/1/26 | 3,000,000 | | 3,616,230 |
| New York City Transitional Finance | | | | | |
| Authority, Future Tax Secured | | | | | |
| Subordinate Revenue | 5.00 | 2/1/36 | 2,000,000 | | 2,293,600 |
| New York City Transitional Finance | | | | | |
| Authority, Future Tax Secured | | | | | |
| Subordinate Revenue | 5.00 | 11/1/38 | 3,000,000 | | 3,389,610 |
| New York City Trust for Cultural | | | | | |
| Resources, Revenue (American | | | | | |
| Museum of Natural History) | 5.00 | 7/1/32 | 4,210,000 | | 4,974,536 |
| New York Liberty Development | | | | | |
| Corporation, Liberty Revenue | | | | | |
| (4 World Trade Center Project) | 5.00 | 11/15/44 | 3,000,000 | | 3,339,630 |
| New York Liberty Development | | | | | |
| Corporation, Liberty Revenue | | | | | |
| (7 World Trade Center Project) | 5.00 | 9/15/40 | 2,000,000 | | 2,272,240 |
| New York Liberty Development | | | | | |
| Corporation, Revenue (3 World | | | | | |
| Trade Center Project) | 5.00 | 11/15/44 | 5,000,000 | b | 5,102,200 |
| New York State Dormitory | | | | | |
| Authority, FHA-Insured | | | | | |
| Mortgage Hospital Revenue | | | | | |
| (Hospital for Special Surgery) | 6.00 | 8/15/38 | 3,470,000 | | 4,101,679 |
| New York State Dormitory | | | | | |
| Authority, Health Center | | | | | |
| Revenue (Guaranteed; SONYMA) | 5.00 | 11/15/19 | 1,000,000 | | 1,003,990 |
12
| | | | |
| Long-Term Municipal | Coupon | Maturity | Principal | |
| Investments (continued) | Rate (%) | Date | Amount ($) | Value ($) |
| New York (continued) | | | | |
| New York State Dormitory | | | | |
| Authority, Revenue (Consolidated | | | | |
| City University System) | 5.63 | 7/1/16 | 4,730,000 | 4,969,007 |
| New York State Dormitory | | | | |
| Authority, Revenue (Consolidated | | | | |
| City University System) | 5.75 | 7/1/18 | 1,345,000 | 1,470,246 |
| New York State Dormitory | | | | |
| Authority, Revenue | | | | |
| (Consolidated City University | | | | |
| System) (Insured; Assured | | | | |
| Guaranty Municipal Corp.) | 5.75 | 7/1/18 | 1,280,000 | 1,399,194 |
| New York State Dormitory | | | | |
| Authority, Revenue | | | | |
| (Cornell University) | 5.00 | 7/1/24 | 4,500,000 | 4,816,395 |
| New York State Dormitory | | | | |
| Authority, Revenue | | | | |
| (Cornell University) | 5.00 | 7/1/35 | 1,500,000 | 1,593,030 |
| New York State Dormitory | | | | |
| Authority, Revenue | | | | |
| (Cornell University) | 5.00 | 7/1/35 | 2,000,000 | 2,281,820 |
| New York State Dormitory | | | | |
| Authority, Revenue | | | | |
| (Memorial Sloan-Kettering | | | | |
| Cancer Center) | 5.00 | 7/1/23 | 1,350,000 | 1,615,545 |
| New York State Dormitory | | | | |
| Authority, Revenue (Mount | | | | |
| Sinai School of Medicine of | | | | |
| New York University) | 5.50 | 7/1/25 | 2,320,000 | 2,703,125 |
| New York State Dormitory | | | | |
| Authority, Revenue | | | | |
| (New York University) | 5.00 | 7/1/34 | 2,000,000 | 2,247,480 |
| New York State Dormitory | | | | |
| Authority, Revenue | | | | |
| (New York University | | | | |
| Hospitals Center) | 5.25 | 7/1/24 | 1,900,000 | 2,029,561 |
| New York State Dormitory | | | | |
| Authority, Revenue (New York | | | | |
| University Hospitals Center) | 5.50 | 7/1/25 | 2,500,000 | 2,879,225 |
| New York State Dormitory | | | | |
| Authority, Revenue (New York | | | | |
| University Hospitals Center) | 5.00 | 7/1/26 | 2,500,000 | 2,586,375 |
The Fund 13
STATEMENT OF INVESTMENTS (continued)
| | | | | |
| Long-Term Municipal | Coupon | Maturity | Principal | | |
| Investments (continued) | Rate (%) | Date | Amount ($) | | Value ($) |
| New York (continued) | | | | | |
| New York State Dormitory | | | | | |
| Authority, Revenue (North | | | | | |
| Shore—Long Island Jewish | | | | | |
| Obligated Group) | 5.00 | 5/1/25 | 5,515,000 | | 5,845,624 |
| New York State Dormitory | | | | | |
| Authority, Revenue (North | | | | | |
| Shore—Long Island Jewish | | | | | |
| Obligated Group) | 5.50 | 5/1/37 | 2,000,000 | | 2,219,260 |
| New York State Dormitory | | | | | |
| Authority, Revenue (Orange | | | | | |
| Regional Medical Center | | | | | |
| Obligated Group) | 6.13 | 12/1/29 | 1,500,000 | | 1,609,215 |
| New York State Dormitory | | | | | |
| Authority, Revenue (Rochester | | | | | |
| Institute of Technology) | 5.00 | 7/1/23 | 2,000,000 | | 2,369,600 |
| New York State Dormitory | | | | | |
| Authority, Revenue (Rochester | | | | | |
| Institute of Technology) | | | | | |
| (Prerefunded) | 6.00 | 7/1/18 | 5,250,000 | c | 6,215,632 |
| New York State Dormitory | | | | | |
| Authority, Revenue | | | | | |
| (State University | | | | | |
| Educational Facilities) | 5.88 | 5/15/17 | 4,060,000 | | 4,433,073 |
| New York State Dormitory | | | | | |
| Authority, Revenue (State | | | | | |
| University of New York | | | | | |
| Dormitory Facilities) | 5.00 | 7/1/43 | 2,500,000 | | 2,767,300 |
| New York State Dormitory | | | | | |
| Authority, Revenue | | | | | |
| (Teachers College) | 5.00 | 3/1/24 | 2,500,000 | | 2,814,075 |
| New York State Dormitory | | | | | |
| Authority, Revenue | | | | | |
| (Teachers College) | 5.38 | 3/1/29 | 2,000,000 | | 2,266,480 |
| New York State Dormitory | | | | | |
| Authority, Revenue (The | | | | | |
| Bronx-Lebanon Hospital Center) | | | | | |
| (LOC; TD Bank) | 6.50 | 8/15/30 | 2,000,000 | | 2,343,780 |
| New York State Dormitory | | | | | |
| Authority, Revenue | | | | | |
| (The New School) | 5.25 | 7/1/30 | 2,500,000 | | 2,835,275 |
14
| | | | |
| Long-Term Municipal | Coupon | Maturity | Principal | |
| Investments (continued) | Rate (%) | Date | Amount ($) | Value ($) |
| New York (continued) | | | | |
| New York State Dormitory | | | | |
| Authority, Revenue (The | | | | |
| Rockefeller University) | 5.00 | 7/1/40 | 4,000,000 | 4,504,280 |
| New York State Dormitory | | | | |
| Authority, State Personal | | | | |
| Income Tax Revenue (Education) | 5.00 | 3/15/19 | 5,500,000 | 5,943,080 |
| New York State Dormitory | | | | |
| Authority, State Personal Income | | | | |
| Tax Revenue (General Purpose) | 5.00 | 2/15/25 | 3,000,000 | 3,642,990 |
| New York State Dormitory | | | | |
| Authority, State Personal Income | | | | |
| Tax Revenue (General Purpose) | 5.00 | 2/15/26 | 1,730,000 | 2,013,910 |
| New York State Dormitory | | | | |
| Authority, State Personal Income | | | | |
| Tax Revenue (General Purpose) | 5.00 | 3/15/31 | 5,000,000 | 5,852,300 |
| New York State Dormitory | | | | |
| Authority, State Sales Tax Revenue | 5.00 | 3/15/23 | 1,430,000 | 1,758,285 |
| New York State Dormitory | | | | |
| Authority, State Sales Tax Revenue | 5.00 | 3/15/44 | 3,000,000 | 3,466,410 |
| New York State Dormitory Authority, | | | | |
| Third General Resolution Revenue | | | | |
| (State University Educational | | | | |
| Facilities Issue) | 5.00 | 5/15/30 | 2,000,000 | 2,336,140 |
| New York State Energy Research | | | | |
| and Development Authority, Gas | | | | |
| Facilities Revenue (The Brooklyn | | | | |
| Union Gas Company Project) | 6.37 | 4/1/20 | 5,000,000 | 5,006,800 |
| New York State Environmental | | | | |
| Facilities Corporation, State | | | | |
| Clean Water and Drinking Water | | | | |
| Revolving Funds Revenue (New | | | | |
| York City Municipal Water | | | | |
| Finance Authority Projects— | | | | |
| Second Resolution Bonds) | 5.00 | 6/15/27 | 2,810,000 | 3,419,967 |
| New York State Environmental | | | | |
| Facilities Corporation, State Clean | | | | |
| Water and Drinking Water Revolving | | | | |
| Funds Revenue (New York City | | | | |
| Municipal Water Finance Authority | | | | |
| Projects—Second Resolution Bonds) | 5.00 | 6/15/29 | 2,470,000 | 2,876,513 |
The Fund 15
STATEMENT OF INVESTMENTS (continued)
| | | | | |
| Long-Term Municipal | Coupon | Maturity | Principal | | |
| Investments (continued) | Rate (%) | Date | Amount ($) | | Value ($) |
| New York (continued) | | | | | |
| New York State Environmental | | | | | |
| Facilities Corporation, State | | | | | |
| Revolving Funds Revenue | | | | | |
| (Master Financing Program) | 5.00 | 5/15/30 | 2,000,000 | | 2,358,380 |
| New York State Environmental | | | | | |
| Facilities Corporation, State | | | | | |
| Revolving Funds Revenue | | | | | |
| (Master Financing Program) | | | | | |
| (Green Bonds) | 5.00 | 5/15/26 | 5,505,000 | | 6,758,874 |
| New York State Mortgage Agency, | | | | | |
| Mortgage Revenue | 5.00 | 4/1/28 | 800,000 | | 851,896 |
| New York State Power Authority, | | | | | |
| Revenue | 5.00 | 11/15/31 | 1,000,000 | | 1,149,360 |
| New York State Thruway Authority, | | | | | |
| General Revenue | 5.00 | 1/1/42 | 1,500,000 | d | 1,657,530 |
| New York State Thruway Authority, | | | | | |
| General Revenue (Insured; | | | | | |
| National Public Finance | | | | | |
| Guarantee Corp.) | 5.00 | 1/1/27 | 5,000,000 | d | 5,524,300 |
| New York State Thruway Authority, | | | | | |
| Second General Highway and | | | | | |
| Bridge Trust Fund Bonds | 5.00 | 4/1/25 | 5,000,000 | d | 5,460,250 |
| New York State Thruway Authority, | | | | | |
| Second General Highway and | | | | | |
| Bridge Trust Fund Bonds | 5.00 | 4/1/26 | 2,500,000 | d | 2,833,475 |
| New York State Thruway Authority, | | | | | |
| Second General Highway and | | | | | |
| Bridge Trust Fund Bonds | 5.00 | 4/1/26 | 2,500,000 | d | 2,875,400 |
| New York State Thruway Authority, | | | | | |
| Second General Highway and | | | | | |
| Bridge Trust Fund Bonds | 5.00 | 4/1/27 | 3,000,000 | d | 3,302,730 |
| New York State Thruway Authority, | | | | | |
| Second General Highway and | | | | | |
| Bridge Trust Fund Bonds | | | | | |
| (Insured; AMBAC) | 5.00 | 4/1/19 | 5,755,000 | d | 5,982,553 |
| New York State Thruway Authority, | | | | | |
| Second General Highway and | | | | | |
| Bridge Trust Fund Bonds | | | | | |
| (Insured; AMBAC) | 5.00 | 4/1/22 | 5,000,000 | d | 5,301,850 |
16
| | | | | |
| Long-Term Municipal | Coupon | Maturity | Principal | | |
| Investments (continued) | Rate (%) | Date | Amount ($) | | Value ($) |
| New York (continued) | | | | | |
| New York State Thruway Authority, | | | | | |
| Second General Highway and | | | | | |
| Bridge Trust Fund Bonds | | | | | |
| (Insured; AMBAC) (Prerefunded) | 5.00 | 10/1/15 | 450,000 | c | 468,387 |
| New York State Thruway Authority, | | | | | |
| State Personal Income Tax | | | | | |
| Revenue (Transportation) | 5.25 | 3/15/27 | 3,000,000 | | 3,330,840 |
| New York State Urban Development | | | | | |
| Corporation, State Personal | | | | | |
| Income Tax Revenue (Economic | | | | | |
| Development and Housing) | | | | | |
| (Insured; AMBAC) | 5.00 | 12/15/23 | 2,000,000 | | 2,098,580 |
| Niagara Tobacco Asset | | | | | |
| Securitization Corporation, | | | | | |
| Tobacco Settlement | | | | | |
| Asset-Backed Bonds | 5.25 | 5/15/34 | 1,000,000 | | 1,134,330 |
| Niagara Tobacco Asset | | | | | |
| Securitization Corporation, | | | | | |
| Tobacco Settlement | | | | | |
| Asset-Backed Bonds | 5.25 | 5/15/40 | 1,000,000 | | 1,120,680 |
| Onondaga Civic Development | | | | | |
| Corporation, Revenue (Saint | | | | | |
| Joseph’s Hospital Health | | | | | |
| Center Project) | 5.13 | 7/1/31 | 1,750,000 | | 1,848,297 |
| Port Authority of New York and New | | | | | |
| Jersey (Consolidated Bonds, | | | | | |
| 93rd Series) | 6.13 | 6/1/94 | 1,955,000 | d | 2,314,036 |
| Port Authority of New York and New | | | | | |
| Jersey (Consolidated Bonds, | | | | | |
| 163rd Series) | 5.00 | 7/15/35 | 5,000,000 | d | 5,707,000 |
| Port Authority of New York and New | | | | | |
| Jersey (Consolidated Bonds, | | | | | |
| 179th Series) | 5.00 | 12/1/25 | 2,000,000 | d | 2,420,940 |
| Port Authority of New York and New | | | | | |
| Jersey (Consolidated Bonds, | | | | | |
| 183rd Series) | 5.00 | 12/15/26 | 3,000,000 | d | 3,644,040 |
| Port Authority of New York and New | | | | | |
| Jersey (Consolidated Bonds, | | | | | |
| 184th Series) | 5.00 | 9/1/36 | 2,500,000 | d | 2,896,075 |
The Fund 17
STATEMENT OF INVESTMENTS (continued)
| | | | | |
| Long-Term Municipal | Coupon | Maturity | Principal | | |
| Investments (continued) | Rate (%) | Date | Amount ($) | | Value ($) |
| New York (continued) | | | | | |
| Port Authority of New York and New | | | | | |
| Jersey (Consolidated Bonds, | | | | | |
| 184th Series) | 5.00 | 9/1/39 | 2,000,000 | d | 2,300,500 |
| Port Authority of New York and New | | | | | |
| Jersey, Special Project Bonds | | | | | |
| (JFK International Air | | | | | |
| Terminal LLC Project) | 6.00 | 12/1/36 | 2,000,000 | d | 2,332,420 |
| Sales Tax Asset Receivable | | | | | |
| Corporation, Sales Tax | | | | | |
| Asset Revenue | 5.00 | 10/15/31 | 1,000,000 | | 1,204,530 |
| Schenectady Industrial Development | | | | | |
| Agency, Civic Facility Revenue | | | | | |
| (Union College Project) | 5.00 | 7/1/25 | 2,260,000 | | 2,413,680 |
| Schenectady Industrial Development | | | | | |
| Agency, Civic Facility Revenue | | | | | |
| (Union College Project) | 5.00 | 7/1/26 | 1,380,000 | | 1,472,695 |
| Suffolk County Economic | | | | | |
| Development Corporation, | | | | | |
| Revenue (Catholic Health | | | | | |
| Services of Long Island | | | | | |
| Obligated Group Project) | 5.00 | 7/1/22 | 1,000,000 | | 1,148,770 |
| Suffolk Tobacco Asset | | | | | |
| Securitization Corporation, | | | | | |
| Tobacco Settlement | | | | | |
| Asset-Backed Bonds | 6.00 | 6/1/48 | 5,000,000 | | 4,408,500 |
| Triborough Bridge and Tunnel | | | | | |
| Authority, General Purpose | | | | | |
| Revenue (Prerefunded) | 5.50 | 1/1/22 | 2,000,000 | c | 2,497,360 |
| Triborough Bridge and Tunnel | | | | | |
| Authority, General Revenue | | | | | |
| (MTA Bridges and Tunnels) | 5.00 | 11/15/25 | 1,250,000 | d | 1,507,563 |
| Triborough Bridge and Tunnel | | | | | |
| Authority, General Revenue | | | | | |
| (MTA Bridges and Tunnels) | 5.00 | 11/15/27 | 1,640,000 | d | 1,872,437 |
18
| | | | | |
| Long-Term Municipal | Coupon | Maturity | Principal | | |
| Investments (continued) | Rate (%) | Date | Amount ($) | | Value ($) |
| New York (continued) | | | | | |
| Triborough Bridge and Tunnel | | | | | |
| Authority, General Revenue | | | | | |
| (MTA Bridges and Tunnels) | 5.00 | 1/1/28 | 2,000,000 | d | 2,359,340 |
| Triborough Bridge and Tunnel | | | | | |
| Authority, General Revenue | | | | | |
| (MTA Bridges and Tunnels) | 5.00 | 11/15/31 | 3,265,000 | d | 3,826,645 |
| Triborough Bridge and Tunnel | | | | | |
| Authority, General Revenue | | | | | |
| (MTA Bridges and Tunnels) | 5.00 | 11/15/38 | 1,000,000 | d | 1,136,560 |
| Westchester County Health Care | | | | | |
| Corporation, Senior Lien Revenue | 6.00 | 11/1/30 | 1,000,000 | | 1,162,890 |
| Westchester County Local | | | | | |
| Development Corporation, | | | | | |
| Revenue (Kendal on | | | | | |
| Hudson Project) | 5.00 | 1/1/28 | 2,700,000 | | 2,919,888 |
| Westchester Tobacco Asset | | | | | |
| Securitization Corporation, | | | | | |
| Tobacco Settlement | | | | | |
| Asset-Backed Bonds | 5.00 | 6/1/26 | 2,000,000 | | 1,960,760 |
| Westchester Tobacco Asset | | | | | |
| Securitization Corporation, | | | | | |
| Tobacco Settlement | | | | | |
| Asset-Backed Bonds | 5.13 | 6/1/45 | 1,200,000 | | 986,292 |
| U.S. Related—2.6% | | | | | |
| Guam, | | | | | |
| Business Privilege Tax Revenue | 5.00 | 1/1/42 | 2,000,000 | | 2,167,940 |
| Guam, | | | | | |
| Hotel Occupancy Tax Revenue | 5.25 | 11/1/18 | 1,100,000 | | 1,257,157 |
| Guam, | | | | | |
| Hotel Occupancy Tax Revenue | 5.50 | 11/1/19 | 1,000,000 | | 1,170,420 |
| Guam Waterworks Authority, | | | | | |
| Water and Wastewater | | | | | |
| System Revenue | 5.63 | 7/1/40 | 1,000,000 | | 1,109,450 |
The Fund 19
STATEMENT OF INVESTMENTS (continued)
| | | | | | |
| Long-Term Municipal | Coupon | Maturity | Principal | | | |
| Investments (continued) | Rate (%) | Date | Amount ($) | | Value ($) | |
| U.S. Related (continued) | | | | | | |
| Puerto Rico Aqueduct and Sewer | | | | | | |
| Authority, Senior Lien Revenue | | | | | | |
| (Insured; Assured Guaranty Corp.) | 5.00 | 7/1/28 | 2,000,000 | | 2,011,200 | |
| Virgin Islands Public Finance | | | | | | |
| Authority, Revenue (Virgin | | | | | | |
| Islands Matching Fund Loan Note) | 5.00 | 10/1/25 | 2,500,000 | | 2,796,550 | |
| |
| Total Investments (cost $382,901,034) | | 100.3 | % | 409,140,529 | |
| Liabilities, Less Cash and Receivables | | | (.3 | %) | (1,339,169 | ) |
| Net Assets | | | 100.0 | % | 407,801,360 | |
|
| a Collateral for floating rate borrowings. |
| b Securities exempt from registration pursuant to Rule 144A under the Securities Act of 1933.These securities may be |
| resold in transactions exempt from registration, normally to qualified institutional buyers.At November 30, 2014, |
| these securities were valued at $20,928,820 or 5.1% of net assets. |
| c These securities are prerefunded; the date shown represents the prerefunded date. Bonds which are prerefunded are |
| collateralized by U.S. Government securities which are held in escrow and are used to pay principal and interest on |
| the municipal issue and to retire the bonds in full at the earliest refunding date. |
| d At November 30, 2014, the fund had $115,213,084 or 28.3% of net assets invested in securities whose payment |
| of principal and interest is dependent upon revenues generated from transportation. |
| | | |
| Portfolio Summary (Unaudited)† | | |
| |
| | Value (%) | | Value (%) |
| Transportation Services | 28.3 | Utility-Electric | 2.4 |
| Education | 19.1 | State/Territory | 1.1 |
| Special Tax | 16.6 | Asset-Backed | .7 |
| Health Care | 9.3 | Pollution Control | .7 |
| Utility-Water and Sewer | 7.9 | Housing | .2 |
| City | 4.3 | Other | 3.4 |
| Prerefunded | 3.7 | | |
| Industrial | 2.6 | | 100.3 |
| |
| † Based on net assets. | | | |
20
| | | |
| Summary of Abbreviations | | |
| |
| ABAG | Association of Bay Area | ACA | American Capital Access |
| | Governments | | |
| AGC | ACE Guaranty Corporation | AGIC | Asset Guaranty Insurance Company |
| AMBAC | American Municipal Bond | ARRN | Adjustable Rate |
| | Assurance Corporation | | Receipt Notes |
| BAN | Bond Anticipation Notes | BPA | Bond Purchase Agreement |
| CIFG | CDC Ixis Financial Guaranty | COP | Certificate of Participation |
| CP | Commercial Paper | DRIVERS | Derivative Inverse |
| | | | Tax-Exempt Receipts |
| EDR | Economic Development | EIR | Environmental Improvement |
| | Revenue | | Revenue |
| FGIC | Financial Guaranty | FHA | Federal Housing |
| | Insurance Company | | Administration |
| FHLB | Federal Home | FHLMC | Federal Home Loan Mortgage |
| | Loan Bank | | Corporation |
| FNMA | Federal National | GAN | Grant Anticipation Notes |
| | Mortgage Association | | |
| GIC | Guaranteed Investment | GNMA | Government National Mortgage |
| | Contract | | Association |
| GO | General Obligation | HR | Hospital Revenue |
| IDB | Industrial Development Board | IDC | Industrial Development Corporation |
| IDR | Industrial Development | LIFERS | Long Inverse Floating |
| | Revenue | | Exempt Receipts |
| LOC | Letter of Credit | LOR | Limited Obligation Revenue |
| LR | Lease Revenue | MERLOTS | Municipal Exempt Receipts |
| | | | Liquidity Option Tender |
| MFHR | Multi-Family Housing Revenue | MFMR | Multi-Family Mortgage Revenue |
| PCR | Pollution Control Revenue | PILOT | Payment in Lieu of Taxes |
| P-FLOATS | Puttable Floating Option | PUTTERS | Puttable Tax-Exempt Receipts |
| | Tax-Exempt Receipts | | |
| RAC | Revenue Anticipation Certificates | RAN | Revenue Anticipation Notes |
| RAW | Revenue Anticipation Warrants | RIB | Residual Interest Bonds |
| ROCS | Reset Options Certificates | RRR | Resources Recovery Revenue |
| SAAN | State Aid Anticipation Notes | SBPA | Standby Bond Purchase Agreement |
| SFHR | Single Family Housing Revenue | SFMR | Single Family Mortgage Revenue |
| SONYMA | State of New York | SPEARS | Short Puttable Exempt |
| | Mortgage Agency | | Adjustable Receipts |
| SWDR | Solid Waste Disposal Revenue | TAN | Tax Anticipation Notes |
| TAW | Tax Anticipation Warrants | TRAN | Tax and Revenue Anticipation Notes |
| XLCA | XL Capital Assurance | | |
| |
| See notes to financial statements. | | |
The Fund 21
STATEMENT OF ASSETS AND LIABILITIES
November 30, 2014
| | | |
| | Cost | Value | |
| Assets ($): | | | |
| Investments in securities—See Statement of Investments | 382,901,034 | 409,140,529 | |
| Cash | | 1,342,824 | |
| Interest receivable | | 4,750,435 | |
| Receivable for shares of Beneficial Interest subscribed | | 92,925 | |
| Prepaid expenses | | 19,069 | |
| | | 415,345,782 | |
| Liabilities ($): | | | |
| Due to The Dreyfus Corporation and affiliates—Note 3(c) | | 305,699 | |
| Payable for floating rate notes issued—Note 4 | | 7,000,000 | |
| Payable for shares of Beneficial Interest redeemed | | 179,067 | |
| Interest and expense payable related to | | | |
| floating rate notes issued—Note 4 | | 9,281 | |
| Accrued expenses | | 50,375 | |
| | | 7,544,422 | |
| Net Assets ($) | | 407,801,360 | |
| Composition of Net Assets ($): | | | |
| Paid-in capital | | 392,655,007 | |
| Accumulated undistributed investment income—net | | 68,923 | |
| Accumulated net realized gain (loss) on investments | | (11,162,065 | ) |
| Accumulated net unrealized appreciation | | | |
| (depreciation) on investments | | 26,239,495 | |
| Net Assets ($) | | 407,801,360 | |
| | | | |
| Net Asset Value Per Share | | | | |
| | Class A | Class C | Class I | Class Y |
| Net Assets ($) | 351,370,672 | 24,238,614 | 32,191,053 | 1,021 |
| Shares Outstanding | 23,568,157 | 1,625,638 | 2,159,087 | 68.49 |
| Net Asset Value Per Share ($) | 14.91 | 14.91 | 14.91 | 14.91 |
| See notes to financial statements. | | | | |
22
STATEMENT OF OPERATIONS
Year Ended November 30, 2014
| | |
| Investment Income ($): | | |
| Interest Income | 16,086,350 | |
| Expenses: | | |
| Management fee—Note 3(a) | 2,130,521 | |
| Shareholder servicing costs—Note 3(c) | 1,047,168 | |
| Distribution fees—Note 3(b) | 153,096 | |
| Professional fees | 93,969 | |
| Registration fees | 56,837 | |
| Interest and expense related to floating rate notes issued—Note 4 | 47,321 | |
| Custodian fees—Note 3(c) | 32,928 | |
| Prospectus and shareholders’ reports | 22,842 | |
| Trustees’ fees and expenses—Note 3(d) | 18,269 | |
| Loan commitment fees—Note 2 | 3,549 | |
| Miscellaneous | 42,331 | |
| Total Expenses | 3,648,831 | |
| Less—reduction in fees due to earnings credits—Note 3(c) | (207 | ) |
| Net Expenses | 3,648,624 | |
| Investment Income—Net | 12,437,726 | |
| Realized and Unrealized Gain (Loss) on Investments—Note 4 ($): | | |
| Net realized gain (loss) on investments | (6,437,431 | ) |
| Net unrealized appreciation (depreciation) on investments | 22,390,133 | |
| Net Realized and Unrealized Gain (Loss) on Investments | 15,952,702 | |
| Net Increase in Net Assets Resulting from Operations | 28,390,428 | |
| |
| See notes to financial statements. | | |
The Fund 23
STATEMENT OF CHANGES IN NET ASSETS
| | | | |
| | Year Ended November 30, | |
| | 2014 | | 2013 | a |
| Operations ($): | | | | |
| Investment income—net | 12,437,726 | | 13,321,489 | |
| Net realized gain (loss) on investments | (6,437,431 | ) | (542,805 | ) |
| Net unrealized appreciation | | | | |
| (depreciation) on investments | 22,390,133 | | (38,728,693 | ) |
| Net Increase (Decrease) in Net Assets | | | | |
| Resulting from Operations | 28,390,428 | | (25,950,009 | ) |
| Dividends to Shareholders from ($): | | | | |
| Investment income—net: | | | | |
| Class A | (11,105,107 | ) | (11,780,703 | ) |
| Class C | (498,980 | ) | (524,150 | ) |
| Class I | (796,691 | ) | (976,121 | ) |
| Class Y | (34 | ) | (15 | ) |
| Total Dividends | (12,400,812 | ) | (13,280,989 | ) |
| Beneficial Interest Transactions ($): | | | | |
| Net proceeds from shares sold: | | | | |
| Class A | 44,760,539 | | 48,081,277 | |
| Class C | 8,164,725 | | 8,691,017 | |
| Class I | 24,453,482 | | 19,826,226 | |
| Class Y | — | | 1,000 | |
| Dividends reinvested: | | | | |
| Class A | 9,017,141 | | 9,444,961 | |
| Class C | 407,913 | | 421,619 | |
| Class I | 615,641 | | 760,587 | |
| Cost of shares redeemed: | | | | |
| Class A | (60,643,431 | ) | (84,248,693 | ) |
| Class C | (5,670,382 | ) | (7,783,890 | ) |
| Class I | (15,926,893 | ) | (21,798,616 | ) |
| Increase (Decrease) in Net Assets from | | | | |
| Beneficial Interest Transactions | 5,178,735 | | (26,604,512 | ) |
| Total Increase (Decrease) in Net Assets | 21,168,351 | | (65,835,510 | ) |
| Net Assets ($): | | | | |
| Beginning of Period | 386,633,009 | | 452,468,519 | |
| End of Period | 407,801,360 | | 386,633,009 | |
| Undistributed investment income—net | 68,923 | | 36,534 | |
24
| | | | |
| | Year Ended November 30, | |
| | 2014 | | 2013 | a |
| Capital Share Transactions: | | | | |
| Class Ab | | | | |
| Shares sold | 3,050,313 | | 3,202,895 | |
| Shares issued for dividends reinvested | 615,098 | | 638,356 | |
| Shares redeemed | (4,162,560 | ) | (5,745,904 | ) |
| Net Increase (Decrease) in Shares Outstanding | (497,149 | ) | (1,904,653 | ) |
| Class Cb | | | | |
| Shares sold | 552,728 | | 575,282 | |
| Shares issued for dividends reinvested | 27,819 | | 28,516 | |
| Shares redeemed | (390,181 | ) | (528,122 | ) |
| Net Increase (Decrease) in Shares Outstanding | 190,366 | | 75,676 | |
| Class I | | | | |
| Shares sold | 1,671,634 | | 1,314,402 | |
| Shares issued for dividends reinvested | 41,856 | | 51,450 | |
| Shares redeemed | (1,103,409 | ) | (1,489,579 | ) |
| Net Increase (Decrease) in Shares Outstanding | 610,081 | | (123,727 | ) |
| Class Y | | | | |
| Shares sold | — | | 68.49 | |
|
| a Effective July 1, 2013, the fund commenced offering ClassY shares. |
| b During the period ended November 30, 2013, 29,976 Class C shares representing $458,140 were exchanged for |
| 30,022 Class A shares. |
See notes to financial statements.
The Fund 25
FINANCIAL HIGHLIGHTS
The following tables describe the performance for each share class for the fiscal periods indicated. All information (except portfolio turnover rate) reflects financial results for a single fund share.Total return shows how much your investment in the fund would have increased (or decreased) during each period, assuming you had reinvested all dividends and distributions.These figures have been derived from the fund’s financial statements.
| | | | | | | | | | |
| | | | Year Ended November 30, | | | |
| Class A Shares | 2014 | | 2013 | | 2012 | | 2011 | | 2010 | |
| Per Share Data ($): | | | | | | | | | | |
| Net asset value, beginning of period | 14.29 | | 15.60 | | 14.62 | | 14.35 | | 14.28 | |
| Investment Operations: | | | | | | | | | | |
| Investment income—neta | .47 | | .46 | | .52 | | .55 | | .56 | |
| Net realized and unrealized | | | | | | | | | | |
| gain (loss) on investments | .62 | | (1.31 | ) | .98 | | .27 | | .07 | |
| Total from Investment Operations | 1.09 | | (.85 | ) | 1.50 | | .82 | | .63 | |
| Distributions: | | | | | | | | | | |
| Dividends from investment income—net | (.47 | ) | (.46 | ) | (.52 | ) | (.55 | ) | (.56 | ) |
| Net asset value, end of period | 14.91 | | 14.29 | | 15.60 | | 14.62 | | 14.35 | |
| Total Return (%)b | 7.76 | | (5.52 | ) | 10.39 | | 5.89 | | 4.40 | |
| Ratios/Supplemental Data (%): | | | | | | | | | | |
| Ratio of total expenses | | | | | | | | | | |
| to average net assets | .92 | | .90 | | .91 | | .92 | | .92 | |
| Ratio of net expenses | | | | | | | | | | |
| to average net assets | .92 | | .90 | | .91 | | .91 | | .85 | |
| Ratio of interest and expense related | | | | | | | | | | |
| to floating rate notes issued | | | | | | | | | | |
| to average net assets | .01 | | .01 | | .00 | c | .00 | c | .00 | c |
| Ratio of net investment income | | | | | | | | | | |
| to average net assets | 3.24 | | 3.09 | | 3.41 | | 3.87 | | 3.81 | |
| Portfolio Turnover Rate | 20.10 | | 12.95 | | 9.96 | | 10.20 | | 10.32 | |
| Net Assets, end of period ($ x 1,000) | 351,371 | | 343,975 | | 405,161 | | 352,610 | | 367,649 | |
| |
| a | Based on average shares outstanding. |
| b | Exclusive of sales charge. |
| c | Amount represents less than .01%. |
See notes to financial statements.
26
| | | | | | | | | | |
| | | | Year Ended November 30, | | | |
| Class C Shares | 2014 | | 2013 | | 2012 | | 2011 | | 2010 | |
| Per Share Data ($): | | | | | | | | | | |
| Net asset value, beginning of period | 14.30 | | 15.60 | | 14.62 | | 14.35 | | 14.28 | |
| Investment Operations: | | | | | | | | | | |
| Investment income—neta | .36 | | .35 | | .40 | | .44 | | .45 | |
| Net realized and unrealized | | | | | | | | | | |
| gain (loss) on investments | .61 | | (1.31 | ) | .98 | | .27 | | .07 | |
| Total from Investment Operations | .97 | | (.96 | ) | 1.38 | | .71 | | .52 | |
| Distributions: | | | | | | | | | | |
| Dividends from investment income—net | (.36 | ) | (.34 | ) | (.40 | ) | (.44 | ) | (.45 | ) |
| Net asset value, end of period | 14.91 | | 14.30 | | 15.60 | | 14.62 | | 14.35 | |
| Total Return (%)b | 6.93 | | (6.24 | ) | 9.55 | | 5.09 | | 3.62 | |
| Ratios/Supplemental Data (%): | | | | | | | | | | |
| Ratio of total expenses | | | | | | | | | | |
| to average net assets | 1.68 | | 1.67 | | 1.68 | | 1.68 | | 1.68 | |
| Ratio of net expenses | | | | | | | | | | |
| to average net assets | 1.68 | | 1.67 | | 1.68 | | 1.66 | | 1.60 | |
| Ratio of interest and expense related | | | | | | | | | | |
| to floating rate notes issued | | | | | | | | | | |
| to average net assets | .01 | | .01 | | .00 | c | .00 | c | .00 | c |
| Ratio of net investment income | | | | | | | | | | |
| to average net assets | 2.45 | | 2.32 | | 2.61 | | 3.11 | | 3.07 | |
| Portfolio Turnover Rate | 20.10 | | 12.95 | | 9.96 | | 10.20 | | 10.32 | |
| Net Assets, end of period ($ x 1,000) | 24,239 | | 20,517 | | 21,214 | | 13,260 | | 14,110 | |
| |
| a | Based on average shares outstanding. |
| b | Exclusive of sales charge. |
| c | Amount represents less than .01%. |
See notes to financial statements.
The Fund 27
FINANCIAL HIGHLIGHTS (continued)
| | | | | | | | | | |
| | | | Year Ended November 30, | | | |
| Class I Shares | 2014 | | 2013 | | 2012 | | 2011 | | 2010 | |
| Per Share Data ($): | | | | | | | | | | |
| Net asset value, beginning of period | 14.29 | | 15.60 | | 14.62 | | 14.35 | | 14.28 | |
| Investment Operations: | | | | | | | | | | |
| Investment income—neta | .50 | | .50 | | .53 | | .57 | | .58 | |
| Net realized and unrealized | | | | | | | | | | |
| gain (loss) on investments | .63 | | (1.31 | ) | 1.00 | | .28 | | .07 | |
| Total from Investment Operations | 1.13 | | (.81 | ) | 1.53 | | .85 | | .65 | |
| Distributions: | | | | | | | | | | |
| Dividends from investment income—net | (.51 | ) | (.50 | ) | (.55 | ) | (.58 | ) | (.58 | ) |
| Net asset value, end of period | 14.91 | | 14.29 | | 15.60 | | 14.62 | | 14.35 | |
| Total Return (%) | 8.03 | | (5.28 | ) | 10.65 | | 6.13 | | 4.58 | |
| Ratios/Supplemental Data (%): | | | | | | | | | | |
| Ratio of total expenses | | | | | | | | | | |
| to average net assets | .66 | | .64 | | .68 | | .68 | | .67 | |
| Ratio of net expenses | | | | | | | | | | |
| to average net assets | .66 | | .64 | | .68 | | .68 | | .67 | |
| Ratio of interest and expense related | | | | | | | | | | |
| to floating rate notes issued | | | | | | | | | | |
| to average net assets | .01 | | .01 | | .00 | b | .00 | b | .00 | b |
| Ratio of net investment income | | | | | | | | | | |
| to average net assets | 3.45 | | 3.34 | | 3.55 | | 4.08 | | 3.97 | |
| Portfolio Turnover Rate | 20.10 | | 12.95 | | 9.96 | | 10.20 | | 10.32 | |
| Net Assets, end of period ($ x 1,000) | 32,191 | | 22,139 | | 26,094 | | 4,068 | | 6,553 | |
| |
| a | Based on average shares outstanding. |
| b | Amount represents less than .01%. |
See notes to financial statements.
28
| | | | |
| | Year Ended November 30, | |
| Class Y Shares | 2014 | | 2013 | a |
| Per Share Data ($): | | | | |
| Net asset value, beginning of period | 14.30 | | 14.60 | |
| Investment Operations: | | | | |
| Investment income—netb | .49 | | .23 | |
| Net realized and unrealized | | | | |
| gain (loss) on investments | .61 | | (.31 | ) |
| Total from Investment Operations | 1.10 | | (.08 | ) |
| Distributions: | | | | |
| Dividends from investment income—net | (.49 | ) | (.22 | ) |
| Net asset value, end of period | 14.91 | | 14.30 | |
| Total Return (%) | 7.89 | | (.62 | )c |
| Ratios/Supplemental Data (%): | | | | |
| Ratio of total expenses to average net assets | .79 | | .55 | d |
| Ratio of net expenses to average net assets | .79 | | .55 | d |
| Ratio of interest and expense related to | | | | |
| floating rate notes issued to average net assets | .01 | | .01 | d |
| Ratio of net investment income to average net assets | 3.32 | | 3.79 | d |
| Portfolio Turnover Rate | 20.10 | | 12.95 | |
| Net Assets, end of period ($ x 1,000) | 1 | | 1 | |
| |
| a | From July 1, 2013 (commencement of initial offering) to November 30, 2013. |
| b | Based on average shares outstanding. |
| c | Not annualized. |
| d | Annualized. |
See notes to financial statements.
The Fund 29
NOTES TO FINANCIAL STATEMENTS
NOTE 1—Significant Accounting Policies:
Dreyfus New York AMT-Free Municipal Bond Fund (the “fund”) is registered under the Investment Company Act of 1940, as amended (the “Act”), as a non-diversified open-end management investment company. The fund’s investment objective is to maximize current income exempt from federal, New York state and New York city income taxes to the extent consistent with the preservation of capital. The Dreyfus Corporation (the “Manager” or “Dreyfus”), a wholly-owned subsidiary of The Bank of New York Mellon Corporation (“BNY Mellon”), serves as the fund’s investment adviser.
MBSC Securities Corporation (the “Distributor”), a wholly-owned subsidiary of the Manager, is the distributor of the fund’s shares. The fund is authorized to issue an unlimited number of $.001 par value shares of Beneficial Interest in each of the following classes of shares: Class A, Class C, Class I and ClassY. Class A shares generally are subject to a sales charge imposed at the time of purchase. Class C shares are subject to a contingent deferred sales charge (“CDSC”) imposed on Class C shares redeemed within one year of purchase. Class I and Class Y shares are sold at net asset value per share generally to institutional investors. Other differences between the classes include the services offered to and the expenses borne by each class, the allocation of certain transfer agency costs, and certain voting rights. Income, expenses (other than expenses attributable to a specific class), and realized and unrealized gains or losses on investments are allocated to each class of shares based on its relative net assets.
As of November 30, 2014, MBC Investments Corp., an indirect subsidiary of BNY Mellon, held all of the outstanding Class Y shares of the fund.
The Financial Accounting Standards Board (“FASB”) Accounting Standards Codification (“ASC”) is the exclusive reference of authoritative U.S. generally accepted accounting principles (“GAAP”) recognized by the FASB to be applied by nongovernmental entities. Rules and interpretive releases of the Securities and Exchange Commission (“SEC”)
30
under authority of federal laws are also sources of authoritative GAAP for SEC registrants. The fund’s financial statements are prepared in accordance with GAAP, which may require the use of management estimates and assumptions. Actual results could differ from those estimates.
The fund enters into contracts that contain a variety of indemnifications. The fund’s maximum exposure under these arrangements is unknown.The fund does not anticipate recognizing any loss related to these arrangements.
(a) Portfolio valuation: The fair value of a financial instrument is the amount that would be received to sell an asset or paid to transfer a liability in an orderly transaction between market participants at the measurement date (i.e., the exit price). GAAP establishes a fair value hierarchy that prioritizes the inputs of valuation techniques used to measure fair value. This hierarchy gives the highest priority to unadjusted quoted prices in active markets for identical assets or liabilities (Level 1 measurements) and the lowest priority to unobservable inputs (Level 3 measurements).
Additionally, GAAP provides guidance on determining whether the volume and activity in a market has decreased significantly and whether such a decrease in activity results in transactions that are not orderly. GAAP requires enhanced disclosures around valuation inputs and techniques used during annual and interim periods.
Various inputs are used in determining the value of the fund’s investments relating to fair value measurements.These inputs are summarized in the three broad levels listed below:
Level 1—unadjusted quoted prices in active markets for identical investments.
Level 2—other significant observable inputs (including quoted prices for similar investments, interest rates, prepayment speeds, credit risk, etc.).
Level 3—significant unobservable inputs (including the fund’s own assumptions in determining the fair value of investments).
The Fund 31
NOTES TO FINANCIAL STATEMENTS (continued)
The inputs or methodology used for valuing securities are not necessarily an indication of the risk associated with investing in those securities.
Changes in valuation techniques may result in transfers in or out of an assigned level within the disclosure hierarchy. Valuation techniques used to value the fund’s investments are as follows:
Investments in securities are valued each business day by an independent pricing service (the “Service”) approved by the fund’s Board of Trustees (the “Board”). Investments for which quoted bid prices are readily available and are representative of the bid side of the market in the judgment of the Service are valued at the mean between the quoted bid prices (as obtained by the Service from dealers in such securities) and asked prices (as calculated by the Service based upon its evaluation of the market for such securities). Other investments (which constitute a majority of the portfolio securities) are carried at fair value as determined by the Service, based on methods which include consideration of the following: yields or prices of municipal securities of comparable quality, coupon, maturity and type; indications as to values from dealers; and general market conditions. All of the preceding securities are generally categorized within Level 2 of the fair value hierarchy.
The Service’s procedures are reviewed by Dreyfus under the general supervision of the Board.
When market quotations or official closing prices are not readily available, or are determined not to reflect accurately fair value, such as when the value of a security has been significantly affected by events after the close of the exchange or market on which the security is principally traded, but before the fund calculates its net asset value, the fund may value these investments at fair value as determined in accordance with the procedures approved by the Board. Certain factors may be considered when fair valuing investments such as: fundamental analytical data, the nature and duration of restrictions on disposition, an evaluation of the forces that influence the market in which the securities are purchased and sold, and public trading in similar securities of the issuer or
32
comparable issuers.These securities are either categorized within Level 2 or 3 of the fair value hierarchy depending on the relevant inputs used.
For restricted securities where observable inputs are limited, assumptions about market activity and risk are used and are generally categorized within Level 3 of the fair value hierarchy.
The following is a summary of the inputs used as of November 30, 2014 in valuing the fund’s investments:
| | | | | | |
| | | Level 2—Other | | Level 3— | | |
| | Level 1— | Significant | | Significant | | |
| | Unadjusted | Observable | | Unobservable | | |
| | Quoted Prices | Inputs | | Inputs | Total | |
| Assets ($) | | | | | | |
| Investments in Securities: | | | | | |
| Municipal Bonds† | — | 409,140,529 | | — | 409,140,529 | |
| Liabilities ($) | | | | | | |
| Floating Rate Notes†† | — | (7,000,000 | ) | — | (7,000,000 | ) |
| |
| † | See Statement of Investments for additional detailed categorizations. |
| †† | Certain of the fund’s liabilities are held at carrying amount, which approximates fair value for |
| | financial reporting purposes. |
At November 30, 2014, there were no transfers between Level 1 and Level 2 of the fair value hierarchy.
(b) Securities transactions and investment income: Securities transactions are recorded on a trade date basis. Realized gains and losses from securities transactions are recorded on the identified cost basis. Interest income, adjusted for accretion of discount and amortization of premium on investments, is earned from settlement date and recognized on the accrual basis. Securities purchased or sold on a when issued or delayed delivery basis may be settled a month or more after the trade date.
The fund follows an investment policy of investing primarily in municipal obligations of one state. Economic changes affecting the state and certain of its public bodies and municipalities may affect the ability of issuers within the state to pay interest on, or repay principal of, municipal obligations held by the fund.
The Fund 33
NOTES TO FINANCIAL STATEMENTS (continued)
(c) Dividends to shareholders: It is the policy of the fund to declare dividends daily from investment income-net. Such dividends are paid monthly. Dividends from net realized capital gains, if any, are normally declared and paid annually, but the fund may make distributions on a more frequent basis to comply with the distribution requirements of the Internal Revenue Code of 1986, as amended (the “Code”).To the extent that net realized capital gains can be offset by capital loss carryovers, it is the policy of the fund not to distribute such gains. Income and capital gain distributions are determined in accordance with income tax regulations, which may differ from GAAP.
(d) Federal income taxes: It is the policy of the fund to continue to qualify as a regulated investment company, which can distribute tax-exempt dividends, by complying with the applicable provisions of the Code, and to make distributions of income and net realized capital gain sufficient to relieve it from substantially all federal income and excise taxes.
As of and during the period ended November 30, 2014, the fund did not have any liabilities for any uncertain tax positions. The fund recognizes interest and penalties, if any, related to uncertain tax positions as income tax expense in the Statement of Operations. During the period ended November 30, 2014, the fund did not incur any interest or penalties.
Each tax year in the four-year period ended November 30, 2014 remains subject to examination by the Internal Revenue Service and state taxing authorities.
At November 30, 2014, the components of accumulated earnings on a tax basis were as follows: undistributed tax-exempt income $119,947, accumulated capital losses $11,185,446 and unrealized appreciation $26,262,876.
Under the Regulated Investment Company Modernization Act of 2010 (the “2010 Act”), the fund is permitted to carry forward capital losses incurred in taxable years beginning after December 22, 2010
34
(“post-enactment losses”) for an unlimited period. Furthermore, post-enactment capital loss carryovers retain their character as either short-term or long-term capital losses rather than short-term as they were under previous statute.The 2010 Act requires post-enactment losses to be utilized before the utilization of losses incurred in taxable years prior to the effective date of the 2010 Act (“pre-enactment losses”).As a result of this ordering rule, pre-enactment losses may be more likely to expire unused.
The accumulated capital loss carryover is available for federal income tax purposes to be applied against future net realized capital gains, if any, realized subsequent to November 30, 2014. If not applied, $1,821,970 of the carryover expires in fiscal year 2016, $1,480,006 expires in fiscal year 2017 and $487,305 expires in fiscal year 2019.The fund has $1,426,422 of post-enactment short-term capital losses and $5,969,743 of post-enactment long-term capital losses which can be carried forward for an unlimited period.
The tax character of distributions paid to shareholders during the fiscal periods ended November 30, 2014 and November 30, 2013 were as follows: tax-exempt income $12,400,812 and $13,280,989, respectively.
During the period ended November 30, 2014, as a result of permanent book to tax differences, primarily due to the tax treatment for amortization adjustments, the fund decreased accumulated undistributed investment income-net by $4,525 and increased accumulated net realized gain (loss) on investments by the same amount. Net assets and net asset value per share were not affected by this reclassification.
NOTE 2—Bank Lines of Credit:
The fund participates with other Dreyfus-managed funds in a $430 million unsecured credit facility led by Citibank, N.A. and a $300 million unsecured credit facility provided by The Bank of New York Mellon, a subsidiary of BNY Mellon and an affiliate of Dreyfus (each, a “Facility”), each to be utilized primarily for temporary or emergency
The Fund 35
NOTES TO FINANCIAL STATEMENTS (continued)
purposes, including the financing of redemptions. Prior to October 8, 2014, the unsecured credit facility with Citibank, N.A. was $265 million. In connection therewith, the fund has agreed to pay its pro rata portion of commitment fees for each Facility. Interest is charged to the fund based on rates determined pursuant to the terms of the respective Facility at the time of borrowing. During the period ended November 30, 2014, the fund did not borrow under the Facilities.
NOTE 3—Management Fee and Other Transactions with Affiliates:
(a) Pursuant to a management agreement with the Manager, the management fee is computed at the annual rate of .55% of the value of the fund’s average daily net assets and is payable monthly.
During the period ended November 30, 2014, the Distributor retained $8,872 from commissions earned on sales of the fund’s Class A shares and $1,642 from CDSCs on redemptions of the fund’s Class C shares.
(b) Under the Distribution Plan adopted pursuant to Rule 12b-1 under the Act, Class C shares pay the Distributor for distributing its shares at an annual rate of .75% of the value of its average daily net assets. During the period ended November 30, 2014, Class C shares were charged $153,096 pursuant to the Distribution Plan.
(c) Under the Shareholder Services Plan, Class A and Class C shares pay the Distributor at an annual rate of .25% of the value of their average daily net assets for the provision of certain services.The services provided may include personal services relating to shareholder accounts, such as answering shareholder inquiries regarding the fund and providing reports and other information, and services related to the maintenance of shareholder accounts.The Distributor may make payments to Service Agents (securities dealers, financial institutions or other industry professionals) with respect to these services.The Distributor determines the amounts to be paid to Service Agents. During the period ended November 30, 2014, Class A and Class C shares were charged $859,370 and $51,032, respectively, pursuant to the Shareholder Services Plan.
36
The fund has arrangements with the transfer agent and the custodian whereby the fund may receive earnings credits when positive cash balances are maintained, which are used to offset transfer agency and custody fees. For financial reporting purposes, the fund includes net earnings credits as an expense offset in the Statement of Operations.
The fund compensates Dreyfus Transfer, Inc., a wholly-owned subsidiary of the Manager, under a transfer agency agreement for providing transfer agency and cash management services for the fund. The majority of transfer agency fees are comprised of amounts paid on a per account basis, while cash management fees are related to fund subscriptions and redemptions. During the period ended November 30, 2014, the fund was charged $76,176 for transfer agency services and $3,294 for cash management services. These fees are included in Shareholder servicing costs in the Statement of Operations. Cash management fees were partially offset by earnings credits of $207.
The fund compensates The Bank of NewYork Mellon under a custody agreement for providing custodial services for the fund.These fees are determined based on net assets, geographic region and transaction activity. During the period ended November 30, 2014, the fund was charged $32,928 pursuant to the custody agreement.
The fund compensates The Bank of New York Mellon for performing certain cash management services related to fund subscriptions and redemptions, including shareholder redemption draft processing, under a cash management agreement. During the period ended November 30, 2014, the fund was charged $2,372 pursuant to the agreement, which is included in Shareholder servicing costs in the Statement of Operations.
During the period ended November 30, 2014, the fund was charged $7,919 for services performed by the Chief Compliance Officer and his staff.
The components of “Due to The Dreyfus Corporation and affiliates” in the Statement of Assets and Liabilities consist of: management fees $183,416, Distribution Plan fees $14,766, Shareholder Services Plan
The Fund 37
NOTES TO FINANCIAL STATEMENTS (continued)
fees $76,862, custodian fees $14,900, Chief Compliance Officer fees $1,234 and transfer agency fees $14,521.
(d) Each Board member also serves as a Board member of other funds within the Dreyfus complex. Annual retainer fees and attendance fees are allocated to each fund based on net assets.
NOTE 4—Securities Transactions:
The aggregate amount of purchases and sales of investment securities, excluding short-term securities, during the period ended November 30, 2014, amounted to $84,339,934 and $76,446,818, respectively.
Inverse Floater Securities: The fund participates in secondary inverse floater structures in which fixed-rate, tax-exempt municipal bonds are transferred to a trust (the “Trust”).The Trust typically issues two variable rate securities that are collateralized by the cash flows of the fixed-rate, tax-exempt municipal bonds. One of these variable rate securities pays interest based on a short-term floating rate set by a remarketing agent at predetermined intervals (“Trust Certificates”). A residual interest tax-exempt security is also created by the Trust, which is transferred to the fund, and is paid interest based on the remaining cash flows of the Trust, after payment of interest on the other securities and various expenses of the Trust.An inverse floater security may be collapsed without the consent of the fund due to certain termination events such as bankruptcy, default or other credit event.
The fund accounts for the transfer of bonds to the Trust as secured borrowings, with the securities transferred remaining in the fund’s investments, and the related floating rate certificate securities reflected as fund liabilities in the Statement of Assets and Liabilities.
The fund may invest in inverse floater securities on either a non-recourse or recourse basis. These securities are typically supported by a liquidity facility provided by a bank or other financial institution (the “Liquidity Provider”) that allows the holders of the Trust Certificates
38
to tender their certificates in exchange for payment from the Liquidity Provider of par plus accrued interest on any business day prior to a termination event. When the fund invests in inverse floater securities on a non-recourse basis, the Liquidity Provider is required to make a payment under the liquidity facility due to a termination event to the holders of the Trust Certificates. When this occurs, the Liquidity Provider typically liquidates all or a portion of the municipal securities held in the Trust. A liquidation shortfall occurs if the Trust Certificates exceed the proceeds of the sale of the bonds in the Trust (“Liquidation Shortfall”). When a fund invests in inverse floater securities on a recourse basis, the fund typically enters into a reimbursement agreement with the Liquidity Provider where the fund is required to repay the Liquidity Provider the amount of any Liquidation Shortfall. As a result, a fund investing in a recourse inverse floater security bears the risk of loss with respect to any Liquidation Shortfall.
The average amount of borrowings outstanding under the inverse floater structure during the period ended November 30, 2014 was approximately $7,000,000, with a related weighted average annualized interest rate of .68%.
At November 30, 2014, the cost of investments for federal income tax purposes was $375,877,653; accordingly, accumulated net unrealized appreciation on investments was $26,262,876, consisting of $27,084,734 gross unrealized appreciation and $821,858 gross unrealized depreciation.
The Fund 39
REPORT OF INDEPENDENT REGISTERED
PUBLIC ACCOUNTING FIRM
Shareholders and Board of Trustees
Dreyfus New York AMT-Free Municipal Bond Fund
We have audited the accompanying statement of assets and liabilities of Dreyfus New York AMT-Free Municipal Bond Fund, including the statement of investments, as of November 30, 2014, and the related statement of operations for the year then ended, the statement of changes in net assets for each of the two years in the period then ended, and the financial highlights for each of the periods indicated therein. These financial statements and financial highlights are the responsibility of the Fund’s management. Our responsibility is to express an opinion on these financial statements and financial highlights based on our audits.
We conducted our audits in accordance with the standards of the Public Company Accounting Oversight Board (United States). Those standards require that we plan and perform the audit to obtain reasonable assurance about whether the financial statements and financial highlights are free of material misstatement. We were not engaged to perform an audit of the Fund’s internal control over financial reporting. Our audits included consideration of internal control over financial reporting as a basis for designing audit procedures that are appropriate in the circumstances, but not for the purpose of expressing an opinion on the effectiveness of the Fund’s internal control over financial reporting. Accordingly, we express no such opinion. An audit also includes examining, on a test basis, evidence supporting the amounts and disclosures in the financial statements and financial highlights, assessing the accounting principles used and significant estimates made by management, and evaluating the overall financial statement presentation. Our procedures included confirmation of securities owned as of November 30, 2014 by correspondence with the custodian and others.We believe that our audits provide a reasonable basis for our opinion.
In our opinion, the financial statements and financial highlights referred to above present fairly, in all material respects, the financial position of Dreyfus New York AMT-Free Municipal Bond Fund at November 30, 2014, the results of its operations for the year then ended, the changes in its net assets for each of the two years in the period then ended, and the financial highlights for each of the indicated periods, in conformity with U.S. generally accepted accounting principles.

New York, New York
January 28, 2015
40
IMPORTANT TAX INFORMATION (Unaudited)
In accordance with federal tax law, the fund hereby reports all the dividends paid from investment income-net during its fiscal year ended November 30, 2014 as “exempt-interest dividends” (not subject to regular federal income tax, and for individuals who are NewYork residents, New York state and New York city personal income taxes). Where required by federal tax law rules, shareholders will receive notification of their portion of the fund’s taxable ordinary dividends (if any), capital gains distributions (if any) and tax-exempt dividends paid for the 2014 calendar year on Form 1099-DIV, which will be mailed in early 2015.
The Fund 41
INFORMATION ABOUT THE RENEWAL OF THE
FUND’S MANAGEMENT AGREEMENT (Unaudited)
At a meeting of the fund’s Board of Trustees held on July 22, 2014, the Board considered the renewal of the fund’s Management Agreement pursuant to which Dreyfus provides the fund with investment advisory and administrative services (the “Agreement”). The Board members, none of whom are “interested persons” (as defined in the Investment Company Act of 1940, as amended) of the fund, were assisted in their review by independent legal counsel and met with counsel in executive session separate from Dreyfus representatives. In considering the renewal of the Agreement, the Board considered all factors that it believed to be relevant, including those discussed below.The Board did not identify any one factor as dispositive, and each Board member may have attributed different weights to the factors considered.
Analysis of Nature, Extent, and Quality of Services Provided to the Fund. The Board considered information provided to them at the meeting and in previous presentations from Dreyfus representatives regarding the nature, extent, and quality of the services provided to funds in the Dreyfus fund complex. Dreyfus provided the number of open accounts in the fund, the fund’s asset size and the allocation of fund assets among distribution channels. Dreyfus also had previously provided information regarding the diverse intermediary relationships and distribution channels of funds in the Dreyfus fund complex (such as retail direct or intermediary, in which intermediaries typically are paid by the fund and/or Dreyfus) and Dreyfus’ corresponding need for broad, deep, and diverse resources to be able to provide ongoing shareholder services to each intermediary or distribution channel, as applicable to the fund.
The Board also considered research support available to, and portfolio management capabilities of, the fund’s portfolio management personnel and that Dreyfus also provides oversight of day-to-day fund operations, including fund accounting and administration and assistance in meeting legal and regulatory requirements. The Board also considered Dreyfus’ extensive administrative, accounting, and compliance infrastructures.
42
Comparative Analysis of the Fund’s Performance and Management Fee and Expense Ratio. The Board reviewed reports prepared by Lipper, Inc. (“Lipper”), an independent provider of investment company data, which included information comparing (1) the fund’s performance with the performance of a group of comparable funds (the “Performance Group”) and with a broader group of funds (the “Performance Universe”), all for various periods ended May 31, 2014, and (2) the fund’s actual and contractual management fees and total expenses with those of a group of comparable funds (the “Expense Group”) and with a broader group of funds (the “Expense Universe”), the information for which was derived in part from fund financial statements available to Lipper as of the date of its analysis. Dreyfus previously had furnished the Board with a description of the methodology Lipper used to select the Performance Group and Performance Universe and the Expense Group and Expense Universe.
Dreyfus representatives stated that the usefulness of performance comparisons may be affected by a number of factors, including different investment limitations that may be applicable to the fund and comparison funds. The Board discussed the results of the comparisons and noted that the fund’s total return performance was below the Performance Group and Performance Universe medians for all periods. The Board also noted that the fund’s yield performance was below the Performance Group median for all of the ten one-year periods ended May 31st and below the Performance Universe median for seven of the ten one-year periods ended May 31st.The Board noted the proximity of the fund’s total return performance or yield to the Performance Group and/or Performance Universe median in certain periods when the fund’s total return performance or yield was below median. Dreyfus also provided a comparison of the fund’s calendar year total returns to the returns of the fund’s Lipper category average and noted that the fund’s calendar year total returns were above the Lipper category
The Fund 43
INFORMATION ABOUT THE RENEWAL OF THE FUND’S
MANAGEMENT AGREEMENT (Unaudited) (continued)
average for six of the ten calendar years. Dreyfus representatives noted that not all of the funds in the Performance Group were “AMT-free” funds (seeking to provide income exempt from the federal alternative minimum tax), and that the fund’s generally shorter duration and higher credit quality relative to its peers affected the fund’s relative performance. Dreyfus representatives also noted that the fund’s investment in municipal bonds issued in Puerto Rico affected the fund’s relative performance.
The Board also reviewed the range of actual and contractual management fees and total expenses of the Expense Group and Expense Universe funds and discussed the results of the comparisons.The Board noted that the fund’s contractual management fee was above the Expense Group median and the fund’s actual management fee and total expenses were above the Expense Group and Expense Universe medians.
Dreyfus representatives reviewed with the Board the management or investment advisory fees (1) paid by funds advised or administered by Dreyfus that are in the same Lipper category as the fund and (2) paid to Dreyfus or the Dreyfus-affiliated primary employer of the fund’s primary portfolio manager(s) for advising any separate accounts and/or other types of client portfolios that are considered to have similar investment strategies and policies as the fund (the “Similar Clients”), and explained the nature of the Similar Clients. They discussed differences in fees paid and the relationship of the fees paid in light of any differences in the services provided and other relevant factors. The Board considered the relevance of the fee information provided for the Similar Clients to evaluate the appropriateness and reasonableness of the fund’s management fee.
Analysis of Profitability and Economies of Scale. Dreyfus representatives reviewed the expenses allocated and profit received by Dreyfus and its affiliates and the resulting profitability percentage for managing the fund and the aggregate profitability percentage to Dreyfus and its affiliates for managing the funds in the Dreyfus fund complex, and the method used to determine the expenses and profit. The Board con-
44
cluded that the profitability results were not unreasonable, given the services rendered and service levels provided by Dreyfus. The Board also had been provided with information prepared by an independent consulting firm regarding Dreyfus’ approach to allocating costs to, and determining the profitability of, individual funds and the entire Dreyfus fund complex. The consulting firm also had analyzed where any economies of scale might emerge in connection with the management of a fund.
The Board considered on the advice of its counsel the profitability analysis (1) as part of its evaluation of whether the fees under the Agreement bear a reasonable relationship to the mix of services provided by Dreyfus, including the nature, extent and quality of such services, and (2) in light of the relevant circumstances for the fund and the extent to which economies of scale would be realized if the fund grows and whether fee levels reflect these economies of scale for the benefit of fund shareholders. Dreyfus representatives noted that a discussion of economies of scale is predicated on a fund having achieved a substantial size with increasing assets and that, if a fund’s assets had been stable or decreasing, the possibility that Dreyfus may have realized any economies of scale would be less. Dreyfus representatives also noted that, as a result of shared and allocated costs among funds in the Dreyfus fund complex, the extent of economies of scale could depend substantially on the level of assets in the complex as a whole, so that increases and decreases in complex-wide assets can affect potential economies of scale in a manner that is disproportionate to, or even in the opposite direction from, changes in the fund’s asset level.The Board also considered potential benefits to Dreyfus from acting as investment adviser and noted that there were no soft dollar arrangements in effect for trading the fund’s investments.
At the conclusion of these discussions, the Board agreed that it had been furnished with sufficient information to make an informed business decision with respect to the renewal of the Agreement. Based
The Fund 45
INFORMATION ABOUT THE RENEWAL OF THE FUND’S
MANAGEMENT AGREEMENT (Unaudited) (continued)
on the discussions and considerations as described above, the Board concluded and determined as follows.
The Board concluded that the nature, extent and quality of the services provided by Dreyfus are adequate and appropriate.
The Board was concerned with the fund’s performance but noted the considerations described above and agreed to closely monitor performance.
The Board concluded that the fee paid to Dreyfus was reasonable in light of the considerations described above.
The Board determined that the economies of scale which may accrue to Dreyfus and its affiliates in connection with the management of the fund had been adequately considered by Dreyfus in connection with the fee rate charged to the fund pursuant to the Agreement and that, to the extent in the future it were determined that material economies of scale had not been shared with the fund, the Board would seek to have those economies of scale shared with the fund.
In evaluating the Agreement, the Board considered these conclusions and determinations and also relied on its previous knowledge, gained through meetings and other interactions with Dreyfus and its affiliates, of the fund and the services provided to the fund by Dreyfus.The Board also relied on information received on a routine and regular basis throughout the year relating to the operations of the fund and the investment management and other services provided under the Agreement, including information on the investment performance of the fund in comparison to similar mutual funds and benchmark performance indices; general market outlook as applicable to the fund; and compliance reports. In addition, the Board’s consideration of the contractual fee arrangements for this fund had the benefit of a number of years of reviews of prior or similar agreements during which lengthy discussions took place between the Board and Dreyfus representatives. Certain aspects of the arrangements may receive greater scrutiny in some years than in others, and the Board’s conclusions may be based, in part, on their consideration of the same or similar arrangements in prior years. The Board determined that renewal of the Agreement was in the best interests of the fund and its shareholders.
46
BOARD MEMBERS INFORMATION (Unaudited)
INDEPENDENT BOARD MEMBERS
|
| Joseph S. DiMartino (71) |
| Chairman of the Board (1995) |
| Principal Occupation During Past 5Years: |
| • Corporate Director and Trustee (1995-present) |
| Other Public Company Board Memberships During Past 5Years: |
| • CBIZ (formerly, Century Business Services, Inc.), a provider of outsourcing functions for small |
| and medium size companies, Director (1997-present) |
| • The Newark Group, a provider of a national market of paper recovery facilities, paperboard |
| mills and paperboard converting plants, Director (2000-2010) |
| • Sunair Services Corporation, a provider of certain outdoor-related services to homes and |
| businesses, Director (2005-2009) |
| No. of Portfolios for which Board Member Serves: 146 |
| ——————— |
| Francine J. Bovich (63) |
| Board Member (2012) |
| Principal Occupation During Past 5Years: |
| • Trustee,The Bradley Trusts, private trust funds (2011-present) |
| • Managing Director, Morgan Stanley Investment Management (1993-2010) |
| Other Public Company Board Membership During Past 5Years: |
| • Annaly Capital Management, Inc., Board Member (May 2014-present) |
| No. of Portfolios for which Board Member Serves: 46 |
| ——————— |
| Peggy C. Davis (71) |
| Board Member (1990) |
| Principal Occupation During Past 5Years: |
| • Shad Professor of Law, New York University School of Law (1983-present) |
| No. of Portfolios for which Board Member Serves: 52 |
| ——————— |
| Diane Dunst (75) |
| Board Member (2007) |
| Principal Occupation During Past 5Years: |
| • President of Huntting House Antiques (1999-present) |
| No. of Portfolios for which Board Member Serves: 14 |
The Fund 47
BOARD MEMBERS INFORMATION (Unaudited) (continued)
INDEPENDENT BOARD MEMBERS (continued)
|
| Nathan Leventhal (71) |
| Board Member (1989) |
| Principal Occupation During Past 5Years: |
| • Chairman of the Avery-Fisher Artist Program (1997-2014) |
| • Commissioner, NYC Planning Commission (2007-2011) |
| Other Public Company Board Membership During Past 5Years: |
| • Movado Group, Inc., Director (2003-present) |
| No. of Portfolios for which Board Member Serves: 52 |
| |
| ——————— |
| Robin A. Melvin (51) |
| Board Member (2012) |
| Principal Occupation During Past 5Years: |
| • Board Member, Illinois Mentoring Partnership, non-profit organization dedicated to increasing |
| the quantity and quality of mentoring services in Illinois (2013-present) |
| • Director, Boisi Family Foundation, a private family foundation that supports youth-serving orga- |
| nizations that promote the self sufficiency of youth from disadvantaged circumstances (1995-2012) |
| No. of Portfolios for which Board Member Serves: 114 |
| |
| ——————— |
| Once elected all Board Members serve for an indefinite term, but achieve Emeritus status upon reaching age 80.The |
| address of the Board Members and Officers is c/o The Dreyfus Corporation, 200 Park Avenue, NewYork, NewYork |
| 10166.Additional information about the Board Members is available in the fund’s Statement of Additional Information |
| which can be obtained from Dreyfus free of charge by calling this toll free number: 1-800-DREYFUS. |
| Clifford L.Alexander, Jr., Emeritus Board Member |
| Ernest Kafka, Emeritus Board Member |
| Jay I. Meltzer, Emeritus Board Member |
| Daniel Rose, Emeritus Board Member |
| Sander Vanocur, Emeritus Board Member |
48
OFFICERS OF THE FUND (Unaudited)
The Fund 49
OFFICERS OF THE FUND (Unaudited) (continued)
50
For More Information
Telephone Call your financial representative or 1-800-DREYFUS
Mail The Dreyfus Family of Funds, 144 Glenn Curtiss Boulevard, Uniondale, NY 11556-0144
The fund files its complete schedule of portfolio holdings with the Securities and Exchange Commission (“SEC”) for the first and third quarters of each fiscal year on Form N-Q. The fund’s Forms N-Q are available on the SEC’s website at http://www.sec.gov and may be reviewed and copied at the SEC’s Public Reference Room in Washington, DC. Information on the operation of the Public Reference Room may be obtained by calling 1-800-SEC-0330.
Information regarding how the fund voted proxies relating to portfolio securities for the most recent 12-month period ended June 30 is available on the SEC’s website at http://www.sec.gov and without charge, upon request, by calling 1-800-DREYFUS.

Item 2. Code of Ethics.
The Registrant has adopted a code of ethics that applies to the Registrant's principal executive officer, principal financial officer, principal accounting officer or controller, or persons performing similar functions. There have been no amendments to, or waivers in connection with, the Code of Ethics during the period covered by this Report.
Item 3. Audit Committee Financial Expert.
The Registrant's Board has determined that Joseph S. DiMartino, a member of the Audit Committee of the Board, is an audit committee financial expert as defined by the Securities and Exchange Commission (the "SEC"). Joseph S. DiMartino is "independent" as defined by the SEC for purposes of audit committee financial expert determinations.
Item 4. Principal Accountant Fees and Services.
(a) Audit Fees. The aggregate fees billed for each of the last two fiscal years (the "Reporting Periods") for professional services rendered by the Registrant's principal accountant (the "Auditor") for the audit of the Registrant's annual financial statements or services that are normally provided by the Auditor in connection with the statutory and regulatory filings or engagements for the Reporting Periods, were $32,149 in 2013 and $32,792 in 2014.
(b) Audit-Related Fees. The aggregate fees billed in the Reporting Periods for assurance and related services by the Auditor that are reasonably related to the performance of the audit of the Registrant's financial statements and are not reported under paragraph (a) of this Item 4 were $7,200 in 2013 and $6,942 in 2014. These services consisted of one or more of the following: (i) agreed upon procedures related to compliance with Internal Revenue Code section 817(h), (ii) security counts required by Rule 17f-2 under the Investment Company Act of 1940, as amended, (iii) advisory services as to the accounting or disclosure treatment of Registrant transactions or events and (iv) advisory services to the accounting or disclosure treatment of the actual or potential impact to the Registrant of final or proposed rules, standards or interpretations by the Securities and Exchange Commission, the Financial Accounting Standards Boards or other regulatory or standard-setting bodies.
The aggregate fees billed in the Reporting Periods for non-audit assurance and related services by the Auditor to the Registrant's investment adviser (not including any sub-investment adviser whose role is primarily portfolio management and is subcontracted with or overseen by another investment adviser), and any entity controlling, controlled by or under common control with the investment adviser that provides ongoing services to the Registrant ("Service Affiliates"), that were reasonably related to the performance of the annual audit of the Service Affiliate, which required pre-approval by the Audit Committee were $0 in 2013 and $0 in 2014.
(c) Tax Fees. The aggregate fees billed in the Reporting Periods for professional services rendered by the Auditor for tax compliance, tax advice, and tax planning ("Tax Services") were $3,220 in 2013 and $3,578 in 2014. These services consisted of: (i) review or preparation of U.S. federal, state, local and excise tax returns; (ii) U.S. federal, state and local tax planning, advice and assistance regarding statutory, regulatory or administrative developments; and (iii) tax advice regarding tax qualification matters and/or treatment of various financial instruments held or proposed to be acquired or held. The aggregate fees billed in the Reporting Periods for Tax Services by the Auditor to Service Affiliates, which required pre-approval by the Audit Committee were $0 in 2013 and $0 in 2014.
(d) All Other Fees. The aggregate fees billed in the Reporting Periods for products and services provided by the Auditor, other than the services reported in paragraphs (a) through (c) of this Item, were $379 in 2013 and $640 in 2014. [These services consisted of a review of the Registrant's anti-money laundering program].
The aggregate fees billed in the Reporting Periods for Non-Audit Services by the Auditor to Service Affiliates, other than the services reported in paragraphs (b) through (c) of this Item, which required pre-approval by the Audit Committee, were $0 in 2013 and $0 in 2014.
(e)(1) Audit Committee Pre-Approval Policies and Procedures. The Registrant's Audit Committee has established policies and procedures (the "Policy") for pre-approval (within specified fee limits) of the Auditor's engagements for non-audit services to the Registrant and Service Affiliates without specific case-by-case consideration. The pre-approved services in the Policy can include pre-approved audit services, pre-approved audit-related services, pre-approved tax services and pre-approved all other services. Pre-approval considerations include whether the proposed services are compatible with maintaining the Auditor's independence. Pre-approvals pursuant to the Policy are considered annually.
(e)(2) Note: None of the services described in paragraphs (b) through (d) of this Item 4 were approved by the Audit Committee pursuant to paragraph (c)(7)(i)(C) of Rule 2-01 of Regulation S-X.
(f) None of the hours expended on the principal accountant's engagement to audit the registrant's financial statements for the most recent fiscal year were attributed to work performed by persons other than the principal account's full-time, permanent employees.
Non-Audit Fees. The aggregate non-audit fees billed by the Auditor for services rendered to the Registrant, and rendered to Service Affiliates, for the Reporting Periods were $51,023,448 in 2013 and $25,624,689 in 2014.
Auditor Independence. The Registrant's Audit Committee has considered whether the provision of non-audit services that were rendered to Service Affiliates, which were not pre-approved (not requiring pre-approval), is compatible with maintaining the Auditor's independence.
Item 5. Audit Committee of Listed Registrants.
Not applicable. [CLOSED-END FUNDS ONLY]
Item 6. Investments.
(a) Not applicable.
Item 7. Disclosure of Proxy Voting Policies and Procedures for Closed-End Management Investment Companies.
Not applicable. [CLOSED-END FUNDS ONLY]
Item 8. Portfolio Managers of Closed-End Management Investment Companies.
Not applicable. [CLOSED-END FUNDS ONLY, beginning with reports for periods ended on and after December 31, 2005]
Item 9. Purchases of Equity Securities by Closed-End Management Investment Companies and Affiliated Purchasers.
Not applicable. [CLOSED-END FUNDS ONLY]
Item 10. Submission of Matters to a Vote of Security Holders.
There have been no material changes to the procedures applicable to Item 10.
Item 11. Controls and Procedures.
(a) The Registrant's principal executive and principal financial officers have concluded, based on their evaluation of the Registrant's disclosure controls and procedures as of a date within 90 days of the filing date of this report, that the Registrant's disclosure controls and procedures are reasonably designed to ensure that information required to be disclosed by the Registrant on Form N-CSR is recorded, processed, summarized and reported within the required time periods and that information required to be disclosed by the Registrant in the reports that it files or submits on Form N-CSR is accumulated and communicated to the Registrant's management, including its principal executive and principal financial officers, as appropriate to allow timely decisions regarding required disclosure.
(b) There were no changes to the Registrant's internal control over financial reporting that occurred during the second fiscal quarter of the period covered by this report that have materially affected, or are reasonably likely to materially affect, the Registrant's internal control over financial reporting.
Item 12. Exhibits.
(a)(1) Code of ethics referred to in Item 2.
(a)(2) Certifications of principal executive and principal financial officers as required by Rule 30a-2(a) under the Investment Company Act of 1940.
(a)(3) Not applicable.
(b) Certification of principal executive and principal financial officers as required by Rule 30a-2(b) under the Investment Company Act of 1940.
SIGNATURES
Pursuant to the requirements of the Securities Exchange Act of 1934 and the Investment Company Act of 1940, the Registrant has duly caused this Report to be signed on its behalf by the undersigned, thereunto duly authorized.
Dreyfus New York AMT-Free Municipal Bond Fund
By: /s/Bradley J. Skapyak
Bradley J. Skapyak,
President
Date: January 22, 2015
Pursuant to the requirements of the Securities Exchange Act of 1934 and the Investment Company Act of 1940, this Report has been signed below by the following persons on behalf of the Registrant and in the capacities and on the dates indicated.
By: /s/Bradley J. Skapyak
Bradley J. Skapyak,
President
Date: January 22, 2015
By: /s/ James Windels
James Windels,
Treasurer
Date: January 22, 2015
EXHIBIT INDEX
(a)(1) Code of ethics referred to in Item 2.
(a)(2) Certifications of principal executive and principal financial officers as required by Rule 30a-2(a) under the Investment Company Act of 1940. (EX-99.CERT)
(b) Certification of principal executive and principal financial officers as required by Rule 30a-2(b) under the Investment Company Act of 1940. (EX-99.906CERT)