UNITED STATES
SECURITIES AND EXCHANGE COMMISSION
Washington, D.C. 20549
FORM N-CSR
CERTIFIED SHAREHOLDER REPORT OF REGISTERED MANAGEMENT
INVESTMENT COMPANIES
Investment Company Act file number | 811-04764 |
| |
| BNY Mellon Opportunistic Municipal Securities Fund | |
| (Exact name of Registrant as specified in charter) | |
| | |
| c/o The Dreyfus Corporation 240 Greenwich Street New York, New York 10286 | |
| (Address of principal executive offices) (Zip code) | |
| | |
| Bennett A. MacDougall, Esq. 240 Greenwich Street New York, New York 10286 | |
| (Name and address of agent for service) | |
|
Registrant's telephone number, including area code: | (212) 922-6400 |
| |
Date of fiscal year end: | 04/30 | |
Date of reporting period: | 04/30/19 | |
| | | | | | | |
FORM N-CSR
Item 1. Reports to Stockholders.
BNY Mellon Opportunistic Municipal Securities Fund
| |
ANNUAL REPORT April 30, 2019 |
| |
Save time. Save paper. View your next shareholder report online as soon as it’s available. Log into www.bnymellonim.com/us and sign up for eCommunications. It’s simple and only takes a few minutes. |
| |
The views expressed in this report reflect those of the portfolio manager(s) only through the end of the period covered and do not necessarily represent the views of BNY Mellon Investment Adviser, Inc. or any other person in the BNY Mellon Investment Adviser, Inc. organization. Any such views are subject to change at any time based upon market or other conditions and BNY Mellon Investment Adviser, Inc. disclaims any responsibility to update such views. These views may not be relied on as investment advice and, because investment decisions for a fund in the BNY Mellon Family of Funds are based on numerous factors, may not be relied on as an indication of trading intent on behalf of any fund in the BNY Mellon Family of Funds. |
| |
Not FDIC-Insured • Not Bank-Guaranteed • May Lose Value |
Contents
THE FUND
FOR MORE INFORMATION
Back Cover
| | | | |
| |
BNY Mellon Opportunistic Municipal Securities Fund
| | The Fund |
A LETTER FROM THE PRESIDENT OF BNY MELLON INVESTMENT ADVISER, INC.
Dear Shareholder:
We are pleased to present this annual report for BNY Mellon Opportunistic Municipal Securities Fund’s (formerly the Dreyfus Municipal Bond Opportunity Fund), covering the 12-month period from May 1, 2018 through April 30, 2019. For information about how the fund performed during the reporting period, as well as general market perspectives, we provide a Discussion of Fund Performance on the pages that follow.
At the beginning of the reporting period, developed economies outside of the U.S. continued to weaken, while the U.S. economy sustained its relatively healthy growth rate. Calm markets prevailed throughout the summer, as robust growth and strong corporate earnings supported U.S. stock returns, while other developed markets continued to decline.
The fourth quarter of 2018 saw broad market weakness, due in part to heightened concerns about interest-rate increases, trade tensions and slowing global growth. The slump largely erased prior gains on U.S. indices, while losses deepened in international markets. December experienced a sharp sell-off, as it appeared that the U.S. Federal Reserve (the “Fed”) would maintain its hawkish stance on monetary policy. However, comments made in January by the Fed indicated that it would slow the pace of interest-rate increases, and this helped stimulate a rebound across equity markets that continued through the end of the reporting period.
Fixed-income markets declined early in the period, as interest rates and inflation rose, pressuring most bond prices. Comparatively strong U.S. equity markets fed investor risk appetites, reducing the demand for Treasuries and increasing yields. But a return of stock-market volatility in October triggered a flight to quality, boosting Treasury prices and flattening the yield curve. Corporate bonds, however, were hindered somewhat by concerns about economic growth, resulting in widening spreads and lower prices through November. In January, when the Fed’s comments indicated that rate increases would be less likely in 2019, bond markets rallied, and most U.S. indices continued to post positive returns through the end of April.
We remain positive on the near-term economic outlook for the U.S. but will monitor relevant data for any signs of a change. As always, we encourage you to discuss the risks and opportunities in today’s investment environment with your financial advisor.
Thank you for your continued confidence and support.
Sincerely,

Renee LaRoche-Morris
President
BNY Mellon Investment Adviser, Inc.
June 3, 2019
2
DISCUSSION OF FUND PERFORMANCE(Unaudited)
For the period from May 1, 2018 through April 30, 2019, as provided by Daniel Rabasco and Jeffrey Burger, Portfolio Managers
Market and Fund Performance Overview
For the 12-month period ended April 30, 2019, BNY Mellon Opportunistic Municipal Securities Fund’s (formerly Dreyfus Municipal Bond Opportunity Fund) Class A shares produced a total return of 5.70%, Class C shares returned 4.87%, Class I shares returned 5.88%, Class Y shares returned 5.85%, and Class Z shares returned 5.75%.1 In comparison, the Bloomberg Barclays U.S. Municipal Bond Index (the “Index”), the fund’s benchmark index, achieved a total return of 6.16% for the same period.2
Municipal bonds during the reporting period encountered bouts of volatility stemming from rising interest rates and shifting supply-and-demand dynamics in the municipal securities market. The fund underperformed the Index, largely due to unfavorable sector allocations.
The Fund’s Investment Approach
The fund seeks to maximize current income exempt from federal income tax to the extent consistent with the preservation of capital. To pursue its goal, the fund normally invests at least 80% of its net assets, plus any borrowings for investment purposes, in municipal bonds that provide income exempt from federal income tax. Typically, the fund invests substantially all of its assets in such municipal bonds. The fund invests at least 70% of its assets in municipal bonds rated, at the time of purchase, investment grade (Baa/BBB or higher) or the unrated equivalent as determined by BNY Mellon Investment Adviser, Inc. (formerly The Dreyfus Corporation). For additional yield, the fund may invest up to 30% of its assets in municipal bonds rated below investment grade (“high yield” or “junk” bonds) or the unrated equivalent as determined by BNY Mellon Investment Adviser, Inc. The dollar-weighted average maturity of the fund’s portfolio normally exceeds 10 years, but the fund may invest without regard to maturity or duration.
The portfolio managers focus on identifying undervalued sectors and securities and minimize the use of interest-rate forecasting. The portfolio managers select municipal bonds for the fund’s portfolio by using fundamental credit analysis to estimate the relative value and attractiveness of various sectors and securities, and to exploit pricing inefficiencies in the municipal bond market, and actively trading among various sectors, such as pre-refunded, general obligation and revenue, based on their apparent relative values. The fund seeks to invest in several of these sectors.
Shift in Federal Reserve Policy Drove Municipal Bonds
Municipal bonds struggled during the first two-thirds of the reporting period as the economy continued to perform well, and the Federal Reserve (the “Fed”) continued on a path of raising short-term interest rates. The Fed hiked the federal funds policy rate three times during the reporting period, bringing the target to 2.25%-2.50%. Flows into municipal bond funds were fairly steady and supply also was manageable as new issuance for 2018 came in approximately 24% below that of 2017.
From a macroeconomic perspective, data became more mixed towards the end of 2018, and investors became increasingly concerned about the effect of the Fed’s hawkish stance on
3
DISCUSSION OF FUND PERFORMANCE(Unaudited) (continued)
interest rates. This resulted in some volatility in capital markets that resulted in a flight to quality in which higher-quality securities, including municipal bonds, rallied strongly. The Fed’s shift to a more dovish stance also fed demand, as it confirmed investor concerns about a possible weakening of the economy.
As 2019 progressed, supply through the first four months of the year continued to be manageable, while demand rallied significantly and fund flows surged, hitting record levels. Investors, especially those in high-tax states, reacted to the impact on their tax bills from the Tax Cuts and Jobs Act of 2017 and the new cap on the deductibility of state and local taxes. In response, these investors sought tax-exempt municipal bonds as a tax shelter. Also, the relative stability of the municipal bond market to that of the equity markets also attracted investors.
The flight to quality caused rates to fall, and investors then began to reach for yield. As a result, longer-term municipals, especially those 10 years and longer, experienced a greater compression of yields than did shorter maturities, resulting in a flatter municipal bond yield curve. The ratio of municipal bond yields to Treasury yields fell significantly, especially for longer bonds, reflecting the outperformance of municipal bonds versus Treasuries. Investors also began to reach for the yield available from lower-quality issues, resulting in a tightening of quality spreads.
Although long-term obligations, including pension and health care liabilities, remain a concern, credit quality remained stable to strong during the period. Driven by continued economic strength, tax revenues were healthy, allowing many issuers to increase their “rainy day” funds. Tobacco bonds, those backed by certain states’ settlement of litigation with U.S. tobacco companies, were hurt by a proposal by the Food and Drug Administration to ban menthol cigarettes.
Sector Allocation Hindered Fund Results
The fund’s performance versus the Index was hampered during the reporting period by the sector allocation strategy. Both the overweight to revenue bonds and the underweight to general obligation bonds constrained performance, especially in Illinois and Chicago general obligation bonds, which performed well. Also detracting were tobacco-backed bonds, which were hampered by the menthol ban proposal noted above. During the reporting period, we elected to trim the fund’s tobacco exposure.
On a more positive note, the fund’s yield curve positioning contributed positively to the fund’s results; both the overweight to 10-year maturities and the underweight to shorter maturities were additive to returns. Being overweight to both A rated and BBB rated bonds also contributed.
The fund made use of derivatives during the reporting period in order to hedge against rising interest rates; however, the hedge was removed early in 2019, and it had little impact on the fund’s performance.
A Constructive Investment Posture
The domestic economy remains strong, fueled by the 2017 tax cuts. Employment continues to be robust, with unemployment at near-record-low levels, and wage growth is picking up, further raising the prospect of an increase in inflation. One risk to this outlook is a
4
deterioration in trade relations, which could derail the economy’s momentum. While market participants are concerned over the impact of trade tensions on economic growth, we believe the Fed is looking forward, focusing on economic data and, for the near term, will be on hold in adjusting short-term rates.
Nevertheless, even if rates eventually rise moderately over the coming year, demand for municipal bonds should remain strong and supply manageable, in our view. The municipal bond market should perform relatively well. In addition, the cap on federal deductibility of state and local taxes will likely continue to help drive demand for municipal securities, encouraging the reinvestment of the proceeds of a large number of bonds that are due to mature in the coming months. We expect to keep the fund’s duration neutral to modestly long relative to the benchmark, and we will continue to focus on security selection, emphasizing undervalued issues and relying on our credit research capabilities.
June 3, 2019
1 Total return includes reinvestment of dividends and any capital gains paid and does not take into consideration the maximum initial sales charge in the case of Class A shares or the applicable contingent deferred sales charge imposed on redemptions in the case of Class C shares. Had these charges been reflected, returns would have been lower. Class I, Class Y, and Class Z are not subject to any initial or deferred sales charge. Past performance is no guarantee of future results. Share price, yield, and investment return fluctuate such that upon redemption, fund shares may be worth more or less than their original cost. Income may be subject to state and local taxes, and some income may be subject to the federal alternative minimum tax (AMT) for certain investors. Capital gains, if any, are taxable.
2 Source: Lipper Inc. — The Bloomberg Barclays U.S. Municipal Bond Index covers the U.S. dollar-denominated, long-term tax-exempt bond market. Investors cannot invest directly in any index.
Bonds are subject generally to interest-rate, credit, liquidity, and market risks, to varying degrees, all of which are more fully described in the fund’s prospectus. Generally, all other factors being equal, bond prices are inversely related to interest-rate changes, and rate increases can cause price declines.
The amount of public information available about municipal bonds is generally less than that for corporate equities or bonds. Special factors, such as legislative changes, and state and local economic and business developments, may adversely affect the yield and/or value of the fund’s investments in municipal bonds. Other factors include the general conditions of the municipal bond market, the size of the particular offering, the maturity of the obligation, and the rating of the issue. Changes in economic, business, or political conditions relating to a particular municipal project, municipality, or state in which the fund invests may have an impact on the fund’s share price.
5
FUND PERFORMANCE(Unaudited)
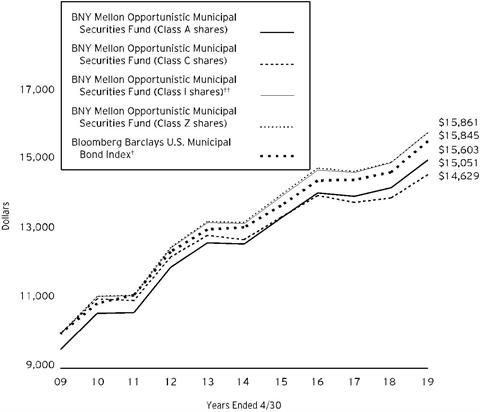
Comparison of change in value of a $10,000 investment in Class A shares, Class C shares, Class I shares and Class Z shares of BNY Mellon Opportunistic Municipal Securities Fund with a hypothetical investment of $10,000 in the Bloomberg Barclays U.S. Municipal Bond Index (the “Index”).
† Source: Lipper Inc.
†† The total return figures presented for Class I shares of the fund reflect the performance of the fund’s Class A shares for the period prior to 8/31/16 (the inception date for Class I shares), not reflecting the applicable sales load for Class A shares.
Past performance is not predictive of future performance.
The above graph compares a hypothetical $10,000 investment made in each of the Class A, Class C, Class I and Class Z shares of BNY Mellon Opportunistic Municipal Securities Fund on 4/30/09 to a hypothetical investment of $10,000 made in the Index on that date. All dividends and capital gain distributions are reinvested.
The fund’s performance shown in the line graph above takes into account the maximum initial sales charge on Class A shares and all other applicable fees and expenses on all classes. The Index, unlike the fund, covers the U.S. dollar-denominated long-term tax-exempt bond market. These factors can contribute to the Index potentially outperforming or underperforming the fund. Unlike a mutual fund, the Index is not subject to charges, fees and other expenses. Investors cannot invest directly in any index. Further information relating to fund performance, including expense reimbursements, if applicable, is contained in the Financial Highlights section of the prospectus and elsewhere in this report.
6

Comparison of change in value of a $1,000,000 investment in Class Y shares of BNY Mellon Opportunistic Municipal Securities Fund with a hypothetical investment of $1,000,000 in the Bloomberg Barclays U.S. Municipal Bond Index (the “Index”).
† Source: Lipper Inc.
†† The total return figures presented for Class Y shares of the fund reflect the performance of the fund’s Class A shares for the period prior to 8/31/16 (the inception date for Class Y shares), not reflecting the applicable sales load for Class A shares.
Past performance is not predictive of future performance.
The above graph compares a hypothetical $1,000,000 investment made in Class Y shares of BNY Mellon Opportunistic Municipal Securities Fund on 4/30/09 to a hypothetical investment of $1,000,000 made in the Index on that date. All dividends and capital gain distributions are reinvested.
The fund’s performance shown in the graph above takes into account all applicable fees and expenses of the fund’s Class Y shares. The Index, unlike the fund, covers the U.S. dollar-denominated long-term tax-exempt bond market. These factors can contribute to the Index potentially outperforming or underperforming the fund. Unlike a mutual fund, the Index is not subject to charges, fees and other expenses. Investors cannot invest directly in any index. Further information relating to fund performance, including expense reimbursements, if applicable, is contained in the Financial Highlights section of the prospectus and elsewhere in this report.
7
FUND PERFORMANCE(Unaudited) (continued)
| | | | | |
Average Annual Total Returns as of 4/30/19 | | | |
| Inception
Date | 1 Year | 5 Years | 10 Years |
Class A shares | | | | |
with maximum sales charge (4.5%) | 11/26/86 | 0.97% | 2.64% | 4.17% |
without sales charge | 11/26/86 | 5.70% | 3.60% | 4.66% |
Class C shares | | | | |
with applicable redemption charge† | 7/13/95 | 3.87% | 2.81% | 3.88% |
without redemption | 7/13/95 | 4.87% | 2.81% | 3.88% |
Class I shares | 8/31/16 | 5.88% | 3.73%†† | 4.72%†† |
Class Y shares | 8/31/16 | 5.85% | 3.65%†† | 4.68%†† |
Class Z shares | 10/14/04 | 5.75% | 3.66% | 4.71% |
Bloomberg Barclays U.S. Municipal Bond Index | | 6.16% | 3.56% | 4.55% |
† The maximum contingent deferred sales charge for Class C shares is 1% for shares redeemed within one year of the date of purchase.
†† The total return performance figures presented for Class I and Class Y shares of the fund reflect the performance of the fund’s Class A shares for the period prior to 8/31/16 (the inception date for Class I and Y shares), not reflecting the applicable sales load for Class A shares.
The performance data quoted represents past performance, which is no guarantee of future results. Share price and investment return fluctuate and an investor’s shares may be worth more or less than original cost upon redemption. Current performance may be lower or higher than the performance quoted. Go to bnymellonim.com/us for the fund’s most recent month-end returns.
The fund's performance shown in the graphs and table do not reflect the deduction of taxes that a shareholder would pay on fund distributions or the redemption of fund shares. In addition to the performance of Class A shares shown with and without a maximum sales charge, the fund's performance shown in the table takes into account all other applicable fees and expenses on all classes.
8
UNDERSTANDING YOUR FUND’S EXPENSES(Unaudited)
As a mutual fund investor, you pay ongoing expenses, such as management fees and other expenses. Using the information below, you can estimate how these expenses affect your investment and compare them with the expenses of other funds. You also may pay one-time transaction expenses, including sales charges (loads) and redemption fees, which are not shown in this section and would have resulted in higher total expenses. For more information, see your fund’s prospectus or talk to your financial adviser.
Review your fund’s expenses
The table below shows the expenses you would have paid on a $1,000 investment in BNY Mellon Opportunistic Municipal Securities Fund from November 1, 2018 to April 30, 2019. It also shows how much a $1,000 investment would be worth at the close of the period, assuming actual returns and expenses.
| | | | | | | | | | | | | | | |
Expenses and Value of a $1,000 Investment | | |
assuming actual returns for the six months ended April 30, 2019 |
| | | | Class A | | Class C | | Class I | | Class Y | | Class Z |
Expenses paid per $1,000† | | $4.02 | | $8.18 | | $2.85 | | $2.85 | | $3.77 |
Ending value (after expenses) | | $1,054.40 | | $1,050.30 | | $1,055.70 | | $1,055.70 | | $1,054.70 |
COMPARING YOUR FUND’S EXPENSES
WITH THOSE OF OTHER FUNDS(Unaudited)
Using the SEC’s method to compare expenses
The Securities and Exchange Commission (“SEC”) has established guidelines to help investors assess fund expenses. Per these guidelines, the table below shows your fund’s expenses based on a $1,000 investment, assuming a hypothetical 5% annualized return. You can use this information to compare the ongoing expenses (but not transaction expenses or total cost) of investing in the fund with those of other funds. All mutual fund shareholder reports will provide this information to help you make this comparison. Please note that you cannot use this information to estimate your actual ending account balance and expenses paid during the period.
| | | | | | | | | | | | | | | | | |
Expenses and Value of a $1,000 Investment | | | |
assuming a hypothetical 5% annualized return for the six months ended April 30, 2019 |
| | | | | Class A | | Class C | | Class I | | Class Y | | Class Z |
Expenses paid per $1,000† | | | $3.96 | | $8.05 | | $2.81 | | $2.81 | | $3.71 |
Ending value (after expenses) | | | $1,020.88 | | $1,016.81 | | $1,022.02 | | $1,022.02 | | $1,021.12 |
† Expenses are equal to the fund’s annualized expense ratio of .79% for Class A, 1.61% for Class C, .56% for Class I, .56% for Class Y and .74% for Class Z, multiplied by the average account value over the period, multiplied by 181/365 (to reflect the one-half year period).
9
STATEMENT OF INVESTMENTS
April 30, 2019
| | | | | | | | | | |
| |
Description | Coupon
Rate (%) | | Maturity
Date | | Principal
Amount ($) | | Value ($) | |
Bonds and Notes - .4% | | | | | |
U.S. Related - .4% | | | | | |
Federal Home Loan Mortgage Corp. Multifamily Variable Rate Certificate,
Revenue Bonds, Ser. M
(cost $1,259,075) | | 3.15 | | 1/1/2036 | | 1,250,000 | | 1,282,588 | |
| | | | | | | | | |
Long-Term Municipal Investments - 98.7% | | | | | |
Alabama - 3.5% | | | | | |
Birmingham-Jefferson Civic Center Authority,
Special Tax Revenue Bonds, Ser. B | | 5.00 | | 7/1/2043 | | 2,500,000 | | 2,829,725 | |
Black Belt Energy Gas District,
Gas Prepay Revenue Bonds, Ser. B1, 1 Month LIBOR x 0.67 +.90% | | 2.58 | | 12/1/2023 | | 1,405,000 | a | 1,378,923 | |
Jefferson County,
Revenue Bonds, Refunding | | 5.00 | | 9/15/2032 | | 1,000,000 | | 1,168,240 | |
Jefferson County,
Senior Lien Sewer Revenue Bonds, Refunding (Insured; Assured Guaranty Municipal Corp.) Ser. C | | 0/6.6 | | 10/1/2042 | | 7,835,000 | b | 7,169,182 | |
| | 12,546,070 | |
Arizona - 2.2% | | | | | |
La Paz County Industrial Development Authority,
Education Facility Revenue Bonds (Charter Schools Solutions-Harmony Public Schools Project) Ser. A | | 5.00 | | 2/15/2046 | | 2,000,000 | c | 2,140,980 | |
Maricopa County Industrial Development Authority,
Revenue Bonds (Banner Health Obligated Group) Ser. A | | 5.00 | | 1/1/2041 | | 1,175,000 | | 1,373,469 | |
Maricopa County Industrial Development Authority,
Revenue Bonds (Benjamin Franklin Charter School) | | 6.00 | | 7/1/2038 | | 2,750,000 | c | 3,100,817 | |
Phoenix Industrial Development Authority,
Education Facility Revenue Bonds, Refunding (BASIS Schools Projects) Ser. A | | 5.00 | | 7/1/2046 | | 1,000,000 | c | 1,040,790 | |
| | 7,656,056 | |
California - 4.6% | | | | | |
California,
GO (Various Purpose) | | 5.00 | | 10/1/2030 | | 4,500,000 | | 5,625,540 | |
California,
GO, Refunding (Various Purpose) | | 5.00 | | 4/1/2033 | | 2,710,000 | | 3,376,253 | |
10
| | | | | | | | | | |
| |
Description | Coupon
Rate (%) | | Maturity Date | | Principal
Amount ($) | | Value ($) | |
Long-Term Municipal Investments - 98.7%(continued) | | | | | |
California - 4.6% (continued) | | | | | |
California Health Facilities Financing Authority,
Revenue Bonds, Refunding (Sutter Health) Ser. B | | 5.00 | | 11/15/2046 | | 2,500,000 | | 2,873,150 | |
North Natomas Community Facilities District Number 4,
Special Tax Revenue Bonds, Refunding, Ser. E | | 5.00 | | 9/1/2030 | | 1,500,000 | | 1,674,795 | |
San Francisco City and County Airport Commission,
Revenue Bonds, Refunding (San Francisco International Airport) Ser. B | | 5.00 | | 5/1/2041 | | 2,500,000 | | 2,849,325 | |
| | 16,399,063 | |
Colorado - 4.6% | | | | | |
Colorado Educational & Cultural Facilities Authority,
Revenue Bonds (Johnson & Wales University) Ser. A | | 5.00 | | 4/1/2031 | | 1,360,000 | | 1,443,123 | |
Colorado Health Facilities Authority,
Revenue Bonds (Catholic Health Initiatives) Ser. A | | 5.25 | | 1/1/2045 | | 1,500,000 | | 1,612,905 | |
Colorado Health Facilities Authority,
Revenue Bonds (Children's Hospital Colorado Project) Ser. A | | 5.00 | | 12/1/2041 | | 2,500,000 | | 2,844,150 | |
Colorado Health Facilities Authority,
Revenue Bonds (Covenant Retirement Communities Obligated Group) | | 5.00 | | 12/1/2043 | | 2,000,000 | | 2,245,740 | |
Denver City and County ,
Airport Revenue Bonds, Refunding, Ser. A | | 5.00 | | 12/1/2048 | | 3,000,000 | | 3,485,820 | |
Denver City and County ,
Airport System Subordinate Revenue Bonds, Ser. A | | 5.50 | | 11/15/2027 | | 3,065,000 | | 3,496,828 | |
E-470 Public Highway Authority,
Senior Revenue Bonds, Refunding, Ser. C | | 5.38 | | 9/1/2026 | | 1,000,000 | | 1,042,130 | |
| | 16,170,696 | |
Connecticut - 3.1% | | | | | |
Connecticut,
GO, Ser. A | | 5.00 | | 10/15/2025 | | 3,000,000 | | 3,366,060 | |
Connecticut,
Special Tax Obligation Revenue Bonds (Transportation Infrastructure Purposes) Ser. A | | 5.00 | | 10/1/2029 | | 2,500,000 | | 2,773,675 | |
11
STATEMENT OF INVESTMENTS (continued)
| | | | | | | | | | |
| |
Description | Coupon
Rate (%) | | Maturity Date | | Principal
Amount ($) | | Value ($) | |
Long-Term Municipal Investments - 98.7%(continued) | | | | | |
Connecticut - 3.1% (continued) | | | | | |
Connecticut Health and Educational Facilities Authority,
Revenue Bonds (Yale University) Ser. V1 | | 2.05 | | 7/1/2036 | | 1,500,000 | d | 1,500,000 | |
Connecticut State Development Authority,
Water Facilities Revenue Bonds (Aquarion Water Company of Connecticut Project) | | 5.50 | | 4/1/2021 | | 3,000,000 | | 3,173,370 | |
| | 10,813,105 | |
District of Columbia - .8% | | | | | |
Metropolitan Washington Airports Authority,
Airport System Revenue Bonds, Refunding | | 5.00 | | 10/1/2035 | | 1,500,000 | | 1,761,930 | |
Metropolitan Washington Airports Authority,
Airport System Revenue Bonds, Refunding, Ser. A | | 5.00 | | 10/1/2035 | | 1,000,000 | | 1,157,300 | |
| | 2,919,230 | |
Florida - 3.7% | | | | | |
Broward County,
Airport System Revenue Bonds | | 5.00 | | 10/1/2037 | | 1,560,000 | | 1,810,645 | |
Escambia,
Sales Tax Revenue Bonds | | 5.00 | | 10/1/2046 | | 2,000,000 | | 2,316,680 | |
Miami Beach,
Stormwater Revenue Bonds, Refunding | | 5.00 | | 9/1/2047 | | 2,500,000 | | 2,720,900 | |
Miami Beach Redevelopment Agency,
Tax Increment Revenue Bonds, Refunding (City Center/Historic Convention Village) | | 5.00 | | 2/1/2033 | | 1,000,000 | | 1,128,140 | |
Miami-Dade County,
Seaport Revenue Bonds, Ser. A | | 5.50 | | 10/1/2042 | | 2,500,000 | | 2,801,350 | |
Palm Bay,
Utility System Improvement Revenue Bonds (Insured; National Public Finance Guarantee Corp.) | | 0.00 | | 10/1/2020 | | 875,000 | e | 835,581 | |
Pinellas County Health Facilities Authority,
Revenue Bonds, Refunding (BayCare Health System) (Insured; National Public Finance Guarantee Corp.) Ser. A2 | | 3.64 | | 11/15/2023 | | 650,000 | d | 650,000 | |
Port of Palm Beach District,
Revenue Bonds, Refunding (Insured; XLCA) | | 0.00 | | 9/1/2023 | | 1,000,000 | e | 861,890 | |
| | 13,125,186 | |
12
| | | | | | | | | | |
| |
Description | Coupon
Rate (%) | | Maturity Date | | Principal
Amount ($) | | Value ($) | |
Long-Term Municipal Investments - 98.7%(continued) | | | | | |
Georgia - 1.9% | | | | | |
Atlanta Development Authority,
Revenue Bonds (Georgia Proton Treatment Center Project) Ser. A1 | | 7.00 | | 1/1/2040 | | 1,500,000 | | 1,554,270 | |
Georgia Municipal Electric Authority,
Project One Subordinated Revenue Bonds, Refunding, Ser. A | | 5.00 | | 1/1/2028 | | 2,500,000 | | 2,887,650 | |
Private Colleges & Universities Authority,
Revenue Bonds, Refunding (Emory University) Ser. A | | 5.00 | | 10/1/2043 | | 2,200,000 | | 2,430,956 | |
| | 6,872,876 | |
Illinois - 13.9% | | | | | |
Chicago,
Waste Water Transmission Revenue Bonds (Insured; Assured Guaranty Municipal Corporation) | | 5.00 | | 1/1/2033 | | 2,490,000 | | 2,751,699 | |
Chicago,
Waterworks Second Lien Revenue Bonds | | 5.00 | | 11/1/2025 | | 1,925,000 | | 2,172,286 | |
Chicago Board of Education,
GO, Refunding (Insured; Assured Guaranty Municipal Corporation) Ser. A | | 5.00 | | 12/1/2033 | | 1,000,000 | | 1,155,270 | |
Chicago Board of Education,
GO, Refunding (Insured; Assured Guaranty Municipal Corporation) Ser. C | | 5.00 | | 12/1/2030 | | 1,500,000 | | 1,753,980 | |
Chicago Board of Education,
Revenue Bonds | | 5.00 | | 4/1/2046 | | 1,000,000 | | 1,084,470 | |
Chicago O'Hare International Airport,
Customer Facility Charge Senior Lien Revenue Bonds | | 5.75 | | 1/1/2043 | | 3,750,000 | | 4,206,375 | |
Chicago O'Hare International Airport,
General Airport Revenue Bonds, Refunding, Ser. A | | 5.00 | | 1/1/2034 | | 2,100,000 | | 2,350,929 | |
Chicago O'Hare International Airport,
Senior Lien Revenue Bonds, Refunding, Ser. A | | 5.00 | | 1/1/2048 | | 1,500,000 | | 1,726,050 | |
Chicago Park District,
GO, Refunding, Ser. C (Limited Tax) | | 5.00 | | 1/1/2027 | | 2,030,000 | | 2,225,996 | |
Cook County,
Sales Tax Revenue Bonds, Refunding | | 5.00 | | 11/15/2035 | | 2,500,000 | | 2,889,475 | |
Greater Chicago Metropolitan Water Reclamation District,
GO, Unlimited Tax Capital Improvement (Green Bonds), Ser. A | | 5.00 | | 12/1/2044 | | 2,000,000 | | 2,208,340 | |
13
STATEMENT OF INVESTMENTS (continued)
| | | | | | | | | | |
| |
Description | Coupon
Rate (%) | | Maturity Date | | Principal
Amount ($) | | Value ($) | |
Long-Term Municipal Investments - 98.7%(continued) | | | | | |
Illinois - 13.9% (continued) | | | | | |
Illinois,
Revenue Bonds (Insured; Build America Mutual Assurance Company) Ser. A | | 5.00 | | 6/15/2030 | | 2,000,000 | | 2,281,960 | |
Illinois,
Sales Tax Revenue Bonds, Refunding | | 5.00 | | 6/15/2024 | | 2,500,000 | | 2,704,875 | |
Illinois Finance Authority,
Revenue Bonds (Advocate Health Care Network) | | 5.00 | | 6/1/2027 | | 5,230,000 | | 5,853,887 | |
Illinois Finance Authority,
Revenue Bonds, Refunding (OSF Healthcare System) Ser. A | | 5.00 | | 11/15/2045 | | 1,000,000 | | 1,093,240 | |
Illinois Finance Authority,
Revenue Bonds, Refunding (Rehabilitation Institute of Chicago) Ser. A | | 6.00 | | 7/1/2043 | | 2,500,000 | | 2,801,975 | |
Illinois Finance Authority,
Revenue Bonds, Refunding (Rush University Medical Center Obligated Group) Ser. A | | 5.00 | | 11/15/2033 | | 3,000,000 | | 3,367,740 | |
Illinois Municipal Electric Agency,
Power Supply System Revenue Bonds, Refunding, Ser. A | | 5.00 | | 2/1/2032 | | 1,500,000 | | 1,721,100 | |
Metropolitan Pier and Exposition Authority,
Revenue Bonds, Refunding (McCormick Place Expansion Project) Ser. B | | 5.00 | | 12/15/2028 | | 2,000,000 | | 2,108,800 | |
Railsplitter Tobacco Settlement Authority,
Revenue Bonds | | 5.00 | | 6/1/2026 | | 2,320,000 | | 2,744,073 | |
| | 49,202,520 | |
Indiana - 1.6% | | | | | |
Indiana Finance Authority,
Hospital Revenue Bonds, Refunding (Community Health Network) Ser. A | | 5.00 | | 5/1/2042 | | 4,000,000 | | 4,331,880 | |
Indiana Finance Authority,
Revenue Bonds, Refunding (Marquette Project) | | 5.00 | | 3/1/2039 | | 1,400,000 | | 1,451,492 | |
| | 5,783,372 | |
Iowa - 1.8% | | | | | |
Iowa Finance Authority,
Healthcare Revenue Bonds (Genesis Health System) | | 5.00 | | 7/1/2024 | | 1,635,000 | | 1,828,126 | |
Iowa Finance Authority,
Midwestern Disaster Area Revenue Bonds, Refunding (Iowa Fertilizer Company Project) | | 5.25 | | 12/1/2025 | | 1,000,000 | | 1,078,270 | |
14
| | | | | | | | | | |
| |
Description | Coupon
Rate (%) | | Maturity Date | | Principal
Amount ($) | | Value ($) | |
Long-Term Municipal Investments - 98.7%(continued) | | | | | |
Iowa - 1.8% (continued) | | | | | |
Iowa Finance Authority,
Midwestern Disaster Area Revenue Bonds, Refunding (Iowa Fertilizer Company Project) | | 5.88 | | 12/1/2027 | | 1,520,000 | | 1,598,341 | |
Iowa Finance Authority,
Midwestern Disaster Area Revenue Bonds, Refunding (Iowa Fertilizer Company Project) Ser. B | | 5.25 | | 12/1/2037 | | 1,765,000 | | 1,892,733 | |
| | 6,397,470 | |
Kansas - .5% | | | | | |
Kansas Development Finance Authority,
Revenue Bonds (Village Shalom Project) Ser. B | | 4.00 | | 11/15/2025 | | 1,700,000 | | 1,737,281 | |
Kentucky - 3.5% | | | | | |
Kentucky Economic Development Finance Authority,
Revenue Bonds, Refunding (Louisville Arena Project) (Insured; Assured Guaranty Municipal Corporation) Ser. A | | 5.00 | | 12/1/2045 | | 2,000,000 | | 2,262,000 | |
Kentucky Public Energy Authority,
Gas Supply Revenue Bonds, Ser. A | | 4.00 | | 4/1/2024 | | 3,250,000 | | 3,507,042 | |
Kentucky Public Energy Authority,
Revenue Bonds, Ser. B | | 4.00 | | 1/1/2025 | | 6,000,000 | | 6,561,300 | |
| | 12,330,342 | |
Louisiana - 2.4% | | | | | |
Louisiana Public Facilities Authority,
Hospital Revenue Bonds (Franciscan Missionaries of Our Lady Health System Project) Ser. A | | 5.00 | | 7/1/2047 | | 1,500,000 | | 1,674,405 | |
Louisiana Tobacco Settlement Financing Corporation,
Asset-Backed Revenue Bonds, Refunding, Ser. A | | 5.25 | | 5/15/2035 | | 1,500,000 | | 1,632,135 | |
New Orleans Aviation Board,
General Airport Revenue Bonds (North Terminal Project) Ser. B | | 5.00 | | 1/1/2040 | | 2,175,000 | | 2,397,633 | |
New Orleans Aviation Board,
Revenue Bonds (Insured; Assured Guaranty Municipal Corp.) | | 5.00 | | 10/1/2048 | | 1,250,000 | | 1,441,875 | |
New Orleans Aviation Board,
Revenue Bonds, Refunding (Insured; Assured Guaranty Municipal Corp.) | | 5.00 | | 1/1/2036 | | 1,135,000 | | 1,323,989 | |
| | 8,470,037 | |
15
STATEMENT OF INVESTMENTS (continued)
| | | | | | | | | | |
| |
Description | Coupon
Rate (%) | | Maturity Date | | Principal
Amount ($) | | Value ($) | |
Long-Term Municipal Investments - 98.7%(continued) | | | | | |
Maine - .6% | | | | | |
Maine Health and Higher Educational Facilities Authority,
Revenue Bonds (Maine General Medical Center) | | 7.50 | | 7/1/2032 | | 2,000,000 | | 2,212,800 | |
Massachusetts - 1.7% | | | | | |
Massachusetts Development Finance Agency,
Revenue Bonds, Refunding (Suffolk University) | | 5.00 | | 7/1/2027 | | 1,750,000 | | 2,080,418 | |
Massachusetts Development Finance Agency,
Revenue Bonds, Refunding, Ser. A | | 5.00 | | 7/1/2033 | | 1,250,000 | | 1,478,588 | |
Massachusetts Development Finance Agency,
Revenue Bonds, Refunding, Ser. A | | 5.00 | | 7/1/2044 | | 1,000,000 | | 1,144,360 | |
Massachusetts Educational Financing Authority,
Education Loan Revenue Bonds, Refunding, Ser. K | | 5.25 | | 7/1/2029 | | 1,325,000 | | 1,421,791 | |
| | 6,125,157 | |
Michigan - 5.2% | | | | | |
Great Lakes Water Authority,
Water Supply System Second Lien Revenue Bonds, Ser. B | | 5.00 | | 7/1/2046 | | 3,000,000 | | 3,387,270 | |
Karegnondi Water Authority,
Revenue Bonds, Refunding | | 5.00 | | 11/1/2041 | | 1,000,000 | | 1,133,940 | |
Lansing Board of Water and Light,
Utility System Revenue Bonds, Ser. A | | 5.50 | | 7/1/2041 | | 1,500,000 | | 1,612,095 | |
Michigan Finance Authority,
Local Government Loan Program Revenue Bonds, Refunding (Insured; Assured Guaranty Municipal Corp.) Ser. C3 | | 5.00 | | 7/1/2031 | | 2,500,000 | | 2,824,025 | |
Michigan Finance Authority,
Local Government Loan Program Revenue Bonds, Refunding (Insured; Assured Guaranty Municipal Corp.) Ser. D1 | | 5.00 | | 7/1/2037 | | 2,000,000 | | 2,231,480 | |
Michigan Strategic Fund,
Revenue Bonds (Genesee Power Station Project) | | 5.00 | | 6/30/2033 | | 3,900,000 | | 4,584,333 | |
Michigan Strategic Fund,
Revenue Bonds, Refunding (Genesee Power Station Project) | | 7.50 | | 1/1/2021 | | 1,700,000 | | 1,684,394 | |
16
| | | | | | | | | | |
| |
Description | Coupon
Rate (%) | | Maturity Date | | Principal
Amount ($) | | Value ($) | |
Long-Term Municipal Investments - 98.7%(continued) | | | | | |
Michigan - 5.2% (continued) | | | | | |
Wayne County Airport Authority,
Airport Revenue Bonds (Detroit Metropolitan Wayne County Airport) Ser. D | | 5.00 | | 12/1/2045 | | 1,000,000 | | 1,134,040 | |
| | 18,591,577 | |
Missouri - .7% | | | | | |
Missouri Health and Educational Facilities Authority,
Health Facilities Revenue Bonds, Refunding (CoxHealth) Ser. A | | 5.00 | | 11/15/2029 | | 2,000,000 | | 2,318,460 | |
Nebraska - .6% | | | | | |
Public Power Generation Agency,
Revenue Bonds, Refunding (Whelan Energy Center Unit 2) | | 5.00 | | 1/1/2037 | | 2,000,000 | | 2,266,020 | |
Nevada - 1.3% | | | | | |
Clark County,
GO (Limited Tax) | | 5.00 | | 11/1/2038 | | 3,020,000 | | 3,368,327 | |
Reno,
Sales Tax Revenue Bonds, Refunding, First Lien (Reno Transportation Rail Access Project) | | 5.00 | | 6/1/2048 | | 1,070,000 | | 1,242,955 | |
| | 4,611,282 | |
New Jersey - 5.2% | | | | | |
Essex County Improvement Authority,
Revenue Bonds (Covanta Project) | | 5.25 | | 7/1/2045 | | 2,500,000 | c | 2,517,200 | |
New Jersey Economic Development Authority,
Revenue Bonds, Refunding, Ser. XX | | 5.25 | | 6/15/2027 | | 1,000,000 | | 1,130,690 | |
New Jersey Economic Development Authority,
School Facilities Construction Revenue Bonds, Refunding, Ser. NN | | 5.00 | | 3/1/2028 | | 1,000,000 | | 1,077,040 | |
New Jersey Economic Development Authority,
School Facilities Construction Revenue Bonds, Refunding, Ser. WW | | 5.25 | | 6/15/2031 | | 2,100,000 | | 2,335,074 | |
New Jersey Economic Development Authority,
School Facilities Construction Revenue Bonds, Refunding, Ser. WW | | 5.25 | | 6/15/2029 | | 1,000,000 | | 1,122,210 | |
New Jersey Educational Facilities Authority,
Revenue Bonds, Refunding (Stockton University) Ser. A | | 5.00 | | 7/1/2041 | | 1,000,000 | | 1,118,360 | |
New Jersey Health Care Facilities Financing Authority,
Revenue Bonds (Inspira Health Obligated Group) | | 5.00 | | 7/1/2037 | | 1,600,000 | | 1,847,632 | |
17
STATEMENT OF INVESTMENTS (continued)
| | | | | | | | | | |
| |
Description | Coupon
Rate (%) | | Maturity Date | | Principal
Amount ($) | | Value ($) | |
Long-Term Municipal Investments - 98.7%(continued) | | | | | |
New Jersey - 5.2% (continued) | | | | | |
New Jersey Tobacco Settlement Financing Corporation,
Revenue Bonds, Refunding, Ser. A | | 5.00 | | 6/1/2046 | | 2,000,000 | | 2,186,000 | |
New Jersey Tobacco Settlement Financing Corporation,
Revenue Bonds, Refunding, Ser. A | | 5.00 | | 6/1/2036 | | 2,000,000 | | 2,286,540 | |
New Jersey Tobacco Settlement Financing Corporation,
Revenue Bonds, Refunding, Ser. A | | 5.25 | | 6/1/2046 | | 2,500,000 | | 2,800,575 | |
| | 18,421,321 | |
New York - 4.7% | | | | | |
New York City Industrial Development Agency,
Senior Airport Facilities Revenue Bonds, Refunding (Transportation Infrastructure Properties, LLC Obligated Group) Ser. A | | 5.00 | | 7/1/2020 | | 1,000,000 | | 1,034,860 | |
New York Counties Tobacco Trust V,
Revenue Bonds, Ser. S2 | | 0.00 | | 6/1/2050 | | 4,400,000 | e | 602,624 | |
New York Liberty Development Corporation,
Revenue Bonds, Refunding (3 World Trade Center Project) | | 5.00 | | 11/15/2044 | | 2,500,000 | c | 2,692,425 | |
New York Liberty Development Corporation,
Revenue Bonds, Refunding (Goldman Sachs Headquarters) | | 5.25 | | 10/1/2035 | | 1,000,000 | | 1,284,080 | |
New York State Dormitory Authority,
State Personal Income Tax Revenue Bonds (General Purpose) Ser. A | | 5.00 | | 2/15/2043 | | 3,100,000 | | 3,422,462 | |
New York State Dormitory Authority,
Toll Highway Senior Revenue Bonds, Refunding, Ser. A | | 5.00 | | 3/15/2035 | | 3,000,000 | | 3,448,380 | |
New York Transportation Development Corporation,
Special Facility Revenue Bonds (LaGuardia Airport Terminal B Redevelopment Project) Ser. A | | 5.00 | | 7/1/2046 | | 2,500,000 | | 2,713,200 | |
New York Transportation Development Corporation,
Special Facility Revenue Bonds, Refunding (American Airlines Inc.) | | 5.00 | | 8/1/2026 | | 700,000 | | 738,325 | |
TSASC,
Revenue Bonds, Refunding, Ser. B | | 5.00 | | 6/1/2048 | | 815,000 | | 797,681 | |
| | 16,734,037 | |
18
| | | | | | | | | | |
| |
Description | Coupon
Rate (%) | | Maturity Date | | Principal
Amount ($) | | Value ($) | |
Long-Term Municipal Investments - 98.7%(continued) | | | | | |
Ohio - 2.7% | | | | | |
Allen County,
Hospital Facilities Revenue Bonds, Refunding (Catholic Health Partners) Ser. A | | 5.00 | | 5/1/2042 | | 4,500,000 | | 4,786,470 | |
Cuyahoga County,
Revenue Bonds, Refunding (The Metrohealth System) | | 5.25 | | 2/15/2047 | | 1,000,000 | | 1,101,570 | |
Ohio,
Revenue Bonds, Refunding (Lease Appropriations-Adult Correctional Building Fund Projects) Ser. A | | 5.00 | | 10/1/2037 | | 1,430,000 | | 1,687,901 | |
Ohio,
Revenue Bonds, Refunding (Lease Appropriations-Adult Correctional Building Fund Projects) Ser. A | | 5.00 | | 10/1/2036 | | 1,750,000 | | 2,072,035 | |
| | 9,647,976 | |
Pennsylvania - 8.8% | | | | | |
Berks County Industrial Development Authority,
Health Systems Revenue Bonds, Refunding (Tower Health Project) | | 5.00 | | 11/1/2047 | | 1,350,000 | | 1,523,772 | |
Commonwealth Financing Authority,
Revenue Bonds (Tobacco Master Settlement Payment) | | 5.00 | | 6/1/2030 | | 2,000,000 | | 2,397,740 | |
Delaware Valley Regional Finance Authority,
Revenue Bonds, Ser. C (Insured; CNTY Gtd.) MUNIPSA +.53% | | 2.83 | | 9/1/2023 | | 3,000,000 | a | 3,001,260 | |
Montgomery County Industrial Development Authority,
Revenue Bonds, Refunding (Adult Communities Total Services, Inc. Retirement - Life Communities, Inc. Obligated Group) | | 5.00 | | 11/15/2036 | | 3,500,000 | | 3,928,470 | |
Pennsylvania Turnpike Commission,
Motor License Fund-Enhanced Turnpike Subordinate Special Revenue Bonds, Ser. B | | 5.00 | | 12/1/2042 | | 3,995,000 | | 4,266,580 | |
Pennsylvania Turnpike Commission,
Oil Franchise Tax Revenue Bonds, Ser. B | | 5.25 | | 12/1/2048 | | 4,000,000 | | 4,701,240 | |
Pennsylvania Turnpike Commission,
Turnpike Revenue Bonds, Ser. A1 | | 5.00 | | 12/1/2036 | | 3,250,000 | | 3,737,012 | |
Pennsylvania Turnpike Commission,
Turnpike Senior Lien Revenue Bonds, Ser. A | | 5.00 | | 12/1/2042 | | 2,000,000 | | 2,152,180 | |
Philadelphia School District,
GO, Refunding, Ser. E | | 5.25 | | 9/1/2023 | | 4,000,000 | | 4,157,280 | |
19
STATEMENT OF INVESTMENTS (continued)
| | | | | | | | | | |
| |
Description | Coupon
Rate (%) | | Maturity Date | | Principal
Amount ($) | | Value ($) | |
Long-Term Municipal Investments - 98.7%(continued) | | | | | |
Pennsylvania - 8.8% (continued) | | | | | |
Philadelphia School District,
GO, Ser. A | | 5.00 | | 9/1/2038 | | 1,000,000 | | 1,140,510 | |
| | 31,006,044 | |
South Carolina - 1.5% | | | | | |
South Carolina Public Service Authority,
Revenue Bonds, Refunding (Santee Cooper) Ser. B | | 5.13 | | 12/1/2043 | | 5,000,000 | | 5,457,700 | |
Tennessee - 1.3% | | | | | |
Johnson City Health and Educational Facilities Board,
Revenue Bonds, Refunding (Mountain States Health Alliance) Ser. A | | 6.00 | | 7/1/2020 | | 2,435,000 | f | 2,556,555 | |
Tennessee Energy Acquisition Corporation,
Gas Revenue Bonds | | 4.00 | | 11/1/2025 | | 1,750,000 | | 1,896,458 | |
| | 4,453,013 | |
Texas - 11.0% | | | | | |
Austin,
Water & Waste Water Systems Revenue Bonds, Refunding, Ser. A | | 5.00 | | 11/15/2043 | | 3,305,000 | | 3,661,609 | |
Clifton Higher Education Finance Corporation,
Education Revenue Bonds, Refunding (IDEA Public Schools) (Insured; Permanent School Fund Guarantee Program) | | 5.00 | | 8/15/2031 | | 3,825,000 | | 4,328,485 | |
Clifton Higher Education Finance Corporation,
Revenue Bonds (International Leadership) Ser. D | | 5.75 | | 8/15/2033 | | 4,500,000 | | 4,771,800 | |
Garland,
Tax Electric Utility System Revenue Bonds, Refunding | | 5.00 | | 3/1/2044 | | 1,500,000 | | 1,776,975 | |
Love Field Airport Modernization Corporation,
General Airport Revenue Bonds | | 5.00 | | 11/1/2034 | | 3,500,000 | | 3,984,505 | |
Love Field Airport Modernization Corporation,
Special Facilities Revenue Bonds (Southwest Airlines Company) | | 5.00 | | 11/1/2022 | | 2,000,000 | | 2,205,480 | |
Lower Colorado River Authority,
Revenue Bonds, Refunding | | 5.00 | | 5/15/2039 | | 3,000,000 | | 3,279,420 | |
Lubbock,
Tax Electric Light & Power System Revenue Bonds | | 5.00 | | 4/15/2048 | | 2,475,000 | | 2,873,648 | |
20
| | | | | | | | | | |
| |
Description | Coupon
Rate (%) | | Maturity Date | | Principal
Amount ($) | | Value ($) | |
Long-Term Municipal Investments - 98.7%(continued) | | | | | |
Texas - 11.0% (continued) | | | | | |
Mission Economic Development Corporation,
Revenue Bonds, Refunding (Natgasoline Project) | | 4.63 | | 10/1/2031 | | 1,000,000 | c | 1,043,640 | |
New Hope Cultural Education Facilities Finance Corporation,
Student Housing Revenue Bonds (National Campus and Community Development Corporation - College Station Properties LLC) Ser. A | | 5.00 | | 7/1/2035 | | 1,500,000 | | 1,379,295 | |
North Texas Tollway Authority,
First Tier System Revenue Bonds, Refunding, Ser. A | | 5.00 | | 1/1/2039 | | 4,000,000 | | 4,582,800 | |
North Texas Tollway Authority,
Revenue Bonds, Refunding | | 5.00 | | 1/1/2048 | | 1,000,000 | | 1,152,690 | |
San Antonio,
Electric and Gas Systems Junior Lien Revenue Bonds | | 5.00 | | 2/1/2043 | | 3,500,000 | | 3,851,225 | |
| | 38,891,572 | |
U.S. Related - .4% | | | | | |
Puerto Rico Highway & Transportation Authority,
Transportation Revenue Bonds, Refunding (Insured; AMBAC Indemnity Corp.) Ser. L | | 5.25 | | 7/1/2041 | | 1,400,000 | | 1,475,670 | |
Utah - 1.0% | | | | | |
Salt Lake City,
Airport Revenue Bonds, Ser. A | | 5.00 | | 7/1/2034 | | 3,000,000 | | 3,502,830 | |
Virginia - 1.0% | | | | | |
Virginia Small Business Financing Authority,
Revenue Bonds (AMT-Senior Lien-95 Express Lanes) | | 5.00 | | 7/1/2034 | | 1,700,000 | | 1,802,306 | |
Winchester Economic Development Authority,
Revenue Bonds, Refunding (Valley Health System Obligated Group) | | 5.00 | | 1/1/2035 | | 1,560,000 | | 1,777,667 | |
| | 3,579,973 | |
Washington - .8% | | | | | |
Washington State Convention Center Public Facilities District,
Revenue Bonds | | 5.00 | | 7/1/2058 | | 2,450,000 | | 2,775,066 | |
West Virginia - 1.5% | | | | | |
West Virginia University,
Revenue Bonds (West Virginia University Projects) Ser. B | | 5.00 | | 10/1/2036 | | 5,000,000 | | 5,310,650 | |
21
STATEMENT OF INVESTMENTS (continued)
| | | | | | | | | | |
| |
Description | Coupon
Rate (%) | | Maturity Date | | Principal
Amount ($) | | Value ($) | |
Long-Term Municipal Investments - 98.7%(continued) | | | | | |
Wisconsin - .6% | | | | | |
Public Finance Authority,
Revenue Bonds, Refunding (Renown Regional Medical Center Project) Ser. A | | 5.00 | | 6/1/2040 | | 2,000,000 | | 2,209,220 | |
TotalLong-Term Municipal Investments
(cost $334,840,382) | | 350,013,672 | |
Total Investments(cost $336,099,457) | | 99.1% | 351,296,260 | |
Cash and Receivables (Net) | | 0.9% | 3,187,501 | |
Net Assets | | 100.0% | 354,483,761 | |
a Variable rate security—rate shown is the interest rate in effect at period end.
b Zero coupon until a specified date at which time the stated coupon rate becomes effective until maturity.
c Security exempt from registration pursuant to Rule 144A under the Securities Act of 1933. These securities may be resold in transactions exempt from registration, normally to qualified institutional buyers. At April 30, 2019, these securities were valued at $14,134,193 or 3.99% of net assets.
d Auction Rate Security—interest rate is reset periodically under an auction process that is conducted by an auction agent. Rate shown is the interest rate in effect at period end.
e Security issued with a zero coupon. Income is recognized through the accretion of discount.
f These securities are prerefunded; the date shown represents the prerefunded date. Bonds which are prerefunded are collateralized by U.S. Government securities which are held in escrow and are used to pay principal and interest on the municipal issue and to retire the bonds in full at the earliest refunding date.
22
| | |
Portfolio Summary (Unaudited)† | Value (%) |
Medical | 14.3 |
Airport | 10.7 |
Education | 9.9 |
Transportation | 8.8 |
Water | 7.9 |
Municipal | 6.6 |
Special Tax | 5.6 |
General Obligation | 5.4 |
Development | 4.1 |
Power | 4.0 |
Tobacco Settlement | 3.7 |
Utilities | 3.1 |
Nursing Homes | 2.6 |
School District | 2.3 |
Utility-Electric Rev | 1.9 |
Facilities | 1.9 |
Lease Rev. | 1.4 |
Pollution | 1.2 |
Other | 1.0 |
Industl Revenue | .8 |
Prerefunded | .7 |
Student Loan | .4 |
Housing | .4 |
Multifamily Housing | .4 |
| | 99.1 |
† Based on net assets.
See notes to financial statements.
23
| | | | |
| |
Summary of Abbreviations(Unaudited) |
| |
ABAG | Association of Bay Area Governments | ACA | American Capital Access |
AGC | ACE Guaranty Corporation | AGIC | Asset Guaranty Insurance Company |
AMBAC | American Municipal Bond Assurance Corporation | ARRN | Adjustable Rate Receipt Notes |
BAN | Bond Anticipation Notes | BPA | Bond Purchase Agreement |
CIFG | CDC Ixis Financial Guaranty | COP | Certificate of Participation |
CP | Commercial Paper | DRIVERS | Derivative Inverse Tax-Exempt Receipts |
EDR | Economic Development Revenue | EIR | Environmental Improvement Revenue |
EURIBOR | Euro Interbank Offered Rate | FGIC | Financial Guaranty Insurance Company |
FHA | Federal Housing Administration | FHLB | Federal Home Loan Bank |
FHLMC | Federal Home Loan Mortgage Corporation | FNMA | Federal National Mortgage Association |
GAN | Grant Anticipation Notes | GIC | Guaranteed Investment Contract |
GNMA | Government National Mortgage Association | GO | General Obligation |
HR | Hospital Revenue | IDB | Industrial Development Board |
IDC | Industrial Development Corporation | IDR | Industrial Development Revenue |
LIBOR | London Interbank Offered Rate | LIFERS | Long Inverse Floating Exempt Receipts |
LOC | Letter of Credit | LOR | Limited Obligation Revenue |
LR | Lease Revenue | MERLOTS | Municipal Exempt Receipts Liquidity Option Tender |
MFHR | Multi-Family Housing Revenue | MFMR | Multi-Family Mortgage Revenue |
MUNIPSA | Securities Industry and Financial Markets Association Municipal Swap Index Yield | PCR | Pollution Control Revenue |
PILOT | Payment in Lieu of Taxes | P-FLOATS | Puttable Floating Option Tax-Exempt Receipts |
PUTTERS | Puttable Tax-Exempt Receipts | RAC | Revenue Anticipation Certificates |
RAN | Revenue Anticipation Notes | RAW | Revenue Anticipation Warrants |
RIB | Residual Interest Bonds | ROCS | Reset Options Certificates |
RRR | Resources Recovery Revenue | SAAN | State Aid Anticipation Notes |
SBPA | Standby Bond Purchase Agreement | SFHR | Single Family Housing Revenue |
SFMR | Single Family Mortgage Revenue | SOFRRATE | Secured Overnight Financing Rate |
SONYMA | State of New York Mortgage Agency | SPEARS | Short Puttable Exempt Adjustable Receipts |
SWDR | Solid Waste Disposal Revenue | TAN | Tax Anticipation Notes |
TAW | Tax Anticipation Warrants | TRAN | Tax and Revenue Anticipation Notes |
XLCA | XL Capital Assurance | | |
See notes to financial statements.
24
STATEMENT OF ASSETS AND LIABILITIES
April 30, 2019
| | | | | | | |
| | | | | | |
| | | Cost | | Value | |
Assets ($): | | | | |
Investments in securities—See Statement of Investments | 336,099,457 | | 351,296,260 | |
Cash | | | | | 1,829,910 | |
Interest receivable | | 4,935,705 | |
Receivable for shares of Beneficial Interest subscribed | | 92,648 | |
Prepaid expenses | | | | | 45,296 | |
| | | | | 358,199,819 | |
Liabilities ($): | | | | |
Due to BNY Mellon Investment Adviser, Inc. and affiliates—Note 3(c) | | 193,282 | |
Payable for investment securities purchased | | 2,763,767 | |
Payable for shares of Beneficial Interest redeemed | | 662,534 | |
Trustees fees and expenses payable | | 7,401 | |
Accrued expenses | | | | | 89,074 | |
| | | | | 3,716,058 | |
Net Assets ($) | | | 354,483,761 | |
Composition of Net Assets ($): | | | | |
Paid-in capital | | | | | 339,251,198 | |
Total distributable earnings (loss) | | | | | 15,232,563 | |
Net Assets ($) | | | 354,483,761 | |
| | | | | | | |
Net Asset Value Per Share | Class A | Class C | Class I | Class Y | Class Z | |
Net Assets ($) | 146,874,593 | 5,796,227 | 26,520,637 | 40,674 | 175,251,630 | |
Shares Outstanding | 11,362,999 | 447,362 | 2,051,050 | 3,146.83 | 13,557,779 | |
Net Asset Value Per Share ($) | 12.93 | 12.96 | 12.93 | 12.93 | 12.93 | |
| | | | | | |
See notes to financial statements. | | | | | | |
25
STATEMENT OF OPERATIONS
Year Ended April 30, 2019
| | | | | | | |
| | | | | | |
| | | | | | |
Investment Income ($): | | | | |
Interest Income | | | 13,189,100 | |
Expenses: | | | | |
Management fee—Note 3(a) | | | 1,676,362 | |
Shareholder servicing costs—Note 3(c) | | | 909,988 | |
Professional fees | | | 92,540 | |
Registration fees | | | 78,511 | |
Distribution fees—Note 3(b) | | | 42,293 | |
Trustees’ fees and expenses—Note 3(d) | | | 27,038 | |
Prospectus and shareholders’ reports | | | 19,189 | |
Loan commitment fees—Note 2 | | | 7,339 | |
Custodian fees—Note 3(c) | | | 4,434 | |
Miscellaneous | | | 54,106 | |
Total Expenses | | | 2,911,800 | |
Less—reduction in fees due to earnings credits—Note 3(c) | | | (3,817) | |
Net Expenses | | | 2,907,983 | |
Investment Income—Net | | | 10,281,117 | |
Realized and Unrealized Gain (Loss) on Investments—Note 4 ($): | | |
Net realized gain (loss) on investments | 2,499,802 | |
Net realized gain (loss) on futures | (23,352) | |
Net Realized Gain (Loss) | | | 2,476,450 | |
Net unrealized appreciation (depreciation) on investments | | | 6,561,615 | |
Net Realized and Unrealized Gain (Loss) on Investments | | | 9,038,065 | |
Net Increase in Net Assets Resulting from Operations | | 19,319,182 | |
| | | | | | |
See notes to financial statements. | | | | | |
26
STATEMENT OF CHANGES IN NET ASSETS
| | | | | | | | | | |
| | | | Year Ended April 30, |
| | | | 2019 | | 2018 | |
Operations ($): | | | | | | | | |
Investment income—net | | | 10,281,117 | | | | 11,137,917 | |
Net realized gain (loss) on investments | | 2,476,450 | | | | 5,662,062 | |
Net unrealized appreciation (depreciation)
on investments | | 6,561,615 | | | | (9,965,103) | |
Net Increase (Decrease) in Net Assets
Resulting from Operations | 19,319,182 | | | | 6,834,876 | |
Distributions ($): | |
Distributions to shareholders: | | | | | | | | |
Class A | | | (4,363,195) | | | | (4,834,323) | |
Class C | | | (123,286) | | | | (175,138) | |
Class I | | | (604,493) | | | | (260,413) | |
Class Y | | | (869) | | | | (297) | |
Class Z | | | (5,295,246) | | | | (5,875,625) | |
Total Distributions | | | (10,387,089) | | | | (11,145,796) | |
Beneficial Interest Transactions ($): | |
Net proceeds from shares sold: | | | | | | | | |
Class A | | | 6,183,454 | | | | 12,096,524 | |
Class C | | | 1,103,622 | | | | 1,095,825 | |
Class I | | | 17,255,365 | | | | 10,044,766 | |
Class Y | | | 30,000 | | | | - | |
Class Z | | | 2,852,938 | | | | 2,833,411 | |
Distributions reinvested: | | | | | | | | |
Class A | | | 3,599,588 | | | | 3,892,245 | |
Class C | | | 97,941 | | | | 140,527 | |
Class I | | | 599,485 | | | | 258,620 | |
Class Z | | | 4,255,343 | | | | 4,694,480 | |
Cost of shares redeemed: | | | | | | | | |
Class A | | | (17,922,801) | | | | (28,253,684) | |
Class C | | | (1,348,654) | | | | (5,146,753) | |
Class I | | | (5,776,431) | | | | (1,763,487) | |
Class Z | | | (17,191,619) | | | | (24,128,999) | |
Increase (Decrease) in Net Assets
from Beneficial Interest Transactions | (6,261,769) | | | | (24,236,525) | |
Total Increase (Decrease) in Net Assets | 2,670,324 | | | | (28,547,445) | |
Net Assets ($): | |
Beginning of Period | | | 351,813,437 | | | | 380,360,882 | |
End of Period | | | 354,483,761 | | | | 351,813,437 | |
27
STATEMENT OF CHANGES IN NET ASSETS (continued)
| | | | | | | | | | |
| | | | Year Ended April 30, |
| | | | 2019 | | 2018 | |
Capital Share Transactions (Shares): | |
Class Aa | | | | | | | | |
Shares sold | | | 488,547 | | | | 936,607 | |
Shares issued for distributions reinvested | | | 283,746 | | | | 303,239 | |
Shares redeemed | | | (1,414,144) | | | | (2,200,610) | |
Net Increase (Decrease) in Shares Outstanding | (641,851) | | | | (960,764) | |
Class Ca | | | | | | | | |
Shares sold | | | 87,229 | | | | 85,012 | |
Shares issued for distributions reinvested | | | 7,700 | | | | 10,907 | |
Shares redeemed | | | (106,503) | | | | (397,925) | |
Net Increase (Decrease) in Shares Outstanding | (11,574) | | | | (302,006) | |
Class I | | | | | | | | |
Shares sold | | | 1,370,633 | | | | 785,027 | |
Shares issued for distributions reinvested | | | 47,198 | | | | 20,205 | |
Shares redeemed | | | (457,311) | | | | (137,101) | |
Net Increase (Decrease) in Shares Outstanding | 960,520 | | | | 668,131 | |
Class Y | | | | | | | | |
Shares sold | | | 2,400 | | | | - | |
Net Increase (Decrease) in Shares Outstanding | 2,400 | | | | - | |
Class Z | | | | | | | | |
Shares sold | | | 225,215 | | | | 220,879 | |
Shares issued for distributions reinvested | | | 335,413 | | | | 365,718 | |
Shares redeemed | | | (1,357,812) | | | | (1,878,779) | |
Net Increase (Decrease) in Shares Outstanding | (797,184) | | | | (1,292,182) | |
| | | | | | | | | |
aDuring the period ended April 30, 2019, 1,768 Class C shares representing $22,448 were automatically converted for 1,772 Class A shares and during the period ended April 30, 2018, 35,882 Class C shares representing $465,113 were automatically converted for 35,972 Class A shares.
| |
See notes to financial statements. | | | | | | | | |
28
FINANCIAL HIGHLIGHTS
The following tables describe the performance for each share class for the fiscal periods indicated. All information (except portfolio turnover rate) reflects financial results for a single fund share. Total return shows how much your investment in the fund would have increased (or decreased) during each period, assuming you had reinvested all dividends and distributions. These figures have been derived from the fund’s financial statements.
| | | | | | | | | | |
| | | | | | |
| | |
| | Year Ended April 30, |
Class A Shares | | 2019 | 2018 | 2017 | 2016 | 2015 |
Per Share Data ($): | | | | | | |
Net asset value, beginning of period | | 12.60 | 12.76 | 13.24 | 12.96 | 12.65 |
Investment Operations: | | | | | | |
Investment income—neta | | .37 | .38 | .39 | .42 | .44 |
Net realized and unrealized
gain (loss) on investments | | .34 | (.16) | (.48) | .28 | .30 |
Total from Investment Operations | | .71 | .22 | (.09) | .70 | .74 |
Distributions: | | | | | | |
Dividends from investment
income—net | | (.37) | (.38) | (.39) | (.42) | (.43) |
Dividends from net realized
gain on investments | | (.01) | — | — | — | — |
Total Distributions | | (.38) | (.38) | (.39) | (.42) | (.43) |
Net asset value, end of period | | 12.93 | 12.60 | 12.76 | 13.24 | 12.96 |
Total Return (%)b | | 5.70 | 1.72 | (.70) | 5.52 | 5.94 |
Ratios/Supplemental Data (%): | | | | | | |
Ratio of total expenses
to average net assets | | .86 | .93 | .94 | .92 | .93 |
Ratio of net expenses
to average net assets | | .86 | .93 | .94 | .92 | .93 |
Ratio of interest and expense related
to floating rate notes issued
to average net assets | | — | — | — | .00c | .01 |
Ratio of net investment income
to average net assets | | 2.94 | 2.97 | 2.99 | 3.27 | 3.38 |
Portfolio Turnover Rate | | 27.39 | 26.94 | 20.93 | 18.85 | 16.18 |
Net Assets, end of period ($ x 1,000) | | 146,875 | 151,312 | 165,492 | 183,052 | 186,078 |
a Based on average shares outstanding.
b Exclusive of sales charge.
c Amount represents less than .01%
See notes to financial statements.
29
FINANCIAL HIGHLIGHTS (continued)
| | | | | | | | | | | |
| | | | | | |
| | |
| | Year Ended April 30, |
Class C Shares | | 2019 | 2018 | 2017 | 2016 | 2015 |
Per Share Data ($): | | | | | | |
Net asset value, beginning of period | | 12.63 | 12.79 | 13.27 | 12.99 | 12.68 |
Investment Operations: | | | | | | |
Investment income—neta | | .27 | .28 | .29 | .33 | .34 |
Net realized and unrealized
gain (loss) on investments | | .34 | (.16) | (.48) | .28 | .30 |
Total from Investment Operations | | .61 | .12 | (.19) | .61 | .64 |
Distributions: | | | | | | |
Dividends from investment
income—net | | (.27) | (.28) | (.29) | (.33) | (.33) |
Dividends from net realized
gain on investments | | (.01) | — | — | — | — |
Total Distributions | | (.28) | (.28) | (.29) | (.33) | (.33) |
Net asset value, end of period | | 12.96 | 12.63 | 12.79 | 13.27 | 12.99 |
Total Return (%)b | | 4.87 | .94 | (1.45) | 4.74 | 5.11 |
Ratios/Supplemental Data (%): | | | | | | |
Ratio of total expenses
to average net assets | | 1.65 | 1.70 | 1.71 | 1.69 | 1.69 |
Ratio of net expenses
to average net assets | | 1.65 | 1.70 | 1.71 | 1.69 | 1.69 |
Ratio of interest and expense related
to floating rate notes issued to
average net assets | | — | — | — | .00c | .01 |
Ratio of net investment income
to average net assets | | 2.15 | 2.20 | 2.23 | 2.53 | 2.59 |
Portfolio Turnover Rate | | 27.39 | 26.94 | 20.93 | 18.85 | 16.18 |
Net Assets, end of period ($ x 1,000) | | 5,796 | 5,798 | 9,736 | 10,307 | 8,490 |
a Based on average shares outstanding.
b Exclusive of sales charge.
c Amount represents less than .01%.
See notes to financial statements.
30
| | | | | | |
| | | | | | |
| | | | | | |
| | | | Year Ended April 30, |
Class I Shares | | | 2019 | 2018 | 2017a |
Per Share Data ($): | | | | | |
Net asset value, beginning of period | | | 12.61 | 12.77 | 13.39 |
Investment Operations: | | | | | |
Investment income—netb | | | .40 | .40 | .24 |
Net realized and unrealized
gain (loss) on investments | | | .33 | (.15) | (.58) |
Total from Investment Operations | | | .73 | .25 | (.34) |
Distributions: | | | | | |
Dividends from investment income—net | | | (.40) | (.41) | (.28) |
Dividends from net realized gain on investments | | | (.01) | — | — |
Total Distributions | | | (.41) | (.41) | (.28) |
Net asset value, end of period | | | 12.93 | 12.61 | 12.77 |
Total Return (%) | | | 5.88 | 1.96 | (2.56)c |
Ratios/Supplemental Data (%): | | | | | |
Ratio of total expenses to average net assets | | | .62 | .70 | .75d |
Ratio of net expenses to average net assets | | | .62 | .70 | .75d |
Ratio of net investment income
to average net assets | | | 3.17 | 3.19 | 3.35d |
Portfolio Turnover Rate | | | 27.39 | 26.94 | 20.93 |
Net Assets, end of period ($ x 1,000) | | | 26,521 | 13,751 | 5,393 |
a From August 31, 2016 (commencement of initial offering) to April 30, 2017.
b Based on average shares outstanding.
c Not annualized.
d Annualized.
See notes to financial statements.
31
FINANCIAL HIGHLIGHTS (continued)
| | | | | | | | |
| | | | | | | |
| | | | | | | |
| | | | | | Year Ended April 30, |
Class Y Shares | | | | 2019 | 2018 | 2017a |
Per Share Data ($): | | | | | | |
Net asset value, beginning of period | | | | 12.61 | 12.77 | 13.39 |
Investment Operations: | | | | | | |
Investment income—netb | | | | .42 | .41 | .25 |
Net realized and unrealized gain (loss) on investments | | | | .31 | (.17) | (.63) |
Total from Investment Operations | | | | .73 | .24 | (.38) |
Distributions: | | | | | | |
Dividends from investment income—net | | | | (.40) | (.40) | (.24) |
Dividends from net realized gain on investments | | | | (.01) | — | — |
Total Distributions | | | | (.41) | (.40) | (.24) |
Net asset value, end of period | | | | 12.93 | 12.61 | 12.77 |
Total Return (%) | | | | 5.85 | 1.93 | (2.87)c |
Ratios/Supplemental Data (%): | | | | | | |
Ratio of total expenses to average net assets | | | | .62 | .70 | .86d |
Ratio of net expenses to average net assets | | | | .62 | .70 | .86d |
Ratio of net investment income to average net assets | | | | 3.22 | 3.17 | 2.90d |
Portfolio Turnover Rate | | | | 27.39 | 26.94 | 20.93 |
Net Assets, end of period ($ x 1,000) | | | | 41 | 9 | 10 |
a From August 31, 2016 (commencement of initial offering) to April 30, 2017.
b Based on average shares outstanding.
c Not annualized.
d Annualized.
See notes to financial statements.
32
| | | | | | | | | | | |
| | | | | | |
| | |
| | Year Ended April 30, |
Class Z Shares | | 2019 | 2018 | 2017 | 2016 | 2015 |
Per Share Data ($): | | | | | | |
Net asset value, beginning of period | | 12.60 | 12.76 | 13.24 | 12.96 | 12.65 |
Investment Operations: | | | | | | |
Investment income—neta | | .38 | .39 | .40 | .43 | .44 |
Net realized and unrealized
gain (loss) on investments | | .34 | (.16) | (.49) | .28 | .31 |
Total from Investment Operations | | .72 | .23 | (.09) | .71 | .75 |
Distributions:: | | | | | | |
Dividends from investment
income—net | | (.38) | (.39) | (.39) | (.43) | (.44) |
Dividends from net realized
gain on investments | | (.01) | — | — | — | — |
Total Distributions | | (.39) | (.39) | (.39) | (.43) | (.44) |
Net asset value, end of period | | 12.93 | 12.60 | 12.76 | 13.24 | 12.96 |
Total Return (%) | | 5.75 | 1.79 | (.65) | 5.57 | 6.00 |
Ratios/Supplemental Data (%): | | | | | | |
Ratio of total expenses
to average net assets | | .81 | .87 | .89 | .87 | .87 |
Ratio of net expenses
to average net assets | | .81 | .87 | .89 | .87 | .87 |
Ratio of interest and expense
related to floating rate notes
issued to average net assets | | — | — | — | .00b | .01 |
Ratio of net investment income
to average net assets | | 2.99 | 3.03 | 3.05 | 3.32 | 3.43 |
Portfolio Turnover Rate | | 27.39 | 26.94 | 20.93 | 18.85 | 16.18 |
Net Assets, end of period ($ x 1,000) | | 175,252 | 180,942 | 199,730 | 215,695 | 216,573 |
a Based on average shares outstanding.
b Amount represents less than .01%.
See notes to financial statements.
33
NOTES TO FINANCIAL STATEMENTS
NOTE 1—Significant Accounting Policies:
BNY Mellon Opportunistic Municipal Securities Fund (the “fund”) is registered under the Investment Company Act of 1940, as amended (the “Act”), is a diversified open-ended management investment company. The fund’s investment objective is to seek to maximize current income exempt from federal income tax to the extent consistent with the preservation of capital. BNY Mellon Investment Adviser, Inc. (the “Adviser”), a wholly-owned subsidiary of The Bank of New York Mellon Corporation (“BNY Mellon”), serves as the fund’s investment adviser.
Effective June 3, 2019, the fund changed its name from Dreyfus Municipal Bond Opportunity Fund to BNY Mellon Opportunistic Municipal Securities Fund. In addition, The Dreyfus Corporation, the fund’s investment adviser and administrator, changed its name to “BNY Mellon Investment Adviser, Inc.”, MBSC Securities Corporation, the fund’s distributor, changed its name to “BNY Mellon Securities Corporation” and Dreyfus Transfer, Inc., the fund’s transfer agent, changed its name to “BNY Mellon Transfer, Inc.”
BNY Mellon Securities Corporation (the “Distributor”), a wholly-owned subsidiary of the Adviser, is the distributor of the fund’s shares. The fund is authorized to issue an unlimited number of $.001 par value shares of Beneficial Interest in each of the following classes of shares: Class A, Class C, Class I, Class T, Class Y and Class Z. Class A and Class T shares generally are subject to a sales charge imposed at the time of purchase. Class C shares are subject to a contingent deferred sales charge (“CDSC”) imposed on Class C shares redeemed within one year of purchase. Class C shares automatically convert to Class A shares ten years after the date of purchase, without the imposition of a sales charge. Class I and Class Y shares are sold at net asset value per share generally to institutional investors. Class Z shares are sold at net asset value per share to certain shareholders of the fund. Class Z shares generally are not available for new accounts. As of the date of this report, the fund did not offer Class T shares for purchase. Other differences between the classes include the services offered to and the expenses borne by each class, the allocation of certain transfer agency costs, and certain voting rights. Income, expenses (other than expenses attributable to a specific class), and realized and unrealized gains or losses on investments are allocated to each class of shares based on its relative net assets.
As of April 30, 2019, MBC Investments Corp., an indirect subsidiary of BNY Mellon, held all of outstanding shares of Class Y shares of the fund.
34
The Financial Accounting Standards Board (“FASB”) Accounting Standards Codification is the exclusive reference of authoritative U.S. generally accepted accounting principles (“GAAP”) recognized by the FASB to be applied by nongovernmental entities. Rules and interpretive releases of the Securities and Exchange Commission (“SEC”) under authority of federal laws are also sources of authoritative GAAP for SEC registrants. The fund’s financial statements are prepared in accordance with GAAP, which may require the use of management estimates and assumptions. Actual results could differ from those estimates.
The fundenters into contracts that contain a variety of indemnifications. The fund’s maximum exposure under these arrangements is unknown. The fund does not anticipate recognizing any loss related to these arrangements.
(a) Portfolio valuation: The fair value of a financial instrument is the amount that would be received to sell an asset or paid to transfer a liability in an orderly transaction between market participants at the measurement date (i.e., the exit price). GAAP establishes a fair value hierarchy that prioritizes the inputs of valuation techniques used to measure fair value. This hierarchy gives the highest priority to unadjusted quoted prices in active markets for identical assets or liabilities (Level 1 measurements) and the lowest priority to unobservable inputs (Level 3 measurements).
Additionally, GAAP provides guidance on determining whether the volume and activity in a market has decreased significantly and whether such a decrease in activity results in transactions that are not orderly. GAAP requires enhanced disclosures around valuation inputs and techniques used during annual and interim periods.
Various inputs are used in determining the value of the fund’s investments relating to fair value measurements. These inputs are summarized in the three broad levels listed below:
Level 1—unadjusted quoted prices in active markets for identical investments.
Level 2—other significant observable inputs (including quoted prices for similar investments, interest rates, prepayment speeds, credit risk, etc.).
Level 3—significant unobservable inputs (including the fund’s own assumptions in determining the fair value of investments).
The inputs or methodology used for valuing securities are not necessarily an indication of the risk associated with investing in those securities.
35
NOTES TO FINANCIAL STATEMENTS(continued)
Changes in valuation techniques may result in transfers in or out of an assigned level within the disclosure hierarchy. Valuation techniques used to value the fund’s investments are as follows:
Investments in securities are valued each business day by an independent pricing service (the “Service”) approved by the fund’s Board of Trustees (the “Board”). Investments for which quoted bid prices are readily available and are representative of the bid side of the market in the judgment of the Service are valued at the mean between the quoted bid prices (as obtained by the Service from dealers in such securities) and asked prices (as calculated by the Service based upon its evaluation of the market for such securities). Other investments (which constitute a majority of the portfolio securities) are carried at fair value as determined by the Service, based on methods which include consideration of the following: yields or prices of municipal securities of comparable quality, coupon, maturity and type; indications as to values from dealers; and general market conditions. All of the preceding securities are generally categorized within Level 2 of the fair value hierarchy.
The Service is engaged under the general oversight of the Board.
When market quotations or official closing prices are not readily available, or are determined not to accurately reflect fair value, such as when the value of a security has been significantly affected by events after the close of the exchange or market on which the security is principally traded, but before the fund calculates its net asset value, the fund may value these investments at fair value as determined in accordance with the procedures approved by the Board. Certain factors may be considered when fair valuing investments such as: fundamental analytical data, the nature and duration of restrictions on disposition, an evaluation of the forces that influence the market in which the securities are purchased and sold, and public trading in similar securities of the issuer or comparable issuers. These securities are either categorized within Level 2 or 3 of the fair value hierarchy depending on the relevant inputs used.
For restricted securities where observable inputs are limited, assumptions about market activity and risk are used and such securities are generally categorized within Level 3 of the fair value hierarchy.
The following is a summary of the inputs used as of April 30, 2019in valuing the fund’s investments:
36
| | | | | |
| | Level 1 - Unadjusted Quoted Prices | Level 2 - Other Significant Observable Inputs | Level 3 - Significant Unobservable Inputs | Total |
Assets ($) | | | |
Investments in Securities: | | | |
Municipal Bonds† | — | 351,296,260 | — | 351,296,260 |
† See Statement of Investments for additional detailed categorizations.
At April 30, 2019, there were no transfers between levels of the fair value hierarchy. It is the fund’s policy to recognize transfers between levels at the end of the reporting period.
(b) Securities transactions and investment income: Securities transactions are recorded on a trade date basis. Realized gains and losses from securities transactions are recorded on the identified cost basis. Interest income, adjusted for accretion of discount and amortization of premium on investments, is earned from settlement date and recognized on the accrual basis. Securities purchased or sold on a when issued or delayed delivery basis may be settled a month or more after the trade date.
(c) Dividends and distributions to shareholders:It is the policy of the fund to declare dividends daily from investment income-net. Such dividends are paid monthly. Dividends from net realized capital gains, if any, are normally declared and paid annually, but the fund may make distributions on a more frequent basis to comply with the distribution requirements of the Internal Revenue Code of 1986, as amended (the “Code”). To the extent that net realized capital gains can be offset by capital loss carryovers, it is the policy of the fund not to distribute such gains. Income and capital gain distributions are determined in accordance with income tax regulations, which may differ from GAAP.
(d) Federal income taxes: It is the policy of the fund to continue to qualify as a regulated investment company, which can distribute tax-exempt dividends, by complying with the applicable provisions of the Code, and to make distributions of income and net realized capital gain sufficient to relieve it from substantially all federal income and excise taxes.
As of and during the period ended April 30, 2019, the fund did not have any liabilities for any uncertain tax positions. The fund recognizes interest and penalties, if any, related to uncertain tax positions as income tax expense in the Statement of Operations. During the period ended April 30, 2019, the fund did not incur any interest or penalties.
37
NOTES TO FINANCIAL STATEMENTS(continued)
Each tax year in the four-year period ended April 30, 2019 remains subject to examination by the Internal Revenue Service and state taxing authorities.
At April 30, 2019, the components of accumulated earnings on a tax basis were as follows: undistributed tax-exempt income $699,095 and unrealized appreciation $15,224,732.
The tax character of distributions paid to shareholders during the fiscal periods ended April 30, 2019 and April 30, 2018 were as follows: tax-exempt income $10,202,806 and $11,145,796, and ordinary income $184,283 and $0, respectively.
During the period ended April 30, 2019, as a result of permanent book to tax differences, primarily due to the tax treatment for capital loss carryover expiration and dividend reclassification, the fund increased total distributable earnings (loss) by $1,325,817 and decreased paid-in capital by the same amount. Net assets and net asset value per share were not affected by this reclassification.
(e) New Accounting Pronouncements: In March 2017, the FASB issued Accounting Standards Update 2017-08, Receivables—Nonrefundable Fees and Other Costs (Subtopic 310-20): Premium Amortization On Purchased Callable Debt Securities (“ASU 2017-08”). The update shortens the amortization period for the premium on certain purchased callable debt securities to the earliest call date. ASU 2017-08 will be effective for fiscal years beginning after December 15, 2018.
Also in August 2018, the FASB issued Accounting Standards Update 2018-13, Fair Value Measurement (Topic 820): Disclosure Framework—Changes to the Disclosure Requirements for Fair Value Measurement (“ASU 2018-13”). The update provides guidance that modifies certain disclosure requirements for fair value measurements. ASU 2018-13 will be effective for fiscal years beginning after December 15, 2019. Management is currently assessing the potential impact of these changes to future financial statements.
NOTE 2—Bank Lines of Credit:
The fund participates with other long-term open-end funds managed by the Adviser in a $1.030 billion unsecured credit facility led by Citibank, N.A. (the “Citibank Credit Facility”) and a $300 million unsecured credit facility provided by The Bank of New York Mellon (the “BNYM Credit Facility”), a subsidiary of BNY Mellon and an affiliate of the Manager, each to be utilized primarily for temporary or emergency purposes, including the financing of redemptions (each, a “Facility”). The Citibank
38
Credit Facility is available in two tranches: (i) Tranche A is in an amount equal to $830 million and is available to all long-term open-ended funds, including the fund, and (ii) Tranche B is in amount equal to $200 million and is available only to BNY Mellon Floating Rate Income Fund, a series of BNY Mellon Investment Funds IV, Inc. Prior to October 3, 2018, the unsecured credit facility with Citibank, N.A. was $830 million. In connection therewith, the fund has agreed to pay its pro rata portion of commitment fees for Tranche A of the Citibank Credit Facility and the BNYM Credit Facility. Interest is charged to the fund based on rates determined pursuant to the terms of the respective Facility at the time of borrowing. During the period ended April 30, 2019, the fund did not borrow under the Facilities.
NOTE 3—Management Fee and Other Transactions with Affiliates:
(a)Pursuant to a management agreement with the Adviser, the management fee is computed at the annual rate of .55% of the value of the fund’s average daily net assets and is payable monthly. Effective, December 31, 2018, the Board approved a reduction in the management fee from an annual rate of .55% to an annual rate of .35% of the value of the fund’s average daily net assets.
During the period ended April 30, 2019, the Distributor retained $1,810 from commissions earned on sales of the fund’s Class A shares and $48 from CDSC fees on redemptions of the fund’s Class C shares.
(b) Under the Distribution Plan adopted pursuant to Rule 12b-1 under the Act, Class C shares pay the Distributor for distributing its shares at an annual rate of .75% of the value of its average daily net assets. During the period ended April 30, 2019, Class C shares were charged $42,293 pursuant to the Distribution Plan.
(c)Under the Shareholder Services Plan, Class A and Class C shares pay the Distributor at an annual rate of .25% of the value of their average daily net assets and Class Z shares reimburse the Distributor at an annual rate of .20% of the value of its average daily net assets for the provision of certain services. The services provided may include personal services relating to shareholder accounts, such as answering shareholder inquiries regarding the fund and providing reports and other information, and services related to the maintenance of shareholder accounts. The Distributor may make payments to Service Agents (securities dealers, financial institutions or other industry professionals) with respect to these services. The Distributor determines the amounts to be paid to Service Agents. During the period ended April 30, 2019, Class A, Class C and Class Z shares were
39
NOTES TO FINANCIAL STATEMENTS(continued)
charged $367,832, $14,098 and $350,975, respectively, pursuant to the Shareholder Services Plan.
The fund has arrangements with the transfer agent and the custodian whereby the fund may receive earnings credits when positive cash balances are maintained, which are used to offset transfer agency and custody fees. For financial reporting purposes, the fund includes net earnings credits, if any, as an expense offset in the Statement of Operations.
The fund compensates BNY Mellon Transfer, Inc., a wholly-owned subsidiary of the Adviser, under a transfer agency agreement for providing transfer agency and cash management services for the fund. The majority of transfer agency fees are comprised of amounts paid on a per account basis, while cash management fees are related to fund subscriptions and redemptions. During the period ended April 30, 2019, the fund was charged $94,342 for transfer agency services. These fees are included in Shareholder servicing costs in the Statement of Operations.
The fund compensates The Bank of New York Mellon under a custody agreement for providing custodial services for the fund. These fees are determined based on net assets, geographic region and transaction activity. During the period ended April 30, 2019, the fund was charged $4,434 pursuant to the custody agreement. These fees were partially offset by earnings credits of $3,782.
The fund compensates The Bank of New York Mellon under a shareholder redemption draft processing agreement for providing certain services related to the fund’s check writing privilege. During the period ended April 30, 2019, the fund was charged $4,386 pursuant to the agreement, which is included in Shareholder servicing costs in the Statement of Operations. These fees were partially offset by earnings credits of $35.
During the period ended April 30, 2019, the fund was charged $12,173 for services performed by the Chief Compliance Officer and his staff. These fees are included in Miscellaneous in the Statement of Operations.
The components of “Due to BNY Mellon Investment Adviser, Inc. and affiliates” in the Statement of Assets and Liabilities consist of: management fees $101,793, Distribution Plan fees $3,558, Shareholder Services Plan fees $60,144, custodian fees $3,354, Chief Compliance Officer fees 6,790 and transfer agency fees $17,643.
(d) Each Board member also serves as a Board member of other funds in the BNY Mellon Family of Funds complex. Annual retainer fees and attendance fees are allocated to each fund based on net assets.
40
NOTE 4—Securities Transactions:
The aggregate amount of purchases and sales of investment securities, excluding short-term securities, during the period ended April 30, 2019, amounted to $94,344,985 and $97,179,894, respectively.
Derivatives:A derivative is a financial instrument whose performance is derived from the performance of another asset. Each type of derivative instrument that was held by the fund during the period ended April 30, 2019 is discussed below.
Futures:In the normal course of pursuing its investment objective, the fund is exposed to market risk, including interest rate risk as a result of changes in value of underlying financial instruments. The fund invests in futures in order to manage its exposure to or protect against changes in the market. A futures contract represents a commitment for the future purchase or a sale of an asset at a specified date. Upon entering into such contracts, these investments require initial margin deposits with a counterparty, which consist of cash or cash equivalents. The amount of these deposits is determined by the exchange or Board of Trade on which the contract is traded and is subject to change. Accordingly, variation margin payments are received or made to reflect daily unrealized gains or losses which are recorded in the Statement of Operations. When the contracts are closed, the fund recognizes a realized gain or loss which is reflected in the Statement of Operations. There is minimal counterparty credit risk to the fund with futures since they are exchange traded, and the exchange guarantees the futures against default. At April 30, 2019 there were no financial futures outstanding.
The following summarizes the average market value of derivatives outstanding duringthe period ended April 30, 2019:
| | | |
| | Average Market Value ($) |
Interest rate futures | | 15,100 |
| | |
At April 30, 2019, the cost of investments for federal income tax purposes was $336,071,528; accordingly, accumulated net unrealized appreciation on investments was $15,224,732, consisting of $15,898,977 gross unrealized appreciation and $674,245 gross unrealized depreciation.
41
REPORT OF INDEPENDENT REGISTERED PUBLIC ACCOUNTING FIRM
To the Shareholders and the Board of Trustees of BNY Mellon Opportunistic Municipal Securities Fund (formerly, Dreyfus Municipal Bond Opportunity Fund)
Opinion on the Financial Statements
We have audited the accompanying statement of assets and liabilities of BNY Mellon Opportunistic Municipal Securities Fund (the “Fund”)(formerly, Dreyfus Municipal Bond Opportunity Fund), including the statement of investments, as of April 30, 2019, and the related statement of operations for the year then ended, the statements of changes in net assets for each of the two years in the period then ended, the financial highlights for each of the five years in the period then ended and the related notes (collectively referred to as the “financial statements”). In our opinion, the financial statements present fairly, in all material respects, the financial position of the Fund at April 30, 2019, the results of its operations for the year then ended, the changes in its net assets for each of the two years in the period then ended and its financial highlights for each of the five years in the period then ended, in conformity with U.S. generally accepted accounting principles.
Basis for Opinion
These financial statements are the responsibility of the Fund’s management. Our responsibility is to express an opinion on the Fund’s financial statements based on our audits. We are a public accounting firm registered with the Public Company Accounting Oversight Board (United States) (“PCAOB”) and are required to be independent with respect to the Fund in accordance with the U.S. federal securities laws and the applicable rules and regulations of the Securities and Exchange Commission and the PCAOB.
We conducted our audits in accordance with the standards of the PCAOB. Those standards require that we plan and perform the audit to obtain reasonable assurance about whether the financial statements are free of material misstatement, whether due to error or fraud. The Fund is not required to have, nor were we engaged to perform, an audit of the Fund’s internal control over financial reporting. As part of our audits, we are required to obtain an understanding of internal control over financial reporting, but not for the purpose of expressing an opinion on the effectiveness of the Fund’s internal control over financial reporting. Accordingly, we express no such opinion.
Our audits included performing procedures to assess the risks of material misstatement of the financial statements, whether due to error or fraud, and performing procedures that respond to those risks. Such procedures included examining, on a test basis, evidence regarding the amounts and disclosures in the financial statements. Our procedures included confirmation of securities owned as of April 30, 2019, by correspondence with the custodian and others or by other appropriate auditing procedures where replies from others were not received. Our audits also included evaluating the accounting principles used and significant estimates made by management, as well as evaluating the overall presentation of the financial statements. We believe that our audits provide a reasonable basis for our opinion.

We have served as the auditor of one or more investment companies in the BNY Mellon Family of Funds since at least 1957, but we are unable to determine the specific year.
New York, New York
June 26, 2019
42
IMPORTANT TAX INFORMATION(Unaudited)
In accordance with federal tax law, the fund hereby reports all the dividends paid from investment income-net during the fiscal year ended April 30, 2019 as “exempt-interest dividends” (not generally subject to regular federal income tax), except $45,085 that is being reported as an ordinary income distribution for reporting purposes. Where required by federal tax law rules, shareholders will receive notification of their portion of the fund’s taxable ordinary dividends (if any), capital gains distributions (if any) and tax-exempt dividends paid for the 2019 calendar year on Form 1099-DIV which will be mailed in early 2020.
43
INFORMATION ABOUT THE RENEWAL OF THE FUND’S MANAGEMENT AGREEMENT (Unaudited)
At a meeting of the fund’s Board of Trustees held on October 29, 2018, the Board considered the approval of an amendment of the fund’s Management Agreement, pursuant to which the Adviser provides the fund with investment advisory and administrative services (the “Agreement “). The Adviser proposed to amend the Agreement to reduce the management fee payable by the fund from an annual rate of 0.55% to 0.35%, effective December 31, 2018. The Board members, none of whom are “interested persons “ (as defined in the Investment Company Act of 1940, as amended) of the fund, were assisted in their review by independent legal counsel and met with counsel in executive session separate from representatives of the Adviser. Since the Board had renewed the Agreement at a Board meeting held on July 31, 2018 (the “July Meeting “), and, other than as discussed below, there had been no material changes in the information presented, the Board addressed certain of the relevant considerations by reference to their considerations and determinations at the July Meeting. In considering the amendment of the Agreement, the Board considered all factors that it believed to be relevant, including those discussed below. The Board did not identify any one factor as dispositive, and each Board member may have attributed different weights to the factors considered.
Analysis of Nature, Extent, and Quality of Services Provided to the Fund. The nature, extent and quality of services provided had been considered at the July Meeting, and there had been no material changes in this information. The Board also considered that the Adviser stated that there will be no diminution in the nature, extent or quality of the services provided to the fund pursuant to the Agreement, as proposed to be amended, by the Adviser or the Adviser’s affiliates.
Comparative Analysis of the Fund’s Performance and Management Fee and Expense Ratio. The Adviser did not provide the Board with information comparing the fund’s performance with the performance of a group of comparable funds because that information had been reviewed at the July Meeting.
The Board reviewed a report comparing the fund’s actual and contractual management fees and total expenses (before and after the proposed fee reduction) with those of a group of comparable funds. The Board also reviewed the range of actual and contractual management fees and total expenses of the comparable funds and discussed the results of the comparisons, which showed that the fund’s actual and contractual management fees and total expenses (all after giving effect to the proposed management fee reduction) were all below the average and median of the respective actual and contractual management fees and total expenses of the comparable funds.
The Adviser did not provide the Board with the management or investment advisory fees (1) paid by funds advised or administered by the Adviser that are in the same Lipper category as the fund and (2) paid to the Adviser for advising any separate accounts and/or other types of client portfolios that are considered to have similar investment strategies and policies as the fund because this information had been reviewed at the July Meeting.
44
Analysis of Profitability and Economies of Scale. The Board had considered profitability, economies of scale and the potential benefits to the Adviser at the July Meeting. The Adviser representatives noted that the amendment would result in a reduction in the Adviser’s fee (and therefore negatively impacting profitability and any potential economies of scale) and that potential benefits would not change materially as a result of the amendment from those considered at the July Meeting.
At the conclusion of these discussions, the Board agreed that it had been furnished with sufficient information to make an informed business decision with respect to the amendment of the Agreement. Based on the discussions and considerations as described above, the Board concluded and determined as follows.
· The Board concluded that the nature, extent and quality of the services to be provided by the Adviser continue to be adequate and appropriate.
· The Board concluded that the fee to be paid to the Adviser was appropriate under the circumstances and in light of the factors and the totality of the services provided.
In evaluating the Agreement, the Board considered these conclusions and determinations and also relied on its previous knowledge, gained through meetings and other interactions with the Adviser and its affiliates, of the Adviser and the services provided to the fund by the Adviser. The Board also relied on information received on a routine and regular basis throughout the year relating to the operations of the fund and the investment management and other services provided under the Agreement, including information on the investment performance of the fund in comparison to similar mutual funds and benchmark performance indices; general market outlook as applicable to the fund; and compliance reports. In addition, the Board’s consideration of the contractual fee arrangements for this fund had the benefit of a number of years of reviews of the Agreement for the fund, or substantially similar agreements for other BNY Mellon funds that the Board oversees, during which lengthy discussions took place between the Board and representatives of the Adviser. Certain aspects of the arrangements may receive greater scrutiny in some years than in others, and the Board’s conclusions may be based, in part, on their consideration of the fund’s arrangements, or substantially similar arrangements for other BNY Mellon funds that the Board oversees, in prior years. The Board determined to approve the amendment of the Agreement.
45
BOARD MEMBERS INFORMATION(Unaudited)
INDEPENDENT BOARD MEMBERS
Joseph S. DiMartino (75)
Chairman of the Board (1995)
Principal Occupation During Past 5 Years:
· Corporate Director and Trustee (1995-present)
Other Public Company Board Memberships During Past 5 Years:
· CBIZ (formerly, Century Business Services, Inc.), a provider of outsourcing functions for small and medium size companies, Director (1997-present)
No. of Portfolios for which Board Member Serves:120
———————
Francine J. Bovich (67)
Board Member (2012)
Principal Occupation During Past 5 Years:
· Trustee, The Bradley Trusts, private trust funds (2011-present)
Other Public Company Board Memberships During Past 5 Years:
· Annaly Capital Management, Inc., a real estate investment trust, Director (2014-present)
No. of Portfolios for which Board Member Serves:69
———————
Peggy C. Davis (76)
Board Member (1990)
Principal Occupation During Past 5 Years:
· Shad Professor of Law, New York University School of Law (1983-present)
No. of Portfolios for which Board Member Serves:44
———————
Diane Dunst (79)
Board Member (2007)
Principal Occupation During Past 5 Years:
· President of Huntting House Antiques (1999-present)
No. of Portfolios for which Board Member Serves:14
———————
46
Nathan Leventhal (76)
Board Member (1989)
Principal Occupation During Past 5 Years:
· President Emeritus of Lincoln Center for the Performing Arts (2001-present)
· Chairman of the Avery Fisher Artist Program (1997-2014)
Other Public Company Board Memberships During Past 5 Years:
· Movado Group, Inc., Director (2003-present)
No. of Portfolios for which Board Member Serves:47
———————
Robin A. Melvin (55)
Board Member (2012)
Principal Occupation During Past 5 Years:
· Co-chairman, Illinois Mentoring Partnership, non-profit organization dedicated to increasing the quantity and quality of mentoring services in Illinois (2014-present; board member since 2013)
No. of Portfolios for which Board Member Serves:98
———————
Once elected all Board Members serve for an indefinite term, but achieve Emeritus status upon reaching age 80. The address of the Board Members and Officers is c/o BNY Mellon Investment Adviser, Inc. 240 Greenwich Street, New York, New York 10166. Additional information about the Board Member is available in the fund’s Statement of Additional Information which can be obtained from the Adviser free of charge by calling this toll free number: 1-800-373-9387.
Clifford L. Alexander, Jr., Emeritus Board Member
Ernest Kafka, Emeritus Board Member
Daniel Rose, Emeritus Board Member
47
OFFICERS OF THE FUND(Unaudited)
RENEE LAROCHE-MORRIS, President since January 2018.
President and a director of BNY Mellon Investment Adviser, Inc. since January 2018. She is an officer of 62 investment companies (comprised of 120 portfolios) managed by the Adviser. She is 48 years old and has been an employee of BNY Mellon since 2003.
JAMES WINDELS, Treasurer since November 2001.
Director- BNY Mellon Fund Administration, and an officer of 63 investment companies (comprised of 143 portfolios) managed by the Adviser. He is 60 years old and has been an employee of the Adviser since April 1985.
BENNETT A. MACDOUGALL, Chief Legal Officer since October 2015.
Chief Legal Officer of the Adviser and Associate General Counsel and Managing Director of BNY Mellon since June 2015; Director and Associate General Counsel of Deutsche Bank – Asset & Wealth Management Division from June 2005 to June 2015, and as Chief Legal Officer of Deutsche Investment Management Americas Inc. from June 2012 to May 2015. He is an officer of 63 investment companies (comprised of 143 portfolios) managed by the Adviser. He is 47 years old and has been an employee of the Adviser since June 2015.
DAVID DIPETRILLO, Vice President since January 2018.
Head of North America Product, BNY Mellon Investment Management since January 2018, Director of Product Strategy, BNY Mellon Investment Management from January 2016 to December 2017; Head of US Retail Product and Channel Marketing, BNY Mellon Investment Management from January 2014 to December 2015. He is an officer of 62 investment companies (comprised of 120 portfolios) managed by the Adviser. He is 41 years old and has been an employee of BNY Mellon since 2005.
JAMES BITETTO, Vice President since August 2005 and Secretary since February 2018.
Managing Counsel of BNY Mellon and Secretary of the Adviser, and an officer of 63 investment companies (comprised of 143 portfolios) managed by the Adviser. He is 52 years old and has been an employee of the Adviser since December 1996.
SONALEE CROSS, Vice President and Assistant Secretary since March 2018.
Counsel of BNY Mellon since October 2016; Associate at Proskauer Rose LLP from April 2016 to September 2016; Attorney at EnTrust Capital from August 2015 to February 2016; Associate at Sidley Austin LLP from September 2013 to August 2015. She is an officer of 63 investment companies (comprised of 143 portfolios) managed by the Adviser. She is 31 years old and has been an employee of the Adviser since October 2016.
DEIRDRE CUNNANE, Vice President and Assistant Secretary since March 2019.
Counsel of BNY Mellon since August 2018; Senior Regulatory Specialist at BNY Mellon Investment Management Services from February 2016 to August 2018; Trustee Associate at BNY Mellon Trust Company (Ireland) Limited from August 2013 to February 2016. She is an officer of 63 investment companies (comprised of 143 portfolios) managed by the Adviser. She is 28 years old and has been an employee of the Adviser since August 2018.
SARAH S. KELLEHER, Vice President and Assistant Secretary since April 2014.
Managing Counsel of BNY Mellon since December 2017, Senior Counsel of BNY Mellon from March 2013 to December 2017. She is an officer of 63 investment companies (comprised of 143 portfolios) managed by the Adviser. She is 43 years old and has been an employee of the Adviser since March 2013.
JEFF PRUSNOFSKY, Vice President and Assistant Secretary since August 2005.
Senior Managing Counsel of BNY Mellon, and an officer of 63 investment companies (comprised of 143 portfolios) managed by the Adviser. He is 54 years old and has been an employee of the Adviser since October 1990.
PETER M. SULLIVAN, Vice President and Assistant Secretary since March 2019.
Managing Counsel of BNY Mellon, and an officer of 63 investment companies (comprised of 143 portfolios) managed by the Adviser. He is 51 years old and has been an employee of the Adviser since April 2004.
48
NATALYA ZELENSKY, Vice President and Assistant Secretary since March 2017.
Counsel of BNY Mellon since May 2016; Attorney at Wildermuth Endowment Strategy Fund/Wildermuth Advisory, LLC from November 2015 to May 2016 and Assistant General Counsel at RCS Advisory Services from July 2014 to November 2015. She is an officer of 63 investment companies (comprised of 143 portfolios) managed by the Adviser. She is 34 years old and has been an employee of the Adviser since May 2016.
GAVIN C. REILLY, Assistant Treasurer since December 2005.
Tax Manager of BNY Mellon Fund Administration, and an officer of 63 investment companies (comprised of 143 portfolios) managed by the Adviser. He is 50 years old and has been an employee of the Adviser since April 1991.
ROBERT S. ROBOL, Assistant Treasurer since August 2005.
Senior Accounting Manager- BNY Mellon Fund Administration, and an officer of 63 investment companies (comprised of 143 portfolios) managed by the Adviser. He is 55 years old and has been an employee of the Adviser since October 1988.
ROBERT SALVIOLO, Assistant Treasurer since July 2007.
Senior Accounting Manager – BNY Mellon Fund Administration, and an officer of 63 investment companies (comprised of 143 portfolios) managed by the Adviser. He is 52 years old and has been an employee of the Adviser since June 1989.
ROBERT SVAGNA, Assistant Treasurer since August 2005.
Senior Accounting Manager – BNY Mellon Fund Administration, and an officer of 63 investment companies (comprised of 143 portfolios) managed by the Adviser. He is 52 years old and has been an employee of the Adviser since November 1990.
JOSEPH W. CONNOLLY, Chief Compliance Officer since October 2004.
Chief Compliance Officer of the Adviser, the BNY Mellon Family of Funds and BNY Mellon Funds Trust (63 investment companies, comprised of 143 portfolios). He is 62 years old and has served in various capacities with the Adviser since 1980, including manager of the firm’s Fund Accounting Department from 1997 through October 2001.
CARIDAD M. CAROSELLA, Anti-Money Laundering Compliance Officer since January 2016.
Anti-Money Laundering Compliance Officer of the BNY Mellon Family of Funds and BNY Mellon Funds Trust since January 2016; from May 2015 to December 2015, Interim Anti-Money Laundering Compliance Officer of the BNY Mellon Family of Funds and BNY Mellon Funds Trust and the Distributor; from January 2012 to May 2015, AML Surveillance Officer of the Distributor. She is an officer of 57 investment companies (comprised of 137 portfolios) managed by the Adviser. She is 50 years old and has been an employee of the Distributor since 1997.
49
BNY Mellon Opportunistic Municipal Securities Fund
240 Greenwich Street
New York, NY 10286
Adviser
BNY Mellon Investment Adviser, Inc.
240 Greenwich Street
New York, NY 10286
Custodian
The Bank of New York Mellon
240 Greenwich Street
New York, NY 10286
Transfer Agent &
Dividend Disbursing Agent
BNY Mellon Transfer, Inc.
240 Greenwich Street
New York, NY 10286
Distributor
BNY Mellon Securities Corporation
240 Greenwich Street
New York, NY 10286
| | |
Ticker Symbols: Class A: PTEBX Class C: DMBCX Class I: DMBVX Class Y: DMBYX Class Z: DMBZX |
Telephone Call your financial representative or 1-800-373-9387
Mail The BNY Mellon Family of Funds, 144 Glenn Curtiss Boulevard, Uniondale, NY 11556-0144
E-mailSend your request toinfo@bnymellon.com
InternetInformation can be viewed online or downloaded atwww.bnymellonim.com/us
The fund files its complete schedule of portfolio holdings with the Securities and Exchange Commission (“SEC”) for the first and third quarters of each fiscal year on Form N-PORT. The fund’s Forms N-PORT are available on the SEC’s website atwww.sec.gov.
A description of the policies and procedures that the fund uses to determine how to vote proxies relating to portfolio securities and information regarding how the fund voted these proxies for the most recent 12-month period ended June 30 is available atwww.bnymellonim.com/us and on the SEC’s website atwww.sec.gov and without charge, upon request, by calling 1-800-373-9387.
| | |
© 2019 BNY Mellon Securities Corporation
0022AR0419 | 
|
Item 2. Code of Ethics.
The Registrant has adopted a code of ethics that applies to the Registrant's principal executive officer, principal financial officer, principal accounting officer or controller, or persons performing similar functions. There have been no amendments to, or waivers in connection with, the Code of Ethics during the period covered by this Report.
Item 3. Audit Committee Financial Expert.
The Registrant's Board has determined that Joseph S. DiMartino, a member of the Audit Committee of the Board, is an audit committee financial expert as defined by the Securities and Exchange Commission (the "SEC"). Mr. DiMartino is "independent" as defined by the SEC for purposes of audit committee financial expert determinations.
Item 4. Principal Accountant Fees and Services.
(a) Audit Fees. The aggregate fees billed for each of the last two fiscal years (the "Reporting Periods") for professional services rendered by the Registrant's principal accountant (the "Auditor") for the audit of the Registrant's annual financial statements or services that are normally provided by the Auditor in connection with the statutory and regulatory filings or engagements for the Reporting Periods, were $35,843 in 2018 and $36,470 in 2019.
(b) Audit-Related Fees. The aggregate fees billed in the Reporting Periods for assurance and related services by the Auditor that are reasonably related to the performance of the audit of the Registrant's financial statements and are not reported under paragraph (a) of this Item 4 were $9,296 in 2018 and $6,807 in 2019. These services consisted of one or more of the following: (i) agreed upon procedures related to compliance with Internal Revenue Code section 817(h), (ii) security counts required by Rule 17f-2 under the Investment Company Act of 1940, as amended, (iii) advisory services as to the accounting or disclosure treatment of Registrant transactions or events and (iv) advisory services to the accounting or disclosure treatment of the actual or potential impact to the Registrant of final or proposed rules, standards or interpretations by the Securities and Exchange Commission, the Financial Accounting Standards Boards or other regulatory or standard-setting bodies.
The aggregate fees billed in the Reporting Periods for non-audit assurance and related services by the Auditor to the Registrant's investment adviser (not including any sub-investment adviser whose role is primarily portfolio management and is subcontracted with or overseen by another investment adviser), and any entity controlling, controlled by or under common control with the investment adviser that provides ongoing services to the Registrant ("Service Affiliates"), that were reasonably related to the performance of the annual audit of the Service Affiliate, which required pre-approval by the Audit Committee were $0 in 2018 and $0 in 2019.
(c) Tax Fees. The aggregate fees billed in the Reporting Periods for professional services rendered by the Auditor for tax compliance, tax advice, and tax planning ("Tax Services") were $3,233 in 2018 and $3,478 in 2019. These services consisted of: (i) review or preparation of U.S. federal, state, local and excise tax returns; (ii) U.S. federal, state and local tax planning, advice and assistance regarding statutory, regulatory or administrative developments, and (iii) tax advice regarding tax qualification matters and/or treatment of various financial instruments held or proposed to be acquired or held. The aggregate fees billed in the Reporting Periods for Tax Services by the Auditor to Service Affiliates, which required pre-approval by the Audit Committee were $0 in 2018 and $0 in 2019.
(d) All Other Fees. The aggregate fees billed in the Reporting Periods for products and services provided by the Auditor, other than the services reported in paragraphs (a) through (c) of this Item, were $1,187 in 2018 and $1,190 in 2019. These services consisted of a review of the Registrant's anti-money laundering program.
The aggregate fees billed in the Reporting Periods for Non-Audit Services by the Auditor to Service Affiliates, other than the services reported in paragraphs (b) through (c) of this Item, which required pre-approval by the Audit Committee, were $0 in 2018 and $0 in 2019.
(e)(1)Audit Committee Pre-Approval Policies and Procedures. The Registrant's Audit Committee has established policies and procedures (the "Policy") for pre-approval (within specified fee limits) of the Auditor's engagements for non-audit services to the Registrant and Service Affiliates without specific case-by-case consideration. The pre-approved services in the Policy can include pre-approved audit services, pre-approved audit-related services, pre-approved tax services and pre-approved all other services. Pre-approval considerations include whether the proposed services are compatible with maintaining the Auditor's independence. Pre-approvals pursuant to the Policy are considered annually.
(e)(2)Note. None of the services described in paragraphs (b) through (d) of this Item 4 were approved by the Audit Committee pursuant to paragraph (c)(7)(i)(C) of Rule 2-01 of Regulation S-X.
(f) None of the hours expended on the principal accountant's engagement to audit the registrant's financial statements for the most recent fiscal year were attributed to work performed by persons other than the principal account's full-time, permanent employees.
Non-Audit Fees. The aggregate non-audit fees billed by the Auditor for services rendered to the Registrant, and rendered to Service Affiliates, for the Reporting Periods were $28,081,041 in 2018 and $17,322,788 in 2019.
Auditor Independence. The Registrant's Audit Committee has considered whether the provision of non-audit services that were rendered to Service Affiliates, which were not pre-approved (not requiring pre-approval), is compatible with maintaining the Auditor's independence.
Item 5. Audit Committee of Listed Registrants.
Not applicable.
Item 6. Investments.
(a) Not applicable.
Item 7. Disclosure of Proxy Voting Policies and Procedures for Closed-End Management Investment Companies.
Not applicable.
Item 8. Portfolio Managers of Closed-End Management Investment Companies.
Not applicable.
Item 9. Purchases of Equity Securities by Closed-End Management Investment Companies and Affiliated Purchasers.
Not applicable.
Item 10. Submission of Matters to a Vote of Security Holders.
There have been no material changes to the procedures applicable to Item 10.
Item 11. Controls and Procedures.
(a) The Registrant's principal executive and principal financial officers have concluded, based on their evaluation of the Registrant's disclosure controls and procedures as of a date within 90 days of the filing date of this report, that the Registrant's disclosure controls and procedures are reasonably designed to ensure that information required to be disclosed by the Registrant on Form N-CSR is recorded, processed, summarized and reported within the required time periods and that information required to be disclosed by the Registrant in the reports that it files or submits on Form N-CSR is accumulated and communicated to the Registrant's management, including its principal executive and principal financial officers, as appropriate to allow timely decisions regarding required disclosure.
(b) There were no changes to the Registrant's internal control over financial reporting that occurred during the second fiscal quarter of the period covered by this report that have materially affected, or are reasonably likely to materially affect, the Registrant's internal control over financial reporting.
Item 12. Disclosure of Securities Lending Activities for Closed-End Management Investment Companies.
Not applicable.
Item 13. Exhibits.
(a)(1) Code of ethics referred to in Item 2.
(a)(2) Certifications of principal executive and principal financial officers as required by Rule 30a-2(a) under the Investment Company Act of 1940.
(a)(3) Not applicable.
(b) Certification of principal executive and principal financial officers as required by Rule 30a-2(b) under the Investment Company Act of 1940.
SIGNATURES
Pursuant to the requirements of the Securities Exchange Act of 1934 and the Investment Company Act of 1940, the Registrant has duly caused this Report to be signed on its behalf by the undersigned, thereunto duly authorized.
BNY Mellon Opportunistic Municipal Securities Fund
By: /s/ Renee LaRoche-Morris
Renee LaRoche-Morris
President
Date: June 25, 2019
Pursuant to the requirements of the Securities Exchange Act of 1934 and the Investment Company Act of 1940, this Report has been signed below by the following persons on behalf of the Registrant and in the capacities and on the dates indicated.
By: /s/ Renee LaRoche-Morris
Renee LaRoche-Morris
President
Date: June 25, 2019
By: /s/ James Windels
James Windels
Treasurer
Date: June 25, 2019
EXHIBIT INDEX
(a)(1) Code of ethics referred to in Item 2.
(a)(2) Certifications of principal executive and principal financial officers as required by Rule 30a-2(a) under the Investment Company Act of 1940. (EX-99.CERT)
(b) Certification of principal executive and principal financial officers as required by Rule 30a-2(b) under the Investment Company Act of 1940. (EX-99.906CERT)