UNITED STATES
SECURITIES AND EXCHANGE COMMISSION
Washington, D.C. 20549
FORM N-CSR
CERTIFIED SHAREHOLDER REPORT OF REGISTERED MANAGEMENT
INVESTMENT COMPANIES
| Investment Company Act file number | 811-04764 |
| | |
| | BNY Mellon Opportunistic Municipal Securities Fund | |
| | (Exact name of Registrant as specified in charter) | |
| | | |
| | c/o BNY Mellon Investment Adviser, Inc. 240 Greenwich Street New York, New York 10286 | |
| | (Address of principal executive offices) (Zip code) | |
| | | |
| | Deirdre Cunnane, Esq. 240 Greenwich Street New York, New York 10286 | |
| | (Name and address of agent for service) | |
| |
| Registrant's telephone number, including area code: | (212) 922-6400 |
| | |
Date of fiscal year end: | 04/30 | |
| Date of reporting period: | 04/30/23 | |
| | | | | | | |
FORM N-CSR
Item 1. Reports to Stockholders.
BNY Mellon Opportunistic Municipal Securities Fund
| |
ANNUAL REPORT April 30, 2023 |
| |
Save time. Save paper. View your next shareholder report online as soon as it’s available. Log into www.im.bnymellon.com and sign up for eCommunications. It’s simple and only takes a few minutes. |
| |
The views expressed in this report reflect those of the portfolio manager(s) only through the end of the period covered and do not necessarily represent the views of BNY Mellon Investment Adviser, Inc. or any other person in the BNY Mellon Investment Adviser, Inc. organization. Any such views are subject to change at any time based upon market or other conditions and BNY Mellon Investment Adviser, Inc. disclaims any responsibility to update such views. These views may not be relied on as investment advice and, because investment decisions for a fund in the BNY Mellon Family of Funds are based on numerous factors, may not be relied on as an indication of trading intent on behalf of any fund in the BNY Mellon Family of Funds. |
| |
Not FDIC-Insured • Not Bank-Guaranteed • May Lose Value |
Contents
THE FUND
FOR MORE INFORMATION
Back Cover
DISCUSSION OF FUND PERFORMANCE (Unaudited)
For the period from May 1, 2022, through April 30, 2023, as provided by Daniel Rabasco and Jeffrey Burger, Portfolio Managers employed by the fund’s sub-adviser, Insight North America LLC
Market and Fund Performance Overview
For the 12-month period ended April 30, 2023, BNY Mellon Opportunistic Municipal Securities Fund (the “fund”) produced a total return of 1.40% for Class A shares, 0.61% for Class C shares, 1.64% for Class I shares 1.65% for Class Y shares and 1.36% for Class Z shares.1 In comparison, the Bloomberg U.S. Municipal Bond Index (the “Index”), the fund’s benchmark index, achieved a total return of 2.87% for the same period.2
Municipal bonds posted gains during the reporting period largely as a result of easing inflation and investor anticipation of an end to the Federal Reserve’s (the “Fed”) rate hikes. The fund lagged the Index mainly due to unfavorable security selection, especially in certain portions of the revenue bond market.
The Fund’s Investment Approach
The fund seeks to maximize current income exempt from federal income tax to the extent consistent with the preservation of capital. To pursue its goal, the fund normally invests at least 80% of its net assets, plus any borrowings for investment purposes, in municipal bonds that provide income exempt from federal income tax. Typically, the fund invests substantially all of its assets in such municipal bonds. The fund invests at least 70% of its assets in municipal bonds rated, at the time of purchase, investment grade (Baa/BBB or higher) or the unrated equivalent as determined by the fund’s sub-adviser, Insight North America LLC (“INA”). For additional yield, the fund may invest up to 30% of its assets in municipal bonds rated below investment grade (“high yield” or “junk” bonds) or the unrated equivalent as determined by INA. The dollar-weighted, average maturity of the fund’s portfolio normally exceeds 10 years, but the fund may invest without regard to maturity or duration.
The portfolio managers focus on identifying undervalued sectors and securities and minimize the use of interest-rate forecasting. The portfolio managers select municipal bonds for the fund’s portfolio by using fundamental credit analysis to estimate the relative value and attractiveness of various sectors and securities, and to exploit pricing inefficiencies in the municipal bond market, and by actively trading among various sectors, and securities, including pre-refunded, general obligation and revenue bonds, based on their apparent relative values. The fund seeks to invest in several different sectors, and does not seek to overweight any particular sector but may do so depending on each sector’s relative value at any given time.
Market Rebounds as Inflation Retreats, Rate Hikes Ease
During the reporting period, the municipal bond market experienced volatility driven by economic uncertainty, rising inflation and geopolitical risk. While employment remained strong, the outcome of the Fed’s tightening policy was uncertain, with investors fearing that an economic slowdown was becoming more likely. But toward the end of the period, inflation began to ease, and investors began to anticipate the end of the Fed’s rate hikes.
Inflation measures stayed near multidecade highs during the first part of the reporting period. The Fed continued increasing the federal funds rate, which began in March 2022, raising it eight times by April 30, 2023. Toward the end of the period, the Fed began to moderate these increases, hiking by just 25 basis points in February and March 2023. By the end of the period, the federal funds target rate was 4.75–5.00%, up from 0.25–0.50% at the start of the period.
Fears that the economy could slow were realized when the first quarter GDP figures were released in April 2022. A still-strong labor market, however, suggested that the economy could rebound, but second quarter data showed that economic growth slowed again, making for two-consecutive quarters of decline, a rough indicator of recession. Nevertheless, the economy rebounded in the third and fourth quarter, posting gains of 3.2% and 2.6%, respectively. Growth continued in the first quarter of 2023, with the economy expanding 1.1%.
For much of the period, the persistence of higher-than-expected inflation, combined with measures from the Fed to combat it, led to significant to higher interest rates and outflows from municipal bond mutual funds. The need for fund managers to meet redemptions only added to the downward momentum.
2
While headwinds prevailed over most of the period, credit fundamentals in the municipal market remained strong. In addition, turmoil resulted in more attractive valuations in many segments of the market, creating the potential for outperformance in the future.
Late in 2022 and into 2023, municipal bonds began to rebound as inflation abated, and investors began to anticipate a recession could be on the horizon, and an end to the Fed’s rate-hiking cycle. A perception that the stress on regional banks resulting from the banking crisis would help slow the economy also supported the market. In addition, the normal seasonal decline in supply, combined with the seasonal reinvestment of maturing bonds, buoyed the market.
Security Selection Weighed on Fund Results
The fund’s performance was hindered primarily by security selection. Selections were especially unfavorable in state general obligation bonds as well as in certain portions of the revenue bond segment, including appropriation bonds, special tax, airports and transportation. The fund’s overweight to revenue bonds, more broadly, also hindered relative performance. An overweight position in continuing care/retirement centers hampered returns as well; these operators continued to experience pricing pressures due to higher labor costs, among other challenges. Finally, the fund’s curve positioning versus the Index also detracted. Although the fund was neutral on duration, positions at the long end of the curve were hurt slightly by the rise in rates during the period. The fund did not make use of derivatives.
On the other hand, security selections in certain segments added to the fund’s relative performance. Selections in the hospital, industrial development and prepaid gas segments in particular were especially helpful. In addition, an overweighting of public power and education bonds was beneficial.
Anticipating Easing Inflation and an End to Monetary Tightening
Although volatility could continue in the short term as the market responds to continued Fed tightening, we remain sanguine about the market. It appears that inflation has begun to ease, and we believe it may have peaked, allowing the Fed to ease up on its tightening policy. Nevertheless, we expect to have more clarity on inflation and monetary policy as the year progresses. Municipal bonds typically perform well at the end of a monetary tightening cycle, and we are beginning to see more interest from retail investors, given the attractive yields.
With a possible recession on the horizon, we will remain cautious on credit quality. Nevertheless, municipalities’ fundamentals remain healthy and we will take advantage of in situations where credit quality remains sound.
May 15, 2023
1 Total return includes reinvestment of dividends and any capital gains paid and does not take into consideration the maximum initial sales charge in the case of Class A shares or the applicable contingent deferred sales charge imposed on redemptions in the case of Class C shares. Had these charges been reflected, returns would have been lower. Class I, Class Y and Class Z are not subject to any initial or deferred sales charge. Past performance is no guarantee of future results. Share price, yield and investment return fluctuate such that upon redemption, fund shares may be worth more or less than their original cost. Income may be subject to state and local taxes, and some income may be subject to the federal alternative minimum tax (AMT) for certain investors. Capital gains, if any, are taxable.
2 Source: Lipper Inc. — The Bloomberg U.S. Municipal Bond Index covers the U.S. dollar-denominated, long-term, tax-exempt bond market. Investors cannot invest directly in any index.
Bonds are subject generally to interest-rate, credit, liquidity and market risks, to varying degrees, all of which are more fully described in the fund’s prospectus. Generally, all other factors being equal, bond prices are inversely related to interest-rate changes, and rate increases can cause price declines.
High yield bonds involve increased credit and liquidity risk than higher-rated bonds and are considered speculative in terms of the issuer’s ability to pay interest and repay principal on a timely basis.
The amount of public information available about municipal bonds is generally less than that for corporate equities or bonds. Special factors, such as legislative changes, and state and local economic and business developments, may adversely affect the yield and/or value of the fund’s investments in municipal bonds. Other factors include the general conditions of the municipal bond market, the size of the particular offering, the maturity of the obligation and the rating of the issue. Changes in economic, business or political conditions relating to a particular municipal project, municipality or state in which the fund invests may have an impact on the fund’s share price.
References to specific securities, asset classes and financial markets are for illustrative purposes only and are not intended to be and should not be interpreted as recommendations.
3
FUND PERFORMANCE (Unaudited)

Comparison of change in value of a $10,000 investment in Class A shares, Class C shares, Class I shares and Class Z shares of BNY Mellon Opportunistic Municipal Securities Fund with a hypothetical investment of $10,000 in the Bloomberg U.S. Municipal Bond Index (the “Index”).
† Source: Lipper Inc.
†† The total return figures presented for Class I shares of the fund reflect the performance of the fund’s Class A shares for the period prior to 8/31/16 (the inception date for Class I shares), not reflecting the applicable sales load for Class A shares.
Past performance is not predictive of future performance.
The above graph compares a hypothetical $10,000 investment made in each of the Class A shares, Class C shares, Class I shares and Class Z shares of BNY Mellon Opportunistic Municipal Securities Fund on 4/30/13 to a hypothetical investment of $10,000 made in the Index on that date. All dividends and capital gain distributions are reinvested.
The fund’s performance shown in the line graph above takes into account the maximum initial sales charge on Class A shares and all other applicable fees and expenses on Class A shares, Class C shares, Class I shares and Class Z shares. The Index, unlike the fund, covers the U.S. dollar-denominated long-term tax-exempt bond market. These factors can contribute to the Index potentially outperforming or underperforming the fund. Unlike a mutual fund, the Index is not subject to charges, fees and other expenses. Investors cannot invest directly in any index. Further information relating to fund performance, including expense reimbursements, if applicable, is contained in the Financial Highlights section of the prospectus and elsewhere in this report.
4
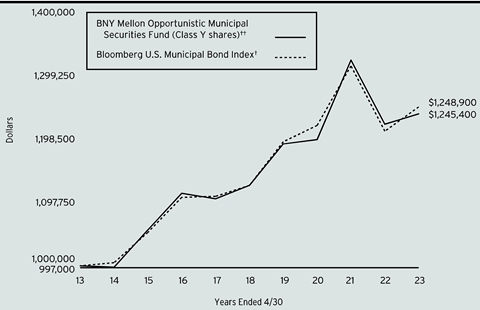
Comparison of change in value of a $1,000,000 investment in Class Y shares of BNY Mellon Opportunistic Municipal Securities Fund with a hypothetical investment of $1,000,000 in the Bloomberg U.S. Municipal Bond Index (the “Index”).
† Source: Lipper Inc.
†† The total return figures presented for Class Y shares of the fund reflect the performance of the fund’s Class A shares for the period prior to 8/31/16 (the inception date for Class Y shares), not reflecting the applicable sales load for Class A shares.
Past performance is not predictive of future performance.
The above graph compares a hypothetical $1,000,000 investment made in Class Y shares of BNY Mellon Opportunistic Municipal Securities Fund on 4/30/13 to a hypothetical investment of $1,000,000 made in the Index on that date. All dividends and capital gain distributions are reinvested.
The fund’s performance shown in the graph above takes into account all applicable fees and expenses of the fund’s Class Y shares. The Index, unlike the fund, covers the U.S. dollar-denominated long-term tax-exempt bond market. These factors can contribute to the Index potentially outperforming or underperforming the fund. Unlike a mutual fund, the Index is not subject to charges, fees and other expenses. Investors cannot invest directly in any index. Further information relating to fund performance, including expense reimbursements, if applicable, is contained in the Financial Highlights section of the prospectus and elsewhere in this report.
5
FUND PERFORMANCE (Unaudited) (continued)
| | | | | |
Average Annual Total Returns as of 4/30/2023 | | | |
| Inception
Date | 1 Year | 5 Years | 10 Years |
Class A shares | | | | |
with maximum sales charge (4.50%) | 11/26/86 | -3.14% | .84% | 1.62% |
without sales charge | 11/26/86 | 1.40% | 1.77% | 2.09% |
Class C shares | | | | |
with applicable redemption charge † | 7/13/95 | -.38% | .98% | 1.31% |
without redemption | 7/13/95 | .61% | .98% | 1.31% |
Class I shares | 8/31/16 | 1.64% | 2.02% | 2.26%†† |
Class Y shares | 8/31/16 | 1.65% | 2.00% | 2.22%†† |
Class Z shares | 10/14/04 | 1.36% | 1.82% | 2.14% |
Bloomberg U.S. Municipal Bond Index | | 2.87% | 2.06% | 2.25% |
† The maximum contingent deferred sales charge for Class C shares is 1% for shares redeemed within one year of the date of purchase.
†† The total return performance figures presented for Class I shares and Class Y shares of the fund reflect the performance of the fund’s Class A shares for the period prior to 8/31/16 (the inception date for Class I shares and Class Y shares), not reflecting the applicable sales load for Class A shares.
The performance data quoted represents past performance, which is no guarantee of future results. Share price and investment return fluctuate and an investor’s shares may be worth more or less than original cost upon redemption. Current performance may be lower or higher than the performance quoted. Go to www.im.bnymellon.com for the fund’s most recent month-end returns.
The fund’s performance shown in the graphs and table does not reflect the deduction of taxes that a shareholder would pay on fund distributions or the redemption of fund shares. In addition to the performance of Class A shares shown with and without a maximum sales charge, the fund’s performance shown in the table takes into account all other applicable fees and expenses on all classes.
6
UNDERSTANDING YOUR FUND’S EXPENSES (Unaudited)
As a mutual fund investor, you pay ongoing expenses, such as management fees and other expenses. Using the information below, you can estimate how these expenses affect your investment and compare them with the expenses of other funds. You also may pay one-time transaction expenses, including sales charges (loads) and redemption fees, which are not shown in this section and would have resulted in higher total expenses. For more information, see your fund’s prospectus or talk to your financial adviser.
Review your fund’s expenses
The table below shows the expenses you would have paid on a $1,000 investment in BNY Mellon Opportunistic Municipal Securities Fund from November 1, 2022 to April 30, 2023. It also shows how much a $1,000 investment would be worth at the close of the period, assuming actual returns and expenses.
| | | | | | | | |
Expenses and Value of a $1,000 Investment | |
Assume actual returns for the six months ended April 30, 2023 | |
| | | | | | | |
| | Class A | Class C | Class I | Class Y | Class Z | |
Expenses paid per $1,000† | $3.65 | $7.69 | $2.47 | $2.42 | $3.44 | |
Ending value (after expenses) | $1,073.10 | $1,068.80 | $1,074.20 | $1,074.40 | $1,073.30 | |
COMPARING YOUR FUND’S EXPENSES WITH THOSE OF OTHER FUNDS (Unaudited)
Using the SEC’s method to compare expenses
The Securities and Exchange Commission (“SEC”) has established guidelines to help investors assess fund expenses. Per these guidelines, the table below shows your fund’s expenses based on a $1,000 investment, assuming a hypothetical 5% annualized return. You can use this information to compare the ongoing expenses (but not transaction expenses or total cost) of investing in the fund with those of other funds. All mutual fund shareholder reports will provide this information to help you make this comparison. Please note that you cannot use this information to estimate your actual ending account balance and expenses paid during the period.
| | | | | | | | |
Expenses and Value of a $1,000 Investment | |
Assuming a hypothetical 5% annualized return for the six months ended April 30, 2023 | |
| | | | | | | |
| | Class A | Class C | Class I | Class Y | Class Z | |
Expenses paid per $1,000† | $3.56 | $7.50 | $2.41 | $2.36 | $3.36 | |
Ending value (after expenses) | $1,021.27 | $1,017.36 | $1,022.41 | $1,022.46 | $1,021.47 | |
† | Expenses are equal to the fund’s annualized expense ratio of .71% for Class A, 1.50% for Class C, .48% for Class I, .47% for Class Y and .67% for Class Z, multiplied by the average account value over the period, multiplied by 181/365 (to reflect the one-half year period). | |
7
STATEMENT OF INVESTMENTS
April 30, 2023
| | | | | | | | | | |
| |
Description | Coupon
Rate (%) | | Maturity Date | | Principal Amount ($) | | Value ($) | |
Bonds and Notes - .2% | | | | | |
Collateralized Municipal-Backed Securities - .2% | | | | | |
Arizona Industrial Development Authority, Revenue Bonds, Ser. 2019-2
(cost $1,080,814) | | 3.63 | | 5/20/2033 | | 984,715 | | 921,382 | |
| | | | | | | | | |
Long-Term Municipal Investments - 99.3% | | | | | |
Alabama - 4.3% | | | | | |
Birmingham-Jefferson Civic Center Authority, Special Tax Bonds, Ser. B | | 5.00 | | 7/1/2043 | | 2,500,000 | | 2,620,255 | |
Black Belt Energy Gas District, Revenue Bonds (Project No. 4) Ser. A1 | | 4.00 | | 12/1/2025 | | 1,250,000 | a | 1,251,952 | |
Black Belt Energy Gas District, Revenue Bonds, Refunding, Ser. D1 | | 4.00 | | 6/1/2027 | | 1,000,000 | a | 1,005,327 | |
Black Belt Energy Gas District, Revenue Bonds, Ser. B1, 1 Month LIBOR +0.90% | | 4.15 | | 12/1/2023 | | 1,405,000 | a,b | 1,403,497 | |
Jefferson County, Revenue Bonds, Refunding (Insured; Assured Guaranty Municipal Corp.) Ser. C | | 6.60 | | 10/1/2042 | | 7,835,000 | c | 8,071,681 | |
The Lower Alabama Gas District, Revenue Bonds (Gas Project) | | 4.00 | | 12/1/2025 | | 1,750,000 | a | 1,750,188 | |
The Southeast Alabama Gas Supply District, Revenue Bonds (Project No. 2) Ser. A | | 4.00 | | 6/1/2024 | | 2,240,000 | a | 2,242,179 | |
University of Alabama at Birmingham, Revenue Bonds, Ser. B | | 4.00 | | 10/1/2035 | | 2,000,000 | | 2,073,376 | |
| | 20,418,455 | |
Arizona - 3.1% | | | | | |
Arizona Industrial Development Authority, Revenue Bonds (Equitable School Revolving Fund Obligated Group) Ser. A | | 4.00 | | 11/1/2038 | | 3,065,000 | | 2,974,140 | |
Arizona Industrial Development Authority, Revenue Bonds, Refunding (BASIS Schools Project) Ser. A | | 5.38 | | 7/1/2050 | | 2,500,000 | d | 2,394,869 | |
Glendale Industrial Development Authority, Revenue Bonds, Refunding (Sun Health Services Obligated Group) Ser. A | | 5.00 | | 11/15/2054 | | 1,500,000 | | 1,355,054 | |
8
| | | | | | | | | | |
| |
Description | Coupon
Rate (%) | | Maturity Date | | Principal Amount ($) | | Value ($) | |
Long-Term Municipal Investments - 99.3% (continued) | | | | | |
Arizona - 3.1% (continued) | | | | | |
La Paz County Industrial Development Authority, Revenue Bonds (Harmony Public Schools) Ser. A | | 5.00 | | 2/15/2048 | | 1,000,000 | | 982,210 | |
La Paz County Industrial Development Authority, Revenue Bonds (Harmony Public Schools) Ser. A | | 5.00 | | 2/15/2046 | | 2,000,000 | d | 1,979,203 | |
Maricopa County Industrial Development Authority, Revenue Bonds (Banner Health Obligated Group) Ser. A | | 5.00 | | 1/1/2041 | | 1,175,000 | | 1,234,281 | |
Maricopa County Industrial Development Authority, Revenue Bonds (Benjamin Franklin Charter School Obligated Group) | | 6.00 | | 7/1/2038 | | 2,750,000 | d | 2,883,772 | |
The Phoenix Arizona Industrial Development Authority, Revenue Bonds, Refunding (BASIS Schools Projects) Ser. A | | 5.00 | | 7/1/2046 | | 1,000,000 | d | 923,809 | |
| | 14,727,338 | |
California - 4.2% | | | | | |
Alameda Corridor Transportation Authority, Revenue Bonds (Insured; Assured Guaranty Municipal Corp.) Ser. C | | 5.00 | | 10/1/2052 | | 2,500,000 | | 2,719,596 | |
California, GO, Refunding | | 5.00 | | 4/1/2042 | | 1,400,000 | | 1,584,577 | |
California, GO, Refunding | | 5.25 | | 9/1/2047 | | 1,000,000 | | 1,144,731 | |
California Community Choice Financing Authority, Revenue Bonds (Green Bond) | | 5.25 | | 10/1/2031 | | 2,000,000 | a | 2,089,327 | |
California County Tobacco Securitization Agency, Revenue Bonds, Refunding, Ser. A | | 4.00 | | 6/1/2040 | | 400,000 | | 394,735 | |
California Health Facilities Financing Authority, Revenue Bonds, Refunding (Sutter Health Obligated Group) Ser. B | | 5.00 | | 11/15/2046 | | 1,480,000 | | 1,519,635 | |
California Housing Finance Agency, Revenue Bonds, Ser. 2021-1 | | 3.50 | | 11/20/2035 | | 1,453,953 | | 1,377,744 | |
California Municipal Finance Authority, Revenue Bonds (Green Bond) (Insured; Build America Mutual) | | 5.00 | | 5/15/2027 | | 450,000 | | 479,866 | |
California Municipal Finance Authority, Revenue Bonds, Refunding (HumanGood California Obligated Group) Ser. A | | 5.00 | | 10/1/2044 | | 2,500,000 | | 2,555,005 | |
9
STATEMENT OF INVESTMENTS (continued)
| | | | | | | | | | |
| |
Description | Coupon
Rate (%) | | Maturity Date | | Principal Amount ($) | | Value ($) | |
Long-Term Municipal Investments - 99.3% (continued) | | | | | |
California - 4.2% (continued) | | | | | |
California University, Revenue Bonds, Refunding, Ser. B2 | | 0.55 | | 11/1/2026 | | 1,000,000 | a | 889,972 | |
Orange County Community Facilities District, Special Tax Bonds, Ser. A | | 5.00 | | 8/15/2047 | | 1,000,000 | | 1,025,010 | |
San Diego County Regional Airport Authority, Revenue Bonds, Ser. B | | 4.00 | | 7/1/2046 | | 1,750,000 | | 1,652,047 | |
San Francisco City & County Airport Commission, Revenue Bonds, Refunding, Ser. B | | 5.00 | | 5/1/2041 | | 1,500,000 | | 1,533,554 | |
San Jose Evergreen Community College District, GO, Ser. C | | 4.00 | | 9/1/2045 | | 1,000,000 | | 1,012,565 | |
| | 19,978,364 | |
Colorado - 6.0% | | | | | |
Colorado Health Facilities Authority, Revenue Bonds (Children's Hospital Colorado Obligated Group) Ser. A | | 5.00 | | 12/1/2041 | | 2,500,000 | | 2,558,023 | |
Colorado Health Facilities Authority, Revenue Bonds (Covenant Retirement Communities & Services Obligated Group) | | 5.00 | | 12/1/2043 | | 3,280,000 | | 3,292,584 | |
Colorado Health Facilities Authority, Revenue Bonds, Refunding | | 5.00 | | 11/19/2026 | | 2,270,000 | a | 2,419,880 | |
Colorado Health Facilities Authority, Revenue Bonds, Refunding (CommonSpirit Health Obligated Group) Ser. A | | 5.00 | | 8/1/2044 | | 1,250,000 | | 1,291,255 | |
Colorado Health Facilities Authority, Revenue Bonds, Refunding (Intermountain Healthcare Obligated Group) Ser. A | | 4.00 | | 5/15/2052 | | 2,000,000 | | 1,911,563 | |
Colorado Health Facilities Authority, Revenue Bonds, Refunding, Ser. A | | 4.00 | | 1/1/2036 | | 2,000,000 | | 2,056,913 | |
Denver City & County Airport System, Revenue Bonds, Refunding, Ser. A | | 5.00 | | 12/1/2048 | | 3,000,000 | | 3,079,586 | |
Denver City & County Airport System, Revenue Bonds, Refunding, Ser. A | | 5.50 | | 11/15/2053 | | 3,000,000 | | 3,288,879 | |
Denver City & County Airport System, Revenue Bonds, Refunding, Ser. D | | 5.00 | | 11/15/2024 | | 2,400,000 | | 2,453,065 | |
Denver City & County Airport System, Revenue Bonds, Ser. A | | 5.50 | | 11/15/2027 | | 3,065,000 | | 3,092,300 | |
Regional Transportation District, Revenue Bonds, Refunding (Denver Transit Partners) Ser. A | | 5.00 | | 1/15/2031 | | 950,000 | | 1,033,737 | |
10
| | | | | | | | | | |
| |
Description | Coupon
Rate (%) | | Maturity Date | | Principal Amount ($) | | Value ($) | |
Long-Term Municipal Investments - 99.3% (continued) | | | | | |
Colorado - 6.0% (continued) | | | | | |
Weld County School District No. RE-4, GO (Insured; State Aid Withholding) | | 5.00 | | 12/1/2042 | | 2,000,000 | | 2,257,692 | |
| | 28,735,477 | |
Connecticut - .8% | | | | | |
Connecticut, GO, Ser. F | | 5.00 | | 11/15/2041 | | 2,500,000 | | 2,810,880 | |
Connecticut Health & Educational Facilities Authority, Revenue Bonds, Refunding (Fairfield University) Ser. T | | 4.00 | | 7/1/2055 | | 1,000,000 | | 900,819 | |
| | 3,711,699 | |
District of Columbia - 2.7% | | | | | |
District of Columbia, Revenue Bonds, Ser. A | | 5.50 | | 7/1/2047 | | 3,000,000 | | 3,453,016 | |
Metropolitan Washington Airports Authority, Revenue Bonds, Refunding | | 5.00 | | 10/1/2035 | | 1,500,000 | | 1,580,631 | |
Metropolitan Washington Airports Authority, Revenue Bonds, Refunding, Ser. A | | 5.00 | | 10/1/2035 | | 1,000,000 | | 1,041,009 | |
Metropolitan Washington Airports Authority, Revenue Bonds, Refunding, Ser. A | | 5.00 | | 10/1/2027 | | 3,340,000 | | 3,393,981 | |
Metropolitan Washington Airports Authority, Revenue Bonds, Refunding, Ser. B | | 4.00 | | 10/1/2049 | | 2,500,000 | | 2,350,342 | |
Washington Metropolitan Area Transit Authority, Revenue Bonds (Green Bond) Ser. A | | 4.13 | | 7/15/2047 | | 1,000,000 | | 988,562 | |
| | 12,807,541 | |
Florida - 3.7% | | | | | |
Broward County Airport System, Revenue Bonds | | 5.00 | | 10/1/2037 | | 1,560,000 | | 1,624,958 | |
Escambia County, Revenue Bonds | | 5.00 | | 10/1/2046 | | 2,000,000 | | 2,112,686 | |
Florida Municipal Power Agency, Revenue Bonds, Ser. A | | 3.00 | | 10/1/2032 | | 1,000,000 | | 958,963 | |
Hillsborough County Aviation Authority, Revenue Bonds | | 5.00 | | 10/1/2034 | | 1,000,000 | | 1,117,142 | |
Jacksonville, Revenue Bonds, Refunding (Brooks Rehabilitation Project) | | 4.00 | | 11/1/2045 | | 1,500,000 | | 1,372,701 | |
JEA Water & Sewer System, Revenue Bonds, Refunding, Ser. A | | 4.00 | | 10/1/2040 | | 800,000 | | 797,882 | |
Miami Beach Redevelopment Agency, Tax Allocation Bonds, Refunding | | 5.00 | | 2/1/2033 | | 1,000,000 | | 1,009,168 | |
11
STATEMENT OF INVESTMENTS (continued)
| | | | | | | | | | |
| |
Description | Coupon
Rate (%) | | Maturity Date | | Principal Amount ($) | | Value ($) | |
Long-Term Municipal Investments - 99.3% (continued) | | | | | |
Florida - 3.7% (continued) | | | | | |
Miami Beach Stormwater, Revenue Bonds, Refunding | | 5.00 | | 9/1/2047 | | 2,500,000 | | 2,500,021 | |
Mid-Bay Bridge Authority, Revenue Bonds, Refunding, Ser. A | | 5.00 | | 10/1/2040 | | 1,000,000 | | 1,009,002 | |
Orange County Health Facilities Authority, Revenue Bonds (Orlando Health Obligated Group) Ser. A | | 5.00 | | 10/1/2053 | | 2,000,000 | | 2,120,182 | |
Palm Beach County Health Facilities Authority, Revenue Bonds, Refunding (Baptist Health South Florida Obligated Group) | | 4.00 | | 8/15/2049 | | 3,305,000 | | 3,023,525 | |
| | 17,646,230 | |
Georgia - 4.3% | | | | | |
Atlanta Water & Wastewater, Revenue Bonds, Refunding | | 5.00 | | 11/1/2041 | | 1,000,000 | | 1,068,446 | |
Georgia Municipal Electric Authority, Revenue Bonds (Plant Vogtle Units 3&4 Project) | | 5.00 | | 1/1/2037 | | 1,100,000 | | 1,164,481 | |
Georgia Municipal Electric Authority, Revenue Bonds (Plant Vogtle Units 3&4 Project) (Insured; Assured Guaranty Municipal Corp.) Ser. A | | 5.00 | | 7/1/2055 | | 1,000,000 | | 1,047,528 | |
Georgia Municipal Electric Authority, Revenue Bonds (Plant Vogtle Units 3&4 Project) Ser. A | | 5.00 | | 7/1/2052 | | 3,250,000 | | 3,361,607 | |
Georgia Municipal Electric Authority, Revenue Bonds, Refunding (Project No. 1) Ser. A | | 5.00 | | 1/1/2028 | | 2,500,000 | | 2,627,148 | |
Georgia Ports Authority, Revenue Bonds | | 4.00 | | 7/1/2052 | | 1,250,000 | | 1,216,961 | |
Main Street Natural Gas, Revenue Bonds, Ser. A | | 5.00 | | 6/1/2030 | | 2,500,000 | a | 2,637,918 | |
Main Street Natural Gas, Revenue Bonds, Ser. B | | 5.00 | | 6/1/2029 | | 2,000,000 | a | 2,099,567 | |
Main Street Natural Gas, Revenue Bonds, Ser. C | | 4.00 | | 9/1/2026 | | 3,750,000 | a | 3,746,998 | |
Private Colleges & Universities Authority, Revenue Bonds, Refunding (Emory University) Ser. A | | 5.00 | | 10/1/2043 | | 1,700,000 | | 1,704,413 | |
| | 20,675,067 | |
Hawaii - .3% | | | | | |
Hawaii Airports System, Revenue Bonds, Ser. A | | 5.00 | | 7/1/2047 | | 1,250,000 | | 1,312,326 | |
12
| | | | | | | | | | |
| |
Description | Coupon
Rate (%) | | Maturity Date | | Principal Amount ($) | | Value ($) | |
Long-Term Municipal Investments - 99.3% (continued) | | | | | |
Illinois - 9.9% | | | | | |
Chicago Board of Education, GO, Refunding (Insured; Assured Guaranty Municipal Corp.) Ser. A | | 5.00 | | 12/1/2033 | | 1,000,000 | | 1,072,971 | |
Chicago Board of Education, GO, Refunding (Insured; Assured Guaranty Municipal Corp.) Ser. C | | 5.00 | | 12/1/2030 | | 1,500,000 | | 1,614,335 | |
Chicago Board of Education Dedicated Capital Improvement Tax, Revenue Bonds | | 5.00 | | 4/1/2042 | | 1,000,000 | | 1,016,305 | |
Chicago II Wastewater Transmission, Revenue Bonds (Insured; Assured Guaranty Municipal Corp.) | | 5.00 | | 1/1/2033 | | 2,490,000 | | 2,524,542 | |
Chicago II Waterworks, Revenue Bonds (2nd Lien Project) | | 5.00 | | 11/1/2025 | | 1,925,000 | | 1,960,634 | |
Chicago O'Hare International Airport, Revenue Bonds, Refunding, Ser. A | | 5.00 | | 1/1/2034 | | 2,100,000 | | 2,137,740 | |
Chicago O'Hare International Airport, Revenue Bonds, Ser. A | | 5.50 | | 1/1/2055 | | 1,500,000 | | 1,618,776 | |
Chicago Park District, GO, Refunding, Ser. C | | 5.00 | | 1/1/2027 | | 2,030,000 | | 2,050,142 | |
Cook County II, GO, Refunding, Ser. A | | 5.00 | | 11/15/2025 | | 2,000,000 | | 2,085,451 | |
Cook County II, Revenue Bonds, Refunding | | 5.00 | | 11/15/2035 | | 2,500,000 | | 2,670,293 | |
Illinois, GO, Refunding, Ser. D | | 4.00 | | 7/1/2037 | | 1,750,000 | | 1,728,879 | |
Illinois, Revenue Bonds (Insured; Build America Mutual) Ser. A | | 5.00 | | 6/15/2030 | | 2,000,000 | | 2,170,287 | |
Illinois Finance Authority, Revenue Bonds (Advocate Health Care Obligated Group) | | 5.00 | | 6/1/2027 | | 270,000 | | 270,297 | |
Illinois Finance Authority, Revenue Bonds, Refunding (OSF Healthcare System Obligated Group) Ser. A | | 5.00 | | 11/15/2045 | | 1,000,000 | | 1,010,217 | |
Illinois Finance Authority, Revenue Bonds, Refunding (Rush University Medical Center Obligated Group) Ser. A | | 5.00 | | 11/15/2033 | | 3,000,000 | | 3,095,743 | |
Illinois Finance Authority, Revenue Bonds, Refunding (The University of Chicago) Ser. A | | 4.00 | | 4/1/2050 | | 3,760,000 | | 3,543,614 | |
Illinois Finance Authority, Revenue Bonds, Refunding, Ser. A | | 6.00 | | 7/1/2043 | | 2,500,000 | | 2,510,672 | |
Illinois Housing Development Authority, Revenue Bonds (Insured; GNMA, FNMA, FHLMC) Ser. A | | 3.00 | | 4/1/2051 | | 1,865,000 | | 1,807,884 | |
13
STATEMENT OF INVESTMENTS (continued)
| | | | | | | | | | |
| |
Description | Coupon
Rate (%) | | Maturity Date | | Principal Amount ($) | | Value ($) | |
Long-Term Municipal Investments - 99.3% (continued) | | | | | |
Illinois - 9.9% (continued) | | | | | |
Illinois Municipal Electric Agency, Revenue Bonds, Refunding, Ser. A | | 5.00 | | 2/1/2032 | | 1,500,000 | | 1,552,267 | |
Northern Illinois University, Revenue Bonds, Refunding (Insured; Build America Mutual) Ser. B | | 4.00 | | 4/1/2040 | | 1,475,000 | | 1,383,008 | |
Regional Transportation Authority, Revenue Bonds, Refunding (Insured; Assured Guaranty Municipal Corp.) | | 6.00 | | 6/1/2025 | | 1,000,000 | | 1,033,067 | |
Sales Tax Securitization Corp., Revenue Bonds, Refunding, Ser. A | | 4.00 | | 1/1/2039 | | 2,350,000 | | 2,317,484 | |
Sales Tax Securitization Corp., Revenue Bonds, Refunding, Ser. A | | 4.00 | | 1/1/2038 | | 1,000,000 | | 994,102 | |
Sales Tax Securitization Corp., Revenue Bonds, Refunding, Ser. A | | 5.00 | | 1/1/2034 | | 1,400,000 | | 1,611,637 | |
Sales Tax Securitization Corp., Revenue Bonds, Refunding, Ser. A | | 5.00 | | 1/1/2036 | | 3,500,000 | | 3,786,433 | |
| | 47,566,780 | |
Indiana - .6% | | | | | |
Indiana Finance Authority, Revenue Bonds, Refunding (CWA Authority Project) Ser. 1 | | 4.00 | | 10/1/2036 | | 2,980,000 | | 3,047,511 | |
Iowa - 2.0% | | | | | |
Iowa Finance Authority, Revenue Bonds, Refunding (Iowa Fertilizer Co. Project) | | 5.00 | | 12/1/2050 | | 2,730,000 | | 2,713,708 | |
Iowa Student Loan Liquidity Corp., Revenue Bonds, Ser. B | | 5.00 | | 12/1/2030 | | 1,500,000 | | 1,671,389 | |
Iowa Tobacco Settlement Authority, Revenue Bonds, Refunding, Ser. A2 | | 4.00 | | 6/1/2049 | | 2,000,000 | | 1,801,872 | |
Iowa Tobacco Settlement Authority, Revenue Bonds, Refunding, Ser. B1 | | 4.00 | | 6/1/2049 | | 1,420,000 | | 1,406,107 | |
PEFA, Revenue Bonds (Gas Project) | | 5.00 | | 9/1/2026 | | 2,000,000 | a | 2,060,125 | |
| | 9,653,201 | |
Kansas - .0% | | | | | |
Kansas Development Finance Authority, Revenue Bonds, Ser. B | | 4.00 | | 11/15/2025 | | 250,000 | | 234,986 | |
Kentucky - 1.8% | | | | | |
Kentucky Economic Development Finance Authority, Revenue Bonds, Refunding (Louisville Arena Project) (Insured; Assured Guaranty Municipal Corp.) Ser. A | | 5.00 | | 12/1/2045 | | 2,000,000 | | 2,059,424 | |
14
| | | | | | | | | | |
| |
Description | Coupon
Rate (%) | | Maturity Date | | Principal Amount ($) | | Value ($) | |
Long-Term Municipal Investments - 99.3% (continued) | | | | | |
Kentucky - 1.8% (continued) | | | | | |
Kentucky Public Energy Authority, Revenue Bonds, Ser. A | | 4.00 | | 4/1/2024 | | 1,010,000 | a | 1,010,987 | |
Kentucky Public Energy Authority, Revenue Bonds, Ser. A1 | | 4.00 | | 8/1/2030 | | 1,500,000 | a | 1,488,098 | |
Kentucky Public Energy Authority, Revenue Bonds, Ser. B | | 4.00 | | 1/1/2025 | | 4,000,000 | a | 4,010,394 | |
| | 8,568,903 | |
Louisiana - 1.8% | | | | | |
Louisiana Public Facilities Authority, Revenue Bonds (Franciscan Missionaries of Our Lady Health System Obligated Group) Ser. A | | 5.00 | | 7/1/2047 | | 1,500,000 | | 1,524,447 | |
New Orleans Aviation Board, Revenue Bonds (Parking Facilities Corp.) (Insured; Assured Guaranty Municipal Corp.) | | 5.00 | | 10/1/2048 | | 1,250,000 | | 1,309,829 | |
New Orleans Aviation Board, Revenue Bonds, Refunding (Insured; Assured Guaranty Municipal Corp.) | | 5.00 | | 1/1/2036 | | 1,135,000 | | 1,225,030 | |
New Orleans Aviation Board, Revenue Bonds, Ser. B | | 5.00 | | 1/1/2040 | | 2,175,000 | | 2,190,382 | |
St. John the Baptist Parish, Revenue Bonds, Refunding (Marathon Oil Corp.) | | 2.20 | | 7/1/2026 | | 1,000,000 | a | 941,295 | |
Tobacco Settlement Financing Corp., Revenue Bonds, Refunding, Ser. A | | 5.25 | | 5/15/2035 | | 1,500,000 | | 1,510,092 | |
| | 8,701,075 | |
Maryland - .3% | | | | | |
Maryland Economic Development Corp., Revenue Bonds (Green Bond) (Purple Line Transit Partners) Ser. B | | 5.25 | | 6/30/2052 | | 1,590,000 | | 1,614,500 | |
Massachusetts - 1.3% | | | | | |
Massachusetts Development Finance Agency, Revenue Bonds, Refunding (Boston Medical Center Corp. Obligated Group) | | 4.38 | | 7/1/2052 | | 1,000,000 | | 970,744 | |
Massachusetts Development Finance Agency, Revenue Bonds, Refunding (Suffolk University) | | 5.00 | | 7/1/2027 | | 1,750,000 | | 1,840,248 | |
Massachusetts Educational Financing Authority, Revenue Bonds, Ser. B | | 5.00 | | 7/1/2027 | | 2,350,000 | | 2,494,511 | |
15
STATEMENT OF INVESTMENTS (continued)
| | | | | | | | | | |
| |
Description | Coupon
Rate (%) | | Maturity Date | | Principal Amount ($) | | Value ($) | |
Long-Term Municipal Investments - 99.3% (continued) | | | | | |
Massachusetts - 1.3% (continued) | | | | | |
Massachusetts Port Authority, Revenue Bonds (Green Bond) Ser. A | | 5.00 | | 7/1/2034 | | 1,000,000 | | 1,133,567 | |
| | 6,439,070 | |
Michigan - 5.1% | | | | | |
Great Lakes Water Authority, Revenue Bonds, Ser. B | | 5.00 | | 7/1/2046 | | 3,000,000 | | 3,092,941 | |
Karegnondi Water Authority, Revenue Bonds, Refunding | | 5.00 | | 11/1/2041 | | 1,000,000 | | 1,040,041 | |
Lansing Board of Water & Light, Revenue Bonds, Ser. B | | 2.00 | | 7/1/2026 | | 2,500,000 | a | 2,384,001 | |
Michigan Finance Authority, Revenue Bonds (Henry Ford Health System Obligated Group) Ser. A | | 4.00 | | 11/15/2050 | | 1,665,000 | | 1,510,037 | |
Michigan Finance Authority, Revenue Bonds, Refunding | | 4.00 | | 4/15/2042 | | 2,425,000 | | 2,364,578 | |
Michigan Finance Authority, Revenue Bonds, Refunding (Great Lakes Water Authority) (Insured; Assured Guaranty Municipal Corp.) Ser. C3 | | 5.00 | | 7/1/2031 | | 2,500,000 | | 2,545,710 | |
Michigan Finance Authority, Revenue Bonds, Refunding (Insured; Assured Guaranty Municipal Corp.) Ser. D1 | | 5.00 | | 7/1/2037 | | 2,000,000 | | 2,025,132 | |
Michigan Housing Development Authority, Revenue Bonds, Ser. A | | 3.50 | | 12/1/2050 | | 1,605,000 | | 1,581,980 | |
Michigan Strategic Fund, Revenue Bonds (I-75 Improvement Project) | | 5.00 | | 6/30/2033 | | 3,900,000 | | 4,092,752 | |
Michigan Trunk Line, Revenue Bonds | | 4.00 | | 11/15/2046 | | 1,140,000 | | 1,118,394 | |
Pontiac School District, GO | | 4.00 | | 5/1/2045 | | 1,800,000 | | 1,801,310 | |
Wayne County Airport Authority, Revenue Bonds, Ser. D | | 5.00 | | 12/1/2045 | | 1,000,000 | | 1,024,059 | |
| | 24,580,935 | |
Missouri - .6% | | | | | |
Kansas City Industrial Development Authority, Revenue Bonds, Ser. B | | 5.00 | | 3/1/2054 | | 3,060,000 | | 3,135,868 | |
Multi-State - .2% | | | | | |
Federal Home Loan Mortgage Corp. Multifamily Variable Rate Certificates, Revenue Bonds, Ser. M048 | | 3.15 | | 1/15/2036 | | 1,175,000 | d | 1,076,866 | |
16
| | | | | | | | | | |
| |
Description | Coupon
Rate (%) | | Maturity Date | | Principal Amount ($) | | Value ($) | |
Long-Term Municipal Investments - 99.3% (continued) | | | | | |
Nebraska - .4% | | | | | |
Public Power Generation Agency, Revenue Bonds, Refunding | | 5.00 | | 1/1/2037 | | 2,000,000 | | 2,091,944 | |
Nevada - 1.4% | | | | | |
Clark County School District, GO, Ser. A | | 5.00 | | 6/15/2039 | | 5,000,000 | | 5,572,627 | |
Reno, Revenue Bonds, Refunding (Reno Transportation Rail Access Project) | | 5.00 | | 6/1/2048 | | 1,070,000 | | 1,111,775 | |
| | 6,684,402 | |
New Jersey - 3.3% | | | | | |
New Jersey Economic Development Authority, Revenue Bonds, Refunding, Ser. XX | | 5.25 | | 6/15/2027 | | 465,000 | | 485,478 | |
New Jersey Educational Facilities Authority, Revenue Bonds, Refunding (Stockton University) Ser. A | | 5.00 | | 7/1/2041 | | 1,000,000 | | 1,016,954 | |
New Jersey Health Care Facilities Financing Authority, Revenue Bonds (Inspira Health Obligated Group) | | 5.00 | | 7/1/2037 | | 1,600,000 | | 1,673,631 | |
New Jersey Higher Education Student Assistance Authority, Revenue Bonds, Ser. B | | 5.00 | | 12/1/2024 | | 570,000 | | 580,419 | |
New Jersey Transportation Trust Fund Authority, Revenue Bonds | | 5.50 | | 6/15/2050 | | 1,000,000 | | 1,109,102 | |
New Jersey Transportation Trust Fund Authority, Revenue Bonds, Ser. BB | | 5.00 | | 6/15/2044 | | 2,000,000 | | 2,098,755 | |
New Jersey Turnpike Authority, Revenue Bonds, Refunding, Ser. D | | 5.00 | | 1/1/2028 | | 1,000,000 | | 1,065,641 | |
South Jersey Transportation Authority, Revenue Bonds | | 4.63 | | 11/1/2047 | | 1,000,000 | | 1,016,991 | |
Tobacco Settlement Financing Corp., Revenue Bonds, Refunding, Ser. A | | 5.00 | | 6/1/2046 | | 3,880,000 | | 3,997,247 | |
Tobacco Settlement Financing Corp., Revenue Bonds, Refunding, Ser. A | | 5.00 | | 6/1/2036 | | 2,000,000 | | 2,127,742 | |
Tobacco Settlement Financing Corp., Revenue Bonds, Refunding, Ser. A | | 5.25 | | 6/1/2046 | | 620,000 | | 648,618 | |
| | 15,820,578 | |
New Mexico - 1.0% | | | | | |
New Mexico Educational Assistance Foundation, Revenue Bonds, Refunding, Ser. 1A | | 5.00 | | 9/1/2025 | | 2,080,000 | | 2,148,105 | |
17
STATEMENT OF INVESTMENTS (continued)
| | | | | | | | | | |
| |
Description | Coupon
Rate (%) | | Maturity Date | | Principal Amount ($) | | Value ($) | |
Long-Term Municipal Investments - 99.3% (continued) | | | | | |
New Mexico - 1.0% (continued) | | | | | |
New Mexico Mortgage Finance Authority, Revenue Bonds (Insured; GNMA, FNMA, FHLMC) Ser. C | | 3.00 | | 1/1/2052 | | 2,645,000 | | 2,560,148 | |
| | 4,708,253 | |
New York - 6.4% | | | | | |
Metropolitan Transportation Authority, Revenue Bonds, Refunding (Green Bond) Ser. C1 | | 5.00 | | 11/15/2050 | | 3,000,000 | | 3,104,186 | |
New York City, GO, Ser. F1 | | 4.00 | | 3/1/2047 | | 200,000 | | 195,662 | |
New York City Housing Development Corp., Revenue Bonds (Insured; Federal Housing Administration) Ser. F2 | | 0.60 | | 7/1/2025 | | 1,000,000 | a | 923,988 | |
New York Liberty Development Corp., Revenue Bonds, Refunding (Class 1-3 World Trade Center Project) | | 5.00 | | 11/15/2044 | | 2,500,000 | d | 2,429,314 | |
New York Liberty Development Corp., Revenue Bonds, Refunding (Goldman Sachs Headquarters) | | 5.25 | | 10/1/2035 | | 1,000,000 | | 1,148,940 | |
New York State Dormitory Authority, Revenue Bonds, Refunding, Ser. E | | 4.00 | | 3/15/2038 | | 1,400,000 | | 1,431,106 | |
New York State Mortgage Agency, Revenue Bonds, Refunding, Ser. 232 | | 5.00 | | 4/1/2026 | | 1,180,000 | | 1,227,409 | |
New York Transportation Development Corp., Revenue Bonds (Delta Air Lines) | | 4.38 | | 10/1/2045 | | 2,500,000 | | 2,384,729 | |
New York Transportation Development Corp., Revenue Bonds (Delta Air Lines) | | 5.00 | | 1/1/2032 | | 1,500,000 | | 1,572,661 | |
New York Transportation Development Corp., Revenue Bonds (JFK International Air Terminal) | | 5.00 | | 12/1/2040 | | 2,000,000 | | 2,091,332 | |
New York Transportation Development Corp., Revenue Bonds (LaGuardia Airport Terminal B Redevelopment Project) Ser. A | | 5.25 | | 1/1/2050 | | 2,500,000 | | 2,503,039 | |
Triborough Bridge & Tunnel Authority, Revenue Bonds, Refunding, Ser. C | | 5.25 | | 5/15/2052 | | 5,000,000 | | 5,575,555 | |
Triborough Bridge & Tunnel Authority, Revenue Bonds, Refunding, Ser. C2 | | 5.00 | | 11/15/2042 | | 1,500,000 | | 1,607,138 | |
18
| | | | | | | | | | |
| |
Description | Coupon
Rate (%) | | Maturity Date | | Principal Amount ($) | | Value ($) | |
Long-Term Municipal Investments - 99.3% (continued) | | | | | |
New York - 6.4% (continued) | | | | | |
Triborough Bridge & Tunnel Authority, Revenue Bonds, Ser. A | | 5.25 | | 5/15/2057 | | 2,500,000 | | 2,764,404 | |
TSASC, Revenue Bonds, Refunding, Ser. B | | 5.00 | | 6/1/2045 | | 815,000 | | 766,205 | |
Westchester County Local Development Corp., Revenue Bonds, Refunding (Purchase Senior Learning Community Obligated Group) | | 5.00 | | 7/1/2046 | | 1,000,000 | d | 771,295 | |
| | 30,496,963 | |
North Carolina - 1.5% | | | | | |
Charlotte Airport, Revenue Bonds, Refunding, Ser. B | | 5.00 | | 7/1/2038 | | 1,000,000 | | 1,091,810 | |
North Carolina Medical Care Commission, Revenue Bonds (Twin Lakes Community) Ser. A | | 5.00 | | 1/1/2038 | | 1,000,000 | | 996,846 | |
The Charlotte-Mecklenburg Hospital Authority, Revenue Bonds (Atrium Health Obligated Group) | | 5.00 | | 12/1/2028 | | 1,500,000 | a | 1,671,753 | |
The Charlotte-Mecklenburg Hospital Authority, Revenue Bonds (Atrium Health Obligated Group) Ser. B | | 5.00 | | 12/2/2024 | | 3,500,000 | a | 3,598,944 | |
| | 7,359,353 | |
North Dakota - .3% | | | | | |
University of North Dakota, COP (Insured; Assured Guaranty Municipal Corp.) Ser. A | | 4.00 | | 6/1/2046 | | 1,470,000 | | 1,394,436 | |
Ohio - 1.8% | | | | | |
Buckeye Tobacco Settlement Financing Authority, Revenue Bonds, Refunding, Ser. A2 | | 4.00 | | 6/1/2048 | | 6,000,000 | | 5,312,137 | |
Cuyahoga County, Revenue Bonds, Refunding (The MetroHealth System) | | 5.25 | | 2/15/2047 | | 1,000,000 | | 1,012,776 | |
Ohio, Revenue Bonds (Cleveland Clinic Health System Obligated Group) | | 2.75 | | 5/1/2028 | | 1,000,000 | a | 984,991 | |
Ohio, Revenue Bonds, Refunding (Lease Appropriations-Adult Correctional Building Fund Projects) Ser. A | | 5.00 | | 10/1/2037 | | 1,430,000 | | 1,541,700 | |
| | 8,851,604 | |
Oregon - 1.2% | | | | | |
Port of Portland, Revenue Bonds, Refunding (Green Bond) Ser. 29 | | 5.50 | | 7/1/2053 | | 3,250,000 | | 3,579,329 | |
19
STATEMENT OF INVESTMENTS (continued)
| | | | | | | | | | |
| |
Description | Coupon
Rate (%) | | Maturity Date | | Principal Amount ($) | | Value ($) | |
Long-Term Municipal Investments - 99.3% (continued) | | | | | |
Oregon - 1.2% (continued) | | | | | |
Port of Portland, Revenue Bonds, Refunding, Ser. 28 | | 4.00 | | 7/1/2047 | | 2,250,000 | | 2,137,985 | |
| | 5,717,314 | |
Pennsylvania - 7.7% | | | | | |
Allentown Neighborhood Improvement Zone Development Authority, Revenue Bonds (City Center Project) | | 5.00 | | 5/1/2033 | | 2,750,000 | d | 2,800,944 | |
Allentown School District, GO, Refunding (Insured; Build America Mutual) Ser. B | | 5.00 | | 2/1/2030 | | 1,000,000 | | 1,127,441 | |
Commonwealth Financing Authority, Revenue Bonds | | 5.00 | | 6/1/2030 | | 2,000,000 | | 2,187,775 | |
Geisinger Authority, Revenue Bonds, Refunding (Geisinger Health System Obligated Group) | | 5.00 | | 2/15/2027 | | 1,350,000 | a | 1,417,574 | |
Luzerne County Industrial Development Authority, Revenue Bonds, Refunding (Pennsylvania-American Water Co.) | | 2.45 | | 12/3/2029 | | 1,750,000 | a | 1,610,652 | |
Montgomery County Industrial Development Authority, Revenue Bonds, Refunding (ACTS Retirement-Life Communities Obligated Group) | | 5.00 | | 11/15/2036 | | 3,500,000 | | 3,489,708 | |
Pennsylvania Economic Development Financing Authority, Revenue Bonds (Insured; Assured Guaranteed Municipal Corp.) | | 5.00 | | 12/31/2057 | | 2,000,000 | | 2,092,803 | |
Pennsylvania Higher Education Assistance Agency, Revenue Bonds, Ser. A | | 5.00 | | 6/1/2029 | | 1,400,000 | | 1,505,682 | |
Pennsylvania Turnpike Commission, Revenue Bonds, Ser. A1 | | 5.00 | | 12/1/2036 | | 1,250,000 | | 1,315,865 | |
Pennsylvania Turnpike Commission Oil Franchise, Revenue Bonds, Refunding, Ser. A | | 5.00 | | 12/1/2046 | | 3,000,000 | | 3,257,525 | |
Pennsylvania Turnpike Commission Oil Franchise, Revenue Bonds, Ser. B | | 5.25 | | 12/1/2048 | | 4,000,000 | | 4,246,287 | |
Philadelphia, GO, Ser. A | | 5.00 | | 5/1/2033 | | 4,000,000 | | 4,612,424 | |
The Philadelphia Redevelopment Authority, Revenue Bonds, Refunding, Ser. B | | 5.00 | | 4/15/2024 | | 1,500,000 | | 1,519,101 | |
The Philadelphia School District, GO (Insured; State Aid Withholding) Ser. A | | 4.00 | | 9/1/2036 | | 1,420,000 | | 1,426,678 | |
20
| | | | | | | | | | |
| |
Description | Coupon
Rate (%) | | Maturity Date | | Principal Amount ($) | | Value ($) | |
Long-Term Municipal Investments - 99.3% (continued) | | | | | |
Pennsylvania - 7.7% (continued) | | | | | |
The Philadelphia School District, GO (Insured; State Aid Withholding) Ser. A | | 5.00 | | 9/1/2038 | | 1,000,000 | | 1,069,642 | |
The Philadelphia School District, GO (Insured; State Aid Withholding) Ser. A | | 5.00 | | 9/1/2044 | | 3,000,000 | | 3,193,950 | |
| | 36,874,051 | |
Rhode Island - .4% | | | | | |
Providence Public Building Authority, Revenue Bonds (Insured; Assured Guaranty Municipal Corp.) Ser. A | | 5.00 | | 9/15/2037 | | 1,695,000 | | 1,823,076 | |
South Carolina - 2.3% | | | | | |
Piedmont Municipal Power Agency, Revenue Bonds, Refunding, Ser. B | | 5.00 | | 1/1/2029 | | 1,000,000 | | 1,104,752 | |
Piedmont Municipal Power Agency, Revenue Bonds, Refunding, Ser. D | | 4.00 | | 1/1/2033 | | 3,000,000 | | 3,093,936 | |
South Carolina Public Service Authority, Revenue Bonds (Santee Cooper) Ser. A | | 4.00 | | 12/1/2055 | | 2,000,000 | | 1,767,587 | |
South Carolina Public Service Authority, Revenue Bonds, Refunding (Santee Cooper) | | 5.13 | | 12/1/2043 | | 5,000,000 | | 5,016,673 | |
| | 10,982,948 | |
Tennessee - 1.0% | | | | | |
Tennergy Corp., Revenue Bonds, Ser. A | | 4.00 | | 9/1/2028 | | 2,000,000 | a | 2,000,568 | |
Tennessee Energy Acquisition Corp., Revenue Bonds | | 4.00 | | 11/1/2025 | | 1,000,000 | a | 1,000,360 | |
The Metropolitan Nashville Airport Authority, Revenue Bonds, Ser. B | | 5.50 | | 7/1/2052 | | 1,500,000 | | 1,625,951 | |
| | 4,626,879 | |
Texas - 9.3% | | | | | |
Argyle Independent School District, GO (Insured; Permanent School Fund Guarantee Program) | | 5.00 | | 8/15/2035 | | 1,100,000 | | 1,297,624 | |
Clifton Higher Education Finance Corp., Revenue Bonds (International Leadership of Texas) Ser. D | | 5.75 | | 8/15/2033 | | 4,500,000 | | 4,578,477 | |
Clifton Higher Education Finance Corp., Revenue Bonds, Refunding (IDEA Public Schools) (Insured; Permanent School Fund Guarantee Program) | | 5.00 | | 8/15/2031 | | 3,825,000 | | 3,908,294 | |
Corpus Christi Utility System, Revenue Bonds, Refunding, Ser. A | | 4.00 | | 7/15/2035 | | 1,000,000 | | 1,032,895 | |
21
STATEMENT OF INVESTMENTS (continued)
| | | | | | | | | | |
| |
Description | Coupon
Rate (%) | | Maturity Date | | Principal Amount ($) | | Value ($) | |
Long-Term Municipal Investments - 99.3% (continued) | | | | | |
Texas - 9.3% (continued) | | | | | |
Dallas Area Rapid Transit, Revenue Bonds, Refunding, Ser. B | | 4.00 | | 12/1/2051 | | 1,925,000 | | 1,869,621 | |
Dallas Fort Worth International Airport, Revenue Bonds, Refunding, Ser. B | | 5.00 | | 11/1/2040 | | 2,500,000 | | 2,792,232 | |
Garland Electric Utility System, Revenue Bonds, Refunding | | 5.00 | | 3/1/2044 | | 1,500,000 | | 1,591,740 | |
Georgetown Utility System, Revenue Bonds (Insured; Assured Guaranteed Municipal Corp.) | | 5.25 | | 8/15/2052 | | 3,000,000 | | 3,273,809 | |
Houston Airport System, Revenue Bonds (United Airlines) Ser. C | | 5.00 | | 7/15/2028 | | 1,000,000 | | 1,015,182 | |
Lamar Consolidated Independent School District, GO | | 4.00 | | 2/15/2053 | | 1,225,000 | | 1,154,934 | |
Love Field Airport Modernization Corp., Revenue Bonds | | 5.00 | | 11/1/2034 | | 3,500,000 | | 3,586,780 | |
Lower Colorado River Authority, Revenue Bonds, Refunding | | 5.00 | | 5/15/2039 | | 3,000,000 | | 2,999,843 | |
Lower Colorado River Authority, Revenue Bonds, Refunding (LCRA Transmission Services Corp.) Ser. A | | 4.00 | | 5/15/2049 | | 1,000,000 | | 894,692 | |
Lubbock Electric Light & Power System, Revenue Bonds | | 5.00 | | 4/15/2048 | | 2,475,000 | | 2,555,167 | |
Mission Economic Development Corp., Revenue Bonds, Refunding (Natgasoline Project) | | 4.63 | | 10/1/2031 | | 2,800,000 | d | 2,735,999 | |
North Texas Tollway Authority, Revenue Bonds, Refunding, Ser. A | | 5.00 | | 1/1/2039 | | 4,000,000 | | 4,130,527 | |
Plano Independent School District, GO | | 5.00 | | 2/15/2043 | | 1,000,000 | | 1,115,503 | |
Tarrant County Cultural Education Facilities Finance Corp., Revenue Bonds (Baylor Scott & White Health Obligated Group) Ser. F | | 5.00 | | 11/15/2030 | | 2,000,000 | a | 2,247,829 | |
Tarrant County Cultural Education Facilities Finance Corp., Revenue Bonds (CHRISTUS Health Obligated Group) Ser. A | | 5.00 | | 7/1/2032 | | 1,500,000 | a | 1,694,296 | |
| | 44,475,444 | |
U.S. Related - 2.3% | | | | | |
Puerto Rico, GO, Ser. A1 | | 5.63 | | 7/1/2029 | | 3,000,000 | | 3,176,405 | |
Puerto Rico, GO, Ser. A1 | | 5.63 | | 7/1/2027 | | 7,500,000 | | 7,825,304 | |
| | 11,001,709 | |
Utah - .9% | | | | | |
Salt Lake City Airport, Revenue Bonds, Ser. A | | 5.00 | | 7/1/2034 | | 3,000,000 | | 3,167,025 | |
22
| | | | | | | | | | |
| |
Description | Coupon
Rate (%) | | Maturity Date | | Principal Amount ($) | | Value ($) | |
Long-Term Municipal Investments - 99.3% (continued) | | | | | |
Utah - .9% (continued) | | | | | |
Utah Telecommunication Open Infrastructure Agency, Revenue Bonds, Refunding | | 5.50 | | 6/1/2040 | | 1,200,000 | | 1,375,237 | |
| | 4,542,262 | |
Virginia - 1.5% | | | | | |
Virginia Public Building Authority, Revenue Bonds, Ser. A | | 4.00 | | 8/1/2039 | | 2,500,000 | | 2,566,335 | |
Virginia Public Building Authority, Revenue Bonds, Ser. C | | 5.00 | | 8/1/2030 | | 1,275,000 | | 1,349,067 | |
Virginia Small Business Financing Authority, Revenue Bonds, Refunding | | 5.00 | | 12/31/2047 | | 1,500,000 | | 1,513,163 | |
Winchester Economic Development Authority, Revenue Bonds, Refunding (Valley Health System Obligated Group) | | 5.00 | | 1/1/2035 | | 1,560,000 | | 1,620,683 | |
| | 7,049,248 | |
Washington - 2.2% | | | | | |
Port of Seattle, Revenue Bonds | | 5.00 | | 4/1/2029 | | 2,380,000 | | 2,594,281 | |
Port of Seattle, Revenue Bonds, Refunding | | 4.00 | | 8/1/2047 | | 1,500,000 | | 1,380,088 | |
Washington, GO, Ser. B | | 5.00 | | 2/1/2043 | | 2,710,000 | | 3,055,131 | |
Washington Convention Center Public Facilities District, Revenue Bonds | | 5.00 | | 7/1/2058 | | 2,450,000 | | 2,464,178 | |
Washington Housing Finance Commission, Revenue Bonds, Ser. A1 | | 3.50 | | 12/20/2035 | | 972,161 | | 913,146 | |
| | 10,406,824 | |
Wisconsin - 1.4% | | | | | |
Public Finance Authority, Revenue Bonds, Refunding (Duke Energy Progress) Ser. B | | 4.00 | | 10/1/2030 | | 2,855,000 | a | 2,931,603 | |
Public Finance Authority, Revenue Bonds, Refunding (Renown Regional Medical Center) Ser. A | | 5.00 | | 6/1/2040 | | 2,000,000 | | 2,037,034 | |
23
STATEMENT OF INVESTMENTS (continued)
| | | | | | | | | | |
| |
Description | Coupon
Rate (%) | | Maturity Date | | Principal Amount ($) | | Value ($) | |
Long-Term Municipal Investments - 99.3% (continued) | | | | | |
Wisconsin - 1.4% (continued) | | | | | |
Public Finance Authority, Revenue Bonds, Ser. A | | 5.00 | | 10/1/2052 | | 1,500,000 | | 1,572,597 | |
| | 6,541,234 | |
Total Long-Term Municipal Investments
(cost $488,068,649) | | 476,080,714 | |
Total Investments (cost $489,149,463) | | 99.5% | 477,002,096 | |
Cash and Receivables (Net) | | 0.5% | 2,230,818 | |
Net Assets | | 100.0% | 479,232,914 | |
a These securities have a put feature; the date shown represents the put date and the bond holder can take a specific action to retain the bond after the put date.
b Variable rate security—interest rate resets periodically and rate shown is the interest rate in effect at period end. Security description also includes the reference rate and spread if published and available.
c Zero coupon until a specified date at which time the stated coupon rate becomes effective until maturity.
d Security exempt from registration pursuant to Rule 144A under the Securities Act of 1933. These securities may be resold in transactions exempt from registration, normally to qualified institutional buyers. At April 30, 2023, these securities were valued at $17,996,071 or 3.76% of net assets.
| | |
Portfolio Summary (Unaudited) † | Value (%) |
General | 19.6 |
Airport | 12.2 |
Medical | 10.9 |
Education | 7.4 |
Transportation | 7.1 |
Power | 6.7 |
General Obligation | 6.3 |
Water | 5.6 |
School District | 4.7 |
Tobacco Settlement | 4.2 |
Development | 3.8 |
Nursing Homes | 2.6 |
Utilities | 2.5 |
Student Loan | 1.7 |
Single Family Housing | 1.5 |
Multifamily Housing | 1.1 |
Special Tax | .8 |
Facilities | .7 |
Housing | .1 |
| | 99.5 |
† Based on net assets.
See notes to financial statements.
24
| | | | |
| |
Summary of Abbreviations (Unaudited) |
| |
ABAG | Association of Bay Area Governments | AGC | ACE Guaranty Corporation |
AGIC | Asset Guaranty Insurance Company | AMBAC | American Municipal Bond Assurance Corporation |
BAN | Bond Anticipation Notes | BSBY | Bloomberg Short-Term Bank Yield Index |
CIFG | CDC Ixis Financial Guaranty | COP | Certificate of Participation |
CP | Commercial Paper | DRIVERS | Derivative Inverse Tax-Exempt Receipts |
EFFR | Effective Federal Funds Rate | FGIC | Financial Guaranty Insurance Company |
FHA | Federal Housing Administration | FHLB | Federal Home Loan Bank |
FHLMC | Federal Home Loan Mortgage Corporation | FNMA | Federal National Mortgage Association |
GAN | Grant Anticipation Notes | GIC | Guaranteed Investment Contract |
GNMA | Government National Mortgage Association | GO | General Obligation |
IDC | Industrial Development Corporation | LIBOR | London Interbank Offered Rate |
LOC | Letter of Credit | LR | Lease Revenue |
NAN | Note Anticipation Notes | MFHR | Multi-Family Housing Revenue |
MFMR | Multi-Family Mortgage Revenue | MUNIPSA | Securities Industry and Financial Markets Association Municipal Swap Index Yield |
OBFR | Overnight Bank Funding Rate | PILOT | Payment in Lieu of Taxes |
PRIME | Prime Lending Rate | PUTTERS | Puttable Tax-Exempt Receipts |
RAC | Revenue Anticipation Certificates | RAN | Revenue Anticipation Notes |
RIB | Residual Interest Bonds | SFHR | Single Family Housing Revenue |
SFMR | Single Family Mortgage Revenue | SOFR | Secured Overnight Financing Rate |
TAN | Tax Anticipation Notes | TRAN | Tax and Revenue Anticipation Notes |
U.S. T-BILL | U.S. Treasury Bill Money Market Yield | XLCA | XL Capital Assurance |
| | | | |
See notes to financial statements.
25
STATEMENT OF ASSETS AND LIABILITIES
April 30, 2023
| | | | | | | |
| | | | | | |
| | | Cost | | Value | |
Assets ($): | | | | |
Investments in securities—See Statement of Investments | 489,149,463 | | 477,002,096 | |
Cash | | | | | 1,907,427 | |
Interest receivable | | 6,701,434 | |
Receivable for shares of Beneficial Interest subscribed | | 201,329 | |
Prepaid expenses | | | | | 57,409 | |
| | | | | 485,869,695 | |
Liabilities ($): | | | | |
Due to BNY Mellon Investment Adviser, Inc. and affiliates—Note 3(c) | | 217,788 | |
Payable for shares of Beneficial Interest redeemed | | 3,606,380 | |
Payable for investment securities purchased | | 2,703,765 | |
Trustees’ fees and expenses payable | | 4,554 | |
Other accrued expenses | | | | | 104,294 | |
| | | | | 6,636,781 | |
Net Assets ($) | | | 479,232,914 | |
Composition of Net Assets ($): | | | | |
Paid-in capital | | | | | 498,636,163 | |
Total distributable earnings (loss) | | | | | (19,403,249) | |
Net Assets ($) | | | 479,232,914 | |
| | | | | | | |
Net Asset Value Per Share | Class A | Class C | Class I | Class Y | Class Z | |
Net Assets ($) | 154,319,528 | 4,607,580 | 187,298,574 | 37,743 | 132,969,489 | |
Shares Outstanding | 12,866,704 | 383,249 | 15,610,446 | 3,147 | 11,085,777 | |
Net Asset Value Per Share ($) | 11.99 | 12.02 | 12.00 | 11.99 | 11.99 | |
| | | | | | |
See notes to financial statements. | | | | | | |
26
STATEMENT OF OPERATIONS
Year Ended April 30, 2023
| | | | | | | |
| | | | | | |
| | | | | | |
Investment Income ($): | | | | |
Interest Income | | | 15,715,902 | |
Expenses: | | | | |
Management fee—Note 3(a) | | | 1,678,143 | |
Shareholder servicing costs—Note 3(c) | | | 904,542 | |
Registration fees | | | 157,604 | |
Professional fees | | | 87,437 | |
Trustees’ fees and expenses—Note 3(d) | | | 55,831 | |
Distribution fees—Note 3(b) | | | 33,695 | |
Prospectus and shareholders’ reports | | | 20,820 | |
Chief Compliance Officer fees—Note 3(c) | | | 15,519 | |
Loan commitment fees—Note 2 | | | 10,959 | |
Custodian fees—Note 3(c) | | | 7,785 | |
Miscellaneous | | | 37,478 | |
Total Expenses | | | 3,009,813 | |
Less—reduction in fees due to earnings credits—Note 3(c) | | | (25,122) | |
Net Expenses | | | 2,984,691 | |
Net Investment Income | | | 12,731,211 | |
Realized and Unrealized Gain (Loss) on Investments—Note 4 ($): | | |
Net realized gain (loss) on investments | (7,832,079) | |
Net change in unrealized appreciation (depreciation) on investments | 2,808,746 | |
Net Realized and Unrealized Gain (Loss) on Investments | | | (5,023,333) | |
Net Increase in Net Assets Resulting from Operations | | 7,707,878 | |
| | | | | | |
See notes to financial statements. | | | | | |
27
STATEMENT OF CHANGES IN NET ASSETS
| | | | | | | | | | |
| | | | Year Ended April 30, |
| | | | 2023 | | 2022 | |
Operations ($): | | | | | | | | |
Net investment income | | | 12,731,211 | | | | 9,785,258 | |
Net realized gain (loss) on investments | | (7,832,079) | | | | 1,230,248 | |
Net change in unrealized appreciation
(depreciation) on investments | | 2,808,746 | | | | (46,204,537) | |
Net Increase (Decrease) in Net Assets
Resulting from Operations | 7,707,878 | | | | (35,189,031) | |
Distributions ($): | |
Distributions to shareholders: | | | | | | | | |
Class A | | | (4,413,191) | | | | (4,775,936) | |
Class C | | | (90,724) | | | | (98,691) | |
Class I | | | (5,509,053) | | | | (2,611,194) | |
Class Y | | | (1,140) | | | | (1,180) | |
Class Z | | | (3,833,610) | | | | (4,177,283) | |
Total Distributions | | | (13,847,718) | | | | (11,664,284) | |
Beneficial Interest Transactions ($): | |
Net proceeds from shares sold: | | | | | | | | |
Class A | | | 44,202,389 | | | | 26,042,955 | |
Class C | | | 1,177,878 | | | | 718,021 | |
Class I | | | 207,421,428 | | | | 99,571,830 | |
Class Z | | | 904,549 | | | | 2,400,380 | |
Distributions reinvested: | | | | | | | | |
Class A | | | 3,912,381 | | | | 4,226,313 | |
Class C | | | 90,724 | | | | 97,919 | |
Class I | | | 5,482,981 | | | | 2,577,270 | |
Class Z | | | 3,170,521 | | | | 3,442,707 | |
Cost of shares redeemed: | | | | | | | | |
Class A | | | (51,993,308) | | | | (36,144,145) | |
Class C | | | (1,297,793) | | | | (1,496,345) | |
Class I | | | (147,641,083) | | | | (40,433,858) | |
Class Z | | | (12,497,483) | | | | (15,430,865) | |
Increase (Decrease) in Net Assets
from Beneficial Interest Transactions | 52,933,184 | | | | 45,572,182 | |
Total Increase (Decrease) in Net Assets | 46,793,344 | | | | (1,281,133) | |
Net Assets ($): | |
Beginning of Period | | | 432,439,570 | | | | 433,720,703 | |
End of Period | | | 479,232,914 | | | | 432,439,570 | |
28
| | | | | | | | | | |
| | | | Year Ended April 30, |
| | | | 2023 | | 2022 | |
Capital Share Transactions (Shares): | |
Class Aa | | | | | | | | |
Shares sold | | | 3,717,469 | | | | 1,949,303 | |
Shares issued for distributions reinvested | | | 328,961 | | | | 318,201 | |
Shares redeemed | | | (4,369,471) | | | | (2,764,226) | |
Net Increase (Decrease) in Shares Outstanding | (323,041) | | | | (496,722) | |
Class C | | | | | | | | |
Shares sold | | | 99,982 | | | | 53,185 | |
Shares issued for distributions reinvested | | | 7,612 | | | | 7,347 | |
Shares redeemed | | | (108,804) | | | | (112,780) | |
Net Increase (Decrease) in Shares Outstanding | (1,210) | | | | (52,248) | |
Class Ia,b | | | | | | | | |
Shares sold | | | 17,338,674 | | | | 7,690,890 | |
Shares issued for distributions reinvested | | | 461,008 | | | | 194,528 | |
Shares redeemed | | | (12,363,537) | | | | (3,091,236) | |
Net Increase (Decrease) in Shares Outstanding | 5,436,145 | | | | 4,794,182 | |
Class Zb | | | | | | | | |
Shares sold | | | 75,614 | | | | 181,237 | |
Shares issued for distributions reinvested | | | 266,515 | | | | 259,221 | |
Shares redeemed | | | (1,047,280) | | | | (1,158,702) | |
Net Increase (Decrease) in Shares Outstanding | (705,151) | | | | (718,244) | |
| | | | | | | | | |
a | During the period ended April 30, 2023, 45,328 Class A shares representing $525,906 were exchanged for 45,289 Class I shares. | |
b | During the period ended April 30, 2023, 5,913 Class Z shares representing $72,611 were exchanged for 5,908 Class I shares. | |
See notes to financial statements. | | | | | | | | |
29
FINANCIAL HIGHLIGHTS
The following tables describe the performance for each share class for the fiscal periods indicated. All information (except portfolio turnover rate) reflects financial results for a single fund share. Net asset value total return is calculated assuming an initial investment made at the net asset value at the beginning of the period, reinvestment of all dividends and distributions at net asset value during the period, and redemption at net asset value on the last day of the period. Net asset value total return includes adjustments in accordance with accounting principles generally accepted in the United States of America and as such, the net asset value for financial reporting purposes and the returns based upon those net asset values may differ from the net asset value and returns for shareholder transactions. These figures have been derived from the fund’s financial statements.
| | | | | | | | | | |
| | | | | | |
| | |
| | Year Ended April 30, |
Class A Shares | | 2023 | 2022 | 2021 | 2020 | 2019 |
Per Share Data ($): | | | | | | |
Net asset value, beginning of period | | 12.17 | 13.55 | 12.62 | 12.93 | 12.60 |
Investment Operations: | | | | | | |
Net investment incomea | | .31 | .29 | .33 | .36 | .37 |
Net realized and unrealized
gain (loss) on investments | | (.16) | (1.33) | .96 | (.31) | .34 |
Total from Investment Operations | | .15 | (1.04) | 1.29 | .05 | .71 |
Distributions: | | | | | | |
Dividends from net investment
income | | (.30) | (.28) | (.33) | (.36) | (.37) |
Dividends from net realized
gain on investments | | (.03) | (.06) | (.03) | − | (.01) |
Total Distributions | | (.33) | (.34) | (.36) | (.36) | (.38) |
Net asset value, end of period | | 11.99 | 12.17 | 13.55 | 12.62 | 12.93 |
Total Return (%)b | | 1.40 | (7.92) | 10.27 | .32 | 5.70 |
Ratios/Supplemental Data (%): | | | | | | |
Ratio of total expenses
to average net assets | | .72 | .72 | .72 | .73 | .86 |
Ratio of net expenses
to average net assets | | .72 | .72 | .72 | .73 | .86 |
Ratio of net investment income
to average net assets | | 2.56 | 2.14 | 2.47 | 2.75 | 2.94 |
Portfolio Turnover Rate | | 21.69 | 9.69 | 9.40 | 21.90 | 27.39 |
Net Assets, end of period ($ x 1,000) | | 154,320 | 160,455 | 185,393 | 145,636 | 146,875 |
a Based on average shares outstanding.
b Exclusive of sales charge.
See notes to financial statements.
30
| | | | | | | | | | | |
| | | | | | |
| | |
| | Year Ended April 30, |
Class C Shares | | 2023 | 2022 | 2021 | 2020 | 2019 |
Per Share Data ($): | | | | | | |
Net asset value, beginning of period | | 12.19 | 13.58 | 12.65 | 12.96 | 12.63 |
Investment Operations: | | | | | | |
Net investment incomea | | .21 | .18 | .23 | .26 | .27 |
Net realized and unrealized
gain (loss) on investments | | (.14) | (1.33) | .96 | (.31) | .34 |
Total from Investment Operations | | .07 | (1.15) | 1.19 | (.05) | .61 |
Distributions: | | | | | | |
Dividends from net investment
income | | (.21) | (.18) | (.23) | (.26) | (.27) |
Dividends from net realized
gain on investments | | (.03) | (.06) | (.03) | − | (.01) |
Total Distributions | | (.24) | (.24) | (.26) | (.26) | (.28) |
Net asset value, end of period | | 12.02 | 12.19 | 13.58 | 12.65 | 12.96 |
Total Return (%)b | | .61 | (8.62) | 9.39 | (.46) | 4.87 |
Ratios/Supplemental Data (%): | | | | | | |
Ratio of total expenses
to average net assets | | 1.51 | 1.50 | 1.51 | 1.51 | 1.65 |
Ratio of net expenses
to average net assets | | 1.50 | 1.50 | 1.51 | 1.51 | 1.65 |
Ratio of net investment income
to average net assets | | 1.78 | 1.36 | 1.68 | 1.97 | 2.15 |
Portfolio Turnover Rate | | 21.69 | 9.69 | 9.40 | 21.90 | 27.39 |
Net Assets, end of period ($ x 1,000) | | 4,608 | 4,688 | 5,930 | 4,980 | 5,796 |
a Based on average shares outstanding.
b Exclusive of sales charge.
See notes to financial statements.
31
FINANCIAL HIGHLIGHTS (continued)
| | | | | | | | | |
| | | | | |
| | | | |
| | Year Ended April 30, |
Class I Shares | | 2023 | 2022 | 2021 | 2020 | 2019 |
Per Share Data ($): | | | | | | |
Net asset value, beginning of period | | 12.17 | 13.55 | 12.62 | 12.93 | 12.61 |
Investment Operations: | | | | | | |
Net investment incomea | | .34 | .31 | .36 | .39 | .40 |
Net realized and unrealized
gain (loss) on investments | | (.15) | (1.31) | .96 | (.30) | .33 |
Total from Investment Operations | | .19 | (1.00) | 1.32 | .09 | .73 |
Distributions: | | | | | | |
Dividends from net investment
income | | (.33) | (.32) | (.36) | (.40) | (.40) |
Dividends from net realized
gain on investments | | (.03) | (.06) | (.03) | − | (.01) |
Total Distributions | | (.36) | (.38) | (.39) | (.40) | (.41) |
Net asset value, end of period | | 12.00 | 12.17 | 13.55 | 12.62 | 12.93 |
Total Return (%) | | 1.64 | (7.62) | 10.53 | .57 | 5.88 |
Ratios/Supplemental Data (%): | | | | | | |
Ratio of total expenses
to average net assets | | .49 | .48 | .49 | .48 | .62 |
Ratio of net expenses
to average net assets | | .48 | .48 | .49 | .48 | .62 |
Ratio of net investment income
to average net assets | | 2.80 | 2.38 | 2.71 | 2.97 | 3.17 |
Portfolio Turnover Rate | | 21.69 | 9.69 | 9.40 | 21.90 | 27.39 |
Net Assets, end of period ($ x 1,000) | | 187,299 | 123,812 | 72,900 | 55,013 | 26,521 |
a Based on average shares outstanding.
See notes to financial statements.
32
| | | | | | | | | |
| | | | |
| | |
| | Year Ended April 30, |
Class Y Shares | | 2023 | 2022 | 2021 | 2020 | 2019 |
Per Share Data ($): | | | | | | |
Net asset value, beginning of period | | 12.16 | 13.55 | 12.62 | 12.93 | 12.61 |
Investment Operations: | | | | | | |
Net investment incomea | | .34 | .32 | .36 | .40 | .42 |
Net realized and unrealized
gain (loss) on investments | | (.15) | (1.33) | .96 | (.31) | .31 |
Total from Investment Operations | | .19 | (1.01) | 1.32 | .09 | .73 |
Distributions: | | | | | | |
Dividends from net investment
income | | (.33) | (.32) | (.36) | (.40) | (.40) |
Dividends from net realized
gain on investments | | (.03) | (.06) | (.03) | − | (.01) |
Total Distributions | | (.36) | (.38) | (.39) | (.40) | (.41) |
Net asset value, end of period | | 11.99 | 12.16 | 13.55 | 12.62 | 12.93 |
Total Return (%) | | 1.65 | (7.69) | 10.54 | .57 | 5.85 |
Ratios/Supplemental Data (%): | | | | | | |
Ratio of total expenses
to average net assets | | .48 | .46 | .49 | .47 | .62 |
Ratio of net expenses
to average net assets | | .47 | .46 | .49 | .47 | .62 |
Ratio of net investment income
to average net assets | | 2.81 | 2.40 | 2.72 | 3.00 | 3.22 |
Portfolio Turnover Rate | | 21.69 | 9.69 | 9.40 | 21.90 | 27.39 |
Net Assets, end of period ($ x 1,000) | | 38 | 38 | 43 | 40 | 41 |
a Based on average shares outstanding.
See notes to financial statements.
33
FINANCIAL HIGHLIGHTS (continued)
| | | | | | | | | | | |
| | | | | | |
| | |
| | Year Ended April 30, |
Class Z Shares | | 2023 | 2022 | 2021 | 2020 | 2019 |
Per Share Data ($): | | | | | | |
Net asset value, beginning of period | | 12.17 | 13.55 | 12.62 | 12.93 | 12.60 |
Investment Operations: | | | | | | |
Net investment incomea | | .31 | .29 | .34 | .37 | .38 |
Net realized and unrealized
gain (loss) on investments | | (.15) | (1.32) | .96 | (.31) | .34 |
Total from Investment Operations | | .16 | (1.03) | 1.30 | .06 | .72 |
Distributions: | | | | | | |
Dividends from net investment
income | | (.31) | (.29) | (.34) | (.37) | (.38) |
Dividends from net realized
gain on investments | | (.03) | (.06) | (.03) | − | (.01) |
Total Distributions | | (.34) | (.35) | (.37) | (.37) | (.39) |
Net asset value, end of period | | 11.99 | 12.17 | 13.55 | 12.62 | 12.93 |
Total Return (%) | | 1.36 | (7.80) | 10.32 | .37 | 5.75 |
Ratios/Supplemental Data (%): | | | | | | |
Ratio of total expenses
to average net assets | | .68 | .67 | .67 | .67 | .81 |
Ratio of net expenses
to average net assets | | .67 | .67 | .67 | .67 | .81 |
Ratio of net investment income
to average net assets | | 2.60 | 2.19 | 2.52 | 2.81 | 2.99 |
Portfolio Turnover Rate | | 21.69 | 9.69 | 9.40 | 21.90 | 27.39 |
Net Assets, end of period ($ x 1,000) | | 132,969 | 143,446 | 169,455 | 164,045 | 175,252 |
a Based on average shares outstanding.
See notes to financial statements.
34
NOTES TO FINANCIAL STATEMENTS
NOTE 1—Significant Accounting Policies:
BNY Mellon Opportunistic Municipal Securities Fund (the “fund”), which is registered under the Investment Company Act of 1940, as amended (the “Act”), is a diversified open-ended management investment company. The fund’s investment objective is to seek to maximize current income exempt from federal income tax to the extent consistent with the preservation of capital. BNY Mellon Investment Adviser, Inc. (the “Adviser”), a wholly-owned subsidiary of The Bank of New York Mellon Corporation (“BNY Mellon”), serves as the fund’s investment adviser. Insight North America LLC (the “Sub-Adviser”), an indirect wholly-owned subsidiary of BNY Mellon and an affiliate of the Adviser, serves as the fund’s sub-adviser.
BNY Mellon Securities Corporation (the “Distributor”), a wholly-owned subsidiary of the Adviser, is the distributor of the fund’s shares. The fund is authorized to issue an unlimited number of $.001 par value shares of Beneficial Interest in each of the following classes of shares: Class A, Class C, Class I, Class Y and Class Z. Class A and Class C shares are sold primarily to retail investors through financial intermediaries and bear Distribution and/or Shareholder Services Plan fees. Class A shares generally are subject to a sales charge imposed at the time of purchase. Class A shares bought without an initial sales charge as part of an investment of $250,000 or more may be charged a contingent deferred sales charge (“CDSC”) of 1.00% if redeemed within one year. Class C shares are subject to a CDSC imposed on Class C shares redeemed within one year of purchase. Class C shares automatically convert to Class A shares eight years after the date of purchase, without the imposition of a sales charge. Class I shares are sold primarily to bank trust departments and other financial service providers (including BNY Mellon and its affiliates), acting on behalf of customers having a qualified trust or an investment account or relationship at such institution, and bear no Distribution or Shareholder Services Plan fees. Class Y shares are sold at net asset value per share generally to institutional investors, and bear no Distribution or Shareholder Services Plan fees. Class Z shares are sold at net asset value per share to certain shareholders of the fund. Class Z shares generally are not available for new accounts and bear Shareholder Services Plan fees. Class I, Class Y and Class Z shares are offered without a front-end sales charge or CDSC. Other differences between the classes include the services offered to and the expenses borne by each class, the allocation of certain transfer agency costs, and certain voting rights. Income, expenses (other than expenses attributable to a specific class), and realized
35
NOTES TO FINANCIAL STATEMENTS (continued)
and unrealized gains or losses on investments are allocated to each class of shares based on its relative net assets.
As of April 30, 2023, MBC Investments Corporation, an indirect subsidiary of BNY Mellon, held all of the outstanding Class Y shares of the fund.
The Financial Accounting Standards Board (“FASB”) Accounting Standards Codification (“ASC”) is the exclusive reference of authoritative U.S. generally accepted accounting principles (“GAAP”) recognized by the FASB to be applied by nongovernmental entities. Rules and interpretive releases of the SEC under authority of federal laws are also sources of authoritative GAAP for SEC registrants. The fund is an investment company and applies the accounting and reporting guidance of the FASB ASC Topic 946 Financial Services-Investment Companies. The fund’s financial statements are prepared in accordance with GAAP, which may require the use of management estimates and assumptions. Actual results could differ from those estimates.
The fund enters into contracts that contain a variety of indemnifications. The fund’s maximum exposure under these arrangements is unknown. The fund does not anticipate recognizing any loss related to these arrangements.
(a) Portfolio valuation: The fair value of a financial instrument is the amount that would be received to sell an asset or paid to transfer a liability in an orderly transaction between market participants at the measurement date (i.e., the exit price). GAAP establishes a fair value hierarchy that prioritizes the inputs of valuation techniques used to measure fair value. This hierarchy gives the highest priority to unadjusted quoted prices in active markets for identical assets or liabilities (Level 1 measurements) and the lowest priority to unobservable inputs (Level 3 measurements).
Additionally, GAAP provides guidance on determining whether the volume and activity in a market has decreased significantly and whether such a decrease in activity results in transactions that are not orderly. GAAP requires enhanced disclosures around valuation inputs and techniques used during annual and interim periods.
Various inputs are used in determining the value of the fund’s investments relating to fair value measurements. These inputs are summarized in the three broad levels listed below:
Level 1—unadjusted quoted prices in active markets for identical investments.
36
Level 2—other significant observable inputs (including quoted prices for similar investments, interest rates, prepayment speeds, credit risk, etc.).
Level 3—significant unobservable inputs (including the fund’s own assumptions in determining the fair value of investments).
The inputs or methodology used for valuing securities are not necessarily an indication of the risk associated with investing in those securities.
Changes in valuation techniques may result in transfers in or out of an assigned level within the disclosure hierarchy. Valuation techniques used to value the fund’s investments are as follows:
The fund’s Board of Trustees (the “Board”) has designated the Adviser as the fund’s valuation designee, effective September 8, 2022, to make all fair value determinations with respect to the fund’s portfolio investments, subject to the Board’s oversight and pursuant to Rule 2a-5 under the Act.
Investments in municipal securities are valued each business day by an independent pricing service (the “Service”) approved by the Board. Investments for which quoted bid prices are readily available and are representative of the bid side of the market in the judgment of the Service are valued at the mean between the quoted bid prices (as obtained by the Service from dealers in such securities) and asked prices (as calculated by the Service based upon its evaluation of the market for such securities). Municipal investments (which constitute a majority of the portfolio securities) are carried at fair value as determined by the Service, based on methods which include consideration of the following: yields or prices of municipal securities of comparable quality, coupon, maturity and type; indications as to values from dealers; and general market conditions. The Service is engaged under the general oversight of the Board. All of the preceding securities are generally categorized within Level 2 of the fair value hierarchy.
When market quotations or official closing prices are not readily available, or are determined not to accurately reflect fair value, such as when the value of a security has been significantly affected by events after the close of the exchange or market on which the security is principally traded, but before the fund calculates its net asset value, the fund may value these investments at fair value as determined in accordance with the procedures approved by the Board. Certain factors may be considered when fair valuing investments such as: fundamental analytical data, the nature and duration of restrictions on disposition, an evaluation of the forces that influence the market in which the securities are purchased and sold, and public trading in similar securities of the issuer or comparable issuers.
37
NOTES TO FINANCIAL STATEMENTS (continued)
These securities are either categorized within Level 2 or 3 of the fair value hierarchy depending on the relevant inputs used.
For securities where observable inputs are limited, assumptions about market activity and risk are used and such securities are generally categorized within Level 3 of the fair value hierarchy.
The following is a summary of the inputs used as of April 30, 2023 in valuing the fund’s investments:
| | | | | | | |
| | Level 1-Unadjusted Quoted Prices | Level 2- Other Significant Observable Inputs | | Level 3-Significant Unobservable Inputs | Total | |
Assets ($) | | |
Investments in Securities:† | | |
Collateralized Municipal-Backed Securities | - | 921,382 | | - | 921,382 | |
Municipal Securities | - | 476,080,714 | | - | 476,080,714 | |
† See Statement of Investments for additional detailed categorizations, if any.
(b) Securities transactions and investment income: Securities transactions are recorded on a trade date basis. Realized gains and losses from securities transactions are recorded on the identified cost basis. Interest income, adjusted for accretion of discount and amortization of premium on investments, is earned from settlement date and recognized on the accrual basis. Securities purchased or sold on a when-issued or delayed delivery basis may be settled a month or more after the trade date.
(c) Market Risk: The value of the securities in which the fund invests may be affected by political, regulatory, economic and social developments, and developments that impact specific economic sectors, industries or segments of the market. The value of a security may also decline due to general market conditions that are not specifically related to a particular company or industry, such as real or perceived adverse economic conditions, changes in the general outlook for corporate earnings, changes in interest or currency rates, changes to inflation, adverse changes to credit markets or adverse investor sentiment generally. In addition, turbulence in financial markets and reduced liquidity in equity, credit and/or fixed-income markets may negatively affect many issuers, which could adversely affect the fund. Global economies and financial markets are becoming increasingly interconnected, and conditions and events in one country, region or financial market may adversely impact issuers in a different country, region or financial market. These risks may be magnified if certain
38
events or developments adversely interrupt the global supply chain; in these and other circumstances, such risks might affect companies world-wide. Recent examples include pandemic risks related to COVID-19 and aggressive measures taken world-wide in response by governments, including closing borders, restricting international and domestic travel, and the imposition of prolonged quarantines of large populations, and by businesses, including changes to operations and reducing staff.
Municipal Securities Risk: The amount of public information available about municipal securities is generally less than that for corporate equities or bonds. Special factors, such as legislative changes, and state and local economic and business developments, may adversely affect the yield and/or value of the fund’s investments in municipal securities. Other factors include the general conditions of the municipal securities market, the size of the particular offering, the maturity of the obligation and the rating of the issue. Changes in economic, business or political conditions relating to a particular municipal project, municipality, or state, territory or possession of the United States in which the fund invests may have an impact on the fund’s share price. As an example, elevated costs or shortfalls in revenue associated with the spread of the COVID-19 outbreak could affect the ability of municipal issuers to make payments on debt obligations when due. Any such credit impairment could adversely impact the value of their bonds, which could negatively impact the performance of the fund.
(d) Dividends and distributions to shareholders: It is the policy of the fund to declare dividends daily from net investment income. Such dividends are paid monthly. Dividends from net realized capital gains, if any, are normally declared and paid annually, but the fund may make distributions on a more frequent basis to comply with the distribution requirements of the Internal Revenue Code of 1986, as amended (the “Code”). To the extent that net realized capital gains can be offset by capital loss carryovers, it is the policy of the fund not to distribute such gains. Income and capital gain distributions are determined in accordance with income tax regulations, which may differ from GAAP.
(e) Federal income taxes: It is the policy of the fund to continue to qualify as a regulated investment company, which can distribute tax-exempt dividends, by complying with the applicable provisions of the Code, and to make distributions of income and net realized capital gain sufficient to relieve it from substantially all federal income and excise taxes.
As of and during the period ended April 30, 2023, the fund did not have any liabilities for any uncertain tax positions. The fund recognizes interest and penalties, if any, related to uncertain tax positions as income tax
39
NOTES TO FINANCIAL STATEMENTS (continued)
expense in the Statement of Operations. During the period ended April 30, 2023, the fund did not incur any interest or penalties.
Each tax year in the four-year period ended April 30, 2023 remains subject to examination by the Internal Revenue Service and state taxing authorities.
At April 30, 2023, the components of accumulated earnings on a tax basis were as follows: undistributed tax-exempt income $854,872, accumulated capital losses $7,836,289 and unrealized depreciation $12,421,832.
The fund is permitted to carry forward capital losses for an unlimited period. Furthermore, capital loss carryovers retain their character as either short-term or long-term capital losses.
The accumulated capital loss carryover is available for federal income tax purposes to be applied against future net realized capital gains, if any, realized subsequent to April 30, 2023. The fund has $2,079,807 of short-term capital losses and $5,756,482 of long-term capital losses which can be carried forward for an unlimited period.
The tax character of distributions paid to shareholders during the fiscal years ended April 30, 2023 and April 30, 2022 were as follows: tax–exempt income $12,566,924 and $9,732,818, ordinary income $81,252 and $0 and long-term capital gains $1,199,542 and $1,931,466, respectively.
(f) New accounting pronouncements: In 2020, the FASB issued Accounting Standards Update No. 2020-04, Reference Rate Reform (Topic 848): Facilitation of the Effects of Reference Rate Reform on Financial Reporting, which provides optional guidance to ease the potential burden in accounting for (or recognizing the effects of) reference rate reform on financial reporting.
The objective of the guidance in Topic 848 is to provide temporary relief during the transition period. The FASB included a sunset provision within Topic 848 based on expectations of when the LIBOR would cease being published. At the time that Update 2020-04 was issued, the UK Financial Conduct Authority (FCA) had established its intent that it would no longer be necessary to persuade, or compel, banks to submit to LIBOR after December 31, 2021. As a result, the sunset provision was set for December 31, 2022—12 months after the expected cessation date of all currencies and tenors of LIBOR.
In March 2021, the FCA announced that the intended cessation date of the overnight 1-, 3-, 6-, and 12-month tenors of USD LIBOR would be June 30, 2023, which is beyond the current sunset date of Topic 848.
40
Because the current relief in Topic 848 may not cover a period of time during which a significant number of modifications may take place, the amendments in this Update defer the sunset date of Topic 848 from December 31, 2022, to December 31, 2024 (“FASB Sunset Date”), after which entities will no longer be permitted to apply the relief in Topic 848.
Management had evaluated the impact of Topic 848 on the fund’s investments, derivatives, debt and other contracts that will undergo reference rate-related modifications as a result of the Reference Rate Reform. Management has no concerns in adopting Topic 848 by FASB Sunset Date. Management will continue to work with other financial institutions and counterparties to modify contracts as required by applicable regulation and within the regulatory deadlines. As of April 30, 2023, management believes these accounting standards have no impact on the fund and does not have any concerns of adopting the regulations by FASB Sunset Date.
NOTE 2—Bank Lines of Credit:
The fund participates with other long-term open-end funds managed by the Adviser in a $823.5 million unsecured credit facility led by Citibank, N.A. (the “Citibank Credit Facility”) and a $300 million unsecured credit facility provided by BNY Mellon (the “BNYM Credit Facility”), each to be utilized primarily for temporary or emergency purposes, including the financing of redemptions (each, a “Facility”). The Citibank Credit Facility is available in two tranches: (i) Tranche A is in an amount equal to $688.5 million and is available to all long-term open-ended funds, including the fund, and (ii) Tranche B is an amount equal to $135 million and is available only to BNY Mellon Floating Rate Income Fund, a series of BNY Mellon Investment Funds IV, Inc. In connection therewith, the fund has agreed to pay its pro rata portion of commitment fees for Tranche A of the Citibank Credit Facility and the BNYM Credit Facility. Interest is charged to the fund based on rates determined pursuant to the terms of the respective Facility at the time of borrowing. During the period ended April 30, 2023, the fund did not borrow under the Facilities.
NOTE 3—Management Fee, Sub-Advisory Fee and Other Transactions with Affiliates:
(a) Pursuant to a management agreement with the Adviser, the management fee is computed at the annual rate of .35% of the value of the fund’s average daily net assets and is payable monthly.
Pursuant to a sub-investment advisory agreement between the Adviser and the Sub-Adviser, the Adviser pays the Sub-Adviser a monthly fee at an annual rate of .168% of the value of the fund’s average daily net assets.
41
NOTES TO FINANCIAL STATEMENTS (continued)
During the period ended April 30, 2023, the Distributor retained $1,962 from commissions earned on sales of the fund’s Class A shares and $9,694 from CDSC fees on redemptions of the fund’s Class A.
(b) Under the Distribution Plan adopted pursuant to Rule 12b-1 under the Act, Class C shares pay the Distributor for distributing its shares at an annual rate of .75% of the value of its average daily net assets. The Distributor may pay one or more Service Agents in respect of advertising, marketing and other distribution services, and determines the amounts, if any, to be paid to Service Agents and the basis on which such payments are made. During the period ended April 30, 2023, Class C shares were charged $33,695 pursuant to the Distribution Plan.
(c) Under the Shareholder Services Plan, Class A and Class C shares pay the Distributor at an annual rate of .25% of the value of their average daily net assets and Class Z shares reimburse the Distributor at an annual rate of .20% of the value of its average daily net assets for the provision of certain services. The services provided may include personal services relating to shareholder accounts, such as answering shareholder inquiries regarding the fund, and services related to the maintenance of shareholder accounts. The Distributor may make payments to Service Agents (securities dealers, financial institutions or other industry professionals) with respect to these services. The Distributor determines the amounts to be paid to Service Agents. During the period ended April 30, 2023, Class A, Class C and Class Z shares were charged $394,367, $11,232 and $271,218, respectively, pursuant to the Shareholder Services Plan.
The fund has arrangements with BNY Mellon Transfer, Inc., (the “Transfer Agent”) and The Bank of New York Mellon (the “Custodian”), both a subsidiary of BNY Mellon and an affiliate of the Adviser, whereby the fund may receive earnings credits when positive cash balances are maintained, which are used to offset Transfer Agent and Custodian fees. For financial reporting purposes, the fund includes transfer agent net earnings credits, if any, and custody net earnings credits, if any, as an expense offset in the Statement of Operations.
The fund compensates the Transfer Agent, under a transfer agency agreement, for providing transfer agency and cash management services for the fund. The majority of Transfer Agent fees are comprised of amounts paid on a per account basis, while cash management fees are related to fund subscriptions and redemptions. During the period ended April 30, 2023, the fund was charged $75,561 for transfer agency services. These fees are included in Shareholder servicing costs in the Statement of Operations. These fees were partially offset by earnings credits of $23,460.
42
The fund compensates the Custodian, under a custody agreement, for providing custodial services for the fund. These fees are determined based on net assets, geographic region and transaction activity. During the period ended April 30, 2023, the fund was charged $7,785 pursuant to the custody agreement. These fees were partially offset by earnings credits of $1,662.
The fund compensates the Custodian, under a shareholder redemption draft processing agreement, for providing certain services related to the fund’s check writing privilege. During the period ended April 30, 2023, the fund was charged $4,481 pursuant to the agreement, which is included in Shareholder servicing costs in the Statement of Operations.
During the period ended April 30, 2023, the fund was charged $15,519 for services performed by the fund’s Chief Compliance Officer and his staff. These fees are included in Chief Compliance Officer fees in the Statement of Operations.
The components of “Due to BNY Mellon Investment Adviser, Inc. and affiliates” in the Statement of Assets and Liabilities consist of: management fees of $142,480, Distribution Plan fees of $2,845, Shareholder Services Plan fees of $55,841, Custodian fees of $5,985, Chief Compliance Officer fees of $5,145 and Transfer Agent fees of $5,492.
(d) Each board member also serves as a board member of other funds in the BNY Mellon Family of Funds complex. Annual retainer fees and attendance fees are allocated to each fund based on net assets.
NOTE 4—Securities Transactions:
The aggregate amount of purchases and sales (including paydowns) of investment securities, excluding short-term securities, during the period ended April 30, 2023, amounted to $181,746,069 and $100,558,485, respectively.
At April 30, 2023, the cost of investments for federal income tax purposes was $489,423,928; accordingly, accumulated net unrealized depreciation on investments was $12,421,832, consisting of $3,953,600 gross unrealized appreciation and $16,375,432 gross unrealized depreciation.
43
REPORT OF INDEPENDENT REGISTERED PUBLIC ACCOUNTING FIRM
To the Shareholders and the Board of Trustees of BNY Mellon Opportunistic Municipal Securities Fund
Opinion on the Financial Statements
We have audited the accompanying statement of assets and liabilities of BNY Mellon Opportunistic Municipal Securities Fund (the “Fund”), including the statement of investments, as of April 30, 2023, and the related statement of operations for the year then ended, the statements of changes in net assets for each of the two years in the period then ended, the financial highlights for each of the five years in the period then ended and the related notes (collectively referred to as the “financial statements”). In our opinion, the financial statements present fairly, in all material respects, the financial position of the Fund at April 30, 2023, the results of its operations for the year then ended, the changes in its net assets for each of the two years in the period then ended and its financial highlights for each of the five years in the period then ended, in conformity with U.S. generally accepted accounting principles.
Basis for Opinion
These financial statements are the responsibility of the Fund’s management. Our responsibility is to express an opinion on the Fund’s financial statements based on our audits. We are a public accounting firm registered with the Public Company Accounting Oversight Board (United States) (“PCAOB”) and are required to be independent with respect to the Fund in accordance with the U.S. federal securities laws and the applicable rules and regulations of the Securities and Exchange Commission and the PCAOB.
We conducted our audits in accordance with the standards of the PCAOB. Those standards require that we plan and perform the audit to obtain reasonable assurance about whether the financial statements are free of material misstatement, whether due to error or fraud. The Fund is not required to have, nor were we engaged to perform, an audit of the Fund’s internal control over financial reporting. As part of our audits, we are required to obtain an understanding of internal control over financial reporting but not for the purpose of expressing an opinion on the effectiveness of the Fund’s internal control over financial reporting. Accordingly, we express no such opinion.
Our audits included performing procedures to assess the risks of material misstatement of the financial statements, whether due to error or fraud, and performing procedures that respond to those risks. Such procedures included examining, on a test basis, evidence regarding the amounts and disclosures in the financial statements. Our procedures included confirmation of securities owned as of April 30, 2023, by correspondence with the custodian, brokers and others; when replies were not received from brokers and others, we performed other auditing procedures. Our audits also included evaluating the accounting principles used and significant estimates made by management, as well as evaluating the overall presentation of the financial statements. We believe that our audits provide a reasonable basis for our opinion.

We have served as the auditor of one or more investment companies in the BNY Mellon Family of Funds since at least 1957, but we are unable to determine the specific year.
New York, New York
June 22, 2023
44
IMPORTANT TAX INFORMATION (Unaudited)
In accordance with federal tax law, the fund hereby reports all the dividends paid from net investment income during the fiscal year ended April 30, 2023 as “exempt-interest dividends” (not generally subject to regular federal income tax), except $42,484 that is being reported as an ordinary income distribution for reporting purposes. Where required by federal tax law rules, shareholders will receive notification of their portion of the Fund’s taxable ordinary dividends (if any), capital gains distributions (if any) and tax-exempt dividends paid for the 2023 calendar year on Form 1099-DIV which will be mailed in early 2024. The fund also hereby reports $.0293 per share as a long-term capital gain distribution and $.0009 per share as a short-term capital gain distribution paid on December 23, 2022.
45
BOARD MEMBERS INFORMATION (Unaudited)
Independent Board Members
Joseph S. DiMartino (79)
Chairman of the Board (1995)
Principal Occupation During Past 5 Years:
· Director or Trustee of funds in the BNY Mellon Family of Funds and certain other entities (as described in the fund’s Statement of Additional Information) (1995-Present)
Other Public Company Board Memberships During Past 5 Years:
· CBIZ, Inc., a public company providing professional business services, products and solutions, Director (1997-May 2023)
No. of Portfolios for which Board Member Serves: 88
———————
Francine J. Bovich (71)
Board Member (2012)
Principal Occupation During Past 5 Years:
· The Bradley Trusts, private trust funds, Trustee (2011-Present)
Other Public Company Board Memberships During Past 5 Years:
· Annaly Capital Management, Inc., a real estate investment trust, Director (2014-Present)
No. of Portfolios for which Board Member Serves: 49
———————
Peggy C. Davis (80)
Board Member (1990)
Principal Occupation During Past 5 Years:
· Shad Professor of Law, New York University School of Law (1983-present)
No. of Portfolios for which Board Member Serves: 29
———————
Nathan Leventhal (80)
Board Member (1989)
Principal Occupation During Past 5 Years:
· Lincoln Center for the Performing Arts, President Emeritus (2001-Present)
· Palm Beach Opera, President (2016-Present)
Other Public Company Board Memberships During Past 5 Years:
· Movado Group, Inc., a public company that designs, sources, markets and distributes watches Director (2003-2020)
No. of Portfolios for which Board Member Serves: 29
———————
46
Robin A. Melvin (59)
Board Member (2012)
Principal Occupation During Past 5 Years:
· Westover School, a private girls’ boarding school in Middlebury, Connecticut, Trustee (2019-Present)
· Mentor Illinois, a non-profit organization dedicated to increasing the quantity and quality of mentoring services in Illinois, Co-Chair (2014-2020); Board Member, Mentor Illinois (2013-2020)
· JDRF, a non-profit juvenile diabetes research foundation, Board Member (June 2021-June 2022)
Other Public Company Board Memberships During Past 5 Years:
· HPS Corporate Lending Fund, a closed-end management investment company regulated as a business development company, Trustee (August 2021-Present)
No. of Portfolios for which Board Member Serves: 68
———————
The address of the Board Members and Officers is c/o BNY Mellon Investment Adviser, Inc., 240 Greenwich Street, New York, New York 10286. Additional information about each Board Member is available in the fund’s Statement of Additional Information which can be obtained from the Adviser free of charge by calling this toll free number: 1-800-373-9387.
47
OFFICERS OF THE FUND (Unaudited)
DAVID DIPETRILLO, President since January 2021.
Vice President and Director of the Adviser since February 2021; Head of North America Product, BNY Mellon Investment Management since January 2018; and Director of Product Strategy, BNY Mellon Investment Management from January 2016 to December 2017. He is an officer of 53 investment companies (comprised of 103 portfolios) managed by the Adviser or an affiliate of the Adviser. He is 45 years old and has been an employee of BNY Mellon since 2005.
JAMES WINDELS, Treasurer since November 2001.
Director of the Adviser since February 2023; Vice President of the Adviser since September 2020; and Director–BNY Mellon Fund Administration. He is an officer of 54 investment companies (comprised of 123 portfolios) managed by the Adviser or an affiliate of the Adviser. He is 64 years old and has been an employee of the Adviser since April 1985.
PETER M. SULLIVAN, Chief Legal Officer since July 2021 and Vice President and Assistant Secretary since March 2019.
Chief Legal Officer of the Adviser and Associate General Counsel of BNY Mellon since July 2021; Senior Managing Counsel of BNY Mellon from December 2020 to July 2021; and Managing Counsel of BNY Mellon from March 2009 to December 2020. He is an officer of 54 investment companies (comprised of 123 portfolios) managed by the Adviser or an affiliate of the Adviser. He is 55 years old and has been an employee of BNY Mellon since April 2004.
JAMES BITETTO, Vice President since August 2005 and Secretary since February 2018.
Senior Managing Counsel of BNY Mellon since December 2019; Managing Counsel of BNY Mellon from April 2014 to December 2019; and Secretary of the Adviser. He is an officer of 54 investment companies (comprised of 123 portfolios) managed by the Adviser or an affiliate of the Adviser. He is 56 years old and has been an employee of the Adviser since December 1996.
DEIRDRE CUNNANE, Vice President and Assistant Secretary since March 2019.
Managing Counsel of BNY Mellon since December 2021, Counsel of BNY Mellon from August 2018 to December 2021; and Senior Regulatory Specialist at BNY Mellon Investment Management Services from February 2016 to August 2018. She is an officer of 54 investment companies (comprised of 123 portfolios) managed by the Adviser or an affiliate of the Adviser. She is 32 years old and has been an employee of the Adviser since August 2018.
SARAH S. KELLEHER, Vice President and Assistant Secretary since April 2014.
Vice President of BNY Mellon ETF Investment Adviser; LLC since February 2020; Senior Managing Counsel of BNY Mellon since September 2021; Managing Counsel of BNY Mellon from December 2017 to September 2021; and Senior Counsel of BNY Mellon from March 2013 to December 2017. She is an officer of 54 investment companies (comprised of 123 portfolios) managed by the Adviser or an affiliate of the Adviser. She is 47 years old and has been an employee of the Adviser since March 2013.
JEFF PRUSNOFSKY, Vice President and Assistant Secretary since August 2005.
Senior Managing Counsel of BNY Mellon. He is an officer of 54 investment companies (comprised of 123 portfolios) managed by the Adviser or an affiliate of the Adviser. He is 57 years old and has been an employee of the Adviser since October 1990.
AMANDA QUINN, Vice President and Assistant Secretary since March 2020.
Counsel of BNY Mellon since June 2019; Regulatory Administration Manager at BNY Mellon Investment Management Services from September 2018 to May 2019; and Senior Regulatory Specialist at BNY Mellon Investment Management Services from April 2015 to August 2018. She is an officer of 54 investment companies (comprised of 123 portfolios) managed by the Adviser or an affiliate of the Adviser. She is 38 years old and has been an employee of the Adviser since June 2019.
48
JOANNE SKERRETT, Vice President and Assistant Secretary since March 2023.
Counsel of BNY Mellon since June 2022; Senior Counsel with the Mutual Fund Directors Forum, a leading funds industry organization, from 2016 to June 2022. She is an officer of 54 investment companies (comprised of 123 portfolios) managed by the Adviser or an affiliate of the Adviser. She is 51 years old and has been an employee of the Adviser since June 2022.
NATALYA ZELENSKY, Vice President and Assistant Secretary since March 2017.
Chief Compliance Officer since August 2021 and Vice President since February 2020 of BNY Mellon ETF Investment Adviser, LLC; Chief Compliance Officer since August 2021 and Vice President and Assistant Secretary since February 2020 of BNY Mellon ETF Trust; Managing Counsel of BNY Mellon from December 2019 to August 2021; Counsel of BNY Mellon from May 2016 to December 2019; and Assistant Secretary of the Adviser from April 2018 to August 2021. She is an officer of 54 investment companies (comprised of 123 portfolios) managed by the Adviser or an affiliate of the Adviser. She is 37 years old and has been an employee of BNY Mellon since May 2016.
DANIEL GOLDSTEIN, Vice President since March 2022.
Head of Product Development of North America Distribution, BNY Mellon Investment Management since January 2018; Executive Vice President of North America Product, BNY Mellon Investment Management since April 2023, and Senior Vice President, Development & Oversight of North America Product, BNY Mellon Investment Management since 2010 to March 2023. He is an officer of 53 investment companies (comprised of 103 portfolios) managed by the Adviser or an affiliate of the Adviser. He is 53 years old and has been an employee of the Distributor since 1991.
JOSEPH MARTELLA, Vice President since March 2022.
Vice President since March 2022, Head of Product Management of North America Distribution, BNY Mellon Investment Management since January 2018; Executive Vice President of North America Product, BNY Mellon Investment Management since April 2023, and Senior Vice President of North America Product, BNY Mellon Investment Management since 2010 to March 2023. He is an officer of 53 investment companies (comprised of 103 portfolios) managed by the Adviser or an affiliate of the Adviser. He is 46 years old and has been an employee of the Distributor since 1999.
GAVIN C. REILLY, Assistant Treasurer since December 2005.
Tax Manager–BNY Mellon Fund Administration. He is an officer of 54 investment companies (comprised of 123 portfolios) managed by the Adviser or an affiliate of the Adviser. He is 54 years old and has been an employee of the Adviser since April 1991.
ROBERT SALVIOLO, Assistant Treasurer since July 2007.
Senior Accounting Manager–BNY Mellon Fund Administration. He is an officer of 54 investment companies (comprised of 123 portfolios) managed by the Adviser or an affiliate of the Adviser. He is 55 years old and has been an employee of the Adviser since June 1989.
ROBERT SVAGNA, Assistant Treasurer since August 2005.
Senior Accounting Manager–BNY Mellon Fund Administration. He is an officer of 54 investment companies (comprised of 123 portfolios) managed by the Adviser or an affiliate of the Adviser. He is 56 years old and has been an employee of the Adviser since November 1990.
JOSEPH W. CONNOLLY, Chief Compliance Officer since October 2004.
Chief Compliance Officer of the BNY Mellon Family of Funds and BNY Mellon Funds Trust since 2004; and Chief Compliance Officer of the Adviser from 2004 until June 2021. He is the Chief Compliance Officer of 53 investment companies (comprised of 108 portfolios) managed by the Adviser. He is 65 years old.
CARIDAD M. CAROSELLA, Anti-Money Laundering Compliance Officer since January 2016.
Anti-Money Laundering Compliance Officer of the BNY Mellon Family of Funds and BNY Mellon Funds Trust. She is an officer of 47 investment companies (comprised of 116 portfolios) managed by the Adviser or an affiliate of the Adviser. She is 54 years old and has been an employee of the Distributor since 1997.
49
BNY Mellon Opportunistic Municipal Securities Fund
240 Greenwich Street
New York, NY 10286
Adviser
BNY Mellon Investment Adviser, Inc.
240 Greenwich Street
New York, NY 10286
Sub-Adviser
Insight North America LLC
200 Park Avenue, 7th Floor
New York, NY 10166
Custodian
The Bank of New York Mellon
240 Greenwich Street
New York, NY 10286
Transfer Agent &
Dividend Disbursing Agent
BNY Mellon Transfer, Inc.
240 Greenwich Street
New York, NY 10286
Distributor
BNY Mellon Securities Corporation
240 Greenwich Street
New York, NY 10286
| | |
Ticker Symbols: | Class A: PTEBX Class C: DMBCX Class I: DMBVX Class Y: DMBYX Class Z: DMBZX |
Telephone Call your financial representative or 1-800-373-9387
Mail The BNY Mellon Family of Funds, 144 Glenn Curtiss Boulevard, Uniondale, NY 11556-0144
E-mail Send your request to info@bnymellon.com
Internet Information can be viewed online or downloaded at www.im.bnymellon.com
The fund files its complete schedule of portfolio holdings with the Securities and Exchange Commission (“SEC”) for the first and third quarters of each fiscal year on Form N-PORT. The fund’s Forms N-PORT are available on the SEC’s website at www.sec.gov.
A description of the policies and procedures that the fund uses to determine how to vote proxies relating to portfolio securities and information regarding how the fund voted these proxies for the most recent 12-month period ended June 30 is available at www.im.bnymellon.com and on the SEC’s website at www.sec.gov and without charge, upon request, by calling 1-800-373-9387.
| | |
© 2023 BNY Mellon Securities Corporation
0022AR0423 | 
|
Item 2. Code of Ethics.
The Registrant has adopted a code of ethics that applies to the Registrant's principal executive officer, principal financial officer, principal accounting officer or controller, or persons performing similar functions. There have been no amendments to, or waivers in connection with, the Code of Ethics during the period covered by this Report.
Item 3. Audit Committee Financial Expert.
The Registrant's Board has determined that Joseph S. DiMartino, a member of the Audit Committee of the Board, is an audit committee financial expert as defined by the Securities and Exchange Commission (the "SEC"). Mr. DiMartino is "independent" as defined by the SEC for purposes of audit committee financial expert determinations.
Item 4. Principal Accountant Fees and Services.
(a) Audit Fees. The aggregate fees billed for each of the last two fiscal years (the "Reporting Periods") for professional services rendered by the Registrant's principal accountant (the "Auditor") for the audit of the Registrant's annual financial statements or services that are normally provided by the Auditor in connection with the statutory and regulatory filings or engagements for the Reporting Periods, were $36,204 in 2022 and $36,928 in 2023.
(b) Audit-Related Fees. The aggregate fees billed in the Reporting Periods for assurance and related services by the Auditor that are reasonably related to the performance of the audit of the Registrant's financial statements and are not reported under paragraph (a) of this Item 4 were $14,550 in 2022 and $14,445 in 2023. These services consisted of one or more of the following: (i) agreed upon procedures related to compliance with Internal Revenue Code section 817(h), (ii) security counts required by Rule 17f-2 under the Investment Company Act of 1940, as amended, (iii) advisory services as to the accounting or disclosure treatment of Registrant transactions or events and (iv) advisory services to the accounting or disclosure treatment of the actual or potential impact to the Registrant of final or proposed rules, standards or interpretations by the Securities and Exchange Commission, the Financial Accounting Standards Boards or other regulatory or standard-setting bodies.
The aggregate fees billed in the Reporting Periods for non-audit assurance and related services by the Auditor to the Registrant's investment adviser (not including any sub-investment adviser whose role is primarily portfolio management and is subcontracted with or overseen by another investment adviser), and any entity controlling, controlled by or under common control with the investment adviser that provides ongoing services to the Registrant ("Service Affiliates"), that were reasonably related to the performance of the annual audit of the Service Affiliate, which required pre-approval by the Audit Committee were $0 in 2022 and $0 in 2023.
(c) Tax Fees. The aggregate fees billed in the Reporting Periods for professional services rendered by the Auditor for tax compliance, tax advice, and tax planning ("Tax Services") were $3,342 in 2022 and $3,342 in 2023. These services consisted of: (i) review or preparation of U.S. federal, state, local and excise tax returns; (ii) U.S. federal, state and local tax planning, advice and assistance regarding statutory, regulatory or administrative developments; (iii) tax advice regarding tax qualification matters and/or treatment of various financial instruments held or proposed to be acquired or held, and (iv) determination of Passive Foreign Investment Companies. The aggregate fees billed in the Reporting Periods for Tax Services by the Auditor to Service Affiliates, which required pre-approval by the Audit Committee were $8,158 in 2022 and $8,158 in 2023.
(d) All Other Fees. The aggregate fees billed in the Reporting Periods for products and services provided by the Auditor, other than the services reported in paragraphs (a) through (c) of this Item, were $1,352 in 2022 and $1,349 in 2023. These services consisted of a review of the Registrant's anti-money laundering program.
The aggregate fees billed in the Reporting Periods for Non-Audit Services by the Auditor to Service Affiliates, other than the services reported in paragraphs (b) through (c) of this Item, which required pre-approval by the Audit Committee, were $0 in 2022 and $0 in 2023.
(e)(1) Audit Committee Pre-Approval Policies and Procedures. The Registrant's Audit Committee has established policies and procedures (the "Policy") for pre-approval (within specified fee limits) of the Auditor's engagements for non-audit services to the Registrant and Service Affiliates without specific case-by-case consideration. The pre-approved services in the Policy can include pre-approved audit services, pre-approved audit-related services, pre-approved tax services and pre-approved all other services. Pre-approval considerations include whether the proposed services are compatible with maintaining the Auditor's independence. Pre-approvals pursuant to the Policy are considered annually.
(e)(2) Note. None of the services described in paragraphs (b) through (d) of this Item 4 were approved by the Audit Committee pursuant to paragraph (c)(7)(i)(C) of Rule 2-01 of Regulation S-X.
(f) None of the hours expended on the principal accountant's engagement to audit the registrant's financial statements for the most recent fiscal year were attributed to work performed by persons other than the principal accountant's full-time, permanent employees.
Non-Audit Fees. The aggregate non-audit fees billed by the Auditor for services rendered to the Registrant, and rendered to Service Affiliates, for the Reporting Periods were $2,423,621 in 2022 and $1,706,473 in 2023.
Auditor Independence. The Registrant's Audit Committee has considered whether the provision of non-audit services that were rendered to Service Affiliates, which were not pre-approved (not requiring pre-approval), is compatible with maintaining the Auditor's independence.
(j) Not applicable.
Item 5. Audit Committee of Listed Registrants.
Not applicable.
Item 6. Investments.
(a) Not applicable.
| Item 7. | Disclosure of Proxy Voting Policies and Procedures for Closed-End Management Investment Companies. |
Not applicable.
Item 8. Portfolio Managers of Closed-End Management Investment Companies.
Not applicable.
| Item 9. | Purchases of Equity Securities by Closed-End Management Investment Companies and Affiliated Purchasers. |
Not applicable.
| Item 10. | Submission of Matters to a Vote of Security Holders. |
There have been no material changes to the procedures applicable to Item 10.
| Item 11. | Controls and Procedures. |
(a) The Registrant's principal executive and principal financial officers have concluded, based on their evaluation of the Registrant's disclosure controls and procedures as of a date within 90 days of the filing date of this report, that the Registrant's disclosure controls and procedures are reasonably designed to ensure that information required to be disclosed by the Registrant on Form N-CSR is recorded, processed, summarized and reported within the required time periods and that information required to be disclosed by the Registrant in the reports that it files or submits on Form N-CSR is accumulated and communicated to the Registrant's management, including its principal executive and principal financial officers, as appropriate to allow timely decisions regarding required disclosure.
(b) There were no changes to the Registrant's internal control over financial reporting that occurred during the period covered by this report that have materially affected, or are reasonably likely to materially affect, the Registrant's internal control over financial reporting.
| Item 12. | Disclosure of Securities Lending Activities for Closed-End Management Investment Companies. |
Not applicable.
(a)(1) Code of ethics referred to in Item 2.
(a)(2) Certifications of principal executive and principal financial officers as required by Rule 30a-2(a) under the Investment Company Act of 1940.
(a)(3) Not applicable.
(b) Certification of principal executive and principal financial officers as required by Rule 30a-2(b) under the Investment Company Act of 1940.
SIGNATURES
Pursuant to the requirements of the Securities Exchange Act of 1934 and the Investment Company Act of 1940, the Registrant has duly caused this Report to be signed on its behalf by the undersigned, thereunto duly authorized.
BNY Mellon Opportunistic Municipal Securities Fund
By: /s/ David J. DiPetrillo
David J. DiPetrillo
President (Principal Executive Officer)
Date: June 22, 2023
Pursuant to the requirements of the Securities Exchange Act of 1934 and the Investment Company Act of 1940, this Report has been signed below by the following persons on behalf of the Registrant and in the capacities and on the dates indicated.
By: /s/ David J. DiPetrillo
David J. DiPetrillo
President (Principal Executive Officer)
Date: June 22, 2023
By: /s/ James Windels
James Windels
Treasurer (Principal Financial Officer)
Date: June 21, 2023
EXHIBIT INDEX
(a)(1) Code of ethics referred to in Item 2.
(a)(2) Certifications of principal executive and principal financial officers as required by Rule 30a-2(a) under the Investment Company Act of 1940. (EX-99.CERT)
(b) Certification of principal executive and principal financial officers as required by Rule 30a-2(b) under the Investment Company Act of 1940. (EX-99.906CERT)
