UNITED STATES
SECURITIES AND EXCHANGE COMMISSION
Washington, D.C. 20549
FORM N-CSR
CERTIFIED SHAREHOLDER REPORT OF REGISTERED
MANAGEMENT INVESTMENT COMPANIES
Investment Company Act file Number: 811-04767
EAGLE GROWTH & INCOME FUND
(Exact name of Registrant as Specified in Charter)
880 Carillon Parkway
St. Petersburg, FL 33716
(Address of Principal Executive Office) (Zip Code)
Registrant’s Telephone Number, including Area Code: (727) 567-8143
RICHARD J. ROSSI, PRESIDENT
880 Carillon Parkway
St. Petersburg, FL 33716
(Name and Address of Agent for Service)
Copy to:
FRANCINE J. ROSENBERGER, ESQ.
K & L Gates LLP
1601 K Street, NW
Washington, D.C. 20006
Date of fiscal year end: October 31
Date of reporting period: April 30, 2010
| Item 1. | Reports to Shareholders |

| | | | |
| Semiannual Report | | | | |
| | |
| and Investment Performance Review for the | | | | |
| six-month period ended April 30, 2010 (unaudited) | | | | |
| | |
| Eagle Capital Appreciation Fund | | | | |
| | |
| Eagle Growth & Income Fund | | | | |
| | |
| Eagle International Equity Fund | | | | |
| | |
| Eagle Investment Grade Bond Fund | | | | |
| | |
| Eagle Large Cap Core Fund | | | | |
| | |
| Eagle Mid Cap Growth Fund | | | | |
| | |
| Eagle Mid Cap Stock Fund | | | | |
| | |
| Eagle Small Cap Core Value Fund | | | | |
| | |
| Eagle Small Cap Growth Fund | | | | |
| |
 | | |

| | | | | | | | |
| Go Paperless with eDelivery | | visit eagleasset.com/eDelivery | | For more information, see inside. | | | | |
Table of Contents

Visit eagleasset.com/eDelivery to receive shareholder communications including prospectuses and fund reports with a service that helps protect the environment:
Environmentally friendly. Go green with eDelivery by reducing the number of trees used to produce paper.
Efficient. Stop waiting on regular mail. Your documents will be sent via email as soon as they are available.
Easy. Download and save files using your home computer with a few clicks of a mouse.
President’s Letter
Dear Fellow Shareholders:
I am pleased to present the semiannual report and investment performance review of the Eagle Family of Funds for the six months ended April 30, 2010 (the “reporting period”).
Major U.S. stock indexes posted solid gains during the reporting period, extending the rally that began in early March 2009, as investors were encouraged by low inflation, strong earnings, and low interest rates. Some positive economic indicators, along with the strength in corporate America, had led to long-term optimism, even amid near-term caution and volatility.
Internationally, most markets posted solid returns reflecting some signs of improvement in the economic environment. Emerging markets outpaced developed markets, with the notable exception of China, which barely remained in positive territory. The debt crisis in Greece and Portugal has created uncertainty in domestic and foreign markets. There is concern that the problems in Greece and Portugal may spread to other European countries with similar fiscal positions.
In the commentaries that follow, each fund’s portfolio managers discuss the specific performance in their funds. While performance during the reporting period was encouraging and positive signs of economic growth are present, it bears remembering that markets can be quite volatile. Recoveries are seldom in a straight line and investors can expect challenges along the way as the year unfolds.
Market corrections and movement can create opportunities for long-term, fundamental stock picking over time.
I would like to remind you that investing in any mutual fund carries certain risks. The principal risk factors for each fund are described at the end of this report. Carefully consider the investment objectives, charges and expenses of any fund before you invest. Contact us at 800.421.4184 or eagleasset.com or your financial advisor for a prospectus, which contains this and other important information about the Eagle Family of Funds. Our website also has timely information about the Funds, including performance and portfolio holdings.
Finally, on March 12, 2010, I was appointed president of the Funds by their Boards of Trustees. I have been with Eagle Asset Management, Inc., the Funds’ investment adviser, since 2000 and assumed the role of president and co-chief operating officer last year. I am grateful for your continued support and confidence in the Eagle Family of Funds.
Sincerely,

Richard J. Rossi
President
June 15, 2010
| | |
| Performance Summary and Commentary |
| Eagle Capital Appreciation Fund | | |
Meet the managers | Steven M. Barry and David G. Shell, CFA®, are Chief Investment Officers and Senior Portfolio Managers at Goldman Sachs Asset Management L.P. and have been responsible for the day-to-day management of the Eagle Capital Appreciation Fund (the “Fund”) since 2002. Mr. Shell and Mr. Barry have been affiliated with the Fund since 1987 and 1999, respectively. Both Portfolio Managers have more than 20 years of investment experience.
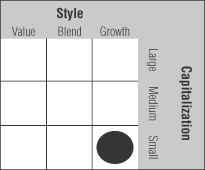
Investment highlights | The Fund invests primarily in common stocks. The Fund’s portfolio management team believes that wealth is created through the long-term ownership of a growing business. They take a “bottom-up” approach to investing based on in-depth, fundamental research. A bottom-up method of analysis emphasizes the outlook at the company and industry level versus reliance on the general economy and/or market trends. The portfolio managers use an intensive research process and each company is analyzed as if they were going to own and operate that company indefinitely. Key characteristics of the companies in which the Fund currently seeks to invest may include: dominant market share, established brand name, pricing power, recurring revenue stream, free cash flow, high returns on invested capital, predictable growth, sustainable growth, long product life cycle, enduring competitive advantage, favorable demographic trends and excellent management.
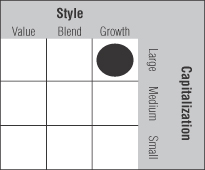
This Morningstar Style Box™ shows the Fund’s investment style and size of companies held in the Fund.
© Copyright 2010 Morningstar, Inc. All Rights Reserved. The information contained herein: (1) is proprietary to Morningstar and/or its content providers; (2) may not be copied or distributed; and (3) is not warranted to be accurate, complete or timely. Neither Morningstar nor its content providers are responsible for any damages or losses arising from any use of this information.
Performance summary | The Fund’s Class A shares returned 14.22% (excluding front-end sales charges) during the six-month period ended April 30, 2010, underperforming its benchmark index, the Russell 1000® Growth Index, which returned 15.79%. The Russell 1000® Growth Index measures
performance of those Russell 1000® companies with higher price-to-book ratios and higher forecasted growth values and is representative of U.S. securities exhibiting growth characteristics. Please keep in mind that an index is not available for direct investment; therefore, its performance does not reflect the expenses associated with the active management of an actual portfolio.
Performance data represented is historical and does not guarantee future results. The investment return and principal value of an investment will fluctuate, and you may have a gain or loss when you sell shares. Current performance may be higher or lower than the performance data quoted. To obtain more current performance data as of the most recent month-end, please visit our website at eagleasset.com.
Performance discussion | The Fund delivered strong absolute performance during the six-month reporting period. The Fund’s top performing sectors were consumer discretionary and financials. While all market sectors posted positive returns, the Fund’s weakest returns were in the materials, consumer staples and health care sectors.
The Fund trailed its benchmark, the Russell 1000® Growth Index, during the period. The Fund had a significant underweight in the top performing industrials sector, while weakness in selected health care stocks detracted from performance. On the positive side, stock selection in the information technology sector and an overweight position in the strong telecommunications sector contributed to results.
Under performers | Pharmaceutical manufacturer Baxter International, Inc. detracted from performance. Shares of Baxter fell after the company trimmed its guidance for 2010 due to a weaker outlook for its bioscience (blood plasma) business. Competition in the blood plasma market has increased, making it more difficult for Baxter to price its products at a premium. While we expect uncertainty in the plasma business to remain an overhang in the near-term, we continue to hold the stock in the Fund as we believe the company trades at an attractive valuation due to its robust product pipeline and its market leading franchise.
Retailer Staples, Inc. traded down after the company reported fourth quarter earnings and provided full year 2010 guidance that disappointed investors. In our view, the company is making investments in new business and processes that should strengthen its brand and position it for growth over the long-term. The Fund still owns the stock.
| | |
| Performance Summary and Commentary |
| Eagle Capital Appreciation Fund (cont’d) | | |
Financial holding company Morgan Stanley detracted from performance during the period and we exited our position. While we continue to like the business for its diverse product offering and strong balance sheet, we have greater conviction in Northern Trust. Consequently, we decided to exit our position in Morgan Stanley to initiate a position in Northern Trust, which we believe offers greater upside potential over the next three to five years.
Suncor Energy Inc., an oil exploration firm, detracted from performance and we exited our position. Suncor has had some operational issues in the past several months and we now have lower confidence it will be able to meet its production guidance. While we continue to like Suncor longer term, we believe there are more attractive investment opportunities in the energy space.
Gilead Sciences Inc., a biopharmaceuticals company, detracted from performance as uncertainty around health care reform weighed on the stock. We continue to have conviction in the company as we believe it is well positioned within the biotechnology industry, holding dominant market share in several niche areas. Specifically, Gilead produces the most commonly used treatments for HIV/AIDS and is continually developing improved antiretroviral therapies to maintain its advantage. We continue to hold the stock in the Fund.
Top performers | Wireless tower company Crown Castle International Corporation contributed to performance after reporting positive earnings. Shares rose after one of their major customers, Clearwire, made a significant investment to further build out its new wireless network. As the wireless space continues to expand, we believe that our wireless tower businesses are well positioned given their dominant market share in an industry with high barriers to entry. The Fund continues to hold the stock.
Apple Inc. contributed to performance after posting second quarter earnings that were significantly ahead of consensus. The strong results were driven by record iPhone sales of nearly 9 million units, a 131% jump from the second quarter last year. We continue to hold the stock in the Fund as we have conviction in Apple’s expanding product lineup, including the recent introduction of the iPad, and believe the stock is attractively valued.
CB Richard Ellis Group, Inc., the world’s leading commercial real estate services firm, contributed to performance after reporting fourth quarter results that exceeded expectations. Sales and leasing revenues increased year-over-year and margins showed significant improvement driven by well executed cost cutting efforts. Furthermore, the company’s management team expressed increasing optimism that the real estate markets are nearing an inflection point. While the timing of a recovery remains uncertain, we believe CB Richard Ellis is well positioned to take market share and generate significant operating leverage. We continue to hold the stock in the Fund.
Broadcom Corporation, a global leader in semiconductors for wired and wireless communications, contributed to performance. Shares rose after the company reported better than expected fourth quarter earnings and issued positive first quarter sales guidance. We continue to maintain our long-term conviction in the name and hold the stock in the Fund as we believe that Broadcom is well positioned to gain market share from its peers due to its strong portfolio of multi integrated semiconductor chips.
Software company Oracle Corporation contributed to performance after reporting strong quarterly results and providing an encouraging outlook. The company’s software license revenues and product support revenues were above expectation as demand has improved. We believe that the acquisition of Sun Microsystems should complement Oracle’s product portfolio and strengthen its long-term industry position. The Fund continues to own the stock.
| | |
| Performance Summary and Commentary |
| Eagle Growth & Income Fund | | |
Meet the managers | William V. Fries, CFA®, Managing Director, and Cliff Remily, CFA®, of Thornburg Investment Management, Inc. are Co-Portfolio Managers of the Eagle Growth & Income Fund (the “Fund”). Mr. Fries has more than 40 years of investment experience and has been Portfolio Manager/Co-Portfolio Manager since 2001. Mr. Remily was named Co-Portfolio Manager in January 2009 and has more than 10 years of industry experience.
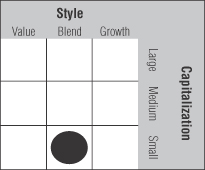
Investment highlights | The Fund invests primarily in domestic equity securities (primarily common stocks). The Fund’s portfolio managers look for promising investments that can be purchased at a discount to their estimate of each investment’s intrinsic value. They seek investments that deliver a competitive total return over normal investment time horizons. Holdings are classified in three categories: basic value, consistent earners and emerging franchises as a means of structuring diversification. Dividends and dividend growth are a consideration in stock selection and may include stocks outside the traditional dividend paying areas.
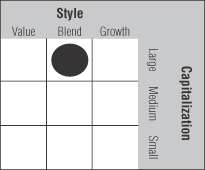
This Morningstar Style Box™ shows the Fund’s investment style and size of companies held in the Fund.
Performance summary | The Fund’s Class A shares returned 10.78% (excluding front-end sales charges) during the six-month period ended April 30, 2010, underperforming the Fund’s benchmark index, which returned 15.66% during the same period. The Fund’s benchmark index, the Standard & Poor’s 500 Composite Stock Index (“S&P 500 Index”), is an unmanaged index of 500 U.S. stocks and gives a broad look at how stock prices have performed. Please keep in mind that an index is not available for direct investment; therefore, its performance does not reflect the expenses associated with the active management of an actual portfolio.
Performance data represented is historical and does not guarantee future results. The investment return and principal value of an investment will fluctuate, and you may have a gain or loss when you sell shares. Current performance may be higher or lower than the performance data quoted. To obtain more current performance data as of the most recent month-end, please visit our website at eagleasset.com.
Performance discussion | On an absolute basis, the Fund posted strong returns during the reporting period. We believe the actions taken during and since the downturn of 2008 and early 2009 solidly positioned the portfolio for the current market. All market sectors posted positive returns for the reporting period, with the financials, information technology, and consumer discretionary sectors making the greatest contributions to the Fund’s total return. The Fund’s investments in the telecommunication services, energy and utilities sectors lagged the Fund as a whole.
The Fund’s exposure to fixed-income was dramatically reduced over the reporting period from 13% to roughly 1.5% as many of the holdings approached price targets. The decision to invest in bonds was opportunistic given the market conditions in 2009. In general, we continued to see strong price appreciation in our bond portfolios and made the transition away from fixed income back into more attractive equities that are uncovered through our fundamental, bottom-up research process.
The Fund underperformed its benchmark index, the S&P 500 Index, during the reporting period. Relative to the benchmark, the Fund benefited from an overweight allocation to the financials sector, particularly with banking stocks. Detracting from relative performance were the telecommunication services, industrials, consumer discretionary and healthcare sectors. The telecommunication services sector was the weakest performing sector and the Fund had negative stock selection coupled with a significant overweight position. In industrials, the Fund’s material underweight position damped the effect of strong stock selection. In consumer discretionary, an underweight position and stock selection detracted from relative performance. Finally, in healthcare, negative stock selection hurt performance relative to the benchmark.
| | |
| Performance Summary and Commentary |
| Eagle Growth & Income Fund (cont’d) | | |
Because we have the flexibility to vary widely from benchmark sector weights, the relative size of our investments in a sector can often cause short-term over- or under-performance. However, we believe that, over the long-term, our bottom-up approach and basket diversification allow individual stock picking to be a more important driver of performance than sector allocation.
Under performers | Shares of Telefonica SA, a telecommunication services provider in Europe and Latin America, declined due to concerns over the European debt crisis as well as a growing perception the firm has a maturing revenue stream in an increasingly competitive market. In Europe, sovereign debt issues continue to arise as Greece looks to refinance its debt commitments and investors grow increasingly concerned about fiscal deficits in Italy, Spain, and other European countries. The Fund continues to hold the stock.
AXA SA has three main businesses, annuity and life insurance, property and casualty insurance and asset management. The annuity business, which is core to our investment thesis, is in recovery mode on the strength of newly configured products. The other segments have improved but are still not contributing to their potential, as the property & casualty business needs firmer pricing to return to its former profit levels and asset management continues to experience net outflows, albeit at a declining rate. Financial turmoil in Europe related to Greece, potential austerity measures in a number of countries and the company’s investment exposure (manageable but a meaningful percent of tangible equity capital), hangs over the stock as investors evaluate solvency and capital strength of financial institutions. We continue to hold the stock in the Fund as we believe the valuation imbeds most of the negatives and little of the potential.
Drug manufacturer Actelion Pharmaceuticals Ltd. announced disappointing results in a trial for their existing drug Tracleer in a new indication (Idiopathic Pulmonary Fibrosis). While positive results in this trial would have been great news, we continue to believe that the company looks reasonably valued on its currently approved products and has a number of very exciting new treatments in its pipeline. We continue to hold the stock in the Fund.
Weak natural gas prices have had a negative impact on energy producer ENI SpA. However, we believe the company is well
positioned to maintain its attractive dividend and grow its earnings power over the longer term. As such, the Fund continues to hold the stock.
Brazilian stock exchange BM&F Bovespa S.A. has seen its equity trading business recover from last year’s lows, but improvement in the derivatives business up until this most recent quarter has been sluggish. Additionally, general macro concerns have arisen over the Brazilian government’s attempts to restrict the inflow of foreign capital, the possibility of further interest rate increases in Brazil, and the impact to financial service stocks from recent turmoil in Europe. The Fund continues to own the stock.
Top performers | Fifth Third Bancorp, a diversified financial services holding company, increased in value as the company’s balance sheet continued to heal and fears surrounding the company’s ability to manage their leverage subsided. The Fund continues to hold the stock.
Aircraft manufacturer Boeing Company successfully tested its 787 Dreamliner aircraft during the period. The 787 represents a tremendous future revenue and earnings opportunity for Boeing, and successful progress of this program, as well as the strengthening global economy, rewarded shareholders smartly during the period. The Fund continues to hold the stock.
Telecommunication services provider Comcast Corporation performed well during the period. Recently, the Federal Communications Commission announced that the regulatory regime surrounding broadband internet access may change. While the FCC claims they will not regulate pricing in the industry under the new regime, investors are skeptical. We continue to hold the stock in the Fund.
Baidu, Inc. is the leader in Chinese language internet search. It saw its share price increase as the company’s largest competitor, Google, announced plans to exit the Chinese internet advertising business. The Fund continues to own the stock.
Software provider Amdocs Ltd. announced very strong earnings in the December quarter which helped drive price appreciation. Not only did the firm outperform expectations on the top and bottom line, but they issued very strong guidance indicating a return to growth for the company. The Fund continues to hold the stock.
| | |
| Performance Summary and Commentary |
| Eagle International Equity Fund | | |
Meet the managers | Richard C. Pell is Chief Executive Officer at Artio Global Investors Inc. and Chief Investment Officer at its affiliate, Artio Global Management LLC (“Artio Global”). Rudolph-Riad Younes, CFA®, is Head of International Equities at Artio Global. Messrs. Pell and Younes have managed the Eagle International Equity Fund (the “Fund”) since 2002.
Investment highlights | The Fund invests primarily in foreign equity securities. The Fund’s portfolio managers seek investment opportunities within the developed and emerging markets. In the developed markets, a “bottom-up” approach is adopted. A bottom-up method of analysis emphasizes the outlook at the company and industry level versus reliance on the general economy and/or market trends. In the emerging markets, a “top-down” assessment consisting of currency/interest rate risks, political environments/leadership assessment, growth rates, structural reforms and risk (liquidity) is applied. A top-down method of analysis emphasizes the significance of economy and market cycles. In Japan, given the highly segmented nature of this market comprised of both strong global competitors and protected domestic industries, a hybrid approach encompassing both bottom-up and top-down analyses is conducted.
This Morningstar Style Box™ shows the Fund’s investment style and size of companies held in the Fund.
Performance summary | The Fund’s Class A shares returned 4.76% (excluding front-end sales charges) during the six-month period ended April 30, 2010, underperforming the Fund’s benchmark index, which returned 5.76% during the same period. The Fund’s benchmark index, the Morgan Stanley Capital International® All Country World Index ex-US (“MSCI® ACWI ex- US”), is a free float-adjusted market capitalization index that is designed to measure equity market performance in the global developed and emerging markets. Please keep in mind that an index is not available for direct investment; therefore, its performance does not reflect the expenses associated with the active management of an actual portfolio.
Performance data represented is historical and does not guarantee future results. The investment return and principal value of an investment will fluctuate, and you may have a gain or loss when you sell shares. Current performance may be higher or lower than the performance data quoted. To obtain more current performance data as of the most recent month-end, please visit our website at eagleasset.com.
Performance discussion | For the reporting period, the Fund lagged behind its benchmark. Stock selection in emerging markets detracted as did the Fund’s underweight to and stock selection in Japan, while UK stock selection was positive. Within Continental Europe, the decision to underweight banks in Spain and Greece was positive. Additionally, the decision to hedge a portion of the Fund’s Euro exposure back to the US dollar contributed to results.
Stock selection in China and South Korea detracted from relative performance. In particular, China Construction Bank Corp and Industrial & Commercial Bank of China Ltd underperformed. However, positions held in India outperformed the benchmark, particularly ICICI Bank Ltd, iShares MSCI India Index Fund, Tata Motors Ltd and HDFC Bank Ltd. Within Central and Eastern Europe, the Ukraine, Russia and Hungary positively contributed to performance, including positions in Ukraine Social Bank (Ukraine) and OTP Bank (Hungary).
From a sector perspective, information technology underperformed the benchmark, due primarily to two positions in Taiwan. Weakness in Gazprom ADS and Lukoil ADS (Russia) as well as OMV AG (Austria) contributed to absolute and relative underperformance in the energy sector. On a positive note, companies held within materials outperformed, including Rio Tinto Ltd (Australia), Rio Tinto PLC and Xstrata PLC (UK) as well as Norilsk Nickel (Russia). Within financials, positions held in Lloyds Banking Group PLC and HSBC Holdings PLC (UK) had a positive effect; however, the Fund’s positions in Mediobanca Banca di Credito Finanziario and Unicredito Italiano (Italy) and BNP Paribas (France) underperformed. Finally, within consumer staples, shares of Imperial Tobacco Group PLC and Reckitt Benckiser Group PLC underperformed.
The core European markets, particularly those highly leveraged to global trade, (particularly Germany, France and the Netherlands) are running lower deficits and are in better structural positions than their southern neighbors, the epicenter of the turmoil. We have taken several defensive measures within the Fund in light of the sovereign debt debacle. We find ourselves once again in an environment where macro factors are driving markets, and the solutions lie in government and
| | |
| Performance Summary and Commentary |
| Eagle International Equity Fund (cont’d) | | |
central bank policy changes. We hold no positions in the banks or insurers within Portugal, Ireland, Greece and Spain and are underweight financials globally versus the benchmark. We have reduced our exposure to materials and other cyclical companies, although we have directed some of the proceeds toward gold mining companies as well as small positions in gold exchange-traded funds (ETFs). On the currency front, we have a hedge against Euro weakness and have hedges in place against weakening emerging European currencies and those of some small developed European currencies. We are favoring globally-oriented or export-focused firms as well as defensive growth companies with strong brands, especially those that have exposure to the growth potential of emerging markets. This currently includes the consumer staples sector and pharmaceutical industry. We also are focused on European capital goods and industrial companies including airports, cement and those involved in trucking, logistics and electrical
equipment. Finally, the Fund is overweight in Central and Eastern European markets, including Russia.
The Fund is underweight to Japan because of demographic, debt and political issues. Within emerging Asia, we found several technology companies attractive, including several in Taiwan and South Korea, as the region continues to achieve global dominance in an industry that we believe would benefit from the global capital expenditure cycle. Within India, the Fund’s holdings are in companies leveraged to the long-term infrastructure build-out, with particular focus on steel, engineering and cement companies as well as private sector banks. In China, we are avoiding the banking sector, given an overheated real estate market. Instead, the Fund’s holdings are focused on the domestic consumer, amid structural changes in China toward a more consumption-driven economy.
| | |
| Performance Summary and Commentary |
| Eagle Investment Grade Bond Fund |
Meet the managers | James C. Camp, CFA®, a Managing Director at Eagle Asset Management (“Eagle”) and Joseph Jackson, CFA®, have been Co-Portfolio Managers of the Eagle Investment Grade Bond Fund (the “Fund”) since its inception on March 1, 2010, and are jointly responsible for the day-to-day management of the Fund’s investment portfolio.
Investment highlights | The Fund invests primarily in investment grade fixed income securities. Investment grade is defined as securities rated [BBB-] or better by Standard & Poor’s Rating Services or an equivalent rating by at least one other nationally recognized statistical rating organization or, for unrated securities, those that are determined to be of equivalent quality by the Fund’s portfolio manager. The average portfolio duration of the Fund is expected to vary and may generally range anywhere from two to seven years based upon economic and market conditions. The Fund expects to invest in a variety of fixed income securities including, but not limited to corporate debt securities of U.S. and non-U.S. issuers, including corporate commercial paper; bank certificates of deposit; debt securities issued by states or local governments and their agencies; obligations of non-U.S. Governments and their subdivisions, agencies and government sponsored enterprises; obligations of international agencies or supranational entities (such as the European Union); obligations issued or guaranteed by the U.S. Government and its agencies; mortgage-backed securities and asset-backed securities; commercial real estate securities; and floating rate instruments.
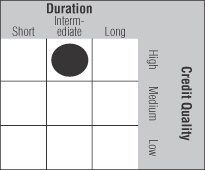
This Morningstar Style Box™ shows the credit quality and the duration of the Fund’s investments.
Performance summary | The Fund’s Class A shares returned 0.70% (excluding front-end sales charges) from March 1, 2010 (commencement of operations) to April 30, 2010, outperforming its benchmark index, which returned 0.58% during the same period. The Fund’s benchmark index, the Barclays Intermediate Government/Credit Bond Index, includes U.S. government and investment grade credit securities that
have a greater than or equal to one year and less than ten years remaining to maturity and have $250 million or more of outstanding face value. Please keep in mind that an index is not available for direct investment; therefore, its performance does not reflect the expenses associated with the active management of an actual portfolio.
Performance data represented is historical and does not guarantee future results. The investment return and principal value of an investment will fluctuate, and you may have a gain or loss when you sell shares. Current performance may be higher or lower than the performance data quoted. To obtain more current performance data as of the most recent month-end, please visit our website at eagleasset.com.
Performance discussion | The Fund commenced operations on March 1, 2010. During the two months of operations covered by the reporting period, there was a high level of bond issuance and liquidity in the marketplace. This allowed us to invest the Fund’s assets quickly and efficiently. Further, since the Fund was in the start-up phase, there was low turnover during the period.
On an absolute basis, the Fund’s corporate bond holdings led performance during the period. In particular, holdings in the industrials sector outpaced those in the financials and utilities sectors. Due to falling interest rates, longer duration bonds outperformed those with shorter maturities.
For the reporting period, the Fund outperformed its benchmark index. The biggest contributor to relative performance was that the Fund maintained a longer average duration in its Treasury holdings than the benchmark while interest rates fell during the reporting period. In particular, the Fund’s overweight and longer duration positions in industrials and utilities contributed to performance. The Fund also benefited from its holdings in commercial mortgage backed securities (CMBS), which outperformed the benchmark. Detracting from relative performance was the Fund’s underweight and underperforming holdings in financials.
Top performers | Pharmaceutical manufacturers Pfizer, Inc. and Amgen, Inc. were both strong performers during the period. The passage of the healthcare bill was viewed by the market as a positive for the future earnings potential of these firms. The Fund continues to hold these bonds.
Barrick Gold Corporation, a mining company, performed well due to the high price of gold during the reporting period. The Fund continues to hold the bond.
| | |
| Performance Summary and Commentary |
| Eagle Investment Grade Bond Fund (cont’d) |
The Fund’s U.S. Treasury Note maturing in 2017 helped Fund performance as longer duration Treasuries rallied during the period. The Fund continues to hold the bond.
The Fund’s holding in Ginnie Mae was also a top performer because we were able to buy the security at a favorable price. We continue to hold the bond in the Fund.
Under performers | The Fund’s position in software firm CA, Inc. lagged on rumors that the firm is a buyout target. The Fund continues to hold the position.
Telecommunications firm Verizon Communications, Inc. trailed the market as it is a short duration holding in a low risk firm. The broad market rally favored longer duration bonds of higher
risk. The Fund sold this bond, maturing in 2012, and purchased a longer duration Verizon issue maturing in 2019.
Investment bank Goldman Sachs Group, Inc. declined following the announcement of SEC fraud charges in connection with a 2007 synthetic sub-prime mortgage derivative deal. The Fund continues to own the bond.
A Fannie Mae 2006 series bond, maturing in 2033, hurt performance as a significant number of loans were bought back by the company at a discount. The Fund still owns the bond.
The Fund’s U.S. Treasury Note maturing in 2013 hurt performance as short duration Treasuries performed poorly in March and April. We continue to own the bond in the Fund.
| | |
| Performance Summary and Commentary |
| Eagle Large Cap Core Fund | | |
Meet the managers | Richard Skeppstrom, John “Jay” Jordan, CFA®, Craig Dauer, CFA®, and Robert Marshall at Eagle Asset Management, Inc. (“Eagle”) have been Co-Portfolio Managers of the Eagle Large Cap Core Fund (the “Fund”) since its inception in 2005. Mr. Skeppstrom is a Managing Director at Eagle and has 19 years of investment experience. Mr. Jordan, Mr. Dauer and Mr. Marshall have 19,16 and 23 years of investment experience, respectively.
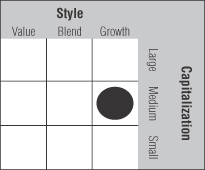
Investment highlights | The Fund invests primarily in common stocks. When identifying investments for the Fund, the portfolio managers use a “bottom-up” research process that is combined with a proprietary relative-valuation discipline. A bottom-up method of analysis emphasizes the outlook at the company and industry level versus reliance on the general economy and/or market trends. In general, the portfolio managers seek to select securities, that, at the time of purchase, have above-average expected returns and at least one of the following characteristics: projected earnings growth rate at or above the benchmark index, above-average earnings quality and stability, or a price-to-earnings ratio comparable to the benchmark index.
This Morningstar Style Box™ shows the Fund’s investment style and size of companies held in the Fund.
Performance summary | The Fund’s Class A shares returned 14.08% (excluding front-end sales charges) during the six-month period ended April 30, 2010 underperforming the Fund’s benchmark index, which returned 15.66% during the same period. The Fund’s benchmark index, the Standard & Poor’s 500 Composite Stock Index (“S&P 500 Index”), is an unmanaged index of 500 U.S. stocks and gives a broad look at how stock prices have performed. Please keep in mind that an index is not available for direct investment; therefore, its performance does not reflect the expenses associated with the active management of an actual portfolio.
Performance data represented is historical and does not guarantee future results. The investment return and
principal value of an investment will fluctuate, and you may have a gain or loss when you sell shares. Current performance may be higher or lower than the performance data quoted. To obtain more current performance data as of the most recent month-end, please visit our website at eagleasset.com.
Performance discussion | The Fund performed well during the reporting period, with particularly strong absolute returns from its holdings in the telecommunication services, consumer discretionary and industrials sectors. In telecommunication services, the Fund benefited from a single holding in the wireless telecommunications services industry that outperformed the Fund’s other holdings. In consumer discretionary, holdings in the multiline retail (e.g. department stores), media and specialty retail industries all performed well. In industrials, the Fund’s strong performing holdings were in the industrial conglomerates, machinery and aerospace & defense industries. Absolute performance was hindered by a single holding in the consumer staples sector, which posted a negative return.
The Fund slightly underperformed its benchmark index during the period, primarily due to stock selection in the consumer staples sector. In addition, the Fund’s holdings in the strong performing industrials sector detracted from relative performance. Finally, a few underperforming stocks in the overweighted information technology sector held back Fund performance. Relative performance was helped by strong stock selection in the telecommunication services, energy and health care sectors. The Fund also benefited from a lack of holdings in the underperforming utilities sector and an overweight position in the strong performing consumer discretionary sector.
Under performers | Pharmacy services company CVS Caremark Corporation announced additional large contract losses in its pharmacy benefits management (PBM) business. We sold the Fund’s holdings because we were not satisfied with management’s explanations for the contract losses and were unable to independently gauge how impaired the PBM business might be.
Shares of the investment bank Goldman Sachs Group, Inc. declined following the announcement of SEC fraud charges in connection with a 2007 synthetic sub-prime mortgage derivative deal. The Fund continues to hold the stock as we feel that the firm maintains a strong position in a consolidating industry and the stock is attractively valued.
BP PLC, an oil exploration firm, saw its shares fall on liability concerns associated with the recent Deepwater Horizon oil spill
| | |
| Performance Summary and Commentary |
| Eagle Large Cap Core Fund (cont’d) | | |
in the Gulf of Mexico. The fallout from this accident offset improving fundamentals within its exploration and production business. The Fund held the stock at the end of the reporting period pending analysis of its potential liability resulting from the spill.
Exxon Mobil Corporation underperformed as its defensive characteristics, including stability and financial strength, remained out of favor in a strong equity return environment driven by exceptional earnings growth. The Fund continues to hold the stock for its solid fundamentals and attractive valuation.
The stock price of computer games developer Activision Blizzard, Inc. declined on the news that several members of its game studio (Infinity Ward) which produced the hit game Modern Warfare 2 resigned, and will likely join a recently established start-up founded by the unit’s prior managers. Personnel changes are common in the industry, and the company’s studio is well positioned going forward. The Fund continues to hold the shares on our belief that the market over reacted to the employee defections.
Top performers | Managed care provider UnitedHealth Group, Inc. performed well as the health care reform bill that ultimately
passed was relatively benign to the managed care industry. Most critically, the bill did not include a government-run option to compete with the private companies. We trimmed the Fund’s holdings in January to take profits resulting from market optimism surrounding Scott Brown’s Massachusetts Senate election, which led some to declare healthcare reform dead. While we did not share that degree of optimism, we feel that the market supports the stock’s valuation and continue to hold it in the Fund.
Sales performance improved at retailer Macy’s Inc. Accordingly, analysts increased their earnings estimates for the year. We trimmed the Fund’s position in mid-April as the stock approached fair value.
EOG Resources, Inc. is an oil and gas exploration company which benefited from rising oil prices and a strong growth profile. The Fund continues to hold the position.
Bank of America Corporation and Wells Fargo & Company both benefited from their low market valuations as the market began to anticipate the peak of provisioning and a re-normalization of earnings in an expanding economy. We believe the stocks remain attractively valued and are both still held by the Fund.
| | |
| Performance Summary and Commentary |
| Eagle Mid Cap Growth Fund | | |
Meet the managers | Bert L. Boksen, CFA®, a Managing Director and Senior Vice President at Eagle Asset Management, Inc. (“Eagle”), is the Portfolio Manager of the Eagle Mid Cap Growth Fund (the “Fund”). Mr. Boksen has more than 30 years of investment experience. Christopher Sassouni, DMD, with 21 years of investment experience and Eric Mintz, CFA®, with 15 years of investment experience, have been Assistant Portfolio Managers since 2006 and 2008, respectively.
Investment highlights | The Fund invests primarily in stocks of mid-capitalization companies. The Fund’s portfolio managers seek to capture the significant long-term capital appreciation potential of mid-cap, rapidly growing companies. The portfolio managers use a “bottom-up” investment approach through a proprietary research strategy that emphasizes the selection of mid-cap growth stocks that are reasonably priced. A bottom-up method of analysis emphasizes the outlook at the company and industry level versus reliance on the general economy and/or market trends. The Fund’s portfolio managers believe that conducting extensive research on mid cap companies may enable the Fund to capitalize on market inefficiencies and thus outperform the market.
This Morningstar Style Box™ shows the Fund’s investment style and size of companies held in the Fund.
Performance summary | The Fund’s Class A shares returned 26.12% (excluding front-end sales charges) during the six-month period ended April 30, 2010 outperforming the Fund’s benchmark index, which returned 23.23% during the same period. The Fund’s benchmark index, the Russell Midcap® Growth Index, measures the performance of those Russell Midcap companies with higher price-to-book ratios and higher forecasted growth values. Please keep in mind that an index is not available for direct investment; therefore, its performance does not reflect the expenses associated with the active management of an actual portfolio.
Performance data represented is historical and does not guarantee future results. The investment return and
principal value of an investment will fluctuate, and you may have a gain or loss when you sell shares. Current performance may be higher or lower than the performance data quoted. To obtain more current performance data as of the most recent month-end, please visit our website at eagleasset.com.
Performance discussion | Investments in the materials and industrials sectors led the Fund’s strong returns. In materials, stocks in the chemicals and metals & mining industries performed well. In industrials, the strongest rally was found in the road & rail industry. Elsewhere, the Fund’s holdings in the electronic equipment instruments & components and biotechnology industries performed well. While all sectors posted positive returns, on an absolute basis, stocks in the financials and consumer staples sectors lagged. The construction & engineering and auto components industries had negative returns for the reporting period.
The Fund outperformed its benchmark index during the reporting period, as investments in the materials, industrials, information technology, consumer staples, and energy sectors outperformed the benchmark due to strong stock selection. In materials, the Fund outperformed the benchmark due to strong returns and an overweight position in the chemicals industry. Strong returns in the overweight road & rail industry benefited industrials. The electronic equipment instruments & components industry and overweight software industry led to outperformance in information technology. The Fund’s only consumer staples holding (in the household products industry) had very strong performance relative to the lackluster benchmark sector performance. Strong stock selection in the oil gas & consumable fuels industry led to outperformance in the lagging energy sector.
Relative to the benchmark, the Fund slightly underperformed in the financials and consumer discretionary sectors. While the Fund’s absolute performance was in line with the benchmark, an overweight position in the lagging capital markets industry led to underperformance in the financials sector. In the top performing consumer discretionary sector, the lagging returns in the internet & catalog retail industry detracted from sector returns as did a lack of exposure to some of the better performing industries, such as multiline retail, leisure equipment & products and automobiles.
Top Performers | Micron Technology, Inc. sells memory used in computers, and is benefiting from increasing demand in conjunction with vastly lower industry supply, which is pushing up prices and increasing profitability.
| | |
| Performance Summary and Commentary |
| Eagle Mid Cap Growth Fund (cont’d) |
Shares in Huntsman Corporation, a chemical producer, appreciated as investors are anticipating improved business fundamentals as a result of an economic recovery in this highly cyclical industry. Further, the company has successfully implemented a cost reduction program.
Transportation company Kansas City Southern, Inc., appreciated on strong pricing and volume trends.
Sound technology provider Dolby Laboratories, Inc. appreciated during the reporting period due to a pickup in demand in Blu-ray and the Windows 7 product cycle.
Fertilizer producer Terra Industries Inc’s share price increased during the period as the result of a bidding war for the company which ended with its acquisition by CF Industries Holdings.
With the exception of Terra Industries, Inc., which was acquired, the Fund still holds each of these securities.
Under performers | CF Industries Holdings, a fertilizer producer, traded down due to concerns regarding the cost of its recent acquisition of Terra Industries as well as seasonality in fertilizer sales. We continue to hold the stock as we believe the Terra acquisition is a long-term positive for the company.
KLA-Tencor Corporation provides process control and yield-management solutions to semiconductor manufacturers. We sold the stock because we no longer see the company benefiting as much as its peers from increased spending by semiconductor manufacturers.
Oil and gas explorer Denbury Resources, Inc. underperformed due to its surprising acquisition of Encore Oil and Gas. We sold the stock and replaced it with shares of another company in this industry.
Specialty electrical contracting and maintenance company Quanta Services, Inc. has seen delays in its new transmission line business. Although we believe in the long-term fundamentals of the business, we sold the stock due to its near-term outlook uncertainty.
Health insurer Cigna Corporation has declined slightly since our recent purchase, due primarily to market conditions. We remain optimistic about the company as it has little exposure to the individual and group markets, nor does it offer Medicare plans. As such, we feel it is ideally positioned to weather the storms of healthcare reform and continue to hold the stock in the Fund.
| | |
| Performance Summary and Commentary |
| Eagle Mid Cap Stock Fund | | |
Meet the managers | Todd L. McCallister, Ph.D., CFA®, is a Managing Director and Senior Vice President at Eagle Asset Management, Inc. (“Eagle”) and Co-Portfolio Manager of the Eagle Mid Cap Stock Fund (the “Fund”). Mr. McCallister has more than 20 years of investment experience and has managed the Fund since its inception in 1997. Stacey Serafini Thomas, CFA®, is a Vice President at Eagle and served as Assistant Portfolio Manager to the Fund from 2000 to 2005, before being named Co-Portfolio Manager. Ms. Thomas has more than 10 years of investment experience.
Investment highlights | The Fund invests primarily in stocks of mid-capitalization companies. The portfolio managers of the Fund employ a “bottom-up” stock-selection process to identify growing, mid-cap companies that are reasonably priced. A bottom-up method of analysis emphasizes the outlook at the company and industry level versus reliance on the general economy and/or market trends. The portfolio managers seek to gain a comprehensive understanding of a company’s management, business plan, financials, real rate of growth and competitive threats and advantages.
This Morningstar Style Box™ shows the Fund’s investment style and size of companies held in the Fund.
Performance summary | The Fund’s Class A shares returned 15.55% (excluding front-end sales charges) during the six-month period ended April 30, 2010, underperforming the Fund’s benchmark index, which returned 25.77% during the same period. The Fund’s benchmark index, the Standard & Poor’s MidCap 400 Index (“S&P MidCap 400”), is an unmanaged index that measures the performance of the mid-sized company segment of the U.S. market. Please keep in mind that an index is not available for direct investment; therefore, its performance does not reflect the expenses associated with the active management of an actual portfolio.
Performance data represented is historical and does not guarantee future results. The investment return and principal value of an investment will fluctuate, and you may have a gain or loss when you sell shares. Current performance may be higher or lower than the performance data quoted. To obtain more current performance data as of the most recent month-end, please visit our website at eagleasset.com.
Performance discussion | During the reporting period, the Fund saw the strongest absolute contribution from the information technology, consumer discretionary, and materials sectors. In information technology the electronic equipment instruments and semiconductors industries led performance, while in consumer discretionary, holdings in the media and specialty retail industries contributed the most. In materials, chemicals and containers/packaging were the top performing industries. While all sectors had positive absolute returns for the Fund, holdings in the utilities and telecommunication sectors contributed the least amount.
The Fund underperformed relative to its benchmark index during the reporting period. The better performing mid-cap companies were those with a low return-on-equity (ROE), low price and low market cap. The Fund’s holdings in the utilities sector outperformed while maintaining a large underweight to utilities. Holding in the financials and industrials sectors had the worst relative performance. In financials, the Fund had an overweight position in the insurance and diversified financial services industries. While the Fund’s holdings in these industries posted positive returns during the reporting period, they underperformed the benchmark. In industrials, holdings in the professional services and machinery industries underperformed the benchmark.
Under performers | Tax preparation firm H&R Block, Inc. announced in February that its tax preparation division was showing disappointing results for the early portion of the tax season. Consequently, the company said it’s not likely to reach its previously announced earnings guidance. The Fund sold the stock after management failed to provide updated earnings guidance or plans to address the problems.
FTI Consulting, Inc, a business advisory firm, traded lower after reporting weaker than expected corporate finance and restructuring results and issuing its 2010 earnings guidance. Investors appear to be worried about how a move from recession to recovery will affect FTI’s revenues. We sold the Fund’s position in the stock.
| | |
| Performance Summary and Commentary |
| Eagle Mid Cap Stock Fund (cont’d) |
Payment services firm Western Union Company underperformed after it announced earnings estimates for the coming year below analysts’ expectations. Management explained that their estimates considered that much of its business is tied to employment levels. We sold the stock from the Fund because we believe that compressed profit margins will negatively impact earnings for more than a year.
AGCO Corporation, an agricultural equipment manufacturer, has traded lower since earnings were reported in April. Some investors are concerned that business in South America is going to be weaker than expected and earnings growth will be reduced. The Fund continues to hold this stock.
State Street Corporation, a major institutional bank, traded lower after they reported lower than expected earnings and lower fee revenue. The company also reported weaker securities lending and foreign exchange revenues. The Fund continues to hold the stock.
Top performers | Whiting Petroleum Corporation is an energy company that gives us exposure to Bakken Shale, the most potent domestic crude oil region. The company’s stock was trading at a discount to its peers based on a net asset value of proven reserves and also has some of the strongest margins in the industry. Further, its operating well results keep improving and management has said it intends to double its rig count. The Fund continues to hold the stock.
Semiconductor manufacturer Marvell Technology Group, Ltd. reported strong earnings driven by improvements in its gross margin and growth in all its business units. The Fund continues to hold the stock.
Airgas, Inc., a distributor of specialty industrial gas products, was the subject of a hostile takeover bid by Air Products and Chemicals, which had been rebuffed in private negotiations before taking its offer for Airgas public on February 5th. Airgas is currently the largest U.S. industrial gases distributor and the combined company would be the third largest in the world. We expect that Air Products will likely wage a proxy battle, and we took the opportunity to sell the Fund’s position.
The Fund acquired shares in internet and television marketing firm Liberty Media Holding Corporation Interactive during the period at what we viewed as an attractive valuation in spite of its high profit margins and investments. The stock price increased after a tender offer for its Live Nation unit by its sister company Liberty Capital, which moved some cash and debt from Liberty Capital to Liberty Interactive. Liberty Interactive also beat earnings expectations, driven by revenue growth at QVC. The Fund continues to hold the stock.
Silver Wheaton Corporation utilizes silver streams, which are agreements to purchase all or part of a silver mine’s production. The company’s earnings in the fourth quarter, and 2009 as a whole, met estimates and analysts’ consensus. The Fund continues to own this stock as we believe that the company will benefit from its focus on silver production as investors diversify into precious metals.
| | |
| Performance Summary and Commentary |
| Eagle Small Cap Core Value Fund | | |
Meet the managers | David M. Adams, CFA®, Lead Portfolio Manager, and John “Jack” McPherson, CFA®, Co-Portfolio Manager, are Managing Directors at Eagle Boston Investment Management, Inc. (“EBIM”) and have been responsible for the day-to-day management of the Eagle Small Cap Core Value Fund (the “Fund”) since its inception in 2008. Both Mr. Adams and Mr. McPherson have 20 years of investment experience.
Investment highlights | The Fund invests primarily in equity securities of small-capitalization companies. Using a value approach to investing, the Fund’s portfolio managers seek to capture capital growth by selecting securities that the portfolio managers believe are selling at a discount relative to their underlying value and then hold them until their market value reflects their intrinsic value. To assess value, a “bottom-up” method of analysis is utilized. A bottom-up method of analysis emphasizes the outlook at the company and industry level versus reliance on the general economy and/or market trends. Other factors that the portfolio managers may look for when selecting investments include: management with demonstrated ability and commitment to the company, above-average potential for earnings and revenue growth, low debt levels relative to total capitalization and strong industry fundamentals.
This Morningstar Style Box™ shows the Fund’s investment style and size of companies held in the Fund.
Performance summary | The Fund’s Class A shares returned 23.32% (excluding front-end sales charges) during six-month period ended April 30, 2010, underperforming the Fund’s benchmark index, which returned 28.17% during the same period. The Fund’s benchmark index, the Russell 2000® Index, is an unmanaged index comprised of the 2,000 smallest companies in the Russell 3000® Index. The Russell 3000® Index measures the performance of the 3,000 largest U.S. companies based on total market capitalization. Please keep in mind that an index is not available for direct investment; therefore, its performance does not reflect the expenses associated with the active management of an actual portfolio.
Performance data represented is historical and does not guarantee future results. The investment return and principal value of an investment will fluctuate, and you may have a gain or loss when you sell shares. Current performance may be higher or lower than the performance data quoted. To obtain more current performance data as of the most recent month-end, please visit our website at eagleasset.com.
Performance discussion | The Fund realized strong absolute returns during the period, benefiting from strong performance in the consumer staples, materials and energy sectors. While the utilities, telecommunications services and information technology sectors all generated positive returns for the period, they lagged the overall return for the Fund.
The performance of the Fund trailed its benchmark index during the reporting period. The primary factor contributing to the Fund’s relative underperformance was the Fund’s below average exposure to higher beta areas of the market versus the Russell 2000® Index. A higher beta stock is one that has a higher degree of volatility, and thus risk, than the average stock in a market. During the reporting period, the highest beta stocks were the strongest performers, reflecting a higher tolerance for risk among investors. The Fund’s fundamental focus on higher quality companies with below average debt combined with our value-oriented investing approach generally results in below average exposure to the riskier market segments. We believe that higher-quality stocks tend to outperform higher beta stocks over longer periods of time and we remain committed to focusing on the higher-quality segment of the market.
Relative to the benchmark, the Fund outperformed in the energy, consumer staples and telecommunication services sectors. In energy, the Fund benefited from an overweight position and strong stock selection. In consumer staples, strong stock selection led to outperformance, while in telecommunication services, outperformance was driven by an overweight position. Sectors detracting from relative performance were consumer discretionary and information technology. In consumer discretionary, the Fund was underweight and underperformed while holding an overweight position in the underperforming information technology sector.
Under performers | Electronic payment system provider Euronet Worldwide, Inc. saw its shares fall as investors reacted to a price cut for their services in the Polish market. The Fund continues to hold the position as we believe that investors overreacted to the pricing change.
| | |
| Performance Summary and Commentary |
| Eagle Small Cap Core Value Fund (cont’d) |
Gift retailer 1-800-FLOWERS.COM, Inc. again reported results that disappointed analysts’ expectations, causing its shares to drop. We believe the long-term potential for the business remains attractive and continue to hold the stock in the Fund.
Comstock Resources, Inc., an oil and gas exploration firm, declined as weak natural gas prices offset continued strong developments within their major production areas. The Fund continues to hold the position as we believe the company has attractive drilling sites in some of the more important natural gas producing regions of the country.
Shares in financial technology and brokerage firm Investment Technology Group, Inc. declined as weak equity market trading volumes contributed to slightly disappointing earnings results. We continue to hold the position in the Fund as we view the company as well positioned to benefit from an eventual rebound in activity.
Merit Medical Systems, Inc., a medical device manufacturer, declined as a result of a disappointing earnings report. The disappointing earnings report was partially driven by intentional production cuts designed to manage inventory. The Fund continues to hold the position as we believe the long-term outlook remains attractive.
Top performers | Technology firm Sonic Solutions saw its shares increase dramatically during the reporting period as the company announced several new partners for its CinemaNow product, which continues to validate the long-term earnings potential of the company. We continue to hold the position in the Fund.
FGX International designed and marketed products under brands such as Foster Grant. The company was acquired by a European competitor during the reporting period at a premium, leading to its strong performance. The Fund no longer owns the stock as the merger was completed in March.
Marketing firm Herbalife Ltd. saw its stock price benefit from strong results. We continue to own the position in the Fund.
Retailer Jo-Ann Stores, Inc. appreciated as the company’s results again exceeded investor expectations. The Fund continues to own this stock.
IAMGOLD Corporation, a mining firm, saw its shares rise as investor optimism regarding one of their development programs continued to improve. We continue to hold the position in the Fund.
| | |
| Performance Summary and Commentary |
| Eagle Small Cap Growth Fund | | |
Meet the managers | Bert L. Boksen, CFA®, a Managing Director and Senior Vice President at Eagle Asset Management, Inc. (“Eagle”), has been responsible for the management of the Eagle Small Cap Growth Fund (the “Fund”) since 1995. Mr. Boksen has more than 30 years of investment experience. Eric Mintz, CFA®, has 15 years of investment experience and has been Assistant Portfolio Manager since 2008.
Investment highlights | The Fund invests primarily in stocks of small-capitalization companies. Using a “bottom-up” approach, the Fund’s portfolio managers seek to capture the significant long-term capital appreciation potential of small, rapidly growing companies. A bottom-up method of analysis emphasizes the outlook at the company and industry level versus reliance on the general economy and/or market trends. The portfolio managers also look for small-cap growth companies that are reasonably priced. Since small-cap companies often have narrower markets than large-cap companies, the portfolio managers believe that conducting extensive proprietary research on small-cap growth companies may enable the Fund to capitalize on market inefficiencies and thus outperform the market.
This Morningstar Style Box™ shows the Fund’s investment style and size of companies held in the Fund.
Performance summary | The Fund’s Class A shares returned 26.81% (excluding front-end sales charges) during the six-month period ended April 30, 2010, outperforming the Fund’s benchmark index, which returned 25.49% during the same period. The Fund’s benchmark index, the Russell 2000® Growth Index, is an unmanaged index comprised of Russell 2000® companies with higher price-to-book ratios and higher forecasted growth values. The Russell 2000® Index is an unmanaged index comprised of the 2,000 smallest companies in the Russell 3000® Index. The Russell 3000® Index measures the performance of the 3,000 largest U.S. companies based on total market capitalization.
Performance data represented is historical and does not guarantee future results. The investment return and principal value of an investment will fluctuate, and you may have a gain or loss when you sell shares. Current performance may be higher or lower than the performance data quoted. To obtain more current performance data as of the most recent month-end, please visit our website at eagleasset.com.
Performance discussion | On an absolute basis, the energy and materials sectors led the Fund’s returns during the reporting period, while all sectors posted gains. In energy, the stocks in the energy equipment & services and oil, gas & consumable fuels industries posted strong gains. In materials, the Fund’s investments in the chemicals industry performed well. In addition, the Fund’s holdings in the auto components industry, which is part of the consumer discretionary sector, contributed to overall absolute performance.
On an absolute basis, the industrials and financials sectors lagged. In industrials, the Fund’s construction & engineering holdings posted negative returns, while holdings in the commercial services industry lagged. In financials, the capital markets holdings had negative returns for the reporting period.
The Fund outperformed its benchmark index for the reporting period. Relative to the benchmark, stocks in the materials, energy and healthcare sectors outperformed due to strong stock selection. In materials, the Fund outperformed the benchmark due to strong returns and an overweight position in the chemicals industry. Strong returns and an overweight position in the energy equipment & services industry led to outperformance in energy. Outperformance in healthcare is primarily due to a large position in a medical device stock that appreciated significantly during the reporting period.
Relative to the benchmark, the Fund underperformed most significantly in industrials and, to a lesser extent, in the information technology, consumer discretionary and financials sectors. The Fund’s underperformance in industrials was due to an overweight positioning and underperformance in the commercial services & supplies and construction & engineering industries. Information technology was a relative laggard due to underperformance of the Fund’s holdings in the semiconductors & semiconductor equipment and computers & peripherals industries. The Fund’s textiles apparel & luxury goods and household durables holdings underperformed relative to the benchmark in the consumer discretionary sector. In the financials sector, negative returns in the capital markets industry led to relative underperformance.
| | |
| Performance Summary and Commentary |
| Eagle Small Cap Growth Fund (cont’d) | | |
Top performers | Medical device company Thoratec Corporation exhibited strong stock performance due to stronger than expected interest in left ventricular assist devices (LVADs) for the treatment of patients with end stage heart failure. The company recently received U.S. Food and Drug Administration (FDA) approval in “destination therapy” (an alternative to cardiac transplantation), which we believe is still in its infancy. The Fund still holds the stock.
Shares in Huntsman Corporation, a chemical producer, appreciated as investors were anticipating improved business fundamentals as a result an economic recovery in this highly cyclical industry. Further, the company has successfully implemented a cost reduction program. The Fund still owns the stock.
Fertilizer producer Terra Industries Inc.’s share price increased during the period as the result of a bidding war for the company which ended with its acquisition by CF Industries Holdings. The Fund sold its shares prior to the close of the acquisition.
Shares in oil equipment manufacturer Lufkin Industries, Inc. appreciated due to a sharp rise in oil prices, which helped boost prospects for a recovery in demand for Lufkin’s pump jacks. The Fund still holds its shares in Lufkin.
OYO Geospace Corporation, a provider of seismic instruments to the oil and gas industries, appreciated substantially on significant orders for its new wireless product line. The Fund still owns the stock.
Under performers | Clothing manufacturer True Religion Apparel, Inc. gave back some of its prior period gains in November when investors became concerned about its management’s muted outlook and high inventory levels. We took our profits and sold the stock.
Compellent Technologies, Inc., which provides storage solutions for commercial computer users, pulled back after margins came in below expectations due to heavy discounts used to lock in large strategic accounts. The stock was recently sold.
Shares of water pipe manufacturer Northwest Pipe Company fell after the company pre-announced disappointing third quarter results and delayed filing its financial reports due to an ongoing investigation in accounting irregularities. We continue to hold the stock due to favorable prospects for its end markets in 2010 and believe the stock’s current valuation is well below replacement cost and appears to more than adequately discount the risks associated with an accounting restatement.
Telecommunications company EMS Technologies, Inc. declined after it announced lower than expected earnings and muted guidance due to the challenging economic environment. We are optimistic that a recent change in key management will improve performance and we continue to hold the stock.
FormFactor, Inc. provides equipment used to electronically test integrated circuits. The stock has been weak due to poor earnings results and guidance. We continue to hold the stock because we believe the company continues to have a strong competitive position and demand is expected to pick up significantly in the second half of the year.
Investment Portfolios
| | | | | | |
| EAGLE CAPITAL APPRECIATION FUND | | | | | | |
| Common stocks—96.3% (a) | | | | Shares | | Value |
| Apparel—1.8% | | | | | | |
| Nike, Inc., Class B | | | | 138,800 | | $10,536,308 |
| | | |
| Banks—2.2% | | | | | | |
| Northern Trust Corporation | | | | 231,546 | | 12,730,399 |
| | | |
| Beverages—3.7% | | | | | | |
| PepsiCo, Inc. | | | | 340,409 | | 22,201,475 |
| | | |
| Biotechnology—3.6% | | | | | | |
| Biogen Idec Inc.* | | | | 210,813 | | 11,225,792 |
| Gilead Sciences, Inc.* | | | | 253,977 | | 10,075,268 |
| | | |
| Chemicals—1.5% | | | | | | |
| Praxair, Inc. | | | | 105,500 | | 8,837,735 |
| | | |
| Commercial services—2.3% | | | | | | |
| Mastercard Inc., Class A | | | | 54,700 | | 13,567,788 |
| The Western Union Company | | | | 11,210 | | 204,582 |
| | | |
| Computers—5.1% | | | | | | |
| Apple, Inc.* | | | | 115,400 | | 30,133,248 |
| | | |
| Cosmetics/personal care—3.4% | | | | | | |
| The Procter & Gamble Company | | | | 321,539 | | 19,986,864 |
| | | |
| Electronics—2.3% | | | | | | |
| Thermo Fisher Scientific Inc.* | | | | 241,376 | | 13,343,265 |
| | | |
| Financial services—4.7% | | | | | | |
| CME Group Inc. | | | | 49,917 | | 16,393,242 |
| The Charles Schwab Corporation | | | | 591,919 | | 11,418,118 |
| | | |
| Healthcare products—9.4% | | | | | | |
| Baxter International Inc. | | | | 422,439 | | 19,947,570 |
| Johnson & Johnson | | | | 321,847 | | 20,694,762 |
| St. Jude Medical, Inc.* | | | | 364,700 | | 14,887,054 |
| | | |
| Internet—3.1% | | | | | | |
| Equinix Inc.* | | | | 183,095 | | 18,428,512 |
| | | |
| Oil & gas—4.1% | | | | | | |
| Occidental Petroleum Corporation | | | | 154,400 | | 13,689,104 |
| Southwestern Energy Company* | | | | 260,329 | | 10,329,854 |
| | | |
| Oil & gas services—7.0% | | | | | | |
| Halliburton Company | | | | 473,641 | | 14,517,097 |
| Schlumberger Ltd. | | | | 374,842 | | 26,771,216 |
| | | |
| Pharmaceuticals—3.3% | | | | | | |
| Express Scripts Inc.* | | | | 115,500 | | 11,565,015 |
| Teva Pharmaceutical Industries Ltd., Sponsored ADR | | | | 139,165 | | 8,173,160 |
| | | |
| Real estate—2.9% | | | | | | |
| CB Richard Ellis Group Inc., Class A* | | | | 997,432 | | 17,275,522 |
| | | |
| Retail—9.0% | | | | | | |
| Costco Wholesale Corporation | | | | 273,248 | | 16,143,492 |
| Lowe’s Companies, Inc. | | | | 357,137 | | 9,685,555 |
| Staples, Inc. | | | | 658,100 | | 15,485,093 |
| Target Corporation | | | | 214,100 | | 12,175,867 |
| | | |
| Semiconductors—4.3% | | | | | | |
| Altera Corporation | | | | 341,909 | | 8,670,812 |
| Broadcom Corporation, Class A | | | | 491,400 | | 16,948,386 |
| | | |
| Software—7.0% | | | | | | |
| Microsoft Corporation | | | | 667,450 | | 20,383,923 |
| Oracle Corporation | | | | 825,338 | | 21,326,734 |
| | | |
| Telecommunications—15.6% | | | | | | |
| American Tower Corporation, Class A* | | | | 741,450 | | 30,258,574 |
| | | | | | |
| | | |
| Common stocks—96.3% (a) | | | | Shares | | Value |
| Cisco Systems, Inc.* | | | | 659,800 | | $17,761,816 |
| Crown Castle International Corporation* | | | | 618,378 | | 23,405,607 |
| QUALCOMM Inc. | | | | 536,040 | | 20,766,191 |
| Total common stocks (cost $449,525,470) | | | | | | 569,945,000 |
| | | |
| Repurchase agreement—3.3% (a) | | | | | | |
| Repurchase agreement with Fixed Income Clearing Corporation dated April 30, 2010 @ 0.05% to be repurchased at $19,707,082 on May 3, 2010, collateralized by $20,515,000 United States Treasury Notes, 3.375% due November 15, 2019 (market value $20,393,352 including interest) (cost $19,707,000) | | 19,707,000 |
| |
| Total investment portfolio (cost $469,232,470) 99.6% (a) | | $589,652,000 |
| |
* Non-income producing security. (a) Percentages indicated are based on net assets of $591,703,778. | | |
| |
| ADR—American depository receipt | | |
| | |
| |
| Sector allocation | | |
| Sector | | Percent of net assets |
| Consumer, non-cyclical | | 22.2% |
| Technology | | 20.1% |
| Communications | | 18.6% |
| Energy | | 11.0% |
| Consumer, cyclical | | 10.8% |
| Financial | | 9.8% |
| Other sectors | | 3.8% |
| Cash | | 3.3% |
| | | | | | |
| | | | |
| EAGLE GROWTH & INCOME FUND | | | | | | |
| Common stocks—93.1% (a) | | | | Shares | | Value |
| Domestic—62.9% | | | | | | |
| Aerospace/defense—3.7% | | | | | | |
| Lockheed Martin Corporation | | | | 38,700 | | $3,285,243 |
| The Boeing Company | | | | 54,900 | | 3,976,407 |
| | | |
| Agriculture—1.7% | | | | | | |
| Philip Morris International Inc. | | | | 70,200 | | 3,445,416 |
| | | |
| Banks—11.1% | | | | | | |
| Bank of America Corporation | | | | 161,500 | | 2,879,545 |
| Fifth Third Bancorp | | | | 276,571 | | 4,123,674 |
| JPMorgan Chase & Company | | | | 114,752 | | 4,886,140 |
| KeyCorp | | | | 218,400 | | 1,969,968 |
| SVB Financial Group* | | | | 69,400 | | 3,416,562 |
| U.S. Bancorp | | | | 171,800 | | 4,599,086 |
| | | |
| Beverages—1.8% | | | | | | |
| The Coca-Cola Company | | | | 67,300 | | 3,597,185 |
| | | |
| Biotechnology—1.9% | | | | | | |
| Gilead Sciences, Inc.* | | | | 97,382 | | 3,863,144 |
| | | |
| Chemicals—2.0% | | | | | | |
| E.I. du Pont de Nemours & Company | | | | 97,500 | | 3,884,400 |
| | |
| 20 | | The accompanying notes are an integral part of the financial statements. |
Investment Portfolios
| | | | | | |
| EAGLE GROWTH & INCOME FUND (cont’d) | | | | | | |
| Common stocks—93.1% (a) | | | | Shares | | Value |
| Commercial services—2.3% | | | | | | |
| Paychex, Inc. | | | | 150,500 | | $4,605,300 |
| | | |
| Computers—4.1% | | | | | | |
| Apple, Inc.* | | | | 7,435 | | 1,941,427 |
| Dell Inc.* | | | | 375,500 | | 6,075,590 |
| | | |
| Electric—1.9% | | | | | | |
| Entergy Corporation | | | | 46,200 | | 3,755,598 |
| | | |
| Financial services—2.0% | | | | | | |
| AllianceBernstein Holding LP | | | | 122,600 | | 3,848,414 |
| | | |
| Food—2.1% | | | | | | |
| Sysco Corporation | | | | 128,800 | | 4,062,352 |
| | | |
| Healthcare products—1.3% | | | | | | |
| Varian Medical Systems, Inc.* | | | | 44,888 | | 2,530,785 |
| | | |
| Insurance—2.3% | | | | | | |
| Hartford Financial Services Group, Inc. | | | | 87,500 | | 2,499,875 |
| Mercury General Corporation | | | | 43,932 | | 1,976,501 |
| | | |
| Internet—1.7% | | | | | | |
| Google Inc., Class A* | | | | 6,300 | | 3,310,272 |
| | | |
| Iron/steel—2.0% | | | | | | |
| United States Steel Corporation | | | | 71,100 | | 3,886,326 |
| | | |
| Oil & gas—4.4% | | | | | | |
| ConocoPhillips | | | | 55,600 | | 3,290,964 |
| Diamond Offshore Drilling, Inc. | | | | 21,800 | | 1,724,380 |
| Exxon Mobil Corporation | | | | 52,855 | | 3,586,212 |
| | | |
| Pharmaceuticals—1.7% | | | | | | |
| Eli Lilly & Company | | | | 95,275 | | 3,331,767 |
| | | |
| Retail—2.1% | | | | | | |
| McDonald’s Corporation | | | | 57,500 | | 4,058,925 |
| | | |
| Software—6.3% | | | | | | |
| Eclipsys Corporation* | | | | 170,500 | | 3,525,940 |
| Fiserv, Inc.* | | | | 69,100 | | 3,530,319 |
| Microsoft Corporation | | | | 177,800 | | 5,430,012 |
| | | |
| Telecommunications—3.9% | | | | | | |
| AT&T Inc. | | | | 109,300 | | 2,848,358 |
| Leap Wireless International Inc.* | | | | 105,000 | | 1,923,600 |
| Qwest Communications International Inc. | | | | 555,000 | | 2,902,650 |
| | | |
| Television, cable & radio—2.6% | | | | | | |
| Comcast Corporation, Class A | | | | 277,300 | | 5,227,105 |
| Total domestic common stocks (cost $111,995,250) | | 123,799,442 |
| | | |
| Foreign—30.2% (b) | | | | | | |
| Beverages—1.8% | | | | | | |
| Foster’s Group Ltd. | | | | 712,300 | | 3,575,229 |
| | | |
| Cosmetics/personal care—1.3% | | | | | | |
| Natura Cosmeticos SA | | | | 117,300 | | 2,490,073 |
| | | |
| Electric—1.9% | | | | | | |
| Enel SpA | | | | 722,500 | | 3,768,080 |
| | | |
| Entertainment—0.8% | | | | | | |
| Berjaya Sports Toto Bhd | | | | 1,112,600 | | 1,589,921 |
| | | |
| Financial services—2.3% | | | | | | |
| BM&F Bovespa SA | | | | 216,000 | | 1,415,355 |
| Hong Kong Exchanges and Clearing Ltd. | | | | 187,900 | | 3,076,040 |
| | | | | | |
| | | |
| Common stocks—93.1% (a) | | | | Shares | | Value |
| Food—2.9% | | | | | | |
| Metcash Ltd. | | | | 533,600 | | $1,995,146 |
| Nestle SA | | | | 77,700 | | 3,792,109 |
| | | |
| Insurance—2.9% | | | | | | |
| ACE Ltd. | | | | 77,345 | | 4,113,981 |
| AXA SA | | | | 81,800 | | 1,625,936 |
| | | |
| Internet—1.3% | | | | | | |
| Baidu Inc., Sponsored ADR* | | | | 3,600 | | 2,481,480 |
| | | |
| Multimedia—0.8% | | | | | | |
| Pearson PLC | | | | 98,554 | | 1,582,153 |
| | | |
| Oil & gas—2.9% | | | | | | |
| Canadian Oil Sands Trust | | | | 64,400 | | 1,949,498 |
| ENI SpA | | | | 167,700 | | 3,759,407 |
| | | |
| Pharmaceuticals—3.7% | | | | | | |
| Actelion Ltd.* | | | | 23,700 | | 953,725 |
| Novartis AG | | | | 55,200 | | 2,816,371 |
| Teva Pharmaceutical Industries Ltd., Sponsored ADR | | | | 59,600 | | 3,500,308 |
| | | |
| Telecommunications—7.6% | | | | | | |
| Amdocs Ltd.* | | | | 143,700 | | 4,589,778 |
| China Mobile Ltd. | | | | 190,500 | | 1,862,795 |
| Telefonica SA | | | | 131,600 | | 2,955,319 |
| Telstra Corporation Ltd. | | | | 1,199,300 | | 3,510,671 |
| Vodafone Group PLC | | | | 887,535 | | 1,973,824 |
| Total foreign common stocks (cost $54,473,636) | | | | | | 59,377,199 |
| Total common stocks (cost $166,468,886) | | | | | | 183,176,641 |
| | | |
| Preferred stocks—1.6% (a) | | | | | | |
| Banks—1.6% | | | | | | |
| Bank of America Corporation, FRN, 0.74%, Series H | | | | 60,000 | | 1,053,000 |
| Fifth Third Bancorp, 8.5%, Series G (convertible) | | | | 14,200 | | 2,130,000 |
| Total preferred stocks (cost $1,958,343) | | | | | | 3,183,000 |
| | | |
| Corporate bonds—1.4% (a) | | | | Principal
amount | | Value |
| Domestic—0.7% | | | | | | |
| Agriculture—0.7% | | | | | | |
| Altria Group Inc., 9.7%, 11/10/18 | | | | $1,000,000 | | 1,257,591 |
| Total domestic corporate bonds (cost $1,011,602) | | | | | | 1,257,591 |
| | | |
| Foreign—0.7% (b) | | | | | | |
| Financial services—0.7% | | | | | | |
| Swiss Reinsurance Capital I LP, 144A, 6.854% to 05/25/16, floating rate to 05/29/49 | | | | 1,550,000 | | 1,438,540 |
| Total foreign corporate bonds (cost $840,475) | | | | | | 1,438,540 |
| Total corporate bonds (cost $1,852,077) | | | | | | 2,696,131 |
| | | |
| Convertible bonds—0.0% (a) | | | | | | |
| Telecommunications—0.0% | | | | | | |
| Level 3 Communications Inc., 2.875%, 07/15/10 | | | | 68,000 | | 67,744 |
| Total convertible bonds (cost $66,268) | | | | | | 67,744 |
| | | |
| Total investment portfolio excluding repurchase agreement (cost $170,345,574) | | | | | | 189,123,516 |
| | |
| The accompanying notes are an integral part of the financial statements. | | 21 |
Investment Portfolios
| | | | | | |
| EAGLE GROWTH & INCOME FUND (cont’d) | | | | | | |
| Repurchase agreement—3.6% (a) | | | | | | |
| Repurchase agreement with Fixed Income Clearing Corporation dated April 30, 2010 @ 0.05% to be repurchased at $7,152,030 on May 3, 2010, collateralized by $7,450,000 United States Treasury Notes, 3.375% due November 15, 2019 (market value $7,405,824 including interest) (cost $7,152,000) | | $7,152,000 |
| |
| Total investment portfolio (cost $177,497,574) 99.7% (a) | | $196,275,516 |
| |
* Non-income producing security. (a) Percentages indicated are based on net assets of $196,866,899. (b) Securities are U.S. dollar denominated. 144A—144A securities are issued pursuant to Rule 144A of the Securities Act of 1933. Most of these are deemed to be liquid for purposes of compliance limitations on holdings of illiquid securities and all may be resold as transactions exempt from registration to qualified institutional buyers. At April 30, 2010, these securities aggregated $1,438,540 or 0.7% of the net assets of the Fund. ADR—American depository receipt FRN—Floating rate notes reset their interest rates on a semiannual or quarterly basis. | | |
| | |
| |
| Sector allocation | | |
| Sector | | Percent of net assets |
| Financial | | 22.9% |
| Consumer, non-cyclical | | 21.3% |
| Communications | | 17.9% |
| Technology | | 12.4% |
| Energy | | 7.3% |
| Basic materials | | 3.9% |
| Utilities | | 3.8% |
| Industrial | | 3.7% |
| Consumer, cyclical | | 2.9% |
| Cash | | 3.6% |
| | | | | | |
| | | | |
| EAGLE INTERNATIONAL EQUITY FUND | | | | | | |
| Common stocks—93.3% (a) | | | | Shares | | Value |
| Australia—4.9% | | | | | | |
| AMP Ltd. | | | | 21,081 | | $121,211 |
| Asciano Group* | | | | 91,546 | | 141,852 |
| Australia & New Zealand Banking Group Ltd. | | | | 19,488 | | 429,903 |
| BHP Billiton Ltd. | | | | 25,084 | | 916,381 |
| Commonwealth Bank of Australia | | | | 8,319 | | 445,208 |
| Macquarie Atlas Roads Group* | | | | 5,613 | | 5,090 |
| MAp Group | | | | 209,016 | | 598,675 |
| National Australia Bank Ltd. | | | | 13,124 | | 335,428 |
| Newcrest Mining Ltd. | | | | 11,435 | | 343,777 |
| Rio Tinto Ltd. | | | | 17,217 | | 1,120,076 |
| Wesfarmers Ltd. | | | | 2,041 | | 54,650 |
| Westpac Banking Corporation | | | | 16,815 | | 417,899 |
| | | |
| Austria—1.8% | | | | | | |
| Erste Group Bank AG | | | | 29,149 | | 1,301,850 |
| | | | | | |
| | | |
| Common stocks—93.3% (a) | | | | Shares | | Value |
| OMV AG | | | | 13,563 | | $488,142 |
| Voestalpine AG | | | | 1,007 | | 38,016 |
| | | |
| Belgium—0.4% | | | | | | |
| KBC Groep NV | | | | 7,710 | | 349,079 |
| | | |
| Bermuda—0.1% | | | | | | |
| China Yurun Food Group Ltd. | | | | 22,000 | | 66,940 |
| | | |
| Brazil—0.9% | | | | | | |
| All America Latina Logistica SA | | | | 2,728 | | 24,828 |
| Amil Participacoes SA | | | | 6,814 | | 55,860 |
| BRF - Brasil Foods SA | | | | 9,042 | | 118,080 |
| Centrais Eletricas Brasileiras SA | | | | 7,195 | | 102,239 |
| Hypermarcas SA* | | | | 29,141 | | 402,349 |
| Vale SA, Sponsored ADR | | | | 6,355 | | 194,654 |
| | | |
| Britain—9.1% | | | | | | |
| Anglo American PLC* | | | | 10,025 | | 429,359 |
| Barclays PLC | | | | 175,669 | | 899,428 |
| BG Group PLC | | | | 17,782 | | 298,552 |
| BHP Billiton PLC | | | | 23,411 | | 719,243 |
| Diageo PLC | | | | 22,305 | | 380,525 |
| GlaxoSmithKline PLC | | | | 65,316 | | 1,210,235 |
| Imperial Tobacco Group PLC | | | | 27,259 | | 778,682 |
| Legal & General Group PLC | | | | 62,745 | | 81,272 |
| Lloyds Banking Group PLC* | | | | 1,016,661 | | 1,016,686 |
| Lonmin PLC* | | | | 3,831 | | 111,181 |
| Prudential PLC | | | | 9,481 | | 84,065 |
| Rio Tinto PLC | | | | 23,726 | | 1,196,844 |
| Rolls-Royce Group PLC | | | | 17,889 | | 157,983 |
| Tesco PLC | | | | 69,958 | | 465,368 |
| Vodafone Group PLC | | | | 383,639 | | 853,186 |
| WPP PLC | | | | 40,273 | | 428,170 |
| | | |
| Canada—5.5% | | | | | | |
| Agnico-Eagle Mines Ltd. | | | | 955 | | 60,574 |
| Bank of Montreal | | | | 3,495 | | 217,070 |
| Bank of Nova Scotia | | | | 6,708 | | 341,938 |
| Barrick Gold Corporation | | | | 28,412 | | 1,239,074 |
| Canadian Imperial Bank of Commerce | | | | 3,167 | | 232,459 |
| Canadian Pacific Railway Ltd. | | | | 1,388 | | 81,821 |
| Cenovus Energy Inc. | | | | 1,659 | | 48,784 |
| Goldcorp Inc. | | | | 6,806 | | 294,203 |
| IAMGOLD Corporation | | | | 4,082 | | 73,056 |
| IGM Financial Inc. | | | | 968 | | 40,186 |
| Ivanhoe Mines Ltd.* | | | | 12,360 | | 196,753 |
| Kinross Gold Corporation | | | | 5,775 | | 110,292 |
| Manulife Financial Corporation | | | | 7,977 | | 143,866 |
| Potash Corporation of Saskatchewan Inc. | | | | 2,870 | | 317,090 |
| Royal Bank of Canada | | | | 8,768 | | 531,622 |
| Silver Wheaton Corporation* | | | | 9,134 | | 179,479 |
| Sun Life Financial Inc. | | | | 1,510 | | 44,402 |
| Suncor Energy Inc. | | | | 18,664 | | 638,486 |
| Talisman Energy Inc. | | | | 20,270 | | 345,017 |
| The Toronto-Dominion Bank | | | | 4,832 | | 359,142 |
| | | |
| Cayman Islands—0.6% | | | | | | |
| China Mengniu Dairy Company Ltd. | | | | 106,000 | | 316,134 |
| Hengan International Group Company Ltd. | | | | 24,500 | | 187,569 |
| Sands China Ltd.* | | | | 66,400 | | 107,585 |
| | | |
| China—0.4% | | | | | | |
| Beijing Capital International Airport Company Ltd. | | | | 84,717 | | 51,001 |
| China Shenhua Energy Company Ltd. | | | | 44,500 | | 189,670 |
| | |
| 22 | | The accompanying notes are an integral part of the financial statements. |
Investment Portfolios
| | | | | | |
| EAGLE INTERNATIONAL EQUITY FUND (cont’d) | | | | | | |
| Common stocks—93.3% (a) | | | | Shares | | Value |
| China (cont’d) | | | | | | |
| Shandong Weigao Group Medical Polymer Company Ltd. | | | | 10,000 | | $47,132 |
| Sinopharm Group Company | | | | 22,800 | | 102,693 |
| | | |
| Czech—1.3% | | | | | | |
| Komercni Banka, AS | | | | 6,282 | | 1,296,090 |
| | | |
| Denmark—1.1% | | | | | | |
| A.P. Moller-Maersk AS | | | | 26 | | 215,687 |
| DSV AS | | | | 3,745 | | 66,680 |
| Novo Nordisk AS, Class B | | | | 9,449 | | 771,770 |
| | | |
| Finland—0.8% | | | | | | |
| Fortum Oyj | | | | 6,455 | | 167,243 |
| Kesko Oyj, Class B | | | | 4,291 | | 166,392 |
| Stora Enso Oyj, Class R | | | | 23,561 | | 197,571 |
| UPM-Kymmene Oyj | | | | 15,686 | | 226,470 |
| | | |
| France—6.1% | | | | | | |
| Aeroports de Paris | | | | 2,473 | | 203,097 |
| AXA SA | | | | 15,760 | | 313,261 |
| BNP Paribas | | | | 12,195 | | 838,176 |
| Carrefour SA | | | | 5,164 | | 253,297 |
| CFAO SA | | | | 2,397 | | 82,082 |
| Danone | | | | 14,963 | | 883,174 |
| EDF SA | | | | 2,671 | | 143,698 |
| Eutelsat Communications | | | | 3,878 | | 138,252 |
| France Telecom SA | | | | 4,622 | | 101,316 |
| Iliad SA | | | | 2,613 | | 261,010 |
| L’Occitane International SA* | | | | 4,527 | | 8,793 |
| LVMH Moet Hennessy Louis Vuitton SA | | | | 4,578 | | 523,354 |
| PPR | | | | 2,825 | | 378,044 |
| Publicis Groupe SA | | | | 2,948 | | 130,530 |
| Sanofi-Aventis SA | | | | 10,388 | | 711,301 |
| Schneider Electric SA | | | | 2,053 | | 234,518 |
| Technip SA | | | | 1,886 | | 150,718 |
| Vallourec SA | | | | 599 | | 119,745 |
| Veolia Environnement | | | | 5,439 | | 170,907 |
| Vinci SA | | | | 7,596 | | 425,416 |
| | | |
| Germany—6.1% | | | | | | |
| Adidas AG | | | | 3,341 | | 196,186 |
| Allianz SE | | | | 4,194 | | 481,478 |
| Bayer AG | | | | 5,305 | | 339,570 |
| Bilfinger Berger AG | | | | 1,023 | | 68,045 |
| Daimler AG | | | | 10,415 | | 538,250 |
| Deutsche Boerse AG | | | | 3,985 | | 310,603 |
| Deutsche Telekom AG | | | | 5,333 | | 69,346 |
| E.ON AG | | | | 13,661 | | 504,925 |
| Fraport AG | | | | 24,338 | | 1,261,235 |
| Fresenius SE | | | | 4,994 | | 355,802 |
| HeidelbergCement AG | | | | 6,724 | | 417,958 |
| Henkel AG & Co. KGaA | | | | 652 | | 29,421 |
| HOCHTIEF AG | | | | 752 | | 62,225 |
| MAN SE | | | | 6,223 | | 589,242 |
| Metro AG | | | | 982 | | 59,039 |
| RWE AG | | | | 3,974 | | 325,183 |
| SAP AG | | | | 5,231 | | 252,007 |
| Siemens AG | | | | 2,332 | | 230,548 |
| | | |
| Greece—0.2% | | | | | | |
| Coca Cola Hellenic Bottling Company SA | | | | 7,849 | | 212,688 |
| | | |
| Hong Kong—1.1% | | | | | | |
| China Merchants Holdings International Company Ltd. | | | | 98,970 | | 343,263 |
| China Resources Enterprise Ltd. | | | | 126,000 | | 442,555 |
| | | | | | |
| | | |
| Common stocks—93.3% (a) | | | | Shares | | Value |
| GOME Electrical Appliances Holdings Ltd. | | | | 325,773 | | $104,286 |
| Lenovo Group Ltd. | | | | 272,000 | | 200,181 |
| | | |
| Hungary—1.0% | | | | | | |
| OTP Bank PLC | | | | 28,340 | | 997,736 |
| | | |
| India—2.4% | | | | | | |
| Dr. Reddy’s Laboratories Ltd., Sponsored ADR | | | | 5,040 | | 141,574 |
| HDFC Bank Ltd., Sponsored ADR | | | | 3,415 | | 509,245 |
| ICICI Bank Ltd., Sponsored ADR | | | | 14,121 | | 600,425 |
| Infosys Technologies Ltd., Sponsored ADR | | | | 3,448 | | 206,466 |
| Sterlite Industries India Ltd., Sponsored ADR | | | | 23,725 | | 430,372 |
| Tata Motors Ltd., Sponsored ADR | | | | 24,365 | | 498,264 |
| | | |
| Indonesia—0.2% | | | | | | |
| Telekomunikasi Indonesia Tbk PT | | | | 174,006 | | 149,657 |
| | | |
| Ireland—0.5% | | | | | | |
| CRH PLC | | | | 6,297 | | 176,659 |
| Dragon Oil PLC* | | | | 23,510 | | 173,203 |
| Shire PLC | | | | 5,267 | | 116,288 |
| | | |
| Israel—0.5% | | | | | | |
| Teva Pharmaceutical Industries Ltd., Sponsored ADR | | | | 9,041 | | 530,978 |
| | | |
| Italy—1.9% | | | | | | |
| Buzzi Unicem SpA | | | | 9,412 | | 140,728 |
| ENI SpA | | | | 13,441 | | 301,313 |
| Fiat SpA | | | | 5,720 | | 75,600 |
| Intesa Sanpaolo SpA | | | | 28,579 | | 94,054 |
| Mediobanca SpA* | | | | 24,137 | | 222,821 |
| Prysmian SpA | | | | 3,237 | | 58,156 |
| Saipem SpA | | | | 4,045 | | 151,736 |
| Telecom Italia SpA | | | | 177,416 | | 248,321 |
| UniCredit SpA | | | | 247,923 | | 650,262 |
| | | |
| Japan—10.4% | | | | | | |
| Aisin Seiki Company Ltd. | | | | 2,801 | | 84,357 |
| Asahi Breweries Ltd. | | | | 6,300 | | 113,546 |
| Asahi Glass Company Ltd. | | | | 12,000 | | 141,913 |
| Canon Inc. | | | | 7,473 | | 341,180 |
| Central Japan Railway Company | | | | 13 | | 105,913 |
| Credit Saison Company, Ltd. | | | | 7,600 | | 111,381 |
| Daikin Industries Ltd. | | | | 3,070 | | 116,318 |
| Denso Corporation | | | | 4,411 | | 127,804 |
| East Japan Railway Company | | | | 3,956 | | 264,229 |
| Eisai Company Ltd. | | | | 1,700 | | 58,238 |
| Fanuc Ltd. | | | | 3,400 | | 402,184 |
| Fukuoka Financial Group Inc. | | | | 18,000 | | 77,420 |
| Honda Motor Company Ltd. | | | | 23,990 | | 810,629 |
| ITOCHU Corporation | | | | 16,000 | | 139,159 |
| JFE Holdings Inc. | | | | 2,943 | | 106,053 |
| Kirin Holdings Company Ltd. | | | | 9,800 | | 140,738 |
| Komatsu Ltd. | | | | 8,000 | | 161,454 |
| Kubota Corporation | | | | 8,770 | | 77,129 |
| Kyocera Corporation | | | | 700 | | 68,850 |
| Mazda Motor Corporation | | | | 35,000 | | 104,327 |
| Mitsubishi Corporation | | | | 18,200 | | 431,882 |
| Mitsubishi Electric Corporation | | | | 11,000 | | 98,202 |
| Mitsubishi Heavy Industries Ltd. | | | | 14,000 | | 56,352 |
| Mitsubishi UFJ Financial Group Inc. | | | | 116,600 | | 606,661 |
| Mitsubishi UFJ Lease & Finance Company Ltd. | | | | 780 | | 30,229 |
| Mitsui & Company Ltd. | | | | 26,400 | | 398,355 |
| NGK Insulators Ltd. | | | | 5,818 | | 114,526 |
| Nidec Corporation | | | | 5,700 | | 590,419 |
| | |
| The accompanying notes are an integral part of the financial statements. | | 23 |
Investment Portfolios
| | | | | | |
| EAGLE INTERNATIONAL EQUITY FUND (cont’d) | | | | | | |
| Common stocks—93.3% (a) | | | | Shares | | Value |
| Japan (cont’d) | | | | | | |
| Nintendo Company Ltd. | | | | 1,961 | | $659,073 |
| Nippon Telegraph & Telephone Corporation | | | | 2,500 | | 101,478 |
| Nissan Motor Company Ltd. | | | | 32,000 | | 280,364 |
| NSK Ltd. | | | | 6,000 | | 45,899 |
| NTT DoCoMo Inc. | | | | 91 | | 141,549 |
| ORIX Corporation | | | | 2,712 | | 248,381 |
| Panasonic Corporation | | | | 21,953 | | 320,919 |
| Resona Holdings Inc. | | | | 5,900 | | 72,168 |
| Ricoh Company Ltd. | | | | 6,000 | | 102,582 |
| Shin-Etsu Chemical Company Ltd. | | | | 1,400 | | 80,842 |
| SMC Corporation | | | | 850 | | 121,995 |
| Sony Corporation | | | | 11,386 | | 389,230 |
| Stanley Electric Company Ltd. | | | | 2,200 | | 45,129 |
| Sumitomo Mitsui Financial Group Inc. | | | | 16,600 | | 547,658 |
| Suzuki Motor Corporation | | | | 16,700 | | 352,545 |
| Takeda Pharmaceutical Company Ltd. | | | | 1,657 | | 71,310 |
| The Bank of Yokohama Ltd. | | | | 14,500 | | 75,792 |
| The Chiba Bank Ltd. | | | | 8,700 | | 55,385 |
| The Sumitomo Trust & Banking Company Ltd. | | | | 45,600 | | 276,702 |
| Toyota Motor Corporation | | | | 10,441 | | 403,232 |
| Unicharm Corporation | | | | 1,672 | | 162,340 |
| | | |
| Luxembourg—0.6% | | | | | | |
| Evraz Group SA, Sponsored GDR | | | | 12,657 | | 459,237 |
| SES SA | | | | 6,632 | | 152,497 |
| | | |
| Malaysia—0.0% | | | | | | |
| Axiata Group Bhd* | | | | 26,800 | | 32,544 |
| | | |
| Mexico—2.0% | | | | | | |
| America Movil, SAB de CV, Sponsored ADR | | | | 9,065 | | 466,666 |
| Cemex SAB de CV* | | | | 106,265 | | 126,787 |
| Cemex SAB de CV, Sponsored ADR* | | | | 35,437 | | 420,992 |
| Fomento Economico Mexicano, SAB de CV, Sponsored ADR | | | | 13,034 | | 616,899 |
| Grupo Comercial Chedraui SA de CV* | | | | 11,169 | | 32,612 |
| Grupo Financiero Banorte, SAB de CV | | | | 42,298 | | 170,054 |
| Grupo Televisa SA | | | | 5,277 | | 21,957 |
| Grupo Televisa SA, Sponsored ADR | | | | 8,693 | | 180,641 |
| | | |
| Netherlands—6.1% | | | | | | |
| ASML Holding NV | | | | 6,235 | | 203,242 |
| Heineken NV | | | | 8,456 | | 392,513 |
| ING Groep NV | | | | 54,861 | | 491,081 |
| Koninklijke KPN NV | | | | 35,699 | | 533,749 |
| Koninklijke Philips Electronics NV | | | | 11,356 | | 383,739 |
| Randstad Holding NV | | | | 4,234 | | 215,845 |
| Royal Dutch Shell PLC, Class A | | | | 66,894 | | 2,096,202 |
| TNT NV | | | | 22,623 | | 695,202 |
| Unilever NV | | | | 36,271 | | 1,108,472 |
| | | |
| Norway—1.3% | | | | | | |
| DnB NOR ASA | | | | 12,322 | | 144,997 |
| Marine Harvest ASA | | | | 117,230 | | 108,457 |
| Statoil ASA | | | | 33,448 | | 807,439 |
| Storebrand ASA | | | | 10,263 | | 77,277 |
| Telenor ASA | | | | 10,763 | | 153,771 |
| | | |
| Papua New Guinea—0.1% | | | | | | |
| Lihir Gold Ltd. | | | | 34,548 | | 122,392 |
| | | |
| Poland—1.6% | | | | | | |
| Bank Pekao SA | | | | 12,505 | | 709,824 |
| Bank Zachodni WBK SA | | | | 1,034 | | 75,769 |
| Powszechna Kasa Oszczednosci Bank Polski SA | | | | 58,603 | | 841,200 |
| | | | | | |
| | | |
| Common stocks—93.3% (a) | | | | Shares | | Value |
| Portugal—0.2% | | | | | | |
| Galp Energia SGPS SA, Class B | | | | 12,000 | | $191,325 |
| | | |
| Russia—5.4% | | | | | | |
| Gazprom Neft JSC, Sponsored ADR* | | | | 1,850 | | 50,548 |
| Magnit OJSC, Sponsored GDR | | | | 17,900 | | 333,676 |
| Mechel, Sponsored ADR | | | | 12,927 | | 332,224 |
| MMC Norilsk Nickel, Sponsored ADR* | | | | 41,214 | | 791,309 |
| Mobile Telesystems OJSC, Sponsored ADR | | | | 961 | | 53,095 |
| NovaTek OAO | | | | 38,376 | | 239,850 |
| NovaTek OAO, Sponsored GDR | | | | 2,230 | | 168,406 |
| Novorossiysk Commercial Sea Port, Sponsored GDR | | | | 1,100 | | 14,850 |
| Rosneft Oil Company, Sponsored GDR | | | | 84,015 | | 679,158 |
| Sberbank | | | | 703,898 | | 1,895,222 |
| Sistema JSFC, Sponsored GDR | | | | 1,750 | | 46,660 |
| Uralkali, Sponsored GDR | | | | 2,405 | | 51,693 |
| VTB Bank OJSC, Sponsored GDR | | | | 56,992 | | 305,953 |
| X 5 Retail Group NV, Sponsored GDR* | | | | 12,950 | | 460,372 |
| | | |
| South Africa—1.3% | | | | | | |
| AngloGold Ashanti Ltd. | | | | 1,327 | | 55,689 |
| Aspen Pharmacare Holdings Ltd. | | | | 29,550 | | 332,216 |
| Impala Platinum Holdings Ltd. | | | | 7,421 | | 209,018 |
| Massmart Holdings Ltd. | | | | 7,383 | | 109,948 |
| Shoprite Holdings Ltd. | | | | 30,374 | | 323,772 |
| Standard Bank Group Ltd. | | | | 19,466 | | 301,768 |
| | | |
| South Korea—1.4% | | | | | | |
| Hyundai Motor Company | | | | 4,619 | | 564,507 |
| POSCO | | | | 866 | | 388,920 |
| Samsung Electronics Company Ltd. | | | | 595 | | 450,008 |
| | | |
| Spain—0.4% | | | | | | |
| Amadeus IT Holding SA, Class A* | | | | 4,691 | | 74,950 |
| Ferrovial SA | | | | 11,049 | | 97,396 |
| Inditex SA | | | | 3,359 | | 206,481 |
| | | |
| Sweden—1.3% | | | | | | |
| Atlas Copco AB, Class A | | | | 10,524 | | 171,157 |
| Hennes & Mauritz AB, Class B | | | | 4,848 | | 309,042 |
| Sandvik AB | | | | 19,912 | | 288,233 |
| Svenska Cellulosa AB, Class B | | | | 8,212 | | 107,570 |
| Swedish Match AB | | | | 1,968 | | 44,940 |
| TeliaSonera AB | | | | 8,767 | | 60,218 |
| Volvo AB, Class B | | | | 25,673 | | 317,760 |
| | | |
| Switzerland—7.8% | | | | | | |
| ABB Ltd. | | | | 13,078 | | 251,684 |
| Credit Suisse Group AG | | | | 10,811 | | 494,568 |
| Flughafen Zuerich AG | | | | 566 | | 186,712 |
| Holcim Ltd. | | | | 3,494 | | 262,005 |
| Nestle SA | | | | 30,794 | | 1,502,886 |
| Nobel Biocare Holding AG | | | | 6,128 | | 134,615 |
| Novartis AG | | | | 33,421 | | 1,705,180 |
| Roche Holding AG | | | | 6,725 | | 1,062,977 |
| Swiss Reinsurance Company Ltd. | | | | 3,842 | | 167,485 |
| Swisscom AG | | | | 375 | | 127,124 |
| Syngenta AG | | | | 1,866 | | 473,828 |
| The Swatch Group AG | | | | 831 | | 244,956 |
| UBS AG | | | | 22,207 | | 343,087 |
| Xstrata PLC | | | | 41,104 | | 680,673 |
| Zurich Financial Services AG | | | | 868 | | 193,525 |
| | | |
| Taiwan—3.3% | | | | | | |
| Acer Inc. | | | | 165,000 | | 447,316 |
| | |
| 24 | | The accompanying notes are an integral part of the financial statements. |
Investment Portfolios
| | | | | | |
| EAGLE INTERNATIONAL EQUITY FUND (cont’d) | | |
| Common stocks—93.3% (a) | | | | Shares | | Value |
| Taiwan (cont’d) | | | | | | |
| Asustek Computer Inc. | | | | 192,000 | | $368,510 |
| Hon Hai Precision Industry Company Ltd. | | | | 268,000 | | 1,251,817 |
| HTC Corporation | | | | 55,000 | | 734,631 |
| MediaTek Inc. | | | | 2,000 | | 33,648 |
| Taiwan Semiconductor Manufacturing Company Ltd. | | | | 262,000 | | 511,023 |
| | | |
| Thailand—0.1% | | | | | | |
| Thai Beverage PCL | | | | 477,000 | | 98,757 |
| | | |
| Ukraine—0.4% | | | | | | |
| Raiffeisen Bank Aval* | | | | 1,908,985 | | 117,458 |
| Ukrsotsbank JSCB* | | | | 2,466,696 | | 222,042 |
| UkrTelecom* | | | | 401,238 | | 38,823 |
| | | |
| United Kingdom—2.6% | | | | | | |
| ARM Holdings PLC | | | | 35,704 | | 138,182 |
| Cairn Energy PLC* | | | | 18,472 | | 112,774 |
| Carnival PLC | | | | 1,723 | | 74,695 |
| Compass Group PLC | | | | 13,596 | | 110,975 |
| Petropavlovsk PLC | | | | 8,210 | | 147,333 |
| Reckitt Benckiser Group PLC | | | | 23,707 | | 1,230,390 |
| Rolls-Royce Group PLC, Class C* | | | | 1,610,010 | | 2,463 |
| Royal Bank of Scotland Group PLC | | | | 299,240 | | 245,799 |
| SABMiller PLC | | | | 5,121 | | 160,803 |
| Smith & Nephew PLC | | | | 4,086 | | 42,416 |
| Whitbread PLC | | | | 2,991 | | 70,291 |
| WM Morrison Supermarkets PLC | | | | 49,893 | | 220,841 |
| | | |
| United States—0.1% | | | | | | |
| CTC Media, Inc. | | | | 4,373 | | 73,860 |
| Total common stocks (cost $78,972,815) | | | | | | 93,316,714 |
| | | |
| Preferred stocks—1.3% (a) | | | | | | |
| Brazil—0.7% | | | | | | |
| Centrais Eletricas Brasileiras SA | | | | 4,498 | | 78,147 |
| Cia Brasileira de Distribuicao | | | | 7,462 | | 255,294 |
| Petroleo Brasileiro SA | | | | 19,692 | | 371,579 |
| | | |
| Germany—0.6% | | | | | | |
| Henkel AG & Company KGaA | | | | 4,195 | | 224,481 |
| Porsche Automobil Holding SE | | | | 2,100 | | 122,145 |
| Volkswagen AG | | | | 2,181 | | 210,293 |
| Total preferred stocks (cost $1,187,483) | | | | | | 1,261,939 |
| | | |
| Investment companies—3.9% (a) | | | | | | |
| India—0.6% | | | | | | |
| iShares MSCI India ETF* | | | | 79,700 | | 577,931 |
| | | |
| United States—3.3% | | | | | | |
| iShares MSCI Emerging Markets Index Fund ETF | | | | 24,021 | | 1,010,083 |
| Market Vectors - Gold Miners ETF | | | | 23,232 | | 1,173,913 |
| SPDR Gold Trust ETF* | | | | 9,895 | | 1,141,686 |
| Total investment companies (cost $3,560,445) | | | | | | 3,903,613 |
| | | |
| Rights—0.0% (a) | | | | | | |
| Brazil—0.0% | | | | | | |
| Cia Brasileira de Distribuicao 06/02/10* | | | | 32 | | 0 |
| Total rights (cost $0) | | | | | | 0 |
| | |
| Total investment portfolio excluding repurchase agreement (cost $83,720,743) | | | | 98,482,266 |
| | | | | | |
| | | |
| Repurchase agreement—0.6% (a) | | | | | | Value |
Repurchase agreement with Fixed Income Clearing Corporation dated April 30, 2010 @ 0.05% to be repurchased at $619,003 on May 3, 2010, collateralized by $640,000 United States Treasury Notes, 1.375% due February 15, 2013 (market value $641,099 including interest)
(cost $619,000) | | $619,000 |
| | | |
| Total investment portfolio (cost $84,339,743) 99.1% (a) | | | | | | $99,101,266 |
| |
* Non-income producing security. (a) Percentages indicated are based on net assets of $100,038,736. (b) Restricted securities deemed to be illiquid for purposes of compliance limitations on holdings of illiquid securities. At April 30, 2010, these securities aggregated $2,463 or 0.0% of the net assets of the Fund. ADR—American depository receipt ETF—Exchange-traded fund GDR—Global depository receipt SPDR—Standard & Poor’s depository receipt | | |
| | |
| |
| Sector allocation | | |
| Sector | | Percent of net assets |
| Financial | | 25.3% |
| Consumer, non-cyclical | | 19.5% |
| Basic materials | | 13.9% |
| Industrial | | 11.8% |
| Consumer, cyclical | | 9.0% |
| Energy | | 7.5% |
| Communications | | 4.6% |
| Technology | | 4.1% |
| Other sectors | | 2.8% |
| Cash | | 0.6% |
| | | | | | | | | | | |
|
| Forward foreign currency contracts outstanding | |
| Contract to deliver | | In exchange for | | Delivery
date | | Unrealized
appreciation
(depreciation) | |
| CZK | | 17,555,820 | | USD | | 936,510 | | 6/16/10 | | $24,891 | |
| EUR | | 8,042,028 | | USD | | 10,966,914 | | 6/16/10 | | 257,789 | |
| EUR | | 2,283,863 | | USD | | 3,004,282 | | 6/16/10 | | (37,013 | ) |
| SEK | | 3,742,262 | | USD | | 515,376 | | 6/16/10 | | (1,376 | ) |
| USD | | 3,492,961 | | EUR | | 2,603,068 | | 6/16/10 | | (26,599 | ) |
| | | | Net unrealized appreciation | | $217,692 | |
| | | |
| CZK—Czech Koruna | | | | | | | |
| EUR—Euro Currency | | | | | | | |
| SEK—Swedish Krona | | | | | | | |
| USD—United States Dollar | | | | | | | |
| | |
| The accompanying notes are an integral part of the financial statements. | | 25 |
Investment Portfolios
| | | | |
| EAGLE INTERNATIONAL EQUITY FUND (cont’d) |
| Industry Allocation | | |
| Industry | | Value | | Percent of
net assets |
| Banks | | $19,666,048 | | 19.7% |
| Mining | | 10,795,645 | | 10.8% |
| Oil & gas | | 7,010,778 | | 7.0% |
| Pharmaceuticals | | 6,884,893 | | 6.9% |
| Food | | 6,642,194 | | 6.6% |
| Auto manufacturers | | 4,277,916 | | 4.3% |
| Telecommunications | | 3,468,252 | | 3.5% |
| Engineering & construction | | 3,205,486 | | 3.2% |
| Electronics | | 2,409,351 | | 2.4% |
| Insurance | | 2,198,923 | | 2.2% |
| Beverages | | 2,116,469 | | 2.1% |
| Financial services | | 2,049,952 | | 2.0% |
| Computers | | 1,957,104 | | 2.0% |
| Building materials | | 1,803,360 | | 1.8% |
| Transportation | | 1,611,062 | | 1.6% |
| Retail | | 1,592,392 | | 1.6% |
| Equity fund | | 1,588,014 | | 1.6% |
| Machinery | | 1,457,518 | | 1.5% |
| Iron/steel | | 1,324,450 | | 1.3% |
| Healthcare products | | 1,324,231 | | 1.3% |
| Electric | | 1,321,435 | | 1.3% |
| Chemicals | | 1,263,023 | | 1.3% |
| Household products | | 1,259,811 | | 1.3% |
| Commodity fund | | 1,141,685 | | 1.1% |
| Semiconductors | | 1,132,861 | | 1.1% |
| Distribution/wholesale | | 969,396 | | 1.0% |
| Agriculture | | 823,622 | | 0.8% |
| Home furnishings | | 710,149 | | 0.7% |
| Toys/games/hobbies | | 659,073 | | 0.6% |
| Forest products & paper | | 531,611 | | 0.5% |
| Office/business equipment | | 443,762 | | 0.4% |
| Multimedia | | 428,170 | | 0.4% |
| Hand/machine tools | | 410,228 | | 0.4% |
| Electrical components & equipment | | 390,876 | | 0.4% |
| Software | | 326,957 | | 0.3% |
| Oil & gas services | | 302,454 | | 0.3% |
| Internet | | 261,010 | | 0.3% |
| Auto parts & equipment | | 257,290 | | 0.3% |
| Diversified manufacturer | | 230,548 | | 0.2% |
| Commercial services | | 220,935 | | 0.2% |
| Semiconductor equipment | | 203,242 | | 0.2% |
| | | | |
| |
| Industry Allocation (cont’d) | | |
| Industry | | Value | | Percent of
net assets |
| Broadcasting services/programs | | $202,598 | | 0.2% |
| Apparel | | 196,186 | | 0.2% |
| Coal | | 189,670 | | 0.2% |
| Cosmetics/personal care | | 171,133 | | 0.2% |
| Water | | 170,908 | | 0.2% |
| Metal fabricate/hardware | | 165,644 | | 0.2% |
| Aerospace/defense | | 160,446 | | 0.2% |
| Advertising | | 130,530 | | 0.1% |
| Food service | | 110,975 | | 0.1% |
| Lodging | | 107,585 | | 0.1% |
| Leisure time | | 74,695 | | 0.1% |
| Television, cable & radio | | 73,860 | | 0.1% |
| Healthcare services | | 55,860 | | 0.1% |
| Total investment portfolio excluding repurchase agreement | | $98,482,266 | | 98.5% |
| | | | | | |
| | | | |
| EAGLE INVESTMENT GRADE BOND FUND | | | | | | |
| Corporate bonds—29.5% (a) | | | | Principal
amount
(in thousands) | | Value |
| Aerospace/defense—1.5% | | | | |
| Lockheed Martin Corporation, 4.25%, 11/15/19 | | | | 306 | | $304,640 |
| United Technologies Corporation, 5.375%, 12/15/17 | | | | 247 | | 272,294 |
| | | |
| Banks—1.8% | | | | | | |
| JPMorgan Chase & Company, 3.7%, 01/20/15 | | | | 337 | | 343,895 |
| The Goldman Sachs Group Inc., 6.0%, 05/01/14 | | | | 323 | | 347,459 |
| | | |
| Beverages—2.9% | | | | | | |
| Anheuser-Busch InBev Worldwide Inc., 144A, 3.625%, 04/15/15 | | | | 350 | | 354,019 |
| PepsiCo Inc., 7.9%, 11/01/18 | | | | 230 | | 290,122 |
| The Coca-Cola Company, 5.35%, 11/15/17 | | | | 425 | | 473,414 |
| | | |
| Biotechnology—0.6% | | | | | | |
| Amgen Inc., 5.7%, 02/01/19 | | | | 226 | | 250,044 |
| | | |
| Diversified manufacturer—0.6% | | | | | | |
| ITT Corporation, 6.125%, 05/01/19 | | | | 205 | | 227,167 |
| | | |
| Electric—2.9% | | | | | | |
| Carolina Power & Light Company, 5.25%, 12/15/15 | | | | 150 | | 166,970 |
| Exelon Generation Company LLC, 5.2%, 10/01/19 | | | | 340 | | 351,195 |
| Progress Energy Carolina, 5.3%, 01/15/19 | | | | 85 | | 91,355 |
| PSEG Power LLC, 144A, 2.5%, 04/15/13 | | | | 250 | | 250,783 |
| Virginia Electric and Power Company, 5.4%, 01/15/16 | | | | 190 | | 208,060 |
| Virginia Electric and Power Company, 5.4%, 04/30/18 | | | | 60 | | 65,007 |
| | | |
| Financial services—2.7% | | | | | | |
| BlackRock Inc., Series 2, 5.0%, 12/10/19 | | | | 305 | | 312,961 |
| CME Group Inc., 5.4%, 08/01/13 | | | | 400 | | 440,297 |
| TD Ameritrade Holding Corporation, 4.15%, 12/01/14 | | | | 300 | | 306,398 |
| | | |
| Food—0.8% | | | | | | |
| General Mills Inc., 5.65%, 02/15/19 | | | | 290 | | 317,022 |
| | |
| 26 | | The accompanying notes are an integral part of the financial statements. |
Investment Portfolios
| | | | | | |
| EAGLE INVESTMENT GRADE BOND FUND (cont’d) | | | | | | |
| Corporate bonds—29.5% (a) | | | | Principal
amount
(in thousands) | | Value |
| Gas—0.6% | | | | | | |
| Sempra Energy, 9.8%, 02/15/19 | | | | 175 | | $232,433 |
| | | |
| Healthcare products—1.1% | | | | | | |
| Baxter International Inc., 5.375%, 06/01/18 | | | | 160 | | 175,160 |
| St. Jude Medical Inc., 3.75%, 07/15/14 | | | | 231 | | 239,250 |
| | | |
| Insurance—0.7% | | | | | | |
| Berkshire Hathaway Finance Corporation, 5.4%, 05/15/18 | | | | 235 | | 253,375 |
| | | |
| Mining—1.8% | | | | | | |
| Barrick Gold Corporation, 6.95%, 04/01/19 | | | | 293 | | 343,276 |
| Newmont Mining Corporation, 5.125%, 10/01/19 | | | | 330 | | 340,188 |
| | | |
| Oil & gas—1.9% | | | | | | |
| Devon Energy Corporation, 5.625%, 01/15/14 | | | | 181 | | 199,562 |
| Shell International Finance BV, 1.875%, 03/25/13 | | | | 250 | | 251,093 |
| XTO Energy Inc., 5.75%, 12/15/13 | | | | 254 | | 286,416 |
| | | |
| Pharmaceuticals—1.4% | | | | | | |
| Express Scripts Inc., 5.25%, 06/15/12 | | | | 166 | | 177,796 |
| Pfizer Inc., 6.2%, 03/15/19 | | | | 304 | | 346,649 |
| | | |
| Retail—0.5% | | | | | | |
| McDonald’s Corporation, 5.8%, 10/15/17 | | | | 115 | | 130,148 |
| Wal-Mart Stores Inc. Pass Through Trusts, Series C, 8.875%, 06/29/11 | | | | 53 | | 53,105 |
| | | |
| Software—1.6% | | | | | | |
| Adobe Systems Inc., 3.25%, 02/01/15 | | | | 181 | | 183,060 |
| CA Inc., 6.125%, 12/01/14 | | | | 150 | | 164,572 |
| Oracle Corporation, 3.75%, 07/08/14 | | | | 255 | | 267,659 |
| | | |
| Telecommunications—3.8% | | | | | | |
| AT&T Corporation, 7.3%, 11/15/11 | | | | 306 | | 333,795 |
| Cisco Systems Inc., 4.95%, 02/15/19 | | | | 251 | | 266,200 |
| Deutsche Telekom International Finance BV, 5.875%, 08/20/13 | | | | 300 | | 328,910 |
| Verizon Communications Inc., 6.35%, 04/01/19 | | | | 460 | | 516,789 |
| | | |
| Television, cable & radio—0.6% | | | | | | |
| DIRECTV Holdings LLC, 144A, 3.55%, 03/15/15 | | | | 250 | | 249,207 |
| | | |
| Transportation—1.7% | | | | | | |
| Norfolk Southern Corporation, 5.9%, 06/15/19 | | | | 200 | | 218,579 |
| Union Pacific Corporation, 5.7%, 08/15/18 | | | | 410 | | 441,925 |
| Total corporate bonds (cost $11,272,741) | | | | | | 11,372,249 |
| | | |
| U.S. Government agency securities—21.7% (a) | | | | | | |
| Fixed rate U.S. Government agency securities—7.6% | | |
| Fannie Mae, 5.0%, 04/15/15 | | | | 1,075 | | 1,195,086 |
| Federal Home Loan Banks, 1.125%, 05/18/12 | | | | 500 | | 499,634 |
| Freddie Mac, 4.75%, 11/17/15 | | | | 1,100 | | 1,203,584 |
| | | |
| Government-backed corporate bonds—14.1% | | | | | | |
| Bank of America Corporation, FDIC, 3.125%, 06/15/12 | | | | 350 | | 363,826 |
| Citibank NA, FDIC, 1.75%, 12/28/12 | | | | 1,000 | | 1,006,847 |
| Citigroup Inc., FDIC, 2.125%, 04/30/12 | | | | 355 | | 362,125 |
| General Electric Capital Corporation, FDIC, 3.0%, 12/09/11 | | | | 1,340 | | 1,384,936 |
| John Deere Capital Corporation, FDIC, 2.875%, 06/19/12 | | | | 850 | | 880,682 |
| JPMorgan Chase & Company, FDIC, 3.125%, 12/01/11 | | | | 535 | | 553,832 |
| The Goldman Sachs Group Inc., FDIC, 3.25%, 06/15/12 | | | | 850 | | 887,236 |
| Total U.S. Government agency securities (cost $8,322,284) | | 8,337,788 |
| | | | | | |
| U.S. Treasuries—24.4% (a) | | | | Principal
amount
(in thousands) | | Value |
| U.S. Treasury Note, 4.0%, 08/15/18 | | | | 550 | | $573,891 |
| U.S. Treasury Note, 4.25%, 11/15/14 | | | | 3,050 | | 3,322,832 |
| U.S. Treasury Note, 4.5%, 02/15/16 | | | | 2,000 | | 2,196,094 |
| U.S. Treasury Note, 4.75%, 08/15/17 | | | | 3,000 | | 3,316,875 |
| Total U.S. Treasuries (cost $9,361,547) | | | | | | 9,409,692 |
| |
| Mortgage-backed obligations—20.0% (a) | | |
| Commercial mortgage-backed obligations—7.0% | | | | | | |
| Credit Suisse First Boston Mortgage Securities Corporation, Series 2005-C5, Class A3, 5.1%, 08/15/38 | | | | 379 | | 397,986 |
| JPMorgan Chase Commercial Mortgage Series Trust, Series 2002-C3, Class A2, 4.994%, 07/12/35 | | | | 275 | | 289,315 |
| JPMorgan Chase Commercial Mortgage Series Trust, Series 2003-PM1A, Class A4, 5.326%, 08/12/40 | | | | 230 | | 244,620 |
| LB-UBS Commercial Mortgage Trust, Series 2001-C7, Class A5, 6.133%, 12/15/30 | | | | 500 | | 525,934 |
| LB-UBS Commercial Mortgage Trust, Series 2003-C7, Class A2, 4.064%, 09/15/27 | | | | 100 | | 100,008 |
| Merrill Lynch Mortgage Investors Trust, Series 1998-C1, Class A3, 6.72%, 11/15/26 | | | | 23 | | 25,410 |
| Morgan Stanley Capital I, Series 2003-T11, Class A4, 5.15%, 06/13/41 | | | | 385 | | 409,556 |
| Wachovia Bank Commercial Mortgage Trust, Series 2003-C6, Class A3, 4.957%, 08/15/35 | | | | 683 | | 694,953 |
| |
| Federal agency mortgage-backed obligations—13.0% | | |
| Fannie Mae, Series 2006-63, Class AB, 6.5%, 10/25/33 | | | | 163 | | 168,441 |
| Fannie Mae, Series 2007-118, Class AB, 5.0%, 04/25/35 | | | | 863 | | 908,117 |
| Fannie Mae REMICs, Series 2006-B1, Class AB, 6.0%, 06/25/16 | | | | 15 | | 15,948 |
| Fannie Mae REMICs, Series 2007-B2, Class AB, 5.5%, 12/25/20 | | | | 1,169 | | 1,249,096 |
| Freddie Mac, Series 3114, Class GC, 5.0%, 01/15/34 | | | | 691 | | 726,750 |
| Freddie Mac, Series 3456, Class CG, 5.0%, 01/15/35 | | | | 657 | | 692,128 |
| Freddie Mac REMICs, Series R005, Class AB, 5.5%, 12/15/18 | | | | 178 | | 186,685 |
| Freddie Mac REMICs, Series R006, Class AK, 5.75%, 12/15/18 | | | | 346 | | 363,488 |
| Ginnie Mae, Series 2004-86, Class PK, 4.0%, 09/20/34 | | | | 667 | | 694,665 |
| Total mortgage-backed obligations (cost $7,614,940) | | 7,693,100 |
| | | |
| Total investment portfolio excluding repurchase agreement (cost $36,571,512) | | | | | | 36,812,829 |
| |
| Repurchase agreement—1.8% (a) | | |
| Repurchase agreement with Fixed Income Clearing Corporation dated April 30, 2010 @ 0.05% to be repurchased at $705,003 on May 3, 2010, collateralized by $730,000 United States Treasury Bills, due September 9, 2010 (market value $729,497 including interest) (cost $705,000) | | 705,000 |
| |
| Total investment portfolio (cost $37,276,512) 97.4% (a) | | $37,517,829 |
| |
| (a) Percentages indicated are based on net assets of $38,501,893. | | |
| |
| 144A—144A securities are issued pursuant to Rule 144A of the Securities Act of 1933. Most of these are deemed to be liquid for purposes of compliance limitations on holdings of illiquid securities and all may be resold as transactions exempt from registration to qualified institutional buyers. At April 30, 2010, these securities aggregated $854,009 or 2.2% of the net assets of the Fund. | | |
| FDIC—Federal deposit insurance corporation | | |
| REMIC—Real estate mortgage investment conduit | | |
| | |
| The accompanying notes are an integral part of the financial statements. | | 27 |
Investment Portfolios
| | |
| EAGLE INVESTMENT GRADE BOND FUND (cont’d) |
| Standard & Poor’s bond ratings | | |
| Bond rating | | Percent of net assets |
| AAA | | 28.6% |
| AA | | 3.5% |
| A | | 14.0% |
| BBB | | 12.0% |
| Not rated | | 37.5% |
| | | | | | |
| | | | |
| EAGLE LARGE CAP CORE FUND | | | | | | |
| Common stocks—87.5% (a) | | | | Shares | | Value |
| Advertising—3.1% | | | | | | |
| Omnicom Group Inc. | | | | 105,485 | | $4,499,990 |
| | | |
| Aerospace/defense—1.7% | | | | | | |
| United Technologies Corporation | | | | 31,980 | | 2,396,901 |
| | | |
| Auto manufacturers—2.3% | | | | | | |
| PACCAR Inc. | | | | 70,575 | | 3,283,149 |
| | | |
| Banks—12.1% | | | | | | |
| Bank of America Corporation | | | | 323,735 | | 5,772,195 |
| JPMorgan Chase & Company | | | | 62,355 | | 2,655,076 |
| The Goldman Sachs Group, Inc. | | | | 19,546 | | 2,838,079 |
| Wells Fargo & Company | | | | 185,270 | | 6,134,290 |
| | | |
| Computers—2.1% | | | | | | |
| EMC Corporation* | | | | 156,260 | | 2,970,503 |
| | | |
| Diversified manufacturer—5.7% | | | | | | |
| General Electric Company | | | | 171,030 | | 3,225,626 |
| Tyco International Ltd. | | | | 127,636 | | 4,951,000 |
| | | |
| Healthcare products—7.2% | | | | | | |
| Covidien PLC | | | | 53,546 | | 2,569,673 |
| Johnson & Johnson | | | | 76,815 | | 4,939,204 |
| Zimmer Holdings, Inc.* | | | | 46,950 | | 2,859,724 |
| | | |
| Healthcare services—2.0% | | | | | | |
| UnitedHealth Group Inc. | | | | 96,400 | | 2,921,884 |
| | | |
| Insurance—1.8% | | | | | | |
| MetLife, Inc. | | | | 55,430 | | 2,526,499 |
| | | |
| Multimedia—1.5% | | | | | | |
| Viacom Inc., Class B* | | | | 61,005 | | 2,155,307 |
| | | |
| Oil & gas—9.9% | | | | | | |
| BP PLC, Sponsored ADR | | | | 69,530 | | 3,625,990 |
| ConocoPhillips | | | | 77,420 | | 4,582,490 |
| EOG Resources Inc. | | | | 34,955 | | 3,919,155 |
| Exxon Mobil Corporation | | | | 32,015 | | 2,172,218 |
| | | |
| Oil & gas services—2.4% | | | | | | |
| Schlumberger Ltd. | | | | 48,535 | | 3,466,370 |
| | | |
| Pharmaceuticals—2.9% | | | | | | |
| Pfizer Inc. | | | | 247,345 | | 4,135,608 |
| | | |
| Retail—9.3% | | | | | | |
| Home Depot, Inc. | | | | 83,175 | | 2,931,919 |
| Macy’s Inc. | | | | 93,570 | | 2,170,824 |
| Staples, Inc. | | | | 242,535 | | 5,706,849 |
| Wal-Mart Stores, Inc. | | | | 49,200 | | 2,639,580 |
| | | | | | |
| | | |
| Common stocks—87.5% (a) | | | | Shares | | Value |
| Semiconductor equipment—3.6% | | | | | | |
| Applied Materials, Inc. | | | | 374,480 | | $5,160,334 |
| | | |
| Semiconductors—2.2% | | | | | | |
| Texas Instruments Inc. | | | | 121,975 | | 3,172,570 |
| | | |
| Software—10.8% | | | | | | |
| Activision Blizzard Inc. | | | | 234,565 | �� | 2,598,980 |
| Adobe Systems Inc.* | | | | 81,275 | | 2,730,027 |
| Autodesk, Inc.* | | | | 111,410 | | 3,789,054 |
| Electronic Arts Inc.* | | | | 79,840 | | 1,546,501 |
| Microsoft Corporation | | | | 160,410 | | 4,898,921 |
| | | |
| Telecommunications—5.5% | | | | | | |
| Cisco Systems, Inc.* | | | | 98,790 | | 2,659,427 |
| QUALCOMM Inc. | | | | 68,685 | | 2,660,857 |
| Sprint Nextel Corporation* | | | | 601,865 | | 2,557,926 |
| | | |
| Television, cable & radio—1.4% | | | | | | |
| Comcast Corporation, Class A | | | | 100,935 | | 1,992,456 |
| Total common stocks (cost $110,629,279) | | | | | | 125,817,156 |
| | | |
| Investment companies—2.8% (a) | | | | | | |
| Materials Select Sector SPDR ETF | | | | 119,310 | | 4,057,733 |
| Total investment companies (cost $3,976,137) | | | | | | 4,057,733 |
| | | |
| Total investment portfolio excluding repurchase agreement (cost $114,605,416) | | | | | | 129,874,889 |
| | | |
| Repurchase agreement—9.8% (a) | | | | | | |
| Repurchase agreement with Fixed Income Clearing Corporation dated April 30, 2010 @ 0.05% to be repurchased at $14,096,059 on May 3, 2010, collateralized by $14,675,000 United States Treasury Notes, 3.375% due November 15, 2019 (market value $14,587,981 including interest) (cost $14,096,000) | | 14,096,000 |
| |
| Total investment portfolio (cost $128,701,416) 100.1% (a) | | $143,970,889 |
| |
* Non-income producing security. (a) Percentages indicated are based on net assets of $143,868,241. | | |
| |
| ADR—American depository receipt | | |
| ETF—Exchange-traded fund | | |
| SPDR—Standard & Poor’s depository receipt | | |
| | |
| |
| Sector allocation | | |
| Sector | | Percent of net assets |
| Technology | | 18.8% |
| Financial | | 16.7% |
| Energy | | 12.3% |
| Consumer, non-cyclical | | 12.1% |
| Consumer, cyclical | | 11.6% |
| Communications | | 11.5% |
| Industrial | | 7.3% |
| Cash | | 9.8% |
| | |
| 28 | | The accompanying notes are an integral part of the financial statements. |
Investment Portfolios
| | | | | | |
| EAGLE MID CAP GROWTH FUND | | | | | | |
| Common stocks—97.1% (a) | | | | Shares | | Value |
| Aerospace/defense—1.6% | | | | | | |
| Goodrich Corporation | | | | 41,330 | | $3,065,859 |
| | | |
| Apparel—2.1% | | | | | | |
| Coach Inc. | | | | 98,190 | | 4,099,432 |
| | | |
| Auto manufacturers—3.1% | | | | | | |
| Navistar International Corporation* | | | | 68,305 | | 3,301,864 |
| Oshkosh Corporation* | | | | 67,105 | | 2,591,595 |
| | | |
| Banks—2.0% | | | | | | |
| Regions Financial Corporation | | | | 426,205 | | 3,767,652 |
| | | |
| Biotechnology—3.0% | | | | | | |
| Dendreon Corporation* | | | | 45,500 | | 2,467,010 |
| Illumina, Inc.* | | | | 31,600 | | 1,323,092 |
| United Therapeutics Corporation* | | | | 32,610 | | 1,855,183 |
| | | |
| Chemicals—2.5% | | | | | | |
| CF Industries Holdings Inc. | | | | 25,590 | | 2,141,115 |
| Huntsman Corporation | | | | 237,341 | | 2,708,061 |
| | | |
| Commercial services—5.7% | | | | | | |
| Apollo Group Inc., Class A* | | | | 51,710 | | 2,968,671 |
| Hewitt Associates Inc., Class A* | | | | 90,771 | | 3,720,703 |
| Ritchie Brothers Auctioneers Inc. | | | | 99,045 | | 2,317,653 |
| Robert Half International Inc. | | | | 68,110 | | 1,864,852 |
| | | |
| Computers—2.0% | | | | | | |
| SanDisk Corporation* | | | | 51,630 | | 2,059,521 |
| Western Digital Corporation* | | | | 43,760 | | 1,798,098 |
| | | |
| Electronics—5.3% | | | | | | |
| Dolby Laboratories, Inc., Class A* | | | | 66,620 | | 4,578,126 |
| Gentex Corporation | | | | 84,875 | | 1,823,964 |
| Thermo Fisher Scientific Inc.* | | | | 68,175 | | 3,768,714 |
| | | |
| Entertainment—2.4% | | | | | | |
| Bally Technologies, Inc.* | | | | 99,694 | | 4,597,887 |
| | | |
| Environmental control—2.2% | | | | | | |
| Republic Services, Inc. | | | | 63,565 | | 1,972,422 |
| Waste Connections, Inc.* | | | | 60,375 | | 2,160,821 |
| | | |
| Financial services—4.2% | | | | | | |
| Ameriprise Financial, Inc. | | | | 96,870 | | 4,490,893 |
| Jefferies Group Inc. | | | | 63,140 | | 1,718,671 |
| TD Ameritrade Holding Corporation* | | | | 91,555 | | 1,832,931 |
| | | |
| Healthcare products—1.8% | | | | | | |
| Inverness Medical Innovations Inc.* | | | | 37,490 | | 1,491,352 |
| Patterson Companies, Inc. | | | | 59,420 | | 1,900,846 |
| | | |
| Healthcare services—3.7% | | | | | | |
| CIGNA Corporation | | | | 55,055 | | 1,765,063 |
| Health Management Associates, Inc., Class A* | | | | 346,895 | | 3,233,061 |
| Lincare Holdings Inc.* | | | | 44,255 | | 2,066,266 |
| | | |
| Household products—2.6% | | | | | | |
| Church & Dwight Co., Inc. | | | | 72,400 | | 5,013,700 |
| | | |
| Housewares—1.6% | | | | | | |
| Newell Rubbermaid Inc. | | | | 174,905 | | 2,985,628 |
| | | |
| Insurance—1.1% | | | | | | |
| RenaissanceRe Holdings Ltd. | | | | 36,560 | | 2,045,532 |
| | | |
| Iron/steel—1.6% | | | | | | |
| Allegheny Technologies Inc. | | | | 57,490 | | 3,073,990 |
| Leisure time—3.4% | | | | | | |
| Carnival Corporation | | | | 114,100 | | 4,757,970 |
| | | | | | |
| | | |
| Common stocks—97.1% (a) | | | | Shares | | Value |
| Harley-Davidson, Inc. | | | | 53,940 | | $1,824,790 |
| | | |
| Lodging—1.5% | | | | | | |
| Las Vegas Sands Corporation* | | | | 112,555 | | 2,798,117 |
| | | |
| Machinery—3.7% | | | | | | |
| AGCO Corporation* | | | | 65,635 | | 2,298,538 |
| Bucyrus International Inc. | | | | 42,170 | | 2,657,132 |
| Cummins, Inc. | | | | 29,030 | | 2,096,837 |
| | | |
| Metal fabricate/hardware—1.0% | | | | | | |
| Precision Castparts Corporation | | | | 14,315 | | 1,837,187 |
| | | |
| Mining—1.6% | | | | | | |
| Freeport-McMoRan Copper & Gold Inc. | | | | 39,640 | | 2,994,009 |
| | | |
| Oil & gas—5.9% | | | | | | |
| Continental Resources Inc.* | | | | 96,375 | | 4,737,795 |
| Pioneer Natural Resources Company | | | | 29,380 | | 1,884,139 |
| Whiting Petroleum Corporation* | | | | 50,455 | | 4,557,600 |
| | | |
| Oil & gas services—1.4% | | | | | | |
| Baker Hughes Inc. | | | | 55,615 | | 2,767,402 |
| | | |
| Pharmaceuticals—5.7% | | | | | | |
| Express Scripts Inc.* | | | | 48,235 | | 4,829,771 |
| Mylan Inc.* | | | | 279,080 | | 6,148,132 |
| | | |
| Retail—3.9% | | | | | | |
| Chico’s FAS, Inc. | | | | 266,760 | | 3,972,056 |
| Limited Brands Inc. | | | | 130,805 | | 3,505,574 |
| | | |
| Semiconductors—7.5% | | | | | | |
| ARM Holdings PLC, Sponsored ADR | | | | 166,735 | | 1,905,781 |
| Linear Technology Corporation | | | | 90,545 | | 2,721,783 |
| Micron Technology, Inc.* | | | | 479,225 | | 4,480,754 |
| Rovi Corporation* | | | | 131,955 | | 5,143,606 |
| | | |
| Software—5.6% | | | | | | |
| ANSYS, Inc.* | | | | 90,830 | | 4,087,350 |
| Autodesk, Inc.* | | | | 125,775 | | 4,277,608 |
| MSCI Inc., Class A* | | | | 69,000 | | 2,390,850 |
| | | |
| Telecommunications—4.0% | | | | | | |
| Amdocs Ltd.* | | | | 121,635 | | 3,885,022 |
| American Tower Corporation, Class A* | | | | 49,975 | | 2,039,480 |
| Polycom, Inc.* | | | | 54,970 | | 1,789,274 |
| | | |
| Transportation—3.4% | | | | | | |
| Kansas City Southern* | | | | 118,840 | | 4,818,962 |
| Landstar System, Inc. | | | | 38,205 | | 1,689,428 |
| Total common stocks (cost $136,164,540) | | | | | | 185,467,175 |
| | | |
| Repurchase agreement—1.5% (a) | | | | | | |
| Repurchase agreement with Fixed Income Clearing Corporation dated April 30, 2010 @ 0.05% to be repurchased at $2,922,012 on May 3, 2010, collateralized by $3,045,000 United States Treasury Notes, 3.375% due November 15, 2019 (market value $3,026,944 including interest) (cost $2,922,000) | | 2,922,000 |
| |
| Total investment portfolio (cost $139,086,540) 98.6% (a) | | $188,389,175 |
| |
| * Non-income producing security. | | |
| (a) Percentages indicated are based on net assets of $190,939,028. | | |
| |
| ADR—American depository receipt | | |
| | |
| The accompanying notes are an integral part of the financial statements. | | 29 |
Investment Portfolios
| | |
| EAGLE MID CAP GROWTH FUND (cont’d) |
| Sector allocation | | |
| Sector | | Percent of net assets |
| Consumer, non-cyclical | | 19.5% |
| Technology | | 18.1% |
| Consumer, cyclical | | 18.0% |
| Industrial | | 17.2% |
| Energy | | 7.3% |
| Financial | | 7.3% |
| Basic materials | | 5.7% |
| Communications | | 4.0% |
| Cash | | 1.5% |
| | | | | | |
| | | | |
| EAGLE MID CAP STOCK FUND | | | | | | |
| Common stocks—99.4% (a) | | | | Shares | | Value |
| Domestic—88.4% | | | | | | |
| Advertising—1.0% | | | | | | |
| The Interpublic Group of Companies, Inc.* | | | | 1,783,311 | | $15,889,301 |
| | | |
| Apparel—2.6% | | | | | | |
| VF Corporation | | | | 480,387 | | 41,515,045 |
| | | |
| Auto manufacturers—2.0% | | | | | | |
| Oshkosh Corporation* | | | | 836,259 | | 32,296,323 |
| | | |
| Auto parts & equipment—1.5% | | | | | | |
| WABCO Holdings Inc.* | | | | 691,885 | | 22,963,663 |
| | | |
| Banks—3.1% | | | | | | |
| BOK Financial Corporation | | | | 38,629 | | 2,102,576 |
| Fifth Third Bancorp | | | | 1,631,890 | | 24,331,480 |
| State Street Corporation | | | | 533,385 | | 23,202,248 |
| | | |
| Beverages—1.9% | | | | | | |
| Dr. Pepper Snapple Group Inc. | | | | 906,158 | | 29,658,551 |
| | | |
| Biotechnology—1.0% | | | | | | |
| Bio-Rad Laboratories, Inc., Class A* | | | | 144,131 | | 16,097,991 |
| | | |
| Chemicals—5.2% | | | | | | |
| Air Products & Chemicals Inc. | | | | 411,989 | | 31,632,515 |
| Albemarle Corporation | | | | 367,524 | | 16,781,146 |
| Ecolab Inc. | | | | 359,100 | | 17,538,444 |
| Sigma-Aldrich Corporation | | | | 284,677 | | 16,881,346 |
| | | |
| Commercial services—2.5% | | | | | | |
| Hewitt Associates Inc., Class A* | | | | 588,418 | | 24,119,254 |
| SEI Investments Company | | | | 714,081 | | 16,038,259 |
| | | |
| Computers—4.1% | | | | | | |
| IHS Inc., Class A* | | | | 648,813 | | 32,875,355 |
| Synopsys, Inc.* | | | | 1,398,575 | | 31,761,638 |
| | | |
| Electric—1.0% | | | | | | |
| ITC Holdings Corporation | | | | 275,555 | | 15,384,236 |
| | | |
| Electrical components & equipment—2.1% | | | | | | |
| AMETEK, Inc. | | | | 375,364 | | 16,234,493 |
| Energizer Holdings, Inc.* | | | | 275,481 | | 16,831,889 |
| | | |
| Electronics—5.7% | | | | | | |
| Agilent Technologies Inc.* | | | | 741,915 | | 26,901,838 |
| | | | | | |
| | | |
| Common stocks—99.4% (a) | | | | Shares | | Value |
| Amphenol Corporation, Class A | | | | 983,166 | | $45,432,101 |
| Waters Corporation* | | | | 245,242 | | 17,654,972 |
| | | |
| Environmental control—2.3% | | | | | | |
| Stericycle Inc.* | | | | 286,587 | | 16,879,974 |
| Waste Connections, Inc.* | | | | 564,484 | | 20,202,882 |
| | | |
| Financial services—7.6% | | | | | | |
| Discover Financial Services | | | | 2,060,353 | | 31,853,057 |
| IntercontinentalExchange, Inc.* | | | | 144,205 | | 16,818,629 |
| Leucadia National Corporation* | | | | 1,205,112 | | 30,501,385 |
| SLM Corporation* | | | | 2,070,657 | | 25,344,842 |
| The NASDAQ OMX Group Inc.* | | | | 725,260 | | 15,230,460 |
| | | |
| Healthcare products—3.1% | | | | | | |
| Beckman Coulter, Inc. | | | | 267,094 | | 16,666,666 |
| St. Jude Medical, Inc.* | | | | 802,316 | | 32,750,539 |
| | | |
| Healthcare services—3.1% | | | | | | |
| Laboratory Corporation of America Holdings* | | | | 207,047 | | 16,267,683 |
| Lincare Holdings Inc.* | | | | 343,264 | | 16,026,996 |
| Mednax Inc.* | | | | 302,711 | | 16,630,942 |
| | | |
| Household products—1.0% | | | | | | |
| The Scotts Miracle-Gro Company, Class A | | | | 336,727 | | 16,314,423 |
| | | |
| Insurance—1.0% | | | | | | |
| Reinsurance Group of America Inc. | | | | 309,887 | | 15,999,466 |
| | | |
| Internet—3.4% | | | | | | |
| Liberty Media Interactive, Class A* | | | | 2,464,610 | | 37,881,056 |
| Symantec Corporation* | | | | 924,120 | | 15,497,492 |
| | | |
| Machinery—4.9% | | | | | | |
| AGCO Corporation* | | | | 775,602 | | 27,161,582 |
| Flowserve Corporation | | | | 207,530 | | 23,778,787 |
| Roper Industries Inc. | | | | 425,615 | | 25,971,027 |
| | | |
| Oil & gas—4.9% | | | | | | |
| Noble Energy, Inc. | | | | 238,145 | | 18,194,278 |
| Petrohawk Energy Corporation* | | | | 700,485 | | 15,123,471 |
| Plains Exploration & Production Company* | | | | 513,274 | | 15,044,061 |
| Whiting Petroleum Corporation* | | | | 313,153 | | 28,287,110 |
| | | |
| Oil & gas services—2.1% | | | | | | |
| National Oilwell Varco, Inc. | | | | 359,745 | | 15,839,572 |
| Oceaneering International, Inc.* | | | | 270,641 | | 17,726,986 |
| | | |
| Packaging & containers—4.9% | | | | | | |
| Crown Holdings Inc.* | | | | 872,039 | | 22,673,014 |
| Owens-Illinois, Inc.* | | | | 666,602 | | 23,624,375 |
| Rock-Tenn Company, Class A | | | | 595,252 | | 30,715,003 |
| | | |
| Pharmaceuticals—1.5% | | | | | | |
| McKesson Corporation | | | | 359,966 | | 23,329,396 |
| | | |
| Printing & publishing—2.0% | | | | | | |
| John Wiley & Sons, Inc., Class A | | | | 729,535 | | 30,837,444 |
| | | |
| Retail—2.1% | | | | | | |
| TJX Companies, Inc. | | | | 710,677 | | 32,932,772 |
| | | |
| Semiconductors—1.6% | | | | | | |
| Rovi Corporation* | | | | 643,247 | | 25,073,768 |
| | | |
| Software—5.7% | | | | | | |
| Activision Blizzard Inc. | | | | 1,757,295 | | 19,470,829 |
| Adobe Systems Inc.* | | | | 449,810 | | 15,109,118 |
| Fiserv, Inc.* | | | | 677,910 | | 34,634,422 |
| Sybase, Inc.* | | | | 487,450 | | 21,145,581 |
| | |
| 30 | | The accompanying notes are an integral part of the financial statements. |
Investment Portfolios
| | | | | | |
| EAGLE MID CAP STOCK FUND (cont’d) | | |
| Common stocks—99.4% (a) | | | | Shares | | Value |
| Television, cable & radio—1.5% | | | | | | |
| DISH Network Corporation, Class A | | | | 1,088,858 | | $24,118,205 |
| | | |
| Toys/games/hobbies—2.0% | | | | | | |
| Hasbro, Inc. | | | | 806,707 | | 30,945,281 |
| Total domestic common stocks (cost $1,266,899,642) | | 1,396,727,238 |
| | | |
| Foreign—11.0% (b) | | | | | | |
| Financial services—1.0% | | | | | | |
| Lazard Ltd., Class A | | | | 409,176 | | 15,818,744 |
| | | |
| Insurance—3.2% | | | | | | |
| Allied World Assurance Company Holdings, Ltd. | | | | 721,361 | | 31,429,699 |
| XL Capital Ltd., Class A | | | | 1,057,995 | | 18,832,311 |
| | | |
| Mining—2.3% | | | | | | |
| Silver Wheaton Corporation* | | | | 1,875,595 | | 36,611,614 |
| | | |
| Pharmaceuticals—1.0% | | | | | | |
| Shire PLC, Sponsored ADR | | | | 239,071 | | 15,740,435 |
| | | |
| Semiconductors—1.2% | | | | | | |
| Marvell Technology Group Ltd.* | | | | 928,705 | | 19,177,758 |
| | | |
| Software—1.8% | | | | | | |
| Check Point Software Technologies Ltd.* | | | | 770,545 | | 27,446,813 |
| | | |
| Telecommunications—0.5% | | | | | | |
| Cellcom Israel Ltd. | | | | 270,340 | | 8,191,303 |
| Total foreign common stocks (cost $156,937,031) | | 173,248,677 |
| Total common stocks (cost $1,423,836,673) | | | | | | 1,569,975,915 |
| |
| Total investment portfolio (cost $1,423,836,673) 99.4% (a) | | $1,569,975,915 |
| | | |
| * Non-income producing security | | | | | | |
| (a) Percentages indicated are based on net assets of $1,580,257,869. (b) Securities are U.S. dollar denominated. | | |
| | | |
| ADR—American depository receipt | | | | | | |
| | |
| |
| Sector allocation | | |
| Sector | | Percent of net assets |
| Industrial | | 19.9% |
| Financial | | 15.9% |
| Technology | | 15.4% |
| Consumer, non-cyclical | | 14.1% |
| Consumer, cyclical | | 10.2% |
| Communications | | 8.4% |
| Basic materials | | 7.6% |
| Energy | | 7.0% |
| Utilities | | 0.9% |
| | | | | | |
| |
| EAGLE SMALL CAP CORE VALUE FUND |
| Common stocks—93.8% (a) | | | | Shares | | Value |
| Aerospace/defense—1.0% | | | | | | |
| Orbital Sciences Corporation* | | | | 38,367 | | $705,185 |
| | | | | | |
| | | |
| Common stocks—93.8% (a) | | | | Shares | | Value |
| Banks—6.8% | | | | | | |
| Cardinal Financial Corporation | | | | 52,471 | | $574,557 |
| Columbia Banking System Inc. | | | | 16,041 | | 360,602 |
| First Financial Bancorp | | | | 46,054 | | 880,092 |
| Oriental Financial Group, Inc. | | | | 32,335 | | 540,641 |
| PrivateBancorp Inc. | | | | 41,111 | | 588,710 |
| Signature Bank* | | | | 15,110 | | 610,142 |
| Southwest Bancorp, Inc. | | | | 27,720 | | 406,375 |
| Sterling Bancshares, Inc. | | | | 42,120 | | 247,666 |
| Texas Capital Bancshares, Inc.* | | | | 36,404 | | 724,440 |
| | | |
| Biotechnology—1.5% | | | | | | |
| Charles River Laboratories International, Inc.* | | | | 8,330 | | 278,888 |
| Cubist Pharmaceuticals, Inc.* | | | | 37,092 | | 831,603 |
| | | |
| Chemicals—0.8% | | | | | | |
| Kraton Performance Polymers Inc.* | | | | 29,085 | | 551,452 |
| | | |
| Coal—1.3% | | | | | | |
| Alpha Natural Resources Inc.* | | | | 20,167 | | 949,462 |
| | | |
| Commercial services—10.4% | | | | | | |
| Chemed Corporation | | | | 19,660 | | 1,081,497 |
| Cross Country Healthcare, Inc.* | | | | 61,362 | | 614,847 |
| Euronet Worldwide, Inc.* | | | | 48,825 | | 777,782 |
| Gartner, Inc.* | | | | 32,695 | | 787,296 |
| Interactive Data Corporation | | | | 31,485 | | 1,053,803 |
| LECG Corporation* | | | | 166,029 | | 557,857 |
| Net 1 UEPS Technologies, Inc.* | | | | 56,333 | | 923,861 |
| On Assignment, Inc.* | | | | 94,637 | | 665,298 |
| Parexel International Corporation* | | | | 32,655 | | 770,005 |
| The Providence Service Corporation* | | | | 22,785 | | 378,459 |
| | | |
| Computers—2.9% | | | | | | |
| Electronics for Imaging, Inc.* | | | | 47,800 | | 614,230 |
| Insight Enterprises, Inc.* | | | | 29,345 | | 441,055 |
| Mercury Computer Systems, Inc.* | | | | 37,020 | | 476,077 |
| SMART Modular Technologies (WWH), Inc.* | | | | 80,896 | | 567,890 |
| | | |
| Distribution/wholesale—0.8% | | | | | | |
| School Specialty, Inc.* | | | | 26,351 | | 618,194 |
| | | |
| Diversified manufacturer—1.8% | | | | | | |
| Barnes Group Inc. | | | | 39,835 | | 828,568 |
| Matthews International Corporation, Class A | | | | 13,054 | | 456,890 |
| | | |
| Electric—0.9% | | | | | | |
| Allete, Inc. | | | | 18,685 | | 681,442 |
| | | |
| Electrical components & equipment—0.8% | | | | | | |
| Belden, Inc. | | | | 20,970 | | 575,836 |
| | | |
| Electronics—2.1% | | | | | | |
| Benchmark Electronics, Inc.* | | | | 26,905 | | 582,224 |
| Sonic Solutions, Inc.* | | | | 76,148 | | 955,657 |
| | | |
| Engineering & construction—2.1% | | | | | | |
| Dycom Industries, Inc.* | | | | 61,808 | | 656,401 |
| URS Corporation* | | | | 17,308 | | 888,766 |
| | | |
| Entertainment—0.3% | | | | | | |
| Lions Gate Entertainment Corporation* | | | | 27,393 | | 189,560 |
| | | |
| Environmental control—0.3% | | | | | | |
| Casella Waste Systems, Inc., Class A* | | | | 45,962 | | 237,164 |
| | | |
| Financial services—4.3% | | | | | | |
| Compass Diversified Holdings | | | | 16,120 | | 234,062 |
| Cowen Group Inc., Class A* | | | | 78,760 | | 425,304 |
| | |
| The accompanying notes are an integral part of the financial statements. | | 31 |
Investment Portfolios
| | | | | | |
| EAGLE SMALL CAP CORE VALUE FUND (cont’d) |
| Common stocks—93.8% (a) | | | | Shares | | Value |
| Financial services (cont’d) | | | | | | |
| Investment Technology Group, Inc.* | | | | 31,555 | | $548,110 |
| MarketAxess Holdings Inc. | | | | 44,036 | | 692,246 |
| optionsXpress Holdings, Inc.* | | | | 39,347 | | 698,409 |
| SWS Group Inc. | | | | 51,584 | | 571,035 |
| | | |
| Gas—1.8% | | | | | | |
| AGL Resources, Inc. | | | | 33,435 | | 1,321,017 |
| | | |
| Healthcare products—1.4% | | | | | | |
| Merit Medical Systems, Inc.* | | | | 65,383 | | 1,057,243 |
| | | |
| Healthcare services—5.7% | | | | | | |
| AMERIGROUP Corporation* | | | | 33,842 | | 1,226,434 |
| Amsurg Corporation* | | | | 47,345 | | 980,988 |
| Mednax Inc.* | | | | 13,570 | | 745,536 |
| Psychiatric Solutions, Inc.* | | | | 36,749 | | 1,182,215 |
| | | |
| Household products—1.1% | | | | | | |
| Jarden Corporation | | | | 26,117 | | 838,878 |
| | | |
| Insurance—4.3% | | | | | | |
| American Equity Investment Life Holding Company | | | | 86,090 | | 905,667 |
| Assured Guaranty Ltd. | | | | 27,215 | | 586,483 |
| First Mercury Financial Corporation | | | | 35,415 | | 464,291 |
| Platinum Underwriters Holdings, Ltd. | | | | 17,620 | | 655,640 |
| Stewart Information Services Corporation | | | | 30,203 | | 343,710 |
| Validus Holdings Ltd. | | | | 6,954 | | 177,814 |
| | | |
| Internet—2.0% | | | | | | |
| 1-800-FLOWERS.COM Inc., Class A* | | | | 142,880 | | 408,637 |
| SonicWALL, Inc.* | | | | 102,657 | | 1,039,915 |
| | | |
| Machinery—1.7% | | | | | | |
| Altra Holdings, Inc.* | | | | 45,400 | | 688,264 |
| Flowserve Corporation | | | | 1,411 | | 161,672 |
| Wabtec Corporation | | | | 7,640 | | 363,511 |
| | | |
| Metal fabricate/hardware—0.8% | | | | | | |
| Kaydon Corporation | | | | 13,765 | | 573,037 |
| | | |
| Mining—2.1% | | | | | | |
| Gammon Gold Inc.* | | | | 26,917 | | 199,724 |
| IAMGOLD Corporation | | | | 76,030 | | 1,358,656 |
| | | |
| Oil & gas—2.1% | | | | | | |
| Comstock Resources, Inc.* | | | | 16,750 | | 537,005 |
| Rosetta Resources, Inc.* | | | | 39,450 | | 982,305 |
| | | |
| Oil & gas services—3.1% | | | | | | |
| Dresser-Rand Group, Inc.* | | | | 30,906 | | 1,090,364 |
| Oceaneering International, Inc.* | | | | 18,176 | | 1,190,528 |
| | | |
| Packaging & containers—0.9% | | | | | | |
| Silgan Holdings Inc. | | | | 10,658 | | 642,997 |
| | | |
| Pharmaceuticals—1.7% | | | | | | |
| Herbalife Ltd. | | | | 26,501 | | 1,278,673 |
| | | |
| Printing & publishing—1.4% | | | | | | |
| John Wiley & Sons, Inc., Class A | | | | 23,465 | | 991,866 |
| | | |
| REITs—3.2% | | | | | | |
| BioMed Realty Trust, Inc. | | | | 38,460 | | 711,895 |
| Chimera Investment Corporation | | | | 77,665 | | 316,097 |
| Government Properties Income Trust | | | | 39,980 | | 1,083,858 |
| Kite Realty Group Trust | | | | 34,055 | | 184,578 |
| | | | | | |
| | | |
| Common stocks—93.8% (a) | | | | Shares | | Value |
| Retail—5.8% | | | | | | |
| AerCap Holdings NV* | | | | 33,793 | | $466,343 |
| AFC Enterprises, Inc.* | | | | 85,385 | | 931,550 |
| Jo-Ann Stores Inc.* | | | | 26,570 | | 1,172,268 |
| Nu Skin Enterprises, Inc., Class A | | | | 30,785 | | 925,397 |
| Stage Stores, Inc. | | | | 46,750 | | 712,938 |
| | | |
| Savings & loans—0.9% | | | | | | |
| Berkshire Hills Bancorp Inc. | | | | 30,866 | | 648,186 |
| | | |
| Semiconductor equipment—0.6% | | | | | | |
| Varian Semiconductor Equipment Associates, Inc.* | | | | 13,310 | | 438,431 |
| | | |
| Semiconductors—1.0% | | | | | | |
| Microsemi Corporation* | | | | 42,565 | | 704,876 |
| | | |
| Software—6.7% | | | | | | |
| ACI Worldwide, Inc.* | | | | 20,530 | | 385,759 |
| Aspen Technology, Inc.* | | | | 115,842 | | 1,363,460 |
| Avid Technology, Inc.* | | | | 37,090 | | 541,514 |
| Bottomline Technologies, Inc.* | | | | 78,881 | | 1,372,529 |
| Innerworkings Inc.* | | | | 31,020 | | 185,500 |
| Sybase, Inc.* | | | | 24,370 | | 1,057,171 |
| | | |
| Telecommunications—6.1% | | | | | | |
| Alaska Communications Systems Group, Inc. | | | | 78,677 | | 673,475 |
| Cbeyond Inc.* | | | | 36,858 | | 566,876 |
| CommScope, Inc.* | | | | 29,050 | | 946,449 |
| Switch & Data Facilities Company, Inc.* | | | | 41,175 | | 790,148 |
| Symmetricom, Inc.* | | | | 122,186 | | 810,093 |
| Syniverse Holdings, Inc.* | | | | 31,530 | | 633,122 |
| | | |
| Transportation—1.3% | | | | | | |
| Crude Carriers Corporation* | | | | 21,075 | | 393,049 |
| Genesee & Wyoming Inc., Class A* | | | | 13,760 | | 538,020 |
| Total common stocks (cost $40,996,382) | | | | | | 68,346,292 |
| | | |
| Investment companies—1.9% (a) | | | | | | |
| Apollo Investment Corporation | | | | 35,053 | | 426,244 |
| iShares Russell 2000 Index Fund (ETF) | | | | 7,495 | | 536,492 |
| iShares Russell 2000 Value Index Fund (ETF) | | | | 5,765 | | 393,115 |
| Total investment companies (cost $668,074) | | | | | | 1,355,851 |
| |
| Total investment portfolio excluding repurchase agreement (cost $41,664,456) | | 69,702,143 |
| | | |
| Repurchase agreement—4.2% (a) | | | | | | |
| Repurchase agreement with Fixed Income Clearing Corporation dated April 30, 2010 @ 0.05% to be repurchased at $3,092,013 on May 3, 2010, collateralized by $3,220,000 United States Treasury Notes, 3.375% due November 15, 2019 (market value $3,200,906 including interest) (cost $3,092,000) | | | | | | 3,092,000 |
| |
| Total investment portfolio (cost $44,756,456) 99.9% (a) | | $72,794,143 |
| | | |
| * Non-income producing security | | | | | | |
| (a) Percentages indicated are based on net assets of $72,901,410. | | |
| | | |
| ETF—Exchange-traded fund | | | | | | |
| REIT—Real estate investment trust | | | | | | |
| | |
| 32 | | The accompanying notes are an integral part of the financial statements. |
Investment Portfolios
| | |
| EAGLE SMALL CAP CORE VALUE FUND (cont’d) |
| Sector allocation | | |
| Sector | | Percent of net assets |
| Financial | | 21.3% |
| Consumer, non-cyclical | | 20.5% |
| Technology | | 12.8% |
| Industrial | | 12.7% |
| Communications | | 9.4% |
| Consumer, cyclical | | 6.9% |
| Energy | | 6.5% |
| Other sectors | | 5.6% |
| Cash | | 4.2% |
| | | | | | |
| | | | |
| EAGLE SMALL CAP GROWTH FUND | | | | | | |
| Common stocks—98.3% (a) | | | | Shares | | Value |
| Aerospace/defense—1.2% | | | | | | |
| Triumph Group Inc. | | | | 67,956 | | $5,270,667 |
| Apparel—1.1% | | | | | | |
| Steven Madden Ltd.* | | | | 84,519 | | 4,898,721 |
| | | |
| Auto parts & equipment—2.5% | | | | | | |
| American Axle & Manufacturing Holdings Inc.* | | | | 495,040 | | 5,326,630 |
| ArvinMeritor Inc.* | | | | 358,365 | | 5,490,152 |
| | | |
| Banks—1.2% | | | | | | |
| First Commonwealth Financial Corporation | | | | 376,146 | | 2,463,756 |
| UMB Financial Corporation | | | | 61,142 | | 2,575,301 |
| | | |
| Biotechnology—2.8% | | | | | | |
| Bio-Rad Laboratories, Inc., Class A* | | | | 48,390 | | 5,404,679 |
| Cubist Pharmaceuticals, Inc.* | | | | 90,674 | | 2,032,911 |
| Regeneron Pharmaceuticals Inc.* | | | | 117,098 | | 2,989,512 |
| Seattle Genetics Inc.* | | | | 154,380 | | 1,945,188 |
| | | |
| Chemicals—2.0% | | | | | | |
| Huntsman Corporation | | | | 780,613 | | 8,906,794 |
| | | |
| Commercial services—8.4% | | | | | | |
| Coinstar Inc.* | | | | 171,413 | | 7,603,881 |
| Monster Worldwide, Inc.* | | | | 238,208 | | 4,151,965 |
| Ritchie Brothers Auctioneers Inc. | | | | 271,613 | | 6,355,744 |
| Sotheby’s | | | | 200,225 | | 6,687,515 |
| SuccessFactors Inc.* | | | | 198,983 | | 4,164,714 |
| The GEO Group, Inc.* | | | | 360,405 | | 7,633,378 |
| | | |
| Computers—3.3% | | | | | | |
| Netezza Corporation* | | | | 388,725 | | 5,321,645 |
| Radiant Systems Inc.* | | | | 248,185 | | 3,491,963 |
| Riverbed Technology Inc.* | | | | 174,176 | | 5,397,714 |
| | | |
| Electrical components & equipment—1.2% | | | | | | |
| GrafTech International Ltd.* | | | | 308,168 | | 5,195,712 |
| | | |
| Electronics—1.6% | | | | | | |
| Coherent, Inc.* | | | | 189,501 | | 7,119,553 |
| | | |
| Entertainment—3.5% | | | | | | |
| Bally Technologies, Inc.* | | | | 198,072 | | 9,135,081 |
| Shuffle Master, Inc.* | | | | 650,924 | | 6,248,870 |
| | | |
| Environmental control—1.6% | | | | | | |
| Waste Connections, Inc.* | | | | 192,087 | | 6,874,794 |
| | | | | | |
| | | |
| Common stocks—98.3% (a) | | | | Shares | | Value |
| Financial services—1.6% | | | | | | |
| Broadpoint Gleacher Securities Inc.* | | | | 495,802 | | $2,122,033 |
| Duff & Phelps Corporation, Class A | | | | 181,512 | | 2,849,738 |
| optionsXpress Holdings, Inc.* | | | | 119,222 | | 2,116,190 |
| | | |
| Hand/machine tools—1.5% | | | | | | |
| Regal-Beloit Corporation | | | | 106,826 | | 6,758,881 |
| Healthcare products—5.9% | | | | | | |
| American Medical Systems Holdings, Inc.* | | | | 402,390 | | 7,210,829 |
| Cutera, Inc.* | | | | 131,568 | | 1,520,926 |
| Thoratec Corporation* | | | | 332,587 | | 14,830,054 |
| Vital Images, Inc.* | | | | 128,915 | | 2,034,279 |
| Healthcare services—7.4% | | | | | | |
| Amedisys Inc.* | | | | 115,161 | | 6,630,970 |
| Centene Corporation* | | | | 195,923 | | 4,486,637 |
| Genoptix Inc.* | | | | 169,060 | | 6,540,931 |
| ICON PLC, Sponsored ADR* | | | | 150,308 | | 4,384,484 |
| Lincare Holdings Inc.* | | | | 122,780 | | 5,732,598 |
| Psychiatric Solutions, Inc.* | | | | 146,276 | | 4,705,699 |
| | | |
| Home furnishings—3.1% | | | | | | |
| DTS, Inc.* | | | | 213,134 | | 7,084,574 |
| Universal Electronics, Inc.* | | | | 296,877 | | 6,299,730 |
| | | |
| Insurance—0.7% | | | | | | |
| MGIC Investment Corporation* | | | | 309,278 | | 3,225,770 |
| | | |
| Internet—1.8% | | | | | | |
| TIBCO Software, Inc.* | | | | 707,219 | | 8,062,297 |
| | | |
| Lodging—1.0% | | | | | | |
| Choice Hotels International Inc. | | | | 116,058 | | 4,214,066 |
| | | |
| Metal fabricate/hardware—1.0% | | | | | | |
| Northwest Pipe Company* | | | | 177,154 | | 4,272,954 |
| | | |
| Mining—1.1% | | | | | | |
| Titanium Metals Corporation* | | | | 320,743 | | 4,945,857 |
| | | |
| Oil & gas—3.0% | | | | | | |
| Brigham Exploration Company* | | | | 245,934 | | 4,798,172 |
| Unit Corporation* | | | | 45,692 | | 2,182,707 |
| Whiting Petroleum Corporation* | | | | 68,670 | | 6,202,961 |
| | | |
| Oil & gas services—4.3% | | | | | | |
| Lufkin Industries, Inc. | | | | 138,136 | | 11,759,518 |
| OYO Geospace Corporation* | | | | 145,006 | | 7,206,798 |
| | | |
| Pharmaceuticals—4.0% | | | | | | |
| BioMarin Pharmaceutical Inc.* | | | | 221,703 | | 5,181,199 |
| Herbalife Ltd. | | | | 83,935 | | 4,049,864 |
| Onyx Pharmaceuticals Inc.* | | | | 126,421 | | 3,649,774 |
| Salix Pharmaceuticals Ltd.* | | | | 55,844 | | 2,244,929 |
| Vivus Inc.* | | | | 225,940 | | 2,302,329 |
| | | |
| REIT—0.8% | | | | | | |
| Redwood Trust Inc. | | | | 199,964 | | 3,335,400 |
| | | |
| Retail—9.8% | | | | | | |
| BJ’s Restaurants, Inc.* | | | | 321,305 | | 7,753,090 |
| Cash America International, Inc. | | | | 319,150 | | 11,827,699 |
| Chico’s FAS, Inc. | | | | 347,918 | | 5,180,499 |
| Genesco Inc.* | | | | 385,820 | | 12,843,948 |
| Vitamin Shoppe Inc.* | | | | 217,525 | | 5,398,970 |
| | | |
| Semiconductor equipment—5.8% | | | | | | |
| Formfactor Inc.* | | | | 452,669 | | 6,794,562 |
| | |
| The accompanying notes are an integral part of the financial statements. | | 33 |
Investment Portfolios
| | | | | | |
| EAGLE SMALL CAP GROWTH FUND (cont’d) | | | | | | |
| Common stocks—98.3% (a) | | | | Shares | | Value |
| Semiconductor equipment (cont’d) | | | | | | |
| Teradyne, Inc.* | | | | 333,160 | | $4,074,547 |
| Varian Semiconductor Equipment Associates, Inc.* | | | | 271,923 | | 8,957,144 |
| Veeco Instruments Inc.* | | | | 124,030 | | 5,456,080 |
| | | |
| Semiconductors—4.3% | | | | | | |
| ON Semiconductor Corporation* | | | | 908,236 | | 7,211,394 |
| Rovi Corporation* | | | | 294,205 | | 11,468,111 |
| | | |
| Software—8.1% | | | | | | |
| ANSYS, Inc.* | | | | 182,726 | | 8,222,670 |
| Eclipsys Corporation* | | | | 410,681 | | 8,492,883 |
| Informatica Corporation* | | | | 300,567 | | 7,517,181 |
| MedAssets Inc.* | | | | 247,916 | | 5,659,922 |
| Quality Systems, Inc. | | | | 87,954 | | 5,629,936 |
| | | |
| Telecommunications—1.1% | | | | | | |
| EMS Technologies, Inc.* | | | | 310,214 | | 4,929,300 |
| | | |
| Transportation—1.6% | | | | | | |
| Landstar System, Inc. | | | | 158,937 | | 7,028,195 |
| Total common stocks (cost $302,554,101) | | | | | | 430,076,119 |
| | | |
| Repurchase agreement—1.1% (a) | | | | | | |
| Repurchase agreement with Fixed Income Clearing Corporation dated April 30, 2010 @ 0.05% to be repurchased at $4,909,020 on May 3, 2010, collateralized by $5,115,000 United States Treasury Notes, 3.375% due November 15, 2019 (market value $5,084,669 including interest) (cost $4,909,000) | | 4,909,000 |
| |
| Total investment portfolio (cost $307,463,101) 99.4% (a) | | $434,985,119 |
| | | | | | |
| | | | | | | |
| Footnotes | | | | | | |
| * Non-income producing security | | |
| (a) Percentages indicated are based on net assets of $437,641,376. | | |
| |
| ADR—American depository receipt | | |
| REIT—Real estate investment trust | | |
| | |
| |
| Sector allocation | | |
| Sector | | Percent of net assets |
| Consumer, non-cyclical | | 25.6% |
| Technology | | 24.2% |
| Consumer, cyclical | | 21.0% |
| Industrial | | 9.7% |
| Energy | | 7.3% |
| Financial | | 4.3% |
| Basic materials | | 3.2% |
| Communications | | 3.0% |
| Cash | | 1.1% |
| | |
| 34 | | The accompanying notes are an integral part of the financial statements. |
[THIS PAGE INTENTIONALLY LEFT BLANK]
Statements of Assets and Liabilities
| | | | | | | | | | | | |
| | | Eagle
Capital
Appreciation
Fund | | | Eagle
Growth
& Income
Fund | | | Eagle
International
Equity
Fund | | | Eagle
Investment
Grade Bond
Fund | |
| | | | |
| Assets | | | | | | | | | | | | |
| Investments, at value (a) | | $569,945,000 | | | $189,123,516 | | | $98,482,266 | | | $36,812,829 | |
| Repurchase agreements (b) | | 19,707,000 | | | 7,152,000 | | | 619,000 | | | 705,000 | |
| Cash | | 17 | | | 106 | | | 762 | | | 394 | |
| Foreign currency (identified cost $858,830) | | — | | | — | | | 859,954 | | | — | |
| Receivable for investments sold | | 8,187,096 | | | 208,945 | | | 3,443,686 | | | — | |
| Receivable for fund shares sold | | 2,109,233 | | | 1,240,085 | | | 41,358 | | | 887,410 | |
| Receivable for dividends and interest | | 236,560 | | | 386,085 | | | 247,385 | | | 387,208 | |
| Receivable for recoverable foreign withholding taxes | | — | | | 45,552 | | | 146,707 | | | — | |
| Prepaid expenses | | 53,880 | | | 43,023 | | | 31,347 | | | 72,228 | |
| Unrealized gain on forward foreign currency contracts | | — | | | — | | | 282,680 | | | — | |
| Total assets | | 600,238,786 | | | 198,199,312 | | | 104,155,145 | | | 38,865,069 | |
| | | | |
| Liabilities | | | | | | | | | | | | |
| Payable for investments purchased | | 6,370,178 | | | 547,372 | | | 3,423,864 | | | 245,737 | |
| Payable for fund shares redeemed | | 1,494,946 | | | 499,105 | | | 399,479 | | | 79,991 | |
| Payable to the custodian | | — | | | — | | | — | | | — | |
| Accrued investment advisory fees | | 294,853 | | | 84,955 | | | 50,427 | | | — | |
| Accrued administrative fees | | 71,830 | | | 23,982 | | | 12,957 | | | 577 | |
| Accrued distribution fees | | 169,381 | | | 80,773 | | | 58,145 | | | 15,707 | |
| Accrued shareholder servicing fees | | 83,121 | | | 47,234 | | | 15,808 | | | — | |
| Accrued fund accounting fees | | 8,556 | | | 7,641 | | | 11,792 | | | 7,493 | |
| Accrued internal audit fees | | 206 | | | 206 | | | 206 | | | 267 | |
| Accrued trustees and officers compensation | | 7,458 | | | 8,836 | | | 8,650 | | | 5,135 | |
| Other accrued expenses | | 34,479 | | | 32,309 | | | 70,093 | | | 8,269 | |
| Unrealized loss on forward foreign currency contracts | | — | | | — | | | 64,988 | | | — | |
| Total liabilities | | 8,535,008 | | | 1,332,413 | | | 4,116,409 | | | 363,176 | |
| Net assets | | 591,703,778 | | | 196,866,899 | | | 100,038,736 | | | 38,501,893 | |
| | | | |
| Net assets consists of | | | | | | | | | | | | |
| Paid-in capital | | 557,477,625 | | | 192,618,718 | | | 171,494,200 | | | 38,232,518 | |
| Undistributed net investment income (loss) | | (1,031,837 | ) | | 270,840 | | | (643,431 | ) | | 43,470 | |
| Accumulated net realized gain (loss) | | (85,161,540 | ) | | (14,805,881 | ) | | (85,792,090 | ) | | (15,412 | ) |
| Unrealized gain on forward foreign currency contracts | | — | | | — | | | 217,692 | | | — | |
Net unrealized appreciation (depreciation) on investments and
other assets and liabilities denominated in foreign currencies | | 120,419,530 | | | 18,783,222 | | | 14,762,365 | | | 241,317 | |
| Net assets | | 591,703,778 | | | 196,866,899 | | | 100,038,736 | | | 38,501,893 | |
| | | | |
| Net assets, at market value | | | | | | | | | | | | |
| Class A | | 456,992,183 | | | 123,108,077 | | | 43,507,714 | | | 22,421,059 | |
| Class C | | 88,904,524 | | | 67,550,302 | | | 56,372,298 | | | 16,063,193 | |
| Class I | | 21,249,535 | | | 5,876,761 | | | 153,804 | | | 12,605 | |
| Class R-3 | | 735,872 | | | 329,123 | | | 2,457 | | | 2,517 | |
| Class R-5 | | 23,821,664 | | | 2,636 | | | 2,463 | | | 2,519 | |
| | | | |
Net asset value (“NAV”),
offering and redemption price per share | | | | | | | | | | | | |
| Class A | | $25.87 | | | $12.72 | | | $20.45 | | | $14.53 | |
| Maximum offering price (c) | | $27.16 | | | $13.35 | | | $21.47 | | | $15.10 | |
| Class C | | $22.65 | | | $12.35 | | | $18.45 | | | $14.52 | |
| Class I | | $26.30 | | | $12.70 | | | $20.56 | | | $14.53 | |
| Class R-3 | | $25.69 | | | $12.70 | | | $20.44 | | | $14.53 | |
| Class R-5 | | $26.25 | | | $12.71 | | | $20.57 | | | $14.54 | |
| | | | |
| Shares of beneficial interest outstanding | | | | | | | | | | | | |
| Class A | | 17,664,870 | | | 9,680,923 | | | 2,127,857 | | | 1,543,044 | |
| Class C | | 3,925,692 | | | 5,468,038 | | | 3,055,861 | | | 1,106,502 | |
| Class I | | 808,071 | | | 462,592 | | | 7,480 | | | 867 | |
| Class R-3 | | 28,639 | | | 25,919 | | | 120 | | | 173 | |
| Class R-5 | | 907,618 | | | 207 | | | 120 | | | 173 | |
| | | | |
| (a) Identified cost | | $449,525,470 | | | $170,345,574 | | | $83,720,743 | | | $36,571,512 | |
(b) Identified cost is the same as value. (c) For all funds except the Eagle Investment Grade Bond Fund, the maximum offering price is computed as 100/95.25 of NAV. The maximum offering price for the Eagle Investment Grade Bond Fund is computed as 100/96.25 of NAV.
| | |
| 36 | | The accompanying notes are an integral part of the financial statements. |
Statements of Assets and Liabilities
| | | | | | | | | | | | | |
Eagle
Large Cap
Core
Fund | | | Eagle
Mid Cap
Growth
Fund | | | Eagle
Mid Cap
Stock
Fund | | | Eagle
Small Cap
Core Value
Fund | | | Eagle
Small Cap
Growth
Fund | |
| | | | |
| | | | | | | | | | | | | |
| $129,874,889 | | | $185,467,175 | | | $1,569,975,915 | | | $69,702,143 | | | $430,076,119 | |
| 14,096,000 | | | 2,922,000 | | | — | | | 3,092,000 | | | 4,909,000 | |
| 900 | | | 311 | | | — | | | 809 | | | 987 | |
| — | | | — | | | — | | | — | | | — | |
| — | | | 5,466,376 | | | 79,094,758 | | | 532,343 | | | 5,458,560 | |
| 233,697 | | | 383,076 | | | 3,470,733 | | | 226,622 | | | 1,540,909 | |
| 32,831 | | | 15,604 | | | 470,370 | | | 37,259 | | | 3,768 | |
| — | | | — | | | — | | | — | | | — | |
| 42,117 | | | 31,161 | | | 50,100 | | | 31,978 | | | 50,817 | |
| — | | | — | | | — | | | — | | | — | |
| 144,280,434 | | | 194,285,703 | | | 1,653,061,876 | | | 73,623,154 | | | 442,040,160 | |
| | | | |
| | | | | | | | | | | | | |
| — | | | 2,779,946 | | | 65,296,164 | | | 479,839 | | | 3,056,996 | |
| 264,541 | | | 313,587 | | | 3,941,653 | | | 159,283 | | | 864,285 | |
| — | | | — | | | 1,966,397 | | | — | | | — | |
| 71,505 | | | 92,556 | | | 717,705 | | | 30,159 | | | 212,146 | |
| 12,835 | | | 22,766 | | | 179,579 | | | 3,484 | | | 48,960 | |
| 10,869 | | | 71,003 | | | 400,441 | | | 5,690 | | | 112,049 | |
| 6,675 | | | 22,242 | | | 226,006 | | | — | | | 56,373 | |
| 8,266 | | | 8,303 | | | 8,539 | | | 7,798 | | | 8,518 | |
| 206 | | | 206 | | | 206 | | | 206 | | | 206 | |
| 8,679 | | | 8,679 | | | 8,681 | | | 8,679 | | | 8,679 | |
| 28,617 | | | 27,387 | | | 58,636 | | | 26,606 | | | 30,572 | |
| — | | | — | | | — | | | — | | | — | |
| 412,193 | | | 3,346,675 | | | 72,804,007 | | | 721,744 | | | 4,398,784 | |
| 143,868,241 | | | 190,939,028 | | | 1,580,257,869 | | | 72,901,410 | | | 437,641,376 | |
| | | | |
| | | | | | | | | | | | | |
| 191,152,407 | | | 155,619,743 | | | 1,640,149,316 | | | 42,237,814 | | | 375,072,875 | |
| 80,346 | | | (140,877 | ) | | (1,750,080 | ) | | (57,674 | ) | | (155,731 | ) |
| (62,633,985 | ) | | (13,842,473 | ) | | (204,280,609 | ) | | 2,683,583 | | | (64,797,786 | ) |
| — | | | — | | | — | | | — | | | — | |
15,269,473 |
| | 49,302,635 | | | 146,139,242 | | | 28,037,687 | | | 127,522,018 | |
| 143,868,241 | | | 190,939,028 | | | 1,580,257,869 | | | 72,901,410 | | | 437,641,376 | |
| | | | |
| | | | | | | | | | | | | |
| 12,026,199 | | | 124,972,609 | | | 905,042,350 | | | 8,876,862 | | | 263,269,029 | |
| 10,018,561 | | | 55,788,057 | | | 252,792,337 | | | 4,847,272 | | | 71,763,312 | |
| 121,798,849 | | | 9,783,273 | | | 349,442,468 | | | 59,171,745 | | | 60,266,523 | |
| 2,667 | | | 392,328 | | | 3,779,063 | | | 2,762 | | | 1,601,641 | |
| 21,965 | | | 2,761 | | | 69,201,651 | | | 2,769 | | | 40,740,871 | |
| | | | |
| | | | | | | | | | | | | |
| $13.64 | | | $26.80 | | | $24.38 | | | $19.74 | | | $31.83 | |
| $14.32 | | | $28.14 | | | $25.60 | | | $20.72 | | | $33.42 | |
| $13.47 | | | $23.72 | | | $21.49 | | | $19.51 | | | $27.08 | |
| $13.62 | | | $27.27 | | | $24.73 | | | $19.85 | | | $32.33 | |
| $13.62 | | | $26.69 | | | $24.22 | | | $19.73 | | | $31.60 | |
| $13.92 | | | $27.28 | | | $24.77 | | | $19.85 | | | $32.31 | |
| | | | |
| | | | | | | | | | | | | |
| 881,875 | | | 4,662,495 | | | 37,126,203 | | | 449,613 | | | 8,272,312 | |
| 743,870 | | | 2,351,666 | | | 11,764,304 | | | 248,475 | | | 2,649,671 | |
| 8,942,618 | | | 358,692 | | | 14,130,774 | | | 2,980,510 | | | 1,864,324 | |
| 196 | | | 14,698 | | | 156,060 | | | 140 | | | 50,681 | |
| 1,578 | | | 101 | | | 2,794,202 | | | 140 | | | 1,260,775 | |
| | | | |
| $114,605,416 | | | $136,164,540 | | | $1,423,836,673 | | | $41,664,456 | | | $302,554,101 | |
| | |
| The accompanying notes are an integral part of the financial statements. | | 37 |
Statements of Operations
| | | | | | | | | | | | | | | | |
| | | Eagle
Capital
Appreciation
Fund | | | Eagle
Growth
& Income
Fund | | | Eagle
International
Equity
Fund | | | Eagle
Investment
Grade Bond
Fund † | |
| | | | |
| Investment income | | | | | | | | | | | | | | | | |
| Dividends (a) | | $ | 2,677,409 | | | $ | 2,241,509 | | | $ | 1,142,237 | | | $ | — | |
| Interest | | | 1,530 | | | | 380,777 | | | | 132 | | | | 117,881 | |
| Total income | | | 2,678,939 | | | | 2,622,286 | | | | 1,142,369 | | | | 117,881 | |
| | | | |
| Expenses | | | | | | | | | | | | | | | | |
| Investment advisory fees | | | 1,650,450 | | | | 453,113 | | | | 459,411 | | | | 27,862 | |
| Administrative fees | | | 402,173 | | | | 125,341 | | | | 83,091 | | | | 6,965 | |
| Distribution fees | | | 969,823 | | | | 422,537 | | | | 371,079 | | | | 25,281 | |
| Shareholder servicing fees | | | 487,206 | | | | 128,751 | | | | 104,011 | | | | 1,729 | |
| Fund accounting fees | | | 49,395 | | | | 50,072 | | | | 35,650 | | | | 15,001 | |
| Professional fees | | | 42,630 | | | | 46,856 | | | | 46,944 | | | | 5,722 | |
| State qualification expenses | | | 47,290 | | | | 39,571 | | | | 29,302 | | | | 660 | |
| Organizational costs | | | — | | | | — | | | | — | | | | 41,232 | |
| Offering costs | | | — | | | | — | | | | — | | | | 13,305 | |
| Reports to shareholders | | | 10,310 | | | | 3,968 | | | | 1,358 | | | | 950 | |
| Trustees and officers compensation | | | 19,033 | | | | 21,786 | | | | 21,600 | | | | 5,135 | |
| Custodian fees | | | 12,236 | | | | 11,964 | | | | 134,353 | | | | 1,350 | |
| Internal audit fees | | | 1,233 | | | | 1,233 | | | | 1,233 | | | | 267 | |
| Other | | | 19,012 | | | | 14,850 | | | | 13,329 | | | | 3,179 | |
| Total expenses before adjustments | | | 3,710,791 | | | | 1,320,042 | | | | 1,301,361 | | | | 148,638 | |
| Fees and expenses waived | | | — | | | | (434 | ) | | | (106,426 | ) | | | (94,584 | ) |
| Recovered fees previously waived by Manager | | | — | | | | 81,374 | | | | — | | | | — | |
| Expense offsets | | | (15 | ) | | | (31 | ) | | | — | | | | — | |
| Total expenses after adjustments | | | 3,710,776 | | | | 1,400,951 | | | | 1,194,935 | | | | 54,054 | |
| Net investment income (loss) | | | (1,031,837 | ) | | | 1,221,335 | | | | (52,566 | ) | | | 63,827 | |
| | | | |
| Realized and unrealized gain (loss) on investments | | | | | | | | | | | | | | | | |
| Net realized gain (loss) on investments | | | 22,283,593 | | | | 5,957,573 | | | | 8,971,635 | | | | (15,412 | ) |
| Net realized gain (loss) on foreign currency transactions (b) | | | — | | | | (100,934 | ) | | | (136,374 | ) | | | — | |
| Net change in unrealized appreciation (depreciation) on investments | | | 48,213,769 | | | | 9,613,681 | | | | (3,930,810 | ) | | | 241,317 | |
| Net change in unrealized appreciation (depreciation) on translation of assets and liabilities denominated in foreign currencies | | | — | | | | 2,019 | | | | 456,890 | | | | — | |
| Net gain (loss) on investments | | | 70,497,362 | | | | 15,472,339 | | | | 5,361,341 | | | | 225,905 | |
Net increase (decrease) in net assets
resulting from operations | | | 69,465,525 | | | | 16,693,674 | | | | 5,308,775 | | | | 289,732 | |
| | | | |
| (a) Net of foreign withholding taxes | | | $13,409 | | | | $193,406 | | | | $127,504 | | | | $ — | |
| | | | |
| (b) Includes Brazilian IOF tax of | | | — | | | | 82,611 | | | | 17,511 | | | | — | |
† For the period March 1, 2010 (commencement of operations) to April 30, 2010.
| | |
| 38 | | The accompanying notes are an integral part of the financial statements. |
Statements of Operations
| | | | | | | | | | | | | | | | | | |
Eagle
Large Cap
Core
Fund | | | Eagle
Mid Cap
Growth
Fund | | | Eagle
Mid Cap
Stock
Fund | | | Eagle
Small Cap
Core Value
Fund | | | Eagle
Small Cap
Growth
Fund | |
| | | | |
| | | | | | | | | | | | | | | | | | |
| $ | 974,450 | | | $ | 1,167,681 | | | $ | 7,433,489 | | | $ | 372,238 | | | $ | 2,194,491 | |
| | 870 | | | | 234 | | | | 1,837 | | | | 300 | | | | 534 | |
| | 975,320 | | | | 1,167,915 | | | | 7,435,326 | | | | 372,538 | | | | 2,195,025 | |
| | | | |
| | | | | | | | | | | | | | | | | | |
| | 402,543 | | | | 501,302 | | | | 4,070,301 | | | | 195,799 | | | | 1,088,103 | |
| | 72,394 | | | | 123,514 | | | | 1,017,560 | | | | 35,394 | | | | 255,067 | |
| | 62,827 | | | | 390,968 | | | | 2,308,271 | | | | 28,865 | | | | 615,039 | |
| | 179,649 | | | | 131,840 | | | | 1,317,493 | | | | 93,907 | | | | 323,097 | |
| | 48,963 | | | | 48,952 | | | | 49,386 | | | | 48,296 | | | | 49,397 | |
| | 37,711 | | | | 37,144 | | | | 37,155 | | | | 37,136 | | | | 37,296 | |
| | 33,274 | | | | 31,732 | | | | 51,843 | | | | 37,430 | | | | 37,055 | |
| | — | | | | — | | | | — | | | | — | | | | — | |
| | — | | | | — | | | | — | | | | — | | | | — | |
| | 5,531 | | | | 3,159 | | | | 42,105 | | | | 3,567 | | | | 6,840 | |
| | 21,629 | | | | 21,629 | | | | 21,631 | | | | 21,629 | | | | 21,629 | |
| | 2,968 | | | | 4,272 | | | | 34,824 | | | | 2,663 | | | | 9,216 | |
| | 1,233 | | | | 1,233 | | | | 1,233 | | | | 1,233 | | | | 1,233 | |
| | 13,608 | | | | 13,575 | | | | 25,820 | | | | 11,713 | | | | 15,773 | |
| | 882,330 | | | | 1,309,320 | | | | 8,977,622 | | | | 517,632 | | | | 2,459,745 | |
| | (162,004 | ) | | | (522 | ) | | | — | | | | (161,189 | ) | | | — | |
| | — | | | | — | | | | — | | | | — | | | | — | |
| | (11 | ) | | | (6 | ) | | | (222 | ) | | | (6 | ) | | | (5 | ) |
| | 720,315 | | | | 1,308,792 | | | | 8,977,400 | | | | 356,437 | | | | 2,459,740 | |
| | 255,005 | | | | (140,877 | ) | | | (1,542,074 | ) | | | 16,101 | | | | (264,715 | ) |
| | | | |
| | | | | | | | | | | | | | | | | | |
| | 1,661,406 | | | | 14,225,842 | | | | 184,031,902 | | | | 2,727,886 | | | | 15,189,234 | |
| | — | | | | — | | | | — | | | | — | | | | — | |
| | 15,943,196 | | | | 24,048,332 | | | | 29,775,345 | | | | 11,094,143 | | | | 71,059,361 | |
|
— |
| | | — | | | | — | | | | — | | | | — | |
| | 17,604,602 | | | | 38,274,174 | | | | 213,807,247 | | | | 13,822,029 | | | | 86,248,595 | |
|
17,859,607 |
| | | 38,133,297 | | | | 212,265,173 | | | | 13,838,130 | | | | 85,983,880 | |
| | | | |
| | $ — | | | | $4,493 | | | | $147,156 | | | | $662 | | | | $8,004 | |
| | | | |
| | — | | | | — | | | | — | | | | — | | | | — | |
| | |
| The accompanying notes are an integral part of the financial statements. | | 39 |
Statements of Changes in Net Assets
| | | | | | | | | | | | | | | | | | | | | |
| | | Eagle Capital
Appreciation Fund | | | Eagle Growth
& Income Fund | | | Eagle International
Equity Fund | | | Eagle Investment
Grade Bond Fund | |
| | | 11/1/09 to
4/30/10* | | | 11/1/08 to
10/31/09 | | | 11/1/09 to
4/30/10* | | | 11/1/08 to
10/31/09 | | | 11/1/09 to
4/30/10* | | | 11/1/08 to
10/31/09 | | | 3/1/10 to
4/30/10* (c) | |
| | | | | | | |
| Net assets, beginning of period | | $486,558,402 | | | $442,306,086 | | | $141,502,238 | | | $96,988,805 | | | $117,155,129 | | | $163,841,193 | | | $— | |
| Increase (decrease) in net assets from operations | | | | | | | | | | | | | | | | | | | | | |
| Net investment income (loss) | | (1,031,837 | ) | | (1,782,603 | ) | | 1,221,335 | | | 2,971,034 | | | (52,566 | ) | | 911,426 | | | 63,827 | |
| Net realized gain (loss) on investments | | 22,283,593 | | | (70,982,973 | ) | | 5,957,573 | | | (8,693,220 | ) | | 8,971,635 | | | (35,794,386 | ) | | (15,412 | ) |
| Net realized gain (loss) on foreign currency transactions (b) | | — | | | — | | | (100,934 | ) | | (603,582 | ) | | (136,374 | ) | | 2,560,936 | | | — | |
| Net change in unrealized appreciation (depreciation) on investments | | 48,213,769 | | | 151,709,769 | | | 9,613,681 | | | 28,119,220 | | | (3,930,810 | ) | | 47,618,859 | | | 241,317 | |
| Net change in unrealized appreciation (depreciation) on translation of assets and liabilities denominated in foreign currencies | | — | | | — | | | 2,019 | | | 3,493 | | | 456,890 | | | (5,581,811 | ) | | — | |
| Net increase (decrease) in net assets resulting from operations | | 69,465,525 | | | 78,944,193 | | | 16,693,674 | | | 21,796,945 | | | 5,308,775 | | | 9,715,024 | | | 289,732 | |
| Distributions to shareholders from | | | | | | | | | | | | | | | | | | | | | |
| Net investment income | | — | | | — | | | (1,170,068 | ) | | (3,030,927 | ) | | — | | | (5,314,007 | ) | | (20,357 | ) |
| Net realized gains | | — | | | — | | | — | | | — | | | — | | | — | | | — | |
| Net distributions to shareholders | | — | | | — | | | (1,170,068 | ) | | (3,030,927 | ) | | — | | | (5,314,007 | ) | | (20,357 | ) |
| Fund share transactions | | | | | | | | | | | | | | | | | | | | | |
| Proceeds from shares sold-Class A | | 90,337,110 | | | 91,862,409 | | | 32,996,518 | | | 34,047,379 | | | 2,256,146 | | | 10,034,646 | | | 22,438,264 | |
| Issued as reinvestment of distributions-Class A | | — | | | — | | | 740,272 | | | 1,858,490 | | | — | | | 2,253,539 | | | 11,244 | |
| Cost of shares redeemed-Class A | | (52,914,939 | ) | | (115,349,472 | ) | | (10,831,209 | ) | | (18,806,972 | ) | | (13,643,764 | ) | | (34,749,624 | ) | | (187,984 | ) |
| Proceeds from shares sold-Class C | | 2,957,939 | | | 6,301,679 | | | 17,006,636 | | | 14,441,585 | | | 1,306,928 | | | 6,156,437 | | | 15,975,474 | |
| Issued as reinvestment of distributions-Class C | | — | | | — | | | 239,105 | | | 844,172 | | | — | | | 2,610,913 | | | 4,097 | |
| Cost of shares redeemed-Class C | | (9,945,100 | ) | | (21,927,284 | ) | | (3,999,496 | ) | | (8,666,716 | ) | | (12,349,279 | ) | | (37,662,224 | ) | | (26,082 | ) |
| Proceeds from shares sold-Class I | | 6,786,464 | | | 9,920,860 | | | 4,078,341 | | | 1,765,651 | | | 7,939 | | | 1,258,426 | | | 12,500 | |
| Issued as reinvestment of distributions-Class I | | — | | | — | | | 6,512 | | | 1,273 | | | — | | | — | | | 2 | |
| Cost of shares redeemed-Class I | | (1,945,132 | ) | | (6,500,408 | ) | | (424,666 | ) | | (19,287 | ) | | (8,138 | ) | | (989,194 | ) | | — | |
| Proceeds from shares sold-Class R-3 | | 102,647 | | | 388,778 | | | 24,363 | | | 280,032 | | | 2,500 | | | — | | | 2,500 | |
| Issued as reinvestment of distributions-Class R-3 | | — | | | — | | | 2,166 | | | 1,808 | | | — | | | — | | | 1 | |
| Cost of shares redeemed-Class R-3 | | (176,795 | ) | | (27,632 | ) | | — | | | — | | | — | | | — | | | — | |
| Proceeds from shares sold-Class R-5 | | 2,680,081 | | | 5,356,787 | | | 2,500 | | | — | | | 2,500 | | | — | | | 2,500 | |
| Issued as reinvestment of distributions-Class R-5 | | — | | | — | | | 13 | | | — | | | — | | | — | | | 2 | |
| Cost of shares redeemed-Class R-5 | | (2,202,424 | ) | | (4,717,594 | ) | | — | | | — | | | — | | | — | | | — | |
| Net increase (decrease) from fund share transactions | | 35,679,851 | | | (34,691,877 | ) | | 39,841,055 | | | 25,747,415 | | | (22,425,168 | ) | | (51,087,081 | ) | | 38,232,518 | |
| Increase (decrease) in net assets | | 105,145,376 | | | 44,252,316 | | | 55,364,661 | | | 44,513,433 | | | (17,116,393 | ) | | (46,686,064 | ) | | 38,501,893 | |
| Net assets, end of period (a) | | 591,703,778 | | | 486,558,402 | | | 196,866,899 | | | 141,502,238 | | | 100,038,736 | | | 117,155,129 | | | 38,501,893 | |
| (a) Includes undistributed net investment income | | | | | | | | | | | | | | | | | | | | | |
| (accumulated net investment loss) of | | $(1,031,837 | ) | | $— | | | $270,865 | | | $219,598 | | | $(643,431 | ) | | $(590,865 | ) | | $43,470 | |
| | | | | | | |
| (b) Includes Brazilian IOF tax of | | — | | | — | | | 82,611 | | | — | | | 17,511 | | | — | | | — | |
| | | | | | | |
| Shares issued and redeemed | | | | | | | | | | | | | | | | | | | | | |
| Shares sold-Class A | | 3,573,936 | | | 5,009,360 | | | 2,707,294 | | | 3,291,400 | | | 109,633 | | | 595,758 | | | 1,555,281 | |
| Issued as reinvestment of distributions-Class A | | — | | | — | | | 59,393 | | | 183,479 | | | — | | | 134,975 | | | 781 | |
| Shares redeemed-Class A | | (2,106,597 | ) | | (6,544,041 | ) | | (891,666 | ) | | (1,977,699 | ) | | (667,801 | ) | | (2,127,606 | ) | | (13,018 | ) |
| Shares sold-Class C | | 134,788 | | | 385,422 | | | 1,425,579 | | | 1,436,903 | | | 70,448 | | | 410,924 | | | 1,108,025 | |
| Issued as reinvestment of distributions-Class C | | — | | | — | | | 19,746 | | | 86,176 | | | — | | | 171,305 | | | 285 | |
| Shares redeemed-Class C | | (452,584 | ) | | (1,419,713 | ) | | (338,645 | ) | | (942,107 | ) | | (667,938 | ) | | (2,572,434 | ) | | (1,808 | ) |
| Shares sold-Class I | | 268,443 | | | 497,775 | | | 334,529 | | | 164,656 | | | 399 | | | 79,132 | | | 867 | |
| Issued as reinvestment of distributions-Class I | | — | | | — | | | 511 | | | 115 | | | — | | | — | | | — | |
| Shares redeemed-Class I | | (75,432 | ) | | (392,848 | ) | | (35,459 | ) | | (1,760 | ) | | (399 | ) | | (71,652 | ) | | — | |
| Shares sold-Class R-3 | | 4,118 | | | 19,689 | | | 1,941 | | | 23,654 | | | 120 | | | — | | | 173 | |
| Issued as reinvestment of distributions-Class R-3 | | — | | | — | | | 174 | | | 150 | | | — | | | — | | | — | |
| Shares redeemed-Class R-3 | | (6,968 | ) | | (1,427 | ) | | — | | | — | | | — | | | — | | | — | |
| Shares sold-Class R-5 | | 105,645 | | | 280,379 | | | 206 | | | — | | | 120 | | | — | | | 173 | |
| Issued as reinvestment of distributions-Class R-5 | | — | | | — | | | 1 | | | — | | | — | | | — | | | — | |
| Shares redeemed-Class R-5 | | (86,586 | ) | | (255,618 | ) | | — | | | — | | | — | | | — | | | — | |
| Shares issued and redeemed | | 1,358,763 | | | (2,421,022 | ) | | 3,283,604 | | | 2,264,967 | | | (1,155,418 | ) | | (3,379,598 | ) | | 2,650,759 | |
| | | | | | | |
| * Unaudited | | | | | | | | | | | | | | | | | | | | | |
(c) For the period March 1, 2010 (commencement of operations) to April 30, 2010. (d) For the period November 3, 2008 (commencement of operations) to October 31, 2009. (e) Includes tax return of capital distributions of $186,860.
| | |
| 40 | | The accompanying notes are an integral part of the financial statements. |
Statements of Changes in Net Assets
| | | | | | | | | | | | | | | | | | | | | | | | | | | | |
| Eagle Large Cap Core Fund | | | Eagle Mid Cap Growth Fund | | | Eagle Mid Cap Stock Fund | | | Eagle Small Cap Core
Value Fund | | | Eagle Small Cap Growth Fund | |
11/1/09 to
4/30/10* | | | 11/1/08 to
10/31/09 | | | 11/1/09 to
4/30/10* | | | 11/1/08 to
10/31/09 | | | 11/1/09 to
4/30/10* | | | 11/1/08 to
10/31/09 | | | 11/1/09 to
4/30/10* | | | 11/3/08 to
10/31/09 (d) | | | 11/1/09 to
4/30/10* | | | 11/1/08 to
10/31/09 | |
| | | | | | | | | |
| $124,850,857 | | | $150,519,698 | | | $146,725,344 | | | $128,341,052 | | | $1,360,595,478 | | | $1,113,403,737 | | | $57,833,435 | | | $— | | | $312,128,302 | | | $270,399,419 | |
| | | | | | | | | | | | | | | | | | | | | | | | | | | | |
| 255,005 | | | 1,247,380 | | | (140,877 | ) | | (1,054,090 | ) | | (1,542,074 | ) | | (2,912,750 | ) | | 16,101 | | | (55,546 | ) | | (264,715 | ) | | (2,451,734 | ) |
| 1,661,406 | | | (37,998,722 | ) | | 14,225,842 | | | (21,860,794 | ) | | 184,031,902 | | | (202,886,263 | ) | | 2,727,886 | | | 2,089,797 | | | 15,189,234 | | | (74,657,248 | ) |
| — | | | — | | | — | | | — | | | — | | | — | | | — | | | — | | | — | | | — | |
| 15,943,196 | | | 45,315,169 | | | 24,048,332 | | | 39,599,016 | | | 29,775,345 | | | 374,125,086 | | | 11,094,143 | | | 16,943,544 | | | 71,059,361 | | | 108,665,604 | |
— |
| | — | | | — | | | — | | | — | | | — | | | — | | | — | | | — | | | — | |
| 17,859,607 | | | 8,563,827 | | | 38,133,297 | | | 16,684,132 | | | 212,265,173 | | | 168,326,073 | | | 13,838,130 | | | 18,977,795 | | | 85,983,880 | | | 31,556,622 | |
| | | | | | | | | | | | | | | | | | | | | | | | | | | | |
| (965,747 | ) | | (2,233,573 | ) | | — | | | — | | | — | | | — | | | (37,833 | ) | | — | | | — | | | — | |
| — | | | — | | | — | | | — | | | — | | | — | | | (2,027,828 | ) | | — | | | — | | | — | |
| (965,747 | ) | | (2,233,573 | ) | | — | | | — | | | — | | | — | | | (2,065,661 | ) | | — | | | — | | | — | |
| | | | | | | | | | | | | | | | | | | | | | | | | | | | |
| 674,183 | | | 1,923,879 | | | 21,311,607 | | | 25,224,739 | | | 79,240,212 | | | 197,579,460 | | | 1,977,703 | | | 5,090,916 | | | 41,892,050 | | | 58,304,739 | |
| 47,258 | | | 109,742 | | | — | | | — | | | — | | | — | | | 189,893 | | | — | | | — | | | — | |
| (1,403,549 | ) | | (4,005,927 | ) | | (16,482,246 | ) | | (26,840,300 | ) | | (111,223,114 | ) | | (262,214,770 | ) | | (198,421 | ) | | (418,935 | ) | | (33,080,327 | ) | | (64,602,948 | ) |
| 616,149 | | | 1,488,931 | | | 2,997,310 | | | 7,610,208 | | | 11,483,127 | | | 26,855,616 | | | 968,458 | | | 3,075,373 | | | 3,048,823 | | | 10,473,989 | |
| — | | | 10,057 | | | — | | | — | | | — | | | — | | | 122,120 | | | — | | | — | | | — | |
| (1,070,358 | ) | | (1,986,922 | ) | | (4,210,777 | ) | | (9,247,929 | ) | | (25,107,017 | ) | | (50,365,332 | ) | | (220,760 | ) | | (254,488 | ) | | (6,533,760 | ) | | (14,597,120 | ) |
| 12,842,023 | | | 26,464,887 | | | 3,102,086 | | | 4,840,895 | | | 95,474,069 | | | 190,159,453 | | | 5,544,871 | | | 39,324,515 | | | 34,915,754 | | | 8,594,439 | |
| 876,556 | | | 2,048,529 | | | — | | | — | | | — | | | — | | | 1,689,029 | | | — | | | — | | | — | |
| (10,462,049 | ) | | (58,057,505 | ) | | (533,466 | ) | | (227,262 | ) | | (43,212,759 | ) | | (48,229,911 | ) | | (6,782,387 | ) | | (7,961,741 | ) | | (2,208,932 | ) | | (2,361,747 | ) |
| 2,500 | | | — | | | 199,761 | | | 658,212 | | | 1,291,678 | | | 1,524,337 | | | 2,500 | | | — | | | 298,096 | | | 1,047,709 | |
| — | | | — | | | — | | | — | | | — | | | — | | | — | | | — | | | — | | | — | |
| — | | | — | | | (306,388 | ) | | (318,403 | ) | | (525,530 | ) | | (597,213 | ) | | — | | | — | | | (744,572 | ) | | (764,144 | ) |
| 714 | | | 5,935 | | | 2,500 | | | — | | | 5,479,406 | | | 31,322,747 | | | 2,500 | | | — | | | 5,323,207 | | | 16,800,032 | |
| 161 | | | — | | | — | | | — | | | — | | | — | | | — | | | — | | | — | | | — | |
| (64 | ) | | (701 | ) | | — | | | — | | | (5,502,854 | ) | | (7,168,719 | ) | | — | | | — | | | (3,381,145 | ) | | (2,722,688 | ) |
| 2,123,524 | | | (31,999,095 | ) | | 6,080,387 | | | 1,700,160 | | | 7,397,218 | | | 78,865,668 | | | 3,295,506 | | | 38,855,640 | | | 39,529,194 | | | 10,172,261 | |
| 19,017,384 | | | (25,668,841 | ) | | 44,213,684 | | | 18,384,292 | | | 219,662,391 | | | 247,191,741 | | | 15,067,975 | | | 57,833,435 | | | 125,513,074 | | | 41,728,883 | |
| 143,868,241 | | | 124,850,857 | | | 190,939,028 | | | 146,725,344 | | | 1,580,257,869 | | | 1,360,595,478 | | | 72,901,410 | | | 57,833,435 | | | 437,641,376 | | | 312,128,302 | |
| | | | | | | | | | | | | | | | | | | | | | | | | | | | |
| $80,346 | | | $791,088 | | | $(140,877 | ) | | $— | | | $(1,750,080 | ) | | $(208,006 | ) | | $(57,674 | ) | | $(35,942 | ) | | $(155,731 | ) | | $108,984 | |
| | | | | | | | | |
| — | | | — | | | — | | | — | | | — | | | — | | | — | | | — | | | — | | | — | |
| | | | | | | | | |
| | | | | | | | | | | | | | | | | | | | | | | | | | | | |
| 52,402 | | | 191,197 | | | 865,269 | | | 1,368,513 | | | 3,442,804 | | | 11,101,355 | | | 107,643 | | | 373,694 | | | 1,450,421 | | | 2,712,594 | |
| 3,799 | | | 11,725 | | | — | | | — | | | — | | | — | | | 11,021 | | | — | | | — | | | — | |
| (110,802 | ) | | (409,849 | ) | | (690,103 | ) | | (1,484,342 | ) | | (4,822,058 | ) | | (15,158,025 | ) | | (11,093 | ) | | (31,652 | ) | | (1,166,121 | ) | | (3,111,128 | ) |
| 48,099 | | | 150,516 | | | 138,085 | | | 473,431 | | | 565,807 | | | 1,700,760 | | | 53,529 | | | 221,065 | | | 125,353 | | | 573,022 | |
| — | | | 1,080 | | | — | | | — | | | — | | | — | | | 7,154 | | | — | | | — | | | — | |
| (83,593 | ) | | (204,737 | ) | | (195,420 | ) | | (590,394 | ) | | (1,233,984 | ) | | (3,270,863 | ) | | (12,305 | ) | | (20,968 | ) | | (269,801 | ) | | (827,327 | ) |
| 1,000,798 | | | 2,646,440 | | | 123,807 | | | 243,373 | | | 4,095,086 | | | 10,215,374 | | | 306,235 | | | 3,474,664 | | | 1,162,944 | | | 426,895 | |
| 70,690 | | | 219,564 | | | — | | | — | | | — | | | — | | | 97,688 | | | — | | | — | | | — | |
| (810,506 | ) | | (6,252,510 | ) | | (20,705 | ) | | (11,653 | ) | | (1,842,031 | ) | | (2,603,066 | ) | | (370,274 | ) | | (527,803 | ) | | (72,387 | ) | | (109,368 | ) |
| 196 | | | — | | | 8,238 | | | 35,550 | | | 55,751 | | | 87,669 | | | 140 | | | — | | | 10,586 | | | 50,939 | |
| — | | | — | | | — | | | — | | | — | | | — | | | — | | | — | | | — | | | — | |
| — | | | — | | | (12,489 | ) | | (16,601 | ) | | (22,456 | ) | | (32,777 | ) | | — | | | — | | | (26,736 | ) | | (34,513 | ) |
| 55 | | | 565 | | | 101 | | | — | | | 234,069 | | | 1,886,589 | | | 140 | | | — | | | 182,165 | | | 837,725 | |
| 13 | | | — | | | — | | | — | | | — | | | — | | | — | | | — | | | — | | | — | |
| (5 | ) | | (60 | ) | | — | | | — | | | (233,810 | ) | | (389,934 | ) | | — | | | — | | | (116,660 | ) | | (120,927 | ) |
| 171,146 | | | (3,646,069 | ) | | 216,783 | | | 17,877 | | | 239,178 | | | 3,537,082 | | | 189,878 | | | 3,489,000 | | | 1,279,764 | | | 397,912 | |
| | | | | | | | | |
| | | | | | | | | | | | | | | | | | | | | | | | | | | | |
| | |
| The accompanying notes are an integral part of the financial statements. | | 41 |
Financial Highlights
| | | | | | | | | | | | | | | | | | | | | | | | | | | | | | | | | | | | | | | | | |
Fiscal periods† | | | | | From investment operations | | | Dividends & distributions | | | | | Ratios to average daily net assets (%) | | | | | | | | |
| | Beginning
net asset
value | | Income
(loss) | | | Realized &
unrealized
gain (loss) | | | Total | | | From
investment
income | | | From
realized
gains | | | Total | | | Ending
net
asset
value | | With
expenses
waived/
recovered | | | Without
expenses
waived/
recovered | | | Net
income
(loss) | | | Portfolio
turnover
rate (%) | | Total
return
(%) (a) | | | Ending
net
assets
(millions) |
| Beginning | | Ending | | | | | | | | | | | | | | | |
| Eagle Capital Appreciation Fund | | | | | | | | | | | | | | | | | | | | | | | | | | | | | | | | | | | | |
| Class A* | | | | | | | | | | | | | | | | | | | | | | | | | | | | | | | | | | | | |
| 11/01/09 | | 04/30/10 | | | $22.65 | | $(0.03 | ) | | $3.25 | | | $3.22 | | | $— | | | $— | | | $— | | | $25.87 | | 1.26 | (b) | | 1.26 | (b) | | (0.28 | )(b) | | 26 | | 14.22 | (c) | | $457 |
| 11/01/08 | | 10/31/09 | | | 18.58 | | (0.06 | ) | | 4.13 | | | 4.07 | | | — | | | — | | | — | | | 22.65 | | 1.32 | | | 1.32 | | | (0.31 | ) | | 54 | | 21.91 | | | 367 |
| 11/01/07 | | 10/31/08 | | | 35.99 | | (0.13 | ) | | (12.71 | ) | | (12.84 | ) | | — | | | (4.57 | ) | | (4.57 | ) | | 18.58 | | 1.20 | | | 1.20 | | | (0.45 | ) | | 61 | | (40.38 | ) | | 329 |
| 11/01/06 | | 10/31/07 | | | 29.67 | | 0.04 | | | 6.46 | (d) | | 6.50 | | | — | | | (0.18 | ) | | (0.18 | ) | | 35.99 | | 1.20 | | | 1.20 | | | 0.11 | | | 62 | | 22.02 | | | 566 |
| 09/01/06 | | 10/31/06 | (e) | | 28.59 | | (0.01 | ) | | 1.09 | (d) | | 1.08 | | | — | | | — | | | — | | | 29.67 | | 1.23 | (b) | | 1.23 | (b) | | (0.19 | )(b) | | 7 | | 3.78 | (c) | | 387 |
| 09/01/05 | | 08/31/06 | | | 26.28 | | (0.06 | ) | | 2.37 | (d) | | 2.31 | | | — | | | — | | | — | | | 28.59 | | 1.19 | | | 1.19 | | | (0.23 | ) | | 58 | | 8.79 | | | 378 |
| 09/01/04 | | 08/31/05 | | | 22.85 | | — | | | 3.43 | (d) | | 3.43 | | | — | | | — | | | — | | | 26.28 | | 1.18 | | | 1.18 | | | 0.01 | | | 42 | | 15.01 | | | 391 |
| Class C* | | | | | | | | | | | | | | | | | | | | | | | | | | | | | | | | | | | | |
| 11/01/09 | | 04/30/10 | | | 19.90 | | (0.11 | ) | | 2.86 | | | 2.75 | | | — | | | — | | | — | | | 22.65 | | 2.01 | (b) | | 2.01 | (b) | | (1.03 | )(b) | | 26 | | 13.82 | (c) | | 89 |
| 11/01/08 | | 10/31/09 | | | 16.45 | | (0.18 | ) | | 3.63 | | | 3.45 | | | — | | | — | | | — | | | 19.90 | | 2.08 | | | 2.08 | | | (1.07 | ) | | 54 | | 20.97 | | | 84 |
| 11/01/07 | | 10/31/08 | | | 32.64 | | (0.30 | ) | | (11.32 | ) | | (11.62 | ) | | — | | | (4.57 | ) | | (4.57 | ) | | 16.45 | | 1.95 | | | 1.95 | | | (1.19 | ) | | 61 | | (40.85 | ) | | 87 |
| 11/01/06 | | 10/31/07 | | | 27.13 | | (0.19 | ) | | 5.88 | (d) | | 5.69 | | | — | | | (0.18 | ) | | (0.18 | ) | | 32.64 | | 1.96 | | | 1.96 | | | (0.65 | ) | | 62 | | 21.09 | | | 170 |
| 09/01/06 | | 10/31/06 | (e) | | 26.17 | | (0.04 | ) | | 1.00 | (d) | | 0.96 | | | — | | | — | | | — | | | 27.13 | | 1.99 | (b) | | 1.99 | (b) | | (0.94 | )(b) | | 7 | | 3.67 | (c) | | 149 |
| 09/01/05 | | 08/31/06 | | | 24.29 | | (0.25 | ) | | 2.13 | (d) | | 1.88 | | | — | | | — | | | — | | | 26.17 | | 1.94 | | | 1.94 | | | (0.98 | ) | | 58 | | 7.74 | | | 145 |
| 09/01/04 | | 08/31/05 | | | 21.27 | | (0.17 | ) | | 3.19 | (d) | | 3.02 | | | — | | | — | | | — | | | 24.29 | | 1.93 | | | 1.93 | | | (0.73 | ) | | 42 | | 14.20 | | | 120 |
| Class I* | | | | | | | | | | | | | | | | | | | | | | | | | | | | | | | | | | | | |
| 11/01/09 | | 04/30/10 | | | 22.98 | | 0.01 | | | 3.31 | | | 3.32 | | | — | | | — | | | — | | | 26.30 | | 0.88 | (b) | | 0.88 | (b) | | 0.07 | (b) | | 26 | | 14.45 | (c) | | 21 |
| 11/01/08 | | 10/31/09 | | | 18.78 | | 0.01 | | | 4.19 | | | 4.20 | | | — | | | — | | | — | | | 22.98 | | 0.94 | | | 0.94 | | | 0.07 | | | 54 | | 22.36 | | | 14 |
| 11/01/07 | | 10/31/08 | | | 36.21 | | — | | | (12.86 | ) | | (12.86 | ) | | — | | | (4.57 | ) | | (4.57 | ) | | 18.78 | | 0.79 | | | 0.79 | | | (0.01 | ) | | 61 | | (40.16 | ) | | 10 |
| 11/01/06 | | 10/31/07 | | | 29.73 | | 0.17 | | | 6.49 | (d) | | 6.66 | | | — | | | (0.18 | ) | | (0.18 | ) | | 36.21 | | 0.80 | | | 0.80 | | | 0.51 | | | 62 | | 22.51 | | | 51 |
| 09/01/06 | | 10/31/06 | (e) | | 28.63 | | 0.01 | | | 1.09 | (d) | | 1.10 | | | — | | | — | | | — | | | 29.73 | | 0.85 | (b) | | 0.85 | (b) | | 0.20 | (b) | | 7 | | 3.84 | (c) | | 30 |
| 03/21/06 | | 08/31/06 | | | 28.93 | | 0.01 | | | (0.31 | )(d) | | (0.30 | ) | | — | | | — | | | — | | | 28.63 | | 0.91 | (b) | | 0.91 | (b) | | 0.07 | (b) | | 58 | | (1.04 | )(c) | | 26 |
| Class R-3* | | | | | | | | | | | | | | | | | | | | | | | | | | | | | | | | | | | | |
| 11/01/09 | | 04/30/10 | | | 22.52 | | (0.06 | ) | | 3.23 | | | 3.17 | | | — | | | — | | | — | | | 25.69 | | 1.46 | (b) | | 1.46 | (b) | | (0.49 | )(b) | | 26 | | 14.08 | (c) | | 1 |
| 11/01/08 | | 10/31/09 | | | 18.51 | | (0.10 | ) | | 4.11 | | | 4.01 | | | — | | | — | | | — | | | 22.52 | | 1.49 | | | 1.49 | | | (0.51 | ) | | 54 | | 21.66 | | | 1 |
| 11/01/07 | | 10/31/08 | | | 35.97 | | (0.20 | ) | | (12.69 | ) | | (12.89 | ) | | — | | | (4.57 | ) | | (4.57 | ) | | 18.51 | | 1.42 | | | 1.42 | | | (0.70 | ) | | 61 | | (40.56 | ) | | 0 |
| 09/12/07 | | 10/31/07 | | | 33.30 | | (0.05 | ) | | 2.72 | (d) | | 2.67 | | | — | | | — | | | — | | | 35.97 | | 1.65 | (b) | | 7.17 | (b) | | (1.26 | )(b) | | 62 | | 8.02 | (c) | | 0 |
| Class R-5* | | | | | | | | | | | | | | | | | | | | | | | | | | | | | | | | | | | | |
| 11/01/09 | | 04/30/10 | | | 22.94 | | 0.01 | | | 3.30 | | | 3.31 | | | — | | | — | | | — | | | 26.25 | | 0.86 | (b) | | 0.86 | (b) | | 0.11 | (b) | | 26 | | 14.43 | (c) | | 24 |
| 11/01/08 | | 10/31/09 | | | 18.73 | | 0.02 | | | 4.19 | | | 4.21 | | | — | | | — | | | — | | | 22.94 | | 0.87 | | | 0.87 | | | 0.12 | | | 54 | | 22.48 | | | 20 |
| 11/01/07 | | 10/31/08 | | | 36.13 | | (0.04 | ) | | (12.79 | ) | | (12.83 | ) | | — | | | (4.57 | ) | | (4.57 | ) | | 18.73 | | 0.83 | | | 0.83 | | | (0.13 | ) | | 61 | | (40.17 | ) | | 16 |
| 11/01/06 | | 10/31/07 | | | 29.68 | | 0.16 | | | 6.47 | (d) | | 6.63 | | | — | | | (0.18 | ) | | (0.18 | ) | | 36.13 | | 0.85 | | | 0.85 | | | 0.48 | | | 62 | | 22.45 | | | 12 |
| 10/02/06 | | 10/31/06 | | | 29.04 | | — | | | 0.64 | (d) | | 0.64 | | | — | | | — | | | — | | | 29.68 | | 0.85 | (b) | | 0.85 | (b) | | (0.20 | )(b) | | 7 | | 2.20 | (c) | | 7 |
| | | | | | | | | | | | | |
| Eagle Growth & Income Fund | | | | | | | | | | | | | | | | | | | | | | | | | | | | | | | | | | | | |
| Class A* | | | | | | | | | | | | | | | | | | | | | | | | | | | | | | | | | | | | |
| 11/01/09 | | 04/30/10 | | | 11.57 | | 0.10 | | | 1.14 | | | 1.24 | | | (0.09 | ) | | — | | | (0.09 | ) | | 12.72 | | 1.40 | (b) | | 1.32 | (b) | | 1.72 | (b) | | 24 | | 10.78 | (c) | | 123 |
| 11/01/08 | | 10/31/09 | | | 9.71 | | 0.31 | | | 1.86 | | | 2.17 | | | (0.31 | ) | | — | | | (0.31 | ) | | 11.57 | | 1.39 | | | 1.55 | | | 3.12 | | | 57 | | 22.88 | | | 90 |
| 11/01/07 | | 10/31/08 | | | 17.77 | | 0.37 | | | (6.27 | ) | | (5.90 | ) | | (0.35 | ) | | (1.81 | ) | | (2.16 | ) | | 9.71 | | 1.35 | | | 1.33 | | | 2.75 | | | 64 | | (37.25 | ) | | 61 |
| 11/01/06 | | 10/31/07 | | | 14.68 | | 0.36 | | | 3.60 | (d) | | 3.96 | | | (0.34 | ) | | (0.53 | ) | | (0.87 | ) | | 17.77 | | 1.35 | | | 1.40 | | | 2.28 | | | 63 | | 28.17 | | | 96 |
| 10/01/06 | | 10/31/06 | (e) | | 14.43 | | 0.02 | | | 0.34 | (d) | | 0.36 | | | (0.11 | ) | | — | | | (0.11 | ) | | 14.68 | | 1.35 | (b) | | 1.56 | (b) | | 1.33 | (b) | | 4 | | 2.52 | (c) | | 68 |
| 10/01/05 | | 09/30/06 | | | 13.81 | | 0.38 | | | 1.43 | (d) | | 1.81 | | | (0.34 | ) | | (0.85 | ) | | (1.19 | ) | | 14.43 | | 1.35 | | | 1.42 | | | 2.74 | | | 54 | | 13.90 | | | 68 |
| 10/01/04 | | 09/30/05 | | | 11.80 | | 0.28 | | | 1.99 | (d) | | 2.27 | | | (0.26 | ) | | — | | | (0.26 | ) | | 13.81 | | 1.35 | | | 1.51 | | | 2.13 | | | 73 | | 19.41 | | | 45 |
| Class C* | | | | | | | | | | | | | | | | | | | | | | | | | | | | | | | | | | | | |
| 11/01/09 | | 04/30/10 | | | 11.24 | | 0.05 | | | 1.12 | | | 1.17 | | | (0.06 | ) | | — | | | (0.06 | ) | | 12.35 | | 2.20 | (b) | | 2.06 | (b) | | 0.92 | (b) | | 24 | | 10.38 | (c) | | 68 |
| 11/01/08 | | 10/31/09 | | | 9.45 | | 0.23 | | | 1.80 | | | 2.03 | | | (0.24 | ) | | — | | | (0.24 | ) | | 11.24 | | 2.19 | | | 2.31 | | | 2.35 | | | 57 | | 21.89 | | | 49 |
| 11/01/07 | | 10/31/08 | | | 17.34 | | 0.26 | | | (6.10 | ) | | (5.84 | ) | | (0.24 | ) | | (1.81 | ) | | (2.05 | ) | | 9.45 | | 2.15 | | | 2.09 | | | 1.95 | | | 64 | | (37.75 | ) | | 36 |
| 11/01/06 | | 10/31/07 | | | 14.38 | | 0.23 | | | 3.50 | (d) | | 3.73 | | | (0.24 | ) | | (0.53 | ) | | (0.77 | ) | | 17.34 | | 2.14 | | | 2.16 | | | 1.52 | | | 63 | | 27.05 | | | 59 |
| 10/01/06 | | 10/31/06 | (e) | | 14.12 | | 0.01 | | | 0.34 | (d) | | 0.35 | | | (0.09 | ) | | — | | | (0.09 | ) | | 14.38 | | 2.10 | (b) | | 2.31 | (b) | | 0.58 | (b) | | 4 | | 2.46 | (c) | | 47 |
| 10/01/05 | | 09/30/06 | | | 13.54 | | 0.27 | | | 1.40 | (d) | | 1.67 | | | (0.24 | ) | | (0.85 | ) | | (1.09 | ) | | 14.12 | | 2.10 | | | 2.17 | | | 2.00 | | | 54 | | 13.01 | | | 46 |
| 10/01/04 | | 09/30/05 | | | 11.57 | | 0.18 | | | 1.96 | (d) | | 2.14 | | | (0.17 | ) | | — | | | (0.17 | ) | | 13.54 | | 2.10 | | | 2.26 | | | 1.37 | | | 73 | | 18.60 | | | 31 |
| Class I* | | | | | | | | | | | | | | | | | | | | | | | | | | | | | | | | | | | | | | | | | |
| 11/01/09 | | 04/30/10 | | | 11.56 | | 0.13 | | | 1.13 | | | 1.26 | | | (0.12 | ) | | — | | | (0.12 | ) | | 12.70 | | 0.95 | (b) | | 0.97 | (b) | | 2.14 | (b) | | 24 | | 10.92 | (c) | | 6 |
| 03/18/09 | | 10/31/09 | | | 8.43 | | 0.20 | | | 3.20 | | | 3.40 | | | (0.27 | ) | | — | | | (0.27 | ) | | 11.56 | | 0.95 | (b) | | 1.12 | (b) | | 3.08 | (b) | | 57 | | 40.72 | (c) | | 2 |
| Class R-3* | | | | | | | | | | | | | | | | | | | | | | | | | | | | | | | | | | | | |
| 11/01/09 | | 04/30/10 | | | 11.55 | | 0.10 | | | 1.14 | | | 1.24 | | | (0.09 | ) | | — | | | (0.09 | ) | | 12.70 | | 1.51 | (b) | | 1.51 | (b) | | 1.61 | (b) | | 24 | | 10.73 | (c) | | 0 |
| 09/30/09 | | 10/31/09 | | | 11.84 | | 0.01 | | | (0.22 | ) | | (0.21 | ) | | (0.08 | ) | | — | | | (0.08 | ) | | 11.55 | | 1.65 | (b) | | 1.56 | (b) | | 0.94 | (b) | | 57 | | (1.83 | )(c) | | 0 |
| Class R-5* | | | | | | | | | | | | | | | | | | | | | | | | | | | | | | | | | | | | |
| 12/28/09 | | 04/30/10 | | | 12.11 | | 0.09 | | | 0.57 | | | 0.66 | | | (0.06 | ) | | — | | | (0.06 | ) | | 12.71 | | 0.95 | (b) | | 1.95 | (b) | | 2.19 | (b) | | 24 | | 5.45 | (c) | | 0 |
| | |
| 42 | | The accompanying notes are an integral part of the financial statements. |
Financial Highlights
| | | | | | | | | | | | | | | | | | | | | | | | | | | | | | | | | | | | | | | | | |
Fiscal periods† | | | | | From investment operations | | | Dividends & distributions | | | | | Ratios to average daily net assets (%) | | | | | | | | |
| | Beginning
net asset
value | | Income
(loss) | | | Realized &
unrealized
gain (loss) | | | Total | | | From
investment
income | | | From
realized
gains | | | Total | | | Ending
net
asset
value | | With
expenses
waived/
recovered | | | Without
expenses
waived/
recovered | | | Net
income
(loss) | | | Portfolio
turnover
rate (%) | | Total
return
(%) (a) | | | Ending
net
assets
(millions) |
| Beginning | | Ending | | | | | | | | | | | | | | | |
| Eagle International Equity Fund | | | | | | | | | | | | | | | | | | | | | | | | | | | | | | | | | | | | |
| Class A* | | | | | | | | | | | | | | | | | | | | | | | | | | | | | | | | | | | | |
| 11/01/09 | | 04/30/10 | | | $19.52 | | $0.03 | | | $0.90 | | | $0.93 | | | $— | | | $— | | | $— | | | $20.45 | | 1.73 | (b) | | 1.93 | (b) | | 0.32 | (b) | | 57 | | 4.76 | (c) | | $44 |
| 11/01/08 | | 10/31/09 | | | 17.80 | | 0.20 | | | 2.23 | | | 2.43 | | | (0.71 | )(f) | | — | | | (0.71 | ) | | 19.52 | | 1.70 | | | 1.85 | | | 1.18 | | | 179 | | 14.34 | | | 52 |
| 11/01/07 | | 10/31/08 | | | 36.52 | | 0.32 | | | (16.15 | ) | | (15.83 | ) | | — | | | (2.89 | ) | | (2.89 | ) | | 17.80 | | 1.41 | | | 1.41 | | | 1.11 | | | 115 | | (46.77 | ) | | 73 |
| 11/01/06 | | 10/31/07 | | | 29.97 | | 0.27 | | | 8.87 | (d) | | 9.14 | | | (0.47 | ) | | (2.12 | ) | | (2.59 | ) | | 36.52 | | 1.47 | | | 1.41 | | | 0.83 | | | 56 | | 32.58 | | | 166 |
| 11/01/05 | | 10/31/06 | | | 25.20 | | 0.24 | | | 6.73 | (d) | | 6.97 | | | (0.16 | ) | | (2.04 | ) | | (2.20 | ) | | 29.97 | | 1.71 | | | 1.53 | | | 0.86 | | | 58 | | 29.31 | | | 91 |
| 11/01/04 | | 10/31/05 | | | 20.95 | | 0.09 | | | 4.49 | (d) | | 4.58 | | | (0.33 | ) | | — | | | (0.33 | ) | | 25.20 | | 1.78 | | | 2.00 | | | 0.38 | | | 78 | | 21.98 | | | 50 |
| Class C* | | | | | | | | | | | | | | | | | | | | | | | | | | | | | | | | | | | | |
| 11/01/09 | | 04/30/10 | | | 17.68 | | (0.04 | ) | | 0.81 | | | 0.77 | | | — | | | — | | | — | | | 18.45 | | 2.49 | (b) | | 2.68 | (b) | | (0.43 | )(b) | | 57 | | 4.36 | (c) | | 56 |
| 11/01/08 | | 10/31/09 | | | 16.15 | | 0.06 | | | 2.01 | | | 2.07 | | | (0.54 | )(f) | | — | | | (0.54 | ) | | 17.68 | | 2.48 | | | 2.62 | | | 0.39 | | | 179 | | 13.34 | | | 65 |
| 11/01/07 | | 10/31/08 | | | 33.66 | | 0.09 | | | (14.71 | ) | | (14.62 | ) | | — | | | (2.89 | ) | | (2.89 | ) | | 16.15 | | 2.17 | | | 2.17 | | | 0.33 | | | 115 | | (47.19 | ) | | 91 |
| 11/01/06 | | 10/31/07 | | | 27.85 | | 0.01 | | | 8.23 | (d) | | 8.24 | | | (0.31 | ) | | (2.12 | ) | | (2.43 | ) | | 33.66 | | 2.23 | | | 2.17 | | | 0.05 | | | 56 | | 31.60 | | | 189 |
| 11/01/05 | | 10/31/06 | | | 23.58 | | 0.02 | | | 6.30 | (d) | | 6.32 | | | (0.01 | ) | | (2.04 | ) | | (2.05 | ) | | 27.85 | | 2.46 | | | 2.28 | | | 0.07 | | | 58 | | 28.38 | | | 118 |
| 11/01/04 | | 10/31/05 | | | 19.66 | | (0.08 | ) | | 4.20 | (d) | | 4.12 | | | (0.20 | ) | | — | | | (0.20 | ) | | 23.58 | | 2.53 | | | 2.75 | | | (0.35 | ) | | 78 | | 21.06 | | | 73 |
| Class I* | | | | | | | | | | | | | | | | | | | | | | | | | | | | | | | | | | | | |
| 11/01/09 | | 04/30/10 | | | 19.57 | | 0.10 | | | 0.89 | | | 0.99 | | | — | | | — | | | — | | | 20.56 | | 1.15 | (b) | | 1.54 | (b) | | 0.93 | (b) | | 57 | | 5.06 | (c) | | 0 |
| 03/13/09(g) | | 10/31/09 | | | 13.59 | | 0.08 | | | 5.90 | | | 5.98 | | | — | | | — | | | — | | | 19.57 | | 1.15 | (b) | | 1.50 | (b) | | 0.76 | (b) | | 179 | | 44.00 | (c) | | 0 |
| 02/09/09 | | 02/24/09 | (g) | | 15.60 | | 0.02 | | | (1.86 | ) | | (1.84 | ) | | — | | | — | | | — | | | 13.76 | | 1.15 | (b) | | 1.40 | (b) | | 2.92 | (b) | | 179 | | (11.79 | )(c) | | 0 |
| Class R-3* | | | | | | | | | | | | | | | | | | | | | | | | | | | | | | | | | | | | |
| 12/28/09 | | 04/30/10 | | | 20.80 | | 0.03 | | | (0.39 | ) | | (0.36 | ) | | — | | | — | | | — | | | 20.44 | | 1.75 | (b) | | 3.78 | (b) | | 0.49 | (b) | | 57 | | (1.73 | )(c) | | 0 |
| Class R-5* | | | | | | | | | | | | | | | | | | | | | | | | | | | | | | | | | | | | |
| 12/28/09 | | 04/30/10 | | | 20.88 | | 0.08 | | | (0.39 | ) | | (0.31 | ) | | — | | | — | | | — | | | 20.57 | | 1.15 | (b) | | 2.62 | (b) | | 1.10 | (b) | | 57 | | (1.48 | )(c) | | 0 |
| | | | | | | | | | | | | |
| Eagle Investment Grade Bond Fund | | | | | | | | | | | | | | | | | | | | | | | | | | | | | | | | | | | | |
| Class A* | | | | | | | | | | | | | | | | | | | | | | | | | | | | | | | | | | | | |
| 03/01/10 | | 04/30/10 | | | 14.44 | | 0.05 | | | 0.05 | | | 0.10 | | | (0.01 | ) | | — | | | (0.01 | ) | | 14.53 | | 0.85 | (b) | | 2.94 | (b) | | 1.67 | (b) | | 17 | | 0.70 | (c) | | 22 |
| Class C* | | | | | | | | | | | | | | | | | | | | | | | | | | | | | | | | | | | | |
| 03/01/10 | | 04/30/10 | | | 14.44 | | 0.02 | | | 0.07 | | | 0.09 | | | (0.01 | ) | | — | | | (0.01 | ) | | 14.52 | | 1.65 | (b) | | 3.60 | (b) | | 0.91 | (b) | | 17 | | 0.59 | (c) | | 16 |
| Class I* | | | | | | | | | | | | | | | | | | | | | | | | | | | | | | | | | | | | |
| 03/01/10 | | 04/30/10 | | | 14.44 | | 0.05 | | | 0.05 | | | 0.10 | | | (0.01 | ) | | — | | | (0.01 | ) | | 14.53 | | 0.60 | (b) | | 2.61 | (b) | | 2.00 | (b) | | 17 | | 0.72 | (c) | | 0 |
| Class R-3* | | | | | | | | | | | | | | | | | | | | | | | | | | | | | | | | | | | | |
| 03/01/10 | | 04/30/10 | | | 14.44 | | 0.03 | | | 0.07 | | | 0.10 | | | (0.01 | ) | | — | | | (0.01 | ) | | 14.53 | | 1.09 | (b) | | 4.38 | (b) | | 1.29 | (b) | | 17 | | 0.68 | (c) | | 0 |
| Class R-5* | | | | | | | | | | | | | | | | | | | | | | | | | | | | | | | | | | | | |
| 03/01/10 | | 04/30/10 | | | 14.44 | | 0.04 | | | 0.07 | | | 0.11 | | | (0.01 | ) | | — | | | (0.01 | ) | | 14.54 | | 0.60 | (b) | | 3.94 | (b) | | 1.78 | (b) | | 17 | | 0.79 | (c) | | 0 |
| | | | | | | | | | | | | |
| Eagle Large Cap Core Fund | | | | | | | | | | | | | | | | | | | | | | | | | | | | | | | | | | | | |
| Class A* | | | | | | | | | | | | | | | | | | | | | | | | | | | | | | | | | | | | |
| 11/01/09 | | 04/30/10 | | | 12.01 | | 0.01 | | | 1.68 | | | 1.69 | | | (0.06 | ) | | — | | | (0.06 | ) | | 13.64 | | 1.37 | (b) | | 1.41 | (b) | | 0.10 | (b) | | 15 | | 14.08 | (c) | | 12 |
| 11/01/08 | | 10/31/09 | | | 10.70 | | 0.07 | | | 1.36 | | | 1.43 | | | (0.12 | ) | | — | | | (0.12 | ) | | 12.01 | | 1.38 | | | 1.47 | | | 0.68 | | | 40 | | 13.68 | | | 11 |
| 11/01/07 | | 10/31/08 | | | 17.95 | | 0.17 | | | (6.52 | ) | | (6.35 | ) | | (0.13 | ) | | (0.77 | ) | | (0.90 | ) | | 10.70 | | 1.26 | | | 1.26 | | | 1.14 | | | 43 | | (37.08 | ) | | 12 |
| 11/01/06 | | 10/31/07 | | | 16.54 | | 0.13 | | | 1.48 | (d) | | 1.61 | | | (0.08 | ) | | (0.12 | ) | | (0.20 | ) | | 17.95 | | 1.36 | | | 1.28 | | | 0.73 | | | 45 | | 9.85 | | | 27 |
| 11/01/05 | | 10/31/06 | | | 14.29 | | 0.09 | | | 2.16 | (d) | | 2.25 | | | — | | | — | | | — | | | 16.54 | | 1.53 | | | 1.52 | | | 0.57 | | | 43 | | 15.75 | | | 23 |
| 05/02/05 | | 10/31/05 | | | 14.29 | | (0.01 | ) | | 0.01 | (d) | | — | | | — | | | — | | | — | | | 14.29 | | 1.65 | (b) | | 3.25 | (b) | | (0.09 | )(b) | | 66 | | — | (c) | | 19 |
| Class C* | | | | | | | | | | | | | | | | | | | | | | | | | | | | | | | | | | | | |
| 11/01/09 | | 04/30/10 | | | 11.86 | | (0.04 | ) | | 1.65 | | | 1.61 | | | — | | | — | | | — | | | 13.47 | | 2.17 | (b) | | 2.24 | (b) | | (0.70 | )(b) | | 15 | | 13.58 | (c) | | 10 |
| 11/01/08 | | 10/31/09 | | | 10.53 | | (0.01 | ) | | 1.35 | | | 1.34 | | | (0.01 | ) | | — | | | (0.01 | ) | | 11.86 | | 2.18 | | | 2.32 | | | (0.15 | ) | | 40 | | 12.78 | | | 9 |
| 11/01/07 | | 10/31/08 | | | 17.68 | | 0.04 | | | (6.42 | ) | | (6.38 | ) | | — | | | (0.77 | ) | | (0.77 | ) | | 10.53 | | 2.10 | | | 2.10 | | | 0.28 | | | 43 | | (37.58 | ) | | 9 |
| 11/01/06 | | 10/31/07 | | | 16.35 | | (0.02 | ) | | 1.47 | (d) | | 1.45 | | | — | | | (0.12 | ) | | (0.12 | ) | | 17.68 | | 2.18 | | | 2.11 | | | (0.10 | ) | | 45 | | 8.95 | | | 17 |
| 11/01/05 | | 10/31/06 | | | 14.23 | | (0.03 | ) | | 2.15 | (d) | | 2.12 | | | — | | | — | | | — | | | 16.35 | | 2.28 | | | 2.27 | | | (0.19 | ) | | 43 | | 14.90 | | | 15 |
| 05/02/05 | | 10/31/05 | | | 14.29 | | (0.05 | ) | | (0.01 | )(d) | | (0.06 | ) | | — | | | — | | | — | | | 14.23 | | 2.40 | (b) | | 4.00 | (b) | | (0.85 | )(b) | | 66 | | (0.42 | )(c) | | 10 |
| Class I* | | | | | | | | | | | | | | | | | | | | | | | | | | | | | | | | | | | | |
| 11/01/09 | | 04/30/10 | | | 12.02 | | 0.03 | | | 1.67 | | | 1.70 | | | (0.10 | ) | | — | | | (0.10 | ) | | 13.62 | | 0.95 | (b) | | 1.23 | (b) | | 0.50 | (b) | | 15 | | 14.26 | (c) | | 122 |
| 11/01/08 | | 10/31/09 | | | 10.73 | | 0.12 | | | 1.35 | | | 1.47 | | | (0.18 | ) | | — | | | (0.18 | ) | | 12.02 | | 0.95 | | | 1.28 | | | 1.18 | | | 40 | | 14.20 | | | 104 |
| 11/01/07 | | 10/31/08 | | | 18.01 | | 0.20 | | | (6.51 | ) | | (6.31 | ) | | (0.20 | ) | | (0.77 | ) | | (0.97 | ) | | 10.73 | | 0.95 | | | 1.04 | | | 1.39 | | | 43 | | (36.86 | ) | | 130 |
| 11/01/06 | | 10/31/07 | | | 16.60 | | 0.19 | | | 1.48 | (d) | | 1.67 | | | (0.14 | ) | | (0.12 | ) | | (0.26 | ) | | 18.01 | | 0.95 | | | 1.06 | | | 1.12 | | | 45 | | 10.22 | | | 183 |
| 03/03/06 | | 10/31/06 | | | 15.17 | | 0.08 | | | 1.35 | (d) | | 1.43 | | | — | | | — | | | — | | | 16.60 | | 0.95 | (b) | | 1.23 | (b) | | 0.87 | (b) | | 43 | | 9.43 | (c) | | 128 |
| Class R-3* | | | | | | | | | | | | | | | | | | | | | | | | | | | | | | | | | | | | |
| 12/28/09 | | 04/30/10 | | | 12.77 | | (0.02 | ) | | 0.87 | | | 0.85 | | | — | | | — | | | — | | | 13.62 | | 1.65 | (b) | | 2.19 | (b) | | (0.46 | ) (b) | | 15 | | 6.66 | (c) | | 0 |
| | |
| The accompanying notes are an integral part of the financial statements. | | 43 |
Financial Highlights
| | | | | | | | | | | | | | | | | | | | | | | | | | | | | | | | | | | | | | | | |
Fiscal periods† | | | | From investment operations | | | Dividends & distributions | | | | | Ratios to average daily net assets (%) | | | | | | | | |
| | Beginning
net asset
value | | Income
(loss) | | | Realized &
unrealized
gain (loss) | | | Total | | | From
investment
income | | | From
realized
gains | | | Total | | | Ending
net
asset
value | | With
expenses
waived/
recovered | | | Without
expenses
waived/
recovered | | | Net
income
(loss) | | | Portfolio
turnover
rate (%) | | Total
return
(%) (a) | | | Ending
net
assets
(millions) |
| Beginning | | Ending | | | | | | | | | | | | | | |
| Eagle Large Cap Core Fund (cont’d) | | | | | | | | | | | | | | | | | | | | | | | | | | | | | | | | | | | | |
| Class R-5* | | | | | | | | | | | | | | | | | | | | | | | | | | | | | | | | | | | | |
| 11/01/09 | | 04/30/10 | | $12.28 | | $0.03 | | | $1.72 | | | $1.75 | | | $(0.11 | ) | | $— | | | $(0.11 | ) | | $13.92 | | 0.95 | (b) | | 1.32 | (b) | | 0.50 | (b) | | 15 | | 14.29 | (c) | | $0 |
| 11/01/08 | | 10/31/09 | | 10.76 | | 0.11 | | | 1.41 | | | 1.52 | | | — | | | — | | | — | | | 12.28 | | 0.95 | | | 1.22 | | | 0.97 | | | 40 | | 14.13 | | | 0 |
| 11/01/07 | | 10/31/08 | | 17.98 | | 0.27 | | | (6.51 | ) | | (6.24 | ) | | (0.21 | ) | | (0.77 | ) | | (0.98 | ) | | 10.76 | | 0.86 | | | 0.90 | | | 1.71 | | | 43 | | (36.52 | ) | | 0 |
| 04/02/07 | | 10/31/07 | | 16.51 | | — | | | 1.47 | (d) | | 1.47 | | | — | | | — | | | — | | | 17.98 | | 0.91 | (b) | | 0.91 | (b) | | 0.05 | (b) | | 45 | | 8.90 | (c) | | 1 |
| | | | | | | | | | | | | |
| Eagle Mid Cap Growth Fund | | | | | | | | | | | | | | | | | | | | | | | | | | | | | | | | | | | | |
| Class A* | | | | | | | | | | | | | | | | | | | | | | | | | | | | | | | | | | | | |
| 11/01/09 | | 04/30/10 | | 21.25 | | 0.01 | | | 5.54 | | | 5.55 | | | — | | | — | | | — | | | 26.80 | | 1.35 | (b) | | 1.35 | (b) | | 0.05 | (b) | | 41 | | 26.12 | (c) | | 125 |
| 11/01/08 | | 10/31/09 | | 18.63 | | (0.11 | ) | | 2.73 | | | 2.62 | | | — | | | — | | | — | | | 21.25 | | 1.44 | | | 1.44 | | | (0.59 | ) | | 127 | | 14.06 | | | 95 |
| 11/01/07 | | 10/31/08 | | 34.48 | | (0.20 | ) | | (10.29 | ) | | (10.49 | ) | | — | | | (5.36 | ) | | (5.36 | ) | | 18.63 | | 1.30 | | | 1.30 | | | (0.74 | ) | | 141 | | (35.68 | ) | | 86 |
| 11/01/06 | | 10/31/07 | | 28.11 | | (0.24 | ) | | 9.18 | (d) | | 8.94 | | | — | | | (2.57 | ) | | (2.57 | ) | | 34.48 | | 1.36 | | | 1.36 | | | (0.80 | ) | | 98 | | 34.28 | | | 130 |
| 11/01/05 | | 10/31/06 | | 26.72 | | (0.14 | ) | | 2.95 | (d) | | 2.81 | | | — | | | (1.42 | ) | | (1.42 | ) | | 28.11 | | 1.29 | | | 1.29 | | | (0.49 | ) | | 111 | | 10.70 | | | 135 |
| 11/01/04 | | 10/31/05 | | 25.26 | | (0.22 | ) | | 2.89 | (d) | | 2.67 | | | — | | | (1.21 | ) | | (1.21 | ) | | 26.72 | | 1.34 | | | 1.34 | | | (0.81 | ) | | 75 | | 10.66 | | | 127 |
| Class C* | | | | | | | | | | | | | | | | | | | | | | | | | | | | | | | | | | | | |
| 11/01/09 | | 04/30/10 | | 18.88 | | (0.08 | ) | | 4.92 | | | 4.84 | | | — | | | — | | | — | | | 23.72 | | 2.12 | (b) | | 2.12 | (b) | | (0.71 | )(b) | | 41 | | 25.64 | (c) | | 56 |
| 11/01/08 | | 10/31/09 | | 16.68 | | (0.23 | ) | | 2.43 | | | 2.20 | | | — | | | — | | | — | | | 18.88 | | 2.22 | | | 2.22 | | | (1.36 | ) | | 127 | | 13.19 | | | 45 |
| 11/01/07 | | 10/31/08 | | 31.65 | | (0.36 | ) | | (9.25 | ) | | (9.61 | ) | | — | | | (5.36 | ) | | (5.36 | ) | | 16.68 | | 2.05 | | | 2.05 | | | (1.48 | ) | | 141 | | (36.16 | ) | | 42 |
| 11/01/06 | | 10/31/07 | | 26.18 | | (0.42 | ) | | 8.46 | (d) | | 8.04 | | | — | | | (2.57 | ) | | (2.57 | ) | | 31.65 | | 2.11 | | | 2.11 | | | (1.54 | ) | | 98 | | 33.28 | | | 69 |
| 11/01/05 | | 10/31/06 | | 25.15 | | (0.32 | ) | | 2.77 | (d) | | 2.45 | | | — | | | (1.42 | ) | | (1.42 | ) | | 26.18 | | 2.04 | | | 2.04 | | | (1.23 | ) | | 111 | | 9.90 | | | 64 |
| 11/01/04 | | 10/31/05 | | 24.02 | | (0.39 | ) | | 2.73 | (d) | | 2.34 | | | — | | | (1.21 | ) | | (1.21 | ) | | 25.15 | | 2.09 | | | 2.09 | | | (1.55 | ) | | 75 | | 9.80 | | | 67 |
| Class I* | | | | | | | | | | | | | | | | | | | | | | | | | | | | | | | | | | | | |
| 11/01/09 | | 04/30/10 | | 21.58 | | 0.05 | | | 5.64 | | | 5.69 | | | — | | | — | | | — | | | 27.27 | | 0.95 | (b) | | 0.96 | (b) | | 0.40 | (b) | | 41 | | 26.37 | (c) | | 10 |
| 11/01/08 | | 10/31/09 | | 18.83 | | (0.02 | ) | | 2.77 | | | 2.75 | | | — | | | — | | | — | | | 21.58 | | 0.95 | | | 1.05 | | | (0.13 | ) | | 127 | | 14.60 | | | 6 |
| 11/01/07 | | 10/31/08 | | 34.69 | | (0.12 | ) | | (10.38 | ) | | (10.50 | ) | | — | | | (5.36 | ) | | (5.36 | ) | | 18.83 | | 0.95 | | | 1.04 | | | (0.54 | ) | | 141 | | (35.46 | ) | | 0 |
| 11/01/06 | | 10/31/07 | | 28.16 | | (0.11 | ) | | 9.21 | (d) | | 9.10 | | | — | | | (2.57 | ) | | (2.57 | ) | | 34.69 | | 0.95 | | | 1.08 | | | (0.37 | ) | | 98 | | 34.83 | | | 0 |
| 06/21/06 | | 10/31/06 | | 26.63 | | (0.04 | ) | | 1.57 | (d) | | 1.53 | | | — | | | — | | | — | | | 28.16 | | 0.95 | (b) | | 1.05 | (b) | | (0.42 | )(b) | | 111 | | 5.75 | (c) | | 0 |
| Class R-3* | | | | | | | | | | | | | | | | | | | | | | | | | | | | | | | | | | | | |
| 11/01/09 | | 04/30/10 | | 21.19 | | (0.02 | ) | | 5.52 | | | 5.50 | | | — | | | — | | | — | | | 26.69 | | 1.70 | (b) | | 1.72 | (b) | | (0.17 | )(b) | | 41 | | 25.90 | (c) | | 0 |
| 01/12/09 | | 10/31/09 | | 16.84 | | (0.15 | ) | | 4.50 | | | 4.35 | | | — | | | — | | | — | | | 21.19 | | 1.74 | (b) | | 1.74 | (b) | | (0.94 | )(b) | | 127 | | 25.83 | (c) | | 0 |
| Class R-5* | | | | | | | | | | | | | | | | | | | | | | | | | | | | | | | | | | | | |
| 12/28/09 | | 04/30/10 | | 24.70 | | (0.02 | ) | | 2.60 | | | 2.58 | | | — | | | — | | | — | | | 27.28 | | 0.95 | (b) | | 2.30 | (b) | | (0.29 | )(b) | | 41 | | 10.45 | (c) | | 0 |
| | | | | | | | | | | | | |
| Eagle Mid Cap Stock Fund | | | | | | | | | | | | | | | | | | | | | | | | | | | | | | | | | | | | |
| Class A* | | | | | | | | | | | | | | | | | | | | | | | | | | | | | | | | | | | | |
| 11/01/09 | | 04/30/10 | | 21.10 | | (0.02 | ) | | 3.30 | | | 3.28 | | | — | | | — | | | — | | | 24.38 | | 1.19 | (b) | | 1.19 | (b) | | (0.18 | )(b) | | 131 | | 15.55 | (c) | | 905 |
| 11/01/08 | | 10/31/09 | | 18.34 | | (0.03 | ) | | 2.79 | | | 2.76 | | | — | | | — | | | — | | | 21.10 | | 1.26 | | | 1.26 | | | (0.18 | ) | | 196 | | 15.05 | | | 812 |
| 11/01/07 | | 10/31/08 | | 32.59 | | (0.09 | ) | | (10.83 | ) | | (10.92 | ) | | — | | | (3.33 | ) | | (3.33 | ) | | 18.34 | | 1.15 | | | 1.15 | | | (0.34 | ) | | 176 | | (37.04 | ) | | 780 |
| 11/01/06 | | 10/31/07 | | 30.12 | | (0.06 | ) | | 5.61 | (d) | | 5.55 | | | — | | | (3.08 | ) | | (3.08 | ) | | 32.59 | | 1.13 | | | 1.13 | | | (0.18 | ) | | 185 | | 20.08 | | | 1,312 |
| 11/01/05 | | 10/31/06 | | 27.79 | | (0.10 | ) | | 4.39 | (d) | | 4.29 | | | — | | | (1.96 | ) | | (1.96 | ) | | 30.12 | | 1.13 | | | 1.13 | | | (0.35 | ) | | 180 | | 16.18 | | | 904 |
| 11/01/04 | | 10/31/05 | | 24.57 | | (0.13 | ) | | 3.35 | (d) | | 3.22 | | | — | | | — | | | — | | | 27.79 | | 1.15 | | | 1.15 | | | (0.48 | ) | | 146 | | 13.11 | | | 633 |
| Class C* | | | | | | | | | | | | | | | | | | | | | | | | | | | | | | | | | | | | |
| 11/01/09 | | 04/30/10 | | 18.67 | | (0.09 | ) | | 2.91 | | | 2.82 | | | — | | | — | | | — | | | 21.49 | | 1.93 | (b) | | 1.93 | (b) | | (0.92 | )(b) | | 131 | | 15.10 | (c) | | 253 |
| 11/01/08 | | 10/31/09 | | 16.34 | | (0.15 | ) | | 2.48 | | | 2.33 | | | — | | | — | | | — | | | 18.67 | | 2.00 | | | 2.00 | | | (0.93 | ) | | 196 | | 14.26 | | | 232 |
| 11/01/07 | | 10/31/08 | | 29.62 | | (0.25 | ) | | (9.70 | ) | | (9.95 | ) | | — | | | (3.33 | ) | | (3.33 | ) | | 16.34 | | 1.88 | | | 1.88 | | | (1.07 | ) | | 176 | | (37.53 | ) | | 229 |
| 11/01/06 | | 10/31/07 | | 27.83 | | (0.26 | ) | | 5.13 | (d) | | 4.87 | | | — | | | (3.08 | ) | | (3.08 | ) | | 29.62 | | 1.88 | | | 1.88 | | | (0.94 | ) | | 185 | | 19.21 | | | 410 |
| 11/01/05 | | 10/31/06 | | 26.00 | | (0.29 | ) | | 4.08 | (d) | | 3.79 | | | — | | | (1.96 | ) | | (1.96 | ) | | 27.83 | | 1.88 | | | 1.88 | | | (1.10 | ) | | 180 | | 15.31 | | | 345 |
| 11/01/04 | | 10/31/05 | | 23.16 | | (0.31 | ) | | 3.15 | (d) | | 2.84 | | | — | | | — | | | — | | | 26.00 | | 1.90 | | | 1.90 | | | (1.23 | ) | | 146 | | 12.26 | | | 284 |
| Class I* | | | | | | | | | | | | | | | | | | | | | | | | | | | | | | | | | | | | |
| 11/01/09 | | 04/30/10 | | 21.36 | | 0.02 | | | 3.35 | | | 3.37 | | | — | | | — | | | — | | | 24.73 | | 0.79 | (b) | | 0.79 | (b) | | 0.20 | (b) | | 131 | | 15.78 | (c) | | 349 |
| 11/01/08 | | 10/31/09 | | 18.49 | | 0.03 | | | 2.84 | | | 2.87 | | | — | | | — | | | — | | | 21.36 | | 0.87 | | | 0.87 | | | 0.16 | | | 196 | | 15.52 | | | 254 |
| 11/01/07 | | 10/31/08 | | 32.74 | | — | | | (10.92 | ) | | (10.92 | ) | | — | | | (3.33 | ) | | (3.33 | ) | | 18.49 | | 0.81 | | | 0.81 | | | (0.02 | ) | | 176 | | (36.85 | ) | | 79 |
| 11/01/06 | | 10/31/07 | | 30.15 | | 0.05 | | | 5.62 | (d) | | 5.67 | | | — | | | (3.08 | ) | | (3.08 | ) | | 32.74 | | 0.81 | | | 0.81 | | | 0.17 | | | 185 | | 20.50 | | | 94 |
| 06/06/06 | | 10/31/06 | | 28.21 | | (0.01 | ) | | 1.95 | (d) | | 1.94 | | | — | | | — | | | — | | | 30.15 | | 0.84 | (b) | | 0.84 | (b) | | (0.15 | )(b) | | 180 | | 6.88 | (c) | | 17 |
| Class R-3* | | | | | | | | | | | | | | | | | | | | | | | | | | | | | | | | | | | | |
| 11/01/09 | | 04/30/10 | | 20.98 | | (0.05 | ) | | 3.29 | | | 3.24 | | | — | | | — | | | — | | | 24.22 | | 1.38 | (b) | | 1.38 | (b) | | (0.41 | )(b) | | 131 | | 15.44 | (c) | | 4 |
| 11/01/08 | | 10/31/09 | | 18.26 | | (0.06 | ) | | 2.78 | | | 2.72 | | | — | | | — | | | — | | | 20.98 | | 1.40 | | | 1.40 | | | (0.35 | ) | | 196 | | 14.90 | | | 3 |
| 11/01/07 | | 10/31/08 | | 32.52 | | (0.13 | ) | | (10.80 | ) | | (10.93 | ) | | — | | | (3.33 | ) | | (3.33 | ) | | 18.26 | | 1.33 | | | 1.33 | | | (0.53 | ) | | 176 | | (37.16 | ) | | 1 |
| 11/01/06 | | 10/31/07 | | 30.10 | | (0.10 | ) | | 5.60 | (d) | | 5.50 | | | — | | | (3.08 | ) | | (3.08 | ) | | 32.52 | | 1.29 | | | 1.29 | | | (0.33 | ) | | 185 | | 19.91 | | | 1 |
| 08/10/06 | | 10/31/06 | | 27.82 | | (0.04 | ) | | 2.32 | (d) | | 2.28 | | | — | | | — | | | — | | | 30.10 | | 1.27 | (b) | | 1.27 | (b) | | (0.60 | )(b) | | 180 | | 8.20 | (c) | | 0 |
| | |
| 44 | | The accompanying notes are an integral part of the financial statements. |
Financial Highlights
| | | | | | | | | | | | | | | | | | | | | | | | | | | | | | | | | | | | | | | | |
Fiscal periods† | | | | From investment operations | | | Dividends & distributions | | | | | Ratios to average daily net assets (%) | | | | | | | | |
| | Beginning
net asset
value | | Income
(loss) | | | Realized &
unrealized
gain (loss) | | | Total | | | From
investment
income | | | From
realized
gains | | | Total | | | Ending
net
asset
value | | With
expenses
waived/
recovered | | | Without
expenses
waived/
recovered | | | Net
income
(loss) | | | Portfolio
turnover
rate (%) | | Total
return
(%) (a) | | | Ending
net
assets
(millions) |
| Beginning | | Ending | | | | | | | | | | | | | | |
| Eagle Mid Cap Stock Fund (cont’d) | | | | | | | | | | | | | | | | | | | | | | | | | | | | | | | | | | | | |
| Class R-5* | | | | | | | | | | | | | | | | | | | | | | | | | | | | | | | | | | | | |
| 11/01/09 | | 04/30/10 | | $21.39 | | $0.03 | | | $3.35 | | | $3.38 | | | $— | | | $— | | | $— | | | $24.77 | | 0.78 | (b) | | 0.78 | (b) | | 0.22 | (b) | | 131 | | 15.80 | (c) | | $69 |
| 11/01/08 | | 10/31/09 | | 18.50 | | 0.05 | | | 2.84 | | | 2.89 | | | — | | | — | | | — | | | 21.39 | | 0.79 | | | 0.79 | | | 0.28 | | | 196 | | 15.62 | | | 60 |
| 11/01/07 | | 10/31/08 | | 32.73 | | 0.02 | | | (10.92 | ) | | (10.90 | ) | | — | | | (3.33 | ) | | (3.33 | ) | | 18.50 | | 0.74 | | | 0.74 | | | 0.06 | | | 176 | | (36.80 | ) | | 24 |
| 11/01/06 | | 10/31/07 | | 30.13 | | 0.07 | | | 5.61 | (d) | | 5.68 | | | — | | | (3.08 | ) | | (3.08 | ) | | 32.73 | | 0.75 | | | 0.75 | | | 0.23 | | | 185 | | 20.55 | | | 34 |
| 10/02/06 | | 10/31/06 | | 28.96 | | — | | | 1.17 | (d) | | 1.17 | | | — | | | — | | | — | | | 30.13 | | 0.67 | (b) | | 0.67 | (b) | | (0.15 | )(b) | | 180 | | 4.04 | (c) | | 12 |
| | | | | | | | | | | | | |
| Eagle Small Cap Core Value Fund | | | | | | | | | | | | | | | | | | | | | | | | | | | | | | | | | | | | |
| Class A* | | | | | | | | | | | | | | | | | | | | | | | | | | | | | | | | | | | | |
| 11/01/09 | | 04/30/10 | | 16.54 | | (0.03 | ) | | 3.80 | | | 3.77 | | | — | | | (0.57 | ) | | (0.57 | ) | | 19.74 | | 1.50 | (b) | | 1.66 | (b) | | (0.36 | )(b) | | 11 | | 23.32 | (c) | | 9 |
| 11/03/08 | | 10/31/09 | | 14.29 | | (0.07 | ) | | 2.32 | | | 2.25 | | | — | | | — | | | — | | | 16.54 | | 1.48 | (b) | | 4.53 | (b) | | (0.45 | )(b) | | 23 | | 15.75 | (c) | | 6 |
| Class C* | | | | | | | | | | | | | | | | | | | | | | | | | | | | | | | | | | | | |
| 11/01/09 | | 04/30/10 | | 16.41 | | (0.10 | ) | | 3.77 | | | 3.67 | | | — | | | (0.57 | ) | | (0.57 | ) | | 19.51 | | 2.30 | (b) | | 2.49 | (b) | | (1.16 | )(b) | | 11 | | 22.88 | (c) | | 5 |
| 11/03/08 | | 10/31/09 | | 14.29 | | (0.19 | ) | | 2.31 | | | 2.12 | | | — | | | — | | | — | | | 16.41 | | 2.28 | (b) | | 5.37 | (b) | | (1.27 | )(b) | | 23 | | 14.84 | (c) | | 3 |
| Class I* | | | | | | | | | | | | | | | | | | | | | | | | | | | | | | | | | | | | |
| 11/01/09 | | 04/30/10 | | 16.59 | | 0.02 | | | 3.82 | | | 3.84 | | | (0.01 | ) | | (0.57 | ) | | (0.58 | ) | | 19.85 | | 0.95 | (b) | | 1.51 | (b) | | 0.19 | (b) | | 11 | | 23.71 | (c) | | 59 |
| 03/09/09 | | 10/31/09 | | 9.65 | | (0.01 | ) | | 6.95 | | | 6.94 | | | — | | | — | | | — | | | 16.59 | | 0.95 | (b) | | 1.80 | (b) | | (0.04 | )(b) | | 23 | | 71.92 | (c) | | 49 |
| Class R-3* | | | | | | | | | | | | | | | | | | | | | | | | | | | | | | | | | | | | |
| 12/28/09 | | 04/30/10 | | 17.86 | | (0.04 | ) | | 1.91 | | | 1.87 | | | — | | | — | | | — | | | 19.73 | | 1.69 | (b) | | 2.83 | (b) | | (0.59 | )(b) | | 11 | | 10.47 | (c) | | 0 |
| Class R-5* | | | | | | | | | | | | | | | | | | | | | | | | | | | | | | | | | | | | |
| 12/28/09 | | 04/30/10 | | 17.92 | | 0.01 | | | 1.92 | | | 1.93 | | | — | | | — | | | — | | | 19.85 | | 0.95 | (b) | | 2.10 | (b) | | 0.15 | (b) | | 11 | | 10.77 | (c) | | 0 |
| | | | | | | | | | | | | |
| Eagle Small Cap Growth Fund | | | | | | | | | | | | | | | | | | | | | | | | | | | | | | | | | | | | |
| Class A* | | | | | | | | | | | | | | | | | | | | | | | | | | | | | | | | | | | | |
| 11/01/09 | | 04/30/10 | | 25.10 | | (0.01 | ) | | 6.74 | | | 6.73 | | | — | | | — | | | — | | | 31.83 | | 1.30 | (b) | | 1.30 | (b) | | (0.07 | )(b) | | 21 | | 26.81 | (c) | | 263 |
| 11/01/08 | | 10/31/09 | | 22.52 | | (0.18 | ) | | 2.76 | | | 2.58 | | | — | | | — | | | — | | | 25.10 | | 1.37 | | | 1.37 | | | (0.83 | ) | | 110 | | 11.46 | | | 200 |
| 11/01/07 | | 10/31/08 | | 41.33 | | (0.16 | ) | | (12.81 | ) | | (12.97 | ) | | — | | | (5.84 | ) | | (5.84 | ) | | 22.52 | | 1.27 | | | 1.27 | | | (0.50 | ) | | 51 | | (35.81 | ) | | 189 |
| 11/01/06 | | 10/31/07 | | 37.87 | | (0.15 | ) | | 6.46 | (d) | | 6.31 | | | — | | | (2.85 | ) | | (2.85 | ) | | 41.33 | | 1.25 | | | 1.25 | | | (0.38 | ) | | 64 | | 17.65 | | | 327 |
| 11/01/05 | | 10/31/06 | | 32.93 | | (0.15 | ) | | 6.23 | (d) | | 6.08 | | | — | | | (1.14 | ) | | (1.14 | ) | | 37.87 | | 1.24 | | | 1.24 | | | (0.43 | ) | | 49 | | 18.89 | | | 269 |
| 11/01/04 | | 10/31/05 | | 32.19 | | (0.13 | ) | | 2.43 | (d) | | 2.30 | | | — | | | (1.56 | ) | | (1.56 | ) | | 32.93 | | 1.30 | | | 1.25 | | | (0.39 | ) | | 50 | | 7.08 | | | 225 |
| Class C* | | | | | | | | | | | | | | | | | | | | | | | | | | | | | | | | | | | | |
| 11/01/09 | | 04/30/10 | | 21.44 | | (0.10 | ) | | 5.74 | | | 5.64 | | | — | | | — | | | — | | | 27.08 | | 2.07 | (b) | | 2.07 | (b) | | (0.79 | )(b) | | 21 | | 26.31 | (c) | | 72 |
| 11/01/08 | | 10/31/09 | | 19.40 | | (0.30 | ) | | 2.34 | | | 2.04 | | | — | | | — | | | — | | | 21.44 | | 2.17 | | | 2.17 | | | (1.63 | ) | | 110 | | 10.52 | | | 60 |
| 11/01/07 | | 10/31/08 | | 36.69 | | (0.34 | ) | | (11.11 | ) | | (11.45 | ) | | — | | | (5.84 | ) | | (5.84 | ) | | 19.40 | | 2.02 | | | 2.02 | | | (1.25 | ) | | 51 | | (36.26 | ) | | 59 |
| 11/01/06 | | 10/31/07 | | 34.17 | | (0.39 | ) | | 5.76 | (d) | | 5.37 | | | — | | | (2.85 | ) | | (2.85 | ) | | 36.69 | | 2.00 | | | 2.00 | | | (1.12 | ) | | 64 | | 16.75 | | | 110 |
| 11/01/05 | | 10/31/06 | | 30.03 | | (0.38 | ) | | 5.66 | (d) | | 5.28 | | | — | | | (1.14 | ) | | (1.14 | ) | | 34.17 | | 1.99 | | | 1.99 | | | (1.18 | ) | | 49 | | 18.02 | | | 100 |
| 11/01/04 | | 10/31/05 | | 29.70 | | (0.34 | ) | | 2.23 | (d) | | 1.89 | | | — | | | (1.56 | ) | | (1.56 | ) | | 30.03 | | 2.05 | | | 2.00 | | | (1.13 | ) | | 50 | | 6.26 | | | 91 |
| Class I* | | | | | | | | | | | | | | | | | | | | | | | | | | | | | | | | | | | | |
| 11/01/09 | | 04/30/10 | | 25.44 | | 0.02 | | | 6.87 | | | 6.89 | | | — | | | — | | | — | | | 32.33 | | 0.83 | (b) | | 0.83 | (b) | | 0.10 | (b) | | 21 | | 27.08 | (c) | | 60 |
| 11/01/08 | | 10/31/09 | | 22.72 | | (0.08 | ) | | 2.80 | | | 2.72 | | | — | | | — | | | — | | | 25.44 | | 0.87 | | | 0.87 | | | (0.37 | ) | | 110 | | 11.97 | | | 20 |
| 11/01/07 | | 10/31/08 | | 41.51 | | (0.08 | ) | | (12.87 | ) | | (12.95 | ) | | — | | | (5.84 | ) | | (5.84 | ) | | 22.72 | | 0.93 | | | 0.93 | | | (0.27 | ) | | 51 | | (35.57 | ) | | 10 |
| 11/01/06 | | 10/31/07 | | 37.91 | | (0.06 | ) | | 6.51 | (d) | | 6.45 | | | — | | | (2.85 | ) | | (2.85 | ) | | 41.51 | | 0.95 | | | 0.96 | | | (0.15 | ) | | 64 | | 18.03 | | | 2 |
| 06/27/06 | | 10/31/06 | | 33.68 | | (0.02 | ) | | 4.25 | (d) | | 4.23 | | | — | | | — | | | — | | | 37.91 | | 0.95 | (b) | | 1.08 | (b) | | (0.14 | )(b) | | 49 | | 12.56 | (c) | | 0 |
| Class R-3* | | | | | | | | | | | | | | | | | | | | | | | | | | | | | | | | | | | | |
| 11/01/09 | | 04/30/10 | | 24.96 | | (0.01 | ) | | 6.65 | | | 6.64 | | | — | | | — | | | — | | | 31.60 | | 1.57 | (b) | | 1.57 | (b) | | (0.10 | )(b) | | 21 | | 26.60 | (c) | | 2 |
| 11/01/08 | | 10/31/09 | | 22.44 | | (0.18 | ) | | 2.70 | | | 2.52 | | | — | | | — | | | — | | | 24.96 | | 1.54 | | | 1.54 | | | (1.01 | ) | | 110 | | 11.23 | | | 2 |
| 11/01/07 | | 10/31/08 | | 41.25 | | (0.20 | ) | | (12.77 | ) | | (12.97 | ) | | — | | | (5.84 | ) | | (5.84 | ) | | 22.44 | | 1.42 | | | 1.42 | | | (0.67 | ) | | 51 | | (35.88 | ) | | 1 |
| 11/01/06 | | 10/31/07 | | 37.88 | | (0.28 | ) | | 6.50 | (d) | | 6.22 | | | — | | | (2.85 | ) | | (2.85 | ) | | 41.25 | | 1.37 | | | 1.37 | | | (0.65 | ) | | 64 | | 17.40 | | | 1 |
| 09/19/06 | | 10/31/06 | | 35.99 | | (0.03 | ) | | 1.92 | (d) | | 1.89 | | | — | | | — | | | — | | | 37.88 | | 1.60 | (b) | | 2.05 | (b) | | (1.04 | )(b) | | 49 | | 5.25 | (c) | | 0 |
| Class R-5* | | | | | | | | | | | | | | | | | | | | | | | | | | | | | | | | | | | | |
| 11/01/09 | | 04/30/10 | | 25.43 | | 0.05 | | | 6.83 | | | 6.88 | | | — | | | — | | | — | | | 32.31 | | 0.88 | (b) | | 0.88 | (b) | | 0.34 | (b) | | 21 | | 27.05 | (c) | | 41 |
| 11/01/08 | | 10/31/09 | | 22.72 | | (0.09 | ) | | 2.80 | | | 2.71 | | | — | | | — | | | — | | | 25.43 | | 0.90 | | | 0.90 | | | (0.40 | ) | | 110 | | 11.93 | | | 30 |
| 11/01/07 | | 10/31/08 | | 41.50 | | (0.05 | ) | | (12.89 | ) | | (12.94 | ) | | — | | | (5.84 | ) | | (5.84 | ) | | 22.72 | | 0.90 | | | 0.90 | | | (0.15 | ) | | 51 | | (35.55 | ) | | 11 |
| 11/01/06 | | 10/31/07 | | 37.88 | | — | | | 6.47 | (d) | | 6.47 | | | — | | | (2.85 | ) | | (2.85 | ) | | 41.50 | | 0.88 | | | 0.88 | | | (0.01 | ) | | 64 | | 18.10 | | | 15 |
| 10/02/06 | | 10/31/06 | | 35.86 | | — | | | 2.02 | (d) | | 2.02 | | | — | | | — | | | — | | | 37.88 | | 0.83 | (b) | | 0.83 | (b) | | (0.10 | )(b) | | 49 | | 5.63 | (c) | | 13 |
† The data for the fiscal periods ending after October 31, 2009 are unaudited.
* Per share amounts have been calculated using the monthly average share method.
(a) Total returns are calculated without the imposition of either front-end or contingent deferred sales charges. (b) Annualized. (c) Not annualized. (d) Includes redemption fee amounts that represent less than $0.01 per share. (e) Denotes a partial period when the Eagle Capital Appreciation Fund and Eagle Growth & Income Fund changed their fiscal and tax year ends to October 31. (f) Includes tax return of capital distribution of $0.02 per share. (g) There were no shares outstanding from February 25, 2009 through March 12, 2009.
| | |
| The accompanying notes are an integral part of the financial statements. | | 45 |
Notes to Financial Statements
NOTE 1 | Organization and investment objective The Eagle Capital Appreciation Fund, Eagle Growth & Income Fund and Eagle Series Trust (each a “Trust” and collectively the “Trusts”) are organized as separate Massachusetts business trusts and are registered under the Investment Company Act of 1940, as amended, as diversified, open-end management investment companies. Each Trust offers shares in the following series (each a “Fund” and collectively the “Funds”) and are advised by Eagle Asset Management, Inc. (“Eagle” or “Manager”).
The Eagle Family of Funds consist of the Trusts in addition to another investment company advised by the Manager, the Eagle Cash Trust. Members of the Boards of Trustees (“Boards”) for the Trusts may serve as Trustees for one or more of the Eagle Family of Funds.
| | • | | The Eagle Capital Appreciation Fund (“Capital Appreciation Fund”) seeks long-term capital appreciation. |
| | • | | The Eagle Growth & Income Fund (“Growth & Income Fund”) primarily seeks long-term capital appreciation and, secondarily, seeks current income. |
The Eagle Series Trust currently offers shares in seven series:
| | • | | The Eagle International Equity Fund (“International Equity Fund”) seeks capital appreciation principally through investment in a portfolio of international equity securities, |
| | • | | The Eagle Investment Grade Bond Fund (“Investment Grade Bond Fund”) seeks current income and preservation of capital, |
| | • | | The Eagle Large Cap Core Fund (“Large Cap Core Fund”) seeks long-term growth through capital appreciation, |
| | • | | The Eagle Mid Cap Growth Fund (“Mid Cap Growth Fund”) seeks long-term capital appreciation, |
| | • | | The Eagle Mid Cap Stock Fund (“Mid Cap Stock Fund”) seeks long-term capital appreciation, |
| | • | | The Eagle Small Cap Core Value Fund (“Small Cap Core Value Fund”) seeks capital growth, and |
| | • | | The Eagle Small Cap Growth Fund (“Small Cap Growth Fund”) seeks long-term capital appreciation. |
Class offerings Each Fund is authorized and currently offers Class A, Class C, Class I, Class R-3 and Class R-5 shares to qualified buyers.
| | • | | For all funds except the Investment Grade Bond Fund, Class A shares are sold at a maximum front-end sales |
| | | charge of 4.75%. For the Investment Grade Bond Fund, Class A shares are sold at a maximum front-end sales charge of 3.75%. Class A share investments greater than $1 million, which are not sold subject to a sales charge, may be subject to a contingent deferred sales charge (“CDSC”) of up to 1% of the lower of net asset value (“NAV”) or purchase price if redeemed within 18 months of purchase. |
| | • | | Class C shares are sold subject to a CDSC of 1% of the lower of NAV or purchase price if redeemed within one year of purchase. |
| | • | | Class I, Class R-3 and Class R-5 shares are each sold without a front-end sales charge or a CDSC to qualified buyers. |
NOTE 2 | Significant accounting policies
Use of estimates The preparation of financial statements in accordance with accounting principles generally accepted in the United States of America requires management to make estimates and assumptions that affect the reported amounts and disclosures. Actual results could differ from those estimates and those differences could be material.
Valuation of securities The price of each Fund’s shares is based on the NAV per share of each class of a Fund. The Funds determine the NAV of their shares on each day the New York Stock Exchange (“NYSE”) is open for business, as of the close of the regular trading session (typically 4:00 p.m. Eastern time), or earlier NYSE closing time that day. If the NYSE or other securities exchange modifies the closing price of securities traded on that exchange after the NAV is calculated, the Manager is not required to recalculate the NAV.
Generally, the Funds value portfolio securities for which market quotations are readily available at market value; however, a Fund may adjust the market quotation price to reflect events that occur between the close of those markets and the time of the Fund’s determination of the NAV.
A market quotation may be considered unreliable or unavailable for various reasons, such as:
| | • | | The quotation may be stale; |
| | • | | The quotation may be unreliable because the security is not traded frequently; |
| | • | | Trading on the security ceased before the close of the trading market; |
Notes to Financial Statements
| | • | | Security is newly issued; |
| | • | | Issuer specific events occurred after the security ceased trading; or |
| | • | | Because of the passage of time between the close of the market on which the security trades and the close of the NYSE. |
Issuer specific events may cause the last market quotation to be unreliable. Such events may include:
| | • | | A merger or insolvency; |
| | • | | Events which affect a geographical area or an industry segment, such as political events or natural disasters; or |
| | • | | Market events, such as a significant movement in the U.S. market. |
Both the latest transaction prices and adjustments are furnished by an independent pricing service subject to supervision by the Boards. The Funds value all other securities and assets for which market quotations are unavailable or unreliable at their fair value in good faith using procedures (“Procedures”) approved by the Boards. A Fund may fair value small-cap securities, for example, that are thinly traded or illiquid. Fair value is that amount that the owner might reasonably expect to receive for the security upon its current sale. Fair value requires consideration of all appropriate factors, including indications of fair value available from pricing services. A fair value price is an estimated price and may vary from the prices used by other mutual funds to calculate their NAV. Fair value pricing methods, Procedures and pricing services can change from time to time as approved by the Boards. Pursuant to the Procedures, the Boards have delegated the day-to-day responsibility for applying and administering the Procedures to a valuation committee comprised of certain officers of the Trusts and other employees of the Manager (“Valuation Committee”). The composition of this Valuation Committee may change from time to time.
There can be no assurance, however, that a fair value price used by a Fund on any given day will more accurately reflect the market value of a security or securities than the market price of such security or securities on that day. Fair value pricing may deter shareholders from trading the Fund shares on a frequent basis in an attempt to take advantage of arbitrage opportunities resulting from potentially stale prices of portfolio holdings. However, it cannot eliminate the possibility of frequent trading. Specific types of securities are valued as follows:
| | • | | Domestic exchange traded equity securities Market quotations are generally available and reliable for domestic exchange traded equity securities. If the prices provided by the pricing service and independent quoted prices are unreliable, the Valuation Committee will fair value the security using the Procedures. |
| | • | | Foreign equity securities If market quotations are available and reliable for foreign exchange traded equity securities, the securities will be valued at the market quotations. Because trading hours for certain foreign securities end before the close of the NYSE, closing market quotations may become unreliable. Consequently, fair valuation of portfolio securities may occur on a daily basis. The fund may fair value a security if certain events occur between the time trading ends on a particular security and the fund’s NAV calculation. The fund may also fair value a particular security if the events are significant and make the closing price unreliable. If an issuer specific event has occurred that Eagle determines, in its judgment, is likely to have affected the closing price of a foreign security, it will price the security at fair value. Eagle also utilizes a screening process from a pricing vendor to indicate the degree of certainty, based on historical data, that the closing price in the principal market where a foreign security trades is not the current market value as of the close of the NYSE. Securities and other assets quoted in foreign currencies are valued in U.S. dollars based on exchange rates provided by a pricing service. The pricing vendor, pricing methodology or degree of certainty may change from time to time. Fund securities primarily traded on foreign markets may trade on days that are not business days of the fund. Because the NAV of fund shares is determined only on business days of the fund, the value of the portfolio securities of a fund that invests in foreign securities may change on days when you will not be able to purchase or redeem shares of the fund. |
| | • | | Fixed income securities Government, corporate, asset-backed bonds, municipal bonds and convertible securities, including high yield or junk bonds, normally are valued on the basis of prices provided by independent pricing services. Prices provided by the pricing services may be determined without exclusive reliance on quoted prices, and may reflect appropriate factors such as institution-size trading in similar groups of securities, developments related to special securities, dividend rate, maturity and other market data. If the prices provided by the pricing service and independent quoted prices are unreliable, the Valuation Committee will fair value the security using the Procedures. |
Notes to Financial Statements
| | • | | Short-term securities The amortized cost method of security valuation is used by the Funds (as set forth in Rule 2a-7 under the Investment Company Act of 1940, as amended) for short-term investments (investments that have a maturity date of 60 days or less). The amortized cost of an instrument is determined by valuing it at cost as of the time of purchase and thereafter accreting/amortizing any purchase discount/premium at a constant rate until maturity. Amortized cost approximates fair value. |
| | • | | Futures and options Futures and options are valued on the basis of market quotations, if available. |
Each Fund utilizes a three level hierarchy of inputs to establish a classification of fair value measurements. The three levels are defined below:
Level 1—Valuations based on quoted prices for identical securities in active markets;
Level 2—Valuations based on inputs other than quoted prices that are observable, either directly or indirectly, including inputs in markets that are not considered active; and
Level 3—Valuations based on inputs that are unobservable and significant to the fair value measurement.
The following is a summary of the inputs used to value each Fund’s investments as of April 30, 2010.
| | | | | | |
| | | Quoted prices in
active markets
for identical
assets (Level 1) | | Significant
other
observable
inputs
(Level 2) | | Total |
| Capital Appreciation Fund | | | | | | |
| Domestic common stocks (a) | | $569,945,000 | | $— | | $569,945,000 |
| Short-term investments | | — | | 19,707,000 | | 19,707,000 |
| Total investment portfolio | | $569,945,000 | | $19,707,000 | | $589,652,000 |
| Growth & Income Fund | | | | | | |
| Domestic common stocks (a) | | $123,799,442 | | $— | | $123,799,442 |
| Foreign common stocks | | | | | | |
Beverages | | — | | 3,575,229 | | 3,575,229 |
Cosmetics/personal care | | 2,490,073 | | — | | 2,490,073 |
Electric | | — | | 3,768,080 | | 3,768,080 |
Entertainment | | — | | 1,589,921 | | 1,589,921 |
Financial services | | 1,415,355 | | 3,076,040 | | 4,491,395 |
Food | | — | | 5,787,255 | | 5,787,255 |
| | | | | | |
| | | Quoted prices in
active markets
for identical
assets (Level 1) | | Significant
other
observable
inputs
(Level 2) | | Total |
| Growth & Income Fund (cont’d) | | | | | | |
Insurance | | $4,113,981 | | $1,625,936 | | $5,739,917 |
Internet | | 2,481,480 | | — | | 2,481,480 |
Multimedia | | — | | 1,582,153 | | 1,582,153 |
Oil & gas | | 1,949,498 | | 3,759,407 | | 5,708,905 |
Pharmaceuticals | | 3,500,308 | | 3,770,096 | | 7,270,404 |
Telecommunications | | 6,563,602 | | 8,328,785 | | 14,892,387 |
| Domestic preferred stocks (a) | | 3,183,000 | | — | | 3,183,000 |
| Domestic corporate bonds (a) | | — | | 1,257,591 | | 1,257,591 |
| Foreign corporate bonds (a) | | — | | 1,438,540 | | 1,438,540 |
| Domestic convertible bonds (a) | | — | | 67,744 | | 67,744 |
| Short-term investments | | — | | 7,152,000 | | 7,152,000 |
| Total investment portfolio | | $149,496,739 | | $46,778,777 | | $196,275,516 |
| International Equity Fund | | | | | | |
| Foreign common stocks | | | | | | |
Advertising | | $130,530 | | $ — | | $130,530 |
Aerospace/defense | | — | | 160,446 | | 160,446 |
Agriculture | | 823,622 | | — | | 823,622 |
Apparel | | — | | 196,186 | | 196,186 |
Auto manufacturers | | 1,421,205 | | 2,524,273 | | 3,945,478 |
Auto parts & equipment | | — | | 257,290 | | 257,290 |
Banks | | 3,442,002 | | 16,224,046 | | 19,666,048 |
Beverages | | 1,251,708 | | 864,761 | | 2,116,469 |
Broadcasting services/programs | | 202,598 | | — | | 202,598 |
Building materials | | 547,779 | | 1,255,581 | | 1,803,360 |
Chemicals | | 656,660 | | 606,363 | | 1,263,023 |
Coal | | — | | 189,670 | | 189,670 |
Commercial services | | 5,090 | | 215,845 | | 220,935 |
Computers | | 206,466 | | 1,750,638 | | 1,957,104 |
Cosmetics/personal care | | — | | 171,133 | | 171,133 |
Distribution/wholesale | | — | | 969,396 | | 969,396 |
Diversified manufacturer | | — | | 230,548 | | 230,548 |
Electric | | 607,164 | | 636,124 | | 1,243,288 |
Electrical components & equipment | | — | | 390,876 | | 390,876 |
Electronics | | 590,419 | | 1,818,932 | | 2,409,351 |
Engineering & construction | | 186,712 | | 3,018,774 | | 3,205,486 |
Financial services | | 350,789 | | 1,699,163 | | 2,049,952 |
Food | | 890,788 | | 5,496,112 | | 6,386,900 |
Food service | | — | | 110,975 | | 110,975 |
Forest products & paper | | — | | 531,611 | | 531,611 |
Notes to Financial Statements
| | | | | | |
| | | Quoted prices in
active markets
for identical
assets (Level 1) | | Significant
other
observable
inputs
(Level 2) | | Total |
| International Equity Fund (cont’d) | | | | |
Hand/machine tools | | $— | | $410,228 | | $410,228 |
Healthcare products | | 355,802 | | 743,948 | | 1,099,750 |
Healthcare services | | 55,860 | | — | | 55,860 |
Home furnishings | | — | | 710,149 | | 710,149 |
Household products | | — | | 1,259,811 | | 1,259,811 |
Insurance | | 272,333 | | 1,926,590 | | 2,198,923 |
Internet | | — | | 261,010 | | 261,010 |
Iron/steel | | 438,277 | | 886,173 | | 1,324,450 |
Leisure time | | — | | 74,695 | | 74,695 |
Lodging | | — | | 107,585 | | 107,585 |
Machinery | | 171,157 | | 1,286,361 | | 1,457,518 |
Metal fabricate/hardware | | — | | 165,644 | | 165,644 |
Mining | | 3,569,766 | | 6,051,966 | | 9,621,732 |
Multimedia | | — | | 428,170 | | 428,170 |
Office/business equipment | | 102,582 | | 341,180 | | 443,762 |
Oil & gas | | 2,275,374 | | 4,363,825 | | 6,639,199 |
Oil & gas services | | — | | 302,454 | | 302,454 |
Pharmaceuticals | | 3,464,401 | | 3,420,492 | | 6,884,893 |
Retail | | 142,560 | | 1,449,832 | | 1,592,392 |
Semiconductor equipment | | — | | 203,242 | | 203,242 |
Semiconductors | | — | | 1,132,861 | | 1,132,861 |
Software | | 74,950 | | 252,007 | | 326,957 |
Telecommunications | | 1,525,444 | | 1,942,808 | | 3,468,252 |
Television, cable & radio | | 73,860 | | — | | 73,860 |
Toys/games/hobbies | | — | | 659,073 | | 659,073 |
Transportation | | 816,701 | | 794,361 | | 1,611,062 |
Water | | — | | 170,908 | | 170,908 |
| Foreign preferred stocks | | | | | | |
Auto manufacturers | | 122,145 | | 210,293 | | 332,438 |
Electric | | 78,147 | | — | | 78,147 |
Food | | 255,294 | | — | | 255,294 |
Household products | | — | | 224,481 | | 224,481 |
Oil & gas | | 371,579 | | — | | 371,579 |
| Investment companies | | | | | | |
Commodity fund | | 1,141,685 | | — | | 1,141,685 |
Equity fund | | 1,010,083 | | 577,931 | | 1,588,014 |
Mining | | 1,173,913 | | — | | 1,173,913 |
| Short-term investments | | — | | 619,000 | | 619,000 |
| Other financial instruments (b) | | 217,692 | | — | | 217,692 |
| Total investment portfolio | | $29,023,137 | | $70,295,821 | | $99,318,958 |
| | | | | | |
| | | Quoted prices in
active markets
for identical
assets (Level 1) | | Significant
other
observable
inputs
(Level 2) | | Total |
| Investment Grade Bond Fund | | | | | | |
| Domestic corporate bonds (a) | | $ — | | $11,372,249 | | $11,372,249 |
| U.S. Government agency securities (a) | | — | | 8,337,788 | | 8,337,788 |
| U.S. Treasuries (a) | | — | | 9,409,692 | | 9,409,692 |
| Mortgage-backed obligations (a) | | — | | 7,693,100 | | 7,693,100 |
| Short-term investments | | — | | 705,000 | | 705,000 |
| Total investment portfolio | | $ — | | $37,517,829 | | $37,517,829 |
| Large Cap Core Fund | | | | | | |
| Domestic common stocks (a) | | $125,817,156 | | $— | | $125,817,156 |
| Investment companies (a) | | 4,057,733 | | — | | 4,057,733 |
| Short-term investments | | — | | 14,096,000 | | 14,096,000 |
| Total investment portfolio | | $129,874,889 | | $14,096,000 | | $143,970,889 |
| Mid Cap Growth Fund | | | | | | |
| Domestic common stocks (a) | | $185,467,175 | | $— | | $185,467,175 |
| Short-term investments | | — | | 2,922,000 | | 2,922,000 |
| Total investment portfolio | | $185,467,175 | | $2,922,000 | | $188,389,175 |
| Mid Cap Stock Fund | | | | | | |
| Domestic common stocks (a) | | $1,396,727,238 | | $— | | $1,396,727,238 |
| Foreign common stocks (a) | | 173,248,677 | | — | | 173,248,677 |
| Total investment portfolio | | $1,569,975,915 | | $— | | $1,569,975,915 |
| Small Cap Core Value Fund | | | | | | |
| Domestic common stocks (a) | | $68,346,292 | | $— | | $68,346,292 |
| Investment companies (a) | | 1,355,851 | | — | | 1,355,851 |
| Short-term investments | | — | | 3,092,000 | | 3,092,000 |
| Total investment portfolio | | $69,702,143 | | $3,092,000 | | $72,794,143 |
| Small Cap Growth Fund | | | | | | |
| Domestic common stocks (a) | | $430,076,119 | | $— | | $430,076,119 |
| Short-term investments | | — | | 4,909,000 | | 4,909,000 |
| Total investment portfolio | | $430,076,119 | | $4,909,000 | | $434,985,119 |
| (a) Please see the investment portfolio for detail by industry. (b) Other financial instruments include foreign forward currency contracts which are valued at the unrealized appreciation/(depreciation) of the instrument. |
As of April 30, 2010, no Fund had any investments classified as Level 3.
Derivative instruments The Funds have adopted the provisions of FASB Accounting Standards CodificationTM ASC 815-10-50 (“Statement”). The new requirement amends and expands the disclosure requirement related to derivative instruments in order to provide users of financial statements with an enhanced understanding of the use of derivative instruments
Notes to Financial Statements
by a Fund and how these derivatives affect the financial position, financial performance and cash flows of the Fund. The Statement requires qualitative disclosures about the objectives and strategies for using derivative instruments, quantitative disclosures about the fair value of, and gains and losses on, derivative instruments, as well as disclosures about credit-risk-related contingent features in derivative agreements.
During the period ended April 30, 2010, the International Equity Fund engaged in limited derivative activity. The contract amounts in the Investment Portfolio are representative of typical volumes.
Fair values of derivative instruments for the International Equity Fund as of April 30, 2010 are as follows:
| | | | |
| Type of derivative | | Balance Sheet location | | Value |
| Assets | | | | |
| Forward foreign currency contracts | | Unrealized gain on forward foreign currency contracts | | $282,680 |
| Liabilities | | | | |
| Forward foreign currency contracts | | Unrealized loss on forward foreign currency contracts | | $64,988 |
The effect of derivative instruments on the International Equity Fund’s Statement of Operations for the period ended April 30, 2010 is as follows:
| | |
| Type of derivative | | Forward foreign currency contracts |
| Location of gain (loss) on derivatives recognized in income | | Net realized gain (loss) on foreign currency transactions/Net change in unrealized appreciation (depreciation) on translation of assets and liabilities denominated in foreign currencies |
| Realized gain (loss) on derivatives recognized in income | | $(21,984) |
| Change in unrealized appreciation (depreciation) on derivatives recognized in income | | $483,407 |
During the period ended April 30, 2010, no other Fund engaged in derivative activity.
Foreign currency transactions The books and records of each Fund are maintained in U.S. dollars. Foreign currency transactions are translated into U.S. dollars on the following basis: (i) market value of investment securities, other assets and other liabilities at the daily rates of exchange, and (ii) purchases and sales of investment securities, dividend and interest income and certain expenses at the rates of exchange
prevailing on the respective dates of such transactions. Each Fund does not isolate that portion of gains and losses on investments which is due to changes in foreign exchange rates from that which is due to changes in market prices of the investments. Such fluctuations are included with the net realized and unrealized gains and losses from investment transactions. Net realized gain (loss) from foreign currency transactions and the net change in unrealized appreciation (depreciation) on translation of assets and liabilities denominated in foreign currencies include gains and losses between trade and settlement date on securities transactions, gains and losses arising from the purchase and sale of forward foreign currency contracts and gains and losses between the ex and payment dates on dividends, interest and foreign withholding taxes. Net realized gain (loss) from foreign currency transactions also includes the effect of any Brazilian IOF tax.
Forward foreign currency contracts Each of the Funds except the Small Cap Growth Fund is authorized to enter into forward foreign currency contracts which are used primarily to hedge against foreign currency exchange rate risk on its non-U.S. dollar denominated investment securities. Forward foreign currency contracts are translated to U.S. dollars using forward exchange rates provided by a pricing service as of the close of the NYSE each valuation day and the unrealized gain or loss is included in the Statement of Assets and Liabilities. When the contracts are closed, the gain or loss is realized. Realized and unrealized gains and losses are included in the Statements of Operations. Risks may arise from unanticipated movements in the currency’s value relative to the U.S. dollar and from the possible inability of counter-parties to meet the terms of their contracts.
Real estate investment trusts (“REITs”) There are certain additional risks involved in investing in REITs. These include, but are not limited to, economic conditions, changes in zoning laws, real estate values, property taxes and interest rates. Dividend income is recorded at the Manager’s estimate of the income included in distributions from the REIT investments. Distributions received in excess of the estimated amount are recorded as a reduction of the cost of the investments. The actual amounts of income, return of capital and capital gains are only determined by each REIT after the fiscal year end and may differ from the estimated amounts.
Repurchase agreements Each Fund enters into repurchase agreements whereby a Fund, through its custodian, receives delivery of the underlying securities, the market value of which at the time of purchase is required to be in an amount of at
Notes to Financial Statements
least 100% of the resale price. Repurchase agreements involve the risk that the seller will fail to repurchase the security, as agreed. In that case, each Fund will bear the risk of market value fluctuations until the security can be sold and may encounter delays and incur costs in liquidating the security. In the event of bankruptcy or insolvency of the seller, delays and costs may be incurred.
Revenue recognition Investment security transactions are accounted for on a trade date basis. Dividend income is recorded on the ex-dividend date. Interest income is recorded on an accrual basis.
Expenses Each Fund is charged for those expenses that are directly attributable to it, while other expenses are allocated proportionately among the Eagle Family of Funds based upon methods approved by the Boards. Expenses that are directly attributable to a specific class of shares, such as distribution fees, shareholder servicing fees and administrative fees, are charged directly to that class. Other expenses of each Fund are allocated to each class of shares based upon their relative percentage of net assets. The Funds have entered into an arrangement with the custodian whereby each Fund receives credits on uninvested cash balances which are used to offset a portion of each Fund’s expenses. These custodian credits are shown as “Expense offsets” in the Statements of Operations.
Class allocations Each class of shares has equal rights to earnings and assets except that each class may bear different expense for administration, distribution and/or shareholder services. Income, expenses (other than expenses attributable to a specific class), and realized and unrealized gains or losses on investments are allocated to each class of shares based on its relative net assets.
Distribution of income and gains In each Fund except the Investment Grade Bond Fund and the Growth & Income Fund, distributions of net investment income are made annually. Distributions of net investment income in the Investment Grade Bond Fund and the Growth & Income Fund are made monthly and quarterly, respectively. Net realized gains from investment transactions during any particular fiscal year in excess of available capital loss carryforwards, which, if not distributed, would be taxable to each Fund, will be distributed to shareholders in the following fiscal year. Each Fund uses the identified cost method for determining realized gain or loss on investments for both financial and federal income tax reporting purposes.
All dividends paid by the Funds from net investment income are deemed to be ordinary income for federal income tax purposes.
Dividends paid to shareholders from net investment income were as follows:
| | | | |
| Distributions from net investment income | | 11/1/09 to
4/30/10 | | 11/1/08 to
10/31/09 |
| Growth & Income Fund | | | | |
| Class A | | $849,934 | | $2,076,204 |
| Class C | | 278,230 | | 931,321 |
| Class I | | 39,725 | | 21,594 |
| Class R-3 | | 2,166 | | 1,808 |
| Class R-5 | | 13 | | — |
| International Equity Fund | | | | |
| Class A | | — | | 2,569,804 |
| Class C | | — | | 2,744,203 |
| Class I | | — | | — |
| Class R-3 | | — | | — |
| Class R-5 | | — | | — |
| Investment Grade Bond Fund | | | | |
| Class A | | 15,297 | | N/A |
| Class C | | 5,045 | | N/A |
| Class I | | 12 | | N/A |
| Class R-3 | | 1 | | N/A |
| Class R-5 | | 2 | | N/A |
| Large Cap Core Fund | | | | |
| Class A | | 50,802 | | 123,051 |
| Class C | | — | | 10,575 |
| Class I | | 914,784 | | 2,099,947 |
| Class R-3 | | — | | — |
| Class R-5 | | 161 | | — |
| Small Cap Core Value Fund | | | | |
| Class A | | — | | — |
| Class C | | — | | — |
| Class I | | 37,833 | | — |
| Class R-3 | | — | | — |
| Class R-5 | | — | | — |
Distributions paid to shareholders from net realized gains were as follows:
| | |
| Distributions from net realized gains | | 11/1/09 to
4/30/10 |
| Small Cap Core Value Fund | | |
| Class A | | $209,246 |
| Class C | | 124,062 |
| Class I | | 1,694,520 |
| Class R-3 | | — |
| Class R-5 | | — |
Notes to Financial Statements
No distributions were paid to shareholders from net realized gains during the period November 1, 2008 to October 31, 2009.
Offering and organizational costs Offering costs of $79,835 associated with the formation of the Investment Grade Bond Fund were accounted for as a deferred charge and are amortized on a straight-line basis over 12 months from the date of commencement of operations. Also, organizational costs of $41,232 associated with the formation of the fund were charged and expensed after the commencement of operations.
Other In the normal course of business the Funds enter into contracts that contain a variety of representations and warranties, which provide general indemnifications. The Funds’ maximum exposure under these arrangements is unknown, as this would involve future claims that may be made against the Funds and/or its affiliates that have not yet occurred. However, based on experience, the risk of loss to each Fund is expected to be remote.
NOTE 3 | Purchases and sales of securities For the six-month period ended April 30, 2010, purchases and sales of investment securities (excluding repurchase agreements and short-term obligations) were as follows:
| | | | |
| | | Purchases | | Sales |
| Capital Appreciation Fund | | $153,033,470 | | $137,768,014 |
| Growth & Income Fund | | 84,230,397 | | 37,967,704 |
| International Equity Fund | | 62,268,201 | | 87,023,003 |
| Investment Grade Bond Fund | | 42,531,430 | | 5,633,549 |
| Large Cap Core Fund | | 18,289,098 | | 27,319,842 |
| Mid Cap Growth Fund | | 67,672,936 | | 66,412,864 |
| Mid Cap Stock Fund | | 1,901,254,774 | | 1,900,323,144 |
| Small Cap Core Value Fund | | 8,229,589 | | 6,837,946 |
| Small Cap Growth Fund | | 108,782,241 | | 75,555,516 |
NOTE 4 | Investment advisory fees and other transactions with affiliates Each Fund agreed to pay to the Manager an investment advisory and an administrative fee equal to an annualized rate based on a percentage of each Fund’s average daily net assets, computed daily and payable monthly. For advisory services provided by the Manager, the investment advisory rate for each Fund was as follows:
| | | | |
Investment advisory fee
rate schedule | | Breakpoint | | Investment
advisory fee |
| Capital Appreciation Fund | | First $1 billion
Over $1 billion | | 0.60%
0.55% |
| Growth & Income Fund | | First $100 million
$100 million to $500 million Over $500 million | | 0.60%
0.45% 0.40% |
| International Equity Fund | | First $100 million
$100 million to $1 billion Over $1 billion | | 0.85%
0.65% 0.55% |
| Investment Grade Bond Fund | | All assets | | 0.30% |
| Large Cap Core Fund | | All assets | | 0.60% |
Mid Cap Growth Fund, Mid Cap Stock Fund, Small Cap Core Value Fund and Small Cap Growth Fund | | First $500 million
$500 million to $1 billion Over $1 billion | | 0.60%
0.55% 0.50% |
For administrative services provided by the Manager, each Fund agreed to pay an administrative rate of 0.15% for Class A, Class C and Class R-3 shares and 0.10% for Class I and Class R-5. For the six-month period ended April 30, 2010, the amount of administrative fees charged to the Funds were as follows:
| | | | | | |
| Administrative fees | | | | Class A | | Class C |
| Capital Appreciation Fund | | | | $314,065 | | $66,685 |
| Growth & Income Fund | | | | 80,061 | | 43,255 |
| International Equity Fund | | | | 36,465 | | 46,545 |
| Investment Grade Bond Fund | | | | 4,228 | | 2,735 |
| Large Cap Core Fund | | | | 8,647 | | 7,262 |
| Mid Cap Growth Fund | | | | 81,443 | | 38,123 |
| Mid Cap Stock Fund | | | | 648,272 | | 182,966 |
| Small Cap Core Value Fund | | | | 5,267 | | 3,013 |
| Small Cap Growth Fund | | | | 171,079 | | 48,902 |
| | | | | | |
| | | |
| Administrative fees (cont’d) | | Class I | | Class R-3 | | Class R-5 |
| Capital Appreciation Fund | | $9,520 | | $545 | | $11,358 |
| Growth & Income Fund | | 1,804 | | 220 | | 1 |
| International Equity Fund | | 79 | | 1 | | 1 |
| Investment Grade Bond Fund | | 1 | | — | | 1 |
| Large Cap Core Fund | | 56,474 | | 1 | | 10 |
| Mid Cap Growth Fund | | 3,624 | | 323 | | 1 |
| Mid Cap Stock Fund | | 151,389 | | 2,413 | | 32,520 |
| Small Cap Core Value Fund | | 27,112 | | 1 | | 1 |
| Small Cap Growth Fund | | 16,407 | | 1,168 | | 17,511 |
Subadvisory fees The Manager entered into subadvisory agreements with certain parties to provide investment advice,
Notes to Financial Statements
portfolio management services (including the placement of brokerage orders), certain compliance and other services to the Funds.
The Manager entered into a subadvisory agreement with unaffiliated parties to serve as subadviser to the Capital Appreciation Fund, Growth & Income Fund and International Equity Fund.
The Manager entered into a subadvisory agreement with Eagle Boston Investment Management, Inc. (“EBIM”), an affiliate of Eagle, to serve as subadviser for the Small Cap Core Value Fund. Under this agreement, Eagle pays EBIM an annualized rate of 0.375% on the first $500 million of total assets, 0.35% on assets between $500 million and $1 billion, and 0.325% on all assets over $1 billion as a percentage of the Fund’s average daily net assets, computed daily and payable monthly.
Distribution and service fees Pursuant to the Class A, Class C and Class R-3 Distribution plans and in accordance with Rule 12b-1 of the Investment Company Act of 1940, as amended (“Rule 12b-1 Plans”), the Funds are authorized to pay Eagle Fund Distributors, Inc. (“Distributor”), an affiliate of the Manager, a fee based on the average daily net assets for each class of shares, accrued daily and payable monthly. The distribution and service rate for Class A shares is 0.25%; for Class C shares is 1% and for Class R-3 shares is 0.50%. The Distribution plans for Class I and Class R-5 shares do not authorize a distribution fee to be paid from Fund assets. For the six-month period ended April 30, 2010, the amount of distribution and service fees charged to the Funds under the Rule 12b-1 Plans were as follows:
| | | | | | |
| Fees under the Rule 12b-1 Plans | | Class A | | Class C | | Class R-3 |
| Capital Appreciation Fund | | $523,441 | | $444,564 | | $1,818 |
| Growth & Income Fund | | 133,433 | | 288,369 | | 735 |
| International Equity Fund | | 60,776 | | 310,299 | | 4 |
| Investment Grade Bond Fund | | 7,046 | | 18,233 | | 2 |
| Large Cap Core Fund | | 14,413 | | 48,410 | | 4 |
| Mid Cap Growth Fund | | 135,738 | | 254,152 | | 1,078 |
| Mid Cap Stock Fund | | 1,080,453 | | 1,219,775 | | 8,043 |
| Small Cap Core Value Fund | | 8,777 | | 20,084 | | 4 |
| Small Cap Growth Fund | | 285,135 | | 326,012 | | 3,892 |
Sales charges For the six-month period ended April 30, 2010, total front-end and CDSCs paid to the Distributor were as follows:
| | | | | | |
| | | Front-end
sales charge | | Contingent deferred
sales charges |
| | | Class A | | Class A | | Class C |
| Capital Appreciation Fund | | $48,707 | | $— | | $1,738 |
| Growth & Income Fund | | 173,541 | | 7 | | 2,763 |
| International Equity Fund | | 10,401 | | 11 | | 1,804 |
| Investment Grade Bond Fnd | | 49,637 | | — | | 32 |
| Large Cap Core Fund | | 1,542 | | — | | 235 |
| Mid Cap Growth Fund | | 33,594 | | 6 | | 691 |
| Mid Cap Stock Fund | | 166,103 | | 7 | | 6,852 |
| Small Cap Core Value Fund | | 14,793 | | — | | 142 |
| Small Cap Growth Fund | | 43,423 | | 68 | | 2,956 |
The Distributor paid commissions to salespersons from these fees and incurred other distribution costs.
Agency commissions For the six-month period ended April 30, 2010, total agency brokerage commissions paid by the Funds and agency brokerage commissions paid directly to Raymond James & Associates, Inc. (“RJA”), an affiliate of the Manager, were as follows:
| | | | |
| | | Total agency
brokerage
commissions | | Paid to
Raymond
James &
Associates, Inc. |
| Capital Appreciation Fund | | $229,591 | | $— |
| Growth & Income Fund | | 86,308 | | 538 |
| International Equity Fund | | 193,110 | | — |
| Large Cap Core Fund | | 32,989 | | — |
| Mid Cap Growth Fund | | 143,704 | | 1,363 |
| Mid Cap Stock Fund | | 3,137,645 | | 24,294 |
| Small Cap Core Value Fund | | 17,983 | | 92 |
| Small Cap Growth Fund | | 230,029 | | 1,976 |
Internal audit fees RJA provides internal audit services to the Funds. Each Fund pays RJA a fixed and/or hourly fee for these services.
Fund accounting fees Eagle Fund Services, Inc. (“EFS”) is the fund accountant for each of the Funds except the International Equity Fund. For providing fund accounting services, EFS receives payment from the Funds at a fixed base fee per fund, a multiple class fee and any out-of-pocket expenses. The custodian, not EFS, provides fund accounting services for the International Equity Fund.
Shareholder servicing fees EFS is the shareholder servicing agent for each of the Funds. For providing shareholder services, EFS receives payment from the Funds at a fixed fee per shareholder
Notes to Financial Statements
account plus any out-of-pocket expenses. For the six-month period ended April 30, 2010, the amount of Shareholder Servicing fees charged to the Funds were as follows:
| | | | | | |
| Shareholder servicing fees | | | | Class A | | Class C |
| Capital Appreciation Fund | | | | $383,520 | | $82,377 |
| Growth & Income Fund | | | | 84,038 | | 42,482 |
| International Equity Fund | | | | 45,063 | | 58,845 |
| Investment Grade Bond Fund | | | | 749 | | 964 |
| Large Cap Core Fund | | | | 9,594 | | 11,695 |
| Mid Cap Growth Fund | | | | 84,130 | | 44,518 |
| Mid Cap Stock Fund | | | | 890,721 | | 239,926 |
| Small Cap Core Value Fund | | | | 5,620 | | 4,831 |
| Small Cap Growth Fund | | | | 228,009 | | 72,529 |
| | | | | | |
| | | |
| Shareholder servicing fees (cont’d) | | Class I | | Class R-3 | | Class R-5 |
| Capital Appreciation Fund | | $10,620 | | $483 | | $10,206 |
| Growth & Income Fund | | 2,087 | | 135 | | 9 |
| International Equity Fund | | 79 | | 15 | | 9 |
| Investment Grade Bond Fund | | 8 | | 4 | | 4 |
| Large Cap Core Fund | | 158,316 | | 6 | | 38 |
| Mid Cap Growth Fund | | 2,593 | | 587 | | 12 |
| Mid Cap Stock Fund | | 153,128 | | 2,378 | | 31,340 |
| Small Cap Core Value Fund | | 83,440 | | 9 | | 7 |
| Small Cap Growth Fund | | 6,165 | | 1,722 | | 14,672 |
Expense limitations For the periods indicated in the table below, Eagle has contractually agreed to waive its fees and/or reimburse expenses to each class to the extent that the annual operating expense rate for each class of shares exceed the following annualized rates as a percentage of average daily net assets of each class of shares.
| | | | |
| Expense limitations rate schedule | | 3/1/10 to 2/28/11 | | 3/1/09 to
2/28/10 |
| Capital Appreciation Fund | | | | |
| Class A | | 1.40% | | 1.40% |
| Class C | | 2.20% | | 2.20% |
| Class I | | 0.95% | | 0.95% |
| Class R-3 | | 1.65% | | 1.65% |
| Class R-5 | | 0.95% | | 0.95% |
| Growth & Income Fund | | | | |
| Class A | | 1.40% | | 1.40% |
| Class C | | 2.20% | | 2.20% |
| Class I | | 0.95% | | 0.95% |
| Class R-3 | | 1.65% | | 1.65% |
| Class R-5 | | 0.95% | | 0.95% |
| | | | |
| Expense limitations rate schedule (cont’d) | | 3/1/10 to 2/28/11 | | 3/1/09 to
2/28/10 |
| International Equity Fund | | | | |
| Class A | | 1.75% | | 1.75% |
| Class C | | 2.55% | | 2.55% |
| Class I | | 1.15% | | 1.15% |
| Class R-3 | | 1.75% | | 1.75% |
| Class R-5 | | 1.15% | | 1.15% |
| Investment Grade Bond Fund | | | | |
| Class A | | 0.85% | | N/A |
| Class C | | 1.65% | | N/A |
| Class I | | 0.60% | | N/A |
| Class R-3 | | 1.15% | | N/A |
| Class R-5 | | 0.60% | | N/A |
| Large Cap Core Fund | | | | |
| Class A | | 1.40% | | 1.40% |
| Class C | | 2.20% | | 2.20% |
| Class I | | 0.95% | | 0.95% |
| Class R-3 | | 1.65% | | 1.65% |
| Class R-5 | | 0.95% | | 0.95% |
| Mid Cap Growth Fund | | | | |
| Class A | | 1.50% | | 1.50% |
| Class C | | 2.30% | | 2.30% |
| Class I | | 0.95% | | 0.95% |
| Class R-3 | | 1.70% | | 1.75% |
| Class R-5 | | 0.95% | | 0.95% |
| Mid Cap Stock Fund | | | | |
| Class A | | 1.50% | | 1.50% |
| Class C | | 2.30% | | 2.30% |
| Class I | | 0.95% | | 0.95% |
| Class R-3 | | 1.70% | | 1.75% |
| Class R-5 | | 0.95% | | 0.95% |
| Small Cap Core Value Fund | | | | |
| Class A | | 1.50% | | 1.50% |
| Class C | | 2.30% | | 2.30% |
| Class I | | 0.95% | | 0.95% |
| Class R-3 | | 1.70% | | 1.70% |
| Class R-5 | | 0.95% | | 0.95% |
| Small Cap Growth Fund | | | | |
| Class A | | 1.50% | | 1.50% |
| Class C | | 2.30% | | 2.30% |
| Class I | | 0.95% | | 0.95% |
| Class R-3 | | 1.70% | | 1.70% |
| Class R-5 | | 0.95% | | 0.95% |
Notes to Financial Statements
For the six-month period ended April 30, 2010, fees and expenses waived and/or reimbursed based on the expense rate limitation schedule were as follows:
| | | | | | |
| Expenses waived and/or reimbursed | | Fund level | | Class A | | Class C |
| International Equity Fund | | $106,243 | | $— | | $— |
| Investment Grade Bond Fund | | 86,801 | | 4,976 | | 2,787 |
| Large Cap Core Fund | | — | | 2,631 | | 3,415 |
| Small Cap Core Value Fund | | 49,451 | | 418 | | 839 |
Expenses waived and/or reimbursed
(cont'd) | | Class I | | Class R-3 | | Class R-5 |
| Growth & Income Fund | | $425 | | $— | | $9 |
| International Equity Fund | | 158 | | 15 | | 10 |
| Investment Grade Bond Fund | | 10 | | 5 | | 5 |
| Large Cap Core Fund | | 155,916 | | 5 | | 37 |
| Mid Cap Growth Fund | | 497 | | 13 | | 12 |
| Small Cap Core Value Fund | | 110,463 | | 9 | | 9 |
A portion or all of a Fund’s fees and expenses waived and/or reimbursed by the Manager in prior fiscal years may be recoverable by Eagle prior to their expiration date. Eagle must recover from the same class of shares any previously waived and/or reimbursed fees and expenses within two years from the Fund’s fiscal year end during which the fees and expenses where originally waived and/or reimbursed. Previously waived and/or reimbursed fees and expenses are recovered by Eagle when expenses in the current fiscal year fall below the expense rate limitation then in effect. The following table shows the amounts that Eagle may be allowed to recover by class of shares and the date in which these amounts will expire.
| | | | |
| Recoverable expenses | | 10/31/11 | | 10/31/10 |
| Growth & Income Fund Class A | | $108,210 | | $— |
| Growth & Income Fund Class C | | 44,451 | | — |
| Growth & Income Fund Class I | | 1,097 | | — |
| International Equity Fund | | 120,582 | | — |
| International Equity Fund Class A | | 28,859 | | — |
| International Equity Fund Class C | | 24,484 | | — |
| International Equity Fund Class I | | 118 | | — |
| Large Cap Core Fund Class A | | 8,172 | | — |
| Large Cap Core Fund Class C | | 11,295 | | — |
| Large Cap Core Fund Class I | | 327,069 | | 148,145 |
| Large Cap Core Fund Class R-5 | | 37 | | 113 |
| Mid Cap Growth Fund Class I | | 2,265 | | 83 |
| Small Cap Core Value Fund | | 281,547 | | — |
| Small Cap Core Value Fund Class A | | 8,003 | | — |
| Small Cap Core Value Fund Class C | | 6,223 | | — |
| Small Cap Core Value Fund Class I | | 134,164 | | — |
For the six-month period ended April 30, 2010, the Manager recovered previously waived expenses from the Growth & Income Fund’s Class A shares in the amount of $41,542 and Class C shares in the amount of $39,832.
Trustees and officers compensation Each Trustee of the Eagle Family of Funds who is not an employee of the Manager receives an annual retainer along with meeting fees for those Eagle Family of Funds’ regular or special meetings attended in person and 25% of such fees are received for telephonic meetings. All reasonable out-of-pocket expenses are also reimbursed. Except when directly attributable to a Fund, Trustees’ fees and expenses are allocated on a pro rata basis among each fund in the Eagle Family of Funds. The pro rata allocation is for each fund for which the Trustee is elected to serve. Certain officers of the Eagle Family of Funds may also be officers and/or directors of Eagle. Such officers receive no compensation from the Funds except for the Funds’ Chief Compliance Officer. A portion of the Chief Compliance Officer’s total compensation is paid equally by each fund in the Eagle Family of Funds.
NOTE 5 | Federal income taxes and distributions Each Fund is treated as a single corporate taxpayer as provided for in the Tax Reform Act of 1986, as amended. Accordingly, no provision for federal income taxes is required since the Funds intend to continue to qualify as a regulated investment company under Subchapter M of the Internal Revenue Code and distribute to shareholders all of its taxable income and gains. Federal income tax regulations differ from generally accepted accounting principles; therefore, distributions determined in accordance with tax regulations may differ significantly in amount or character from net investment income and realized gains for financial reporting purposes. Financial reporting records are adjusted for permanent book/ tax differences to reflect tax character; these adjustments have no effect on net assets or NAV per share. Financial reporting records are not adjusted for temporary differences. Management has analyzed the Funds’ tax positions taken on federal income tax returns for all open tax years (tax years ended October 31, 2006 to October 31, 2009) and has concluded that no provision for federal income tax is required in the Funds’ financial statements.
Notes to Financial Statements
As of April 30, 2010, the identified cost of investments in securities owned by each Fund for federal income tax purposes were as follows:
| | |
| | | Identified cost |
| Capital Appreciation Fund | | $472,196,942 |
| Growth & Income Fund | | 177,583,963 |
| International Equity Fund | | 98,181,625 |
| Investment Grade Bond Fund | | 37,284,792 |
| Large Cap Core Fund | | 130,393,936 |
| Mid Cap Growth Fund | | 140,489,144 |
| Mid Cap Stock Fund | | 1,438,102,253 |
| Small Cap Core Value Fund | | 44,805,981 |
| Small Cap Growth Fund | | 310,905,277 |
As of April 30, 2010, the net unrealized appreciation (depreciation) of investments in securities owned by each Fund were as follows:
| | | | | | | |
| | | Unrealized
appreciation | | Unrealized
depreciation | | | Net unrealized
appreciation
(depreciation) |
| Capital Appreciation Fund | | $126,832,061 | | $(9,377,003 | ) | | $117,455,058 |
| Growth & Income Fund | | 26,142,684 | | (7,451,131 | ) | | 18,691,553 |
| International Equity Fund | | 16,599,902 | | (15,680,261 | ) | | 919,641 |
| Investment Grade Bond Fund | | 254,243 | | (21,206 | ) | | 233,037 |
| Large Cap Core Fund | | 22,595,562 | | (9,018,609 | ) | | 13,576,953 |
| Mid Cap Growth Fund | | 50,332,266 | | (2,432,235 | ) | | 47,900,031 |
| Mid Cap Stock Fund | | 161,589,731 | | (29,716,069 | ) | | 131,873,662 |
| Small Cap Core Value Fund | | 28,320,441 | | (332,279 | ) | | 27,988,162 |
| Small Cap Growth Fund | | 133,141,233 | | (9,061,391 | ) | | 124,079,842 |
NOTE 6 | Subsequent events The Manager has evaluated subsequent events through June 18, 2010, the date of issuance of the financial statements, and determined that no material events or transactions would require recognition or disclosure in the Funds’ financial statements.
Understanding Your Ongoing Costs
As a shareholder of a Fund, you incur two types of costs: (1) transaction costs, including sales charges on purchases, contingent deferred sales charges, or redemption fees; and (2) ongoing costs, including investment advisory fees; distribution (12b-1) fees; and other Fund expenses. The following sections are intended to help you understand your ongoing cost (in dollars) of investing in each Fund and to compare these costs with the ongoing costs of investing in other mutual funds. Please note that the expenses shown in the table are meant to highlight your ongoing costs only and do not reflect one-time transaction expenses, such as sales charges or redemption fees. Therefore, if these transactional costs were included, your costs would have been higher. For more information, see your Fund’s prospectus or contact your financial advisor.
Actual expenses | The table below shows the actual expenses you would have paid on a $1,000 investment in each Fund held from the beginning period date indicated through April 30, 2010. It also shows how much a $1,000 investment would be worth at the close of the period, assuming actual returns after ongoing expenses. This table is useful in comparing ongoing costs only, and will not help you determine the relative total costs of owning different funds. Simply divide your account value by $1,000 (for example, an $8,600 account value divided by $1,000 = 8.6), then multiply the result by the number in the line under the heading entitled “Expenses paid during period” to estimate the expenses you paid on your account during this period.
| | | | | | | | | | | | |
| | | Beginning
period date | | Account value
at beginning
period date | | Ending account
value at
April 30, 2010 | | Expenses paid
during
period (a) | | Annualized
expense
ratio | | Number of
days in
the period |
| Eagle Capital Appreciation Fund | | | | | | | | | | | | |
| Class A | | 11/01/09 | | $1,000.00 | | $1,142.20 | | $6.67 | | 1.26% | | 181 |
| Class C | | 11/01/09 | | $1,000.00 | | $1,138.20 | | $10.65 | | 2.01% | | 181 |
| Class I | | 11/01/09 | | $1,000.00 | | $1,144.50 | | $4.70 | | 0.88% | | 181 |
| Class R-3 | | 11/01/09 | | $1,000.00 | | $1,140.80 | | $7.73 | | 1.46% | | 181 |
| Class R-5 | | 11/01/09 | | $1,000.00 | | $1,144.30 | | $4.59 | | 0.86% | | 181 |
| Eagle Growth & Income Fund | | | | | | | | | | | | |
| Class A | | 11/01/09 | | $1,000.00 | | $1,107.80 | | $7.32 | | 1.40% | | 181 |
| Class C | | 11/01/09 | | $1,000.00 | | $1,103.80 | | $11.48 | | 2.20% | | 181 |
| Class I | | 11/01/09 | | $1,000.00 | | $1,109.20 | | $4.97 | | 0.95% | | 181 |
| Class R-3 | | 11/01/09 | | $1,000.00 | | $1,107.30 | | $7.88 | | 1.51% | | 181 |
| Class R-5 | | 12/28/09 | | $1,000.00 | | $1,054.50 | | $3.31 | | 0.95% | | 123 |
| Eagle International Equity Fund | | | | | | | | | | | | |
| Class A | | 11/01/09 | | $1,000.00 | | $1,047.60 | | $8.81 | | 1.73% | | 181 |
| Class C | | 11/01/09 | | $1,000.00 | | $1,043.60 | | $12.61 | | 2.49% | | 181 |
| Class I | | 11/01/09 | | $1,000.00 | | $1,050.60 | | $5.84 | | 1.15% | | 181 |
| Class R-3 | | 12/28/09 | | $1,000.00 | | $982.70 | | $5.84 | | 1.75% | | 123 |
| Class R-5 | | 12/28/09 | | $1,000.00 | | $985.20 | | $3.84 | | 1.15% | | 123 |
| Eagle Investment Grade Bond Fund | | | | | | | | | | | | |
| Class A | | 03/01/10 | | $1,000.00 | | $1,007.00 | | $1.40 | | 0.85% | | 60 |
| Class C | | 03/01/10 | | $1,000.00 | | $1,005.90 | | $2.72 | | 1.65% | | 60 |
| Class I | | 03/01/10 | | $1,000.00 | | $1,007.20 | | $0.99 | | 0.60% | | 60 |
| Class R-3 | | 03/01/10 | | $1,000.00 | | $1,006.80 | | $1.79 | | 1.09% | | 60 |
| Class R-5 | | 03/01/10 | | $1,000.00 | | $1,007.90 | | $0.99 | | 0.60% | | 60 |
| Eagle Large Cap Core Fund | | | | | | | | | | | | |
| Class A | | 11/01/09 | | $1,000.00 | | $1,140.80 | | $7.26 | | 1.37% | | 181 |
| Class C | | 11/01/09 | | $1,000.00 | | $1,135.80 | | $11.48 | | 2.17% | | 181 |
| Class I | | 11/01/09 | | $1,000.00 | | $1,142.60 | | $5.05 | | 0.95% | | 181 |
| Class R-3 | | 12/28/09 | | $1,000.00 | | $1,066.60 | | $5.76 | | 1.65% | | 123 |
| Class R-5 | | 11/01/09 | | $1,000.00 | | $1,142.90 | | $5.05 | | 0.95% | | 181 |
| Eagle Mid Cap Growth Fund | | | | | | | | | | | | |
| Class A | | 11/01/09 | | $1,000.00 | | $1,261.20 | | $7.56 | | 1.35% | | 181 |
| Class C | | 11/01/09 | | $1,000.00 | | $1,256.40 | | $11.85 | | 2.12% | | 181 |
| Class I | | 11/01/09 | | $1,000.00 | | $1,263.70 | | $5.33 | | 0.95% | | 181 |
| Class R-3 | | 11/01/09 | | $1,000.00 | | $1,259.00 | | $9.58 | | 1.70% | | 181 |
| Class R-5 | | 12/28/09 | | $1,000.00 | | $1,104.50 | | $3.40 | | 0.95% | | 123 |
| Eagle Mid Cap Stock Fund | | | | | | | | | | | | |
| Class A | | 11/01/09 | | $1,000.00 | | $1,155.50 | | $6.37 | | 1.19% | | 181 |
| Class C | | 11/01/09 | | $1,000.00 | | $1,151.00 | | $10.31 | | 1.93% | | 181 |
| Class I | | 11/01/09 | | $1,000.00 | | $1,157.80 | | $4.21 | | 0.79% | | 181 |
| Class R-3 | | 11/01/09 | | $1,000.00 | | $1,154.40 | | $7.39 | | 1.38% | | 181 |
| Class R-5 | | 11/01/09 | | $1,000.00 | | $1,158.00 | | $4.19 | | 0.78% | | 181 |
| Eagle Small Cap Core Value Fund | | | | | | | | | | | | |
| Class A | | 11/01/09 | | $1,000.00 | | $1,233.20 | | $8.30 | | 1.50% | | 181 |
| Class C | | 11/01/09 | | $1,000.00 | | $1,228.80 | | $12.71 | | 2.30% | | 181 |
| Class I | | 11/01/09 | | $1,000.00 | | $1,237.10 | | $5.27 | | 0.95% | | 181 |
| Class R-3 | | 12/28/09 | | $1,000.00 | | $1,104.70 | | $6.01 | | 1.69% | | 123 |
| Class R-5 | | 12/28/09 | | $1,000.00 | | $1,107.70 | | $3.41 | | 0.95% | | 123 |
| Eagle Small Cap Growth Fund | | | | | | | | | | | | |
| Class A | | 11/01/09 | | $1,000.00 | | $1,268.10 | | $7.30 | | 1.30% | | 181 |
| Class C | | 11/01/09 | | $1,000.00 | | $1,263.10 | | $11.62 | | 2.07% | | 181 |
| Class I | | 11/01/09 | | $1,000.00 | | $1,270.80 | | $4.68 | | 0.83% | | 181 |
| Class R-3 | | 11/01/09 | | $1,000.00 | | $1,266.00 | | $8.83 | | 1.57% | | 181 |
| Class R-5 | | 11/01/09 | | $1,000.00 | | $1,270.50 | | $4.97 | | 0.88% | | 181 |
(a) Expenses are calculated using each Funds’ annualized expense ratio for each class of shares, multiplied by the average account value for the period, then multiplying the result by the actual number of days in the period; and then dividing that result by the actual number of days in the fiscal year (365).
Understanding Your Ongoing Costs
Hypothetical example for comparison purposes | All mutual funds now follow guidelines to assist shareholders in comparing expenses between different funds. Per these guidelines, the table below shows each Fund’s expenses based on a $1,000 investment held from November 1, 2009 through April 30, 2010 and assuming for this period a hypothetical 5% annualized rate of return before ongoing expenses, which is not
the Fund’s actual return. Please note that you should not use this information to estimate your actual ending account balance and expenses paid during the period. You can use this information to compare the ongoing expenses (but not transaction expenses or total costs) of investing in the Funds with those of other funds. All mutual fund shareholder reports will provide this information to help you make this comparison.
| | | | | | | | |
| | | Beginning account value
November 1, 2009 | | Ending account value
April 30, 2010 | | Expenses paid
during period (a) | | Annualized
expense ratio |
| | | | |
| Eagle Capital Appreciation Fund | | | | | | | | |
| Class A | | $1,000.00 | | $1,018.56 | | $6.29 | | 1.26% |
| Class C | | $1,000.00 | | $1,014.83 | | $10.03 | | 2.01% |
| Class I | | $1,000.00 | | $1,020.41 | | $4.43 | | 0.88% |
| Class R-3 | | $1,000.00 | | $1,017.57 | | $7.28 | | 1.46% |
| Class R-5 | | $1,000.00 | | $1,020.51 | | $4.32 | | 0.86% |
| Eagle Growth & Income Fund | | | | | | | | |
| Class A | | $1,000.00 | | $1,017.85 | | $7.00 | | 1.40% |
| Class C | | $1,000.00 | | $1,013.89 | | $10.99 | | 2.20% |
| Class I | | $1,000.00 | | $1,020.08 | | $4.76 | | 0.95% |
| Class R-3 | | $1,000.00 | | $1,017.32 | | $7.54 | | 1.51% |
| Class R-5 | | $1,000.00 | | $1,020.06 | | $4.78 | | 0.95% |
| Eagle International Equity Fund | | | | | | | | |
| Class A | | $1,000.00 | | $1,016.19 | | $8.67 | | 1.73% |
| Class C | | $1,000.00 | | $1,012.45 | | $12.42 | | 2.49% |
| Class I | | $1,000.00 | | $1,019.10 | | $5.75 | | 1.15% |
| Class R-3 | | $1,000.00 | | $1,016.12 | | $8.74 | | 1.75% |
| Class R-5 | | $1,000.00 | | $1,019.09 | | $5.75 | | 1.15% |
| Eagle Investment Grade Bond Fund | | | | | | | | |
| Class A | | $1,000.00 | | $1,020.58 | | $4.26 | | 0.85% |
| Class C | | $1,000.00 | | $1,016.61 | | $8.25 | | 1.65% |
| Class I | | $1,000.00 | | $1,021.82 | | $3.01 | | 0.60% |
| Class R-3 | | $1,000.00 | | $1,019.40 | | $5.44 | | 1.09% |
| Class R-5 | | $1,000.00 | | $1,021.82 | | $3.00 | | 0.60% |
| Eagle Large Cap Core Fund | | | | | | | | |
| Class A | | $1,000.00 | | $1,018.02 | | $6.84 | | 1.37% |
| Class C | | $1,000.00 | | $1,014.05 | | $10.82 | | 2.17% |
| Class I | | $1,000.00 | | $1,020.08 | | $4.76 | | 0.95% |
| Class R-3 | | $1,000.00 | | $1,016.60 | | $8.27 | | 1.65% |
| Class R-5 | | $1,000.00 | | $1,020.09 | | $4.76 | | 0.95% |
| Eagle Mid Cap Growth Fund | | | | | | | | |
| Class A | | $1,000.00 | | $1,018.11 | | $6.75 | | 1.35% |
| Class C | | $1,000.00 | | $1,014.29 | | $10.58 | | 2.12% |
| Class I | | $1,000.00 | | $1,020.08 | | $4.76 | | 0.95% |
| Class R-3 | | $1,000.00 | | $1,016.31 | | $8.55 | | 1.70% |
| Class R-5 | | $1,000.00 | | $1,020.04 | | $4.80 | | 0.95% |
| Eagle Mid Cap Stock Fund | | | | | | | | |
| Class A | | $1,000.00 | | $1,018.88 | | $5.97 | | 1.19% |
| Class C | | $1,000.00 | | $1,015.21 | | $9.66 | | 1.93% |
| Class I | | $1,000.00 | | $1,020.89 | | $3.94 | | 0.79% |
| Class R-3 | | $1,000.00 | | $1,017.93 | | $6.92 | | 1.38% |
| Class R-5 | | $1,000.00 | | $1,020.91 | | $3.92 | | 0.78% |
| Eagle Small Cap Core Value Fund | | | | | | | | |
| Class A | | $1,000.00 | | $1,017.36 | | $7.50 | | 1.50% |
| Class C | | $1,000.00 | | $1,013.39 | | $11.48 | | 2.30% |
| Class I | | $1,000.00 | | $1,020.08 | | $4.76 | | 0.95% |
| Class R-3 | | $1,000.00 | | $1,016.39 | | $8.47 | | 1.69% |
| Class R-5 | | $1,000.00 | | $1,020.04 | | $4.80 | | 0.95% |
| Eagle Small Cap Growth Fund | | | | | | | | |
| Class A | | $1,000.00 | | $1,018.35 | | $6.50 | | 1.30% |
| Class C | | $1,000.00 | | $1,014.52 | | $10.35 | | 2.07% |
| Class I | | $1,000.00 | | $1,020.67 | | $4.16 | | 0.83% |
| Class R-3 | | $1,000.00 | | $1,017.00 | | $7.86 | | 1.57% |
| Class R-5 | | $1,000.00 | | $1,020.42 | | $4.42 | | 0.88% |
(a) Expenses are calculated using each Funds’ annualized expense ratios for each class of shares, multiplied by the average account value for the period, then multiplying the result by the actual number of days in the period (181); and then dividing that result by the actual number of days in the fiscal year (365).
Principal Risks
The greatest risk of investing in a mutual fund is that its returns will fluctuate and you could lose money. Turbulence in financial markets and reduced liquidity in equity, credit and fixed income markets may negatively affect many issuers worldwide, which could have an adverse effect on the funds. The following table identifies the primary risk factors of each fund in light of their respective principal investment strategies. These risk factors are explained following the table.
| | | | | | | | | | | | | | | | | | |
| | | Eagle
Capital
Appreciation
Fund | | Eagle
Growth
& Income
Fund | | Eagle
International
Equity
Fund | | Eagle
Investment
Grade Bond
Fund | | Eagle
Large Cap
Core
Fund | | Eagle
Mid Cap
Growth
Fund | | Eagle
Mid Cap
Stock
Fund | | Eagle
Small Cap
Core Value
Fund | | Eagle
Small Cap
Growth
Fund |
| Call | | | | | | | | X | | | | | | | | | | |
| Covered call options | | | | X | | | | | | | | | | | | | | |
| Credit | | | | X | | X | | X | | | | | | | | | | |
| Derivatives | | | | | | X | | | | | | | | | | | | |
| Emerging markets | | | | | | X | | | | | | | | | | | | |
| Focused holdings | | X | | | | | | | | X | | | | | | | | |
| Foreign securities | | | | X | | X | | X | | | | | | | | | | |
| Govt sponsored enterprises | | | | X | | | | X | | | | | | | | | | |
| Growth stocks | | X | | X | | X | | | | X | | X | | X | | X | | X |
| High-yield securities | | | | X | | X | | X | | | | | | | | | | |
| Inflation | | | | | | | | X | | | | | | | | | | |
| Interest rates | | | | X | | X | | X | | | | | | | | | | |
| Issuer and market | | | | | | | | X | | | | | | | | | | |
| Liquidity | | | | | | X | | X | | | | | | | | | | |
| Market timing activities | | | | X | | X | | | | | | | | | | X | | X |
| Mortgage- and asset-backed securities | | | | | | | | X | | | | | | | | | | |
| Other investment companies and ETFs | | | | | | X | | X | | | | | | | | X | | |
| Portfolio turnover | | | | | | X | | | | | | X | | X | | | | |
| Sectors | | X | | | | X | | | | X | | | | X | | | | |
| Small- and mid-cap companies | | X | | X | | X | | | | | | X | | X | | X | | X |
| Stock market | | | | X | | X | | | | X | | X | | X | | X | | X |
| Value stocks | | | | X | | | | | | X | | | | X | | X | | |
Call | Call risk is the possibility that, as interest rates decline, issuers of callable bonds may call fixed income securities with high interest rates prior to their maturity dates.
Covered call options | Covered call option risk arises due to potential changes in the value of the stock on which the option is written.
Credit | Credit risk arises if an issuer of a fixed income security is unable to meet its financial obligations or goes bankrupt.
Derivatives | Derivative risk is the risk that the strategy used in purchasing futures contracts, forward foreign currency contract and options on futures may not succeed.
Emerging markets | Emerging markets risk arises because emerging markets are generally smaller, less developed, less liquid and more volatile than the securities markets of the U.S. and developed markets. Additionally, risk arises because investing in emerging markets has greater social, political and economic uncertainty, dependence on foreign aid and a limited number of buyers.
Focused holdings | Focused holdings risk is the risk of a fund holding a core portfolio of stocks of fewer companies than other diversified funds.
Foreign securities | Foreign security risk is the risk of instability in currency exchange rates, political unrest, economic conditions or foreign law changes.
Principal Risks
Government sponsored enterprises | Government Sponsored Enterprises (“GSE”) (which are obligations issued by agencies and instrumentalities of the U.S. Government) risk is due to investments in GSEs have variations in the level of support they receive from the U.S. Government.
Growth stocks | Growth stock risk is the risk of a lack of earnings increase or lack of dividend yield.
High-yield securities | High-yield security risk results from investments in below investment grade bonds, which have a greater risk of loss of money, are susceptible to rising interest rates and have greater volatility.
Inflation | Inflation risk is the risk that high rates of inflation or changes in the market’s inflation expectations may adversely affect the market value of inflation-sensitive securities.
Interest rates | Interest rate risk is the risk that the value of a fund’s investments in fixed income securities will fall when interest rates rise. The effect of increasing interest rates is more pronounced for any intermediate-term or longer-term fixed income obligations owned by a fund.
Issuer and market | Issuer and market risk is the risk that market conditions or other events that impact specific fixed-income issuers will have an adverse effect on the fund’s yield.
Liquidity | Liquidity risk is the possibility that, during times of widespread market turbulence, trading activity in certain securities may be significantly hampered, which may reduce the returns of the fund because it may be unable to sell the illiquid securities at an advantageous price or time.
Market timing activities | Market timing risk arises because a fund’s value may be affected by market timing, especially in high-yield and foreign securities.
Mortgage- and asset-backed securities | Mortgage- and asset-backed security risk, which is possible in an unstable or depressed housing market, arises from the potential for mortgage failure or premature repayment of principal.
Other investment companies and ETFs | Investing in other investment companies and exchange-traded funds (“ETFs”) carries with it the risk that by investing in another investment company or ETF the fund, and therefore its shareholders, indirectly bear the fund’s proportionate share of the fees and expenses paid by shareholders of the other investment company or ETF, in addition to the fees and expenses fund shareholders directly bear in connection with the fund’s own operations.
Portfolio turnover | Portfolio turnover risk is the risk that performance may be adversely affected by a high rate of portfolio turnover, which generally leads to greater transaction and tax costs.
Sectors | Sector risk is the risk of a fund holding a core portfolio of stocks invested in similar businesses which could all be affected by the same economic or market conditions.
Small- and mid-cap companies | Investments in small- and mid-cap companies may have narrower commercial markets, less liquidity and less financial resources than large-cap companies.
Stock market | Stock market risk is the risk of broad stock market decline or decline in particular holdings.
Value stocks | Value stock risk arises from the possibility that a stock’s true value may not be fully realized by the market.

eDelivery is the most convenient, economical and
environmentally-conscious way to receive information about your fund.
To enroll, please visit
eagleasset.com/eDelivery
Please consider the investment objectives, risks, charges and expenses of any fund carefully before investing. Contact Eagle at 800.421.4184 or your financial advisor for a prospectus, which contains this and other important information about the Funds. Read the prospectus carefully before you invest or send money.
This report is for the information of shareholders of the Eagle Mutual Funds. If you wish to review additional information on the portfolio holdings of a fund, a complete schedule has been filed with the Securities and Exchange Commission (“Commission”) for the first and third quarters of each fund’s fiscal year end on Form N-Q. These filings are available on the Commission’s website at www.sec.gov and may be reviewed and copied at the Commission’s Public Reference Room in Washington, D.C. Information on the operations of the Public Reference Room may be obtained by calling 800.SEC.0330. A description of each fund’s proxy voting policies, procedures and information regarding how each fund voted proxies relating to portfolio securities during the 12-month period ended June 30, 2009, is available without charge, upon request, by calling the Eagle Family of Funds, toll-free at the number above, by accessing our website at eagleasset. com or by accessing the Commission’s website at www.sec.gov.
727.567.8143 | 800.421.4184
Eagle Fund Distributors, Inc., Member FINRA | Not FDIC Insured | May Lose Value | No Bank Guarantee
Not applicable to semi-annual reports.
| Item 3. | Audit Committee Financial Expert |
Not applicable to semi-annual reports.
| Item 4. | Principal Accountant Fees and Services |
Not applicable to semi-annual reports.
| Item 5. | Audit Committee of Listed Registrants |
Not applicable to the registrant.
| Item 6. | Schedule of Investments |
Included as part of report to shareholders under Item 1.
| Item 7. | Disclosure of Proxy Voting Policies and Procedures for Closed-end Management Investment Companies |
Not applicable to the registrant.
| Item 8. | Portfolio Managers of Closed-End Management Investment Companies |
Not applicable to the registrant.
| Item 9. | Purchases of Equity Securities by Closed-End Management Investment Company and Affiliated Purchasers |
Not applicable to the registrant.
| Item 10. | Submission of Matters to a Vote of Security Holders |
There have been no material changes to the Nominating Committee Charter, which sets forth procedures by which shareholders may recommend nominees to the Trust’s Board of Trustees, since the Trust last provided disclosure in response to this item.
| Item 11. | Controls and Procedures |
| (a) | Based on an evaluation of the disclosure controls and procedures (as defined in Rule 30a-3(c) under the Investment Company Act of 1940, as amended), the Principal Executive Officer and Principal Financial Officer of Eagle Growth & Income Fund have concluded that such disclosure controls and procedures are effective as of June 22, 2010. |
| (b) | There was no change in the internal controls over financial reporting (as defined in Rule 30a-3(d)) of Eagle Growth & Income Fund that occurred during the second fiscal quarter of the period covered by this report that has materially affected, or is reasonably likely to materially affect, its internal control over financial reporting. |
| | |
| |
| (a)(1) | | Not applicable to semi-annual reports. |
| |
| (a)(2) | | The certifications required by Rule 30a-2(a) of the Investment Company Act of 1940, as amended, and Section 302 of the Sarbanes-Oxley Act of 2002 is filed and attached hereto as Exhibit 99.CERT. |
| |
| (a)(3) | | Not applicable to the registrant. |
| |
| (b) | | The certification required by Rule 30a-2(b) of the Investment Company Act of 1940, as amended, and Section 906 of the Sarbanes-Oxley Act of 2002 is filed and attached hereto as Exhibit 99.906CERT. |
SIGNATURES
Pursuant to the requirements of the Securities Exchange Act of 1934 and the Investment Company Act of 1940, the registrant has duly caused this report to be signed on its behalf by the undersigned, thereunto duly authorized.
| | | | |
| Date: June 22, 2010 | | | | EAGLE GROWTH & INCOME FUND |
| | |
| | | | | /S/ J. COOPER ABBOTT |
| | | | J. Cooper Abbott |
| | | | Principal Executive Officer |
Pursuant to the requirements of the Securities Exchange Act of 1934 and the Investment Company Act of 1940, this report has been signed below by the following persons on behalf of the registrant and in the capacities and on the dates indicated.
| | | | |
| Date: June 22, 2010 | | | | EAGLE GROWTH & INCOME FUND |
| | |
| | | | | /S/ J. COOPER ABBOTT |
| | | | J. Cooper Abbott |
| | | | Principal Executive Officer |
| | | | |
| Date: June 22, 2010 | | | | |
| | |
| | | | | /S/ M. LISA CRATER |
| | | | M. Lisa Crater |
| | | | Principal Financial Officer |