UNITED STATES
SECURITIES AND EXCHANGE COMMISSION
Washington, D.C. 20549
FORM N-CSR
CERTIFIED SHAREHOLDER REPORT OF REGISTERED
MANAGEMENT INVESTMENT COMPANIES
Investment Company Act File Number: 811-04525
| T. Rowe Price California Tax-Free Income Trust |
| (Exact name of registrant as specified in charter) |
| 100 East Pratt Street, Baltimore, MD 21202 |
| (Address of principal executive offices) |
| David Oestreicher |
| 100 East Pratt Street, Baltimore, MD 21202 |
| (Name and address of agent for service) |
Registrant’s telephone number, including area code: (410) 345-2000
Date of fiscal year end: February 28
Date of reporting period: August 31, 2015
Item 1. Report to Shareholders
 |
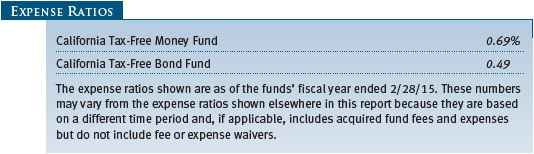
| California Tax-Free Money Fund | August 31, 2015 |
The views and opinions in this report were current as of August 31, 2015. They are not guarantees of performance or investment results and should not be taken as investment advice. Investment decisions reflect a variety of factors, and the managers reserve the right to change their views about individual stocks, sectors, and the markets at any time. As a result, the views expressed should not be relied upon as a forecast of the fund’s future investment intent. The report is certified under the Sarbanes-Oxley Act, which requires mutual funds and other public companies to affirm that, to the best of their knowledge, the information in their financial reports is fairly and accurately stated in all material respects.
REPORTS ON THE WEB
Sign up for our E-mail Program, and you can begin to receive updated fund reports and prospectuses online rather than through the mail. Log in to your account at troweprice.com for more information.
Manager’s Letter
Fellow Shareholders
Tax-free municipal bonds posted modestly positive results in the six-month period ended August 31, 2015, outperforming taxable bonds. Munis are one of the best-performing asset classes year-to-date, as global markets and other higher-risk assets have fallen sharply in recent months in response to China’s economic deceleration and tumbling commodity prices. Tax-free and taxable money market rates remained close to 0.00%, as the Federal Reserve continues to defer raising short-term rates. While there was little performance difference among short-, intermediate-, and long-term securities, higher-quality municipals outpaced lower-quality issues. The California Tax-Free Money Fund performed in line with other money funds in the last six months, while the California Tax-Free Bond Fund slightly outperformed its Lipper group benchmark. The funds’ longer-term relative performance records remained favorable.
ECONOMY AND INTEREST RATES
The economy improved from sluggish first-quarter growth, expanding at an annualized pace of 3.7% in the second quarter of 2015, according to the most recent estimates. The labor market continued to improve, with solid job gains driving the national unemployment rate down to 5.1% in August, its lowest level since 2008. Inflation is likely to remain very low in the near term due to recent declines in oil and other commodity prices. Lower energy costs bode well for consumer spending in the second half of the year. While recent global financial market volatility has given the Federal Reserve pause, the Fed still seems to be on track to begin raising short-term U.S. interest rates at some point in the months ahead. Subsequent rate hikes are expected to be very gradual.

There were large fluctuations in U.S. Treasury and municipal yields during the reporting period in anticipation of the onset of tighter Fed monetary policy and as a result of turmoil in global markets. Both the U.S. Treasury and municipal yield curves steepened over the period, though long-term municipal yields did not rise as much as their Treasury counterparts with similar maturities. At the end of the reporting period, 30-year municipal bonds yielded more than comparable-maturity Treasuries, making them attractive versus taxable bonds as an alternative for taxable fixed income investors.
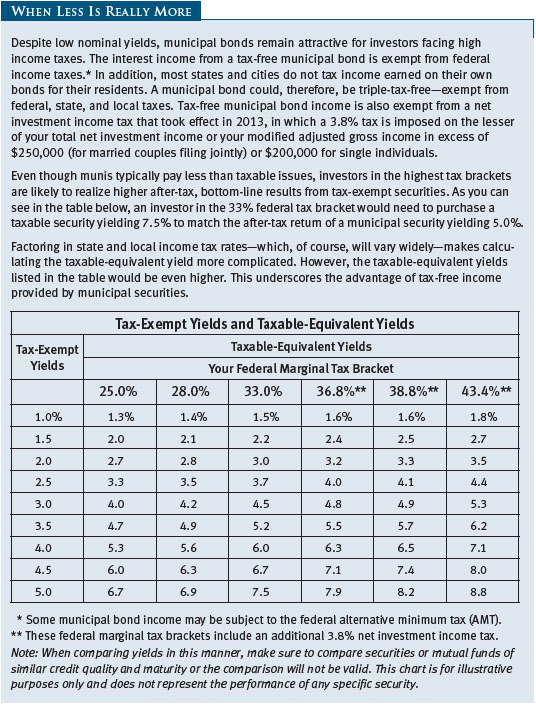
As an illustration of their relative attractiveness, on August 31, 2015, the 3.10% yield offered by a 30-year tax-free general obligation (GO) bond rated AAA was about 105% of the 2.95% pretax yield offered by a 30-year Treasury bond. Including the 3.80% net investment income tax that took effect in 2013 as part of the Affordable Care Act, the top marginal federal tax rate currently stands at 43.40%. An investor in this tax bracket would need to invest in a taxable bond yielding about 5.48% to receive the same after-tax income as that generated by the municipal bond. (To calculate a municipal bond’s taxable-equivalent yield, divide the yield by the quantity of 1.00 minus your federal tax bracket expressed as a decimal—in this case, 1.00 – 0.434, or 0.566.)
MUNICIPAL MARKET NEWS
In the first eight months of 2015, total municipal bond issuance was $289 billion, according to The Bond Buyer, a substantial year-over-year increase. Refunding debt has been rising significantly, as muni issuers have been taking advantage of cheap borrowing costs to refinance older, higher-cost debt. Inflows into the muni market in the first quarter of the year transitioned into a slow but steady pace of outflows during the summer months, though demand from individual investors has been picking up in response to higher muni yields. Overall, flows remain positive year-to-date.
With a few exceptions, fundamentals for municipal issuers remain solid overall. The overwhelming number of issuers in the $3.7 trillion municipal bond market are acting responsibly—raising revenues, reducing expenses, balancing budgets, and taking steps to address long-term liability issues. Most state and local governments have been very cautious about adding to indebtedness since the financial crisis, and a strengthening economy has helped tax revenues rebound. Over 60% of the market is AAA or AA rated, as measured by the Barclays Municipal Bond Index.
Although the market is overwhelmingly high quality, many states and municipalities are grappling with underfunded pensions and other post-employment benefit (OPEB) obligations. Investors often overlooked this long-term risk in the past. We believe the market will increasingly recognize pension risks over time, as the magnitude of unfunded liabilities becomes more conspicuous. New reporting rules from the Governmental Accounting Standards Board are bringing greater transparency to state and local governments’ pension funding gaps.
For example, in the last six months, Chicago’s financial problems, highlighted by an underfunded pension system and other considerations, drew increasing attention after the city’s general obligation debt was downgraded to below investment-grade status by Moody’s in May. The timing of the move by Moody’s came just as the Illinois state supreme court reversed steps toward pension reform that had recently been introduced in the state. In July, Chicago’s plan to reform a portion of its underfunded pension system was similarly struck down by an Illinois circuit court judge, who ruled that the proposed changes diminish pension benefits for individual workers and violate the state constitution, which led to further credit spread widening for both the city and the state. We have no exposure to general obligation debt issued by Chicago, and the recent developments in the city reinforce our bias for revenue bonds that are more insulated from the pension funding risks faced by GO debt.
Puerto Rico was also in the headlines during our reporting period. In late June, Governor Alejandro García Padilla conceded that the U.S. territory could not continue servicing its roughly $72 billion in public debt. The commonwealth subsequently experienced its first official default when it failed to make the full payment due on its Public Finance Corporation bonds at the beginning of August. While this event weighed on the high yield muni index, contagion in the broad muni market has been limited. After our reporting period ended, the commonwealth released a fiscal and economic growth plan that will likely entail a debt restructuring, as the priority of paying debt service as scheduled was notably absent from the plan. T. Rowe Price’s municipal team has maintained for some time that Puerto Rico’s debt burden is unsustainable and will eventually need to be restructured, and our municipal bond portfolios have had very little exposure to the commonwealth’s bonds for some time.
In terms of sector performance, revenue bonds outperformed GOs over the last six months. We continue to favor bonds backed by a dedicated revenue stream over GOs, with a preference for higher-yielding health care and transportation debt. Among revenue bonds, housing, hospital, and water and sewer bonds posted the strongest performance, while leasing was the only revenue sector to post negative returns. High yield tobacco performed particularly well over the period, outpacing the broad municipal market by a wide margin.
CALIFORNIA MARKET NEWS
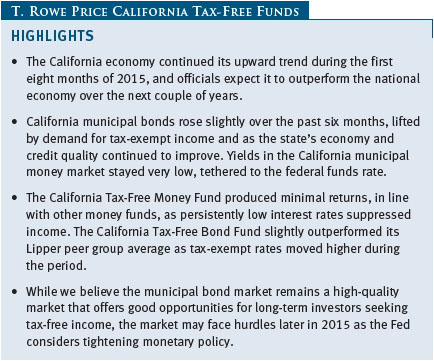
The California economy continued its upward trend during the first eight months of 2015, and officials expect it to outperform the national economy over the next couple of years. However, California’s economy declined more during the recession than the United States as a whole, and the state is recovering from a lower base. The unemployment rate fell to 6.2%, the lowest monthly rate since March 2008. Meanwhile, the state’s total nonfarm employment level rose 4.2% in July 2015 compared with the same period in 2014, reaching 16.1 million jobs. The improvement in employment was broad-based. Nonetheless, the gains were led by the professional and business services sector, which increased 6.5%, thanks to the high-technology and leisure and hospitality industries. State officials project nonfarm employment will increase 2.6% and 2.4% in 2015 and 2016, respectively. This compares with projected national rates of 2.1% and 1.5%, respectively.
California’s General Fund budget for fiscal year 2016 is estimated to have $117.5 billion in total available resources and $115.4 billion in total expenditures, which provides a balance of $2.1 billion. In addition, state officials estimate that the Rainy Day Fund has a balance of $3.5 billion, for total reserves of $5.6 billion. As of August 1, 2015, the state had $86.9 billion of General Fund-supported debt outstanding, of which $75.9 billion consisted of GO bonds, and $11.0 billion of lease-revenue bonds. Moody’s and Fitch maintained an Aa3 and A+ rating, respectively, on the state’s GO bonds. Both agencies upheld their stable outlooks as well.
In July 2015, Standard & Poor’s upgraded its rating for the GO bonds to AA- and assigned a stable outlook. Lease-revenue bonds are typically rated one or two notches below GO bonds.
PORTFOLIO STRATEGIES
California Tax-Free Money Fund
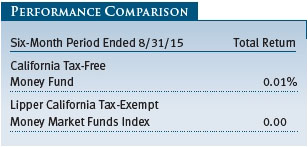
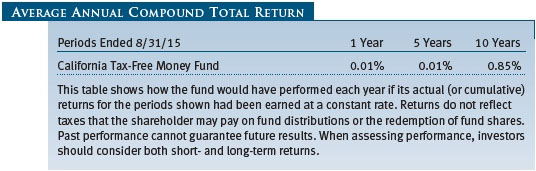
The California Tax-Free Money Fund returned 0.01% for the six months ended August 31, 2015, beating the Lipper California Tax-Exempt Money Market Funds Index during the period. All money market rates remain closely tied to the fed funds target range of 0.00% to 0.25%.
Persistently low interest rates continued to suppress income for money market fund investors. With the U.S. economy improving, many market observers have concluded that the Fed, which has kept short-term interest rates near 0% since the 2008 financial crisis, will start tightening monetary policy sometime in 2015. However, the municipal money market has yet to price in this sentiment.
Over the past six months, spreads between California money market securities and those with Treasuries with similar maturities continued to widen. Yields on California money market securities remain constrained near zero, unlike their taxable counterparts, which have risen somewhat over the reporting period. Overnight yields remained largely unchanged, stuck at 0.01%, while yields on one-year offerings moved higher by about seven basis points to 0.23%. The move reflects expectations for higher interest rates. However, supply and demand imbalances, resulting from an era of historically low rates, continue to dominate the tax-exempt market. As we have noted in prior shareholder letters, municipal issuers have restructured much of their borrowing to lock in favorable long-term financing rates and reduce their exposure to short-term rate increases. The supply of variable rate demand notes (VRDN) is currently around $239 billion, down 57.7% from the 2007 highs of $565 billion. The result has been dramatic. For the first time in many years, total municipal money market assets under management—$247 billion—is higher than the outstanding VRDN supply. This imbalance helps explain the near-zero yields that persist on short-dated munis.
Better economic conditions are also having an impact on supply. Municipalities have seen revenues increase over the last couple of years, reducing their need for short-term borrowing. As a result, two of the largest issuers of revenue anticipation notes, Texas and California, will not bring new deals to market this year. This is good news for municipalities but bad news for money funds, as both issuers are well-known, liquid names owned by a large number of money market funds. Other issuers are also reducing their borrowing. The result is a further reduction in money market supply—as overall note issuance is expected to decrease by at least 20% this year.
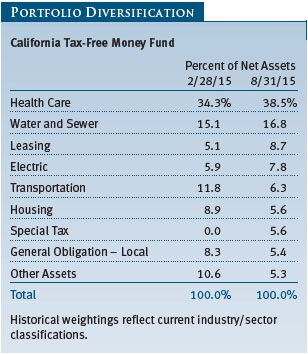
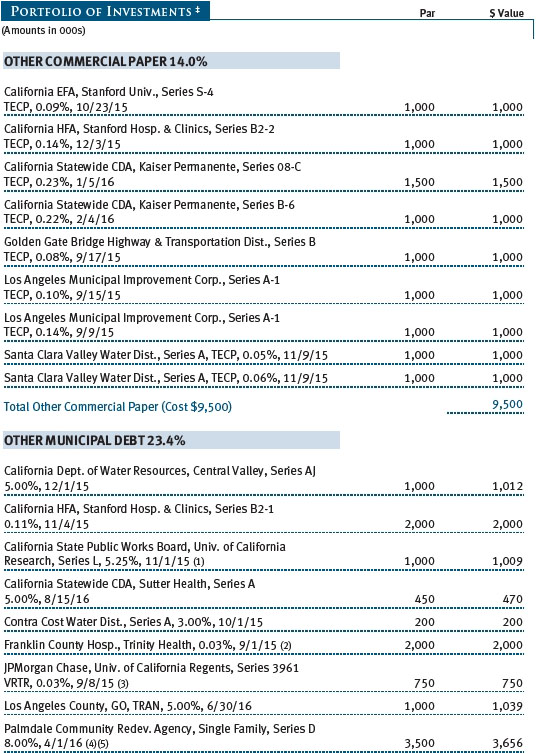
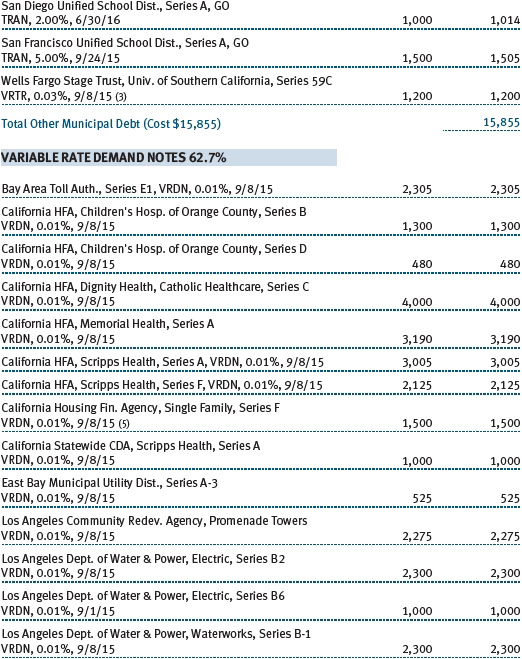
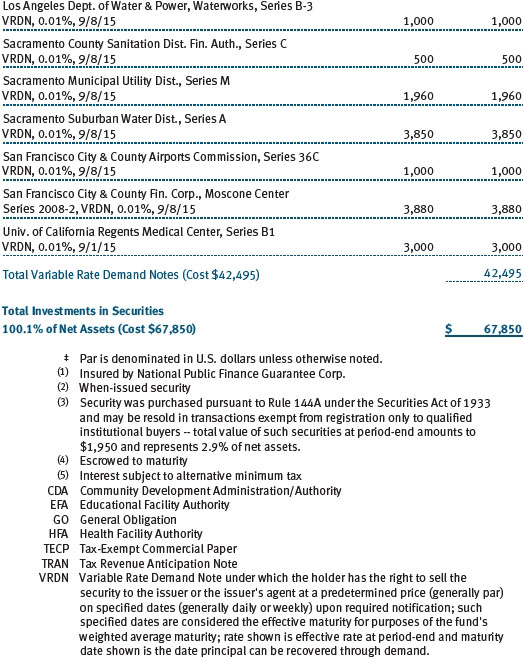
As revenues improve for municipalities so does credit quality, which plays a large role in the management of the California Tax-Free Money Fund. As a policy, we favor highly rated credits such as hospital, water and sewer, and lease-revenue bonds. Some prominent positions in the portfolio include Memorial Health Services, Los Angeles Department of Water, and Los Angeles Municipal Improvement District. Given the opportunity, we always prefer prerefunded bonds. (Please refer to the fund’s portfolio of investments for a complete list of holdings and the amount each represents in the portfolio.)
While the Fed has started removing monetary accommodations, the path toward rate normalization is expected to be long and slow. As always, we remain committed to managing a highly liquid, diversified portfolio focused on liquidity and stability of principal, which we deem of utmost importance to our valued shareholders.
Finally, as we have discussed previously, the Securities and Exchange Commission rule changes affecting money market funds are expected to become effective in October 2016. T. Rowe Price is currently reviewing these rules changes and their ramifications for shareholders. For most shareholders, there will be only a minimal change to their investments. We intend to continue offering a full range of investing solutions and will write more about this important topic as the situation unfolds.
California Tax-Free Bond Fund
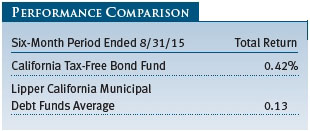
Your fund returned 0.42% for the six months ended August 31, 2015, beating its Lipper peer average, as tax-exempt rates moved higher during the period. The fund’s relative outperformance was driven by our emphasis on revenue bonds over general obligation debt and strong security selection coming from the health care and education segments of the market. Demand for California municipal bonds was firm as the state’s credit quality and its economy continued to improve.
The fund’s duration was unchanged from our last report, ending the period slightly longer than the duration of the Barclays benchmark at five years.
As for yield curve positioning, we maintained an overweight relative to the benchmark in maturities of 15 years and longer in order to capture the additional yield offered in that segment of the yield curve.
Our yield curve emphasis continues to be on the long-maturity end, a positioning that has aided returns over longer time periods. We believe the yield curve will flatten modestly in the coming months as the Fed raises short-term rates. Returns were generally flat across the yield curve during the six-month period, in contrast to the prior six months when the long end of the curve outperformed.
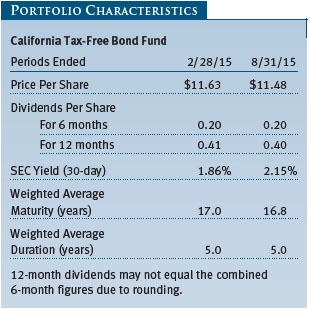
The fund’s sector weightings were little changed over the reporting period. As discussed in prior reports, the fund is overweight revenue-backed bonds and underweight in general obligation bonds, namely at the local GO level. Of note, the State of California remains the largest guarantor in the fund. The education sector increased to just below 7% over the period, with purchases including Azusa Pacific University, Chapman University, and the University of California. Health care remains the largest sector allocation, representing 22% of the fund’s assets, and is an area of the tax-exempt municipal market that typically offers higher-than-average yields. (Please refer to the fund’s portfolio of investments for a complete list of holdings and the amount each represents in the portfolio.)
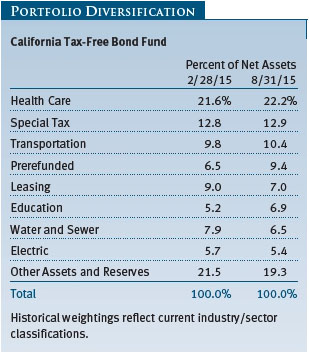
Prerefunded holdings increased by three percentage points, as a number of fund holdings were refinanced by their issuers and recategorized to this sector. Persistent low rates have enabled issuers to refinance older, high-cost debt at more favorable terms, creating a higher allocation of these high-quality securities in the portfolio. Prerefunded holdings are typically backed by an escrow of U.S. Treasury securities and represent a good hedge against rates moving higher, because most have maturities shorter than five years. This spike in prerefunded holdings partially contributed to a slight drop in average maturity to 16.8 years.
Shifts in the funds quality diversification were minimal. A rated holdings decreased by four percentage points, mostly as a result of the decisions by Moody’s and Standard & Poor’s to upgrade California’s GO credit rating into the AA category. AA rated credits compose the largest portion of the fund at 44%. New holdings were rated A and lower as we continue to believe they offer greater value than higher-quality alternatives.

With the fund’s nearly flat return for the period, holdings that fared best varied in structure and characteristics. A number of lower-rated holdings continued to perform well, as did bonds with near-term issuer prepayment options that were priced at or near par. As always, we will continue to focus on the best long-term prospects in the municipal market, driven by our fundamental research-based investment process.
OUTLOOK
We believe that the municipal bond market remains a high-quality market that offers good opportunities for long-term investors seeking tax-free income. While fundamentals are sound overall and technical support should persist, there could be hurdles later in 2015. In particular, with the Fed preparing to tighten monetary policy, we are mindful that rising rates would likely weaken the appetite for bonds with higher interest rate risk. However, with the Fed tending to act cautiously, the transition to higher rates may not be as painful as some fear.
While we believe that many states deserve high credit ratings and will be able to continue servicing their debts, we have longer-term concerns about significant funding shortfalls for pensions and OPEB obligations in some jurisdictions. These funding gaps stem from investment losses during the financial crisis, insufficient plan contributions over time, and unrealistic return projections. Although few large plans are at risk of insolvency in the near term, the magnitude of unfunded liabilities is becoming more conspicuous in a few states.
Ultimately, we believe T. Rowe Price’s independent credit research is our greatest strength and will remain an asset for our investors as we navigate the current market environment. As always, we focus on finding attractively valued bonds issued by municipalities with good long-term fundamentals—an investment strategy that we believe will continue to serve our investors well.
Respectfully submitted,

Joseph K. Lynagh
Chairman of the Investment Advisory Committee
California Tax-Free Money Fund

Konstantine B. Mallas
Chairman of the Investment Advisory Committee
California Tax-Free Bond Fund
September 22, 2015
The committee chairmen have day-to-day responsibility for managing the portfolios and work with committee members in developing and executing the funds’ investment programs.
RISKS OF INVESTING
Since money market funds are managed to maintain a constant $1.00 share price, there should be little risk of principal loss. However, there is no assurance the fund will avoid principal losses if fund holdings default or are downgraded or if interest rates rise sharply in an unusually short period. In addition, the fund’s yield will vary; it is not fixed for a specific period like the yield on a bank certificate of deposit. An investment in the fund is not insured or guaranteed by the Federal Deposit Insurance Corporation (FDIC) or any other government agency. Although a money market fund seeks to preserve the value of your investment at $1.00 per share, it is possible to lose money by investing in it.
Bonds are subject to interest rate risk (the decline in bond prices that usually accompanies a rise in interest rates) and credit risk (the chance that any fund holding could have its credit rating downgraded or that a bond issuer will default by failing to make timely payments of interest or principal), potentially reducing the fund’s income level and share price. The fund is less diversified than one investing nationally. Some income may be subject to state and local taxes and the federal alternative minimum tax.
GLOSSARY
Barclays Municipal Bond Index: A broadly diversified index of tax-exempt bonds.
Basis point: One one-hundredth of one percentage point, or 0.01%.
Duration: A measure of a bond fund’s sensitivity to changes in interest rates. For example, a fund with a duration of five years would fall about 5% in price in response to a one-percentage-point rise in interest rates, and vice versa.
Federal funds rate: The interest rate charged on overnight loans of reserves by one financial institution to another in the United States. The Federal Reserve sets a target federal funds rate to affect the direction of interest rates.
General obligation (GO) debt: A government’s strongest pledge that obligates its full faith and credit, including, if necessary, its ability to raise taxes.
Gross domestic product: The total market value of all goods and services produced in a country in a given year.
Lipper indexes: Fund benchmarks that consist of a small number (10 to 30) of the largest mutual funds in a particular category as tracked by Lipper Inc.
Lipper averages: The averages of available mutual fund performance returns for specified time periods in categories defined by Lipper Inc.
Other post-employment benefits (OPEB) liability: Benefits paid to an employee after retirement, such as premiums for life and health insurance.
Prerefunded bond: A bond that originally may have been issued as a general obligation or revenue bond but that is now secured by an escrow fund consisting entirely of direct U.S. government obligations that are sufficient for paying the bondholders.
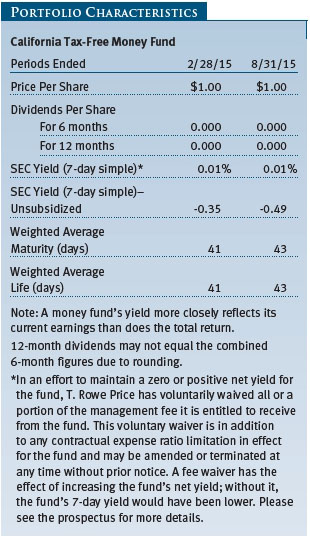
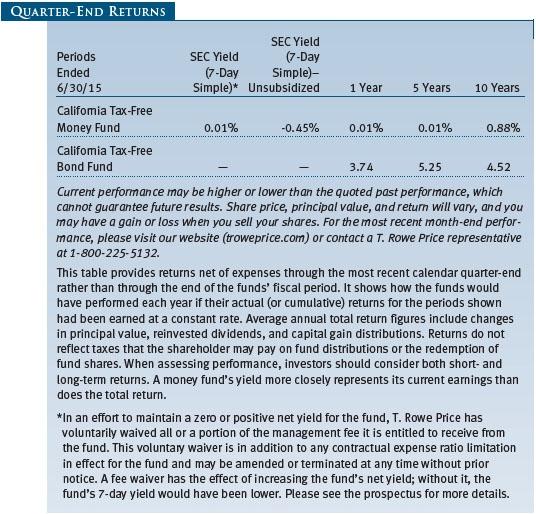
SEC yield (7-day simple): A method of calculating a money fund’s yield by annualizing the fund’s net investment income for the last seven days of each period divided by the fund’s net asset value at the end of the period. Yield will vary and is not guaranteed.
SEC yield (30-day): A method of calculating a fund’s yield that assumes all portfolio securities are held until maturity. The Securities and Exchange Commission (SEC) requires all bond funds to calculate this yield. Yield will vary and is not guaranteed.
Weighted average life: A measure of a fund’s credit quality risk. In general, the longer the average life, the greater the fund’s credit quality risk. The average life is the dollar-weighted average maturity of a portfolio’s individual securities without taking into account interest rate readjustment dates. Money funds must maintain a weighted average life of less than 120 days.
Weighted average maturity: A measure of a fund’s interest rate sensitivity. In general, the longer the average maturity, the greater the fund’s sensitivity to interest rate changes. The weighted average maturity may take into account the interest rate readjustment dates for certain securities. Money funds must maintain a weighted average maturity of less than 60 days.
Yield curve: A graphic depiction of the relationship between yields and maturity dates for a set of similar securities. A security with a longer maturity usually has a higher yield. If a short-term security offers a higher yield, then the curve is said to be “inverted.” If short- and long-term bonds are offering equivalent yields, then the curve is said to be “flat.”
Performance and Expenses
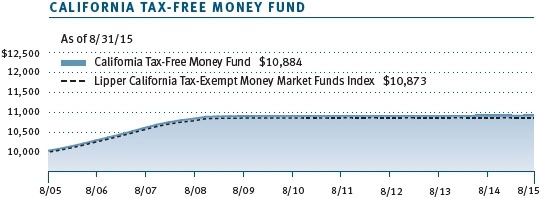
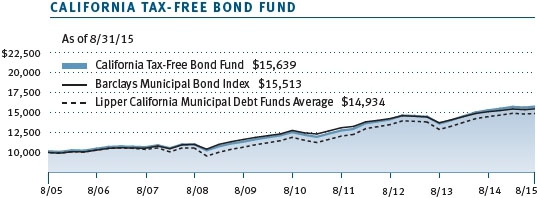
| Growth of $10,000 |
This chart shows the value of a hypothetical $10,000 investment in the fund over the past 10 fiscal year periods or since inception (for funds lacking 10-year records). The result is compared with benchmarks, which may include a broad-based market index and a peer group average or index. Market indexes do not include expenses, which are deducted from fund returns as well as mutual fund averages and indexes.
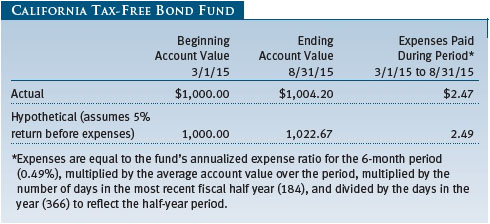
| Fund Expense Example |
As a mutual fund shareholder, you may incur two types of costs: (1) transaction costs, such as redemption fees or sales loads, and (2) ongoing costs, including management fees, distribution and service (12b-1) fees, and other fund expenses. The following example is intended to help you understand your ongoing costs (in dollars) of investing in the fund and to compare these costs with the ongoing costs of investing in other mutual funds. The example is based on an investment of $1,000 invested at the beginning of the most recent six-month period and held for the entire period.
Actual Expenses
The first line of the following table (Actual) provides information about actual account values and expenses based on the fund’s actual returns. You may use the information on this line, together with your account balance, to estimate the expenses that you paid over the period. Simply divide your account value by $1,000 (for example, an $8,600 account value divided by $1,000 = 8.6), then multiply the result by the number on the first line under the heading “Expenses Paid During Period” to estimate the expenses you paid on your account during this period.
Hypothetical Example for Comparison Purposes
The information on the second line of the table (Hypothetical) is based on hypothetical account values and expenses derived from the fund’s actual expense ratio and an assumed 5% per year rate of return before expenses (not the fund’s actual return). You may compare the ongoing costs of investing in the fund with other funds by contrasting this 5% hypothetical example and the 5% hypothetical examples that appear in the shareholder reports of the other funds. The hypothetical account values and expenses may not be used to estimate the actual ending account balance or expenses you paid for the period.
Note: T. Rowe Price charges an annual account service fee of $20, generally for accounts with less than $10,000. The fee is waived for any investor whose T. Rowe Price mutual fund accounts total $50,000 or more; accounts electing to receive electronic delivery of account statements, transaction confirmations, prospectuses, and shareholder reports; or accounts of an investor who is a T. Rowe Price Preferred Services, Personal Services, or Enhanced Personal Services client (enrollment in these programs generally requires T. Rowe Price assets of at least $100,000). This fee is not included in the accompanying table. If you are subject to the fee, keep it in mind when you are estimating the ongoing expenses of investing in the fund and when comparing the expenses of this fund with other funds.
You should also be aware that the expenses shown in the table highlight only your ongoing costs and do not reflect any transaction costs, such as redemption fees or sales loads. Therefore, the second line of the table is useful in comparing ongoing costs only and will not help you determine the relative total costs of owning different funds. To the extent a fund charges transaction costs, however, the total cost of owning that fund is higher.
Unaudited
The accompanying notes are an integral part of these financial statements.
Unaudited
The accompanying notes are an integral part of these financial statements.
Unaudited
The accompanying notes are an integral part of these financial statements.
Unaudited
The accompanying notes are an integral part of these financial statements.
Unaudited

The accompanying notes are an integral part of these financial statements.
Unaudited
| Notes to Financial Statements |
T. Rowe Price California Tax-Free Income Trust (the trust), is registered under the Investment Company Act of 1940 (the 1940 Act). The California Tax-Free Money Fund (the fund) is a diversified, open-end management investment company established by the trust. The fund commenced operations on September 15, 1986. The fund seeks to provide preservation of capital, liquidity, and, consistent with these objectives, the highest level of income exempt from federal and California state income taxes.
NOTE 1 - SIGNIFICANT ACCOUNTING POLICIES
Basis of Preparation The fund is an investment company and follows accounting and reporting guidance in the Financial Accounting Standards Board (FASB) Accounting Standards Codification Topic 946 (ASC 946). The accompanying financial statements were prepared in accordance with accounting principles generally accepted in the United States of America (GAAP), including but not limited to ASC 946. GAAP requires the use of estimates made by management. Management believes that estimates and valuations are appropriate; however, actual results may differ from those estimates, and the valuations reflected in the accompanying financial statements may differ from the value ultimately realized upon sale or maturity.
Investment Transactions, Investment Income, and Distributions Income and expenses are recorded on the accrual basis. Premiums and discounts on debt securities are amortized for financial reporting purposes. Income tax-related interest and penalties, if incurred, would be recorded as income tax expense. Investment transactions are accounted for on the trade date. Realized gains and losses are reported on the identified cost basis. Distributions to shareholders are recorded on the ex-dividend date. Income distributions are declared daily and paid monthly.
New Accounting Guidance In May 2015, FASB issued ASU No. 2015-07, Fair Value Measurement (Topic 820), Disclosures for Investments in Certain Entities That Calculate Net Asset Value per Share (or Its Equivalent). The ASU removes the requirement to categorize within the fair value hierarchy all investments for which fair value is measured using the net asset value per share practical expedient and amends certain disclosure requirements for such investments. The ASU is effective for interim and annual reporting periods beginning after December 15, 2015. Adoption will have no effect on the fund’s net assets or results of operations.
NOTE 2 - VALUATION
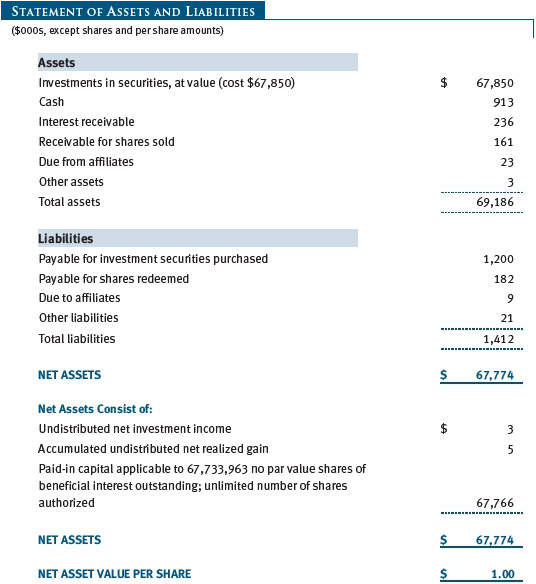
The fund’s financial instruments are valued and its net asset value (NAV) per share is computed at the close of the New York Stock Exchange (NYSE), normally 4 p.m. ET, each day the NYSE is open for business. The fund’s financial instruments are reported at fair value, which GAAP defines as the price that would be received to sell an asset or paid to transfer a liability in an orderly transaction between market participants at the measurement date. The T. Rowe Price Valuation Committee (the Valuation Committee) has been established by the fund’s Board of Trustees (the Board) to ensure that financial instruments are appropriately priced at fair value in accordance with GAAP and the 1940 Act. Subject to oversight by the Board, the Valuation Committee develops and oversees pricing-related policies and procedures and approves all fair value determinations.
Various valuation techniques and inputs are used to determine the fair value of financial instruments. GAAP establishes the following fair value hierarchy that categorizes the inputs used to measure fair value:
Level 1 – quoted prices (unadjusted) in active markets for identical financial instruments that the fund can access at the reporting date
Level 2 – inputs other than Level 1 quoted prices that are observable, either directly or indirectly (including, but not limited to, quoted prices for similar financial instruments in active markets, quoted prices for identical or similar financial instruments in inactive markets, interest rates and yield curves, implied volatilities, and credit spreads)
Level 3 – unobservable inputs
Observable inputs are developed using market data, such as publicly available information about actual events or transactions, and reflect the assumptions market participants would use to price the financial instrument. Unobservable inputs are those for which market data are not available and are developed using the best information available about the assumptions that market participants would use to price the financial instrument. GAAP requires valuation techniques to maximize the use of relevant observable inputs and minimize the use of unobservable inputs. Input levels are not necessarily an indication of the risk or liquidity associated with financial instruments at that level but rather the degree of judgment used in determining those values. For example, securities held by a money market fund are generally high quality and liquid; however, they are reflected as Level 2 because the inputs used to determine fair value are not quoted prices in an active market.
In accordance with Rule 2a-7 under the 1940 Act, the fund values its securities at amortized cost, which approximates fair value. Securities for which amortized cost is deemed not to reflect fair value are stated at fair value as determined in good faith by the Valuation Committee. On August 31, 2015, all of the fund’s financial instruments were classified as Level 2 in the fair value hierarchy.
NOTE 3 - OTHER INVESTMENT TRANSACTIONS
Consistent with its investment objective, the fund engages in the following practices to manage exposure to certain risks and/or to enhance performance. The investment objective, policies, program, and risk factors of the fund are described more fully in the fund’s prospectus and Statement of Additional Information.
Restricted Securities The fund may invest in securities that are subject to legal or contractual restrictions on resale. Prompt sale of such securities at an acceptable price may be difficult and may involve substantial delays and additional costs.
When-Issued Securities The fund may enter into when-issued purchase or sale commitments, pursuant to which it agrees to purchase or sell, respectively, an authorized but not yet issued security for a fixed unit price, with payment and delivery not due until issuance of the security on a scheduled future date. When-issued securities may be new securities or securities issued through a corporate action, such as a reorganization or restructuring. Until settlement, the fund maintains liquid assets sufficient to settle its commitment to purchase a when-issued security or, in the case of a sale commitment, the fund maintains an entitlement to the security to be sold. Amounts realized on when-issued transactions are included in realized gain/loss on securities in the accompanying financial statements.
NOTE 4 - FEDERAL INCOME TAXES
No provision for federal income taxes is required since the fund intends to continue to qualify as a regulated investment company under Subchapter M of the Internal Revenue Code and distribute to shareholders all of its income and gains. Distributions determined in accordance with federal income tax regulations may differ in amount or character from net investment income and realized gains for financial reporting purposes. Financial reporting records are adjusted for permanent book/tax differences to reflect tax character but are not adjusted for temporary differences. The amount and character of tax-basis distributions and composition of net assets are finalized at fiscal year-end; accordingly, tax-basis balances have not been determined as of the date of this report.
At August 31, 2015, the cost of investments for federal income tax purposes was $67,850,000.
NOTE 5 - RELATED PARTY TRANSACTIONS
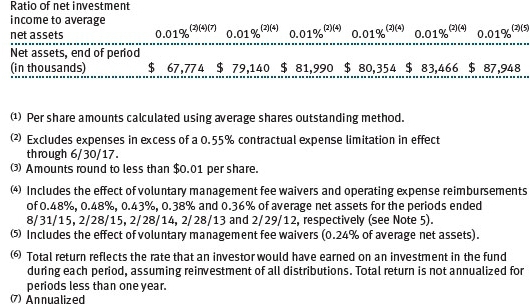
The fund is managed by T. Rowe Price Associates, Inc. (Price Associates), a wholly owned subsidiary of T. Rowe Price Group, Inc. (Price Group). The investment management agreement between the fund and Price Associates provides for an annual investment management fee, which is computed daily and paid monthly. The fee consists of an individual fund fee, equal to 0.10% of the fund’s average daily net assets, and a group fee. The group fee rate is calculated based on the combined net assets of certain mutual funds sponsored by Price Associates (the group) applied to a graduated fee schedule, with rates ranging from 0.48% for the first $1 billion of assets to 0.275% for assets in excess of $400 billion. The fund’s group fee is determined by applying the group fee rate to the fund’s average daily net assets. At August 31, 2015, the effective annual group fee rate was 0.29%.
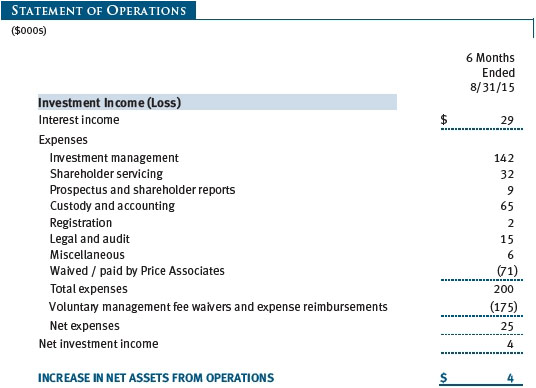
The fund is also subject to a contractual expense limitation through June 30, 2017. During the limitation period, Price Associates is required to waive its management fee and pay the fund for any expenses, excluding interest, taxes, brokerage commissions, and extraordinary expenses, that would otherwise cause the fund’s ratio of annualized total expenses to average net assets (expense ratio) to exceed its expense limitation of 0.55%. For a period of three years after the date of any payment or waiver, the fund may repay Price Associates for expenses previously paid and management fees waived to the extent its net assets grow or expenses decline sufficiently to allow repayment without causing the fund’s expense ratio to exceed its expense limitation. Such repayment is subject to shareholder approval. Pursuant to this agreement, $71,000 of expenses were waived/paid by Price Associates during the six months ended August 31, 2015. Including these amounts, management fees waived and expenses previously paid by Price Associates in the amount of $326,000 remain subject to repayment by the fund at August 31, 2015.
Price Associates may voluntarily waive all or a portion of its management fee and reimburse operating expenses to the extent necessary for the fund to maintain a zero or positive net yield (voluntary waiver). This voluntary waiver is in addition to the contractual expense limit in effect for the fund. Any amounts waived or reimbursed under this voluntary agreement are not subject to repayment by the fund. Price Associates may amend or terminate this voluntary arrangement at any time without prior notice. For the six months ended August 31, 2015, management fees waived and operating expenses reimbursed totaled $175,000.
In addition, the fund has entered into service agreements with Price Associates and a wholly owned subsidiary of Price Associates (collectively, Price). Price Associates provides certain accounting and administrative services to the fund. T. Rowe Price Services, Inc., provides shareholder and administrative services in its capacity as the fund’s transfer and dividend-disbursing agent. For the six months ended August 31, 2015, expenses incurred pursuant to these service agreements were $43,000 for Price Associates and $25,000 for T. Rowe Price Services, Inc. The total amount payable at period-end pursuant to these service agreements is reflected as Due to Affiliates in the accompanying financial statements.
| Information on Proxy Voting Policies, Procedures, and Records |
A description of the policies and procedures used by T. Rowe Price funds and portfolios to determine how to vote proxies relating to portfolio securities is available in each fund’s Statement of Additional Information. You may request this document by calling 1-800-225-5132 or by accessing the SEC’s website, sec.gov.
The description of our proxy voting policies and procedures is also available on our website, troweprice.com. To access it, click on the words “Social Responsibility” at the top of our corporate homepage. Next, click on the words “Conducting Business Responsibly” on the left side of the page that appears. Finally, click on the words “Proxy Voting Policies” on the left side of the page that appears.
Each fund’s most recent annual proxy voting record is available on our website and through the SEC’s website. To access it through our website, follow the above directions to reach the “Conducting Business Responsibly” page. Click on the words “Proxy Voting Records” on the left side of that page, and then click on the “View Proxy Voting Records” link at the bottom of the page that appears.
| How to Obtain Quarterly Portfolio Holdings |
The fund files a complete schedule of portfolio holdings with the Securities and Exchange Commission for the first and third quarters of each fiscal year on Form N-Q. The fund’s Form N-Q is available electronically on the SEC’s website (sec.gov); hard copies may be reviewed and copied at the SEC’s Public Reference Room, 100 F St. N.E., Washington, DC 20549. For more information on the Public Reference Room, call 1-800-SEC-0330.
| Approval of Investment Management Agreement |
On March 13, 2015, the fund’s Board of Directors (Board), including a majority of the fund’s independent directors, approved the continuation of the investment management agreement (Advisory Contract) between the fund and its investment advisor, T. Rowe Price Associates, Inc. (Advisor). In connection with its deliberations, the Board requested, and the Advisor provided, such information as the Board (with advice from independent legal counsel) deemed reasonably necessary. The Board considered a variety of factors in connection with its review of the Advisory Contract, also taking into account information provided by the Advisor during the course of the year, as discussed below:
Services Provided by the Advisor
The Board considered the nature, quality, and extent of the services provided to the fund by the Advisor. These services included, but were not limited to, directing the fund’s investments in accordance with its investment program and the overall management of the fund’s portfolio, as well as a variety of related activities such as financial, investment operations, and administrative services; compliance; maintaining the fund’s records and registrations; and shareholder communications. The Board also reviewed the background and experience of the Advisor’s senior management team and investment personnel involved in the management of the fund, as well as the Advisor’s compliance record. The Board concluded that it was satisfied with the nature, quality, and extent of the services provided by the Advisor.
Investment Performance of the Fund
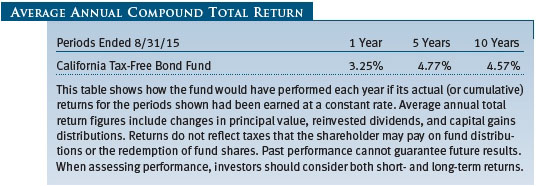
The Board reviewed the fund’s three-month, one-year, and year-by-year returns, as well as the fund’s average annualized total returns over the 3-, 5-, and 10-year periods, and compared these returns with a wide variety of previously agreed-upon comparable performance measures and market data, including those supplied by Lipper and Morningstar, which are independent providers of mutual fund data.
On the basis of this evaluation and the Board’s ongoing review of investment results, and factoring in the relative market conditions during certain of the performance periods, the Board concluded that the fund’s performance was satisfactory.
Costs, Benefits, Profits, and Economies of Scale
The Board reviewed detailed information regarding the revenues received by the Advisor under the Advisory Contract and other benefits that the Advisor (and its affiliates) may have realized from its relationship with the fund, including any research received under “soft dollar” agreements and commission-sharing arrangements with broker-dealers. The Board considered that the Advisor may receive some benefit from soft-dollar arrangements pursuant to which research is received from broker-dealers that execute the applicable fund’s portfolio transactions. The Board received information on the estimated costs incurred and profits realized by the Advisor from managing T. Rowe Price mutual funds. While the Board did not review information regarding profits realized from managing the fund in particular because the fund had either not achieved sufficient portfolio asset size or not recognized sufficient revenues to produce meaningful profit margin percentages, the Board concluded that the Advisor’s profits were reasonable in light of the services provided to the T. Rowe Price funds.
The Board also considered whether the fund benefits under the fee levels set forth in the Advisory Contract from any economies of scale realized by the Advisor. Under the Advisory Contract, the fund pays a fee to the Advisor for investment management services composed of two components—a group fee rate based on the combined average net assets of most of the T. Rowe Price mutual funds (including the fund) that declines at certain asset levels and an individual fund fee rate based on the fund’s average daily net assets—and the fund pays its own expenses of operations (subject to an expense limitation agreed to by the Advisor). At the March 13, 2015, meeting, the Board approved an additional 0.005% breakpoint to the group fee schedule, effective May 1, 2015. With the new breakpoint, the group fee rate will decline to 0.270% when the combined average net assets of the applicable T. Rowe Price funds exceed $500 billion. The Board also noted that, in addition to the contractual expense limitation, there is an arrangement in place whereby the Advisor may voluntarily waive all or a portion of the management fee it is entitled to receive from the fund or pay all or a portion of the fund’s operating expenses in order to maintain a zero or positive net yield for the fund. The Board concluded that the advisory fee structure for the fund continued to provide for a reasonable sharing of benefits from any economies of scale with the fund’s investors.
Fees
The Board was provided with information regarding industry trends in management fees and expenses, and the Board reviewed the fund’s management fee rate, operating expenses, and total expense ratio in comparison with fees and expenses of other comparable funds based on information and data supplied by Lipper. After including reductions resulting from the contractual expense limitation and voluntary fee waiver arrangement, the information provided to the Board indicated that the fund’s management fee rate and total expense ratio were at or below the median for comparable funds.
The Board also reviewed the fee schedules for institutional accounts and private accounts with similar mandates that are advised or subadvised by the Advisor and its affiliates. Management provided the Board with information about the Advisor’s responsibilities and services provided to institutional account clients, including information about how the requirements and economics of the institutional business are fundamentally different from those of the mutual fund business. The Board considered information showing that the mutual fund business is generally more complex from a business and compliance perspective than the institutional business and that the Advisor generally performs significant additional services and assumes greater risk in managing the fund and other T. Rowe Price mutual funds than it does for institutional account clients.
On the basis of the information provided and the factors considered, the Board concluded that the fees paid by the fund under the Advisory Contract are reasonable.
Approval of the Advisory Contract
As noted, the Board approved the continuation of the Advisory Contract. No single factor was considered in isolation or to be determinative to the decision. Rather, the Board concluded, in light of a weighting and balancing of all factors considered, that it was in the best interests of the fund and its shareholders for the Board to approve the continuation of the Advisory Contract (including the fees to be charged for services thereunder). The independent directors were advised throughout the process by independent legal counsel.
Item 2. Code of Ethics.
A code of ethics, as defined in Item 2 of Form N-CSR, applicable to its principal executive officer, principal financial officer, principal accounting officer or controller, or persons performing similar functions is filed as an exhibit to the registrant’s annual Form N-CSR. No substantive amendments were approved or waivers were granted to this code of ethics during the registrant’s most recent fiscal half-year.
Item 3. Audit Committee Financial Expert.
Disclosure required in registrant’s annual Form N-CSR.
Item 4. Principal Accountant Fees and Services.
Disclosure required in registrant’s annual Form N-CSR.
Item 5. Audit Committee of Listed Registrants.
Not applicable.
Item 6. Investments.
(a) Not applicable. The complete schedule of investments is included in Item 1 of this Form N-CSR.
(b) Not applicable.
Item 7. Disclosure of Proxy Voting Policies and Procedures for Closed-End Management Investment Companies.
Not applicable.
Item 8. Portfolio Managers of Closed-End Management Investment Companies.
Not applicable.
Item 9. Purchases of Equity Securities by Closed-End Management Investment Company and Affiliated Purchasers.
Not applicable.
Item 10. Submission of Matters to a Vote of Security Holders.
Not applicable.
Item 11. Controls and Procedures.
(a) The registrant’s principal executive officer and principal financial officer have evaluated the registrant’s disclosure controls and procedures within 90 days of this filing and have concluded that the registrant’s disclosure controls and procedures were effective, as of that date, in ensuring that information required to be disclosed by the registrant in this Form N-CSR was recorded, processed, summarized, and reported timely.
(b) The registrant’s principal executive officer and principal financial officer are aware of no change in the registrant’s internal control over financial reporting that occurred during the registrant’s second fiscal quarter covered by this report that has materially affected, or is reasonably likely to materially affect, the registrant’s internal control over financial reporting.
Item 12. Exhibits.
(a)(1) The registrant’s code of ethics pursuant to Item 2 of Form N-CSR is filed with the registrant’s annual Form N-CSR.
(2) Separate certifications by the registrant's principal executive officer and principal financial officer, pursuant to Section 302 of the Sarbanes-Oxley Act of 2002 and required by Rule 30a-2(a) under the Investment Company Act of 1940, are attached.
(3) Written solicitation to repurchase securities issued by closed-end companies: not applicable.
(b) A certification by the registrant's principal executive officer and principal financial officer, pursuant to Section 906 of the Sarbanes-Oxley Act of 2002 and required by Rule 30a-2(b) under the Investment Company Act of 1940, is attached.
SIGNATURES
Pursuant to the requirements of the Securities Exchange Act of 1934 and the Investment Company Act of 1940, the registrant has duly caused this report to be signed on its behalf by the undersigned, thereunto duly authorized.
T. Rowe Price California Tax-Free Income Trust
| By | /s/ Edward C. Bernard | |
| Edward C. Bernard | ||
| Principal Executive Officer | ||
| Date October 15, 2015 | ||
Pursuant to the requirements of the Securities Exchange Act of 1934 and the Investment Company Act of 1940, this report has been signed below by the following persons on behalf of the registrant and in the capacities and on the dates indicated.
| By | /s/ Edward C. Bernard | |
| Edward C. Bernard | ||
| Principal Executive Officer | ||
| Date October 15, 2015 | ||
| By | /s/ Catherine D. Mathews | |
| Catherine D. Mathews | ||
| Principal Financial Officer | ||
| Date October 15, 2015 | ||