Exhibit 99.2
Link to searchable text of slide shown above
Link to searchable text of slide shown above
Link to searchable text of slide shown above
Link to searchable text of slide shown above
Link to searchable text of slide shown above
Link to searchable text of slide shown above
Link to searchable text of slide shown above
Link to searchable text of slide shown above
Link to searchable text of slide shown above

Link to searchable text of slide shown above

Link to searchable text of slide shown above

Link to searchable text of slide shown above

Link to searchable text of slide shown above
Link to searchable text of slide shown above
Link to searchable text of slide shown above

Link to searchable text of slide shown above
Searchable text section of graphics shown above
[LOGO]
Transactions Overview
July 2005
Certain statements in this presentation that are not historical fact may constitute forward-looking statements within the meaning of the Private Securities Litigation Reform Act of 1995. Such forward-looking statements involve known and unknown risks, uncertainties and other factors which may cause the actual results of the Company to differ materially from historical results or from any results expressed or implied by such forward-looking statements, including without limitation: national and local economic, business, real estate and other market conditions; the competitive environment in which the Company operates; financing risks; possible future downgrades in our credit ratings; property ownership / management risks; the level and volatility of interest rates and changes in capitalization rates with respect to the acquisition and disposition of properties; financial stability of tenants; the Company’s ability to maintain its status as a REIT for federal income tax purposes; acquisition, disposition, development and joint venture risks, including risks that developments and redevelopments are not completed on time or on budget and strategies, actions and performance of affiliates that the Company may not control; potential environmental and other liabilities; and other factors affecting the real estate industry generally. The Company refers you to the documents filed by the Company from time to time with the Securities and Exchange Commission, specifically the section titled “Business-Risk Factors” in the Company’s Annual Report on Form 10-K for the year ended December 31, 2004, which discuss these and other factors that could adversely affect the Company’s results.
[LOGO]
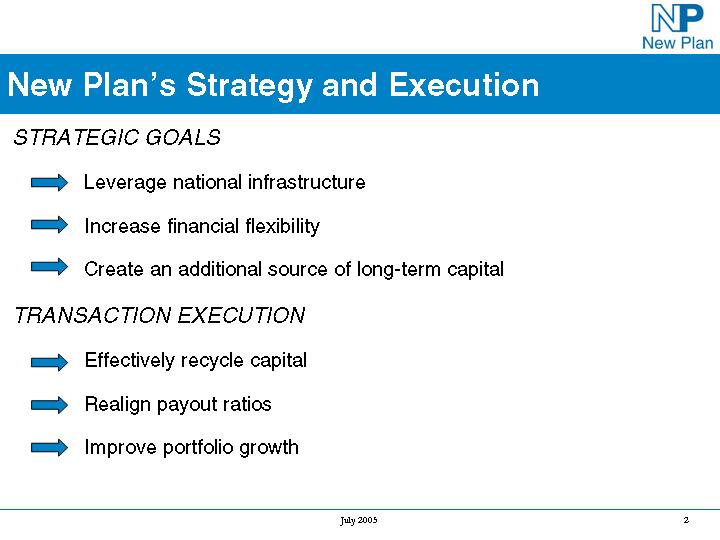
New Plan’s Strategy and Execution
STRATEGIC GOALS
• Leverage national infrastructure
• Increase financial flexibility
• Create an additional source of long-term capital
TRANSACTION EXECUTION
• Effectively recycle capital
• Realign payout ratios
• Improve portfolio growth
2
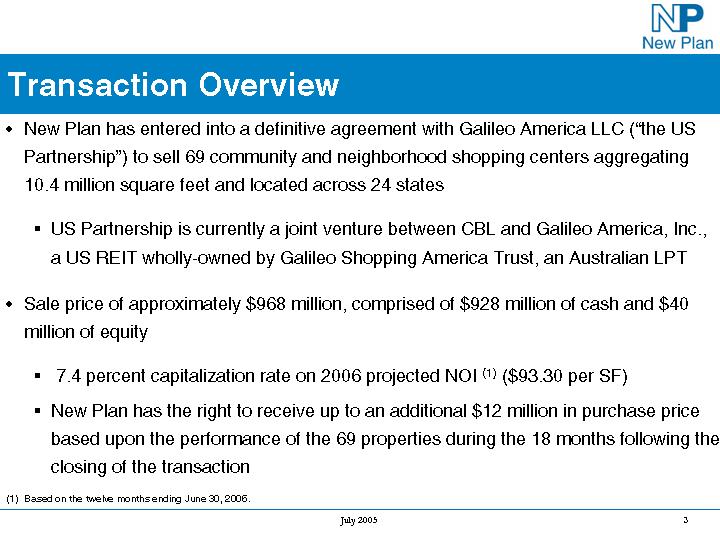
Transaction Overview
• New Plan has entered into a definitive agreement with Galileo America LLC (“the US Partnership”) to sell 69 community and neighborhood shopping centers aggregating 10.4 million square feet and located across 24 states
• US Partnership is currently a joint venture between CBL and Galileo America, Inc., a US REIT wholly-owned by Galileo Shopping America Trust, an Australian LPT
• Sale price of approximately $968 million, comprised of $928 million of cash and $40 million of equity
• 7.4 percent capitalization rate on 2006 projected NOI (1) ($93.30 per SF)
• New Plan has the right to receive up to an additional $12 million in purchase price based upon the performance of the 69 properties during the 18 months following the closing of the transaction
(1) Based on the twelve months ending June 30, 2006.
3
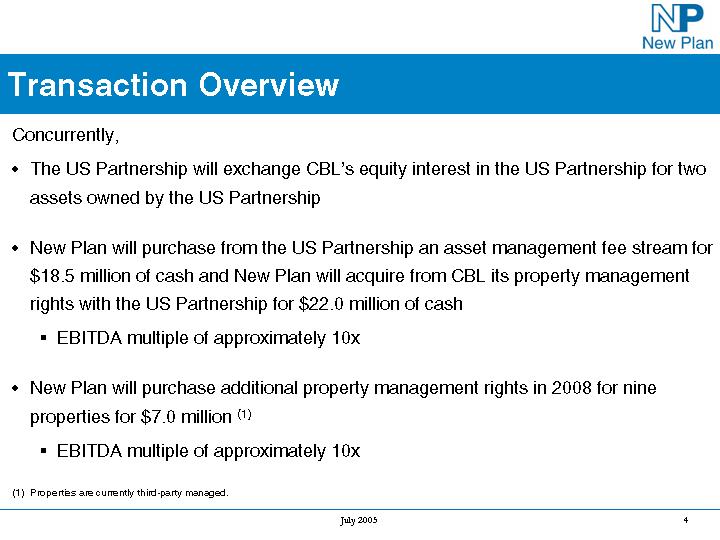
Concurrently,
• The US Partnership will exchange CBL’s equity interest in the US Partnership for two assets owned by the US Partnership
• New Plan will purchase from the US Partnership an asset management fee stream for $18.5 million of cash and New Plan will acquire from CBL its property management rights with the US Partnership for $22.0 million of cash
• EBITDA multiple of approximately 10x
• New Plan will purchase additional property management rights in 2008 for nine properties for $7.0 million (1)
• EBITDA multiple of approximately 10x
(1) Properties are currently third-party managed.
4
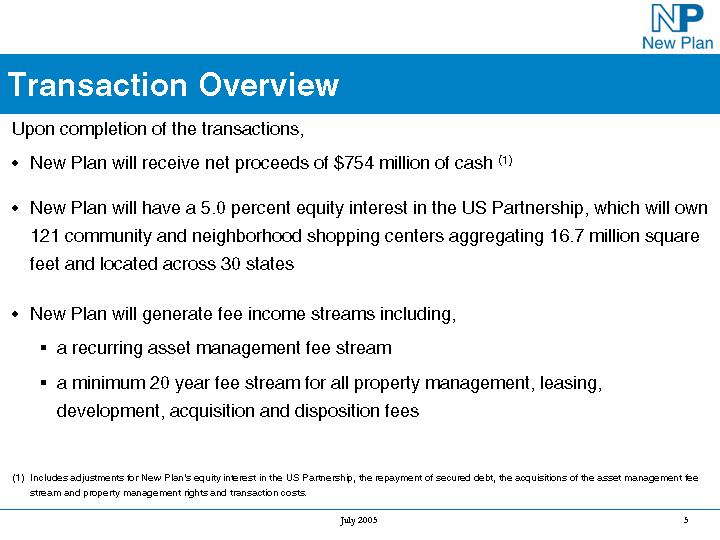
Upon completion of the transactions,
• New Plan will receive net proceeds of $754 million of cash (1)
• New Plan will have a 5.0 percent equity interest in the US Partnership, which will own 121 community and neighborhood shopping centers aggregating 16.7 million square feet and located across 30 states
• New Plan will generate fee income streams including,
• a recurring asset management fee stream
• a minimum 20 year fee stream for all property management, leasing, development, acquisition and disposition fees
(1) Includes adjustments for New Plan’s equity interest in the US Partnership, the repayment of secured debt, the acquisitions of the asset management fee stream and property management rights and transaction costs.
5
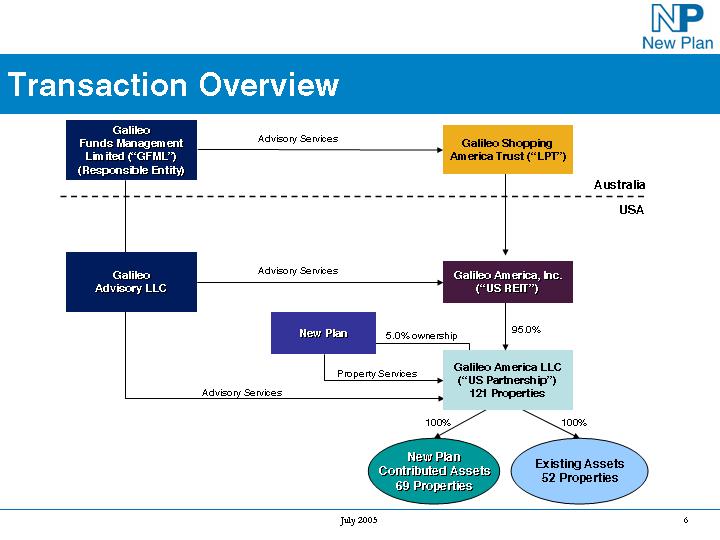
[GRAPHIC]
6
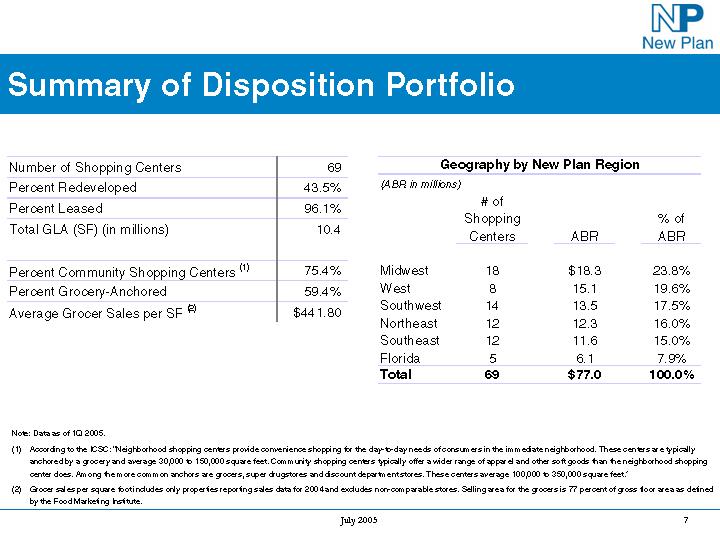
Summary of Disposition Portfolio
Number of Shopping Centers |
| 69 |
| |
Percent Redeveloped |
| 43.5 | % | |
Percent Leased |
| 96.1 | % | |
Total GLA (SF) (in millions) |
| 10.4 |
| |
|
|
|
| |
Percent Community Shopping Centers (1) |
| 75.4 | % | |
Percent Grocery-Anchored |
| 59.4 | % | |
|
|
|
| |
Average Grocer Sales per SF (2) |
| $ | 441.80 |
|
Geography by New Plan Region
(ABR in millions)
|
| # of |
| ABR |
| % of |
| |
|
|
|
|
|
|
|
| |
Midwest |
| 18 |
| $ | 18.3 |
| 23.8 | % |
West |
| 8 |
| 15.1 |
| 19.6 | % | |
Southwest |
| 14 |
| 13.5 |
| 17.5 | % | |
Northeast |
| 12 |
| 12.3 |
| 16.0 | % | |
Southeast |
| 12 |
| 11.6 |
| 15.0 | % | |
Florida |
| 5 |
| 6.1 |
| 7.9 | % | |
Total |
| 69 |
| $ | 77.0 |
| 100.0 | % |
Note: Data as of 1Q 2005.
(1) According to the ICSC: “Neighborhood shopping centers provide convenience shopping for the day-to-day needs of consumers in the immediate neighborhood. These centers are typically anchored by a grocery and average 30,000 to 150,000 square feet. Community shopping centers typically offer a wider range of apparel and other soft goods than the neighborhood shopping center does. Among the more common anchors are grocers, super drugstores and discount department stores. These centers average 100,000 to 350,000 square feet.”
(2) Grocer sales per square foot includes only properties reporting sales data for 2004 and excludes non-comparable stores. Selling area for the grocers is 77 percent of gross floor area as defined by the Food Marketing Institute.
7
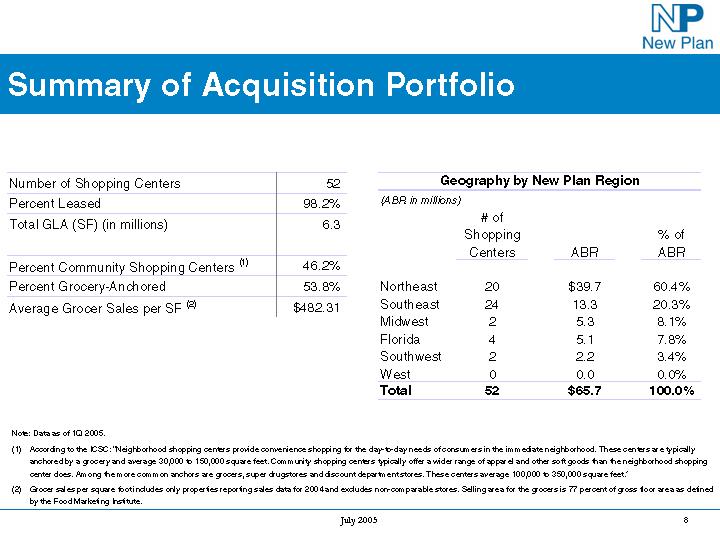
Summary of Acquisition Portfolio
Number of Shopping Centers |
| 52 |
| |
Percent Leased |
| 98.2 | % | |
Total GLA (SF) (in millions) |
| 6.3 |
| |
|
|
|
| |
Percent Community Shopping Centers (1) |
| 46.2 | % | |
Percent Grocery-Anchored |
| 53.8 | % | |
Average Grocer Sales per SF (2) |
| $ | 482.31 |
|
Geography by New Plan Region
(ABR in millions)
|
| # of |
|
|
|
|
| |
|
| Shopping |
|
|
| % of |
| |
|
| Centers |
| ABR |
| ABR |
| |
|
|
|
|
|
|
|
| |
Northeast |
| 20 |
| $ | 39.7 |
| 60.4 | % |
Southeast |
| 24 |
| 13.3 |
| 20.3 | % | |
Midwest |
| 2 |
| 5.3 |
| 8.1 | % | |
Florida |
| 4 |
| 5.1 |
| 7.8 | % | |
Southwest |
| 2 |
| 2.2 |
| 3.4 | % | |
West |
| 0 |
| 0.0 |
| 0.0 | % | |
Total |
| 52 |
| $ | 65.7 |
| 100.0 | % |
Note: Data as of 1Q 2005.
(1) According to the ICSC: “Neighborhood shopping centers provide convenience shopping for the day-to-day needs of consumers in the immediate neighborhood. These centers are typically anchored by a grocery and average 30,000 to 150,000 square feet. Community shopping centers typically offer a wider range of apparel and other soft goods than the neighborhood shopping center does. Among the more common anchors are grocers, super drugstores and discount department stores. These centers average 100,000 to 350,000 square feet.”
(2) Grocer sales per square foot includes only properties reporting sales data for 2004 and excludes non-comparable stores. Selling area for the grocers is 77 percent of gross floor area as defined by the Food Marketing Institute.
8
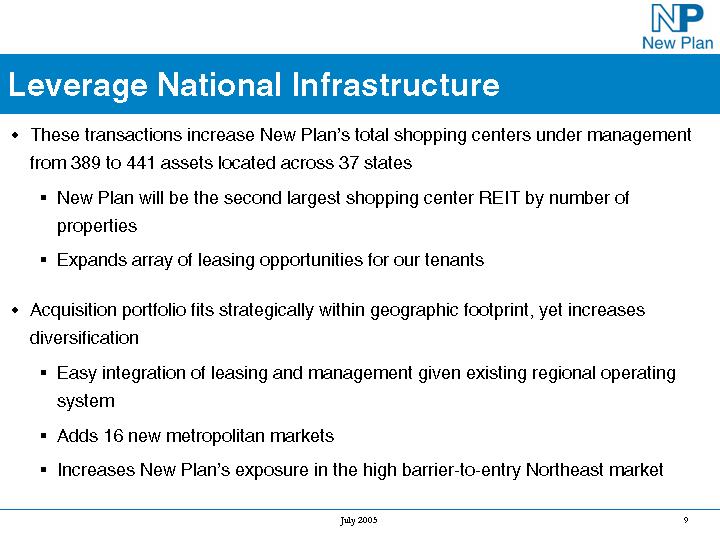
Leverage National Infrastructure
• These transactions increase New Plan’s total shopping centers under management from 389 to 441 assets located across 37 states
• New Plan will be the second largest shopping center REIT by number of properties
• Expands array of leasing opportunities for our tenants
• Acquisition portfolio fits strategically within geographic footprint, yet increases diversification
• Easy integration of leasing and management given existing regional operating system
• Adds 16 new metropolitan markets
• Increases New Plan’s exposure in the high barrier-to-entry Northeast market
9
Leverage National Infrastructure
[GRAPHIC]
10
Sources and Initial Use of Proceeds
(in millions) |
|
|
| |
Sources: |
|
|
| |
Sale price |
| $ | 968.0 |
|
Less: Retained equity in US Partnership |
| (39.8 | ) | |
Gross proceeds from sale |
| $ | 928.2 |
|
Less: Secured debt repaid |
| (101.2 | ) | |
Less: Purchase of asset management fee stream |
| (18.5 | ) | |
Less: Purchase of property management rights |
| (22.0 | ) | |
Less: Transaction costs |
| (32.3 | ) | |
Net proceeds from sale |
| $ | 754.2 |
|
|
|
|
| |
Initial expected uses: |
|
|
| |
Issue special distribution of $3.00 per common share |
| $ | 315.7 |
|
Repayment of outstanding indebtedness |
| 438.5 |
| |
Total initial uses |
| $ | 754.2 |
|
11
Longer-term Alternative Uses of Proceeds
• New Plan’s total debt to undepreciated book value ratio will improve upon closing of the transactions to approximately 43 percent from approximately 47 percent on March 31, 2005
• The flexibility created will enable New Plan to consider longer-term reinvestment alternatives, including
• Redevelopment of existing assets (approximately $250 to $300 million)
• New development
• Opportunities across the spectrum of Class A to value-added shopping centers
• Repurchase of common shares, if appropriate
12
2005 Revised FFO Guidance and Dividend
2005 Expected FFO per Diluted Share of $1.69 to $1.73
Expected annualized dividend of $1.25 per common share
Goal of realigning payout ratio with peer group at 65% to 70% of FFO
13
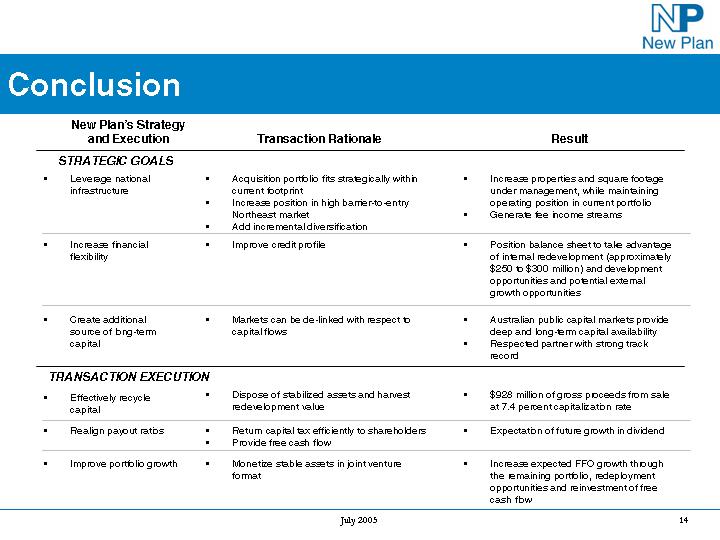
Conclusion
New Plan’s Strategy |
|
|
|
|
and Execution |
| Transaction Rationale |
| Result |
|
|
|
|
|
STRATEGIC GOALS |
|
|
|
|
|
|
|
|
|
• Leverage national infrastructure |
| • Acquisition portfolio fits strategically within current footprint • Increase position in high barrier-to-entry Northeast market • Add incremental diversification |
| • Increase properties and square footage under management, while maintaining operating position in current portfolio • Generate fee income streams |
|
|
|
|
|
• Increase financial flexibility |
| • Improve credit profile |
| • Position balance sheet to take advantage of internal redevelopment (approximately $250 to $300 million) and development opportunities and potential external growth opportunities |
|
|
|
|
|
• Create additional source of long-term capital |
| • Markets can be de-linked with respect to capital flows |
| • Australian public capital markets provide deep and long-term capital availability • Respected partner with strong track record |
|
|
|
|
|
TRANSACTION EXECUTION |
|
|
|
|
|
|
|
|
|
• Effectively recycle capital |
| • Dispose of stabilized assets and harvest redevelopment value |
| • $928 million of gross proceeds from sale at 7.4 percent capitalization rate |
|
|
|
|
|
• Realign payout ratios |
| • Return capital tax efficiently to shareholders • Provide free cash flow
|
| • Expectation of future growth in dividend |
|
|
|
|
|
• Improve portfolio growth |
| • Monetize stable assets in joint venture format |
| • Increase expected FFO growth through the remaining portfolio, redeployment opportunities and reinvestment of free cash flow |
14
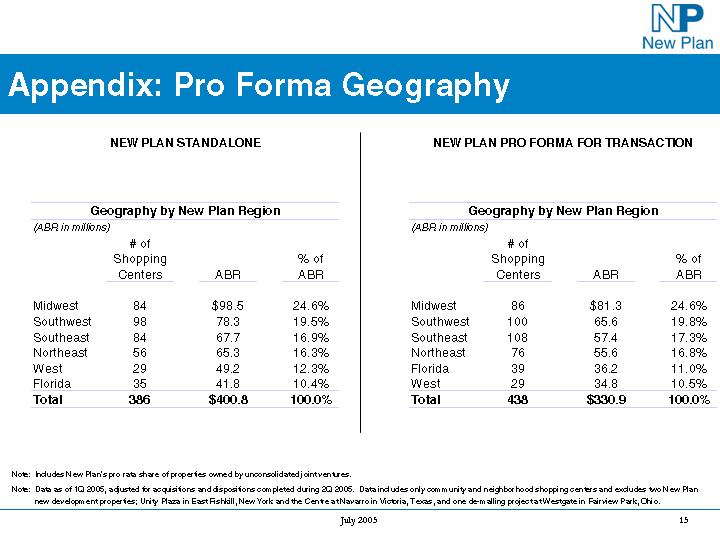
Appendix: Pro Forma Geography
NEW PLAN STANDALONE
Geography by New Plan Region
(ABR in millions)
|
| # of |
|
|
|
|
| |
|
| Shopping |
|
|
| % of |
| |
|
| Centers |
| ABR |
| ABR |
| |
|
|
|
|
|
|
|
| |
Midwest |
| 84 |
| $ | 98.5 |
| 24.6 | % |
Southwest |
| 98 |
| 78.3 |
| 19.5 | % | |
Southeast |
| 84 |
| 67.7 |
| 16.9 | % | |
Northeast |
| 56 |
| 65.3 |
| 16.3 | % | |
West |
| 29 |
| 49.2 |
| 12.3 | % | |
Florida |
| 35 |
| 41.8 |
| 10.4 | % | |
Total |
| 386 |
| $ | 400.8 |
| 100.0 | % |
NEW PLAN PRO FORMA FOR TRANSACTION
Geography by New Plan Region
(ABR in millions)
|
| # of |
|
|
|
|
| |
|
| Shopping |
|
|
| % of |
| |
|
| Centers |
| ABR |
| ABR |
| |
|
|
|
|
|
|
|
| |
Midwest |
| 86 |
| $ | 81.3 |
| 24.6 | % |
Southwest |
| 100 |
| 65.6 |
| 19.8 | % | |
Southeast |
| 108 |
| 57.4 |
| 17.3 | % | |
Northeast |
| 76 |
| 55.6 |
| 16.8 | % | |
Florida |
| 39 |
| 36.2 |
| 11.0 | % | |
West |
| 29 |
| 34.8 |
| 10.5 | % | |
Total |
| 438 |
| $ | 330.9 |
| 100.0 | % |
Note: Includes New Plan’s pro rata share of properties owned by unconsolidated joint ventures.
Note: Data as of 1Q 2005, adjusted for acquisitions and dispositions completed during 2Q 2005. Data includes only community and neighborhood shopping centers and excludes two New Plan new development properties; Unity Plaza in East Fishkill, New York and the Centre at Navarro in Victoria, Texas, and one de-malling project at Westgate in Fairview Park, Ohio.
15
Appendix: Pro Forma Top 10 Tenants
NEW PLAN STANDALONE
Top Ten Tenants
|
| % of |
| ||
|
| ABR |
| ||
|
|
|
| ||
1 |
| The Kroger Co. (1) |
| 3.8 | % |
2 |
| Wal-Mart Stores (2) |
| 3.3 | % |
3 |
| Kmart Corporation |
| 2.5 | % |
4 |
| The TJX Companies (3) |
| 1.9 | % |
5 |
| Publix Super Markets |
| 1.5 | % |
6 |
| Ahold USA (4) |
| 1.3 | % |
7 |
| Winn-Dixie Stores (5) |
| 1.1 | % |
8 |
| Safeway, Inc. (6) |
| 1.1 | % |
9 |
| Delhaize America (7) |
| 1.1 | % |
10 |
| Circuit City Stores, Inc. |
| 1.0 | % |
|
| Total |
| 18.5 | % |
NEW PLAN PRO FORMA FOR TRANSACTION
Top Ten Tenants
|
| % of |
| ||
|
| ABR |
| ||
|
|
|
| ||
1 |
| The Kroger Co. (1) |
| 3.9 | % |
2 |
| Wal-Mart Stores (2) |
| 3.0 | % |
3 |
| Kmart Corporation |
| 2.3 | % |
4 |
| The TJX Companies (3) |
| 1.9 | % |
5 |
| Publix Super Markets |
| 1.8 | % |
6 |
| Ahold USA (4) |
| 1.5 | % |
7 |
| Winn-Dixie Stores (5) |
| 1.4 | % |
8 |
| Delhaize America (7) |
| 1.1 | % |
9 |
| Safeway, Inc. (6) |
| 1.1 | % |
10 |
| CVS |
| 1.0 | % |
|
| Total |
| 19.0 | % |
Note: Includes New Plan’s pro rata share of properties owned by unconsolidated joint ventures.
Note: Data as of 1Q 2005.
(1) Includes King Soopers, Kroger, Ralphs and Smith’s.
(2) Includes SAM’S CLUBS, Supercenters and Wal-Mart stores.
(3) Includes A.J. Wright, HomeGoods, Marshalls and T.J. Maxx.
(4) Includes Giant Food, Martin’s, Stop & Shop and Tops Market.
(5) Includes SaveRite and Winn-Dixie.
(6) Includes Dominick’s, Genuardi’s, Randalls and Tom Thumb.
(7) Includes Food Lion, Harveys and Kash n’ Karry.
16