| 1900 K Street, NW Washington, DC 20006-1110 +1 202 261 3300 Main +1 202 261 3333 Fax www.dechert.com SHAYNA GILMORE shayna.gilmore@dechert.com+1 202 261 3362 Direct +1 202 261 3091 Fax |
February 25, 2020
Via Edgar
Ms. Samantha A. Brutlag
Attorney-Adviser
U.S. Securities and Exchange Commission
Division of Investment Management
100 F Street, NE
Washington, DC 20549
| Re: | HSBC Funds (File Nos. 033-07647 and 811-04782) (the “Registrant”) |
Dear Ms. Brutlag,
This letter responds to comments that you provided to Albert Jung and me in a telephonic conversation on Friday, January 31, 2020 regarding your review of Post-Effective Amendment No. 243 (“PEA No. 243”) to the Registrant’s registration statement filed with the U.S. Securities and Exchange Commission on December 20, 2019. PEA No. 243 was filed on behalf of the Registrant for the purpose of making certain disclosure changes to reflect: (i) the repositioning of the HSBC High Yield Fund (formerly, the HSBC Global High Yield Bond Fund) and the HSBC Strategic Income Fund (formerly, the HSBC Global High Income Bond Fund) (each, a “Fund” and together, the “Funds”); and (ii) the Registrant’s updated asset segregation practices. We have reproduced your comments below, followed by the Registrant’s responses. Capitalized terms have the meanings attributed to such terms in the registration statement.
| 1. | Comment: Please supplementally provide to the Staff for its review completed fee and expense tables and the performance bar chart and table reflecting the period ended December 31, 2019 for each Fund. |
| Response: The completed fee and expense tables and the performance bar chart and table reflecting the period ended December 31, 2019 for each Fund are included in Appendix A hereto. | |
| 2. | Comment: Please revise the order of each Fund’s principal investment risks so that they appear by order of importance most likely to affect the Fund’s NAV, yield, and total return rather than alphabetically. |
 |
| Response: The Registrant respectfully declines to make the requested change. The Registrant is not aware of any requirement in Form N-1A that a fund’s principal risks be set forth in any particular order, and the Registrant believes that the current disclosure adequately and clearly describes the principal risks of investing in each Fund. In addition, the importance of each risk will change over time based on a variety of economic, market, and other factors. Therefore, the Registrant believes that re-ordering its current risk disclosure to emphasize certain risks over others could potentially be misleading to investors. Accordingly, no changes have been made in response to this comment. | |
| 3. | Comment: The “Summary Section–Principal Investment Strategies” for the HSBC Strategic Income Fund provides that “The Fund may purchase securities of various maturities or duration.” Please confirm whether the HSBC Strategic Income Fund may purchase securities of any maturities or duration. If not, please disclose the outer limits of the range of the maturity and duration of the securities in which the HSBC Strategic Income Fund may invest. |
| Response: The Registrant confirms that the HSBC Strategic Income Fund may purchase securities of any maturities or duration. Accordingly, no changes have been made in response to this comment. | |
| 4. | Comment: If the HSBC Strategic Income Fund intends to invest significantly in non-agency, below investment grade mortgage-backed securities, please (1) disclose prominently the related liquidity risks, and state that the liquidity of such investments will change overtime; and (2) provide a written representation from the Board, including all trustees who are not considered “interested persons” of the Funds as defined in Section 2(a)(19) of the Investment Company Act of 1940, as amended (“1940 Act”), that: (a) the HSBC Strategic Income Fund’s strategy is appropriate for an open-end fund, and (b) that the HSBC Strategic Income Fund can comply with liquidity requirements under the 1940 Act. |
| Response: The Registrant confirms that the HSBC Strategic Income Fund does not invest significantly (i.e., more than 20% of the Fund’s total assets) in non-agency, below investment grade mortgage-backed securities. Accordingly, no changes have been made in response to this comment. | |
| 5. | Comment: The “Additional Information About the Funds’ Investment Strategies and Risks–More About Risks and Investment Strategies” provides that “Each of the Funds may purchase securities of various maturities.” Given the placement of this sentence, please confirm that the reference to maturities should not be to duration instead. |
2
 |
| Response: The Registrant has revised the disclosure to address this comment. | |
* * *
We believe that the foregoing has been responsive to the Staff’s comments. Please call the undersigned at (202) 261-3362 if you wish to discuss this correspondence further. Thank you in advance for your attention to this letter.
Best regards,
/s/ Shayna Gilmore
Shayna Gilmore
| cc: | Richard A. Fabietti, President, HSBC Funds, and Senior Vice President, Head of Product Management, HSBC Global Asset Management (USA) Inc. |
| James M. Curtis, Chief Legal Officer, HSBC Funds, and Associate General Counsel, HSBC Technology & Services (USA) Inc. | |
| David J. Harris, Dechert LLP | |
| Brenden P. Carroll, Dechert LLP |
3
 |
Appendix A
HSBC High Yield Fund
Fees and Expenses of the Fund
This table describes the fees and expenses that you may pay if you buy and hold shares of the Fund. The table does not take into account brokerage commissions that you may pay on your purchases of Class I Shares of the Fund. You may qualify for sales charge discounts if you and your family invest, or agree to invest in the future, at least $100,000 in the HSBC Family of Funds. More information about these and other discounts is available from your financial professional, and is explained in “Distribution Arrangements/Sales Charges” on page 39 of this prospectus and in the Fund’s Statement of Additional Information (“SAI”) in “Right of Accumulation” on page 79.
| Shareholder Fees (fees paid directly from your investment) | Class A | Class I | |||
| Maximum Sales Charge (load) Imposed on Purchases (as a % of offering price) | 3.75% | None | |||
| Maximum Deferred Sales Charge (load) (as a % of amount redeemed) | None | None | |||
| Annual Fund Operating Expenses (expenses that you pay each year as a percentage of the value of your investment) | Class A | Class I | |||
| Management Fee | 0.65% | 0.65% | |||
| Other expenses: | |||||
| Shareholder servicing fee | 0.25% | 0.00% | |||
| Other operating expenses | 1.67% | 1.57% | |||
| Total Other Expenses | 1.92% | 1.57% | |||
| Acquired Fund Fees and Expenses | 0.03% | 0.03% | |||
| Total Annual Fund Operating Expenses | 2.60%* | 2.25% | |||
| Fee Waiver and/or Expense Reimbursement** | 1.67% | 1.67% | |||
| Total Annual Fund Operating Expenses After Fee Waiver and/or Expense Reimbursement | 0.93% | 0.58% |
| * | The Total Annual Fund Operating Expenses have been restated to reflect current expenses and do not correlate to the ratios of net and total expenses to average net assets provided in the Financial Highlights, which reflect the operating expenses of the Fund and do not include Acquired Fund Fees and Expenses. |
| ** | HSBC Global Asset Management (USA) Inc., the Fund’s investment adviser (“Adviser”), has entered into a contractual expense limitation agreement with the Fund (“Expense Limitation Agreement”) under which it will limit total expenses of the Fund (excluding interest, taxes, brokerage commissions, extraordinary expenses and estimated indirect expenses attributable to the Fund’s investments in investment companies) to an annual rate of 0.90% for Class A Shares and 0.55% for Class I Shares. Any amounts contractually waived or reimbursed by the Adviser will be subject to repayment by the Fund to the Adviser within three years, calculated monthly from when the waiver or reimbursement was recorded, to the extent that the repayment will not cause the Fund’s operating expenses to exceed the contractual expense limit that was in effect at the time of such waiver or reimbursement. The expense limitation shall be in effect until March 1, 2021. The Expense Limitation Agreement shall terminate upon the termination of the Investment Advisory Contract between HSBC Funds (the “Trust”) and the Adviser, or it may be terminated upon written notice to the Adviser by the Trust’s Board of Trustees. |
Example
This Example is intended to help you compare the cost of investing in the Fund with the cost of investing in other mutual funds. The Example assumes that you invest $10,000 in the Fund for the time periods indicated and then redeem all of your shares at the end of those periods. The Example also assumes that your investment has a 5% return each year and that the Fund’s operating expenses remain the same. The Example takes the Fund’s Expense Limitation Agreement into account until its expiration on March 1, 2021. The Example does not take into account brokerage commissions that you may pay on your purchases of Class I Shares of the Fund. Although your actual costs may be higher or lower, based on these assumptions your costs would be:
| 1 Year | 3 Years | 5 Years | 10 Years | |||||||
| Class A Shares | $466 | $1,000 | $1,559 | $3,079 | ||||||
| Class I Shares | $59 | $542 | $1,052 | $2,454 |
Performance Bar Chart and Table
The bar chart and table below provide an indication of the risks of an investment in the Fund by showing changes in the Fund’s year-to-year performance and by showing how the Fund’s average annual returns compare with that of a broad measure of market performance. Past performance, including before- and after-tax returns, does not indicate how the Fund will perform in the future. Prior to April 1, 2019, the Fund invested at least 80% of its net assets, plus borrowings for investment purposes, in a globally diversified portfolio of high yield securities. Effective April 1, 2019, the Fund invests primarily in U.S. dollar denominated fixed income securities issued by U.S. companies or governments (or any political subdivision, agency, authority or instrumentality of a government). Accordingly, performance information prior to that date reflects the Fund’s former investment strategies, and future performance will vary. In addition, as of April 1, 2019, the Fund’s benchmark was changed from the ICE BofA BB-B Global High Yield Constrained Index (USD Hedged) to the Index. The Adviser believes that the Index is a more appropriate index against which to measure performance in light of the changes to the Fund’s investment strategies.
4
The bar chart below shows the Fund’s annual returns for Class I Shares. The returns for Class A Shares will differ from the Class I Shares’ returns shown in the bar chart because the expenses of the classes differ.
Annual Total Returns as of 12/31 for Class I Shares
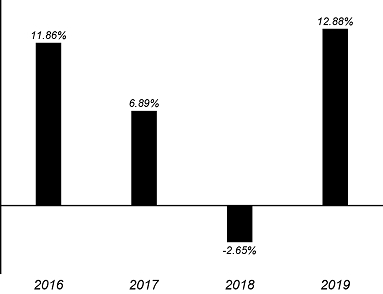
| Best Quarter: | Q1 2019 | 5.76% | ||
| Worst Quarter: | Q4 2018 | -3.45% |
The table below shows returns on a before-tax and after-tax basis. After-tax returns are calculated using the historical highest individual federal marginal income tax rates and do not reflect the impact of state and local taxes. Actual after-tax returns depend on an investor’s tax situation and may differ from those shown. After-tax returns are not relevant to investors who hold their Fund shares through tax-deferred arrangements, such as 401(k) plans or individual retirement accounts. After-tax returns shown in the table below are for Class I Shares of the Fund and after-tax returns for Class A Shares may vary. The table further compares the Fund’s performance over time to those of the Index and the Fund’s former benchmark, the ICE BofA BB-B Global High Yield Constrained Index (USD Hedged).
Average Annual Total Returns (for the periods ended December 31, 2019)
| Inception Date | 1 Year | Since Inception | |||||
| Class I Return Before Taxes | July 14, 2015 | 12.88% | 5.13% | ||||
| Class I Return After Taxes on Distributions | July 14, 2015 | 10.48% | 2.91% | ||||
| Class I Return After Taxes on Distributions and Sale of Fund Shares | July 14, 2015 | 7.57% | 2.92% | ||||
| Class A Return Before Taxes | July 14, 2015 | 8.25% | 3.86% | ||||
| ICE BofA U.S. High Yield Constrained Index (reflects no deduction for fees, expenses or taxes) | 14.41% | 6.29%* | |||||
| ICE BofA BB-B Global High Yield Constrained Index (USD Hedged) (reflects no deduction for fees, expenses or taxes) | — | 14.72% | 6.55%* |
| * | Since July 14, 2015 |
5
HSBC Strategic Income Fund
Fees and Expenses of the Fund
This table describes the fees and expenses that you may pay if you buy and hold shares of the Fund. The table does not take into account brokerage commissions that you may pay on your purchases of Class I Shares of the Fund. You may qualify for sales charge discounts if you and your family invest, or agree to invest in the future, at least $100,000 in the HSBC Family of Funds. More information about these and other discounts is available from your financial professional, and is explained in “Distribution Arrangements/Sales Charges” on page 39 of this prospectus and in the Fund’s Statement of Additional Information (“SAI”) in “Right of Accumulation” on page 79.
| Shareholder Fees (fees paid directly from your investment) | Class A | Class I | |||
| Maximum Sales Charge (load) Imposed on Purchases (as a % of offering price) | 3.75% | None | |||
| Maximum Deferred Sales Charge (load) (as a % of amount redeemed) | None | None | |||
| Annual Fund Operating Expenses (expenses that you pay each year as a percentage of the value of your investment) | Class A | Class I | |||
| Management Fee | 0.65% | 0.65% | |||
| Other expenses: | |||||
| Shareholder servicing fee | 0.25% | 0.00% | |||
| Other operating expenses | 1.86% | 1.76% | |||
| Total Other Expenses | 2.11% | 1.76% | |||
| Total Annual Fund Operating Expenses | 2.76%* | 2.41% | |||
| Fee Waiver and/or Expense Reimbursement** | 1.71% | 1.71% | |||
| Total Annual Fund Operating Expenses After Fee Waiver and/or Expense Reimbursement | 1.05% | 0.70% |
| * | The Total Annual Fund Operating Expenses have been restated to reflect current expenses. |
| ** | HSBC Global Asset Management (USA) Inc., the Fund’s investment adviser (“Adviser”), has entered into a contractual expense limitation agreement with the Fund (“Expense Limitation Agreement”) under which it will limit total expenses of the Fund (excluding interest, taxes, brokerage commissions, extraordinary expenses and estimated indirect expenses attributable to the Fund’s investments in investment companies) to an annual rate of 1.05% for Class A Shares and 0.70% for Class I Shares. Any amounts contractually waived or reimbursed by the Adviser will be subject to repayment by the Fund to the Adviser within three years, calculated monthly from when the waiver or reimbursement was recorded, to the extent that the repayment will not cause the Fund’s operating expenses to exceed the contractual expense limit that was in effect at the time of such waiver or reimbursement. The expense limitation shall be in effect until March 1, 2021. The Expense Limitation Agreement shall terminate upon the termination of the Investment Advisory Contract between HSBC Funds (the “Trust”) and the Adviser, or it may be terminated upon written notice to the Adviser by the Trust’s Board of Trustees. |
Example
This Example is intended to help you compare the cost of investing in the Fund with the cost of investing in other mutual funds. The Example assumes that you invest $10,000 in the Fund for the time periods indicated and then redeem all of your shares at the end of those periods. The Example also assumes that your investment has a 5% return each year and that the Fund’s operating expenses remain the same. The Example takes the Fund’s Expense Limitation Agreement into account until its expiration on March 1, 2021. The Example does not take into account brokerage commissions that you may pay on your purchases of Class I Shares of the Fund. Although your actual costs may be higher or lower, based on these assumptions your costs would be:
| 1 Year | 3 Years | 5 Years | 10 Years | |||||||
| Class A Shares | $478 | $1,043 | $1,633 | $3,229 | ||||||
| Class I Shares | $72 | $587 | $1,130 | $2,615 |
Performance Bar Chart and Table
The bar chart and table below provide an indication of the risks of an investment in the Fund by showing changes in the Fund’s year-to-year performance and by showing how the Fund’s average annual returns compare with that of a broad measure of market performance. Past performance, including before- and after-tax returns, does not indicate how the Fund will perform in the future. Prior to April 1, 2019, the Fund invested under normal circumstances at least 80% of its net assets, plus borrowings for investment purposes, in a globally diversified portfolio of higher yielding securities. Effective April 1, 2019, the Fund invests primarily in U.S. dollar denominated fixed income securities issued by U.S. companies or governments (or any political subdivision, agency, authority or instrumentality of a government). Accordingly, performance information prior to that date reflects the Fund’s former investment strategies, and future performance will vary. In addition, as of April 1, 2019, the Fund’s benchmark was changed from the Bloomberg Barclays High Income Bond Composite Index to the Bloomberg Barclays U.S. Aggregate Bond Index (the “Index”). The Adviser believes that the Index is a more appropriate index against which to measure performance in light of the changes to the Fund’s investment strategies.
6
The bar chart below shows the Fund’s annual returns for Class I Shares. The returns for Class A Shares will differ from the Class I Shares’ returns shown in the bar chart because the expenses of the classes differ.
Annual Total Returns as of 12/31 for Class I Shares
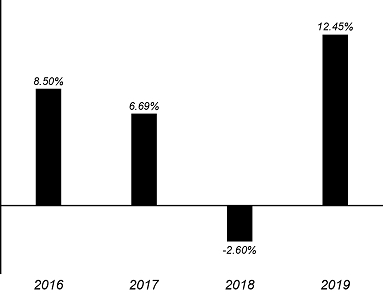
| Best Quarter: | Q1 2019 | 5.47% | ||
| Worst Quarter: | Q4 2018 | -1.44% |
The table below shows returns on a before-tax and after-tax basis. After-tax returns are calculated using the historical highest individual federal marginal income tax rates and do not reflect the impact of state and local taxes. Actual after-tax returns depend on an investor’s tax situation and may differ from those shown. After-tax returns are not relevant to investors who hold their Fund shares through tax-deferred arrangements, such as 401(k) plans or individual retirement accounts. After-tax returns shown in the table below are for Class I Shares of the Fund and after-tax returns for Class A Shares may vary. The table further compares the Fund’s performance over time to those of the Index and the Fund’s former benchmark, the Bloomberg Barclays High Income Bond Composite Index.
Average Annual Total Returns (for the periods ended December 31, 2019)
| Inception Date | 1 Year | Since Inception | |||||
| Class I Return Before Taxes | July 14, 2015 | 12.45% | 4.84% | ||||
| Class I Return After Taxes on Distributions | July 14, 2015 | 10.14% | 3.09% | ||||
| Class I Return After Taxes on Distributions | |||||||
| and Sale of Fund Shares | July 14, 2015 | 7.43% | 2.94% | ||||
| Class A Return Before Taxes | July 14, 2015 | 7.89% | 3.58% | ||||
| Bloomberg Barclays U.S. Aggregate Bond Index (reflects no deduction for fees, expenses or taxes) | — | 8.72% | 3.48%* | ||||
| Bloomberg Barclays High Income Bond Composite Index (reflects no deduction for fees, expenses or taxes) | — | 13.91% | 6.14%* |
| * | Since July 14, 2015 |
7