Exhibit 99.2
IRET
Fourth Quarter Fiscal 2008
Supplemental Operating and Financial Data
for the Quarter Ended April 30, 2008
| | | | | |
CONTACT: Michelle Saari VP - Investors Relations Direct Dial: 701-837-4738 E-Mail: msaari@iret.com | | | | 12 Main Street South Minot, ND 58701 Tel: 701-837-4738 Fax: 701-837-7117 www.iret.com |
Supplemental Financial and Operating Data
Table of Contents
April 30, 2008
| | Page |
| | |
| Company Background and Highlights | 2 |
| | |
| Investment Cost by Segment | |
| | |
| Key Financial Data | |
| Condensed Consolidated Statements of Operations | 5 |
| Condensed Consolidated Balance Sheets | 6 |
| Funds From Operations | 7 |
| Earnings Before Interest, Taxes, Depreciation and Amortization (EBITDA) | 8 |
| | |
| Capital Analysis | |
| Long-Term Mortgage Debt Analysis | 9 |
| Capital Analysis | 10 |
| | |
| Portfolio Analysis | |
| Stabilized Properties Net Operating Income Summary | 11 |
| Net Operating Income Detail | 12-15 |
| Stabilized Properties and Overall Economic Occupancy Levels by Segment | 16 |
| | |
| Tenant Analysis | |
| Commercial Leasing Summary | 17-18 |
| Multi-Family Residential Summary | 19 |
| 10 Largest Tenants - Based on Annualized Base Rent | 20 |
| Lease Expirations as of April 30, 2008 | 21 |
| | |
| Growth and Strategy | |
| Fiscal 2008 Acquisition Summary | 22 |
| Fiscal 2007 and 2008 Development Summary | 23 |
Company Background and Highlights
Fourth Quarter Fiscal 2008
Investors Real Estate Trust is a self-administered, equity real estate investment trust (REIT) investing in a portfolio of income-producing properties located primarily in the upper Midwest. IRET’s portfolio is diversified among multi-family residential, office, medical (including senior housing), industrial and retail segments.
Through the fourth quarter of fiscal year 2008, IRET has acquired $154.7 million in assets, consisting of four office/warehouse properties, fifteen medical office properties (including eight senior housing facilities), three office building and one multi-family residential property. During fiscal year 2008, the Company sold a small office property located in Minnetonka, Minnesota, and two small apartment properties located in Harvey, North Dakota and Devils Lake, North Dakota, respectively, for sales prices totaling approximately $1.4 million. IRET also completed the development of a 67-unit apartment building during the third quarter of fiscal year 2008.
In March 2008, IRET acquired five senior housing facilities with a total of 237 units/beds for an aggregate purchase price (excluding closing costs) of $32.1 million. IRET acquired the facilities from affiliates of Edgewood Vista Senior Living, Inc. ("Edgewood Vista"), a developer and operator of senior living communities with which IRET has had an existing long-term business relationship.
In February 2008, IRET acquired 100% of the member interests in limited liability companies owning three senior housing facilities with a total of 92 units/beds for an aggregate purchase price (excluding closing costs) of $12.6 million, also from affiliates of Edgewood Vista. The eight facilities that IRET acquired are located in Minnesota, Montana, Nebraska, North Dakota and South Dakota, and are leased to subsidiary companies of Sunwest Management, Inc. ("Sunwest"). Sunwest, one of the largest private senior housing operators and developers in the United States, currently owns and operates approximately 250 senior housing properties located in 39 states, and is acquiring the assets of Edgewood Vista.
As part of the acquisition transactions summarized above, during the fourth quarter IRET also bought out certain options held by its tenant, Edgewood Vista, to purchase eleven existing senior housing facilities owned by IRET and leased by Edgewood Vista. IRET paid approximately $14.8 million to Edgewood Vista to extinguish purchase options on these eleven senior housing facilities, which have a total of 741 units/beds and are located in Bismarck, North Dakota; Spearfish, South Dakota; Brainerd, Minnesota; Hermantown, Minnesota (two facilities); Omaha, Nebraska; Fremont, Nebraska; Hastings, Nebraska; Kalispell, Montana; Missoula, Montana, and Virginia, Minnesota. IRET has leased these locations to subsidiaries of Sunwest.
In March 2008, IRET closed on its acquisition of a portfolio of six medical office properties located in the greater Minneapolis, Minnesota metropolitan area. In regard to three of the six buildings, the Company acquired leasehold interests only. IRET paid $6.9 million in cash for the portfolio, assumed existing financing totaling approximately $17.8 million, placed new financing of $21.9 million, and caused the issuance of approximately 567,000 limited partnership units of its operating partnership, IRET Properties, valued at $9.45 per unit or approximately $5.4 million in total, for a total aggregate consideration for the portfolio of $52.0 million, excluding acquisition costs, and excluding costs totaling approximately $1.7 million associated with the early prepayment of the debt encumbering four of the six locations. The portfolio was purchased from a group of local private investors who developed the properties.
Also in March 2008, IRET acquired an approximately 198,708 sq. ft., one-story office/warehouse property located in Eagan, Minnesota, for a purchase price of $6.4 million, excluding closing costs but including the issuance of approximately 315,428 units of its operating partnership, IRET Properties, valued at $9.53 per unit or approximately $3 million in total.
IRET raised over $66 million of capital through its sale of 6.9 million common shares of beneficial interest in a public offering completed during the second quarter of fiscal year 2008. Additionally, IRET renewed its three unsecured lines of credit, totaling $32 million, and, in April 2008, paid its 148th consecutive quarterly distribution per common share/unit at equal or increasing rates. During the third quarter of fiscal year 2008, the Company’s Distribution Reinvestment Plan was revised to add a voluntary cash contribution feature, permitting shareholders participating in the plan to make optional cash payments of $250 to $3,000 per month to purchase IRET common shares at a discount (currently 5%) from the market price.
Subsequent Events: Closed and Pending Acquisitions. Subsequent to its April 30, 2008 fiscal year end, the Company closed on the acquisition of several small apartment buildings in Minot, North Dakota, with a total of 52 units, for a total purchase price of $2.5 million, including the issuance to the seller of 191,596 UPREIT units valued at $10.20 per unit. The Company also acquired, subsequent to its fiscal 2008 year end, a parcel of vacant land in Bismarck, North Dakota, for a purchase price of $575,763. This vacant parcel adjoins the Company’s existing Cottonwoods apartment complexes in Bismarck.
As of April 30, 2008, the Company had signed purchase agreements to acquire a 36-unit multi-family apartment complex in Isanti, Minnesota, for a purchase price of $3.1 million, and an office building in Bismarck, North Dakota, for a purchase price of $2.2 million. These pending acquisitions are subject to various closing conditions and contingencies, and no assurances can be given that these transactions will be completed.
The Company also continues to work to close a previously-announced proposed acquisition of a two-building senior housing complex located in Minot, North Dakota, consisting of two single-story facilities containing approximately 93,708 square feet and 9,693 square feet, respectively, with a combined total of 184 units/beds, for a purchase price of $14.8 million. The Company had expected to close this acquisition prior to its April 30, 2008 fiscal year end; negotiations with the sellers and lenders to the project are continuing, but the Company currently has no firm estimate of when this proposed acquisition transaction may be completed, or negotiations terminated. This pending acquisition is subject to various closing conditions and contingencies, and no assurances can be given that this transaction will be completed.
As of April 30, 2008, IRET owns a diversified portfolio of 235 properties consisting of 72 multi-family residential properties, 65 office properties, 48 medical properties (including senior housing), 17 industrial properties and 33 retail properties. IRET’s distributions have increased every year for 37 consecutive years. IRET’s shares are publicly traded on the NASDAQ Global Select Market (symbols: IRET and IRETP)
Certain statements in these supplemental disclosures are “forward-looking statements” within the meaning of the Private Securities Litigation Reform Act of 1995. Such statements involve known and unknown risks, uncertainties and other factors that may cause actual results to differ materially from projected results. Such risks, uncertainties and other factors include, but are not limited to: fluctuations in interest rates, the effect of government regulation, the availability of capital, changes in general and local economic and real estate market conditions, competition, our ability to attract and retain skilled personnel, and those risks and uncertainties detailed from time to time in our filings with the Securities and Exchange Commission, including our 2007 Form 10-K. We assume no obligation to update or supplement forward-looking statements that become untrue because of subsequent events.
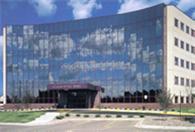
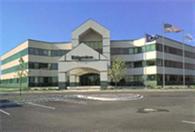
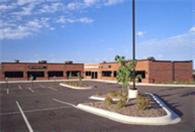
Properties included in Fourth Quarter Fiscal 2008 Acquisitions
| Fairview South Physicians Building | | 303 Ridgeview Medical Office Building |
| Edina, MN | | Burnsville, MN |
| | |
| | | |
| Riverside Park Plaza Building | | Eagan Medical Building |
| Minneapolis, MN | | Eagan, MN |
| | |
Investment Cost by Segment as of April 30, 2008
With investments in the multi-family residential, commercial office, commercial medical, commercial industrial and commercial retail segments, IRET’s balanced portfolio helps to provide stability during market fluctuations in returns from specific property types.
INVESTORS REAL ESTATE TRUST AND SUBSIDIARIES
CONDENSED CONSOLIDATED STATEMENTS OF OPERATIONS (unaudited)
(in thousands, except per share data)
| | | Twelve Months Ended | | | Three Months Ended | |
| OPERATING RESULTS | | 04/30/2008 | | | 04/30/2007 | | | 04/30/2008 | | | 01/31/2008 | | | 10/31/2007 | | | 07/31/2007 | | | 04/30/2007 | |
| Real estate revenue | | $ | 221,170 | | | $ | 197,538 | | | $ | 58,962 | | | $ | 54,424 | | | $ | 54,211 | | | $ | 53,573 | | | $ | 53,666 | |
| Real estate expenses | | | 87,405 | | | | 76,332 | | | | 23,911 | | | | 21,567 | | | | 21,053 | | | | 20,874 | | | | 21,633 | |
| Net operating income | | | 133,765 | | | | 121,206 | | | | 35,051 | | | | 32,857 | | | | 33,158 | | | | 32,699 | | | | 32,033 | |
| Interest | | | (63,439 | ) | | | (58,424 | ) | | | (16,470 | ) | | | (15,840 | ) | | | (15,687 | ) | | | (15,442 | ) | | | (15,323 | ) |
| Depreciation/amortization | | | (51,518 | ) | | | (45,501 | ) | | | (13,974 | ) | | | (12,508 | ) | | | (12,504 | ) | | | (12,532 | ) | | | (12,164 | ) |
| Administrative, advisory and trustee fees | | | (5,203 | ) | | | (4,451 | ) | | | (1,392 | ) | | | (1,348 | ) | | | (1,267 | ) | | | (1,196 | ) | | | (1,177 | ) |
| Operating expenses | | | (1,344 | ) | | | (1,240 | ) | | | (291 | ) | | | (343 | ) | | | (457 | ) | | | (253 | ) | | | (307 | ) |
| Non-operating income | | | 2,760 | | | | 2,665 | | | | 671 | | | | 1,023 | | | | 431 | | | | 635 | | | | 695 | |
| Income before minority interest and discontinued operations and (loss) gain on sale of other investments | | $ | 15,021 | | | $ | 14,255 | | | $ | 3,595 | | | $ | 3,841 | | | $ | 3,674 | | | $ | 3,911 | | | $ | 3,757 | |
| | | | | | | | | | | | | | | | | | | | | | | | | | | | | |
| Gain (loss) on sale of other investments | | | 42 | | | | (38 | ) | | | 38 | | | | 2 | | | | 3 | | | | (1 | ) | | | (1 | ) |
| Minority interest portion of operating partnership income | | | (3,524 | ) | | | (3,217 | ) | | | (833 | ) | | | (855 | ) | | | (855 | ) | | | (981 | ) | | | (921 | ) |
| Minority interest portion of other partnerships’ (income) loss | | | 136 | | | | 26 | | | | 111 | | | | (11 | ) | | | 0 | | | | 36 | | | | 39 | |
| Income from continuing operations | | | 11,675 | | | | 11,026 | | | | 2,911 | | | | 2,977 | | | | 2,822 | | | | 2,965 | | | | 2,874 | |
| Discontinued operations, net of minority interest | | | 413 | | | | 3,084 | | | | 377 | | | | 6 | | | | 14 | | | | 16 | | | | 1,161 | |
| NET INCOME | | | 12,088 | | | | 14,110 | | | | 3,288 | | | | 2,983 | | | | 2,836 | | | | 2,981 | | | | 4,035 | |
| Dividends to preferred shareholders | | | (2,372 | ) | | | (2,372 | ) | | | (593 | ) | | | (593 | ) | | | (593 | ) | | | (593 | ) | | | (593 | ) |
| NET INCOME AVAILABLE TO COMMON SHAREHOLDERS | | $ | 9,716 | | | $ | 11,738 | | | $ | 2,695 | | | $ | 2,390 | | | $ | 2,243 | | | $ | 2,388 | | | $ | 3,442 | |
| | | | | | | | | | | | | | | | | | | | | | | | | | | | | |
| Per Share Data | | | | | | | | | | | | | | | | | | | | | | | | | | | | |
Earnings per common share from continuing operations | | $ | .17 | | | $ | .18 | | | $ | .04 | | | $ | .04 | | | $ | .04 | | | $ | .05 | | | $ | .05 | |
Earnings per common share from discontinued operations | | | .01 | | | | .06 | | | | .01 | | | | .00 | | | | .00 | | | | .00 | | | | .02 | |
| Net income per common share – basic & diluted | | $ | .18 | | | $ | .24 | | | $ | .05 | | | $ | .04 | | | $ | .04 | | | $ | .05 | | | $ | .07 | |
| | | | | | | | | | | | | | | | | | | | | | | | | | | | | |
| Percentage of Revenues | | | | | | | | | | | | | | | | | | | | | | | | | | | | |
| Real estate expenses | | | 39.5 | % | | | 38.6 | % | | | 40.6 | % | | | 39.6 | % | | | 38.8 | % | | | 39.0 | % | | | 40.3 | % |
| General and administrative | | | 2.4 | % | | | 2.3 | % | | | 2.4 | % | | | 2.5 | % | | | 2.3 | % | | | 2.2 | % | | | 2.2 | % |
| | | | | | | | | | | | | | | | | | | | | | | | | | | | | |
| Ratios | | | | | | | | | | | | | | | | | | | | | | | | | | | | |
| EBITDA/Interest expense | | | 2.02 | x | | | 1.99 | x | | | 2.04 | x | | | 1.97 | x | | | 2.01 | x | | | 2.04 | x | | | 2.01 | x |
| EBITDA/Interest expense plus preferred distributions | | | 1.94 | x | | | 1.91 | x | | | 1.97 | x | | | 1.90 | x | | | 1.93 | x | | | 1.97 | x | | | 1.93 | x |
INVESTORS REAL ESTATE TRUST AND SUBSIDIARIES
CONDENSED CONSOLIDATED BALANCE SHEETS (unaudited)
(in thousands)
| | | 04/30/2008 | | | 01/31/2008 | | | 10/31/2007 | | | 07/31/2007 | | | 04/30/2007 | |
| ASSETS | | | | | | | | | | | | | | | |
| Real estate investments | | | | | | | | | | | | | | | |
| Property owned | | $ | 1,648,259 | | | $ | 1,558,560 | | | $ | 1,529,063 | | | $ | 1,520,975 | | | $ | 1,489,287 | |
| Less accumulated depreciation | | | (219,379 | ) | | | (209,400 | ) | | | (199,682 | ) | | | (190,127 | ) | | | (180,544 | ) |
| | | | 1,428,880 | | | | 1,349,160 | | | | 1,329,381 | | | | 1,330,848 | | | | 1,308,743 | |
| Development in progress | | | 22,856 | | | | 14,734 | | | | 10,553 | | | | 4,853 | | | | 3,498 | |
| Unimproved land | | | 3,901 | | | | 3,901 | | | | 3,901 | | | | 4,165 | | | | 3,894 | |
| Mortgage loan receivable, net of allowance | | | 541 | | | | 548 | | | | 391 | | | | 393 | | | | 399 | |
| Total real estate investments | | | 1,456,178 | | | | 1,368,343 | | | | 1,344,226 | | | | 1,340,259 | | | | 1,316,534 | |
| Other assets | | | | | | | | | | | | | | | | | | | | |
| Cash and cash equivalents | | | 53,481 | | | | 76,392 | | | | 89,302 | | | | 24,647 | | | | 44,516 | |
| Marketable securities – available-for-sale | | | 420 | | | | 2,160 | | | | 2,090 | | | | 2,046 | | | | 2,048 | |
| Receivable arising from straight-lining of rents, net of allowance | | | 14,113 | | | | 13,753 | | | | 13,430 | | | | 13,097 | | | | 12,558 | |
| Accounts receivable, net of allowance | | | 4,163 | | | | 3,842 | | | | 2,279 | | | | 2,980 | | | | 3,171 | |
| Real estate deposits | | | 1,379 | | | | 1,103 | | | | 1,601 | | | | 272 | | | | 735 | |
| Prepaid and other assets | | | 349 | | | | 821 | | | | 1,445 | | | | 1,917 | | | | 568 | |
| Intangible assets, net of accumulated amortization | | | 61,649 | | | | 29,025 | | | | 30,457 | | | | 32,999 | | | | 33,240 | |
| Tax, insurance, and other escrow | | | 8,642 | | | | 8,060 | | | | 6,539 | | | | 7,529 | | | | 7,222 | |
| Property and equipment, net | | | 1,467 | | | | 1,487 | | | | 1,486 | | | | 1,476 | | | | 1,458 | |
| Goodwill | | | 1,392 | | | | 1,396 | | | | 1,397 | | | | 1,397 | | | | 1,397 | |
| Deferred charges and leasing costs, net | | | 14,793 | | | | 13,528 | | | | 12,624 | | | | 12,447 | | | | 11,942 | |
| TOTAL ASSETS | | $ | 1,618,026 | | | $ | 1,519,910 | | | $ | 1,506,876 | | | $ | 1,441,066 | | | $ | 1,435,389 | |
| | | | | | | | | | | | | | | | | | | | | |
| LIABILITIES AND SHAREHOLDERS’ EQUITY | | | | | | | | | | | | | | | | | | | | |
| LIABILITIES | | | | | | | | | | | | | | | | | | | | |
| Accounts payable and accrued expenses | | $ | 33,757 | | | $ | 29,573 | | | $ | 22,974 | | | $ | 25,205 | | | $ | 28,995 | |
| Mortgages payable | | | 1,063,858 | | | | 975,785 | | | | 967,612 | | | | 960,086 | | | | 951,139 | |
| Other | | | 978 | | | | 1,019 | | | | 1,161 | | | | 1,103 | | | | 896 | |
| TOTAL LIABILITIES | | | 1,098,593 | | | | 1,006,377 | | | | 991,747 | | | | 986,394 | | | | 981,030 | |
| | | | | | | | | | | | | | | | | | | | | |
| COMMITMENTS AND CONTINGENCIES | | | | | | | | | | | | | | | | | | | | |
| MINORITY INTEREST IN PARTNERSHIPS | | | 12,609 | | | | 12,768 | | | | 12,781 | | | | 12,818 | | | | 12,925 | |
| MINORITY INTEREST OF UNITHOLDERS IN OPERATING PARTNERSHIP | | | 161,818 | | | | 155,301 | | | | 154,274 | | | | 159,477 | | | | 156,465 | |
| SHAREHOLDERS’ EQUITY | | | | | | | | | | | | | | | | | | | | |
| Preferred Shares of Beneficial Interest | | | 27,317 | | | | 27,317 | | | | 27,317 | | | | 27,317 | | | | 27,317 | |
| Common Shares of Beneficial Interest | | | 440,187 | | | | 433,645 | | | | 429,236 | | | | 357,614 | | | | 354,495 | |
| Accumulated distributions in excess of net income | | | (122,498 | ) | | | (115,546 | ) | | | (108,474 | ) | | | (102,526 | ) | | | (96,827 | ) |
| Accumulated other comprehensive income (loss) | | | 0 | | | | 48 | | | | (5 | ) | | | (28 | ) | | | (16 | ) |
| Total shareholders’ equity | | | 345,006 | | | | 345,464 | | | | 348,074 | | | | 282,377 | | | | 284,969 | |
| TOTAL LIABILITIES AND SHAREHOLDERS’ EQUITY | | $ | 1,618,026 | | | $ | 1,519,910 | | | $ | 1,506,876 | | | $ | 1,441,066 | | | $ | 1,435,389 | |
INVESTORS REAL ESTATE TRUST AND SUBSIDIARIES
FUNDS FROM OPERATIONS (unaudited)
(in thousands, except per share and unit data)
| | | Twelve Months Ended | | | Three Months Ended | |
| | | 04/30/2008 | | | 04/30/2007 | | | 04/30/2008 | | | 01/31/2008 | | | 10/31/2007 | | | 07/31/2007 | | | 04/30/2007 | |
Funds From Operations(1) | | | | | | | | | | | | | | | | | | | | | |
| Net income | | $ | 12,088 | | | $ | 14,110 | | | $ | 3,288 | | | $ | 2,983 | | | $ | 2,836 | | | $ | 2,981 | | | $ | 4,035 | |
| Less dividends to preferred shareholders | | | (2,372 | ) | | | (2,372 | ) | | | (593 | ) | | | (593 | ) | | | (593 | ) | | | (593 | ) | | | (593 | ) |
| Net income available to common shareholders | | | 9,716 | | | | 11,738 | | | | 2,695 | | | | 2,390 | | | | 2,243 | | | | 2,388 | | | | 3,442 | |
| Adjustments: | | | | | | | | | | | | | | | | | | | | | | | | | | | | |
| Minority interest in earnings of Unitholders | | | 3,677 | | | | 4,299 | | | | 973 | | | | 858 | | | | 859 | | | | 987 | | | | 1,390 | |
| Depreciation and amortization | | | 51,303 | | | | 45,559 | | | | 13,910 | | | | 12,456 | | | | 12,452 | | | | 12,485 | | | | 12,119 | |
| (Gains)/loss on depreciable property sales | | | (514 | ) | | | (4,602 | ) | | | (510 | ) | | | (2 | ) | | | (3 | ) | | | 1 | | | | (1,616 | ) |
| Funds from operations applicable to common shares and Units | | $ | 64,182 | | | $ | 56,994 | | | $ | 17,068 | | | $ | 15,702 | | | $ | 15,551 | | | $ | 15,861 | | | $ | 15,335 | |
| | | | | | | | | | | | | | | | | | | | | | | | | | | | | |
| FFO per share and unit - basic and diluted | | $ | 0.87 | | | $ | 0.88 | | | $ | 0.22 | | | $ | 0.21 | | | $ | 0.21 | | | $ | 0.23 | | | $ | 0.23 | |
| Weighted average shares and units | | | 73,477 | | | | 64,689 | | | | 78,195 | | | | 75,755 | | | | 70,158 | | | | 68,947 | | | | 67,284 | |
| (1) | Funds From Operations (FFO) - The National Association of Real Estate Investment Trusts, Inc. (NAREIT) defines FFO as net income (computed in accordance with generally accepted accounting principles, excluding gains/losses from sales of property plus real estate depreciation and amortization. We consider FFO to be a standard supplemental measure for equity real estate investment trusts because it facilitates an understanding of the operating performance of properties without giving effect to real estate depreciation and amortization, which assume that the value of real estate assets diminishes predictably over time. Since real estate values instead historically rise or fall with market conditions, we believe that FFO provides investors and management with a more accurate indication of our financial and operating results. |
INVESTORS REAL ESTATE TRUST AND SUBSIDIARIES
EARNINGS BEFORE INTEREST, TAXES, DEPRECIATION AND AMORTIZATION (EBITDA) (unaudited)
(in thousands)
| | | Three Months Ended | |
| | | 04/30/2008 | | | 01/31/2007 | | | 10/31/2007 | | | 07/31/2007 | | | 04/30/2007 | |
EBITDA(1) | | | | | | | | | | | | | | | |
| Net income | | $ | 3,288 | | | $ | 2,983 | | | $ | 2,836 | | | $ | 2,981 | | | $ | 4,035 | |
| Adjustments: | | | | | | | | | | | | | | | | | | | | |
| Minority interest portion of operating partnership income | | | 973 | | | | 858 | | | | 859 | | | | 987 | | | | 1,390 | |
| Income before minority interest | | | 4,261 | | | | 3,841 | | | | 3,695 | | | | 3,968 | | | | 5,425 | |
| Add: | | | | | | | | | | | | | | | | | | | | |
| Interest | | | 16,470 | | | | 15,840 | | | | 15,687 | | | | 15,442 | | | | 15,366 | |
| Depreciation/amortization related to real estate investments | | | 13,542 | | | | 12,165 | | | | 12,177 | | | | 12,205 | | | | 11,823 | |
| Amortization related to non-real estate investments | | | 437 | | | | 356 | | | | 340 | | | | 343 | | | | 362 | |
| Amortization related to real estate revenues | | | (65 | ) | | | (79 | ) | | | (99 | ) | | | (40 | ) | | | (32 | ) |
| Less: | | | | | | | | | | | | | | | | | | | | |
| Interest income | | | (449 | ) | | | (953 | ) | | | (339 | ) | | | (354 | ) | | | (541 | ) |
| (Gain) loss on sale of real estate, land and other investments | | | (552 | ) | | | (2 | ) | | | (3 | ) | | | 1 | | | | (1,616 | ) |
| EBITDA | | $ | 33,644 | | | $ | 31,168 | | | $ | 31,458 | | | $ | 31,565 | | | $ | 30,787 | |
| (1) | EBITDA is earnings before interest, taxes, depreciation and amortization. We consider EBITDA to be an appropriate supplemental performance measure because it eliminates depreciation, interest and the gain/loss from property dispositions, which permits investors to view income from operations without the effect of non-cash depreciation or the cost of debt. EBITDA is a non-GAAP measure. EBITDA as calculated by us is not comparable to EBITDA reported by other REITs that do not define EBITDA exactly as we do. |
INVESTORS REAL ESTATE TRUST AND SUBSIDIARIES
LONG-TERM MORTGAGE DEBT ANALYSIS
(in thousands)
Debt Maturity Schedule
Annual Expirations
| | | Future Maturities of Debt | |
| Fiscal Year | | Fixed Debt | | | Variable Debt | | | Total Debt | |
| 2009 | | $ | 15,144 | | | $ | 2,627 | | | $ | 17,771 | |
| 2010 | | | 130,719 | | | | 2,500 | | | | 133,219 | |
| 2011 | | | 83,133 | | | | 0 | | | | 83,133 | |
| 2012 | | | 89,822 | | | | 0 | | | | 89,822 | |
| 2013 | | | 26,371 | | | | 5,389 | | | | 31,760 | |
| 2014 | | | 50,160 | | | | 0 | | | | 50,160 | |
| 2015 | | | 73,244 | | | | 0 | | | | 73,244 | |
| 2016 | | | 67,587 | | | | 0 | | | | 67,587 | |
| 2017 | | | 163,012 | | | | 0 | | | | 163,012 | |
| Thereafter | | | 352,970 | | | | 1,180 | | | | 354,150 | |
| Total maturities | | $ | 1,052,162 | | | $ | 11,696 | | | $ | 1,063,858 | |
| | | 04/30/2008 | | | 01/31/2008 | | | 10/31/2007 | | | 07/31/2007 | | | 04/30/2007 | |
| Balances Outstanding | | | | | | | | | | | | | | | |
| Mortgage | | | | | | | | | | | | | | | |
| fixed rate | | $ | 1,052,162 | | | $ | 951,112 | | | $ | 943,632 | | | $ | 938,677 | | | $ | 929,474 | |
| variable rate | | | 11,696 | | | | 24,673 | | | | 23,980 | | | | 21,409 | | | | 21,665 | |
| Mortgage total | | | 1,063,858 | | | | 975,785 | | | | 967,612 | | | | 960,086 | | | | 951,139 | |
| | | | | | | | | | | | | | | | | | | | | |
| Weighted Average Interest Rates | | | | | | | | | | | | | | | | | | | | |
| Secured | | | 6.37 | % | | | 6.44 | % | | | 6.36 | % | | | 6.37 | % | | | 6.43 | % |
INVESTORS REAL ESTATE TRUST AND SUBSIDIARIES
CAPITAL ANALYSIS
(in thousands, except per share and unit amounts)
| | | 04/30/2008 | | | 01/31/2008 | | | 10/31/2007 | | | 07/31/2007 | | | 04/30/2007 | |
| Equity Capitalization | | | | | | | | | | | | | | | |
| Common shares outstanding | | | 57,732 | | | | 56,977 | | | | 56,419 | | | | 48,893 | | | | 48,570 | |
| Operating partnership (OP) units outstanding | | | 21,238 | | | | 20,395 | | | | 20,114 | | | | 20,494 | | | | 19,981 | |
| Total common shares and OP units outstanding | | | 78,970 | | | | 77,372 | | | | 76.533 | | | | 69,387 | | | | 68,551 | |
Market price per common share (closing price at end of period) | | $ | 10.20 | | | $ | 9.80 | | | $ | 10.85 | | | $ | 9.62 | | | $ | 10.55 | |
| Equity capitalization-common shares and OP units | | $ | 805,494 | | | $ | 758,246 | | | $ | 830,383 | | | $ | 667,503 | | | $ | 723,213 | |
| Recorded book value of preferred shares | | $ | 27,317 | | | $ | 27,317 | | | $ | 27,317 | | | $ | 27,317 | | | $ | 27,317 | |
| Total equity capitalization | | $ | 832,811 | | | $ | 785,563 | | | $ | 857,700 | | | $ | 694,820 | | | $ | 750,530 | |
| | | | | | | | | | | | | | | | | | | | | |
| Debt Capitalization | | | | | | | | | | | | | | | | | | | | |
| Total mortgage debt | | $ | 1,063,858 | | | $ | 975,785 | | | $ | 967,612 | | | $ | 960,086 | | | $ | 951,139 | |
| Total capitalization | | $ | 1,896,669 | | | $ | 1,761,348 | | | $ | 1,825,312 | | | $ | 1,654,906 | | | $ | 1,701,669 | |
| | | | | | | | | | | | | | | | | | | | | |
| Total debt to total capitalization | | 0.56:1 | | | 0.55:1 | | | 0.53:1 | | | 0.58:1 | | | 0.56:1 | |
| | | | | | | | | | | | | | | | | | | | | |
Earnings to fixed charges(1) | | | 1.16 | x | | | 1.17 | x | | | 1.17 | x | | | 1.18 | x | | | 1.17 | x |
Debt service coverage ratio(2) | | | 1.48 | x | | | 1.42 | x | | | 1.46 | x | | | 1.48 | x | | | 1.46 | x |
| | | | | | | | | | | | | | | | | | | | | |
| Distribution Data | | | | | | | | | | | | | | | | | | | | |
| Common shares and units outstanding at record date | | | 77,675 | | | | 76,698 | | | | 69,363 | | | | 68,523 | | | | 67,638 | |
| Total common distribution paid | | $ | 13,049 | | | $ | 12,847 | | | $ | 11,584 | | | $ | 11,409 | | | $ | 11,228 | |
| Common distribution per share and unit | | $ | 0.1680 | | | $ | 0.1675 | | | $ | 0.1670 | | | $ | 0.1665 | | | $ | 0.1660 | |
Payout ratio (FFO per share and unit basis)(3) | | | 76.4 | % | | | 79.8 | % | | | 79.5 | % | | | 72.4 | % | | | 72.2 | % |
| (1) | The ratio of earnings to fixed charges is computed by dividing earnings by fixed charges. For this purpose, earnings consist of income from continuing operations before adjustments for minority interest in consolidated subsidiaries plus fixed charges, less capitalized interest. Fixed charges consist of mortgage and loan interest expense, whether expensed or capitalized, the amortization of debt expense and capitalized interest. |
| (2) | Debt service coverage ratio is computed by dividing earnings before interest income and expense, depreciation, amortization and gain on sale of real estate by interest expense and principal amortization. |
| (3) | The ratio of the current quarterly distribution rate per common share and unit divided by quarterly FFO per share and unit. |
INVESTORS REAL ESTATE TRUST AND SUBSIDIARIES
STABILIZED PROPERTIES NET OPERATING INCOME SUMMARY
(in thousands)
| | | Stabilized Properties(1) | | | Stabilized Properties | |
| | | Three Months Ended April 30, | | | Twelve months Ended April 30, | |
| Segment | | 2008 | | | 2007 | | | % Change | | | 2008 | | | 2007 | | | % Change | |
| Multi-Family Residential | | $ | 8,617 | | | $ | 8,267 | | | | 4.2 | % | | $ | 35,310 | | | $ | 34,318 | | | | 2.9 | % |
| Commercial Office | | | 8,747 | | | | 8,818 | | | | (0.8 | %) | | | 33,916 | | | | 34,675 | | | | (2.2 | %) |
| Commercial Medical | | | 6,751 | | | | 6,470 | | | | 4.3 | % | | | 26,260 | | | | 25,823 | | | | 1.7 | % |
| Commercial Industrial | | | 1,358 | | | | 1,637 | | | | (17.0 | %) | | | 6,172 | | | | 6,317 | | | | (2.3 | %) |
| Commercial Retail | | | 2,498 | | | | 2,450 | | | | 2.0 | % | | | 9,580 | | | | 9,229 | | | | 3.8 | % |
| | | $ | 27,971 | | | $ | 27,642 | | | | 1.2 | % | | $ | 111,238 | | | $ | 110,362 | | | | 0.8 | % |
| 1. | For 4th Quarter 2008 and 4th Quarter 2007, stabilized properties excluded: |
| | Multi-Family Residential - | 17 South Main Apartments, Minot, ND; Arbors Apartments, S. Sioux City, NE; Indian Hills, Sioux City, IA; Quarry Ridge Apartments, Rochester, MN; Rum River Apartments, Isanti, MN; St. Cloud Student Housing, St. Cloud, MN; Cottonwood IV Apartments, Bismarck, ND and Greenfield Apartments, Omaha, NE. |
| | Commercial Office - | 17 South Main, Minot, ND; Corporate Center West, Omaha, NE; Farnam Executive Center, Omaha, NE; Flagship, Eden Prairie, MN; Gateway Corporate, Woodbury, MN; Highlands Ranch I, Highlands Ranch, CO; Miracle Hills One, Omaha, NE; Pacific Hills, Omaha, NE; Riverport, Maryland Heights, MO; Timberlands, Leawood, KS; Woodlands Plaza, Maryland Heights, MO; 610 Business Center, Brooklyn Park, MN; Intertech, Fenton, MO and Plymouth 5095, Plymouth, MN. |
| | Commercial Medical - | 2828 Chicago Avenue, Minneapolis, MN; Fox River Cottages, Grand Chute, WI; St. Michaels, St. Michael, MN; Barry Point, Kansas City, MO; Edgewood Vista Billings, Billings, MT; Edgewood Vista East Grand Forks, East Grand Forks, MN; Edgewood Vista Sioux Falls, Sioux Falls, SD; Edina 6405 France Medical, Edina, MN; Edina 6363 France Medical, Edina, MN; Minneapolis 701 25th Ave Medical (Riverside), Minneapolis, MN; Burnsville 303 Nicollet Medical (Ridgeview), Burnsville, MN; Burnsville 305 Nicollet Medical (Ridgeview South), Burnsville, MN; Eagan 1440 Duckwood Medical, Eagan, MN; Edgewood Vista Belgrade, Belgrade, MT; Edgewood Vista Columbus, Columbus, NE; Edgewood Vista Fargo, Fargo, ND; Edgewood Vista Grand Island, Grand Island, NE and Edgewood Vista Norfolk, Norfolk, NE. |
| | Commercial Industrial - | Bloomington 2000, Bloomington, MN; Roseville 2929, Roseville, MN; Cedar Lake Business Center, St. Louis Park, MN; Urbandale, Urbandale, IA; Woodbury 1865, Woodbury, MN and Eagan 3785 & 2795 Highway 55, Eagan, MN. |
| | Commercial Retail - | 17 South Main, Minot, ND; Dakota West Plaza, Minot, ND and Weston Walgreens, Weston, WI. |
| 2. | Discontinued operations include: |
| | Multi-Family Residential - | 405 Grant Avenue Apartments, Harvey, ND and Sweetwater – Green Acres 1&2 Apartments, Devils Lake, ND. |
| | Commercial Office - | Minnetonka Office Building, Minnetonka, MN. |
INVESTORS REAL ESTATE TRUST AND SUBSIDIARIES
NET OPERATING INCOME DETAIL
(in thousands)
| | | Three Months Ended April 30, 2008 | |
| | | Multi-Family Residential | | | Commercial Office | | | Commercial Medical | | | Commercial Industrial | | | Commercial Retail | | | Corporate and Other | | | Total | |
| Real estate rental revenue | | | | | | | | | | | | | | | | | | | | | |
Stabilized(1) | | $ | 16,801 | | | $ | 15,932 | | | $ | 9,154 | | | $ | 1,706 | | | $ | 3,524 | | | $ | 0 | | | $ | 47,117 | |
| Non-Stabilized | | | 1,668 | | | | 6,284 | | | | 2,494 | | | | 1,268 | | | | 131 | | | | 0 | | | | 11,845 | |
| Total | | | 18,469 | | | | 22,216 | | | | 11,648 | | | | 2,974 | | | | 3,655 | | | | 0 | | | | 58,962 | |
| | | | | | | | | | | | | | | | | | | | | | | | | | | | | |
| Real estate expenses | | | | | | | | | | | | | | | | | | | | | | | | | | | | |
Stabilized(1) | | | 8,184 | | | | 7,185 | | | | 2,403 | | | | 348 | | | | 1,026 | | | | 0 | | | | 19,146 | |
| Non-Stabilized | | | 879 | | | | 2,731 | | | | 777 | | | | 346 | | | | 32 | | | | 0 | | | | 4,765 | |
| Total | | | 9,063 | | | | 9,916 | | | | 3,180 | | | | 694 | | | | 1,058 | | | | 0 | | | | 23,911 | |
| | | | | | | | | | | | | | | | | | | | | | | | | | | | | |
| Net Operating Income (NOI) | | | | | | | | | | | | | | | | | | | | | | | | | | | | |
Stabilized(1) | | | 8,617 | | | | 8,747 | | | | 6,751 | | | | 1,358 | | | | 2,498 | | | | 0 | | | | 27,971 | |
| Non-Stabilized | | | 789 | | | | 3,553 | | | | 1,717 | | | | 922 | | | | 99 | | | | 0 | | | | 7,080 | |
| Net operating income | | $ | 9,406 | | | $ | 12,300 | | | $ | 8,468 | | | $ | 2,280 | | | $ | 2,597 | | | $ | 0 | | | $ | 35,051 | |
| | | | | | | | | | | | | | | | | | | | | | | | | | | | | |
| Reconciliation of NOI to net income available to common shareholders | | | | | | | | | | | | | | | | | | | | | | | | | | | | |
| Interest (expense) income | | $ | (5,024 | ) | | $ | (5,912 | ) | | $ | (3,913 | ) | | $ | (932 | ) | | $ | (1,051 | ) | | $ | 362 | | | $ | (16,470 | ) |
| Depreciation/amortization | | | (3,417 | ) | | | (5,452 | ) | | | (3,158 | ) | | | (1,133 | ) | | | (753 | ) | | | (61 | ) | | | (13,974 | ) |
Administrative, advisory and trustee fees | | | 0 | | | | 0 | | | | 0 | | | | 0 | | | | 0 | | | | (1,392 | ) | | | (1,392 | ) |
| Operating expenses | | | 0 | | | | 0 | | | | 0 | | | | 0 | | | | 0 | | | | (291 | ) | | | (291 | ) |
| Non-operating income | | | 0 | | | | 0 | | | | 0 | | | | 0 | | | | 0 | | | | 671 | | | | 671 | |
| Income before minority interest and discontinued operations and (loss) gain on sale of other investments | | | 965 | | | | 936 | | | | 1,397 | | | | 215 | | | | 793 | | | | (711 | ) | | | 3,595 | |
| Gain on sale of other investments | | | 0 | | | | 0 | | | | 0 | | | | 0 | | | | 0 | | | | 38 | | | | 38 | |
| Minority interest portion of operating partnership income | | | 0 | | | | 0 | | | | 0 | | | | 0 | | | | 0 | | | | (833 | ) | | | (833 | ) |
| Minority interest portion of other partnerships’ loss | | | 0 | | | | 0 | | | | 0 | | | | 0 | | | | 0 | | | | 111 | | | | 111 | |
| Income from continuing operations | | | 965 | | | | 936 | | | | 1,397 | | | | 215 | | | | 793 | | | | (1,395 | ) | | | 2,911 | |
Discontinued operations, net of minority interest(2) | | | (136 | ) | | | (1 | ) | | | 0 | | | | 0 | | | | 0 | | | | 514 | | | | 377 | |
| NET INCOME | | | 829 | | | | 935 | | | | 1,397 | | | | 215 | | | | 793 | | | | (881 | ) | | | 3,288 | |
| Dividends to preferred shareholders | | | 0 | | | | 0 | | | | 0 | | | | 0 | | | | 0 | | | | (593 | ) | | | (593 | ) |
| NET INCOME AVAILABLE TO COMMON SHAREHOLDERS | | $ | 829 | | | $ | 935 | | | $ | 1,397 | | | $ | 215 | | | $ | 793 | | | $ | (1,474 | ) | | $ | 2,695 | |
| 1. | For 4th Quarter 2008 and 4th Quarter 2007, stabilized properties excluded: |
| | Multi-Family Residential - | 17 South Main Apartments, Minot, ND; Arbors Apartments, S. Sioux City, NE; Indian Hills, Sioux City, IA; Quarry Ridge Apartments, Rochester, MN; Rum River Apartments, Isanti, MN; St. Cloud Student Housing, St. Cloud, MN; Cottonwood IV Apartments, Bismarck, ND and Greenfield Apartments, Omaha, NE. |
| | Commercial Office - | 17 South Main, Minot, ND; Corporate Center West, Omaha, NE; Farnam Executive Center, Omaha, NE; Flagship, Eden Prairie, MN; Gateway Corporate, Woodbury, MN; Highlands Ranch I, Highlands Ranch, CO; Miracle Hills One, Omaha, NE; Pacific Hills, Omaha, NE; Riverport, Maryland Heights, MO; Timberlands, Leawood, KS; Woodlands Plaza, Maryland Heights, MO; 610 Business Center, Brooklyn Park, MN; Intertech, Fenton, MO and Plymouth 5095, Plymouth, MN. |
| | Commercial Medical - | 2828 Chicago Avenue, Minneapolis, MN; Fox River Cottages, Grand Chute, WI; St. Michaels, St. Michael, MN; Barry Point, Kansas City, MO and Edgewood Vista Billings, Billings, MT; Edgewood Vista East Grand Forks, East Grand Forks, MN; Edgewood Vista Sioux Falls, Sioux Falls, SD; Edina 6405 France Medical, Edina, MN; Edina 6363 France Medical, Edina, MN; Minneapolis 701 25th Ave Medical (Riverside), Minneapolis, MN; Burnsville 303 Nicollet Medical (Ridgeview), Burnsville, MN; Burnsville 305 Nicollet Medical (Ridgeview South), Burnsville, MN; Eagan 1440 Duckwood Medical, Eagan, MN; Edgewood Vista Belgrade, Belgrade, MT; Edgewood Vista Columbus, Columbus, NE; Edgewood Vista Fargo, Fargo, ND; Edgewood Vista Grand Island, Grand Island, NE and Edgewood Vista Norfolk, Norfolk, NE. |
| | Commercial Industrial - | Bloomington 2000, Bloomington, MN; Roseville 2929, Roseville, MN; Cedar Lake Business Center, St. Louis Park, MN; Urbandale, Urbandale, IA; Woodbury 1865, Woodbury, MN and Eagan 3785 & 2795 Highway 55, Eagan, MN. |
| | Commercial Retail - | 17 South Main, Minot, ND; Dakota West Plaza, Minot, ND and Weston Walgreens, Weston, WI. |
| 2. | Discontinued operations include: |
| | Multi-Family Residential - | 405 Grant Avenue Apartments, Harvey, ND and Sweetwater – Green Acres 1&2 Apartments, Devils Lake, ND |
| | Commercial Office - | Minnetonka Office Building, Minnetonka, MN. |
INVESTORS REAL ESTATE TRUST AND SUBSIDIARIES
NET OPERATING INCOME DETAIL
(in thousands)
| | | Three Months Ended April 30, 2007 | |
| | | Multi-Family Residential | | | Commercial Office | | | Commercial Medical | | | Commercial Industrial | | | Commercial Retail | | | Corporate and Other | | | Total | |
| Real estate rental revenue | | | | | | | | | | | | | | | | | | | | | |
Stabilized(1) | | $ | 16,213 | | | $ | 15,750 | | | $ | 8,829 | | | $ | 1,956 | | | $ | 3,694 | | | $ | 0 | | | $ | 46,442 | |
| Non-Stabilized | | | 1,117 | | | | 5,304 | | | | 137 | | | | 497 | | | | 169 | | | | 0 | | | | 7,224 | |
| Total | | | 17,330 | | | | 21,054 | | | | 8,966 | | | | 2,453 | | | | 3,863 | | | | 0 | | | | 53,666 | |
| | | | | | | | | | | | | | | | | | | | | | | | | | | | | |
| Real estate expenses | | | | | | | | | | | | | | | | | | | | | | | | | | | | |
Stabilized(1) | | | 7,946 | | | | 6,932 | | | | 2,359 | | | | 319 | | | | 1,244 | | | | 0 | | | | 18,800 | |
| Non-Stabilized | | | 541 | | | | 2,115 | | | | 20 | | | | 135 | | | | 22 | | | | 0 | | | | 2,833 | |
| Total | | | 8,487 | | | | 9,047 | | | | 2,379 | | | | 454 | | | | 1,266 | | | | 0 | | | | 21,633 | |
| | | | | | | | | | | | | | | | | | | | | | | | | | | | | |
| Net Operating Income (NOI) | | | | | | | | | | | | | | | | | | | | | | | | | | | | |
Stabilized(1) | | | 8,267 | | | | 8,818 | | | | 6,470 | | | | 1,637 | | | | 2,450 | | | | 0 | | | | 27,642 | |
| Non-Stabilized | | | 576 | | | | 3,189 | | | | 117 | | | | 362 | | | | 147 | | | | 0 | | | | 4,391 | |
| Net operating income | | $ | 8,843 | | | $ | 12,007 | | | $ | 6,587 | | | $ | 1,999 | | | $ | 2,597 | | | $ | 0 | | | $ | 32,033 | |
| | | | | | | | | | | | | | | | | | | | | | | | | | | | | |
| Reconciliation of NOI to net income available to common shareholders | | | | | | | | | | | | | | | | | | | | | | | | | | | | |
| Interest | | $ | (4,855 | ) | | $ | (5,718 | ) | | $ | (2,817 | ) | | $ | (648 | ) | | $ | (1,016 | ) | | $ | (269 | ) | | $ | (15,323 | ) |
| Depreciation/amortization | | | (3,167 | ) | | | (5,301 | ) | | | (2,060 | ) | | | (531 | ) | | | (677 | ) | | | (428 | ) | | | (12,164 | ) |
Administrative, advisory and trustee fees | | | 0 | | | | 0 | | | | 0 | | | | 0 | | | | 0 | | | | (1,177 | ) | | | (1,177 | ) |
| Operating expenses | | | 0 | | | | 0 | | | | 0 | | | | 0 | | | | 0 | | | | (307 | ) | | | (307 | ) |
| Non-operating income | | | 0 | | | | 0 | | | | 0 | | | | 0 | | | | 0 | | | | 695 | | | | 695 | |
| Income before minority interest and discontinued operations and (loss) gain on sale of other investments | | | 821 | | | | 988 | | | | 1,710 | | | | 820 | | | | 904 | | | | (1,486 | ) | | | 3,757 | |
| Loss on sale of other investments | | | 0 | | | | 0 | | | | 0 | | | | 0 | | | | 0 | | | | (1 | ) | | | (1 | ) |
| Minority interest portion of operating partnership income | | | 0 | | | | 0 | | | | 0 | | | | 0 | | | | 0 | | | | (921 | ) | | | (921 | ) |
| Minority interest portion of other partnerships’ loss | | | 0 | | | | 0 | | | | 0 | | | | 0 | | | | 0 | | | | 39 | | | | 39 | |
| Income from continuing operations | | | 821 | | | | 988 | | | | 1,710 | | | | 820 | | | | 904 | | | | (2,369 | ) | | | 2,874 | |
Discontinued operations, net of minority interest(2) | | | (490 | ) | | | 1 | | | | 0 | | | | 0 | | | | 3 | | | | 1,647 | | | | 1,161 | |
| NET INCOME | | | 331 | | | | 989 | | | | 1,710 | | | | 820 | | | | 907 | | | | (722 | ) | | | 4,035 | |
| Dividends to preferred shareholders | | | 0 | | | | 0 | | | | 0 | | | | 0 | | | | 0 | | | | (593 | ) | | | (593 | ) |
| NET INCOME AVAILABLE TO COMMON SHAREHOLDERS | | $ | 331 | | | $ | 989 | | | $ | 1,710 | | | $ | 820 | | | $ | 907 | | | $ | (1,315 | ) | | $ | 3,442 | |
| 1. | For 4th Quarter 2008 and 4th Quarter 2007, stabilized properties excluded: |
| | Multi-Family Residential - | 17 South Main Apartments, Minot, ND; Arbors Apartments, S. Sioux City, NE; Indian Hills, Sioux City, IA; Quarry Ridge Apartments, Rochester, MN; Rum River Apartments, Isanti, MN and St. Cloud Student Housing, St. Cloud, MN. |
| | Commercial Office - | 17 South Main, Minot, ND; Corporate Center West, Omaha, NE; Farnam Executive Center, Omaha, NE; Flagship, Eden Prairie, MN; Gateway Corporate, Woodbury, MN; Highlands Ranch I, Highlands Ranch, CO; Miracle Hills One, Omaha, NE; Pacific Hills, Omaha, NE; Riverport, Maryland Heights, MO; Timberlands, Leawood, KS and Woodlands Plaza, Maryland Heights, MO. |
| | Commercial Medical - | 2828 Chicago Avenue, Minneapolis, MN; Fox River Cottages, Grand Chute, WI and St. Michaels, St. Michael, MN. |
| | Commercial Industrial - | Bloomington 2000, Bloomington, MN and Roseville 2929, Roseville, MN. |
| | Commercial Retail - | 17 South Main, Minot, ND; Dakota West Plaza, Minot, ND and Weston Walgreens, Weston, WI. |
| 2. | Discontinued operations include: |
| | Multi-Family Residential - | Park East Apartments, Fargo, ND; Clearwater apartments, Boise, ID; 405 Grant Avenue Apartments, Harvey, ND and Sweetwater – Green Acres 1&2 Apartments, Devils Lake, ND. |
| | Commercial Office - | Minnetonka Office Building, Minnetonka, MN. |
| | Commercial Medical - | Wedgewood Sweetwater, Lithia Springs, GA. |
| | Commercial Retail - | Glencoe C-Store, Glencoe, MN; Faribault Checker, Faribault, MN; Long Prairie C-Store, Long Prairie, MN; Paynesville C-Store, Paynesville, MN and Prior Lake I & III Strip Center, Prior Lake, MN. |
| | Unimproved Land - | Long Prairie Unimproved Land, Long Prairie, MN. |
INVESTORS REAL ESTATE TRUST AND SUBSIDIARIES
NET OPERATING INCOME DETAIL
(in thousands)
| | | Twelve Months Ended April 30, 2008 | |
| | | Multi-Family Residential | | | Commercial Office | | | Commercial Medical | | | Commercial Industrial | | | Commercial Retail | | | Corporate and Other | | | Total | |
| Real estate rental revenue | | | | | | | | | | | | | | | | | | | | | |
Stabilized(1) | | $ | 66,900 | | | $ | 60,972 | | | $ | 34,990 | | | $ | 7,507 | | | $ | 13,720 | | | $ | 0 | | | $ | 184,089 | |
| Non-Stabilized | | | 5,927 | | | | 23,070 | | | | 3,422 | | | | 4,184 | | | | 478 | | | | 0 | | | | 37,081 | |
| Total | | | 72,827 | | | | 84,042 | | | | 38,412 | | | | 11,691 | | | | 14,198 | | | | 0 | | | | 221,170 | |
| | | | | | | | | | | | | | | | | | | | | | | | | | | | | |
| Real estate expenses | | | | | | | | | | | | | | | | | | | | | | | | | | | | |
Stabilized(1) | | | 31,590 | | | | 27,056 | | | | 8,730 | | | | 1,335 | | | | 4,140 | | | | 0 | | | | 72,851 | |
| Non-Stabilized | | | 3,047 | | | | 9,150 | | | | 1,026 | | | | 1,194 | | | | 137 | | | | 0 | | | | 14,554 | |
| Total | | | 34,637 | | | | 36,206 | | | | 9,756 | | | | 2,529 | | | | 4,277 | | | | 0 | | | | 87,405 | |
| | | | | | | | | | | | | | | | | | | | | | | | | | | | | |
| Net Operating Income (NOI) | | | | | | | | | | | | | | | | | | | | | | | | | | | | |
Stabilized(1) | | | 35,310 | | | | 33,916 | | | | 26,260 | | | | 6,172 | | | | 9,580 | | | | 0 | | | | 111,238 | |
| Non-Stabilized | | | 2,880 | | | | 13,920 | | | | 2,396 | | | | 2,990 | | | | 341 | | | | 0 | | | | 22,527 | |
| Net operating income | | $ | 38,190 | | | $ | 47,836 | | | $ | 28,656 | | | $ | 9,162 | | | $ | 9,921 | | | $ | 0 | | | $ | 133,765 | |
| | | | | | | | | | | | | | | | | | | | | | | | | | | | | |
| Reconciliation of NOI to net income available to common shareholders | | | | | | | | | | | | | | | | | | | | | | | | | | | | |
| Interest (expense) income | | $ | (20,004 | ) | | $ | (23,459 | ) | | $ | (12,651 | ) | | $ | (3,543 | ) | | $ | (4,260 | ) | | $ | 478 | | | $ | (63,439 | ) |
| Depreciation/amortization | | | (13,231 | ) | | | (21,003 | ) | | | (9,416 | ) | | | (3,405 | ) | | | (2,725 | ) | | | (1,738 | ) | | | (51,518 | ) |
Administrative, advisory and trustee fees | | | 0 | | | | 0 | | | | 0 | | | | 0 | | | | 0 | | | | (5,203 | ) | | | (5,203 | ) |
| Operating expenses | | | 0 | | | | 0 | | | | 0 | | | | 0 | | | | 0 | | | | (1,344 | ) | | | (1,344 | ) |
| Non-operating income | | | 0 | | | | 0 | | | | 0 | | | | 0 | | | | 0 | | | | 2,760 | | | | 2,760 | |
| Income before minority interest and discontinued operations and (loss) gain on sale of other investments | | | 4,955 | | | | 3,374 | | | | 6,589 | | | | 2,214 | | | | 2,936 | | | | (5,047 | ) | | | 15,021 | |
| Gain on sale of other investments | | | 0 | | | | 0 | | | | 0 | | | | 0 | | | | 0 | | | | 42 | | | | 42 | |
| Minority interest portion of operating partnership income | | | 0 | | | | 0 | | | | 0 | | | | 0 | | | | 0 | | | | (3,524 | ) | | | (3,524 | ) |
| Minority interest portion of other partnerships’ loss | | | 0 | | | | 0 | | | | 0 | | | | 0 | | | | 0 | | | | 136 | | | | 136 | |
| Income from continuing operations | | | 4,955 | | | | 3,374 | | | | 6,589 | | | | 2,214 | | | | 2,936 | | | | (8,393 | ) | | | 11,675 | |
Discontinued operations, net of minority interest(2) | | | (97 | ) | | | (4 | ) | | | 0 | | | | 0 | | | | 0 | | | | 514 | | | | 413 | |
| NET INCOME | | | 4,858 | | | | 3,370 | | | | 6,589 | | | | 2,214 | | | | 2,936 | | | | (7,879 | ) | | | 12,088 | |
| Dividends to preferred shareholders | | | 0 | | | | 0 | | | | 0 | | | | 0 | | | | 0 | | | | (2,372 | ) | | | (2,372 | ) |
| NET INCOME AVAILABLE TO COMMON SHAREHOLDERS | | $ | 4,858 | | | $ | 3,370 | | | $ | 6,589 | | | $ | 2,214 | | | $ | 2,936 | | | $ | (10,251 | ) | | $ | 9,716 | |
| 1. | For 4th Quarter 2008 and 4th Quarter 2007, stabilized properties excluded: |
| | Multi-Family Residential - | 17 South Main Apartments, Minot, ND; Arbors Apartments, S. Sioux City, NE; Indian Hills, Sioux City, IA; Quarry Ridge Apartments, Rochester, MN; Rum River Apartments, Isanti, MN; St. Cloud Student Housing, St. Cloud, MN; Cottonwood IV Apartments, Bismarck, ND and Greenfield Apartments, Omaha, NE. |
| | Commercial Office - | 17 South Main, Minot, ND; Corporate Center West, Omaha, NE; Farnam Executive Center, Omaha, NE; Flagship, Eden Prairie, MN; Gateway Corporate, Woodbury, MN; Highlands Ranch I, Highlands Ranch, CO; Miracle Hills One, Omaha, NE; Pacific Hills, Omaha, NE; Riverport, Maryland Heights, MO; Timberlands, Leawood, KS; Woodlands Plaza, Maryland Heights, MO; 610 Business Center, Brooklyn Park, MN; Intertech, Fenton, MO and Plymouth 5095, Plymouth, MN. |
| | Commercial Medical - | 2828 Chicago Avenue, Minneapolis, MN; Fox River Cottages, Grand Chute, WI; St. Michaels, St. Michael, MN; Barry Point, Kansas City, MO; Edgewood Vista East Grand Forks, East Grand Forks, MN; Edgewood Vista Sioux Falls, Sioux Falls, SD; Edina 6405 France Medical, Edina, MN; Edina 6363 France Medical, Edina, MN; Minneapolis 701 25th Ave Medical (Riverside), Minneapolis, MN; Burnsville 303 Nicollet Medical (Ridgeview), Burnsville, MN; Burnsville 305 Nicollet Medical (Ridgeview South), Burnsville, MN; Eagan 1440 Duckwood Medical, Eagan, MN; Edgewood Vista Belgrade, Belgrade, MT; Edgewood Vista Columbus, Columbus, NE; Edgewood Vista Fargo, Fargo, ND; Edgewood Vista Grand Island, Grand Island, NE and Edgewood Vista Norfolk, Norfolk, NE. |
| | Commercial Industrial - | Bloomington 2000, Bloomington, MN; Roseville 2929, Roseville, MN; Cedar Lake Business Center, St. Louis Park, MN; Urbandale, Urbandale, IA; Woodbury 1865, Woodbury, MN and Eagan 3785 & 2795 Highway 55, Eagan, MN. |
| | Commercial Retail - | 17 South Main, Minot, ND; Dakota West Plaza, Minot, ND and Weston Walgreens, Weston, WI. |
| 2. | Discontinued operations include: |
| | Multi-Family Residential - | 405 Grant Avenue Apartments, Harvey, ND and Sweetwater – Green Acres 1&2 Apartments, Devils Lake, ND. |
| | Commercial Office - | Minnetonka Office Building, Minnetonka, MN. |
INVESTORS REAL ESTATE TRUST AND SUBSIDIARIES
NET OPERATING INCOME DETAIL
(in thousands)
| | | Twelve Months Ended April 30, 2007 | |
| | | Multi-Family Residential | | | Commercial Office | | | Commercial Medical | | | Commercial Industrial | | | Commercial Retail | | | Corporate and Other | | | Total | |
| Real estate rental revenue | | | | | | | | | | | | | | | | | | | | | |
Stabilized(1) | | $ | 64,633 | | | $ | 60,402 | | | $ | 34,480 | | | $ | 7,394 | | | $ | 13,650 | | | $ | 0 | | | $ | 180,559 | |
| Non-Stabilized | | | 2,339 | | | | 13,201 | | | | 303 | | | | 697 | | | | 439 | | | | 0 | | | | 16,979 | |
| Total | | | 66,972 | | | | 73,603 | | | | 34,783 | | | | 8,091 | | | | 14,089 | | | | 0 | | | | 197,538 | |
| | | | | | | | | | | | | | | | | | | | | | | | | | | | | |
| Real estate expenses | | | | | | | | | | | | | | | | | | | | | | | | | | | | |
Stabilized(1) | | | 30,315 | | | | 25,727 | | | | 8,657 | | | | 1,077 | | | | 4,421 | | | | 0 | | | | 70,197 | |
| Non-Stabilized | | | 1,139 | | | | 4,748 | | | | 18 | | | | 176 | | | | 54 | | | | 0 | | | | 6,135 | |
| Total | | | 31,454 | | | | 30,475 | | | | 8,675 | | | | 1,253 | | | | 4,475 | | | | 0 | | | | 76,332 | |
| | | | | | | | | | | | | | | | | | | | | | | | | | | | | |
| Net Operating Income (NOI) | | | | | | | | | | | | | | | | | | | | | | | | | | | | |
Stabilized(1) | | | 34,318 | | | | 34,675 | | | | 25,823 | | | | 6,317 | | | | 9,229 | | | | 0 | | | | 110,362 | |
| Non-Stabilized | | | 1,200 | | | | 8,453 | | | | 285 | | | | 521 | | | | 385 | | | | 0 | | | | 10,844 | |
| Net operating income | | $ | 35,518 | | | $ | 43,128 | | | $ | 26,108 | | | $ | 6,838 | | | $ | 9,614 | | | $ | 0 | | | $ | 121,206 | |
| | | | | | | | | | | | | | | | | | | | | | | | | | | | | |
| Reconciliation of NOI to net income available to common shareholders | | | | | | | | | | | | | | | | | | | | | | | | | | | | |
| Interest | | $ | (18,723 | ) | | $ | (20,157 | ) | | $ | (11,291 | ) | | $ | (2,325 | ) | | $ | (4,070 | ) | | $ | (1,858 | ) | | $ | (58,424 | ) |
| Depreciation/amortization | | | (12,108 | ) | | | (19,408 | ) | | | (8,216 | ) | | | (1,802 | ) | | | (2,644 | ) | | | (1,323 | ) | | | (45,501 | ) |
Administrative, advisory and trustee fees | | | 0 | | | | 0 | | | | 0 | | | | 0 | | | | 0 | | | | (4,451 | ) | | | (4,451 | ) |
| Operating expenses | | | 0 | | | | 0 | | | | 0 | | | | 0 | | | | 0 | | | | (1,240 | ) | | | (1,240 | ) |
| Non-operating income | | | 0 | | | | 0 | | | | 0 | | | | 0 | | | | 0 | | | | 2,665 | | | | 2,665 | |
| Income before minority interest and discontinued operations and (loss) gain on sale of other investments | | | 4,687 | | | | 3,563 | | | | 6,601 | | | | 2,711 | | | | 2,900 | | | | (6,207 | ) | | | 14,255 | |
| Loss on sale of other investments | | | 0 | | | | 0 | | | | 0 | | | | 0 | | | | 0 | | | | (38 | ) | | �� | (38 | ) |
| Minority interest portion of operating partnership income | | | 0 | | | | 0 | | | | 0 | | | | 0 | | | | 0 | | | | (3,217 | ) | | | (3,217 | ) |
| Minority interest portion of other partnerships’ loss | | | 0 | | | | 0 | | | | 0 | | | | 0 | | | | 0 | | | | 26 | | | | 26 | |
| Income from continuing operations | | | 4,687 | | | | 3,563 | | | | 6,601 | | | | 2,711 | | | | 2,900 | | | | (9,436 | ) | | | 11,026 | |
Discontinued operations, net of minority interest(2) | | | (516 | ) | | | (147 | ) | | | (108 | ) | | | 0 | | | | (661 | ) | | | 4,516 | | | | 3,084 | |
| NET INCOME | | | 4,171 | | | | 3,416 | | | | 6,493 | | | | 2,711 | | | | 2,239 | | | | (4,920 | ) | | | 14,110 | |
| Dividends to preferred shareholders | | | 0 | | | | 0 | | | | 0 | | | | 0 | | | | 0 | | | | (2,372 | ) | | | (2,372 | ) |
| NET INCOME AVAILABLE TO COMMON SHAREHOLDERS | | $ | 4,171 | | | $ | 3,416 | | | $ | 6,493 | | | $ | 2,711 | | | $ | 2,239 | | | $ | (7,292 | ) | | $ | 11,738 | |
| 1. | For 4th Quarter 2008 and 4th Quarter 2007, stabilized properties excluded: |
| | Multi-Family Residential - | 17 South Main Apartments, Minot, ND; Arbors Apartments, S. Sioux City, NE; Indian Hills, Sioux City, IA; Quarry Ridge Apartments, Rochester, MN; Rum River Apartments, Isanti, MN and St. Cloud Student Housing, St. Cloud, MN. |
| | Commercial Office - | 17 South Main, Minot, ND; Corporate Center West, Omaha, NE; Farnam Executive Center, Omaha, NE; Flagship, Eden Prairie, MN; Gateway Corporate, Woodbury, MN; Highlands Ranch I, Highlands Ranch, CO; Miracle Hills One, Omaha, NE; Pacific Hills, Omaha, NE; Riverport, Maryland Heights, MO; Timberlands, Leawood, KS and Woodlands Plaza, Maryland Heights, MO. |
| | Commercial Medical - | 2828 Chicago Avenue, Minneapolis, MN; Fox River Cottages, Grand Chute, WI and St. Michaels, St. Michael, MN. |
| | Commercial Industrial - | Bloomington 2000, Bloomington, MN and Roseville 2929, Roseville, MN. |
| | Commercial Retail - | 17 South Main, Minot, ND; Dakota West Plaza, Minot, ND and Weston Walgreens, Weston, WI. |
| 2. | Discontinued operations include: |
| | Multi-Family Residential - | Park East Apartments, Fargo, ND; Clearwater apartments, Boise, ID; 405 Grant Avenue Apartments, Harvey, ND and Sweetwater – Green Acres 1&2 Apartments, Devils Lake, ND. |
| | Commercial Office - | Minnetonka Office Building, Minnetonka, MN. |
| | Commercial Medical - | Wedgewood Sweetwater, Lithia Springs, GA. |
| | Commercial Retail - | Glencoe C-Store, Glencoe, MN; Faribault Checker, Faribault, MN; Long Prairie C-Store, Long Prairie, MN; Paynesville C-Store, Paynesville, MN and Prior Lake I & III Strip Center, Prior Lake, MN. |
| | Unimproved Land - | Long Prairie Unimproved Land, Long Prairie, MN. |
INVESTORS REAL ESTATE TRUST AND SUBSIDIARIES
STABILIZED PROPERTIES AND OVERALL ECONOMIC OCCUPANCY LEVELS BY SEGMENT
Q4 2008 vs. Q4 2007
| Segments | | Stabilized Properties | | | All Properties | |
| | | 4th QTR | | | 4th QTR | | | 4th QTR | | | 4th QTR | |
| | | 2008 | | | 2007 | | | 2008 | | | 2007 | |
| Multi-Family Residential | | | 92.8 | % | | | 92.4 | % | | | 92.1 | % | | | 92.5 | % |
| Commercial Office | | | 89.6 | % | | | 90.5 | % | | | 90.8 | % | | | 92.4 | % |
| Commercial Medical | | | 95.2 | % | | | 96.3 | % | | | 96.1 | % | | | 96.3 | % |
| Commercial Industrial | | | 94.7 | % | | | 97.4 | % | | | 95.9 | % | | | 97.8 | % |
| Commercial Retail | | | 87.9 | % | | | 89.3 | % | | | 88.2 | % | | | 89.6 | % |
INVESTORS REAL ESTATE TRUST AND SUBSIDIARIES
COMMERCIAL LEASING SUMMARY
for the three and twelve months ended April 30, 2008
| | | Three Months Ended April 30, 2008 | | | Twelve Months Ended April 30, 2008 | |
| | | New(1) | | | Renew(2) | | | 4th Quarter 2008 Total | | | New(1) | | | Renew(2) | | | Year-To-Date Total | |
| Gross Leasing Square Footage | | | | | | | | | | | | | | | | | | |
| Commercial Office | | | 44,331 | | | | 25,268 | | | | 69,599 | | | | 141,565 | | | | 612,608 | | | | 754,173 | |
| Commercial Medical | | | 677,996 | | | | 17,991 | | | | 695,987 | | | | 717,496 | | | | 50,741 | | | | 768,237 | |
| Commercial Industrial | | | 6,864 | | | | 42,006 | | | | 48,870 | | | | 76,685 | | | | 43,206 | | | | 119,891 | |
| Commercial Retail | | | 10,315 | | | | 34,861 | | | | 45,176 | | | | 40,624 | | | | 121,265 | | | | 161,889 | |
| Total | | | 739,506 | | | | 120,126 | | | | 859,632 | | | | 976,370 | | | | 827,820 | | | | 1,804,190 | |
| | | | | | | | | | | | | | | | | | | | | | | | | |
| Weighted Average Term (yrs) | | | | | | | | | | | | | | | | | | | | | | | | |
| Commercial Office | | | 5.0 | | | | 2.5 | | | | 4.0 | | | | 4.6 | | | | 3.9 | | | | 4.2 | |
| Commercial Medical | | | 21.0 | | | | 6.0 | | | | 6.0 | | | | 17.6 | | | | 4.8 | | | | 6.4 | |
| Commercial Industrial | | | 3.0 | | | | 5.5 | | | | 4.7 | | | | 3.0 | | | | 4.7 | | | | 3.8 | |
| Commercial Retail | | | 5.2 | | | | 2.7 | | | | 3.0 | | | | 4.0 | | | | 2.9 | | | | 3.2 | |
| Total | | | 12.0 | | | | 3.3 | | | | 7.8 | | | | 7.2 | | | | 3.6 | | | | 5.2 | |
| | | | | | | | | | | | | | | | | | | | | | | | | |
| Rental Rate Increases | | | | | | | | | | | | | | | | | | | | | | | | |
| Rate on Expiring Leases | | | | | | | | | | | | | | | | | | | | | | | | |
| Commercial Office | | | | | | | | | | $ | 13.05 | | | | | | | | | | | $ | 12.13 | |
| Commercial Medical | | | | | | | | | | | 10.76 | | | | | | | | | | | | 11.24 | |
| Commercial Industrial | | | | | | | | | | | 5.38 | | | | | | | | | | | | 4.23 | |
| Commercial Retail | | | | | | | | | | | 7.52 | | | | | | | | | | | | 8.91 | |
| Total | | | | | | | | | | $ | 10.73 | | | | | | | | | | | $ | 10.78 | |
| | | | | | | | | | | | | | | | | | | | | | | | | |
| Rate on New and Renewal Leases | | | | | | | | | | | | | | | | | | | | | | | | |
| Commercial Office | | $ | 12.07 | | | $ | 5.06 | | | $ | 9.53 | | | $ | 13.89 | | | $ | 11.06 | | | $ | 11.59 | |
| Commercial Medical | | | 13.30 | | | | 18.49 | | | | 13.43 | | | | 13.89 | | | | 19.38 | | | | 14.25 | |
| Commercial Industrial | | | 2.79 | | | | 5.90 | | | | 5.46 | | | | 2.92 | | | | 6.06 | | | | 4.05 | |
| Commercial Retail | | | 9.94 | | | | 4.31 | | | | 5.60 | | | | 9.40 | | | | 6.09 | | | | 6.92 | |
| Total | | $ | 13.08 | | | $ | 7.15 | | | $ | 12.25 | | | $ | 12.84 | | | $ | 10.58 | | | $ | 11.80 | |
| | | | | | | | | | | | | | | | | | | | | | | | | |
| Percentage Increase (Decrease) | | | | | | | | | | | | | | | | | | | | | | | | |
| Commercial Office | | | | | | | | | | | (27.0 | %) | | | | | | | | | | | (4.5 | %) |
| Commercial Medical | | | | | | | | | | | 24.8 | % | | | | | | | | | | | 26.8 | % |
| Commercial Industrial | | | | | | | | | | | 1.5 | % | | | | | | | | | | | (4.3 | %) |
| Commercial Retail | | | | | | | | | | | (25.5 | %) | | | | | | | | | | | (22.3 | %) |
| Total | | | | | | | | | | | 14.2 | % | | | | | | | | | | | 9.5 | % |
| (1) | Excluding leases in place on date of acquisition. |
| (2) | Renewing leases are not necessarily leases expiring in that period. Expansion footage for renewing tenants is included in this column. |
INVESTORS REAL ESTATE TRUST AND SUBSIDIARIES
COMMERCIAL LEASING SUMMARY
for the three and twelve months ended April 30, 2008
| | | 4th Quarter 2008 Total | | | Year-To-Date Total | |
| | | New | | | Renew | | | Total Dollars | | | New | | | Renew | | | Total Dollars | |
| Tenant Improvements | | | | | | | | | | | | | | | | | | |
| Commercial Office | | $ | 739,445 | | | $ | 37,241 | | | $ | 776,686 | | | $ | 2,307,298 | | | $ | 2,258,612 | | | $ | 4,565,910 | |
| Commercial Medical | | | 0 | | | | 440,000 | | | | 440,000 | | | | 1,065,573 | | | | 768,816 | | | | 1,834,389 | |
| Commercial Industrial | | | 1,000 | | | | 3,000 | | | | 4,000 | | | | 24,630 | | | | 3,000 | | | | 27,630 | |
| Commercial Retail | | | 8,003 | | | | 41,530 | | | | 49,533 | | | | 242,689 | | | | 161,022 | | | | 403,711 | |
| Subtotal | | $ | 748,448 | | | $ | 521,771 | | | $ | 1,270,219 | | | $ | 3,640,190 | | | $ | 3,191,450 | | | $ | 6,831,640 | |
| | | | | | | | | | | | | | | | | | | | | | | | | |
| Tenant Improvements per square foot | | | | | | | | | | | | | | | | | | | | | | | | |
| Commercial Office | | $ | 16.68 | | | $ | 1.47 | | | $ | 11.16 | | | $ | 16.30 | | | $ | 3.69 | | | $ | 6.05 | |
| Commercial Medical | | | 0.00 | | | | 24.46 | | | | 0.47 | | | | 1.12 | | | | 15.15 | | | | 1.83 | |
| Commercial Industrial | | | 0.15 | | | | 0.07 | | | | 0.08 | | | | 0.32 | | | | 0.07 | | | | 0.23 | |
| Commercial Retail | | | 0.78 | | | | 1.19 | | | | 1.10 | | | | 5.97 | | | | 1.33 | | | | 2.49 | |
| Subtotal | | $ | 0.77 | | | $ | 4.34 | | | $ | 1.16 | | | $ | 3.01 | | | $ | 3.86 | | | $ | 3.36 | |
| | | | | | | | | | | | | | | | | | | | | | | | | |
| Leasing Costs | | | | | | | | | | | | | | | | | | | | | | | | |
| Commercial Office | | $ | 347,307 | | | $ | 34,380 | | | $ | 381,687 | | | $ | 986,295 | | | $ | 1,892,413 | | | $ | 2,878,708 | |
| Commercial Medical | | | 0 | | | | 47,802 | | | | 47,802 | | | | 303,094 | | | | 130,126 | | | | 433,220 | |
| Commercial Industrial | | | 5,313 | | | | 25,216 | | | | 30,529 | | | | 37,974 | | | | 25,216 | | | | 63,190 | |
| Commercial Retail | | | 34,075 | | | | 28,854 | | | | 62,929 | | | | 75,974 | | | | 54,916 | | | | 130,890 | |
| Subtotal | | $ | 386,695 | | | $ | 136,252 | | | $ | 522,947 | | | $ | 1,403,337 | | | $ | 2,102,671 | | | $ | 3,506,008 | |
| | | | | | | | | | | | | | | | | | | | | | | | | |
| Leasing Costs per square foot | | | | | | | | | | | | | | | | | | | | | | | | |
| Commercial Office | | $ | 7.83 | | | $ | 1.36 | | | $ | 5.48 | | | $ | 6.97 | | | $ | 3.09 | | | $ | 3.82 | |
| Commercial Medical | | | 0.00 | | | | 2.66 | | | | 0.05 | | | | 0.32 | | | | 2.56 | | | | 0.43 | |
| Commercial Industrial | | | 0.77 | | | | 0.60 | | | | 0.62 | | | | 0.50 | | | | 0.58 | | | | 0.53 | |
| Commercial Retail | | | 3.30 | | | | 0.83 | | | | 1.39 | | | | 1.87 | | | | 0.45 | | | | 0.81 | |
| Subtotal | | $ | 0.40 | | | $ | 1.13 | | | $ | 0.48 | | | $ | 1.16 | | | $ | 2.54 | | | $ | 1.72 | |
| | | | | | | | | | | | | | | | | | | | | | | | | |
| Tenant Improvements and Leasing Costs | | | | | | | | | | | | | | | | | | | | | | | | |
| Commercial Office | | $ | 1,086,752 | | | $ | 71,621 | | | $ | 1,158,373 | | | $ | 3,293,593 | | | $ | 4,151,025 | | | $ | 7,444,618 | |
| Commercial Medical | | | 0 | | | | 487,802 | | | | 487,802 | | | | 1,368,667 | | | | 898,942 | | | | 2,267,609 | |
| Commercial Industrial | | | 6,313 | | | | 28,216 | | | | 34,529 | | | | 62,604 | | | | 28,216 | | | | 90,820 | |
| Commercial Retail | | | 42,078 | | | | 70,384 | | | | 112,462 | | | | 318,663 | | | | 215,938 | | | | 534,601 | |
| Total | | $ | 1,135,143 | | | $ | 658,023 | | | $ | 1,793,166 | | | $ | 5,043,527 | | | $ | 5,294,121 | | | $ | 10,337,648 | |
| | | | | | | | | | | | | | | | | | | | | | | | | |
| Tenant Improvements and Leasing Costs per square foot | | | | | | | | | | | | | | | | | | | | | | | | |
| Commercial Office | | $ | 24.51 | | | $ | 2.83 | | | $ | 16.64 | | | $ | 23.27 | | | $ | 6.78 | | | $ | 9.87 | |
| Commercial Medical | | | 0.00 | | | | 27.11 | | | | 0.53 | | | | 1.44 | | | | 17.72 | | | | 2.27 | |
| Commercial Industrial | | | 0.92 | | | | 0.67 | | | | 0.71 | | | | 0.82 | | | | 0.65 | | | | 0.76 | |
| Commercial Retail | | | 4.08 | | | | 2.02 | | | | 2.49 | | | | 7.84 | | | | 1.78 | | | | 3.30 | |
| Total | | $ | 1.17 | | | $ | 5.48 | | | $ | 1.64 | | | $ | 4.18 | | | $ | 6.40 | | | $ | 5.08 | |
INVESTORS REAL ESTATE TRUST AND SUBSIDIARIES
MULTI-FAMILY RESIDENTIAL SUMMARY
| | | Months Ended | |
| | | 04/30/2008 | | | 01/31/2008 | | | 10/31/2007 | | | 07/31/2007 | | | 04/30/2007 | |
| Number of Units | | | 9,500 | | | | 9,500 | | | | 9,337 | | | | 9,337 | | | | 9,337 | |
| Average Investment Per Unit | | $ | 53,672 | | | $ | 53,313 | | | $ | 52,898 | | | $ | 52,524 | | | $ | 52,206 | |
| | | | | | | | | | | | | | | | | | | | | |
| Average Scheduled Rent per Unit | | | | | | | | | | | | | | | | | | | | |
| Stabilized | | | 707.93 | | | | 703.00 | | | | 698.58 | | | | 696.63 | | | | 695.71 | |
| Non-Stabilized | | | 577.00 | | | | 549.10 | | | | 542.48 | | | | 535.95 | | | | 467.72 | |
| | | | 692.85 | | | | 686.38 | | | | 683.01 | | | | 680.59 | | | | 674.93 | |
| | | | | | | | | | | | | | | | | | | | | |
| Total Receipts per Unit | | | | | | | | | | | | | | | | | | | | |
| Stabilized | | | 666.23 | | | | 668.10 | | | | 668.32 | | | | 650.20 | | | | 642.93 | |
| Non-Stabilized | | | 508.24 | | | | 499.01 | | | | 506.14 | | | | 473.57 | | | | 441.54 | |
| | | | 648.03 | | | | 649.84 | | | | 652.15 | | | | 632.59 | | | | 624.57 | |
| Occupancy % | | | | | | | | | | | | | | | | | | | | |
| Stabilized | | | 92.8 | % | | | 93.7 | % | | | 94.1 | % | | | 92.6 | % | | | 92.4 | % |
| Non-Stabilized | | | 84.6 | % | | | 87.3 | % | | | 89.9 | % | | | 82.3 | % | | | 93.2 | % |
| | | | 92.1 | % | | | 93.1 | % | | | 93.8 | % | | | 91.8 | % | | | 92.5 | % |
| | | | | | | | | | | | | | | | | | | | | |
| Operating Expenses as a % of Scheduled Rent | | | | | | | | | | | | | | | | | | | | |
| Stabilized | | | 45.8 | % | | | 44.3 | % | | | 45.3 | % | | | 43.1 | % | | | 45.3 | % |
| Non-Stabilized | | | 46.4 | % | | | 44.9 | % | | | 46.4 | % | | | 47.5 | % | | | 45.7 | % |
| Total | | | 45.9 | % | | | 44.4 | % | | | 45.4 | % | | | 43.5 | % | | | 45.3 | % |
INVESTORS REAL ESTATE TRUST AND SUBSIDIARIES
10 LARGEST TENANTS – BASED ON ANNUALIZED BASE RENT
as of April 30, 2008
| Tenant | | Number of Buildings | | | Weighted Average Remaining Lease Term in Months | | | % of Total Commercial Segments’ Minimum Rents | | | Aggregate Rentable Square Feet | | | Percentage of Aggregate Occupied Square Feet | |
| Edgewood Vista/Sunwest Management, Inc. | | | 19 | | | | 250 | | | | 9.4 | % | | | 909,591 | | | | 8.6 | % |
| St. Lukes Hospital of Duluth, Inc. | | | 6 | | | | 87 | | | | 3.5 | % | | | 198,775 | | | | 1.9 | % |
| Fairview Health | | | 8 | | | | 51 | | | | 2.3 | % | | | 167,115 | | | | 1.6 | % |
| Applied Underwriters | | | 3 | | | | 106 | | | | 2.2 | % | | | 141,724 | | | | 1.3 | % |
| Best Buy Co., Inc. (NYSE: BBY) | | | 2 | | | | 31 | | | | 2.0 | % | | | 224,650 | | | | 2.1 | % |
| UGS Corp. | | | 1 | | | | 40 | | | | 1.7 | % | | | 122,567 | | | | 1.2 | % |
| HealthEast Care System | | | 1 | | | | 130 | | | | 1.6 | % | | | 114,316 | | | | 1.1 | % |
| Microsoft (NASDAQ: MSFT) | | | 1 | | | | 64 | | | | 1.5 | % | | | 122,040 | | | | 1.1 | % |
| Smurfit - Stone Container (NASDAQ: SSCC) | | | 2 | | | | 92 | | | | 1.5 | % | | | 424,147 | | | | 4.0 | % |
| Allina Health System | | | 5 | | | | 36 | | | | 1.4 | % | | | 87,589 | | | | 0.8 | % |
| Total/Weighted Average | | | | | | | 84 | | | | 27.1 | % | | | 2,512,514 | | | | 23.7 | % |
INVESTORS REAL ESTATE TRUST AND SUBSIDIARIES
LEASE EXPIRATIONS
as of April 30, 2008
| Fiscal Year | | Number of Leases | | | Rentable Square Feet | | | Percent of Rentable Square Feet | | | Annualized Rent * | | | Average Rental Rate | | | Percent of Annualized Rent | |
| Commercial Office | | | | | | | | | | | | | | | | | | |
| 2009 | | | 63 | | | | 450,143 | | | | 10.8 | % | | $ | 4,568,661 | | | $ | 10.15 | | | | 8.8 | % |
| 2010 | | | 74 | | | | 739,701 | | | | 17.8 | % | | | 9,024,375 | | | | 12.20 | | | | 17.4 | % |
| 2011 | | | 59 | | | | 589,818 | | | | 14.2 | % | | | 7,618,245 | | | | 12.92 | | | | 14.7 | % |
| 2012 | | | 41 | | | | 743,200 | | | | 17.9 | % | | | 9,916,850 | | | | 13.34 | | | | 19.2 | % |
| 2013 | | | 33 | | | | 575,359 | | | | 13.8 | % | | | 6,343,937 | | | | 11.03 | | | | 12.3 | % |
| 2014 and thereafter | | | 46 | | | | 1,063,024 | | | | 25.5 | % | | | 14,293,735 | | | | 13.45 | | | | 27.6 | % |
| | | | 316 | | | | 4,161,245 | | | | 100.0 | % | | $ | 51,765,803 | | | $ | 12.44 | | | | 100.0 | % |
| | | | | | | | | | | | | | | | | | | | | | | | | |
| Commercial Medical | | | | | | | | | | | | | | | | | | | | | | | | |
| 2009 | | | 20 | | | | 52,779 | | | | 2.8 | % | | $ | 758,537 | | | $ | 14.37 | | | | 2.6 | % |
| 2010 | | | 19 | | | | 51,017 | | | | 2.7 | % | | | 765,140 | | | | 15.00 | | | | 2.7 | % |
| 2011 | | | 11 | | | | 43,290 | | | | 2.3 | % | | | 703,958 | | | | 16.26 | | | | 2.5 | % |
| 2012 | | | 24 | | | | 91,864 | | | | 4.9 | % | | | 1,669,611 | | | | 18.17 | | | | 5.8 | % |
| 2013 | | | 10 | | | | 46,922 | | | | 2.5 | % | | | 846,313 | | | | 18.04 | | | | 2.9 | % |
| 2014 and thereafter | | | 71 | | | | 1,590,338 | | | | 84.8 | % | | | 24,036,878 | | | | 15.11 | | | | 83.5 | % |
| | | | 155 | | | | 1,876,210 | | | | 100.0 | % | | $ | 28,780,437 | | | $ | 15.34 | | | | 100.0 | % |
| | | | | | | | | | | | | | | | | | | | | | | | | |
| Commercial Industrial | | | | | | | | | | | | | | | | | | | | | | | | |
| 2009 | | | 5 | | | | 149,473 | | | | 5.6 | % | | $ | 557,923 | | | $ | 3.73 | | | | 5.5 | % |
| 2010 | | | 6 | | | | 256,657 | | | | 9.5 | % | | | 775,783 | | | | 3.02 | | | | 7.6 | % |
| 2011 | | | 15 | | | | 1,196,556 | | | | 44.5 | % | | | 4,170,693 | | | | 3.49 | | | | 40.8 | % |
| 2012 | | | 2 | | | | 237,066 | | | | 8.8 | % | | | 640,078 | | | | 2.70 | | | | 6.2 | % |
| 2013 | | | 4 | | | | 263,834 | | | | 9.8 | % | | | 1,276,142 | | | | 4.84 | | | | 12.5 | % |
| 2014 and thereafter | | | 8 | | | | 587,235 | | | | 21.8 | % | | | 2,797,077 | | | | 4.76 | | | | 27.4 | % |
| | | | 40 | | | | 2,690,821 | | | | 100.0 | % | | $ | 10,217,696 | | | $ | 3.80 | | | | 100.0 | % |
| | | | | | | | | | | | | | | | | | | | | | | | | |
| Commercial Retail | | | | | | | | | | | | | | | | | | | | | | | | |
| 2009 | | | 30 | | | | 173,981 | | | | 14.7 | % | | $ | 1,263,146 | | | $ | 7.26 | | | | 13.9 | % |
| 2010 | | | 48 | | | | 212,180 | | | | 17.8 | % | | | 1,378,833 | | | | 6.50 | | | | 15.2 | % |
| 2011 | | | 38 | | | | 252,675 | | | | 21.3 | % | | | 2,438,412 | | | | 9.65 | | | | 26.8 | % |
| 2012 | | | 21 | | | | 197,145 | | | | 16.6 | % | | | 1,026,229 | | | | 5.21 | | | | 11.3 | % |
| 2013 | | | 12 | | | | 63,700 | | | | 5.4 | % | | | 378,514 | | | | 5.94 | | | | 4.2 | % |
| 2014 and thereafter | | | 22 | | | | 287,588 | | | | 24.2 | % | | | 2,605,780 | | | | 9.06 | | | | 28.6 | % |
| | | | 171 | | | | 1,187,269 | | | | 100.0 | % | | $ | 9,090,914 | | | $ | 7.66 | | | | 100.0 | % |
| | | | | | | | | | | | | | | | | | | | | | | | | |
| Commercial Total | | | | | | | | | | | | | | | | | | | | | | | | |
| 2009 | | | 118 | | | | 826,376 | | | | 8.3 | % | | $ | 7,148,267 | | | $ | 8.65 | | | | 7.2 | % |
| 2010 | | | 147 | | | | 1,259,555 | | | | 12.7 | % | | | 11,944,131 | | | | 9.48 | | | | 12.0 | % |
| 2011 | | | 123 | | | | 2,082,339 | | | | 21.0 | % | | | 14,931,308 | | | | 7.17 | | | | 14.9 | % |
| 2012 | | | 88 | | | | 1,269,275 | | | | 12.8 | % | | | 13,252,768 | | | | 10.44 | | | | 13.3 | % |
| 2013 | | | 59 | | | | 949,815 | | | | 9.6 | % | | | 8,844,906 | | | | 9.31 | | | | 8.9 | % |
| 2014 and thereafter | | | 147 | | | | 3,528,185 | | | | 35.6 | % | | | 43,733,470 | | | | 12.40 | | | | 43.7 | % |
| | | | 682 | | | | 9,915,545 | | | | 100.0 | % | | $ | 99,854,852 | | | $ | 10.07 | | | | 100.0 | % |
* Annualized Rent is monthly scheduled rent as of April 30, 2008 (cash basis), multiplied by 12.
INVESTORS REAL ESTATE TRUST AND SUBSIDIARIES
FISCAL 2008 ACQUISITION SUMMARY
as of April 30, 2008
($’s in thousands)
| Property | Location | Segment Type | Acquisition Date | | Square Feet/Units | | | Leased Percentage at Acquisition | | | April 30, 2008 Leased Percentage | | | Investment | |
| | | | | | | | | | | | | | | | |
| Barry Pointe | Kansas City, MO | Commercial Medical | May 2, 2007 | | | 18,502 | | | | 77.9 | % | | | 100.0 | % | | $ | 3,200 | |
| Cedar Lake Business Center | St Louise Park, MN | Commercial Industrial | June 12, 2007 | | | 50,400 | | | | 100.0 | % | | | 100.0 | % | | | 4,040 | |
| Urbandale 3900 106th Street | Urbandale, IA | Commercial Industrial | June 20, 2007 | | | 528,353 | | | | 86.3 | % | | | 100.0 | % | | | 14,000 | |
| Plymouth 5095 Nathan Lane | Plymouth, MN | Commercial Office | July 17, 2007 | | | 20,528 | | | | 100.0 | % | | | 100.0 | % | | | 2,000 | |
| Woodbury 1865 Woodlane | Woodbury, MN | Commercial Industrial | July 17, 2007 | | | 69,600 | | | | 100.0 | % | | | 100.0 | % | | | 4,000 | |
| 610 Business Center | Brooklyn Park, MN | Commercial Office | November 9, 2007 | | | 78,560 | | | | 100.0 | % | | | 100.0 | % | | | 6,500 | |
| Greenfield Apartments | Omaha, NE | Multi-Family Residential | December 12, 2007 | | | 96 | | | | 96.4 | % | | | 93.8 | % | | | 4,700 | |
| Intertech Office Building | Fenton, MO | Commercial Office | December 28, 2007 | | | 64,607 | | | | 90.6 | % | | | 90.6 | % | | | 7,000 | |
| Cottonwood IV Apartments* | Bismarck, ND | Multi-Family Residential | January 2, 2008 | | | 67 | | | | 7.9 | % | | | 47.8 | % | | | 6,191 | |
| Edgewood Vista – Billings | Billings, MT | Commercial Medical | February 29, 2008 | | | 11,800 | | | | 100.0 | % | | | 100.0 | % | | | 4,250 | |
| Edgewood Vista – East Grand Forks | East Grand Forks | Commercial Medical | February 29, 2008 | | | 18,488 | | | | 100.0 | % | | | 100.0 | % | | | 4,990 | |
| Edgewood Vista – Sioux Falls | Sioux Falls, SD | Commercial Medical | February 29, 2008 | | | 11,800 | | | | 100.0 | % | | | 100.0 | % | | | 3,350 | |
| Edina 6405 France Medical | Edina, MN** | Commercial Medical | March 3, 2008 | | | 55,478 | | | | 100.0 | % | | | 100.0 | % | | | 13,615 | |
| Edina 6363 France Medical | Edina, MN** | Commercial Medical | March 3, 2008 | | | 70,934 | | | | 98.3 | % | | | 98.3 | % | | | 13,360 | |
| Minneapolis 701 25th Ave Medical (Riverside) | Minneapolis, MN | Commercial Medical | March 3, 2008 | | | 57,212 | | | | 100.0 | % | | | 100.0 | % | | | 8,000 | |
| Burnsville 303 Nicollet Medical (Ridgeview) | Burnsville, MN | Commercial Medical | Mach 3, 2008 | | | 53,466 | | | | 100.0 | % | | | 100.0 | % | | | 8,800 | |
| Burnsville 305 Nicollet Medical (Ridgeview South) | Burnsville, MN | Commercial Medical | March 3, 2008 | | | 36,199 | | | | 100.0 | % | | | 100.0 | % | | | 5,900 | |
| Eagan 1440 Duckwood Medical | Eagan, MN | Commercial Medical | March 3, 2008 | | | 17,640 | | | | 100.0 | % | | | 100.0 | % | | | 2,325 | |
| Edgewood Vista – Belgrade | Belgrade, MT | Commercial Medical | March 6, 2008 | | | 5,192 | | | | 100.0 | % | | | 100.0 | % | | | 2,100 | |
| Edgewood Vista – Columbus | Columbus, NE | Commercial Medical | March 6, 2008 | | | 5,194 | | | | 100.0 | % | | | 100.0 | % | | | 1,450 | |
| Edgewood Vista – Fargo | Fargo, ND | Commercial Medical | March 6, 2008 | | | 168,811 | | | | 100.0 | % | | | 100.0 | % | | | 25,850 | |
| Edgewood Vista – Grand Island | Grand Island, NE | Commercial Medical | March 6, 2008 | | | 5,185 | | | | 100.0 | % | | | 100.0 | % | | | 1,400 | |
| Edgewood Vista – Norfolk | Norfolk, NE | Commercial Medical | March 6, 2008 | | | 5,135 | | | | 100.0 | % | | | 100.0 | % | | | 1,300 | |
| Eagan 2785 & 2795 Hwy, 55 | Eagan, MN | Commercial Industrial | March 31, 2008 | | | 198,600 | | | | 100.0 | % | | | 100.0 | % | | | 6,400 | |
| | | | Total Square Feet | | | 1,551,684 | | | | | | | | | | | $ | 154,721 | |
| | | | Total Units | | | 163 | | | | | | | | | | | | | |
* Development property placed in service January 2, 2008
** Acquisition of lease hold interests only (air rights lease and ground leases)
INVESTORS REAL ESTATE TRUST AND SUBSIDIARIES
FISCAL 2007 AND 2008 DEVELOPMENT SUMMARY
as of April 30, 2008
($’s in thousands)
| Property and Location | Total Rentable Square Feet or # of Units | | Percentage Leased or Committed | | | Anticipated Total Cash Cost | | | Cash Cost to Date | | Anticipated Construction Completion Date |
| 401 South Main, Minot, ND | 10 Units | | | 0 | % | | $ | 793 | | | $ | 46 | | September 2008 |
| 2828 Chicago Avenue Medical Building, Minneapolis, MN | 56,000 s.f. | | | 73 | % | | | 15,700 | | | | 8,163 | | August 2008 |
Southdale Medical Building Expansion, Edina, MN | 27,750 s.f. | | | 75 | % | | | 10,988 | | | | 5,459 | | July 2008 |
| IRET Corporate Plaza, Minot, ND | 67 units & 60,100 s.f. | | | 33 | % | | | 20,739 | | | | 9,188 | | October 2008 |
| | | | Total | | | $ | 48,220 | | | $ | 22,856 | | |