Exhibit 99.2
First Quarter Fiscal 2009
Supplemental Operating and Financial Data
for the Quarter Ended July 31, 2008
| | | | | |
CONTACT: Michelle Saari VP - Investors Relations Direct Dial: 701-837-4738 E-Mail: msaari@iret.com | | | | 12 Main Street South Minot, ND 58701 Tel: 701-837-4738 Fax: 701-837-7117 www.iret.com |
Supplemental Financial and Operating Data
Table of Contents
July 31, 2008
| | Page |
| | |
| Company Background and Highlights | 2 |
| | |
| Investment Cost by Segment | 3 |
| | |
| Key Financial Data | |
| Condensed Consolidated Balance Sheets | 4 |
| Condensed Consolidated Statements of Operations | 5 |
| Funds From Operations | 6 |
| Earnings Before Interest, Taxes, Depreciation and Amortization (EBITDA) | 7 |
| | |
| Capital Analysis | |
| Long-Term Mortgage Debt Analysis | 8 |
| Capital Analysis | 9 |
| | |
| Portfolio Analysis | |
| Stabilized Properties Net Operating Income Summary | 10 |
| Net Operating Income Detail | 11-12 |
| Stabilized Properties and Overall Economic Occupancy Levels by Segment | 13 |
| | |
| Tenant Analysis | |
| Commercial Leasing Summary | 14-15 |
| Multi-Family Residential Summary | 16 |
| 10 Largest Commercial Tenants - Based on Annualized Base Rent | 17 |
| Lease Expirations as of July 31, 2008 | 18 |
| | |
| Growth and Strategy | |
| Fiscal 2009 Acquisition Summary | 19 |
| Fiscal 2009 Development Summary | 20 |
Company Background and Highlights
First Quarter Fiscal 2009
Investors Real Estate Trust is a self-administered, equity real estate investment trust (REIT) investing in a portfolio of income-producing properties located primarily in the upper Midwest. IRET’s portfolio is diversified among multi-family residential, commercial office, medical (including senior housing), industrial and retail segments.
During the first quarter of fiscal year 2009, IRET acquired a parcel of unimproved land in Bismarck, North Dakota for approximately $576,000, and four small apartment buildings with a total of 52 units in Minot, North Dakota for a purchase price (excluding closing costs) of approximately $2.5 million, including the issuance of limited partnership units of IRET Properties, the Company’s operating partnership, valued at approximately $2.0 million. The Company had no dispositions in the first quarter of fiscal year 2009.
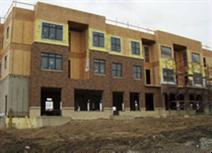
During the first quarter of fiscal year 2009, IRET completed construction of the exterior shell of an approximately 27,750 square foot addition to the Company’s Southdale Medical Building in Edina, Minnesota. Certain interior work and tenant improvements are ongoing and are scheduled for completion in the second quarter of fiscal year 2009. The estimated cost of this expansion project is approximately $11.0 million, including relocation, tenant improvement and leasing costs expected to be incurred to relocate tenants in the existing facility. The addition is currently approximately 75% leased.
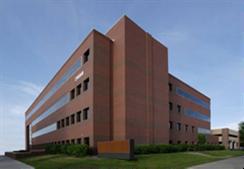
Also during the first quarter of fiscal year 2009, the Company completed construction of the parking ramp adjoining the approximately 56,239 square foot medical office building the Company is constructing next to its existing five-story medical office building located at 2828 Chicago Avenue in Minneapolis, Minnesota. The new medical office building was approximately 85% complete as of July 31, 2008, with interior work and tenant improvements currently ongoing and scheduled for completion in the second quarter of fiscal year 2009. The medical office building and adjoining parking ramp have an estimated total project cost of $15.7 million. As of July 31, 2008, approximately 73% of this new medical office building was pre-leased to two tenants.
The Company changed the ticker symbol for its common shares of beneficial interest listed on the NASDAQ Global Select Market to “IRET” from “IRETS”, with effect on July 1, 2008.
In the first quarter of fiscal year 2009, IRET paid its 149th consecutive quarterly distribution per common share/unit at equal or increasing rates.
As of July 31, 2008, IRET owns a diversified portfolio of 239 properties consisting of 76 multi-family residential properties, 65 office properties, 48 medical properties (including senior housing), 17 industrial properties and 33 retail properties. IRET’s distributions have increased every year for 38 consecutive years. IRET’s shares are publicly traded on the NASDAQ Global Select Market (NASDAQ: IRET).
Certain statements in these supplemental disclosures are “forward-looking statements” within the meaning of the Private Securities Litigation Reform Act of 1995. Such statements involve known and unknown risks, uncertainties and other factors that may cause actual results to differ materially from projected results. Such risks, uncertainties and other factors include, but are not limited to: fluctuations in interest rates, the effect of government regulation, the availability of capital, changes in general and local economic and real estate market conditions, competition, our ability to attract and retain skilled personnel, and those risks and uncertainties detailed from time to time in our filings with the Securities and Exchange Commission, including our 2008 Form 10-K. We assume no obligation to update or supplement forward-looking statements that become untrue because of subsequent events.
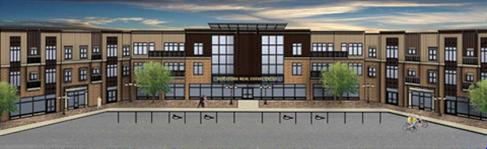
Fiscal 2009 Development Projects
| Southdale Medical Center Expansion Project | 2828 Chicago Avenue Medical Building |
| Edina, MN | Minneapolis, MN |
| |
| | (architects’ rendering) |
| IRET Corporate Plaza |
| Minot, ND |
| |
| (architects’ rendering) | |
Investment Cost by Segment - First Quarter Fiscal 2009
With investments in the multi-family residential and commercial office, medical, industrial and retail segments, IRET’s diversified portfolio helps to provide stability during market fluctuations in returns from specific property types.
INVESTORS REAL ESTATE TRUST AND SUBSIDIARIES
CONDENSED CONSOLIDATED BALANCE SHEETS (unaudited)
(in thousands)
| | | 07/31/2008 | | | 04/30/2008 | | | 01/31/2008 | | | 10/31/2007 | | | 07/31/2007 | |
| ASSETS | | | | | | | | | | | | | | | |
| Real estate investments | | | | | | | | | | | | | | | |
| Property owned | | $ | 1,655,778 | | | $ | 1,648,259 | | | $ | 1,558,560 | | | $ | 1,529,063 | | | $ | 1,520,975 | |
| Less accumulated depreciation | | | (229,691 | ) | | | (219,379 | ) | | | (209,400 | ) | | | (199,682 | ) | | | (190,127 | ) |
| | | | 1,426,087 | | | | 1,428,880 | | | | 1,349,160 | | | | 1,329,381 | | | | 1,330,848 | |
| Development in progress | | | 35,231 | | | | 22,856 | | | | 14,734 | | | | 10,553 | | | | 4,853 | |
| Unimproved land | | | 4,567 | | | | 3,901 | | | | 3,901 | | | | 3,901 | | | | 4,165 | |
| Mortgage loans receivable, net of allowance | | | 534 | | | | 541 | | | | 548 | | | | 391 | | | | 393 | |
| Total real estate investments | | | 1,466,419 | | | | 1,456,178 | | | | 1,368,343 | | | | 1,344,226 | | | | 1,340,259 | |
| Other assets | | | | | | | | | | | | | | | | | | | | |
| Cash and cash equivalents | | | 42,351 | | | | 53,481 | | | | 76,392 | | | | 89,302 | | | | 24,647 | |
| Marketable securities – available-for-sale | | | 420 | | | | 420 | | | | 2,160 | | | | 2,090 | | | | 2,046 | |
| Receivable arising from straight-lining of rents, net of allowance | | | 14,383 | | | | 14,113 | | | | 13,753 | | | | 13,430 | | | | 13,097 | |
| Accounts receivable, net of allowance | | | 4,395 | | | | 4,163 | | | | 3,842 | | | | 2,279 | | | | 2,980 | |
| Real estate deposits | | | 1,048 | | | | 1,379 | | | | 1,103 | | | | 1,601 | | | | 272 | |
| Prepaid and other assets | | | 2,324 | | | | 349 | | | | 821 | | | | 1,445 | | | | 1,917 | |
| Intangible assets, net of accumulated amortization | | | 58,936 | | | | 61,649 | | | | 29,025 | | | | 30,457 | | | | 32,999 | |
| Tax, insurance, and other escrow | | | 7,888 | | | | 8,642 | | | | 8,060 | | | | 6,539 | | | | 7,529 | |
| Property and equipment, net | | | 1,450 | | | | 1,467 | | | | 1,487 | | | | 1,486 | | | | 1,476 | |
| Goodwill | | | 1,392 | | | | 1,392 | | | | 1,396 | | | | 1,397 | | | | 1,397 | |
| Deferred charges and leasing costs, net | | | 15,155 | | | | 14,793 | | | | 13,528 | | | | 12,624 | | | | 12,447 | |
| TOTAL ASSETS | | $ | 1,616,161 | | | $ | 1,618,026 | | | $ | 1,519,910 | | | $ | 1,506,876 | | | $ | 1,441,066 | |
| | | | | | | | | | | | | | | | | | | | | |
| LIABILITIES AND SHAREHOLDERS’ EQUITY | | | | | | | | | | | | | | | | | | | | |
| LIABILITIES | | | | | | | | | | | | | | | | | | | | |
| Accounts payable and accrued expenses | | $ | 32,917 | | | $ | 33,757 | | | $ | 29,573 | | | $ | 22,974 | | | $ | 25,205 | |
| Mortgages payable | | | 1,068,267 | | | | 1,063,858 | | | | 975,785 | | | | 967,612 | | | | 960,086 | |
| Other | | | 830 | | | | 978 | | | | 1,019 | | | | 1,161 | | | | 1,103 | |
| TOTAL LIABILITIES | | | 1,102,014 | | | | 1,098,593 | | | | 1,006,377 | | | | 991,747 | | | | 986,394 | |
| | | | | | | | | | | | | | | | | | | | | |
| COMMITMENTS AND CONTINGENCIES | | | | | | | | | | | | | | | | | | | | |
| MINORITY INTEREST IN PARTNERSHIPS | | | 13,186 | | | | 12,609 | | | | 12,768 | | | | 12,781 | | | | 12,818 | |
| MINORITY INTEREST OF UNITHOLDERS IN OPERATING PARTNERSHIP | | | 159,984 | | | | 161,818 | | | | 155,301 | | | | 154,274 | | | | 159,477 | |
| SHAREHOLDERS’ EQUITY | | | | | | | | | | | | | | | | | | | | |
| Preferred Shares of Beneficial Interest | | | 27,317 | | | | 27,317 | | | | 27,317 | | | | 27,317 | | | | 27,317 | |
| Common Shares of Beneficial Interest | | | 444,134 | | | | 440,187 | | | | 433,645 | | | | 429,236 | | | | 357,614 | |
| Accumulated distributions in excess of net income | | | (130,474 | ) | | | (122,498 | ) | | | (115,546 | ) | | | (108,474 | ) | | | (102,526 | ) |
| Accumulated other comprehensive income (loss) | | | 0 | | | | 0 | | | | 48 | | | | (5 | ) | | | (28 | ) |
| Total shareholders’ equity | | | 340,977 | | | | 345,006 | | | | 345,464 | | | | 348,074 | | | | 282,377 | |
| TOTAL LIABILITIES AND SHAREHOLDERS’ EQUITY | | $ | 1,616,161 | | | $ | 1,618,026 | | | $ | 1,519,910 | | | $ | 1,506,876 | | | $ | 1,441,066 | |
INVESTORS REAL ESTATE TRUST AND SUBSIDIARIES
CONDENSED CONSOLIDATED STATEMENTS OF OPERATIONS (unaudited)
(in thousands, except per share data)
| | | Three Months Ended | |
| OPERATING RESULTS | | 07/31/2008 | | | 04/30/2008 | | | 01/31/2008 | | | 10/31/2007 | | | 07/31/2007 | |
| Real estate revenue | | $ | 58,846 | | | $ | 58,962 | | | $ | 54,424 | | | $ | 54,211 | | | $ | 53,573 | |
| Real estate expenses | | | 23,804 | | | | 23,911 | | | | 21,567 | | | | 21,053 | | | | 20,874 | |
| Net operating income | | | 35,042 | | | | 35,051 | | | | 32,857 | | | | 33,158 | | | | 32,699 | |
| Interest | | | (16,888 | ) | | | (16,470 | ) | | | (15,840 | ) | | | (15,687 | ) | | | (15,442 | ) |
| Depreciation/amortization | | | (13,767 | ) | | | (13,974 | ) | | | (12,508 | ) | | | (12,504 | ) | | | (12,532 | ) |
| Administrative, advisory and trustee fees | | | (1,331 | ) | | | (1,392 | ) | | | (1,348 | ) | | | (1,267 | ) | | | (1,196 | ) |
| Other expenses | | | (362 | ) | | | (291 | ) | | | (343 | ) | | | (457 | ) | | | (253 | ) |
| Other income | | | 248 | | | | 671 | | | | 1,023 | | | | 431 | | | | 635 | |
| Income before minority interest and discontinued operations and (loss) gain on sale of other investments | | $ | 2,942 | | | $ | 3,595 | | | $ | 3,841 | | | $ | 3,674 | | | $ | 3,911 | |
| | | | | | | | | | | | | | | | | | | | | |
| Gain (loss) on sale of other investments | | | 0 | | | | 38 | | | | 2 | | | | 3 | | | | (1 | ) |
| Minority interest portion of operating partnership income | | | (647 | ) | | | (833 | ) | | | (855 | ) | | | (855 | ) | | | (981 | ) |
| Minority interest portion of other partnerships’ (income) loss | | | 63 | | | | 111 | | | | (11 | ) | | | 0 | | | | 36 | |
| Income from continuing operations | | | 2,358 | | | | 2,911 | | | | 2,977 | | | | 2,822 | | | | 2,965 | |
| Discontinued operations, net of minority interest | | | 0 | | | | 377 | | | | 6 | | | | 14 | | | | 16 | |
| NET INCOME | | | 2,358 | | | | 3,288 | | | | 2,983 | | | | 2,836 | | | | 2,981 | |
| Dividends to preferred shareholders | | | (593 | ) | | | (593 | ) | | | (593 | ) | | | (593 | ) | | | (593 | ) |
| NET INCOME AVAILABLE TO COMMON SHAREHOLDERS | | $ | 1,765 | | | $ | 2,695 | | | $ | 2,390 | | | $ | 2,243 | | | $ | 2,388 | |
| | | | | | | | | | | | | | | | | | | | | |
| Per Share Data | | | | | | | | | | | | | | | | | | | | |
Earnings per common share from continuing operations | | $ | .03 | | | $ | .04 | | | $ | .04 | | | $ | .04 | | | $ | .05 | |
Earnings per common share from discontinued operations | | | .00 | | | | .01 | | | | .00 | | | | .00 | | | | .00 | |
| Net income per common share – basic & diluted | | $ | .03 | | | $ | .05 | | | $ | .04 | | | $ | .04 | | | $ | .05 | |
| | | | | | | | | | | | | | | | | | | | | |
| Percentage of Revenues | | | | | | | | | | | | | | | | | | | | |
| Real estate expenses | | | 40.5 | % | | | 40.6 | % | | | 39.6 | % | | | 38.8 | % | | | 39.0 | % |
| General and administrative | | | 2.3 | % | | | 2.4 | % | | | 2.5 | % | | | 2.3 | % | | | 2.2 | % |
| | | | | | | | | | | | | | | | | | | | | |
| Ratios | | | | | | | | | | | | | | | | | | | | |
| EBITDA/Interest expense | | | 1.98 | x | | | 2.04 | x | | | 1.97 | x | | | 2.01 | x | | | 2.04 | x |
| EBITDA/Interest expense plus preferred distributions | | | 1.91 | x | | | 1.97 | x | | | 1.90 | x | | | 1.93 | x | | | 1.97 | x |
INVESTORS REAL ESTATE TRUST AND SUBSIDIARIES
FUNDS FROM OPERATIONS (unaudited)
(in thousands, except per share and unit data)
| | | Three Months Ended | |
| | | 07/31/2008 | | | 04/30/2008 | | | 01/31/2008 | | | 10/31/2007 | | | 07/31/2007 | |
Funds From Operations(1) | | | | | | | | | | | | | | | |
| Net income | | $ | 2,358 | | | $ | 3,288 | | | $ | 2,983 | | | $ | 2,836 | | | $ | 2,981 | |
| Less dividends to preferred shareholders | | | (593 | ) | | | (593 | ) | | | (593 | ) | | | (593 | ) | | | (593 | ) |
| Net income available to common shareholders | | | 1,765 | | | | 2,695 | | | | 2,390 | | | | 2,243 | | | | 2,388 | |
| Adjustments: | | | | | | | | | | | | | | | | | | | | |
| Minority interest in earnings of Unitholders | | | 647 | | | | 973 | | | | 858 | | | | 859 | | | | 987 | |
| Depreciation and amortization | | | 13,641 | | | | 13,910 | | | | 12,456 | | | | 12,452 | | | | 12,485 | |
| (Gain)/loss on depreciable property sales | | | 0 | | | | (510 | ) | | | (2 | ) | | | (3 | ) | | | 1 | |
| Funds from operations applicable to common shares and Units | | $ | 16,053 | | | $ | 17,068 | | | $ | 15,702 | | | $ | 15,551 | | | $ | 15,861 | |
| | | | | | | | | | | | | | | | | | | | | |
| FFO per share and unit - basic and diluted | | $ | 0.20 | | | $ | 0.22 | | | $ | 0.21 | | | $ | 0.21 | | | $ | 0.23 | |
| Weighted average shares and units | | | 79,214 | | | | 78,195 | | | | 75,755 | | | | 70,158 | | | | 68,947 | |
| (1) | Funds From Operations (FFO) - The National Association of Real Estate Investment Trusts, Inc. (NAREIT) defines FFO as net income (computed in accordance with generally accepted accounting principles, excluding gains/losses from sales of property plus real estate depreciation and amortization. We consider FFO to be a standard supplemental measure for equity real estate investment trusts because it facilitates an understanding of the operating performance of properties without giving effect to real estate depreciation and amortization, which assume that the value of real estate assets diminishes predictably over time. Since real estate values instead historically rise or fall with market conditions, we believe that FFO provides investors and management with a more accurate indication of our financial and operating results. |
INVESTORS REAL ESTATE TRUST AND SUBSIDIARIES
EARNINGS BEFORE INTEREST, TAXES, DEPRECIATION AND AMORTIZATION (EBITDA) (unaudited)
(in thousands)
| | | Three Months Ended | |
| | | | 07/312008 | | | 04/30/2008 | | | 01/31/2008 | | | 10/31/2007 | | | 07/31/2007 | |
EBITDA(1) | | | | | | | | | | | | | | | | |
| Net income | | $ | 2,358 | | | $ | 3,288 | | | $ | 2,983 | | | $ | 2,836 | | | $ | 2,981 | |
| Adjustments: | | | | | | | | | | | | | | | | | | | | |
| Minority interest portion of operating partnership income | | | 647 | | | | 973 | | | | 858 | | | | 859 | | | | 987 | |
| Income before minority interest | | | 3,005 | | | | 4,261 | | | | 3,841 | | | | 3,695 | | | | 3,968 | |
| Add: | | | | | | | | | | | | | | | | | | | | |
| Interest | | | 16,888 | | | | 16,470 | | | | 15,840 | | | | 15,687 | | | | 15,442 | |
| Depreciation/amortization related to real estate investments | | | 13,318 | | | | 13,542 | | | | 12,165 | | | | 12,177 | | | | 12,205 | |
| Amortization related to non-real estate investments | | | 449 | | | | 437 | | | | 356 | | | | 340 | | | | 343 | |
Amortization related to real estate revenues(2) | | | (57 | ) | | | (65 | ) | | | (79 | ) | | | (99 | ) | | | (40 | ) |
| Less: | | | | | | | | | | | | | | | | | | | | |
| Interest income | | | (223 | ) | | | (449 | ) | | | (953 | ) | | | (339 | ) | | | (354 | ) |
| (Gain) loss on sale of real estate, land and other investments | | | 0 | | | | (552 | ) | | | (2 | ) | | | (3 | ) | | | 1 | |
| EBITDA | | $ | 33,380 | | | $ | 33,644 | | | $ | 31,168 | | | $ | 31,458 | | | $ | 31,565 | |
| (1) | EBITDA is earnings before interest, taxes, depreciation and amortization. We consider EBITDA to be an appropriate supplemental performance measure because it eliminates depreciation, interest and the gain/loss from property dispositions, which permits investors to view income from operations without the effect of non-cash depreciation or the cost of debt. EBITDA is a non-GAAP measure. EBITDA as calculated by us is not comparable to EBITDA reported by other REITs that do not define EBITDA exactly as we do. |
| (2) | Included in real estate revenue in the Statement of Operations. |
INVESTORS REAL ESTATE TRUST AND SUBSIDIARIES
LONG-TERM MORTGAGE DEBT ANALYSIS
(in thousands)
Debt Maturity Schedule
Annual Expirations
| | | Future Maturities of Debt | |
| Fiscal Year | | Fixed Debt | | | Variable Debt | | | Total Debt | |
| 2009 | | $ | 15,061 | | | $ | 1,142 | | | $ | 16,203 | |
| 2010 | | | 129,768 | | | | 2,500 | | | | 132,268 | |
| 2011 | | | 82,680 | | | | 0 | | | | 82,680 | |
| 2012 | | | 93,168 | | | | 0 | | | | 93,168 | |
| 2013 | | | 26,230 | | | | 4,954 | | | | 31,184 | |
| 2014 | | | 49,490 | | | | 0 | | | | 49,490 | |
| 2015 | | | 72,720 | | | | 0 | | | | 72,720 | |
| 2016 | | | 67,024 | | | | 397 | | | | 67,421 | |
| 2017 | | | 162,667 | | | | 0 | | | | 162,667 | |
| 2018 | | | 94,718 | | | | 0 | | | | 94,718 | |
| Thereafter | | | 263,483 | | | | 2,265 | | | | 265,748 | |
| Total maturities | | $ | 1,057,009 | | | $ | 11,258 | | | $ | 1,068,267 | |
| | | 07/31/2008 | | | 04/30/2008 | | | 01/31/2008 | | | 10/31/2007 | | | 07/31/2007 | |
| Balances Outstanding | | | | | | | | | | | | | | | |
| Mortgage | | | | | | | | | | | | | | | |
| Fixed rate | | $ | 1,057,009 | | | $ | 1,052,162 | | | $ | 951,112 | | | $ | 943,632 | | | $ | 938,677 | |
| Variable rate | | | 11,258 | | | | 11,696 | | | | 24,673 | | | | 23,980 | | | | 21,409 | |
| Mortgage total | | | 1,068,267 | | | | 1,063,858 | | | | 975,785 | | | | 967,612 | | | | 960,086 | |
| | | | | | | | | | | | | | | | | | | | | |
| Weighted Average Interest Rates | | | | | | | | | | | | | | | | | | | | |
| Secured | | | 6.36 | % | | | 6.37 | % | | | 6.44 | % | | | 6.36 | % | | | 6.37 | % |
INVESTORS REAL ESTATE TRUST AND SUBSIDIARIES
CAPITAL ANALYSIS
(in thousands, except per share and unit amounts)
| | | 07/31/2008 | | | 04/30/2008 | | | 01/31/2008 | | | 10/31/2007 | | | 07/31/2007 | |
| Equity Capitalization | | | | | | | | | | | | | | | |
| Common shares outstanding | | | 58,202 | | | | 57,732 | | | | 56,977 | | | | 56,419 | | | | 48,893 | |
| Operating partnership (OP) units outstanding | | | 21,293 | | | | 21,238 | | | | 20,395 | | | | 20,114 | | | | 20,494 | |
| Total common shares and OP units outstanding | | | 79,495 | | | | 78,970 | | | | 77,372 | | | | 76.533 | | | | 69,387 | |
| Market price per common share (closing price at end of period) | | $ | 10.50 | | | $ | 10.20 | | | $ | 9.80 | | | $ | 10.85 | | | $ | 9.62 | |
| Equity capitalization-common shares and OP units | | $ | 834,698 | | | $ | 805,494 | | | $ | 758,246 | | | $ | 830,383 | | | $ | 667,503 | |
| Recorded book value of preferred shares | | $ | 27,317 | | | $ | 27,317 | | | $ | 27,317 | | | $ | 27,317 | | | $ | 27,317 | |
| Total equity capitalization | | $ | 862,015 | | | $ | 832,811 | | | $ | 785,563 | | | $ | 857,700 | | | $ | 694,820 | |
| | | | | | | | | | | | | | | | | | | | | |
| Debt Capitalization | | | | | | | | | | | | | | | | | | | | |
| Total mortgage debt | | $ | 1,068,267 | | | $ | 1,063,858 | | | $ | 975,785 | | | $ | 967,612 | | | $ | 960,086 | |
| Total capitalization | | $ | 1,930,282 | | | $ | 1,896,669 | | | $ | 1,761,348 | | | $ | 1,825,312 | | | $ | 1,654,906 | |
| | | | | | | | | | | | | | | | | | | | | |
| Total debt to total capitalization | | 0.55:1 | | | 0.56:1 | | | 0.55:1 | | | 0.53:1 | | | 0.58:1 | |
| | | | | | | | | | | | | | | | | | | | | |
Earnings to fixed charges(1) | | | 1.15 | x | | | 1.20 | x | | | 1.23 | x | | | 1.23 | x | | | 1.25 | x |
Earnings to combined fixed charges and preferred distributions(2) | | | 1.12 | x | | | 1.16 | x | | | 1.19 | x | | | 1.19 | x | | | 1.21 | x |
Debt service coverage ratio(3) | | | 1.40 | x | | | 1.46 | x | | | 1.42 | x | | | 1.45 | x | | | 1.48 | x |
| | | | | | | | | | | | | | | | | | | | | |
| Distribution Data | | | | | | | | | | | | | | | | | | | | |
| Common shares and units outstanding at record date | | | 79,116 | | | | 77,675 | | | | 76,698 | | | | 69,363 | | | | 68,523 | |
| Total common distribution paid | | $ | 13,332 | | | $ | 13,050 | | | $ | 12,847 | | | $ | 11,584 | | | $ | 11,409 | |
| Common distribution per share and unit | | $ | 0.1685 | | | $ | 0.1680 | | | $ | 0.1675 | | | $ | 0.1670 | | | $ | 0.1665 | |
Payout ratio (FFO per share and unit basis)(4) | | | 84.3 | % | | | 76.4 | % | | | 79.8 | % | | | 79.5 | % | | | 72.4 | % |
| (1) | The ratio of earnings to fixed charges is computed by dividing earnings by fixed charges. For this purpose, earnings consist of income from continuing operations before adjustments for minority interest in consolidated subsidiaries, plus fixed charges and preferred distributions, less capitalized interest and preferred distributions. Fixed charges consist of mortgage and loan interest expense, whether expensed or capitalized, the amortization of debt expense and capitalized interest. |
| (2) | The ratio of earnings to combined fixed charges and preferred distributions is computed by dividing earnings by combined fixed charges and preferred distributions. For this purpose, earnings consist of income from continuing operations before adjustments for minority interest in consolidated subsidiaries, plus fixed charges and preferred distributions, less capitalized interest and preferred distributions. Combined fixed charges and preferred distributions consist of fixed charges (mortgage and loan interest expense, whether expensed or capitalized, the amortization of debt expense and capitalized interest) and preferred distributions. |
| (3) | Debt service coverage ratio is computed by dividing earnings before interest income and expense, depreciation, amortization and gain on sale of real estate by interest expense and principal amortization. |
| (4) | The ratio of the current quarterly distribution rate per common share and unit divided by quarterly FFO per share and unit. |
INVESTORS REAL ESTATE TRUST AND SUBSIDIARIES
STABILIZED PROPERTIES NET OPERATING INCOME SUMMARY
(in thousands)
| | | Stabilized Properties(1) | |
| | | Three Months Ended July 31, | |
| Segment | | 2008 | | | 2007 | | | % Change | |
| Multi-Family Residential | | $ | 9,471 | | | $ | 9,258 | | | | 2.3 | % |
| Commercial Office | | | 10,932 | | | | 11,872 | | | | (7.9 | %) |
| Commercial Medical | | | 6,699 | | | | 6,626 | | | | 1.1 | % |
| Commercial Industrial | | | 1,663 | | | | 1,976 | | | | (15.8 | %) |
| Commercial Retail | | | 2,337 | | | | 2,530 | | | | (7.6 | %) |
| | | $ | 31,102 | | | $ | 32,262 | | | | (3.6 | %) |
| 1. | For 1st Quarter Fiscal 2009 and 1st Quarter Fiscal 2008, stabilized properties excluded: |
Multi-Family Residential - | Indian Hills, Sioux City, IA; Cottonwood IV Apartments, Bismarck, ND; Greenfield Apartments, Omaha, NE; Minot 4th Street Apartments, Minot, ND; Minot 11th Street Apartments, Minot, ND; Minot Fairmont Apartments, Minot, ND; Minot Westridge Apartments, Minot, ND and Thomasbrook Apartments, Lincoln, NE. |
Commercial Office - | 610 Business Center, Brooklyn Park, MN; Intertech, Fenton, MO and Plymouth 5095, Plymouth, MN. |
Commercial Medical - | Barry Point, Kansas City, MO; Edgewood Vista Billings, Billings, MT; Edgewood Vista East Grand Forks, East Grand Forks, MN; Edgewood Vista Sioux Falls, Sioux Falls, SD; Edina 6405 France Medical, Edina, MN; Edina 6363 France Medical, Edina, MN; Minneapolis 701 25th Ave Medical (Riverside), Minneapolis, MN; Burnsville 303 Nicollet Medical (Ridgeview), Burnsville, MN; Burnsville 305 Nicollet Medical (Ridgeview South), Burnsville, MN; Eagan 1440 Duckwood Medical, Eagan, MN; Edgewood Vista Belgrade, Belgrade, MT; Edgewood Vista Columbus, Columbus, NE; Edgewood Vista Fargo, Fargo, ND; Edgewood Vista Grand Island, Grand Island, NE and Edgewood Vista Norfolk, Norfolk, NE. |
Commercial Industrial - | Cedar Lake Business Center, St. Louis Park, MN; Urbandale, Urbandale, IA; Woodbury 1865, Woodbury, MN and Eagan 2785 & 2795 Highway 55, Eagan, MN. |
| Discontinued operations from fiscal 2008 include: |
Multi-Family Residential - | 405 Grant Avenue Apartments, Harvey, ND and Sweetwater – Green Acres 1&2 Apartments, Devils Lake, ND. |
Commercial Office - | Minnetonka Office Building, Minnetonka, MN. |
INVESTORS REAL ESTATE TRUST AND SUBSIDIARIES
NET OPERATING INCOME DETAIL
(in thousands)
| | | Three Months Ended July 31, 2008 | |
| | | Multi-Family Residential | | | Commercial Office | | | Commercial Medical | | | Commercial Industrial | | | Commercial Retail | | | Corporate and Other | | | Total | |
| Real estate rental revenue | | | | | | | | | | | | | | | | | | | | | |
Stabilized(1) | | $ | 17,649 | | | $ | 20,187 | | | $ | 9,303 | | | $ | 2,202 | | | $ | 3,477 | | | $ | 0 | | | $ | 52,818 | |
| Non-Stabilized | | | 952 | | | | 619 | | | | 3,563 | | | | 894 | | | | 0 | | | | 0 | | | | 6,028 | |
| Total | | | 18,601 | | | | 20,806 | | | | 12,866 | | | | 3,096 | | | | 3,477 | | | | 0 | | | | 58,846 | |
| | | | | | | | | | | | | | | | | | | | | | | | | | | | | |
| Real estate expenses | | | | | | | | | | | | | | | | | | | | | | | | | | | | |
Stabilized(1) | | | 8,178 | | | | 9,255 | | | | 2,604 | | | | 539 | | | | 1,140 | | | | 0 | | | | 21,716 | |
| Non-Stabilized | | | 546 | | | | 189 | | | | 1,158 | | | | 195 | | | | 0 | | | | 0 | | | | 2,088 | |
| Total | | | 8,724 | | | | 9,444 | | | | 3,762 | | | | 734 | | | | 1,140 | | | | 0 | | | | 23,804 | |
| | | | | | | | | | | | | | | | | | | | | | | | | | | | | |
| Net Operating Income (NOI) | | | | | | | | | | | | | | | | | | | | | | | | | | | | |
Stabilized(1) | | | 9,471 | | | | 10,932 | | | | 6,699 | | | | 1,663 | | | | 2,337 | | | | 0 | | | | 31,102 | |
| Non-Stabilized | | | 406 | | | | 430 | | | | 2,405 | | | | 699 | | | | 0 | | | | 0 | | | | 3,940 | |
| Net operating income | | $ | 9,877 | | | $ | 11,362 | | | $ | 9,104 | | | $ | 2,362 | | | $ | 2,337 | | | $ | 0 | | | $ | 35,042 | |
| | | | | | | | | | | | | | | | | | | | | | | | | | | | | |
| Reconciliation of NOI to net income available to common shareholders | | | | | | | | | | | | | | | | | | | | | | | | | | | | |
| Interest (expense) income | | $ | (4,945 | ) | | $ | (5,979 | ) | | $ | (4,304 | ) | | $ | (960 | ) | | $ | (1,038 | ) | | $ | 338 | | | $ | (16,888 | ) |
| Depreciation/amortization | | | (3,473 | ) | | | (5,492 | ) | | | (3,140 | ) | | | (859 | ) | | | (742 | ) | | | (61 | ) | | | (13,767 | ) |
| Administrative, advisory and trustee fees | | | 0 | | | | 0 | | | | 0 | | | | 0 | | | | 0 | | | | (1,331 | ) | | | (1,331 | ) |
| Other expenses | | | 0 | | | | 0 | | | | 0 | | | | 0 | | | | 0 | | | | (362 | ) | | | (362 | ) |
| Other income | | | 0 | | | | 0 | | | | 0 | | | | 0 | | | | 0 | | | | 248 | | | | 248 | |
| Income before minority interest and discontinued operations and (loss) gain on sale of other investments | | | 1,459 | | | | (109 | ) | | | 1,660 | | | | 543 | | | | 557 | | | | (1,168 | ) | | | 2,942 | |
| Minority interest portion of operating partnership income | | | 0 | | | | 0 | | | | 0 | | | | 0 | | | | 0 | | | | (647 | ) | | | (647 | ) |
| Minority interest portion of other partnerships’ loss | | | 0 | | | | 0 | | | | 0 | | | | 0 | | | | 0 | | | | 63 | | | | 63 | |
| Income from continuing operations | | | 1,459 | | | | (109 | ) | | | 1,660 | | | | 543 | | | | 557 | | | | (1,752 | ) | | | 2,358 | |
| NET INCOME | | | 1,459 | | | | (109 | ) | | | 1,660 | | | | 543 | | | | 557 | | | | (1,752 | ) | | | 2,358 | |
| Dividends to preferred shareholders | | | 0 | | | | 0 | | | | 0 | | | | 0 | | | | 0 | | | | (593 | ) | | | (593 | ) |
| NET INCOME AVAILABLE TO COMMON SHAREHOLDERS | | $ | 1,459 | | | $ | (109 | ) | | $ | 1,660 | | | $ | 543 | | | $ | 557 | | | $ | (2,345 | ) | | $ | 1,765 | |
| 1. | For 1st Quarter Fiscal 2009 and 1st Quarter Fiscal 2008, stabilized properties excluded: |
Multi-Family Residential - | Indian Hills, Sioux City, IA; Cottonwood IV Apartments, Bismarck, ND; Greenfield Apartments, Omaha, NE; Minot 4th Street Apartments, Minot, ND; Minot 11th Street Apartments, Minot, ND; Minot Fairmont Apartments, Minot, ND; Minot Westridge Apartments, Minot, ND and Thomasbrook Apartments, Lincoln, NE. |
Commercial Office - | 610 Business Center, Brooklyn Park, MN; Intertech, Fenton, MO and Plymouth 5095, Plymouth, MN. |
Commercial Medical - | Barry Point, Kansas City, MO; Edgewood Vista Billings, Billings, MT; Edgewood Vista East Grand Forks, East Grand Forks, MN; Edgewood Vista Sioux Falls, Sioux Falls, SD; Edina 6405 France Medical, Edina, MN; Edina 6363 France Medical, Edina, MN; Minneapolis 701 25th Ave Medical (Riverside), Minneapolis, MN; Burnsville 303 Nicollet Medical (Ridgeview), Burnsville, MN; Burnsville 305 Nicollet Medical (Ridgeview South), Burnsville, MN; Eagan 1440 Duckwood Medical, Eagan, MN; Edgewood Vista Belgrade, Belgrade, MT; Edgewood Vista Columbus, Columbus, NE; Edgewood Vista Fargo, Fargo, ND; Edgewood Vista Grand Island, Grand Island, NE and Edgewood Vista Norfolk, Norfolk, NE. |
Commercial Industrial - | Cedar Lake Business Center, St. Louis Park, MN; Urbandale, Urbandale, IA; Woodbury 1865, Woodbury, MN and Eagan 2785 & 2795 Highway 55, Eagan, MN. |
INVESTORS REAL ESTATE TRUST AND SUBSIDIARIES
NET OPERATING INCOME DETAIL
(in thousands)
| | | Three Months Ended July 31, 2007 | |
| | | Multi-Family Residential | | | Commercial Office | | | Commercial Medical | | | Commercial Industrial | | | Commercial Retail | | | Corporate and Other | | | Total | |
| Real estate rental revenue | | | | | | | | | | | | | | | | | | | | | |
Stabilized(1) | | $ | 17,143 | | | $ | 20,587 | | | $ | 8,855 | | | $ | 2,419 | | | $ | 3,632 | | | $ | 0 | | | $ | 52,636 | |
| Non-Stabilized | | | 576 | | | | 7 | | | | 111 | | | | 243 | | | | 0 | | | | 0 | | | | 937 | |
| Total | | | 17,719 | | | | 20,594 | | | | 8,966 | | | | 2,662 | | | | 3,632 | | | | 0 | | | | 53,573 | |
| | | | | | | | | | | | | | | | | | | | | | | | | | | | | |
| Real estate expenses | | | | | | | | | | | | | | | | | | | | | | | | | | | | |
Stabilized(1) | | | 7,885 | | | | 8,715 | | | | 2,229 | | | | 443 | | | | 1,102 | | | | 0 | | | | 20,374 | |
| Non-Stabilized | | | 399 | | | | 1 | | | | 44 | | | | 56 | | | | 0 | | | | 0 | | | | 500 | |
| Total | | | 8,284 | | | | 8,716 | | | | 2,273 | | | | 499 | | | | 1,102 | | | | 0 | | | | 20,874 | |
| | | | | | | | | | | | | | | | | | | | | | | | | | | | | |
| Net Operating Income (NOI) | | | | | | | | | | | | | | | | | | | | | | | | | | | | |
Stabilized(1) | | | 9,258 | | | | 11,872 | | | | 6,626 | | | | 1,976 | | | | 2,530 | | | | 0 | | | | 32,262 | |
| Non-Stabilized | | | 177 | | | | 6 | | | | 67 | | | | 187 | | | | 0 | | | | 0 | | | | 437 | |
| Net operating income | | $ | 9,435 | | | $ | 11,878 | | | $ | 6,693 | | | $ | 2,163 | | | $ | 2,530 | | | $ | 0 | | | $ | 32,699 | |
| | | | | | | | | | | | | | | | | | | | | | | | | | | | | |
| Reconciliation of NOI to net income available to common shareholders | | | | | | | | | | | | | | | | | | | | | | | | | | | | |
| Interest (expense) income | | $ | (4,953 | ) | | $ | (5,802 | ) | | $ | (2,876 | ) | | $ | (782 | ) | | $ | (1,031 | ) | | $ | 2 | | | $ | (15,442 | ) |
| Depreciation/amortization | | | (3,228 | ) | | | (5,686 | ) | | | (2,161 | ) | | | (718 | ) | | | (684 | ) | | | (55 | ) | | | (12,532 | ) |
| Administrative, advisory and trustee fees | | | 0 | | | | 0 | | | | 0 | | | | 0 | | | | 0 | | | | (1,196 | ) | | | (1,196 | ) |
| Other expenses | | | 0 | | | | 0 | | | | 0 | | | | 0 | | | | 0 | | | | (253 | ) | | | (253 | ) |
| Other income | | | 0 | | | | 0 | | | | 0 | | | | 0 | | | | 0 | | | | 635 | | | | 635 | |
| Income before minority interest and discontinued operations and (loss) gain on sale of other investments | | | 1,254 | | | | 390 | | | | 1,656 | | | | 663 | | | | 815 | | | | (867 | ) | | | 3,911 | |
| Loss on sale of other investments | | | 0 | | | | 0 | | | | 0 | | | | 0 | | | | 0 | | | | (1 | ) | | | (1 | ) |
| Minority interest portion of operating partnership income | | | 0 | | | | 0 | | | | 0 | | | | 0 | | | | 0 | | | | (981 | ) | | | (981 | ) |
| Minority interest portion of other partnerships’ loss | | | 0 | | | | 0 | | | | 0 | | | | 0 | | | | 0 | | | | 36 | | | | 36 | |
| Income from continuing operations | | | 1,254 | | | | 390 | | | | 1,656 | | | | 663 | | | | 815 | | | | (1,813 | ) | | | 2,965 | |
Discontinued operations, net of minority interest(2) | | | 18 | | | | (2 | ) | | | 0 | | | | 0 | | | | 0 | | | | 0 | | | | 16 | |
| NET INCOME | | | 1,272 | | | | 388 | | | | 1,656 | | | | 663 | | | | 815 | | | | (1,813 | ) | | | 2,981 | |
| Dividends to preferred shareholders | | | 0 | | | | 0 | | | | 0 | | | | 0 | | | | 0 | | | | (593 | ) | | | (593 | ) |
| NET INCOME AVAILABLE TO COMMON SHAREHOLDERS | | $ | 1,272 | | | $ | 388 | | | $ | 1,656 | | | $ | 663 | | | $ | 815 | | | $ | (2,406 | ) | | $ | 2,388 | |
| 1. | For 1st Quarter Fiscal 2009 and 1st Quarter Fiscal 2008, stabilized properties excluded: |
Multi-Family Residential - | Indian Hills, Sioux City, IA; Cottonwood IV Apartments, Bismarck, ND; Greenfield Apartments, Omaha, NE; Minot 4th Street Apartments, Minot, ND; Minot 11th Street Apartments, Minot, ND; Minot Fairmont Apartments, Minot, ND; Minot Westridge Apartments, Minot, ND and Thomasbrook Apartments, Lincoln, NE. |
Commercial Office - | 610 Business Center, Brooklyn Park, MN; Intertech, Fenton, MO and Plymouth 5095, Plymouth, MN. |
Commercial Medical - | Barry Point, Kansas City, MO; Edgewood Vista Billings, Billings, MT; Edgewood Vista East Grand Forks, East Grand Forks, MN; Edgewood Vista Sioux Falls, Sioux Falls, SD; Edina 6405 France Medical, Edina, MN; Edina 6363 France Medical, Edina, MN; Minneapolis 701 25th Ave Medical (Riverside), Minneapolis, MN; Burnsville 303 Nicollet Medical (Ridgeview), Burnsville, MN; Burnsville 305 Nicollet Medical (Ridgeview South), Burnsville, MN; Eagan 1440 Duckwood Medical, Eagan, MN; Edgewood Vista Belgrade, Belgrade, MT; Edgewood Vista Columbus, Columbus, NE; Edgewood Vista Fargo, Fargo, ND; Edgewood Vista Grand Island, Grand Island, NE and Edgewood Vista Norfolk, Norfolk, NE. |
Commercial Industrial - | Cedar Lake Business Center, St. Louis Park, MN; Urbandale, Urbandale, IA; Woodbury 1865, Woodbury, MN and Eagan 2785 & 2795 Highway 55, Eagan, MN. |
| Discontinued operations from fiscal 2008 include: |
Multi-Family Residential - | 405 Grant Avenue Apartments, Harvey, ND and Sweetwater – Green Acres 1&2 Apartments, Devils Lake, ND. |
Commercial Office - | Minnetonka Office Building, Minnetonka, MN. |
INVESTORS REAL ESTATE TRUST AND SUBSIDIARIES
STABILIZED PROPERTIES AND OVERALL ECONOMIC OCCUPANCY LEVELS BY SEGMENT
1st Quarter Fiscal 2009 vs. 1st Quarter Fiscal 2008
| Segments | | Stabilized Properties | | | All Properties | |
| | | 1st Quarter | | | 1st Quarter | | | 1st Quarter | | | 1st Quarter | |
| | | Fiscal 2009 | | | Fiscal 2008 | | | Fiscal 2009 | | | Fiscal 2008 | |
| Multi-Family Residential | | | 92.8 | % | | | 92.2 | % | | | 92.3 | % | | | 91.8 | % |
| Commercial Office | | | 88.9 | % | | | 93.3 | % | | | 89.1 | % | | | 93.3 | % |
| Commercial Medical | | | 95.7 | % | | | 96.0 | % | | | 96.5 | % | | | 96.1 | % |
| Commercial Industrial | | | 95.9 | % | | | 98.6 | % | | | 96.8 | % | | | 98.1 | % |
| Commercial Retail | | | 86.6 | % | | | 87.0 | % | | | 86.6 | % | | | 87.0 | % |
INVESTORS REAL ESTATE TRUST AND SUBSIDIARIES
COMMERCIAL LEASING SUMMARY
for the three months ended July 31, 2008
| | | New(1) | | | Renew(2) | | | 1st Quarter Fiscal 2009 Total | |
| Gross Leasing Square Footage | | | | | | | | | |
| Commercial Office | | | 48,371 | | | | 114,138 | | | | 162,509 | |
| Commercial Medical | | | 7,573 | | | | 7,247 | | | | 14,820 | |
| Commercial Industrial | | | 12,500 | | | | 0 | | | | 12,500 | |
| Commercial Retail | | | 7,606 | | | | 38,586 | | | | 46,192 | |
| Total | | | 76,050 | | | | 159,971 | | | | 236,021 | |
| | | | | | | | | | | | | |
| Weighted Average Term (yrs) | | | | | | | | | | | | |
| Commercial Office | | | 4.8 | | | | 3.6 | | | | 4.3 | |
| Commercial Medical | | | 7.5 | | | | 3.7 | | | | 5.2 | |
| Commercial Industrial | | | 0.1 | | | | 0.0 | | | | 0.1 | |
| Commercial Retail | | | 4.1 | | | | 3.2 | | | | 3.7 | |
| Total | | | 4.6 | | | | 3.4 | | | | 4.0 | |
| | | | | | | | | | | | | |
Weighted Average Rental Rate Increases(3) | | | | | | | | | | | | |
| Rate on Expiring Leases | | | | | | | | | | | | |
| Commercial Office | | | | | | | | | | $ | 10.90 | |
| Commercial Medical | | | | | | | | | | | 18.15 | |
| Commercial Industrial | | | | | | | | | | | 0.00 | |
| Commercial Retail | | | | | | | | | | | 8.64 | |
| Total | | | | | | | | | | $ | 10.92 | |
| | | | | | | | | | | | | |
Weighted Average Rate on New and Renewal Leases(3) | | | | | | | | | | | | |
| Commercial Office | | $ | 7.24 | | | $ | 9.83 | | | $ | 9.06 | |
| Commercial Medical | | | 22.65 | | | | 16.49 | | | | 19.64 | |
| Commercial Industrial | | | 5.50 | | | | 0.00 | | | | 5.50 | |
| Commercial Retail | | | 8.56 | | | | 7.95 | | | | 8.05 | |
| Total | | $ | 8.62 | | | $ | 9.68 | | | $ | 9.34 | |
| | | | | | | | | | | | | |
| Percentage Increase (Decrease) | | | | | | | | | | | | |
| Commercial Office | | | | | | | | | | | (16.9 | %) |
| Commercial Medical | | | | | | | | | | | 8.2 | % |
| Commercial Industrial | | | | | | | | | | | 0.0 | % |
| Commercial Retail | | | | | | | | | | | (6.8 | %) |
| Total | | | | | | | | | | | (14.5 | %) |
| (1) | Excluding leases in place on date of acquisition. |
| (2) | Renewing leases are not necessarily leases expiring in that period. Expansion footage for renewing tenants is included in this column. |
| (3) | Net of estimated operating expenses, other than tenant improvements. |
INVESTORS REAL ESTATE TRUST AND SUBSIDIARIES
COMMERCIAL LEASING SUMMARY
for the three months ended July 31, 2008
| | | 1st Quarter Fiscal 2009 Total | |
| | | New | | | Renew | | | Total Dollars | |
| Tenant Improvements | | | | | | | | | |
| Commercial Office | | $ | 482,779 | | | $ | 494,961 | | | $ | 977,740 | |
| Commercial Medical | | | 265,055 | | | | 4,225 | | | | 269,280 | |
| Commercial Industrial | | | 0 | | | | 0 | | | | 0 | |
| Commercial Retail | | | 14,548 | | | | 0 | | | | 14,548 | |
| Subtotal | | $ | 762,382 | | | $ | 499,186 | | | $ | 1,261,568 | |
| | | | | | | | | | | | | |
| Tenant Improvements per square foot | | | | | | | | | | | | |
| Commercial Office | | $ | 9.98 | | | $ | 4.34 | | | $ | 6.02 | |
| Commercial Medical | | | 35.00 | | | | 0.58 | | | | 0.58 | |
| Commercial Industrial | | | 0.00 | | | | 0.00 | | | | 0.00 | |
| Commercial Retail | | | 1.91 | | | | 0.00 | | | | 0.31 | |
| Subtotal | | $ | 10.02 | | | $ | 3.12 | | | $ | 5.35 | |
| | | | | | | | | | | | | |
| Leasing Costs | | | | | | | | | | | | |
| Commercial Office | | $ | 258,509 | | | $ | 412,452 | | | $ | 670,961 | |
| Commercial Medical | | | 50,093 | | | | 13,921 | | | | 64,014 | |
| Commercial Industrial | | | 343 | | | | 0 | | | | 343 | |
| Commercial Retail | | | 12,932 | | | | 2,947 | | | | 15,879 | |
| Subtotal | | $ | 321,877 | | | $ | 429,320 | | | $ | 751,197 | |
| | | | | | | | | | | | | |
| Leasing Costs per square foot | | | | | | | | | | | | |
| Commercial Office | | $ | 5.34 | | | $ | 3.61 | | | $ | 4.13 | |
| Commercial Medical | | | 6.61 | | | | 1.92 | | | | 4.32 | |
| Commercial Industrial | | | 0.03 | | | | 0.00 | | | | 0.03 | |
| Commercial Retail | | | 1.70 | | | | 0.08 | | | | 0.34 | |
| Subtotal | | $ | 4.23 | | | $ | 2.68 | | | $ | 3.18 | |
| | | | | | | | | | | | | |
| Tenant Improvements and Leasing Costs | | | | | | | | | | | | |
| Commercial Office | | $ | 741,288 | | | $ | 907,413 | | | $ | 1,648,701 | |
| Commercial Medical | | | 315,148 | | | | 18,146 | | | | 333,294 | |
| Commercial Industrial | | | 343 | | | | 0 | | | | 343 | |
| Commercial Retail | | | 27,480 | | | | 2,947 | | | | 30,427 | |
| Total | | $ | 1,084,259 | | | $ | 928,506 | | | $ | 2,012,765 | |
| | | | | | | | | | | | | |
| Tenant Improvements and Leasing Costs per square foot | | | | | | | | | | | | |
| Commercial Office | | $ | 15.33 | | | $ | 7.95 | | | $ | 10.15 | |
| Commercial Medical | | | 41.61 | | | | 2.50 | | | | 22.49 | |
| Commercial Industrial | | | 0.03 | | | | 0.00 | | | | 0.03 | |
| Commercial Retail | | | 3.61 | | | | 0.08 | | | | 0.66 | |
| Total | | $ | 14.26 | | | $ | 5.80 | | | $ | 8.53 | |
INVESTORS REAL ESTATE TRUST AND SUBSIDIARIES
MULTI-FAMILY RESIDENTIAL SUMMARY
| | | Three Months Ended | |
| | | 07/31/2008 | | | 04/30/2008 | | | 01/31/2008 | | | 10/31/2007 | | | 07/31/2007 | |
| Number of Units | | | 9,528 | | | | 9,500 | | | | 9,500 | | | | 9,337 | | | | 9,337 | |
| Average Investment Per Unit | | $ | 53,919 | | | $ | 53,677 | | | $ | 53,313 | | | $ | 52,898 | | | $ | 52,524 | |
| | | | | | | | | | | | | | | | | | | | | |
| Average Scheduled Rent per Unit | | | | | | | | | | | | | | | | | | | | |
| Stabilized | | $ | 700.43 | | | $ | 695.01 | | | $ | 690.31 | | | $ | 686.99 | | | $ | 684.23 | |
| Non-Stabilized | | | 647.89 | | | | 657.55 | | | | 611.55 | | | | 590.24 | | | | 595.63 | |
| | | $ | 697.18 | | | $ | 692.85 | | | $ | 686.38 | | | $ | 683.01 | | | $ | 680.59 | |
| | | | | | | | | | | | | | | | | | | | | |
| Total Receipts per Unit | | | | | | | | | | | | | | | | | | | | |
| Stabilized | | $ | 657.09 | | | $ | 658.05 | | | $ | 659.05 | | | $ | 659.02 | | | $ | 638.27 | |
| Non-Stabilized | | | 536.68 | | | | 484.14 | | | | 474.53 | | | | 491.86 | | | | 500.23 | |
| | | $ | 649.63 | | | $ | 648.03 | | | $ | 649.84 | | | $ | 652.15 | | | $ | 632.59 | |
| Occupancy % | | | | | | | | | | | | | | | | | | | | |
| Stabilized | | | 92.8 | % | | | 93.2 | % | | | 93.9 | % | | | 94.2 | % | | | 92.2 | % |
| Non-Stabilized | | | 84.1 | % | | | 72.4 | % | | | 76.1 | % | | | 81.6 | % | | | 81.5 | % |
| | | | 92.3 | % | | | 92.1 | % | | | 93.1 | % | | | 93.8 | % | | | 91.8 | % |
| | | | | | | | | | | | | | | | | | | | | |
| Operating Expenses as a % of Scheduled Rent | | | | | | | | | | | | | | | | | | | | |
| Stabilized | | | 43.5 | % | | | 45.9 | % | | | 44.3 | % | | | 44.6 | % | | | 42.9 | % |
| Non-Stabilized | | | 47.5 | % | | | 46.7 | % | | | 47.2 | % | | | 65.4 | % | | | 58.1 | % |
| Total | | | 43.7 | % | | | 45.9 | % | | | 44.4 | % | | | 45.4 | % | | | 43.5 | % |
INVESTORS REAL ESTATE TRUST AND SUBSIDIARIES
10 LARGEST COMMERCIAL TENANTS – BASED ON ANNUALIZED BASE RENT
as of July 31, 2008
| Tenant | | Number of Properties | | | Weighted Average Remaining Lease Term in Months | | | % of Total Commercial Segments’ Minimum Rents | | | Aggregate Rentable Square Feet | | | Percentage of Aggregate Occupied Square Feet | |
| Affiliates of Edgewood Vista/Sunwest Management, Inc. | | | 21 | | | | 245 | | | | 10.8 | % | | | 983,877 | | | | 9.4 | % |
| St. Lukes Hospital of Duluth, Inc. | | | 6 | | | | 84 | | | | 3.5 | % | | | 198,775 | | | | 1.9 | % |
| Fairview Health | | | 8 | | | | 49 | | | | 2.3 | % | | | 167,086 | | | | 1.6 | % |
| Applied Underwriters | | | 3 | | | | 103 | | | | 2.2 | % | | | 141,724 | | | | 1.3 | % |
| Best Buy Co., Inc. (NYSE: BBY) | | | 2 | | | | 28 | | | | 2.0 | % | | | 224,650 | | | | 2.1 | % |
| UGS Corp. | | | 1 | | | | 37 | | | | 1.7 | % | | | 122,567 | | | | 1.2 | % |
| HealthEast Care System | | | 1 | | | | 127 | | | | 1.6 | % | | | 114,316 | | | | 1.1 | % |
| Microsoft (NASDAQ: MSFT) | | | 1 | | | | 61 | | | | 1.5 | % | | | 122,040 | | | | 1.2 | % |
| Smurfit - Stone Container (NASDAQ: SSCC) | | | 2 | | | | 89 | | | | 1.5 | % | | | 424,147 | | | | 4.0 | % |
| Arcadis Corporate Services (NASDAQ: ARCAF) | | | 2 | | | | 36 | | | | 1.4 | % | | | 82,725 | | | | 0.8 | % |
| Total/Weighted Average | | | | | | | 105 | | | | 28.5 | % | | | 2,581,907 | | | | 24.6 | % |
INVESTORS REAL ESTATE TRUST AND SUBSIDIARIES
LEASE EXPIRATIONS
as of July 31, 2008
| Fiscal Year | | Number of Leases | | | Rentable Square Feet | | | Percent of Rentable Square Feet | | | Annualized Rent * | | | Average Rental Rate | | | Percent of Annualized Rent | |
| Commercial Office | | | | | | | | | | | | | | | | | | |
| 2009 | | | 39 | | | | 314,089 | | | | 7.6 | % | | $ | 3,165,891 | | | $ | 10.08 | | | | 6.0 | % |
| 2010 | | | 75 | | | | 721,436 | | | | 17.3 | % | | | 8,162,688 | | | | 11.31 | | | | 15.4 | % |
| 2011 | | | 64 | | | | 609,070 | | | | 14.6 | % | | | 7,921,067 | | | | 13.01 | | | | 15.0 | % |
| 2012 | | | 46 | | | | 763,435 | | | | 18.4 | % | | | 10,624,841 | | | | 13.92 | | | | 20.1 | % |
| 2013 | | | 34 | | | | 574,474 | | | | 13.8 | % | | | 7,262,507 | | | | 12.64 | | | | 13.8 | % |
| 2014 and thereafter | | | 56 | | | | 1,177,239 | | | | 28.3 | % | | | 15,672,806 | | | | 13.31 | | | | 29.7 | % |
| | | | 314 | | | | 4,159,743 | | | | 100.0 | % | | $ | 52,809,800 | | | $ | 12.70 | | | | 100.0 | % |
| | | | | | | | | | | | | | | | | | | | | | | | | |
| Commercial Medical | | | | | | | | | | | | | | | | | | | | | | | | |
| 2009 | | | 19 | | | | 64,744 | | | | 3.0 | % | | $ | 1,164,769 | | | $ | 17.99 | | | | 3.2 | % |
| 2010 | | | 24 | | | | 66,599 | | | | 3.1 | % | | | 1,237,797 | | | | 18.59 | | | | 3.4 | % |
| 2011 | | | 16 | | | | 60,868 | | | | 2.8 | % | | | 1,112,167 | | | | 18.22 | | | | 3.0 | % |
| 2012 | | | 29 | | | | 108,148 | | | | 5.0 | % | | | 2,235,263 | | | | 20.67 | | | | 6.1 | % |
| 2013 | | | 16 | | | | 66,383 | | | | 3.1 | % | | | 1,200,507 | | | | 18.08 | | | | 3.3 | % |
| 2014 and thereafter | | | 94 | | | | 1,786,348 | | | | 83.0 | % | | | 29,613,757 | | | | 16.58 | | | | 81.0 | % |
| | | | 198 | | | | 2,153,090 | | | | 100.0 | % | | $ | 36,564,260 | | | $ | 16.98 | | | | 100.0 | % |
| | | | | | | | | | | | | | | | | | | | | | | | | |
| Commercial Industrial | | | | | | | | | | | | | | | | | | | | | | | | |
| 2009 | | | 4 | | | | 107,788 | | | | 4.1 | % | | $ | 497,923 | | | $ | 4.62 | | | | 4.9 | % |
| 2010 | | | 6 | | | | 256,657 | | | | 9.7 | % | | | 775,783 | | | | 3.02 | | | | 7.6 | % |
| 2011 | | | 14 | | | | 843,507 | | | | 31.8 | % | | | 2,626,621 | | | | 3.11 | | | | 25.7 | % |
| 2012 | | | 2 | | | | 237,066 | | | | 8.9 | % | | | 640,078 | | | | 2.70 | | | | 6.3 | % |
| 2013 | | | 4 | | | | 263,834 | | | | 10.0 | % | | | 1,288,193 | | | | 4.88 | | | | 12.6 | % |
| 2014 and thereafter | | | 9 | | | | 940,284 | | | | 35.5 | % | | | 4,382,489 | | | | 4.66 | | | | 42.9 | % |
| | | | 39 | | | | 2,649,136 | | | | 100.0 | % | | $ | 10,211,087 | | | $ | 3.85 | | | | 100.0 | % |
| | | | | | | | | | | | | | | | | | | | | | | | | |
| Commercial Retail | | | | | | | | | | | | | | | | | | | | | | | | |
| 2009 | | | 26 | | | | 147,413 | | | | 12.3 | % | | $ | 1,130,399 | | | $ | 7.67 | | | | 11.5 | % |
| 2010 | | | 51 | | | | 216,883 | | | | 18.2 | % | | | 1,492,320 | | | | 6.88 | | | | 15.2 | % |
| 2011 | | | 43 | | | | 259,098 | | | | 21.7 | % | | | 2,551,501 | | | | 9.85 | | | | 26.0 | % |
| 2012 | | | 21 | | | | 213,795 | | | | 17.9 | % | | | 1,137,116 | | | | 5.32 | | | | 11.6 | % |
| 2013 | | | 13 | | | | 67,485 | | | | 5.7 | % | | | 427,440 | | | | 6.33 | | | | 4.4 | % |
| 2014 and thereafter | | | 26 | | | | 288,623 | | | | 24.2 | % | | | 3,065,588 | | | | 10.62 | | | | 31.3 | % |
| | | | 180 | | | | 1,193,297 | | | | 100.0 | % | | $ | 9,804,364 | | | $ | 8.22 | | | | 100.0 | % |
| | | | | | | | | | | | | | | | | | | | | | | | | |
| Commercial Total | | | | | | | | | | | | | | | | | | | | | | | | |
| 2009 | | | 88 | | | | 634,034 | | | | 6.2 | % | | $ | 5,958,982 | | | $ | 9.40 | | | | 5.4 | % |
| 2010 | | | 156 | | | | 1,261,575 | | | | 12.4 | % | | | 11,668,588 | | | | 9.25 | | | | 10.7 | % |
| 2011 | | | 137 | | | | 1,772,543 | | | | 17.5 | % | | | 14,211,356 | | | | 8.02 | | | | 13.0 | % |
| 2012 | | | 98 | | | | 1,322,444 | | | | 13.0 | % | | | 14,637,298 | | | | 11.07 | | | | 13.4 | % |
| 2013 | | | 67 | | | | 972,176 | | | | 9.6 | % | | | 10,178,647 | | | | 10.47 | | | | 9.3 | % |
| 2014 and thereafter | | | 185 | | | | 4,192,494 | | | | 41.3 | % | | | 52,734,640 | | | | 12.58 | | | | 48.2 | % |
| | | | 731 | | | | 10,155,266 | | | | 100.0 | % | | $ | 109,389,511 | | | $ | 10.77 | | | | 100.0 | % |
* Annualized Rent is monthly scheduled rent as of July 31, 2008 (cash basis), multiplied by 12.
INVESTORS REAL ESTATE TRUST AND SUBSIDIARIES
FISCAL 2009 ACQUISITION SUMMARY
as of July 31, 2008
($’s in thousands)
| Property | Location | Segment Type | Acquisition Date | | Square Feet/Units | | | Leased Percentage at Acquisition | | | July 31, 2008 Leased Percentage | | | Investment | |
| | | | | | | | | | | | | | | | |
| 33-unit Minot Westridge Apartments | Minot, ND | Multi-Family Residential | May 1, 2008 | | | 33 | | | | 100.0 | % | | | 100.0 | % | | $ | 1,954 | |
| 12-unit Minot Fairmont Apartments | Minot, ND | Multi-Family Residential | May 1, 2008 | | | 12 | | | | 100.0 | % | | | 100.0 | % | | | 365 | |
4-unit Minot 4th Street Apartments | Minot, ND | Multi-Family Residential | May 1, 2008 | | | 4 | | | | 100.0 | % | | | 100.0 | % | | | 89 | |
3-unit Minot 11th Street Apartments | Minot, ND | Multi-Family Residential | May 1, 2008 | | | 3 | | | | 100.0 | % | | | 100.0 | % | | | 64 | |
| | | | | | | | | | | | | | | | | | | | |
Bismarck 2130 S. 12th Street | Bismarck, ND | Unimproved Land | May 23, 2008 | | | N/A | | | | N/A | | | | N/A | | | | 576 | |
| | | | Total Square Feet | | | 0 | | | | | | | | | | | $ | 3,048 | |
| | | | Total Units | | | 52 | | | | | | | | | | | | | |
INVESTORS REAL ESTATE TRUST AND SUBSIDIARIES
FISCAL 2009 DEVELOPMENT SUMMARY
as of July 31, 2008
($’s in thousands)
| Property and Location | Total Rentable Square Feet or # of Units | | Percentage Leased or Committed | | | Anticipated Total Cost | | | Cost to Date | | Anticipated Construction Completion |
| 2828 Chicago Avenue Medical Building, Minneapolis, MN | 56,239 s.f. | | | 73 | % | | | 15,700 | | | | 14,177 | | 2nd Quarter Fiscal 2009 |
| Southdale Medical Building Expansion, Edina, MN | 27,750 s.f. | | | 75 | % | | | 10,988 | | | | 7,533 | | 2nd Quarter Fiscal 2009 |
| IRET Corporate Plaza, Minot, ND | approximately 71 units & 60,100 s.f. | | | 33 | %* | | | 20,739 | | | | 13,200 | | 2nd Quarter Fiscal 2009 |
| 401 South Main, Minot, ND | 10 Units | | | 0 | % | | $ | 793 | | | $ | 321 | | 2nd Quarter Fiscal 2009 |
| | | | Total | | | $ | 42,332 | | | $ | 35,231 | | |
* IRET - - occupied portion.