Exhibit 99.2
Second Quarter Fiscal 2009
Supplemental Operating and Financial Data
for the Quarter Ended October 31, 2008
| | | | | |
CONTACT: Michelle Saari VP - Investors Relations Direct Dial: 701-837-4738 E-Mail: msaari@iret.com | | | | 12 Main Street South Minot, ND 58701 Tel: 701-837-4738 Fax: 701.838.7785 www.iret.com |
Supplemental Financial and Operating Data
October 31, 2008
| | Page |
| | |
| Company Background and Highlights | 2 |
| | |
| Investment Cost by Segment | 4 |
| | |
| Key Financial Data | |
| Condensed Consolidated Balance Sheets | 5 |
| Condensed Consolidated Statements of Operations | 6 |
| Funds From Operations | 7 |
| Earnings Before Interest, Taxes, Depreciation and Amortization (EBITDA) | 8 |
| | |
| Capital Analysis | |
| Long-Term Mortgage Debt Analysis | 9 |
| Long-Term Mortgage Debt Detail | 10-11 |
| Capital Analysis | 12 |
| | |
| Portfolio Analysis | |
| Stabilized Properties Net Operating Income Summary | 13 |
| Net Operating Income Detail | 14-17 |
| Stabilized Properties and Overall Economic Occupancy Levels by Segment | 18 |
| | |
| Tenant Analysis | |
| Commercial Leasing Summary | 19-20 |
| Multi-Family Residential Summary | 21 |
| 10 Largest Commercial Tenants - Based on Annualized Base Rent | 22 |
| Lease Expirations as of October 31, 2008 | 23 |
| | |
| Growth and Strategy | |
| Fiscal 2009 Acquisition Summary | 24 |
| Fiscal 2009 Development Summary | 25 |
| | |
| Definitions � 60; | 26 |
Company Background and Highlights
Second Quarter Fiscal 2009
Investors Real Estate Trust is a self-administered, equity real estate investment trust (REIT) investing in a portfolio of income-producing properties located primarily in the upper Midwest. IRET’s portfolio is diversified among multi-family residential, commercial office, medical (including senior housing), industrial and retail segments.
During the three months ended October 31, 2008, IRET acquired a 36-unit apartment building located in Isanti, Minnesota for a purchase price of $3.1 million, consisting of approximately $1.3 million in cash, and limited partnership units of IRET’s operating partnership valued at approximately $1.8 million. The apartment building is currently 100% occupied.
IRET also acquired during the second quarter of fiscal year 2009 an approximately 22,500 square foot one-story office property, on approximately 2.5 acres in Bismarck, North Dakota. The office building is connected to a vacant four-story office property which the Company is demolishing. The Company paid $2.2 million for this property, which is the former location of the Bank of North Dakota. The one-story office annex is currently leased through June 2009 to a single tenant.
During the second quarter of fiscal year 2009, IRET completed the remaining interior work and tenant improvements in its approximately 31,643 square foot addition to the Company’s Southdale Medical Building in Edina, Minnesota. The cost of the expansion project was approximately $6.5 million, excluding relocation, tenant improvement and leasing costs incurred to relocate tenants in the existing facility. The addition is currently approximately 84% leased. A lease has been signed for the remainder of the space in the addition, with tenant occupancy expected in the fourth quarter of fiscal year 2009.
Also during the second quarter of fiscal year 2009, IRET completed construction of an approximately 56,239 square foot medical office building and adjoining parking ramp next to the Company’s existing five-story medical office building located at 2828 Chicago Avenue in Minneapolis, Minnesota. The new medical office building and adjoining parking ramp cost approximately $11.3 million to construct. Currently, approximately 72% of this new medical office building is leased to two tenants.
The Company had no material dispositions during the three months ended October 31, 2008.
In the second quarter of fiscal year 2009, IRET paid its 150th consecutive quarterly distribution per common share/unit at equal or increasing rates. The $0.1690 per share/unit distribution was paid October 1, 2008.
As of October 31, 2008, IRET owns a diversified portfolio of 242 properties consisting of 77 multi-family residential properties, 66 office properties, 49 medical properties (including senior housing), 17 industrial properties and 33 retail properties. IRET’s distributions have increased every year for 38 consecutive years. IRET’s shares are publicly traded on the NASDAQ Global Select Market (NASDAQ: IRET).
Company Snapshot
(as of October 31, 2008)
| Company Headquarters | Minot, North Dakota |
| Fiscal Year-End | April 30 |
| Reportable Segments | Multi-Family Residential, Office, Medical, Industrial, Retail |
| Total Properties | 242 |
| Total Square Feet | |
| (commercial properties) | 11.6 million |
| Total Units | |
| (multi-family residential properties) | 9,564 |
| Common Shares Outstanding | 58,713,015 |
| Limited Partnership Units Outstanding | 21,287,484 |
| Common Share Distribution - Quarter/Annualized | $0.1690/$0.6760 |
| Dividend Yield | 6.8% |
| Total Capitalization (see p. 12 for detail) | $1.9 billion |
Investor Information
Board of Trustees
| Jeffrey L. Miller | Trustee and Chairman |
| Stephen L. Stenehjem | Trustee and Vice Chairman, Chair of Compensation Committee |
| John D. Stewart | Trustee, Chair of Audit Committee |
| Patrick G. Jones | Trustee, Chair of Nominating Committee |
| C.W. “Chip” Morgan | Trustee |
| John T. Reed | Trustee |
| W. David Scott | Trustee |
| Thomas A. Wentz, Jr. | Trustee, Senior Vice President - Asset Management and Finance |
| Timothy P. Mihalick | Trustee, Senior Vice President and Chief Operating Officer |
Management
| Thomas A. Wentz, Sr. | President and Chief Executive Officer |
| Diane K. Bryantt | Senior Vice President and Chief Financial Officer |
| Timothy P. Mihalick | Senior Vice President and Chief Operating Officer; Trustee |
| Thomas A. Wentz, Jr | Senior Vice President, Asset Management and Finance; Trustee |
| Kelly A. Walters | Senior Vice President, Capital Markets and New Business Development |
| Charles A. Greenberg | Senior Vice President, Commercial Asset Management |
| Michael A. Bosh | Senior Vice President, General Counsel and Secretary |
Corporate Headquarters:
12 Main Street South
Minot, North Dakota 58701
Trading Symbol: IRET
Stock Exchange Listing: NASDAQ
Investor Relations:
Michelle Saari
msaari@iret.com
Common Share Data (NASDAQ: IRET)
| | | 2nd Quarter Fiscal Year 2009 | | | 1st Quarter Fiscal Year 2009 | | | 4th Quarter Fiscal Year 2008 | | | 3rd Quarter Fiscal Year 2008 | | | 2nd Quarter Fiscal Year 2008 | |
| High Closing Price | | $ | 11.19 | | | $ | 10.68 | | | $ | 10.47 | | | $ | 10.55 | | | $ | 11.59 | |
| Low Closing Price | | $ | 7.66 | | | $ | 9.54 | | | $ | 8.95 | | | $ | 8.84 | | | $ | 9.35 | |
| Average Closing Price | | $ | 10.01 | | | $ | 10.10 | | | $ | 9.82 | | | $ | 9.67 | | | $ | 10.62 | |
| Closing Price at end of quarter | | $ | 9.88 | | | $ | 10.50 | | | $ | 10.20 | | | $ | 9.80 | | | $ | 10.85 | |
| Common Share Distributions—annualized | | $ | 0.676 | | | $ | 0.674 | | | $ | 0.672 | | | $ | 0.67 | | | $ | 0.668 | |
| Closing Dividend Yield - annualized | | | 6.8 | % | | | 6.4 | % | | | 6.6 | % | | | 6.8 | % | | | 6.2 | % |
| Closing common shares outstanding (thousands) | | | 58,713 | | | | 58,202 | | | | 57,732 | | | | 56,977 | | | | 56,419 | |
| Closing limited partnership units outstanding (thousands) | | | 21,287 | | | | 21,293 | | | | 21,238 | | | | 20,395 | | | | 20,114 | |
| Closing market value of outstanding common shares, plus imputed closing market value of outstanding limited partnership units (thousands) | | $ | 790,400 | | | $ | 834,698 | | | $ | 805,494 | | | $ | 758,246 | | | $ | 830,383 | |
Certain statements in these supplemental disclosures are “forward-looking statements” within the meaning of the Private Securities Litigation Reform Act of 1995. Such statements involve known and unknown risks, uncertainties and other factors that may cause actual results to differ materially from projected results. Such risks, uncertainties and other factors include, but are not limited to: fluctuations in interest rates, the effect of government regulation, the availability of capital, changes in general and local economic and real estate market conditions, competition, our ability to attract and retain skilled personnel, and those risks and uncertainties detailed from time to time in our filings with the Securities and Exchange Commission, including our 2008 Form 10-K. We assume no obligation to update or supplement forward-looking statements that become untrue because of subsequent events.
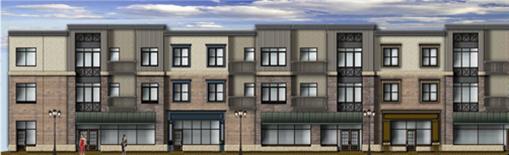
Second Quarter Fiscal 2009 Development Project
| IRET Corporate Plaza, Minot, ND |
| | |
|
| (architects’ rendering) |
| |
| |
| | |
Investment Cost by Segment - Second Quarter Fiscal 2009
With investments in the multi-family residential and commercial office, medical, industrial and retail segments, IRET’s diversified portfolio helps to provide stability during market fluctuations in returns from specific property types.
INVESTORS REAL ESTATE TRUST AND SUBSIDIARIES
CONDENSED CONSOLIDATED BALANCE SHEETS (unaudited)
(in thousands)
| | | 10/31/2008 | | | 07/31/2008 | | | 04/30/2008 | | | 01/31/2008 | | | 10/31/2007 | |
| ASSETS | | | | | | | | | | | | | | | |
| Real estate investments | | | | | | | | | | | | | | | |
| Property owned | | $ | 1,690,763 | | | $ | 1,655,778 | | | $ | 1,648,259 | | | $ | 1,558,560 | | | $ | 1,529,063 | |
| Less accumulated depreciation | | | (240,452 | ) | | | (229,691 | ) | | | (219,379 | ) | | | (209,400 | ) | | | (199,682 | ) |
| | | | 1,450,311 | | | | 1,426,087 | | | | 1,428,880 | | | | 1,349,160 | | | | 1,329,381 | |
| Development in progress | | | 17,603 | | | | 35,231 | | | | 22,856 | | | | 14,734 | | | | 10,553 | |
| Unimproved land | | | 5,036 | | | | 4,567 | | | | 3,901 | | | | 3,901 | | | | 3,901 | |
| Mortgage loans receivable, net of allowance | | | 528 | | | | 534 | | | | 541 | | | | 548 | | | | 391 | |
| Total real estate investments | | | 1,473,478 | | | | 1,466,419 | | | | 1,456,178 | | | | 1,368,343 | | | | 1,344,226 | |
| Other assets | | | | | | | | | | | | | | | | | | | | |
| Cash and cash equivalents | | | 40,855 | | | | 42,351 | | | | 53,481 | | | | 76,392 | | | | 89,302 | |
| Marketable securities – available-for-sale | | | 420 | | | | 420 | | | | 420 | | | | 2,160 | | | | 2,090 | |
| Receivable arising from straight-lining of rents, net of allowance | | | 14,962 | | | | 14,383 | | | | 14,113 | | | | 13,753 | | | | 13,430 | |
| Accounts receivable, net of allowance | | | 3,676 | | | | 4,395 | | | | 4,163 | | | | 3,842 | | | | 2,279 | |
| Real estate deposits | | | 86 | | | | 1,048 | | | | 1,379 | | | | 1,103 | | | | 1,601 | |
| Prepaid and other assets | | | 1,813 | | | | 2,324 | | | | 349 | | | | 821 | | | | 1,445 | |
| Intangible assets, net of accumulated amortization | | | 56,576 | | | | 58,936 | | | | 61,649 | | | | 29,025 | | | | 30,457 | |
| Tax, insurance, and other escrow | | | 6,182 | | | | 7,888 | | | | 8,642 | | | | 8,060 | | | | 6,539 | |
| Property and equipment, net | | | 1,432 | | | | 1,450 | | | | 1,467 | | | | 1,487 | | | | 1,486 | |
| Goodwill | | | 1,392 | | | | 1,392 | | | | 1,392 | | | | 1,396 | | | | 1,397 | |
| Deferred charges and leasing costs, net | | | 16,037 | | | | 15,155 | | | | 14,793 | | | | 13,528 | | | | 12,624 | |
| TOTAL ASSETS | | $ | 1,616,909 | | | $ | 1,616,161 | | | $ | 1,618,026 | | | $ | 1,519,910 | | | $ | 1,506,876 | |
| | | | | | | | | | | | | | | | | | | | | |
| LIABILITIES AND SHAREHOLDERS’ EQUITY | | | | | | | | | | | | | | | | | | | | |
| LIABILITIES | | | | | | | | | | | | | | | | | | | | |
| Accounts payable and accrued expenses | | $ | 26,645 | | | $ | 32,917 | | | $ | 33,757 | | | $ | 29,573 | | | $ | 22,974 | |
| Revolving lines of credit | | | 15,000 | | | | 0 | | | | 0 | | | | 0 | | | | 0 | |
| Mortgages payable | | | 1,066,113 | | | | 1,068,267 | | | | 1,063,858 | | | | 975,785 | | | | 967,612 | |
| Other | | | 703 | | | | 830 | | | | 978 | | | | 1,019 | | | | 1,161 | |
| TOTAL LIABILITIES | | | 1,108,461 | | | | 1,102,014 | | | | 1,098,593 | | | | 1,006,377 | | | | 991,747 | |
| | | | | | | | | | | | | | | | | | | | | |
| COMMITMENTS AND CONTINGENCIES | | | | | | | | | | | | | | | | | | | | |
| MINORITY INTEREST IN PARTNERSHIPS | | | 13,098 | | | | 13,186 | | | | 12,609 | | | | 12,768 | | | | 12,781 | |
| MINORITY INTEREST OF UNITHOLDERS IN OPERATING PARTNERSHIP | | | 157,622 | | | | 159,984 | | | | 161,818 | | | | 155,301 | | | | 154,274 | |
| SHAREHOLDERS’ EQUITY | | | | | | | | | | | | | | | | | | | | |
| Preferred Shares of Beneficial Interest | | | 27,317 | | | | 27,317 | | | | 27,317 | | | | 27,317 | | | | 27,317 | |
| Common Shares of Beneficial Interest | | | 448,803 | | | | 444,134 | | | | 440,187 | | | | 433,645 | | | | 429,236 | |
| Accumulated distributions in excess of net income | | | (138,392 | ) | | | (130,474 | ) | | | (122,498 | ) | | | (115,546 | ) | | | (108,474 | ) |
| Accumulated other comprehensive income (loss) | | | 0 | | | | 0 | | | | 0 | | | | 48 | | | | (5 | ) |
| Total shareholders’ equity | | | 337,728 | | | | 340,977 | | | | 345,006 | | | | 345,464 | | | | 348,074 | |
| TOTAL LIABILITIES AND SHAREHOLDERS’ EQUITY | | $ | 1,616,909 | | | $ | 1,616,161 | | | $ | 1,618,026 | | | $ | 1,519,910 | | | $ | 1,506,876 | |
INVESTORS REAL ESTATE TRUST AND SUBSIDIARIES
CONDENSED CONSOLIDATED STATEMENTS OF OPERATIONS (unaudited)
(in thousands, except per share data)
| | | Six Months Ended | | | Three Months Ended | |
| OPERATING RESULTS | | 10/31/2008 | | | 10/31/2007 | | | 10/31/2008 | | | 07/31/2008 | | | 04/30/2008 | | | 01/31/2008 | | | 10/31/2007 | |
| Real estate revenue | | $ | 118,419 | | | $ | 107,784 | | | $ | 59,573 | | | $ | 58,846 | | | $ | 58,962 | | | $ | 54,424 | | | $ | 54,211 | |
| Real estate expenses | | | 47,757 | | | | 41,927 | | | | 23,953 | | | | 23,804 | | | | 23,911 | | | | 21,567 | | | | 21,053 | |
| Net operating income | | | 70,662 | | | | 65,857 | | | | 35,620 | | | | 35,042 | | | | 35,051 | | | | 32,857 | | | | 33,158 | |
| Interest | | | (33,966 | ) | | | (31,129 | ) | | | (17,078 | ) | | | (16,888 | ) | | | (16,470 | ) | | | (15,840 | ) | | | (15,687 | ) |
| Depreciation/amortization | | | (27,726 | ) | | | (25,036 | ) | | | (13,959 | ) | | | (13,767 | ) | | | (13,974 | ) | | | (12,508 | ) | | | (12,504 | ) |
| Administrative, advisory and trustee fees | | | (2,570 | ) | | | (2,463 | ) | | | (1,239 | ) | | | (1,331 | ) | | | (1,392 | ) | | | (1,348 | ) | | | (1,267 | ) |
| Operating expenses | | | (844 | ) | | | (710 | ) | | | (482 | ) | | | (362 | ) | | | (291 | ) | | | (343 | ) | | | (457 | ) |
| Non-operating income | | | 536 | | | | 1,066 | | | | 288 | | | | 248 | | | | 671 | | | | 1,023 | | | | 431 | |
| Income before minority interest and discontinued operations and (loss) gain on sale of other investments | | $ | 6,092 | | | $ | 7,585 | | | $ | 3,150 | | | $ | 2,942 | | | $ | 3,595 | | | $ | 3,841 | | | $ | 3,674 | |
| | | | | | | | | | | | | | | | | | | | | | | | | | | | | |
| Gain on sale of other investments | | | 54 | | | | 2 | | | | 54 | | | | 0 | | | | 38 | | | | 2 | | | | 3 | |
| Minority interest portion of operating partnership income | | | (1,347 | ) | | | (1,835 | ) | | | (700 | ) | | | (647 | ) | | | (833 | ) | | | (855 | ) | | | (855 | ) |
| Minority interest portion of other partnerships’ (income) loss | | | 82 | | | | 36 | | | | 19 | | | | 63 | | | | 111 | | | | (11 | ) | | | 0 | |
| Income from continuing operations | | | 4,881 | | | | 5,788 | | | | 2,523 | | | | 2,358 | | | | 2,911 | | | | 2,977 | | | | 2,822 | |
| Discontinued operations, net of minority interest | | | 0 | | | | 29 | | | | 0 | | | | 0 | | | | 377 | | | | 6 | | | | 14 | |
| NET INCOME | | | 4,881 | | | | 5,817 | | | | 2,523 | | | | 2,358 | | | | 3,288 | | | | 2,983 | | | | 2,836 | |
| Dividends to preferred shareholders | | | (1,186 | ) | | | (1,186 | ) | | | (593 | ) | | | (593 | ) | | | (593 | ) | | | (593 | ) | | | (593 | ) |
| NET INCOME AVAILABLE TO COMMON SHAREHOLDERS | | $ | 3,695 | | | $ | 4,631 | | | $ | 1,930 | | | $ | 1,765 | | | $ | 2,695 | | | $ | 2,390 | | | $ | 2,243 | |
| | | | | | | | | | | | | | | | | | | | | | | | | | | | | |
| Per Share Data | | | | | | | | | | | | | | | | | | | | | | | | | | | | |
Earnings per common share from continuing operations | | $ | .06 | | | $ | .09 | | | $ | .03 | | | $ | .03 | | | $ | .04 | | | $ | .04 | | | $ | .04 | |
Earnings per common share from discontinued operations | | | .00 | | | | .00 | | | | .00 | | | | .00 | | | | .01 | | | | .00 | | | | .00 | |
| Net income per common share – basic & diluted | | $ | .06 | | | $ | .09 | | | $ | .03 | | | $ | .03 | | | $ | .05 | | | $ | .04 | | | $ | .04 | |
| | | | | | | | | | | | | | | | | | | | | | | | | | | | | |
| Percentage of Revenues | | | | | | | | | | | | | | | | | | | | | | | | | | | | |
| Real estate expenses | | | 40.3 | % | | | 38.9 | % | | | 40.2 | % | | | 40.5 | % | | | 40.6 | % | | | 39.6 | % | | | 38.8 | % |
| General and administrative | | | 2.2 | % | | | 2.3 | % | | | 2.1 | % | | | 2.3 | % | | | 2.4 | % | | | 2.5 | % | | | 2.3 | % |
| Income from continuing operations | | | 4.1 | % | | | 5.4 | % | | | 4.2 | % | | | 4.0 | % | | | 4.9 | % | | | 5.5 | % | | | 5.2 | % |
| Net income | | | 4.1 | % | | | 5.4 | % | | | 4.2 | % | | | 4.0 | % | | | 5.6 | % | | | 5.5 | % | | | 5.2 | % |
| | | | | | | | | | | | | | | | | | | | | | | | | | | | | |
| Ratios | | | | | | | | | | | | | | | | | | | | | | | | | | | | |
| EBITDA/Interest expense | | | 1.98 | x | | | 2.02 | x | | | 1.99 | x | | | 1.98 | x | | | 2.04 | x | | | 1.97 | x | | | 2.01 | x |
| EBITDA/Interest expense plus preferred distributions | | | 1.92 | x | | | 1.95 | x | | | 1.92 | x | | | 1.91 | x | | | 1.97 | x | | | 1.90 | x | | | 1.93 | x |
INVESTORS REAL ESTATE TRUST AND SUBSIDIARIES
FUNDS FROM OPERATIONS (unaudited)
(in thousands, except per share and unit data)
| | | Six Months Ended | | | Three Months Ended | |
| | | 10/31/2008 | | | 10/31/2007 | | | 10/31/2008 | | | 07/31/2008 | | | 04/30/2008 | | | 01/31/2008 | | | 10/31/2007 | |
Funds From Operations(1) | | | | | | | | | | | | | | | | | | | | | |
| Net income | | $ | 4,881 | | | $ | 5,817 | | | $ | 2,523 | | | $ | 2,358 | | | $ | 3,288 | | | $ | 2,983 | | | $ | 2,836 | |
| Less dividends to preferred shareholders | | | (1,186 | ) | | | (1,186 | ) | | | (593 | ) | | | (593 | ) | | | (593 | ) | | | (593 | ) | | | (593 | ) |
| Net income available to common shareholders | | | 3,695 | | | | 4,631 | | | | 1,930 | | | | 1,765 | | | | 2,695 | | | | 2,390 | | | | 2,243 | |
| Adjustments: | | | | | | | | | | | | | | | | | | | | | | | | | | | | |
| Minority interest in earnings of Unitholders | | | 1,347 | | | | 1,846 | | | | 700 | | | | 647 | | | | 973 | | | | 858 | | | | 859 | |
| Depreciation and amortization | | | 27,481 | | | | 24,937 | | | | 13,840 | | | | 13,641 | | | | 13,910 | | | | 12,456 | | | | 12,452 | |
| (Gains)/loss on depreciable property sales | | | (54 | ) | | | (2 | ) | | | (54 | ) | | | 0 | | | | (510 | ) | | | (2 | ) | | | (3 | ) |
| Funds from operations applicable to common shares and Units | | $ | 32,469 | | | $ | 31,412 | | | $ | 16,416 | | | $ | 16,053 | | | $ | 17,068 | | | $ | 15,702 | | | $ | 15,551 | |
| | | | | | | | | | | | | | | | | | | | | | | | | | | | | |
| FFO per share and unit - basic and diluted | | $ | 0.41 | | | $ | 0.45 | | | $ | 0.21 | | | $ | 0.20 | | | $ | 0.22 | | | $ | 0.21 | | | $ | 0.21 | |
| Weighted average shares and units | | | 79,441 | | | | 69,552 | | | | 79,668 | | | | 79,214 | | | | 78,195 | | | | 75,755 | | | | 70,158 | |
(1) | See Definitions on page 26. |
INVESTORS REAL ESTATE TRUST AND SUBSIDIARIES
EARNINGS BEFORE INTEREST, TAXES, DEPRECIATION AND AMORTIZATION (EBITDA) (unaudited)
(in thousands)
| | | Three Months Ended | |
| | | 10/31/2008 | | | | 07/312008 | | | 04/30/2008 | | | 01/31/2008 | | | 10/31/2007 | |
EBITDA(1) | | | | | | | | | | | | | | | | |
| Net income | | $ | 2,523 | | | $ | 2,358 | | | $ | 3,288 | | | $ | 2,983 | | | $ | 2,836 | |
| Adjustments: | | | | | | | | | | | | | | | | | | | | |
| Minority interest portion of operating partnership income | | | 700 | | | | 647 | | | | 973 | | | | 858 | | | | 859 | |
| Income before minority interest | | | 3,223 | | | | 3,005 | | | | 4,261 | | | | 3,841 | | | | 3,695 | |
| Add: | | | | | | | | | | | | | | | | | | | | |
| Interest | | | 17,078 | | | | 16,888 | | | | 16,470 | | | | 15,840 | | | | 15,687 | |
| Depreciation/amortization related to real estate investments | | | 13,480 | | | | 13,318 | | | | 13,542 | | | | 12,165 | | | | 12,177 | |
| Amortization related to non-real estate investments | | | 479 | | | | 449 | | | | 437 | | | | 356 | | | | 340 | |
Amortization related to real estate revenues(2) | | | (52 | ) | | | (57 | ) | | | (65 | ) | | | (79 | ) | | | (99 | ) |
| Less: | | | | | | | | | | | | | | | | | | | | |
| Interest income | | | (210 | ) | | | (223 | ) | | | (449 | ) | | | (953 | ) | | | (339 | ) |
| Gain on sale of real estate, land and other investments | | | (54 | ) | | | 0 | | | | (552 | ) | | | (2 | ) | | | (3 | ) |
| EBITDA | | $ | 33,944 | | | $ | 33,380 | | | $ | 33,644 | | | $ | 31,168 | | | $ | 31,458 | |
| (1) | See Definitions on page 26. |
| (2) | Included in real estate revenue in the Statement of Operations. |
INVESTORS REAL ESTATE TRUST AND SUBSIDIARIES
LONG-TERM MORTGAGE DEBT ANALYSIS
(in thousands)
Debt Maturity Schedule
Annual Expirations
Total Mortgage Debt
6.66% 7.21% 7.64% 7.02% 5.97% 6.24% 5.60% 5.77% 6.22% 5.80% 6.02%
| | | Future Maturities of Debt | |
| Fiscal Year | | Fixed Debt | | | Variable Debt | | | Total Debt | | | Weighted Average(1) | | | % of Total Debt | |
| 2009 | | $ | 3,395 | | | $ | 0 | | | $ | 3,395 | | | | 6.66 | % | | | 0.3 | % |
| 2010 | | | 126,273 | | | | 3,630 | | | | 129,903 | | | | 7.21 | % | | | 12.2 | % |
| 2011 | | | 82,227 | | | | 0 | | | | 82,227 | | | | 7.64 | % | | | 7.7 | % |
| 2012 | | | 92,662 | | | | 0 | | | | 92,662 | | | | 7.02 | % | | | 8.7 | % |
| 2013 | | | 26,088 | | | | 4,937 | | | | 31,025 | | | | 5.97 | % | | | 2.9 | % |
| 2014 | | | 48,812 | | | | 1,082 | | | | 49,894 | | | | 6.24 | % | | | 4.7 | % |
| 2015 | | | 72,191 | | | | 0 | | | | 72,191 | | | | 5.60 | % | | | 6.8 | % |
| 2016 | | | 66,452 | | | | 375 | | | | 66,827 | | | | 5.77 | % | | | 6.3 | % |
| 2017 | | | 162,319 | | | | 0 | | | | 162,319 | | | | 6.22 | % | | | 15.2 | % |
| 2018 | | | 94,372 | | | | 0 | | | | 94,372 | | | | 5.80 | % | | | 8.8 | % |
| Thereafter | | | 280,147 | | | | 1,151 | | | | 281,298 | | | | 6.02 | % | | | 26.4 | % |
| Total maturities | | $ | 1,054,938 | | | $ | 11,175 | | | $ | 1,066,113 | | | | 6.36 | % | | | 100.0 | % |
| (1) | Weighted average interest rate of debt that matures in fiscal year. |
| | | 10/31/2008 | | | 07/31/2008 | | | 04/30/2008 | | | 01/31/2008 | | | 10/31/2007 | |
| Balances Outstanding | | | | | | | | | | | | | | | |
| Mortgage | | | | | | | | | | | | | | | |
| Fixed rate | | $ | 1,054,938 | | | $ | 1,057,009 | | | $ | 1,052,162 | | | $ | 951,112 | | | $ | 943,632 | |
| Variable rate | | | 11,175 | | | | 11,258 | | | | 11,696 | | | | 24,673 | | | | 23,980 | |
| Mortgage total | | | 1,066,113 | | | | 1,068,267 | | | | 1,063,858 | | | | 975,785 | | | | 967,612 | |
| | | | | | | | | | | | | | | | | | | | | |
| Weighted Average Interest Rates | | | | | | | | | | | | | | | | | | | | |
| Secured | | | 6.36 | % | | | 6.36 | % | | | 6.37 | % | | | 6.44 | % | | | 6.36 | % |
INVESTORS REAL ESTATE TRUST AND SUBSIDIARIES
LONG-TERM MORTGAGE DEBT DETAIL
| Property | Maturity Date | | Fiscal 2009 | | | Fiscal 2010 | | | Fiscal 2011 | | | Fiscal 2012 | | | Thereafter | | | Total(1) | |
| Multi-Family Residential | | | | | | | | | | | | | | | | | | | |
| Castle Rock - Billings, MT | 3/1/2009 | | $ | 3,395 | | | $ | 0 | | | $ | 0 | | | $ | 0 | | | $ | 0 | | | $ | 3,395 | |
| Forest Park Estates - Grand Forks, ND | 8/1/2009 | | | 0 | | | | 6,277 | | | | 0 | | | | 0 | | | | 0 | | | | 6,277 | |
| Rimrock Apts - Billings, MT | 8/1/2009 | | | 0 | | | | 2,209 | | | | 0 | | | | 0 | | | | 0 | | | | 2,209 | |
| Rocky Meadows Apts - Billings, MT | 8/1/2009 | | | 0 | | | | 3,139 | | | | 0 | | | | 0 | | | | 0 | | | | 3,139 | |
| Park Meadows I - Waite Park, MN | 9/1/2009 | | | 0 | | | | 2,657 | | | | 0 | | | | 0 | | | | 0 | | | | 2,657 | |
| Park Meadows II & III - Waite Park, MN | 9/1/2009 | | | 0 | | | | 7,053 | | | | 0 | | | | 0 | | | | 0 | | | | 7,053 | |
| Terrace on the Green - Moorhead, MN | 9/01/2009 | | | 0 | | | | 1,431 | | | | 0 | | | | 0 | | | | 0 | | | | 1,431 | |
| Thomasbrook - Lincoln, NE | 10/1/2009 | | | 0 | | | | 5,158 | | | | 0 | | | | 0 | | | | 0 | | | | 5,158 | |
| Crown Colony - Topeka, KS | 11/1/2009 | | | 0 | | | | 6,529 | | | | 0 | | | | 0 | | | | 0 | | | | 6,529 | |
| Sherwood Apts - Topeka, KS | 11/1/2009 | | | 0 | | | | 9,794 | | | | 0 | | | | 0 | | | | 0 | | | | 9,794 | |
| Westwood Park - Bismarck, ND | 12/1/2009 | | | 0 | | | | 1,021 | | | | 0 | | | | 0 | | | | 0 | | | | 1,021 | |
| Dakota Hill at Valley Ranch - Irving, TX | 2/1/2010 | | | 0 | | | | 22,941 | | | | 0 | | | | 0 | | | | 0 | | | | 22,941 | |
| Southbrook & Mariposa - Topeka, KS | 2/1/2010 | | | 0 | | | | 3,200 | | | | 0 | | | | 0 | | | | 0 | | | | 3,200 | |
| Kirkwood Apts - Bismarck, ND | 5/1/2010 | | | 0 | | | | 0 | | | | 1,954 | | | | 0 | | | | 0 | | | | 1,954 | |
| Meadows I - Jamestown, ND | 8/1/2010 | | | 0 | | | | 0 | | | | 912 | | | | 0 | | | | 0 | | | | 912 | |
| Meadows II - Jamestown, ND | 8/1/2010 | | | 0 | | | | 0 | | | | 912 | | | | 0 | | | | 0 | | | | 912 | |
| Olympic Village - Billings, MT | 11/1/2010 | | | 0 | | | | 0 | | | | 7,716 | | | | 0 | | | | 0 | | | | 7,716 | |
| Southview Apartments - Minot, ND | 11/1/2010 | | | 0 | | | | 0 | | | | 749 | | | | 0 | | | | 0 | | | | 749 | |
| Valley Park Manor - Grand Forks, ND | 11/1/2010 | | | 0 | | | | 0 | | | | 2,742 | | | | 0 | | | | 0 | | | | 2,742 | |
| Valley Park Manor - Grand Forks, ND | 11/1/2010 | | | 0 | | | | 0 | | | | 835 | | | | 0 | | | | 0 | | | | 835 | |
| Ridge Oaks Apts - Sioux City, IA | 2/1/2011 | | | 0 | | | | 0 | | | | 2,642 | | | | 0 | | | | 0 | | | | 2,642 | |
| Sunset Trail I - Rochester, MN | 3/1/2011 | | | 0 | | | | 0 | | | | 3,974 | | | | 0 | | | | 0 | | | | 3,974 | |
| Sunset Trail II - Rochester, MN | 3/1/2011 | | | 0 | | | | 0 | | | | 3,864 | | | | 0 | | | | 0 | | | | 3,864 | |
| Oakwood Estates - Sioux Falls, SD | 6/1/2011 | | | 0 | | | | 0 | | | | 0 | | | | 3,514 | | | | 0 | | | | 3,514 | |
| Oxbow - Sioux Falls, SD | 6/1/2011 | | | 0 | | | | 0 | | | | 0 | | | | 3,830 | | | | 0 | | | | 3,830 | |
| Chateau Apts - Minot, ND | 7/1/2011 | | | 0 | | | | 0 | | | | 0 | | | | 1,818 | | | | 0 | | | | 1,818 | |
| Oakmont Apts - Sioux Falls, SD | 9/1/2011 | | | 0 | | | | 0 | | | | 0 | | | | 3,768 | | | | 0 | | | | 3,768 | |
| Canyon Lake Apts - Rapid City, SD | 10/1/2011 | | | 0 | | | | 0 | | | | 0 | | | | 2,727 | | | | 0 | | | | 2,727 | |
| Meadows III - Jamestown, ND | 11/1/2011 | | | 0 | | | | 0 | | | | 0 | | | | 1,012 | | | | 0 | | | | 1,012 | |
| Summary of Debt due after 2012 | | | | 0 | | | | 0 | | | | 0 | | | | 0 | | | | 187,734 | | | | 187,734 | |
| Sub-Total Multi-Family Residential | | | $ | 3,395 | | | $ | 71,409 | | | $ | 26,300 | | | $ | 16,669 | | | $ | 187,734 | | | $ | 305,507 | |
| | | | | | | | | | | | | | | | | | | | | | | | | | |
| Commercial Office | | | | | | | | | | | | | | | | | | | | | | | | | |
| Three Paramount Plaza - Bloomington, MN | 8/1/2009 | | $ | 0 | | | $ | 4,083 | | | $ | 0 | | | $ | 0 | | | $ | 0 | | | $ | 4,083 | |
American Corporate Center - Mendota Heights, MN(2) | 11/1/2009 | | | 0 | | | | 9,761 | | | | 0 | | | | 0 | | | | 0 | | | | 9,761 | (3) |
Mendota Center I - Mendota Heights, MN(2) | 11/1/2009 | | | 0 | | | | 3,870 | | | | 0 | | | | 0 | | | | 0 | | | | 3,870 | (3) |
Mendota Center II - Mendota Heights, MN(2) | 11/1/2009 | | | 0 | | | | 6,198 | | | | 0 | | | | 0 | | | | 0 | | | | 6,198 | (3) |
Mendota Center III - Mendota Heights, MN(2) | 11/1/2009 | | | 0 | | | | 3,600 | | | | 0 | | | | 0 | | | | 0 | | | | 3,600 | (3) |
Mendota Center IV - Mendota Heights, MN(2) | 11/1/2009 | | | 0 | | | | 4,674 | | | | 0 | | | | 0 | | | | 0 | | | | 4,674 | (3) |
| Northgate II - Maple Grove, MN | 2/1/2010 | | | 0 | | | | 1,332 | | | | 0 | | | | 0 | | | | 0 | | | | 1,332 | |
| Southeast Tech Center - Eagan, MN | 2/1/2010 | | | 0 | | | | 3,603 | | | | 0 | | | | 0 | | | | 0 | | | | 3,603 | |
| Westgate I - Boise, ID | 2/1/2010 | | | 0 | | | | 1,948 | | | | 0 | | | | 0 | | | | 0 | | | | 1,948 | |
| Westgate II - Boise, ID | 2/1/2010 | | | 0 | | | | 4,769 | | | | 0 | | | | 0 | | | | 0 | | | | 4,769 | |
| Brenwood - Minnetonka, MN | 10/1/2010 | | | 0 | | | | 0 | | | | 7,748 | | | | 0 | | | | 0 | | | | 7,748 | |
| Nicollet VII - Burnsville, MN | 12/1/2010 | | | 0 | | | | 0 | | | | 4,147 | | | | 0 | | | | 0 | | | | 4,147 | |
| Dewey Hill Business Center - Edina, MN | 1/1/2011 | | | 0 | | | | 0 | | | | 2,700 | | | | 0 | | | | 0 | | | | 2,700 | |
| Plymouth IV - Plymouth, MN | 1/1/2011 | | | 0 | | | | 0 | | | | 3,309 | | | | 0 | | | | 0 | | | | 3,309 | |
| Plymouth V - Plymouth, MN | 1/1/2011 | | | 0 | | | | 0 | | | | 4,762 | | | | 0 | | | | 0 | | | | 4,762 | |
| Whitewater Plaza - Minnetonka, MN | 3/1/2011 | | | 0 | | | | 0 | | | | 2,686 | | | | 0 | | | | 0 | | | | 2,686 | |
| Whitewater Plaza - Minnetonka, MN | 3/1/2011 | | | 0 | | | | 0 | | | | 1,392 | | | | 0 | | | | 0 | | | | 1,392 | |
| 2030 Cliff Road - Eagan, MN | 4/1/2011 | | | 0 | | | | 0 | | | | 508 | | | | 0 | | | | 0 | | | | 508 | |
| Cold Spring Center - St Cloud, MN | 4/1/2011 | | | 0 | | | | 0 | | | | 4,296 | | | | 0 | | | | 0 | | | | 4,296 | |
INVESTORS REAL ESTATE TRUST AND SUBSIDIARIES
LONG-TERM MORTGAGE DEBT DETAIL (continued)
| Property | Maturity Date | | Fiscal 2009 | | | Fiscal 2010 | | | Fiscal 2011 | | | Fiscal 2012 | | | Thereafter | | | Total | |
| Commercial Office - Continued | | | | | | | | | | | | | | | | | | | |
| Pillsbury Business Center - Edina, MN | 4/1/2011 | | $ | 0 | | | $ | 0 | | | $ | 984 | | | $ | 0 | | | $ | 0 | | | $ | 984 | |
| Golden Hills Office Center - Golden Valley, MN | 7/1/2011 | | | 0 | | | | 0 | | | | 0 | | | | 14,628 | | | | 0 | | | | 14,628 | |
| Wells Fargo Center - St Cloud, MN | 7/1/2011 | | | 0 | | | | 0 | | | | 0 | | | | 7,028 | | | | 0 | | | | 7,028 | |
| Interlachen Corp Center - Eagan, MN | 10/11/2011 | | | 0 | | | | 0 | | | | 0 | | | | 10,027 | | | | 0 | | | | 10,027 | |
| Bloomington Business Plaza - Bloomington, MN | 12/1/2011 | | | 0 | | | | 0 | | | | 0 | | | | 4,357 | | | | 0 | | | | 4,357 | |
| Wirth Corporate Center - Golden Valley, MN | 2/1/2012 | | | 0 | | | | 0 | | | | 0 | | | | 4,369 | | | | 0 | | | | 4,369 | |
| Summary of Debt due after 2012 | | | | 0 | | | | 0 | | | | 0 | | | | 0 | | | | 260,101 | | | | 260,101 | |
| Sub-Total Commercial Office | | | $ | 0 | | | $ | 43,838 | | | $ | 32,532 | | | $ | 40,409 | | | $ | 260,101 | | | $ | 376,880 | |
| | | | | | | | | | | | | | | | | | | | | | | | | | |
| Commercial Medical | | | | | | | | | | | | | | | | | | | | | | | | | |
| Edina 6545 France SMC I - Edina, MN | 1/1/2011 | | $ | 0 | | | $ | 0 | | | $ | 22,139 | | | $ | 0 | | | $ | 0 | | | $ | 22,139 | |
| Edina 6525 France SMC II - Edina, MN | 6/1/2011 | | | 0 | | | | 0 | | | | 0 | | | | 9,835 | | | | 0 | | | | 9,835 | |
| Edina 6405 France Medical - Edina, MN | 1/1/2012 | | | 0 | | | | 0 | | | | 0 | | | | 9,419 | | | | 0 | | | | 9,419 | |
| Edina 6363 France Medical - Edina, MN | 4/1/2012 | | | 0 | | | | 0 | | | | 0 | | | | 8,247 | | | | 0 | | | | 8,247 | |
| Summary of Debt due after 2012 | | | | 0 | | | | 0 | | | | 0 | | | | 0 | | | | 206,881 | | | | 206,881 | |
| Sub-Total Commercial Medical | | | $ | 0 | | | $ | 0 | | | $ | 22,139 | | | $ | 27,501 | | | $ | 206,881 | | | $ | 256,521 | |
| | | | | | | | | | | | | | | | | | | | | | | | | | |
| Commercial Industrial | | | | | | | | | | | | | | | | | | | | | | | | | |
| Waconia Industrial Bldg - Waconia, MN | 8/2/2009 | | $ | 0 | | | $ | 1,129 | | | $ | 0 | | | $ | 0 | | | $ | 0 | | | $ | 1,129 | |
| Metal Improvement Co - New Brighton, MN | 10/1/2009 | | | 0 | | | | 1,243 | | | | 0 | | | | 0 | | | | 0 | | | | 1,243 | |
| Lexington Commerce Center - Eagan, MN | 2/1/2010 | | | 0 | | | | 2,898 | | | | 0 | | | | 0 | | | | 0 | | | | 2,898 | |
| Eagan 2785 & 2795 Highway 55 - Eagan, MN | 6/1/2011 | | | 0 | | | | 0 | | | | 0 | | | | 3,812 | | | | 0 | | | | 3,812 | |
| Stone Container - Roseville, MN | 2/1/2012 | | | 0 | | | | 0 | | | | 0 | | | | 4,271 | | | | 0 | | | | 4,271 | |
| Summary of Debt due after 2012 | | | | 0 | | | | 0 | | | | 0 | | | | 0 | | | | 48,679 | | | | 48,679 | |
| Sub-Total Commercial Industrial | | | $ | 0 | | | $ | 5,270 | | | $ | 0 | | | $ | 8,083 | | | $ | 48,679 | | | $ | 62,032 | |
| | | | | | | | | | | | | | | | | | | | | | | | | | |
| Commercial Retail | | | | | | | | | | | | | | | | | | | | | | | | | |
| Rochester Maplewood Square - Rochester, MN | 8/1/2009 | | $ | 0 | | | $ | 3,939 | | | $ | 0 | | | $ | 0 | | | $ | 0 | | | $ | 3,939 | |
| Minot Arrowhead Shopping Center - Minot, ND | 8/23/2009 | | | 0 | | | | 2,500 | | | | 0 | | | | 0 | | | | 0 | | | | 2,500 | |
| Grand Forks MedPark Mall - Grand Forks, ND | 3/1/2010 | | | 0 | | | | 2,947 | | | | 0 | | | | 0 | | | | 0 | | | | 2,947 | |
| Minot Plaza - Minot, ND | 8/1/2010 | | | 0 | | | | 0 | | | | 644 | | | | 0 | | | | 0 | | | | 644 | |
| Kentwood Thomasville Furniture - Kentwood, MI | 2/1/2011 | | | 0 | | | | 0 | | | | 612 | | | | 0 | | | | 0 | | | | 612 | |
| Summary of Debt due after 2012 | | | | 0 | | | | 0 | | | | 0 | | | | 0 | | | | 54,531 | | | | 54,531 | |
| Sub-Total Commercial Retail | | | $ | 0 | | | $ | 9,386 | | | $ | 1,256 | | | $ | 0 | | | $ | 54,531 | | | $ | 65,173 | |
| | | | | | | | | | | | | | | | | | | | | | | | | | |
| Total | | | $ | 3,395 | | | $ | 129,903 | | | $ | 82,227 | | | $ | 92,662 | | | $ | 757,926 | | | $ | 1,066,113 | |
| (1) | Totals given are principal balances as of October 31, 2008. |
| (2) | IRET’s ownership interest in these properties is 51%. IRET’s 49% joint venture partner is obligated on the mortgage debt in proportion to its ownership interest. |
| (3) | Includes the 49% share of IRET’s joint venture partner. |
INVESTORS REAL ESTATE TRUST AND SUBSIDIARIES
CAPITAL ANALYSIS
(in thousands, except per share and unit amounts)
| | | 10/31/2008 | | | 07/31/2008 | | | 04/30/2008 | | | 01/31/2008 | | | 10/31/2007 | |
| Equity Capitalization | | | | | | | | | | | | | | | |
| Common shares outstanding | | | 58,713 | | | | 58,202 | | | | 57,732 | | | | 56,977 | | | | 56,419 | |
| Operating partnership (OP) units outstanding | | | 21,287 | | | | 21,293 | | | | 21,238 | | | | 20,395 | | | | 20,114 | |
| Total common shares and OP units outstanding | | | 80,000 | | | | 79,495 | | | | 78,970 | | | | 77,372 | | | | 76.533 | |
| Market price per common share (closing price at end of period) | | $ | 9.88 | | | $ | 10.50 | | | $ | 10.20 | | | $ | 9.80 | | | $ | 10.85 | |
| Equity capitalization-common shares and OP units | | $ | 790,400 | | | $ | 834,698 | | | $ | 805,494 | | | $ | 758,246 | | | $ | 830,383 | |
| Recorded book value of preferred shares | | $ | 27,317 | | | $ | 27,317 | | | $ | 27,317 | | | $ | 27,317 | | | $ | 27,317 | |
| Total equity capitalization | | $ | 817,717 | | | $ | 862,015 | | | $ | 832,811 | | | $ | 785,563 | | | $ | 857,700 | |
| | | | | | | | | | | | | | | | | | | | | |
| Debt Capitalization | | | | | | | | | | | | | | | | | | | | |
| Total mortgage debt | | $ | 1,066,113 | | | $ | 1,068,267 | | | $ | 1,063,858 | | | $ | 975,785 | | | $ | 967,612 | |
| Total capitalization | | $ | 1,883,830 | | | $ | 1,930,282 | | | $ | 1,896,669 | | | $ | 1,761,348 | | | $ | 1,825,312 | |
| | | | | | | | | | | | | | | | | | | | | |
| Total debt to total capitalization | | 0.57:1 | | | 0.55:1 | | | 0.56:1 | | | 0.55:1 | | | 0.53:1 | |
| | | | | | | | | | | | | | | | | | | | | |
Earnings to fixed charges(1) | | | 1.16 | x | | | 1.15 | x | | | 1.20 | x | | | 1.23 | x | | | 1.23 | x |
Earnings to combined fixed charges and preferred distributions(1) | | | 1.13 | x | | | 1.12 | x | | | 1.16 | x | | | 1.19 | x | | | 1.19 | x |
Debt service coverage ratio(1) | | | 1.41 | x | | | 1.40 | x | | | 1.46 | x | | | 1.42 | x | | | 1.45 | x |
| | | | | | | | | | | | | | | | | | | | | |
| Distribution Data | | | | | | | | | | | | | | | | | | | | |
| Common shares and units outstanding at record date | | | 79,566 | | | | 79,116 | | | | 77,675 | | | | 76,698 | | | | 69,363 | |
| Total common distribution paid | | $ | 13,445 | | | $ | 13,332 | | | $ | 13,050 | | | $ | 12,847 | | | $ | 11,584 | |
| Common distribution per share and unit | | $ | 0.1690 | | | $ | 0.1685 | | | $ | 0.1680 | | | $ | 0.1675 | | | $ | 0.1670 | |
Payout ratio (FFO per share and unit basis)(1) | | | 80.5 | % | | | 84.3 | % | | | 76.4 | % | | | 79.8 | % | | | 79.5 | % |
| (1) | See Definitions on page 26. |
INVESTORS REAL ESTATE TRUST AND SUBSIDIARIES
STABILIZED PROPERTIES NET OPERATING INCOME SUMMARY
(in thousands)
| | | Stabilized Properties(1) | | | Stabilized Properties | |
| | | Three Months Ended October 30, | | | Six months Ended October 30, | |
| Segment | | 2008 | | | 2007 | | | % Change | | | 2008 | | | 2007 | | | % Change | |
| Multi-Family Residential | | $ | 9,955 | | | $ | 9,468 | | | | 5.1 | % | | $ | 19,425 | | | $ | 18,724 | | | | 3.7 | % |
| Commercial Office | | | 11,031 | | | | 11,857 | | | | (7.0 | %) | | | 21,963 | | | | 23,729 | | | | (7.4 | %) |
| Commercial Medical | | | 6,648 | | | | 6,819 | | | | (2.5 | %) | | | 13,333 | | | | 13,445 | | | | (0.8 | %) |
| Commercial Industrial | | | 1,661 | | | | 1,979 | | | | (16.1 | %) | | | 3,323 | | | | 3,955 | | | | (16.0 | %) |
| Commercial Retail | | | 2,357 | | | | 2,398 | | | | (1.7 | %) | | | 4,695 | | | | 4,928 | | | | (4.7 | %) |
| | | $ | 31,652 | | | $ | 32,521 | | | | (2.7 | %) | | $ | 62,739 | | | $ | 64,781 | | | | (3.2 | %) |
| 1. | For 2nd Quarter Fiscal 2009 and 2nd Quarter Fiscal 2008, stabilized properties excluded: |
Multi-Family Residential - | Indian Hills, Sioux City, IA; Cottonwood IV Apartments, Bismarck, ND; Greenfield Apartments, Omaha, NE; Minot 4th Street Apartments, Minot, ND; Minot 11th Street Apartments, Minot, ND; Minot Fairmont Apartments, Minot, ND; Minot Westridge Apartments, Minot, ND; Thomasbrook Apartments, Lincoln, NE and Evergreen Apartments, Isanti, MN. |
| | Total number of units, 611. Occupancy % for the three and six months ended October 31, 2008, 92.6% and 88.4%, respectively. |
Commercial Office - | 610 Business Center, Brooklyn Park, MN; Intertech, Fenton, MO; Plymouth 5095, Plymouth, MN and Bismarck 715 E Broadway, Bismarck, ND. |
| | Total square footage, 185,825. Occupancy % for the three and six months ended October 31, 2008, 95.4% and 95.1%, respectively. |
Commercial Medical - | Barry Point, Kansas City, MO; Edgewood Vista Billings, Billings, MT; Edgewood Vista East Grand Forks, East Grand Forks, MN; Edgewood Vista Sioux Falls, Sioux Falls, SD; Edina 6405 France Medical, Edina, MN; Edina 6363 France Medical, Edina, MN; Minneapolis 701 25th Ave Medical (Riverside), Minneapolis, MN; Burnsville 303 Nicollet Medical (Ridgeview), Burnsville, MN; Burnsville 305 Nicollet Medical (Ridgeview South), Burnsville, MN; Eagan 1440 Duckwood Medical, Eagan, MN; Edgewood Vista Belgrade, Belgrade, MT; Edgewood Vista Columbus, Columbus, NE; Edgewood Vista Fargo, Fargo, ND; Edgewood Vista Grand Island, Grand Island, NE; Edgewood Vista Norfolk, Norfolk, NE and 2828 Chicago Avenue, Minneapolis, MN. |
| | Total square footage, 597,265. Occupancy % for the three and six months ended October 31, 2008, 95.2% and 97.0%, respectively. |
Commercial Industrial - | Cedar Lake Business Center, St. Louis Park, MN; Urbandale, Urbandale, IA; Woodbury 1865, Woodbury, MN and Eagan 2785 & 2795 Highway 55, Eagan, MN. |
| | Total square footage, 846,953. Occupancy % for the three and six months ended October 31, 2008, 100.0% and 100.0%, respectively. |
| Discontinued operations from fiscal 2008 include: |
Multi-Family Residential - | 405 Grant Avenue Apartments, Harvey, ND and Sweetwater – Green Acres 1&2 Apartments, Devils Lake, ND. |
| | Total number of units, 60. |
Commercial Office - | Minnetonka Office Building, Minnetonka, MN. |
| | Total square footage, 1,142. |
INVESTORS REAL ESTATE TRUST AND SUBSIDIARIES
NET OPERATING INCOME DETAIL
(in thousands)
| | | Three Months Ended October 31, 2008 | |
| | | Multi-Family Residential | | | Commercial Office | | | Commercial Medical | | | Commercial Industrial | | | Commercial Retail | | | Corporate and Other | | | Total | |
| Real estate rental revenue | | | | | | | | | | | | | | | | | | | | | |
Stabilized(1) | | $ | 18,326 | | | $ | 20,029 | | | $ | 9,280 | | | $ | 2,139 | | | $ | 3,513 | | | $ | 0 | | | $ | 53,287 | |
| Non-Stabilized | | | 1,076 | | | | 694 | | | | 3,680 | | | | 836 | | | | 0 | | | | 0 | | | | 6,286 | |
| Total | | | 19,402 | | | | 20,723 | | | | 12,960 | | | | 2,975 | | | | 3,513 | | | | 0 | | | | 59,573 | |
| | | | | | | | | | | | | | | | | | | | | | | | | | | | | |
| Real estate expenses | | | | | | | | | | | | | | | | | | | | | | | | | | | | |
Stabilized(1) | | | 8,371 | | | | 8,998 | | | | 2,632 | | | | 478 | | | | 1,156 | | | | 0 | | | | 21,635 | |
| Non-Stabilized | | | 558 | | | | 205 | | | | 1,231 | | | | 324 | | | | 0 | | | | 0 | | | | 2,318 | |
| Total | | | 8,929 | | | | 9,203 | | | | 3,863 | | | | 802 | | | | 1,156 | | | | 0 | | | | 23,953 | |
| | | | | | | | | | | | | | | | | | | | | | | | | | | | | |
| Net Operating Income (NOI) | | | | | | | | | | | | | | | | | | | | | | | | | | | | |
Stabilized(1) | | | 9,955 | | | | 11,031 | | | | 6,648 | | | | 1,661 | | | | 2,357 | | | | 0 | | | | 31,652 | |
| Non-Stabilized | | | 518 | | | | 489 | | | | 2,449 | | | | 512 | | | | 0 | | | | 0 | | | | 3,968 | |
| Net operating income | | $ | 10,473 | | | $ | 11,520 | | | $ | 9,097 | | | $ | 2,173 | | | $ | 2,357 | | | $ | 0 | | | $ | 35,620 | |
| | | | | | | | | | | | | | | | | | | | | | | | | | | | | |
| Reconciliation of NOI to net income available to common shareholders | | | | | | | | | | | | | | | | | | | | | | | | | | | | |
| Interest (expense) income | | $ | (4,916 | ) | | $ | (5,945 | ) | | $ | (4,246 | ) | | $ | (952 | ) | | $ | (992 | ) | | $ | (27 | ) | | $ | (17,078 | ) |
| Depreciation/amortization | | | (3,499 | ) | | | (5,118 | ) | | | (3,194 | ) | | | (903 | ) | | | (698 | ) | | | (547 | ) | | | (13,959 | ) |
| Administrative, advisory and trustee fees | | | 0 | | | | 0 | | | | 0 | | | | 0 | | | | 0 | | | | (1,239 | ) | | | (1,239 | ) |
| Other expenses | | | 0 | | | | 0 | | | | 0 | | | | 0 | | | | 0 | | | | (482 | ) | | | (482 | ) |
| Other income | | | 0 | | | | 0 | | | | 0 | | | | 0 | | | | 0 | | | | 288 | | | | 288 | |
| Income before gain on sale of other investments and minority interest and discontinued operations | | | 2,058 | | | | 457 | | | | 1,657 | | | | 318 | | | | 667 | | | | (2,007 | ) | | | 3,150 | |
| Gain on sale of the other investments | | | 0 | | | | 0 | | | | 0 | | | | 0 | | | | 0 | | | | 54 | | | | 54 | |
| Minority interest portion of operating partnership income | | | 0 | | | | 0 | | | | 0 | | | | 0 | | | | 0 | | | | (700 | ) | | | (700 | ) |
| Minority interest portion of other partnerships’ loss | | | 0 | | | | 0 | | | | 0 | | | | 0 | | | | 0 | | | | 19 | | | | 19 | |
| Income from continuing operations | | | 2,058 | | | | 457 | | | | 1,657 | | | | 318 | | | | 667 | | | | (2,634 | ) | | | 2,523 | |
| NET INCOME | | | 2,058 | | | | 457 | | | | 1,657 | | | | 318 | | | | 667 | | | | (2,634 | ) | | | 2,523 | |
| Dividends to preferred shareholders | | | 0 | | | | 0 | | | | 0 | | | | 0 | | | | 0 | | | | (593 | ) | | | (593 | ) |
| NET INCOME AVAILABLE TO COMMON SHAREHOLDERS | | $ | 2,058 | | | $ | 457 | | | $ | 1,657 | | | $ | 318 | | | $ | 667 | | | $ | (3,227 | ) | | $ | 1,930 | |
| 1. | For 2nd Quarter Fiscal 2009, non-stabilized properties included: |
Multi-Family Residential - | Indian Hills, Sioux City, IA; Cottonwood IV Apartments, Bismarck, ND; Greenfield Apartments, Omaha, NE; Minot 4th Street Apartments, Minot, ND; Minot 11th Street Apartments, Minot, ND; Minot Fairmont Apartments, Minot, ND; Minot Westridge Apartments, Minot, ND; Thomasbrook Apartments, Lincoln, NE and Evergreen Apartments, Isanti, MN. |
| | Total number of units, 611. Occupancy % for the three and six months ended October 31, 2008, 92.6% and 88.4%, respectively. |
Commercial Office - | 610 Business Center, Brooklyn Park, MN; Intertech, Fenton, MO; Plymouth 5095, Plymouth, MN and Bismarck 715 E Broadway, Bismarck, ND. |
| | Total square footage, 185,825. Occupancy % for the three and six months ended October 31, 2008, 95.4% and 95.1%, respectively. |
Commercial Medical - | Barry Point, Kansas City, MO; Edgewood Vista Billings, Billings, MT; Edgewood Vista East Grand Forks, East Grand Forks, MN; Edgewood Vista Sioux Falls, Sioux Falls, SD; Edina 6405 France Medical, Edina, MN; Edina 6363 France Medical, Edina, MN; Minneapolis 701 25th Ave Medical (Riverside), Minneapolis, MN; Burnsville 303 Nicollet Medical (Ridgeview), Burnsville, MN; Burnsville 305 Nicollet Medical (Ridgeview South), Burnsville, MN; Eagan 1440 Duckwood Medical, Eagan, MN; Edgewood Vista Belgrade, Belgrade, MT; Edgewood Vista Columbus, Columbus, NE; Edgewood Vista Fargo, Fargo, ND; Edgewood Vista Grand Island, Grand Island, NE; Edgewood Vista Norfolk, Norfolk, NE and 2828 Chicago Avenue, Minneapolis, MN. |
| | Total square footage, 597,265 Occupancy % for the three and six months ended October 31, 2008, 95.2% and 97.0%, respectively. |
Commercial Industrial - | Cedar Lake Business Center, St. Louis Park, MN; Urbandale, Urbandale, IA; Woodbury 1865, Woodbury, MN and Eagan 2785 & 2795 Highway 55, Eagan, MN. |
| | Total square footage, 846,953. Occupancy % for the three and six months ended October 31, 2008, 100.0% and 100.0%, respectively. |
INVESTORS REAL ESTATE TRUST AND SUBSIDIARIES
NET OPERATING INCOME DETAIL
(in thousands)
| | | Three Months Ended October 31, 2007 | |
| | | Multi-Family Residential | | | Commercial Office | | | Commercial Medical | | | Commercial Industrial | | | Commercial Retail | | | Corporate and Other | | | Total | |
| Real estate rental revenue | | | | | | | | | | | | | | | | | | | | | |
Stabilized(1) | | $ | 17,699 | | | $ | 20,561 | | | $ | 8,799 | | | $ | 2,431 | | | $ | 3,385 | | | $ | 0 | | | $ | 52,875 | |
| Non-Stabilized | | | 569 | | | | 50 | | | | 121 | | | | 596 | | | | 0 | | | | 0 | | | | 1,336 | |
| Total | | | 18,268 | | | | 20,611 | | | | 8,920 | | | | 3,027 | | | | 3,385 | | | | 0 | | | | 54,211 | |
| | | | | | | | | | | | | | | | | | | | | | | | | | | | | |
| Real estate expenses | | | | | | | | | | | | | | | | | | | | | | | | | | | | |
Stabilized(1) | | | 8,231 | | | | 8,704 | | | | 1,980 | | | | 452 | | | | 987 | | | | 0 | | | | 20,354 | |
| Non-Stabilized | | | 445 | | | | 17 | | | | 63 | | | | 174 | | | | 0 | | | | 0 | | | | 699 | |
| Total | | | 8,676 | | | | 8,721 | | | | 2,043 | | | | 626 | | | | 987 | | | | 0 | | | | 21,053 | |
| | | | | | | | | | | | | | | | | | | | | | | | | | | | | |
| Net Operating Income (NOI) | | | | | | | | | | | | | | | | | | | | | | | | | | | | |
Stabilized(1) | | | 9,468 | | | | 11,857 | | | | 6,819 | | | | 1,979 | | | | 2,398 | | | | 0 | | | | 32,521 | |
| Non-Stabilized | | | 124 | | | | 33 | | | | 58 | | | | 422 | | | | 0 | | | | 0 | | | | 637 | |
| Net operating income | | $ | 9,592 | | | $ | 11,890 | | | $ | 6,877 | | | $ | 2,401 | | | $ | 2,398 | | | $ | 0 | | | $ | 33,158 | |
| | | | | | | | | | | | | | | | | | | | | | | | | | | | | |
| Reconciliation of NOI to net income available to common shareholders | | | | | | | | | | | | | | | | | | | | | | | | | | | | |
| Interest (expense) income | | $ | (4,920 | ) | | $ | (5,777 | ) | | $ | (2,822 | ) | | $ | (872 | ) | | $ | (1,050 | ) | | $ | (246 | ) | | $ | (15,687 | ) |
| Depreciation/amortization | | | (3,261 | ) | | | (5,234 | ) | | | (2,122 | ) | | | (821 | ) | | | (662 | ) | | | (404 | ) | | | (12,504 | ) |
| Administrative, advisory and trustee fees | | | 0 | | | | 0 | | | | 0 | | | | 0 | | | | 0 | | | | (1,267 | ) | | | (1,267 | ) |
| Other expenses | | | 0 | | | | 0 | | | | 0 | | | | 0 | | | | 0 | | | | (457 | ) | | | (457 | ) |
| Other income | | | 0 | | | | 0 | | | | 0 | | | | 0 | | | | 0 | | | | 431 | | | | 431 | |
| Income before gain on sale of other investments and minority interest and discontinued operations | | | 1,411 | | | | 879 | | | | 1,933 | | | | 708 | | | | 686 | | | | (1,943 | ) | | | 3,674 | |
| Gain on sale of other investments | | | 0 | | | | 0 | | | | 0 | | | | 0 | | | | 0 | | | | 3 | | | | 3 | |
| Minority interest portion of operating partnership income | | | 0 | | | | 0 | | | | 0 | | | | 0 | | | | 0 | | | | (855 | ) | | | (855 | ) |
| Income from continuing operations | | | 1,411 | | | | 879 | | | | 1,933 | | | | 708 | | | | 686 | | | | (2,795 | ) | | | 2,822 | |
Discontinued operations, net of minority interest(2) | | | 16 | | | | (2 | ) | | | 0 | | | | 0 | | | | 0 | | | | 0 | | | | 14 | |
| NET INCOME | | | 1,427 | | | | 877 | | | | 1,933 | | | | 708 | | | | 686 | | | | (2,795 | ) | | | 2,836 | |
| Dividends to preferred shareholders | | | 0 | | | | 0 | | | | 0 | | | | 0 | | | | 0 | | | | (593 | ) | | | (593 | ) |
| NET INCOME AVAILABLE TO COMMON SHAREHOLDERS | | $ | 1,427 | | | $ | 877 | | | $ | 1,933 | | | $ | 708 | | | $ | 686 | | | $ | (3,388 | ) | | $ | 2,243 | |
| 1. | For 2nd Quarter Fiscal 2008, non-stabilized properties included: |
Multi-Family Residential - | Indian Hills, Sioux City, IA; and Thomasbrook Apartments, Lincoln, NE. |
| | Total number of units, 69. Occupancy for the three and six month ended, 81.7% and 81.6%, respectively. |
Commercial Office - | Plymouth 5095, Plymouth, MN. |
| | Total square footage, 20,528. Occupancy for the three and six month ended, 100.0% and 100.0%, respectively. |
Commercial Medical - | Barry Point, Kansas City, MO. |
| | Total sq. ft., 18,502. Occupancy for the three and six month ended, 100.0% and 100.0%, respectively. |
Commercial Industrial - | Cedar Lake Business Center, St. Louis Park, MN; Urbandale, Urbandale, IA and Woodbury 1865, Woodbury, MN. |
| | Total square footage, 648,353. Occupancy for the three and six month ended, 91.8% and 92.3%, respectively. |
| Discontinued operations from fiscal 2008 include: |
Multi-Family Residential - | 405 Grant Avenue Apartments, Harvey, ND and Sweetwater – Green Acres 1&2 Apartments, Devils Lake, ND. |
| | Total number of units, 60. |
Commercial Office - | Minnetonka Office Building, Minnetonka, MN. |
| | Total square footage, 1,142. |
INVESTORS REAL ESTATE TRUST AND SUBSIDIARIES
NET OPERATING INCOME DETAIL
(in thousands)
| | | Six Months Ended October 31, 2008 | |
| | | Multi-Family Residential | | | Commercial Office | | | Commercial Medical | | | Commercial Industrial | | | Commercial Retail | | | Corporate and Other | | | Total | |
| Real estate rental revenue | | | | | | | | | | | | | | | | | | | | | |
Stabilized(1) | | $ | 35,973 | | | $ | 40,216 | | | $ | 18,780 | | | $ | 4,341 | | | $ | 6,991 | | | $ | 0 | | | $ | 106,301 | |
| Non-Stabilized | | | 2,030 | | | | 1,313 | | | | 7,045 | | | | 1,730 | | | | 0 | | | | 0 | | | | 12,118 | |
| Total | | | 38,003 | | | | 41,529 | | | | 25,825 | | | | 6,071 | | | | 6,991 | | | | 0 | | | | 118,419 | |
| | | | | | | | | | | | | | | | | | | | | | | | | | | | | |
| Real estate expenses | | | | | | | | | | | | | | | | | | | | | | | | | | | | |
Stabilized(1) | | | 16,548 | | | | 18,253 | | | | 5,447 | | | | 1,018 | | | | 2,296 | | | | 0 | | | | 43,562 | |
| Non-Stabilized | | | 1,106 | | | | 394 | | | | 2,178 | | | | 517 | | | | 0 | | | | 0 | | | | 4,195 | |
| Total | | | 17,654 | | | | 18,647 | | | | 7,625 | | | | 1,535 | | | | 2,296 | | | | 0 | | | | 47,757 | |
| | | | | | | | | | | | | | | | | | | | | | | | | | | | | |
| Net Operating Income (NOI) | | | | | | | | | | | | | | | | | | | | | | | | | | | | |
Stabilized(1) | | | 19,425 | | | | 21,963 | | | | 13,333 | | | | 3,323 | | | | 4,695 | | | | 0 | | | | 62,739 | |
| Non-Stabilized | | | 924 | | | | 919 | | | | 4,867 | | | | 1,213 | | | | 0 | | | | 0 | | | | 7,923 | |
| Net operating income | | $ | 20,349 | | | $ | 22,882 | | | $ | 18,200 | | | $ | 4,536 | | | $ | 4,695 | | | $ | 0 | | | $ | 70,662 | |
| | | | | | | | | | | | | | | | | | | | | | | | | | | | | |
| Reconciliation of NOI to net income available to common shareholders | | | | | | | | | | | | | | | | | | | | | | | | | | | | |
| Interest (expense) income | | $ | (9,767 | ) | | $ | (11,847 | ) | | $ | (8,470 | ) | | $ | (1,890 | ) | | $ | (2,002 | ) | | $ | 10 | | | $ | (33,966 | ) |
| Depreciation/amortization | | | (6,971 | ) | | | (10,251 | ) | | | (6,287 | ) | | | (1,732 | ) | | | (1,420 | ) | | | (1,065 | ) | | | (27,726 | ) |
| Administrative, advisory and trustee fees | | | 0 | | | | 0 | | | | 0 | | | | 0 | | | | 0 | | | | (2,570 | ) | | | (2,570 | ) |
| Other expenses | | | 0 | | | | 0 | | | | 0 | | | | 0 | | | | 0 | | | | (844 | ) | | | (844 | ) |
| Other income | | | 0 | | | | 0 | | | | 0 | | | | 0 | | | | 0 | | | | 536 | | | | 536 | |
| Income before gain on sale of other investments and minority interest and discontinued operations | | | 3,611 | | | | 784 | | | | 3,443 | | | | 914 | | | | 1,273 | | | | (3,933 | ) | | | 6,092 | |
| Gain on sale of other investments | | | 0 | | | | 0 | | | | 0 | | | | 0 | | | | 0 | | | | 54 | | | | 54 | |
| Minority interest portion of operating partnership income | | | 0 | | | | 0 | | | | 0 | | | | 0 | | | | 0 | | | | (1,347 | ) | | | (1,347 | ) |
| Minority interest portion of other partnerships’ loss | | | 0 | | | | 0 | | | | 0 | | | | 0 | | | | 0 | | | | 82 | | | | 82 | |
| Income from continuing operations | | | 3,611 | | | | 784 | | | | 3,443 | | | | 914 | | | | 1,273 | | | | (5,144 | ) | | | 4,881 | |
| NET INCOME | | | 3,611 | | | | 784 | | | | 3,443 | | | | 914 | | | | 1,273 | | | | (5,144 | ) | | | 4,881 | |
| Dividends to preferred shareholders | | | 0 | | | | 0 | | | | 0 | | | | 0 | | | | 0 | | | | (1,186 | ) | | | (1,186 | ) |
| NET INCOME AVAILABLE TO COMMON SHAREHOLDERS | | $ | 3,611 | | | $ | 784 | | | $ | 3,443 | | | $ | 914 | | | $ | 1,273 | | | $ | (6,330 | ) | | $ | 3,695 | |
| 1. | For 2nd Quarter Fiscal 2009, non-stabilized properties included: |
Multi-Family Residential - | Indian Hills, Sioux City, IA; Cottonwood IV Apartments, Bismarck, ND; Greenfield Apartments, Omaha, NE; Minot 4th Street Apartments, Minot, ND; Minot 11th Street Apartments, Minot, ND; Minot Fairmont Apartments, Minot, ND; Minot Westridge Apartments, Minot, ND; Thomasbrook Apartments, Lincoln, NE and Evergreen Apartments, Isanti, MN. |
| | Total number of units, 611. Occupancy % for the three and six months ended October 31, 2008, 92.6% and 88.4%, respectively. |
Commercial Office - | 610 Business Center, Brooklyn Park, MN; Intertech, Fenton, MO; Plymouth 5095, Plymouth, MN and Bismarck 715 E Broadway, Bismarck, ND. |
| | Total square footage, 185,825. Occupancy % for the three and six months ended October 31, 2008, 95.4% and 95.1%, respectively. |
Commercial Medical - | Barry Point, Kansas City, MO; Edgewood Vista Billings, Billings, MT; Edgewood Vista East Grand Forks, East Grand Forks, MN; Edgewood Vista Sioux Falls, Sioux Falls, SD; Edina 6405 France Medical, Edina, MN; Edina 6363 France Medical, Edina, MN; Minneapolis 701 25th Ave Medical (Riverside), Minneapolis, MN; Burnsville 303 Nicollet Medical (Ridgeview), Burnsville, MN; Burnsville 305 Nicollet Medical (Ridgeview South), Burnsville, MN; Eagan 1440 Duckwood Medical, Eagan, MN; Edgewood Vista Belgrade, Belgrade, MT; Edgewood Vista Columbus, Columbus, NE; Edgewood Vista Fargo, Fargo, ND; Edgewood Vista Grand Island, Grand Island, NE; Edgewood Vista Norfolk, Norfolk, NE and 2828 Chicago Avenue, Minneapolis, MN. |
| | Total square footage, 597,265. Occupancy % for the three and six months ended October 31, 2008, 95.2% and 97.0%, respectively. |
Commercial Industrial - | Cedar Lake Business Center, St. Louis Park, MN; Urbandale, Urbandale, IA; Woodbury 1865, Woodbury, MN and Eagan 2785 & 2795 Highway 55, Eagan, MN. |
| | Total square footage, 846,953. Occupancy % for the three and six months ended October 31, 2008, 100.0% and 100.0%, respectively. |
INVESTORS REAL ESTATE TRUST AND SUBSIDIARIES
NET OPERATING INCOME DETAIL
(in thousands)
| | | Six Months Ended October 31, 2007 | |
| | | Multi-Family Residential | | | Commercial Office | | | Commercial Medical | | | Commercial Industrial | | | Commercial Retail | | | Corporate and Other | | | Total | |
| Real estate rental revenue | | | | | | | | | | | | | | | | | | | | | |
Stabilized(1) | | $ | 34,840 | | | $ | 41,148 | | | $ | 17,655 | | | $ | 4,850 | | | $ | 7,017 | | | $ | 0 | | | $ | 105,510 | |
| Non-Stabilized | | | 1,147 | | | | 58 | | | | 230 | | | | 839 | | | | 0 | | | | 0 | | | | 2,274 | |
| Total | | | 35,987 | | | | 41,206 | | | | 17,885 | | | | 5,689 | | | | 7,017 | | | | 0 | | | | 107,784 | |
| | | | | | | | | | | | | | | | | | | | | | | | | | | | | |
| Real estate expenses | | | | | | | | | | | | | | | | | | | | | | | | | | | | |
Stabilized(1) | | | 16,116 | | | | 17,419 | | | | 4,210 | | | | 895 | | | | 2,089 | | | | 0 | | | | 40,729 | |
| Non-Stabilized | | | 844 | | | | 18 | | | | 106 | | | | 230 | | | | 0 | | | | 0 | | | | 1,198 | |
| Total | | | 16,960 | | | | 17,437 | | | | 4,316 | | | | 1,125 | | | | 2,089 | | | | 0 | | | | 41,927 | |
| | | | | | | | | | | | | | | | | | | | | | | | | | | | | |
| Net Operating Income (NOI) | | | | | | | | | | | | | | | | | | | | | | | | | | | | |
Stabilized(1) | | | 18,724 | | | | 23,729 | | | | 13,445 | | | | 3,955 | | | | 4,928 | | | | 0 | | | | 64,781 | |
| Non-Stabilized | | | 303 | | | | 40 | | | | 124 | | | | 609 | | | | 0 | | | | 0 | | | | 1,076 | |
| Net operating income | | $ | 19,027 | | | $ | 23,769 | | | $ | 13,569 | | | $ | 4,564 | | | $ | 4,928 | | | $ | 0 | | | $ | 65,857 | |
| | | | | | | | | | | | | | | | | | | | | | | | | | | | | |
| Reconciliation of NOI to net income available to common shareholders | | | | | | | | | | | | | | | | | | | | | | | | | | | | |
| Interest (expense) income | | $ | (9,779 | ) | | $ | (11,507 | ) | | $ | (5,646 | ) | | $ | (1,641 | ) | | $ | (2,056 | ) | | $ | (500 | ) | | $ | (31,129 | ) |
| Depreciation/amortization | | | (6,488 | ) | | | (10,664 | ) | | | (4,237 | ) | | | (1,505 | ) | | | (1,331 | ) | | | (811 | ) | | | (25,036 | ) |
| Administrative, advisory and trustee fees | | | 0 | | | | 0 | | | | 0 | | | | 0 | | | | 0 | | | | (2,463 | ) | | | (2,463 | ) |
| Other expenses | | | 0 | | | | 0 | | | | 0 | | | | 0 | | | | 0 | | | | (710 | ) | | | (710 | ) |
| Other income | | | 0 | | | | 0 | | | | 0 | | | | 0 | | | | 0 | | | | 1,066 | | | | 1,066 | |
| Income before gain on sale of other investments and minority interest and discontinued operations | | | 2,760 | | | | 1,598 | | | | 3,686 | | | | 1,418 | | | | 1,541 | | | | (3,418 | ) | | | 7,585 | |
| Gain on sale of other investments | | | 0 | | | | 0 | | | | 0 | | | | 0 | | | | 0 | | | | 2 | | | | 2 | |
| Minority interest portion of operating partnership income | | | 0 | | | | 0 | | | | 0 | | | | 0 | | | | 0 | | | | (1,835 | ) | | | (1,835 | ) |
| Minority interest portion of other partnerships’ loss | | | 0 | | | | 0 | | | | 0 | | | | 0 | | | | 0 | | | | 36 | | | | 36 | |
| Income from continuing operations | | | 2,760 | | | | 1,598 | | | | 3,686 | | | | 1,418 | | | | 1,541 | | | | (5,215 | ) | | | 5,788 | |
Discontinued operations, net of minority interest(2) | | | 32 | | | | (3 | ) | | | 0 | | | | 0 | | | | 0 | | | | 0 | | | | 29 | |
| NET INCOME | | | 2,792 | | | | 1,595 | | | | 3,686 | | | | 1,418 | | | | 1,541 | | | | (5,215 | ) | | | 5,817 | |
| Dividends to preferred shareholders | | | 0 | | | | 0 | | | | 0 | | | | 0 | | | | 0 | | | | (1,186 | ) | | | (1,186 | ) |
| NET INCOME AVAILABLE TO COMMON SHAREHOLDERS | | $ | 2,792 | | | $ | 1,595 | | | $ | 3,686 | | | $ | 1,418 | | | $ | 1,541 | | | $ | (6,401 | ) | | $ | 4,631 | |
| 1. | For 2nd Quarter Fiscal 2008, non-stabilized properties included: |
Multi-Family Residential - | Indian Hills, Sioux City, IA; and Thomasbrook Apartments, Lincoln, NE. |
| | Total number of units, 69. Occupancy for the three and six month ended, 81.7% and 81.6%, respectively. |
Commercial Office - | Plymouth 5095, Plymouth, MN. |
| | Total square footage, 20,528. Occupancy for the three and six month ended, 100.0% and 100.0%, respectively. |
Commercial Medical - | Barry Point, Kansas City, MO. |
| | Total sq. ft., 18,502. Occupancy for the three and six month ended, 100.0% and 100.0%, respectively. |
Commercial Industrial - | Cedar Lake Business Center, St. Louis Park, MN; Urbandale, Urbandale, IA and Woodbury 1865, Woodbury, MN. |
| | Total square footage, 648,353. Occupancy for the three and six month ended, 91.8% and 92.3%, respectively. |
| Discontinued operations from fiscal 2008 include: |
Multi-Family Residential - | 405 Grant Avenue Apartments, Harvey, ND and Sweetwater – Green Acres 1&2 Apartments, Devils Lake, ND. |
| | Total number of units, 60. |
Commercial Office - | Minnetonka Office Building, Minnetonka, MN. |
| | Total square footage, 1,142. |
INVESTORS REAL ESTATE TRUST AND SUBSIDIARIES
STABILIZED PROPERTIES AND OVERALL ECONOMIC OCCUPANCY LEVELS BY SEGMENT
2nd Quarter Fiscal 2009 vs. 2nd Quarter Fiscal 2008
| Segments | | Stabilized Properties | | | All Properties | |
| | | 2nd Quarter | | | 2nd Quarter | | | 2nd Quarter | | | 2nd Quarter | |
| | | Fiscal 2009 | | | Fiscal 2008 | | | Fiscal 2009 | | | Fiscal 2008 | |
| Multi-Family Residential | | | 95.1 | % | | | 94.2 | % | | | 94.9 | % | | | 93.8 | % |
| Commercial Office | | | 88.5 | % | | | 92.9 | % | | | 88.8 | % | | | 92.9 | % |
| Commercial Medical | | | 95.8 | % | | | 95.6 | % | | | 95.6 | % | | | 95.6 | % |
| Commercial Industrial | | | 96.5 | % | | | 98.4 | % | | | 97.3 | % | | | 97.2 | % |
| Commercial Retail | | | 88.8 | % | | | 86.9 | % | | | 88.8 | % | | | 86.9 | % |
INVESTORS REAL ESTATE TRUST AND SUBSIDIARIES
COMMERCIAL LEASING SUMMARY
for the three months and six months ended October 31, 2008
| | | Three Months Ended October 30, 2008 | | | Six Months Ended October 30, 2008 | |
| | | New(1) | | | Renew(2) | | | 2nd Quarter 2008 Total | | | New(1) | | | Renew(2) | | | Year-To-Date Total | |
| Gross Leasing Square Footage | | | | | | | | | | | | | | | | | | |
| Commercial Office | | | 108,239 | | | | 41,844 | | | | 150,083 | | | | 156,610 | | | | 155,982 | | | | 312,592 | |
| Commercial Medical | | | 623 | | | | 16,075 | | | | 16,698 | | | | 8,196 | | | | 23,322 | | | | 31,518 | |
| Commercial Industrial | | | 0 | | | | 71,627 | | | | 71,627 | | | | 12,500 | | | | 71,627 | | | | 84,127 | |
| Commercial Retail | | | 55,770 | | | | 11,844 | | | | 67,614 | | | | 63,376 | | | | 50,430 | | | | 113,806 | |
| Total | | | 164,632 | | | | 141,390 | | | | 306,022 | | | | 240,682 | | | | 301,361 | | | | 542,043 | |
| | | | | | | | | | | | | | | | | | | | | | | | | |
| Weighted Average Term (yrs) | | | | | | | | | | | | | | | | | | | | | | | | |
| Commercial Office | | | 4.9 | | | | 2.6 | | | | 3.0 | | | | 4.9 | | | | 3.0 | | | | 3.8 | |
| Commercial Medical | | | 3.0 | | | | 5.7 | | | | 5.0 | | | | 6.0 | | | | 5.4 | | | | 5.5 | |
| Commercial Industrial | | | 0.0 | | | | 5.8 | | | | 5.8 | | | | 0.1 | | | | 5.8 | | | | 3.9 | |
| Commercial Retail | | | 9.2 | | | | 3.2 | | | | 6.6 | | | | 5.8 | | | | 3.2 | | | | 4.2 | |
| Total | | | 6.5 | | | | 3.9 | | | | 4.6 | | | | 5.2 | | | | 3.6 | | | | 4.2 | |
| | | | | | | | | | | | | | | | | | | | | | | | | |
| Rental Rate Increases | | | | | | | | | | | | | | | | | | | | | | | | |
| Rate on Expiring Leases | | | | | | | | | | | | | | | | | | | | | | | | |
| Commercial Office | | | | | | | | | | $ | 12.41 | | | | | | | | | | | $ | 11.46 | |
| Commercial Medical | | | | | | | | | | | 19.20 | | | | | | | | | | | | 18.89 | |
| Commercial Industrial | | | | | | | | | | | 2.88 | | | | | | | | | | | | 2.88 | |
| Commercial Retail | | | | | | | | | | | 3.53 | | | | | | | | | | | | 6.67 | |
| Total | | | | | | | | | | $ | 12.33 | | | | | | | | | | | $ | 11.49 | |
| | | | | | | | | | | | | | | | | | | | | | | | | |
| Rate on New and Renewal Leases | | | | | | | | | | | | | | | | | | | | | | | | |
| Commercial Office | | $ | 11.46 | | | $ | 9.64 | | | $ | 10.96 | | | $ | 10.16 | | | $ | 9.78 | | | $ | 9.97 | |
| Commercial Medical | | | 23.04 | | | | 16.24 | | | | 16.51 | | | | 22.68 | | | | 16.32 | | | | 17.98 | |
| Commercial Industrial | | | 0.0 | | | | 4.64 | | | | 4.64 | | | | 5.50 | | | | 4.64 | | | | 4.77 | |
| Commercial Retail | | | 15.19 | | | | 10.80 | | | | 14.41 | | | | 14.39 | | | | 8.62 | | | | 11.83 | |
| Total | | $ | 12.77 | | | $ | 7.95 | | | $ | 10.54 | | | $ | 11.46 | | | $ | 8.87 | | | $ | 10.02 | |
| | | | | | | | | | | | | | | | | | | | | | | | | |
| Percentage Increase (Decrease) | | | | | | | | | | | | | | | | | | | | | | | | |
| Commercial Office | | | | | | | | | | | (11.7 | %) | | | | | | | | | | | (13.0 | %) |
| Commercial Medical | | | | | | | | | | | (14.0 | %) | | | | | | | | | | | (4.8 | %) |
| Commercial Industrial | | | | | | | | | | | 61.1 | % | | | | | | | | | | | 65.6 | % |
| Commercial Retail | | | | | | | | | | | 308.2 | % | | | | | | | | | | | 77.4 | % |
| Total | | | | | | | | | | | (14.5 | %) | | | | | | | | | | | (12.8 | %) |
| (1) | Excluding leases in place on date of acquisition. |
| (2) | Renewing leases are not necessarily leases expiring in that period. Expansion footage for renewing tenants is included in this column. |
| (3) | Net of estimated operating expenses, other than tenant improvements. |
INVESTORS REAL ESTATE TRUST AND SUBSIDIARIES
COMMERCIAL LEASING SUMMARY
for the three months and six months ended October 31, 2008
| | | 2nd Quarter 2008 Total | | | Year-To-Date Total | |
| | | New | | | Renew | | | Total Dollars | | | New | | | Renew | | | Total Dollars | |
| Tenant Improvements | | | | | | | | | | | | | | | | | | |
| Commercial Office | | $ | 890,000 | | | $ | 106,772 | | | $ | 996,772 | | | $ | 1,372,779 | | | $ | 601,733 | | | $ | 1,974,512 | |
| Commercial Medical | | | 6,230 | | | | 250,846 | | | | 257,076 | | | | 271,285 | | | | 255,071 | | | | 526,356 | |
| Commercial Industrial | | | 0 | | | | 169,083 | | | | 169,083 | | | | 0 | | | | 169,083 | | | | 169,083 | |
| Commercial Retail | | | 425,154 | | | | 18,369 | | | | 443,523 | | | | 439,702 | | | | 18,369 | | | | 458,071 | |
| Subtotal | | $ | 1,321,384 | | | $ | 545,070 | | | $ | 1,866,454 | | | $ | 2,083,766 | | | $ | 1,044,256 | | | $ | 3,128,022 | |
| | | | | | | | | | | | | | | | | | | | | | | | | |
| Tenant Improvements per square foot | | | | | | | | | | | | | | | | | | | | | | | | |
| Commercial Office | | $ | 8.22 | | | $ | 2.55 | | | $ | 6.64 | | | $ | 8.77 | | | $ | 3.86 | | | $ | 6.32 | |
| Commercial Medical | | | 10.00 | | | | 15.60 | | | | 15.40 | | | | 33.10 | | | | 10.94 | | | | 16.70 | |
| Commercial Industrial | | | 0.00 | | | | 2.36 | | | | 2.36 | | | | 0.00 | | | | 2.36 | | | | 2.01 | |
| Commercial Retail | | | 7.62 | | | | 1.55 | | | | 6.56 | | | | 6.94 | | | | 0.36 | | | | 4.03 | |
| Subtotal | | $ | 8.03 | | | $ | 3.86 | | | $ | 6.10 | | | $ | 8.66 | | | $ | 3.47 | | | $ | 5.77 | |
| | | | | | | | | | | | | | | | | | | | | | | | | |
| Leasing Costs | | | | | | | | | | | | | | | | | | | | | | | | |
| Commercial Office | | $ | 229,160 | | | $ | 27,001 | | | $ | 256,161 | | | $ | 487,669 | | | $ | 439,453 | | | $ | 927,122 | |
| Commercial Medical | | | 1,870 | | | | 63,534 | | | | 65,404 | | | | 51,963 | | | | 77,455 | | | | 129,418 | |
| Commercial Industrial | | | 0 | | | | 38,960 | | | | 38,960 | | | | 343 | | | | 38,960 | | | | 39,303 | |
| Commercial Retail | | | 24,738 | | | | 28,792 | | | | 53,530 | | | | 37,670 | | | | 31,739 | | | | 69,409 | |
| Subtotal | | $ | 255,768 | | | $ | 158,287 | | | $ | 414,055 | | | $ | 577,645 | | | $ | 587,607 | | | $ | 1,165,252 | |
| | | | | | | | | | | | | | | | | | | | | | | | | |
| Leasing Costs per square foot | | | | | | | | | | | | | | | | | | | | | | | | |
| Commercial Office | | $ | 2.12 | | | $ | 0.65 | | | $ | 1.71 | | | $ | 3.11 | | | $ | 2.82 | | | $ | 2.97 | |
| Commercial Medical | | | 3.00 | | | | 3.95 | | | | 3.92 | | | | 6.34 | | | | 3.32 | | | | 4.11 | |
| Commercial Industrial | | | 0.00 | | | | 0.54 | | | | 0.54 | | | | 0.03 | | | | 0.54 | | | | 0.47 | |
| Commercial Retail | | | 0.44 | | | | 2.43 | | | | 0.79 | | | | 0.59 | | | | 0.63 | | | | 0.61 | |
| Subtotal | | $ | 1.55 | | | $ | 1.12 | | | $ | 1.35 | | | $ | 2.40 | | | $ | 1.95 | | | $ | 2.15 | |
| | | | | | | | | | | | | | | | | | | | | | | | | |
| Tenant Improvements and Leasing Costs | | | | | | | | | | | | | | | | | | | | | | | | |
| Commercial Office | | $ | 1,119,160 | | | $ | 133,773 | | | $ | 1,252,933 | | | $ | 1,860,448 | | | $ | 1,041,186 | | | $ | 2,901,634 | |
| Commercial Medical | | | 8,100 | | | | 314,380 | | | | 322,480 | | | | 323,248 | | | | 332,526 | | | | 655,774 | |
| Commercial Industrial | | | 0.00 | | | | 208,043 | | | | 208,043 | | | | 343 | | | | 208,043 | | | | 208,386 | |
| Commercial Retail | | | 449,892 | | | | 47,161 | | | | 497,053 | | | | 477,372 | | | | 50,108 | | | | 527,480 | |
| Total | | $ | 1,577,152 | | | $ | 703,357 | | | $ | 2,280,509 | | | $ | 2,661,411 | | | $ | 1,631,863 | | | $ | 4,293,274 | |
| | | | | | | | | | | | | | | | | | | | | | | | | |
| Tenant Improvements and Leasing Costs per square foot | | | | | | | | | | | | | | | | | | | | | | | | |
| Commercial Office | | $ | 10.34 | | | $ | 3.20 | | | $ | 8.35 | | | $ | 11.88 | | | $ | 6.68 | | | $ | 9.28 | |
| Commercial Medical | | | 13.00 | | | | 19.56 | | | | 19.31 | | | | 39.44 | | | | 14.26 | | | | 20.81 | |
| Commercial Industrial | | | 0.00 | | | | 2.90 | | | | 2.90 | | | | 0.03 | | | | 2.90 | | | | 2.48 | |
| Commercial Retail | | | 8.07 | | | | 3.98 | | | | 7.35 | | | | 7.53 | | | | 0.99 | | | | 4.63 | |
| Total | | $ | 9.58 | | | $ | 4.97 | | | $ | 7.45 | | | $ | 11.06 | | | $ | 5.41 | | | $ | 7.92 | |
INVESTORS REAL ESTATE TRUST AND SUBSIDIARIES
MULTI-FAMILY RESIDENTIAL SUMMARY
| | | Three Months Ended | |
| | | 10/31/2008 | | | 07/31/2008 | | | 04/30/2008 | | | 01/31/2008 | | | 10/31/2007 | |
| Number of Units | | | 9,564 | | | | 9,528 | | | | 9,500 | | | | 9,500 | | | | 9,337 | |
| Average Investment Per Unit | | $ | 54,303 | | | $ | 53,919 | | | $ | 53,677 | | | $ | 53,313 | | | $ | 52,898 | |
| | | | | | | | | | | | | | | | | | | | | |
| Average Scheduled Rent per Unit | | | | | | | | | | | | | | | | | | | | |
| Stabilized | | $ | 705.53 | | | $ | 700.43 | | | $ | 695.01 | | | $ | 690.31 | | | $ | 686.99 | |
| Non-Stabilized | | | 648.90 | | | | 647.89 | | | | 657.55 | | | | 611.55 | | | | 590.24 | |
| | | $ | 701.98 | | | $ | 697.18 | | | $ | 692.85 | | | $ | 686.38 | | | $ | 683.01 | |
| | | | | | | | | | | | | | | | | | | | | |
| Total Receipts per Unit | | | | | | | | | | | | | | | | | | | | |
| Stabilized | | $ | 682.32 | | | $ | 657.09 | | | $ | 658.05 | | | $ | 659.05 | | | $ | 659.02 | |
| Non-Stabilized | | | 598.48 | | | | 536.68 | | | | 484.14 | | | | 474.53 | | | | 491.86 | |
| | | $ | 677.06 | | | $ | 649.63 | | | $ | 648.03 | | | $ | 649.84 | | | $ | 652.15 | |
| Occupancy % | | | | | | | | | | | | | | | | | | | | |
| Stabilized | | | 95.1 | % | | | 92.8 | % | | | 93.2 | % | | | 93.9 | % | | | 94.2 | % |
| Non-Stabilized | | | 92.6 | % | | | 84.1 | % | | | 72.4 | % | | | 76.1 | % | | | 81.6 | % |
| | | | 94.9 | % | | | 92.3 | % | | | 92.1 | % | | | 93.1 | % | | | 93.8 | % |
| | | | | | | | | | | | | | | | | | | | | |
| Operating Expenses as a % of Scheduled Rent | | | | | | | | | | | | | | | | | | | | |
| Stabilized | | | 44.2 | % | | | 43.5 | % | | | 45.9 | % | | | 44.3 | % | | | 44.6 | % |
| Non-Stabilized | | | 47.9 | % | | | 47.5 | % | | | 46.7 | % | | | 47.2 | % | | | 65.4 | % |
| Total | | | 44.4 | % | | | 43.7 | % | | | 45.9 | % | | | 44.4 | % | | | 45.4 | % |
INVESTORS REAL ESTATE TRUST AND SUBSIDIARIES
10 LARGEST COMMERCIAL TENANTS – BASED ON ANNUALIZED BASE RENT(1)
as of October 31, 2008
| Tenant | | Number of Properties | | | Average Remaining Lease Term in Months | | | % of Total Commercial Segments’ Minimum Rents | | | Aggregate Rentable Square Feet | | | % of Aggregate Occupied Square Feet | |
| Affiliates of Edgewood Vista/Sunwest Management, Inc. | | | 21 | | | | 242 | | | | 10.6 | % | | | 983,877 | | | | 9.2 | % |
| St. Lukes Hospital of Duluth, Inc. | | | 6 | | | | 81 | | | | 3.5 | % | | | 198,775 | | | | 1.9 | % |
| Fairview Health | | | 8 | | | | 53 | | | | 2.3 | % | | | 166,402 | | | | 1.6 | % |
| Applied Underwriters | | | 3 | | | | 100 | | | | 2.3 | % | | | 141,724 | | | | 1.3 | % |
| Best Buy Co., Inc. (NYSE: BBY) | | | 2 | | | | 25 | | | | 2.0 | % | | | 224,650 | | | | 2.1 | % |
| UGS Corp. | | | 1 | | | | 34 | | | | 1.6 | % | | | 122,567 | | | | 1.1 | % |
| HealthEast Care System | | | 1 | | | | 124 | | | | 1.6 | % | | | 114,316 | | | | 1.1 | % |
| Microsoft (NASDAQ: MSFT) | | | 1 | | | | 58 | | | | 1.5 | % | | | 122,040 | | | | 1.1 | % |
| Smurfit - Stone Container (NASDAQ: SSCC) | | | 2 | | | | 66 | | | | 1.5 | % | | | 424,147 | | | | 4.0 | % |
| Arcadis Corporate Services (NASDAQ: ARCAF) | | | 2 | | | | 33 | | | | 1.4 | % | | | 82,725 | | | | 0.8 | % |
| Total/Weighted Average | | | | | | | 106 | | | | 28.3 | % | | | 2,581,223 | | | | 24.2 | % |
| (3) | See Definitions on page 26. |
INVESTORS REAL ESTATE TRUST AND SUBSIDIARIES
LEASE EXPIRATIONS
as of October 31, 2008
| Fiscal Year | | Number of Leases | | | Rentable Square Feet | | | % of Rentable Square Feet | | | Annualized Rent * | | | Average Rental Rate | | | % of Annualized Rent | |
| Commercial Office | | | | | | | | | | | | | | | | | | |
| 2009 | | | 26 | | | | 196,621 | | | | 4.6 | % | | $ | 1,889,845 | | | $ | 9.61 | | | | 3.5 | % |
| 2010 | | | 77 | | | | 675,855 | | | | 16.0 | % | | | 8,077,629 | | | | 11.95 | | | | 14.9 | % |
| 2011 | | | 66 | | | | 654,056 | | | | 15.5 | % | | | 8,612,658 | | | | 13.17 | | | | 15.9 | % |
| 2012 | | | 48 | | | | 777,880 | | | | 18.4 | % | | | 10,762,422 | | | | 13.84 | | | | 19.9 | % |
| 2013 | | | 35 | | | | 577,082 | | | | 13.6 | % | | | 7,314,709 | | | | 12.68 | | | | 13.5 | % |
| 2014 and thereafter | | | 63 | | | | 1,352,680 | | | | 31.9 | % | | | 17,451,185 | | | | 12.90 | | | | 32.3 | % |
| | | | 315 | | | | 4,234,174 | | | | 100.0 | % | | $ | 54,108,448 | | | $ | 12.78 | | | | 100.0 | % |
| | | | | | | | | | | | | | | | | | | | | | | | | |
| Commercial Medical | | | | | | | | | | | | | | | | | | | | | | | | |
| 2009 | | | 13 | | | | 42,261 | | | | 1.9 | % | | $ | 754,060 | | | $ | 17.84 | | | | 2.0 | % |
| 2010 | | | 23 | | | | 58,634 | | | | 2.7 | % | | | 1,094,781 | | | | 18.67 | | | | 2.9 | % |
| 2011 | | | 17 | | | | 67,247 | | | | 3.0 | % | | | 1,247,652 | | | | 18.55 | | | | 3.4 | % |
| 2012 | | | 29 | | | | 111,537 | | | | 5.0 | % | | | 2,248,245 | | | | 20.16 | | | | 6.1 | % |
| 2013 | | | 18 | | | | 68,342 | | | | 3.1 | % | | | 1,242,913 | | | | 18.19 | | | | 3.3 | % |
| 2014 and thereafter | | | 103 | | | | 1,869,474 | | | | 84.3 | % | | | 30,567,273 | | | | 16.35 | | | | 82.3 | % |
| | | | 203 | | | | 2,217,495 | | | | 100.0 | % | | $ | 37,154,924 | | | $ | 16.76 | | | | 100.0 | % |
| | | | | | | | | | | | | | | | | | | | | | | | | |
| Commercial Industrial | | | | | | | | | | | | | | | | | | | | | | | | |
| 2009 | | | 4 | | | | 107,788 | | | | 3.9 | % | | $ | 497,923 | | | $ | 4.62 | | | | 4.7 | % |
| 2010 | | | 7 | | | | 289,844 | | | | 10.4 | % | | | 985,673 | | | | 3.40 | | | | 9.3 | % |
| 2011 | | | 15 | | | | 1,072,579 | | | | 38.5 | % | | | 3,549,017 | | | | 3.31 | | | | 33.4 | % |
| 2012 | | | 2 | | | | 237,066 | | | | 8.5 | % | | | 640,078 | | | | 2.70 | | | | 6.0 | % |
| 2013 | | | 2 | | | | 204,633 | | | | 7.3 | % | | | 1,003,250 | | | | 4.90 | | | | 9.5 | % |
| 2014 and thereafter | | | 10 | | | | 876,989 | | | | 31.4 | % | | | 3,943,857 | | | | 4.50 | | | | 37.1 | % |
| | | | 40 | | | | 2,788,899 | | | | 100.0 | % | | $ | 10,619,798 | | | $ | 3.81 | | | | 100.0 | % |
| | | | | | | | | | | | | | | | | | | | | | | | | |
| Commercial Retail | | | | | | | | | | | | | | | | | | | | | | | | |
| 2009 | | | 25 | | | | 182,068 | | | | 14.5 | % | | $ | 1,118,472 | | | $ | 6.14 | | | | 11.0 | % |
| 2010 | | | 50 | | | | 216,010 | | | | 17.2 | % | | | 1,485,635 | | | | 6.88 | | | | 14.7 | % |
| 2011 | | | 43 | | | | 259,548 | | | | 20.6 | % | | | 2,550,078 | | | | 9.83 | | | | 25.2 | % |
| 2012 | | | 25 | | | | 221,785 | | | | 17.6 | % | | | 1,221,409 | | | | 5.51 | | | | 12.0 | % |
| 2013 | | | 14 | | | | 68,720 | | | | 5.4 | % | | | 444,275 | | | | 6.47 | | | | 4.4 | % |
| 2014 and thereafter | | | 33 | | | | 311,328 | | | | 24.7 | % | | | 3,308,787 | | | | 10.63 | | | | 32.7 | % |
| | | | 190 | | | | 1,259,459 | | | | 100.0 | % | | $ | 10,128,656 | | | $ | 8.04 | | | | 100.0 | % |
| | | | | | | | | | | | | | | | | | | | | | | | | |
| Commercial Total | | | | | | | | | | | | | | | | | | | | | | | | |
| 2009 | | | 68 | | | | 528,738 | | | | 5.0 | % | | $ | 4,260,300 | | | $ | 8.06 | | | | 3.8 | % |
| 2010 | | | 157 | | | | 1,240,343 | | | | 11.8 | % | | | 11,643,718 | | | | 9.39 | | | | 10.4 | % |
| 2011 | | | 141 | | | | 2,053,430 | | | | 19.6 | % | | | 15,959,405 | | | | 7.77 | | | | 14.3 | % |
| 2012 | | | 104 | | | | 1,348,268 | | | | 12.8 | % | | | 14,872,154 | | | | 11.03 | | | | 13.3 | % |
| 2013 | | | 69 | | | | 918,777 | | | | 8.8 | % | | | 10,005,147 | | | | 10.89 | | | | 8.9 | % |
| 2014 and thereafter | | | 209 | | | | 4,410,471 | | | | 42.0 | % | | | 55,271,102 | | | | 12.53 | | | | 49.3 | % |
| | | | 748 | | | | 10,500,027 | | | | 100.0 | % | | $ | 112,011,826 | | | $ | 10.67 | | | | 100.0 | % |
* Annualized Rent is monthly scheduled rent as of October 31, 2008 (cash basis), multiplied by 12.
INVESTORS REAL ESTATE TRUST AND SUBSIDIARIES
FISCAL 2009 ACQUISITION SUMMARY
as of October 31, 2008
($’s in thousands)
| Property | Location | Segment Type | Acquisition Date | | Square Feet/Units | | | Leased Percentage at Acquisition | | | October 31, 2008 Leased Percentage | | | Investment | |
| | | | | | | | | | | | | | | | |
| 33-unit Minot Westridge Apartments | Minot, ND | Multi-Family Residential | May 1, 2008 | | | 33 | | | | 100.0 | % | | | 100.0 | % | | $ | 1,954 | |
| 12-unit Minot Fairmont Apartments | Minot, ND | Multi-Family Residential | May 1, 2008 | | | 12 | | | | 100.0 | % | | | 100.0 | % | | | 365 | |
4-unit Minot 4th Street Apartments | Minot, ND | Multi-Family Residential | May 1, 2008 | | | 4 | | | | 100.0 | % | | | 100.0 | % | | | 89 | |
3-unit Minot 11th Street Apartments | Minot, ND | Multi-Family Residential | May 1, 2008 | | | 3 | | | | 100.0 | % | | | 100.0 | % | | | 64 | |
Bismarck 2130 S. 12th Street | Bismarck, ND | Unimproved Land | May 23, 2008 | | | N/A | | | | N/A | | | | N/A | | | | 576 | |
| 22,500 sq. ft. Bismarck 715 E. Broadway | Bismarck, ND | Commercial Office | August 1, 2008 | | | 22,500 | | | | 100.0 | % | | | 100.0 | % | | | 1,911 | |
| Bismarck 700 E. Main | Bismarck, ND | Unimproved Land | August 1, 2008 | | | N/A | | | | N/A | | | | N/A | | | | 314 | |
| 36-unit Evergreen Apartments | Isanti, MN | Multi-Family Residential | September 2, 2008 | | | 36 | | | | 100.0 | % | | | 100.0 | % | | | 3,100 | |
| 56,239 sq. ft.- 2828 Chicago Avenue | Minneapolis, MN | Commercial Medical | September 16, 2008 | | | 56,239 | | | | 68 | % | | | 72 | % | | | 12,046 | |
| 31,643 sq. ft.- Southdale Medical Expansion (6545 France Avenue) | Edina, MN | Commercial Medical | September 17, 2008 | | | 31,643 | | | | 75 | % | | | 82 | % | | | 6,473 | |
| | | | Total Square Feet | | | 87,882 | | | | | | | | | | | $ | 26,892 | |
| | | | Total Units | | | 88 | | | | | | | | | | | | | |
INVESTORS REAL ESTATE TRUST AND SUBSIDIARIES
FISCAL 2009 DEVELOPMENT SUMMARY
as of October 31, 2008
($’s in thousands)
| Property and Location | Total Rentable Square Feet or # of Units | | Percentage Leased or Committed | | | Anticipated Total Cost | | | Cost to Date | | Anticipated Construction Completion |
| IRET Corporate Plaza, Minot, ND | approximately 71 units & 60,100 sq. ft. | | | 33 | %* | | $ | 20,739 | | | $ | 16,875 | | 3rd Quarter Fiscal 2009 |
| | | | | | | | | | | | | | | |
| 401 South Main, Minot, ND | 10 Units | | | 0 | % | | | 793 | | | | 728 | | 3rd Quarter Fiscal 2009 |
| | | | Total | | | $ | 42,332 | | | $ | 17,603 | | |
* IRET - - occupied portion.
Definitions
October 31, 2008
Annualized base rent (ABR) is calculated as monthly base rent (cash basis) per the lease, as of the reporting period, multiplied by 12.
Debt to total market capitalization is total debt from the balance sheet divided by the sum of total debt from the balance sheet plus the market value of shares outstanding at the end of the period.
Debt service coverage ratio is computed by dividing earnings before interest income and expense, depreciation, amortization and gain on sale of real estate by interest expense and principal amortization.
EBITDA is earnings before interest, taxes, depreciation and amortization. We consider EBITDA to be an appropriate supplemental performance measure because it eliminates depreciation, interest and the gain/loss from property dispositions, which permits investors to view income from operations without the effect of non-cash depreciation or the cost of debt. EBITDA is a non-GAAP measure. EBITDA as calculated by us is not comparable to EBITDA reported by other REITs that do not define EBITDA exactly as we do.
Funds from operations (FFO) - The National Association of Real Estate Investment Trusts, Inc. (NAREIT) defines FFO as net income (computed in accordance with generally accepted accounting principles, excluding gains/losses from sales of property plus real estate depreciation and amortization. FFO is a non-GAAP measure. We consider FFO to be a standard supplemental measure for equity real estate investment trusts because it facilitates an understanding of the operating performance of properties without giving effect to real estate depreciation and amortization, which assume that the value of real estate assets diminishes predictably over time. Since real estate values instead historically rise or fall with market conditions, we believe that FFO provides investors and management with a more accurate indication of our financial and operating results.
Payout ratio (FFO per share and unit basis) - The ratio of the current quarterly distribution rate per common share and unit divided by quarterly FFO per share and unit.
Ratio of earnings to fixed charges - The ratio of earnings to fixed charges is computed by dividing earnings by fixed charges. For this purpose, earnings consist of income from continuing operations before adjustments for minority interest in consolidated subsidiaries, plus fixed charges and preferred distributions, less capitalized interest and preferred distributions. Fixed charges consist of mortgage and loan interest expense, whether expensed or capitalized, the amortization of debt expense and capitalized interest.
Ratio of earnings to combined fixed charges and preferred distributions - The ratio of earnings to combined fixed charges and preferred distributions is computed by dividing earnings by combined fixed charges and preferred distributions. For this purpose, earnings consist of income from continuing operations before adjustments for minority interest in consolidated subsidiaries, plus fixed charges and preferred distributions, less capitalized interest and preferred distributions. Combined fixed charges and preferred distributions consist of fixed charges (mortgage and loan interest expense, whether expensed or capitalized, the amortization of debt expense and capitalized interest) and preferred distributions.
Stabilized properties are those properties owned for the entirety of both periods being compared. While results presented on a stabilized property basis are not determined in accordance with GAAP, management believes that measuring performance on a stabilized property basis is useful to investors and to management because it enables evaluation of how the Company’s properties are performing year over year.