Exhibit 99.2
Fourth Quarter Fiscal 2009
Supplemental Operating and Financial Data
for the Quarter Ended April 30, 2009
| | | | | |
CONTACT: Michelle Saari VP - Investors Relations Direct Dial: 701-837-4738 E-Mail: msaari@iret.com | | | | 3015 16th Street SW, Suite 100 Minot, ND 58701 Tel: 701.837.4738 Fax: 701.838.7785 www.iret.com |
Supplemental Financial and Operating Data
April 30, 2009
| | Page |
| | |
| Company Background and Highlights | 2 |
| | |
| Investment Cost by Segment | 5 |
| | |
| Key Financial Data | |
| Condensed Consolidated Balance Sheets | 6 |
| Condensed Consolidated Statements of Operations | 7 |
| Funds From Operations | 8 |
| Earnings Before Interest, Taxes, Depreciation and Amortization (EBITDA) | 9 |
| | |
| Capital Analysis | |
| Long-Term Mortgage Debt Analysis | 10 |
| Long-Term Mortgage Debt Detail | 11-12 |
| Capital Analysis | 13 |
| | |
| Portfolio Analysis | |
| Stabilized Properties Net Operating Income Summary | 14 |
| Net Operating Income Detail | 15-18 |
| Stabilized Properties and Overall Economic Occupancy Levels by Segment | 19 |
| | |
| Tenant Analysis | |
| Commercial Leasing Summary | 20-21 |
| Multi-Family Residential Summary | 22 |
| 10 Largest Commercial Tenants - Based on Annualized Base Rent | 23 |
| Lease Expirations as of April 30, 2009 | 24 |
| | |
| Growth and Strategy | |
| Fiscal 2009 Acquisition Summary | 25 |
| | |
| Definitions & #160; | 26 |
Company Background and Highlights
Fourth Quarter Fiscal 2009
Investors Real Estate Trust is a self-administered, equity real estate investment trust (REIT) investing in a portfolio of income-producing properties located primarily in the upper Midwest. IRET’s portfolio is diversified among multi-family residential, commercial office, medical (including senior housing), industrial and retail segments.
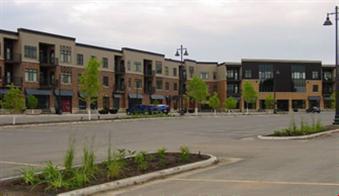
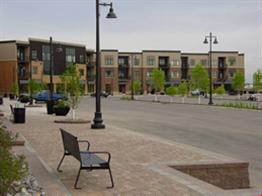
During the three months ended April 30, 2009, IRET had no material acquisitions or dispositions. The Company substantially completed the construction of IRET Corporate Plaza, its mixed-use project located in Minot, North Dakota, which consists of 71 apartment units, of which 58 were leased as of April 30, 2009, and approximately 50,360 square feet of office and retail space. The Company occupies approximately 22,000 square feet of the office and retail space, having moved its headquarters to this location during the fourth quarter of fiscal year 2009. The expected total cost of the project is approximately $23.0 million, including out-lot infrastructure but not including tenant improvements.
IRET’s fourth quarter fiscal year 2009 results reflect the continuing challenges the real estate industry faced during the three months ended April 30, 2009. During this quarter, factors adversely affecting demand for and rents received in IRET’s commercial segments became more intense and pervasive across the United States and in IRET’s markets, with commercial tenants focused on reducing costs through space reductions and lower rents. Additionally, continued job losses may pressure occupancy and revenue in the Company’s multi-family residential segment going forward. The Company expects current credit market conditions and the continued deterioration in the economy to increase credit stresses on Company tenants, and continues to expect this tenant stress to lead to increases in past due accounts and vacancies.
During the fourth quarter of fiscal year 2009, the credit markets continued to be considerably less favorable than in the recent past. Uncertainty about the pricing of commercial real estate, and the curtailment of available financing for commercial real estate, significantly reduced IRET’s ability to rely on cash-out refinancings and on proceeds from the sale of real estate to provide funds for investment opportunities and other business purposes. The continued ability to place debt on multi-family assets on favorable terms with Fannie Mae and Freddie Mac partly offsets the Company’s current inability to leverage its commercial assets at optimal levels, but does not offset it entirely, as the Company does not want to over-leverage its multi-family segment. Primarily due to these financing constraints on commercial real estate, current market conditions are not favorable for traditional leveraged acquisitions and development in IRET’s commercial segments, and consequently the potential for growth in net income from acquisitions and development in these segments is anticipated to be limited in fiscal year 2010.
On April 7, 2009, IRET and IRET Properties entered into a continuous equity offering program sales agreement with Robert W. Baird & Co. Incorporated (Baird). Pursuant to the Sales Agreement, IRET may offer and sell its common shares of beneficial interest, no par value, having an aggregate gross sales price of up to $50 million, from time to time through Baird as IRET’s sales agent. Sales of common shares, if any, under the program will depend upon market conditions and other factors to be determined by IRET and may be made in negotiated transactions or transactions that are deemed to be “at the market offerings”, including sales made directly on the NASDAQ Global Select Market or sales made to or through a market maker other than on an exchange. IRET has no obligation to sell any common shares in the program, and may at any time suspend solicitation and offers under the program or terminate the program. Baird is not required to sell any specific number or dollar amount of common shares but has agreed to use its commercially reasonable efforts to sell the common shares, as instructed by IRET. The common shares sold under the Sales Agreement will be issued pursuant to IRET’s registration statement on Form S-3, and IRET has filed a prospectus supplement with the Securities and Exchange Commission in connection with the offer and sale of the common shares under this continuous equity offering program. During the fourth quarter of fiscal year 2009, IRET sold 632,712 newly-issued common shares under this program, for total proceeds (before offering expenses but after underwriting discounts and commissions) of $6.0 million.
Subsequent to the fourth quarter of fiscal year 2009, IRET completed a public offering of 3,000,000 common shares of beneficial interest at $8.70 per share (before underwriting discounts and commissions). Proceeds to the Company were $24,795,000 after deducting underwriting discounts and commissions but before deducting offering expenses. The shares were sold pursuant to an Underwriting Agreement with Robert W. Baird & Co., Incorporated, D.A. Davidson & Co. and J.J.B. Hilliard, W.L. Lyons, Inc., and were issued pursuant to IRET’s registration statement on Form S-3 filed with and declared effective by the Securities and Exchange Commission.
In the fourth quarter of fiscal year 2009, IRET paid its 152nd consecutive quarterly distribution per common share/unit at equal or increasing rates. The $0.1700 per share/unit distribution was paid April 1, 2009.
As of April 30, 2009, IRET owns a diversified portfolio of 244 properties consisting of 77 multi-family residential properties, 67 office properties, 49 medical properties (including senior housing), 18 industrial properties and 33 retail properties. IRET’s distributions have increased every year for 38 consecutive years. IRET’s shares are publicly traded on the NASDAQ Global Select Market (NASDAQ: IRET).
Company Snapshot
(as of April 30, 2009)
| Company Headquarters | Minot, North Dakota |
| Fiscal Year-End | April 30 |
| Reportable Segments | Multi-Family Residential, Office, Medical, Industrial, Retail |
| Total Properties | 244 |
| Total Square Feet | |
| (commercial properties) | 11.7 million |
| Total Units | |
| (multi-family residential properties) | 9,645 |
| Common Shares Outstanding (thousands) | 60,304 |
| Limited Partnership Units Outstanding (thousands) | 20,838 |
| Common Share Distribution - Quarter/Annualized | $0.170/$0.680 |
| Dividend Yield | 7.4% |
| Total Capitalization (see p. 13 for detail) | $1.8 billion |
Investor Information
Board of Trustees
| Jeffrey L. Miller�� | Trustee and Chairman |
| Stephen L. Stenehjem | Trustee and Vice Chairman, Chair of Compensation Committee |
| John D. Stewart | Trustee, Chair of Audit Committee |
| Patrick G. Jones | Trustee, Chair of Nominating Committee |
| C.W. “Chip” Morgan | Trustee |
| John T. Reed | Trustee |
| W. David Scott | Trustee |
| Thomas A. Wentz, Jr. | Trustee, Senior Vice President - Asset Management and Finance |
| Timothy P. Mihalick | Trustee, Senior Vice President and Chief Operating Officer |
Management
| Thomas A. Wentz, Sr. | President and Chief Executive Officer |
| Diane K. Bryantt | Senior Vice President and Chief Financial Officer |
| Timothy P. Mihalick | Senior Vice President and Chief Operating Officer; Trustee |
| Thomas A. Wentz, Jr | Senior Vice President, Asset Management and Finance; Trustee |
| Charles A. Greenberg | Senior Vice President, Commercial Asset Management |
| Michael A. Bosh | Senior Vice President, General Counsel and Secretary |
Corporate Headquarters:
3015 16th Street SW, Suite 100
Minot, North Dakota 58701
Trading Symbol: IRET
Stock Exchange Listing: NASDAQ
Investor Relations:
Michelle Saari
msaari@iret.com
Common Share Data (NASDAQ: IRET)
| | | 4th Quarter Fiscal Year 2009 | | | 3rd Quarter Fiscal Year 2009 | | | 2nd Quarter Fiscal Year 2009 | | | 1st Quarter Fiscal Year 2009 | | | 4th Quarter Fiscal Year 2008 | |
| High Closing Price | | $ | 10.43 | | | $ | 10.71 | | | $ | 11.19 | | | $ | 10.68 | | | $ | 10.47 | |
| Low Closing Price | | $ | 8.60 | | | $ | 7.43 | | | $ | 7.66 | | | $ | 9.54 | | | $ | 8.95 | |
| Average Closing Price | | $ | 9.58 | | | $ | 9.71 | | | $ | 10.01 | | | $ | 10.10 | | | $ | 9.82 | |
| Closing Price at end of quarter | | $ | 9.25 | | | $ | 9.95 | | | $ | 9.88 | | | $ | 10.50 | | | $ | 10.20 | |
| Common Share Distributions—annualized | | $ | 0.680 | | | $ | 0.678 | | | $ | 0.676 | | | $ | 0.674 | | | $ | 0.672 | |
| Closing Dividend Yield - annualized | | | 7.4 | % | | | 6.8 | % | | | 6.8 | % | | | 6.4 | % | | | 6.6 | % |
| Closing common shares outstanding (thousands) | | | 60,304 | | | | 59,127 | | | | 58,713 | | | | 58,202 | | | | 57,732 | |
| Closing limited partnership units outstanding (thousands) | | | 20,838 | | | | 21,184 | | | | 21,287 | | | | 21,293 | | | | 21,238 | |
| Closing market value of outstanding common shares, plus imputed closing market value of outstanding limited partnership units (thousands) | | $ | 750,564 | | | $ | 799,094 | | | $ | 790,400 | | | $ | 834,698 | | | $ | 805,494 | |
Certain statements in these supplemental disclosures are “forward-looking statements” within the meaning of the Private Securities Litigation Reform Act of 1995. Such statements involve known and unknown risks, uncertainties and other factors that may cause actual results to differ materially from projected results. Such risks, uncertainties and other factors include, but are not limited to: fluctuations in interest rates, the effect of government regulation, the availability of capital, changes in general and local economic and real estate market conditions, competition, our ability to attract and retain skilled personnel, and those risks and uncertainties detailed from time to time in our filings with the Securities and Exchange Commission, including our 2008 Form 10-K. We assume no obligation to update or supplement forward-looking statements that become untrue because of subsequent events.
Fourth Quarter Fiscal 2009 Development Project
| IRET Corporate Plaza, Minot, ND |
| |
| |
| |
| (inside apartment photos) |
Investment Cost by Segment – Fourth Quarter Fiscal 2009
With investments in the multi-family residential and commercial office, medical, industrial and retail segments, IRET’s diversified portfolio helps to provide stability during market fluctuations in returns from specific property types.
INVESTORS REAL ESTATE TRUST AND SUBSIDIARIES
CONDENSED CONSOLIDATED BALANCE SHEETS (unaudited)
(in thousands)
| | | 04/30/2009 | | | 01/31/2009 | | | 10/31/2008 | | | 07/31/2008 | | | 04/30/2008 | |
| ASSETS | | | | | | | | | | | | | | | |
| Real estate investments | | | | | | | | | | | | | | | |
| Property owned | | $ | 1,729,585 | | | $ | 1,719,690 | | | $ | 1,690,763 | | | $ | 1,655,778 | | | $ | 1,648,259 | |
| Less accumulated depreciation | | | (262,871 | ) | | | (251,493 | ) | | | (240,452 | ) | | | (229,691 | ) | | | (219,379 | ) |
| | | | 1,466,714 | | | | 1,468,197 | | | | 1,450,311 | | | | 1,426,087 | | | | 1,428,880 | |
| Development in progress | | | 0 | | | | 0 | | | | 17,603 | | | | 35,231 | | | | 22,856 | |
| Unimproved land | | | 5,701 | | | | 5,695 | | | | 5,036 | | | | 4,567 | | | | 3,901 | |
| Mortgage loans receivable, net of allowance | | | 160 | | | | 161 | | | | 528 | | | | 534 | | | | 541 | |
| Total real estate investments | | | 1,472,575 | | | | 1,474,053 | | | | 1,473,478 | | | | 1,466,419 | | | | 1,456,178 | |
| Other assets | | | | | | | | | | | | | | | | | | | | |
| Cash and cash equivalents | | | 33,244 | | | | 31,022 | | | | 40,855 | | | | 42,351 | | | | 53,481 | |
| Marketable securities – available-for-sale | | | 420 | | | | 420 | | | | 420 | | | | 420 | | | | 420 | |
| Receivable arising from straight-lining of rents, net of allowance | | | 16,012 | | | | 15,558 | | | | 14,962 | | | | 14,383 | | | | 14,113 | |
| Accounts receivable, net of allowance | | | 2,738 | | | | 3,678 | | | | 3,676 | | | | 4,395 | | | | 4,163 | |
| Real estate deposits | | | 88 | | | | 242 | | | | 86 | | | | 1,048 | | | | 1,379 | |
| Prepaid and other assets | | | 1,051 | | | | 1,514 | | | | 1,813 | | | | 2,324 | | | | 349 | |
| Intangible assets, net of accumulated amortization | | | 52,173 | | | | 55,663 | | | | 56,576 | | | | 58,936 | | | | 61,649 | |
| Tax, insurance, and other escrow | | | 7,261 | | | | 8,271 | | | | 6,182 | | | | 7,888 | | | | 8,642 | |
| Property and equipment, net | | | 1,015 | | | | 1,436 | | | | 1,432 | | | | 1,450 | | | | 1,467 | |
| Goodwill | | | 1,392 | | | | 1,392 | | | | 1,392 | | | | 1,392 | | | | 1,392 | |
| Deferred charges and leasing costs, net | | | 17,122 | | | | 16,039 | | | | 16,037 | | | | 15,155 | | | | 14,793 | |
| TOTAL ASSETS | | $ | 1,605,091 | | | $ | 1,609,288 | | | $ | 1,616,909 | | | $ | 1,616,161 | | | $ | 1,618,026 | |
| | | | | | | | | | | | | | | | | | | | | |
| LIABILITIES AND SHAREHOLDERS’ EQUITY | | | | | | | | | | | | | | | | | | | | |
| LIABILITIES | | | | | | | | | | | | | | | | | | | | |
| Accounts payable and accrued expenses | | $ | 32,773 | | | $ | 32,275 | | | $ | 26,645 | | | $ | 32,917 | | | $ | 33,757 | |
| Revolving lines of credit | | | 5,500 | | | | 8,500 | | | | 15,000 | | | | 0 | | | | 0 | |
| Mortgages payable | | | 1,070,158 | | | | 1,068,127 | | | | 1,066,113 | | | | 1,068,267 | | | | 1,063,858 | |
| Other | | | 1,516 | | | | 1,636 | | | | 703 | | | | 830 | | | | 978 | |
| TOTAL LIABILITIES | | | 1,109,947 | | | | 1,110,538 | | | | 1,108,461 | | | | 1,102,014 | | | | 1,098,593 | |
| | | | | | | | | | | | | | | | | | | | | |
| COMMITMENTS AND CONTINGENCIES | | | | | | | | | | | | | | | | | | | | |
| MINORITY INTEREST IN PARTNERSHIPS | | | 13,010 | | | | 13,000 | | | | 13,098 | | | | 13,186 | | | | 12,609 | |
| MINORITY INTEREST OF UNITHOLDERS IN OPERATING PARTNERSHIP | | | 148,199 | | | | 153,566 | | | | 157,622 | | | | 159,984 | | | | 161,818 | |
| SHAREHOLDERS’ EQUITY | | | | | | | | | | | | | | | | | | | | |
| Preferred Shares of Beneficial Interest | | | 27,317 | | | | 27,317 | | | | 27,317 | | | | 27,317 | | | | 27,317 | |
| Common Shares of Beneficial Interest | | | 462,574 | | | | 452,440 | | | | 448,803 | | | | 444,134 | | | | 440,187 | |
| Accumulated distributions in excess of net income | | | (155,956 | ) | | | (147,573 | ) | | | (138,392 | ) | | | (130,474 | ) | | | (122,498 | ) |
| Total shareholders’ equity | | | 333,935 | | | | 332,184 | | | | 337,728 | | | | 340,977 | | | | 345,006 | |
| TOTAL LIABILITIES AND SHAREHOLDERS’ EQUITY | | $ | 1,605,091 | | | $ | 1,609,288 | | | $ | 1,616,909 | | | $ | 1,616,161 | | | $ | 1,618,026 | |
INVESTORS REAL ESTATE TRUST AND SUBSIDIARIES
CONDENSED CONSOLIDATED STATEMENTS OF OPERATIONS (unaudited)
(in thousands, except per share data)
| | | Twelve Months Ended | | | Three Months Ended | |
| OPERATING RESULTS | | 04/30/2009 | | | 04/30/2008 | | | 04/30/2009 | | | 01/31/2009 | | | 10/31/2008 | | | 07/31/2008 | | | 04/30/2008 | |
| Real estate revenue | | $ | 240,005 | | | $ | 221,170 | | | $ | 60,652 | | | $ | 60,934 | | | $ | 59,573 | | | $ | 58,846 | | | $ | 58,962 | |
| Real estate expenses | | | 98,151 | | | | 87,405 | | | | 24,495 | | | | 25,899 | | | | 23,953 | | | | 23,804 | | | | 23,911 | |
| Net operating income | | | 141,854 | | | | 133,765 | | | | 36,157 | | | | 35,035 | | | | 35,620 | | | | 35,042 | | | | 35,051 | |
| Interest | | | (68,743 | ) | | | (63,439 | ) | | | (17,436 | ) | | | (17,341 | ) | | | (17,078 | ) | | | (16,888 | ) | | | (16,470 | ) |
| Depreciation/amortization | | | (56,714 | ) | | | (51,518 | ) | | | (14,438 | ) | | | (14,550 | ) | | | (13,959 | ) | | | (13,767 | ) | | | (13,974 | ) |
| Administrative, advisory and trustee fees | | | (4,882 | ) | | | (5,203 | ) | | | (976 | ) | | | (1,336 | ) | | | (1,239 | ) | | | (1,331 | ) | | | (1,392 | ) |
| Operating expenses | | | (1,440 | ) | | | (1,344 | ) | | | (283 | ) | | | (313 | ) | | | (482 | ) | | | (362 | ) | | | (291 | ) |
| Impairment of real estate investment | | | (338 | ) | | | 0 | | | | (338 | ) | | | 0 | | | | 0 | | | | 0 | | | | 0 | |
| Non-operating income | | | 922 | | | | 2,760 | | | | 234 | | | | 152 | | | | 288 | | | | 248 | | | | 671 | |
| Income before minority interest and discontinued operations and (loss) gain on sale of other investments | | $ | 10,659 | | | $ | 15,021 | | | $ | 2,920 | | | $ | 1,647 | | | $ | 3,150 | | | $ | 2,942 | | | $ | 3,595 | |
| | | | | | | | | | | | | | | | | | | | | | | | | | | | | |
| Gain on sale of other investments | | | 54 | | | | 42 | | | | 0 | | | | 0 | | | | 54 | | | | 0 | | | | 38 | |
| Minority interest portion of operating partnership income | | | (2,227 | ) | | | (3,524 | ) | | | (596 | ) | | | (284 | ) | | | (700 | ) | | | (647 | ) | | | (833 | ) |
| Minority interest portion of other partnerships’ (income) loss | | | 40 | | | | 136 | | | | (57 | ) | | | 15 | | | | 19 | | | | 63 | | | | 111 | |
| Income from continuing operations | | | 8,526 | | | | 11,675 | | | | 2,267 | | | | 1,378 | | | | 2,523 | | | | 2,358 | | | | 2,911 | |
| Discontinued operations, net of minority interest | | | 0 | | | | 413 | | | | 0 | | | | 0 | | | | 0 | | | | 0 | | | | 377 | |
| NET INCOME | | | 8,526 | | | | 12,088 | | | | 2,267 | | | | 1,378 | | | | 2,523 | | | | 2,358 | | | | 3,288 | |
| Dividends to preferred shareholders | | | (2,372 | ) | | | (2,372 | ) | | | (593 | ) | | | (593 | ) | | | (593 | ) | | | (593 | ) | | | (593 | ) |
| NET INCOME AVAILABLE TO COMMON SHAREHOLDERS | | $ | 6,154 | | | $ | 9,716 | | | $ | 1,674 | | | $ | 785 | | | $ | 1,930 | | | $ | 1,765 | | | $ | 2,695 | |
| | | | | | | | | | | | | | | | | | | | | | | | | | | | | |
| Per Share Data | | | | | | | | | | | | | | | | | | | | | | | | | | | | |
Earnings per common share from continuing operations | | $ | .11 | | | $ | .17 | | | $ | .03 | | | $ | .02 | | | $ | .03 | | | $ | .03 | | | $ | .04 | |
Earnings per common share from discontinued operations | | | .00 | | | | .01 | | | | .00 | | | | .00 | | | | .00 | | | | .00 | | | | .01 | |
| Net income per common share – basic & diluted | | $ | .11 | | | $ | .18 | | | $ | .03 | | | $ | .02 | | | $ | .03 | | | $ | .03 | | | $ | .05 | |
| | | | | | | | | | | | | | | | | | | | | | | | | | | | | |
| Percentage of Revenues | | | | | | | | | | | | | | | | | | | | | | | | | | | | |
| Real estate expenses | | | 40.9 | % | | | 39.5 | % | | | 40.4 | % | | | 42.5 | % | | | 40.2 | % | | | 40.5 | % | | | 40.6 | % |
| Interest | | | 28.6 | % | | | 28.7 | % | | | 28.7 | % | | | 28.5 | % | | | 28.7 | % | | | 28.7 | % | | | 27.9 | % |
| Depreciation/amortization | | | 23.6 | % | | | 23.3 | % | | | 23.8 | % | | | 23.9 | % | | | 23.4 | % | | | 23.4 | % | | | 23.7 | % |
| General and administrative | | | 2.0 | % | | | 2.4 | % | | | 1.6 | % | | | 2.2 | % | | | 2.1 | % | | | 2.3 | % | | | 2.4 | % |
| Income from continuing operations | | | 3.6 | % | | | 5.3 | % | | | 3.7 | % | | | 2.3 | % | | | 4.2 | % | | | 4.0 | % | | | 4.9 | % |
| Net income | | | 3.6 | % | | | 5.5 | % | | | 3.7 | % | | | 2.3 | % | | | 4.2 | % | | | 4.0 | % | | | 5.6 | % |
| | | | | | | | | | | | | | | | | | | | | | | | | | | | | |
| Ratios | | | | | | | | | | | | | | | | | | | | | | | | | | | | |
EBITDA(1)/Interest expense | | | 1.97 | x | | | 2.02 | x | | | 1.99 | x | | | 1.93 | x | | | 1.99 | x | | | 1.98 | x | | | 2.04 | x |
| EBITDA/Interest expense plus preferred distributions | | | 1.90 | x | | | 1.94 | x | | | 1.92 | x | | | 1.86 | x | | | 1.92 | x | | | 1.91 | x | | | 1.97 | x |
| (1) | See Definitions on page 26. EBITDA is a non-GAAP measure; see page 9 for a reconciliation of EBITDA to net income. |
INVESTORS REAL ESTATE TRUST AND SUBSIDIARIES
FUNDS FROM OPERATIONS (unaudited)
(in thousands, except per share and unit data)
| | | Twelve Months Ended | | | Three Months Ended | |
| | | 04/30/2009 | | | 04/30/2008 | | | 04/30/2009 | | | 01/31/2009 | | | 10/31/2008 | | | 07/31/2008 | | | 04/30/2008 | |
Funds From Operations(1) | | | | | | | | | | | | | | | | | | | | | |
| Net income | | $ | 8,526 | | | $ | 12,088 | | | $ | 2,267 | | | $ | 1,378 | | | $ | 2,523 | | | $ | 2,358 | | | $ | 3,288 | |
| Less dividends to preferred shareholders | | | (2,372 | ) | | | (2,372 | ) | | | (593 | ) | | | (593 | ) | | | (593 | ) | | | (593 | ) | | | (593 | ) |
| Net income available to common shareholders | | | 6,154 | | | | 9,716 | | | | 1,674 | | | | 785 | | | | 1,930 | | | | 1,765 | | | | 2,695 | |
| Adjustments: | | | | | | | | | | | | | | | | | | | | | | | | | | | | |
| Minority interest in earnings of Unitholders | | | 2,227 | | | | 3,677 | | | | 596 | | | | 284 | | | | 700 | | | | 647 | | | | 973 | |
| Depreciation and amortization | | | 56,295 | | | | 51,303 | | | | 14,360 | | | | 14,454 | | | | 13,840 | | | | 13,641 | | | | 13,910 | |
| (Gains)/loss on depreciable property sales | | | (54 | ) | | | (514 | ) | | | 0 | | | | 0 | | | | (54 | ) | | | 0 | | | | (510 | ) |
| Funds from operations applicable to common shares and Units | | $ | 64,622 | | | $ | 64,182 | | | $ | 16,630 | | | $ | 15,523 | | | $ | 16,416 | | | $ | 16,053 | | | $ | 17,068 | |
| | | | | | | | | | | | | | | | | | | | | | | | | | | | | |
| FFO per share and unit - basic and diluted | | $ | 0.81 | | | $ | 0.87 | | | $ | 0.21 | | | $ | 0.19 | | | $ | 0.21 | | | $ | 0.20 | | | $ | 0.22 | |
| Weighted average shares and units | | | 79,820 | | | | 73,477 | | | | 80,361 | | | | 80,038 | | | | 79,668 | | | | 79,214 | | | | 78,195 | |
(1) | See Definitions on page 26. |
INVESTORS REAL ESTATE TRUST AND SUBSIDIARIES
EARNINGS BEFORE INTEREST, TAXES, DEPRECIATION AND AMORTIZATION (EBITDA) (unaudited)
(in thousands)
| | | Twelve Months Ended | | | Three Months Ended | |
| | | 04/30/2009 | | | 04/30/2008 | | | 04/30/2009 | | | 01/31/2009 | | | 10/31/2008 | | | 07/31/2008 | | | 04/30/2008 | |
EBITDA(1) | | | | | | | | | | | | | | | | | | | | | |
| Net income | | $ | 8,526 | | | $ | 12,088 | | | $ | 2,267 | | | $ | 1,378 | | | $ | 2,523 | | | $ | 2,358 | | | $ | 3,288 | |
| Adjustments: | | | | | | | | | | | | | | | | | | | | | | | | | | | | |
| Minority interest portion of operating partnership income | | | 2,227 | | | | 3,677 | | | | 596 | | | | 284 | | | | 700 | | | | 647 | | | | 973 | |
| Income before minority interest | | | 10,753 | | | | 15,765 | | | | 2,863 | | | | 1,662 | | | | 3,223 | | | | 3,005 | | | | 4,261 | |
| Add: | | | | | | | | | | | | | | | | | | | | | | | | | | | | |
| Interest | | | 68,743 | | | | 63,439 | | | | 17,436 | | | | 17,341 | | | | 17,078 | | | | 16,888 | | | | 16,470 | |
| Depreciation/amortization related to real estate investments | | | 54,646 | | | | 50,089 | | | | 13,825 | | | | 14,023 | | | | 13,480 | | | | 13,318 | | | | 13,542 | |
| Amortization related to non-real estate investments | | | 2,068 | | | | 1,476 | | | | 613 | | | | 527 | | | | 479 | | | | 449 | | | | 437 | |
Amortization related to real estate revenues(2) | | | (133 | ) | | | (283 | ) | | | 3 | | | | (27 | ) | | | (52 | ) | | | (57 | ) | | | (65 | ) |
| Less: | | | | | | | | | | | | | | | | | | | | | | | | | | | | |
| Interest income | | | (607 | ) | | | (2,095 | ) | | | (51 | ) | | | (123 | ) | | | (210 | ) | | | (223 | ) | | | (449 | ) |
| Gain on sale of real estate, land and other investments | | | (54 | ) | | | (556 | ) | | | 0 | | | | 0 | | | | (54 | ) | | | 0 | | | | (552 | ) |
| EBITDA | | $ | 135,416 | | | $ | 127,835 | | | $ | 34,689 | | | $ | 33,403 | | | $ | 33,944 | | | $ | 33,380 | | | $ | 33,644 | |
| (1) | See Definitions on page 26. |
| (2) | Included in real estate revenue in the Statement of Operations. |
INVESTORS REAL ESTATE TRUST AND SUBSIDIARIES
LONG-TERM MORTGAGE DEBT ANALYSIS
(in thousands)
Debt Maturity Schedule
Annual Expirations
Total Mortgage Debt
7.02% 7.64% 7.01% 5.76% 6.22% 5.60% 5.74% 6.22% 5.80% 6.35% 5.80%
| | | Future Maturities of Debt | |
| Fiscal Year | | Fixed Debt | | | Variable Debt | | | Total Debt | | | Weighted Average(1) | | | % of Total Debt | |
| 2010 | | $ | 108,149 | | | $ | 7,089 | | | $ | 115,238 | | | | 7.02 | % | | | 10.8 | % |
| 2011 | | | 81,276 | | | | 0 | | | | 81,276 | | | | 7.64 | % | | | 7.6 | % |
| 2012 | | | 94,116 | | | | 0 | | | | 94,116 | | | | 7.01 | % | | | 8.8 | % |
| 2013 | | | 25,796 | | | | 0 | | | | 25,796 | | | | 5.76 | % | | | 2.4 | % |
| 2014 | | | 47,414 | | | | 1,038 | | | | 48,452 | | | | 6.21 | % | | | 4.5 | % |
| 2015 | | | 71,105 | | | | 0 | | | | 71,105 | | | | 5.60 | % | | | 6.6 | % |
| 2016 | | | 65,280 | | | | 330 | | | | 65,610 | | | | 5.74 | % | | | 6.1 | % |
| 2017 | | | 161,414 | | | | 0 | | | | 161,414 | | | | 6.22 | % | | | 15.1 | % |
| 2018 | | | 93,646 | | | | 0 | | | | 93,646 | | | | 5.80 | % | | | 8.8 | % |
| 2019 | | | 118,274 | | | | 699 | | | | 118,973 | | | | 6.35 | % | | | 11.1 | % |
| Thereafter | | | 194,111 | | | | 421 | | | | 194,532 | | | | 5.80 | % | | | 18.2 | % |
| Total maturities | | $ | 1,060,581 | | | $ | 9,577 | | | $ | 1,070,158 | | | | 6.30 | % | | | 100.0 | % |
| (1) | Weighted average interest rate of debt that matures in fiscal year. |
| | | 04/30/2009 | | | 01/31/2009 | | | 10/31/2008 | | | 07/31/2008 | | | 04/30/2008 | |
| Balances Outstanding | | | | | | | | | | | | | | | |
| Mortgage | | | | | | | | | | | | | | | |
| Fixed rate | | $ | 1,060,581 | | | $ | 1,053,527 | | | $ | 1,054,938 | | | $ | 1,057,009 | | | $ | 1,052,162 | |
| Variable rate | | | 9,577 | | | | 14,600 | | | | 11,175 | | | | 11,258 | | | | 11,696 | |
| Mortgage total | | | 1,070,158 | | | | 1,068,127 | | | | 1,066,113 | | | | 1,068,267 | | | | 1,063,858 | |
| | | | | | | | | | | | | | | | | | | | | |
| Weighted Average Interest Rates | | | | | | | | | | | | | | | | | | | | |
| Secured | | | 6.30 | % | | | 6.34 | % | | | 6.36 | % | | | 6.36 | % | | | 6.37 | % |
INVESTORS REAL ESTATE TRUST AND SUBSIDIARIES
LONG-TERM MORTGAGE DEBT DETAIL AS OF APRIL 30, 2009
| Property | Maturity Date | | Fiscal 2010 | | | Fiscal 2011 | | | Fiscal 2012 | | | Fiscal 2013 | | | Thereafter | | | Total(1) | |
| Multi-Family Residential | | | | | | | | | | | | | | | | | | | |
| Forest Park Estates - Grand Forks, ND | 8/1/2009(2) | | $ | 6,178 | | | $ | 0 | | | $ | 0 | | | $ | 0 | | | $ | 0 | | | $ | 6,178 | |
| Rimrock Apts - Billings, MT | 8/1/2009(2) | | | 2,174 | | | | 0 | | | | 0 | | | | 0 | | | | 0 | | | | 2,174 | |
| Rocky Meadows Apts - Billings, MT | 8/1/2009(2) | | | 3,089 | | | | 0 | | | | 0 | | | | 0 | | | | 0 | | | | 3,089 | |
| Park Meadows I - Waite Park, MN | 9/1/2009(3) | | | 2,629 | | | | 0 | | | | 0 | | | | 0 | | | | 0 | | | | 2,629 | |
| Park Meadows II & III - Waite Park, MN | 9/1/2009(3) | | | 6,977 | | | | 0 | | | | 0 | | | | 0 | | | | 0 | | | | 6,977 | |
| Terrace on the Green - Moorhead, MN | 9/1/2009(3) | | | 1,416 | | | | 0 | | | | 0 | | | | 0 | | | | 0 | | | | 1,416 | |
| Thomasbrook - Lincoln, NE | 10/1/2009 | | | 5,077 | | | | 0 | | | | 0 | | | | 0 | | | | 0 | | | | 5,077 | |
| 17 South Main Apts - Minot, ND | 11/4/2009 | | | 198 | | | | 0 | | | | 0 | | | | 0 | | | | 0 | | | | 198 | |
| 401 South Main - Minot, ND | 11/4/2009 | | | 693 | | | | 0 | | | | 0 | | | | 0 | | | | 0 | | | | 693 | |
| Minot 4th St Apartments - Minot, ND | 11/4/2009 | | | 99 | | | | 0 | | | | 0 | | | | 0 | | | | 0 | | | | 99 | |
| Minot 11th St Apartments - Minot, ND | 11/4/2009 | | | 99 | | | | 0 | | | | 0 | | | | 0 | | | | 0 | | | | 99 | |
| Minot Fairmont Apartments - Minot, ND | 11/4/2009 | | | 396 | | | | 0 | | | | 0 | | | | 0 | | | | 0 | | | | 396 | |
| Minot Westridge Apartments - Minot, ND | 11/4/2009 | | | 1,981 | | | | 0 | | | | 0 | | | | 0 | | | | 0 | | | | 1,981 | |
| Westwood Park - Bismarck, ND | 12/1/2009 | | | 1,006 | | | | 0 | | | | 0 | | | | 0 | | | | 0 | | | | 1,006 | |
| Dakota Hill at Valley Ranch - Irving, TX | 2/1/2010 | | | 22,730 | | | | 0 | | | | 0 | | | | 0 | | | | 0 | | | | 22,730 | |
| Southbrook & Mariposa - Topeka, KS | 2/1/2010 | | | 3,170 | | | | 0 | | | | 0 | | | | 0 | | | | 0 | | | | 3,170 | |
| Kirkwood Apts - Bismarck, ND | 5/1/2010 | | | 0 | | | | 1,925 | | | | 0 | | | | 0 | | | | 0 | | | | 1,925 | |
| Meadows I - Jamestown, ND | 8/1/2010 | | | 0 | | | | 905 | | | | 0 | | | | 0 | | | | 0 | | | | 905 | |
| Meadows II - Jamestown, ND | 8/1/2010 | | | 0 | | | | 905 | | | | 0 | | | | 0 | | | | 0 | | | | 905 | |
| Olympic Village - Billings, MT | 11/1/2010 | | | 0 | | | | 7,656 | | | | 0 | | | | 0 | | | | 0 | | | | 7,656 | |
| Southview Apartments - Minot, ND | 11/1/2010 | | | 0 | | | | 738 | | | | 0 | | | | 0 | | | | 0 | | | | 738 | |
| Valley Park Manor - Grand Forks, ND | 11/1/2010 | | | 0 | | | | 2,720 | | | | 0 | | | | 0 | | | | 0 | | | | 2,720 | |
| Valley Park Manor - Grand Forks, ND | 11/1/2010 | | | 0 | | | | 827 | | | | 0 | | | | 0 | | | | 0 | | | | 827 | |
| Ridge Oaks Apts - Sioux City, IA | 2/1/2011 | | | 0 | | | | 2,619 | | | | 0 | | | | 0 | | | | 0 | | | | 2,619 | |
| Sunset Trail I - Rochester, MN | 3/1/2011 | | | 0 | | | | 3,941 | | | | 0 | | | | 0 | | | | 0 | | | | 3,941 | |
| Sunset Trail II - Rochester, MN | 3/1/2011 | | | 0 | | | | 3,826 | | | | 0 | | | | 0 | | | | 0 | | | | 3,826 | |
| Oakwood Estates - Sioux Falls, SD | 6/1/2011 | | | 0 | | | | 0 | | | | 3,480 | | | | 0 | | | | 0 | | | | 3,480 | |
| Oxbow - Sioux Falls, SD | 6/1/2011 | | | 0 | | | | 0 | | | | 3,793 | | | | 0 | | | | 0 | | | | 3,793 | |
| Chateau Apts - Minot, ND | 7/1/2011 | | | 0 | | | | 0 | | | | 1,802 | | | | 0 | | | | 0 | | | | 1,802 | |
| Oakmont Apts - Sioux Falls, SD | 9/1/2011 | | | 0 | | | | 0 | | | | 3,737 | | | | 0 | | | | 0 | | | | 3,737 | |
| Canyon Lake Apts - Rapid City, SD | 10/1/2011 | | | 0 | | | | 0 | | | | 2,702 | | | | 0 | | | | 0 | | | | 2,702 | |
| Meadows III - Jamestown, ND | 11/1/2011 | | | 0 | | | | 0 | | | | 999 | | | | 0 | | | | 0 | | | | 999 | |
| East Park Apts - Sioux Falls, SD | 12/1/2012 | | | 0 | | | | 0 | | | | 0 | | | | 1,591 | | | | 0 | | | | 1,591 | |
| Sycamore Village Apts - Sioux Falls, SD | 12/1/2012 | | | 0 | | | | 0 | | | | 0 | | | | 895 | | | | 0 | | | | 895 | |
| Monticello Village Apts - Monticello, MN | 3/1/2013 | | | 0 | | | | 0 | | | | 0 | | | | 3,145 | | | | 0 | | | | 3,145 | |
| Summary of Debt due after 2013 | 10/1/2013 | | | 0 | | | | 0 | | | | 0 | | | | 0 | | | | 210,089 | | | | 210,089 | |
| Sub-Total Multi-Family Residential | | | $ | 57,912 | | | $ | 26,062 | | | $ | 16,513 | | | $ | 5,631 | | | $ | 210,089 | | | $ | 316,207 | |
| | | | | | | | | | | | | | | | | | | | | | | | | | |
| Commercial Office | | | | | | | | | | | | | | | | | | | | | | | | | |
| Three Paramount Plaza - Bloomington, MN | 8/1/2009 | | $ | 3,969 | | | $ | 0 | | | $ | 0 | | | $ | 0 | | | $ | 0 | | | $ | 3,969 | |
Mendota - American Corporate Center - Mendota Heights, MN(2)(4) | 11/1/2009 | | | 9,597 | | | | 0 | | | | 0 | | | | 0 | | | | 0 | | | | 9,597 | (5) |
Mendota Center I - Mendota Heights, MN(2)(4) | 11/1/2009 | | | 3,806 | | | | 0 | | | | 0 | | | | 0 | | | | 0 | | | | 3,806 | (5) |
Mendota Center II - Mendota Heights, MN(2)(4) | 11/1/2009 | | | 6,094 | | | | 0 | | | | 0 | | | | 0 | | | | 0 | | | | 6,094 | (5) |
Mendota Center III - Mendota Heights, MN(2)(4) | 11/1/2009 | | | 3,554 | | | | 0 | | | | 0 | | | | 0 | | | | 0 | | | | 3,554 | (5) |
Mendota Center IV - Mendota Heights, MN(2)(4) | 11/1/2009 | | | 4,615 | | | | 0 | | | | 0 | | | | 0 | | | | 0 | | | | 4,615 | (5) |
| Northgate II - Maple Grove, MN | 2/1/2010 | | | 1,312 | | | | 0 | | | | 0 | | | | 0 | | | | 0 | | | | 1,312 | |
| Southeast Tech Center - Eagan, MN | 2/1/2010 | | | 3,549 | | | | 0 | | | | 0 | | | | 0 | | | | 0 | | | | 3,549 | |
| Westgate I - Boise, ID | 2/1/2010 | | | 1,905 | | | | 0 | | | | 0 | | | | 0 | | | | 0 | | | | 1,905 | |
| Westgate II - Boise, ID | 2/1/2010 | | | 4,665 | | | | 0 | | | | 0 | | | | 0 | | | | 0 | | | | 4,665 | |
| Brenwood - Minnetonka, MN | 10/1/2010 | | | 0 | | | | 7,640 | | | | 0 | | | | 0 | | | | 0 | | | | 7,640 | |
| Nicollet VII - Burnsville, MN | 12/1/2010 | | | 0 | | | | 4,090 | | | | 0 | | | | 0 | | | | 0 | | | | 4,090 | |
INVESTORS REAL ESTATE TRUST AND SUBSIDIARIES
LONG-TERM MORTGAGE DEBT DETAIL AS OF APRIL 30, 2009 (continued)
| Property | Maturity Date | | Fiscal 2010 | | | Fiscal 2011 | | | Fiscal 2012 | | | Fiscal 2013 | | | Thereafter | | | Total(1) | |
| Commercial Office - Continued | | | | | | | | | | | | | | | | | | | |
| Dewey Hill Business Center - Edina, MN | 1/1/2011 | | $ | 0 | | | | 2,663 | | | | 0 | | | | 0 | | | | 0 | | | | 2,663 | |
| Plymouth IV - Plymouth, MN | 1/1/2011 | | | 0 | | | | 3,264 | | | | 0 | | | | 0 | | | | 0 | | | | 3,264 | |
| Plymouth V - Plymouth, MN | 1/1/2011 | | | 0 | | | | 4,698 | | | | 0 | | | | 0 | | | | 0 | | | | 4,698 | |
| Whitewater Plaza - Minnetonka, MN | 3/1/2011 | | | 0 | | | | 2,672 | | | | 0 | | | | 0 | | | | 0 | | | | 2,672 | |
| Whitewater Plaza 2nd Mortgage - Minnetonka, MN | 3/1/2011 | | | 0 | | | | 1,385 | | | | 0 | | | | 0 | | | | 0 | | | | 1,385 | |
| 2030 Cliff Road - Eagan, MN | 4/1/2011 | | | 0 | | | | 495 | | | | 0 | | | | 0 | | | | 0 | | | | 495 | |
| Cold Spring Center - St Cloud, MN | 4/1/2011 | | | 0 | | | | 4,212 | | | | 0 | | | | 0 | | | | 0 | | | | 4,212 | |
| Pillsbury Business Center - Edina, MN | 4/1/2011 | | | 0 | | | | 959 | | | | 0 | | | | 0 | | | | 0 | | | | 959 | |
| Golden Hills Office Center - Golden Valley, MN | 7/1/2011 | | | 0 | | | | 0 | | | | 14,537 | | | | 0 | | | | 0 | | | | 14,537 | |
| Wells Fargo Center - St Cloud, MN | 7/1/2011 | | | 0 | | | | 0 | | | | 6,897 | | | | 0 | | | | 0 | | | | 6,897 | |
| Interlachen Corp Center - Eagan, MN | 10/11/2011 | | | 0 | | | | 0 | | | | 9,886 | | | | 0 | | | | 0 | | | | 9,886 | |
| Bloomington Business Plaza - Bloomington, MN | 12/1/2011 | | | 0 | | | | 0 | | | | 4,297 | | | | 0 | | | | 0 | | | | 4,297 | |
| Wirth Corporate Center - Golden Valley, MN | 2/1/2012 | | | 0 | | | | 0 | | | | 4,258 | | | | 0 | | | | 0 | | | | 4,258 | |
| Summary of Debt due after 2013 | 5/1/2014 | | | 0 | | | | 0 | | | | | | | | 0 | | | | 257,730 | | | | 257,730 | |
| Sub-Total Commercial Office | | | $ | 43,066 | | | $ | 32,078 | | | $ | 39,875 | | | $ | 0 | | | $ | 257,730 | | | $ | 372,749 | |
| | | | | | | | | | | | | | | | | | | | | | | | | | |
| Commercial Medical | | | | | | | | | | | | | | | | | | | | | | | | | |
| Edina 6545 France SMC I - Edina, MN | 1/1/2011 | | $ | 0 | | | $ | 21,973 | | | $ | 0 | | | $ | 0 | | | $ | 0 | | | $ | 21,973 | |
| Edina 6525 France SMC II - Edina, MN | 6/1/2011 | | | 0 | | | | 0 | | | | 9,798 | | | | 0 | | | | 0 | | | | 9,798 | |
| Edina 6405 France Medical - Edina, MN | 1/1/2012 | | | 0 | | | | 0 | | | | 9,323 | | | | 0 | | | | 0 | | | | 9,323 | |
| Edina 6363 France Medical - Edina, MN | 4/1/2012 | | | 0 | | | | 0 | | | | 8,159 | | | | 0 | | | | 0 | | | | 8,159 | |
| Fox River Cottages - Grand Chute, WI | 5/1/2012 | | | 0 | | | | 0 | | | | 0 | | | | 2,308 | | | | 0 | | | | 2,308 | |
| Summary of Debt due after 2013 | 8/1/2015 | | | 0 | | | | 0 | | | | 0 | | | | 0 | | | | 188,963 | | | | 188,963 | |
| Sub-Total Commercial Medical | | | $ | 0 | | | $ | 21,973 | | | $ | 27,280 | | | $ | 2,308 | | | $ | 188,963 | | | $ | 240,524 | |
| | | | | | | | | | | | | | | | | | | | | | | | | | |
| Commercial Industrial | | | | | | | | | | | | | | | | | | | | | | | | | |
| Waconia Industrial Bldg - Waconia, MN | 8/2/2009 | | $ | 1,122 | | | $ | 0 | | | $ | 0 | | | $ | 0 | | | $ | 0 | | | $ | 1,122 | |
| Metal Improvement Co - New Brighton, MN | 10/1/2009 | | | 1,217 | | | | 0 | | | | 0 | | | | 0 | | | | 0 | | | | 1,217 | |
| Lexington Commerce Center - Eagan, MN | 2/1/2010 | | | 2,854 | | | | 0 | | | | 0 | | | | 0 | | | | 0 | | | | 2,854 | |
| Eagan 2785 & 2795 Highway 55 - Eagan, MN | 6/1/2011 | | | 0 | | | | 0 | | | | 3,776 | | | | 0 | | | | 0 | | | | 3,776 | |
| Stone Container - Roseville, MN | 2/1/2012 | | | 0 | | | | 0 | | | | 4,173 | | | | 0 | | | | 0 | | | | 4,173 | |
| Minnetonka 13600 Cty Rd 62 - Minnetonka, MN | 2/27/2012 | | | 0 | | | | 0 | | | | 2,499 | | | | 0 | | | | 0 | | | | 2,499 | |
| Dixon Avenue Industrial Park - Des Moines, IA | 1/1/2013 | | | 0 | | | | 0 | | | | 0 | | | | 7,786 | | | | 0 | | | | 7,786 | |
| Bloomington-2000 West 94th Street - Bloomington, MN | 3/1/2013 | | | 0 | | | | 0 | | | | 0 | | | | 4,076 | | | | 0 | | | | 4,076 | |
| Roseville-2929 Long Lake Road - Roseville, MN | 3/1/2013 | | | 0 | | | | 0 | | | | 0 | | | | 5,995 | | | | 0 | | | | 5,995 | |
| Summary of Debt due after 2013 | 9/1/2013 | | | 0 | | | | 0 | | | | 0 | | | | 0 | | | | 43,451 | | | | 43,451 | |
| Sub-Total Commercial Industrial | | | $ | 5,193 | | | $ | 0 | | | $ | 10,448 | | | $ | 17,857 | | | $ | 43,451 | | | $ | 76,949 | |
| | | | | | | | | | | | | | | | | | | | | | | | | | |
| Commercial Retail | | | | | | | | | | | | | | | | | | | | | | | | | |
| Rochester Maplewood Square - Rochester, MN | 8/1/2009 | | $ | 3,660 | | | $ | 0 | | | $ | 0 | | | $ | 0 | | | $ | 0 | | | $ | 3,660 | |
| Minot Arrowhead Shopping Center-2nd Mtg - Minot, ND | 8/23/2009 | | | 2,500 | | | | 0 | | | | 0 | | | | 0 | | | | 0 | | | | 2,500 | |
| Grand Forks MedPark Mall - Grand Forks, ND | 3/1/2010 | | | 2,907 | | | | 0 | | | | 0 | | | | 0 | | | | 0 | | | | 2,907 | |
| Minot Plaza - Minot, ND | 8/1/2010 | | | 0 | | | | 634 | | | | 0 | | | | 0 | | | | 0 | | | | 634 | |
| Kentwood Thomasville Furniture - Kentwood, MI | 2/1/2011 | | | 0 | | | | 529 | | | | 0 | | | | 0 | | | | 0 | | | | 529 | |
| St Cloud Westgate Shopping Center - St Cloud, MN | 10/10/2013 | | | 0 | | | | 0 | | | | 0 | | | | 0 | | | | 53,499 | | | | 53,499 | |
| Sub-Total Commercial Retail | | | $ | 9,067 | | | $ | 1,163 | | | $ | 0 | | | $ | 0 | | | $ | 53,499 | | | $ | 63,729 | |
| | | | | | | | | | | | | | | | | | | | | | | | | | |
| Total | | | $ | 115,238 | | | $ | 81,276 | | | $ | 94,116 | | | $ | 25,796 | | | $ | 753,732 | | | $ | 1,070,158 | |
| (1) | Totals given are principal balances as of April 30, 2009. |
| (2) | Refinancing pending; loan commitment received. |
| (3) | Refinancing closed June 2009; new debt placed with Freddie Mac. |
| (4) | IRET’s ownership interest in these properties is 51%. IRET’s 49% joint venture partner is obligated on the mortgage debt in proportion to its ownership interest. |
| (5) | Includes the 49% share of IRET’s joint venture partner. |
INVESTORS REAL ESTATE TRUST AND SUBSIDIARIES
CAPITAL ANALYSIS
(in thousands, except per share and unit amounts)
| | | 04/30/2009 | | | 01/31/2009 | | | 10/31/2008 | | | 07/31/2008 | | | 04/30/2008 | |
| Equity Capitalization | | | | | | | | | | | | | | | |
| Common shares outstanding | | | 60,304 | | | | 59,127 | | | | 58,713 | | | | 58,202 | | | | 57,732 | |
| Operating partnership (OP) units outstanding | | | 20,838 | | | | 21,184 | | | | 21,287 | | | | 21,293 | | | | 21,238 | |
| Total common shares and OP units outstanding | | | 81,142 | | | | 80,311 | | | | 80,000 | | | | 79,495 | | | | 78,970 | |
| Market price per common share (closing price at end of period) | | $ | 9.25 | | | $ | 9.95 | | | $ | 9.88 | | | $ | 10.50 | | | $ | 10.20 | |
| Equity capitalization-common shares and OP units | | $ | 750,564 | | | $ | 799,094 | | | $ | 790,400 | | | $ | 834,698 | | | $ | 805,494 | |
| Recorded book value of preferred shares | | $ | 27,317 | | | $ | 27,317 | | | $ | 27,317 | | | $ | 27,317 | | | $ | 27,317 | |
| Total equity capitalization | | $ | 777,881 | | | $ | 826,411 | | | $ | 817,717 | | | $ | 862,015 | | | $ | 832,811 | |
| | | | | | | | | | | | | | | | | | | | | |
| Debt Capitalization | | | | | | | | | | | | | | | | | | | | |
| Total mortgage debt | | $ | 1,070,158 | | | $ | 1,068,127 | | | $ | 1,066,113 | | | $ | 1,068,267 | | | $ | 1,063,858 | |
| Total capitalization | | $ | 1,848,039 | | | $ | 1,894,538 | | | $ | 1,883,830 | | | $ | 1,930,282 | | | $ | 1,896,669 | |
| | | | | | | | | | | | | | | | | | | | | |
| Total debt to total capitalization | | 0.58:1 | | | 0.56:1 | | | 0.57:1 | | | 0.55:1 | | | 0.56:1 | |
| | | | | | | | | | | | | | | | | | | | | |
Earnings to fixed charges(1) | | | 1.20 | x | | | 1.13 | x | | | 1.16 | x | | | 1.15 | x | | | 1.20 | x |
Earnings to combined fixed charges and preferred distributions(1) | | | 1.16 | x | | | 1.09 | x | | | 1.13 | x | | | 1.12 | x | | | 1.16 | x |
Debt service coverage ratio(1) | | | 1.42 | x | | | 1.39 | x | | | 1.41 | x | | | 1.40 | x | | | 1.46 | x |
| | | | | | | | | | | | | | | | | | | | | |
| Distribution Data | | | | | | | | | | | | | | | | | | | | |
| Common shares and units outstanding at record date | | | 80,323 | | | | 80,018 | | | | 79,566 | | | | 79,116 | | | | 77,675 | |
| Total common distribution paid | | $ | 13,656 | | | $ | 13,562 | | | $ | 13,445 | | | $ | 13,332 | | | $ | 13,050 | |
| Common distribution per share and unit | | $ | 0.1700 | | | $ | 0.1695 | | | $ | 0.1690 | | | $ | 0.1685 | | | $ | 0.1680 | |
Payout ratio (FFO per share and unit basis)(1) | | | 81.0 | % | | | 89.2 | % | | | 80.5 | % | | | 84.3 | % | | | 76.4 | % |
| (1) | See Definitions on page 26. |
INVESTORS REAL ESTATE TRUST AND SUBSIDIARIES
STABILIZED PROPERTIES NET OPERATING INCOME SUMMARY
(in thousands)
| | | Stabilized Properties(1) | | | Stabilized Properties | |
| | | Three Months Ended April 30, | | | Twelve Months Ended April 30, | |
| Segment | | 2009 | | | 2008 | | | % Change | | | 2009 | | | 2008 | | | % Change | |
| Multi-Family Residential | | $ | 9,697 | | | $ | 9,114 | | | | 6.4 | % | | $ | 38,644 | | | $ | 37,332 | | | | 3.5 | % |
| Commercial Office | | | 11,257 | | | | 12,135 | | | | (7.2 | %) | | | 43,969 | | | | 47,536 | | | | (7.5 | %) |
| Commercial Medical | | | 6,910 | | | | 6,908 | | | | 0.0 | % | | | 26,732 | | | | 26,909 | | | | (0.7 | %) |
| Commercial Industrial | | | 1,666 | | | | 1,717 | | | | (3.0 | %) | | | 6,882 | | | | 7,576 | | | | (9.2 | %) |
| Commercial Retail | | | 2,449 | | | | 2,597 | | | | (5.7 | %) | | | 9,491 | | | | 9,921 | | | | (4.3 | %) |
| | | $ | 31,979 | | | $ | 32,471 | | | | (1.5 | %) | | $ | 125,718 | | | $ | 129,274 | | | | (2.8 | %) |
| 1. | For 4th Quarter Fiscal 2009 and 4th Quarter Fiscal 2008, stabilized properties excluded: |
Multi-Family Residential - | Indian Hills, Sioux City, IA; Cottonwood IV Apartments, Bismarck, ND; Greenfield Apartments, Omaha, NE; Minot 4th Street Apartments, Minot, ND; Minot 11th Street Apartments, Minot, ND; Minot Fairmont Apartments, Minot, ND; Minot Westridge Apartments, Minot, ND; Thomasbrook Apartments, Lincoln, NE; Evergreen Apartments, Isanti, MN; 401 South Main, Minot, ND and IRET Corporate Plaza, Minot, ND. |
| | Total number of units, 692. Occupancy % for the three and twelve months ended April 30, 2009, 87.1% and 88.2%, respectively. |
Commercial Office - | 610 Business Center, Brooklyn Park, MN; Intertech, Fenton, MO; Plymouth 5095, Plymouth, MN; Bismarck 715 E Broadway, Bismarck, ND; 401 South Main, Minot, ND; IRET Corporate Plaza, Minot, ND and 12 South Main Street, Minot, ND. |
| | Total square footage, 246,311. Occupancy % for the three and twelve months ended April 30, 2009, 95.4% and 95.3%, respectively. |
Commercial Medical - | Barry Point, Kansas City, MO; Edgewood Vista Billings, Billings, MT; Edgewood Vista East Grand Forks, East Grand Forks, MN; Edgewood Vista Sioux Falls, Sioux Falls, SD; Edina 6405 France Medical, Edina, MN; Edina 6363 France Medical, Edina, MN; Minneapolis 701 25th Ave Medical (Riverside), Minneapolis, MN; Burnsville 303 Nicollet Medical (Ridgeview), Burnsville, MN; Burnsville 305 Nicollet Medical (Ridgeview South), Burnsville, MN; Eagan 1440 Duckwood Medical, Eagan, MN; Edgewood Vista Belgrade, Belgrade, MT; Edgewood Vista Columbus, Columbus, NE; Edgewood Vista Fargo, Fargo, ND; Edgewood Vista Grand Island, Grand Island, NE; Edgewood Vista Norfolk, Norfolk, NE and 2828 Chicago Avenue, Minneapolis, MN. |
| | Total square footage, 597,265. Occupancy % for the three and twelve months ended April 30, 2009, 92.3% and 94.9%, respectively. |
Commercial Industrial - | Cedar Lake Business Center, St. Louis Park, MN; Urbandale, Urbandale, IA; Woodbury 1865, Woodbury, MN; Eagan 2785 & 2795 Highway 55, Eagan, MN and Minnetonka 13600 County Road 62, Minnetonka, MN. |
| | Total square footage, 916,937. Occupancy % for the three and twelve months ended April 30, 2009, 98.9% and 99.7%, respectively. |
| Discontinued operations from fiscal 2008 include: |
Multi-Family Residential - | 405 Grant Avenue Apartments, Harvey, ND and Sweetwater – Green Acres 1&2 Apartments, Devils Lake, ND. |
| | Total number of units, 60. |
Commercial Office - | Minnetonka Office Building, Minnetonka, MN. |
| | Total square footage, 4,000. |
INVESTORS REAL ESTATE TRUST AND SUBSIDIARIES
NET OPERATING INCOME DETAIL
(in thousands)
| | | Three Months Ended April 30, 2009 | |
| | | Multi-Family Residential | | | Commercial Office | | | Commercial Medical | | | Commercial Industrial | | | Commercial Retail | | | Corporate and Other | | | Total | |
| Real estate rental revenue | | | | | | | | | | | | | | | | | | | | | |
Stabilized(1) | | $ | 18,030 | | | $ | 20,443 | | | $ | 9,638 | | | $ | 2,245 | | | $ | 3,605 | | | $ | 0 | | | $ | 53,961 | |
| Non-Stabilized | | | 1,289 | | | | 682 | | | | 3,755 | | | | 965 | | | | 0 | | | | 0 | | | | 6,691 | |
| Total | | | 19,319 | | | | 21,125 | | | | 13,393 | | | | 3,210 | | | | 3,605 | | | | 0 | | | | 60,652 | |
| | | | | | | | | | | | | | | | | | | | | | | | | | | | | |
| Real estate expenses | | | | | | | | | | | | | | | | | | | | | | | | | | | | |
Stabilized(1) | | | 8,333 | | | | 9,186 | | | | 2,728 | | | | 579 | | | | 1,156 | | | | 0 | | | | 21,982 | |
| Non-Stabilized | | | 768 | | | | 264 | | | | 1,258 | | | | 223 | | | | 0 | | | | 0 | | | | 2,513 | |
| Total | | | 9,101 | | | | 9,450 | | | | 3,986 | | | | 802 | | | | 1,156 | | | | 0 | | | | 24,495 | |
| | | | | | | | | | | | | | | | | | | | | | | | | | | | | |
| Net Operating Income (NOI) | | | | | | | | | | | | | | | | | | | | | | | | | | | | |
Stabilized(1) | | | 9,697 | | | | 11,257 | | | | 6,910 | | | | 1,666 | | | | 2,449 | | | | 0 | | | | 31,979 | |
| Non-Stabilized | | | 521 | | | | 418 | | | | 2,497 | | | | 742 | | | | 0 | | | | 0 | | | | 4,178 | |
| Net operating income | | $ | 10,218 | | | $ | 11,675 | | | $ | 9,407 | | | $ | 2,408 | | | $ | 2,449 | | | $ | 0 | | | $ | 36,157 | |
| | | | | | | | | | | | | | | | | | | | | | | | | | | | | |
| Reconciliation of NOI to net income available to common shareholders | | | | | | | | | | | | | | | | | | | | | | | | | | | | |
| Interest (expense) income | | $ | (5,190 | ) | | $ | (5,933 | ) | | $ | (4,232 | ) | | $ | (1,004 | ) | | $ | (977 | ) | | $ | (100 | ) | | $ | (17,436 | ) |
| Depreciation/amortization | | | (3,690 | ) | | | (5,744 | ) | | | (3,667 | ) | | | (532 | ) | | | (732 | ) | | | (73 | ) | | | (14,438 | ) |
| Administrative, advisory and trustee fees | | | 0 | | | | 0 | | | | 0 | | | | 0 | | | | 0 | | | | (976 | ) | | | (976 | ) |
| Other expenses | | | 0 | | | | 0 | | | | 0 | | | | 0 | | | | 0 | | | | (283 | ) | | | (283 | ) |
| Impairment of real estate investment | | | 0 | | | | (338 | ) | | | 0 | | | | 0 | | | | 0 | | | | 0 | | | | (338 | ) |
| Other income | | | 0 | | | | 0 | | | | 0 | | | | 0 | | | | 0 | | | | 234 | | | | 234 | |
| Income (loss) before gain on sale of other investments and minority interest and discontinued operations | | | 1,338 | | | | (340 | ) | | | 1,508 | | | | 872 | | | | 740 | | | | (1,198 | ) | | | 2,920 | |
| Minority interest portion of operating partnership income | | | 0 | | | | 0 | | | | 0 | | | | 0 | | | | 0 | | | | (596 | ) | | | (596 | ) |
| Minority interest portion of other partnerships’ income | | | 0 | | | | 0 | | | | 0 | | | | 0 | | | | 0 | | | | (57 | ) | | | (57 | ) |
| Income (loss) from continuing operations | | | 1,338 | | | | (340 | ) | | | 1,508 | | | | 872 | | | | 740 | | | | (1,851 | ) | | | 2,267 | |
| NET INCOME (LOSS) | | | 1,338 | | | | (340 | ) | | | 1,508 | | | | 872 | | | | 740 | | | | (1,851 | ) | | | 2,267 | |
| Dividends to preferred shareholders | | | 0 | | | | 0 | | | | 0 | | | | 0 | | | | 0 | | | | (593 | ) | | | (593 | ) |
| NET INCOME (LOSS) AVAILABLE TO COMMON SHAREHOLDERS | | $ | 1,338 | | | $ | (340 | ) | | $ | 1,508 | | | $ | 872 | | | $ | 740 | | | $ | (2,444 | ) | | $ | 1,674 | |
| 1. | For 4th Quarter Fiscal 2009, non-stabilized properties included: |
Multi-Family Residential - | Indian Hills, Sioux City, IA; Cottonwood IV Apartments, Bismarck, ND; Greenfield Apartments, Omaha, NE; Minot 4th Street Apartments, Minot, ND; Minot 11th Street Apartments, Minot, ND; Minot Fairmont Apartments, Minot, ND; Minot Westridge Apartments, Minot, ND; Thomasbrook Apartments, Lincoln, NE; Evergreen Apartments, Isanti, MN; 401 South Main, Minot, ND and IRET Corporate Plaza, Minot, ND. |
| | Total number of units, 692. Occupancy % for the three and twelve months ended April 30, 2009, 87.1% and 88.2%, respectively. |
Commercial Office - | 610 Business Center, Brooklyn Park, MN; Intertech, Fenton, MO; Plymouth 5095, Plymouth, MN; Bismarck 715 E Broadway, Bismarck, ND; 401 South Main, Minot, ND; IRET Corporate Plaza, Minot, ND and 12 South Main Street, Minot, ND. |
| | Total square footage, 246,311. Occupancy % for the three and twelve months ended April 30, 2009, 95.4% and 95.3%, respectively. |
Commercial Medical - | Barry Point, Kansas City, MO; Edgewood Vista Billings, Billings, MT; Edgewood Vista East Grand Forks, East Grand Forks, MN; Edgewood Vista Sioux Falls, Sioux Falls, SD; Edina 6405 France Medical, Edina, MN; Edina 6363 France Medical, Edina, MN; Minneapolis 701 25th Ave Medical (Riverside), Minneapolis, MN; Burnsville 303 Nicollet Medical (Ridgeview), Burnsville, MN; Burnsville 305 Nicollet Medical (Ridgeview South), Burnsville, MN; Eagan 1440 Duckwood Medical, Eagan, MN; Edgewood Vista Belgrade, Belgrade, MT; Edgewood Vista Columbus, Columbus, NE; Edgewood Vista Fargo, Fargo, ND; Edgewood Vista Grand Island, Grand Island, NE; Edgewood Vista Norfolk, Norfolk, NE and 2828 Chicago Avenue, Minneapolis, MN. |
| | Total square footage, 597,265. Occupancy % for the three and twelve months ended April 30, 2009, 92.3% and 94.9%, respectively. |
Commercial Industrial - | Cedar Lake Business Center, St. Louis Park, MN; Urbandale, Urbandale, IA; Woodbury 1865, Woodbury, MN; Eagan 2785 & 2795 Highway 55, Eagan, MN and Minnetonka 13600 County Road 62, Minnetonka, MN. |
| | Total square footage, 916,937. Occupancy % for the three and twelve months ended April 30, 2009, 98.9% and 99.7%, respectively. |
INVESTORS REAL ESTATE TRUST AND SUBSIDIARIES
NET OPERATING INCOME DETAIL
(in thousands)
| | | Three Months Ended April 30, 2008 | |
| | | Multi-Family Residential | | | Commercial Office | | | Commercial Medical | | | Commercial Industrial | | | Commercial Retail | | | Corporate and Other | | | Total | |
| Real estate rental revenue | | | | | | | | | | | | | | | | | | | | | |
Stabilized(1) | | $ | 17,672 | | | $ | 21,877 | | | $ | 9,356 | | | $ | 2,227 | | | $ | 3,655 | | | $ | 0 | | | $ | 54,787 | |
| Non-Stabilized | | | 797 | | | | 339 | | | | 2,292 | | | | 747 | | | | 0 | | | | 0 | | | | 4,175 | |
| Total | | | 18,469 | | | | 22,216 | | | | 11,648 | | | | 2,974 | | | | 3,655 | | | | 0 | | | | 58,962 | |
| | | | | | | | | | | | | | | | | | | | | | | | | | | | | |
| Real estate expenses | | | | | | | | | | | | | | | | | | | | | | | | | | | | |
Stabilized(1) | | | 8,558 | | | | 9,742 | | | | 2,448 | | | | 510 | | | | 1,058 | | | | 0 | | | | 22,316 | |
| Non-Stabilized | | | 505 | | | | 174 | | | | 732 | | | | 184 | | | | 0 | | | | 0 | | | | 1,595 | |
| Total | | | 9,063 | | | | 9,916 | | | | 3,180 | | | | 694 | | | | 1,058 | | | | 0 | | | | 23,911 | |
| | | | | | | | | | | | | | | | | | | | | | | | | | | | | |
| Net Operating Income (NOI) | | | | | | | | | | | | | | | | | | | | | | | | | | | | |
Stabilized(1) | | | 9,114 | | | | 12,135 | | | | 6,908 | | | | 1,717 | | | | 2,597 | | | | 0 | | | | 32,471 | |
| Non-Stabilized | | | 292 | | | | 165 | | | | 1,560 | | | | 563 | | | | 0 | | | | 0 | | | | 2,580 | |
| Net operating income | | $ | 9,406 | | | $ | 12,300 | | | $ | 8,468 | | | $ | 2,280 | | | $ | 2,597 | | | $ | 0 | | | $ | 35,051 | |
| | | | | | | | | | | | | | | | | | | | | | | | | | | | | |
| Reconciliation of NOI to net income available to common shareholders | | | | | | | | | | | | | | | | | | | | | | | | | | | | |
| Interest (expense) income | | $ | (5,024 | ) | | $ | (5,912 | ) | | $ | (3,913 | ) | | $ | (932 | ) | | $ | (1,051 | ) | | $ | 362 | | | $ | (16,470 | ) |
| Depreciation/amortization | | | (3,417 | ) | | | (5,452 | ) | | | (3,158 | ) | | | (1,133 | ) | | | (753 | ) | | | (61 | ) | | | (13,974 | ) |
| Administrative, advisory and trustee fees | | | 0 | | | | 0 | | | | 0 | | | | 0 | | | | 0 | | | | (1,392 | ) | | | (1,392 | ) |
| Other expenses | | | 0 | | | | 0 | | | | 0 | | | | 0 | | | | 0 | | | | (291 | ) | | | (291 | ) |
| Other income | | | 0 | | | | 0 | | | | 0 | | | | 0 | | | | 0 | | | | 671 | | | | 671 | |
| Income (loss) before gain on sale of other investments and minority interest and discontinued operations | | | 965 | | | | 936 | | | | 1,397 | | | | 215 | | | | 793 | | | | (711 | ) | | | 3,595 | |
| Gain on sale of other investments | | | 0 | | | | 0 | | | | 0 | | | | 0 | | | | 0 | | | | 38 | | | | 38 | |
| Minority interest portion of operating partnership income | | | 0 | | | | 0 | | | | 0 | | | | 0 | | | | 0 | | | | (833 | ) | | | (833 | ) |
| Minority interest portion of other partnerships’ loss | | | 0 | | | | 0 | | | | 0 | | | | 0 | | | | 0 | | | | 111 | | | | 111 | |
| Income (loss) from continuing operations | | | 965 | | | | 936 | | | | 1,397 | | | | 215 | | | | 793 | | | | (1,395 | ) | | | 2,911 | |
Discontinued operations, net of minority interest(2) | | | 374 | | | | 3 | | | | 0 | | | | 0 | | | | 0 | | | | 0 | | | | 377 | |
| NET INCOME (LOSS) | | | 1,339 | | | | 939 | | | | 1,397 | | | | 215 | | | | 793 | | | | (1,395 | ) | | | 3,288 | |
| Dividends to preferred shareholders | | | 0 | | | | 0 | | | | 0 | | | | 0 | | | | 0 | | | | (593 | ) | | | (593 | ) |
| NET INCOME (LOSS) AVAILABLE TO COMMON SHAREHOLDERS | | $ | 1,339 | | | $ | 939 | | | $ | 1,397 | | | $ | 215 | | | $ | 793 | | | $ | (1,988 | ) | | $ | 2,695 | |
| 1. | For 4th Quarter Fiscal 2008, non-stabilized properties included: |
Multi-Family Residential - | Indian Hills, Sioux City, IA; Cottonwood IV Apartments, Bismarck, ND and Greenfield Apartments, Omaha, NE. |
| | Total number of units, 283. Occupancy % for the three and twelve months ended April 30, 2009, 72.5% and 77.2%, respectively. |
Commercial Office - | 610 Business Center, Brooklyn Park, MN; Intertech, Fenton, MO; Plymouth 5095, Plymouth, MN and 401 South Main, Minot, ND. |
| | Total square footage, 172,138. Occupancy % for the three and twelve months ended April 30, 2009, 90.0% and 87.5%, respectively. |
Commercial Medical - | Barry Point, Kansas City, MO; Edgewood Vista Billings, Billings, MT; Edgewood Vista East Grand Forks, East Grand Forks, MN; Edgewood Vista Sioux Falls, Sioux Falls, SD; Edina 6405 France Medical, Edina, MN; Edina 6363 France Medical, Edina, MN; Minneapolis 701 25th Ave Medical (Riverside), Minneapolis, MN; Burnsville 303 Nicollet Medical (Ridgeview), Burnsville, MN; Burnsville 305 Nicollet Medical (Ridgeview South), Burnsville, MN; Eagan 1440 Duckwood Medical, Eagan, MN; Edgewood Vista Belgrade, Belgrade, MT; Edgewood Vista Columbus, Columbus, NE; Edgewood Vista Fargo, Fargo, ND; Edgewood Vista Grand Island, Grand Island, NE and Edgewood Vista Norfolk, Norfolk, NE. |
| | Total square footage, 541,026. Occupancy % for the three and twelve months ended April 30, 2009, 99.8% and 99.9%, respectively. |
Commercial Industrial - | Cedar Lake Business Center, St. Louis Park, MN; Urbandale, Urbandale, IA; Woodbury 1865, Woodbury, MN and Eagan 2785 & 2795 Highway 55, Eagan, MN. |
| | Total square footage, 846,953. Occupancy % for the three and twelve months ended April 30, 2009, 97.6% and 93.9%, respectively. |
| 2. | Discontinued operations from fiscal 2008 include: |
Multi-Family Residential - | 405 Grant Avenue Apartments, Harvey, ND and Sweetwater – Green Acres 1&2 Apartments, Devils Lake, ND. |
| | Total number of units, 60. |
Commercial Office - | Minnetonka Office Building, Minnetonka, MN. |
| | Total square footage, 4,000. |
INVESTORS REAL ESTATE TRUST AND SUBSIDIARIES
NET OPERATING INCOME DETAIL
(in thousands)
| | | Twelve Months Ended April 30, 2009 | |
| | | Multi-Family Residential | | | Commercial Office | | | Commercial Medical | | | Commercial Industrial | | | Commercial Retail | | | Corporate and Other | | | Total | |
| Real estate rental revenue | | | | | | | | | | | | | | | | | | | | | |
Stabilized(1) | | $ | 72,255 | | | $ | 80,745 | | | $ | 37,794 | | | $ | 9,062 | | | $ | 14,568 | | | $ | 0 | | | $ | 214,424 | |
| Non-Stabilized | | | 4,461 | | | | 2,701 | | | | 14,770 | | | | 3,649 | | | | 0 | | | | 0 | | | | 25,581 | |
| Total | | | 76,716 | | | | 83,446 | | | | 52,564 | | | | 12,711 | | | | 14,568 | | | | 0 | | | | 240,005 | |
| | | | | | | | | | | | | | | | | | | | | | | | | | | | | |
| Real estate expenses | | | | | | | | | | | | | | | | | | | | | | | | | | | | |
Stabilized(1) | | | 33,611 | | | | 36,776 | | | | 11,062 | | | | 2,180 | | | | 5,077 | | | | 0 | | | | 88,706 | |
| Non-Stabilized | | | 2,551 | | | | 868 | | | | 4,984 | | | | 1,042 | | | | 0 | | | | 0 | | | | 9,445 | |
| Total | | | 36,162 | | | | 37,644 | | | | 16,046 | | | | 3,222 | | | | 5,077 | | | | 0 | | | | 98,151 | |
| | | | | | | | | | | | | | | | | | | | | | | | | | | | | |
| Net Operating Income (NOI) | | | | | | | | | | | | | | | | | | | | | | | | | | | | |
Stabilized(1) | | | 38,644 | | | | 43,969 | | | | 26,732 | | | | 6,882 | | | | 9,491 | | | | 0 | | | | 125,718 | |
| Non-Stabilized | | | 1,910 | | | | 1,833 | | | | 9,786 | | | | 2,607 | | | | 0 | | | | 0 | | | | 16,136 | |
| Net operating income | | $ | 40,554 | | | $ | 45,802 | | | $ | 36,518 | | | $ | 9,489 | | | $ | 9,491 | | | $ | 0 | | | $ | 141,854 | |
| | | | | | | | | | | | | | | | | | | | | | | | | | | | | |
| Reconciliation of NOI to net income available to common shareholders | | | | | | | | | | | | | | | | | | | | | | | | | | | | |
| Interest (expense) income | | $ | (20,304 | ) | | $ | (23,970 | ) | | $ | (17,186 | ) | | $ | (3,909 | ) | | $ | (4,038 | ) | | $ | 664 | | | $ | (68,743 | ) |
| Depreciation/amortization | | | (14,225 | ) | | | (22,371 | ) | | | (13,363 | ) | | | (3,600 | ) | | | (2,902 | ) | | | (253 | ) | | | (56,714 | ) |
| Administrative, advisory and trustee fees | | | 0 | | | | 0 | | | | 0 | | | | 0 | | | | 0 | | | | (4,882 | ) | | | (4,882 | ) |
| Other expenses | | | 0 | | | | 0 | | | | 0 | | | | 0 | | | | 0 | | | | (1,440 | ) | | | (1,440 | ) |
| Loss on impairment of real estate investment | | | 0 | | | | (338 | ) | | | 0 | | | | 0 | | | | 0 | | | | 0 | | | | (338 | ) |
| Other income | | | 0 | | | | 0 | | | | 0 | | | | 0 | | | | 0 | | | | 922 | | | | 922 | |
| Income (loss) before gain on sale of other investments and minority interest and discontinued operations | | | 6,025 | | | | (877 | ) | | | 5,969 | | | | 1,980 | | | | 2,551 | | | | (4,989 | ) | | | 10,659 | |
| Gain on sale of other investments | | | 0 | | | | 0 | | | | 0 | | | | 0 | | | | 0 | | | | 54 | | | | 54 | |
| Minority interest portion of operating partnership income | | | 0 | | | | 0 | | | | 0 | | | | 0 | | | | 0 | | | | (2,227 | ) | | | (2,227 | ) |
| Minority interest portion of other partnerships’ loss | | | 0 | | | | 0 | | | | 0 | | | | 0 | | | | 0 | | | | 40 | | | | 40 | |
| Income (loss) from continuing operations | | | 6,025 | | | | (877 | ) | | | 5,969 | | | | 1,980 | | | | 2,551 | | | | (7,122 | ) | | | 8,526 | |
| NET INCOME (LOSS) | | | 6,025 | | | | (877 | ) | | | 5,969 | | | | 1,980 | | | | 2,551 | | | | (7,122 | ) | | | 8,526 | |
| Dividends to preferred shareholders | | | 0 | | | | 0 | | | | 0 | | | | 0 | | | | 0 | | | | (2,372 | ) | | | (2,372 | ) |
| NET INCOME (LOSS) AVAILABLE TO COMMON SHAREHOLDERS | | $ | 6,025 | | | | (877 | ) | | | 5,969 | | | | 1,980 | | | | 2,551 | | | $ | (9,494 | ) | | $ | 6,154 | |
| 1. | For 4th Quarter Fiscal 2009, non-stabilized properties included: |
Multi-Family Residential - | Indian Hills, Sioux City, IA; Cottonwood IV Apartments, Bismarck, ND; Greenfield Apartments, Omaha, NE; Minot 4th Street Apartments, Minot, ND; Minot 11th Street Apartments, Minot, ND; Minot Fairmont Apartments, Minot, ND; Minot Westridge Apartments, Minot, ND; Thomasbrook Apartments, Lincoln, NE; Evergreen Apartments, Isanti, MN; 401 South Main, Minot, ND and IRET Corporate Plaza, Minot, ND. |
| | Total number of units, 692. Occupancy % for the three and twelve months ended April 30, 2009, 87.1% and 88.2%, respectively. |
Commercial Office - | 610 Business Center, Brooklyn Park, MN; Intertech, Fenton, MO; Plymouth 5095, Plymouth, MN; Bismarck 715 E Broadway, Bismarck, ND; 401 South Main, Minot, ND, IRET Corporate Plaza, Minot, ND and 12 South Main Street, Minot, ND. |
| | Total square footage, 246,311. Occupancy % for the three and twelve months ended April 30, 2009, 95.4% and 95.3%, respectively. |
Commercial Medical - | Barry Point, Kansas City, MO; Edgewood Vista Billings, Billings, MT; Edgewood Vista East Grand Forks, East Grand Forks, MN; Edgewood Vista Sioux Falls, Sioux Falls, SD; Edina 6405 France Medical, Edina, MN; Edina 6363 France Medical, Edina, MN; Minneapolis 701 25th Ave Medical (Riverside), Minneapolis, MN; Burnsville 303 Nicollet Medical (Ridgeview), Burnsville, MN; Burnsville 305 Nicollet Medical (Ridgeview South), Burnsville, MN; Eagan 1440 Duckwood Medical, Eagan, MN; Edgewood Vista Belgrade, Belgrade, MT; Edgewood Vista Columbus, Columbus, NE; Edgewood Vista Fargo, Fargo, ND; Edgewood Vista Grand Island, Grand Island, NE; Edgewood Vista Norfolk, Norfolk, NE and 2828 Chicago Avenue, Minneapolis, MN. |
| | Total square footage, 597,265. Occupancy % for the three and twelve months ended April 30, 2009, 92.3% and 94.9%, respectively. |
Commercial Industrial - | Cedar Lake Business Center, St. Louis Park, MN; Urbandale, Urbandale, IA; Woodbury 1865, Woodbury, MN; Eagan 2785 & 2795 Highway 55, Eagan, MN and Minnetonka 13600 County Road 62, Minnetonka, MN. |
| | Total square footage, 916,937. Occupancy % for the three and twelve months ended April 30, 2009, 98.9% and 99.7%, respectively. |
INVESTORS REAL ESTATE TRUST AND SUBSIDIARIES
NET OPERATING INCOME DETAIL
(in thousands)
| | | Twelve Months Ended April 30, 2008 | |
| | | Multi-Family Residential | | | Commercial Office | | | Commercial Medical | | | Commercial Industrial | | | Commercial Retail | | | Corporate and Other | | | Total | |
| Real estate rental revenue | | | | | | | | | | | | | | | | | | | | | |
Stabilized(1) | | $ | 70,211 | | | $ | 83,470 | | | $ | 35,740 | | | $ | 9,493 | | | $ | 14,198 | | | $ | 0 | | | $ | 213,112 | |
| Non-Stabilized | | | 2,616 | | | | 572 | | | | 2,672 | | | | 2,198 | | | | 0 | | | | 0 | | | | 8,058 | |
| Total | | | 72,827 | | | | 84,042 | | | | 38,412 | | | | 11,691 | | | | 14,198 | | | | 0 | | | | 221,170 | |
| | | | | | | | | | | | | | | | | | | | | | | | | | | | | |
| Real estate expenses | | | | | | | | | | | | | | | | | | | | | | | | | | | | |
Stabilized(1) | | | 32,879 | | | | 35,934 | | | | 8,831 | | | | 1,917 | | | | 4,277 | | | | 0 | | | | 83,838 | |
| Non-Stabilized | | | 1,758 | | | | 272 | | | | 925 | | | | 612 | | | | 0 | | | | 0 | | | | 3,567 | |
| Total | | | 34,637 | | | | 36,206 | | | | 9,756 | | | | 2,529 | | | | 4,277 | | | | 0 | | | | 87,405 | |
| | | | | | | | | | | | | | | | | | | | | | | | | | | | | |
| Net Operating Income (NOI) | | | | | | | | | | | | | | | | | | | | | | | | | | | | |
Stabilized(1) | | | 37,332 | | | | 47,536 | | | | 26,909 | | | | 7,576 | | | | 9,921 | | | | 0 | | | | 129,274 | |
| Non-Stabilized | | | 858 | | | | 300 | | | | 1,747 | | | | 1,586 | | | | 0 | | | | 0 | | | | 4,491 | |
| Net operating income | | $ | 38,190 | | | $ | 47,836 | | | $ | 28,656 | | | $ | 9,162 | | | $ | 9,921 | | | $ | 0 | | | $ | 133,765 | |
| | | | | | | | | | | | | | | | | | | | | | | | | | | | | |
| Reconciliation of NOI to net income available to common shareholders | | | | | | | | | | | | | | | | | | | | | | | | | | | | |
| Interest (expense) income | | $ | (20,004 | ) | | $ | (23,459 | ) | | $ | (12,651 | ) | | $ | (3,543 | ) | | $ | (4,260 | ) | | $ | 478 | | | $ | (63,439 | ) |
| Depreciation/amortization | | | (13,231 | ) | | | (21,003 | ) | | | (9,416 | ) | | | (3,405 | ) | | | (2,725 | ) | | | (1,738 | ) | | | (51,518 | ) |
| Administrative, advisory and trustee fees | | | 0 | | | | 0 | | | | 0 | | | | 0 | | | | 0 | | | | (5,203 | ) | | | (5,203 | ) |
| Other expenses | | | 0 | | | | 0 | | | | 0 | | | | 0 | | | | 0 | | | | (1,344 | ) | | | (1,344 | ) |
| Other income | | | 0 | | | | 0 | | | | 0 | | | | 0 | | | | 0 | | | | 2,760 | | | | 2,760 | |
| Income (loss) before gain on sale of other investments and minority interest and discontinued operations | | | 4,955 | | | | 3,374 | | | | 6,589 | | | | 2,214 | | | | 2,936 | | | | (5,047 | ) | | | 15,021 | |
| Gain on sale of other investments | | | 0 | | | | 0 | | | | 0 | | | | 0 | | | | 0 | | | | 42 | | | | 42 | |
| Minority interest portion of operating partnership income | | | 0 | | | | 0 | | | | 0 | | | | 0 | | | | 0 | | | | (3,524 | ) | | | (3,524 | ) |
| Minority interest portion of other partnerships’ loss | | | 0 | | | | 0 | | | | 0 | | | | 0 | | | | 0 | | | | 136 | | | | 136 | |
| Income (loss) from continuing operations | | | 4,955 | | | | 3,374 | | | | 6,589 | | | | 2,214 | | | | 2,936 | | | | (8,393 | ) | | | 11,675 | |
Discontinued operations, net of minority interest(2) | | | 415 | | | | (2 | ) | | | 0 | | | | 0 | | | | 0 | | | | 0 | | | | 413 | |
| NET INCOME (LOSS) | | | 5,370 | | | | 3,372 | | | | 6,589 | | | | 2,214 | | | | 2,936 | | | | (8,393 | ) | | | 12,088 | |
| Dividends to preferred shareholders | | | 0 | | | | 0 | | | | 0 | | | | 0 | | | | 0 | | | | (2,372 | ) | | | (2,372 | ) |
| NET INCOME (LOSS) AVAILABLE TO COMMON SHAREHOLDERS | | $ | 5,370 | | | $ | 3,372 | | | $ | 6,589 | | | $ | 2,214 | | | $ | 2,936 | | | $ | (10,765 | ) | | $ | 9,716 | |
| 1. | For 4th Quarter Fiscal 2008, non-stabilized properties included: |
Multi-Family Residential - | Indian Hills, Sioux City, IA; Cottonwood IV Apartments, Bismarck, ND and Greenfield Apartments, Omaha, NE. |
| | Total number of units, 283. Occupancy % for the three and twelve months ended April 30, 2009, 72.5% and 77.2%, respectively. |
Commercial Office - | 610 Business Center, Brooklyn Park, MN; Intertech, Fenton, MO; Plymouth 5095, Plymouth, MN and 401 South Main, Minot, ND. |
| | Total square footage, 172,138. Occupancy % for the three and twelve months ended April 30, 2009, 90.0% and 87.5%, respectively. |
Commercial Medical - | Barry Point, Kansas City, MO; Edgewood Vista Billings, Billings, MT; Edgewood Vista East Grand Forks, East Grand Forks, MN; Edgewood Vista Sioux Falls, Sioux Falls, SD; Edina 6405 France Medical, Edina, MN; Edina 6363 France Medical, Edina, MN; Minneapolis 701 25th Ave Medical (Riverside), Minneapolis, MN; Burnsville 303 Nicollet Medical (Ridgeview), Burnsville, MN; Burnsville 305 Nicollet Medical (Ridgeview South), Burnsville, MN; Eagan 1440 Duckwood Medical, Eagan, MN; Edgewood Vista Belgrade, Belgrade, MT; Edgewood Vista Columbus, Columbus, NE; Edgewood Vista Fargo, Fargo, ND; Edgewood Vista Grand Island, Grand Island, NE and Edgewood Vista Norfolk, Norfolk, NE. |
| | Total square footage, 541,026. Occupancy % for the three and twelve months ended April 30, 2009, 99.8% and 99.9%, respectively. |
Commercial Industrial - | Cedar Lake Business Center, St. Louis Park, MN; Urbandale, Urbandale, IA; Woodbury 1865, Woodbury, MN and Eagan 2785 & 2795 Highway 55, Eagan, MN. |
| | Total square footage, 846,953. Occupancy % for the three and twelve months ended April 30, 2009, 97.6% and 93.9%, respectively. |
| 2. | Discontinued operations from fiscal 2008 include: |
Multi-Family Residential - | 405 Grant Avenue Apartments, Harvey, ND and Sweetwater – Green Acres 1&2 Apartments, Devils Lake, ND. |
| | Total number of units, 60. |
Commercial Office - | Minnetonka Office Building, Minnetonka, MN. |
| | Total square footage, 4,000. |
INVESTORS REAL ESTATE TRUST AND SUBSIDIARIES
STABILIZED PROPERTIES AND OVERALL ECONOMIC OCCUPANCY LEVELS BY SEGMENT
4th Quarter Fiscal 2009 vs. 4th Quarter Fiscal 2008
| Segments | | Stabilized Properties | | | All Properties | |
| | | 4th Quarter | | | 4th Quarter | | | 4th Quarter | | | 4th Quarter | |
| | | Fiscal 2009 | | | Fiscal 2008 | | | Fiscal 2009 | | | Fiscal 2008 | |
| Multi-Family Residential | | | 93.1 | % | | | 93.2 | % | | | 92.7 | % | | | 92.1 | % |
| Commercial Office | | | 89.4 | % | | | 90.9 | % | | | 89.7 | % | | | 90.8 | % |
| Commercial Medical | | | 96.9 | % | | | 95.3 | % | | | 95.7 | % | | | 96.1 | % |
| Commercial Industrial | | | 98.0 | % | | | 95.5 | % | | | 98.2 | % | | | 95.9 | % |
| Commercial Retail | | | 85.5 | % | | | 88.2 | % | | | 85.5 | % | | | 88.2 | % |
INVESTORS REAL ESTATE TRUST AND SUBSIDIARIES
COMMERCIAL LEASING SUMMARY
for the three months and twelve months ended April 30, 2009
| | | Three Months Ended April 30, 2009 | | | Twelve Months Ended April 30, 2009 | |
| | | New(1) | | | Renew(2) | | | 4th Quarter 2008 Total | | | New(1) | | | Renew(2) | | | Year-To-Date Total | |
| Gross Leasing Square Footage | | | | | | | | | | | | | | | | | | |
| Commercial Office | | | 12,744 | | | | 81,744 | | | | 94,488 | | | | 181,170 | | | | 431,996 | | | | 613,166 | |
| Commercial Medical | | | 2,672 | | | | 12,932 | | | | 15,604 | | | | 40,515 | | | | 41,281 | | | | 81,796 | |
| Commercial Industrial | | | 41,685 | | | | 203,810 | | | | 245,495 | | | | 353,371 | | | | 345,037 | | | | 698,408 | |
| Commercial Retail | | | 4,120 | | | | 34,100 | | | | 38,220 | | | | 79,354 | | | | 180,872 | | | | 260,226 | |
| Total | | | 61,221 | | | | 332,586 | | | | 393,807 | | | | 654,410 | | | | 999,186 | | | | 1,653,596 | |
| | | | | | | | | | | | | | | | | | | | | | | | | |
| Weighted Average Term (yrs) | | | | | | | | | | | | | | | | | | | | | | | | |
| Commercial Office | | | 3.6 | | | | 4.8 | | | | 4.5 | | | | 4.7 | | | | 3.8 | | | | 4.1 | |
| Commercial Medical | | | 10.4 | | | | 2.6 | | | | 3.9 | | | | 7.0 | | | | 4.4 | | | | 5.2 | |
| Commercial Industrial | | | 5.2 | | | | 3.1 | | | | 3.8 | | | | 4.8 | | | | 5.2 | | | | 5.0 | |
| Commercial Retail | | | 5.4 | | | | 3.3 | | | | 3.4 | | | | 5.1 | | | | 3.4 | | | | 3.9 | |
| Total | | | 5.6 | | | | 3.5 | | | | 3.9 | | | | 5.2 | | | | 3.8 | | | | 4.2 | |
| | | | | | | | | | | | | | | | | | | | | | | | | |
Weighted Average Rental Rate Increases(3) | | | | | | | | | | | | | | | | | | | | | | | | |
| Rate on Expiring Leases | | | | | | | | | | | | | | | | | | | | | | | | |
| Commercial Office | | | | | | | | | | $ | 12.16 | | | | | | | | | | | $ | 11.75 | |
| Commercial Medical | | | | | | | | | | | 0.00 | | | | | | | | | | | | 18.61 | |
| Commercial Industrial | | | | | | | | | | | 0.00 | | | | | | | | | | | | 2.88 | |
| Commercial Retail | | | | | | | | | | | 11.74 | | | | | | | | | | | | 5.42 | |
| Total | | | | | | | | | | $ | 12.07 | | | | | | | | | | | $ | 9.80 | |
| | | | | | | | | | | | | | | | | | | | | | | | | |
Weighted Average Rate on New and Renewal Leases(3) | | | | | | | | | | | | | | | | | | | | | | | | |
| Commercial Office | | $ | 2.04 | | | $ | 13.28 | | | $ | 12.02 | | | $ | 10.10 | | | $ | 10.32 | | | $ | 10.26 | |
| Commercial Medical | | | 19.67 | | | | 18.85 | | | | 18.99 | | | | 25.20 | | | | 17.53 | | | | 21.33 | |
| Commercial Industrial | | | 2.26 | | | | 2.87 | | | | 2.76 | | | | 3.62 | | | | 3.69 | | | | 3.65 | |
| Commercial Retail | | | 8.54 | | | | 11.76 | | | | 11.42 | | | | 13.04 | | | | 8.39 | | | | 9.81 | |
| Total | | $ | 3.80 | | | $ | 6.96 | | | $ | 6.47 | | | $ | 7.89 | | | $ | 7.98 | | | $ | 7.94 | |
| | | | | | | | | | | | | | | | | | | | | | | | | |
| Percentage Increase (Decrease) | | | | | | | | | | | | | | | | | | | | | | | | |
| Commercial Office | | | | | | | | | | | (1.2 | %) | | | | | | | | | | | (12.7 | %) |
| Commercial Medical | | | | | | | | | | | N/A | | | | | | | | | | | | 14.6 | % |
| Commercial Industrial | | | | | | | | | | | N/A | | | | | | | | | | | | 26.7 | % |
| Commercial Retail | | | | | | | | | | | (2.7 | %) | | | | | | | | | | | 81.0 | % |
| Total | | | | | | | | | | | (46.4 | %) | | | | | | | | | | | (19.0 | %) |
| (1) | Excluding leases in place on date of acquisition. |
| (2) | Renewing leases are not necessarily leases expiring in that period. Expansion footage for renewing tenants is included in this column. |
| (3) | Net of estimated operating expenses, other than tenant improvements. |
INVESTORS REAL ESTATE TRUST AND SUBSIDIARIES
COMMERCIAL LEASING SUMMARY
for the three months and twelve months ended April 30, 2009
| | | 4th Quarter 2009 Total | | | Year-To-Date Total | |
| | | New | | | Renew | | | Total Dollars | | | New | | | Renew | | | Total Dollars | |
| Tenant Improvements | | | | | | | | | | | | | | | | | | |
| Commercial Office | | $ | 15,686 | | | $ | 354,529 | | | $ | 370,215 | | | $ | 1,500,075 | | | $ | 2,547,132 | | | $ | 4,047,207 | |
| Commercial Medical | | | 93,520 | | | | 0 | | | | 93,520 | | | | 2,407,865 | | | | 276,301 | | | | 2,684,166 | |
| Commercial Industrial | | | 41,685 | | | | 5,000 | | | | 46,685 | | | | 191,685 | | | | 807,583 | | | | 999,268 | |
| Commercial Retail | | | 83,173 | | | | 9,561 | | | | 92,734 | | | | 533,523 | | | | 102,930 | | | | 636,453 | |
| Subtotal | | $ | 234,064 | | | $ | 369,090 | | | $ | 603,154 | | | $ | 4,633,148 | | | $ | 3,733,946 | | | $ | 8,367,094 | |
| | | | | | | | | | | | | | | | | | | | | | | | | |
| Tenant Improvements per square foot | | | | | | | | | | | | | | | | | | | | | | | | |
| Commercial Office | | $ | 1.23 | | | $ | 4.34 | | | $ | 3.92 | | | $ | 8.28 | | | $ | 5.90 | | | $ | 6.60 | |
| Commercial Medical | | | 35.00 | | | | 0.00 | | | | 5.99 | | | | 59.43 | | | | 6.69 | | | | 32.82 | |
| Commercial Industrial | | | 1.00 | | | | 0.02 | | | | 0.19 | | | | 0.54 | | | | 2.34 | | | | 1.43 | |
| Commercial Retail | | | 20.19 | | | | 0.28 | | | | 2.43 | | | | 6.72 | | | | 0.57 | | | | 2.45 | |
| Subtotal | | $ | 3.82 | | | $ | 1.11 | | | $ | 1.53 | | | $ | 7.08 | | | $ | 3.74 | | | $ | 5.06 | |
| | | | | | | | | | | | | | | | | | | | | | | | | |
| Leasing Costs | | | | | | | | | | | | | | | | | | | | | | | | |
| Commercial Office | | $ | 17,380 | | | $ | 190,711 | | | $ | 208,091 | | | $ | 561,712 | | | $ | 1,196,222 | | | $ | 1,757,934 | |
| Commercial Medical | | | 47,150 | | | | 15,871 | | | | 63,021 | | | | 659,631 | | | | 103,380 | | | | 763,011 | |
| Commercial Industrial | | | 36,843 | | | | 20,484 | | | | 57,327 | | | | 43,993 | | | | 144,509 | | | | 188,502 | |
| Commercial Retail | | | 38,024 | | | | 26,639 | | | | 64,663 | | | | 82,671 | | | | 73,884 | | | | 156,555 | |
| Subtotal | | $ | 139,397 | | | $ | 253,705 | | | $ | 393,102 | | | $ | 1,348,007 | | | $ | 1,517,995 | | | $ | 2,866,002 | |
| | | | | | | | | | | | | | | | | | | | | | | | | |
| Leasing Costs per square foot | | | | | | | | | | | | | | | | | | | | | | | | |
| Commercial Office | | $ | 1.36 | | | $ | 2.33 | | | $ | 2.20 | | | $ | 3.10 | | | $ | 2.77 | | | $ | 2.87 | |
| Commercial Medical | | | 17.65 | | | | 1.23 | | | | 4.04 | | | | 16.28 | | | | 2.50 | | | | 9.33 | |
| Commercial Industrial | | | 0.88 | | | | 0.10 | | | | 0.23 | | | | 0.12 | | | | 0.42 | | | | 0.27 | |
| Commercial Retail | | | 9.23 | | | | 0.78 | | | | 1.69 | | | | 1.04 | | | | 0.41 | | | | 0.60 | |
| Subtotal | | $ | 2.28 | | | $ | 0.76 | | | $ | 1.00 | | | $ | 2.06 | | | $ | 1.52 | | | $ | 1.73 | |
| | | | | | | | | | | | | | | | | | | | | | | | | |
| Tenant Improvements and Leasing Costs | | | | | | | | | | | | | | | | | | | | | | | | |
| Commercial Office | | $ | 33,066 | | | $ | 545,240 | | | $ | 578,306 | | | $ | 2,061,787 | | | $ | 3,743,354 | | | $ | 5,805,141 | |
| Commercial Medical | | | 140,670 | | | | 15,871 | | | | 156,541 | | | | 3,067,496 | | | | 379,681 | | | | 3,447,177 | |
| Commercial Industrial | | | 78,528 | | | | 25,484 | | | | 104,012 | | | | 235,678 | | | | 952,092 | | | | 1,187,770 | |
| Commercial Retail | | | 121,197 | | | | 36,200 | | | | 157,397 | | | | 616,194 | | | | 176,814 | | | | 793,008 | |
| Total | | $ | 373,461 | | | $ | 622,795 | | | $ | 996,256 | | | $ | 5,981,155 | | | $ | 5,251,941 | | | $ | 11,233,096 | |
| | | | | | | | | | | | | | | | | | | | | | | | | |
| Tenant Improvements and Leasing Costs per square foot | | | | | | | | | | | | | | | | | | | | | | | | |
| Commercial Office | | $ | 2.59 | | | $ | 6.67 | | | $ | 6.12 | | | $ | 11.38 | | | $ | 8.67 | | | $ | 9.47 | |
| Commercial Medical | | | 52.65 | | | | 1.23 | | | | 10.03 | | | | 75.71 | | | | 9.20 | | | | 42.14 | |
| Commercial Industrial | | | 1.88 | | | | 0.13 | | | | 0.42 | | | | 0.66 | | | | 2.76 | | | | 1.70 | |
| Commercial Retail | | | 29.42 | | | | 1.06 | | | | 4.12 | | | | 7.77 | | | | 0.98 | | | | 3.05 | |
| Total | | $ | 6.10 | | | $ | 1.87 | | | $ | 2.53 | | | $ | 9.14 | | | $ | 5.26 | | | $ | 6.79 | |
INVESTORS REAL ESTATE TRUST AND SUBSIDIARIES
MULTI-FAMILY RESIDENTIAL SUMMARY
| | | Three Months Ended | |
| | | 04/30/2009 | | | 01/31/2009 | | | 10/31/2008 | | | 07/31/2008 | | | 04/30/2008 | |
| Number of Units | | | 9,645 | | | | 9,645 | | | | 9,564 | | | | 9,528 | | | | 9,500 | |
| Average Investment Per Unit | | $ | 56,130 | | | $ | 55,082 | | | $ | 54,303 | | | $ | 53,919 | | | $ | 53,677 | |
| | | | | | | | | | | | | | | | | | | | | |
| Average Scheduled Rent per Unit | | | | | | | | | | | | | | | | | | | | |
| Stabilized | | $ | 711.22 | | | $ | 708.32 | | | $ | 705.53 | | | $ | 700.43 | | | $ | 695.01 | |
| Non-Stabilized | | | 703.02 | | | | 655.12 | | | | 648.90 | | | | 647.89 | | | | 657.55 | |
| | | $ | 710.63 | | | $ | 704.75 | | | $ | 701.98 | | | $ | 697.18 | | | $ | 692.85 | |
| | | | | | | | | | | | | | | | | | | | | |
| Total Receipts per Unit | | | | | | | | | | | | | | | | | | | | |
| Stabilized | | $ | 671.29 | | | $ | 679.54 | | | $ | 682.32 | | | $ | 657.09 | | | $ | 658.05 | |
| Non-Stabilized | | | 620.95 | | | | 590.39 | | | | 598.48 | | | | 536.68 | | | | 484.14 | |
| | | $ | 667.67 | | | $ | 673.55 | | | $ | 677.06 | | | $ | 649.63 | | | $ | 648.03 | |
| Occupancy % | | | | | | | | | | | | | | | | | | | | |
| Stabilized | | | 93.1 | % | | | 94.5 | % | | | 95.1 | % | | | 92.8 | % | | | 93.2 | % |
| Non-Stabilized | | | 87.1 | % | | | 88.9 | % | | | 92.6 | % | | | 84.1 | % | | | 72.4 | % |
| | | | 92.7 | % | | | 94.2 | % | | | 94.9 | % | | | 92.3 | % | | | 92.1 | % |
| | | | | | | | | | | | | | | | | | | | | |
| Operating Expenses as a % of Scheduled Rent | | | | | | | | | | | | | | | | | | | | |
| Stabilized | | | 43.6 | % | | | 45.9 | % | | | 44.2 | % | | | 43.5 | % | | | 45.9 | % |
| Non-Stabilized | | | 52.6 | % | | | 53.4 | % | | | 47.9 | % | | | 47.5 | % | | | 46.7 | % |
| Total | | | 44.3 | % | | | 46.4 | % | | | 44.4 | % | | | 43.7 | % | | | 45.9 | % |
INVESTORS REAL ESTATE TRUST AND SUBSIDIARIES
10 LARGEST COMMERCIAL TENANTS – BASED ON ANNUALIZED BASE RENT(1)
as of April 30, 2009
| Tenant | | Number of Properties | | | Average Remaining Lease Term in Months | | | % of Total Commercial Segments’ Minimum Rents | | | Aggregate Rentable Square Feet | | | % of Aggregate Occupied Square Feet | |
| Affiliates of Edgewood Vista | | | 19 | | | | 238 | | | | 9.9 | % | | | 909,591 | | | | 8.5 | % |
| St. Lukes Hospital of Duluth, Inc. | | | 6 | | | | 75 | | | | 3.5 | % | | | 198,775 | | | | 1.9 | % |
| Fairview Health | | | 8 | | | | 45 | | | | 2.4 | % | | | 171,848 | | | | 1.6 | % |
| Applied Underwriters | | | 3 | | | | 94 | | | | 2.2 | % | | | 141,724 | | | | 1.3 | % |
| Best Buy Co., Inc. (NYSE: BBY) | | | 2 | | | | 19 | | | | 2.0 | % | | | 224,650 | | | | 2.1 | % |
| HealthEast Care System | | | 1 | | | | 118 | | | | 1.7 | % | | | 114,316 | | | | 1.1 | % |
| UGS Corp. | | | 1 | | | | 28 | | | | 1.6 | % | | | 122,567 | | | | 1.1 | % |
| Microsoft (NASDAQ: MSFT) | | | 1 | | | | 52 | | | | 1.5 | % | | | 122,040 | | | | 1.1 | % |
Smurfit - Stone Container (NASDAQ: SSCC)(2) | | | 2 | | | | 50 | | | | 1.5 | % | | | 424,147 | | | | 4.0 | % |
| Arcadis Corporate Services (NASDAQ: ARCAF) | | | 2 | | | | 27 | | | | 1.4 | % | | | 82,725 | | | | 0.8 | % |
| Total/Weighted Average | | | | | | | 105 | | | | 27.7 | % | | | 2,512,383 | | | | 23.5 | % |
| (1) | See Definitions on page 26. |
| (2) | Smurfit-Stone Container has filed bankruptcy under Chapter 11 of the Bankruptcy Code. To date Smurfit is current on all base rent payments under its leases with us. We have not yet been notified of the debtor’s intentions with respect to these leases. |
INVESTORS REAL ESTATE TRUST AND SUBSIDIARIES
LEASE EXPIRATIONS
as of April 30, 2009
| Fiscal Year | | Number of Leases | | | Rentable Square Feet | | | % of Rentable Square Feet | | | Annualized Rent * | | | Average Rental Rate | | | % of Annualized Rent | |
| Commercial Office | | | | | | | | | | | | | | | | | | |
| 2010 | | | 67 | | | | 390,316 | | | | 9.4 | % | | $ | 4,452,277 | | | $ | 11.41 | | | | 8.3 | % |
| 2011 | | | 67 | | | | 711,983 | | | | 17.1 | % | | | 9,364,376 | | | | 13.15 | | | | 17.5 | % |
| 2012 | | | 52 | | | | 789,196 | | | | 19.0 | % | | | 11,018,858 | | | | 13.96 | | | | 20.6 | % |
| 2013 | | | 33 | | | | 505,752 | | | | 12.2 | % | | | 6,411,409 | | | | 12.68 | | | | 12.0 | % |
| 2014 | | | 32 | | | | 500,779 | | | | 12.0 | % | | | 6,756,328 | | | | 13.49 | | | | 12.6 | % |
| 2015 and thereafter | | | 50 | | | | 1,261,726 | | | | 30.3 | % | | | 15,473,865 | | | | 12.26 | | | | 29.0 | % |
| | | | 301 | | | | 4,159,752 | | | | 100.0 | % | | $ | 53,477,113 | | | $ | 12.86 | | | | 100.0 | % |
| | | | | | | | | | | | | | | | | | | | | | | | | |
| Commercial Medical | | | | | | | | | | | | | | | | | | | | | | | | |
| 2010 | | | 23 | | | | 59,471 | | | | 2.7 | % | | $ | 1,114,386 | | | $ | 18.74 | | | | 2.9 | % |
| 2011 | | | 17 | | | | 67,247 | | | | 3.0 | % | | | 1,217,253 | | | | 18.10 | | | | 3.1 | % |
| 2012 | | | 30 | | | | 113,686 | | | | 5.1 | % | | | 2,328,064 | | | | 20.48 | | | | 5.9 | % |
| 2013 | | | 18 | | | | 68,390 | | | | 3.1 | % | | | 1,259,697 | | | | 18.42 | | | | 3.2 | % |
| 2014 | | | 24 | | | | 160,264 | | | | 7.3 | % | | | 3,300,819 | | | | 20.60 | | | | 8.4 | % |
| 2015 and thereafter | | | 87 | | | | 1,741,372 | | | | 78.8 | % | | | 30,051,488 | | | | 17.26 | | | | 76.5 | % |
| | | | 199 | | | | 2,210,430 | | | | 100.0 | % | | $ | 39,271,707 | | | $ | 17.77 | | | | 100.0 | % |
| | | | | | | | | | | | | | | | | | | | | | | | | |
| Commercial Industrial | | | | | | | | | | | | | | | | | | | | | | | | |
| 2010 | | | 7 | | | | 289,844 | | | | 11.7 | % | | $ | 985,673 | | | $ | 3.40 | | | | 9.0 | % |
| 2011 | | | 15 | | | | 1,072,579 | | | | 43.4 | % | | | 3,596,058 | | | | 3.35 | | | | 32.8 | % |
| 2012 | | | 4 | | | | 228,184 | | | | 9.3 | % | | | 641,725 | | | | 2.81 | | | | 5.8 | % |
| 2013 | | | 3 | | | | 214,335 | | | | 8.7 | % | | | 1,062,335 | | | | 4.96 | | | | 9.7 | % |
| 2014 | | | 4 | | | | 84,775 | | | | 3.4 | % | | | 545,545 | | | | 6.44 | | | | 5.0 | % |
| 2015 and thereafter | | | 8 | | | | 579,520 | | | | 23.5 | % | | | 4,132,472 | | | | 7.13 | | | | 37.7 | % |
| | | | 41 | | | | 2,469,237 | | | | 100.0 | % | | $ | 10,963,808 | | | $ | 4.44 | | | | 100.0 | % |
| | | | | | | | | | | | | | | | | | | | | | | | | |
| Commercial Retail | | | | | | | | | | | | | | | | | | | | | | | | |
| 2010 | | | 44 | | | | 175,724 | | | | 14.8 | % | | $ | 1,171,672 | | | $ | 6.67 | | | | 11.9 | % |
| 2011 | | | 49 | | | �� | 273,247 | | | | 23.0 | % | | | 2,631,307 | | | | 9.63 | | | | 26.8 | % |
| 2012 | | | 30 | | | | 237,300 | | | | 19.9 | % | | | 1,350,762 | | | | 5.69 | | | | 13.7 | % |
| 2013 | | | 15 | | | | 69,970 | | | | 5.9 | % | | | 469,298 | | | | 6.71 | | | | 4.8 | % |
| 2014 | | | 18 | | | | 63,027 | | | | 5.3 | % | | | 753,272 | | | | 11.95 | | | | 7.7 | % |
| 2015 and thereafter | | | 28 | | | | 370,136 | | | | 31.1 | % | | | 3,448,551 | | | | 9.32 | | | | 35.1 | % |
| | | | 184 | | | | 1,189,404 | | | | 100.0 | % | | $ | 9,824,862 | | | $ | 8.26 | | | | 100.0 | % |
| | | | | | | | | | | | | | | | | | | | | | | | | |
| Commercial Total | | | | | | | | | | | | | | | | | | | | | | | | |
| 2010 | | | 141 | | | | 915,355 | | | | 9.1 | % | | $ | 7,724,008 | | | $ | 8.44 | | | | 6.8 | % |
| 2011 | | | 148 | | | | 2,125,056 | | | | 21.2 | % | | | 16,808,994 | | | | 7.91 | | | | 14.8 | % |
| 2012 | | | 116 | | | | 1,368,366 | | | | 13.6 | % | | | 15,339,409 | | | | 11.21 | | | | 13.5 | % |
| 2013 | | | 69 | | | | 858,447 | | | | 8.6 | % | | | 9,202,739 | | | | 10.72 | | | | 8.1 | % |
| 2014 | | | 78 | | | | 808,845 | | | | 8.1 | % | | | 11,355,964 | | | | 14.04 | | | | 10.0 | % |
| 2015 and thereafter | | | 173 | | | | 3,952,754 | | | | 39.4 | % | | | 53,106,376 | | | | 13.44 | | | | 46.8 | % |
| | | | 725 | | | | 10,028,823 | | | | 100.0 | % | | $ | 113,537,490 | | | $ | 11.32 | | | | 100.0 | % |
* Annualized Rent is monthly scheduled rent as of April 30, 2009 (cash basis), multiplied by 12.
INVESTORS REAL ESTATE TRUST AND SUBSIDIARIES
FISCAL 2009 ACQUISITION SUMMARY
as of April 30, 2009
($’s in thousands)
| Property | Location | Segment Type | Acquisition Date | | Square Feet/Units | | | Leased Percentage at Acquisition | | | April 30, 2009 Leased Percentage | | | Acquisition Cost | |
| | | | | | | | | | | | | | | | |
| 33-unit Minot Westridge Apartments | Minot, ND | Multi-Family Residential | May 1, 2008 | | | 33 | | | | 100 | % | | | 99 | % | | $ | 1,954 | |
| 12-unit Minot Fairmont Apartments | Minot, ND | Multi-Family Residential | May 1, 2008 | | | 12 | | | | 100 | % | | | 100 | % | | | 365 | |
4-unit Minot 4th Street Apartments | Minot, ND | Multi-Family Residential | May 1, 2008 | | | 4 | | | | 100 | % | | | 100 | % | | | 89 | |
3-unit Minot 11th Street Apartments | Minot, ND | Multi-Family Residential | May 1, 2008 | | | 3 | | | | 100 | % | | | 100 | % | | | 64 | |
Bismarck 2130 S. 12th Street | Bismarck, ND | Unimproved Land | May 23, 2008 | | | N/A | | | | N/A | | | | N/A | | | | 576 | |
| 22,500 sq. ft. Bismarck 715 E. Broadway | Bismarck, ND | Commercial Office | August 1, 2008 | | | 22,500 | | | | 100 | % | | | 100 | % | | | 1,911 | |
| Bismarck 700 E. Main | Bismarck, ND | Unimproved Land | August 1, 2008 | | | N/A | | | | N/A | | | | N/A | | | | 314 | |
| 36-unit Evergreen Apartments | Isanti, MN | Multi-Family Residential | September 2, 2008 | | | 36 | | | | 100 | % | | | 86 | % | | | 3,100 | |
| 56,239 sq. ft.- 2828 Chicago Avenue | Minneapolis, MN | Commercial Medical | September 16, 2008 | | | 56,239 | | | | 68 | % | | | 73 | % | | | 5,052 | |
| 31,643 sq. ft.- Southdale Medical Expansion (6545 France Avenue) | Edina, MN | Commercial Medical | September 17, 2008 | | | 31,643 | | | | 75 | % | | | 90 | % | | | 779 | |
| 10-unit 401 S. Main | Minot, ND | Multi-Family Residential | November 10, 2008 | | | 10 | | | | 0 | % | | | 100 | % | | | 905 | |
| 69,984 sq. ft. – Minnetonka 13600 Cty Rd 62 | Minnetonka, MN | Commercial Industrial | January 20, 2009 | | | 69,984 | | | | 100 | % | | | 100 | % | | | 4,000 | |
| 71-unit – IRET Corporate Plaza | Minot, ND | Multi-Family Residential | January 31, 2009 | | | 71 | | | | 0 | % | | | 77 | % | | | 10,824 | |
| 50,360 sq. ft. – IRET Corporate Plaza | Minot, ND | Commercial Office | January 31, 2009 | | | 50,360 | | | | 0 | % | | | 0 | % | | | 3,896 | |
| | | | Total Square Feet | | | 230,726 | | | | | | | | | | | $ | 33,829 | |
| | | | Total Units | | | 169 | | | | | | | | | | | | | |
Definitions
April 30, 2009
Annualized base rent (ABR) is calculated as monthly base rent (cash basis) per the lease, as of the reporting period, multiplied by 12.
Debt to total market capitalization is total debt from the balance sheet divided by the sum of total debt from the balance sheet plus the market value of shares outstanding at the end of the period.
Debt service coverage ratio is computed by dividing earnings before interest income and expense, depreciation, amortization and gain on sale of real estate by interest expense and principal amortization.
EBITDA is earnings before interest, taxes, depreciation and amortization. We consider EBITDA to be an appropriate supplemental performance measure because it eliminates depreciation, interest and the gain/loss from property dispositions, which permits investors to view income from operations without the effect of non-cash depreciation or the cost of debt. EBITDA is a non-GAAP measure. EBITDA as calculated by us is not comparable to EBITDA reported by other REITs that do not define EBITDA exactly as we do.
Funds from operations (FFO) - The National Association of Real Estate Investment Trusts, Inc. (NAREIT) defines FFO as net income (computed in accordance with generally accepted accounting principles, excluding gains/losses from sales of property plus real estate depreciation and amortization. FFO is a non-GAAP measure. We consider FFO to be a standard supplemental measure for equity real estate investment trusts because it facilitates an understanding of the operating performance of properties without giving effect to real estate depreciation and amortization, which assume that the value of real estate assets diminishes predictably over time. Since real estate values instead historically rise or fall with market conditions, we believe that FFO provides investors and management with a more accurate indication of our financial and operating results.
Payout ratio (FFO per share and unit basis) - The ratio of the current quarterly distribution rate per common share and unit divided by quarterly FFO per share and unit.
Ratio of earnings to fixed charges - The ratio of earnings to fixed charges is computed by dividing earnings by fixed charges. For this purpose, earnings consist of income from continuing operations before adjustments for minority interest in consolidated subsidiaries, plus fixed charges and preferred distributions, less capitalized interest and preferred distributions. Fixed charges consist of mortgage and loan interest expense, whether expensed or capitalized, the amortization of debt expense and capitalized interest.
Ratio of earnings to combined fixed charges and preferred distributions - The ratio of earnings to combined fixed charges and preferred distributions is computed by dividing earnings by combined fixed charges and preferred distributions. For this purpose, earnings consist of income from continuing operations before adjustments for minority interest in consolidated subsidiaries, plus fixed charges and preferred distributions, less capitalized interest and preferred distributions. Combined fixed charges and preferred distributions consist of fixed charges (mortgage and loan interest expense, whether expensed or capitalized, the amortization of debt expense and capitalized interest) and preferred distributions.
Stabilized properties are those properties owned for the entirety of both periods being compared. While results presented on a stabilized property basis are not determined in accordance with GAAP, management believes that measuring performance on a stabilized property basis is useful to investors and to management because it enables evaluation of how the Company’s properties are performing year over year.