Exhibit 99.2

Third Quarter Fiscal 2011
Supplemental Operating and Financial Data
for the Quarter Ended January 31, 2011
CONTACT: Lindsey Anderson Director of Investor Relations Direct Dial: 701-837-4738 E-Mail: landerson@iret.com | 3015 16th Street SW, Suite 100 Minot, ND 58701 Tel: 701.837.4738 Fax: 701.838.7785 www.iret.com |
Supplemental Financial and Operating Data
January 31, 2011
| Page | |
| Company Background and Highlights | 2 |
| Investment Cost by Segment | 5 |
| Key Financial Data | |
| Condensed Consolidated Balance Sheets | 6 |
| Condensed Consolidated Statements of Operations | 7 |
| Funds From Operations | 8 |
| Earnings Before Interest, Taxes, Depreciation and Amortization (EBITDA) | 9 |
| Capital Analysis | |
| Long-Term Mortgage Debt Analysis | 10 |
| Long-Term Mortgage Debt Detail | 11-12 |
| Capital Analysis | 13 |
| Portfolio Analysis | |
| Stabilized Properties Net Operating Income Summary | 14 |
| Net Operating Income Detail | 15-18 |
| Stabilized Properties and Overall Physical Occupancy Levels by Segment | 19 |
| Tenant Analysis | |
| Commercial Leasing Summary | 20-21 |
| Multi-Family Residential Summary | 22 |
| 10 Largest Commercial Tenants - Based on Annualized Base Rent | 23 |
| Lease Expirations as of January 31, 2011 | 24 |
| Growth and Strategy | |
| Fiscal 2011 Acquisition Summary | 25 |
| Fiscal 2011 Development Summary | 26 |
| Definitions | 27 |
Company Background and Highlights
Third Quarter Fiscal 2011
Investors Real Estate Trust is a self-administered, equity real estate investment trust (REIT) investing in a portfolio of income-producing properties located primarily in the upper Midwest. IRET’s portfolio is diversified among multi-family residential, commercial office, commercial medical (including senior housing), commercial industrial and commercial retail segments.
During the third quarter of fiscal year 2011, the Company acquired three properties: on November 10, 2010, the Company acquired the approximately 108,503 square foot Edgewood Vista assisted living facility in Minot, North Dakota, for approximately $15.2 million, consisting of cash of approximately $9.6 million ($7.4 million of which was paid to the current tenant in the property to acquire the option to purchase the property) and the assumption of existing debt of approximately $5.6 million; on December 10, 2010, the Company acquired an approximately 47,709 square foot retail/office property in Minot, North Dakota, for a purchase price, paid in cash, of $8.3 million; and on December 16, 2010, the Company acquired an approximately 58,574 square foot office property in Omaha, Nebraska, for a purchase price of approximately $8.3 million, of which approximately $5.3 million was paid in cash, with the remainder paid in limited partnership units of the Company’s Operating Partnership valued at a total of $3.0 million. During the third quarter of fiscal year 2011, the Company substantially completed construction of an approximately 24,000 square foot expansion to its existing Edgewood Vista senior housing facility in Spearfish, South Dakota. The cost to construct the addition was approximately $2.7 million, of which $2.3 million has been paid as of January 31, 2011.
During the third quarter of fiscal year 2011, the Company sold a small industrial property in Waconia, Minnesota, on November 1, 2010, and three multi-family residential properties in Colorado, the Pinecone and Miramont Apartments in Fort Collins, Colorado and the Neighborhood Apartments in Colorado Springs, Colorado, on November 15, 2010, for a total sales price of $46.6 million.
IRET has substantially completed its announced goal of transferring the management of the majority of our commercial and multi-family residential properties from third-party property management companies to our own employees. As of January 31, 2011, the Company has under internal management a total of 155 properties in our commercial office, commercial medical, commercial industrial and commercial retail segments, totaling approximately 9.5 million square feet. Approximately 82.4% of the properties in our commercial office segment, 89.3% of the properties in our commercial medical segment, 89.5% of the properties in our commercial industrial segment, 97.0% of the properties in our commercial retail segment, and approximately 93.2% of the properties in our multi-family residential segment (approximately 7,793 units in 69 properties) were internally managed by Company employees as of January 31, 2011. IRET continues to evaluate existing and acquired commercial properties to determine additional suitable candidates for internal management, and to establish appropriate timelines to accomplish the transfers.
On April 7, 2009, IRET and IRET Properties entered into a continuous equity offering program sales agreement with Robert W. Baird & Co. Incorporated (Baird). Pursuant to the Sales Agreement, IRET may offer and sell its common shares of beneficial interest having an aggregate gross sales price of up to $50 million, from time to time through Baird as IRET's sales agent. Sales of common shares, if any, under the program will depend upon market conditions and other factors to be determined by IRET. During the third quarter of fiscal year 2011, IRET sold no common shares under this program.
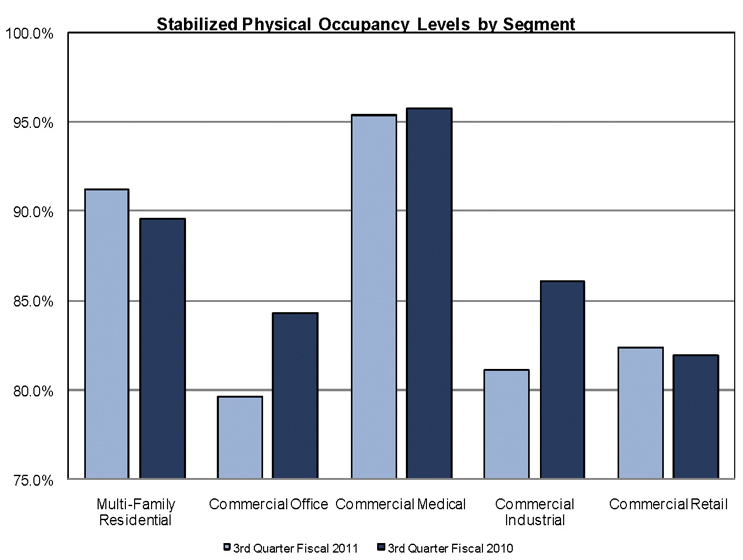
We believe the decreased occupancy levels in our commercial office and commercial industrial segments reflect the economic conditions in our markets, as recovery from the national economic recession has been slow. The recession, and illiquidity and uncertainty in the financial and capital markets during calendar years 2008, 2009, 2010 and continuing into 2011, negatively affected substantially all businesses, including ours. Although signs of an economic recovery have emerged during the first three quarters of our current fiscal year, we continue to expect recovery from the recession to be slow during the balance of the current fiscal year. It is not possible for us to predict or quantify the timing and impact of such a recovery, or lack thereof, during the remainder of fiscal year 2011.
In the third quarter of fiscal year 2011, IRET paid its 159th consecutive quarterly distribution per common share/unit at equal or increasing rates. The $0.1715 per share/unit distribution was paid January 14, 2011. Company management and the Board continue to review the Company’s common share distribution level in conjunction with closely monitoring the Company’s operating results during this prolonged economic downturn.
As of January 31, 2011, IRET owns a diversified portfolio of 250 properties consisting of 74 multi-family residential properties, 68 commercial office properties, 56 commercial medical properties (including senior housing), 19 commercial industrial properties and 33 commercial retail properties. IRET’s distributions have been maintained or increased every year for 39 consecutive years. IRET’s shares are publicly traded on the NASDAQ Global Select Market (NASDAQ: IRET).
Company Snapshot
(as of January 31, 2011)
| Company Headquarters | Minot, North Dakota |
| Fiscal Year-End | April 30 |
| Reportable Segments | Multi-Family Residential, Commercial Office, Commercial Medical, Commercial Industrial, Commercial Retail |
| Total Properties | 250 |
| Total Square Feet | |
| (commercial properties) | 12.2 million |
| Total Units | |
| (multi-family residential properties) | 8,593 |
| Common Shares Outstanding (thousands) | 79,846 |
| Limited Partnership Units Outstanding (thousands) | 20,047 |
| Common Share Distribution - Quarter/Annualized | $0.1715/$0.686 |
| Dividend Yield | 7.7% |
| Total Capitalization (see p. 13 for detail) | $1.9 billion |
Investor Information
Board of Trustees
| Jeffrey L. Miller | Trustee and Chairman |
| Stephen L. Stenehjem | Trustee and Vice Chairman, Chair of Compensation Committee |
| John D. Stewart | Trustee, Chair of Audit Committee |
| Patrick G. Jones | Trustee |
| C.W. “Chip” Morgan | Trustee |
| John T. Reed | Trustee, Chair of Nominating and Governance Committee |
| Edward T. Schafer | Trustee |
| W. David Scott | Trustee |
| Thomas A. Wentz, Jr. | Trustee, Senior Vice President and Chief Operating Officer |
| Timothy P. Mihalick | Trustee, President and Chief Executive Officer |
Management
| Timothy P. Mihalick | President and Chief Executive Officer; Trustee |
| Thomas A. Wentz, Jr | Senior Vice President and Chief Operating Officer; Trustee |
| Diane K. Bryantt | Senior Vice President and Chief Financial Officer |
| Michael A. Bosh | Senior Vice President, General Counsel and Assistant Secretary |
| Charles A. Greenberg | Senior Vice President, Commercial Asset Management |
| Ted E. Holmes | Senior Vice President, Finance |
| Thomas A. Wentz, Sr. | Senior Vice President and Chief Investment Officer |
Corporate Headquarters:
3015 16th Street SW, Suite 100
Minot, North Dakota 58701
Trading Symbol: IRET
Stock Exchange Listing: NASDAQ
Investor Relations:
Lindsey Anderson
landerson@iret.com
Common Share Data (NASDAQ: IRET)
3rd Quarter Fiscal Year 2011 | 2nd Quarter Fiscal Year 2011 | 1st Quarter Fiscal Year 2011 | 4th Quarter Fiscal Year 2010 | 3rd Quarter Fiscal Year 2010 | ||||||||||||||||
| High Closing Price | $ | 9.26 | $ | 8.90 | $ | 9.20 | $ | 9.37 | $ | 9.40 | ||||||||||
| Low Closing Price | $ | 8.74 | $ | 7.97 | $ | 8.25 | $ | 8.31 | $ | 8.25 | ||||||||||
| Average Closing Price | $ | 8.99 | $ | 8.43 | $ | 8.71 | $ | 8.89 | $ | 8.82 | ||||||||||
| Closing Price at end of quarter | $ | 8.94 | $ | 8.80 | $ | 8.47 | $ | 8.73 | $ | 8.73 | ||||||||||
| Common Share Distributions—annualized | $ | 0.686 | $ | 0.686 | $ | 0.686 | $ | 0.686 | $ | 0.686 | ||||||||||
| Closing Dividend Yield - annualized | 7.7 | % | 7.8 | % | 8.1 | % | 7.9 | % | 7.9 | % | ||||||||||
| Closing common shares outstanding (thousands) | 79,846 | 79,092 | 78,158 | 75,805 | 73,966 | |||||||||||||||
| Closing limited partnership units outstanding (thousands) | 20,047 | 19,994 | 20,273 | 20,522 | 20,853 | |||||||||||||||
| Closing market value of outstanding common shares, plus imputed closing market value of outstanding limited partnership units (thousands) | $ | 893,043 | $ | 871,957 | $ | 833,711 | $ | 840,935 | $ | 827,770 | ||||||||||
Certain statements in these supplemental disclosures are “forward-looking statements” within the meaning of the Private Securities Litigation Reform Act of 1995. Such statements involve known and unknown risks, uncertainties and other factors that may cause actual results to differ materially from projected results. Such risks, uncertainties and other factors include, but are not limited to: fluctuations in interest rates, the effect of government regulation, the availability of capital, changes in general and local economic and real estate market conditions, competition, our ability to attract and retain skilled personnel, and those risks and uncertainties detailed from time to time in our filings with the Securities and Exchange Commission, including our 2010 Form 10-K. We assume no obligation to update or supplement forward-looking statements that become untrue because of subsequent events.
Third Quarter Fiscal 2011 Acquisitions
Edgewood Vista - Minot 800 16th Ave SE, Minot, ND 58701 | Omaha 10802 Farnam Drive 10802 Farnam Drive, Omaha, NE 68154 |
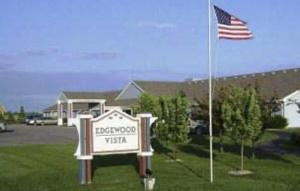 | 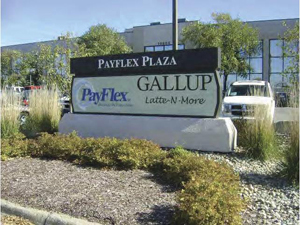 |
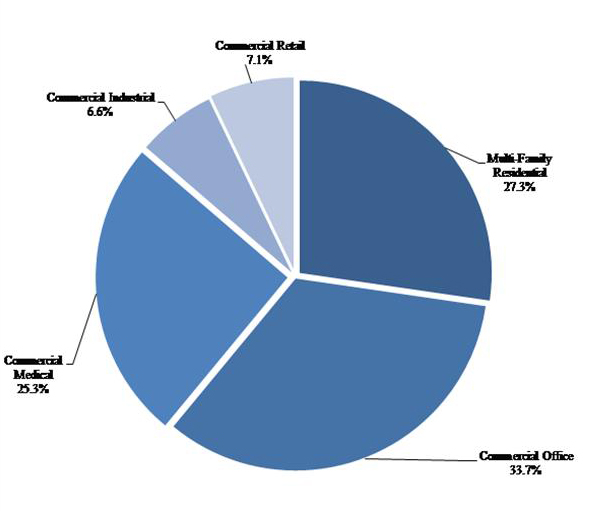
Investment Cost by Segment – Third Quarter Fiscal 2011
With investments in the multi-family residential and commercial office, commercial medical, commercial industrial and commercial retail segments, IRET’s diversified portfolio helps to provide stability during market fluctuations in returns from specific property types.
INVESTORS REAL ESTATE TRUST AND SUBSIDIARIES
CONDENSED CONSOLIDATED BALANCE SHEETS (unaudited)
(in thousands)
| 01/31/2011 | 10/31/2010 | 07/31/2010 | 04/30/2010 | 01/31/2010 | ||||||||||||||||
| ASSETS | ||||||||||||||||||||
| Real estate investments | ||||||||||||||||||||
| Property owned | $ | 1,763,585 | $ | 1,773,924 | $ | 1,813,427 | $ | 1,800,519 | $ | 1,793,995 | ||||||||||
| Less accumulated depreciation | (319,235 | ) | (322,379 | ) | (320,994 | ) | (308,626 | ) | (298,523 | ) | ||||||||||
| 1,444,350 | 1,451,545 | 1,492,433 | 1,491,893 | 1,495,472 | ||||||||||||||||
| Development in progress | 4,231 | 2,755 | 174 | 2,831 | 1,164 | |||||||||||||||
| Unimproved land | 7,470 | 7,876 | 6,020 | 6,007 | 5,987 | |||||||||||||||
| Mortgage loans receivable, net of allowance | 157 | 157 | 158 | 158 | 159 | |||||||||||||||
| Total real estate investments | 1,456,208 | 1,462,333 | 1,498,785 | 1,500,889 | 1,502,782 | |||||||||||||||
| Other assets | ||||||||||||||||||||
| Cash and cash equivalents | 30,907 | 43,701 | 56,077 | 54,791 | 47,790 | |||||||||||||||
| Restricted cash | 0 | 0 | 0 | 0 | 36,500 | |||||||||||||||
| Marketable securities – available-for-sale | 325 | 420 | 420 | 420 | 420 | |||||||||||||||
| Receivable arising from straight-lining of rents, net of allowance | 18,656 | 18,125 | 17,751 | 17,320 | 17,102 | |||||||||||||||
| Accounts receivable, net of allowance | 8,864 | 5,179 | 5,911 | 4,916 | 5,259 | |||||||||||||||
| Real estate deposits | 254 | 2,089 | 302 | 516 | 978 | |||||||||||||||
| Prepaid and other assets | 2,852 | 3,375 | 3,032 | 1,189 | 1,903 | |||||||||||||||
| Intangible assets, net of accumulated amortization | 51,543 | 48,140 | 50,050 | 50,700 | 52,797 | |||||||||||||||
| Tax, insurance, and other escrow | 18,467 | 10,504 | 10,391 | 9,301 | 10,044 | |||||||||||||||
| Property and equipment, net of accumulated depreciation | 1,332 | 1,370 | 1,371 | 1,392 | 1,332 | |||||||||||||||
| Goodwill | 1,127 | 1,260 | 1,388 | 1,388 | 1,392 | |||||||||||||||
| Deferred charges and leasing costs, net of accumulated amortization | 19,737 | 18,606 | 18,449 | 18,108 | 17,637 | |||||||||||||||
| TOTAL ASSETS | $ | 1,610,272 | $ | 1,615,102 | $ | 1,663,927 | $ | 1,660,930 | $ | 1,695,936 | ||||||||||
| LIABILITIES AND EQUITY | ||||||||||||||||||||
| LIABILITIES | ||||||||||||||||||||
| Accounts payable and accrued expenses | $ | 35,633 | $ | 26,616 | $ | 33,340 | $ | 38,514 | $ | 36,453 | ||||||||||
| Revolving lines of credit | 10,000 | 29,100 | 6,528 | 6,550 | 6,579 | |||||||||||||||
| Mortgages payable | 998,929 | 1,004,532 | 1,063,414 | 1,057,619 | 1,091,945 | |||||||||||||||
| Other | 8,423 | 1,227 | 1,272 | 1,320 | 1,368 | |||||||||||||||
| TOTAL LIABILITIES | 1,052,985 | 1,061,475 | 1,104,554 | 1,104,003 | 1,136,345 | |||||||||||||||
| REDEEMABLE NONCONTROLLING INTERESTS – CONSOLIDATED REAL ESTATE ENTITIES | 1,237 | 1,357 | 1,427 | 1,812 | 1,765 | |||||||||||||||
| EQUITY | ||||||||||||||||||||
| Investors Real Estate Trust shareholders’ equity | ||||||||||||||||||||
| Preferred Shares of Beneficial Interest | 27,317 | 27,317 | 27,317 | 27,317 | 27,317 | |||||||||||||||
| Common Shares of Beneficial Interest | 616,701 | 610,580 | 603,344 | 583,618 | 569,439 | |||||||||||||||
| Accumulated distributions in excess of net income | (223,684 | ) | (221,304 | ) | (213,055 | ) | (201,412 | ) | (189,340 | ) | ||||||||||
| Total Investors Real Estate Trust shareholders’ equity | 420,334 | 416,593 | 417,606 | 409,523 | 407,416 | |||||||||||||||
| Noncontrolling interests – Operating Partnership | 126,335 | 126,113 | 130,050 | 134,970 | 139,448 | |||||||||||||||
| Noncontrolling interests – consolidated real estate entities | 9,381 | 9,564 | 10,290 | 10,622 | 10,962 | |||||||||||||||
| Total equity | 556,050 | 552,270 | 557,946 | 555,115 | 557,826 | |||||||||||||||
| TOTAL LIABILITIES AND EQUITY | $ | 1,610,272 | $ | 1,615,102 | $ | 1,663,927 | $ | 1,660,930 | $ | 1,695,936 | ||||||||||
INVESTORS REAL ESTATE TRUST AND SUBSIDIARIES
CONDENSED CONSOLIDATED STATEMENTS OF OPERATIONS (unaudited)
(in thousands, except per share data)
| Nine Months Ended | Three Months Ended | |||||||||||||||||||||||||||
| OPERATING RESULTS | 01/31/2011 | 01/31/2010 | 01/31/2011 | 10/31/2010 | 07/31/2010 | 04/30/2010 | 01/31/2010 | |||||||||||||||||||||
| Real estate revenue | $ | 178,283 | $ | 172,101 | $ | 60,203 | $ | 58,904 | $ | 59,176 | $ | 59,410 | $ | 57,334 | ||||||||||||||
| Real estate expenses | 75,654 | 70,909 | 27,037 | 24,304 | 24,313 | 25,382 | 24,685 | |||||||||||||||||||||
| Gain on involuntary conversion | 0 | 1,660 | 0 | 0 | 0 | 0 | 1,660 | |||||||||||||||||||||
| Net operating income | 102,629 | 102,852 | 33,166 | 34,600 | 34,863 | 34,028 | 34,309 | |||||||||||||||||||||
| Depreciation/amortization | (43,581 | ) | (42,964 | ) | (14,591 | ) | (14,424 | ) | (14,566 | ) | (14,491 | ) | (14,497 | ) | ||||||||||||||
| Administrative expenses, advisory and trustee services | (5,537 | ) | (4,775 | ) | (1,850 | ) | (1,718 | ) | (1,969 | ) | (1,443 | ) | (1,790 | ) | ||||||||||||||
| Other expenses | (1,357 | ) | (1,468 | ) | (441 | ) | (563 | ) | (353 | ) | (1,045 | ) | (536 | ) | ||||||||||||||
| Impairment of real estate investment | 0 | (708 | ) | 0 | 0 | 0 | 0 | 0 | ||||||||||||||||||||
| Interest | (48,395 | ) | (49,306 | ) | (15,888 | ) | (16,436 | ) | (16,071 | ) | (16,359 | ) | (16,534 | ) | ||||||||||||||
| Interest and other income | 411 | 503 | 107 | 167 | 137 | 391 | 250 | |||||||||||||||||||||
| Income tax benefit (expense) | 0 | 0 | 0 | 19 | (19 | ) | 0 | 0 | ||||||||||||||||||||
| Income from continuing operations | 4,170 | 4,134 | 503 | 1,645 | 2,022 | 1,081 | 1,202 | |||||||||||||||||||||
| Income (loss) from discontinued operations | 19,871 | (1,001 | ) | 14,085 | 5,476 | 310 | 371 | (838 | ) | |||||||||||||||||||
| Net income | $ | 24,041 | $ | 3,133 | $ | 14,588 | $ | 7,121 | $ | 2,332 | $ | 1,452 | $ | 364 | ||||||||||||||
| Net (income) loss attributable to noncontrolling interest – Operating Partnership | (4,485 | ) | (381 | ) | (2,793 | ) | (1,322 | ) | (370 | ) | (181 | ) | 39 | |||||||||||||||
| Net loss (income) attributable to noncontrolling interests – consolidated real estate entities | 82 | 2 | 38 | 20 | 24 | (24 | ) | 49 | ||||||||||||||||||||
| Net income attributable to Investors Real Estate Trust | 19,638 | 2,754 | 11,833 | 5,819 | 1,986 | 1,247 | 452 | |||||||||||||||||||||
| Dividends to preferred shareholders | (1,779 | ) | (1,779 | ) | (593 | ) | (593 | ) | (593 | ) | (593 | ) | (593 | ) | ||||||||||||||
| NET INCOME (LOSS) AVAILABLE TO COMMON SHAREHOLDERS | $ | 17,859 | $ | 975 | $ | 11,240 | $ | 5,226 | $ | 1,393 | $ | 654 | $ | (141 | ) | |||||||||||||
| Per Share Data | ||||||||||||||||||||||||||||
| Earnings per common share from continuing operations – Investors Real Estate Trust – basic & diluted | $ | .03 | $ | .03 | $ | .00 | $ | .01 | $ | .02 | $ | .01 | $ | .01 | ||||||||||||||
| Earnings per common share from discontinued operations – Investors Real Estate Trust – basic & diluted | .20 | (.01 | ) | .14 | .06 | .00 | .00 | (.01 | ) | |||||||||||||||||||
| Net income per common share – basic & diluted | $ | .23 | $ | .02 | $ | .14 | $ | .07 | $ | .02 | $ | .01 | $ | .00 | ||||||||||||||
| Percentage of Revenues | ||||||||||||||||||||||||||||
| Real estate expenses | 42.4 | % | 41.2 | % | 44.9 | % | 41.3 | % | 41.1 | % | 42.7 | % | 43.1 | % | ||||||||||||||
| Depreciation/amortization | 24.4 | % | 25.0 | % | 24.2 | % | 24.5 | % | 24.6 | % | 24.4 | % | 25.3 | % | ||||||||||||||
| General and administrative | 3.1 | % | 2.8 | % | 3.1 | % | 2.9 | % | 3.3 | % | 2.4 | % | 3.1 | % | ||||||||||||||
| Interest | 27.1 | % | 28.6 | % | 26.4 | % | 27.9 | % | 27.2 | % | 27.5 | % | 28.8 | % | ||||||||||||||
| Net income | 13.5 | % | 1.8 | % | 24.2 | % | 12.1 | % | 3.9 | % | 2.4 | % | 0.6 | % | ||||||||||||||
| Ratios | ||||||||||||||||||||||||||||
EBITDA(1)/Interest expense | 1.99 | x | 1.92 | x | 1.97 | x | 1.96 | x | 2.04 | x | 1.95 | x | 1.88 | x | ||||||||||||||
| EBITDA/Interest expense plus preferred distributions | 1.92 | x | 1.85 | x | 1.90 | x | 1.89 | x | 1.97 | x | 1.88 | x | 1.82 | x | ||||||||||||||
| (1) | See Definitions on page 27. EBITDA is a non-GAAP measure; see page 9 for a reconciliation of EBITDA to net income (loss). |
INVESTORS REAL ESTATE TRUST AND SUBSIDIARIES
FUNDS FROM OPERATIONS (unaudited)
(in thousands, except per share and unit data)
| Nine Months Ended | Three Months Ended | |||||||||||||||||||||||||||
| 01/31/2011 | 01/31/2010 | 01/31/2011 | 10/31/2010 | 07/31/2010 | �� | 04/30/2010 | 01/31/2010 | |||||||||||||||||||||
Funds From Operations(1) | ||||||||||||||||||||||||||||
| Net income attributable to Investors Real Estate Trust | $ | 19,638 | $ | 2,754 | $ | 11,833 | $ | 5,819 | $ | 1,986 | $ | 1,247 | $ | 452 | ||||||||||||||
| Less dividends to preferred shareholders | (1,779 | ) | (1,779 | ) | (593 | ) | (593 | ) | (593 | ) | (593 | ) | (593 | ) | ||||||||||||||
| Net income (loss) available to common shareholders | 17,859 | 975 | 11,240 | 5,226 | 1,393 | 654 | (141 | ) | ||||||||||||||||||||
| Adjustments: | ||||||||||||||||||||||||||||
| Noncontrolling interests – Operating Partnership | 4,485 | 381 | 2,793 | 1,322 | 370 | 181 | (39 | ) | ||||||||||||||||||||
| Depreciation and amortization | 44,525 | 44,390 | 14,577 | 14,888 | 15,060 | 14,993 | 14,865 | |||||||||||||||||||||
| Gain on depreciable property sales | (19,365 | ) | 0 | (13,961 | ) | (5,404 | ) | 0 | (68 | ) | 0 | |||||||||||||||||
| Funds from operations applicable to common shares and Units | $ | 47,504 | $ | 45,746 | $ | 14,649 | $ | 16,032 | $ | 16,823 | $ | 15,760 | $ | 14,685 | ||||||||||||||
| FFO per share and unit - basic and diluted | $ | 0.48 | $ | 0.52 | $ | 0.14 | $ | 0.17 | $ | 0.17 | $ | 0.17 | $ | 0.16 | ||||||||||||||
| Weighted average shares and units | 98,311 | 88,284 | 99,355 | 98,737 | 96,777 | 94,979 | $ | 94,516 | ||||||||||||||||||||
| (1) | See Definitions on page 27. |
INVESTORS REAL ESTATE TRUST AND SUBSIDIARIES
EARNINGS BEFORE INTEREST, TAXES, DEPRECIATION AND AMORTIZATION (EBITDA) (unaudited)
(in thousands)
| Nine Months Ended | Three Months Ended | |||||||||||||||||||||||||||
| 01/31/2011 | 01/31/2010 | 01/31/2011 | 10/31/2010 | 07/31/2010 | 04/30/2010 | 01/31/2010 | ||||||||||||||||||||||
EBITDA(1) | ||||||||||||||||||||||||||||
| Net income attributable to Investors Real Estate Trust | $ | 19,638 | $ | 2,754 | $ | 11,833 | $ | 5,819 | $ | 1,986 | $ | 1,247 | $ | 452 | ||||||||||||||
| Adjustments: | ||||||||||||||||||||||||||||
| Noncontrolling interests – Operating Partnership | 4,485 | 381 | 2,793 | 1,322 | 370 | 181 | (39 | ) | ||||||||||||||||||||
| Income before noncontrolling interests – Operating Partnership | 24,123 | 3,135 | 14,626 | 7,141 | 2,356 | 1,428 | 413 | |||||||||||||||||||||
| Add: | ||||||||||||||||||||||||||||
| Interest | 49,827 | 52,048 | 15,719 | 17,346 | 16,762 | 17,058 | 17,447 | |||||||||||||||||||||
| Depreciation/amortization related to real estate investments | 42,745 | 42,986 | 13,943 | 14,320 | 14,482 | 14,407 | 14,486 | |||||||||||||||||||||
| Amortization related to non-real estate investments | 1,982 | 1,716 | 689 | 639 | 654 | 654 | 592 | |||||||||||||||||||||
Amortization related to real estate revenues(2) | 97 | 92 | 44 | 28 | 25 | 26 | 28 | |||||||||||||||||||||
| Less: | ||||||||||||||||||||||||||||
| Interest income | (199 | ) | (268 | ) | (75 | ) | (66 | ) | (58 | ) | (278 | ) | (140 | ) | ||||||||||||||
| Gain on sale of real estate, land and other investments | (19,365 | ) | 0 | (13,961 | ) | (5,404 | ) | 0 | (68 | ) | 0 | |||||||||||||||||
| EBITDA | $ | 99,210 | $ | 99,709 | $ | 30,985 | $ | 34,004 | $ | 34,221 | $ | 33,227 | $ | 32,826 | ||||||||||||||
| (1) | See Definitions on page 27. |
| (2) | Included in real estate revenue in the Statement of Operations. |
INVESTORS REAL ESTATE TRUST AND SUBSIDIARIES
LONG-TERM MORTGAGE DEBT ANALYSIS
(in thousands)
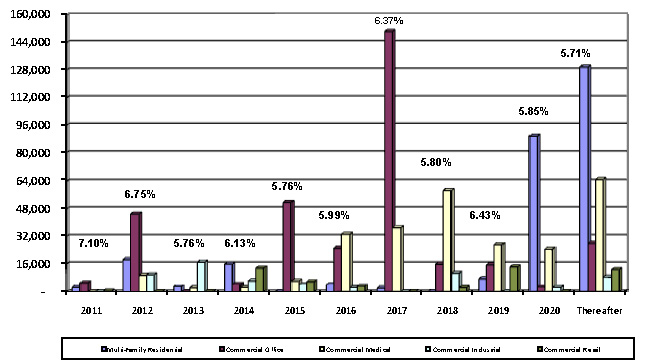
Debt Maturity Schedule
Annual Expirations
Total Mortgage Debt
| Future Maturities of Debt | ||||||||||||||||||||
| Fiscal Year | Fixed Debt | Variable Debt | Total Debt | Weighted Average(1) | % of Total Debt | |||||||||||||||
| 2011 | $ | 8,044 | $ | 0 | $ | 8,044 | 7.10 | % | 0.8 | % | ||||||||||
| 2012 | 83,076 | 0 | 83,076 | 6.75 | % | 8.3 | % | |||||||||||||
| 2013 | 22,304 | 0 | 22,304 | 5.76 | % | 2.2 | % | |||||||||||||
| 2014 | 41,977 | 855 | 42,832 | 6.13 | % | 4.3 | % | |||||||||||||
| 2015 | 68,123 | 0 | 68,123 | 5.76 | % | 6.8 | % | |||||||||||||
| 2016 | 68,471 | 138 | 68,609 | 5.99 | % | 6.9 | % | |||||||||||||
| 2017 | 189,259 | 0 | 189,259 | 6.37 | % | 19.0 | % | |||||||||||||
| 2018 | 87,309 | 0 | 87,309 | 5.80 | % | 8.7 | % | |||||||||||||
| 2019 | 64,330 | 604 | 64,934 | 6.43 | % | 6.5 | % | |||||||||||||
| 2020 | 119,976 | 0 | 119,976 | 5.85 | % | 12.0 | % | |||||||||||||
| Thereafter | 244,463 | 0 | 244,463 | 5.71 | % | 24.5 | % | |||||||||||||
| Total maturities | $ | 997,332 | $ | 1,597 | $ | 998,929 | 6.05 | % | 100.0 | % | ||||||||||
| (1) | Weighted average interest rate of debt that matures in fiscal year. |
| 01/31/2011 | 10/31/2010 | 07/31/2010 | 04/30/2010 | 01/31/2010 | ||||||||||||||||
| Balances Outstanding | ||||||||||||||||||||
| Mortgage | ||||||||||||||||||||
| Fixed rate | $ | 997,332 | $ | 1,002,867 | $ | 1,034,982 | $ | 1,028,606 | $ | 1,086,264 | ||||||||||
| Variable rate | 1,597 | 1,665 | 28,432 | 29,013 | 5,681 | |||||||||||||||
| Mortgage total | 998,929 | 1,004,532 | 1,063,414 | 1,057,619 | 1,091,945 | |||||||||||||||
| Weighted Average Interest Rates | ||||||||||||||||||||
| Secured | 6.05 | % | 6.14 | % | 6.13 | % | 6.17 | % | 6.21 | % | ||||||||||
INVESTORS REAL ESTATE TRUST AND SUBSIDIARIES
LONG-TERM MORTGAGE DEBT DETAIL AS OF JANUARY 31, 2011
| Property | Maturity Date | Fiscal 2011 | Fiscal 2012 | Fiscal 2013 | Fiscal 2014 | Thereafter | Total(1) | ||||||||||||||||||
| Multi-Family Residential | |||||||||||||||||||||||||
Ridge Oaks Apartments - Sioux City, IA2 | 2/1/2011 | $ | 2,535 | $ | 0 | $ | 0 | $ | 0 | $ | 0 | $ | 2,535 | ||||||||||||
Oakwood - Sioux Falls, SD9 | 6/1/2011 | 0 | 3,353 | 0 | 0 | 0 | 3,353 | ||||||||||||||||||
Oxbow - Sioux Falls, SD9 | 6/1/2011 | 0 | 3,654 | 0 | 0 | 0 | 3,654 | ||||||||||||||||||
Chateau Apartments - Minot, ND8 | 7/1/2011 | 0 | 1,740 | 0 | 0 | 0 | 1,740 | ||||||||||||||||||
Oakmont Apartments - Sioux Falls, SD8 | 9/1/2011 | 0 | 3,623 | 0 | 0 | 0 | 3,623 | ||||||||||||||||||
| Canyon Lake Apartments - Rapid City, SD | 10/1/2011 | 0 | 2,607 | 0 | 0 | 0 | 2,607 | ||||||||||||||||||
| The Meadows III - Jamestown, ND | 11/1/2011 | 0 | 951 | 0 | 0 | 0 | 951 | ||||||||||||||||||
| Crown Apartments - Rochester, MN | 1/1/2012 | 0 | 2,532 | 0 | 0 | 0 | 2,532 | ||||||||||||||||||
| Monticello Apartments - Monticello, MN | 3/1/2013 | 0 | 0 | 3,040 | 0 | 0 | 3,040 | ||||||||||||||||||
| Quarry Ridge Apartments - Rochester, MN | 10/1/2013 | 0 | 0 | 0 | 12,202 | 0 | 12,202 | ||||||||||||||||||
| East Park Apartments - Sioux Falls, SD | 12/1/2013 | 0 | 0 | 0 | 1,538 | 0 | 1,538 | ||||||||||||||||||
| Sycamore Village Apartments - Sioux Falls, SD | 12/1/2013 | 0 | 0 | 0 | 865 | 0 | 865 | ||||||||||||||||||
| Candlelight Apartments - Fargo, ND | 3/1/2014 | 0 | 0 | 0 | 1,325 | 0 | 1,325 | ||||||||||||||||||
| Summary of Debt due after Fiscal 2014 | 0 | 0 | 0 | 0 | 233,584 | 233,584 | |||||||||||||||||||
| Sub-Total Multi-Family Residential | $ | 2,535 | $ | 18,460 | $ | 3,040 | $ | 15,930 | $ | 233,584 | $ | 273,549 | |||||||||||||
| Commercial Office | |||||||||||||||||||||||||
Whitewater Plaza - Minnetonka, MN3 | 3/1/2011 | $ | 2,620 | $ | 0 | $ | 0 | $ | 0 | $ | 0 | $ | 2,620 | ||||||||||||
Whitewater Plaza - Minnetonka, MN3 | 3/1/2011 | 1,359 | 0 | 0 | 0 | 0 | 1,359 | ||||||||||||||||||
| 2030 Cliff Road - Eagan, MN | 4/1/2011 | 447 | 0 | 0 | 0 | 0 | 447 | ||||||||||||||||||
| Pillsbury Business Center - Edina, MN | 4/1/2011 | 867 | 0 | 0 | 0 | 0 | 867 | ||||||||||||||||||
Golden Hills Office Center - Golden Valley, MN4 | 7/1/2011 | 0 | 14,193 | 0 | 0 | 0 | 14,193 | ||||||||||||||||||
Wells Fargo Center - St Cloud, MN8 | 7/1/2011 | 0 | 6,409 | 0 | 0 | 0 | 6,409 | ||||||||||||||||||
Brenwood - Minnetonka, MN5 | 10/1/2011 | 0 | 7,224 | 0 | 0 | 0 | 7,224 | ||||||||||||||||||
Interlachen Corporate Center - Eagan, MN6 | 10/11/2011 | 0 | 9,354 | 0 | 0 | 0 | 9,354 | ||||||||||||||||||
Bloomington Business Plaza - Bloomington, MN5 | 12/1/2011 | 0 | 4,069 | 0 | 0 | 0 | 4,069 | ||||||||||||||||||
| Wirth Corporate Center - Golden Valley, MN | 2/1/2012 | 0 | 3,841 | 0 | 0 | 0 | 3,841 | ||||||||||||||||||
| Great Plains - Fargo, ND | 10/1/2013 | 0 | 0 | 0 | 3,426 | 0 | 3,426 | ||||||||||||||||||
| Viromed - Eden Prairie, MN | 4/1/2014 | 0 | 0 | 0 | 975 | 0 | 975 | ||||||||||||||||||
| Summary of Debt due after Fiscal 2014 | 0 | 0 | 0 | 0 | 289,599 | 289,599 | |||||||||||||||||||
| Sub-Total Commercial Office | $ | 5,293 | $ | 45,090 | $ | 0 | $ | 4,401 | $ | 289,599 | $ | 344,383 | |||||||||||||
INVESTORS REAL ESTATE TRUST AND SUBSIDIARIES
LONG-TERM MORTGAGE DEBT DETAIL AS OF JANUARY 31, 2011 (continued)
| Property | Maturity Date | Fiscal 2011 | Fiscal 2012 | Fiscal 2013 | Fiscal 2014 | Thereafter | Total(1) | ||||||||||||||||||
| Commercial Medical | |||||||||||||||||||||||||
Edina 6525 France SMC II - Edina, MN7 | 6/1/2011 | $ | 0 | $ | 9,657 | $ | 0 | $ | 0 | $ | 0 | $ | 9,657 | ||||||||||||
| Georgetown Square - Grand Chute, WI | 5/1/2012 | 0 | 0 | 2,233 | 0 | 0 | 2,233 | ||||||||||||||||||
| High Pointe Health Campus - Lake Elmo, MN | 12/1/2013 | 0 | 0 | 0 | 2,425 | 0 | 2,425 | ||||||||||||||||||
| Summary of Debt due after Fiscal 2014 | 0 | 0 | 0 | 0 | 252,022 | 252,022 | |||||||||||||||||||
| Sub-Total Commercial Medical | $ | 0 | $ | 9,657 | $ | 2,233 | $ | 2,425 | $ | 252,022 | $ | 266,337 | |||||||||||||
| Commercial Industrial | |||||||||||||||||||||||||
Eagan 2785 & 2795 Highway 55 - Eagan, MN8 | 6/1/2011 | $ | 0 | $ | 3,645 | $ | 0 | $ | 0 | $ | 0 | $ | 3,645 | ||||||||||||
| Stone Container - Roseville, MN | 2/1/2012 | 0 | 3,800 | 0 | 0 | 0 | 3,800 | ||||||||||||||||||
| Minnetonka 13600 County Road 62 - Minnetonka, MN | 2/27/2012 | 0 | 2,424 | 0 | 0 | 0 | 2,424 | ||||||||||||||||||
| Dixon Avenue Industrial Park - Des Moines, IA | 1/1/2013 | 0 | 0 | 7,360 | 0 | 0 | 7,360 | ||||||||||||||||||
| Bloomington 2000 West 94th Street - Bloomington, MN | 3/1/2013 | 0 | 0 | 3,914 | 0 | 0 | 3,914 | ||||||||||||||||||
| Roseville 2929 Long Lake Road - Roseville, MN | 3/1/2013 | 0 | 0 | 5,757 | 0 | 0 | 5,757 | ||||||||||||||||||
| Bodycote Industrial Building - Eden Prairie, MN | 9/1/2013 | 0 | 0 | 0 | 1,203 | 0 | 1,203 | ||||||||||||||||||
| Cedar Lake Business Center - St. Louis Park, MN | 11/1/2013 | 0 | 0 | 0 | 2,402 | 0 | 2,402 | ||||||||||||||||||
| Woodbury 1865 Woodlane - Woodbury, MN | 11/1/2013 | 0 | 0 | 0 | 2,825 | 0 | 2,825 | ||||||||||||||||||
| Summary of Debt due after Fiscal 2014 | 0 | 0 | 0 | 28,560 | 28,560 | ||||||||||||||||||||
| Sub-Total Commercial Industrial | $ | 0 | $ | 9,869 | $ | 17,031 | $ | 6,430 | $ | 28,560 | $ | 61,890 | |||||||||||||
| Commercial Retail | |||||||||||||||||||||||||
Kentwood Thomasville Furniture - Kentwood, MI5 | 2/1/2011 | $ | 216 | $ | 0 | $ | 0 | $ | 0 | $ | 0 | $ | 216 | ||||||||||||
| Burnsville I Strip Center - Burnsville, MN | 6/30/2013 | 0 | 0 | 0 | 476 | 0 | 476 | ||||||||||||||||||
| Burnsville II Strip Center - Burnsville, MN | 6/30/2013 | 0 | 0 | 0 | 379 | 0 | 379 | ||||||||||||||||||
| St Cloud Westgate - St Cloud, MN | 10/10/2013 | 0 | 0 | 0 | 3,415 | 0 | 3,415 | ||||||||||||||||||
| Livingston Pamida - Livingston, MT | 12/19/2013 | 0 | 0 | 0 | 1,207 | 0 | 1,207 | ||||||||||||||||||
| Eagan I Retail Center - Eagan, MN | 12/22/2013 | 0 | 0 | 0 | 1,413 | 0 | 1,413 | ||||||||||||||||||
| Forest Lake Westlake Center - Forest Lake, MN | 12/22/2013 | 0 | 0 | 0 | 4,518 | 0 | 4,518 | ||||||||||||||||||
| Pine City C-Store - Pine City, MN | 4/20/2014 | 0 | 0 | 0 | 313 | 0 | 313 | ||||||||||||||||||
| Pine City Evergreen Square - Pine City, MN | 4/20/2014 | 0 | 0 | 0 | 1,925 | 0 | 1,925 | ||||||||||||||||||
| Summary of Debt due after Fiscal 2014 | 0 | 0 | 0 | 0 | 38,908 | 38,908 | |||||||||||||||||||
| Sub-Total Commercial Retail | $ | 216 | $ | 0 | $ | 0 | $ | 13,646 | $ | 38,908 | $ | 52,770 | |||||||||||||
| Total | $ | 8,044 | $ | 83,076 | $ | 22,304 | $ | 42,832 | $ | 842,673 | $ | 998,929 | |||||||||||||
| (1) | Totals are principal balances as of January 31, 2011. |
| (2) | Application signed on November 18, 2010 to refinance; loan was paid off February 1, 2011 and refinance is pending. |
| (3) | Lender has agreed to refinance on March 10, 2011. |
| (4) | Application signed on January 20, 2011 to refinance in April 2010. |
| (5) | Loan was paid off on February 1, 2011. |
| (6) | Loan was refinanced February 11, 2011. |
| (7) | Loan was refinanced March 3, 2011. |
| (8) | Currently in discussion for refinance. |
| (9) Application signed March 3, 2011 for refinance on April 29, 2011. |
INVESTORS REAL ESTATE TRUST AND SUBSIDIARIES
CAPITAL ANALYSIS
(in thousands, except per share and unit amounts)
| Three Months Ended | ||||||||||||||||||||
| 01/31/2011 | 10/31/2010 | 07/31/2010 | 04/30/2010 | 01/31/2010 | ||||||||||||||||
| Equity Capitalization | ||||||||||||||||||||
| Common shares outstanding | 79,846 | 79,092 | 78,158 | 75,805 | 73,966 | |||||||||||||||
| Operating partnership (OP) units outstanding | 20,047 | 19,994 | 20,273 | 20,522 | 20,853 | |||||||||||||||
| Total common shares and OP units outstanding | 99,893 | 99,086 | 98,431 | 96,327 | 94,819 | |||||||||||||||
| Market price per common share (closing price at end of period) | $ | 8.94 | $ | 8.80 | $ | 8.47 | $ | 8.73 | $ | 8.73 | ||||||||||
| Equity capitalization-common shares and OP units | $ | 893,043 | $ | 871,957 | $ | 833,711 | $ | 840,935 | $ | 827,770 | ||||||||||
| Recorded book value of preferred shares | $ | 27,317 | $ | 27,317 | $ | 27,317 | $ | 27,317 | $ | 27,317 | ||||||||||
| Total equity capitalization | $ | 920,360 | $ | 899,274 | $ | 861,028 | $ | 868,252 | $ | 855,087 | ||||||||||
| Debt Capitalization | ||||||||||||||||||||
| Total mortgage debt | $ | 998,929 | $ | 1,004,532 | $ | 1,063,414 | $ | 1,057,619 | $ | 1,091,945 | ||||||||||
| Total capitalization | $ | 1,919,289 | $ | 1,903,806 | $ | 1,924,442 | $ | 1,925,871 | $ | 1,947,032 | ||||||||||
| Total debt to total capitalization | 0.52:1 | 0.53:1 | 0.55:1 | 0.55:1 | 0.56:1 | |||||||||||||||
| Nine Months Ended | Three Months Ended | |||||||||||||||||||||||||||
| 01/31/2011 | 01/31/2010 | 01/31/2011 | 10/31/2010 | 07/31/2010 | 04/30/2010 | 01/31/2010 | ||||||||||||||||||||||
Earnings to fixed charges(1) | 1.08 | x | 1.08 | x | 1.03 | x | 1.10 | x | 1.12 | x | 1.06 | x | 1.07 | x | ||||||||||||||
Earnings to combined fixed charges and preferred distributions(1) | 1.05 | x | 1.04 | x | 1.00 | x | 1.06 | x | 1.08 | x | 1.03 | x | 1.04 | x | ||||||||||||||
Debt service coverage ratio(1) | 1.40 | x | 1.37 | x | 1.37 | x | 1.40 | x | 1.44 | x | 1.39 | x | 1.36 | x | ||||||||||||||
| Distribution Data | ||||||||||||||||||||||||||||
| Common shares and units outstanding at record date | 99,213 | 94,497 | 99,213 | 98,726 | 96,506 | 94,844 | 94,497 | |||||||||||||||||||||
| Total common distribution paid | $ | 50,497 | $ | 45,079 | $ | 17,015 | $ | 16,931 | $ | 16,551 | $ | 16,267 | $ | 16,205 | ||||||||||||||
| Common distribution per share and unit | $ | .5145 | $ | .5130 | $ | .1715 | $ | .1715 | $ | .1715 | $ | .1715 | $ | .1715 | ||||||||||||||
Payout ratio (FFO per share and unit basis)(1) | 107.2 | % | 98.7 | % | 122.5 | % | 100.9 | % | 100.9 | % | 100.9 | % | 107.2 | % | ||||||||||||||
| (1) | See Definitions on page 27. |
INVESTORS REAL ESTATE TRUST AND SUBSIDIARIES
STABILIZED PROPERTIES NET OPERATING INCOME SUMMARY
(in thousands)
Stabilized Properties(1) | Stabilized Properties(1) | |||||||||||||||||||||||
Three Months Ended January 31, | Nine Months Ended January 31, | |||||||||||||||||||||||
| Segment | 2011 | 2010 | % Change | 2011 | 2010 | % Change | ||||||||||||||||||
| Multi-Family Residential | $ | 7,936 | $ | 9,370 | (15.3 | %) | $ | 24,197 | $ | 26,516 | (8.7 | %) | ||||||||||||
| Commercial Office | 9,703 | 11,053 | (12.2 | %) | 31,602 | 34,185 | (7.6 | %) | ||||||||||||||||
| Commercial Medical | 9,918 | 9,527 | 4.1 | % | 30,056 | 28,869 | 4.1 | % | ||||||||||||||||
| Commercial Industrial | 1,971 | 2,061 | (4.4 | %) | 6,322 | 6,506 | (2.8 | %) | ||||||||||||||||
| Commercial Retail | 2,030 | 1,989 | 2.1 | % | 6,698 | 6,469 | 3.5 | % | ||||||||||||||||
| $ | 31,558 | $ | 34,000 | (7.2 | %) | $ | 98,875 | $ | 102,545 | (3.6 | %) | |||||||||||||
| (1) | For Three and Nine Months Ended January 31, 2011, stabilized properties excluded: |
Multi-Family Residential - | Crown Apartments, Rochester, MN and Northern Valley Apartments, Rochester, MN. |
| Total number of units, 64. Occupancy % for January 31, 2011 is 79.7%. |
Commercial Office - | IRET Corporate Plaza, Minot, ND; Minot 2505 16th St SW, Minot, ND; 1st Avenue Building, Minot, ND and Omaha 10802 Farnum Drive, Omaha, NE. |
| Total square footage 128,611. Occupancy % for January 31, 2011 is 99.4%. |
Commercial Medical - | Casper 1930 E 12th Street (Park Place), Casper, WY; Casper 3955 E 12th Street (Meadow Wind), Casper, WY; Cheyenne 4010 N College Drive (Aspen Wind), Cheyenne, WY; Cheyenne 4060 N College Drive (Sierra Hills), Cheyenne, WY; Laramie 1072 N 22nd Street (Spring Wind), Laramie, WY; Billings 2300 Grant Road, Billings, MT; Missoula 3050 Great Northern Avenue, Missoula, MT and Edgewood Vista-Minot, Minot, ND. |
| Total square footage, 375,847. Occupancy % for January 31, 2011 is 100.0%. |
Commercial Industrial - | Clive 2075 NW 94th St., Clive, IA and Fargo 1320 45th Street North, Fargo, ND. |
| Total square footage, 84,754. Occupancy % for January 31, 2011 is 100.0%. |
Commercial Retail - | Minot 1400 31st Ave, Minot, ND. |
| Total square footage, 47,709. Occupancy % for January 31, 2010 is 84.0%. |
| For Three and Nine Months ended January 31, 2010, stabilized properties excluded: |
Commercial Office - | IRET Corporate Plaza, Minot, ND; Minot 2505 16th St SW, Minot, ND and 1st Avenue Building, Minot, ND. |
| Total square footage, 80,322. Occupancy % for January 31, 2010 is 50.7%. |
Commercial Medical - | Casper 1930 E 12th Street (Park Place), Casper, WY; Casper 3955 E 12th Street (Meadow Wind), Casper, WY; Cheyenne 4010 N College Drive (Aspen Wind), Cheyenne, WY; Cheyenne 4060 N College Drive (Sierra Hills), Cheyenne, WY; Laramie 1072 N 22nd Street (Spring Wind), Laramie, WY; Billings 2300 Grant Road, Billings, MT; Missoula 3050 Great Northern Avenue, Missoula, MT and Fox River Cottages, Grand Chute, WI. |
Total square footage, 264,335. Occupancy % for January 31, 2011 is 90.0%. |
Commercial Industrial - | Clive 2075 NW 94th St., Clive, IA. |
| Total square footage, 42,510. Occupancy % for January 31, 2010 is 100.0%. |
INVESTORS REAL ESTATE TRUST AND SUBSIDIARIES
NET OPERATING INCOME DETAIL
(in thousands)
| Three Months Ended January 31, 2011 | ||||||||||||||||||||||||||||
| Reporting Segments | ||||||||||||||||||||||||||||
Multi-Family Residential | Commercial Office | Commercial Medical | Commercial Industrial | Commercial Retail | Corporate and Other | Total | ||||||||||||||||||||||
| Real estate rental revenue | ||||||||||||||||||||||||||||
Stabilized(1) | $ | 16,764 | $ | 19,097 | $ | 13,787 | $ | 3,148 | $ | 3,540 | $ | 0 | $ | 56,336 | ||||||||||||||
| Non-Stabilized | 120 | 246 | 3,206 | 201 | 94 | 0 | 3,867 | |||||||||||||||||||||
| Total | 16,884 | 19,343 | 16,993 | 3,349 | 3,634 | 0 | 60,203 | |||||||||||||||||||||
| Real estate expenses | ||||||||||||||||||||||||||||
Stabilized(1) | 8,828 | 9,394 | 3,869 | 1,177 | 1,510 | 0 | 24,778 | |||||||||||||||||||||
| Non-Stabilized | 75 | 113 | 2,025 | 26 | 20 | 0 | 2,259 | |||||||||||||||||||||
| Total | 8,903 | 9,507 | 5,894 | 1,203 | 1,530 | 0 | 27,037 | |||||||||||||||||||||
Stabilized(1) | 7,936 | 9,703 | 9,918 | 1,971 | 2,030 | 0 | 31,558 | |||||||||||||||||||||
| Non-Stabilized | 45 | 133 | 1,181 | 175 | 74 | 0 | 1,608 | |||||||||||||||||||||
| Net operating income | $ | 7,981 | $ | 9,836 | $ | 11,099 | $ | 2,146 | $ | 2,104 | $ | 0 | $ | 33,166 | ||||||||||||||
| Reconciliation of NOI to net income (loss) available to common shareholders | ||||||||||||||||||||||||||||
| Depreciation/amortization | $ | (3,390 | ) | $ | (5,323 | ) | $ | (4,025 | ) | $ | (914 | ) | $ | (846 | ) | $ | (93 | ) | $ | (14,591 | ) | |||||||
| Administrative, advisory and trustee fees | 0 | 0 | 0 | 0 | 0 | (1,850 | ) | (1,850 | ) | |||||||||||||||||||
| Other expenses | 0 | 0 | 0 | 0 | 0 | (441 | ) | (441 | ) | |||||||||||||||||||
| Interest expense | (4,265 | ) | (5,379 | ) | (4,218 | ) | (993 | ) | (814 | ) | (219 | ) | (15,888 | ) | ||||||||||||||
| Interest and other income | 0 | 0 | 0 | 0 | 0 | 107 | 107 | |||||||||||||||||||||
| Income (loss) from continuing operations | 326 | (866 | ) | 2,856 | 239 | 444 | (2,496 | ) | 503 | |||||||||||||||||||
| Income from discontinued operations | 13,348 | 0 | 0 | 737 | 0 | 0 | 14,085 | |||||||||||||||||||||
| Net income (loss) | 13,674 | (866 | ) | 2,856 | 976 | 444 | (2,496 | ) | 14,588 | |||||||||||||||||||
| Net income attributable to noncontrolling interests – Operating Partnership | 0 | 0 | 0 | 0 | 0 | (2,793 | ) | (2,793 | ) | |||||||||||||||||||
| Net loss attributable to noncontrolling interests – consolidated real estate entities | 0 | 0 | 0 | 0 | 0 | 38 | 38 | |||||||||||||||||||||
| Net income (loss) attributable to Investors Real Estate Trust | 13,674 | (866 | ) | 2,856 | 976 | 444 | (5,251 | ) | 11,833 | |||||||||||||||||||
| Dividends to preferred shareholders | 0 | 0 | 0 | 0 | 0 | (593 | ) | (593 | ) | |||||||||||||||||||
| NET INCOME (LOSS) AVAILABLE TO COMMON SHAREHOLDERS | $ | 13,674 | $ | (866 | ) | $ | 2,856 | $ | 976 | $ | 444 | $ | (5,844 | ) | $ | 11,240 | ||||||||||||
| (1) | For Three Months Ended January 31, 2011, stabilized properties excluded: |
Multi-Family Residential - | Crown Apartments, Rochester, MN and Northern Valley Apartments, Rochester, MN. |
| Total number of units, 64. Occupancy % for January 31, 2011 is 79.7%. |
Commercial Office - | IRET Corporate Plaza, Minot, ND; Minot 2505 16th St SW, Minot, ND; 1st Avenue Building, Minot, ND and Omaha 10802 Farnum Drive, Omaha, NE. |
| Total square footage 128,611. Occupancy % for January 31, 2011 is 99.4%. |
Commercial Medical - | Casper 1930 E 12th Street (Park Place), Casper, WY; Casper 3955 E 12th Street (Meadow Wind), Casper, WY; Cheyenne 4010 N College Drive (Aspen Wind), Cheyenne, WY; Cheyenne 4060 N College Drive (Sierra Hills), Cheyenne, WY; Laramie 1072 N 22nd Street (Spring Wind), Laramie, WY; Billings 2300 Grant Road, Billings, MT; Missoula 3050 Great Northern Avenue, Missoula, MT and Edgewood Vista-Minot, Minot, ND. |
| Total square footage, 375,847. Occupancy % for January 31, 2011 is 100.0%. |
Commercial Industrial - | Clive 2075 NW 94th St., Clive, IA and Fargo 1320 45th Street North, Fargo, ND. |
| Total square footage, 84,754. Occupancy % for January 31, 2011 is 100.0%. |
Commercial Retail - | Minot 1400 31st Ave, Minot, ND. |
| Total square footage, 47,709. Occupancy % for January 31, 2010 is 84.0%. |
INVESTORS REAL ESTATE TRUST AND SUBSIDIARIES
NET OPERATING INCOME DETAIL
(in thousands)
| Three Months Ended January 31, 2010 | ||||||||||||||||||||||||||||
| Reporting Segments | ||||||||||||||||||||||||||||
Multi-Family Residential | Commercial Office | Commercial Medical | Commercial Industrial | Commercial Retail | Corporate and Other | Total | ||||||||||||||||||||||
| Real estate rental revenue | ||||||||||||||||||||||||||||
Stabilized(1) | $ | 16,315 | $ | 20,220 | $ | 13,207 | $ | 3,088 | $ | 3,312 | $ | 0 | $ | 56,142 | ||||||||||||||
| Non-Stabilized | 0 | 83 | 1,011 | 98 | 0 | 0 | 1,192 | |||||||||||||||||||||
| Total | 16,315 | 20,303 | 14,218 | 3,186 | 3,312 | 0 | 57,334 | |||||||||||||||||||||
| Real estate expenses | ||||||||||||||||||||||||||||
Stabilized(1) | 8,605 | 9,167 | 3,680 | 1,027 | 1,323 | 0 | 23,802 | |||||||||||||||||||||
| Non-Stabilized | 0 | 58 | 803 | 23 | (1 | ) | 0 | 883 | ||||||||||||||||||||
| Total | 8,605 | 9,225 | 4,483 | 1,050 | 1,322 | 0 | 24,685 | |||||||||||||||||||||
| Gain on involuntary conversion | ||||||||||||||||||||||||||||
| Non-Stabilized | 1,660 | 0 | 0 | 0 | 0 | 0 | 1,660 | |||||||||||||||||||||
| Total | 1,660 | 0 | 0 | 0 | 0 | 0 | 1,660 | |||||||||||||||||||||
| Net Operating Income (NOI) | ||||||||||||||||||||||||||||
Stabilized(1) | 9,370 | 11,053 | 9,527 | 2,061 | 1,989 | 0 | 34,000 | |||||||||||||||||||||
| Non-Stabilized | 0 | 25 | 208 | 75 | 1 | 0 | 309 | |||||||||||||||||||||
| Net operating income | $ | 9,370 | $ | 11,078 | $ | 9,735 | $ | 2,136 | $ | 1,990 | $ | 0 | $ | 34,309 | ||||||||||||||
| Reconciliation of NOI to net income (loss) available to common shareholders | ||||||||||||||||||||||||||||
| Depreciation/amortization | $ | (3,404 | ) | $ | (5,550 | ) | $ | (3,358 | ) | $ | (915 | ) | $ | (1,033 | ) | $ | (237 | ) | $ | (14,497 | ) | |||||||
| Administrative, advisory and trustee services | 0 | 0 | 0 | 0 | 0 | (1,790 | ) | (1,790 | ) | |||||||||||||||||||
| Other expenses | 0 | 0 | 0 | 0 | 0 | (536 | ) | (536 | ) | |||||||||||||||||||
| Interest expense | (4,282 | ) | (5,817 | ) | (4,410 | ) | (1,052 | ) | (861 | ) | (112 | ) | (16,534 | ) | ||||||||||||||
| Interest and other income | 0 | 0 | 0 | 0 | 0 | 250 | 250 | |||||||||||||||||||||
| Income (loss) from continuing operations | 1,684 | (289 | ) | 1,967 | 169 | 96 | (2,425 | ) | 1,202 | |||||||||||||||||||
| Income (loss) from discontinued operations | 63 | (6 | ) | 4 | (16 | ) | (883 | ) | 0 | (838 | ) | |||||||||||||||||
| Net income (loss) | 1,747 | (295 | ) | 1,971 | 153 | (787 | ) | (2,425 | ) | 364 | ||||||||||||||||||
| Net loss attributable to noncontrolling interests – Operating Partnership | 0 | 0 | 0 | 0 | 0 | 39 | 39 | |||||||||||||||||||||
| Net loss attributable to noncontrolling interests – consolidated real estate entities | 0 | 0 | 0 | 0 | 0 | 49 | 49 | |||||||||||||||||||||
| Net income (loss) attributable to Investors Real Estate Trust | 1,747 | (295 | ) | 1,971 | 153 | (787 | ) | (2,337 | ) | 452 | ||||||||||||||||||
| Dividends to preferred shareholders | 0 | 0 | 0 | 0 | 0 | (593 | ) | (593 | ) | |||||||||||||||||||
| NET INCOME (LOSS) AVAILABLE TO COMMON SHAREHOLDERS | $ | 1,747 | $ | (295 | ) | $ | 1,971 | $ | 153 | $ | (787 | ) | $ | (2,930 | ) | $ | (141 | ) | ||||||||||
| (1) | For Three Months ended January 31, 2010, stabilized properties excluded: |
Commercial Office - | IRET Corporate Plaza, Minot, ND; Minot 2505 16th St SW, Minot, ND and 1st Avenue Building, Minot, ND. |
| Total square footage, 80,322. Occupancy % for January 31, 2010 is 50.7%. |
Commercial Medical - | Casper 1930 E 12th Street (Park Place), Casper, WY; Casper 3955 E 12th Street (Meadow Wind), Casper, WY; Cheyenne 4010 N College Drive (Aspen Wind), Cheyenne, WY; Cheyenne 4060 N College Drive (Sierra Hills), Cheyenne, WY; Laramie 1072 N 22nd Street (Spring Wind), Laramie, WY; Billings 2300 Grant Road, Billings, MT; Missoula 3050 Great Northern Avenue, Missoula, MT and Fox River Cottages, Grand Chute, WI. |
Total square footage, 264,335. Occupancy % for January 31, 2011 is 90.0%. |
Commercial Industrial - | Clive 2075 NW 94th St., Clive, IA. |
| Total square footage, 42,510. Occupancy % for January 31, 2010 is 100.0%. |
INVESTORS REAL ESTATE TRUST AND SUBSIDIARIES
NET OPERATING INCOME DETAIL
(in thousands)
| Nine Months Ended January 31, 2011 | ||||||||||||||||||||||||||||
| Reporting Segments | ||||||||||||||||||||||||||||
Multi-Family Residential | Commercial Office | Commercial Medical | Commercial Industrial | Commercial Retail | Corporate and Other | Total | ||||||||||||||||||||||
| Real estate rental revenue | ||||||||||||||||||||||||||||
Stabilized(1) | $ | 49,228 | $ | 58,461 | $ | 40,814 | $ | 9,360 | $ | 10,317 | $ | 0 | $ | 168,180 | ||||||||||||||
| Non-Stabilized | 368 | 378 | 8,733 | 530 | 94 | 0 | 10,103 | |||||||||||||||||||||
| Total | 49,596 | 58,839 | 49,547 | 9,890 | 10,411 | 0 | 178,283 | |||||||||||||||||||||
| Real estate expenses | ||||||||||||||||||||||||||||
Stabilized(1) | 25,031 | 26,859 | 10,758 | 3,038 | 3,619 | 0 | 69,305 | |||||||||||||||||||||
| Non-Stabilized | 216 | 223 | 5,805 | 85 | 20 | 0 | 6,349 | |||||||||||||||||||||
| Total | 25,247 | 27,082 | 16,563 | 3,123 | 3,639 | 0 | 75,654 | |||||||||||||||||||||
Stabilized(1) | 24,197 | 31,602 | 30,056 | 6,322 | 6,698 | 0 | 98,875 | |||||||||||||||||||||
| Non-Stabilized | 152 | 155 | 2,928 | 445 | 74 | 0 | 3,754 | |||||||||||||||||||||
| Net operating income | $ | 24,349 | $ | 31,757 | $ | 32,984 | $ | 6,767 | $ | 6,772 | $ | 0 | $ | 102,629 | ||||||||||||||
| Reconciliation of NOI to net income (loss) available to common shareholders | ||||||||||||||||||||||||||||
| Depreciation/amortization | $ | (10,116 | ) | $ | (16,317 | ) | $ | (11,858 | ) | $ | (2,680 | ) | $ | (2,327 | ) | $ | (283 | ) | $ | (43,581 | ) | |||||||
| Administrative, advisory and trustee fees | 0 | 0 | 0 | 0 | 0 | (5,537 | ) | (5,537 | ) | |||||||||||||||||||
| Other expenses | 0 | 0 | 0 | 0 | 0 | (1,357 | ) | (1,357 | ) | |||||||||||||||||||
| Interest expense | (12,824 | ) | (16,511 | ) | (13,038 | ) | (2,994 | ) | (2,452 | ) | (576 | ) | (48,395 | ) | ||||||||||||||
| Interest and other income | 0 | 0 | 0 | 0 | 0 | 411 | 411 | |||||||||||||||||||||
| Income (loss) from continuing operations | 1,409 | (1,071 | ) | 8,088 | 1,093 | 1,993 | (7,342 | ) | 4,170 | |||||||||||||||||||
| Income (loss) from discontinued operations | 19,224 | 0 | (8 | ) | 726 | (71 | ) | 0 | 19,871 | |||||||||||||||||||
| Net income (loss) | 20,633 | (1,071 | ) | 8,080 | 1,819 | 1,922 | (7,342 | ) | 24,041 | |||||||||||||||||||
| Net income attributable to noncontrolling interests – Operating Partnership | 0 | 0 | 0 | 0 | 0 | (4,485 | ) | (4,485 | ) | |||||||||||||||||||
| Net loss attributable to noncontrolling interests – consolidated real estate entities | 0 | 0 | 0 | 0 | 0 | 82 | 82 | |||||||||||||||||||||
| Net income (loss) attributable to Investors Real Estate Trust | 20,633 | (1,071 | ) | 8,080 | 1,819 | 1,922 | (11,745 | ) | 19,638 | |||||||||||||||||||
| Dividends to preferred shareholders | 0 | 0 | 0 | 0 | 0 | (1,779 | ) | (1,779 | ) | |||||||||||||||||||
| NET INCOME (LOSS) AVAILABLE TO COMMON SHAREHOLDERS | $ | 20,633 | $ | (1,071 | ) | $ | 8,080 | $ | 1,819 | $ | 1,922 | $ | (13,524 | ) | $ | 17,859 | ||||||||||||
| (1) | For Nine Months Ended January 31, 2011, stabilized properties excluded: |
Multi-Family Residential - | Crown Apartments, Rochester, MN and Northern Valley Apartments, Rochester, MN. |
| Total number of units, 64. Occupancy % for January 31, 2011 is 79.7%. |
Commercial Office - | IRET Corporate Plaza, Minot, ND; Minot 2505 16th St SW, Minot, ND; 1st Avenue Building, Minot, ND and Omaha 10802 Farnum Drive, Omaha, NE. |
| Total square footage 128,611. Occupancy % for January 31, 2011 is 99.4%. |
Commercial Medical - | Casper 1930 E 12th Street (Park Place), Casper, WY; Casper 3955 E 12th Street (Meadow Wind), Casper, WY; Cheyenne 4010 N College Drive (Aspen Wind), Cheyenne, WY; Cheyenne 4060 N College Drive (Sierra Hills), Cheyenne, WY; Laramie 1072 N 22nd Street (Spring Wind), Laramie, WY; Billings 2300 Grant Road, Billings, MT; Missoula 3050 Great Northern Avenue, Missoula, MT and Edgewood Vista-Minot, Minot, ND. |
| Total square footage, 375,847. Occupancy % for January 31, 2011 is 100.0%. |
Commercial Industrial - | Clive 2075 NW 94th St., Clive, IA and Fargo 1320 45th Street North, Fargo, ND. |
| Total square footage, 84,754. Occupancy % for January 31, 2011 is 100.0%. |
Commercial Retail - | Minot 1400 31st Ave, Minot, ND. |
| Total square footage, 47,709. Occupancy % for January 31, 2010 is 84.0%. |
INVESTORS REAL ESTATE TRUST AND SUBSIDIARIES
NET OPERATING INCOME DETAIL
(in thousands)
| Nine Months Ended January 31, 2010 | ||||||||||||||||||||||||||||
| Reporting Segments | ||||||||||||||||||||||||||||
Multi-Family Residential | Commercial Office | Commercial Medical | Commercial Industrial | Commercial Retail | Corporate and Other | Total | ||||||||||||||||||||||
| Real estate rental revenue | ||||||||||||||||||||||||||||
Stabilized(1) | $ | 49,210 | $ | 61,817 | $ | 40,146 | $ | 9,620 | $ | 9,976 | $ | 0 | $ | 170,769 | ||||||||||||||
| Non-Stabilized | 0 | 135 | 1,011 | 186 | 0 | 0 | 1,332 | |||||||||||||||||||||
| Total | 49,210 | 61,952 | 41,157 | 9,806 | 9,976 | 0 | 172,101 | |||||||||||||||||||||
| Real estate expenses | ||||||||||||||||||||||||||||
Stabilized(1) | 24,354 | 27,632 | 11,277 | 3,114 | 3,507 | 0 | 69,884 | |||||||||||||||||||||
| Non-Stabilized | 0 | 119 | 860 | 47 | (1 | ) | 0 | 1,025 | ||||||||||||||||||||
| Total | 24,354 | 27,751 | 12,137 | 3,161 | 3,506 | 0 | 70,909 | |||||||||||||||||||||
| Gain on involuntary conversion | ||||||||||||||||||||||||||||
| Non-Stabilized | 1,660 | 0 | 0 | 0 | 0 | 0 | 1,660 | |||||||||||||||||||||
| Total | 1,660 | 0 | 0 | 0 | 0 | 0 | 1,660 | |||||||||||||||||||||
| Net Operating Income (NOI) | ||||||||||||||||||||||||||||
Stabilized(1) | 26,516 | 34,185 | 28,869 | 6,506 | 6,469 | 0 | 102,545 | |||||||||||||||||||||
| Non-Stabilized | 0 | 16 | 151 | 139 | 1 | 0 | 307 | |||||||||||||||||||||
| Net operating income | $ | 26,516 | $ | 34,201 | $ | 29,020 | $ | 6,645 | $ | 6,470 | $ | 0 | $ | 102,852 | ||||||||||||||
| Reconciliation of NOI to net income (loss) available to common shareholders | ||||||||||||||||||||||||||||
| Depreciation/amortization | $ | (9,774 | ) | $ | (16,778 | ) | $ | (10,843 | ) | $ | (2,749 | ) | $ | (2,426 | ) | $ | (394 | ) | $ | (42,964 | ) | |||||||
| Administrative, advisory and trustee services | 0 | 0 | 0 | 0 | 0 | (4,775 | ) | (4,775 | ) | |||||||||||||||||||
| Other expenses | 0 | 0 | 0 | 0 | 0 | (1,468 | ) | (1,468 | ) | |||||||||||||||||||
| Impairment of real estate investment | 0 | 0 | 0 | 0 | (708 | ) | 0 | (708 | ) | |||||||||||||||||||
| Interest expense | (12,648 | ) | (17,579 | ) | (12,942 | ) | (3,053 | ) | (2,684 | ) | (400 | ) | (49,306 | ) | ||||||||||||||
| Interest and other income | 0 | 0 | 0 | 0 | 0 | 503 | 503 | |||||||||||||||||||||
| Income (loss) from continuing operations | 4,094 | (156 | ) | 5,235 | 843 | 652 | (6,534 | ) | 4,134 | |||||||||||||||||||
| Income (loss) from discontinued operations | 30 | (169 | ) | 10 | (16 | ) | (857 | ) | 1 | (1,001 | ) | |||||||||||||||||
| Net income (loss) | 4,124 | (325 | ) | 5,245 | 827 | (205 | ) | (6,533 | ) | 3,133 | ||||||||||||||||||
| Net income attributable to noncontrolling interests – Operating Partnership | 0 | 0 | 0 | 0 | 0 | (381 | ) | (381 | ) | |||||||||||||||||||
| Net loss attributable to noncontrolling interests – consolidated real estate entities | 0 | 0 | 0 | 0 | 0 | 2 | 2 | |||||||||||||||||||||
| Net income (loss) attributable to Investors Real Estate Trust | 4,124 | (325 | ) | 5,245 | 827 | (205 | ) | (6,912 | ) | 2,754 | ||||||||||||||||||
| Dividends to preferred shareholders | 0 | 0 | 0 | 0 | 0 | (1,779 | ) | (1,779 | ) | |||||||||||||||||||
| NET INCOME (LOSS) AVAILABLE TO COMMON SHAREHOLDERS | $ | 4,124 | $ | (325 | ) | $ | 5,245 | $ | 827 | $ | (205 | ) | $ | (8,691 | ) | $ | 975 | |||||||||||
| (1) | For Nine Months ended January 31, 2010, stabilized properties excluded: |
Commercial Office - | IRET Corporate Plaza, Minot, ND; Minot 2505 16th St SW, Minot, ND and 1st Avenue Building, Minot, ND. |
| Total square footage, 80,322. Occupancy % for January 31, 2010 is 50.7%. |
Commercial Medical - | Casper 1930 E 12th Street (Park Place), Casper, WY; Casper 3955 E 12th Street (Meadow Wind), Casper, WY; Cheyenne 4010 N College Drive (Aspen Wind), Cheyenne, WY; Cheyenne 4060 N College Drive (Sierra Hills), Cheyenne, WY; Laramie 1072 N 22nd Street (Spring Wind), Laramie, WY; Billings 2300 Grant Road, Billings, MT; Missoula 3050 Great Northern Avenue, Missoula, MT and Fox River Cottages, Grand Chute, WI. |
Total square footage, 264,335. Occupancy % for January 31, 2011 is 90.0%. |
Commercial Industrial - | Clive 2075 NW 94th St., Clive, IA. |
| Total square footage, 42,510. Occupancy % for January 31, 2010 is 100.0%. |
INVESTORS REAL ESTATE TRUST AND SUBSIDIARIES
STABILIZED PROPERTIES AND ALL PROPERTIES PHYSICAL OCCUPANCY LEVELS BY SEGMENT
3rd Quarter Fiscal 2011 vs. 3rd Quarter Fiscal 2010
| Segments | Stabilized Properties | All Properties | ||
3rd Quarter | 3rd Quarter | 3rd Quarter | 3rd Quarter | |
| Fiscal 2011 | Fiscal 2010 | Fiscal 2011 | Fiscal 2010 | |
| Multi-Family Residential | 91.2% | 89.6% | 91.1% | 89.6% |
| Commercial Office | 79.6% | 84.3% | 80.1% | 83.7% |
| Commercial Medical | 95.4% | 95.8% | 96.0% | 95.2% |
| Commercial Industrial | 81.1% | 86.1% | 81.7% | 86.3% |
| Commercial Retail | 82.4% | 81.9% | 82.5% | 81.9% |
INVESTORS REAL ESTATE TRUST AND SUBSIDIARIES
COMMERCIAL LEASING SUMMARY
for the three and nine months ended January 31, 2011
| Three Months Ended January 31, 2011 | ||||||||||||||||||||||||
New(1) | Renew(2) | Total | Expiring(3) | Net Change | Percentage Change | |||||||||||||||||||
| Gross Square Footage | ||||||||||||||||||||||||
| Commercial Office | 68,281 | 104,996 | 173,277 | 16,795 | 156,482 | |||||||||||||||||||
| Commercial Medical | 11,686 | 13,785 | 25,471 | 7,604 | 17,867 | |||||||||||||||||||
| Commercial Industrial | 0 | 211,322 | 211,322 | 32,874 | 178,448 | |||||||||||||||||||
| Commercial Retail | 4,666 | 122,879 | 127,545 | 15,596 | 111,949 | |||||||||||||||||||
| Total All Segments | 84,633 | 452,982 | 537,615 | 72,869 | 464,746 | |||||||||||||||||||
Weighted Average Rental Rates(3) | ||||||||||||||||||||||||
| Commercial Office | $ | 18.36 | $ | 10.29 | $ | 13.47 | $ | 10.11 | $ | 3.36 | 33.2 | % | ||||||||||||
| Commercial Medical | 19.37 | 20.57 | 20.02 | 16.51 | 3.51 | 21.3 | % | |||||||||||||||||
| Commercial Industrial | 0.00 | 3.50 | 3.50 | 3.50 | 0.00 | 0.0 | % | |||||||||||||||||
| Commercial Retail | 5.66 | 3.28 | 3.36 | 8.99 | (5.63 | ) | (62.6 | %) | ||||||||||||||||
| Total All Segments | $ | 17.80 | $ | 5.53 | $ | 7.46 | $ | 7.55 | $ | (0.09 | ) | (1.2 | %) | |||||||||||
| Nine Months Ended January 31, 2011 | ||||||||||||||||||||||||
New(1) | Renew(2) | Total | Expiring(3) | Net Change | Percentage Change | |||||||||||||||||||
| Gross Square Footage | ||||||||||||||||||||||||
| Commercial Office | 233,490 | 264,781 | 498,271 | 425,246 | 73,025 | |||||||||||||||||||
| Commercial Medical | 61,721 | 38,236 | 99,957 | 44,463 | 55,494 | |||||||||||||||||||
| Commercial Industrial | 116,119 | 427,939 | 544,058 | 339,404 | 204,654 | |||||||||||||||||||
| Commercial Retail | 24,993 | 161,968 | 186,961 | 182,798 | 4,163 | |||||||||||||||||||
| Total All Segments | 436,323 | 892,924 | 1,329,247 | 991,911 | 337,336 | |||||||||||||||||||
Weighted Average Rental Rates(3) | ||||||||||||||||||||||||
| Commercial Office | $ | 13.30 | $ | 10.37 | $ | 11.74 | $ | 12.18 | $ | (0.44 | ) | (3.6 | %) | |||||||||||
| Commercial Medical | 20.83 | 20.38 | 20.66 | 19.13 | 1.53 | 8.0 | % | |||||||||||||||||
| Commercial Industrial | 6.75 | 3.06 | 3.85 | 3.36 | 0.49 | 14.6 | % | |||||||||||||||||
| Commercial Retail | 10.32 | 3.78 | 4.65 | 8.49 | (3.84 | ) | (45.2 | %) | ||||||||||||||||
| Total All Segments | $ | 12.45 | $ | 6.10 | $ | 8.19 | $ | 8.79 | $ | (0.60 | ) | (6.8 | %) | |||||||||||
| Three Months Ended January 31, 2011 | Nine Months Ended January 31, 2011 | |||||||||||
New(1) | Renew(2) | Total | New(1) | Renew(2) | Total | |||||||
| Weighted Average Term of New/Renewed Leased | ||||||||||||
| Commercial Office | 7.9 | 5.6 | 7.1 | 7.2 | 4.1 | 5.7 | ||||||
| Commercial Medical | 9.2 | 9.0 | 9.1 | 7.0 | 7.4 | 7.2 | ||||||
| Commercial Industrial | 0.0 | 5.2 | 5.2 | 3.6 | 3.3 | 3.4 | ||||||
| Commercial Retail | 2.5 | 3.7 | 3.5 | 2.9 | 2.7 | 2.7 | ||||||
| Total All Segments | 7.7 | 5.6 | 6.6 | 6.0 | 4.0 | 4.9 | ||||||
| (1) | Does not include leases in place on acquired properties. |
| (2) | Renewals may include leases that have renewed prior to expiration date. Square footage or rental rate changes on renewals are included in calculation. |
| (3) | Expired leases include leases with tenants who have vacated or renewed. Excluded from expired leases are leases that have been amended to extend the term, including leases on a month-to-month basis. |
INVESTORS REAL ESTATE TRUST AND SUBSIDIARIES
COMMERCIAL LEASING SUMMARY
for the three and nine months ended January 31, 2011
3rd Quarter Fiscal 2011 Total | Year-To-Date Total | |||||||||||||||||||||||
| New | Renew | Total Dollars | New | Renew | Total Dollars | |||||||||||||||||||
| Tenant Improvements | ||||||||||||||||||||||||
| Commercial Office | $ | 595,501 | $ | 585,161 | $ | 1,180,662 | $ | 1,905,668 | $ | 668,634 | $ | 2,574,302 | ||||||||||||
| Commercial Medical | 410,508 | 283,270 | 693,778 | 446,508 | 292,110 | 738,618 | ||||||||||||||||||
| Commercial Industrial | 0 | 24,000 | 24,000 | 63,400 | 72,000 | 135,400 | ||||||||||||||||||
| Commercial Retail | 5,663 | 10,000 | 15,663 | 20,663 | 10,000 | 30,663 | ||||||||||||||||||
| Subtotal | $ | 1,011,672 | $ | 902,431 | $ | 1,914,103 | $ | 2,436,239 | $ | 1,042,744 | $ | 3,478,983 | ||||||||||||
| Tenant Improvements per square foot | ||||||||||||||||||||||||
| Commercial Office | $ | 8.72 | $ | 5.57 | $ | 6.81 | $ | 8.16 | $ | 2.53 | $ | 5.17 | ||||||||||||
| Commercial Medical | 35.13 | 20.55 | 27.24 | 7.23 | 7.64 | 7.39 | ||||||||||||||||||
| Commercial Industrial | 0.00 | 0.11 | 0.11 | 0.55 | 0.17 | 0.25 | ||||||||||||||||||
| Commercial Retail | 1.21 | 0.08 | 0.12 | 0.83 | 0.06 | 0.16 | ||||||||||||||||||
| All Segments | $ | 11.95 | $ | 1.99 | $ | 3.56 | $ | 5.58 | $ | 1.17 | $ | 2.62 | ||||||||||||
| Leasing Costs | ||||||||||||||||||||||||
| Commercial Office | $ | 582,096 | $ | 626,528 | $ | 1,208,624 | $ | 2,571,252 | $ | 1,171,855 | $ | 3,743,107 | ||||||||||||
| Commercial Medical | 101,919 | 93,505 | 195,424 | 113,494 | 159,543 | 273,037 | ||||||||||||||||||
| Commercial Industrial | 0 | 110,944 | 110,944 | 68,521 | 155,814 | 224,335 | ||||||||||||||||||
| Commercial Retail | 8,664 | 53,665 | 62,329 | 83,493 | 79,162 | 162,655 | ||||||||||||||||||
| Subtotal | $ | 692,679 | $ | 884,642 | $ | 1,577,321 | $ | 2,836,760 | $ | 1,566,374 | $ | 4,403,134 | ||||||||||||
| Leasing Costs per square foot | ||||||||||||||||||||||||
| Commercial Office | $ | 8.53 | $ | 5.97 | $ | 6.98 | $ | 11.01 | $ | 4.43 | $ | 7.51 | ||||||||||||
| Commercial Medical | 8.72 | 6.78 | 7.67 | 1.84 | 4.17 | 2.73 | ||||||||||||||||||
| Commercial Industrial | 0.00 | 0.52 | 0.52 | 0.59 | 0.36 | 0.41 | ||||||||||||||||||
| Commercial Retail | 1.86 | 0.44 | 0.49 | 3.34 | 0.49 | 0.87 | ||||||||||||||||||
| All Segments | $ | 8.18 | $ | 1.95 | $ | 2.93 | $ | 6.50 | $ | 1.75 | $ | 3.31 | ||||||||||||
| Tenant Improvements and Leasing Costs | ||||||||||||||||||||||||
| Commercial Office | $ | 1,177,597 | $ | 1,211,689 | $ | 2,389,286 | $ | 4,476,920 | $ | 1,840,489 | $ | 6,317,409 | ||||||||||||
| Commercial Medical | 512,427 | 376,775 | 889,202 | 560,002 | 451,653 | 1,011,655 | ||||||||||||||||||
| Commercial Industrial | 0 | 134,944 | 134,944 | 131,921 | 227,814 | 359,735 | ||||||||||||||||||
| Commercial Retail | 14,327 | 63,665 | 77,992 | 104,156 | 89,162 | 193,318 | ||||||||||||||||||
| Total | $ | 1,704,351 | $ | 1,787,073 | $ | 3,491,424 | $ | 5,272,999 | $ | 2,609.118 | $ | 7,882,117 | ||||||||||||
| Tenant Improvements and Leasing Costs per square foot | ||||||||||||||||||||||||
| Commercial Office | $ | 17.25 | $ | 11.54 | $ | 13.79 | $ | 19.17 | $ | 6.95 | $ | 12.68 | ||||||||||||
| Commercial Medical | 43.85 | 27.33 | 34.91 | 9.07 | 11.81 | 10.12 | ||||||||||||||||||
| Commercial Industrial | 0.00 | 0.64 | 0.64 | 1.14 | 0.53 | 0.66 | ||||||||||||||||||
| Commercial Retail | 3.07 | 0.52 | 0.61 | 4.17 | 0.55 | 1.03 | ||||||||||||||||||
| All Segments | $ | 20.14 | $ | 3.95 | $ | 6.49 | $ | 12.09 | $ | 2.92 | $ | 5.93 | ||||||||||||
INVESTORS REAL ESTATE TRUST AND SUBSIDIARIES
MULTI-FAMILY RESIDENTIAL SUMMARY
| Three Months Ended | ||||||||||||||||||||
| 01/31/2011 | 10/31/2010 | 07/31/2010 | 04/30/2010 | 01/31/2010 | ||||||||||||||||
| Number of Units | 8,593 | 8,590 | 8,590 | 8,590 | 8,526 | |||||||||||||||
| Average Investment Per Unit | ||||||||||||||||||||
| Stabilized | $ | 55,783 | $ | 55,477 | $ | 55,197 | $ | 54,934 | $ | 54,476 | ||||||||||
| Non-Stabilized | 66,955 | 66,818 | 66,736 | 66,719 | 0 | |||||||||||||||
| $ | 55,866 | $ | 55,561 | $ | 55,283 | $ | 54,963 | $ | 54,476 | |||||||||||
| Average Scheduled Rent per Unit | ||||||||||||||||||||
| Stabilized | $ | 697 | $ | 698 | $ | 696 | $ | 694 | $ | 693 | ||||||||||
| Non-Stabilized | 764 | 772 | 758 | 1,017 | 0 | |||||||||||||||
| $ | 697 | $ | 699 | $ | 696 | $ | 695 | $ | 693 | |||||||||||
| Total Receipts per Unit | ||||||||||||||||||||
| Stabilized | $ | 655 | $ | 642 | $ | 627 | $ | 634 | $ | 638 | ||||||||||
| Non-Stabilized | 626 | 673 | 618 | 961 | 0 | |||||||||||||||
| $ | 655 | $ | 642 | $ | 627 | $ | 634 | $ | 638 | |||||||||||
Total Recurring Capital Expenditures per Unit(1) | ||||||||||||||||||||
| Stabilized | $ | 145 | $ | 166 | $ | 132 | $ | 124 | $ | 104 | ||||||||||
| Non-Stabilized | 278 | 25 | 0 | 0 | 0 | |||||||||||||||
| $ | 146 | $ | 165 | $ | 131 | $ | 123 | $ | 104 | |||||||||||
| Physical Occupancy% | ||||||||||||||||||||
| Stabilized | 91.2 | % | 90.6 | % | 85.7 | % | 89.7 | % | 89.6 | % | ||||||||||
| Non-Stabilized | 79.7 | % | 89.1 | % | 90.6 | % | 95.3 | % | 0.0 | % | ||||||||||
| 91.1 | % | 90.6 | % | 85.8 | % | 89.7 | % | 89.6 | % | |||||||||||
| Operating Expenses as a % of Scheduled Rent | ||||||||||||||||||||
| Stabilized | 49.7 | % | 46.0 | % | 44.9 | % | 46.4 | % | 48.6 | % | ||||||||||
| Non-Stabilized | 50.8 | % | 52.3 | % | 43.8 | % | 18.9 | % | 0.0 | % | ||||||||||
| Total | 49.7 | % | 46.1 | % | 44.9 | % | 46.3 | % | 48.6 | % | ||||||||||
| (1) | See Definitions on page 27. |
INVESTORS REAL ESTATE TRUST AND SUBSIDIARIES
10 LARGEST COMMERCIAL TENANTS – BASED ON ANNUALIZED BASE RENT(1)
as of January 31, 2011
| Tenant | Number of Properties | Average Remaining Lease Term in Months | % of Total Commercial Segments’ Minimum Rents | Aggregate Rentable Square Feet | % of Aggregate Occupied Square Feet |
| Affiliates of Edgewood Vista | 20 | 212 | 10.7% | 1,029,967 | 10.0% |
| St. Lukes Hospital of Duluth, Inc. | 6 | 60 | 3.4% | 198,775 | 1.9% |
| Fairview Health Services | 9 | 65 | 2.6% | 198,233 | 1.9% |
| Applied Underwriters | 3 | 73 | 2.2% | 141,724 | 1.4% |
| Affiliates of Siemens USA | 2 | 13 | 2.1% | 186,224 | 1.8% |
| HealthEast Care System | 1 | 97 | 1.6% | 114,316 | 1.1% |
| Microsoft (NASDAQ: MSFT) | 1 | 31 | 1.4% | 122,040 | 1.2% |
| Smurfit - Stone Container (NASDAQ: SSCC) | 2 | 58 | 1.4% | 406,397 | 4.0% |
| Nebraska Orthopedic Hospital | 1 | 218 | 1.3% | 61,758 | 0.6% |
| Arcadis Corporate Services, Inc. | 1 | 198 | 1.2% | 71,430 | 0.7% |
| Total/Weighted Average | 103 | 27.9% | 2,530,864 | 24.6% |
| (1) | See Definitions on page 27. |
INVESTORS REAL ESTATE TRUST AND SUBSIDIARIES
LEASE EXPIRATIONS
as of January 31, 2011
| Fiscal Year | Number of Leases | Rentable Square Feet | % of Rentable Square Feet | Annualized Rent* | Average Rental Rate | % of Annualized Rent | ||||||||||||||||||
| Commercial Office | ||||||||||||||||||||||||
| 2011 | 19 | 103,979 | 2.6 | % | $ | 1,359,499 | $ | 13.07 | 2.4 | % | ||||||||||||||
| 2012 | 63 | 760,075 | 19.1 | % | 10,511,796 | 13.83 | 18.9 | % | ||||||||||||||||
| 2013 | 43 | 508,210 | 12.7 | % | 6,911,502 | 13.60 | 12.4 | % | ||||||||||||||||
| 2014 | 44 | 600,166 | 15.0 | % | 7,897,347 | 13.16 | 14.2 | % | ||||||||||||||||
| 2015 | 48 | 400,810 | 10.1 | % | 5,766,277 | 14.39 | 10.4 | % | ||||||||||||||||
| 2016 and thereafter | 65 | 1,617,657 | 40.5 | % | 23,179,260 | 14.33 | 41.7 | % | ||||||||||||||||
| 282 | 3,990,897 | 100.0 | % | $ | 55,625,681 | $ | 13.94 | 100.0 | % | |||||||||||||||
| Commercial Medical | ||||||||||||||||||||||||
| 2011 | 4 | 9,544 | 0.4 | % | $ | 170,207 | $ | 17.83 | 0.4 | % | ||||||||||||||
| 2012 | 30 | 107,226 | 4.1 | % | 2,222,813 | 20.73 | 4.7 | % | ||||||||||||||||
| 2013 | 20 | 109,006 | 4.2 | % | 2,405,253 | 22.07 | 5.1 | % | ||||||||||||||||
| 2014 | 28 | 393,484 | 15.2 | % | 7,162,578 | 18.20 | 15.2 | % | ||||||||||||||||
| 2015 | 11 | 54,310 | 2.1 | % | 1,313,691 | 24.19 | 2.8 | % | ||||||||||||||||
| 2016 and thereafter | 96 | 1,921,488 | 74.0 | % | 33,835,023 | 17.61 | 71.8 | % | ||||||||||||||||
| 189 | 2,595,058 | 100.0 | % | $ | 47,109,565 | $ | 18.15 | 100.0 | % | |||||||||||||||
| Commercial Industrial | ||||||||||||||||||||||||
| 2011 | 2 | 8,064 | 0.3 | % | $ | 32,292 | $ | 4.00 | 0.4 | % | ||||||||||||||
| 2012 | 7 | 810,405 | 35.0 | % | 2,205,960 | 2.72 | 23.7 | % | ||||||||||||||||
| 2013 | 2 | 142,185 | 6.2 | % | 685,357 | 4.82 | 7.4 | % | ||||||||||||||||
| 2014 | 7 | 227,214 | 9.8 | % | 915,251 | 4.03 | 9.8 | % | ||||||||||||||||
| 2015 | 3 | 116,685 | 5.1 | % | 536,907 | 4.60 | 5.8 | % | ||||||||||||||||
| 2016 and thereafter | 13 | 1,010,026 | 43.6 | % | 4,911,455 | 4.86 | 52.9 | % | ||||||||||||||||
| 34 | 2,314,579 | 100.0 | % | $ | 9,287,222 | $ | 4.01 | 100.0 | % | |||||||||||||||
| Commercial Retail | ||||||||||||||||||||||||
| 2011 | 9 | 19,591 | 1.7 | % | $ | 174,901 | $ | 8.93 | 1.9 | % | ||||||||||||||
| 2012 | 45 | 309,900 | 27.4 | % | 1,684,466 | 5.44 | 18.1 | % | ||||||||||||||||
| 2013 | 27 | 87,533 | 7.7 | % | 640,090 | 7.31 | 6.9 | % | ||||||||||||||||
| 2014 | 28 | 102,678 | 9.1 | % | 998,612 | 9.73 | 10.7 | % | ||||||||||||||||
| 2015 | 24 | 230,849 | 20.4 | % | 1,970,962 | 8.54 | 21.1 | % | ||||||||||||||||
| 2016 and thereafter | 33 | 381,928 | 33.7 | % | 3,845,481 | 10.07 | 41.3 | % | ||||||||||||||||
| 166 | 1,132,479 | 100.0 | % | $ | 9,314,512 | $ | 8.22 | 100.0 | % | |||||||||||||||
| Commercial Total | ||||||||||||||||||||||||
| 2011 | 34 | 141,178 | 1.4 | % | $ | 1,736,899 | $ | 12.30 | 1.4 | % | ||||||||||||||
| 2012 | 145 | 1,987,606 | 19.8 | % | 16,625,035 | 8.36 | 13.7 | % | ||||||||||||||||
| 2013 | 92 | 846,934 | 8.4 | % | 10,642,202 | 12.57 | 8.8 | % | ||||||||||||||||
| 2014 | 107 | 1,323,542 | 13.2 | % | 16,973,788 | 12.82 | 14.0 | % | ||||||||||||||||
| 2015 | 86 | 802,654 | 8.0 | % | 9,587,837 | 11.95 | 7.9 | % | ||||||||||||||||
| 2016 and thereafter | 207 | 4,931,099 | 49.2 | % | 65,771,219 | 13.34 | 54.2 | % | ||||||||||||||||
| 671 | 10,033,013 | 100.0 | % | $ | 121,336,980 | $ | 12.09 | 100.0 | % | |||||||||||||||
* Annualized Rent is monthly scheduled rent as of January 31, 2011 (cash basis), multiplied by 12.
INVESTORS REAL ESTATE TRUST AND SUBSIDIARIES
FISCAL 2011 ACQUISITION SUMMARY
as of January 31, 2011
($’s in thousands)
| Property | Location | Segment Type | Acquisition Date | Square Feet/Units | Leased Percentage At Acquisition | January 31, 2011 Leased Percentage | Acquisition Cost | ||||||||||||
Fargo 1320 45th Street N(1) | Fargo, ND | Commercial Industrial | June 22, 2010 | 42,244 | 100.0 | % | 100.0 | % | $ | 1,634 | |||||||||
| Billings 2300 Grant Road | Billings, MT | Commercial Medical | July 15, 2010 | 14,705 | 100.0 | % | 100.0 | % | 2,522 | ||||||||||
| Missoula 3050 Great Northern Ave | Missoula, MT | Commercial Medical | July 15, 2010 | 14,640 | 100.0 | % | 100.0 | % | 2,723 | ||||||||||
| Edgewood Vista-Minot | Minot, ND | Commercial Medical | November 10, 2010 | 108,503 | 100.0 | % | 100.0 | % | 15,181 | ||||||||||
Minot 1400 31st Avenue | Minot, ND | Commercial Retail | December 10, 2010 | 47,709 | 100.0 | % | 84.0 | % | 8,250 | ||||||||||
| Omaha 10802 Farnum Drive | Omaha, NE | Commercial Office | December 16, 2010 | 58,574 | 100.0 | % | 98.6 | % | 8,295 | ||||||||||
Edgewood Vista-Spearfish(2) | Spearfish, SD | Commercial Medical | January 10, 2011 | 23,965 | 100.0 | % | 100.0 | % | 2,280 | ||||||||||
| Total Square Feet | 310,340 | $ | 40,885 | ||||||||||||||||
| Total Units | 0 | ||||||||||||||||||
| (1) | Development property placed in service June 22, 2010. Additional costs incurred in fiscal year 2010 totaled $2.3 million for a total project cost at July 31, 2010 of $3.9 million. |
| (2) | Expansion project placed in service January10, 2011. |
INVESTORS REAL ESTATE TRUST AND SUBSIDIARIES
FISCAL 2011 DEVELOPMENT SUMMARY
as of January 31, 2011
($’s in thousands)
| Property and Location | Total Rentable Square Feet or # of Units | Percentage Leased or Committed | Anticipated Total Cost | Cost to Date | Anticipated Construction Completion | |||||||||
| Multi-Family Conversion - Minot, ND | Convert 15,446 sf. commercial office to 24 multi-family residential units | 0 | % | 2,200 | 185 | 1st Quarter Fiscal 2012 | ||||||||
| Buffalo Mall Theaters - Jamestown, ND | 19,037 sf. | 100 | % | 2,100 | 746 | 1st Quarter Fiscal 2012 | ||||||||
| Georgetown Square Condos - Grand Chute, WI | 8 condo units | 0 | % | NA | 1,697 | 2nd Quarter Fiscal 2012 | ||||||||
| Trinity Hospital Build-to-Suit, Minot, ND | 22,000 sf. one story medical clinic | 100 | % | 6,200 | 1,294 | 1st Quarter Fiscal 2012 | ||||||||
| Senior Housing Memory Care Conversion, Cheyenne, WY | Convert portion of the building for a specialized memory care unit | 100 | % | 309 | 309 | 4th Quarter Fiscal 2011 | ||||||||
| Total | $ | 10,809 | $ | 4,231 | ||||||||||
Definitions
January 31, 2011
Annualized base rent (ABR) is calculated as monthly base rent (cash basis) per the lease, as of the reporting period, multiplied by 12.
Debt to total market capitalization is total debt from the balance sheet divided by the sum of total debt from the balance sheet plus the market value of shares outstanding at the end of the period.
Debt service coverage ratio is computed by dividing earnings before interest income and expense, depreciation, amortization and gain on sale of real estate by interest expense and principal amortization.
EBITDA is earnings before interest, taxes, depreciation and amortization. We consider EBITDA to be an appropriate supplemental performance measure because it eliminates depreciation, interest and the gain/loss from property dispositions, which permits investors to view income from operations without the effect of non-cash depreciation or the cost of debt; however, EBIDTA as we calculate it has not been adjusted for the effect of nonrecurring events such as asset impairment and gain/loss on involuntary conversion. EBITDA is a non-GAAP measure. EBITDA as calculated by us is not comparable to EBITDA reported by other REITs that do not define EBITDA exactly as we do.
Funds from operations (FFO) - The National Association of Real Estate Investment Trusts, Inc. (NAREIT) defines FFO as “net income (computed in accordance with generally accepted accounting principles, excluding gains (or losses) from sales of property, plus real estate depreciation and amortization, and adjustments for unconsolidated partnerships and joint ventures. Adjustments for unconsolidated partnerships and joint ventures will be calculated to reflect funds from operations on the same basis.” FFO is a non-GAAP measure. We consider FFO to be a standard supplemental measure for equity real estate investment trusts because it facilitates an understanding of the operating performance of properties without giving effect to real estate depreciation and amortization, which assume that the value of real estate assets diminishes predictably over time. Since real estate values instead historically rise or fall with market conditions, we believe that FFO provides investors and management with a more accurate indication of our financial and operating results.
Net Operating Income is total real estate revenues less real estate expenses and real estate taxes (which consist of utilities, maintenance, real estate taxes, insurance and property management expenses).
Payout ratio (FFO per share and unit basis) - The ratio of the current quarterly or annual distribution rate per common share and unit divided by quarterly or annual FFO per share and unit.
Ratio of earnings to fixed charges - The ratio of earnings to fixed charges is computed by dividing earnings by fixed charges. For this purpose, earnings consist of income from continuing operations plus fixed charges and preferred distributions, less adjustments for noncontrolling interests - consolidated real estate entities, capitalized interest and preferred distributions. Fixed charges consist of mortgage and loan interest expense, whether expensed or capitalized, the amortization of debt expense and capitalized interest.
Ratio of earnings to combined fixed charges and preferred distributions - The ratio of earnings to combined fixed charges and preferred distributions is computed by dividing earnings by combined fixed charges and preferred distributions. For this purpose, earnings consist of income from continuing operations plus fixed charges and preferred distributions, less adjustments for noncontrolling interests - consolidated real estate entities, capitalized interest and preferred distributions. Combined fixed charges and preferred distributions consist of fixed charges (mortgage and loan interest expense, whether expensed or capitalized, the amortization of debt expense and capitalized interest) and preferred distributions.
Recurring capital expenditures are costs that increase the value and extend the useful life of a property. Ordinary repair and maintenance costs that do not extend the useful life of the asset are expensed as incurred. Costs incurred on a lease turnover due to normal wear and tear by the resident are expensed on the turn. Recurring capital improvements typically include appliances, carpeting and flooring, and kitchen/bath cabinets.
Stabilized properties are those properties owned for the entirety of both periods being compared, and, in the case of development or re-development properties, which have achieved a target level of occupancy.