Exhibit 99.2

Fourth Quarter Fiscal 2013
Supplemental Operating and Financial Data
for the Quarter Ended April 30, 2013
CONTACT: Lindsey Knoop-Anderson Director of Investor Relations Direct Dial: 701-837-4738 E-Mail: landerson@iret.com | 1400 31st Avenue SW, Suite 60 Minot, ND 58701 Tel: 701.837.4738 Fax: 701.838.7785 www.iret.com |
Supplemental Financial and Operating Data
April 30, 2013
| Page | |
Company Background and Highlights | 2 |
Property Cost by Segment | 5 |
| Key Financial Data | |
Condensed Consolidated Balance Sheets | 6 |
Condensed Consolidated Statements of Operations | 7 |
Funds From Operations | 8 |
Earnings Before Interest, Taxes, Depreciation and Amortization (EBITDA) | 9 |
| Capital Analysis | |
Long-Term Mortgage Debt Analysis | 10 |
Long-Term Mortgage Debt Detail | 11-13 |
Capital Analysis | 14 |
| Portfolio Analysis | |
Stabilized Properties Net Operating Income Summary | 15 |
Net Operating Income Detail | 16-19 |
Stabilized Properties and Overall Physical Occupancy Levels by Segment | 20 |
| Tenant Analysis | |
Commercial Leasing Summary | 21-22 |
Multi-Family Residential Summary | 23 |
10 Largest Commercial Tenants - Based on Annualized Base Rent | 24 |
Lease Expirations | 25 |
| Growth and Strategy | |
Acquisition Summary | 26 |
Development Summary | 27 |
Definitions | 28 |
1
Company Background and Highlights
Fourth Quarter Fiscal 2013
Investors Real Estate Trust is a self-administered, equity real estate investment trust (REIT) investing in a portfolio of income-producing properties located primarily in the upper Midwest. IRET's portfolio is diversified among multi-family residential; commercial office; commercial healthcare, including senior housing (formerly referred to as the commercial medical segment; the composition of this segment has not changed from prior periods); commercial industrial and commercial retail segments.
During the fourth quarter of fiscal year 2013, the Company closed on its acquisitions of:
| · | a parcel of vacant land in Grand Forks, North Dakota, acquired for possible future development, of approximately 10 acres for a purchase price of $1.6 million, paid in cash; |
| · | a parcel of vacant land in Bismarck, North Dakota, acquired for possible future development, of approximately 18.2 acres for a purchase price of $3.3 million, paid in cash; |
| · | a 336-unit multi-family residential property in Omaha, Nebraska, for a purchase price of $28.3 million, of which approximately $25.8 million was paid in cash and the remainder in limited partnership units of the Operating Partnership valued at $2.5 million; and |
| · | a parcel of vacant land in Golden Valley, Minnesota, acquired for possible future development, of approximately 2.1 acres for a purchase price of $2.1 million, paid in cash. |
During the fourth quarter of fiscal year 2013, the Company placed in service an approximately 3,700 square foot commercial retail building in Minot, North Dakota and completed the conversion of an existing approximately 15,000 square foot commercial office building in Minot, North Dakota to a 20-unit multi-family residential property.
During the fourth quarter of fiscal year 2013, the Company sold one commercial healthcare property for a total sales price of approximately $16.1 million.
On April 5, 2013, the Company completed a public offering of approximately 6.0 million common shares at a public offering price of $9.25 per share, for net proceeds to the Company of approximately $53.0 million after underwriting discounts and estimated offering expenses. The Company contributed the proceeds of the offering to its IRET Properties, its operating partnership, for general corporate purposes, including acquisitions and development and debt repayment.
During the Company's fiscal year 2013, high occupancy levels in the Company's multi-family residential portfolio allowed the Company to implement selected rent increases, and the Company expects to see continued favorable results in this segment in fiscal year 2014. However, the Company's ability to maintain occupancy levels and selectively raise rents remains dependent on continued economic recovery and employment and wage growth. The Company also observes considerable multi-family development activity in the Company's markets, and as this new construction is completed and leased, the Company expects to experience increased competition for tenants. The Company's commercial office segment also showed some progress, with new leasing activity matching absorption rates in the Company's Minneapolis market and in other of its office markets. However, these absorption rates remain low, and the Company continues to expect recovery of the overall office market to be challenged by the slow and uneven recovery of the broader economy and by relatively high unemployment rates.
In the fourth quarter of fiscal year 2013, IRET paid its 168th consecutive quarterly distribution. The $0.1300 per share/unit distribution was payable on April 1, 2013. Subsequent to the end of the fourth quarter of fiscal year 2013, on June 3, 2013, the Company's Board of Trustees declared a regular quarterly distribution of $0.1300 per share and unit on the Company's common shares of beneficial interest and the limited partnership units of IRET Properties, payable July 1, 2013 to common shareholders and unitholders of record on June 14, 2013. Also on June 3, 2013, the Company's Board of Trustees' declared a distribution of $0.5156 per share on the Company's Series A preferred shares of beneficial interest, payable July 1, 2013 to Series A preferred shareholders of record on June 14, 2013, and declared a distribution of $0.4968 per share on the Company's Series B preferred shares of beneficial interest, payable July 1, 2013 to Series B preferred shareholders of record on June 14, 2013.
As of April 30, 2013, IRET owns a diversified portfolio of 269 properties consisting of 87 multi-family residential properties, 67 commercial office properties, 65 commercial healthcare properties (including senior housing), 20 commercial industrial properties and 30 commercial retail properties. IRET's common shares are publicly traded on the New York Stock Exchange (NYSE: IRET).
2
Company Snapshot
(as of April 30, 2013)
Company Headquarters | Minot, North Dakota |
Fiscal Year-End | April 30 |
Reportable Segments | Multi-Family Residential, Commercial Office, Commercial Healthcare, Commercial Industrial, Commercial Retail |
Total Properties | 269 |
| Total Square Feet | |
(commercial properties) | 12.4 million |
| Total Units | |
(multi-family residential properties) | 10,280 |
Common Shares Outstanding (thousands) | 101,488 |
| Limited Partnership Units Outstanding (thousands) | 21,635 |
| Common Share Distribution - Quarter/Annualized | $0.13/$0.52 |
Dividend Yield | 5.3% |
Total Capitalization (see p.14 for detail) | $2.4 billion |
Investor Information
Board of Trustees
Jeffrey L. Miller | Trustee and Chairman |
Stephen L. Stenehjem | Trustee |
John D. Stewart | Trustee, Vice Chairman, and Chair of Audit Committee |
John T. Reed | Trustee, Chair of Nominating and Governance Committee |
W. David Scott | Trustee, Chair of Compensation Committee |
Jeffrey K. Woodbury | Trustee |
Linda J. Hall | Trustee |
Thomas A. Wentz, Jr. | Trustee, Executive Vice President and Chief Operating Officer |
Timothy P. Mihalick | Trustee, President and Chief Executive Officer |
Management
Timothy P. Mihalick | President and Chief Executive Officer; Trustee |
Thomas A. Wentz, Jr | Executive Vice President and Chief Operating Officer; Trustee |
Diane K. Bryantt | Executive Vice President and Chief Financial Officer |
Michael A. Bosh | Executive Vice President, General Counsel and Assistant Secretary |
Mark Reiling | Executive Vice President of Asset Management |
Charles A. Greenberg | Senior Vice President, Commercial Asset Management |
Ted E. Holmes | Senior Vice President, Finance |
Andrew Martin | Senior Vice President, Residential Property Management |
Corporate Headquarters:
1400 31st Avenue SW, Suite 60
Post Office Box 1988
Minot, North Dakota 58702-1988
Trading Symbol: IRET
Stock Exchange Listing: NYSE
Investor Relations:
Lindsey Knoop-Anderson
landerson@iret.com
3
Common Share Data (NYSE: IRET)*
4th Quarter Fiscal Year 2013 | 3rd Quarter Fiscal Year 2013 | 2nd Quarter Fiscal Year 2013 | 1st Quarter Fiscal Year 2013 | 4th Quarter Fiscal Year 2012 | ||||||
| High Closing Price | $ | 10.00 | $ | 9.40 | $ | 8.49 | $ | 8.31 | $ | 7.97 |
| Low Closing Price | $ | 9.20 | $ | 7.73 | $ | 7.92 | $ | 7.05 | $ | 7.22 |
| Average Closing Price | $ | 9.59 | $ | 8.70 | $ | 8.25 | $ | 7.57 | $ | 7.56 |
| Closing Price at end of quarter | $ | 9.73 | $ | 9.36 | $ | 8.42 | $ | 8.16 | $ | 7.22 |
| Common Share Distributions—annualized | $ | 0.520 | $ | 0.520 | $ | 0.520 | $ | 0.520 | $ | 0.520 |
| Closing Dividend Yield - annualized | 5.3% | 5.6% | 6.2% | 6.4% | 7.2% | |||||
| Closing common shares outstanding (thousands) | 101,488 | 94,386 | 93,161 | 91,812 | 89,474 | |||||
| Closing limited partnership units outstanding (thousands) | 21,635 | 21,489 | 21,336 | 21,171 | 20,332 | |||||
| Closing market value of outstanding common shares, plus imputed closing market value of outstanding limited partnership units (thousands) | $ | 1,197,987 | $ | 1,084,590 | $ | 964,065 | $ | 921,941 | $ | 792,799 |
*Effective December 18, 2012, IRET transferred the listing of its common shares and Series A preferred shares to the New York Stock Exchange from the NASDAQ Global Select Market.
Certain statements in these supplemental disclosures are "forward-looking statements" within the meaning of the Private Securities Litigation Reform Act of 1995. Such statements involve known and unknown risks, uncertainties and other factors that may cause actual results to differ materially from projected results. Such risks, uncertainties and other factors include, but are not limited to: intentions and expectations regarding future distributions on our common shares and units, fluctuations in interest rates, the effect of government regulation, the availability of capital, changes in general and local economic and real estate market conditions, competition, our ability to attract and retain skilled personnel, and those risks and uncertainties detailed from time to time in our filings with the Securities and Exchange Commission, including our 2013 Form 10-K. We assume no obligation to update or supplement forward-looking statements that become untrue because of subsequent events.
Fourth Quarter Fiscal 2013 Acquisitions and Development Projects Placed in Service
 | 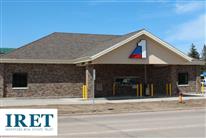 |
First Avenue Apartments 13 1st Ave SW Minot, ND 58701 | Arrowhead First International Bank - Minot, ND 150 16th St. SW Minot, ND 58701 |
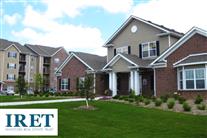 | |
Whispering Ridge 17551 Pinkney Plaza Omaha, NE 68116 | |
4
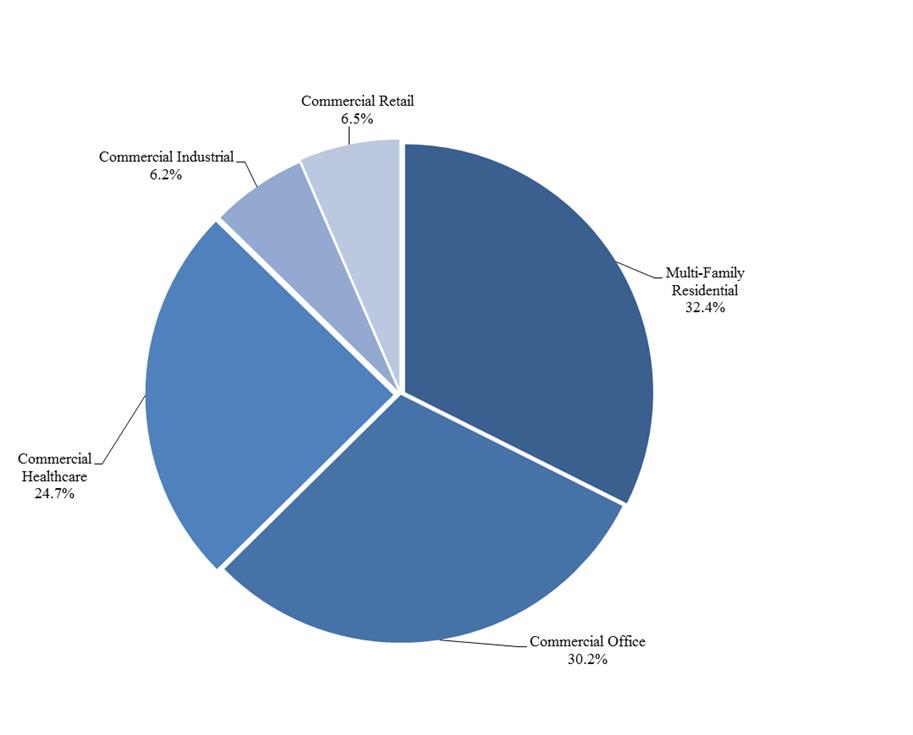
Property Cost by Segment – Fourth Quarter Fiscal 2013
With investments in the multi-family residential and commercial office, commercial healthcare, commercial industrial and commercial retail segments, IRET's diversified portfolio helps to provide stability during market fluctuations in returns from specific property types.
5
INVESTORS REAL ESTATE TRUST AND SUBSIDIARIES
CONDENSED CONSOLIDATED BALANCE SHEETS (unaudited)
(in thousands)
| 4/30/2013 | 1/31/2013 | 10/31/2012 | 07/31/2012 | 04/30/2012 | ||||||
| ASSETS | ||||||||||
| Real estate investments | ||||||||||
| Property owned | $ | 2,032,970 | $ | 2,007,832 | $ | 1,983,978 | $ | 1,979,099 | $ | 1,892,009 |
| Less accumulated depreciation | (420,421) | (408,400) | (394,256) | (387,286) | (373,490) | |||||
| 1,612,549 | 1,599,432 | 1,589,722 | 1,591,813 | 1,518,519 | ||||||
| Development in progress | 46,782 | 20,127 | 23,218 | 10,498 | 27,599 | |||||
| Unimproved land | 21,503 | 18,879 | 11,670 | 10,990 | 10,990 | |||||
| Total real estate investments | 1,680,834 | 1,638,438 | 1,624,610 | 1,613,301 | 1,557,108 | |||||
| Real estate held for sale | 0 | 733 | 1,844 | 1,131 | 2,067 | |||||
| Cash and cash equivalents | 94,133 | 62,302 | 84,258 | 37,002 | 39,989 | |||||
| Other investments | 639 | 638 | 637 | 635 | 634 | |||||
| Receivable arising from straight-lining of rents, net of allowance | 26,354 | 25,471 | 24,895 | 24,127 | 23,273 | |||||
| Accounts receivable, net of allowance | 4,534 | 3,560 | 2,854 | 6,448 | 7,052 | |||||
| Real estate deposits | 196 | 165 | 55 | 4 | 263 | |||||
| Prepaid and other assets | 5,124 | 5,545 | 2,101 | 3,070 | 3,703 | |||||
| Intangible assets, net of accumulated amortization | 40,457 | 41,009 | 42,281 | 43,796 | 44,588 | |||||
| Tax, insurance, and other escrow | 12,569 | 13,306 | 12,177 | 13,161 | 11,669 | |||||
| Property and equipment, net of accumulated depreciation | 1,221 | 1,288 | 1,351 | 1,332 | 1,454 | |||||
| Goodwill | 1,106 | 1,106 | 1,110 | 1,120 | 1,120 | |||||
| Deferred charges and leasing costs, net of accumulated amortization | 22,387 | 22,513 | 21,164 | 21,932 | 21,447 | |||||
| TOTAL ASSETS | $ | 1,889,554 | $ | 1,816,074 | $ | 1,819,337 | $ | 1,767,059 | $ | 1,714,367 |
| LIABILITIES AND EQUITY | ||||||||||
| LIABILITIES | ||||||||||
| Accounts payable and accrued expenses | $ | 50,797 | $ | 44,540 | $ | 38,762 | $ | 41,084 | $ | 47,403 |
| Revolving line of credit | 10,000 | 10,000 | 10,000 | 44,500 | 39,000 | |||||
| Mortgages payable | 1,049,206 | 1,041,623 | 1,045,197 | 1,080,655 | 1,048,689 | |||||
| Other | 18,170 | 21,632 | 32,889 | 25,094 | 14,012 | |||||
| TOTAL LIABILITIES | 1,128,173 | 1,117,795 | 1,126,848 | 1,191,333 | 1,149,104 | |||||
| EQUITY | ||||||||||
| Investors Real Estate Trust shareholders' equity | ||||||||||
| Series A Preferred Shares of Beneficial Interest | 27,317 | 27,317 | 27,317 | 27,317 | 27,317 | |||||
| Series B Preferred Shares of Beneficial Interest | 111,357 | 111,357 | 111,357 | 0 | 0 | |||||
| Common Shares of Beneficial Interest | 784,454 | 721,742 | 711,880 | 701,431 | 684,049 | |||||
| Accumulated distributions in excess of net income | (310,341) | (305,145) | (295,396) | (289,025) | (278,377) | |||||
| Total Investors Real Estate Trust shareholders' equity | 612,787 | 555,271 | 555,158 | 439,723 | 432,989 | |||||
| Noncontrolling interests – Operating Partnership | 122,539 | 121,940 | 122,357 | 122,373 | 118,710 | |||||
| Noncontrolling interests – consolidated real estate entities | 26,055 | 21,068 | 14,974 | 13,630 | 13,564 | |||||
| Total equity | 761,381 | 698,279 | 692,489 | 575,726 | 565,263 | |||||
| TOTAL LIABILITIES AND EQUITY | $ | 1,889,554 | $ | 1,816,074 | $ | 1,819,337 | $ | 1,767,059 | $ | 1,714,367 |
6
INVESTORS REAL ESTATE TRUST AND SUBSIDIARIES
CONDENSED CONSOLIDATED STATEMENTS OF OPERATIONS (unaudited)
(in thousands, except per share data)
| Twelve Months Ended | Three Months Ended | |||||||||||||
| OPERATING RESULTS | 4/30/2013 | 4/30/2012 | 4/30/2013 | 1/31/2013 | 10/31/2012 | 07/31/2012 | 04/30/2012 | |||||||
| Real estate revenue | $ | 259,406 | $ | 239,078 | $ | 67,011 | $ | 65,976 | $ | 64,689 | $ | 61,730 | $ | 59,932 |
| Real estate expenses | 103,132 | 97,388 | 27,122 | 26,372 | 24,802 | 24,836 | 22,632 | |||||||
| Gain on involuntary conversion | 5,084 | 274 | 2,821 | 0 | 2,263 | 0 | 274 | |||||||
| Net operating income | 161,358 | 141,964 | 42,710 | 39,604 | 42,150 | 36,894 | 37,574 | |||||||
| Depreciation/amortization | (65,270) | (59,642) | (16,519) | (16,208) | (16,414) | (16,129) | (15,053) | |||||||
| Administrative expenses, advisory and trustee services | (8,494) | (7,381) | (2,092) | (2,245) | (2,061) | (2,096) | (1,437) | |||||||
| Other expenses | (2,173) | (1,898) | (677) | (464) | (513) | (519) | (389) | |||||||
| Impairment of real estate investments | (305) | 0 | (305) | 0 | 0 | 0 | 0 | |||||||
| Interest expense | (62,900) | (64,066) | (14,928) | (15,566) | (16,141) | (16,265) | (16,172) | |||||||
| Interest and other income | 748 | 786 | 148 | 255 | 203 | 142 | 141 | |||||||
| Income from continuing operations | 22,964 | 9,763 | 8,337 | 5,376 | 7,224 | 2,027 | 4,664 | |||||||
| Income (loss) from discontinued operations | 7,008 | (57) | 3,476 | 777 | 2,786 | (31) | (543) | |||||||
| Net income | $ | 29,972 | $ | 9,706 | $ | 11,813 | $ | 6,153 | $ | 10,010 | $ | 1,996 | $ | 4,121 |
| Net income attributable to noncontrolling interest – Operating Partnership | (3,633) | (1,359) | (1,536) | (556) | (1,290) | (251) | (636) | |||||||
| Net income attributable to noncontrolling interests – consolidated real estate entities | (809) | (135) | (262) | (273) | (208) | (66) | (106) | |||||||
| Net income attributable to Investors Real Estate Trust | 25,530 | 8,212 | 10,015 | 5,324 | 8,512 | 1,679 | 3,379 | |||||||
| Dividends to preferred shareholders | (9,229) | (2,372) | (2,879) | (2,879) | (2,878) | (593) | (593) | |||||||
| NET INCOME AVAILABLE TO COMMON SHAREHOLDERS | $ | 16,301 | $ | 5,840 | $ | 7,136 | $ | 2,445 | $ | 5,634 | $ | 1,086 | $ | 2,786 |
| Per Share Data | ||||||||||||||
| Earnings per common share from continuing operations – Investors Real Estate Trust – basic & diluted | $ | .11 | $ | .07 | $ | .04 | $ | .02 | $ | .04 | $ | .01 | $ | .04 |
| Earnings (loss) per common share from discontinued operations – Investors Real Estate Trust – basic & diluted | .06 | .00 | .03 | .01 | .02 | .00 | (.01) | |||||||
| Net income per common share – basic & diluted | $ | .17 | $ | .07 | $ | .07 | $ | .03 | $ | .06 | $ | .01 | $ | .03 |
| Percentage of Revenues | ||||||||||||||
| Real estate expenses | 39.8% | 40.7% | 40.1% | 40.0% | 38.3% | 40.2% | 37.8% | |||||||
| Depreciation/amortization | 25.2% | 24.9% | 24.7% | 24.6% | 25.4% | 26.1% | 25.1% | |||||||
| General and administrative | 3.3% | 3.1% | 3.1% | 3.4% | 3.2% | 3.4% | 2.4% | |||||||
| Interest | 24.2% | 26.8% | 22.3% | 23.6% | 25.0% | 26.3% | 27.0% | |||||||
| Income (loss) from discontinued operations | 2.7% | 0.0% | 5.2% | 1.2% | 4.3% | (0.1%) | (0.9%) | |||||||
| Net income | 11.6% | 4.1% | 18.4% | 9.3% | 15.5% | 3.2% | 6.9% | |||||||
| Ratios | ||||||||||||||
EBITDA(1)/Interest expense | 2.30x | 2.06x | 2.41x | 2.34x | 2.28x | 2.09x | 2.17x | |||||||
EBITDA(1)/Interest expense plus preferred distributions | 2.01x | 1.99x | 2.03x | 1.98x | 1.95x | 2.02x | 2.09x | |||||||
| (1) | See Definitions on page 28. EBITDA is a non-GAAP measure; see page 9 for a reconciliation of EBITDA to net income. |
7
INVESTORS REAL ESTATE TRUST AND SUBSIDIARIES
FUNDS FROM OPERATIONS (unaudited)
(in thousands, except per share and unit data)
| Twelve Months Ended | Three Months Ended | |||||||||||||
| 4/30/2013 | 4/30/2012 | 4/30/2013 | 1/31/2013 | 10/31/2012 | 07/31/2012 | 04/30/2012 | ||||||||
Funds From Operations(1) | ||||||||||||||
| Net income attributable to Investors Real Estate Trust | $ | 25,530 | $ | 8,212 | $ | 10,015 | $ | 5,324 | $ | 8,512 | $ | 1,679 | $ | 3,379 |
| Less dividends to preferred shareholders | (9,229) | (2,372) | (2,879) | (2,879) | (2,878) | (593) | (593) | |||||||
| Net income available to common shareholders | 16,301 | 5,840 | 7,136 | 2,445 | 5,634 | 1,086 | 2,786 | |||||||
| Adjustments: | ||||||||||||||
| Noncontrolling interests – Operating Partnership | 3,633 | 1,359 | 1,536 | 556 | 1,290 | 251 | 636 | |||||||
| Depreciation and amortization | 65,542 | 60,057 | 16,572 | 16,263 | 16,520 | 16,187 | 15,165 | |||||||
| Impairment of real estate investments | 305 | 428 | 305 | 0 | 0 | 0 | 293 | |||||||
| (Gain) loss on depreciable property sales | $ | (6,885) | $ | (349) | (3,433) | (772) | (2,753) | 73 | 240 | |||||
| Funds from operations applicable to common shares and Units | 78,896 | 67,335 | $ | 22,116 | $ | 18,492 | $ | 20,691 | $ | 17,597 | $ | 19,120 | ||
| FFO per share and unit - basic and diluted | $ | 0.69 | $ | 0.65 | $ | 0.19 | $ | 0.16 | $ | 0.18 | $ | 0.16 | $ | 0.18 |
Adjusted funds from operations(1) | ||||||||||||||
| Funds from operations applicable to common shares and Units | $ | 78,896 | $ | 67,335 | $ | 22,116 | $ | 18,492 | $ | 20,691 | $ | 17,597 | $ | 19,120 |
| Adjustments: | ||||||||||||||
| Tenant improvements at stabilized properties | (9,839) | (10,309) | (3,092) | (3,156) | (1,385) | (2,206) | (4,846) | |||||||
| Leasing costs at stabilized properties | (5,127) | (4,275) | (610) | (2,231) | (951) | (1,335) | (807) | |||||||
Recurring capital expenditures(1) | (5,990) | (6,704) | (687) | (1,614) | (1,893) | (1,796) | (1,451) | |||||||
| Straight-line rents | (3,091) | (4,384) | (883) | (576) | (768) | (864) | (1,330) | |||||||
| Non-real estate depreciation | 381 | 409 | 82 | 80 | 83 | 136 | 78 | |||||||
| Gain on involuntary conversion | (5,084) | (274) | (2,821) | 0 | (2,263) | 0 | (274) | |||||||
| Adjusted funds from operations applicable to common shares and Units | $ | 50,146 | $ | 41,799 | $ | 14,105 | $ | 10,995 | $ | 13,514 | $ | 11,532 | $ | 10,490 |
| AFFO per share and unit - basic and diluted | 0.44 | 0.41 | 0.12 | 0.10 | 0.12 | 0.10 | 0.10 | |||||||
| Weighted average shares and units | 114,535 | 103,432 | 118,192 | 115,207 | 113,690 | 111,292 | 107,316 | |||||||
| (1) | See Definitions on page 28. |
8
INVESTORS REAL ESTATE TRUST AND SUBSIDIARIES
EARNINGS BEFORE INTEREST, TAXES, DEPRECIATION AND AMORTIZATION (EBITDA) (unaudited)
(in thousands)
| Twelve Months Ended | Three Months Ended | |||||||||||||
| 4/30/2013 | 4/30/2012 | 4/30/2013 | 1/31/2013 | 10/31/2012 | 07/31/2012 | 04/30/2012 | ||||||||
EBITDA(1) | ||||||||||||||
| Net income attributable to Investors Real Estate Trust | $ | 25,530 | $ | 8,212 | $ | 10,015 | $ | 5,324 | $ | 8,512 | $ | 1,679 | $ | 3,379 |
| Adjustments: | ||||||||||||||
| Noncontrolling interests – Operating Partnership | 3,633 | 1,359 | 1,536 | 556 | 1,290 | 251 | 636 | |||||||
| Income before noncontrolling interests – Operating Partnership | 29,163 | 9,571 | 11,551 | 5,880 | 9,802 | 1,930 | 4,015 | |||||||
| Add: | ||||||||||||||
| Interest | 63,686 | 65,230 | 15,069 | 15,731 | 16,369 | 16,517 | 16,454 | |||||||
| Depreciation/amortization related to real estate investments | 62,475 | 57,108 | 15,759 | 15,506 | 15,757 | 15,453 | 14,390 | |||||||
| Amortization related to non-real estate investments | 3,274 | 3,216 | 848 | 794 | 799 | 833 | 821 | |||||||
Amortization related to real estate revenues(2) | 175 | 141 | 49 | 43 | 46 | 37 | 30 | |||||||
| Less: | ||||||||||||||
| Interest income | (222) | (148) | (46) | (70) | (88) | (18) | (33) | |||||||
| Gain on sale of real estate, land and other investments | (6,885) | (349) | (3,433) | (772) | (2,753) | 73 | 240 | |||||||
| Gain on involuntary conversion | (5,084) | (274) | (2,821) | 0 | (2,263) | 0 | (274) | |||||||
| EBITDA | $ | 146,582 | $ | 134,495 | $ | 36,976 | $ | 37,112 | $ | 37,669 | $ | 34,825 | $ | 35,643 |
| (1) | Definitions on page 28. |
| (2) | Included in real estate revenue in the Statement of Operations. |
9
INVESTORS REAL ESTATE TRUST AND SUBSIDIARIES
LONG-TERM MORTGAGE DEBT* ANALYSIS
(in thousands)
Debt Maturity Schedule
Annual Expirations
Total Mortgage Debt*
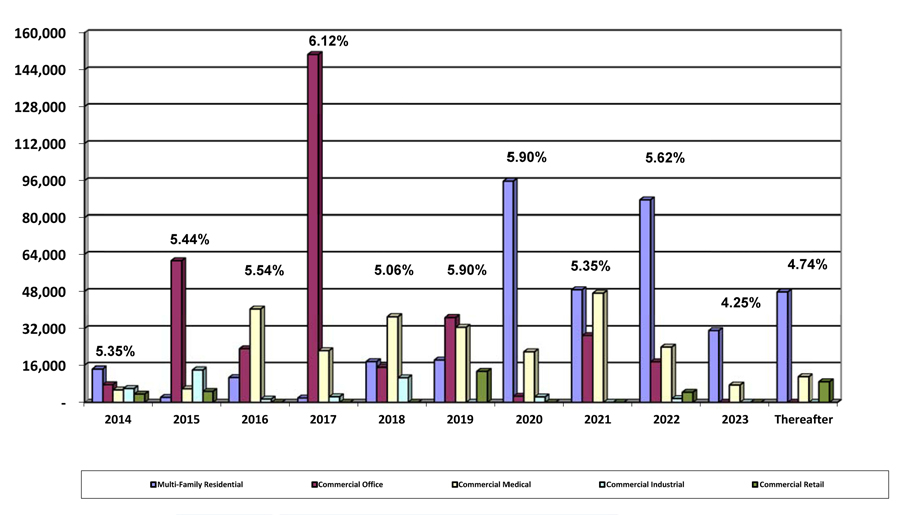
Future Maturities of Mortgage Debt | ||||||||
| Fiscal Year | Fixed Debt | Variable Debt | Total Debt | Weighted Average(1) | % of Total Debt | |||
| 2014 | $ | 33,701 | $ | 3,474 | $ | 37,175 | 5.35% | 3.5% |
| 2015 | 70,990 | 17,161 | 88,151 | 5.44% | 8.4% | |||
| 2016 | 75,782 | 0 | 75,782 | 5.54% | 7.2% | |||
| 2017 | 177,159 | 0 | 177,159 | 6.12% | 16.9% | |||
| 2018 | 80,599 | 0 | 80,599 | 5.06% | 7.7% | |||
| 2019 | 95,502 | 5,581 | 101,083 | 5.90% | 9.6% | |||
| 2020 | 122,622 | 0 | 122,622 | 5.90% | 11.7% | |||
| 2021 | 124,960 | 0 | 124,960 | 5.35% | 12.0% | |||
| 2022 | 135,070 | 0 | 135,070 | 5.62% | 12.9% | |||
| 2023 | 38,651 | 0 | 38,651 | 4.25% | 3.7% | |||
| Thereafter | 67,954 | 0 | 67,954 | 4.74% | 6.4% | |||
| Total maturities | $ | 1,022,990 | $ | 26,216 | $ | 1,049,206 | 5.55% | 100.0% |
| (1) | Weighted average interest rate of debt that matures in fiscal year. |
| 4/30/2013 | 1/31/2013 | 10/31/2012 | 07/31/2012 | 04/30/2012 | ||||||
| Balances Outstanding | ||||||||||
| Mortgage | ||||||||||
| Fixed rate | $ | 1,022,990 | $ | 1,004,567 | $ | 1,021,661 | $ | 1,064,564 | $ | 1,032,543 |
| Variable rate | 26,216 | 37,056 | 23,536 | 16,091 | 16,146 | |||||
| Mortgage total | $ | 1,049,206 | $ | 1,041,623 | $ | 1,045,197 | $ | 1,080,655 | $ | 1,048,689 |
| Weighted Average Interest Rates | ||||||||||
| Secured | 5.55% | 5.65% | 5.66% | 5.72% | 5.78% | |||||
10
INVESTORS REAL ESTATE TRUST AND SUBSIDIARIES
LONG-TERM MORTGAGE DEBT* DETAIL AS OF APRIL 30, 2013
(in thousands)
(in thousands)
| Property | Maturity Date | Fiscal 2014 | Fiscal 2015 | Fiscal 2016 | Fiscal 2017 | Thereafter | Total(1) | ||||||||
| Multi-Family Residential | |||||||||||||||
Quarry Ridge - Rochester, MN(2) | 10/1/2013 | $ | 11,599 | $ | 0 | $ | 0 | $ | 0 | $ | 0 | $ | 11,599 | ||
| Monticello Village - Monticello, MN | 3/1/2014 | 2,886 | 0 | 0 | 0 | 0 | 2,886 | ||||||||
| Evergreen II - Isanti, MN | 11/1/2014 | 0 | 2,148 | 0 | 0 | 0 | 2,148 | ||||||||
| Campus Center - St Cloud, MN | 6/1/2015 | 0 | 0 | 1,280 | 0 | 0 | 1,280 | ||||||||
| Campus Knoll - St Cloud, MN | 6/1/2015 | 0 | 0 | 853 | 0 | 0 | 853 | ||||||||
| Landmark - Grand Forks, ND | 8/24/2015 | 0 | 0 | 1,700 | 0 | 0 | 1,700 | ||||||||
| Regency Park Estates - St Cloud, MN | 1/1/2016 | 0 | 0 | 6,966 | 0 | 0 | 6,966 | ||||||||
| Pebble Springs – Bismarck, ND | 7/1/2016 | 0 | 0 | 0 | 792 | 0 | 792 | ||||||||
| Southview – Minot, ND | 7/1/2016 | 0 | 0 | 0 | 1,082 | 0 | 1,082 | ||||||||
| Summary of Debt due after Fiscal 2017 | 0 | 0 | 0 | 0 | 346,919 | 346,919 | |||||||||
| Sub-Total Multi-Family Residential | $ | 14,485 | $ | 2,148 | $ | 10,799 | $ | 1,874 | $ | 346,919 | $ | 376,225 | |||
| Commercial Office | |||||||||||||||
| Whitewater Plaza - Minnetonka, MN | 3/1/2014 | $ | 2,523 | $ | 0 | $ | 0 | $ | 0 | $ | 0 | $ | 2,523 | ||
| Whitewater Plaza - Minnetonka, MN | 3/1/2014 | 1,308 | 0 | 0 | 0 | 0 | 1,308 | ||||||||
| Viromed - Eden Prairie, MN | 4/1/2014 | 324 | 0 | 0 | 0 | 0 | 324 | ||||||||
| Wirth Corporate Center - Golden Valley, MN | 4/1/2014 | 3,538 | 0 | 0 | 0 | 0 | 3,538 | ||||||||
| TCA Building - Eagan, MN | 5/1/2014 | 0 | 7,080 | 0 | 0 | 0 | 7,080 | ||||||||
Brenwood - Hennepin County, MN(3) | 7/15/2014 | 0 | 5,250 | 0 | 0 | 0 | 5,250 | ||||||||
| Burnsville Bluffs II - Burnsville, MN | 8/8/2014 | 0 | 1,719 | 0 | 0 | 0 | 1,719 | ||||||||
| Plymouth IV - Plymouth, MN | 8/8/2014 | 0 | 3,170 | 0 | 0 | 0 | 3,170 | ||||||||
| Plymouth V - Plymouth, MN | 8/8/2014 | 0 | 3,705 | 0 | 0 | 0 | 3,705 | ||||||||
| Plaza VII - Boise, ID | 9/1/2014 | 0 | 993 | 0 | 0 | 0 | 993 | ||||||||
| Crosstown Centre - Eden Prairie, MN | 12/1/2014 | 0 | 3,303 | 0 | 0 | 0 | 3,303 | ||||||||
| Crosstown Centre - Eden Prairie, MN | 12/1/2014 | 0 | 9,908 | 0 | 0 | 0 | 9,908 | ||||||||
| Northgate I - Maple Grove, MN | 12/10/2014 | 0 | 5,163 | 0 | 0 | 0 | 5,163 | ||||||||
| Plymouth I - Plymouth, MN | 12/10/2014 | 0 | 1,157 | 0 | 0 | 0 | 1,157 | ||||||||
| Plymouth II - Plymouth, MN | 12/10/2014 | 0 | 1,157 | 0 | 0 | 0 | 1,157 | ||||||||
| Plymouth III - Plymouth, MN | 12/10/2014 | 0 | 1,425 | 0 | 0 | 0 | 1,425 | ||||||||
| Benton Business Park - Sauk Rapids, MN | 1/1/2015 | 0 | 560 | 0 | 0 | 0 | 560 | ||||||||
| West River Business Park - Waite Park, MN | 1/1/2015 | 0 | 560 | 0 | 0 | 0 | 560 | ||||||||
| Highlands Ranch I - Highlands Ranch, CO | 3/1/2015 | 0 | 8,221 | 0 | 0 | 0 | 8,221 | ||||||||
| Highlands Ranch II - Highlands Ranch, CO | 3/1/2015 | 0 | 7,898 | 0 | 0 | 0 | 7,898 | ||||||||
| US Bank Financial Center - Bloomington, MN | 7/1/2015 | 0 | 0 | 13,425 | 0 | 0 | 13,425 | ||||||||
| Rapid City 900 Concourse Drive - Rapid City, SD | 8/1/2015 | 0 | 0 | 1,171 | 0 | 0 | 1,171 | ||||||||
| Westgate I - Boise, ID | 8/1/2015 | 0 | 0 | 1,196 | 0 | 0 | 1,196 | ||||||||
| Westgate II - Boise, ID | 8/1/2015 | 0 | 0 | 2,929 | 0 | 0 | 2,929 | ||||||||
| Brook Valley I - LaVista, NE | 1/1/2016 | 0 | 0 | 1,301 | 0 | 0 | 1,301 | ||||||||
| Spring Valley IV - Omaha, NE | 1/1/2016 | 0 | 0 | 775 | 0 | 0 | 775 | ||||||||
| Spring Valley V - Omaha, NE | 1/1/2016 | 0 | 0 | 852 | 0 | 0 | 852 | ||||||||
| Spring Valley X - Omaha, NE | 1/1/2016 | 0 | 0 | 790 | 0 | 0 | 790 | ||||||||
| Spring Valley XI - Omaha, NE | 1/1/2016 | 0 | 0 | 775 | 0 | 0 | 775 | ||||||||
| American Corporate Center – Mendota Heights, MN | 9/1/2016 | 0 | 0 | 0 | 8,909 | 0 | 8,909 | ||||||||
| Mendota Office Center I – Mendota Heights, MN | 9/1/2016 | 0 | 0 | 0 | 3,836 | 0 | 3,836 | ||||||||
| Mendota Office Center II - Mendota Heights, MN | 9/1/2016 | 0 | 0 | 0 | 5,668 | 0 | 5,668 | ||||||||
| Mendota Office Center III - Mendota Heights, MN | 9/1/2016 | 0 | 0 | 0 | 3,895 | 0 | 3,895 | ||||||||
11
INVESTORS REAL ESTATE TRUST AND SUBSIDIARIES
LONG-TERM MORTGAGE DEBT* DETAIL AS OF APRIL 30, 2013 (continued)
(in thousands)
(in thousands)
| Property | Maturity Date | Fiscal 2014 | Fiscal 2015 | Fiscal 2016 | Fiscal 2017 | Thereafter | Total(1) | ||||||||||
| Mendota Office Center IV - Mendota Heights, MN | 9/1/2016 | 0 | 0 | 0 | 4,631 | 0 | 4,631 | ||||||||||
| Corporate Center West – Omaha, NE | 10/6/2016 | 0 | 0 | 0 | 17,315 | 0 | 17,315 | ||||||||||
| Farnam Executive Center – Omaha, NE | 10/6/2016 | 0 | 0 | 0 | 12,160 | 0 | 12,160 | ||||||||||
| Flagship – Eden Prarie, MN | 10/6/2016 | 0 | 0 | 0 | 21,565 | 0 | 21,565 | ||||||||||
| Gateway Corporate Center – Woodbury, MN | 10/6/2016 | 0 | 0 | 0 | 8,700 | 0 | 8,700 | ||||||||||
| Miracle Hills One – Omaha, NE | 10/6/2016 | 0 | 0 | 0 | 8,895 | 0 | 8,895 | ||||||||||
| Pacific Hills – Omaha, NE | 10/6/2016 | 0 | 0 | 0 | 16,770 | 0 | 16,770 | ||||||||||
| Riverport – Maryland Heights, MO | 10/6/2016 | 0 | 0 | 0 | 19,690 | 0 | 19,690 | ||||||||||
| Timberlands – Leawood, KS | 10/6/2016 | 0 | 0 | 0 | 13,155 | 0 | 13,155 | ||||||||||
| Woodlands Plaza IV – Maryland Heights, MO | 10/6/2016 | 0 | 0 | 0 | 4,360 | 0 | 4,360 | ||||||||||
| 2030 Cliff Road – Eagan, MN | 1/11/2017 | 0 | 0 | 0 | 967 | 0 | 967 | ||||||||||
| Summary of Debt due after Fiscal 2017 | 0 | 0 | 0 | 0 | 101,061 | 101,061 | |||||||||||
| Sub-Total Commercial Office | $ | 7,693 | $ | 61,269 | $ | 23,214 | $ | 150,516 | $ | 101,061 | $ | 343,753 | |||||
| Commercial Healthcare | ||||||||||||||
| High Pointe Health Campus - Lake Elmo, MN | 4/1/2014 | $ | 5,400 | $ | 0 | $ | 0 | $ | 0 | $ | 0 | $ | 5,400 | |
| Edgewood Vista - Billings, MT | 12/10/2014 | 0 | 1,905 | 0 | 0 | 0 | 1,905 | |||||||
| Edgewood Vista - East Grand Forks, MN | 12/10/2014 | 0 | 2,902 | 0 | 0 | 0 | 2,902 | |||||||
| Edgewood Vista - Sioux Falls, SD | 12/10/2014 | 0 | 1,091 | 0 | 0 | 0 | 1,091 | |||||||
| Garden View Medical - St Paul, MN | 8/1/2015 | 0 | 0 | 1,320 | 0 | 0 | 1,320 | |||||||
| Edina 6363 France Medical - St Paul, MN | 8/6/2015 | 0 | 0 | 10,000 | 0 | 0 | 10,000 | |||||||
| 2800 Medical Building - Minneapolis, MN | 9/1/2015 | 0 | 0 | 5,399 | 0 | 0 | 5,399 | |||||||
| 2828 Medical Building - Minneapolis, MN | 9/1/2015 | 0 | 0 | 8,379 | 0 | 0 | 8,379 | |||||||
| Edina 6405 France Medical - Edina, MN | 9/1/2015 | 0 | 0 | 8,782 | 0 | 0 | 8,782 | |||||||
| Ritchie Medical Plaza - St Paul, MN | 9/1/2015 | 0 | 0 | 6,463 | 0 | 0 | 6,463 | |||||||
| Airport Medical – Bloomington, MN | 6/1/2016 | 0 | 0 | 0 | 1,083 | 0 | 1,083 | |||||||
| Park Dental – Brooklyn Center, MN | 6/1/2016 | 0 | 0 | 0 | 621 | 0 | 621 | |||||||
| Edina 6517 Drew Ave – Edina, MN | 9/6/2016 | 0 | 0 | 0 | 1,133 | 0 | 1,133 | |||||||
| Edgewood Vista – Fargo, ND | 10/25/2016 | 0 | 0 | 0 | 12,877 | 0 | 12,877 | |||||||
Sartell 2000 23rd St S – Sartell, MN | 12/1/2016 | 0 | 0 | 0 | 3,256 | 0 | 3,256 | |||||||
| Billings 2300 Grant Road – Billings, MT | 12/31/2016 | 0 | 0 | 0 | 1,645 | 0 | 1,645 | |||||||
| Missoula 3050 Great Northern Ave – Missoula, MT | 12/31/2016 | 0 | 0 | 0 | 1,727 | 0 | 1,727 | |||||||
| Summary of Debt due after Fiscal 2017 | 0 | 0 | 0 | 0 | 181,403 | 181,403 | ||||||||
| Sub-Total Commercial Healthcare | $ | 5,400 | $ | 5,898 | $ | 40,343 | $ | 22,342 | $ | 181,403 | $ | 255,386 | ||
| Commercial Industrial | ||||||||||||||
Bodycote Industrial Building - Eden Prairie, MN(3) | 9/1/2013 | $ | 1,046 | $ | 0 | $ | 0 | $ | 0 | $ | 0 | $ | 1,046 | |
| Cedar Lake Business Center - St. Louis Park, MN | 11/1/2013 | 2,276 | 0 | 0 | 0 | 0 | 2,276 | |||||||
| Woodbury 1865 Woodlane - Woodbury, MN | 11/1/2013 | 2,679 | 0 | 0 | 0 | 0 | 2,679 | |||||||
Stone Container - Roseville, MN(3) | 7/14/2014 | 0 | 4,500 | 0 | 0 | 0 | 4,500 | |||||||
| Brooklyn Park 7401 Boone Avenue - Brooklyn Park, MN | 9/28/2014 | 0 | 7,411 | 0 | 0 | 0 | 7,411 | |||||||
| Clive 2075 NW 94th St - Clive, IA | 9/30/2014 | 0 | 2,175 | 0 | 0 | 0 | 2,175 | |||||||
| Stone Container - Fargo, ND | 12/1/2015 | 0 | 0 | 633 | 0 | 0 | 633 | |||||||
| Stone Container - Fargo, ND | 12/1/2015 | 0 | 0 | 793 | 0 | 0 | 793 |
12
INVESTORS REAL ESTATE TRUST AND SUBSIDIARIES
LONG-TERM MORTGAGE DEBT* DETAIL AS OF APRIL 30, 2013 (continued)
(in thousands)
(in thousands)
| Property | Maturity Date | Fiscal 2014 | Fiscal 2015 | Fiscal 2016 | Fiscal 2017 | Thereafter | Total(1) | ||||||||||
| Minnetonka 13600 County Road 62 – Minnetonka, MN | 2/27/2017 | 0 | 0 | 0 | 2,427 | 0 | 2,427 | ||||||||||
| Summary of Debt due after Fiscal 2017 | 0 | 0 | 0 | 0 | 14,682 | 14,682 | |||||||||||
| Sub-Total Commercial Industrial | $ | 6,001 | $ | 14,086 | $ | 1,426 | $ | 2,427 | $ | 14,682 | $ | 38,622 | |||||
| Commercial Retail | ||||||||||||||
| Burnsville I Strip Center - Burnsville, MN | 6/30/2013 | $ | 329 | $ | 0 | $ | 0 | $ | 0 | $ | 0 | $ | 329 | |
| Burnsville II Strip Center - Burnsville, MN | 6/30/2013 | 259 | 0 | 0 | 0 | 0 | 259 | |||||||
| St Cloud Westgate - St Cloud, MN | 10/10/2013 | 3,008 | 0 | 0 | 0 | 0 | 3,008 | |||||||
| Omaha Barnes & Noble - Omaha, NE | 6/1/2014 | 0 | 2,418 | 0 | 0 | 0 | 2,418 | |||||||
| Jamestown Buffalo Mall - Jamestown, ND | 9/1/2014 | 0 | 462 | 0 | 0 | 0 | 462 | |||||||
| Fargo Express Center - Fargo, ND | 10/1/2014 | 0 | 938 | 0 | 0 | 0 | 938 | |||||||
| Lakeville Strip Center - Lakeville, MN | 10/1/2014 | 0 | 932 | 0 | 0 | 0 | 932 | |||||||
| Summary of Debt due after Fiscal 2017 | 0 | 0 | 0 | 0 | 26,874 | 26,874 | ||||||||
| Sub-Total Commercial Retail | $ | 3,596 | $ | 4,750 | $ | 0 | $ | 0 | $ | 26,874 | $ | 35,220 | ||
| Total | $ | 37,175 | $ | 88,151 | $ | 75,782 | $ | 177,159 | $ | 670,939 | $ | 1,049,206 |
| * | Mortgage debt does not include the Company's multi-bank line of credit or construction loans. The line of credit has a maturity date of August 12, 2014; as of April 30, 2013, the Company had borrowings of $10.0 million outstanding under this line. Construction loans and other debt totaled $18.1 million as of April 30, 2013. |
| (1) | Totals are principal balances as of April 30, 2013. |
| (2) | Application for refinance signed subsequent to April 30, 2013. |
| (3) | Loan was paid off subsequent to April 30, 2013. |
13
INVESTORS REAL ESTATE TRUST AND SUBSIDIARIES
CAPITAL ANALYSIS
(in thousands, except per share and unit amounts)
| Three Months Ended | ||||||||||
| 4/30/2013 | 1/31/2013 | 10/31/2012 | 07/31/2012 | 04/30/2012 | ||||||
| Equity Capitalization | ||||||||||
| Common shares outstanding | 101,488 | 94,386 | 93,161 | 91,812 | 89,474 | |||||
| Operating partnership (OP) units outstanding | 21,635 | 21,489 | 21,336 | 21,171 | 20,332 | |||||
| Total common shares and OP units outstanding | 123,123 | 115,875 | 114,497 | 112,983 | 109,806 | |||||
| Market price per common share (closing price at end of period) | $ | 9.73 | $ | 9.36 | $ | 8.42 | $ | 8.16 | $ | 7.22 |
| Equity capitalization-common shares and OP units | $ | 1,197,987 | $ | 1,084,590 | $ | 964,065 | $ | 921,941 | $ | 792,799 |
| Recorded book value of preferred shares | $ | 138,674 | $ | 138,674 | $ | 138,674 | $ | 27,317 | $ | 27,317 |
| Total equity capitalization | $ | 1,336,661 | $ | 1,223,264 | $ | 1,102,739 | $ | 949,258 | $ | 820,116 |
| Debt Capitalization | ||||||||||
| Total debt | $ | 1,077,282 | $ | 1,073,152 | $ | 1,087,972 | $ | 1,150,123 | $ | 1,101,564 |
| Total capitalization | $ | 2,413,943 | $ | 2,296,416 | $ | 2,190,711 | $ | 2,099,381 | $ | 1,921,680 |
| Total debt to total capitalization | 0.45:1 | 0.47:1 | 0.50:1 | 0.55:1 | 0.57:1 | |||||
| Twelve Months Ended | Three Months Ended | |||||||||||||
| 4/30/2013 | 4/30/2012 | 4/30/2013 | 1/31/2013 | 10/31/2012 | 07/31/2012 | 04/30/2012 | ||||||||
Earnings to fixed charges(1) | 1.33x | 1.14x | 1.51x | 1.31x | 1.42x | 1.11x | 1.25x | |||||||
Earnings to combined fixed charges and preferred distributions(1) | 1.17x | 1.10x | 1.27x | 1.11x | 1.21x | 1.07x | 1.21x | |||||||
Debt service coverage ratio(1) | 1.59x | 1.43x | 1.64x | 1.63x | 1.60x | 1.45x | 1.49x | |||||||
| Distribution Data | ||||||||||||||
| Common shares and units outstanding at record date | 116,338 | 106,642 | 116,338 | 115,284 | 113,516 | 111,525 | 106,642 | |||||||
| Total common distribution paid | $ | 59,250 | $ | 57,756 | $ | 15,124 | $ | 14,956 | $ | 14,757 | $ | 14,413 | $ | 13,809 |
| Common distribution per share and unit | $ | .5200 | $ | .5615 | $ | .1300 | $ | .1300 | $ | .1300 | $ | .1300 | $ | .1300 |
Payout ratio (FFO per share and unit basis)(1) | 75.4% | 86.4% | 68.4% | 81.3% | 72.2% | 81.3% | 72.2% | |||||||
Payout ratio (AFFO per share and unit basis)(1) | 130.0% | 137.0% | 162.5% | 130.0% | 108.3% | 130.0% | 130.0% | |||||||
| (1) | See Definitions on page 28. |
14
INVESTORS REAL ESTATE TRUST AND SUBSIDIARIES
STABILIZED PROPERTIES NET OPERATING INCOME SUMMARY
(in thousands)
Stabilized Properties(1) | Stabilized Properties(1) | |||||||||
Three Months Ended April 30, | Twelve Months Ended April 30, | |||||||||
| Segment | 2013 | 2012 | % Change | 2013 | 2012 | % Change | ||||
| Multi-Family Residential | $ | 14,899 | $ | 10,279 | 44.9% | $ | 55,895 | $ | 38,595 | 44.8% |
| Commercial Office | 10,192 | 10,247 | (0.5%) | 39,216 | 39,518 | (0.8%) | ||||
| Commercial Healthcare | 11,295 | 11,030 | 2.4% | 45,196 | 43,861 | 3.0% | ||||
| Commercial Industrial | 2,816 | 3,357 | (16.1%) | 10,656 | 10,776 | (1.1%) | ||||
| Commercial Retail | 3,509 | 2,661 | 31.9% | 10,395 | 9,214 | 12.8% | ||||
| $ | 42,711 | $ | 37,574 | 13.7% | $ | 161,358 | $ | 141,964 | 13.7% | |
| (1) | See list of properties excluded from stabilized properties on page ii. |
15
INVESTORS REAL ESTATE TRUST AND SUBSIDIARIES
NET OPERATING INCOME DETAIL
(in thousands)
| Three Months Ended April 30, 2013 | ||||||||||||||
| Reporting Segments | ||||||||||||||
Multi-Family Residential | Commercial Office | Commercial Healthcare | Commercial Industrial | Commercial Retail | Corporate and Other | Total | ||||||||
| Real estate rental revenue | ||||||||||||||
Stabilized(1) | $ | 18,469 | $ | 20,057 | $ | 14,321 | $ | 3,862 | $ | 3,855 | $ | 0 | $ | 60,564 |
| Non-Stabilized | 4,909 | 0 | 1,368 | 160 | 11 | 0 | 6,448 | |||||||
| Total | 23,378 | 20,057 | 15,689 | 4,022 | 3,866 | 0 | 67,012 | |||||||
| Real estate expenses | ||||||||||||||
Stabilized(1) | 8,171 | 9,865 | 4,131 | 1,206 | 1,585 | 0 | 24,958 | |||||||
| Non-Stabilized | 1,897 | 0 | 263 | 0 | 4 | 0 | 2,164 | |||||||
| Total | 10,068 | 9,865 | 4,394 | 1,206 | 1,589 | 0 | 27,122 | |||||||
| Gain on involuntary conversion | ||||||||||||||
Stabilized(1) | 0 | 0 | 0 | 0 | 1,232 | 0 | 1,232 | |||||||
| Non-stabilized | 1,589 | 0 | 0 | 0 | 0 | 0 | 1,589 | |||||||
| Total | 1,589 | 0 | 0 | 0 | 1,232 | 0 | 2,821 | |||||||
| Net Operating Income (NOI) | ||||||||||||||
Stabilized(1) | 10,298 | 10,192 | 10,190 | 2,656 | 3,502 | 0 | 36,838 | |||||||
| Non-Stabilized | 4,601 | 0 | 1,105 | 160 | 7 | 0 | 5,873 | |||||||
| Net operating income | $ | 14,899 | $ | 10,192 | $ | 11,295 | $ | 2,816 | $ | 3,509 | $ | 0 | $ | 42,711 |
| Reconciliation of NOI to net income (loss) available to common shareholders | ||||||||||||||
| Depreciation/amortization | $ | (4,764) | $ | (5,283) | $ | (4,488) | $ | (895) | $ | (1,006) | $ | (83) | $ | (16,519) |
| Administrative, advisory and trustee fees | 0 | 0 | 0 | 0 | 0 | (2,092) | (2,092) | |||||||
| Other expenses | 0 | 0 | 0 | 0 | 0 | (677) | (677) | |||||||
| Impairment of real estate investments | 0 | 0 | 0 | 0 | 0 | (305) | (305) | |||||||
| Interest expense | (5,161) | (5,163) | (3,501) | (674) | (510) | 81 | (14,928) | |||||||
| Interest and other income | 0 | 0 | 0 | 0 | 0 | 148 | 148 | |||||||
| Income (loss) from continuing operations | 4,974 | (254) | 3,306 | 1,247 | 1,993 | (2,928) | 8,338 | |||||||
| Income from discontinued operations | 3475 | 0 | 0 | 0 | 0 | 0 | 3,475 | |||||||
| Net income (loss) | 8,449 | (254) | 3,306 | 1,247 | 1,993 | (2,928) | 11,813 | |||||||
| Net income attributable to noncontrolling interests – Operating Partnership | 0 | 0 | 0 | 0 | 0 | (1,537) | (1,537) | |||||||
| Net income attributable to noncontrolling interests – consolidated real estate entities | 0 | 0 | 0 | 0 | 0 | (262) | (262) | |||||||
| Net income (loss) attributable to Investors Real Estate Trust | 8,449 | (254) | 3,306 | 1,247 | 1,993 | (4,727) | 10,014 | |||||||
| Dividends to preferred shareholders | 0 | 0 | 0 | 0 | 0 | (2,879) | (2,879) | |||||||
| NET INCOME (LOSS) AVAILABLE TO COMMON SHAREHOLDERS | $ | 8,449 | (254) | 3,306 | 1,247 | 1,993 | $ | (7,606) | $ | 7,135 | ||||
| (1) | See list of properties excluded from stabilized properties on page ii. |
16
INVESTORS REAL ESTATE TRUST AND SUBSIDIARIES
NET OPERATING INCOME DETAIL
(in thousands)
| Three Months Ended April 30, 2012 | ||||||||||||||
| Reporting Segments | ||||||||||||||
Multi-Family Residential | Commercial Office | Commercial Healthcare | Commercial Industrial | Commercial Retail | Corporate and Other | Total | ||||||||
| Real estate rental revenue | ||||||||||||||
Stabilized(1) | $ | 17,737 | $ | 18,611 | $ | 13,913 | $ | 3,728 | $ | 3,558 | $ | 0 | $ | 57,547 |
| Non-Stabilized | 1,322 | 0 | 1,063 | 0 | 0 | 0 | 2,385 | |||||||
| Total | 19,059 | 18,611 | 14,976 | 3,728 | 3,558 | 0 | 59,932 | |||||||
| Real estate expenses | ||||||||||||||
Stabilized(1) | 8,272 | 8,364 | 3,817 | 371 | 1,171 | 0 | 21,995 | |||||||
| Non-Stabilized | 508 | 0 | 129 | 0 | 0 | 0 | 637 | |||||||
| Total | 8,780 | 8,364 | 3,946 | 371 | 1,171 | 0 | 22,632 | |||||||
| Gain on involuntary conversion | ||||||||||||||
| Stabilized(1) | 0 | 0 | 0 | 0 | 274 | 0 | 274 | |||||||
| Non-stabilized | 0 | 0 | 0 | 0 | 0 | 0 | 0 | |||||||
| Total | 0 | 0 | 0 | 0 | 274 | 0 | 274 | |||||||
| Net Operating Income (NOI) | ||||||||||||||
Stabilized(1) | 9,465 | 10,247 | 10,096 | 3,357 | 2,661 | 0 | 35,826 | |||||||
| Non-Stabilized | 814 | 0 | 934 | 0 | 0 | 0 | 1,748 | |||||||
| Net operating income | $ | 10,279 | $ | 10,247 | $ | 11,030 | $ | 3,357 | $ | 2,661 | $ | 0 | $ | 37,574 |
| Reconciliation of NOI to net income (loss) available to common shareholders | ||||||||||||||
| Depreciation/amortization | $ | (3,820) | $ | (5,190) | $ | (4,203) | $ | (863) | $ | (899) | $ | (78) | $ | (15,053) |
| Administrative, advisory and trustee services | 0 | 0 | 0 | 0 | 0 | (1,437) | (1,437) | |||||||
| Other expenses | 0 | 0 | 0 | 0 | 0 | (389) | (389) | |||||||
| Interest expense | (4,454) | (5,364) | (4,253) | (914) | (709) | (478) | (16,172) | |||||||
| Interest and other income | 0 | 0 | 0 | 0 | 0 | 141 | 141 | |||||||
| Income (loss) from continuing operations | 2,005 | (307) | 2,574 | 1,580 | 1,053 | (2,241) | 4,664 | |||||||
| Income (loss) from discontinued operations | 54 | 0 | (383) | 0 | (214) | 0 | (543) | |||||||
| Net income (loss) | 2,059 | (307) | 2,191 | 1,580 | 839 | (2,241) | 4,121 | |||||||
| Net income attributable to noncontrolling interests – Operating Partnership | 0 | 0 | 0 | 0 | 0 | (636) | (636) | |||||||
| Net income attributable to noncontrolling interests – consolidated real estate entities | 0 | 0 | 0 | 0 | 0 | (106) | (106) | |||||||
| Net income (loss) attributable to Investors Real Estate Trust | 2,059 | (307) | 2,191 | 1,580 | 839 | (2,983) | 3,379 | |||||||
| Dividends to preferred shareholders | 0 | 0 | 0 | 0 | 0 | (593) | (593) | |||||||
| NET INCOME (LOSS) AVAILABLE TO COMMON SHAREHOLDERS | $ | 2,059 | $ | (307) | $ | 2,191 | $ | 1,580 | $ | 839 | $ | (3,576) | $ | 2,786 |
| (1) | See list of properties excluded from stabilized properties on page ii. |
17
INVESTORS REAL ESTATE TRUST AND SUBSIDIARIES
NET OPERATING INCOME DETAIL
(in thousands)
| Twelve Months Ended April 30, 2013 | ||||||||||||||
| Reporting Segments | ||||||||||||||
Multi-Family Residential | Commercial Office | Commercial Healthcare | Commercial Industrial | Commercial Retail | Corporate and Other | Total | ||||||||
| Real estate rental revenue | ||||||||||||||
Stabilized(1) | $ | 72,948 | $ | 77,162 | $ | 57,304 | $ | 14,699 | $ | 14,588 | $ | 0 | $ | 236,701 |
| Non-Stabilized | 17,811 | 0 | 4,671 | 212 | 11 | 0 | 22,705 | |||||||
| Total | 90,759 | 77,162 | 61,975 | 14,911 | 14,599 | 0 | 259,406 | |||||||
| Real estate expenses | ||||||||||||||
Stabilized(1) | 32,445 | 37,946 | 16,027 | 4,255 | 5,433 | 0 | 96,106 | |||||||
| Non-Stabilized | 6,271 | 0 | 752 | 0 | 3 | 0 | 7,026 | |||||||
| Total | 38,716 | 37,946 | 16,779 | 4,255 | 5,436 | 0 | 103,132 | |||||||
| Gain on involuntary conversion | ||||||||||||||
Stabilized(1) | 0 | 0 | 0 | 0 | 1,232 | 0 | 1,232 | |||||||
| Non-stabilized | 3,852 | 0 | 0 | 0 | 0 | 0 | 3,852 | |||||||
| Total | 3,852 | 0 | 0 | 0 | 1,232 | 0 | 5,084 | |||||||
| Net Operating Income (NOI) | ||||||||||||||
Stabilized(1) | 40,503 | 39,216 | 41,277 | 10,444 | 10,387 | 0 | 141,827 | |||||||
| Non-Stabilized | 15,392 | 0 | 3,919 | 212 | 8 | 0 | 19,531 | |||||||
| Net operating income | $ | 55,895 | $ | 39,216 | $ | 45,196 | $ | 10,656 | $ | 10,395 | $ | 0 | $ | 161,358 |
| Reconciliation of NOI to net income (loss) available to common shareholders | ||||||||||||||
| Depreciation/amortization | $ | (18,707) | $ | (20,920) | $ | (17,732) | $ | (3,642) | $ | (3,888) | $ | (381) | $ | (65,270) |
| Administrative, advisory and trustee fees | 0 | 0 | 0 | 0 | 0 | (8,494) | (8,494) | |||||||
| Other expenses | 0 | 0 | 0 | 0 | 0 | (2,173) | (2,173) | |||||||
| Impairment of real estate investments | 0 | 0 | 0 | 0 | 0 | (305) | (305) | |||||||
| Interest expense | (20,533) | (21,008) | (15,076) | (3,102) | (2,376) | (805) | (62,900) | |||||||
| Interest and other income | 0 | 0 | 0 | 0 | 0 | 748 | 748 | |||||||
| Income (loss) from continuing operations | 16,655 | (2,712) | 12,388 | 3,912 | 4,131 | (11,410) | 22,964 | |||||||
| Income (loss) from discontinued operations | 3,653 | 0 | 3,419 | 0 | (64) | 0 | 7,008 | |||||||
| Net income (loss) | 20,308 | (2,712) | 15,807 | 3,912 | 4,067 | (11,410) | 29,972 | |||||||
| Net income attributable to noncontrolling interests – Operating Partnership | 0 | 0 | 0 | 0 | 0 | (3,633) | (3,633) | |||||||
| Net income attributable to noncontrolling interests – consolidated real estate entities | 0 | 0 | 0 | 0 | 0 | (809) | (809) | |||||||
| Net income (loss) attributable to Investors Real Estate Trust | 20,308 | (2,712) | 15,807 | 3,912 | 4,067 | (15,852) | 25,530 | |||||||
| Dividends to preferred shareholders | 0 | 0 | 0 | 0 | 0 | (9,229) | (9,229) | |||||||
| NET INCOME (LOSS) AVAILABLE TO COMMON SHAREHOLDERS | $ | 20,308 | $ | (2,712) | $ | 15,807 | $ | 3,912 | $ | 4,067 | $ | (25,081) | $ | 16,301 |
| (1) | See list of properties excluded from stabilized properties on page ii. |
18
INVESTORS REAL ESTATE TRUST AND SUBSIDIARIES
NET OPERATING INCOME DETAIL
(in thousands)
| Twelve Months Ended April 30, 2012 | ||||||||||||||
| Reporting Segments | ||||||||||||||
Multi-Family Residential | Commercial Office | Commercial Healthcare | Commercial Industrial | Commercial Retail | Corporate and Other | Total | ||||||||
| Real estate rental revenue | ||||||||||||||
Stabilized(1) | $ | 69,883 | $ | 74,334 | $ | 61,978 | $ | 14,325 | $ | 13,408 | $ | 0 | $ | 233,928 |
| Non-Stabilized | 2,617 | 0 | 2,533 | 0 | 0 | 0 | 5,150 | |||||||
| Total | 72,500 | 74,334 | 64,511 | 14,325 | 13,408 | 0 | 239,078 | |||||||
| Real estate expenses | ||||||||||||||
Stabilized(1) | 32,801 | 34,816 | 20,353 | 3,549 | 4,468 | 0 | 95,987 | |||||||
| Non-Stabilized | 1,104 | 0 | 297 | 0 | 0 | 0 | 1,401 | |||||||
| Total | 33,905 | 34,816 | 20,650 | 3,549 | 4,468 | 0 | 97,388 | |||||||
| Gain on involuntary conversion | ||||||||||||||
Stabilized(1) | 0 | 0 | 0 | 0 | 274 | 0 | 274 | |||||||
| Non-stabilized | 0 | 0 | 0 | 0 | 0 | 0 | 0 | |||||||
| Total | 0 | 0 | 0 | 0 | 274 | 0 | 274 | |||||||
| Net Operating Income (NOI) | ||||||||||||||
Stabilized(1) | 37,082 | 39,518 | 41,625 | 10,776 | 9,214 | 0 | 138,215 | |||||||
| Non-Stabilized | 1,513 | 0 | 2,236 | 0 | 0 | 0 | 3,749 | |||||||
| Net operating income | $ | 38,595 | $ | 39,518 | $ | 43,861 | $ | 10,776 | $ | 9,214 | $ | 0 | $ | 141,964 |
| Reconciliation of NOI to net income (loss) available to common shareholders | ||||||||||||||
| Depreciation/amortization | $ | (14,374) | $ | (20,944) | $ | (16,792) | $ | (3,685) | $ | (3,465) | $ | (382) | $ | (59,642) |
| Administrative, advisory and trustee fees | 0 | 0 | 0 | 0 | 0 | (7,381) | (7,381) | |||||||
| Other expenses | 0 | 0 | 0 | 0 | 0 | (1,898) | (1,898) | |||||||
| Interest expense | (17,715) | (21,350) | (15,974) | (3,668) | (3,017) | (2,342) | (64,066) | |||||||
| Interest and other income | 0 | 0 | 0 | 0 | 0 | 786 | 786 | |||||||
| Income (loss) from continuing operations | 6506 | (2,776) | 11,095 | 3,423 | 2,732 | (11,217) | 9,763 | |||||||
| Income (loss) from discontinued operations | 161 | 0 | (465) | 0 | 247 | 0 | (57) | |||||||
| Net income (loss) | 6,667 | (2,776) | 10,630 | 3,423 | 2,979 | (11,217) | 9,706 | |||||||
| Net income attributable to noncontrolling interests – Operating Partnership | 0 | 0 | 0 | 0 | 0 | (1,359) | (1,359) | |||||||
| Net income attributable to noncontrolling interests – consolidated real estate entities | 0 | 0 | 0 | 0 | 0 | (135) | (135) | |||||||
| Net income (loss) attributable to Investors Real Estate Trust | 6,667 | (2,776) | 10,630 | 3,423 | 2,979 | (12,711) | 8,212 | |||||||
| Dividends to preferred shareholders | 0 | 0 | 0 | 0 | 0 | (2,372) | (2,372) | |||||||
| NET INCOME (LOSS) AVAILABLE TO COMMON SHAREHOLDERS | $ | 6,667 | $ | (2,776) | $ | 10,630 | $ | 3,423 | $ | 2,979 | $ | (15,083) | $ | 5,840 |
| (1) | See list of properties excluded from stabilized properties on page ii. |
19
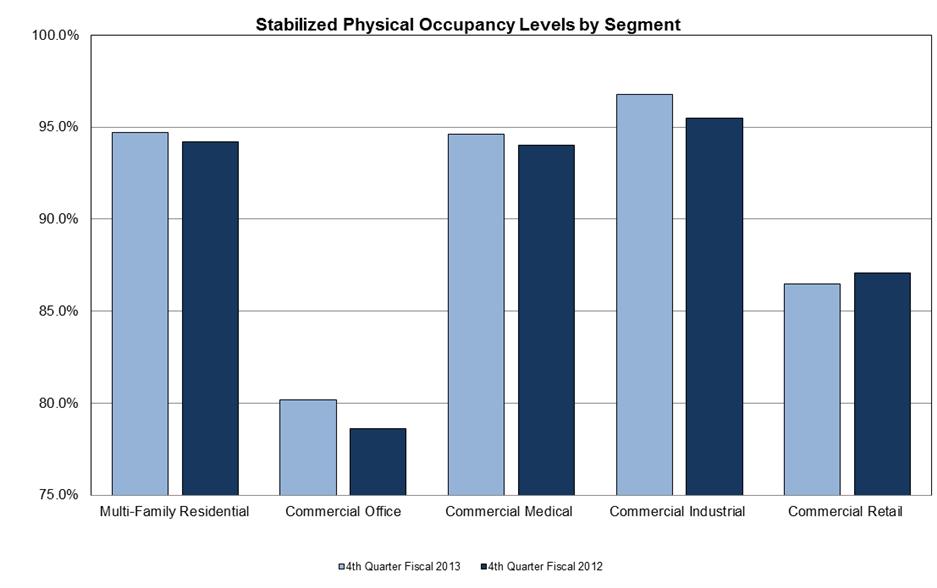
INVESTORS REAL ESTATE TRUST AND SUBSIDIARIES
STABILIZED PROPERTIES AND ALL PROPERTIES PHYSICAL OCCUPANCY LEVELS BY SEGMENT
4th Quarter Fiscal 2013 vs. 4th Quarter Fiscal 2012
| Segments | Stabilized Properties | All Properties | ||
4th Quarter | 4th Quarter | 4th Quarter | 4th Quarter | |
| Fiscal 2013 | Fiscal 2012 | Fiscal 2013 | Fiscal 2012 | |
| Multi-Family Residential | 94.7% | 94.2% | 94.6% | 93.7% |
| Commercial Office | 80.2% | 78.6% | 80.2% | 78.6% |
| Commercial Healthcare | 94.6% | 94.0% | 94.7% | 94.4% |
| Commercial Industrial | 96.8% | 95.5% | 96.8% | 95.5% |
| Commercial Retail | 86.5% | 87.1% | 86.5% | 87.1% |
20
INVESTORS REAL ESTATE TRUST AND SUBSIDIARIES
COMMERCIAL LEASING SUMMARY (Stabilized Properties)
for the three months ended April 30, 2013
| Three Months Ended April 30, 2013 | ||||
Square Feet of New Leases(1) | Square Feet of Leases Renewed(1) (2) | Total Square Feet of Leases Executed(1) | Physical Occupancy | |
| Segments | Fiscal Year Ended April 30, | |||
| Office | 97,904 | 166,083 | 263,987 | 80.2% |
| Healthcare | 3,448 | 31,258 | 34,706 | 94.6% |
| Industrial | 36,982 | 13,870 | 50,852 | 96.8% |
| Retail | 28,460 | 30,891 | 59,351 | 86.5% |
| Total | 166,794 | 242,102 | 408,896 | 88.2% |
| (1) | The leasing activity presented is based on leases signed or executed for our stabilized rental properties during the period and is not intended to coincide with the commencement of rental revenue in accordance with accounting principles generally accepted in the United States of America ("GAAP"). |
| (2) | Leases renewed include the retained occupancy of tenants on a month-to-month basis past their original lease expiration date. |
| New Leases | Three Months Ended April 30, 2013 | |||||||||
| Segments | Square Feet of New Leases(1) | Average Term in Years | Average Effective Rent(2) | Estimated Tenant Improvement Cost per Square Foot(1) | Leasing Commissions per Square Foot(1) | |||||
| Office | 97,904 | 6.7 | $ | 16.48 | $ | 19.37 | $ | 7.62 | ||
| Healthcare | 3,448 | 6.3 | 17.57 | 25.95 | 7.10 | |||||
| Industrial | 36,982 | 4.8 | 4.84 | 3.91 | 1.43 | |||||
| Retail | 28,460 | 5.5 | 7.85 | 9.16 | 5.30 | |||||
| Total | 166,794 | 6.2 | $ | 12.45 | $ | 14.33 | $ | 5.84 | ||
| (1) | The leasing activity presented is based on leases signed or executed for our stabilized rental properties during the period and is not intended to coincide with the commencement of rental revenue in accordance with accounting principles generally accepted in the United States of America ("GAAP"). Tenant improvements and leasing commissions presented are based on square feet leased during the period. |
| (2) | Effective rents represent average annual base rental payments, on a straight-line basis for the term of each lease, excluding operating expense reimbursements. The underlying leases contain various expense structures including gross, modified gross, net and triple net. |
| Lease Renewals | Three Months Ended April 30, 2013 | ||||||||||||
| Segments | Square Feet of Leases Renewed(1) | Percent of Expiring Leases Renewed(2) | Average Term in Years | Weighted Average Growth (Decline) in Effective Rents(3) | Estimated Tenant Improvement Cost per Square Foot(1) | Leasing Commissions per Square Foot(1) | |||||||
| Office | 166,083 | 84.7% | 2.8 | (4.9%) | $ | 5.60 | $ | 4.26 | |||||
| Healthcare | 31,258 | 100.0% | 5.6 | 2.8% | 8.72 | 3.59 | |||||||
| Industrial | 13,870 | 7.8% | 3.0 | 1.4% | 0.00 | 0.64 | |||||||
| Retail | 30,891 | 100.0% | 3.6 | 23.4% | 2.44 | 0.25 | |||||||
| Total | 242,102 | 50.4% | 3.7 | (1.3%) | $ | 5.28 | $ | 3.45 | |||||
| (1) | The leasing activity presented is based on leases signed or executed for our stabilized rental properties during the period and is not intended to coincide with the commencement of rental revenue in accordance with accounting principles generally accepted in the United States of America ("GAAP"). Tenant improvements and leasing commissions are based on square feet leased during the period. |
| (2) | Renewal percentage of expiring leases is based on square footage of renewed leases and not the number of leases renewed. Expiring leases where the tenant retained occupancy on a month-to-month basis past the lease expiration date were considered to have been renewed. |
| (3) | Represents the percentage change in effective rent between the original leases and the renewal leases. Effective rents represent average annual base rental payments, on a straight-line basis for the term of each lease, excluding operating expense reimbursements. The underlying leases contain various expense structures including gross, modified gross, net and triple net. |
21
INVESTORS REAL ESTATE TRUST AND SUBSIDIARIES
COMMERCIAL LEASING SUMMARY (Stabilized Properties)
for the twelve months ended April 30, 2013
| Twelve Months Ended April 30, 2013 | ||||
Square Feet of New Leases(1) | Square Feet of Leases Renewed(1) (2) | Total Square Feet of Leases Executed(1) | Physical Occupancy | |
| Segments | Fiscal Year Ended April 30, | |||
| Office | 263,799 | 399,399 | 663,198 | 80.2% |
| Healthcare | 51,126 | 55,718 | 106,844 | 94.6% |
| Industrial | 36,982 | 23,572 | 60,554 | 96.8% |
| Retail | 92,662 | 86,878 | 179,540 | 86.5% |
| Total | 444,569 | 565,567 | 1,010,136 | 88.2% |
| (1) | The leasing activity presented is based on leases signed or executed for our stabilized rental properties during the period and is not intended to coincide with the commencement of rental revenue in accordance with accounting principles generally accepted in the United States of America ("GAAP"). |
| (2) | Leases renewed include the retained occupancy of tenants on a month-to-month basis past their original lease expiration date. |
| New Leases | Twelve Months Ended April 30, 2013 | |||||||||
| Segments | Square Feet of New Leases(1) | Average Term in Years | Average Effective Rent(2) | Estimated Tenant Improvement Cost per Square Foot(1) | Leasing Commissions per Square Foot(1) | |||||
| Office | 263,799 | 5.5 | $ | 14.53 | $ | 14.24 | $ | 5.34 | ||
| Healthcare | 51,126 | 8.2 | 20.14 | 37.99 | 7.06 | |||||
| Industrial | 36,982 | 4.8 | 4.84 | 3.90 | 1.43 | |||||
| Retail | 92,662 | 5.0 | 8.93 | 9.66 | 2.21 | |||||
| Total | 444,569 | 5.9 | $ | 13.20 | $ | 15.16 | $ | 4.56 | ||
| (1) | The leasing activity presented is based on leases signed or executed for our stabilized rental properties during the period and is not intended to coincide with the commencement of rental revenue in accordance with accounting principles generally accepted in the United States of America ("GAAP"). Tenant improvements and leasing commissions presented are based on square feet leased during the period. |
| (2) | Effective rents represent average annual base rental payments, on a straight-line basis for the term of each lease, excluding operating expense reimbursements. The underlying leases contain various expense structures including gross, modified gross, net and triple net. |
| Lease Renewals | Twelve Months Ended April 30, 2013 | ||||||||||||
| Segments | Square Feet of Leases Renewed(1) | Percent of Expiring Leases Renewed(2) | Average Term in Years | Weighted Average Growth (Decline) in Effective Rents(3) | Estimated Tenant Improvement Cost per Square Foot(1) | Leasing Commissions per Square Foot(1) | |||||||
| Office | 399,399 | 87.1% | 3.1 | (5.3%) | $ | 5.89 | $ | 4.47 | |||||
| Healthcare | 55,718 | 74.1% | 6.5 | 4.7% | 16.67 | 4.74 | |||||||
| Industrial | 23,572 | 30.9% | 3.1 | (2.8%) | 0.21 | 0.59 | |||||||
| Retail | 86,878 | 72.4% | 3.4 | 8.6% | 1.03 | 0.25 | |||||||
| Total | 565,567 | 70.1% | 3.9 | (2.6%) | $ | 5.97 | $ | 3.6 | |||||
| (1) | The leasing activity presented is based on leases signed or executed for our stabilized rental properties during the period and is not intended to coincide with the commencement of rental revenue in accordance with accounting principles generally accepted in the United States of America ("GAAP"). Tenant improvements and leasing commissions are based on square feet leased during the period. |
| (2) | Renewal percentage of expiring leases is based on square footage of renewed leases and not the number of leases renewed. Expiring leases where the tenant retained occupancy on a month-to-month basis past the lease expiration date were considered to have been renewed. |
| (3) | Represents the percentage change in effective rent between the original leases and the renewal leases. Effective rents represent average annual base rental payments, on a straight-line basis for the term of each lease, excluding operating expense reimbursements. The underlying leases contain various expense structures including gross, modified gross, net and triple net. |
22
INVESTORS REAL ESTATE TRUST AND SUBSIDIARIES
MULTI-FAMILY RESIDENTIAL SUMMARY
| Three Months Ended | ||||||||||
| 4/30/2013 | 1/31/2013 | 10/31/2012 | 07/31/2012 | 04/30/2012 | ||||||
| Number of Units | 10,280 | 9,924 | 9,934 | 9,876 | 8,894 | |||||
| Average Investment Per Unit | ||||||||||
| Stabilized | $ | 58,765 | $ | 58,506 | $ | 58,308 | $ | 58,012 | $ | 57,776 |
| Non-Stabilized | 87,408 | 87,083 | 85,580 | 83,113 | 83,758 | |||||
| All Properties | $ | 63,659 | $ | 63,107 | $ | 62,614 | $ | 61,472 | $ | 59,268 |
Average Scheduled Rent(1) per Unit | ||||||||||
| Stabilized | $ | 748 | $ | 742 | $ | 734 | $ | 726 | $ | 718 |
| Non-Stabilized | 944 | 994 | 967 | 889 | 908 | |||||
| All Properties | $ | 781 | $ | 782 | $ | 771 | $ | 749 | $ | 729 |
| Total Receipts per Unit | ||||||||||
| Stabilized | $ | 739 | $ | 731 | $ | 733 | $ | 716 | $ | 709 |
| Non-Stabilized | 954 | 1,004 | 996 | 831 | 845 | |||||
| All Properties | $ | 776 | $ | 775 | $ | 774 | $ | 732 | $ | 717 |
Total Recurring Capital Expenditures per Unit(1) | $ | 176 | $ | 134 | $ | 193 | $ | 209 | $ | 157 |
| Physical Occupancy% | ||||||||||
| Stabilized | 94.7% | 94.0% | 94.8% | 93.7% | 94.2% | |||||
| Non-Stabilized | 94.5% | 91.4% | 93.4% | 88.7% | 85.4% | |||||
| All Properties | 94.6% | 93.6% | 94.6% | 93.0% | 93.7% | |||||
| Operating Expenses as a % of Scheduled Rent | ||||||||||
| Stabilized | 44.0% | 47.3% | 41.3% | 44.8% | 46.4% | |||||
| Non-Stabilized | 43.0% | 38.7% | 36.9% | 34.8% | 37.3% | |||||
| All Properties | 43.8% | 45.5% | 40.4% | 43.1% | 45.8% | |||||
| (1) | See Definitions on page 28. |
23
INVESTORS REAL ESTATE TRUST AND SUBSIDIARIES
10 LARGEST COMMERCIAL TENANTS – BASED ON ANNUALIZED BASE RENT(1)
as of April 30, 2013
| Tenant | Number of Properties | Average Remaining Lease Term in Months | % of Total Commercial Segments' Minimum Rents | Aggregate Rentable Square Feet | % of Aggregate Occupied Square Feet |
| Affiliates of Edgewood Vista | 32 | 85 | 13.2% | 1,481,647 | 13.5% |
| St. Luke's Hospital of Duluth, Inc. | 6 | 33 | 3.5% | 198,775 | 1.8% |
| Fairview Health Services | 9 | 46 | 3.4% | 240,123 | 2.2% |
| Applied Underwriters | 3 | 46 | 2.3% | 141,724 | 1.3% |
| HealthEast Care System | 1 | 70 | 1.6% | 114,316 | 1.0% |
| Affiliates of Siemens USA (NYSE: SI) | 2 | 47 | 1.3% | 112,848 | 1.0% |
| Nebraska Orthopaedic Hospital | 1 | 191 | 1.3% | 61,758 | 0.6% |
| Arcadis Corporate Services, Inc. | 1 | 39 | 1.2% | 71,430 | 0.7% |
| Microsoft (NASDAQ: MSFT) | 1 | 68 | 1.2% | 122,040 | 1.1% |
| State of Idaho Department of Health and Welfare | 2 | 58 | 1.1% | 103,342 | 0.9% |
| Total/Weighted Average | 63 | 30.1% | 2,648,003 | 24.1% |
| (1) | See Definitions on page 28. |
24
INVESTORS REAL ESTATE TRUST AND SUBSIDIARIES
LEASE EXPIRATIONS
as of April 30, 2013
| (dollars in thousands except average rental rates) | ||||||||
| Fiscal Year | Number of Leases | Rentable Square Feet | % of Rentable Square Feet | Annualized Rent(6) | Average Rental Rate | % of Annualized Base Rent | ||
| Commercial Office | ||||||||
2014(1) | 88 | 577,745 | 14.2% | $ | 7,085 | $ | 12.26 | 11.9% |
| 2015 | 74 | 496,626 | 12.3% | 8,073 | 16.26 | 13.6% | ||
| 2016 | 51 | 655,231 | 16.1% | 10,080 | 15.38 | 16.9% | ||
| 2017 | 49 | 865,962 | 21.3% | 14,761 | 17.05 | 24.8% | ||
| 2018 | 40 | 499,545 | 12.3% | 7,168 | 14.35 | 12.0% | ||
| 2019 and thereafter | 45 | 964,917 | 23.8% | 12,354 | 12.80 | 20.8% | ||
| 347 | 4,060,026 | 100.0% | $ | 59,521 | $ | 14.66 | 100.0% | |
Commercial Healthcare | ||||||||
2014(2) | 45 | 467,447 | 16.7% | $ | 7,724 | $ | 16.52 | 16.0% |
| 2015 | 16 | 60,120 | 2.1% | 1,549 | 25.77 | 3.2% | ||
| 2016 | 25 | 176,027 | 6.3% | 3,638 | 20.67 | 7.6% | ||
| 2017 | 20 | 133,237 | 4.8% | 2,846 | 21.36 | 5.9% | ||
| 2018 | 21 | 171,709 | 6.1% | 4,115 | 23.96 | 8.5% | ||
| 2019 and thereafter | 77 | 1,791,491 | 64.0% | 28,367 | 15.83 | 58.8% | ||
| 204 | 2,800,031 | 100.0% | $ | 48,239 | $ | 17.23 | 100.0% | |
| Commercial Industrial | ||||||||
2014(3) | 14 | 481,510 | 16.8% | $ | 1,716 | $ | 3.56 | 14.8% |
| 2015 | 6 | 344,493 | 12.0% | 1,406 | 4.08 | 12.1% | ||
| 2016 | 11 | 783,414 | 27.3% | 3,216 | 4.11 | 27.6% | ||
| 2017 | 5 | 311,141 | 10.8% | 1,183 | 3.80 | 10.2% | ||
| 2018 | 0 | 0 | 0.0% | 0 | 0.00 | 0.0% | ||
| 2019 and thereafter | 10 | 949,352 | 33.1% | 4,102 | 4.32 | 35.3% | ||
| 46 | 2,869,910 | 100.0% | $ | 11,623 | $ | 4.05 | 100.0% | |
| Commercial Retail | ||||||||
2014(4) | 62 | 250,565 | 20.7% | $ | 2,050 | $ | 8.18 | 19.0% |
| 2015 | 41 | 332,263 | 27.5% | 2,428 | 7.31 | 22.4% | ||
| 2016 | 27 | 99,636 | 8.2% | 1,209 | 12.14 | 11.2% | ||
| 2017 | 25 | 126,340 | 10.4% | 1,192 | 9.43 | 11.0% | ||
| 2018 | 18 | 38,992 | 3.2% | 511 | 13.10 | 4.7% | ||
| 2019 and thereafter | 26 | 363,104 | 30.0% | 3,427 | 9.44 | 31.7% | ||
| 199 | 1,210,900 | 100.0% | $ | 10,817 | $ | 8.93 | 100.0% | |
| Commercial Total | ||||||||
2014(5) | 209 | 1,777,267 | 16.2% | $ | 18,575 | $ | 10.45 | 14.3% |
| 2015 | 137 | 1,233,502 | 11.3% | 13,456 | 10.91 | 10.3% | ||
| 2016 | 114 | 1,714,308 | 15.7% | 18,143 | 10.58 | 13.9% | ||
| 2017 | 99 | 1,436,680 | 13.1% | 19,982 | 13.91 | 15.3% | ||
| 2018 | 79 | 710,246 | 6.5% | 11,794 | 16.61 | 9.1% | ||
| 2019 and thereafter | 158 | 4,068,864 | 37.2% | 48,250 | 11.86 | 37.1% | ||
| 796 | 10,940,867 | 100.0% | $ | 130,200 | $ | 11.90 | 100.0% | |
| (1) | Includes month-to-month leases. As of April 30, 2013 month-to-month leases accounted for 103,108 square feet. |
| (2) | Includes month-to-month leases. As of April 30, 2013 month-to-month leases accounted for 42,201 square feet. |
| (3) | Includes month-to-month leases. As of April 30, 2013 month-to-month leases accounted for 221,062 square feet. |
| (4) | Includes month-to-month leases. As of April 30, 2013 month-to-month leases accounted for 51,135 square feet. |
| (5) | Includes month-to-month leases. As of April 30, 2013 month-to-month leases accounted for 417,506 square feet. |
| (6) | Annualized Base Rent is monthly scheduled rent as of April 1, 2013 (cash basis), multiplied by 12. |
25
INVESTORS REAL ESTATE TRUST AND SUBSIDIARIES
FISCAL 2013 ACQUISITION SUMMARY
as of April 30, 2013
(dollars in thousands)
| Property | Location | Segment Type | Acquisition Date | Square Feet/Units | Leased Percentage At Acquisition | April 30, 2013 Leased Percentage | Acquisition Cost | ||||
| Villa West | Topeka, KS | Multi-Family Residential | May 8, 2012 | 308 | 98.1% | 86.7% | $ | 17,650 | |||
| Colony | Lincoln, NE | Multi-Family Residential | June 4, 2012 | 232 | 98.3% | 97.0% | 17,500 | ||||
| Lakeside Village | Lincoln, NE | Multi-Family Residential | June 4, 2012 | 208 | 86.5% | 91.4% | 17,250 | ||||
Quarry Ridge II(1) | Rochester, MN | Multi-Family Residential | June 29, 2012 | 159 | 33.3% | 98.7% | 4,591 | ||||
Williston Garden Buildings 3 and 4(2) | Williston, ND | Multi-Family Residential | July 31, 2012 | 73 | 98.6% | 98.6% | 7,058 | ||||
| University Commons | Williston, ND | Unimproved Land | August 1, 2012 | n/a | n/a | n/a | 823 | ||||
| Cypress Court | St. Cloud, MN | Unimproved Land | August 10, 2012 | n/a | n/a | n/a | 447 | ||||
| Cypress Court Apartment Development | St. Cloud, MN | Unimproved Land | August 10, 2012 | n/a | n/a | n/a | 1,136 | ||||
| The Ponds at Heritage Place | Sartell, MN | Multi-Family Residential | October 10, 2012 | 58 | 91.4% | 89.7% | 5,020 | ||||
Spring Wind Expansion(3) | Laramie, WY | Commercial Healthcare | November 16, 2012 | 26,662 | 100.0% | 100.0% | 1,675 | ||||
| Badger Hills | Rochester, MN | Unimproved Land | December 14, 2012 | n/a | n/a | n/a | 1,050 | ||||
Minot IPS(4) | Minot, ND | Commercial Industrial | December 17, 2012 | 27,698 | 100.0% | 100.0% | 4,087 | ||||
| Grand Forks | Grand Forks, ND | Unimproved Land | December 31, 2012 | n/a | n/a | n/a | 4,278 | ||||
Jamestown Medical Office Building(5) | Jamestown, ND | Commercial Healthcare | January 1, 2013 | 45,222 | 91.7% | 80.5% | 6,597 | ||||
| Minot (Southgate Lot 4) | Minot, ND | Unimproved Land | January 11, 2013 | n/a | n/a | n/a | 1,882 | ||||
| Commons at Southgate | Minot, ND | Unimproved Land | January 22, 2013 | n/a | n/a | n/a | 3,691 | ||||
| Landing at Southgate | Minot, ND | Unimproved Land | January 22, 2013 | n/a | n/a | n/a | 2,262 | ||||
Arrowhead First International Bank(6) | Minot, ND | Commercial Retail | March, 19, 2013 | 3,702 | 100.0% | 100.0% | 1,165 | ||||
| Grand Forks 2150 | Grand Forks, ND | Unimproved Land | March 25, 2013 | n/a | n/a | n/a | 1,600 | ||||
| Bismarck 4916 | Bismarck, ND | Unimproved Land | April 12, 2013 | n/a | n/a | n/a | 3,250 | ||||
First Avenue(7) | Minot, ND | Multi-Family Residential | April 15, 2013 | 20 | 100.0% | 100.0% | 2,356 | ||||
| Whispering Ridge | Omaha, NE | Multi-Family Residential | April 24, 2013 | 336 | 100.0% | 100.0% | 28,314 | ||||
| Arcata | Golden Valley, MN | Unimproved Land | April 30, 2013 | n/a | n/a | n/a | 2,088 | ||||
| Total Square Feet | 103,153 | $ | 135,770 | ||||||||
| Total Units | 1,394 | ||||||||||
| (1) | Development property placed in service June 29, 2012. Additional costs paid in fiscal years 2012 and 2011, and land acquired in fiscal year 2007, totaled $13.0 million, for a total project cost at April 30, 2013 of $17.6 million. |
| (2) | Development property placed in service July 31, 2012. Buildings 1 and 2 were placed in service in fiscal year 2012. Additional costs paid in fiscal year 2012 totaled $12.0 million, for a total project cost at April 30, 2013 of $19.1 million. |
| (3) | Expansion project placed in service November 16, 2012. Additional costs paid in fiscal year 2012 totaled $1.8 million, for a total project cost at April 30, 2013 of $3.5 million. |
| (4) | Development property placed in service December 17, 2012. Additional costs paid in fiscal year 2012 totaled $1.8 million, for a total project cost at April 30, 2013 of $5.9 million. |
| (5) | Development property placed in service January 1, 2013. Additional costs paid in fiscal year 2012 totaled $1.0 million, for a total project cost at April 30, 2013 of $7.6 million. |
| (6) | Development property placed in service March 19, 2013. Additional costs paid in fiscal year 2012 totaled approximately $75,000, for a total project cost at April 30, 2013 of $1.2 million |
| (7) | Redevelopment property placed in service April 15, 2013. Additional costs paid in fiscal years 2012 and 2011 totaled approximately $321,000, for a total project cost at April 30, 2013 of $2.7 million. |
26
INVESTORS REAL ESTATE TRUST AND SUBSIDIARIES
FISCAL 2013 DEVELOPMENT IN PROGESS SUMMARY
as of April 30, 2013
(dollars in thousands)
| Property and Location | Total Rentable Square Feet or # of Units | Percentage Leased or Committed | Anticipated Total Cost | Cost to Date | Anticipated Construction Completion | ||
| River Ridge - Bismarck, ND | 146 unit apartment building | 16.4% | $ | 25,800 | $ | 13,200 | 2nd Quarter Fiscal 2014 |
Cypress Court Apartment Development - St. Cloud, MN(1) | 132 unit apartment building | 20.0% | 14,300 | 6,500 | 2nd Quarter Fiscal 2014 | ||
Landing at Southgate - Minot, ND(2) | three 36 unit apartment buildings | 12.0% | 15,000 | 7,400 | 2nd Quarter Fiscal 2014 | ||
Commons at Southgate - Minot, ND(2) | 233 unit apartment building | 0% | 37,200 | 6,500 | 1st Quarter Fiscal 2015 | ||
Renaissance Heights I - Williston, ND(3) | 288 unit apartment building | 0% | 62,200 | 10,100 | 2nd Quarter Fiscal 2015 | ||
| Arcata - Golden Valley, MN | 165 unit apartment building | 0% | 33,400 | 2,700 | 3rd Quarter Fiscal 2015 | ||
| Other | n/a | n/a | n/a | 400 | n/a | ||
| $ | 187,900 | $ | 46,800 | ||||
| (1) | The Company is a 79% partner in the joint venture entity constructing this property; the anticipated total cost amount given is the total cost to the joint venture entity. |
| (2) | The Company is a 51% partner in the joint venture entity constructing these properties; the anticipated total cost amount given is the total cost to the joint venture entity |
| (3) | The Company is a 70% partner in the joint venture entity constructing this property; the anticipated total cost amount given is the total cost to the joint venture entity |
27
Definitions
April 30, 2013
Adjusted funds from operations (AFFO) is calculated by subtracting from Funds from operations (FFO) (1) tenant improvements and leasing costs at stabilized properties, and recurring capital expenditures that are capitalized and amortized and are necessary to maintain our properties and revenue stream and (2) straight line rents, then adding (3) non-real estate depreciation and amortization. We may also subtract from FFO certain unusual non-recurring items that do not produce cash available for distribution to shareholders. AFFO is included herein because we consider it to be a measure of a REIT's ability to incur and service debt and to pay distributions to its shareholders. AFFO is a non-GAAP and non-standardized measure, and may be calculated differently by other REITs. Through the second quarter of fiscal year 2013, our calculation of AFFO excluded (that is, subtracted from FFO) tenant improvements and leasing costs on an all-property basis. In the third quarter of the current fiscal year, we revised our calculation to subtract from FFO leasing commissions and tenant improvements at stabilized properties only, since we consider tenant improvement and leasing cost levels at non-stabilized properties unrepresentative of expected levels at stabilized properties. This change in definition had no effect on AFFO per share and unit as previously reported. We also updated the calculation to exclude the write-off of fully-amortized leasing costs, which had previously been included in the calculation. This change resulted in a decrease in AFFO per share and unit in the second quarter of fiscal year 2013 from $0.13 to $0.12 and in the fourth quarter of fiscal year 2012 from $0.11 to $0.10. The AFFO per share and unit payout ratio had a corresponding increase in the second quarter of fiscal year 2013 from 100.00% to 108.3% and in the fourth quarter of fiscal year 2012 from 118.2% to 130.0%.
Annualized base rent (ABR) is calculated as monthly base rent (cash basis) per the lease, as of the reporting period, multiplied by 12.
Debt to total market capitalization is total debt from the balance sheet divided by the sum of total debt from the balance sheet plus the market value of shares outstanding at the end of the period.
Debt service coverage ratio is computed by dividing earnings before interest income and expense, depreciation, amortization and gain on sale of real estate by interest expense and principal amortization.
EBITDA is earnings before interest, taxes, depreciation and amortization. We consider EBITDA to be an appropriate supplemental performance measure because it eliminates depreciation, interest and the gain/loss from property dispositions, which permits investors to view income from operations without the effect of non-cash depreciation or the cost of debt; however, EBIDTA as we calculate it has not been adjusted for the effect of nonrecurring events such as asset impairment and gain/loss on involuntary conversion. EBITDA is a non-GAAP measure. EBITDA as calculated by us is not comparable to EBITDA reported by other REITs that do not define EBITDA exactly as we do.
Funds from operations (FFO) - The National Association of Real Estate Investment Trusts, Inc. (NAREIT) defines FFO as "net income (computed in accordance with generally accepted accounting principles, excluding gains (or losses) from sales of property, plus real estate depreciation and amortization, and adjustments for unconsolidated partnerships and joint ventures. Adjustments for unconsolidated partnerships and joint ventures will be calculated to reflect funds from operations on the same basis." In addition, in October 2011 NAREIT clarified its computation of FFO to exclude impairment charges for all periods presented. FFO is a non-GAAP measure. We consider FFO, which is a standard supplemental measure for equity real estate investment trusts, helpful to investors because it facilitates an understanding of the operating performance of properties without giving effect to impairment write-downs and to real estate depreciation and amortization, which assumes that the value of real estate assets diminishes predictably over time. Since real estate values instead historically rise or fall with market conditions, we believe that FFO provides investors and management with a more accurate indication of our financial and operating results.
Net Operating Income (NOI) is total real estate revenues and gain on involuntary conversion less real estate expenses (which consist of utilities, maintenance, real estate taxes, insurance and property management expenses). We believe that NOI is an important supplemental measure of operating performance for a REIT's operating real estate because it provides a measure of core operations that is unaffected by depreciation, amortization, financing and general and administrative expense. NOI does not represent cash generated by operating activities in accordance with GAAP and should not be considered an alternative to net income, net income available for common shareholders or cash flow from operating activities as a measure of financial performance.
Payout ratio (FFO per share and unit basis) - The ratio of the current quarterly or annual distribution rate per common share and unit divided by quarterly or annual FFO per share and unit.
Ratio of earnings to fixed charges - The ratio of earnings to fixed charges is computed by dividing earnings by fixed charges. For this purpose, earnings consist of income from continuing operations plus fixed charges and preferred distributions, less adjustments for noncontrolling interests - consolidated real estate entities, capitalized interest and preferred distributions. Fixed charges consist of mortgage and loan interest expense, whether expensed or capitalized, the amortization of debt expense and capitalized interest.
Ratio of earnings to combined fixed charges and preferred distributions - The ratio of earnings to combined fixed charges and preferred distributions is computed by dividing earnings by combined fixed charges and preferred distributions. For this purpose, earnings consist of income from continuing operations plus fixed charges and preferred distributions, less adjustments for noncontrolling interests - consolidated real estate entities, capitalized interest and preferred distributions. Combined fixed charges and preferred distributions consist of fixed charges (mortgage and loan interest expense, whether expensed or capitalized, the amortization of debt expense and capitalized interest) and preferred distributions.
Recurring capital expenditures are expenditures (excluding capital expenditures recoverable from tenants and capital expenditures at properties sold during the period) made on a regular or recurring basis to maintain a property's competitive position within its market, generally with a depreciable life of 5 to 12 years, but excluding (a) capital expenditures made in the year of acquisition and in subsequent periods until the property is stabilized (i.e., excluding capital expenditures on non-stabilized properties), (b) improvements associated with the expansion or re-development of a building, (c) renovations to a building which change the underlying classification of the building (for example, from industrial to office or Class C office to Class A office) or (d) capital improvements that represent the addition of something new to a property, rather than the replacement of an existing item.
Scheduled rent revenue is the total possible revenue from all leasable units and square footage, with occupied space valued at contract rates pursuant to leases and vacant units or square footage at market rates.
Stabilized properties are properties owned or in service for the entirety of the periods being compared, and, in the case of development or re-development properties, which have achieved a target level of occupancy of 90% for multi-family residential properties and 85% for commercial office, healthcare, industrial and retail properties.
28