Exhibit 99.2
Third Quarter Fiscal 2015
Supplemental Operating and Financial Data
for the Quarter Ended January 31, 2015
| | | | | |
CONTACT: Cindy Bradehoft Director of Investor Relations Direct Dial: 952-401-4835 E-Mail: cbradehoft@iret.com | | | | 1400 31st Avenue SW, Suite 60 Minot, ND 58701 Tel: 701.837.4738 Fax: 701.838.7785 www.iret.com |
Supplemental Financial and Operating Data
January 31, 2015
| | Page |
| | |
| Company Background and Highlights | 2 |
| | |
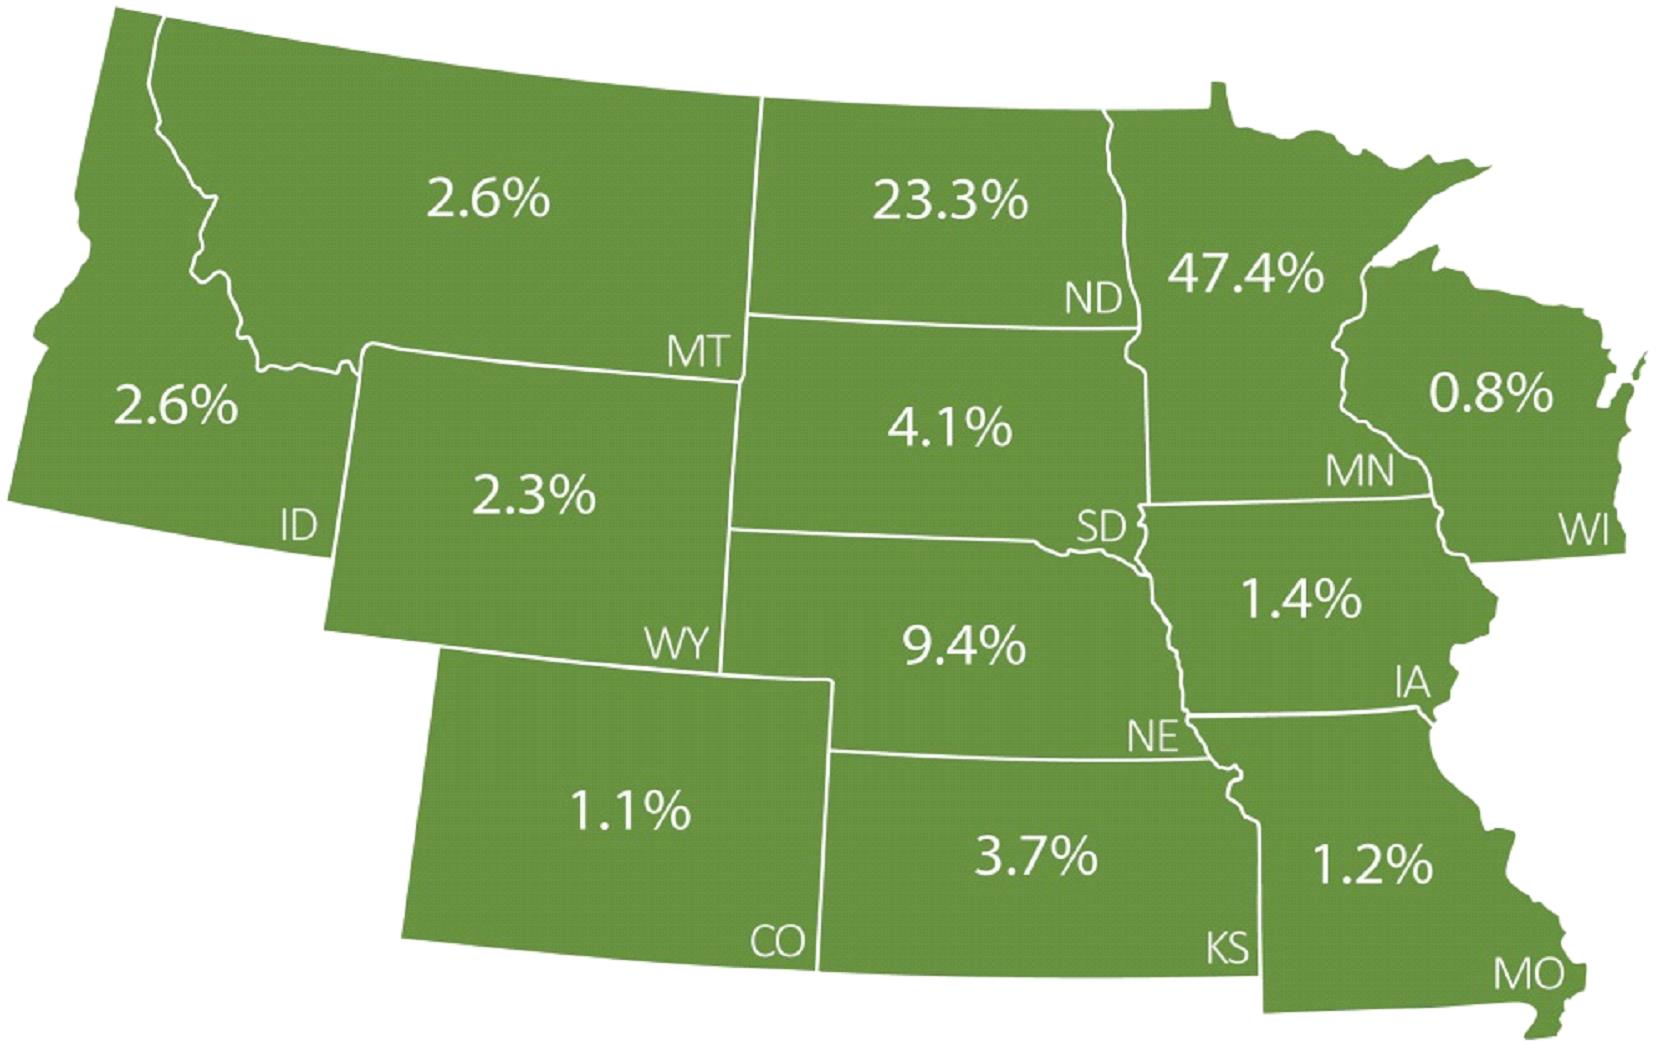
| Property Cost by Segment and by State | 5 |
| | |
| Key Financial Data | |
| Condensed Consolidated Balance Sheets | 6 |
| Condensed Consolidated Statements of Operations | 7 |
| Funds From Operations | 8 |
| Adjusted Earnings Before Interest, Taxes, Depreciation and Amortization (Adjusted EBITDA) | 9 |
| | |
| Capital Analysis | |
| Long-Term Mortgage Debt Analysis | 10 |
| Long-Term Mortgage Debt Detail | 11-13 |
| Capital Analysis | 14 |
| | |
| Portfolio Analysis | |
| Same-Store Properties Net Operating Income Summary | 15 |
| Net Operating Income Detail | 16-19 |
| Same-Store Properties and All Properties Occupancy Levels by Segment | 20 |
| | |
| Tenant Analysis | |
| Multi-Family Residential Summary | 21 |
| Commercial Leasing Summary | 22-25 |
| 10 Largest Commercial Tenants - Based on Annualized Base Rent | 26 |
| Commercial Lease Expirations | 27 |
| | |
| Growth and Strategy | |
| Acquisition Summary | 28 |
| Development Placed in Service Summary | 29 |
| Development in Progress Summary | 30 |
| Acquisitions and Development Liquidity Profile | 31 |
| | |
| Definitions | 32 |
Company Background and Highlights
Third Quarter Fiscal 2015
Investors Real Estate Trust is a self-administered, equity real estate investment trust (REIT) investing in a portfolio of income-producing properties located primarily in the upper Midwest. IRET's portfolio is diversified among multi-family residential; office; healthcare, including senior housing; industrial and retail segments.
During the third quarter of fiscal year 2015, the Company closed on its acquisition of an approximately 1.1-acre parcel of vacant land in Minot, North Dakota, for a purchase price of $1.3 million. Also during the third quarter of fiscal year 2015, the Company placed in service the 130-unit Red 20 multi-family residential property in Minneapolis, Minnesota, owned by a joint venture entity in which the Company has an approximately 58.6% interest; the 233-unit Commons at Southgate multi-family residential property in Minot, North Dakota, owned by a joint venture entity in which the Company has an approximately 52.9% interest; the 64-unit Cypress Court II multi-family residential property in St. Cloud, Minnesota, owned by a joint venture entity in which the Company has an approximately 86.1% interest; the 165-unit Arcata multi-family residential property in Golden Valley, Minnesota and the 4,998-square foot Minot Wells Fargo Bank retail property in Minot, North Dakota.
During the third quarter of fiscal year 2015, the Company sold an office property in Maple Grove, Minnesota and a retail property in Fargo, North Dakota for sales prices totaling $10.0 million.
During the third quarter of fiscal year 2015, continued high occupancy levels in the Company's multi-family residential portfolio allowed the Company to implement selected rent increases, and the Company expects to see continued favorable results in this segment in the remainder of fiscal year 2015. Demand was strong for the approximately 798 apartment units the Company placed in service during fiscal year 2015. The following development projects were completed in the third quarter, with a total of 592 units available for lease: the Commons at Southgate project in Minot, North Dakota; Cypress Court in St. Cloud, Minnesota; Arcata in Golden Valley, Minnesota and Red 20 in Minneapolis, Minnesota. The Company's Renaissance Heights project in Williston, North Dakota has 162 out of 288 planned units currently in service. However, the Company's ability to maintain occupancy levels and selectively raise rents remains dependent on continued healthy employment and wage growth. The Company has continued to observe considerable multi-family development activity in the Company's markets, and as this new construction is completed and leased, the Company will experience increased competition for residents. However, based on information available to the Company, it appears that apartment developers in our markets are currently seeing increases in construction costs for potential new apartment developments, which may slow new developments in our markets.
The Company's office segment, mostly concentrated in Minnesota, continued to be affected by a number of adverse macro conditions. Demand for office space continues to be limited, with space absorption in the Minneapolis market in particular concentrated in prime locations, and suburban office properties continuing to lag in terms of occupancy. Businesses appear to be maintaining their goal of increasing the density of their work spaces by placing more employees in less total square footage, and downsizing upon lease renewals. The Company expects this erosion in demand for office space to continue, which we expect will impede increases on rental rates in our office portfolio. As a result, although the Company has experienced some modest growth in occupancy levels during the third quarter of fiscal year 2015 compared to the third quarter of fiscal year 2014, on an all-properties basis, the Company continues to expect a slow and uneven recovery in its office segment.
The Company's healthcare segment consists of medical office properties and senior housing facilities. The medical office sector remains stable with modest increases in both occupancy and rents. The Company's senior housing assets continue to benefit from the strengthening recovery in the housing market, as occupancy trends are closely aligned with the ability of seniors to sell their homes in anticipation of moving to a senior care facility.
Both the industrial and retail property markets continue to show signs of recovery. The Company's industrial properties are located primarily in the Minneapolis market, and all of these Minneapolis properties are 100% leased. The demand for bulk warehouse and manufacturing space in the Company's markets is strong, with rents generally rising. The retail recovery is evident in regard to the Company's Minneapolis-metro and grocery-anchored retail properties, which are performing well. Locations outside the Minneapolis-metro area, however, continue to experience less demand, with the recession-driven contraction not yet fully reversed.
In January 2015, the Company announced that it is exploring a calendar year 2015 disposition of substantially all of its commercial office and retail properties, in an update to its current strategic plan, under which the Company has been directing new investments primarily toward multifamily residential and healthcare properties. The Company intends to use the proceeds from dispositions to continue portfolio deleveraging and for developing and acquiring high-quality assets in the Company's multi-family, industrial and healthcare segments.
In the third quarter of fiscal year 2015, IRET paid its 175th consecutive quarterly distribution. The $0.1300 per share/unit distribution was payable on January 16, 2015. Subsequent to the end of the third quarter of fiscal year 2015, on March 4, 2015, the Company's Board of Trustees declared a regular quarterly distribution of $0.1300 per share and unit on the Company's common shares of beneficial interest and the limited partnership units of IRET Properties, payable April 1, 2015 to common shareholders and unitholders of record on March 16, 2015. Also on March 4, 2015, the Company's Board of Trustees' declared a distribution of $0.5156 per share on the Company's Series A preferred shares of beneficial interest, payable March 31, 2015 to Series A preferred shareholders of record on March 16, 2015, and declared a distribution of $0.4968 per share on the Company's Series B preferred shares of beneficial interest, payable March 31, 2015 to Series B preferred shareholders of record on March 16, 2015.
As of January 31, 2015, IRET owns a diversified portfolio of 259 properties consisting of 99 multi-family residential properties, 62 office properties, 67 healthcare properties (including senior housing), 7 industrial properties and 24 retail properties. IRET's common shares are publicly traded on the New York Stock Exchange (NYSE: IRET).
Company Snapshot
(as of January 31, 2015)
| Company Headquarters | Minot, North Dakota |
| Fiscal Year-End | April 30 |
| Reportable Segments | Multi-Family Residential, Office, Healthcare, Industrial, Retail |
| Total Properties | 259 |
| Total Square Feet | |
| (commercial properties) | 9.8 million |
| Total Units | |
| (multi-family residential properties) | 11,765 |
| Common Shares Outstanding (thousands) | 122,134 |
| Limited Partnership Units Outstanding (thousands) | 14,398 |
| Common Share Distribution - Quarter/Annualized | $0.13/$0.52 |
| Dividend Yield | 6.3% |
| Total Capitalization (see p.14 for detail) | $2.5 billion |
Investor Information
(as of March 12, 2015)
Board of Trustees
| Timothy P. Mihalick | President and Chief Executive Officer; Trustee |
| Diane K. Bryantt | Executive Vice President and Chief Operating Officer |
| Ted E. Holmes | Executive Vice President and Chief Financial Officer |
| Michael A. Bosh | Executive Vice President, General Counsel and Assistant Secretary |
| Mark Reiling | Executive Vice President and Chief Investment Officer |
| Charles A. Greenberg | Senior Vice President, Commercial Asset Management |
| Andrew Martin | Senior Vice President, Residential Property Management |
Management
| Timothy P. Mihalick | President and Chief Executive Officer; Trustee |
| Diane K. Bryantt | Executive Vice President and Chief Operating Officer |
| Ted E. Holmes | Executive Vice President and Chief Financial Officer |
| Michael A. Bosh | Executive Vice President, General Counsel and Assistant Secretary |
| Mark Reiling | Executive Vice President and Chief Investment Officer |
| Charles A. Greenberg | Senior Vice President, Commercial Asset Management |
| Ted E. Holmes | Senior Vice President, Finance |
| Andrew Martin | Senior Vice President, Residential Property Management |
Corporate Headquarters:
1400 31st Avenue SW, Suite 60
Post Office Box 1988
Minot, North Dakota 58702-1988
Trading Symbol: IRET
Stock Exchange Listing: NYSE
Investor Relations Contact:
Cindy Bradehoft
cbradehoft@iret.com
Common Share Data (NYSE: IRET)
| | 3rd Quarter Fiscal Year 2015 | 2nd Quarter Fiscal Year 2015 | 1st Quarter Fiscal Year 2015 | 4th Quarter Fiscal Year 2014 | 3rd Quarter Fiscal Year 2014 |
| High Closing Price | $ | 8.60 | $ | 8.59 | $ | 9.21 | $ | 9.06 | $ | 8.94 |
| Low Closing Price | $ | 8.05 | $ | 7.49 | $ | 8.52 | $ | 8.34 | $ | 8.24 |
| Average Closing Price | $ | 8.35 | $ | 8.11 | $ | 8.82 | $ | 8.71 | $ | 8.58 |
| Closing Price at end of quarter | $ | 8.25 | $ | 8.40 | $ | 8.52 | $ | 8.72 | $ | 8.69 |
| Common Share Distributions—annualized | $ | 0.520 | $ | 0.520 | $ | 0.520 | $ | 0.520 | $ | 0.520 |
| Closing Dividend Yield - annualized | | 6.3% | | 6.2% | | 6.1% | | 6.0% | | 6.0% |
| Closing common shares outstanding (thousands) | | 122,134 | | 119,809 | | 114,763 | | 109,019 | | 106,937 |
| Closing limited partnership units outstanding (thousands) | | 14,398 | | 14,731 | | 17,975 | | 21,094 | | 21,799 |
| Closing market value of outstanding common shares, plus imputed closing market value of outstanding limited partnership units (thousands) | $ | 1,126,389 | $ | 1,130,136 | $ | 1,130,928 | $ | 1,134,585 | $ | 1,118,716 |
Certain statements in these supplemental disclosures are "forward-looking statements" within the meaning of the Private Securities Litigation Reform Act of 1995. Such statements involve known and unknown risks, uncertainties and other factors that may cause actual results to differ materially from projected results. Such risks, uncertainties and other factors include, but are not limited to: intentions and expectations regarding future distributions on our common shares and units, fluctuations in interest rates, the effect of government regulation, the availability of capital, changes in general and local economic and real estate market conditions, competition, our ability to attract and retain skilled personnel, and those risks and uncertainties detailed from time to time in our filings with the Securities and Exchange Commission, including our 2014 Form 10-K. We assume no obligation to update or supplement forward-looking statements that become untrue because of subsequent events.
Third Quarter Fiscal 2015 Developments Placed in Service
| | |
| |
| | |
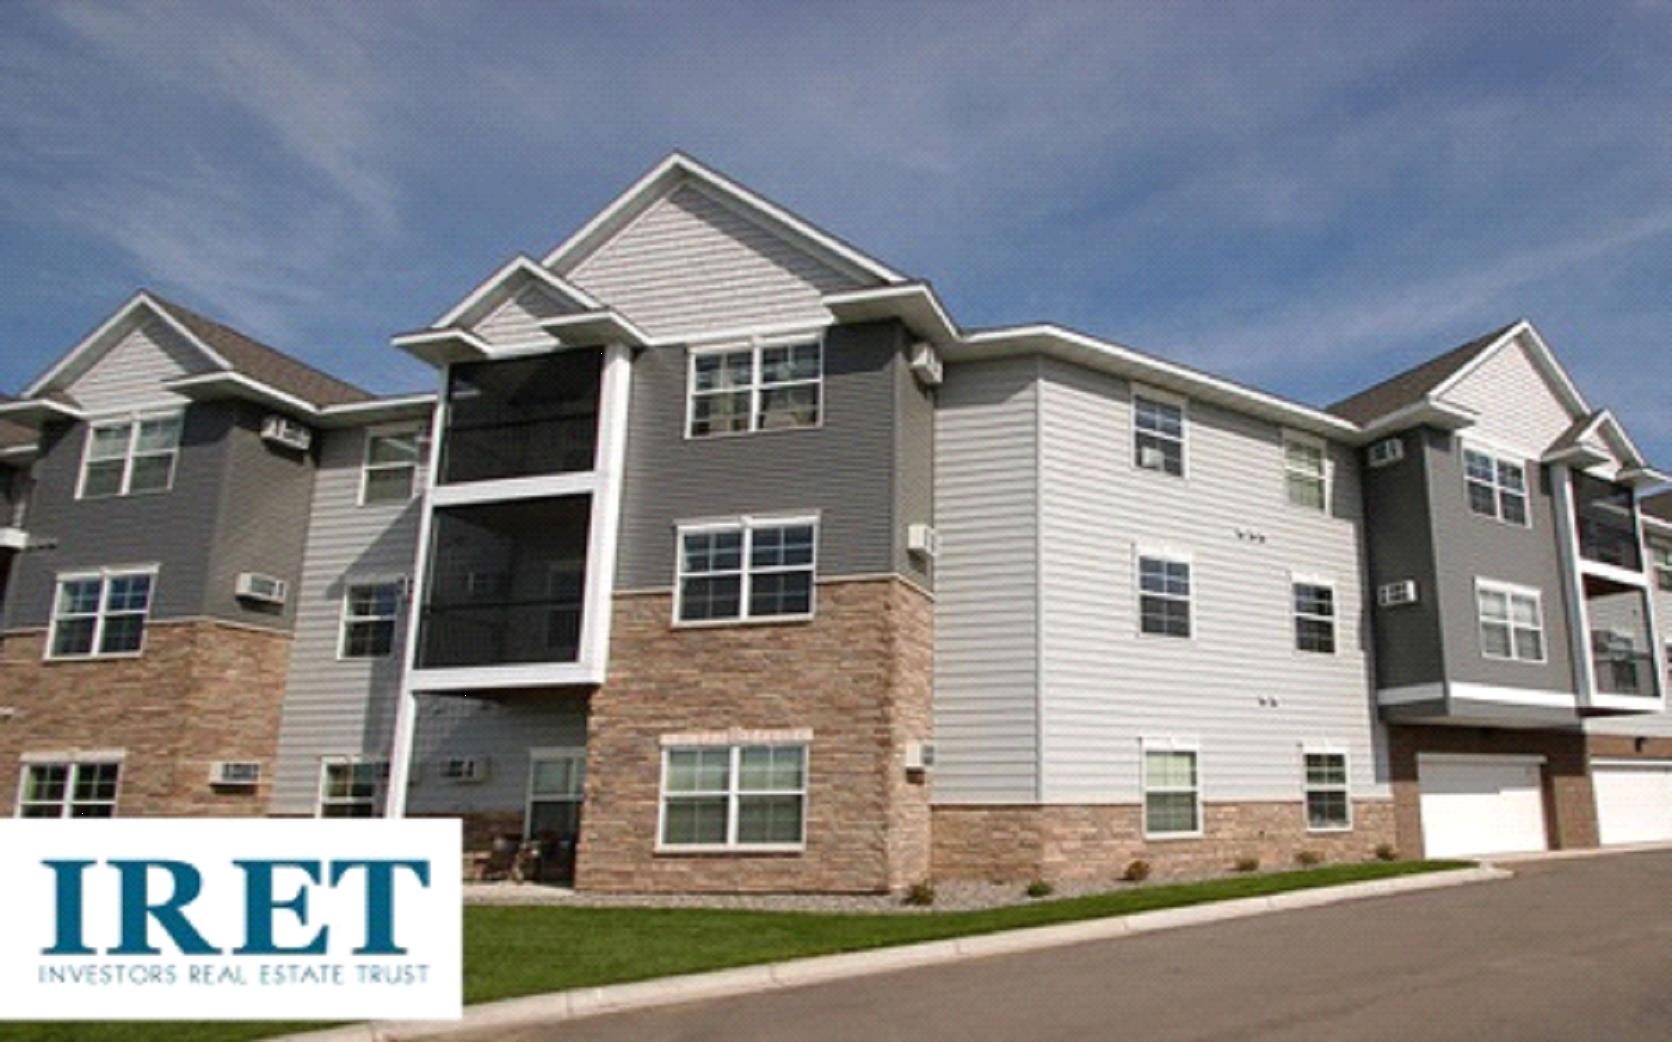
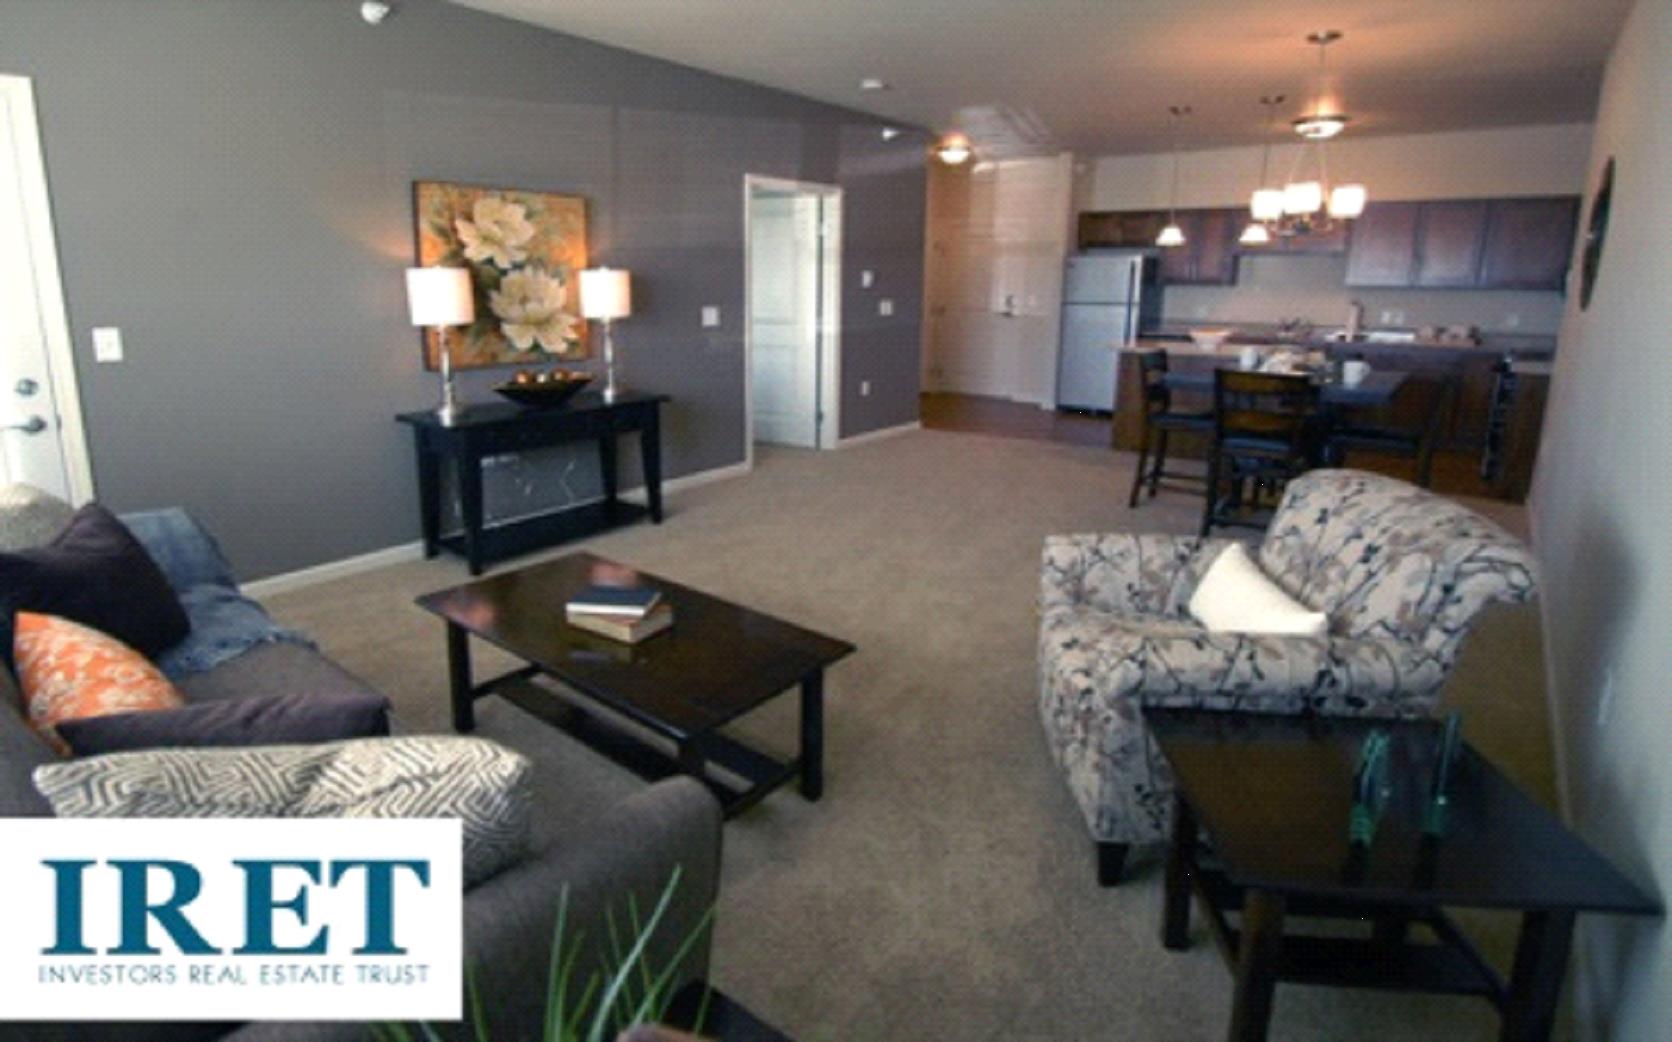
Arcata Apartments (exterior) Golden Valley, MN | Arcata Apartments (interior) Golden Valley, MN |
| | |
| |
| | |
Cypress Court (exterior) St. Cloud Metro, MN | Cypress Court (interior) St. Cloud Metro, MN |
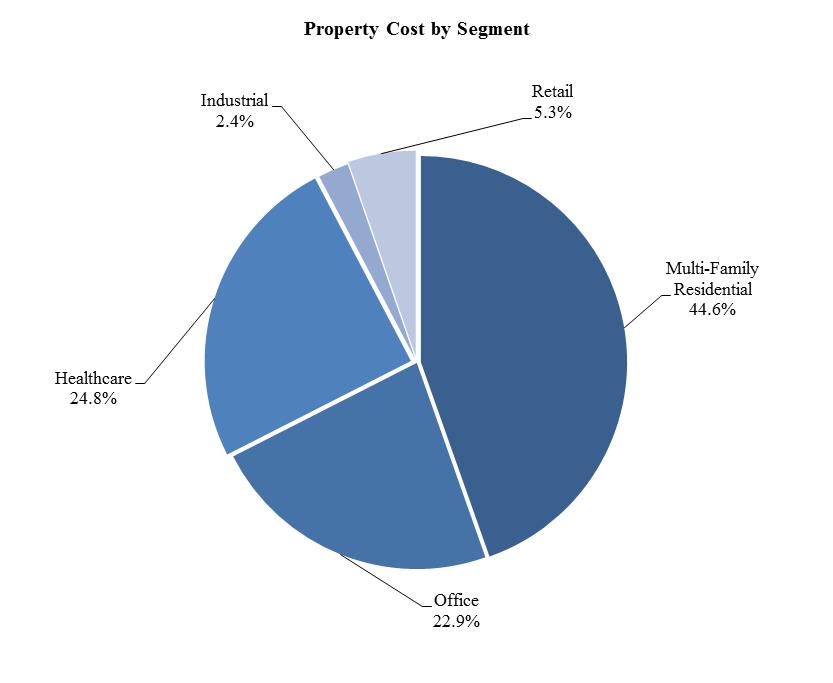
Third Quarter Fiscal 2015
Percentage of Total Property Cost by State
INVESTORS REAL ESTATE TRUST AND SUBSIDIARIES
CONDENSED CONSOLIDATED BALANCE SHEETS (unaudited)
(in thousands)
| | 1/31/2015 | 10/31/2014 | 7/31/2014 | 4/30/2014 | 1/31/2014 |
| ASSETS | | | | | | | | | | |
| Real estate investments | | | | | | | | | | |
| Property owned | $ | 2,093,148 | $ | 2,013,770 | $ | 2,025,327 | $ | 1,996,031 | $ | 2,042,290 |
| Less accumulated depreciation | | (439,153) | | (426,545) | | (435,317) | | (424,288) | | (439,233) |
| | | 1,653,995 | | 1,587,225 | | 1,590,010 | | 1,571,743 | | 1,603,057 |
| Development in progress | | 114,005 | | 146,390 | | 131,862 | | 104,609 | | 89,086 |
| Unimproved land | | 27,675 | | 24,947 | | 24,772 | | 22,864 | | 21,498 |
| Total real estate investments | | 1,795,675 | | 1,758,562 | | 1,746,644 | | 1,699,216 | | 1,713,641 |
| Real estate held for sale | | 44,259 | | 41,183 | | 6,508 | | 2,951 | | 0 |
| Cash and cash equivalents | | 52,148 | | 52,999 | | 60,620 | | 47,267 | | 53,494 |
| Other investments | | 329 | | 329 | | 329 | | 329 | | 643 |
| Receivable arising from straight-lining of rents, net of allowance | | 27,169 | | 27,425 | | 27,286 | | 27,096 | | 27,026 |
| Accounts receivable, net of allowance | | 5,574 | | 3,719 | | 7,013 | | 10,206 | | 15,540 |
| Real estate deposits | | 7,494 | | 4,924 | | 3,741 | | 145 | | 3,502 |
| Prepaid and other assets | | 5,580 | | 2,263 | | 3,428 | | 4,639 | | 8,197 |
| Intangible assets, net of accumulated amortization | | 28,475 | | 29,745 | | 31,478 | | 32,639 | | 34,008 |
| Tax, insurance, and other escrow | | 11,277 | | 16,338 | | 20,451 | | 20,880 | | 24,550 |
| Property and equipment, net of accumulated depreciation | | 1,619 | | 1,598 | | 1,641 | | 1,681 | | 1,719 |
| Goodwill | | 1,940 | | 1,940 | | 1,951 | | 1,100 | | 1,100 |
| Deferred charges and leasing costs, net of accumulated amortization | | 19,803 | | 20,445 | | 20,677 | | 21,072 | | 21,138 |
| TOTAL ASSETS | $ | 2,001,342 | $ | 1,961,470 | $ | 1,931,767 | $ | 1,869,221 | $ | 1,904,558 |
| | | | | | | | | | | |
| LIABILITIES AND EQUITY | | | | | | | | | | |
| LIABILITIES | | | | | | | | | | |
| Accounts payable and accrued expenses | $ | 69,901 | $ | 67,037 | $ | 62,517 | $ | 59,105 | $ | 54,337 |
| Revolving line of credit | | 50,500 | | 40,500 | | 35,500 | | 22,500 | | 22,500 |
| Mortgages payable | | 1,006,179 | | 1,013,161 | | 1,017,574 | | 997,689 | | 1,008,524 |
| Other | | 132,210 | | 107,731 | | 83,666 | | 63,178 | | 47,767 |
| TOTAL LIABILITIES | | 1,258,790 | | 1,228,429 | | 1,199,257 | | 1,142,472 | | 1,133,128 |
| | | | | | | | | | | |
| REDEEMABLE NONCONTROLLING INTERESTS – CONSOLIDATED REAL ESTATE ENTITIES | | 6,340 | | 6,373 | | 6,313 | | 6,203 | | 6,113 |
| EQUITY | | | | | | | | | | |
| Investors Real Estate Trust shareholders' equity | | | | | | | | | | |
| Series A Preferred Shares of Beneficial Interest | | 27,317 | | 27,317 | | 27,317 | | 27,317 | | 27,317 |
| Series B Preferred Shares of Beneficial Interest | | 111,357 | | 111,357 | | 111,357 | | 111,357 | | 111,357 |
| Common Shares of Beneficial Interest | | 935,287 | | 918,221 | | 884,415 | | 843,268 | | 829,816 |
| Accumulated distributions in excess of net income | | (430,282) | | (420,036) | | (407,052) | | (389,758) | | (344,294) |
| Total Investors Real Estate Trust shareholders' equity | | 643,679 | | 636,859 | | 616,037 | | 592,184 | | 624,196 |
| Noncontrolling interests – Operating Partnership | | 61,177 | | 63,207 | | 84,250 | | 105,724 | | 117,803 |
| Noncontrolling interests – consolidated real estate entities | | 31,356 | | 26,602 | | 25,910 | | 22,638 | | 23,318 |
| Total equity | | 736,212 | | 726,668 | | 726,197 | | 720,546 | | 765,317 |
| TOTAL LIABILITIES, REDEEMABLE NONCONTROLLING INTERESTS AND EQUITY | $ | 2,001,342 | $ | 1,961,470 | $ | 1,931,767 | $ | 1,869,221 | $ | 1,904,558 |
INVESTORS REAL ESTATE TRUST AND SUBSIDIARIES
CONDENSED CONSOLIDATED STATEMENTS OF OPERATIONS (unaudited)
(in thousands, except per share data)
| | Nine Months Ended | Three Months Ended |
| OPERATING RESULTS | 1/31/2015 | 1/31/2014 | 1/31/2015 | 10/31/2014 | 7/31/2014 | 4/30/2014 | 1/31/2014 |
| Real estate revenue | $ | 209,832 | $ | 198,499 | $ | 71,953 | $ | 70,042 | $ | 67,837 | $ | 66,983 | $ | 67,629 |
| Real estate expenses | | 83,189 | | 78,898 | | 28,434 | | 27,237 | | 27,518 | | 29,589 | | 25,927 |
| Gain on involuntary conversion | | 0 | | 2,480 | | 0 | | 0 | | 0 | | 0 | | 1,514 |
| Net operating income | | 126,643 | | 122,081 | | 43,519 | | 42,805 | | 40,319 | | 37,394 | | 43,216 |
| TRS senior housing revenue | | 2,599 | | 804 | | 963 | | 843 | | 793 | | 823 | | 804 |
| TRS senior housing expenses | | (2,243) | | (671) | | (825) | | (725) | | (693) | | (660) | | (671) |
| Depreciation/amortization | | (52,474) | | (53,656) | | (17,750) | | (17,668) | | (17,056) | | (17,262) | | (17,489) |
| General and administrative | | (10,986) | | (9,572) | | (3,242) | | (3,468) | | (4,276) | | (3,303) | | (2,935) |
| Impairment of real estate investments | | (6,105) | | (4,798) | | (540) | | (3,245) | | (2,320) | | (37,768) | | (4,798) |
| Interest expense | | (43,858) | | (44,525) | | (14,595) | | (14,599) | | (14,664) | | (14,617) | | (15,130) |
| Interest and other income | | 2,057 | | 1,469 | | 670 | | 696 | | 691 | | 922 | | 607 |
| (Loss) income before loss on sale of real estate and other investments and income from discontinued operations | | 15,633 | | 11,132 | | 8,200 | | 4,639 | | 2,794 | | (34,471) | | 3,604 |
| Loss on sale of real estate and other investments | | (811) | | 0 | | 951 | | 1,231 | | (2,993) | | (51) | | 0 |
| (Loss) income from continuing operations | | 14,822 | | 11,132 | | 9,151 | | 5,870 | | (199) | | (34,522) | | 3,604 |
| Income from discontinued operations | | 0 | | 6,450 | | 0 | | 0 | | 0 | | 0 | | 465 |
| Net (loss) income | $ | 14,822 | $ | 17,582 | $ | 9,151 | $ | 5,870 | $ | (199) | $ | (34,522) | $ | 4,069 |
| | | | | | | | | | | | | | | |
| Net loss (income) attributable to noncontrolling interest – Operating Partnership | | (618) | | (1,406) | | (657) | | (363) | | 402 | | 6,082 | | (130) |
| Net income attributable to noncontrolling interests – consolidated real estate entities | | (870) | | (808) | | (123) | | (393) | | (354) | | (102) | | (436) |
| Net (loss) income attributable to Investors Real Estate Trust | | 13,334 | | 15,368 | | 8,371 | | 5,114 | | (151) | | (28,542) | | 3,503 |
| Dividends to preferred shareholders | | (8,636) | | (8,636) | | (2,879) | | (2,878) | | (2,879) | | (2,878) | | (2,879) |
| NET (LOSS) INCOME AVAILABLE TO COMMON SHAREHOLDERS | $ | 4,698 | $ | 6,732 | $ | 5,492 | $ | 2,236 | $ | (3,030) | $ | (31,420) | $ | 624 |
| | | | | | | | | | | | | | | |
| Per Share Data | | | | | | | | | | | | | | |
| Earnings (loss) per common share from continuing operations – Investors Real Estate Trust – basic & diluted | $ | .04 | $ | .01 | $ | .05 | $ | .02 | $ | (.03) | $ | (.29) | $ | .00 |
| Earnings per common share from discontinued operations – Investors Real Estate Trust – basic & diluted | | .00 | | .05 | | .00 | | .00 | | .00 | | .00 | | .00 |
| Net income per common share – basic & diluted | $ | .04 | $ | .06 | $ | .05 | $ | .02 | $ | (.03) | $ | (.29) | $ | .00 |
| | | | | | | | | | | | | | | |
| Percentage of Revenues | | | | | | | | | | | | | | |
| Real estate expenses | | 39.6% | | 39.7% | | 39.5% | | 38.9% | | 40.6% | | 44.2% | | 38.3% |
| Depreciation/amortization | | 25.0% | | 27.0% | | 24.7% | | 25.2% | | 25.1% | | 25.8% | | 25.9% |
| General and administrative | | 5.2% | | 4.8% | | 4.5% | | 5.0% | | 6.3% | | 4.9% | | 4.3% |
| Interest | | 20.9% | | 22.4% | | 20.3% | | 20.8% | | 21.6% | | 21.8% | | 22.4% |
| Income from discontinued operations | | 0.0% | | 3.2% | | 0.0% | | 0.0% | | 0.0% | | 0.0% | | 0.7% |
| Net (loss) income | | 7.1% | | 8.9% | | 12.7% | | 8.4% | | (0.3)% | | (51.5)% | | 6.0% |
| | | | | | | | | | | | | | | |
| Ratios | | | | | | | | | | | | | | |
Adjusted EBITDA(1)/Interest expense | | 2.44x | | 2.25x | | 2.53x | | 2.48x | | 2.29x | | 2.26x | | 2.13x |
Adjusted EBITDA(1)/Interest expense plus preferred distributions | | 2.06x | | 1.90x | | 2.14x | | 2.10x | | 1.94x | | 1.90x | | 1.81x |
| (1) | See Definitions on page 32. Adjusted EBITDA is a non-GAAP measure; see page 9 for a reconciliation of Adjusted EBITDA to net income. |
INVESTORS REAL ESTATE TRUST AND SUBSIDIARIES
FUNDS FROM OPERATIONS (unaudited)
(in thousands, except per share and unit data)
| | Nine Months Ended | Three Months Ended |
| | 1/31/2015 | 1/31/2014 | 1/31/2015 | 10/31/2014 | 7/31/2014 | 4/30/2014 | 1/31/2014 |
Funds From Operations(1) | | | | | | | | | | | | | | |
| Net income (loss) attributable to Investors Real Estate Trust | $ | 13,334 | $ | 15,368 | $ | 8,371 | $ | 5,114 | $ | (151) | $ | (28,542) | $ | 3,503 |
| Less dividends to preferred shareholders | | (8,636) | | (8,636) | | (2,879) | | (2,878) | | (2,879) | | (2,878) | | (2,879) |
| Net (loss) income available to common shareholders | | 4,698 | | 6,732 | | 5,492 | | 2,236 | | (3,030) | | (31,420) | | 624 |
| Adjustments: | | | | | | | | | | | | | | |
| Noncontrolling interests – Operating Partnership | | 618 | | 1,406 | | 657 | | 363 | | (402) | | (6,082) | | 130 |
| Depreciation and amortization | | 52,367 | | 54,591 | | 17,706 | | 17,624 | | 17,037 | | 17,239 | | 17,546 |
| Impairment of real estate investments | | 6,105 | | 6,658 | | 540 | | 3,245 | | 2,320 | | 37,768 | | 4,798 |
| Loss (gain) on depreciable property sales | $ | 811 | $ | (6,999) | | (951) | | (1,231) | | 2,993 | | 51 | | (358) |
| Funds from operations applicable to common shares and Units | | 64,599 | | 62,388 | $ | 23,444 | $ | 22,237 | $ | 18,918 | $ | 17,556 | $ | 22,740 |
| | | | | | | | | | | | | | | |
| FFO per share and unit - basic and diluted | $ | 0.48 | $ | 0.49 | $ | 0.17 | $ | 0.17 | $ | 0.14 | $ | 0.14 | $ | 0.17 |
| | | | | | | | | | | | | | | |
Adjusted funds from operations(1) | | | | | | | | | | | | | | |
| Funds from operations applicable to common shares and Units | $ | 64,599 | $ | 62,388 | $ | 23,444 | $ | 22,237 | $ | 18,918 | $ | 17,556 | $ | 22,740 |
| Adjustments: | | | | | | | | | | | | | | |
Tenant improvements at same-store(2) properties | | (4,649) | | (8,389) | | (1,984) | | (542) | | (2,169) | | (1,610) | | (4,205) |
Leasing costs at same-store properties(2) | | (1,606) | | (2,870) | | (358) | | (699) | | (578) | | (1,038) | | (1,219) |
Recurring capital expenditures(1)(2) | | (4,793) | | (3,858) | | (1,865) | | (1,567) | | (1,386) | | (1,118) | | (1,093) |
| Straight-line rents | | (187) | | (2,136) | | 184 | | (103) | | (268) | | (70) | | (818) |
| Non-real estate depreciation | | 288 | | 266 | | 94 | | 96 | | 99 | | 102 | | 99 |
Share-based compensation expense(3) | | 1,935 | | 889 | | 260 | | 601 | | 1,073 | | 272 | | 272 |
| Gain on involuntary conversion | | 0 | | (2,480) | | 0 | | 0 | | 0 | | 0 | | (1,514) |
| Adjusted funds from operations applicable to common shares and Units | $ | 55,587 | $ | 43,810 | $ | 19,775 | $ | 20,023 | $ | 15,689 | $ | 14,094 | $ | 14,262 |
| | | | | | | | | | | | | | | |
| AFFO per share and unit - basic and diluted | $ | 0.42 | $ | 0.35 | $ | 0.15 | $ | 0.15 | $ | 0.12 | $ | 0.11 | $ | 0.11 |
| | | | | | | | | | | | | | | |
| Weighted average shares and units | | 133,637 | | 126,302 | | 135,315 | | 133,295 | | 131,332 | | 129,244 | | 128,027 |
| | | | | | | | | | | | | | | |
| (1) | See Definitions on page 32. |
| (2) | Quarterly information is for properties in the same-store pool at that point in time; consequently, quarterly numbers may not total to year-to-date numbers. |
| (3) | Three months ended 7/31/14, 4/30/14 and 1/31/14 revised to include trustee share-based compensation expense. |
INVESTORS REAL ESTATE TRUST AND SUBSIDIARIES
ADJUSTED EARNINGS BEFORE INTEREST, TAXES, DEPRECIATION AND AMORTIZATION (ADJUSTED EBITDA) (unaudited)
(in thousands)
| | Nine Months Ended | Three Months Ended |
| | 1/31/2015 | 1/31/2014 | 1/31/2015 | 10/31/2014 | 7/31/2014 | 4/30/2014 | 1/31/2014 |
Adjusted EBITDA(1) | | | | | | | | | | | | | | |
| Net income (loss) attributable to Investors Real Estate Trust | $ | 13,334 | $ | 15,368 | $ | 8,371 | $ | 5,114 | $ | (151) | $ | (28,542) | $ | 3,503 |
| Adjustments: | | | | | | | | | | | | | | |
| Noncontrolling interests – Operating Partnership | | 618 | | 1,406 | | 657 | | 363 | | (402) | | (6,082) | | 130 |
| Income (loss) before noncontrolling interests – Operating Partnership | | 13,952 | | 16,774 | | 9,028 | | 5,477 | | (553) | | (34,624) | | 3,633 |
| Add: | | | | | | | | | | | | | | |
| Interest expense | | 43,858 | | 44,946 | | 14,595 | | 14,599 | | 14,664 | | 14,617 | | 15,159 |
| Depreciation/amortization related to real estate investments | | 49,846 | | 52,093 | | 16,834 | | 16,814 | | 16,198 | | 16,449 | | 16,825 |
| Amortization related to non-real estate investments | | 2,628 | | 2,590 | | 916 | | 840 | | 872 | | 826 | | 758 |
Amortization related to real estate revenues(2) | | 181 | | 175 | | 50 | | 66 | | 65 | | 66 | | 62 |
| Impairment of real estate investments | | 6,105 | | 4,798 | | 540 | | 3,245 | | 2,320 | | 37,768 | | 4,798 |
| Less: | | | | | | | | | | | | | | |
| Interest income | | (1,681) | | (1,346) | | (561) | | (560) | | (560) | | (562) | | (573) |
| Loss (gain) on sale of real estate and other investments | | 811 | | (6,999) | | (951) | | (1,231) | | 2,993 | | 51 | | (358) |
| Gain on involuntary conversion | | 0 | | (2,480) | | 0 | | 0 | | 0 | | 0 | | (1,514) |
| Adjusted EBITDA | $ | 115,700 | $ | 110,551 | | 40,451 | | 39,250 | | 35,999 | | 34,591 | $ | 38,790 |
| (1) | See Definitions on page 32. |
| (2) | Included in real estate revenue in the Statement of Operations. |
INVESTORS REAL ESTATE TRUST AND SUBSIDIARIES
LONG-TERM MORTGAGE DEBT* ANALYSIS
(in thousands)
Debt Maturity Schedule
Annual Expirations
| | Future Maturities of Mortgage Debt |
| Fiscal Year | Fixed Debt | Variable Debt | Total Debt | Weighted Average(1) | % of Total Debt |
| 2015 (remainder) | $ | 15,180 | $ | 8,184 | $ | 23,364 | 4.77% | 2.3% |
| 2016 | | 99,558 | | 0 | | 99,558 | 4.25% | 9.9% |
| 2017 | | 169,438 | | 15,000 | | 184,438 | 5.85% | 18.3% |
| 2018 | | 32,894 | | 31,000 | | 63,894 | 4.32% | 6.4% |
| 2019 | | 85,771 | | 5,376 | | 91,147 | 5.78% | 9.0% |
| 2020 | | 116,821 | | 18,895 | | 135,716 | 5.37% | 13.5% |
| 2021 | | 129,385 | | 0 | | 129,385 | 5.30% | 12.9% |
| 2022 | | 129,704 | | 0 | | 129,704 | 5.61% | 12.9% |
| 2023 | | 37,363 | | 0 | | 37,363 | 4.25% | 3.7% |
| 2024 | | 72,762 | | 0 | | 72,762 | 4.31% | 7.2% |
| Thereafter | | 38,848 | | 0 | | 38,848 | 4.50% | 3.9% |
| Total maturities | $ | 927,724 | $ | 78,455 | $ | 1,006,179 | 5.17% | 100.0% |
| (1) | Weighted average interest rate of debt that matures in fiscal year. |
| | 1/31/2015 | 10/31/2014 | 7/31/2014 | 4/30/2014 | 1/31/2014 |
| Balances Outstanding | | | | | | | | | | |
| Mortgage | | | | | | | | | | |
| Fixed rate | $ | 927,724 | $ | 949,002 | $ | 972,142 | $ | 977,224 | $ | 1,000,222 |
| Variable rate | | 78,455 | | 64,159 | | 45,432 | | 20,465 | | 8,302 |
| Mortgage total | $ | 1,006,179 | $ | 1,013,161 | $ | 1,017,574 | $ | 997,689 | $ | 1,008,524 |
| | | | | | | | | | | |
| Weighted Average Interest Rates | | | | | | | | | | |
| Secured | | 5.17% | | 5.26% | | 5.32% | | 5.37% | | 5.48% |
INVESTORS REAL ESTATE TRUST AND SUBSIDIARIES
LONG-TERM MORTGAGE DEBT* DETAIL AS OF JANUARY 31, 2015
(in thousands)
| Property | Maturity Date | Fiscal 2015 | Fiscal 2016 | Fiscal 2017 | Fiscal 2018 | Thereafter | Total(1) |
| | | | | | | | |
| Multi-Family Residential | | | | | | | | | | | | | | |
| Campus Center - St Cloud, MN | 6/1/2015 | | $ | 0 | $ | 1,147 | $ | 0 | $ | 0 | $ | 0 | $ | 1,147 |
| Campus Knoll - St Cloud, MN | 6/1/2015 | | | 0 | | 765 | | 0 | | 0 | | 0 | | 765 |
| Landmark - Grand Forks, ND | 8/24/2015 | | | 0 | | 1,590 | | 0 | | 0 | | 0 | | 1,590 |
| Regency Park Estates - St Cloud, MN | 1/1/2016 | | | 0 | | 6,719 | | 0 | | 0 | | 0 | | 6,719 |
| Pebble Springs – Bismarck, ND | 7/1/2016 | | | 0 | | 0 | | 762 | | 0 | | 0 | | 762 |
| Southview – Minot, ND | 7/1/2016 | | | 0 | | 0 | | 1,041 | | 0 | | 0 | | 1,041 |
| Homestead Gardens I – Rapid City, SD | 7/11/16 | | | 0 | | 0 | | 6,979 | | 0 | | 0 | | 6,979 |
| River Ridge – Bismarck, ND | 6/30/17 | | | 0 | | 0 | | 0 | | 13,200 | | 0 | | 13,200 |
| Evergreen II – Isanti, MN | 11/1/2017 | | | 0 | | 0 | | 0 | | 2,078 | | 0 | | 2,078 |
| Ponds – Sartell, MN | 11/1/2017 | | | 0 | | 0 | | 0 | | 3,877 | | 0 | | 3,877 |
| Summary of Debt due after Fiscal 2018 | | | | 0 | | 0 | | 0 | | 0 | | 375,059 | | 375,059 |
| Sub-Total Multi-Family Residential | | | $ | 0 | $ | 10,221 | $ | 8,782 | $ | 19,155 | $ | 375,059 | $ | 413,217 |
| | | | | | | | | | | | | | | |
| Office | | | | | | | | | | | | | | |
Burnsville Bluffs II – Burnsville, MN(2) | 2/8/2015 | | $ | 1,637 | $ | 0 | $ | 0 | $ | 0 | $ | 0 | $ | 1,637 |
Plymouth IV - Plymouth, MN(2) | 2/8/2015 | | | 3,019 | | 0 | | 0 | | 0 | | 0 | | 3,019 |
Plymouth V - Plymouth, MN(2) | 2/8/2015 | | | 3,528 | | 0 | | 0 | | 0 | | 0 | | 3,528 |
Highlands Ranch I - Highlands Ranch, CO(3) | 3/1/2015 | | | 7,812 | | 0 | | 0 | | 0 | | 0 | | 7,812 |
Highlands Ranch II - Highlands Ranch, CO(3) | 3/1/2015 | | | 7,368 | | 0 | | 0 | | 0 | | 0 | | 7,368 |
| US Bank Financial Center - Bloomington, MN | 7/1/2015 | | | 0 | | 12,852 | | 0 | | 0 | | 0 | | 12,852 |
| Rapid City 900 Concourse Drive - Rapid City, SD | 8/1/2015 | | | 0 | | 314 | | 0 | | 0 | | 0 | | 314 |
| Westgate I - Boise, ID | 8/1/2015 | | | 0 | | 1,125 | | 0 | | 0 | | 0 | | 1,125 |
| Westgate II - Boise, ID | 8/1/2015 | | | 0 | | 2,756 | | 0 | | 0 | | 0 | | 2,756 |
| Brook Valley I - LaVista, NE | 1/1/2016 | | | 0 | | 1,221 | | 0 | | 0 | | 0 | | 1,221 |
| Spring Valley IV - Omaha, NE | 1/1/2016 | | | 0 | | 727 | | 0 | | 0 | | 0 | | 727 |
| Spring Valley V - Omaha, NE | 1/1/2016 | | | 0 | | 800 | | 0 | | 0 | | 0 | | 800 |
| Spring Valley X - Omaha, NE | 1/1/2016 | | | 0 | | 741 | | 0 | | 0 | | 0 | | 741 |
| Spring Valley XI - Omaha, NE | 1/1/2016 | | | 0 | | 727 | | 0 | | 0 | | 0 | | 727 |
| American Corporate Center – Mendota Heights, MN | 9/1/2016 | | | 0 | | 0 | | 8,702 | | 0 | | 0 | | 8,702 |
| Mendota Office Center I – Mendota Heights, MN | 9/1/2016 | | | 0 | | 0 | | 3,747 | | 0 | | 0 | | 3,747 |
| Mendota Office Center II - Mendota Heights, MN | 9/1/2016 | | | 0 | | 0 | | 5,536 | | 0 | | 0 | | 5,536 |
| Mendota Office Center III - Mendota Heights, MN | 9/1/2016 | | | 0 | | 0 | | 3,805 | | 0 | | 0 | | 3,805 |
INVESTORS REAL ESTATE TRUST AND SUBSIDIARIES
LONG-TERM MORTGAGE DEBT* DETAIL AS OF JANUARY 31, 2015 (continued)
(in thousands)
| Property | Maturity Date | Fiscal 2015 | Fiscal 2016 | Fiscal 2017 | Fiscal 2018 | Thereafter | Total(1) |
| | | | | | | | | | | | | | | |
| Office - continued | | | | | | | | | | | | | | |
| Mendota Office Center IV - Mendota Heights, MN | 9/1/2016 | | $ | 0 | $ | 0 | $ | 4,523 | $ | 0 | $ | 0 | $ | 4,523 |
Corporate Center West – Omaha, NE(4) | 10/6/2016 | | | 0 | | 0 | | 17,315 | | 0 | | 0 | | 17,315 |
Farnam Executive Center – Omaha, NE(4) | 10/6/2016 | | | 0 | | 0 | | 12,160 | | 0 | | 0 | | 12,160 |
Flagship – Eden Prairie, MN(4) | 10/6/2016 | | | 0 | | 0 | | 21,565 | | 0 | | 0 | | 21,565 |
Gateway Corporate Center – Woodbury, MN(4) | 10/6/2016 | | | 0 | | 0 | | 8,700 | | 0 | | 0 | | 8,700 |
Miracle Hills One – Omaha, NE(4) | 10/6/2016 | | | 0 | | 0 | | 8,895 | | 0 | | 0 | | 8,895 |
Pacific Hills – Omaha, NE(4) | 10/6/2016 | | | 0 | | 0 | | 16,770 | | 0 | | 0 | | 16,770 |
Riverport – Maryland Heights, MO(4) | 10/6/2016 | | | 0 | | 0 | | 19,690 | | 0 | | 0 | | 19,690 |
Timberlands – Leawood, KS(4) | 10/6/2016 | | | 0 | | 0 | | 13,155 | | 0 | | 0 | | 13,155 |
Woodlands Plaza IV – Maryland Heights, MO(4) | 10/6/2016 | | | 0 | | 0 | | 4,360 | | 0 | | 0 | | 4,360 |
| 2030 Cliff Road – Eagan, MN | 1/11/2017 | | | 0 | | 0 | | 914 | | 0 | | 0 | | 914 |
| TCA Building – Eagan, MN | 2/3/2017 | | | 0 | | 0 | | 7,500 | | 0 | | 0 | | 7,500 |
| Interlachen Corporate Center – Eagan, MN | 6/30/17 | | | 0 | | 0 | | 0 | | 8,800 | | 0 | | 8,800 |
| Plymouth 5095 Nathan Lane – Plymouth, MN | 11/1/2017 | | | 0 | | 0 | | 0 | | 1,156 | | 0 | | 1,156 |
| Prairie Oak Business Center – Eden Prairie, MN | 11/1/2017 | | | 0 | | 0 | | 0 | | 3,144 | | 0 | | 3,144 |
| Crosstown Centre – Eden Prairie, MN | 12/1/2017 | | | 0 | | 0 | | 0 | | 9,000 | | 0 | | 9,000 |
| 7800 West Brown Deer Road – Milwaukee, WI | 4/1/2018 | | | 0 | | 0 | | 0 | | 10,371 | | 0 | | 10,371 |
| Summary of Debt due after Fiscal 2018 | | | | 0 | | 0 | | 0 | | 0 | | 76,536 | | 76,536 |
| Sub-Total Office | | | $ | 23,364 | $ | 21,263 | $ | 157,337 | $ | 32,471 | $ | 76,536 | $ | 310,971 |
| | | | | | | | | | | | | | | |
| Healthcare | | | | | | | | | | | | | | |
Garden View Medical - St Paul, MN(3) | 8/1/2015 | | $ | 0 | $ | 354 | $ | 0 | $ | 0 | $ | 0 | $ | 354 |
| Edina 6363 France Medical - St Paul, MN | 8/6/2015 | | | 0 | | 9,635 | | 0 | | 0 | | 0 | | 9,635 |
| Edina 6405 France Medical - Edina, MN | 9/1/2015 | | | 0 | | 8,229 | | 0 | | 0 | | 0 | | 8,229 |
| Ritchie Medical Plaza - St Paul, MN | 9/1/2015 | | | 0 | | 6,043 | | 0 | | 0 | | 0 | | 6,043 |
| Edgewood Vista – Fargo, ND | 2/25/2016 | | | 0 | | 11,992 | | 0 | | 0 | | 0 | | 11,992 |
| Edgewood Vista – Fremont, NE | 2/25/2016 | | | 0 | | 556 | | 0 | | 0 | | 0 | | 556 |
| Edgewood Vista – Hastings, NE | 2/25/2016 | | | 0 | | 573 | | 0 | | 0 | | 0 | | 573 |
| Edgewood Vista – Hermantown I, MN | 2/25/2016 | | | 0 | | 15,357 | | 0 | | 0 | | 0 | | 15,357 |
| Edgewood Vista – Kalispell, MT | 2/25/2016 | | | 0 | | 574 | | 0 | | 0 | | 0 | | 574 |
| Edgewood Vista – Missoula, MT | 2/25/2016 | | | 0 | | 815 | | 0 | | 0 | | 0 | | 815 |
| Edgewood Vista – Omaha, NE | 2/25/2016 | | | 0 | | 363 | | 0 | | 0 | | 0 | | 363 |
| Edgewood Vista – Virginia, MN | 2/25/2016 | | | 0 | | 13,063 | | 0 | | 0 | | 0 | | 13,063 |
| Airport Medical – Bloomington, MN | 6/1/2016 | | | 0 | | 0 | | 518 | | 0 | | 0 | | 518 |
| Park Dental – Brooklyn Center, MN | 6/1/2016 | | | 0 | | 0 | | 297 | | 0 | | 0 | | 297 |
Sartell 2000 23rd St S – Sartell, MN | 12/1/2016 | | | 0 | | 0 | | 1,815 | | 0 | | 0 | | 1,815 |
| Billings 2300 Grant Road – Billings, MT | 12/31/2016 | | | 0 | | 0 | | 1,285 | | 0 | | 0 | | 1,285 |
| Missoula 3050 Great Northern Ave – Missoula, MT | 12/31/2016 | | | 0 | | 0 | | 1,331 | | 0 | | 0 | | 1,331 |
| High Pointe Health Campus – Lake Elmo, MN | 4/1/2017 | | | 0 | | 0 | | 7,500 | | 0 | | 0 | | 7,500 |
| Edgewood Vista – Billings, MT | 4/10/2017 | | | 0 | | 0 | | 1,800 | | 0 | | 0 | | 1,800 |
| Edgewood Vista – East Grand Forks, MN | 4/10/2017 | | | 0 | | 0 | | 2,742 | | 0 | | 0 | | 2,742 |
| Edgewood Vista – Sioux Falls, SD | 4/10/2017 | | | 0 | | 0 | | 1,031 | | 0 | | 0 | | 1,031 |
| St Michael Clinic – St. Michael, MN | 4/1/2018 | | | 0 | | 0 | | 0 | | 1,810 | | 0 | | 1,810 |
| Summary of Debt due after Fiscal 2018 | | | | 0 | | 0 | | 0 | | 0 | | 154,015 | | 154,015 |
| Sub-Total Healthcare | | | $ | 0 | $ | 67,554 | $ | 18,319 | $ | 1,810 | $ | 154,015 | $ | 241,698 |
INVESTORS REAL ESTATE TRUST AND SUBSIDIARIES
LONG-TERM MORTGAGE DEBT* DETAIL AS OF JANUARY 31, 2015 (continued)
(in thousands)
| Property | Maturity Date | Fiscal 2015 | Fiscal 2016 | Fiscal 2017 | Fiscal 2018 | Thereafter | Total(1) |
| Industrial | | | | | | | | | | | | | |
| Stone Container - Fargo, ND | 12/1/2015 | $ | 0 | $ | 233 | $ | 0 | $ | 0 | $ | 0 | $ | 233 |
| Stone Container - Fargo, ND | 12/1/2015 | | 0 | | 287 | | 0 | | 0 | | 0 | | 287 |
Urbandale 3900 106th Street – Urbandale, IA | 7/5/2017 | | 0 | | 0 | | 0 | | 10,458 | | 0 | | 10,458 |
| Summary of Debt due after Fiscal 2018 | | | 0 | | 0 | | 0 | | 0 | | 2,251 | | 2,251 |
| Sub-Total Industrial | | $ | 0 | $ | 520 | $ | 0 | $ | 10,458 | $ | 2,251 | $ | 13,229 |
| | | | | | | | | | | | | | |
| Retail | | | | | | | | | | | | | |
| Summary of Debt due after Fiscal 2018 | | $ | 0 | $ | 0 | $ | 0 | $ | 0 | $ | 27,064 | | 27,064 |
| Sub-Total Retail | | $ | 0 | $ | 0 | $ | 0 | $ | 0 | $ | 27,064 | $ | 27,064 |
| | | | | | | | | | | | | | |
| Total | | $ | 23,364 | $ | 99,558 | $ | 184,438 | $ | 63,894 | $ | 634,925 | $ | 1,006,179 |
| * | Mortgage debt does not include the Company's multi-bank line of credit or construction loans. The line of credit has a maturity date of September 1, 2017; as of January 31, 2015, the Company had borrowings of $50.5 million outstanding under this line. Construction loans and other debt totaled $132.2 million as of January 31, 2015. |
| (1) | Totals are principal balances as of January 31, 2015. |
| (2) | Loan maturity was extended to June 8, 2015 subsequent to January 31, 2015 |
| (3) | Loan was paid off subsequent to January 31, 2015. |
| (4) | Amount is part of a non-recourse $122.6 million CMBS loan, for which nine of the Company's office properties serve as collateral and under which a special-purpose subsidiary of the Company is the borrower. This loan matures in October 2016. Because the loan amount significantly exceeds the Company's current estimate of the fair value of this nine-property portfolio, the Company contacted the master servicer to initiate discussions on various alternatives with regard to the loan. During the first quarter of fiscal year 2015, the Company was notified that the loan has been transferred to the special servicer. The Company cannot predict the outcome of discussions with the special servicer regarding the loan. Cash flow from the portfolio currently covers debt service on the loan, and to date the borrower is current on all payments under the loan. |
INVESTORS REAL ESTATE TRUST AND SUBSIDIARIES
CAPITAL ANALYSIS
(in thousands, except per share and unit amounts)
| | Three Months Ended |
| | 1/31/2015 | 10/31/2014 | 7/31/2014 | 4/30/2014 | 1/31/2014 |
| Equity Capitalization | | | | | | | | | | |
| Common shares outstanding | | 122,134 | | 119,809 | | 114,763 | | 109,019 | | 106,937 |
| Operating partnership (OP) units outstanding | | 14,398 | | 14,731 | | 17,975 | | 21,094 | | 21,799 |
| Total common shares and OP units outstanding | | 136,532 | | 134,540 | | 132,738 | | 130,113 | | 128,736 |
| Market price per common share (closing price at end of period) | $ | 8.25 | $ | 8.40 | $ | 8.52 | $ | 8.72 | $ | 8.69 |
| Equity capitalization-common shares and OP units | $ | 1,126,389 | $ | 1,130,136 | $ | 1,130,928 | $ | 1,134,585 | $ | 1,118,716 |
| Recorded book value of preferred shares | $ | 138,674 | $ | 138,674 | $ | 138,674 | $ | 138,674 | $ | 138,674 |
| Total equity capitalization | $ | 1,265,063 | $ | 1,268,810 | $ | 1,269,602 | $ | 1,273,259 | $ | 1,257,390 |
| | | | | | | | | | | |
| Debt Capitalization | | | | | | | | | | |
| Total debt | $ | 1,188,218 | $ | 1,160,628 | $ | 1,135,892 | $ | 1,083,321 | $ | 1,078,741 |
| Total capitalization | $ | 2,453,281 | $ | 2,429,438 | $ | 2,405,494 | $ | 2,356,580 | $ | 2,336,131 |
| | | | | | | | | | | |
| Total debt to total capitalization | | 0.48:1 | | 0.48:1 | | 0.47:1 | | 0.46:1 | | 0.46:1 |
| | | | | | | | | | | |
| | Nine Months Ended | Three Months Ended |
| | 1/31/2015 | 1/31/2014 | 1/31/2015 | 10/31/2014 | 7/31/2014 | 4/30/2014 | 1/31/2014 |
Earnings to fixed charges(1) | | 1.22x | | 1.17x | | 1.48x | | 1.27x | | (2) | | (3) | | 1.15x |
Earnings to combined fixed charges and preferred distributions(1) | | 1.03x | | .99x | | 1.25x | | 1.08x | | (2) | | (3) | | 0.97x |
Debt service coverage ratio(1) | | 1.66x | | 1.54x | | 1.70x | | 1.71x | | 1.57x | | 1.53x | | 1.46x |
| | | | | | | | | | | | | | | |
| Distribution Data | | | | | | | | | | | | | | |
| Common shares and units outstanding at record date | | 135,490 | | 128,004 | | 135,490 | | 133,527 | | 130,795 | | 129,372 | | 128,004 |
| Total common distribution paid | $ | 51,975 | $ | 49,193 | $ | 17,613 | $ | 17,358 | $ | 17,004 | $ | 16,819 | $ | 16,639 |
| Common distribution per share and unit | $ | .3900 | $ | .3900 | $ | .1300 | $ | .1300 | $ | .1300 | $ | .1300 | $ | .1300 |
Payout ratio (FFO per share and unit basis)(1) | | 81.3% | | 79.6% | | 76.5% | | 76.5% | | 92.9% | | 92.9% | | 76.5% |
Payout ratio (AFFO per share and unit basis)(1) | | 92.9% | | 114.7% | | 86.7% | | 86.7% | | 108.3% | | 118.2% | | 118.2% |
| (1) | See Definitions on page 32. |
| (2) | Due to non-cash asset impairment and loss on sale charges of $5.3 million in the three months ended July 31, 2014, earnings were inadequate to cover fixed charges and combined fixed charges and preferred distributions by $1.6 million and $4.5 million, respectively. Excluding the asset impairment and loss on sale charges, the ratios of earnings to fixed charges and earnings to combined fixed charges and preferred distributions would have been 1.24 and 1.05, respectively, for the three months ended July 31, 2014. |
| (3) | Due to non-cash asset impairment charges of $37.8 million in the three months ended April 30, 2014, earnings were inadequate to cover fixed charges and combined fixed charges and preferred distributions by $35.3 million and $38.2 million, respectively. Excluding the asset impairment charge, the ratios of earnings to fixed charges and earnings to combined fixed charges and preferred distributions would have been 1.16 and 0.98, respectively, for the three months ended April 30, 2014. |
INVESTORS REAL ESTATE TRUST AND SUBSIDIARIES
SAME-STORE PROPERTIES NET OPERATING INCOME SUMMARY
(in thousands)
| | Same-Store Properties(1) | Same-Store Properties(1) |
| | Three Months Ended January 31 | Nine Months Ended January 31 |
| Segment | 2015 | 2014 | % Change | 2015 | 2014 | % Change |
| Multi-Family Residential | $ | 13,332 | $ | 13,724 | (2.9)% | $ | 41,093 | $ | 40,778 | 0.8% |
| Office | | 9,378 | | 9,758 | (3.9)% | | 26,944 | | 27,974 | (3.7)% |
| Healthcare | | 12,837 | | 12,905 | (0.5)% | | 36,281 | | 36,157 | 0.3% |
| Industrial | | 1,247 | | 1,259 | (1.0)% | | 3,653 | | 3,630 | 0.6% |
| Retail | | 1,899 | | 2,020 | (6.0)% | | 6,042 | | 5,984 | 1.0% |
| | $ | 38,693 | $ | 39,666 | (2.5)% | $ | 114,013 | $ | 114,523 | (0.4)% |
| (1) | See list of properties excluded from same-store properties on page ii. |
INVESTORS REAL ESTATE TRUST AND SUBSIDIARIES
NET OPERATING INCOME DETAIL
(in thousands)
| | Three Months Ended January 31, 2015 |
| | Reporting Segments | | |
| | Multi-Family Residential | Office | Healthcare | Industrial | Retail | Corporate and Other | Total |
| Real estate rental revenue | | | | | | | | | | | | | | |
Same-store(1) | $ | 24,773 | $ | 17,798 | $ | 17,041 | $ | 1,705 | $ | 3,119 | $ | 0 | $ | 64,436 |
| Non-same-store | | 5,483 | | 1,288 | | 546 | | 36 | | 164 | | 0 | | 7,517 |
| Total | | 30,256 | | 19,086 | | 17,587 | | 1,741 | | 3,283 | | 0 | | 71,953 |
| | | | | | | | | | | | | | | |
| Real estate expenses | | | | | | | | | | | | | | |
Same-store(1) | | 11,441 | | 8,420 | | 4,204 | | 458 | | 1,220 | | 0 | | 25,743 |
| Non-same-store | | 1,877 | | 630 | | 111 | | 43 | | 30 | | 0 | | 2,691 |
| Total | | 13,318 | | 9,050 | | 4,315 | | 501 | | 1,250 | | 0 | | 28,434 |
| | | | | | | | | | | | | | | |
| Net operating income (NOI) | | | | | | | | | | | | | | |
Same-store(1) | | 13,332 | | 9,378 | | 12,837 | | 1,247 | | 1,899 | | 0 | | 38,693 |
| Non-same-store | | 3,606 | | 658 | | 435 | | (7) | | 134 | | 0 | | 4,826 |
| Net operating income | $ | 16,938 | $ | 10,036 | $ | 13,272 | $ | 1,240 | $ | 2,033 | $ | 0 | $ | 43,519 |
| | | | | | | | | | | | | | | |
| Reconciliation of NOI to net income (loss) available to common shareholders | | | | | | | | | | | | | | |
| TRS senior housing revenue | $ | 0 | $ | 0 | $ | 0 | $ | 0 | $ | 0 | $ | 963 | $ | 963 |
| TRS senior housing expenses | | 0 | | 0 | | 0 | | 0 | | 0 | | (825) | | (825) |
| Depreciation/amortization | | (6,900) | | (4,315) | | (4,957) | | (390) | | (1,094) | | (94) | | (17,750) |
| General and administrative | | 0 | | 0 | | 0 | | 0 | | 0 | | (3,242) | | (3,242) |
| Impairment of real estate investments | | 0 | | 0 | | 0 | | 0 | | 0 | | (540) | | (540) |
| Interest expense | | (5,794) | | (4,614) | | (3,804) | | (201) | | (332) | | 150 | | (14,595) |
| Interest and other income | | 0 | | 0 | | 0 | | 0 | | 0 | | 670 | | 670 |
| Income (loss) before gain on sale of real estate and other investments | | 4,244 | | 1,107 | | 4,511 | | 649 | | 607 | | (2,918) | | 8,200 |
| Gain on sale of real estate and other investments | | 0 | | 319 | | 0 | | 0 | | 632 | | 0 | | 951 |
| Net income (loss) | | 4,244 | | 1,426 | | 4,511 | | 649 | | 1,239 | | (2,918) | | 9,151 |
| Net income attributable to noncontrolling interests – Operating Partnership | | 0 | | 0 | | 0 | | 0 | | 0 | | (657) | | (657) |
| Net income attributable to noncontrolling interests – consolidated real estate entities | | 0 | | 0 | | 0 | | 0 | | 0 | | (123) | | (123) |
| Net income (loss) attributable to Investors Real Estate Trust | | 4,244 | | 1,426 | | 4,511 | | 649 | | 1,239 | | (3,698) | | 8,371 |
| Dividends to preferred shareholders | | 0 | | 0 | | 0 | | 0 | | 0 | | (2,879) | | (2,879) |
| NET INCOME (LOSS) AVAILABLE TO COMMON SHAREHOLDERS | $ | 4,244 | $ | 1,426 | $ | 4,511 | $ | 649 | $ | 1,239 | $ | (6,577) | $ | 5,492 |
| (1) | See list of properties excluded from same-store properties on page ii. |
INVESTORS REAL ESTATE TRUST AND SUBSIDIARIES
NET OPERATING INCOME DETAIL
(in thousands)
| | Three Months Ended January 31, 2014 |
| | Reporting Segments | | |
| | Multi-Family Residential | Office | Healthcare | Industrial | Retail | Corporate and Other | Total |
| Real estate rental revenue | | | | | | | | | | | | | | |
Same-store(1) | $ | 23,911 | $ | 17,852 | $ | 16,969 | $ | 1,595 | $ | 3,236 | $ | 0 | $ | 63,563 |
| Non-same-store | | 1,937 | | 1,542 | | 273 | | 69 | | 245 | | 0 | | 4,066 |
| Total | | 25,848 | | 19,394 | | 17,242 | | 1,664 | | 3,481 | | 0 | | 67,629 |
| | | | | | | | | | | | | | | |
| Real estate expenses | | | | | | | | | | | | | | |
Same-store(1) | | 10,187 | | 8,094 | | 4,064 | | 336 | | 1,216 | | 0 | | 23,897 |
| Non-same-store | | 811 | | 943 | | 56 | | 157 | | 63 | | 0 | | 2,030 |
| Total | | 10,998 | | 9,037 | | 4,120 | | 493 | | 1,279 | | 0 | | 25,927 |
| | | | | | | | | | | | | | | |
| Gain on involuntary conversion | | | | | | | | | | | | | | |
Same-store(1) | | 0 | | 0 | | 0 | | 0 | | 0 | | 0 | | 0 |
| Non-same-store | | 1,514 | | 0 | | 0 | | 0 | | 0 | | 0 | | 1,514 |
| Total | | 1,514 | | 0 | | 0 | | 0 | | 0 | | 0 | | 1,514 |
| | | | | | | | | | | | | | | |
| Net operating income (NOI) | | | | | | | | | | | | | | |
Same-store(1) | | 13,724 | | 9,758 | | 12,905 | | 1,259 | | 2,020 | | 0 | | 39,666 |
| Non-same-store | | 2,640 | | 599 | | 217 | | (88) | | 182 | | 0 | | 3,550 |
| Net operating income | $ | 16,364 | $ | 10,357 | $ | 13,122 | $ | 1,171 | $ | 2,202 | $ | 0 | $ | 43,216 |
| | | | | | | | | | | | | | | |
| Reconciliation of NOI to net income (loss) available to common shareholders | | | | | | | | | | | | | | |
| TRS senior housing revenue | $ | 0 | $ | 0 | $ | 0 | $ | 0 | $ | 0 | $ | 804 | $ | 804 |
| TRS senior housing expenses | | 0 | | 0 | | 0 | | 0 | | 0 | | (671) | | (671) |
| Depreciation/amortization | | (5,444) | | (5,776) | | (4,938) | | (457) | | (792) | | (82) | $ | (17,489) |
| General and administrative | | 0 | | 0 | | 0 | | 0 | | 0 | | (2,935) | | (2,935) |
| Impairment of real estate investments | | 0 | | 0 | | 0 | | (4,798) | | 0 | | 0 | | (4,798) |
| Interest expense | | (5,491) | | (5,083) | | (4,053) | | (213) | | (421) | | 131 | | (15,130) |
| Interest and other income | | 0 | | 0 | | 0 | | 0 | | 0 | | 607 | | 607 |
| Income (loss) from continuing operations | | 5,429 | | (502) | | 4,131 | | (4,297) | | 989 | | (2,146) | | 3,604 |
| Income (loss) from discontinued operations | | (205) | | 0 | | 0 | | 861 | | (191) | | 0 | | 465 |
| Net income (loss) | | 5,224 | | (502) | | 4,131 | | (3,436) | | 798 | | (2,146) | | 4,069 |
| Net income attributable to noncontrolling interests – Operating Partnership | | 0 | | 0 | | 0 | | 0 | | 0 | | (130) | | (130) |
| Net income attributable to noncontrolling interests – consolidated real estate entities | | 0 | | 0 | | 0 | | 0 | | 0 | | (436) | | (436) |
| Net income (loss) attributable to Investors Real Estate Trust | | 5,224 | | (502) | | 4,131 | | (3,436) | | 798 | | (2,712) | | 3,503 |
| Dividends to preferred shareholders | | 0 | | 0 | | 0 | | 0 | | 0 | | (2,879) | | (2,879) |
| NET INCOME (LOSS) AVAILABLE TO COMMON SHAREHOLDERS | $ | 5,224 | $ | (502) | $ | 4,131 | $ | (3,436) | $ | 798 | $ | (5,591) | $ | 624 |
(1) See list of properties excluded from same-store properties on page ii.
INVESTORS REAL ESTATE TRUST AND SUBSIDIARIES
NET OPERATING INCOME DETAIL
(in thousands)
| | Nine Months Ended January 31, 2015 |
| | Reporting Segments | | |
| | Multi-Family Residential | Office | Healthcare | Industrial | Retail | Corporate and Other | Total |
| Real estate rental revenue | | | | | | | | | | | | | | |
Same-store(1) | $ | 74,206 | $ | 52,645 | $ | 48,843 | $ | 4,758 | $ | 9,411 | $ | 0 | $ | 189,863 |
| Non-same-store | | 13,370 | | 4,272 | | 1,479 | | 146 | | 702 | | 0 | | 19,969 |
| Total | | 87,576 | | 56,917 | | 50,322 | | 4,904 | | 10,113 | | 0 | | 209,832 |
| | | | | | | | | | | | | | | |
| Real estate expenses | | | | | | | | | | | | | | |
Same-store(1) | | 33,113 | | 25,701 | | 12,562 | | 1,105 | | 3,369 | | 0 | | 75,850 |
| Non-same-store | | 4,587 | | 2,172 | | 343 | | 118 | | 119 | | 0 | | 7,339 |
| Total | | 37,700 | | 27,873 | | 12,905 | | 1,223 | | 3,488 | | 0 | | 83,189 |
| | | | | | | | | | | | | | | |
| Net operating income (NOI) | | | | | | | | | | | | | | |
Same-store(1) | | 41,093 | | 26,944 | | 36,281 | | 3,653 | | 6,042 | | 0 | | 114,013 |
| Non-same-store | | 8,783 | | 2,100 | | 1,136 | | 28 | | 583 | | 0 | | 12,630 |
| Net operating income | $ | 49,876 | $ | 29,044 | $ | 37,417 | $ | 3,681 | $ | 6,625 | $ | 0 | $ | 126,643 |
| | | | | | | | | | | | | | | |
| Reconciliation of NOI to net income (loss) available to common shareholders | | | | | | | | | | | | | | |
| TRS senior housing revenue | $ | 0 | $ | 0 | $ | 0 | $ | 0 | $ | 0 | $ | 2,599 | $ | 2,599 |
| TRS senior housing expenses | | 0 | | 0 | | 0 | | 0 | | 0 | | (2,243) | | (2,243) |
| Depreciation/amortization | | (19,119) | | (14,231) | | (14,995) | | (1,171) | | (2,670) | | (288) | | (52,474) |
| General and administrative | | 0 | | 0 | | 0 | | 0 | | 0 | | (10,986) | | (10,986) |
| Impairment of real estate investments | | 0 | | (3,428) | | 0 | | 0 | | (1,384) | | (1,293) | | (6,105) |
| Interest expense | | (16,861) | | (14,479) | | (11,211) | | (605) | | (1,036) | | 334 | | (43,858) |
| Interest and other income | | 0 | | 0 | | 0 | | 0 | | 0 | | 2,057 | | 2,057 |
| Income (loss) before loss on sale of real estate and other investments | | 13,896 | | (3,094) | | 11,211 | | 1,905 | | 1,535 | | (9,820) | | 15,633 |
| Loss on sale of real estate and other investments | | 1,418 | | 126 | | 0 | | (1,793) | | 633 | | (1,195) | | (811) |
| Net income (loss) | | 15,314 | | (2,968) | | 11,211 | | 112 | | 2,168 | | (11,015) | | 14,822 |
| Net income attributable to noncontrolling interests – Operating Partnership | | 0 | | 0 | | 0 | | 0 | | 0 | | (618) | | (618) |
| Net income attributable to noncontrolling interests – consolidated real estate entities | | 0 | | 0 | | 0 | | 0 | | 0 | | (870) | | (870) |
| Net income (loss) attributable to Investors Real Estate Trust | | 15,314 | | (2,968) | | 11,211 | | 112 | | 2,168 | | (12,503) | | 13,334 |
| Dividends to preferred shareholders | | 0 | | 0 | | 0 | | 0 | | 0 | | (8,636) | | (8,636) |
| NET INCOME (LOSS) AVAILABLE TO COMMON SHAREHOLDERS | $ | 15,314 | $ | (2,968) | $ | 11,211 | $ | 112 | $ | 2,168 | $ | (21,139) | $ | 4,698 |
| (1) | See list of properties excluded from same-store properties on page ii. |
INVESTORS REAL ESTATE TRUST AND SUBSIDIARIES
NET OPERATING INCOME DETAIL
(in thousands)
| | Nine Months Ended January 31, 2014 |
| | Reporting Segments | | |
| | Multi-Family Residential | Office | Healthcare | Industrial | Retail | Corporate and Other | Total |
| Real estate rental revenue | | | | | | | | | | | | | | |
Same-store(1) | $ | 71,889 | $ | 53,539 | $ | 48,470 | $ | 4,654 | $ | 9,390 | $ | 0 | $ | 187,942 |
| Non-same-store | | 3,770 | | 4,536 | | 870 | | 619 | | 762 | | 0 | | 10,557 |
| Total | | 75,659 | | 58,075 | | 49,340 | | 5,273 | | 10,152 | | 0 | | 198,499 |
| | | | | | | | | | | | | | | |
| Real estate expenses | | | | | | | | | | | | | | |
Same-store(1) | | 31,111 | | 25,565 | | 12,313 | | 1,024 | | 3,406 | | 0 | | 73,419 |
| Non-same-store | | 1,895 | | 2,750 | | 221 | | 423 | | 190 | | 0 | | 5,479 |
| Total | | 33,006 | | 28,315 | | 12,534 | | 1,447 | | 3,596 | | 0 | | 78,898 |
| | | | | | | | | | | | | | | |
| Gain on involuntary conversion | | | | | | | | | | | | | | |
Same-store(1) | | 0 | | 0 | | 0 | | 0 | | 0 | | 0 | | 0 |
| Non-same-store | | 2,480 | | 0 | | 0 | | 0 | | 0 | | 0 | | 2,480 |
| Total | | 2,480 | | 0 | | 0 | | 0 | | 0 | | 0 | | 2,480 |
| | | | | | | | | | | | | | | |
| Net operating income (NOI) | | | | | | | | | | | | | | |
Same-store(1) | | 40,778 | | 27,974 | | 36,157 | | 3,630 | | 5,984 | | 0 | | 114,523 |
| Non-same-store | | 4,355 | | 1,786 | | 649 | | 196 | | 572 | | 0 | | 7,558 |
| Net operating income | $ | 45,133 | $ | 29,760 | $ | 36,806 | $ | 3,826 | $ | 6,556 | $ | 0 | $ | 122,081 |
| | | | | | | | | | | | | | | |
| Reconciliation of NOI to net income (loss) available to common shareholders | | | | | | | | | | | | | | |
| TRS senior housing revenue | $ | 0 | $ | 0 | $ | 0 | $ | 0 | $ | 0 | $ | 804 | $ | 804 |
| TRS senior housing expenses | | 0 | | 0 | | 0 | | 0 | | 0 | | (671) | | (671) |
| Depreciation/amortization | | (16,527) | | (16,564) | | (16,510) | | (1,410) | | (2,396) | | (249) | | (53,656) |
| General and administrative | | 0 | | 0 | | 0 | | 0 | | 0 | | (9,572) | | (9,572) |
| Impairment of real estate investments | | 0 | | 0 | | 0 | | (4,798) | | 0 | | 0 | | (4,798) |
| Interest expense | | (16,276) | | (15,271) | | (11,776) | | (768) | | (1,406) | | 972 | | (44,525) |
| Interest and other income | | 0 | | 0 | | 0 | | 0 | | 0 | | 1,469 | | 1,469 |
| Income (loss) from continuing operations | | 12,330 | | (2,075) | | 8,520 | | (3,150) | | 2,754 | | (7,247) | | 11,132 |
| Income (loss) from discontinued operations | | (99) | | (1,794) | | 0 | | 8,923 | | (580) | | 0 | | 6,450 |
| Net income (loss) | | 12,231 | | (3,869) | | 8,520 | | 5,773 | | 2,174 | | (7,247) | | 17,582 |
| Net income attributable to noncontrolling interests – Operating Partnership | | 0 | | 0 | | 0 | | 0 | | 0 | | (1,406) | | (1,406) |
| Net income attributable to noncontrolling interests – consolidated real estate entities | | 0 | | 0 | | 0 | | 0 | | 0 | | (808) | | (808) |
| Net income (loss) attributable to Investors Real Estate Trust | | 12,231 | | (3,869) | | 8,520 | | 5,773 | | 2,174 | | (9,461) | | 15,368 |
| Dividends to preferred shareholders | | 0 | | 0 | | 0 | | 0 | | 0 | | (8,636) | | (8,636) |
| NET INCOME (LOSS) AVAILABLE TO COMMON SHAREHOLDERS | $ | 12,231 | $ | (3,869) | $ | 8,520 | $ | 5,773 | $ | 2,174 | $ | (18,097) | $ | 6,732 |
| (1) | See list of properties excluded from same-store properties on page ii. |
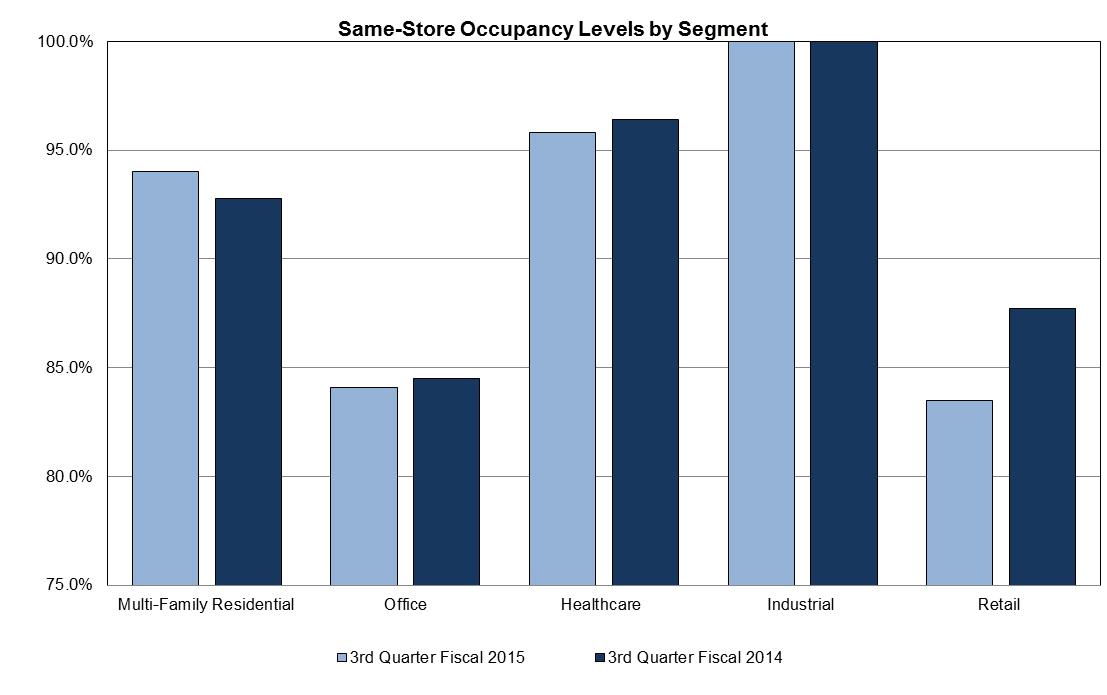
INVESTORS REAL ESTATE TRUST AND SUBSIDIARIES
SAME-STORE PROPERTIES AND ALL PROPERTIES OCCUPANCY LEVELS BY SEGMENT
3rd Quarter Fiscal 2015 vs. 3rd Quarter Fiscal 2014
| Segments | Same-Store Properties | All Properties |
| | 3rd Quarter | 3rd Quarter | 3rd Quarter | 3rd Quarter |
| | Fiscal 2015 | Fiscal 2014 | Fiscal 2015 | Fiscal 2014 |
| Multi-Family Residential | 94.0% | 92.8% | 91.3% | 91.8% |
| Office | 84.1% | 84.5% | 81.9% | 80.4% |
| Healthcare | 95.8% | 96.4% | 95.8% | 96.4% |
| Industrial | 100.0% | 100.0% | 100.0% | 86.2% |
| Retail | 83.5% | 87.7% | 83.8% | 86.9% |
INVESTORS REAL ESTATE TRUST AND SUBSIDIARIES
MULTI-FAMILY RESIDENTIAL SUMMARY(2)
| | Three Months Ended |
| | 1/31/2015 | 10/31/2014 | 7/31/2014 | 4/30/2014 | 1/31/2014 |
| Number of Units | | 11,765 | | 11,292 | | 11,080 | | 10,779 | | 10,725 |
| Average Investment Per Unit | | | | | | | | | | |
| Same-Store | $ | 66,466 | $ | 66,233 | $ | 65,956 | $ | 61,323 | $ | 61,187 |
| Non-Same-Store | | 143,999 | | 133,763 | | 125,239 | | 100,374 | | 96,467 |
| All Properties | $ | 77,723 | $ | 74,190 | $ | 71,326 | $ | 69,905 | $ | 68,728 |
| | | | | | | | | | | |
Average Scheduled Rent(1) per Unit | | | | | | | | | | |
| Same-Store | $ | 841 | $ | 835 | $ | 825 | $ | 785 | $ | 781 |
| Non-Same-Store | | 1,390 | | 1,320 | | 1,220 | | 1,051 | | 1,010 |
| All Properties | $ | 920 | $ | 892 | $ | 861 | $ | 843 | $ | 830 |
| | | | | | | | | | | |
| Total Receipts per Unit | | | | | | | | | | |
| Same-Store | $ | 835 | $ | 844 | $ | 820 | $ | 773 | $ | 767 |
| Non-Same-Store | | 1,087 | | 1,121 | | 1,067 | | 971 | | 947 |
| All Properties | $ | 871 | $ | 877 | $ | 842 | $ | 816 | $ | 806 |
| | | | | | | | | | | |
Total Recurring Capital Expenditures per Unit(1) | $ | 119 | $ | 158 | $ | 139 | $ | 133 | $ | 130 |
| | | | | | | | | | | |
| Occupancy% | | | | | | | | | | |
| Same-Store | | 94.0% | | 95.6% | | 93.8% | | 94.5% | | 93.5% |
| Non-Same-Store | | 77.1% | | 87.6% | | 89.5% | | 87.6% | | 85.3% |
| All Properties | | 91.3% | | 94.6% | | 93.4% | | 93.0% | | 91.8% |
| | | | | | | | | | | |
| Operating Expenses as a % of Scheduled Rent | | | | | | | | | | |
| Same-Store | | 46.0% | | 43.7% | | 46.0% | | 50.2% | | 43.0% |
| Non-Same-Store | | 27.0% | | 28.8% | | 29.5% | | 45.9% | | 39.8% |
| All Properties | | 41.8% | | 41.1% | | 43.9% | | 49.0% | | 42.2% |
| (1) | See Definitions on page 32. |
| (2) | Previously-reported amounts are not revised for discontinued operations or changes in the composition of the same-store properties pool. |
INVESTORS REAL ESTATE TRUST AND SUBSIDIARIES
COMMERCIAL LEASING SUMMARY (Same-Store Properties)
Commercial Leasing Activity
During fiscal year 2015, we have executed new and renewal commercial leases for our same-store rental properties on 186,514 square feet for the three months ended January 31, 2015 and 840,419 square feet for the nine months ended January 31, 2015. As a result of our leasing efforts, occupancy in our same-store commercial portfolio increased to 89.5% as of January 31, 2015, up from 86.4% as of January 31, 2014.
The total leasing activity for our same-store commercial rental properties, expressed in square feet of leases signed during the period, and the resulting occupancy levels, are as follows:
Three Months Ended January 31, 2015 and 2014
| | Square Feet of New Leases(1) | Square Feet of Leases Renewed(1) | Total Square Feet of Leases Executed(1) | | Occupancy |
| | |
| Segments | 2015 | 2014 | 2015 | 2014 | 2015 | 2014 | | 2015 | 2014 |
| Office | 37,076 | 64,288 | 63,091 | 80,424 | 100,167 | 144,712 | | 83.3% | 80.4% |
| Healthcare | 6,400 | 175 | 7,703 | 17,734 | 14,103 | 17,909 | | 96.0% | 96.4% |
| Industrial | 0 | 64,000 | 29,995 | 0 | 29,995 | 64,000 | | 100.0% | 85.6% |
| Retail | 3,284 | 27,107 | 38,965 | 28,564 | 42,249 | 55,671 | | 85.7% | 86.9% |
| Total | 46,760 | 155,570 | 139,754 | 126,722 | 186,514 | 282,292 | | 89.5% | 86.4% |
| (1) | The leasing activity presented is based on leases signed or executed for our same-store rental properties during the period and is not intended to coincide with the commencement of rental revenue in accordance with GAAP. Prior periods reflect amounts previously reported and exclude retroactive adjustments for properties reclassified to discontinued operations or non-same-store in the current period. |
Nine Months Ended January 31, 2015 and 2014
| | Square Feet of New Leases(1) | Square Feet of Leases Renewed(1) | Total Square Feet of Leases Executed(1) | | Occupancy |
| | |
| Segments | 2015 | 2014 | 2015 | 2014 | 2015 | 2014 | | 2015 | 2014 |
| Office | 119,624 | 278,143 | 330,240 | 222,798 | 449,864 | 500,941 | | 83.3% | 80.4% |
| Healthcare | 17,979 | 31,268 | 108,391 | 34,996 | 126,370 | 66,264 | | 96.0% | 96.4% |
| Industrial | 0 | 234,403 | 29,995 | 251,831 | 29,995 | 486,234 | | 100.0% | 85.6% |
| Retail | 51,252 | 124,966 | 182,938 | 78,257 | 234,190 | 203,223 | | 85.7% | 86.9% |
| Total | 188,855 | 668,780 | 651,564 | 587,882 | 840,419 | 1,256,662 | | 89.5% | 86.4% |
| (1) | The leasing activity presented is based on leases signed or executed for our same-store rental properties during the period and is not intended to coincide with the commencement of rental revenue in accordance with GAAP. Prior periods reflect amounts previously reported and exclude retroactive adjustments for properties reclassified to discontinued operations or non-same-store in the current period. |
INVESTORS REAL ESTATE TRUST AND SUBSIDIARIES
COMMERCIAL LEASING SUMMARY (Same-Store Properties)
New Leases
The following table sets forth the average effective rents and the estimated costs of tenant improvements and leasing commissions, on a per square foot basis, that we are obligated to fulfill under the new leases signed for our same-store commercial rental properties:
Three Months Ended January 31, 2015 and 2014
| | Square Feet of New Leases(1) | Average Term in Years | Average Effective Rent(2) | Estimated Tenant Improvement Cost per Square Foot(1) | Leasing Commissions per Square Foot(1) |
| | 2015 | 2014 | 2015 | 2014 | 2015 | 2014 | 2015 | 2014 | 2015 | 2014 |
| Office | | 37,076 | | 64,288 | | 4.4 | | 3.6 | $ | 14.29 | $ | 13.85 | $ | 15.57 | $ | 6.76 | $ | 5.87 | $ | 3.20 |
| Healthcare | | 6,400 | | 175 | | 7.5 | | 0.8 | | 18.51 | | 13.71 | | 59.06 | | 0 | | 6.50 | | 0 |
| Industrial | | 0 | | 64,000 | | 0 | | 2.8 | | 0 | | 3.03 | | 0 | | 0 | | 0 | | 0.03 |
| Retail | | 3,284 | | 27,107 | | 2.0 | | 5.4 | | 8.54 | | 10.94 | | 2.23 | | 2.89 | | 1.78 | | 5.61 |
| Total | | 46,760 | | 155,570 | | 4.3 | | 3.9 | $ | 14.47 | $ | 8.89 | $ | 20.58 | $ | 3.30 | $ | 5.67 | $ | 2.31 |
| (1) | The leasing activity presented is based on leases signed or executed for our same-store rental properties during the period and is not intended to coincide with the commencement of rental revenue in accordance with GAAP. Prior periods reflect amounts previously reported and exclude retroactive adjustments for properties reclassified to discontinued operations or non-same-store in the current period. Tenant improvements and leasing commissions presented are based on square feet leased during the period. |
| (2) | Effective rents represent average annual base rental payments, on a straight-line basis for the term of each lease, excluding operating expense reimbursements. The underlying leases contain various expense structures including gross, modified gross, net and triple net. |
Nine Months Ended January 31, 2015 and 2014
| | Square Feet of New Leases(1) | Average Term in Years | Average Effective Rent(2) | Estimated Tenant Improvement Cost per Square Foot(1) | Leasing Commissions per Square Foot(1) |
| | 2015 | 2014 | 2015 | 2014 | 2015 | 2014 | 2015 | 2014 | 2015 | 2014 |
| Office | | 119,624 | | 278,143 | | 4.6 | | 4.3 | $ | 14.00 | $ | 14.26 | $ | 15.65 | $ | 13.10 | $ | 5.33 | $ | 4.33 |
| Healthcare | | 17,979 | | 31,268 | | 6.1 | | 4.8 | | 20.00 | | 21.38 | | 37.16 | | 49.66 | | 6.84 | | 6.75 |
| Industrial | | 0 | | 234,403 | | 0 | | 3.1 | | 0 | | 3.55 | | 0 | | 0.13 | | 0 | | 0.50 |
| Retail | | 51,252 | | 124,966 | | 3.6 | | 5.4 | | 8.36 | | 5.70 | | 16.26 | | 1.84 | | 3.46 | | 4.47 |
| Total | | 188,855 | | 668,780 | | 4.5 | | 4.4 | $ | 13.04 | $ | 9.24 | $ | 17.86 | $ | 8.16 | $ | 4.97 | $ | 3.13 |
| (1) | The leasing activity presented is based on leases signed or executed for our same-store rental properties during the period and is not intended to coincide with the commencement of rental revenue in accordance with GAAP. Prior periods reflect amounts previously reported and exclude retroactive adjustments for properties reclassified to discontinued operations or non-same-store in the current period. Tenant improvements and leasing commissions presented are based on square feet leased during the period. |
| (2) | Effective rents represent average annual base rental payments, on a straight-line basis for the term of each lease, excluding operating expense reimbursements. The underlying leases contain various expense structures including gross, modified gross, net and triple net. |
Our ability to maintain or increase occupancy rates is a principal driver of maintaining and increasing the average effective rents in our commercial segments. The increase in the average effective rental rate in the total commercial portfolio for the three months ended January 31, 2015 and the nine months ended January 31, 2015 when compared to the same periods in the prior fiscal year is due primarily to the fact that there were no new industrial leases executed in the nine months ended January 31, 2015, since industrial segment rents are typically lower on a per-square foot basis than rents charged for higher-finish office, retail and healthcare space. Absent the new industrial leases executed in the three months ended January 31, 2014 and the nine months ended January 31, 2014 the average effective rental rate of the total commercial portfolio for those periods would have been would have been $12.99 and $12.31 per-square foot respectively. The balance of the increase in the average effective rental rate in the total commercial portfolio for the three months ended January 31, 2015 and the nine months ended January31, 2015 when compared to the same period in the prior fiscal year is due to increased leasing costs incurred for leases executed in the nine months ended January 31, 2015.
INVESTORS REAL ESTATE TRUST AND SUBSIDIARIES
COMMERCIAL LEASING SUMMARY (Same-Store Properties)
Lease Renewals
The following table summarizes our lease renewal activity within our same-store commercial segments (square feet data in thousands):
Three Months Ended January 31, 2015 and 2014
| | Square Feet of Leases Renewed(1) | Percent of Expiring Leases Renewed(2) | Average Term in Years | Weighted Average Growth (Decline) in Effective Rents(3) | Estimated Tenant Improvement Cost per Square Foot(1) | Leasing Commissions per Square Foot(1) |
| | 2015 | 2014 | 2015 | 2014 | 2015 | 2014 | 2015 | 2014 | 2015 | 2014 | 2015 | 2014 |
| Office | | 63,091 | | 80,424 | | 65.4% | | 44.4% | | 2.1 | | 3.2 | | 9.2% | | (1.0%) | $ | 0.31 | $ | 4.54 | $ | 1.63 | $ | 1.87 |
| Healthcare | | 7,703 | | 17,734 | | 84.5% | | 100.0% | | 16.8 | | 2.3 | | 1.3% | | 9.6% | | 35.00 | | 0 | | 7.80 | | 0.02 |
| Industrial | | 29,995 | | 0 | | 0% | | 0% | | 3.0 | | 0 | | (4.5%) | | 0% | | 0 | | 0 | | 1.21 | | 0 |
| Retail | | 38,965 | | 28,564 | | 44.8% | | 100% | | 3.8 | | 4.0 | | 17.4% | | 13.3% | | 1.93 | | 4.63 | | 0 | | 0.06 |
| Total | | 139,754 | | 126,722 | | 63.4% | | 55.1% | | 3.5 | | 3.3 | | 8.7% | | 3.6% | $ | 2.61 | $ | 3.93 | $ | 1.43 | $ | 1.20 |
| (1) | The leasing activity presented is based on leases signed or executed for our same-store rental properties during the period and is not intended to coincide with the commencement of rental revenue in accordance with GAAP. Prior periods reflect amounts previously reported and exclude retroactive adjustments for properties reclassified to discontinued operations or non-same-store in the current period. Tenant improvements and leasing commissions are based on square feet leased during the period. |
| (2) | Renewal percentage of expiring leases is based on square footage of renewed leases and not the number of leases renewed. Beginning in the first quarter of fiscal year 2015, the category of renewed leases does not include leases that have become month-to-month leases; these month-to-month leases are considered lease amendments. Previous-period data has been revised to reflect this change. |
| (3) | Represents the percentage change in effective rent between the original leases and the renewal leases. Effective rents represent average annual base rental payments, on a straight-line basis for the term of each lease, excluding operating expense reimbursements. The underlying leases contain various expense structures including gross, modified gross, net and triple net. |
Nine Months Ended January 31, 2015 and 2014
| | Square Feet of Leases Renewed(1) | Percent of Expiring Leases Renewed(2) | Average Term in Years | Weighted Average Growth (Decline) in Effective Rents(3) | Estimated Tenant Improvement Cost per Square Foot(1) | Leasing Commissions per Square Foot(1) |
| | 2015 | 2014 | 2015 | 2014 | 2015 | 2014 | 2015 | 2014 | 2015 | 2014 | 2015 | 2014 |
| Office | | 330,240 | | 222,798 | | 64.7% | | 52.9% | | 2.6 | | 3.6 | | 10.8% | | (2.4%) | $ | 2.38 | $ | 4.69 | $ | 1.57 | $ | 3.31 |
| Healthcare | | 108,391 | | 34,996 | | 73.2% | | 100.0% | | 6.3 | | 3.6 | | (3.5%) | | 8.8% | | 10.99 | | 9.96 | | 1.54 | | 1.10 |
| Industrial | | 29,995 | | 251,831 | | 0.0% | | 42.3% | | 3.0 | | 3.2 | | (4.5%) | | 7.5% | | 0 | | 0.32 | | 1.21 | | 0.48 |
| Retail | | 182,938 | | 78,257 | | 46.1% | | 37.4% | | 4.0 | | 3.7 | | 28.1% | | 10.0% | | 1.87 | | 1.88 | | 0.04 | | 0.05 |
| Total | | 651,564 | | 587,882 | | 59.9% | | 50.9% | | 3.7 | | 3.6 | | 9.1% | | 2.7% | $ | 3.56 | $ | 2.76 | $ | 1.12 | $ | 1.53 |
| (1) | The leasing activity presented is based on leases signed or executed for our same-store rental properties during the period and is not intended to coincide with the commencement of rental revenue in accordance with GAAP. Prior periods reflect amounts previously reported and exclude retroactive adjustments for properties reclassified to discontinued operations or non-same-store in the current period. Tenant improvements and leasing commissions are based on square feet leased during the period. |
| (2) | Renewal percentage of expiring leases is based on square footage of renewed leases and not the number of leases renewed. Beginning in the first quarter of fiscal year 2015, the category of renewed leases does not include leases that have become month-to-month leases; these month-to-month leases are considered lease amendments. Previous-period data has been revised to reflect this change. |
| (3) | Represents the percentage change in effective rent between the original leases and the renewal leases. Effective rents represent average annual base rental payments, on a straight-line basis for the term of each lease, excluding operating expense reimbursements. The underlying leases contain various expense structures including gross, modified gross, net and triple net. |
The decline in the average growth in effective rents for the healthcare segment for the nine months ended January 31, 2015 when compared to the same period in the prior fiscal year is due to a 45,081 square foot lease renewal executed with the existing single tenant at our Pavilion I property in Duluth, Minnesota. This lease was renewed at a lower rate than the previous expiring lease due to very low leasing transaction costs associated with the lease renewal. Absent this lease transaction, the weighted average growth rate in effective rents for the nine months ended January 31, 2015 would have been 3.8%.
The increase in the weighted average growth in effective rents for the retail segment for the nine months ended January 31, 2015 when compared to the same period in the prior fiscal year is due to a 47,150 square foot lease renewal executed at our Rochester, Minnesota Maplewood Square property and a 36,752 square foot lease renewal executed at our St. Cloud Minnesota Westgate property. The increase in the rental rate at our Rochester, Minnesota property was primarily due to the improved financial condition of the tenant which enabled IRET to renew the lease at fair market rental rates. The lease renewal at our St. Cloud, Minnesota property contained a significant tenant improvement allowance negotiated by the tenant which enabled IRET to negotiate an increased rental rate as well. Absent these two lease transactions, the weighted average growth rate in effective rents for the retail segment for the nine months ended January 31, 2015 would have been 11.8%.
INVESTORS REAL ESTATE TRUST AND SUBSIDIARIES
COMMERCIAL LEASING SUMMARY (Same-Store Properties)
Lease Expirations
Our ability to maintain and improve occupancy rates, and base rents, primarily depends upon our continuing ability to re-lease expiring space. The following table reflects the in-service portfolio lease expiration schedule of our consolidated commercial segments properties, including square footage and annualized base rent for expiring leases, as of January 31, 2015.
| Fiscal Year of Lease Expiration | # of Leases | Square Footage of Expiring Leases(3) | | Percentage of Total Commercial Segments Leased Square Footage | Annualized Base
Rent of Expiring
Leases at Expiration(2) | | Percentage of Total Commercial Segments Annualized Base Rent |
2015(remainder)(1) | 63 | 439,791 | | 5.1% | $ | 5,194,075 | | 4.5% |
| 2016 | 124 | 1,051,087 | | 12.2% | | 12,563,469 | | 10.9% |
| 2017 | 145 | 1,239,131 | | 14.4% | | 19,394,557 | | 16.8% |
| 2018 | 103 | 772,479 | | 8.9% | | 11,874,316 | | 10.3% |
| 2019 | 88 | 1,290,169 | | 15.0% | | 17,851,438 | | 15.5% |
| 2020 | 57 | 677,871 | | 7.8% | | 7,981,396 | | 6.9% |
| 2021 | 51 | 430,125 | | 5.0% | | 6,096,329 | | 5.3% |
| 2022 | 46 | 1,386,552 | | 16.1% | | 17,577,646 | | 15.3% |
| 2023 | 16 | 499,626 | | 5.8% | | 2,519,283 | | 2.2% |
| 2024 | 43 | 405,254 | | 4.7% | | 6,313,940 | | 5.5% |
| Thereafter | 25 | 432,096 | | 5.0% | | 7,825,276 | | 6.8% |
| Totals | 761 | 8,624,181 | | 100.0% | $ | 115,191,725 | | 100.0% |
| (1) | Includes month-to-month leases. As of January 31, 2015 month-to-month leases accounted for 342,968 square feet. |
| (2) | Annualized Base Rent is monthly scheduled rent as of January 1, 2015, multiplied by 12. |
| (3) | Assuming that none of the tenants exercise renewal or termination options, and including leases renewed prior to expiration. Also excludes 143,024 square feet of space occupied by IRET. |
Because of the diverse property types in the Company's commercial portfolio and the dispersed locations of a substantial portion of the portfolio's properties in secondary and tertiary markets, information on current market rents is difficult to obtain, is highly subjective, and is often not directly comparable between properties. As a result, the Company believes that the increase or decrease in effective rent on its recent leases is the most objective and meaningful information available regarding rent trends and the relationship between rents on leases expiring in the near-term and current market rents across the Company's markets. The Company believes that rents on its new and renewed leases generally approximate market rents.
INVESTORS REAL ESTATE TRUST AND SUBSIDIARIES
10 LARGEST COMMERCIAL TENANTS – BASED ON ANNUALIZED BASE RENT(1)
as of January 31, 2015
| Tenant | Number of Properties | Average Remaining Lease Term in Months | % of Total Commercial Segments' Minimum Rents | Aggregate Rentable Square Feet | % of Aggregate Occupied Square Feet |
| Affiliates of Edgewood Vista | 33 | 65 | 14.8% | 1,521,147 | 15.5% | |
| Fairview Health Services | 10 | 39 | 3.8% | 276,510 | 2.8% | |
| St. Luke's Hospital of Duluth, Inc. | 6 | 34 | 3.5% | 198,775 | 2.0% | |
| Applied Underwriters | 3 | 25 | 2.4% | 141,724 | 1.4% | |
| HealthEast Care System | 1 | 49 | 1.8% | 114,316 | 1.2% | |
| Microsoft (NASDAQ: MSFT) | 1 | 47 | 1.4% | 122,040 | 1.2% | |
| Affiliates of Siemens USA (NYSE: SI) | 2 | 26 | 1.4% | 112,848 | 1.2% | |
| Arcadis Corporate Services, Inc. | 1 | 18 | 1.4% | 71,430 | 0.7% | |
Nebraska Orthopaedic Hospital(2) | 1 | 170 | 1.4% | 61,758 | 0.6% | |
| State of Idaho Department of Health and Welfare | 2 | 37 | 1.2% | 103,342 | 1.1% | |
| Total/Weighted Average | | 49 | 33.1% | 2,723,890 | 27.7% | |
| (1) | See Definitions on page 32. |
| (2) | The tenant in the Company's Nebraska Orthopaedic Hospital property has exercised its option to purchase the property. The Company and its tenant are currently engaged in an arbitration proceeding pursuant to the lease agreement to determine the purchase price. The Company currently can give no assurance that the sale of the property pursuant to the purchase option will be completed. |
INVESTORS REAL ESTATE TRUST AND SUBSIDIARIES
COMMERCIAL LEASE EXPIRATIONS
as of January 31, 2015
| | (dollars in thousands except average rental rates) |
| Fiscal Year | Number of Leases | Rentable Square Feet(1) | % of Rentable Square Feet | Annualized Rent(2) | Average Rental Rate | % of Annualized Base Rent |
| Office | | | | | | | | |
2015(remainder)(3) | 22 | 73,755 | 2.0% | $ | 1,045 | $ | 14.17 | 2.0% |
| 2016 | 59 | 547,464 | 14.7% | | 7,077 | | 12.93 | 13.3% |
| 2017 | 76 | 859,394 | 23.0% | | 14,260 | | 16.59 | 26.8% |
| 2018 | 57 | 518,063 | 14.0% | | 6,925 | | 13.37 | 13.0% |
| 2019 | 52 | 931,277 | 25.0% | | 12,951 | | 13.91 | 24.4% |
| 2020 and thereafter | 73 | 800,857 | 21.5% | | 10,884 | | 13.59 | 20.5% |
| | 339 | 3,730,810 | 100.0% | $ | 53,142 | $ | 14.24 | 100.0% |
| | | | | | | | | |
| Healthcare | | | | | | | | |
2015(remainder)(4) | 22 | 309,750 | 10.8% | $ | 3,655 | $ | 11.80 | 7.6% |
| 2016 | 27 | 157,311 | 5.5% | | 2,945 | | 18.72 | 6.2% |
| 2017 | 31 | 164,634 | 5.7% | | 3,487 | | 21.18 | 7.3% |
| 2018 | 20 | 173,048 | 6.0% | | 4,229 | | 24.44 | 8.8% |
| 2019 | 14 | 191,963 | 6.7% | | 3,944 | | 20.55 | 8.3% |
| 2020 and thereafter | 109 | 1,872,167 | 65.3% | | 29,485 | | 15.75 | 61.8% |
| | 223 | 2,868,873 | 100.0% | $ | 47,745 | $ | 16.64 | 100.0% |
| | | | | | | | | |
| Industrial | | | | | | | | |
2015(remainder)(5) | 0 | 0 | 0.0% | $ | 0 | $ | 0.00 | 0.0% |
| 2016 | 4 | 248,098 | 24.3% | | 1,493 | | 6.02 | 29.8% |
| 2017 | 1 | 69,600 | 6.8% | | 356 | | 5.11 | 7.0% |
| 2018 | 0 | 0 | 0.0% | | 0 | | 0.00 | 0.0% |
| 2019 | 5 | 127,600 | 12.5% | | 515 | | 4.04 | 10.3% |
| 2020 and thereafter | 5 | 574,813 | 56.4% | | 2,653 | | 4.62 | 52.9% |
| | 15 | 1,020,111 | 100.0% | $ | 5,017 | $ | 4.92 | 100.0% |
| | | | | | | | | |
| Retail | | | | | | | | |
2015(remainder)(6) | 19 | 56,286 | 5.6% | $ | 494 | $ | 8.78 | 5.3% |
| 2016 | 34 | 98,214 | 9.8% | | 1,049 | | 10.68 | 11.3% |
| 2017 | 37 | 145,503 | 14.5% | | 1,291 | | 8.87 | 13.9% |
| 2018 | 26 | 81,368 | 8.1% | | 721 | | 8.86 | 7.8% |
| 2019 | 17 | 39,329 | 3.9% | | 441 | | 11.21 | 4.7% |
| 2020 and thereafter | 51 | 583,687 | 58.1% | | 5,292 | | 9.07 | 57.0% |
| | 184 | 1,004,387 | 100.0% | $ | 9,288 | $ | 9.25 | 100.0% |
| | | | | | | | | |
| Commercial Total | | | | | | | | |
2015(remainder)(7) | 63 | 439,791 | 5.1% | $ | 5,194 | $ | 11.81 | 4.5% |
| 2016 | 124 | 1,051,087 | 12.2% | | 12,564 | | 11.95 | 10.9% |
| 2017 | 145 | 1,239,131 | 14.4% | | 19,394 | | 15.65 | 16.9% |
| 2018 | 103 | 772,479 | 8.9% | | 11,875 | | 15.37 | 10.3% |
| 2019 | 88 | 1,290,169 | 15.0% | | 17,851 | | 13.84 | 15.5% |
| 2020 and thereafter | 238 | 3,831,524 | 44.4% | | 48,314 | | 12.61 | 41.9% |
| | 761 | 8,624,181 | 100.0% | $ | 115,192 | $ | 13.36 | 100.0% |
| (1) | Excludes 143,024 square feet of space occupied by IRET. |
| (2) | Annualized Base Rent is monthly scheduled rent as of January 1, 2015 (cash basis), multiplied by 12. |
| (3) | Includes month-to-month leases. As of January 31, 2015 month-to-month leases accounted for 8,961 square feet. |
| (4) | Includes month-to-month leases. As of January 31, 2015 month-to-month leases accounted for 309,338 square feet. |
| (5) | The Industrial segment has no month-to-month leases in place as of January 31, 2015. |
| (6) | Includes month-to-month leases. As of January 31, 2015 month-to-month leases accounted for 24,669 square feet. |
| (7) | Includes month-to-month leases. As of January 31, 2015 month-to-month leases accounted for 342,968 square feet. |
INVESTORS REAL ESTATE TRUST AND SUBSIDIARIES
FISCAL 2015 ACQUISITION SUMMARY
as of January 31, 2015
(dollars in thousands)
| Property | | Location | | Property Type | | Acquisition Date | Square Feet/Units | Occupancy At Acquisition | January 31, 2015 Occupancy | Acquisition Cost |
| | | | | | | | | | | | |
| Creekside Crossing | | Bismarck, ND | | Unimproved Land | | May 22, 2014 | n/a | n/a | n/a | $ | 4,269 |
| Homestead Garden | | Rapid City, SD | | Multi-Family Residential | | June 2, 2014 | 152 | 96.7% | 94.1% | | 15,000 |
| Silver Springs | | Rapid City, SD | | Multi-Family Residential | | June 2, 2014 | 52 | 98.0% | 86.5% | | 3,280 |
| PrairieCare Medical | | Brooklyn Park, MN | | Unimproved Land | | June 5, 2014 | n/a | n/a | n/a | | 2,616 |
71 France Phase I(1) | | Edina, MN | | Unimproved Land | | June 12, 2014 | n/a | n/a | n/a | | 1,413 |
Northridge(2) | | Bismarck, ND | | Multi-Family Residential | | September 12, 2014 | 68 | 55.9% | 95.6% | | 8,500 |
Monticello 7th Addition | | Monticello, MN | | Unimproved Land | | October 9, 2014 | n/a | n/a | n/a | | 1,660 |
71 France Phase II & III(1) | | Edina, MN | | Unimproved Land | | November 4, 2014 | n/a | n/a | n/a | | 3,309 |
Minot 1525 24th Ave SW | | Minot, ND | | Unimproved Land | | December 23,2014 | n/a | n/a | n/a | | 1,250 |
| | | | | | | Total Square Feet | 0 | | | $ | 41,297 |
| | | | | | | Total Units | 272 | | | | |
| (1) | Land is owned by a joint venture in which the Company will have an approximately 52.6% interest after the development project is completed. The joint venture is consolidated in IRET's financial statements. |
| (2) | Newly constructed project was purchased from developer and was still in lease-up at time of acquisition. |
INVESTORS REAL ESTATE TRUST AND SUBSIDIARIES
FISCAL 2015 DEVELOPMENT PLACED IN SERVICE SUMMARY
as of January 31, 2015
(dollars in thousands)
Property(1) | | Location | | Segment Type | | Date Placed in Service | Square Feet/Units | Occupancy At Date Placed in Service | January 31, 2015 Occupancy | Development Cost |
| | | | | | | | | | | | |
Dakota Commons(2) | | Williston, ND | | Multi-Family Residential | | July 15, 2014 | 44 | 40.9% | 100% | $ | 10,419 |
Minot Wells Fargo Bank(3) | | Minot, ND | | Retail | | November 10, 2014 | 4,998 | 100% | 100% | | 3,185 |
Red 20(4) | | Minneapolis, MN | | Multi-Family Residential | | November 21, 2014 | 130 | 29.2% | 55.4% | | 28,330 |
Commons at Southgate(5) | | Minot, ND | | Multi-Family Residential | | December 9, 2014 | 233 | 75.1% | 85.8% | | 34,612 |
Cypress Court II(6) | | St. Cloud, MN | | Multi-Family Residential | | January 1, 2015 | 64 | 50.0% | 50.0% | | 6,638 |
Arcata(7) | | Golden Valley, MN | | Multi-Family Residential | | January 1, 2015 | 165 | 9.1% | 9.1% | | 30,384 |
| | | | | | | Total Square Feet | 4,998 | | | $ | 113,568 |
| | | | | | | Total Units | 636 | | | | |
| (1) | Development projects that are placed in service in phases are excluded from this table until the entire project has been placed in service. See Note 6 for additional information on the Renaissance Heights project, which was partially placed in service during the fiscal year 2014 and the nine months ended January 31, 2015. |
| (2) | Development property placed in service July 15, 2014. Costs paid in fiscal year 2014 totaled $8.1 million, including the land acquired in fiscal year 2013. Additional costs paid in fiscal year 2015 totaled $2.3 million, for a total project cost at January 31, 2015 of $10.4 million. |
| (3) | Development property placed in service November 21, 2014. Costs paid in fiscal year 2014 totaled $12.2 million. Additional costs paid in fiscal year 2015 totaled $16.1 million, for a total project cost at January 31, 2015 of $28.3 million. The project is owned by a joint venture entity in which the Company has an approximately 58.6% interest. The joint venture is consolidated in IRET's financial statements. |
| (4) | Development property placed in service December 9, 2014. Costs paid in fiscal years 2013 and 2014 totaled $5.9 million and $20.6 million, respectively. Additional costs paid in fiscal year 2015 totaled $8.1 million, for a total project cost at January 31, 2015 of $34.6 million. The project is owned by a joint venture entity in which the Company has an approximately 52.9% interest. The joint venture is consolidated in IRET's financial statements. |
| (5) | Development property placed in service January 1, 2015. Costs paid in fiscal year 2014 totaled $1.2 million. Additional costs paid in fiscal year 2015 totaled $5.5 million, for a total project cost at January 31, 2015 of $6.6 million. The project is owned by a joint venture entity in which the Company has an approximately 86.1% interest. The joint venture is consolidated in IRET's financial statements. |
| (6) | Development property placed in service January 1, 2015. Costs paid in fiscal years 2013 and 2014 totaled $2.7 million and $8.6 million, respectively. Additional costs paid in fiscal year 2015 totaled $19.1 million, for a total project cost at January 31, 2015 of $30.4 million. |
| (7) | Development property placed in service November 10, 2014. Costs paid in fiscal year 2015 totaled $3.2 million, including land acquired in fiscal year 2013. |
INVESTORS REAL ESTATE TRUST AND SUBSIDIARIES
FISCAL 2015 DEVELOPMENT IN PROGESS SUMMARY
as of January 31, 2015
(dollars in thousands)
| | | | | (in thousands) | (in fiscal years) |
| Project Name and Location | Planned Segment | Rentable Square Feet or Number of Units | Percentage Leased or Committed | Anticipated Total Cost | Costs as of January 31, 2015(1) | Anticipated Construction Completion |
| Roseville 3075 Long Lake Rd - Roseville, MN | Industrial | 202,807 sq ft | 5.4% | | 13,915 | | 8,900 | 4Q 2015 |
| Minot Office Center - Minot, ND | Retail | 7,963 sq ft | 0% | | 2,923 | | 1,802 | 1Q 2016 |
Renaissance Heights - Williston, ND(2) | Multi-Family Residential | 288 units | 46.9% | | 62,362 | | 54,713 | 1Q 2016 |
| Chateau II - Minot, ND | Multi-Family Residential | 72 units | 0% | | 14,711 | | 11,257 | 1Q 2016 |
| Edina 6565 France SMC III - Edina, MN | Healthcare | 57,479 sq ft | 24.2% | | 34,665 | | 16,668 | 1Q 2016 |
| Cardinal Point - Grand Forks, ND | Multi-Family Residential | 251 units | 0% | | 40,042 | | 19,885 | 2Q 2016 |
| Deer Ridge – Jamestown, ND | Multi-Family Residential | 163 units | 4.9% | | 24,519 | | 11,202 | 2Q 2016 |
| PrairieCare Medical - Brooklyn Park, MN | Healthcare | 72,895 sq ft | 100% | | 24,251 | | 12,195 | 2Q 2016 |
71 France Phases I & II- Edina, MN(3) | Multi-Family Residential | 181 units | 0% | | 52,055 | | 20,787 | 3Q 2016 |
| Other | n/a | n/a | n/a | | n/a | | 2,547 | n/a |
| | | | | $ | 379,870 | $ | 263,105 | |
| (1) | Includes costs related to development projects that are placed in service in phases (Renaissance Heights - $46.0 million). |
| (2) | The Company is an approximately 70% partner in the joint venture entity constructing this project; the anticipated total cost amount given is the total cost to the joint venture entity. |
| (3) | The project will be constructed in three phases by a joint venture entity in which the Company has an approximately 52.6% interest. The anticipated total cost amount given in the table above is the total cost to the joint venture entity of the project's first and second phase. The expected total project cost for all three phases is approximately $73.3 million for a total of approximately 241 residential units and approximately 21,772 square feet of retail space. |
INVESTORS REAL ESTATE TRUST AND SUBSIDIARIES
ACQUISITIONS AND DEVELOPMENT LIQUIDITY PROFILE
as of January 31, 2015
(in millions)
| Sources of Liquidity | | Liquidity Needs |
| Liquidity Source | Amount | | Liquidity Need | Amount |
Cash on balance sheet as of 1/31/15(1) | $ 52 | | Acquisitions | $ 24 |
Line of credit availability(2) | $ 40 | | Development | $ 32 |
Disposition proceeds(3) | $ 34 | | | |
| Estimated new debt on acquisitions | $ 17 | | | |
| Total Potential Liquidity | $ 143 | | Total Liquidity Needs | $ 56 |
| Excess Liquidity / (Need) | $ 87 | | | |
| | | | | |
| Capital Sources |
| Nine Months Ended 1/31/15 | | FY2014 |
| Capital Source | Proceeds Generated | | Capital Source | Proceeds Generated |
Sale of common shares under dividend
reinvestment and share purchase plan | $ 39 | | Sale of common shares under dividend
reinvestment and share purchase plan | $ 41 |
Proceeds from sales of real estate and
discontinued operations | $ 27 | | Proceeds from sales of real estate and
discontinued operations | $ 80 |
| Total Capital Generated | $ 66 | | Total Capital Generated | $ 121 |
| (1) | Includes compensating balances of $14 million |
| (2) | Line of credit of $90 million less $50 million drawn as of 01/31/15 |
| (3) | Disposition proceeds consists of $56 million of estimated gross proceeds, less estimated outstanding debt and estimated closing costs of $22 million from closed and pending sales for the period from 01/31/15 through 03/12/15. No assurances can be given that pending transactions will be completed on terms currently proposed, or at all. |
| (4) | Acquisitions amount consists of estimated gross costs for closed and pending acquisitions for the period from 01/31/15 through 03/12/15. No assurances can be given that pending transactions will be completed on terms currently proposed, or at all. |
| (5) | Development in progress of $380 million less construction loans closed or committed of $219 million = IRET equity required of $161 million. IRET equity required of $161 million less $129 million invested as of 01/31/15 = amount remaining to be invested of $32 million. |
Definitions
January 31, 2015
Adjusted EBITDA is earnings before interest, taxes, depreciation, amortization, gain/loss on sale of real estate and other investments, impairment of real estate investments, gain/loss on extinguishment of debt and gain/loss from involuntary conversion. We consider Adjusted EBITDA to be an appropriate supplemental performance measure because it permits investors to view income from operations without the effect of depreciation, the cost of debt, or non-operating gains and losses. Adjusted EBITDA is a non-GAAP measure. Adjusted EBITDA as calculated by us is not comparable to Adjusted EBITDA reported by other REITs that do not define Adjusted EBITDA exactly as we do.
Adjusted funds from operations (AFFO) is calculated by subtracting from Funds from operations (FFO) (1) tenant improvements and leasing costs at same-store properties, and recurring capital expenditures that are capitalized and amortized and are necessary to maintain our properties and revenue stream and (2) straight line rents, then adding (3) non-real estate depreciation and amortization and (4) share-based compensation expense. We may also subtract from FFO certain unusual non-recurring items that do not produce cash available for distribution to shareholders. Our calculation subtracts from FFO leasing commissions and tenant improvements at same-store properties only, since we consider tenant improvement and leasing cost levels at non-same-store properties unrepresentative of expected levels at same-store properties. Previously-reported AFFO amounts are not revised for changes in the composition of the same-store properties pool. AFFO is included herein because we consider it to be a measure of a REIT's ability to incur and service debt and to pay distributions to its shareholders. AFFO is a non-GAAP and non-standardized measure, and may be calculated differently by other REITs.
Annualized base rent (ABR) is calculated as monthly base rent (cash basis) per the lease, as of the reporting period, multiplied by 12.
Debt to total market capitalization is total debt from the balance sheet divided by the sum of total debt from the balance sheet plus the market value of shares outstanding at the end of the period.
Debt service coverage ratio is computed by dividing Adjusted EBITDA by interest expense and principal amortization.
Funds from operations (FFO) - The National Association of Real Estate Investment Trusts, Inc. (NAREIT) defines FFO as "net income (computed in accordance with generally accepted accounting principles, excluding gains (or losses) from sales of property, plus real estate depreciation and amortization, and adjustments for unconsolidated partnerships and joint ventures. Adjustments for unconsolidated partnerships and joint ventures will be calculated to reflect funds from operations on the same basis." In addition, in October 2011 NAREIT clarified its computation of FFO to exclude impairment charges for all periods presented. FFO is a non-GAAP measure. We consider FFO, which is a standard supplemental measure for equity real estate investment trusts, helpful to investors because it facilitates an understanding of the operating performance of properties without giving effect to impairment write-downs and to real estate depreciation and amortization, which assumes that the value of real estate assets diminishes predictably over time. Since real estate values instead historically rise or fall with market conditions, we believe that FFO provides investors and management with a more accurate indication of our financial and operating results.
Net Operating Income (NOI) is total real estate revenues and gain on involuntary conversion less real estate expenses (which consist of utilities, maintenance, real estate taxes, insurance and property management expenses). We believe that NOI is an important supplemental measure of operating performance for a REIT's operating real estate because it provides a measure of core operations that is unaffected by depreciation, amortization, financing and general and administrative expense. NOI does not represent cash generated by operating activities in accordance with GAAP and should not be considered an alternative to net income, net income available for common shareholders or cash flow from operating activities as a measure of financial performance.
Payout ratio (FFO per share and unit basis) - The ratio of the current quarterly or annual distribution rate per common share and unit divided by quarterly or annual FFO per share and unit.
Ratio of earnings to fixed charges - The ratio of earnings to fixed charges is computed by dividing earnings by fixed charges. For this purpose, earnings consist of income from continuing operations plus fixed charges and preferred distributions, less adjustments for noncontrolling interests - consolidated real estate entities, capitalized interest and preferred distributions. Fixed charges consist of mortgage and loan interest expense, whether expensed or capitalized, the amortization of debt expense and capitalized interest.
Ratio of earnings to combined fixed charges and preferred distributions - The ratio of earnings to combined fixed charges and preferred distributions is computed by dividing earnings by combined fixed charges and preferred distributions. For this purpose, earnings consist of income from continuing operations plus fixed charges and preferred distributions, less adjustments for noncontrolling interests - consolidated real estate entities, capitalized interest and preferred distributions. Combined fixed charges and preferred distributions consist of fixed charges (mortgage and loan interest expense, whether expensed or capitalized, the amortization of debt expense and capitalized interest) and preferred distributions.
Recurring capital expenditures are expenditures (excluding capital expenditures recoverable from tenants and capital expenditures at properties sold during the period) made on a regular or recurring basis to maintain a property's competitive position within its market, generally with a depreciable life of 5 to 12 years, but excluding (a) capital expenditures made in the year of acquisition and in subsequent periods until the property is classified as same-store (i.e., excluding capital expenditures on non-same-store properties), (b) improvements associated with the expansion or re-development of a building, (c) renovations to a building which change the underlying classification of the building (for example, from industrial to office or Class C office to Class A office) or (d) capital improvements that represent the addition of something new to a property, rather than the replacement of an existing item.
Scheduled rent revenue is the total possible revenue from all leasable units and square footage, with occupied space valued at contract rates pursuant to leases and vacant units or square footage at market rates.
Same-store properties are properties owned or in service for the entirety of the periods being compared (except for properties for which significant redevelopment or expansion occurred during either of the periods being compared, and properties sold or classified as held for sale), and, in the case of development or re-development properties, which have achieved a target level of occupancy of 90% for multi-family residential properties and 85% for office, healthcare, industrial and retail properties.