Supplemental Financial and Operating Data
April 30, 2016
|
|
|
|
| Page |
|
|
|
Company Background |
| 2 |
|
|
|
Property Cost by Segment and by State |
| 4 |
|
|
|
Key Financial Data |
|
|
Condensed Consolidated Balance Sheets |
| 5 |
Condensed Consolidated Statements of Operations |
| 6 |
Funds From Operations |
| 7 |
Adjusted EBITDA |
| 8 |
|
|
|
Capital Analysis |
|
|
Long-Term Mortgage Debt Analysis |
| 9 |
Long-Term Mortgage Debt Detail |
| 10 |
Capital Analysis |
| 11 |
|
|
|
Portfolio Analysis |
|
|
Same-Store Properties Net Operating Income Summary |
| 12 |
Net Operating Income Detail |
| 13-16 |
Same-Store Properties and All Properties Occupancy Levels by Segment |
| 17 |
|
|
|
Tenant Analysis |
|
|
Multifamily Summary |
| 18 |
Commercial Leasing Summary |
| 19-21 |
10 Largest Commercial Tenants - Based on Annualized Base Rent |
| 23 |
Commercial Lease Expirations |
| 23 |
|
|
|
Growth Analysis |
|
|
Acquisitions and Development Summary |
| 24 |
Acquisitions and Development Liquidity Profile |
| 25 |
|
|
|
Definitions |
| 26 |
1
Company Background
Fourth Quarter Fiscal 2016
We are a self-administered, equity real estate investment trust (REIT) investing in a portfolio of income-producing properties located primarily in the upper Midwest. Our portfolio consists of multifamily and healthcare segments.
As of April 30, 2016, we held for investment a portfolio of 146 properties consisting of 99 multifamily properties, 31 healthcare properties, and 16 other commercial properties. Our common shares, Series A preferred shares and Series B preferred shares are publicly traded on the New York Stock Exchange (NYSE symbols: IRET, IRETPR and IRETPRB, respectively).
Company Snapshot
(as of April 30, 2016)
Company Headquarters | Minot, North Dakota |
Fiscal Year-End | April 30 |
Reportable Segments | Multifamily and Healthcare |
Total Properties Held for Investment | 146 |
Total Units Held for Investment |
|
(multifamily properties) | 12,950 |
Total Square Feet Held for Investment |
|
(commercial properties) | 2.9 million |
Common Shares Outstanding (thousands) | 121,091 |
Limited Partnership Units Outstanding (thousands) | 16,285 |
Common Share Distribution - Quarter/Annualized | $0.13/$0.52 |
Dividend Yield | 8.6% |
Total Capitalization (see p.12 for detail) | $2.0 billion |
Investor Information
Board of Trustees
Jeffrey L. Miller | Trustee and Chairman |
John D. Stewart | Trustee, Vice Chairman, and Chair of Nominating and Governance Committee |
Jeffrey K. Woodbury | Trustee, Chair of Audit Committee |
Linda J. Hall | Trustee, Chair of Compensation Committee |
Jeffrey P. Caira | Trustee |
Michael T. Dance | Trustee |
Terrance P. Maxwell | Trustee |
John A. Schissel | Trustee |
Stephen L. Stenehjem | Trustee |
Timothy P. Mihalick | Trustee, President and Chief Executive Officer |
|
|
Management |
|
|
|
Timothy P. Mihalick | President and Chief Executive Officer; Trustee |
Diane K. Bryantt | Executive Vice President and Chief Operating Officer |
Ted E. Holmes | Executive Vice President and Chief Financial Officer |
Michael A. Bosh | Executive Vice President, General Counsel and Assistant Secretary |
Mark W. Reiling | Executive Vice President and Chief Investment Officer |
Andrew Martin | Senior Vice President, Residential Property Management |
Corporate Headquarters:
1400 31st Avenue SW, Suite 60
Post Office Box 1988
Minot, North Dakota 58702-1988
Trading Symbol for Common Shares: IRET
Stock Exchange Listing: NYSE
Investor Relations Contact:
Stephen Swett
203-682-8377
IR@iret.com
2
Common Share Data (NYSE: IRET)
|
|
|
|
|
|
|
|
|
|
|
|
|
|
|
|
|
|
| 4th Quarter |
| 3rd Quarter |
| 2nd Quarter |
| 1st Quarter |
| 4th Quarter |
| |||||
|
| Fiscal Year 2016 |
| Fiscal Year 2016 |
| Fiscal Year 2016 |
| Fiscal Year 2015 |
| Fiscal Year 2015 |
| |||||
High Closing Price |
| $ | 7.48 |
| $ | 8.39 |
| $ | 8.16 |
| $ | 7.44 |
| $ | 8.31 |
|
Low Closing Price |
| $ | 5.97 |
| $ | 6.24 |
| $ | 6.51 |
| $ | 6.93 |
| $ | 7.09 |
|
Average Closing Price |
| $ | 6.71 |
| $ | 7.35 |
| $ | 7.39 |
| $ | 7.22 |
| $ | 7.52 |
|
Closing Price at end of quarter |
| $ | 6.02 |
| $ | 6.52 |
| $ | 8.12 |
| $ | 7.21 |
| $ | 7.17 |
|
Common Share Distributions—annualized |
| $ | 0.52 |
| $ | 0.52 |
| $ | 0.52 |
| $ | 0.52 |
| $ | 0.52 |
|
Closing Dividend Yield - annualized |
|
| 8.6 | % |
| 8.0 | % |
| 6.4 | % |
| 7.2 | % |
| 7.3 | % |
Closing common shares outstanding (thousands) |
|
| 121,091 |
|
| 121,034 |
|
| 122,798 |
|
| 125,520 |
|
| 124,456 |
|
Closing limited partnership units outstanding (thousands) |
|
| 16,285 |
|
| 13,864 |
|
| 13,890 |
|
| 13,921 |
|
| 14,000 |
|
Closing market value of outstanding common shares, plus imputed closing market value of outstanding limited partnership units (thousands) |
| $ | 827,004 |
| $ | 879,535 |
| $ | 1,109,907 |
| $ | 1,005,370 |
| $ | 992,729 |
|
Certain statements in these supplemental disclosures are “forward-looking statements” within the meaning of the Private Securities Litigation Reform Act of 1995. Such statements involve known and unknown risks, uncertainties and other factors that may cause actual results to differ materially from projected results. Such risks, uncertainties and other factors include, but are not limited to: intentions and expectations regarding future distributions on our common shares and units, fluctuations in interest rates, the effect of government regulation, the availability of capital, changes in general and local economic and real estate market conditions, competition, our ability to attract and retain skilled personnel, and those risks and uncertainties detailed from time to time in our filings with the Securities and Exchange Commission, including our Form 10-K for fiscal year 2016. We assume no obligation to update or supplement forward-looking statements that become untrue because of subsequent events.
3
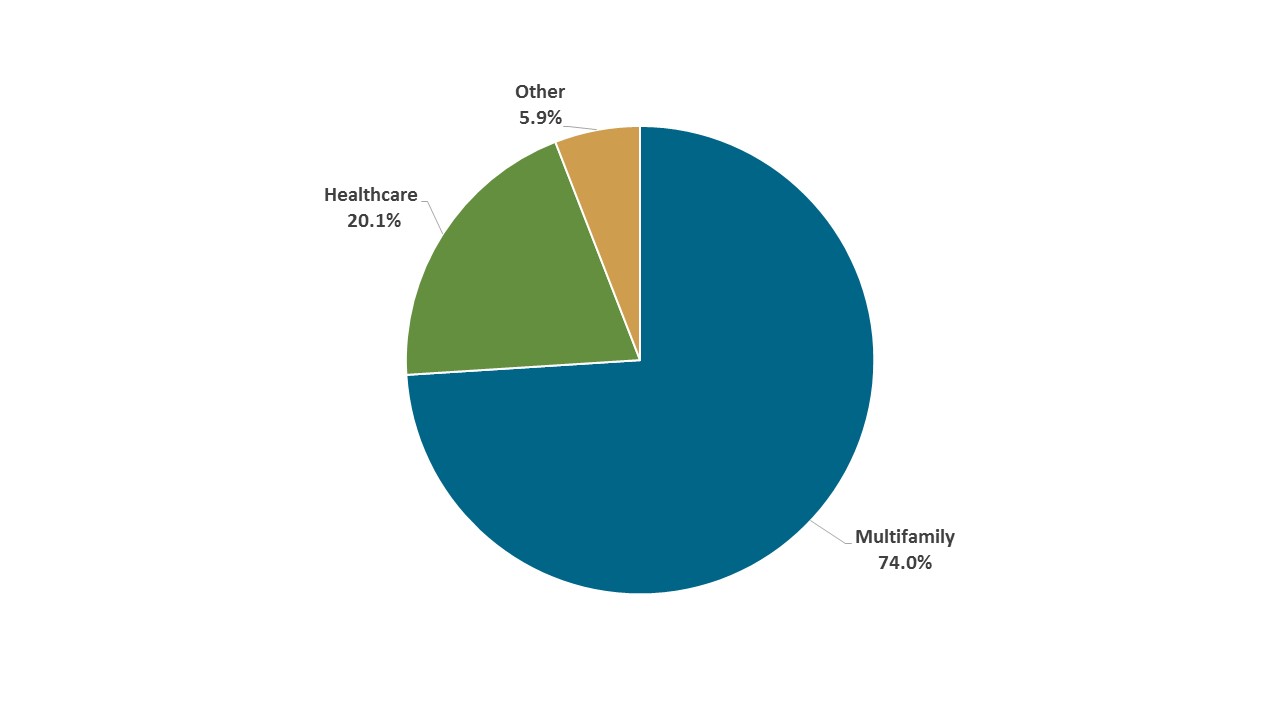
Fourth Quarter Fiscal 2016
Property Cost by Segment for Properties Held for Investment
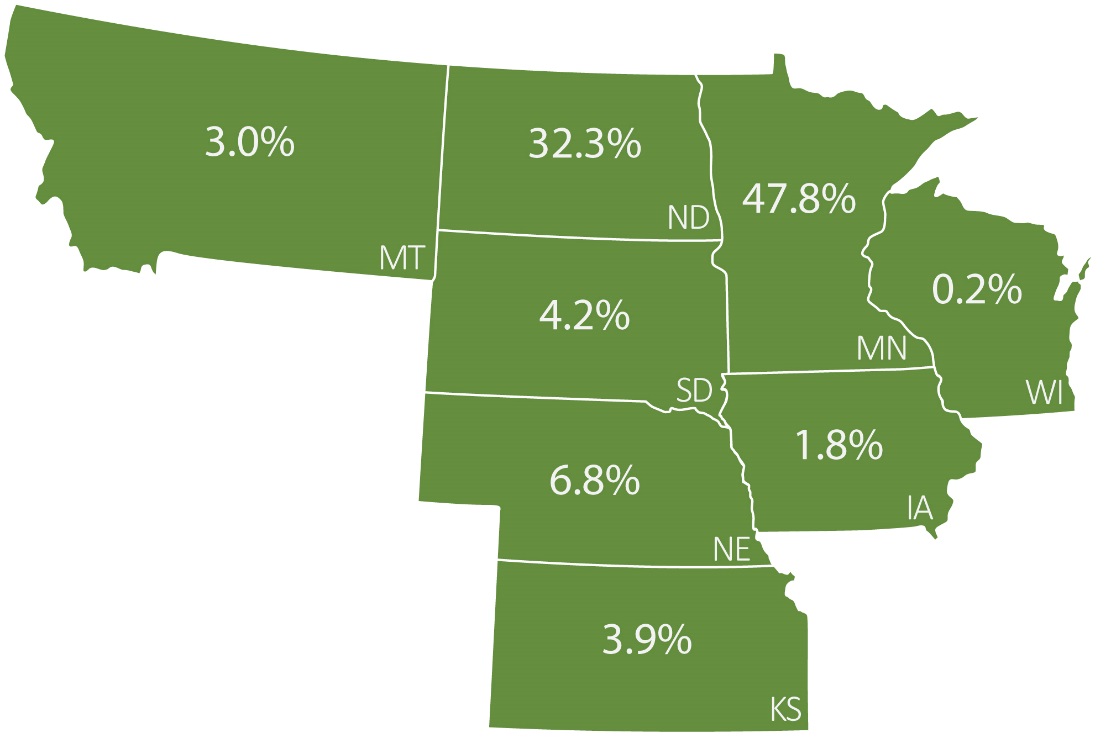
Percentage of Total Property Cost by State for Properties Held for Investment
4
INVESTORS REAL ESTATE TRUST AND SUBSIDIARIES
CONDENSED CONSOLIDATED BALANCE SHEETS (unaudited)
(in thousands)
|
|
|
|
|
|
|
|
|
|
|
|
|
|
|
|
|
|
| 4/30/2016 |
| 1/31/2016 |
| 10/31/2015 |
| 7/31/2015 |
| 4/30/2015 |
| |||||
ASSETS |
|
|
|
|
|
|
|
|
|
|
|
|
|
|
|
|
Real estate investments |
|
|
|
|
|
|
|
|
|
|
|
|
|
|
|
|
Property owned |
| $ | 1,681,471 |
| $ | 1,589,921 |
| $ | 1,552,448 |
| $ | 1,408,251 |
| $ | 1,335,687 |
|
Less accumulated depreciation |
|
| (312,889) |
|
| (308,876) |
|
| (296,927) |
|
| (290,269) |
|
| (279,417) |
|
|
|
| 1,368,582 |
|
| 1,281,045 |
|
| 1,255,521 |
|
| 1,117,982 |
|
| 1,056,270 |
|
Development in progress |
|
| 51,681 |
|
| 78,341 |
|
| 89,843 |
|
| 133,794 |
|
| 153,994 |
|
Unimproved land |
|
| 20,939 |
|
| 22,304 |
|
| 22,485 |
|
| 24,542 |
|
| 25,827 |
|
Total real estate investments |
|
| 1,441,202 |
|
| 1,381,690 |
|
| 1,367,849 |
|
| 1,276,318 |
|
| 1,236,091 |
|
Assets held for sale and assets of discontinued operations |
|
| 220,761 |
|
| 231,956 |
|
| 325,095 |
|
| 664,758 |
|
| 675,764 |
|
Cash and cash equivalents |
|
| 66,698 |
|
| 47,117 |
|
| 55,133 |
|
| 44,770 |
|
| 48,970 |
|
Other investments |
|
| 50 |
|
| 50 |
|
| 329 |
|
| 329 |
|
| 329 |
|
Receivable arising from straight-lining of rents, net of allowance |
|
| 7,179 |
|
| 6,662 |
|
| 6,185 |
|
| 5,905 |
|
| 6,504 |
|
Accounts receivable, net of allowance |
|
| 1,524 |
|
| 2,180 |
|
| 3,015 |
|
| 2,715 |
|
| 2,390 |
|
Real estate deposits |
|
| 0 |
|
| 1,250 |
|
| 444 |
|
| 6,614 |
|
| 2,489 |
|
Prepaid and other assets |
|
| 2,937 |
|
| 3,868 |
|
| 3,243 |
|
| 2,195 |
|
| 3,134 |
|
Intangible assets, net of accumulated amortization |
|
| 1,858 |
|
| 1,590 |
|
| 2,132 |
|
| 1,188 |
|
| 1,388 |
|
Tax, insurance, and other escrow |
|
| 5,450 |
|
| 7,221 |
|
| 6,752 |
|
| 8,227 |
|
| 9,499 |
|
Property and equipment, net of accumulated depreciation |
|
| 1,011 |
|
| 948 |
|
| 897 |
|
| 945 |
|
| 1,027 |
|
Goodwill |
|
| 1,680 |
|
| 1,697 |
|
| 1,697 |
|
| 1,718 |
|
| 1,718 |
|
Deferred charges and leasing costs, net of accumulated amortization |
|
| 9,827 |
|
| 9,580 |
|
| 9,182 |
|
| 8,991 |
|
| 8,534 |
|
TOTAL ASSETS |
| $ | 1,760,177 |
| $ | 1,695,809 |
| $ | 1,781,953 |
| $ | 2,024,673 |
| $ | 1,997,837 |
|
|
|
|
|
|
|
|
|
|
|
|
|
|
|
|
|
|
LIABILITIES, REDEEMABLE NONCONTROLLING INTERESTS AND EQUITY |
|
|
|
|
|
|
|
|
|
|
|
|
|
|
|
|
LIABILITIES |
|
|
|
|
|
|
|
|
|
|
|
|
|
|
|
|
Liabilities held for sale and liabilites of discontinued operations |
| $ | 77,712 |
| $ | 89,348 |
| $ | 223,918 |
| $ | 387,802 |
| $ | 401,299 |
|
Accounts payable and accrued expenses |
|
| 39,727 |
|
| 47,636 |
|
| 54,631 |
|
| 59,802 |
|
| 55,540 |
|
Revolving line of credit |
|
| 17,500 |
|
| 17,500 |
|
| 17,500 |
|
| 83,500 |
|
| 60,500 |
|
Mortgages payable |
|
| 817,324 |
|
| 692,788 |
|
| 659,348 |
|
| 599,348 |
|
| 596,965 |
|
Construction debt and other |
|
| 82,130 |
|
| 132,364 |
|
| 120,578 |
|
| 157,973 |
|
| 136,211 |
|
TOTAL LIABILITIES |
|
| 1,034,393 |
|
| 979,636 |
|
| 1,075,975 |
|
| 1,288,425 |
|
| 1,250,515 |
|
|
|
|
|
|
|
|
|
|
|
|
|
|
|
|
|
|
REDEEMABLE NONCONTROLLING INTERESTS – CONSOLIDATED REAL ESTATE ENTITIES |
|
| 7,522 |
|
| 7,244 |
|
| 7,105 |
|
| 6,361 |
|
| 6,368 |
|
EQUITY |
|
|
|
|
|
|
|
|
|
|
|
|
|
|
|
|
Investors Real Estate Trust shareholders’ equity |
|
|
|
|
|
|
|
|
|
|
|
|
|
|
|
|
Series A Preferred Shares of Beneficial Interest |
|
| 27,317 |
|
| 27,317 |
|
| 27,317 |
|
| 27,317 |
|
| 27,317 |
|
Series B Preferred Shares of Beneficial Interest |
|
| 111,357 |
|
| 111,357 |
|
| 111,357 |
|
| 111,357 |
|
| 111,357 |
|
Common Shares of Beneficial Interest |
|
| 922,084 |
|
| 924,658 |
|
| 936,893 |
|
| 957,707 |
|
| 951,868 |
|
Accumulated distributions in excess of net income |
|
| (442,000) |
|
| (434,388) |
|
| (455,508) |
|
| (452,971) |
|
| (438,432) |
|
Total Investors Real Estate Trust shareholders’ equity |
|
| 618,758 |
|
| 628,944 |
|
| 620,059 |
|
| 643,410 |
|
| 652,110 |
|
Noncontrolling interests – Operating Partnership |
|
| 78,484 |
|
| 58,254 |
|
| 55,957 |
|
| 56,120 |
|
| 58,325 |
|
Noncontrolling interests – consolidated real estate entities |
|
| 21,020 |
|
| 21,731 |
|
| 22,857 |
|
| 30,357 |
|
| 30,519 |
|
Total equity |
|
| 718,262 |
|
| 708,929 |
|
| 698,873 |
|
| 729,887 |
|
| 740,954 |
|
TOTAL LIABILITIES, REDEEMABLE NONCONTROLLING INTERESTS AND EQUITY |
| $ | 1,760,177 |
| $ | 1,695,809 |
| $ | 1,781,953 |
| $ | 2,024,673 |
| $ | 1,997,837 |
|
5
INVESTORS REAL ESTATE TRUST AND SUBSIDIARIES
CONDENSED CONSOLIDATED STATEMENTS OF OPERATIONS (unaudited)
(in thousands, except per share data)
|
|
|
|
|
|
|
|
|
|
|
|
|
|
|
|
|
|
|
|
|
|
|
|
|
| Twelve Months Ended |
| Three Months Ended |
| ||||||||||||||||||
OPERATING RESULTS |
| 4/30/2016 |
| 4/30/2015 |
|
| 4/30/2016 |
| 1/31/2016 |
| 10/31/2015 |
| 7/31/2015 |
| 4/30/2015 |
| |||||||
Real estate revenue |
| $ | 188,320 |
| $ | 179,321 |
|
| $ | 48,523 |
| $ | 48,406 |
| $ | 46,346 |
| $ | 45,045 |
| $ | 45,141 |
|
Real estate expenses |
|
| 79,100 |
|
| 73,137 |
|
|
| 20,524 |
|
| 20,321 |
|
| 19,951 |
|
| 18,304 |
|
| 18,544 |
|
Net operating income |
|
| 109,220 |
|
| 106,184 |
|
|
| 27,999 |
|
| 28,085 |
|
| 26,395 |
|
| 26,741 |
|
| 26,597 |
|
Depreciation/amortization |
|
| (49,832) |
|
| (42,784) |
|
|
| (13,517) |
|
| (12,693) |
|
| (12,405) |
|
| (11,217) |
|
| (11,180) |
|
Impairment of real estate investments |
|
| (5,543) |
|
| (4,663) |
|
|
| (2,223) |
|
| (162) |
|
| (1,873) |
|
| (1,285) |
|
| — |
|
General and administrative expenses |
|
| (11,267) |
|
| (11,824) |
|
|
| (2,951) |
|
| (2,929) |
|
| (2,933) |
|
| (2,454) |
|
| (2,516) |
|
Acquisition and investment related costs |
|
| (830) |
|
| (362) |
|
|
| (397) |
|
| (35) |
|
| (391) |
|
| (7) |
|
| (125) |
|
Other expenses |
|
| (2,231) |
|
| (1,647) |
|
|
| (950) |
|
| (51) |
|
| (813) |
|
| (417) |
|
| (207) |
|
Interest expense |
|
| (35,768) |
|
| (34,447) |
|
|
| (10,062) |
|
| (9,151) |
|
| (8,741) |
|
| (7,814) |
|
| (8,972) |
|
Loss on extinguishment of debt |
|
| (106) |
|
| — |
|
|
| — |
|
| — |
|
| (106) |
|
| — |
|
| — |
|
Interest and other income |
|
| 2,573 |
|
| 2,956 |
|
|
| 600 |
|
| 701 |
|
| 665 |
|
| 607 |
|
| 904 |
|
Income before income (loss) on sale of real estate and other investments and income (loss) from discontinued operations |
|
| 6,216 |
|
| 13,413 |
|
|
| (1,501) |
|
| 3,765 |
|
| (202) |
|
| 4,154 |
|
| 4,501 |
|
Income (loss) on sale of real estate and other investments |
|
| 9,640 |
|
| 6,093 |
|
|
| 8,369 |
|
| 1,446 |
|
| — |
|
| (175) |
|
| 6,904 |
|
Gain on bargain purchase |
|
| 3,424 |
|
| — |
|
|
| 3,424 |
|
| — |
|
| — |
|
| — |
|
| — |
|
Income from continuing operations |
|
| 19,280 |
|
| 19,506 |
|
|
| 10,292 |
|
| 5,211 |
|
| (202) |
|
| 3,979 |
|
| 11,405 |
|
Income (loss) from discontinued operations |
|
| 57,322 |
|
| 9,178 |
|
|
| 1,463 |
|
| 38,232 |
|
| 16,879 |
|
| 748 |
|
| 2,457 |
|
Net income |
| $ | 76,602 |
| $ | 28,684 |
|
| $ | 11,755 |
| $ | 43,443 |
| $ | 16,677 |
| $ | 4,727 |
| $ | 13,862 |
|
|
|
|
|
|
|
|
|
|
|
|
|
|
|
|
|
|
|
|
|
|
|
|
|
Net income attributable to noncontrolling interest – Operating Partnership |
|
| (7,032) |
|
| (1,526) |
|
|
| (1,092) |
|
| (4,227) |
|
| (1,527) |
|
| (186) |
|
| (908) |
|
Net loss (income) attributable to noncontrolling interests – consolidated real estate entities |
|
| 2,436 |
|
| (3,071) |
|
|
| 340 |
|
| 581 |
|
| 1,516 |
|
| (1) |
|
| (2,201) |
|
Net income attributable to Investors Real Estate Trust |
|
| 72,006 |
|
| 24,087 |
|
|
| 11,003 |
|
| 39,797 |
|
| 16,666 |
|
| 4,540 |
|
| 10,753 |
|
Dividends to preferred shareholders |
|
| (11,514) |
|
| (11,514) |
|
|
| (2,878) |
|
| (2,879) |
|
| (2,878) |
|
| (2,879) |
|
| (2,878) |
|
NET INCOME AVAILABLE TO COMMON SHAREHOLDERS |
| $ | 60,492 |
| $ | 12,573 |
|
| $ | 8,125 |
| $ | 36,918 |
| $ | 13,788 |
| $ | 1,661 |
| $ | 7,875 |
|
|
|
|
|
|
|
|
|
|
|
|
|
|
|
|
|
|
|
|
|
|
|
|
|
Per Share Data |
|
|
|
|
|
|
|
|
|
|
|
|
|
|
|
|
|
|
|
|
|
|
|
Earnings per common share from continuing operations – Investors Real Estate Trust – basic & diluted |
| $ | 0.08 |
| $ | 0.04 |
|
| $ | 0.06 |
| $ | 0.02 |
| $ | (0.01) |
| $ | 0.01 |
| $ | 0.05 |
|
Earnings (loss) per common share from discontinued operations – Investors Real Estate Trust – basic & diluted |
|
| 0.41 |
|
| 0.07 |
|
|
| 0.01 |
|
| 0.28 |
|
| 0.12 |
|
| — |
|
| 0.02 |
|
Net income per common share – basic & diluted |
| $ | 0.49 |
| $ | 0.11 |
|
| $ | 0.07 |
| $ | 0.30 |
| $ | 0.11 |
| $ | 0.01 |
| $ | 0.07 |
|
|
|
|
|
|
|
|
|
|
|
|
|
|
|
|
|
|
|
|
|
|
|
|
|
Percentage of Revenues |
|
|
|
|
|
|
|
|
|
|
|
|
|
|
|
|
|
|
|
|
|
|
|
Real estate expenses |
|
| 42.0 | % |
| 40.8 | % |
|
| 42.3 | % |
| 42.0 | % |
| 43.0 | % |
| 40.6 | % |
| 41.1 | % |
Depreciation/amortization |
|
| 26.5 | % |
| 23.9 | % |
|
| 27.9 | % |
| 26.2 | % |
| 26.8 | % |
| 24.9 | % |
| 24.8 | % |
General and administrative expenses |
|
| 6.0 | % |
| 6.6 | % |
|
| 6.8 | % |
| 6.1 | % |
| 6.3 | % |
| 5.4 | % |
| 5.6 | % |
Interest |
|
| 19.0 | % |
| 19.2 | % |
|
| 20.7 | % |
| 18.9 | % |
| 18.9 | % |
| 17.3 | % |
| 19.9 | % |
Income (loss) from discontinued operations |
|
| 30.4 | % |
| 5.1 | % |
|
| 3.0 | % |
| 79.0 | % |
| 36.4 | % |
| 1.7 | % |
| 5.4 | % |
Net income |
|
| 40.7 | % |
| 16.0 | % |
|
| 25.1 | % |
| 89.7 | % |
| 36.0 | % |
| 10.5 | % |
| 30.7 | % |
|
|
|
|
|
|
|
|
|
|
|
|
|
|
|
|
|
|
|
|
|
|
|
|
Ratios |
|
|
|
|
|
|
|
|
|
|
|
|
|
|
|
|
|
|
|
|
|
|
|
Adjusted EBITDA(1)/Interest expense |
|
| 2.54 | x |
| 2.63 | x |
|
| 2.76 | x |
| 2.29 | x |
| 2.08 | x |
| 2.28 | x |
| 2.41 | x |
Adjusted EBITDA(1)/Interest expense plus preferred distributions |
|
| 2.10 | x |
| 2.20 | x |
|
| 2.23 | x |
| 1.92 | x |
| 1.74 | x |
| 1.95 | x |
| 2.05 | x |
(1) | See Definitions on page 27. Adjusted EBITDA is a non-GAAP measure; see page 8 for a reconciliation of Adjusted EBITDA to net income. |
6
INVESTORS REAL ESTATE TRUST AND SUBSIDIARIES
FUNDS FROM OPERATIONS (unaudited)
(in thousands, except per share and unit data)
|
|
|
|
|
|
|
|
|
|
|
|
|
|
|
|
|
|
|
|
|
|
|
|
|
| Twelve Months Ended |
|
| Three Months Ended |
| |||||||||||||||||
|
| 4/30/2016 |
| 4/30/2015 | �� |
| 4/30/2016 |
| 1/31/2016 |
| 10/31/2015 |
| 7/31/2015 |
| 4/30/2015 |
| |||||||
Funds From Operations(1) |
|
|
|
|
|
|
|
|
|
|
|
|
|
|
|
|
|
|
|
|
|
|
|
Net income attributable to Investors Real Estate Trust |
| $ | 72,006 |
| $ | 24,087 |
|
| $ | 11,003 |
| $ | 39,797 |
| $ | 16,666 |
| $ | 4,540 |
| $ | 10,753 |
|
Less dividends to preferred shareholders |
|
| (11,514) |
|
| (11,514) |
|
|
| (2,878) |
|
| (2,879) |
|
| (2,878) |
|
| (2,879) |
|
| (2,878) |
|
Net income available to common shareholders |
|
| 60,492 |
|
| 12,573 |
|
|
| 8,125 |
|
| 36,918 |
|
| 13,788 |
|
| 1,661 |
|
| 7,875 |
|
Adjustments: |
|
|
|
|
|
|
|
|
|
|
|
|
|
|
|
|
|
|
|
|
|
|
|
Noncontrolling interests – Operating Partnership |
|
| 7,032 |
|
| 1,526 |
|
|
| 1,092 |
|
| 4,227 |
|
| 1,527 |
|
| 186 |
|
| 908 |
|
Depreciation and amortization of real properyty |
|
| 63,789 |
|
| 70,450 |
|
|
| 15,694 |
|
| 14,975 |
|
| 14,860 |
|
| 18,259 |
|
| 18,083 |
|
Impairment of real estate investments |
|
| 5,983 |
|
| 6,105 |
|
|
| 2,223 |
|
| 162 |
|
| 1,873 |
|
| 1,725 |
|
| — |
|
(Gain) loss on depreciable property sales |
| $ | (33,422) |
| $ | (4,079) |
|
|
| (7,910) |
|
| (1,778) |
|
| (23,909) |
|
| 175 |
|
| (4,890) |
|
FFO applicable to common shares and Units(2) |
|
| 103,874 |
|
| 86,575 |
|
| $ | 19,224 |
| $ | 54,504 |
| $ | 8,139 |
| $ | 22,006 |
| $ | 21,976 |
|
|
|
|
|
|
|
|
|
|
|
|
|
|
|
|
|
|
|
|
|
|
|
|
|
FFO per share and unit - basic and diluted |
| $ | 0.76 |
| $ | 0.64 |
|
| $ | 0.14 |
| $ | 0.40 |
| $ | 0.06 |
| $ | 0.16 |
| $ | 0.16 |
|
|
|
|
|
|
|
|
|
|
|
|
|
|
|
|
|
|
|
|
|
|
|
|
|
Adjusted funds from operations(1) |
|
|
|
|
|
|
|
|
|
|
|
|
|
|
|
|
|
|
|
|
|
|
|
FFO applicable to common shares and Units |
| $ | 103,874 |
| $ | 86,575 |
|
| $ | 19,224 |
| $ | 54,504 |
| $ | 8,139 |
| $ | 22,006 |
| $ | 21,976 |
|
Adjustments: |
|
|
|
|
|
|
|
|
|
|
|
|
|
|
|
|
|
|
|
|
|
|
|
Tenant improvements at same-store(3) properties |
|
| (1,509) |
|
| (7,589) |
|
|
| (778) |
|
| (383) |
|
| (157) |
|
| (191) |
|
| (2,939) |
|
Leasing costs at same-store properties(3) |
|
| (587) |
|
| (2,290) |
|
|
| (89) |
|
| (102) |
|
| (59) |
|
| (336) |
|
| (684) |
|
Recurring capital expenditures(1)(3) |
|
| (5,553) |
|
| (6,135) |
|
|
| (825) |
|
| (1,406) |
|
| (1,713) |
|
| (1,636) |
|
| (1,342) |
|
Straight-line rents |
|
| (859) |
|
| 12 |
|
|
| (238) |
|
| (554) |
|
| (309) |
|
| 242 |
|
| 198 |
|
Non-real estate depreciation |
|
| 354 |
|
| 388 |
|
|
| 93 |
|
| 80 |
|
| 80 |
|
| 101 |
|
| 100 |
|
Acquisition costs(4) |
|
| 253 |
|
| 112 |
|
|
| 91 |
|
| 9 |
|
| 153 |
|
| — |
|
| 112 |
|
Default interest |
|
| 4,683 |
|
| 528 |
|
|
| — |
|
| 1,566 |
|
| 1,567 |
|
| 1,550 |
|
| 528 |
|
(Gain) loss on extinguishment of debt |
|
| (29,230) |
|
| — |
|
|
| — |
|
| (36,456) |
|
| 7,226 |
|
| — |
|
| — |
|
Gain on bargain purchase |
|
| (3,424) |
|
| — |
|
|
| (3,424) |
|
| — |
|
| — |
|
| — |
|
| — |
|
Share-based compensation expense |
|
| 2,256 |
|
| 2,215 |
|
|
| 864 |
|
| 787 |
|
| 539 |
|
| 66 |
|
| 280 |
|
AFFO applicable to common shares and Units |
| $ | 70,258 |
| $ | 73,816 |
|
| $ | 14,918 |
| $ | 18,045 |
| $ | 15,466 |
| $ | 21,802 |
| $ | 18,229 |
|
|
|
|
|
|
|
|
|
|
|
|
|
|
|
|
|
|
|
|
|
|
|
|
|
AFFO per share and unit - basic and diluted |
| $ | 0.51 |
| $ | 0.55 |
|
| $ | 0.11 |
| $ | 0.13 |
| $ | 0.11 |
| $ | 0.16 |
| $ | 0.13 |
|
|
|
|
|
|
|
|
|
|
|
|
|
|
|
|
|
|
|
|
|
|
|
|
|
Weighted average shares and units |
|
| 137,372 |
|
| 134,598 |
|
|
| 136,438 |
|
| 135,741 |
|
| 138,565 |
|
| 138,806 |
|
| 137,412 |
|
(1) | See Definitions on page 27. |
(2) | Excluding gain or loss on extinguishment of debt and default interest, FFO would have been $15.8 million and $0.12 per share and unit for the three months ended April 30, 2016 and $75.9 million and $0.55 per share and unit for the twelve months ended April 30, 2016. |
(3) | Quarterly information is for properties in the same-store pool at that point in time; consequently, quarterly numbers may not total to year-to-date numbers. |
(4) | Twelve months ended 4/30/15 and three months ended 7/31/15 and 4/30/15 revised to include acquisition costs. |
7
INVESTORS REAL ESTATE TRUST AND SUBSIDIARIES
ADJUSTED EARNINGS BEFORE INTEREST, TAXES, DEPRECIATION AND AMORTIZATION (ADJUSTED EBITDA) (unaudited)
(in thousands)
|
|
|
|
|
|
|
|
|
|
|
|
|
|
|
|
|
|
|
|
|
|
|
|
|
| Twelve Months Ended |
|
| Three Months Ended |
| |||||||||||||||||
|
| 4/30/2016 |
| 4/30/2015 |
|
| 4/30/2016 |
| 1/31/2016 |
| 10/31/2015 |
| 7/31/2015 |
| 4/30/2015 |
| |||||||
Adjusted EBITDA(1) |
|
|
|
|
|
|
|
|
|
|
|
|
|
|
|
|
|
|
|
|
|
|
|
Net income attributable to Investors Real Estate Trust |
| $ | 72,006 |
| $ | 24,087 |
|
| $ | 11,003 |
| $ | 39,797 |
| $ | 16,666 |
| $ | 4,540 |
| $ | 10,753 |
|
Adjustments: |
|
|
|
|
|
|
|
|
|
|
|
|
|
|
|
|
|
|
|
|
|
|
|
Noncontrolling interests – Operating Partnership |
|
| 7,032 |
|
| 1,526 |
|
|
| 1,092 |
|
| 4,227 |
|
| 1,527 |
|
| 186 |
|
| 908 |
|
Income before noncontrolling interests – Operating Partnership |
|
| 79,038 |
|
| 25,613 |
|
|
| 12,095 |
|
| 44,024 |
|
| 18,193 |
|
| 4,726 |
|
| 11,661 |
|
Add: |
|
|
|
|
|
|
|
|
|
|
|
|
|
|
|
|
|
|
|
|
|
|
|
Interest expense |
|
| 54,174 |
|
| 59,020 |
|
|
| 11,475 |
|
| 13,976 |
|
| 13,762 |
|
| 14,961 |
|
| 15,162 |
|
(Gain) loss on extinguishment of debt |
|
| (29,230) |
|
| — |
|
|
| — |
|
| (36,456) |
|
| 7,226 |
|
| — |
|
| — |
|
Depreciation/amortization related to real estate investments |
|
| 63,998 |
| �� | 70,607 |
|
|
| 15,765 |
|
| 15,024 |
|
| 14,903 |
|
| 18,306 |
|
| 18,133 |
|
Amortization related to real estate revenues(2) |
|
| 146 |
|
| 231 |
|
|
| 23 |
|
| 31 |
|
| 38 |
|
| 54 |
|
| 50 |
|
Impairment of real estate investments |
|
| 5,983 |
|
| 6,105 |
|
|
| 2,223 |
|
| 162 |
|
| 1,873 |
|
| 1,725 |
|
| — |
|
Less: |
|
|
|
|
|
|
|
|
|
|
|
|
|
|
|
|
|
|
|
|
|
|
|
Interest income |
|
| (2,257) |
|
| (2,238) |
|
|
| (570) |
|
| (566) |
|
| (565) |
|
| (556) |
|
| (557) |
|
(Gain) loss on sale of real estate and other investments |
|
| (34,193) |
|
| (4,079) |
|
|
| (7,911) |
|
| (1,777) |
|
| (24,680) |
|
| 175 |
|
| (4,890) |
|
Adjusted EBITDA |
| $ | 137,659 |
| $ | 155,259 |
|
|
| 33,100 |
|
| 34,418 |
|
| 30,750 |
|
| 39,391 |
|
| 39,559 |
|
(1) | See Definitions on page 27. |
(2) | Included in real estate revenue in the Statement of Operations. |
8
INVESTORS REAL ESTATE TRUST AND SUBSIDIARIES
LONG-TERM MORTGAGE DEBT* ANALYSIS
(in thousands)
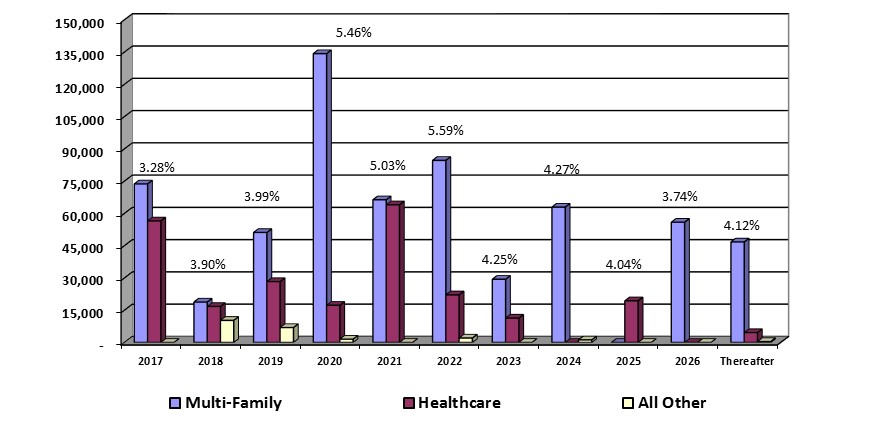
Debt Maturity Schedule
Annual Expirations
Total Mortgage Debt*
|
|
|
|
|
|
|
|
|
|
|
|
|
|
|
|
| Future Maturities of Mortgage Debt(1) |
| |||||||||||
|
|
|
|
|
|
|
|
|
|
| Weighted |
| % of |
|
Fiscal Year |
| Fixed Debt |
| Variable Debt |
| Total Debt |
| Average(2) |
| Total Debt |
| |||
2017 |
| $ | 64,832 |
| $ | 65,341 |
| $ | 130,173 |
| 3.28 | % | 14.7 | % |
2018 |
|
| 17,771 |
|
| 27,982 |
|
| 45,753 |
| 3.90 | % | 5.2 | % |
2019 |
|
| 34,121 |
|
| 52,210 |
|
| 86,331 |
| 3.99 | % | 9.7 | % |
2020 |
|
| 101,773 |
|
| 51,268 |
|
| 153,041 |
| 5.46 | % | 17.3 | % |
2021 |
|
| 130,335 |
|
| — |
|
| 130,335 |
| 5.03 | % | 14.7 | % |
2022 |
|
| 108,805 |
|
| — |
|
| 108,805 |
| 5.59 | % | 12.3 | % |
2023 |
|
| 40,670 |
|
| — |
|
| 40,670 |
| 4.25 | % | 4.6 | % |
2024 |
|
| 64,080 |
|
| — |
|
| 64,080 |
| 4.27 | % | 7.2 | % |
2025 |
|
| 19,365 |
|
| — |
|
| 19,365 |
| 4.04 | % | 2.2 | % |
2026 |
|
| 55,890 |
|
| — |
|
| 55,890 |
| 3.74 | % | 6.3 | % |
Thereafter |
|
| 51,704 |
|
| — |
|
| 51,704 |
| 4.12 | % | 5.8 | % |
Total maturities |
| $ | 689,346 |
| $ | 196,801 |
| $ | 886,147 |
| 4.54 | % | 100.0 | % |
(1) | Includes mortgages on properties held for sale. |
(2) | Weighted average interest rate of debt that matures in fiscal year. |
|
|
|
|
|
|
|
|
|
|
|
|
|
|
|
|
|
|
| 4/30/2016 |
| 1/31/2016 |
| 10/31/2015 |
| 7/31/2015 |
| 4/30/2015 |
| |||||
Balances Outstanding(1) |
|
|
|
|
|
|
|
|
|
|
|
|
|
|
|
|
Mortgage |
|
|
|
|
|
|
|
|
|
|
|
|
|
|
|
|
Fixed rate |
| $ | 689,346 |
| $ | 682,312 |
| $ | 920,234 |
| $ | 1,106,257 |
| $ | 1,054,455 |
|
Variable rate |
|
| 196,801 |
|
| 89,994 |
|
| 89,826 |
|
| 82,664 |
|
| 69,967 |
|
Mortgage total |
| $ | 886,147 |
| $ | 772,306 |
| $ | 1,010,060 |
| $ | 1,188,921 |
| $ | 1,124,422 |
|
|
|
|
|
|
|
|
|
|
|
|
|
|
|
|
|
|
Weighted Average Interest Rates Secured |
|
| 4.54 | % |
| 4.83 | % |
| 5.04 | % |
| 5.12 | % |
| 5.16 | % |
(1) | Includes mortgages on properties held for sale. |
9
INVESTORS REAL ESTATE TRUST AND SUBSIDIARIES
LONG-TERM MORTGAGE DEBT* DETAIL AS OF APRIL 30, 2016
(in thousands)
|
|
|
|
|
|
|
|
|
|
|
|
|
|
|
|
|
|
|
|
|
|
Property |
| Maturity Date |
| Fiscal 2017 |
| Fiscal 2018 |
| Fiscal 2019 |
| Fiscal 2020 |
| Thereafter |
| Total(1) |
| ||||||
|
|
|
|
|
|
|
|
|
|
|
|
|
|
|
|
|
|
|
|
|
|
Multifamily |
|
|
|
|
|
|
|
|
|
|
|
|
|
|
|
|
|
|
|
|
|
Pebble Springs – Bismarck, ND |
| 7/1/2016 |
| $ | 738 |
| $ | — |
| $ | — |
| $ | — |
| $ | — |
| $ | 738 |
|
Southview – Minot, ND |
| 7/1/2016 |
|
| 1,009 |
|
| — |
|
| — |
|
| — |
|
| — |
|
| 1,009 |
|
Homestead Gardens I – Rapid City, SD(2) |
| 7/11/2016 |
|
| 6,553 |
|
| — |
|
| — |
|
| — |
|
| — |
|
| 6,553 |
|
Commons at Southgate-Minot, ND |
| 9/1/2016 |
|
| 21,760 |
|
| — |
|
| — |
|
| — |
|
| — |
|
| 21,760 |
|
Landing at Southgate-Minot, ND |
| 9/1/2016 |
|
| 10,240 |
|
| — |
|
| — |
|
| — |
|
| — |
|
| 10,240 |
|
Arcata Apartments-Golden Valley, MN |
| 2/15/2017 |
|
| 23,321 |
|
| — |
|
| — |
|
| — |
|
| — |
|
| 23,321 |
|
Williston Garden - Williston, ND |
| 4/30/2017 |
|
| 7,550 |
|
| — |
|
| — |
|
| — |
|
| — |
|
| 7,550 |
|
Williston Garden - Williston, ND |
| 4/30/2017 |
|
| 2,520 |
|
| — |
|
| — |
|
| — |
|
| — |
|
| 2,520 |
|
River Ridge – Bismarck, ND |
| 6/30/2017 |
|
| — |
|
| 13,000 |
|
| — |
|
| — |
|
| — |
|
| 13,000 |
|
Evergreen II – Isanti, MN |
| 11/1/2017 |
|
| — |
|
| 2,020 |
|
| — |
|
| — |
|
| — |
|
| 2,020 |
|
Ponds – Sartell, MN |
| 11/1/2017 |
|
| — |
|
| 3,749 |
|
| — |
|
| — |
|
| — |
|
| 3,749 |
|
Homestead Gardens II - Rapid City, SD |
| 6/1/2018 |
|
| — |
|
| — |
|
| 3,282 |
|
| — |
|
| — |
|
| 3,282 |
|
Plaza - Minot, ND |
| 8/1/2018 |
|
| — |
|
| — |
|
| 5,212 |
|
| — |
|
| — |
|
| 5,212 |
|
Greenfield - Omaha, NE |
| 2/1/2019 |
|
| — |
|
| — |
|
| 3,503 |
|
| — |
|
| — |
|
| 3,503 |
|
Brooklyn Heights - Minot, ND |
| 4/1/2019 |
|
| — |
|
| — |
|
| 636 |
|
| — |
|
| — |
|
| 636 |
|
Colton Heights - Minot, ND |
| 4/1/2019 |
|
| — |
|
| — |
|
| 358 |
|
| — |
|
| — |
|
| 358 |
|
Pines - Minot, ND |
| 4/1/2019 |
|
| — |
|
| — |
| �� | 102 |
|
| — |
|
| — |
|
| 102 |
|
Summit Park - Minot, ND |
| 4/1/2019 |
|
| — |
|
| — |
|
| 882 |
|
| — |
|
| — |
|
| 882 |
|
Terrace Heights - Minot, ND |
| 4/1/2019 |
|
| — |
|
| — |
|
| 147 |
|
| — |
|
| — |
|
| 147 |
|
Avalon Cove-Rochester, MN |
| 4/5/2019 |
|
| — |
|
| — |
|
| 25,900 |
|
| — |
|
| — |
|
| 25,900 |
|
Crystal Bay-Rochester, MN |
| 4/5/2019 |
|
| — |
|
| — |
|
| 8,000 |
|
| — |
|
| — |
|
| 8,000 |
|
French Creek-Rochester, MN |
| 4/5/2019 |
|
| — |
|
| — |
|
| 3,100 |
|
| — |
|
| — |
|
| 3,100 |
|
Monticello Village - Monticello, MN |
| 5/28/2019 |
|
| — |
|
| — |
|
| — |
|
| 2,901 |
|
| — |
|
| 2,901 |
|
Rimrock West - Billings, MT |
| 9/1/2019 |
|
| — |
|
| — |
|
| — |
|
| 3,223 |
|
| — |
|
| 3,223 |
|
Rocky Meadows - Billings, MT |
| 9/1/2019 |
|
| — |
|
| — |
|
| — |
|
| 4,997 |
|
| — |
|
| 4,997 |
|
Cimarron Hills - Omaha, NE |
| 10/1/2019 |
|
| — |
|
| — |
|
| — |
|
| 4,648 |
|
| — |
|
| 4,648 |
|
Cottonwood - Bismarck, ND |
| 10/1/2019 |
|
| — |
|
| — |
|
| — |
|
| 15,358 |
|
| — |
|
| 15,358 |
|
Forest Park - Grand Forks, ND |
| 10/1/2019 |
|
| — |
|
| — |
|
| — |
|
| 7,422 |
|
| — |
|
| 7,422 |
|
Renaissance Heights I - Williston, ND |
| 10/1/2019 |
|
| — |
|
| — |
|
| — |
|
| 42,221 |
|
| — |
|
| 42,221 |
|
Evergreen - Isanti, MN |
| 11/1/2019 |
|
| — |
|
| — |
|
| — |
|
| 1,951 |
|
| — |
|
| 1,951 |
|
Pinehurst - Billings, MT |
| 11/1/2019 |
|
| — |
|
| — |
|
| — |
|
| 164 |
|
| — |
|
| 164 |
|
Northridge - Bismarck, ND |
| 12/1/2019 |
|
| — |
|
| — |
|
| — |
|
| 6,146 |
|
| — |
|
| 6,146 |
|
Castlerock - Billings, MT |
| 1/1/2020 |
|
| — |
|
| — |
|
| — |
|
| 6,465 |
|
| — |
|
| 6,465 |
|
Thomasbrook - Lincoln, NE |
| 1/1/2020 |
|
| — |
|
| — |
|
| — |
|
| 5,793 |
|
| — |
|
| 5,793 |
|
Westwood Park - Bismarck, ND |
| 1/1/2020 |
|
| — |
|
| — |
|
| — |
|
| 1,916 |
|
| — |
|
| 1,916 |
|
Kirkwood Manor - Bismarck, ND |
| 2/1/2020 |
|
| — |
|
| — |
|
| — |
|
| 3,204 |
|
| — |
|
| 3,204 |
|
Brookfield Village - Topeka, KS |
| 3/1/2020 |
|
| — |
|
| — |
|
| — |
|
| 5,124 |
|
| — |
|
| 5,124 |
|
Crown Colony - Topeka, KS |
| 4/1/2020 |
|
| — |
|
| — |
|
| — |
|
| 7,936 |
|
| — |
|
| 7,936 |
|
Mariposa - Topeka, KS |
| 4/1/2020 |
|
| — |
|
| — |
|
| — |
|
| 2,872 |
|
| — |
|
| 2,872 |
|
Sherwood - Topeka, KS |
| 4/1/2020 |
|
| — |
|
| — |
|
| — |
|
| 11,918 |
|
| — |
|
| 11,918 |
|
Summary of Debt due after Fiscal 2020 |
|
|
|
| — |
|
| — |
|
| — |
|
| — |
|
| 345,838 |
|
| 345,838 |
|
Sub-Total Multifamily |
|
|
| $ | 73,691 |
| $ | 18,769 |
| $ | 51,122 |
| $ | 134,259 |
| $ | 345,838 |
| $ | 623,679 |
|
|
|
|
|
|
|
|
|
|
|
|
|
|
|
|
|
|
|
|
|
|
|
|
|
|
|
|
|
|
|
|
|
|
|
|
|
|
|
|
|
|
|
|
|
Healthcare |
|
|
|
|
|
|
|
|
|
|
|
|
|
|
|
|
|
|
|
|
|
Sartell 2000 23rd St S – Sartell, MN(3) |
| 12/1/2016 |
|
| 662 |
|
| — |
|
| — |
|
| — |
|
| — |
|
| 662 |
|
Billings 2300 Grant Road – Billings, MT |
| 12/31/2016 |
|
| 980 |
|
| — |
|
| — |
|
| — |
|
| — |
|
| 980 |
|
Missoula 3050 Great Northern Ave – Missoula, MT |
| 12/31/2016 |
|
| 997 |
|
| — |
|
| — |
|
| — |
|
| — |
|
| 997 |
|
Edgewood Vista – Fargo, ND(3) |
| 2/25/2017 |
|
| 11,297 |
|
| — |
|
| — |
|
| — |
|
| — |
|
| 11,297 |
|
Edgewood Vista – Fremont, NE(3) |
| 2/25/2017 |
|
| 528 |
|
| — |
|
| — |
|
| — |
|
| — |
|
| 528 |
|
10
|
|
|
|
|
|
|
|
|
|
|
|
|
|
|
|
|
|
|
|
|
|
Property |
| Maturity Date |
| Fiscal 2017 |
| Fiscal 2018 |
| Fiscal 2019 |
| Fiscal 2020 |
| Thereafter |
| Total (1) |
| ||||||
Edgewood Vista – Hastings, NE(3) |
| 2/25/2017 |
|
| 544 |
|
| — |
|
| — |
|
| — |
|
| — |
|
| 544 |
|
Edgewood Vista – Hermantown I, MN(3) |
| 2/25/2017 |
|
| 14,576 |
|
| — |
|
| — |
|
| — |
|
| — |
|
| 14,576 |
|
Edgewood Vista – Kalispell, MT(3) |
| 2/25/2017 |
|
| 545 |
|
| — |
|
| — |
|
| — |
|
| — |
|
| 545 |
|
Edgewood Vista – Missoula, MT(3) |
| 2/25/2017 |
|
| 774 |
|
| — |
|
| — |
|
| — |
|
| — |
|
| 774 |
|
Edgewood Vista – Omaha, NE(3) |
| 2/25/2017 |
|
| 345 |
|
| — |
|
| — |
|
| — |
|
| — |
|
| 345 |
|
Edgewood Vista – Virginia, MN(3) |
| 2/25/2017 |
|
| 12,399 |
|
| — |
|
| — |
|
| — |
|
| — |
|
| 12,399 |
|
High Pointe Health Campus – Lake Elmo, MN |
| 4/1/2017 |
|
| 7,500 |
|
| — |
|
| — |
|
| — |
|
| — |
|
| 7,500 |
|
Edgewood Vista – Billings, MT(3) |
| 4/10/2017 |
|
| 1,723 |
|
| — |
|
| — |
|
| — |
|
| — |
|
| 1,723 |
|
Edgewood Vista – East Grand Forks, MN(3) |
| 4/10/2017 |
|
| 2,625 |
|
| — |
|
| — |
|
| — |
|
| — |
|
| 2,625 |
|
Edgewood Vista – Sioux Falls, SD(3) |
| 4/10/2017 |
|
| 987 |
|
| — |
|
| — |
|
| — |
|
| — |
|
| 987 |
|
St Michael Clinic – St. Michael, MN |
| 4/1/2018 |
|
| — |
|
| 1,736 |
|
| — |
|
| — |
|
| — |
|
| 1,736 |
|
PrairieCare Medical - Brooklyn Park, MN |
| 4/10/2018 |
|
| — |
|
| 14,982 |
|
| — |
|
| — |
|
| — |
|
| 14,982 |
|
Garden View Medical – St. Paul, MN |
| 6/30/2018 |
|
| — |
|
| — |
|
| 6,890 |
|
| — |
|
| — |
|
| 6,890 |
|
Ritchie Medical Plaza – St. Paul, MN |
| 6/30/2018 |
|
| — |
|
| — |
|
| 8,320 |
|
| — |
|
| — |
|
| 8,320 |
|
Spring Creek - American Falls - American Falls, ID(3) |
| 9/1/2018 |
|
| — |
|
| — |
|
| 1,955 |
|
| — |
|
| — |
|
| 1,955 |
|
Spring Creek - Eagle - Eagle, ID(3) |
| 9/1/2018 |
|
| — |
|
| — |
|
| 1,799 |
|
| — |
|
| — |
|
| 1,799 |
|
Spring Creek - Meridian - Meridian, ID(3) |
| 9/1/2018 |
|
| — |
|
| — |
|
| 2,972 |
|
| — |
|
| — |
|
| 2,972 |
|
Spring Creek - Soda Springs - Soda Springs, ID(3) |
| 9/1/2018 |
|
| — |
|
| — |
|
| 703 |
|
| — |
|
| — |
|
| 703 |
|
Health East St John & Woodwinds - Maplewood & Woodbury, MN |
| 2/1/2019 |
|
| — |
|
| — |
|
| 5,654 |
|
| — |
|
| — |
|
| 5,654 |
|
Denfeld Clinic - Duluth, MN |
| 8/1/2019 |
|
| — |
|
| — |
|
| — |
|
| 1,308 |
|
| — |
|
| 1,308 |
|
Gateway Clinic - Sandstone, MN |
| 8/1/2019 |
|
| — |
|
| — |
|
| — |
|
| 757 |
|
| — |
|
| 757 |
|
Mariner Clinic - Superior, WI |
| 8/1/2019 |
|
| — |
|
| — |
|
| — |
|
| 1,657 |
|
| — |
|
| 1,657 |
|
Pavilion I - Duluth, MN |
| 8/1/2019 |
|
| — |
|
| — |
|
| — |
|
| 4,366 |
|
| — |
|
| 4,366 |
|
Pavilion II - Duluth, MN |
| 8/1/2019 |
|
| — |
|
| — |
|
| — |
|
| 8,034 |
|
| — |
|
| 8,034 |
|
Wells Clinic - Hibbing, MN |
| 8/1/2019 |
|
| — |
|
| — |
|
| — |
|
| 1,156 |
|
| — |
|
| 1,156 |
|
Summary of Debt due after Fiscal 2020 |
|
|
|
| — |
|
| — |
|
| — |
|
| — |
|
| 121,384 |
|
| 121,384 |
|
Sub-Total Healthcare |
|
|
| $ | 56,482 |
| $ | 16,718 |
| $ | 28,293 |
| $ | 17,278 |
| $ | 121,384 |
| $ | 240,155 |
|
|
|
|
|
|
|
|
|
|
|
|
|
|
|
|
|
|
|
|
|
|
|
All Other |
|
|
|
|
|
|
|
|
|
|
|
|
|
|
|
|
|
|
|
|
|
Urbandale 3900 106th Street – Urbandale, IA |
| 7/5/2017 |
|
| — |
|
| 10,266 |
|
| — |
|
| — |
|
| — |
|
| 10,266 |
|
Plaza 16 – Minot, ND |
| 8/1/2018 |
|
| — |
|
| — |
|
| 6,916 |
|
| — |
|
| — |
|
| 6,916 |
|
Lexington Commerce Center - Eagan, MN |
| 2/1/2020 |
|
| — |
|
| — |
|
| — |
|
| 1,504 |
|
| — |
|
| 1,504 |
|
Summary of Debt due after Fiscal 2020 |
|
|
|
| — |
|
| — |
|
| — |
|
| — |
|
| 3,627 |
|
| 3,627 |
|
Sub-Total All Other |
|
|
| $ | — |
| $ | 10,266 |
| $ | 6,916 |
| $ | 1,504 |
| $ | 3,627 |
| $ | 22,313 |
|
|
|
|
|
|
|
|
|
|
|
|
|
|
|
|
|
|
|
|
|
|
|
Total |
|
|
| $ | 130,173 |
| $ | 45,753 |
| $ | 86,331 |
| $ | 153,041 |
| $ | 470,849 |
| $ | 886,147 |
|
* Mortgage debt does not include our multi-bank line of credit or construction loans. The line of credit has a maturity date of September 1, 2017. As of April 30, 2016, we had borrowings of $17.5 million outstanding under this line. Construction loans and other debt totaled $82.1 million as of April 30, 2016.
(1)Totals are principal balances as of April 30, 2016.
(2)Mortgage was paid off subsequent to April 30, 2016.
(3)Property is classified as held for sale at April 30, 2016.
11
INVESTORS REAL ESTATE TRUST AND SUBSIDIARIES
CAPITAL ANALYSIS
(in thousands, except per share and unit amounts)
|
|
|
|
|
|
|
|
|
|
|
|
|
|
|
|
|
|
| Three Months Ended |
| |||||||||||||
|
| 4/30/2016 |
| 1/31/2016 |
| 10/31/2015 |
| 7/31/2015 |
| 4/30/2015 |
| |||||
Equity Capitalization |
|
|
|
|
|
|
|
|
|
|
|
|
|
|
|
|
Common shares outstanding |
|
| 121,091 |
|
| 121,034 |
|
| 122,798 |
|
| 125,520 |
|
| 124,456 |
|
Operating partnership (OP) units outstanding |
|
| 16,285 |
|
| 13,864 |
|
| 13,890 |
|
| 13,921 |
|
| 14,000 |
|
Total common shares and OP units outstanding |
|
| 137,376 |
|
| 134,898 |
|
| 136,688 |
|
| 139,441 |
|
| 138,456 |
|
Market price per common share (closing price at end of period) |
| $ | 6.02 |
| $ | 6.52 |
| $ | 8.12 |
| $ | 7.21 |
| $ | 7.17 |
|
Equity capitalization-common shares and OP units |
| $ | 827,004 |
| $ | 879,535 |
| $ | 1,109,907 |
| $ | 1,005,370 |
| $ | 992,730 |
|
Recorded book value of preferred shares |
| $ | 138,674 |
| $ | 138,674 |
| $ | 138,674 |
| $ | 138,674 |
| $ | 138,674 |
|
Total equity capitalization |
| $ | 965,678 |
| $ | 1,018,209 |
| $ | 1,248,581 |
| $ | 1,144,044 |
| $ | 1,131,404 |
|
|
|
|
|
|
|
|
|
|
|
|
|
|
|
|
|
|
Debt Capitalization |
|
|
|
|
|
|
|
|
|
|
|
|
|
|
|
|
Total debt |
| $ | 993,323 |
| $ | 940,294 |
| $ | 1,007,825 |
| $ | 1,211,621 |
| $ | 1,178,851 |
|
Total capitalization |
| $ | 1,959,001 |
| $ | 1,958,503 |
| $ | 2,256,406 |
| $ | 2,355,665 |
| $ | 2,310,255 |
|
|
|
|
|
|
|
|
|
|
|
|
|
|
|
|
|
|
Total debt to total capitalization |
|
| 0.51:1 |
|
| 0.48:1 |
|
| 0.45:1 |
|
| 0.51:1 |
|
| 0.51:1 |
|
|
|
|
|
|
|
|
|
|
|
|
|
|
|
|
|
|
|
|
|
|
|
|
|
|
| Twelve Months Ended |
|
| Three Months Ended |
| |||||||||||||||||
|
| 4/30/2016 |
| 4/30/2015 |
|
| 4/30/2016 |
| 1/31/2016 |
| 10/31/2015 |
| 7/31/2015 |
| 4/30/2015 |
| |||||||
Earnings to fixed charges(1) |
|
| 1.29 | x |
| 1.18 | x |
|
| 1.85 | x |
| 1.32 | x |
| 1.02 | x |
| 1.10 | x |
| 1.48 | x |
Earnings to combined fixed charges and preferred distributions(1) |
|
| 1.08 | x |
| 1.00 | x |
|
| 1.49 | x |
| 1.11 | x |
| (2) | x |
| (3) | x |
| 1.26 | x |
Debt service coverage ratio(1) |
|
| 1.75 | x |
| 1.75 | x |
|
| 1.86 | x |
| 1.65 | x |
| 1.63 | x |
| 1.63 | x |
| 1.64 | x |
|
|
|
|
|
|
|
|
|
|
|
|
|
|
|
|
|
|
|
|
|
|
|
|
Distribution Data |
|
|
|
|
|
|
|
|
|
|
|
|
|
|
|
|
|
|
|
|
|
|
|
Common shares and units outstanding at record date |
|
| 134,897 |
|
| 137,596 |
|
|
| 134,897 |
|
| 135,408 |
|
| 139,540 |
|
| 138,576 |
|
| 137,596 |
|
Total common distribution paid on shares and units |
| $ | 71,290 |
| $ | 69,854 |
|
| $ | 17,536 |
| $ | 17,603 |
| $ | 18,136 |
| $ | 18,015 |
| $ | 17,879 |
|
Common distribution per share and unit |
| $ | 0.52 |
| $ | 0.52 |
|
| $ | 0.13 |
| $ | 0.13 |
| $ | 0.13 |
| $ | 0.13 |
| $ | 0.13 |
|
Payout ratio (FFO per share and unit basis)(1) |
|
| 68.4 | % |
| 81.3 | % |
|
| 92.9 | % |
| 32.5 | % |
| 216.7 | % |
| 81.3 | % |
| 81.3 | % |
Payout ratio (AFFO per share and unit basis)(1) |
|
| 102.0 | % |
| 94.5 | % |
|
| 118.2 | % |
| 100 | % |
| 118.2 | % |
| 81.3 | % |
| 100 | % |
(1) | See Definitions on page 27. |
(2) | Earnings were inadequate to cover combined fixed charges and preferred distributions by $2.6 million. Excluding non-cash asset impairment and loss on sale charges of $1.9 million in the three months ended October 31, 2015, the ratio of earnings to combined fixed charges and preferred distributions would have been .96x for the three months ended October 31, 2015. |
(3) | Earnings were inadequate to cover combined fixed charges and preferred distributions by $1.2 million. Excluding non-cash asset impairment and loss on sale charges of $1.5 million in the three months ended July 31, 2015, the ratio of earnings to combined fixed charges and preferred distributions would have been 1.01x for the three months ended October 31, 2015. |
12
INVESTORS REAL ESTATE TRUST AND SUBSIDIARIES
SAME-STORE PROPERTIES NET OPERATING INCOME SUMMARY
(in thousands)
|
|
|
|
|
|
|
|
|
|
|
|
|
|
|
|
|
|
|
| Same Store Properties |
| Same Store Properties |
| ||||||||||||
|
| Three Months Ended |
| Twelve Months Ended |
| ||||||||||||
|
| April 30 |
| April 30 |
| ||||||||||||
|
|
|
|
|
|
|
| % |
|
|
|
|
|
|
| % |
|
Segment |
| 2016 |
| 2015 |
| Change |
| 2016 |
| 2015 |
| Change |
| ||||
Multi-Family Residential |
| $ | 13,946 |
| $ | 14,496 |
| (3.8) | % | $ | 55,508 |
| $ | 58,444 |
| (5.0) | % |
Healthcare |
|
| 6,424 |
|
| 6,298 |
| 2.0 | % |
| 26,174 |
|
| 25,676 |
| 1.9 | % |
All Other |
|
| 1,753 |
|
| 1,847 |
| (5.1) | % |
| 7,430 |
|
| 6,600 |
| 12.6 | % |
|
| $ | 22,123 |
| $ | 22,641 |
| (2.3) | % | $ | 89,112 |
| $ | 90,720 |
| (1.8) | % |
13
INVESTORS REAL ESTATE TRUST AND SUBSIDIARIES
NET OPERATING INCOME DETAIL
(in thousands)
|
|
|
|
|
|
|
|
|
|
|
|
|
|
|
|
|
|
| Three Months Ended April 30, 2016 |
| |||||||||||||
|
| Reporting Segments |
| |||||||||||||
|
|
|
|
|
|
|
|
|
|
| Corporate and |
|
|
|
| |
|
| Multifamily |
| Healthcare |
| All Other |
| Other |
| Total |
| |||||
Real estate rental revenue |
|
|
|
|
|
|
|
|
|
|
|
|
|
|
|
|
Same-store |
| $ | 25,377 |
| $ | 10,241 |
| $ | 2,274 |
| $ | — |
| $ | 37,892 |
|
Non-same-store |
|
| 8,739 |
|
| 1,391 |
|
| 501 |
|
| — |
|
| 10,631 |
|
Total |
|
| 34,116 |
|
| 11,632 |
|
| 2,775 |
|
| — |
|
| 48,523 |
|
|
|
|
|
|
|
|
|
|
|
|
|
|
|
|
|
|
Real estate expenses |
|
|
|
|
|
|
|
|
|
|
|
|
|
|
|
|
Same-store |
|
| 11,431 |
|
| 3,817 |
|
| 521 |
|
| — |
|
| 15,769 |
|
Non-same-store |
|
| 4,192 |
|
| 446 |
|
| 117 |
|
| — |
|
| 4,755 |
|
Total |
|
| 15,623 |
|
| 4,263 |
|
| 638 |
|
| — |
|
| 20,524 |
|
|
|
|
|
|
|
|
|
|
|
|
|
|
|
|
|
|
Net operating income (NOI) |
|
|
|
|
|
|
|
|
|
|
|
|
|
|
|
|
Same-store |
|
| 13,946 |
|
| 6,424 |
|
| 1,753 |
|
| — |
|
| 22,123 |
|
Non-same-store |
|
| 4,547 |
|
| 945 |
|
| 384 |
|
| — |
|
| 5,876 |
|
Net operating income |
| $ | 18,493 |
| $ | 7,369 |
| $ | 2,137 |
| $ | — |
| $ | 27,999 |
|
|
|
|
|
|
|
|
|
|
|
|
|
|
|
|
|
|
Reconciliation of NOI to net income (loss) available to common shareholders |
|
|
|
|
|
|
|
|
|
|
|
|
|
|
|
|
Depreciation/amortization |
| $ | (9,418) |
| $ | (3,109) |
| $ | (913) |
| $ | (77) |
| $ | (13,517) |
|
Impairment of real estate investments |
|
| — |
|
| (1,898) |
|
|
|
|
| (325) |
|
| (2,223) |
|
General and administrative expenses |
|
| — |
|
| — |
|
| — |
|
| (2,951) |
|
| (2,951) |
|
Acquisition and investment related costs |
|
| — |
|
| — |
|
| — |
|
| (397) |
|
| (397) |
|
Other expenses |
|
| — |
|
| — |
|
| — |
|
| (950) |
|
| (950) |
|
Interest expense |
|
| (7,365) |
|
| (2,115) |
|
| (368) |
|
| (214) |
|
| (10,062) |
|
Interest and other income |
|
| — |
|
| — |
|
| — |
|
| 600 |
|
| 600 |
|
Income before gain (loss) on sale of real estate and other investments, gain on bargain purchase and income from discontinued operations |
|
| 1,710 |
|
| 247 |
|
| 856 |
|
| (4,314) |
|
| (1,501) |
|
Gain (loss) on sale of real estate and other investments |
|
| (32) |
|
| 7,982 |
|
| 420 |
|
| (1) |
|
| 8,369 |
|
Gain on bargain purchase |
|
| 3,424 |
|
| — |
|
| — |
|
| — |
|
| 3,424 |
|
Income (loss) from continuing operations |
|
| 5,102 |
|
| 8,229 |
|
| 1,276 |
|
| (4,315) |
|
| 10,292 |
|
Income from discontinued operations |
|
| — |
|
| 1,320 |
|
| 143 |
|
| — |
|
| 1,463 |
|
Net income (loss) |
|
| 5,102 |
|
| 9,549 |
|
| 1,419 |
|
| (4,315) |
|
| 11,755 |
|
Net income attributable to noncontrolling interests – Operating Partnership |
|
| — |
|
| — |
|
| — |
|
| (1,092) |
|
| (1,092) |
|
Net loss attributable to noncontrolling interests – consolidated real estate entities |
|
| — |
|
| — |
|
| — |
|
| 340 |
|
| 340 |
|
Net income (loss) attributable to Investors Real Estate Trust |
|
| 5,102 |
|
| 9,549 |
|
| 1,419 |
|
| (5,067) |
|
| 11,003 |
|
Dividends to preferred shareholders |
|
| — |
|
| — |
|
| — |
|
| (2,878) |
|
| (2,878) |
|
NET INCOME (LOSS) AVAILABLE TO COMMON SHAREHOLDERS |
| $ | 5,102 |
| $ | 9,549 |
| $ | 1,419 |
| $ | (7,945) |
| $ | 8,125 |
|
14
INVESTORS REAL ESTATE TRUST AND SUBSIDIARIES
NET OPERATING INCOME DETAIL
(in thousands)
|
|
|
|
|
|
|
|
|
|
|
|
|
|
|
|
|
|
| Three Months Ended April 30, 2015 |
| |||||||||||||
|
| Reporting Segments |
| |||||||||||||
|
|
|
|
|
|
|
|
|
|
| Corporate and |
|
|
|
| |
|
| Multifamily |
| Healthcare |
| All Other |
| Other |
| Total |
| |||||
Real estate rental revenue |
|
|
|
|
|
|
|
|
|
|
|
|
|
|
|
|
Same-store |
| $ | 25,818 |
| $ | 10,138 |
| $ | 2,300 |
| $ | — |
| $ | 38,256 |
|
Non-same-store |
|
| 5,131 |
|
| 555 |
|
| 1,199 |
|
| — |
|
| 6,885 |
|
Total |
|
| 30,949 |
|
| 10,693 |
|
| 3,499 |
|
| — |
|
| 45,141 |
|
|
|
|
|
|
|
|
|
|
|
|
|
|
|
|
|
|
Real estate expenses |
|
|
|
|
|
|
|
|
|
|
|
|
|
|
|
|
Same-store |
|
| 11,322 |
|
| 3,840 |
|
| 453 |
|
| — |
|
| 15,615 |
|
Non-same-store |
|
| 2,147 |
|
| 215 |
|
| 567 |
|
| — |
|
| 2,929 |
|
Total |
|
| 13,469 |
|
| 4,055 |
|
| 1,020 |
|
| — |
|
| 18,544 |
|
|
|
|
|
|
|
|
|
|
|
|
|
|
|
|
|
|
Net operating income (NOI) |
|
|
|
|
|
|
|
|
|
|
|
|
|
|
|
|
Same-store |
|
| 14,496 |
|
| 6,298 |
|
| 1,847 |
|
| — |
|
| 22,641 |
|
Non-same-store |
|
| 2,984 |
|
| 340 |
|
| 632 |
|
| — |
|
| 3,956 |
|
Net operating income |
| $ | 17,480 |
| $ | 6,638 |
| $ | 2,479 |
| $ | — |
| $ | 26,597 |
|
|
|
|
|
|
|
|
|
|
|
|
|
|
|
|
|
|
Reconciliation of NOI to net income (loss) available to common shareholders |
|
|
|
|
|
|
|
|
|
|
|
|
|
|
|
|
Depreciation/amortization |
| $ | (7,519) |
| $ | (2,650) |
| $ | (926) |
| $ | (85) |
| $ | (11,180) |
|
General and administrative expenses |
|
| — |
| $ | — |
| $ | — |
|
| (2,516) |
|
| (2,516) |
|
Acquisition and investment related costs |
|
| — |
|
| — |
|
| — |
|
| (125) |
|
| (125) |
|
Other expenses |
|
| — |
|
| — |
|
| — |
|
| (207) |
|
| (207) |
|
Interest expense |
|
| (5,921) |
|
| (1,994) |
|
| (1,078) |
|
| 21 |
|
| (8,972) |
|
Interest and other income |
|
| — |
|
| — |
|
| — |
|
| 904 |
|
| 904 |
|
Income (loss) before gain on sale of real estate and other investments and (loss) income from discontinued operations |
|
| 4,040 |
|
| 1,994 |
|
| 475 |
|
| (2,008) |
|
| 4,501 |
|
Gain on sale of real estate and other investments |
|
| — |
|
| 4,109 |
|
| 3,141 |
|
| (346) |
|
| 6,904 |
|
Income (loss) from continuing operations |
|
| 4,040 |
|
| 6,103 |
|
| 3,616 |
|
| (2,354) |
|
| 11,405 |
|
(Loss) income from discontinued operations |
|
| — |
|
| — |
|
| 2,457 |
|
| — |
|
| 2,457 |
|
Net income (loss) |
|
| 4,040 |
|
| 6,103 |
|
| 6,073 |
|
| (2,354) |
|
| 13,862 |
|
Net income attributable to noncontrolling interests – Operating Partnership |
|
| — |
|
| — |
|
| — |
|
| (908) |
|
| (908) |
|
Net income attributable to noncontrolling interests – consolidated real estate entities |
|
| — |
|
| — |
|
| — |
|
| (2,201) |
|
| (2,201) |
|
Net income (loss) attributable to Investors Real Estate Trust |
|
| 4,040 |
|
| 6,103 |
|
| 6,073 |
|
| (5,463) |
|
| 10,753 |
|
Dividends to preferred shareholders |
|
| — |
|
| — |
|
| — |
|
| (2,878) |
|
| (2,878) |
|
NET INCOME (LOSS) AVAILABLE TO COMMON SHAREHOLDERS |
| $ | 4,040 |
|
| 6,103 |
|
| 6,073 |
|
| (8,341) |
|
| 7,875 |
|
15
INVESTORS REAL ESTATE TRUST AND SUBSIDIARIES
NET OPERATING INCOME DETAIL
(in thousands)
|
|
|
|
|
|
|
|
|
|
|
|
|
|
|
|
|
|
| Twelve Months Ended April 30, 2016 |
| |||||||||||||
|
| Reporting Segments |
| |||||||||||||
|
|
|
|
|
|
|
|
|
|
| Corporate and |
|
|
|
| |
|
| Multifamily |
| Healthcare |
| All Other |
| Other |
| Total |
| |||||
Real estate rental revenue |
|
|
|
|
|
|
|
|
|
|
|
|
|
|
|
|
Same-store |
| $ | 102,694 |
| $ | 40,715 |
| $ | 9,601 |
| $ | — |
| $ | 153,010 |
|
Non-same-store |
|
| 28,455 |
|
| 4,906 |
|
| 1,949 |
|
| — |
|
| 35,310 |
|
Total |
|
| 131,149 |
|
| 45,621 |
|
| 11,550 |
|
| — |
|
| 188,320 |
|
|
|
|
|
|
|
|
|
|
|
|
|
|
|
|
|
|
Real estate expenses |
|
|
|
|
|
|
|
|
|
|
|
|
|
|
|
|
Same-store |
|
| 47,186 |
|
| 14,541 |
|
| 2,171 |
|
| — |
|
| 63,898 |
|
Non-same-store |
|
| 13,291 |
|
| 1,480 |
|
| 431 |
|
| — |
|
| 15,202 |
|
Total |
|
| 60,477 |
|
| 16,021 |
|
| 2,602 |
|
| — |
|
| 79,100 |
|
|
|
|
|
|
|
|
|
|
|
|
|
|
|
|
|
|
Net operating income (NOI) |
|
|
|
|
|
|
|
|
|
|
|
|
|
|
|
|
Same-store |
|
| 55,508 |
|
| 26,174 |
|
| 7,430 |
|
| — |
|
| 89,112 |
|
Non-same-store |
|
| 15,164 |
|
| 3,426 |
|
| 1,518 |
|
| — |
|
| 20,108 |
|
Net operating income |
| $ | 70,672 |
| $ | 29,600 |
| $ | 8,948 |
| $ | — |
| $ | 109,220 |
|
|
|
|
|
|
|
|
|
|
|
|
|
|
|
|
|
|
Reconciliation of NOI to net income (loss) available to common shareholders |
|
|
|
|
|
|
|
|
|
|
|
|
|
|
|
|
Depreciation/amortization |
| $ | (34,396) |
| $ | (11,496) |
| $ | (3,648) |
| $ | (292) |
| $ | (49,832) |
|
Impairment of real estate investments |
|
| (1,873) |
|
| (1,898) |
|
| — |
|
| (1,772) |
|
| (5,543) |
|
General and dministrative expenses |
|
| — |
| $ | — |
| $ | — |
|
| (11,267) |
|
| (11,267) |
|
Acquisition and investment related costs |
|
| — |
|
| — |
|
| — |
|
| (830) |
|
| (830) |
|
Other expenses |
|
| — |
|
| — |
|
| — |
|
| (2,231) |
|
| (2,231) |
|
Interest expense |
|
| (26,742) |
|
| (8,607) |
|
| (1,584) |
|
| 1,165 |
|
| (35,768) |
|
Loss on extinguishment of debt |
|
| (93) |
|
| — |
|
| (13) |
|
| — |
|
| (106) |
|
Interest and other income |
|
| — |
|
| — |
|
| — |
|
| 2,573 |
|
| 2,573 |
|
Income (loss) before gain (loss) on sale of real estate, gain on bargain purchase and other investments and (loss) income from discontinued operations |
|
| 7,568 |
|
| 7,599 |
|
| 3,703 |
|
| (12,654) |
|
| 6,216 |
|
Gain (loss) on sale of real estate and other investments |
|
| (32) |
|
| 7,982 |
|
| 1,705 |
|
| (15) |
|
| 9,640 |
|
Gain on bargain purchase |
|
| 3,424 |
|
| — |
|
| — |
|
| — |
|
| 3,424 |
|
Income (loss) from continuing operations |
|
| 10,960 |
|
| 15,581 |
|
| 5,408 |
|
| (12,669) |
|
| 19,280 |
|
(Loss) income from discontinued operations |
|
| — |
|
| 5,926 |
|
| 51,396 |
|
| — |
|
| 57,322 |
|
Net income (loss) |
|
| 10,960 |
|
| 21,507 |
|
| 56,804 |
|
| (12,669) |
|
| 76,602 |
|
Net income attributable to noncontrolling interests – Operating Partnership |
|
| — |
|
| — |
|
| — |
|
| (7,081) |
|
| (7,081) |
|
Net loss attributable to noncontrolling interests – consolidated real estate entities |
|
| — |
|
| — |
|
| — |
|
| 2,436 |
|
| 2,436 |
|
Net income (loss) attributable to Investors Real Estate Trust |
|
| 10,960 |
|
| 21,507 |
|
| 56,804 |
|
| (17,314) |
|
| 71,957 |
|
Dividends to preferred shareholders |
|
| — |
|
| — |
|
| — |
|
| (11,514) |
|
| (11,514) |
|
NET INCOME (LOSS) AVAILABLE TO COMMON SHAREHOLDERS |
| $ | 10,960 |
| $ | 21,507 |
| $ | 56,804 |
| $ | (28,828) |
| $ | 60,443 |
|
16
INVESTORS REAL ESTATE TRUST AND SUBSIDIARIES
NET OPERATING INCOME DETAIL
(in thousands)
|
|
|
|
|
|
|
|
|
|
|
|
|
|
|
|
|
|
| Twelve Months Ended April 30, 2015 |
| |||||||||||||
|
| Reporting Segments |
| |||||||||||||
|
|
|
|
|
|
|
|
|
|
| Corporate and |
|
|
|
| |
|
| Multifamily |
| Healthcare |
| All Other |
| Other |
| Total |
| |||||
Real estate rental revenue |
|
|
|
|
|
|
|
|
|
|
|
|
|
|
|
|
Same-store |
| $ | 103,238 |
| $ | 40,885 |
| $ | 9,299 |
| $ | — |
| $ | 153,422 |
|
Non-same-store |
|
| 15,288 |
|
| 3,268 |
|
| 7,343 |
|
| — |
|
| 25,899 |
|
Total |
|
| 118,526 |
|
| 44,153 |
|
| 16,642 |
|
| — |
|
| 179,321 |
|
|
|
|
|
|
|
|
|
|
|
|
|
|
|
|
|
|
Real estate expenses |
|
|
|
|
|
|
|
|
|
|
|
|
|
|
|
|
Same-store |
|
| 44,794 |
|
| 15,209 |
|
| 2,699 |
|
| — |
|
| 62,702 |
|
Non-same-store |
|
| 6,378 |
|
| 1,031 |
|
| 3,026 |
|
| — |
|
| 10,435 |
|
Total |
|
| 51,172 |
|
| 16,240 |
|
| 5,725 |
|
| — |
|
| 73,137 |
|
|
|
|
|
|
|
|
|
|
|
|
|
|
|
|
|
|
Net operating income (NOI) |
|
|
|
|
|
|
|
|
|
|
|
|
|
|
|
|
Same-store |
|
| 58,444 |
|
| 25,676 |
|
| 6,600 |
|
| — |
|
| 90,720 |
|
Non-same-store |
|
| 8,910 |
|
| 2,237 |
|
| 4,317 |
|
| — |
|
| 15,464 |
|
Net operating income |
| $ | 67,354 |
| $ | 27,913 |
| $ | 10,917 |
| $ | — |
| $ | 106,184 |
|
|
|
|
|
|
|
|
|
|
|
|
|
|
|
|
|
|
Reconciliation of NOI to net income (loss) available to common shareholders |
|
|
|
|
|
|
|
|
|
|
|
|
|
|
|
|
Depreciation/amortization |
| $ | (26,638) |
| $ | (10,855) |
| $ | (4,963) |
| $ | (328) |
| $ | (42,784) |
|
Impairment of real estate investments |
|
| — |
|
| — |
|
| (3,369) |
|
| (1,294) |
|
| (4,663) |
|
General and dministrative expenses |
|
| — |
| $ | — |
| $ | — |
|
| (11,824) |
|
| (11,824) |
|
Acquisition and investment related costs |
|
| — |
|
| — |
|
| — |
|
| (362) |
|
| (362) |
|
Other expenses |
|
| — |
|
| — |
|
| — |
|
| (1,647) |
|
| (1,647) |
|
Interest expense |
|
| (22,782) |
|
| (8,898) |
|
| (3,122) |
|
| 355 |
|
| (34,447) |
|
Interest and other income |
|
| — |
|
| — |
|
| — |
|
| 2,956 |
|
| 2,956 |
|
Income (loss) before gain (loss) on sale of real estate and other investments and (loss) income from discontinued operations |
|
| 17,934 |
|
| 8,160 |
|
| (537) |
|
| (12,144) |
|
| 13,413 |
|
Gain (loss) on sale of real estate and other investments |
|
| 1,418 |
|
| 4,109 |
|
| 2,107 |
|
| (1,541) |
|
| 6,093 |
|
Income (loss) from continuing operations |
|
| 19,352 |
|
| 12,269 |
|
| 1,570 |
|
| (13,685) |
|
| 19,506 |
|
(Loss) income from discontinued operations |
|
| — |
|
| 6,832 |
|
| 2,346 |
|
| — |
|
| 9,178 |
|
Net income (loss) |
|
| 19,352 |
|
| 19,101 |
|
| 3,916 |
|
| (13,685) |
|
| 28,684 |
|
Net income attributable to noncontrolling interests – Operating Partnership |
|
| — |
|
| — |
|
| — |
|
| (1,526) |
|
| (1,526) |
|
Net income attributable to noncontrolling interests – consolidated real estate entities |
|
| — |
|
| — |
|
| — |
|
| (3,071) |
|
| (3,071) |
|
Net income (loss) attributable to Investors Real Estate Trust |
|
| 19,352 |
|
| 19,101 |
|
| 3,916 |
|
| (18,282) |
|
| 24,087 |
|
Dividends to preferred shareholders |
|
| — |
|
| — |
|
| — |
|
| (11,514) |
|
| (11,514) |
|
NET INCOME (LOSS) AVAILABLE TO COMMON SHAREHOLDERS |
| $ | 19,352 |
| $ | 19,101 |
| $ | 3,916 |
| $ | (29,796) |
| $ | 12,573 |
|
17
INVESTORS REAL ESTATE TRUST AND SUBSIDIARIES
SAME-STORE PROPERTIES AND ALL PROPERTIES OCCUPANCY LEVELS BY SEGMENT
April 30, 2016 vs. April 30, 2015
|
|
|
|
|
|
|
|
|
|
Segments |
| Same-Store Properties | All Properties |
| |||||
|
| April 30, 2016 | April 30, 2015 | April 30, 2016 | April 30, 2015 |
| |||
Multifamily |
| 94.8 | % | 95.1 | % | 90.8 | % | 92.0 | % |
Healthcare |
| 95.6 | % | 95.3 | % | 89.4 | % | 91.5 | % |
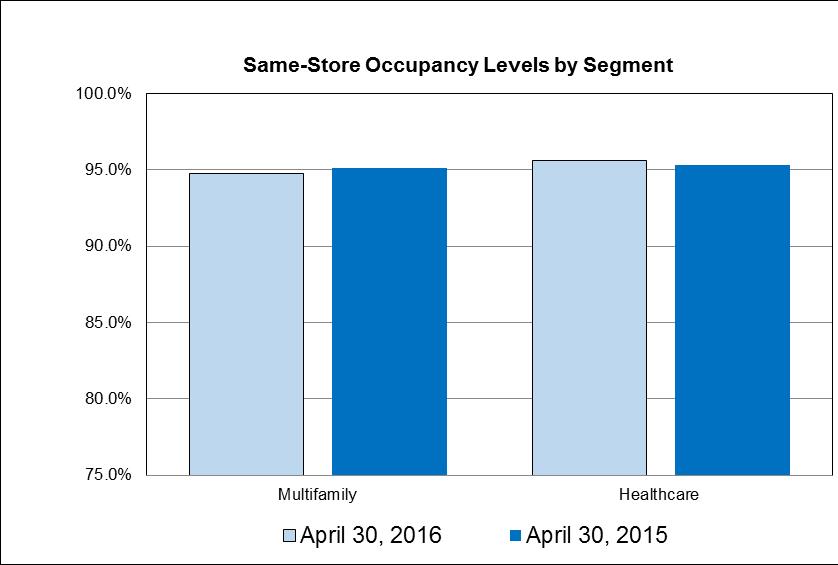
18
INVESTORS REAL ESTATE TRUST AND SUBSIDIARIES
MULTIFAMILY SUMMARY(1)
|
|
|
|
|
|
|
|
|
|
|
|
|
|
|
|
|
|
| Three Months Ended |
| |||||||||||||
|
| 04/30/16 |
|
| 01/31/16 |
|
| 10/31/15 |
|
| 07/31/15 |
|
| 04/30/15 |
| |
Number of Units |
|
|
|
|
|
|
|
|
|
|
|
|
|
|
|
|
Same-Store |
|
| 9,853 |
|
| 9,877 |
|
| 9,877 |
|
| 10,268 |
|
| 9,895 |
|
Non-Same-Store |
|
| 3,121 |
|
| 2,915 |
|
| 2,783 |
|
| 1,759 |
|
| 1,949 |
|
All Properties |
|
| 12,974 |
|
| 12,792 |
|
| 12,660 |
|
| 12,027 |
|
| 11,844 |
|
|
|
|
|
|
|
|
|
|
|
|
|
|
|
|
|
|
Average Investment Per Unit |
|
|
|
|
|
|
|
|
|
|
|
|
|
|
|
|
Same-Store |
| $ | 72,986 |
| $ | 72,696 |
| $ | 72,308 |
| $ | 69,992 |
| $ | 66,741 |
|
Non-Same-Store |
|
| 161,851 |
|
| 142,111 |
|
| 134,136 |
|
| 149,281 |
|
| 146,337 |
|
All Properties |
| $ | 94,092 |
| $ | 88,228 |
| $ | 84,701 |
| $ | 81,180 |
| $ | 79,617 |
|
|
|
|
|
|
|
|
|
|
|
|
|
|
|
|
|
|
Average Scheduled Rent(2) per Unit |
|
|
|
|
|
|
|
|
|
|
|
|
|
|
|
|
Same-Store |
| $ | 871 |
| $ | 877 |
| $ | 885 |
| $ | 861 |
| $ | 843 |
|
Non-Same-Store |
|
| 1,244 |
|
| 1,229 |
|
| 1,218 |
|
| 1,445 |
|
| 1,452 |
|
All Properties |
| $ | 960 |
| $ | 956 |
| $ | 952 |
| $ | 944 |
| $ | 942 |
|
|
|
|
|
|
|
|
|
|
|
|
|
|
|
|
|
|
Total Receipts per Unit(3) |
|
|
|
|
|
|
|
|
|
|
|
|
|
|
|
|
Same-Store |
| $ | 859 |
| $ | 861 |
| $ | 877 |
| $ | 848 |
| $ | 838 |
|
Non-Same-Store |
|
| 949 |
|
| 911 |
|
| 826 |
|
| 1,037 |
|
| 1,062 |
|
All Properties |
| $ | 880 |
| $ | 872 |
| $ | 866 |
| $ | 875 |
| $ | 874 |
|
|
|
|
|
|
|
|
|
|
|
|
|
|
|
|
|
|
Total Recurring Capital Expenditures(2) per Unit |
| $ | 84 |
| $ | 142 |
| $ | 173 |
| $ | 159 |
| $ | 136 |
|
|
|
|
|
|
|
|
|
|
|
|
|
|
|
|
|
|
Occupancy |
|
|
|
|
|
|
|
|
|
|
|
|
|
|
|
|
Same-Store |
|
| 94.8 | % |
| 94.9 | % |
| 95.4 | % |
| 93.5 | % |
| 94.7 | % |
Non-Same-Store |
|
| 78.4 | % |
| 78.1 | % |
| 79.5 | % |
| 77.7 | % |
| 78.6 | % |
All Properties |
|
| 90.8 | % |
| 91.1 | % |
| 91.9 | % |
| 91.2 | % |
| 92.0 | % |
|
|
|
|
|
|
|
|
|
|
|
|
|
|
|
|
|
Operating Expenses as a % of Scheduled Rent |
|
|
|
|
|
|
|
|
|
|
|
|
|
|
|
|
Same-Store |
|
| 44.4 | % |
| 45.9 | % |
| 47.1 | % |
| 44.4 | % |
| 44.2 | % |
Non-Same-Store |
|
| 36.6 | % |
| 34.0 | % |
| 39.9 | % |
| 31.9 | % |
| 30.0 | % |
All Properties |
|
| 42.0 | % |
| 42.4 | % |
| 45.2 | % |
| 41.7 | % |
| 40.7 | % |
(1) | Previously reported amounts are not revised for discontinued operations or changes in the composition of the same-store properties pool. |
(2) | See Definitions on page 27. |
(3) | Includes vacant units. |
19
INVESTORS REAL ESTATE TRUST AND SUBSIDIARIES
COMMERCIAL LEASING SUMMARY (Same-Store Properties)
Commercial Leasing Activity
During fiscal year 2016, we executed new and renewal leases for our same-store healthcare properties on 33,785 square feet for the three months ended April 30, 2016 and 201,989 square feet for the twelve months ended April 30, 2016. Due to our leasing efforts, occupancy in our same-store healthcare portfolio has remained strong at 95.6% as of April 30, 2016, compared to 95.3% as of April 30, 2015.
The total leasing activity for our same-store healthcare properties, expressed in square feet of leases signed during the period, and the resulting occupancy levels, are as follows:
Three Months Ended April 30, 2016 and 2015
|
|
|
|
|
|
|
|
|
|
|
|
|
|
|
|
|
|
|
|
|
|
|
|
|
|
|
| Total |
|
|
|
|
| ||
|
| Square Feet of |
| Square Feet of |
| Square Feet of |
|
|
|
|
| ||||||
|
| New Leases(1) |
| Leases Renewed(1) |
| Leases Executed(1 |
| Occupancy |
| ||||||||
Segments |
| 2016 |
| 2015 |
| 2016 |
| 2015 |
| 2016 |
| 2015 |
| 2016 |
| 2015 |
|
Healthcare |
| 361 |
| 3,174 |
| 33,424 |
| 1,270 |
| 33,785 |
| 4,444 |
| 95.6 | % | 95.3 | % |
(1) | The leasing activity presented is based on leases signed or executed for our same-store rental properties during the period and is not intended to coincide with the commencement of rental revenue in accordance with US GAAP. Prior periods reflect amounts previously reported and exclude retroactive adjustments for properties reclassified to discontinued operations or non-same-store in the current period. |
Twelve Months Ended April 30, 2016 and 2015
|
|
|
|
|
|
|
|
|
|
|
|
|
|
|
|
|
|
|
|
|
|
|
|
|
|
|
| Total |
|
|
|
|
| ||
|
| Square Feet of |
| Square Feet of |
| Square Feet of |
|
|
|
|
| ||||||
|
| New Leases(1) |
| Leases Renewed(1) |
| Leases Executed(1) |
| Occupancy |
| ||||||||
Segments |
| 2016 |
| 2015 |
| 2016 |
| 2015 |
| 2016 |
| 2015 |
| 2016 |
| 2015 |
|
Healthcare |
| 45,446 |
| 21,153 |
| 156,543 |
| 109,661 |
| 201,989 |
| 130,814 |
| 95.6 | % | 95.3 | % |
(1) | The leasing activity presented is based on leases signed or executed for our same-store rental properties during the period and is not intended to coincide with the commencement of rental revenue in accordance with US GAAP. Prior periods reflect amounts previously reported and exclude retroactive adjustments for properties reclassified to discontinued operations or non-same-store in the current period. |
New Leases
The following table sets forth the average effective rents and the estimated costs of tenant improvements and leasing commissions, on a per square foot basis, that we are obligated to fulfill under the new leases signed for our same-store healthcare and industrial properties:
Three Months Ended April 30, 2016 and 2015
|
|
|
|
|
|
|
|
|
|
|
|
|
|
|
|
|
|
|
|
|
|
|
|
|
|
|
|
|
|
|
|
|
|
|
|
|
|
|
|
|
|
|
| Estimated Tenant |
| Leasing |
| ||||||||
|
| Square Feet of |
| Average Term |
| Average |
| Improvement Cost per |
| Commissions per |
| ||||||||||||||||
|
| New Leases(1 |
| in Years |
| Effective Rent(2 |
| Square Foot(1) |
| Square Foot(1 |
| ||||||||||||||||
Segments |
| 2016 |
| 2015 |
| 2016 |
| 2015 |
|
| 2016 |
|
| 2015 |
|
| 2016 |
|
| 2015 |
|
| 2016 |
|
| 2015 |
|
Healthcare |
| 361 |
| 3,174 |
| 0.5 |
| 0.3 |
| $ | 19.28 |
| $ | 3.78 |
| $ | 0.00 |
| $ | 0.00 |
| $ | 0.00 |
| $ | 0.00 |
|
(1) | The leasing activity presented is based on leases signed or executed for our same-store rental properties during the period and is not intended to coincide with the commencement of rental revenue in accordance with US GAAP. Prior periods reflect amounts previously reported and exclude retroactive adjustments for properties reclassified to discontinued operations or non-same-store in the current period. Tenant improvements and leasing commissions presented are based on square feet leased during the period. |
(2) | Effective rents represent average annual base rental payments, on a straight-line basis for the term of each lease, excluding operating expense reimbursements. The underlying leases contain various expense structures including gross, modified gross, net and triple net. |
20
INVESTORS REAL ESTATE TRUST AND SUBSIDIARIES
COMMERCIAL LEASING SUMMARY (Same-Store Properties)
Twelve Months Ended April 30, 2016 and 2015
|
|
|
|
|
|
|
|
|
|
|
|
|
|
|
|
|
|
|
|
|
|
|
|
|
|
|
|
|
|
|
|
|
|
|
|
|
|
|
|
|
|
|
| Estimated Tenant | Leasing |
| |||||||||
|
| Square Feet of | Average Term | Average | Improvement Cost per | Commissions per |
| ||||||||||||||||||||
|
| New Leases(1) | in Years | Effective Rent(2) | Square Foot(1) | Square Foot(1) |
| ||||||||||||||||||||
|
| 2016 |
| 2015 |
| 2016 |
| 2015 |
| 2016 |
| 2015 |
| 2016 |
| 2015 |
| 2016 |
| 2015 |
| ||||||
Healthcare |
| 45,446 |
| 21,153 |
| 6.6 |
| 5.4 |
| $ | 19.97 |
| $ | 17.57 |
| $ | 12.99 |
| $ | 31.58 |
| $ | 3.24 |
| $ | 5.81 |
|
(1) | The leasing activity presented is based on leases signed or executed for our same-store rental properties during the period and is not intended to coincide with the commencement of rental revenue in accordance with US GAAP. Prior periods reflect amounts previously reported and exclude retroactive adjustments for properties reclassified to discontinued operations or non-same-store in the current period. Tenant improvements and leasing commissions presented are based on square feet leased during the period. |
(2) | Effective rents represent average annual base rental payments, on a straight-line basis for the term of each lease, excluding operating expense reimbursements. The underlying leases contain various expense structures including gross, modified gross, net and triple net. |
Our ability to maintain or increase occupancy rates is a principal driver of maintaining and increasing the average effective rents in our healthcare segment. The increase in the average effective rental rates of new leases executed in our healthcare segment in fiscal year 2016 when compared to new leases executed in the prior year is due to the signing of a 3,174 square foot lease for storage space at our St. Paul, Minnesota Ritchie Medical Plaza property for $3.78 per square foot in fiscal year 2015. Absent this transaction, the average effective rental rate for leases executed in our healthcare segment in fiscal year 2015 would have been $20.00 per square foot.
Lease Renewals
The following table summarizes our lease renewal activity within our same-store healthcare and industrial segments (square feet data in thousands):
Three Months Ended April 30, 2016 and 2015
|
|
|
|
|
|
|
|
|
|
|
|
|
|
|
|
|
|
|
|
|
|
|
|
|
|
|
|
|
|
|
|
|
|
|
|
|
|
|
|
|
|
|
|
|
|
|
| Estimated |
|
|
|
|
|
|
| ||||
|
|
|
|
|
|
|
|
|
|
|
|
|
| Weighted Average |
| Tenant Improvement |
| Leasing |
| ||||||||||
|
| Square Feet of Leases |
| Percent of Expiring |
| Average Term |
| Growth (Decline) |
| Cost per Square |
| Commissions per |
| ||||||||||||||||
|
| Renewed(1) |
| Leases Renewed(2) |
| in Years |
| in Effective Rents(3) |
| Foot(1) |
| Square Foot(1) |
| ||||||||||||||||
|
| 2016 |
| 2015 |
| 2016 |
| 2015 |
| 2016 |
| 2015 |
| 2016 |
| 2015 |
| 2016 |
| 2015 |
| 2016 |
| 2015 |
| ||||
Healthcare |
| 33,424 |
| 1,270 |
| 95.8 | % | 72.9 | % | 4.2 |
| 3.0 |
| 5.4 | % | (0.1) | % | $ | 10.20 |
| $ | 0.00 |
| $ | 1.97 |
| $ | 3.15 |
|
(1) | The leasing activity presented is based on leases signed or executed for our same-store rental properties during the period and is not intended to coincide with the commencement of rental revenue in accordance with US GAAP. Prior periods reflect amounts previously reported and exclude retroactive adjustments for properties reclassified to discontinued operations or non-same-store in the current period. Tenant improvements and leasing commissions are based on square feet leased during the period. |
(2) | Renewal percentage of expiring leases is based on square footage of renewed leases and not the number of leases renewed. The category of renewed leases does not include leases that have become month-to-month leases, as the month-to-month leases are considered lease amendments. |
(3) | Represents the percentage change in effective rent between the original leases and the renewal leases. Effective rents represent average annual base rental payments, on a straight-line basis for the term of each lease, excluding operating expense reimbursements. The underlying leases contain various expense structures including gross, modified gross, net and triple net. |
Twelve Months Ended April 31, 2016 and 2015
|
|
|
|
|
|
|
|
|
|
|
|
|
|
|
|
|
|
|
|
|
|
|
|
|
|
|
|
|
|
|
|
|
|
|
|
|
|
|
|
|
|
|
|
|
|
|
| Estimated |
|
|
|
|
|
|
| ||||
|
|
|
|
|
|
|
|
|
|
|
|
|
| Weighted Average |
| Tenant Improvement |
| Leasing |
| ||||||||||
|
| Square Feet of Leases |
| Percent of Expiring |
| Average Term |
| Growth (Decline) |
| Cost per Square |
| Commissions per |
| ||||||||||||||||
|
| Renewed(1) |
| Leases Renewed(2) |
| in Years |
| in Effective Rents(3) |
| Foot(1) |
| Square Foot(1 |
| ||||||||||||||||
|
| 2016 |
| 2015 |
| 2016 |
| 2015 |
| 2016 |
| 2015 |
| 2016 |
| 2015 |
| 2016 |
| 2015 |
| 2016 |
| 2015 |
| ||||
Healthcare |
| 156,543 |
| 109,661 |
| 92.2 | % | 73.2 | % | 4.7 |
| 5.8 |
| 5.7 | % | (3.5) | % | $ | 9.40 |
| $ | 10.87 |
| $ | 2.65 |
| $ | 1.56 |
|
(1) | The leasing activity presented is based on leases signed or executed for our same-store rental properties during the period and is not intended to coincide with the commencement of rental revenue in accordance with US GAAP. Prior periods reflect amounts previously reported and exclude retroactive adjustments for properties reclassified to discontinued operations or non-same-store in the current period. Tenant improvements and leasing commissions are based on square feet leased during the period. |
(2) | Renewal percentage of expiring leases is based on square footage of renewed leases and not the number of leases renewed. The category of renewed leases does not include leases that have become month-to-month leases, as the month-to-month leases are considered lease amendments. |
(3) | Represents the percentage change in effective rent between the original leases and the renewal leases. Effective rents represent average annual base rental payments, on a straight-line basis for the term of each lease, excluding operating expense reimbursements. The underlying leases contain various expense structures including gross, modified gross, net and triple net. |
The increase in the average growth in effective rents for the healthcare segment in fiscal year 2016 when compared to the prior fiscal year is due to a 45,081 square foot lease renewal executed with the existing single tenant at our Pavilion I property in Duluth, Minnesota in fiscal year 2015. This lease was renewed at a lower rate than the previous expiring lease due to very low leasing transaction costs associated with the lease renewal. Absent this transaction, the weighted average growth rate in effective rents for fiscal year 2015 would have been 3.8%.
21
INVESTORS REAL ESTATE TRUST AND SUBSIDIARIES
COMMERCIAL LEASING SUMMARY (Same-Store Properties)
Lease Expirations
Our ability to maintain and improve occupancy rates, and base rents, primarily depends upon our continuing ability to re-lease expiring space. The following table reflects the in-service portfolio lease expiration schedule of our healthcare properties, including square footage and annualized base rent for expiring leases, as of April 30, 2016.
|
|
|
|
|
|
|
|
|
|
|
|
|
|
|
|
|
|
| Percentage of Total |
| Annualized Base |
| Percentage of Total |
| |
|
|
|
| Square Footage of |
| Commercial Segments |
| Rent of Expiring |
| Commercial Segments |
| |
Fiscal Year of Lease Expiration |
| # of Leases |
| Expiring Leases(2) |
| Leased Square Footage |
| Leases at Expiration(3) |
| Annualized Base Rent |
| |
2017(1) |
| 42 |
| 128,903 |
| 9.6 | % | $ | 2,489,085 |
| 8.4 | % |
2018 |
| 19 |
| 179,143 |
| 13.3 | % |
| 4,400,887 |
| 15.0 | % |
2019 |
| 17 |
| 206,208 |
| 15.3 | % |
| 4,159,949 |
| 14.2 | % |
2020 |
| 13 |
| 68,513 |
| 5.1 | % |
| 1,426,988 |
| 4.9 | % |
2021 |
| 22 |
| 109,019 |
| 8.1 | % |
| 2,310,744 |
| 7.9 | % |
2022 |
| 13 |
| 67,243 |
| 5.0 | % |
| 1,223,686 |
| 4.2 | % |
2023 |
| 11 |
| 52,511 |
| 3.9 | % |
| 847,350 |
| 2.9 | % |
2024 |
| 25 |
| 154,575 |
| 11.5 | % |
| 3,562,151 |
| 12.2 | % |
2025 |
| 5 |
| 76,691 |
| 5.7 | % |
| 1,661,344 |
| 5.7 | % |
2026 |
| 8 |
| 99,024 |
| 7.4 | % |
| 1,716,891 |
| 5.9 | % |
Thereafter |
| 14 |
| 202,534 |
| 15.1 | % |
| 5,476,247 |
| 18.7 | % |
Totals |
| 189 |
| 1,344,364 |
| 100.0 | % | $ | 29,275,322 |
| 100.0 | % |
(1) | Includes month-to-month leases. As of April 30, 2016, month-to-month leases accounted for 20,687 square feet. |
(2) | Assuming that none of the tenants exercise renewal or termination options, and including leases renewed prior to expiration. Also excludes 1,361 square feet of space occupied by us. |
(3) | Annualized Base Rent is monthly scheduled rent as of April 1, 2016, multiplied by 12. |
22
INVESTORS REAL ESTATE TRUST AND SUBSIDIARIES
10 LARGEST COMMERCIAL TENANTS – BASED ON ANNUALIZED BASE RENT(1)
as of April 30, 2016
|
|
|
|
|
|
|
|
|
|
|
|
|
|
|
|
|
| % of Total |
|
|
|
|
|
|
|
|
| Average |
| Commercial |
|
|
| % of Aggregate |
|
|
|
|
| Remaining |
| Segments’ |
| Aggregate |
| Occupied |
|
|
| Number of |
| Lease Term |
| Minimum |
| Rentable |
| Square |
|
Tenant |
| Properties |
| in Months |
| Rents |
| Square Feet |
| Feet |
|
Affiliates of Edgewood Vista |
| 33 |
| 53 |
| 28.4 | % | 1,521,147 |
| 35.3 | % |
Fairview Health Services |
| 8 |
| 52 |
| 7.2 | % | 240,243 |
| 5.6 | % |
St. Luke’s Hospital of Duluth, Inc. |
| 5 |
| 96 |
| 6.3 | % | 186,331 |
| 4.3 | % |
PrairieCare Medical LLC |
| 2 |
| 228 |
| 4.3 | % | 100,292 |
| 2.3 | % |
HealthEast Care System |
| 1 |
| 34 |
| 3.4 | % | 114,316 |
| 2.7 | % |
Quality Manufacturing Corp |
| 1 |
| 81 |
| 2.0 | % | 427,798 |
| 9.9 | % |
Westrock CP LLC |
| 1 |
| 112 |
| 1.8 | % | 195,075 |
| 4.5 | % |
Allina Health |
| 4 |
| 47 |
| 1.6 | % | 56,306 |
| 1.3 | % |
Children’s Hospitals & Clinics |
| 3 |
| 58 |
| 1.6 | % | 51,088 |
| 1.2 | % |
Noran Neurological Clinic |
| 1 |
| 264 |
| 1.4 | % | 38,506 |
| 0.9 | % |
Total/Weighted Average |
|
|
| 64 |
| 58.0 | % | 2,931,102 |
| 68.0 | % |
(1)See Definitions on page 27.
23
INVESTORS REAL ESTATE TRUST AND SUBSIDIARIES
COMMERCIAL LEASE EXPIRATIONS
as of April 30, 2016
|
|
|
|
|
|
|
|
|
|
|
|
|
|
|
|
|
| (dollars in thousands except average rental rates) |
| ||||||||||||
|
|
|
|
|
|
|
|
|
|
| Average |
| % of |
| |
|
| Number of |
| Rentable |
| % of Rentable |
| Annualized |
| Rental |
| Annualized |
| ||
Fiscal Year |
| Leases |
| Square Feet(1) |
| Square Feet |
| Rent(2) |
| Rate |
| Base Rent |
| ||
Healthcare |
|
|
|
|
|
|
|
|
|
|
|
|
|
|
|
2017 (3) |
| 42 |
| 128,903 |
| 9.6 | % | $ | 2,489 |
| $ | 19.31 |
| 8.5 | % |
2018 |
| 19 |
| 179,143 |
| 13.3 | % |
| 4,401 |
|
| 24.57 |
| 15.0 | % |
2019 |
| 17 |
| 206,208 |
| 15.4 | % |
| 4,160 |
|
| 20.17 |
| 14.2 | % |
2020 |
| 13 |
| 68,513 |
| 5.1 | % |
| 1,427 |
|
| 20.83 |
| 4.9 | % |
2021 |
| 22 |
| 109,019 |
| 8.1 | % |
| 2,310 |
|
| 21.19 |
| 7.9 | % |
2022 and thereafter |
| 76 |
| 652,578 |
| 48.5 | % |
| 14,488 |
|
| 22.20 |
| 49.5 | % |
|
| 189 |
| 1,344,364 |
| 100.0 | % | $ | 29,275 |
| $ | 21.78 |
| 100.0 | % |
|
|
|
|
|
|
|
|
|
|
|
|
|
|
|
|
(1)Excludes 1,361 square feet of space occupied by us.
(2)Annualized Base Rent is monthly scheduled rent as of April 1, 2016 (cash basis), multiplied by 12.
(3)Includes month-to-month leases. As of April 30, 2016 month-to-month leases accounted for 20,687 square feet.
24
INVESTORS REAL ESTATE TRUST AND SUBSIDIARIES
FISCAL 2016 ACQUISITIONS AND DEVELOPMENT SUMMARY
as of April 30, 2016
(dollars in thousands)
Acquisitions
|
|
|
|
|
|
|
|
|
|
|
|
|
|
|
|
|
|
|
|
|
|
|
|
|
|
| Occupancy |
| January 31, |
|
|
|
|
|
|
|
|
|
| Acquisition |
| Square |
| At |
| 2016 |
| Acquisition |
| |
Property |
| Location |
| Segment |
| Date |
| Feet/Units |
| Acquisition |
| Occupancy |
| Cost |
| |
Lakeside Medical Plaza |
| Omaha, NE |
| Healthcare |
| 8/20/15 |
| 27,819 |
| 100 | % | 100 | % | $ | 6,500 |
|
Gardens |
| Grand Forks, ND |
| Multifamily |
| 9/10/15 |
| 74 |
| 36.5 | % | 100.0 | % |
| 9,250 |
|
GrandeVille at Cascade Lake |
| Rochester, MN |
| Multifamily |
| 10/29/15 |
| 276 |
| 94.6 | % | 74.6 | % |
| 56,000 |
|
Avalon Cove |
| Rochester, MN |
| Multifamily |
| 3/22/16 |
| 187 |
| 98.4 | % | 95.7 | % |
| 36,250 |
|
Cascade Shores |
| Rochester, MN |
| Multifamily |
| 3/22/16 |
| 90 |
| 96.7 | % | 93.3 | % |
| 18,500 |
|
Crystal Bay |
| Rochester, MN |
| Multifamily |
| 3/22/16 |
| 76 |
| 97.4 | % | 94.7 | % |
| 12,000 |
|
French Creek |
| Rochester, MN |
| Multifamily |
| 3/22/16 |
| 40 |
| 100.0 | % | 100.0 | % |
| 5,000 |
|
|
|
|
|
|
| Total Sq Ft |
| 27,819 |
|
|
|
|
| $ | 143,500 |
|
|
|
|
|
|
| Total Units |
| 743 |
|
|
|
|
|
|
|
|
Developments Placed in Service
|
|
|
|
|
|
|
|
|
|
|
|
|
|
|
|
|
|
|
|
|
|
|
|
| Rentable |
| Occupancy at |
| Occupancy |
| Development |
| |
|
|
|
|
|
| Date Placed in |
| Square |
| Date Placed in |
| as of |
| Cost as of |
| |
Property(1) |
| Location |
| Segment |
| Service |
| Feet/Units |
| Service |
| April 30, 2016 |
| April 30, 2016 |
| |
Chateau II |
| Minot, ND |
| Multifamily |
| 6/1/15 |
| 72 |
| 27.8 | % | 84.7 | % | $ | 14,648 |
|
Edina 6565 France SMC III(2) |
| Edina, MN |
| Healthcare |
| 6/1/15 |
| 57,624 |
| 24.5 | % | 24.5 | % |
| 33,041 |
|
Renaissance Heights(3) |
| Williston, ND |
| Multifamily |
| 7/27/15 |
| 288 |
| 42.4 | % | 43.8 | % |
| 62,514 |
|
PrairieCare Medical |
| Brooklyn Park, MN |
| Healthcare |
| 9/8/15 |
| 70,756 |
| 100.0 | % | 100.0 | % |
| 24,440 |
|
Minot Southgate Retail |
| Minot, ND |
| Other |
| 10/1/15 |
| 7,963 |
| — | % | — | % |
| 2,623 |
|
Deer Ridge |
| Jamestown, ND |
| Multifamily |
| 2/22/16 |
| 163 |
| 33.1 | % | 50.9 | % |
| 24,837 |
|
Cardinal Point |
| Grand Forks, ND |
| Multifamily |
| 3/18/16 |
| 251 |
| 42.2 | % | 44.2 | % |
| 49,732 |
|
|
|
|
|
|
| Total Sq Ft |
| 136,343 |
|
|
|
|
| $ | 211,835 |
|
|
|
|
|
|
| Total Units |
| 774 |
|
|
|
|
|
|
|
|
(1) | Development projects that are placed in service in phases are excluded from this table until the entire project has been placed in service. See Developments in Progress for additional information on the 71 France project, which was partially placed in service during the twelve months ended April 30, 2016. |
(2) | Percentage leased or committed as of June 23, 2016 was 88.0%. |
(3) | We are currently an approximately 70.0% partner in the joint venture entity constructing this project; the anticipated total cost amount given is the total cost to the joint venture entity. |
Developments in Progress
|
|
|
|
|
|
|
|
|
|
|
|
|
|
|
|
|
|
|
|
|
|
|
|
|
|
|
|
|
|
|
|
|
| (in fiscal years) |
|
|
|
|
|
|
|
|
| Percentage |
| (in thousands) |
| Anticipated |
| ||||
|
|
|
|
|
|
|
| Leased |
| Anticipated |
| Costs as of |
| Construction |
| ||
Project Name and Location |
| Location |
| Planned Segment |
| Number of Units |
| or Committed |
| Total Cost(1) |
| April 30, 2016 |
| Completion |
| ||
71 France(2) |
| Edina, MN |
| Multifamily |
| 241 units |
| 49.4 | % |
| 73,290 |
|
| 71,727 |
| 1Q 2017 |
|
Monticello Crossings |
| Monticello, MN |
| Multifamily |
| 202 units |
| 5.5 | % |
| 31,784 |
|
| 17,507 |
| 2Q 2017 |
|
Other |
|
|
| n/a |
| n/a |
| n/a |
|
| n/a |
|
| 3,729 |
| n/a |
|
|
|
|
|
|
|
|
|
|
| $ | 105,074 |
| $ | 92,963 |
|
|
|
(1) | Includes costs related to development projects that are placed in service in phases (Deer Ridge - $14.3 million, 71 France - $41.3 million, Cardinal Point - $23.0 million). |
(2) | The project will be constructed in three phases by a joint venture entity in which we currently have an approximately 52.6% interest. The anticipated total cost amount given is the total cost to the joint venture entity. The anticipated total cost includes approximately 21,772 square feet of retail space. |
25
INVESTORS REAL ESTATE TRUST AND SUBSIDIARIES
ACQUISITIONS AND DEVELOPMENT LIQUIDITY PROFILE
as of April 30, 2016
(in millions)
|
|
|
|
|
|
|
|
|
|
Sources of Liquidity |
| Liquidity Needs |
| ||||||
Liquidity Source |
| Amount |
| Liquidity Need |
| Amount |
| ||
Cash on balance sheet as of 4/30/16(1) |
| $ | 67 |
| Development |
| $ | 19 |
|
Line of credit availability(2) |
| $ | 82 |
| Acquisitions |
| $ | — |
|
Disposition proceeds(3) |
| $ | 13 |
|
|
|
|
|
|
Construction loan proceeds |
| $ | 26 |
|
|
|
|
|
|
Total Potential Liquidity |
| $ | 188 |
| Total Liquidity Needs |
| $ | 19 |
|
Excess Liquidity / (Need) |
| $ | 169 |
|
|
|
|
|
|
|
|
|
|
|
|
|
|
|
|
Capital Sources |
| ||||||||
FY2016 |
| FY2015 |
| ||||||
|
| Proceeds |
|
|
| Proceeds |
| ||
Capital Source |
| Generated |
| Capital Source |
| Generated |
| ||
Sale of common shares under dividend reinvestment and share purchase plan |
| $ | 1 |
| Sale of common shares under dividend reinvestment and share purchase plan |
| $ | 39 |
|
Proceeds from sales of real estate and discontinued operations |
| $ | 406 |
| Proceeds from sales of real estate and discontinued operations |
| $ | 27 |
|
Total Capital Generated |
| $ | 407 |
| Total Capital Generated |
| $ | 66 |
|
(1) | Includes compensating balances of $14 million. |
(2) | Line of credit of $100 million less $18 million drawn as of 4/30/16. |
(3) | Disposition proceeds consists of $14 million of estimated gross proceeds, less estimated outstanding debt and estimated closing costs of $1 million from closed and pending sales for the period from 4/30/16 through 6/29/16. No assurances can be given that pending transactions will be completed on terms currently proposed, or at all. |
26
Definitions
April 30, 2016
Adjusted EBITDA is earnings before interest, taxes, depreciation, amortization, gain/loss on sale of real estate and other investments, impairment of real estate investments, gain/loss on extinguishment of debt and gain/loss from involuntary conversion. We consider Adjusted EBITDA to be an appropriate supplemental performance measure because it permits investors to view income from operations without the effect of depreciation, the cost of debt, or non-operating gains and losses. Adjusted EBITDA is a non-GAAP measure. Adjusted EBITDA as calculated by us is not comparable to Adjusted EBITDA reported by other REITs that do not define Adjusted EBITDA exactly as we do.
Adjusted funds from operations (AFFO) is calculated by subtracting from Funds from operations (FFO) (1) tenant improvements and leasing costs at same-store properties, and recurring capital expenditures that are capitalized and amortized and are necessary to maintain our properties and revenue stream and (2) straight line rents, then adding (3) non-real estate depreciation and amortization and (4) share-based compensation expense. We may also adjust FFO for certain unusual non-recurring items that do not produce cash available for distribution to shareholders or are otherwise not representative of our ongoing operating performance. Our calculation subtracts from FFO leasing commissions and tenant improvements at same-store properties only, since we consider tenant improvement and leasing cost levels at non-same-store properties unrepresentative of expected levels at same-store properties. Previously-reported AFFO amounts are not revised for changes in the composition of the same-store properties pool. AFFO is included herein because we consider it to be a measure of a REIT's ability to incur and service debt and to pay distributions to its shareholders. AFFO is a non-GAAP and non-standardized measure, and may be calculated differently by other REITs.
Annualized base rent (ABR) is calculated as monthly base rent (cash basis) per the lease, as of the reporting period, multiplied by 12.
Debt to total market capitalization is total debt from the balance sheet divided by the sum of total debt from the balance sheet plus the market value of shares outstanding at the end of the period.
Debt service coverage ratio is computed by dividing Adjusted EBITDA by interest expense and principal amortization.
Funds from operations (FFO) - The National Association of Real Estate Investment Trusts, Inc. (NAREIT) defines FFO as “net income (computed in accordance with generally accepted accounting principles, excluding gains (or losses) from sales of property, plus real estate depreciation and amortization, and adjustments for unconsolidated partnerships and joint ventures. Adjustments for unconsolidated partnerships and joint ventures will be calculated to reflect funds from operations on the same basis.” In addition, in October 2011 NAREIT clarified its computation of FFO to exclude impairment charges for all periods presented. FFO is a non-GAAP measure. We consider FFO, which is a standard supplemental measure for equity real estate investment trusts, helpful to investors because it facilitates an understanding of the operating performance of properties without giving effect to impairment write-downs and to real estate depreciation and amortization, which assumes that the value of real estate assets diminishes predictably over time. Since real estate values instead historically rise or fall with market conditions, we believe that FFO provides investors and management with a more accurate indication of our financial and operating results.
Net Operating Income (NOI) is total real estate revenues and gain on involuntary conversion less real estate expenses (which consist of utilities, maintenance, real estate taxes, insurance and property management expenses). We believe that NOI is an important supplemental measure of operating performance for a REIT’s operating real estate because it provides a measure of core operations that is unaffected by depreciation, amortization, financing and general and administrative expense. NOI does not represent cash generated by operating activities in accordance with GAAP and should not be considered an alternative to net income, net income available for common shareholders or cash flow from operating activities as a measure of financial performance.
Payout ratio (FFO per share and unit basis) - The ratio of the current quarterly or annual distribution rate per common share and unit divided by quarterly or annual FFO per share and unit.
Ratio of earnings to fixed charges - The ratio of earnings to fixed charges is computed by dividing earnings by fixed charges. For this purpose, earnings consist of income from continuing operations plus fixed charges and preferred distributions, less adjustments for noncontrolling interests - consolidated real estate entities, capitalized interest and preferred distributions. Fixed charges consist of mortgage and loan interest expense, whether expensed or capitalized, the amortization of debt expense and capitalized interest.
Ratio of earnings to combined fixed charges and preferred distributions - The ratio of earnings to combined fixed charges and preferred distributions is computed by dividing earnings by combined fixed charges and preferred distributions. For this purpose, earnings consist of income from continuing operations plus fixed charges and preferred distributions, less adjustments for noncontrolling interests - consolidated real estate entities, capitalized interest and preferred distributions. Combined fixed charges and preferred distributions consist of fixed charges (mortgage and loan interest expense, whether expensed or capitalized, the amortization of debt expense and capitalized interest) and preferred distributions.
27
Recurring capital expenditures are expenditures (excluding capital expenditures recoverable from tenants and capital expenditures at properties sold during the period) made on a regular or recurring basis to maintain a property’s competitive position within its market, generally with a depreciable life of 5 to 12 years, but excluding (a) capital expenditures made in the year of acquisition and in subsequent periods until the property is classified as same-store (i.e., excluding capital expenditures on non-same-store properties), (b) improvements associated with the expansion or re-development of a building, (c) renovations to a building which change the underlying classification of the building (for example, from industrial to office or Class C office to Class A office) or (d) capital improvements that represent the addition of something new to a property, rather than the replacement of an existing item.
Scheduled rent revenue is the total possible revenue from all leasable units and square footage, with occupied space valued at contract rates pursuant to leases and vacant units or square footage at market rates.
Same-store properties are properties owned or in service for the entirety of the periods being compared (except for properties for which significant redevelopment or expansion occurred during either of the periods being compared, and properties sold or classified as held for sale), and, in the case of development or re-development properties, which have achieved a target level of occupancy of 90% for multifamily properties and 85% for office, healthcare, industrial and retail properties.
US GAAP – Accounting principles generally accepted in the United States of America.
28