REITWEEK 2019: CONFERENCE PRESENTATION NEW YORK HILTON MIDTOWN I NYC I JUNE 4-6, 2019

SAFE HARBOR STATEMENT AND LEGAL DISCLOSURE Certain statements in this presentation are “forward-looking statements” within the meaning of the Private Securities Litigation Reform Act of 1995. Such statements involve known and unknown risks, uncertainties, and other factors that may cause actual results to differ materially from expected results. These statements may be identified by our use of words such as “expects,” “plans,” “estimates,” “anticipates,” “projects,” “intends,” “believes,” and similar expressions that do not relate to historical matters. Such risks, uncertainties, and other factors include, but are not limited to, changes in general and local economic and real estate market conditions, rental conditions in our markets, fluctuations in interest rates, the effect of government regulations, the availability and cost of capital and other financing risks, risks associated with our value-add and redevelopment opportunities, the failure of our property acquisition and disposition activities to achieve expected results, competition in our markets, our ability to attract and retain skilled personnel, our ability to maintain our tax status as a real estate investment trust (REIT), and those risks and uncertainties detailed from time to time in our filings with the Securities and Exchange Commission, including the “Management’s Discussion and Analysis of Financial Condition and Results of Operations” and “Risk Factors” contained in our Form 10-KT for the transition period ended December 31, 2018. We assume no obligation to update or supplement forward-looking statements that become untrue due to subsequent events. 2 www.iretapartments.com REITweek: 2019 Investor Conference
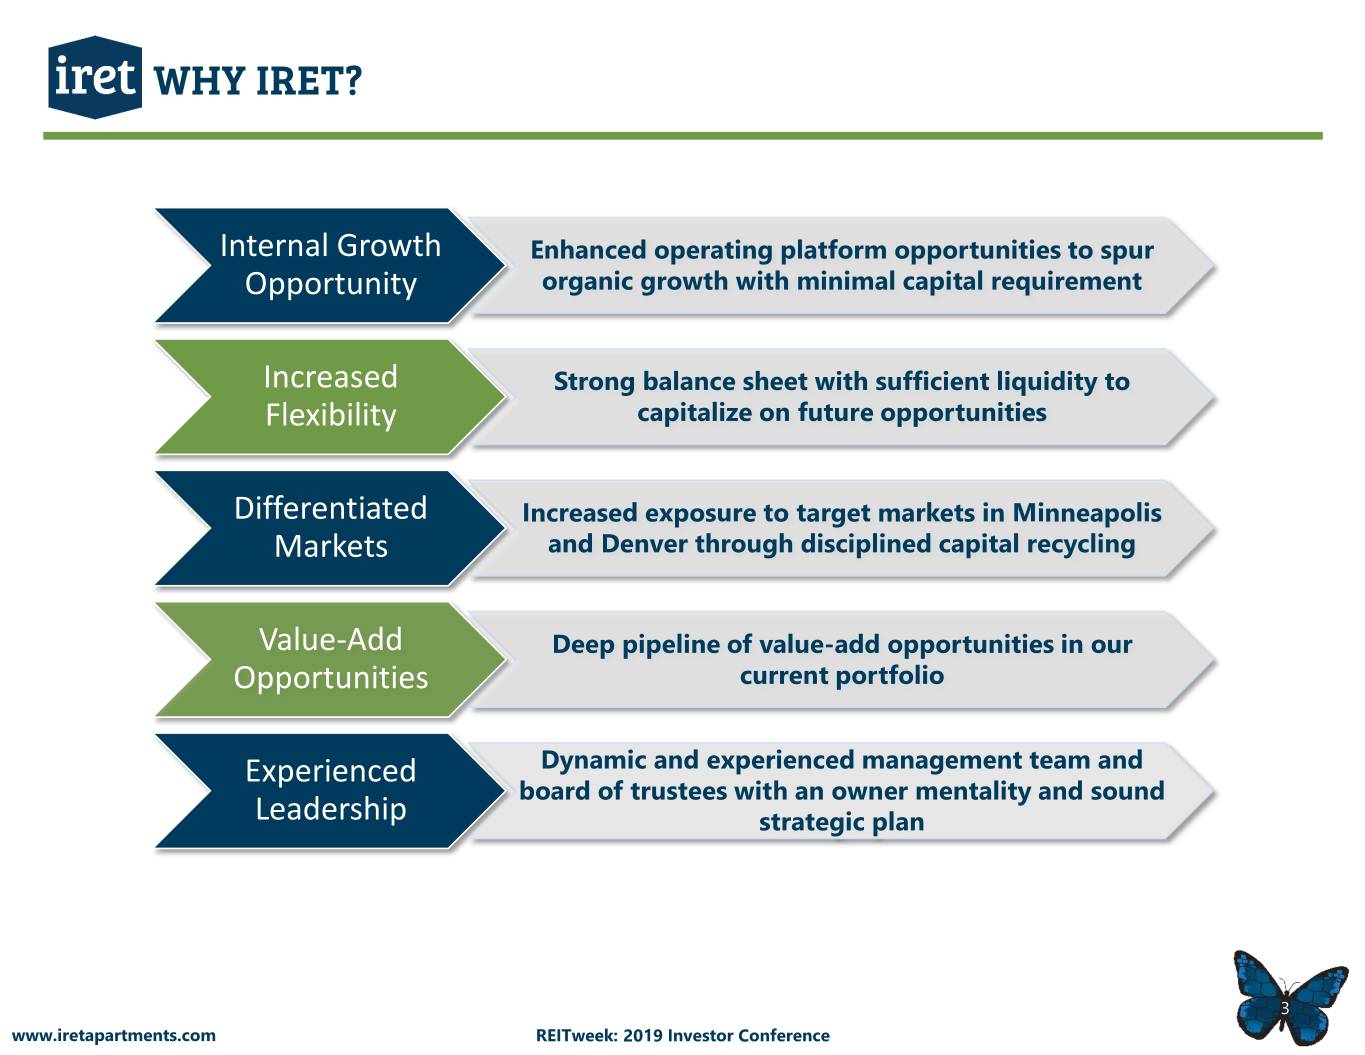
WHY IRET? Internal Growth Enhanced operating platform opportunities to spur Opportunity organic growth with minimal capital requirement Increased Strong balance sheet with sufficient liquidity to Flexibility capitalize on future opportunities Differentiated Increased exposure to target markets in Minneapolis Markets and Denver through disciplined capital recycling Value-Add Deep pipeline of value-add opportunities in our Opportunities current portfolio Experienced Dynamic and experienced management team and board of trustees with an owner mentality and sound Leadership strategic plan 3 www.iretapartments.com REITweek: 2019 Investor Conference
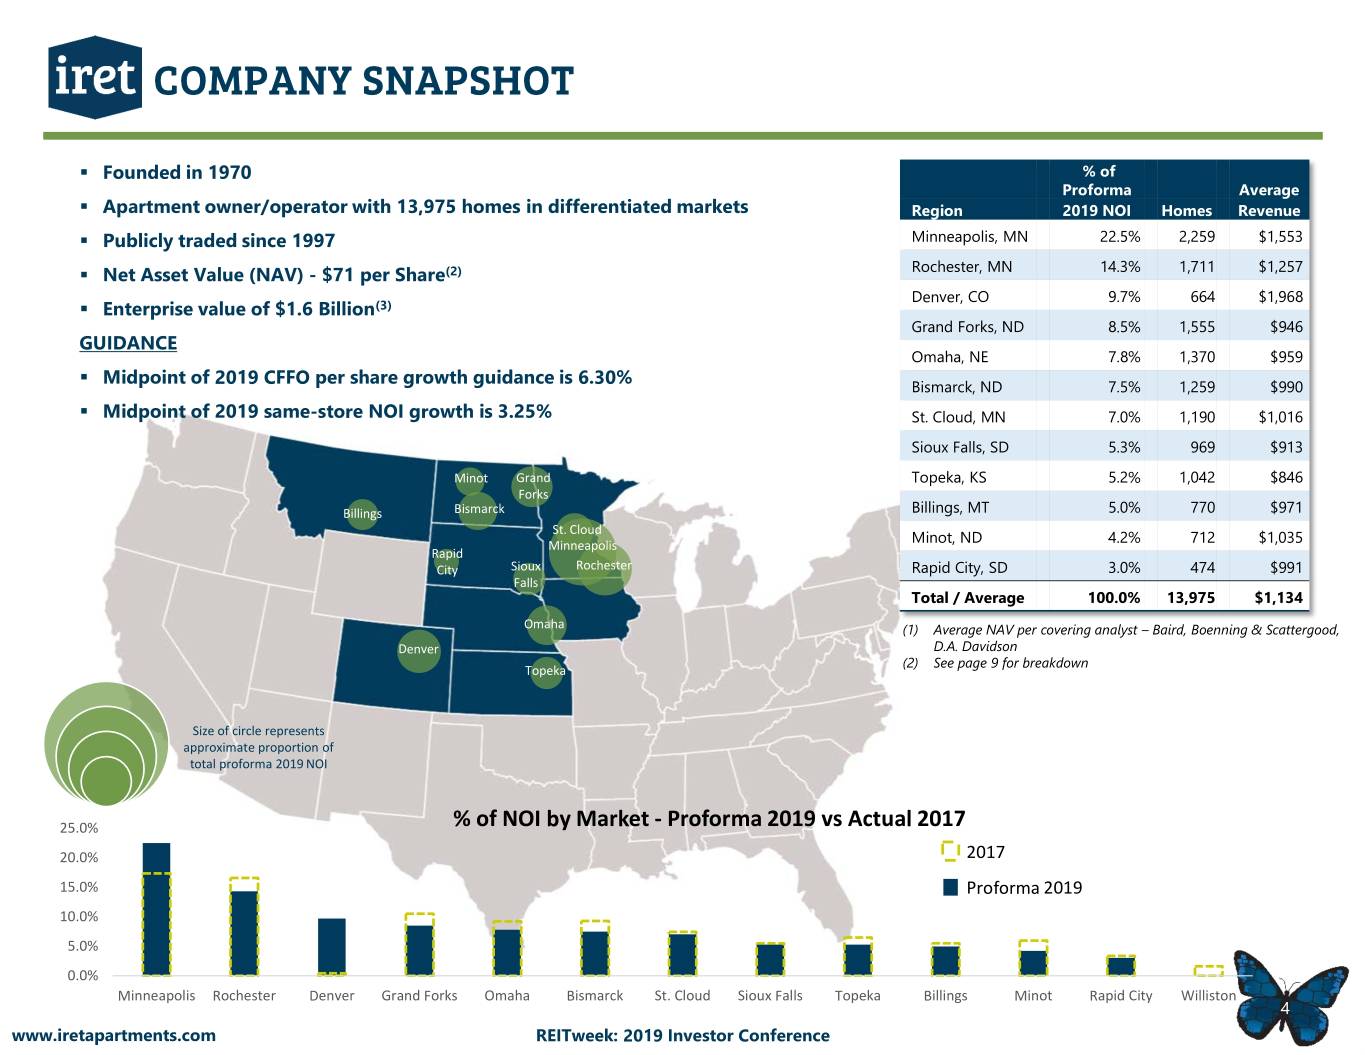
COMPANY SNAPSHOT . Founded in 1970 % of Proforma Average . Apartment owner/operator with 13,975 homes in differentiated markets Region 2019 NOI Homes Revenue . Publicly traded since 1997 Minneapolis, MN 22.5% 2,259 $1,553 . Net Asset Value (NAV) - $71 per Share(2) Rochester, MN 14.3% 1,711 $1,257 Denver, CO 9.7% 664 $1,968 . Enterprise value of $1.6 Billion(3) Grand Forks, ND 8.5% 1,555 $946 GUIDANCE Omaha, NE 7.8% 1,370 $959 . Midpoint of 2019 CFFO per share growth guidance is 6.30% Bismarck, ND 7.5% 1,259 $990 . Midpoint of 2019 same-store NOI growth is 3.25% St. Cloud, MN 7.0% 1,190 $1,016 Sioux Falls, SD 5.3% 969 $913 Minot Grand Topeka, KS 5.2% 1,042 $846 Forks Billings Bismarck Billings, MT 5.0% 770 $971 St. Cloud Minneapolis Minot, ND 4.2% 712 $1,035 Rapid City Sioux Rochester Rapid City, SD 3.0% 474 $991 Falls Total / Average 100.0% 13,975 $1,134 Omaha (1) Average NAV per covering analyst – Baird, Boenning & Scattergood, Denver D.A. Davidson (2) See page 9 for breakdown Topeka Size of circle represents approximate proportion of total proforma 2019 NOI 25.0% % of NOI by Market - Proforma 2019 vs Actual 2017 20.0% 2017 15.0% Proforma 2019 10.0% 5.0% 0.0% Minneapolis Rochester Denver Grand Forks Omaha Bismarck St. Cloud Sioux Falls Topeka Billings Minot Rapid City Williston 4 www.iretapartments.com REITweek: 2019 Investor Conference
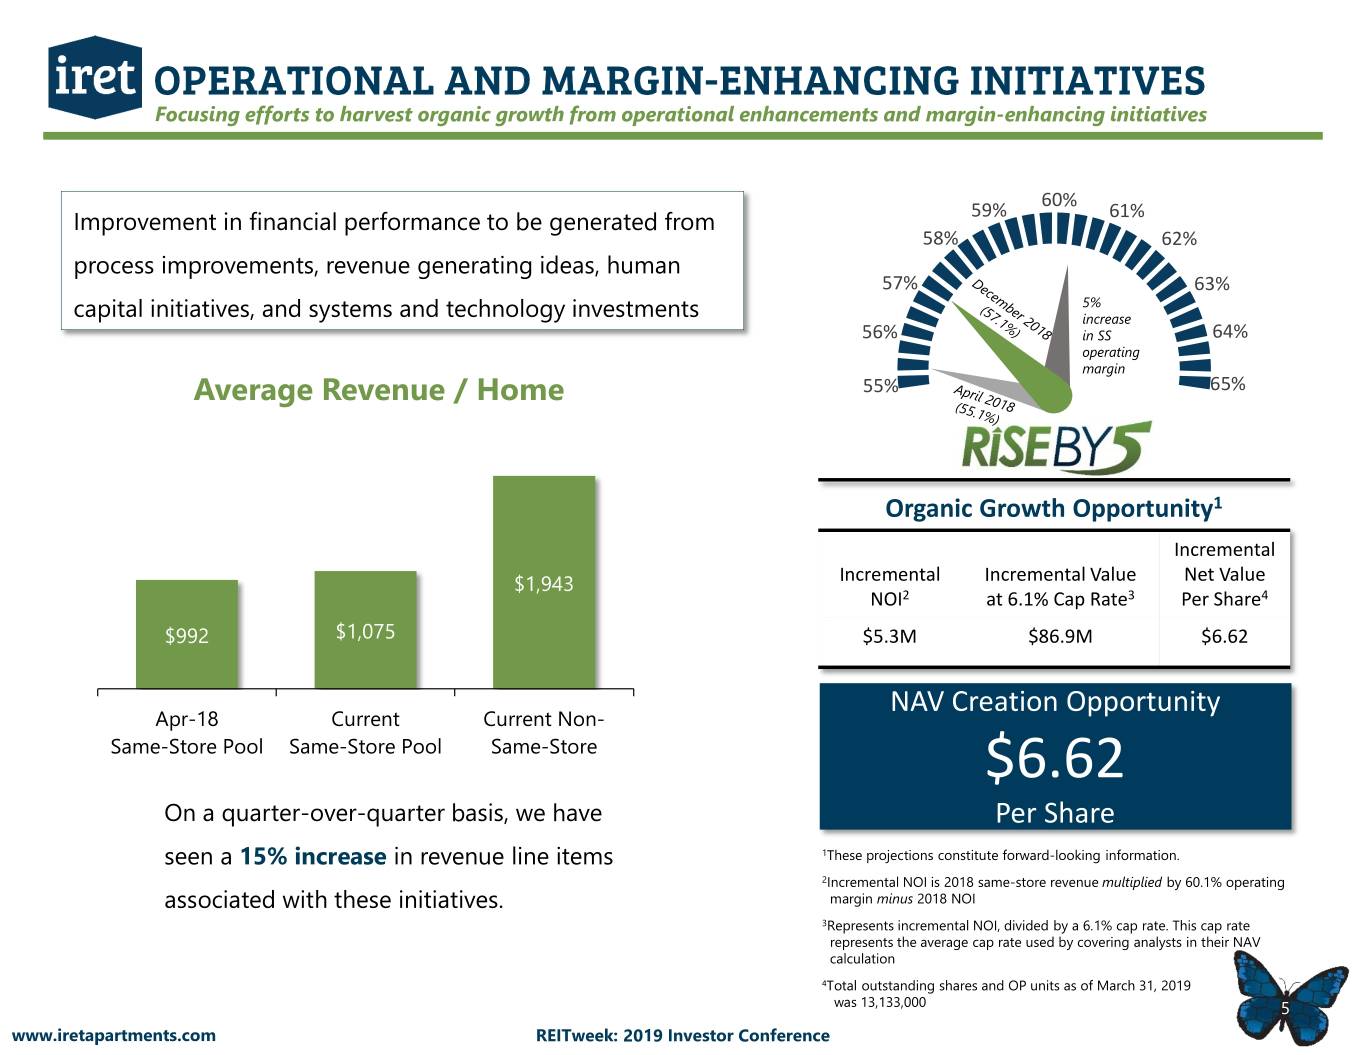
OPERATIONAL AND MARGIN-ENHANCING INITIATIVES Focusing efforts to harvest organic growth from operational enhancements and margin-enhancing initiatives 60% 59% 61% Improvement in financial performance to be generated from 58% 62% process improvements, revenue generating ideas, human 57% 63% 5% capital initiatives, and systems and technology investments increase 56% in SS 64% operating margin Average Revenue / Home 55% 65% Organic Growth Opportunity1 Incremental Incremental Incremental Value Net Value $1,943 NOI2 at 6.1% Cap Rate3 Per Share4 $992 $1,075 $5.3M $86.9M $6.62 NAV Creation Opportunity Apr-18 Current Current Non- Same-Store Pool Same-Store Pool Same-Store $6.62 On a quarter-over-quarter basis, we have Per Share seen a 15% increase in revenue line items 1These projections constitute forward-looking information. 2Incremental NOI is 2018 same-store revenue multiplied by 60.1% operating associated with these initiatives. margin minus 2018 NOI 3Represents incremental NOI, divided by a 6.1% cap rate. This cap rate represents the average cap rate used by covering analysts in their NAV calculation 4Total outstanding shares and OP units as of March 31, 2019 was 13,133,000 5 www.iretapartments.com REITweek: 2019 Investor Conference
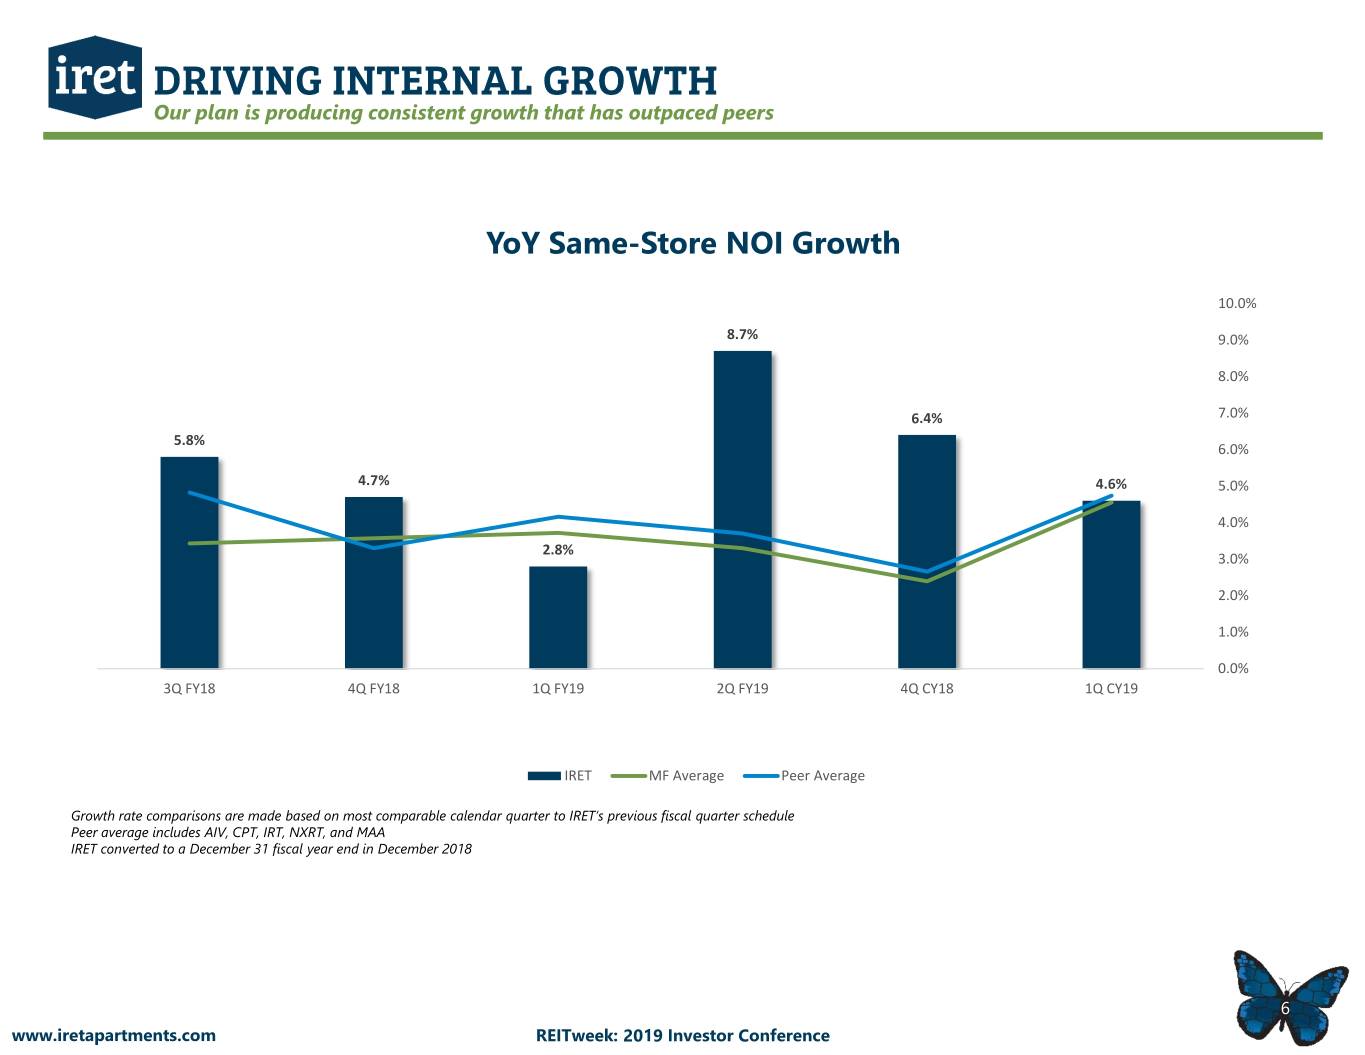
DRIVING INTERNAL GROWTH Our plan is producing consistent growth that has outpaced peers YoY Same-Store NOI Growth 10.0% 8.7% 9.0% 8.0% 6.4% 7.0% 5.8% 6.0% 4.7% 4.6% 5.0% 4.0% 2.8% 3.0% 2.0% 1.0% 0.0% 3Q FY18 4Q FY18 1Q FY19 2Q FY19 4Q CY18 1Q CY19 IRET MF Average Peer Average Growth rate comparisons are made based on most comparable calendar quarter to IRET’s previous fiscal quarter schedule Peer average includes AIV, CPT, IRT, NXRT, and MAA IRET converted to a December 31 fiscal year end in December 2018 6 www.iretapartments.com REITweek: 2019 Investor Conference
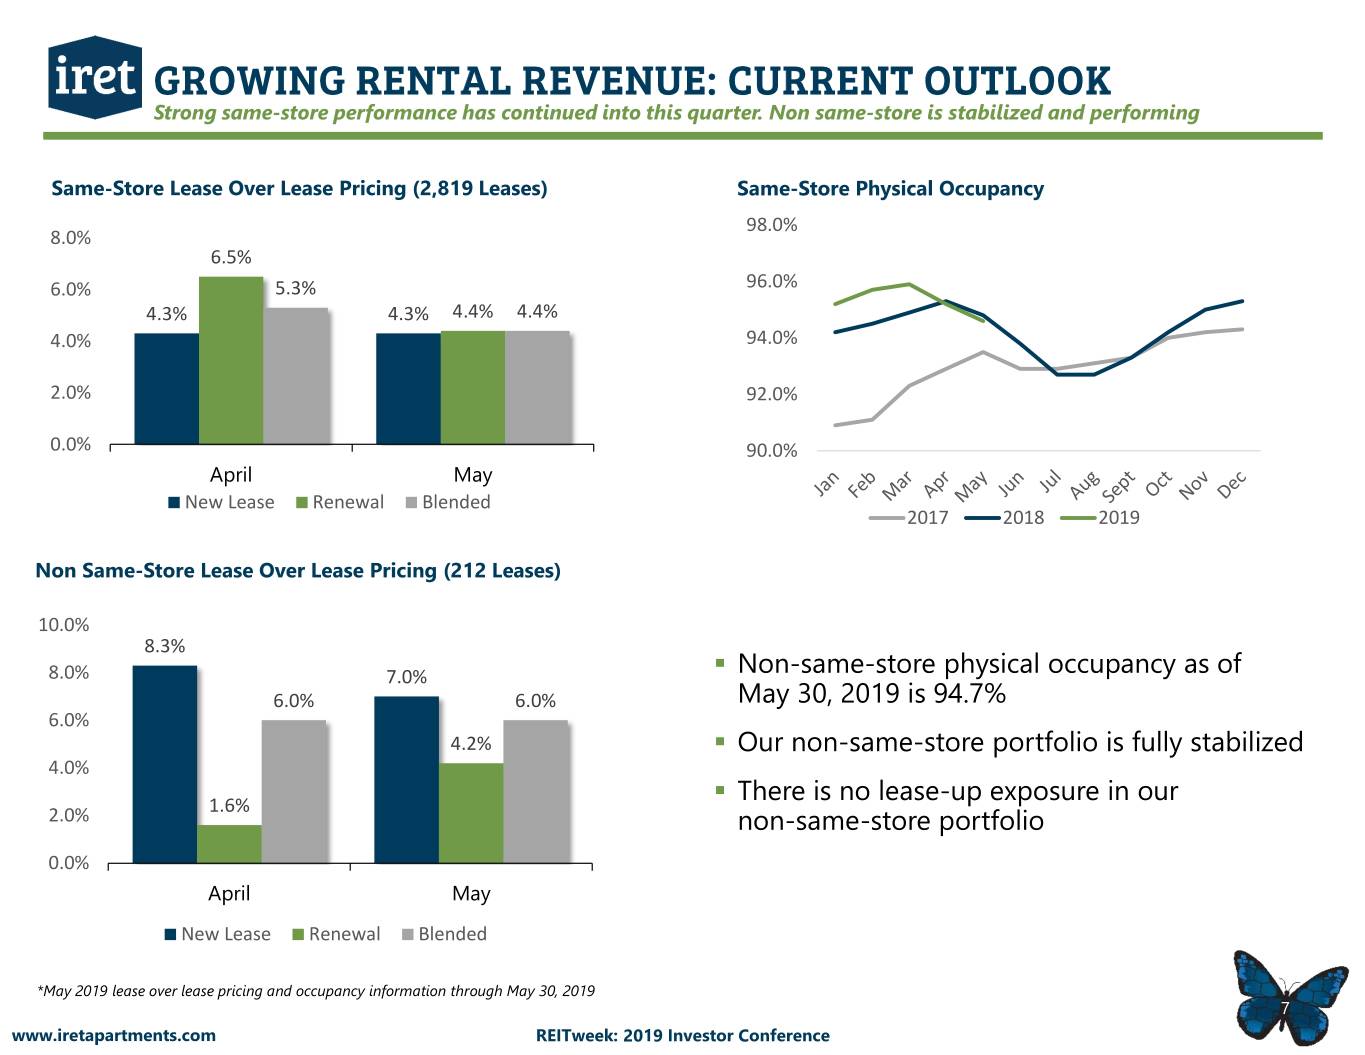
GROWING RENTAL REVENUE: CURRENT OUTLOOK Strong same-store performance has continued into this quarter. Non same-store is stabilized and performing Same-Store Lease Over Lease Pricing (2,819 Leases) Same-Store Physical Occupancy 98.0% 8.0% 6.5% 6.0% 5.3% 96.0% 4.3% 4.3% 4.4% 4.4% 4.0% 94.0% 2.0% 92.0% 0.0% 90.0% April May New Lease Renewal Blended 2017 2018 2019 Non Same-Store Lease Over Lease Pricing (212 Leases) 10.0% 8.3% . 8.0% 7.0% Non-same-store physical occupancy as of 6.0% 6.0% May 30, 2019 is 94.7% 6.0% 4.2% . Our non-same-store portfolio is fully stabilized 4.0% . 1.6% There is no lease-up exposure in our 2.0% non-same-store portfolio 0.0% April May New Lease Renewal Blended *May 2019 lease over lease pricing and occupancy information through May 30, 2019 7 www.iretapartments.com REITweek: 2019 Investor Conference
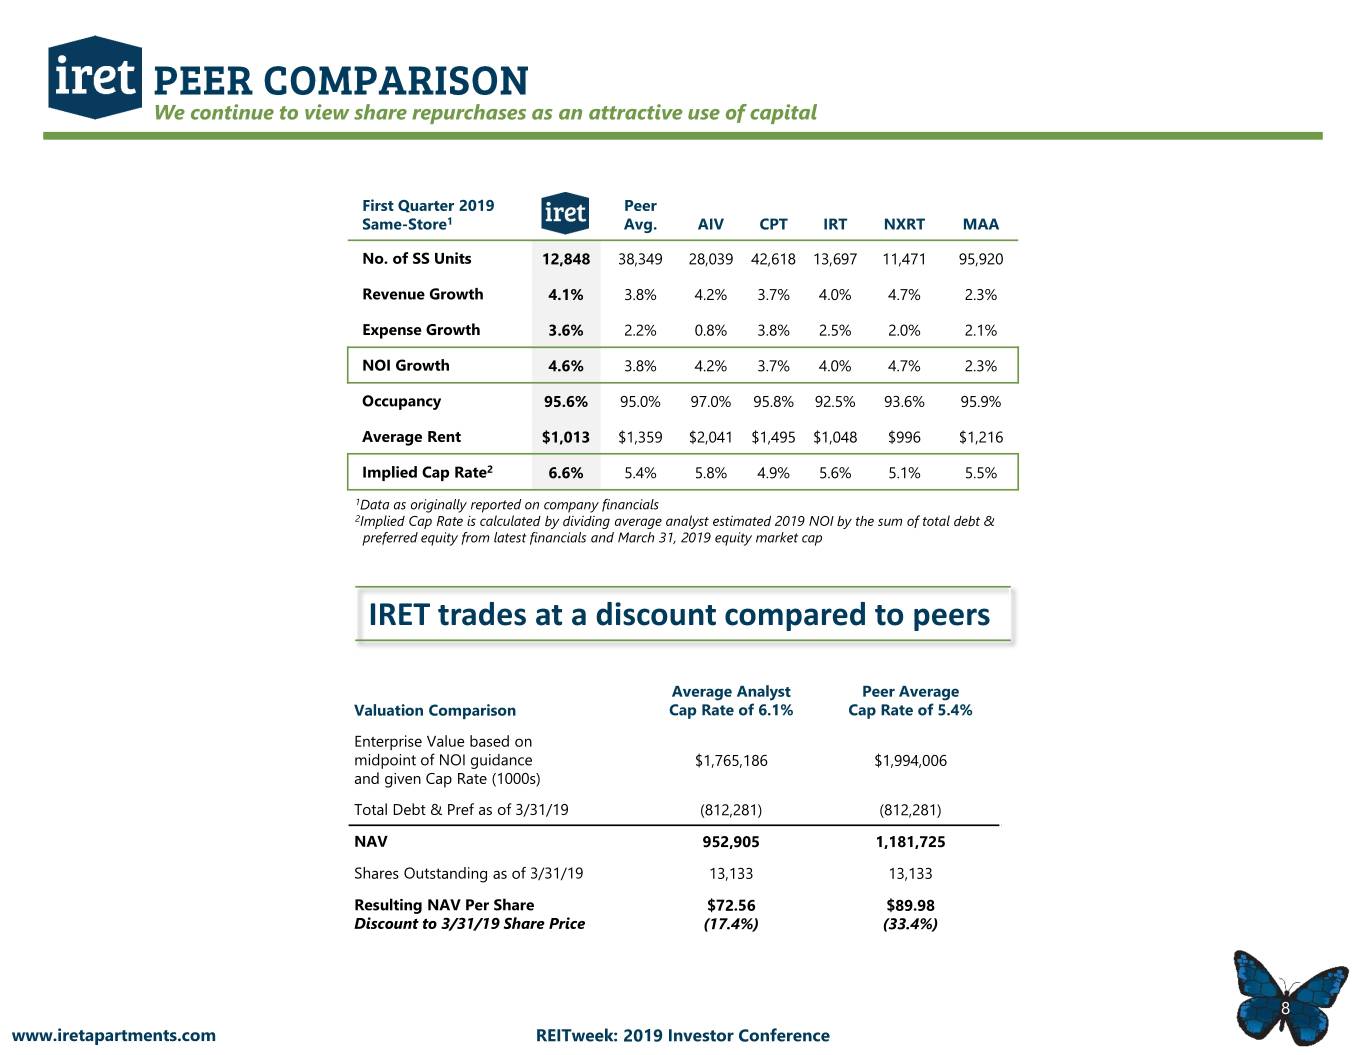
PEER COMPARISON We continue to view share repurchases as an attractive use of capital First Quarter 2019 Peer Same-Store1 Avg. AIV CPT IRT NXRT MAA No. of SS Units 12,848 38,349 28,039 42,618 13,697 11,471 95,920 Revenue Growth 4.1% 3.8% 4.2% 3.7% 4.0% 4.7% 2.3% Expense Growth 3.6% 2.2% 0.8% 3.8% 2.5% 2.0% 2.1% NOI Growth 4.6% 3.8% 4.2% 3.7% 4.0% 4.7% 2.3% Occupancy 95.6% 95.0% 97.0% 95.8% 92.5% 93.6% 95.9% Average Rent $1,013 $1,359 $2,041 $1,495 $1,048 $996 $1,216 Implied Cap Rate2 6.6% 5.4% 5.8% 4.9% 5.6% 5.1% 5.5% 1Data as originally reported on company financials 2Implied Cap Rate is calculated by dividing average analyst estimated 2019 NOI by the sum of total debt & preferred equity from latest financials and March 31, 2019 equity market cap IRET trades at a discount compared to peers Average Analyst Peer Average Valuation Comparison Cap Rate of 6.1% Cap Rate of 5.4% Enterprise Value based on midpoint of NOI guidance $1,765,186 $1,994,006 and given Cap Rate (1000s) Total Debt & Pref as of 3/31/19 (812,281) (812,281) NAV 952,905 1,181,725 Shares Outstanding as of 3/31/19 13,133 13,133 Resulting NAV Per Share $72.56 $89.98 Discount to 3/31/19 Share Price (17.4%) (33.4%) 8 www.iretapartments.com REITweek: 2019 Investor Conference
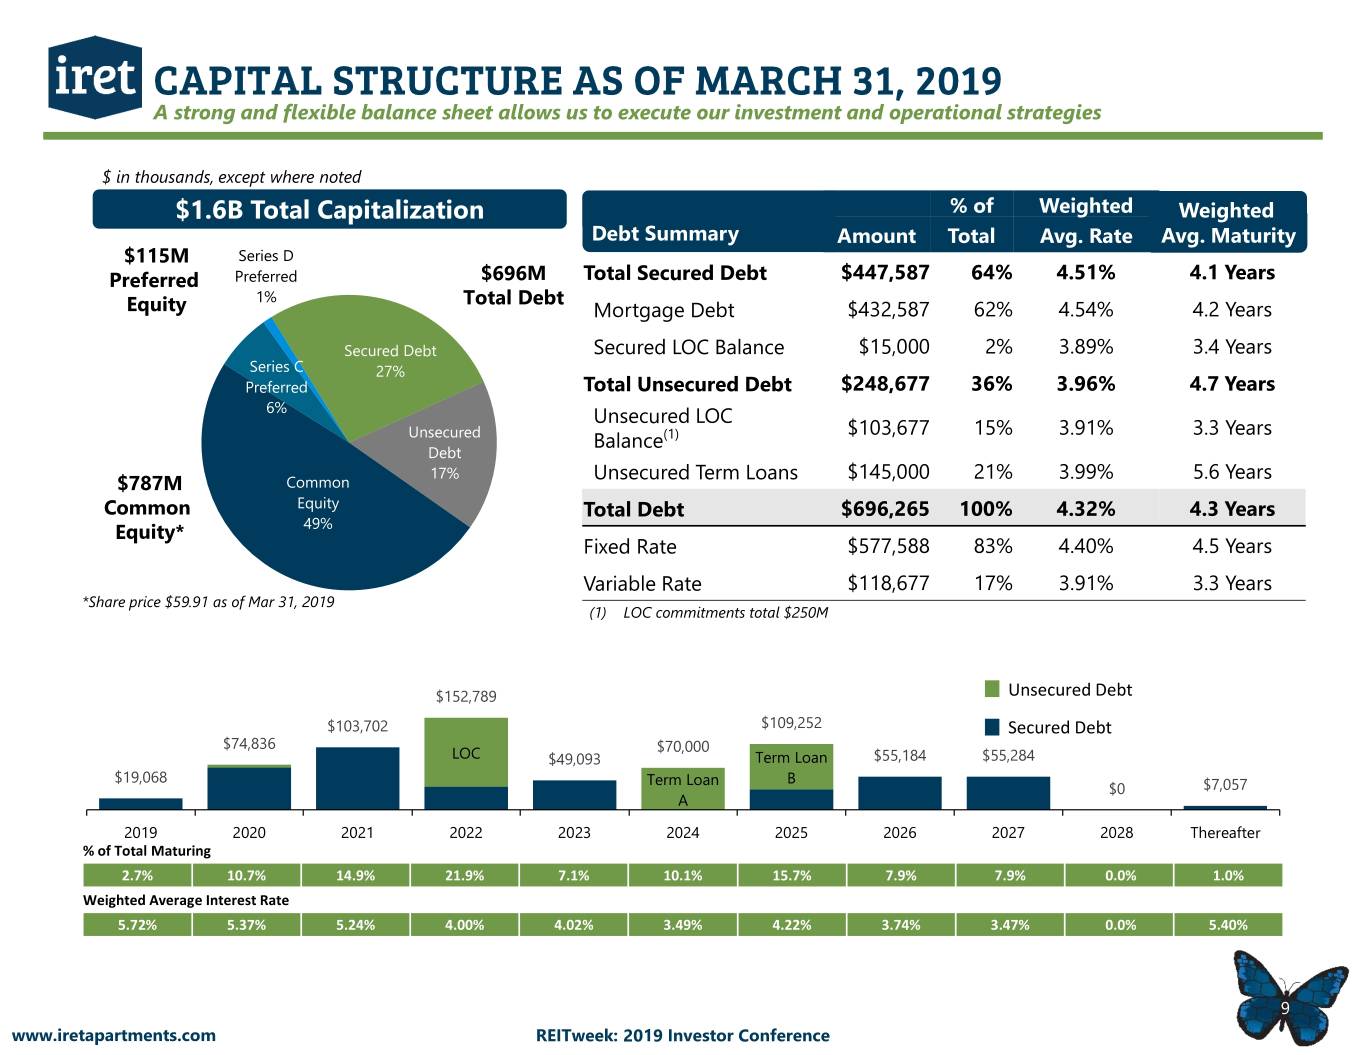
CAPITAL STRUCTURE AS OF MARCH 31, 2019 A strong and flexible balance sheet allows us to execute our investment and operational strategies $ in thousands, except where noted $1.6B Total Capitalization % of Weighted Weighted Debt Summary Amount Total Avg. Rate Avg. Maturity $115M Series D Preferred Preferred $696M Total Secured Debt $447,587 64% 4.51% 4.1 Years 1% Total Debt Equity Mortgage Debt $432,587 62% 4.54% 4.2 Years Secured Debt Secured LOC Balance $15,000 2% 3.89% 3.4 Years Series C 27% Preferred Total Unsecured Debt $248,677 36% 3.96% 4.7 Years 6% Unsecured LOC $103,677 15% 3.91% 3.3 Years Unsecured Balance(1) Debt 17% Unsecured Term Loans $145,000 21% 3.99% 5.6 Years $787M Common Common Equity Total Debt $696,265 100% 4.32% 4.3 Years Equity* 49% Fixed Rate $577,588 83% 4.40% 4.5 Years Variable Rate $118,677 17% 3.91% 3.3 Years *Share price $59.91 as of Mar 31, 2019 (1) LOC commitments total $250M $152,789 Unsecured Debt $103,702 $109,252 Secured Debt $74,836 $70,000 LOC $49,093 Term Loan $55,184 $55,284 $19,068 Term Loan B $0 $7,057 A 2019 2020 2021 2022 2023 2024 2025 2026 2027 2028 Thereafter % of Total Maturing 2.7% 10.7% 14.9% 21.9% 7.1% 10.1% 15.7% 7.9% 7.9% 0.0% 1.0% Weighted Average Interest Rate 5.72% 5.37% 5.24% 4.00% 4.02% 3.49% 4.22% 3.74% 3.47% 0.0% 5.40% 9 www.iretapartments.com REITweek: 2019 Investor Conference
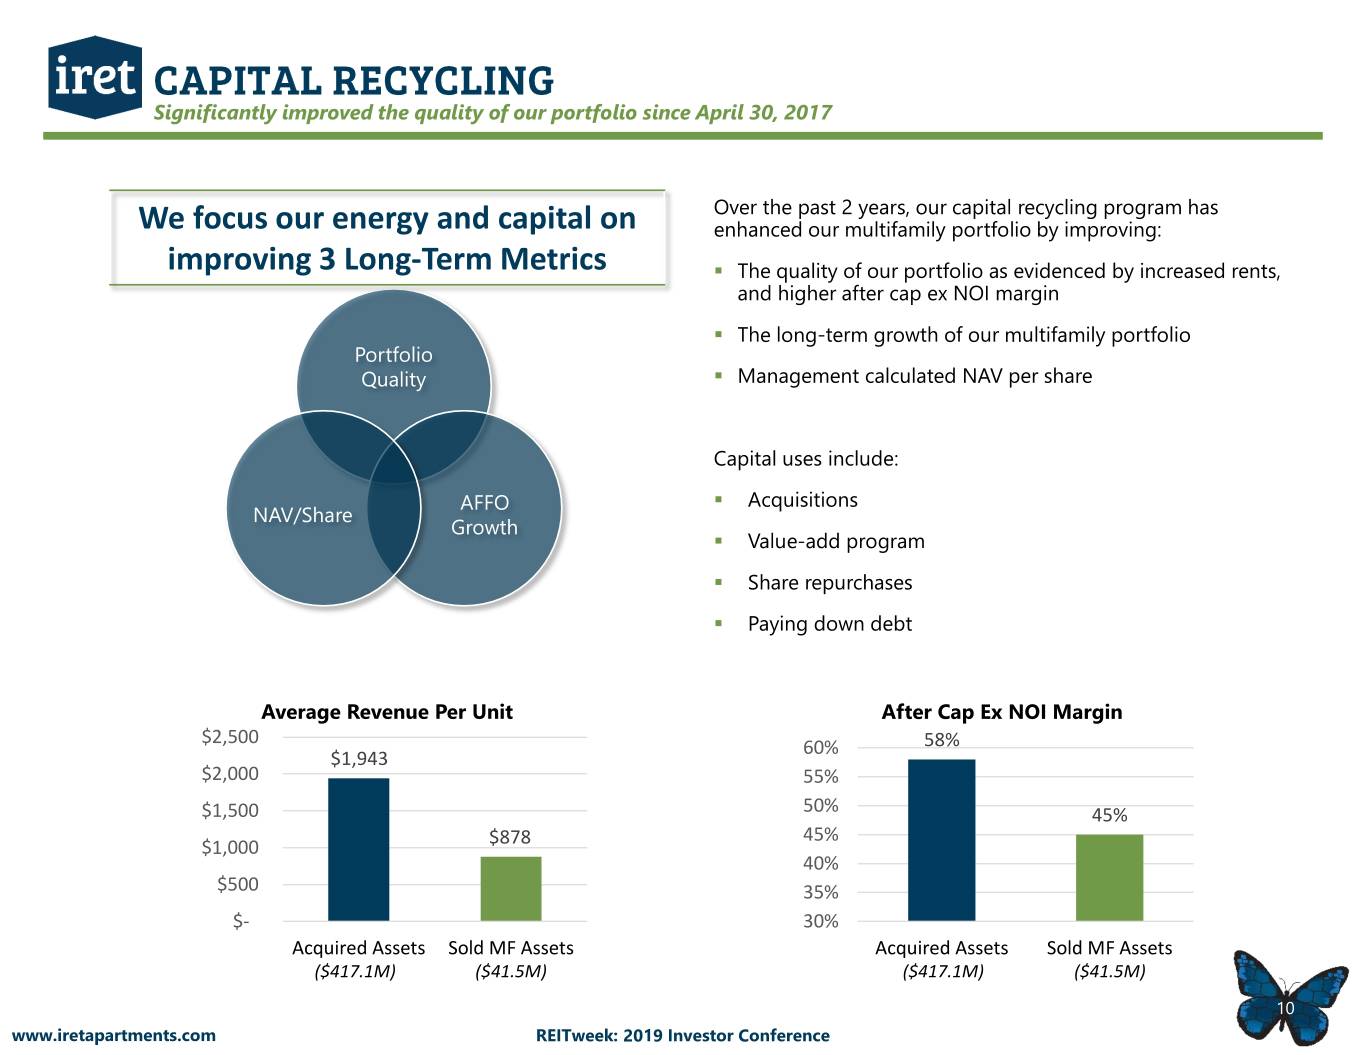
CAPITAL RECYCLING Significantly improved the quality of our portfolio since April 30, 2017 Over the past 2 years, our capital recycling program has We focus our energy and capital on enhanced our multifamily portfolio by improving: improving 3 Long-Term Metrics . The quality of our portfolio as evidenced by increased rents, and higher after cap ex NOI margin . The long-term growth of our multifamily portfolio Portfolio Quality . Management calculated NAV per share Capital uses include: AFFO . Acquisitions NAV/Share Growth . Value-add program . Share repurchases . Paying down debt Average Revenue Per Unit After Cap Ex NOI Margin $2,500 60% 58% $1,943 $2,000 55% $1,500 50% 45% 45% $1,000 $878 40% $500 35% $- 30% Acquired Assets Sold MF Assets Acquired Assets Sold MF Assets ($417.1M) ($41.5M) ($417.1M) ($41.5M) 10 www.iretapartments.com REITweek: 2019 Investor Conference
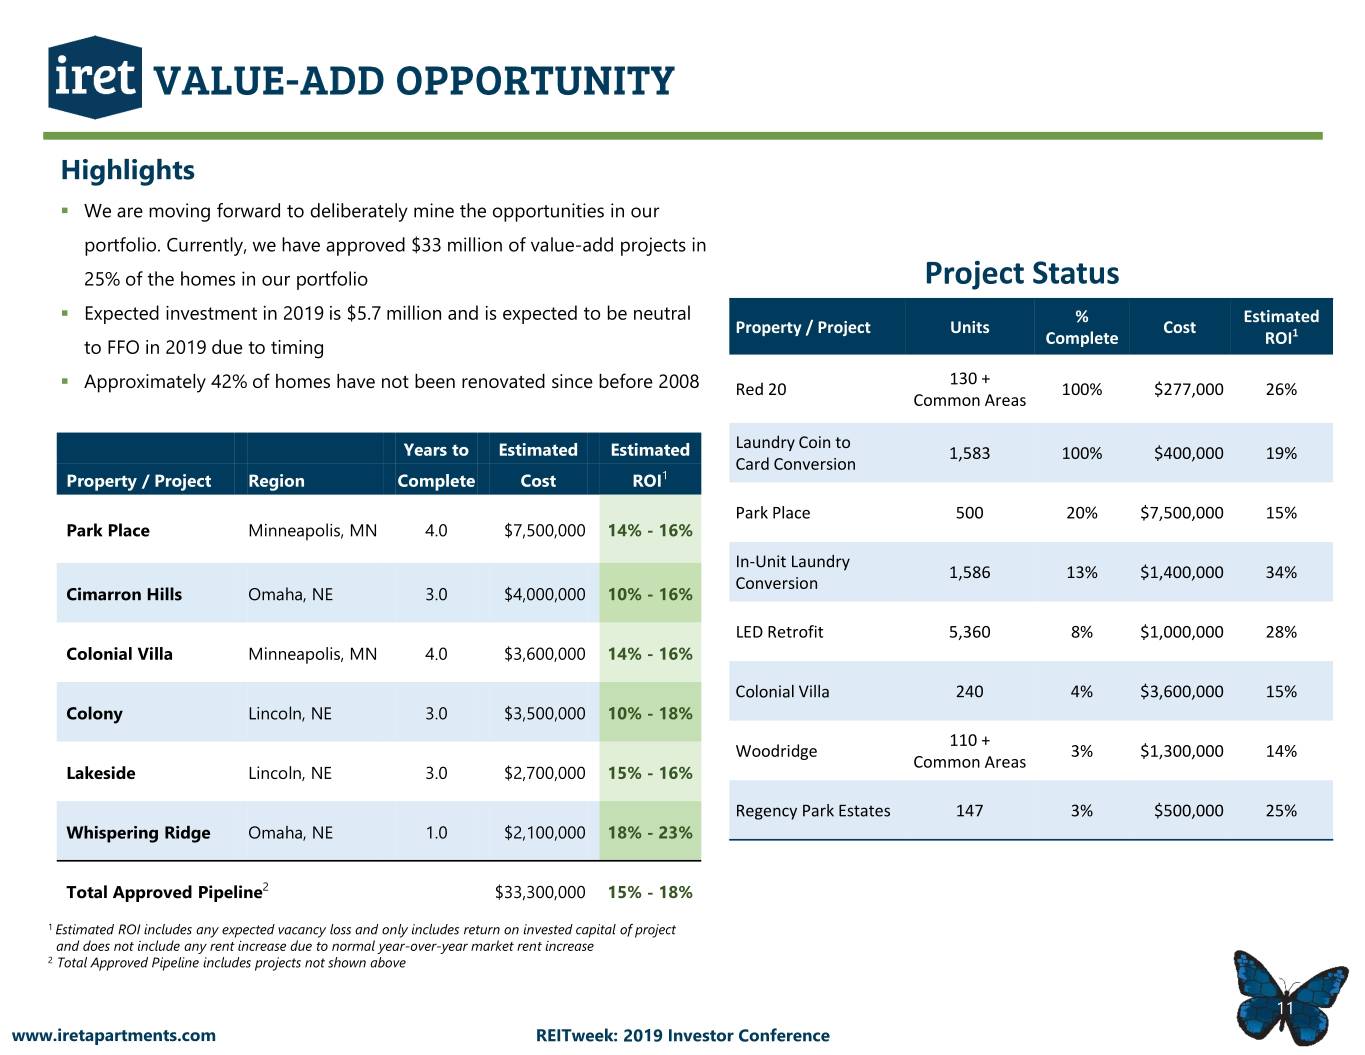
VALUE-ADD OPPORTUNITY Highlights . We are moving forward to deliberately mine the opportunities in our portfolio. Currently, we have approved $33 million of value-add projects in 25% of the homes in our portfolio Project Status . Expected investment in 2019 is $5.7 million and is expected to be neutral % Estimated Property / Project Units Cost Complete ROI1 to FFO in 2019 due to timing 130 + . Approximately 42% of homes have not been renovated since before 2008 Red 20 100% $277,000 26% Common Areas Laundry Coin to Years to Estimated Estimated 1,583 100% $400,000 19% Card Conversion Property / Project Region Complete Cost ROI1 Park Place 500 20% $7,500,000 15% Park Place Minneapolis, MN 4.0 $7,500,000 14% - 16% In-Unit Laundry 1,586 13% $1,400,000 34% Conversion Cimarron Hills Omaha, NE 3.0 $4,000,000 10% - 16% LED Retrofit 5,360 8% $1,000,000 28% Colonial Villa Minneapolis, MN 4.0 $3,600,000 14% - 16% Colonial Villa 240 4% $3,600,000 15% Colony Lincoln, NE 3.0 $3,500,000 10% - 18% 110 + Woodridge 3% $1,300,000 14% Common Areas Lakeside Lincoln, NE 3.0 $2,700,000 15% - 16% Regency Park Estates 147 3% $500,000 25% Whispering Ridge Omaha, NE 1.0 $2,100,000 18% - 23% Total Approved Pipeline2 $33,300,000 15% - 18% 1 Estimated ROI includes any expected vacancy loss and only includes return on invested capital of project and does not include any rent increase due to normal year-over-year market rent increase 2 Total Approved Pipeline includes projects not shown above 11 www.iretapartments.com REITweek: 2019 Investor Conference
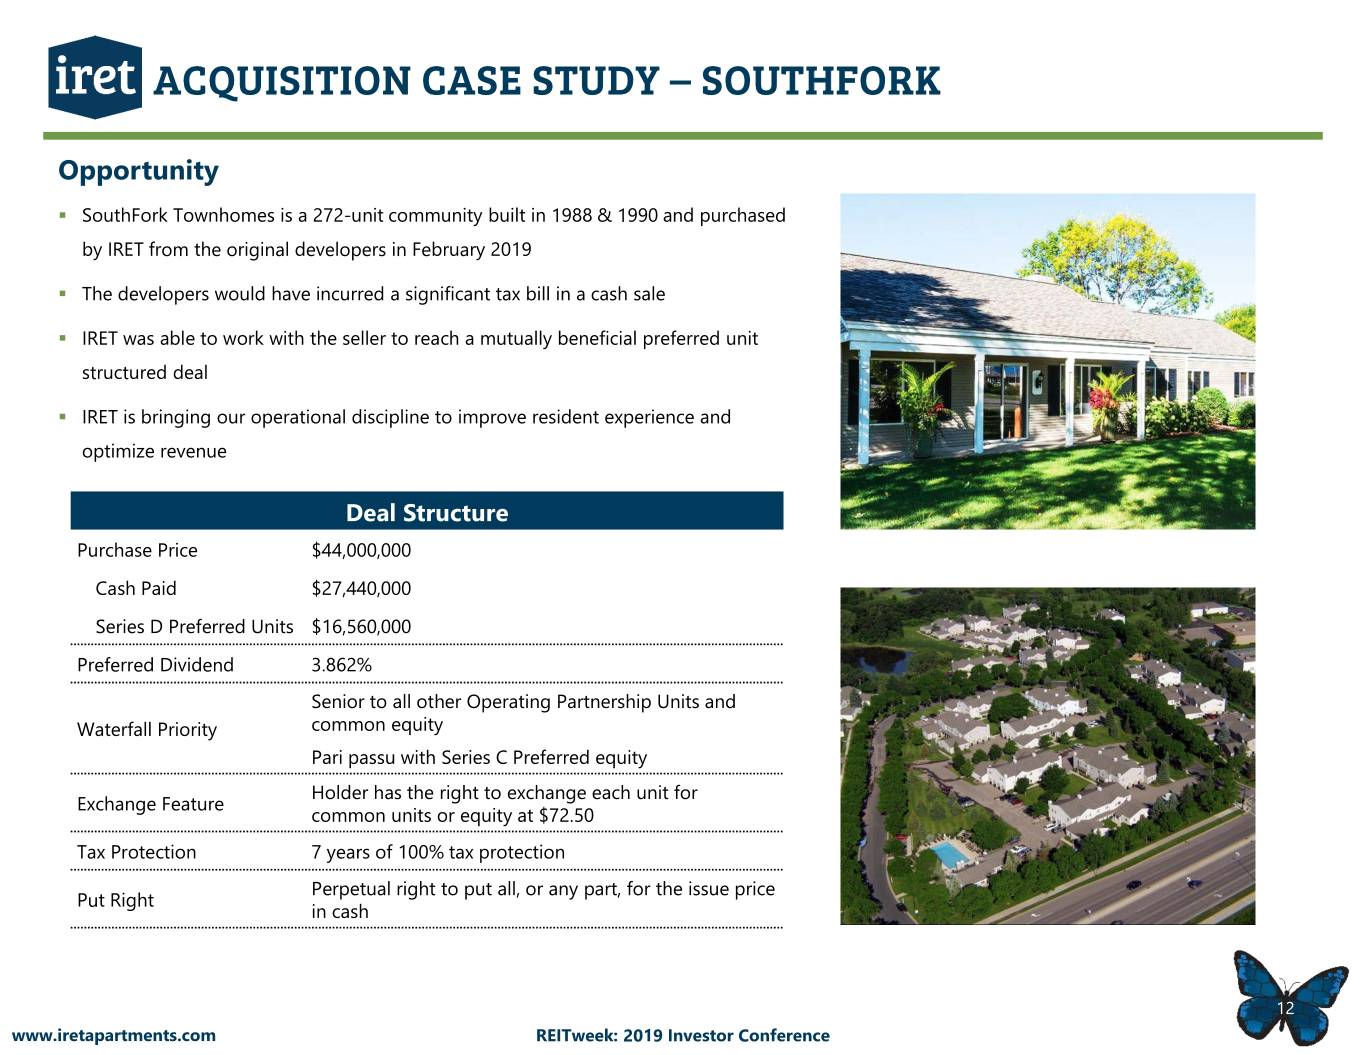
ACQUISITION CASE STUDY – SOUTHFORK Opportunity . SouthFork Townhomes is a 272-unit community built in 1988 & 1990 and purchased by IRET from the original developers in February 2019 . The developers would have incurred a significant tax bill in a cash sale . IRET was able to work with the seller to reach a mutually beneficial preferred unit structured deal . IRET is bringing our operational discipline to improve resident experience and optimize revenue Deal Structure Purchase Price $44,000,000 Cash Paid $27,440,000 Series D Preferred Units $16,560,000 Preferred Dividend 3.862% Senior to all other Operating Partnership Units and Waterfall Priority common equity Pari passu with Series C Preferred equity Holder has the right to exchange each unit for Exchange Feature common units or equity at $72.50 Tax Protection 7 years of 100% tax protection Perpetual right to put all, or any part, for the issue price Put Right in cash 12 www.iretapartments.com REITweek: 2019 Investor Conference
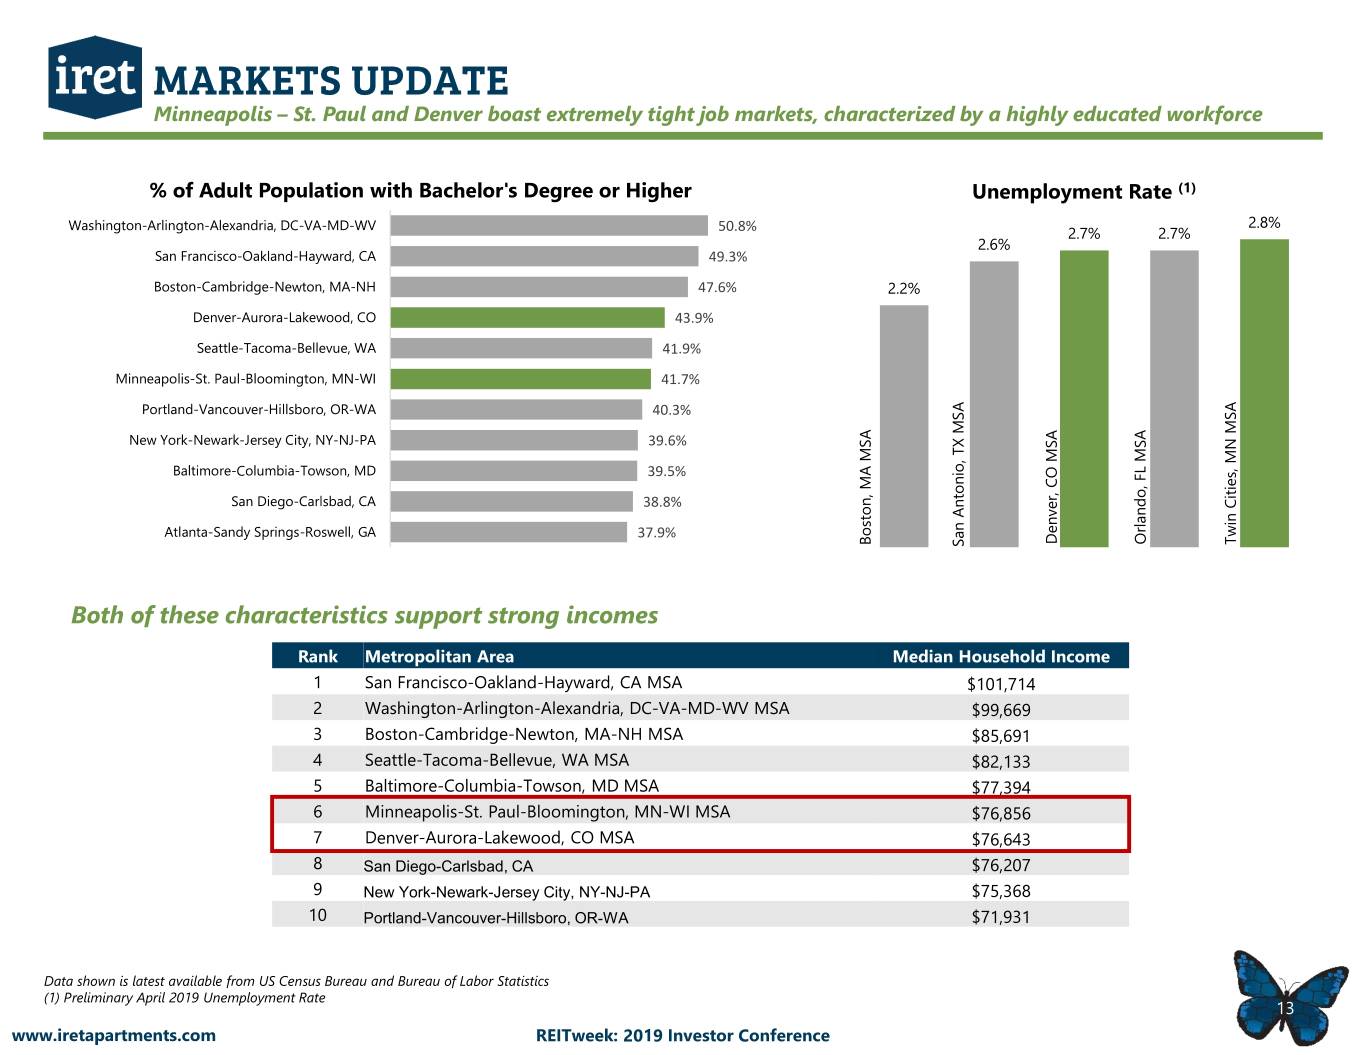
MARKETS UPDATE Minneapolis – St. Paul and Denver boast extremely tight job markets, characterized by a highly educated workforce % of Adult Population with Bachelor's Degree or Higher Unemployment Rate (1) Washington-Arlington-Alexandria, DC-VA-MD-WV 50.8% 2.8% 2.7% 2.7% 2.6% San Francisco-Oakland-Hayward, CA 49.3% Boston-Cambridge-Newton, MA-NH 47.6% 2.2% Denver-Aurora-Lakewood, CO 43.9% Seattle-Tacoma-Bellevue, WA 41.9% Minneapolis-St. Paul-Bloomington, MN-WI 41.7% Portland-Vancouver-Hillsboro, OR-WA 40.3% New York-Newark-Jersey City, NY-NJ-PA 39.6% Baltimore-Columbia-Towson, MD 39.5% San Diego-Carlsbad, CA 38.8% Atlanta-Sandy Springs-Roswell, GA 37.9% Denver, CO MSA Orlando, FL MSA Twin Cities, MN MSA Boston, MA MSA San Antonio,MSA TX Both of these characteristics support strong incomes Rank Metropolitan Area Median Household Income 1 San Francisco-Oakland-Hayward, CA MSA $101,714 2 Washington-Arlington-Alexandria, DC-VA-MD-WV MSA $99,669 3 Boston-Cambridge-Newton, MA-NH MSA $85,691 4 Seattle-Tacoma-Bellevue, WA MSA $82,133 5 Baltimore-Columbia-Towson, MD MSA $77,394 6 Minneapolis-St. Paul-Bloomington, MN-WI MSA $76,856 7 Denver-Aurora-Lakewood, CO MSA $76,643 8 San Diego-Carlsbad, CA $76,207 9 New York-Newark-Jersey City, NY-NJ-PA $75,368 10 Portland-Vancouver-Hillsboro, OR-WA $71,931 Data shown is latest available from US Census Bureau and Bureau of Labor Statistics (1) Preliminary April 2019 Unemployment Rate 13 www.iretapartments.com REITweek: 2019 Investor Conference
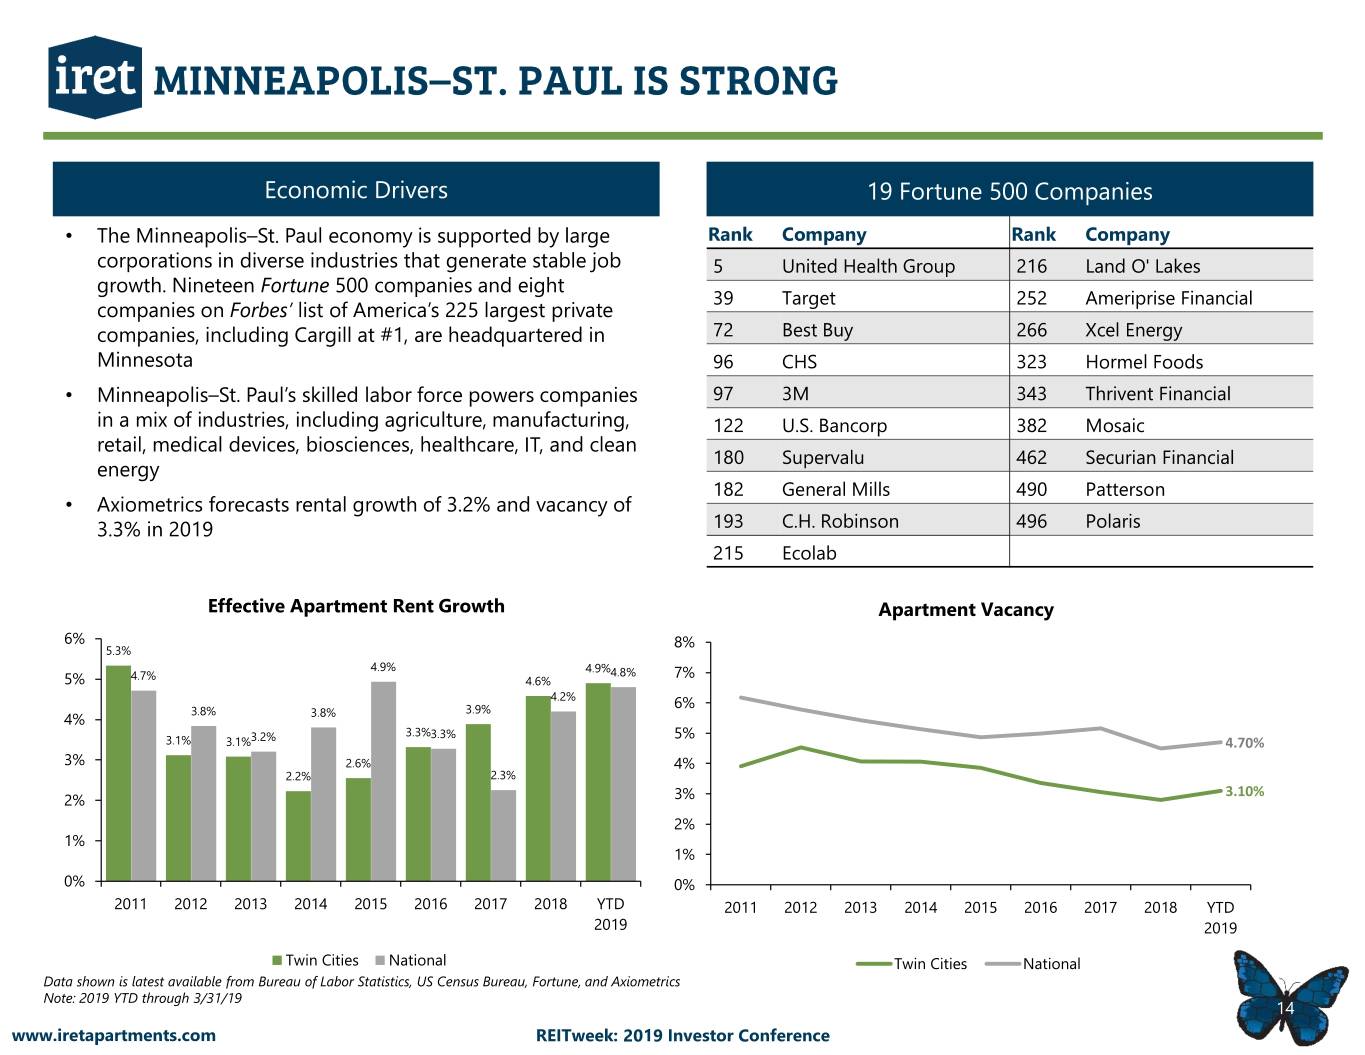
MINNEAPOLIS–ST. PAUL IS STRONG Economic Drivers 19 Fortune 500 Companies • The Minneapolis–St. Paul economy is supported by large Rank Company Rank Company corporations in diverse industries that generate stable job 5 United Health Group 216 Land O' Lakes growth. Nineteen Fortune 500 companies and eight 39 Target 252 Ameriprise Financial companies on Forbes’ list of America’s 225 largest private companies, including Cargill at #1, are headquartered in 72 Best Buy 266 Xcel Energy Minnesota 96 CHS 323 Hormel Foods • Minneapolis–St. Paul’s skilled labor force powers companies 97 3M 343 Thrivent Financial in a mix of industries, including agriculture, manufacturing, 122 U.S. Bancorp 382 Mosaic retail, medical devices, biosciences, healthcare, IT, and clean 180 Supervalu 462 Securian Financial energy 182 General Mills 490 Patterson • Axiometrics forecasts rental growth of 3.2% and vacancy of 3.3% in 2019 193 C.H. Robinson 496 Polaris 215 Ecolab Effective Apartment Rent Growth Apartment Vacancy 6% 5.3% 8% 4.9% 4.9%4.8% 7% 5% 4.7% 4.6% 4.2% 3.8% 3.9% 6% 4% 3.8% 3.3%3.3% 5% 3.1% 3.1%3.2% 4.70% 3% 2.6% 4% 2.2% 2.3% 3.10% 2% 3% 2% 1% 1% 0% 0% 2011 2012 2013 2014 2015 2016 2017 2018 YTD 2011 2012 2013 2014 2015 2016 2017 2018 YTD 2019 2019 Twin Cities National Twin Cities National Data shown is latest available from Bureau of Labor Statistics, US Census Bureau, Fortune, and Axiometrics Note: 2019 YTD through 3/31/19 14 www.iretapartments.com REITweek: 2019 Investor Conference
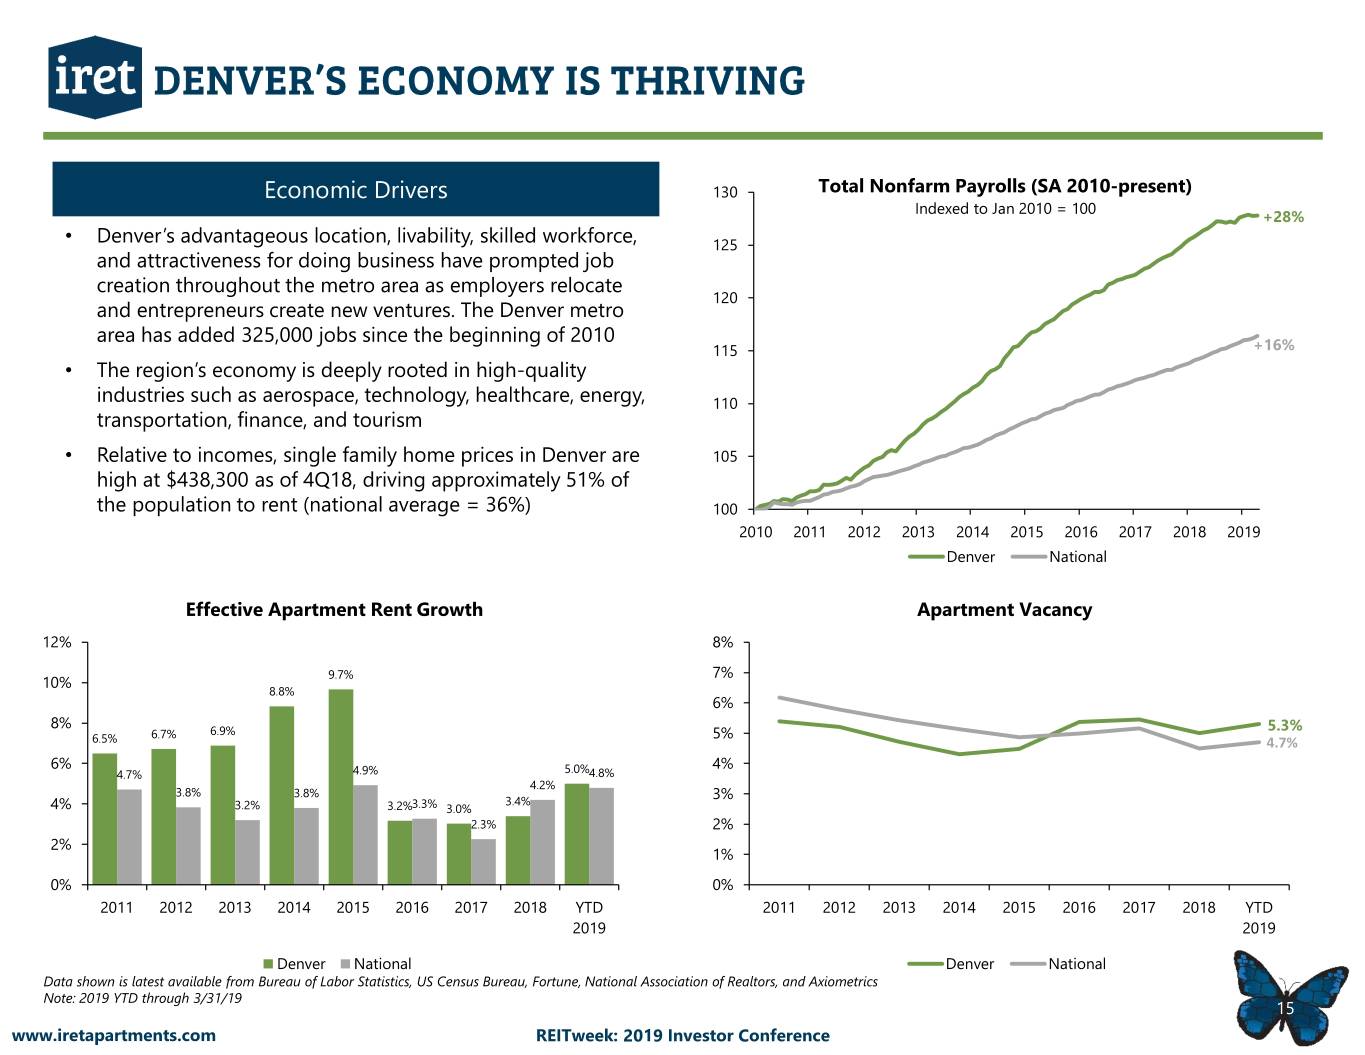
DENVER’S ECONOMY IS THRIVING Economic Drivers 130 Total Nonfarm Payrolls (SA 2010-present) Indexed to Jan 2010 = 100 +28% • Denver’s advantageous location, livability, skilled workforce, 125 and attractiveness for doing business have prompted job creation throughout the metro area as employers relocate 120 and entrepreneurs create new ventures. The Denver metro area has added 325,000 jobs since the beginning of 2010 115 +16% • The region’s economy is deeply rooted in high-quality industries such as aerospace, technology, healthcare, energy, 110 transportation, finance, and tourism • Relative to incomes, single family home prices in Denver are 105 high at $438,300 as of 4Q18, driving approximately 51% of the population to rent (national average = 36%) 100 2010 2011 2012 2013 2014 2015 2016 2017 2018 2019 Denver National Effective Apartment Rent Growth Apartment Vacancy 12% 8% 9.7% 7% 10% 8.8% 6% 8% 5.3% 6.7% 6.9% 5% 6.5% 4.7% 6% 4% 4.7% 4.9% 5.0%4.8% 4.2% 3.8% 3.8% 3.4% 3% 4% 3.2% 3.2%3.3% 3.0% 2.3% 2% 2% 1% 0% 0% 2011 2012 2013 2014 2015 2016 2017 2018 YTD 2011 2012 2013 2014 2015 2016 2017 2018 YTD 2019 2019 Denver National Denver National Data shown is latest available from Bureau of Labor Statistics, US Census Bureau, Fortune, National Association of Realtors, and Axiometrics Note: 2019 YTD through 3/31/19 15 www.iretapartments.com REITweek: 2019 Investor Conference
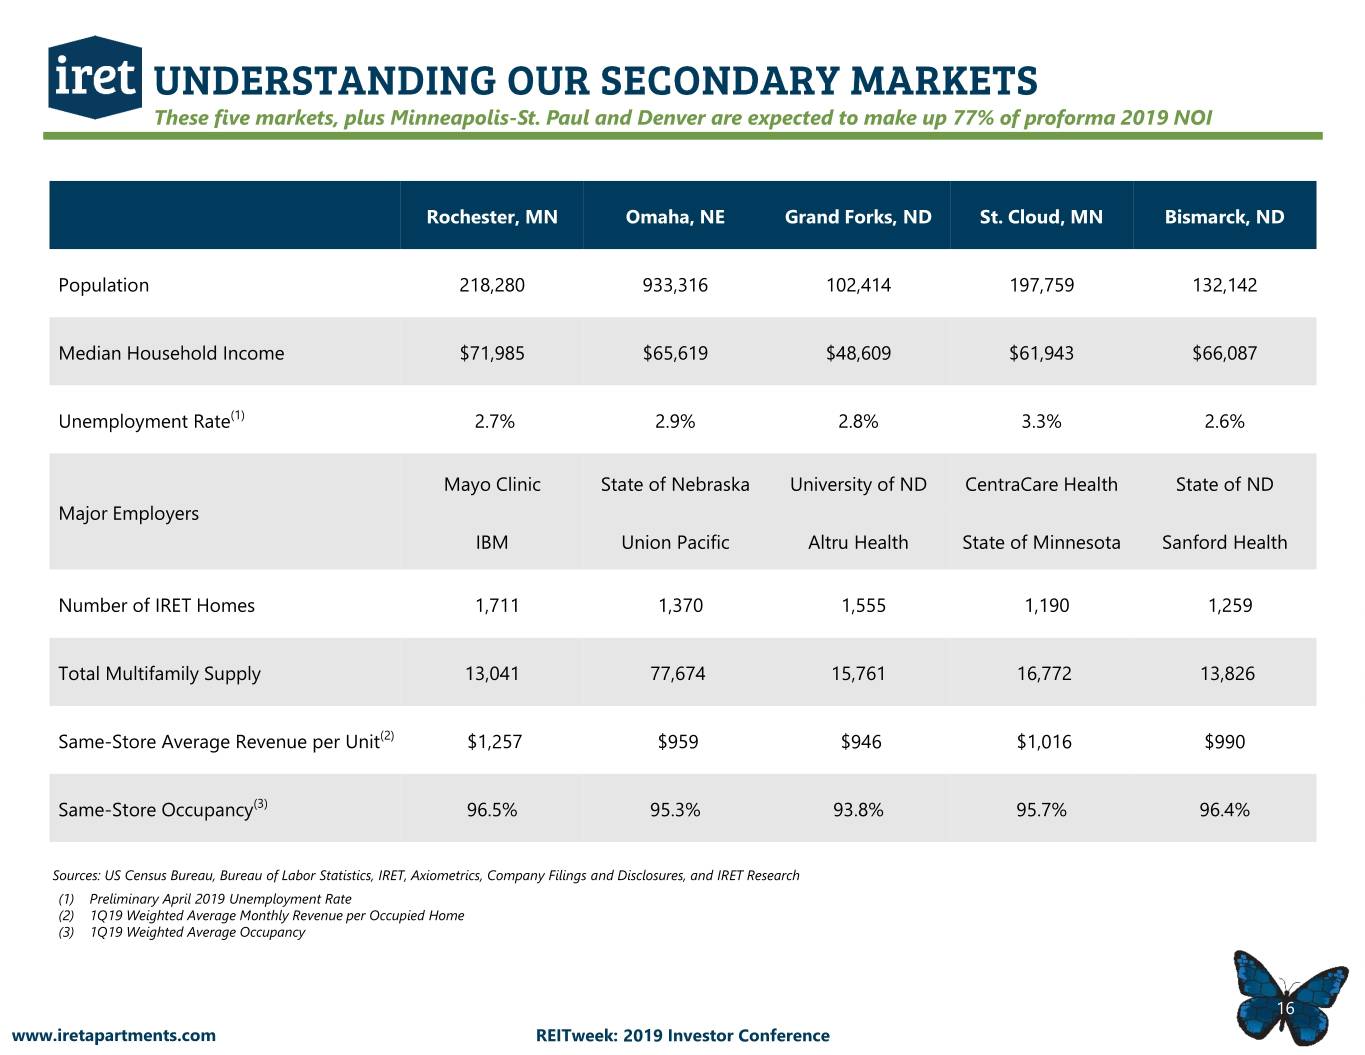
UNDERSTANDING OUR SECONDARY MARKETS These five markets, plus Minneapolis-St. Paul and Denver are expected to make up 77% of proforma 2019 NOI Rochester, MN Omaha, NE Grand Forks, ND St. Cloud, MN Bismarck, ND Population 218,280 933,316 102,414 197,759 132,142 Median Household Income $71,985 $65,619 $48,609 $61,943 $66,087 Unemployment Rate(1) 2.7% 2.9% 2.8% 3.3% 2.6% Mayo Clinic State of Nebraska University of ND CentraCare Health State of ND Major Employers IBM Union Pacific Altru Health State of Minnesota Sanford Health Number of IRET Homes 1,711 1,370 1,555 1,190 1,259 Total Multifamily Supply 13,041 77,674 15,761 16,772 13,826 Same-Store Average Revenue per Unit(2) $1,257 $959 $946 $1,016 $990 Same-Store Occupancy(3) 96.5% 95.3% 93.8% 95.7% 96.4% Sources: US Census Bureau, Bureau of Labor Statistics, IRET, Axiometrics, Company Filings and Disclosures, and IRET Research (1) Preliminary April 2019 Unemployment Rate (2) 1Q19 Weighted Average Monthly Revenue per Occupied Home (3) 1Q19 Weighted Average Occupancy 16 www.iretapartments.com REITweek: 2019 Investor Conference
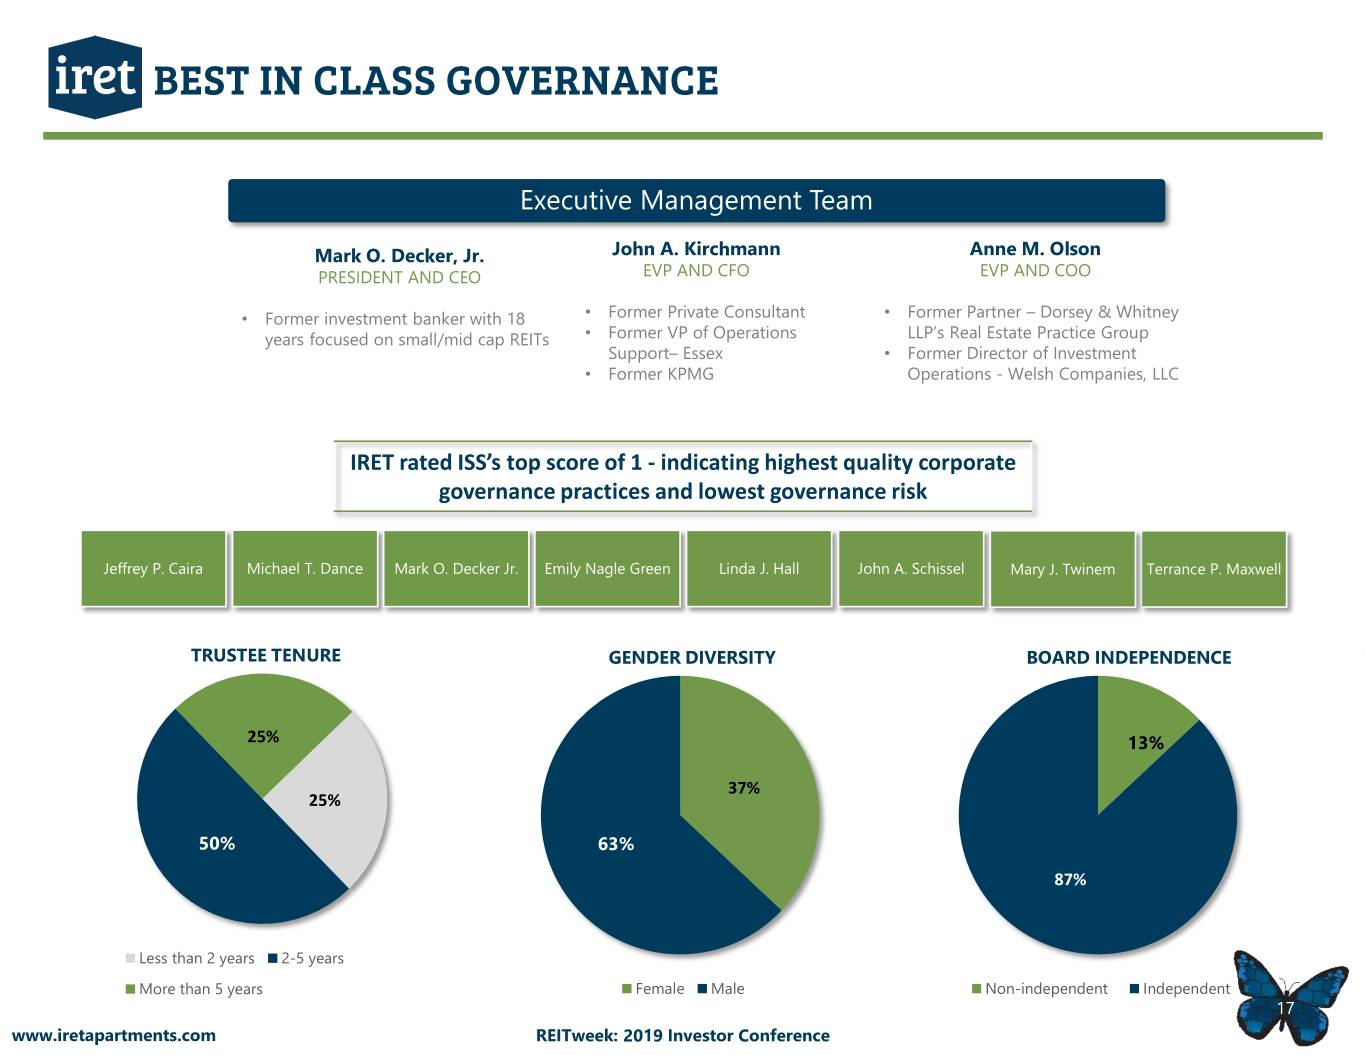
BEST IN CLASS GOVERNANCE Executive Management Team Mark O. Decker, Jr. John A. Kirchmann Anne M. Olson PRESIDENT AND CEO EVP AND CFO EVP AND COO • Former investment banker with 18 • Former Private Consultant • Former Partner – Dorsey & Whitney years focused on small/mid cap REITs • Former VP of Operations LLP’s Real Estate Practice Group Support– Essex • Former Director of Investment • Former KPMG Operations - Welsh Companies, LLC IRET rated ISS’s top score of 1 - indicating highest quality corporate governance practices and lowest governance risk Jeffrey P. Caira Michael T. Dance Mark O. Decker Jr. Emily Nagle Green Linda J. Hall John A. Schissel Mary J. Twinem Terrance P. Maxwell TRUSTEE TENURE GENDER DIVERSITY BOARD INDEPENDENCE 25% 13% 37% 25% 50% 63% 87% Less than 2 years 2-5 years More than 5 years Female Male Non-independent Independent 17 www.iretapartments.com REITweek: 2019 Investor Conference
INVESTMENT HIGHLIGHTS Internal Growth Opportunities Flexible Balance Sheet Differentiated Market Exposure Value Add Opportunities Best in Class Governance 18 www.iretapartments.com REITweek: 2019 Investor Conference

Investor Relations Contact: Jonathan Bishop ir@iret.com 952.401.4827


