Table of Contents
As filed with the Securities and Exchange Commission on August 2, 2021
UNITED STATES
SECURITIES AND EXCHANGE COMMISSION
Washington, D.C. 20549
FORM N-CSR
CERTIFIED SHAREHOLDER REPORT OF REGISTERED
MANAGEMENT INVESTMENT COMPANIES
Investment Company Act File Number 811-4786
Ariel Investment Trust
(Exact name of registrant as specified in charter)
200 East Randolph Street
Suite 2900
Chicago, Illinois, 60601
(Address of principal executive offices) (Zip code)
Mareilé B. Cusack, Esq.
200 East Randolph Street
Suite 2900
Chicago, Illinois 60601
(Name and address of agent for service)
with a copy to:
Arthur Don, Esq.
Greenberg Traurig, LLP
77 West Wacker Drive
Suite 3100
Chicago, IL 60601
Registrant’s telephone number, including area code: (312) 726-0140
Date of fiscal year end: September 30
Date of reporting period: March 31, 2021
Table of Contents
Item 1. Reports to Stockholders.
(a) The following is a copy of the report transmitted to shareholders pursuant to Rule 30e-1 under the Investment Company Act of 1940 (the “Act”) (17 CFR 270.30e-1):
Table of Contents

The patient investor
SEMI-ANNUAL REPORT: 03/31/21
Ariel Fund
Ariel Appreciation Fund
Ariel Focus Fund
Ariel International Fund
Ariel Global Fund

Slow and steady wins the race.
Table of Contents
Ariel Investment Trust
c/o U.S. Bank Global Fund Services
P.O. Box 701
Milwaukee, WI 53201-0701
800.292.7435
• arielinvestments.com
• linkedin.com/company/ariel-investments
• instagram.com/arielinvestments
• twitter.com/arielinvests
Table of Contents
| 3 | ||||||||
| 8 | ||||||||
| 13 | ||||||||
| 18 | ||||||||
Semi-annual report | ||||||||
| 21 | ||||||||
| 32 | ||||||||
| 34 | ||||||||
| 36 | ||||||||
| 39 | ||||||||
| 44 | ||||||||
| 50 | ||||||||
| 54 | ||||||||
| 55 | ||||||||
| 56 | ||||||||
| 57 | ||||||||
Information about the Funds’ indexes and the GICS sector classification standards | 58 | |||||||
Table of Contents
Table of Contents

 |  | |
| John W. Rogers, Jr. | Mellody Hobson | |
| Chairman and | Co-CEO and | |
| Co-CEO | President | |
Average annual total returns as of 03/31/21
| 1Q21 | 1-year | 3-year | 5-year | 10-year |
Since | |||||||
Ariel Fund
| 19.50% | 102.70% | 11.97% | 13.71% | 11.09% | 11.49% | ||||||
Russell 2500TM Value Index
| 16.83 | 87.47 | 10.88 | 12.15 | 10.23 | 11.18 | ||||||
Russell 2500TM Index
| 10.93 | 89.40 | 15.34 | 15.93 | 12.20 | 11.23 | ||||||
S&P 500® Index
| 6.17 | 56.35 | 16.78 | 16.29 | 13.91 | 10.89 | ||||||
* The inception date for Ariel Fund is 11/06/86.
Average annual total returns as of 03/31/21
| 1Q21 | 1-year | 3-year | 5-year | 10-year |
Since | |||||||
| Ariel Appreciation Fund | 15.65% | 81.07% | 10.16% | 11.28% | 10.21% | 10.72% | ||||||
| Russell Midcap® Value Index | 13.05 | 73.76 | 10.70 | 11.60 | 11.05 | 11.38 | ||||||
| Russell Midcap® Index | 8.14 | 73.64 | 14.73 | 14.67 | 12.47 | 11.66 | ||||||
| S&P 500® Index | 6.17 | 56.35 | 16.78 | 16.29 | 13.91 | 10.36 | ||||||
* The inception date for Ariel Appreciation Fund is 12/01/89.
Performance data quoted represents past performance. Past performance does not guarantee future results. All performance assumes the reinvestment of dividends and capital gains and represents returns of the Investor Class shares. The investment return and principal value of an investment will fluctuate so that an investor’s shares, when redeemed, may be worth more or less than their original cost. Current performance may be lower or higher than the performance data quoted. Any extraordinary performance shown for short-term periods may not be sustainable and is not representative of the performance over longer periods. Performance data current to the most recent month-end for Ariel Fund and Ariel Appreciation Fund may be obtained by visiting our website, arielinvestments.com.
ARIELINVESTMENTS.COM 3
Table of Contents
Six months ago, we ended our September 30, 2020 letter by writing, “…we believe smaller companies are well-positioned to slingshot out of this pandemic.” We were not just “talking our book.” Instead, we offered a detailed rationale for our optimism. Since then, we have witnessed a market leadership change with smaller companies and value shares taking center stage. For the quarter ending March 31, 2021, large cap indices performed well on an absolute basis, but their relative results significantly lagged the re-discovered small and midcap benchmarks as well as our funds.
Ariel Fund and Ariel Appreciation Fund beat both their value and core benchmarks as well as the broad market during the three-month period, with only a bit of cash and a lack of Energy marginally nipping results.
For the first time in our 38-year history we have posted triple digit twelve-month gains. These eye-popping one-year numbers have been turbocharged by renewed investor interest in our sweet spot—misunderstood, ignored and unloved small and mid-sized companies. While on the surface, returns might appear to be excessive, they make perfect sense in the context of the pandemic-induced free-fall and outsized investor fears that roiled markets last Spring. In the wake of a strong economic recovery, rationality has prevailed. That said, The New York Times is right to counsel, “As an investor, you aren’t likely to see many years like this.”1
THE MADNESS OF CROWDS
It is fair to say, crowds have been more than a bit mad this year. The gates have literally and figuratively been stormed as increasingly divided societies boldly took to the streets in our country and around the world. Even homebound day traders mounted a gloves-off attack against “big money” market makers. Armed with stimulus checks, FinTech apps and message boards, they decided it was time to be seen and heard. “[With] retail trading now account[ing] for as much volume as mutual funds and hedge funds combined,”
the pack flexed its muscle.2 Surging share prices were decoupled from fundamentals. Out of nowhere, some of the most random stocks were “crowdfunded” by everyday people, united in their mission to leverage the power in their numbers. They bid up the frailest of names to unimaginable heights and took public victory laps as they giddily squeezed hedge fund shorts along the way.
The poster child for this fury was a flailing fanboy favorite. As the Financial Times summed, “Investors coordinating their purchases on Reddit’s Wall Street Bets message board were able to drive up the share price of GameStop, the US video retailer, from less than $20 at the start of the year to more than $480 by late January, while the prices of some other beaten down stocks also soared.”3 That random and frenetic action distorted smaller company benchmark returns in ways never seen before. GameStop’s (GME) +907% return was not only the single largest contributor to the small cap benchmarks4 for the quarter; this one company, whose average weight was under 0.50% in the Russell 2000 Value Index, added a whopping 75 basis points to its returns for the period.
SIDESTEPPING THE SIDESHOWS
These crowded trades were just one of the many manias that have played out this year. Of late, headlines are dominated by speculative excess. Bitcoin and other cryptocurrencies are now even juicing some corporate balance sheets. SPACs—the blank check companies waiting around for something to buy—have raised more money so far than in all of 2020. And newfangled concepts called NFTs, short for non-fungible tokens (which explains everything), put head scratching value on any and all things digital. There is a last century, dotcom feel to this simmering mania.
While we are aware of the dubious forces around us, we are not distracted from our task at hand—mining value. But now, at a time of ever intensifying market highs, some are asking if value still has room to run, given its meaningful performance divergence from its growth stock peers since
| 1 | Sommer, Jeff. “Now That Everyone is Bullish, Exercise Caution,” The New York Times. April 25, 2021. |
| 2 | Phillips, Matt. “As Retail Trading Spikes, A Focus on the Little Guy,” The New York Times. April 15, 2021. |
| 3 | Fletcher, Laurence. “Hedge funds rethink after GameStop pain,” Financial Times. April 15, 2021. |
| 4 | Russell 2000 and Russell 2000 Value Indices. |
4 SLOW AND STEADY WINS THE RACE
Table of Contents
last Fall. We believe the following graphs make a convincing case for value’s continued outperformance. The first shows value still trades at a steep discount relative to growth despite recent performance strength.
Relative fwd P/E of Russell 1000 Value vs. Growth (1978–present)
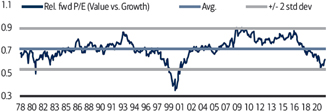
Source: BofA US Equity & US Quant Strategy. FactSet
A look back to 1926, as depicted below, shows value tends to beat growth for an average duration of 33 months. As of April 2021, we were in month seven.
Value/Growth performance (Fama French factors based on Book Value to Price) with cycles determined by 10% moves
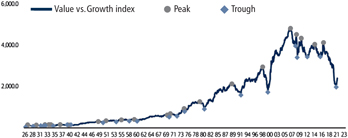
Source: Tuck School of Business data library. BofA US Equity & Quant Strategy; Note: March performance is based on the Russell 1000 Balue and Growth Index. Past performance does not guarantee future results.
In what has been one of the most incredible and unpredictable market environments in history, we remain focused on the fundamentals of individual companies as opposed to the vicissitudes of the markets and market actors around us. One could easily become sidetracked by the sideshows. Instead, our long-term, patient investing philosophy compels us to look beyond the horizon and to tune out the noise. We can sleep at night knowing we own shares of real businesses. In the end, fundamentals matter,
and the circus always moves on. To this last point, we are always watching closely for signs of cracks and fissures, waiting to pounce. Sooner or later, there might even be opportunity in some of today’s irrationality.
“We can sleep at night knowing we own shares of real businesses.”
PORTFOLIO COMINGS AND GOINGS
While we did not exit any holdings during the quarter in Ariel Fund, we initiated a position in Axalta Coating Systems, Ltd. (AXTA) which is emerging from the shadow of its former parent, DuPont. We expect Axalta—a leading manufacturer of coatings for cars and trucks—to continue to gain market share from ongoing consolidation in its refinishing business and further margin improvement through cost savings programs.
Likewise, we added nVent Electric (NVT) and Axalta to Ariel Appreciation Fund while successfully exiting Nordstrom, Inc. (JWN) and ViacomCBS Inc. (VIAC).
As always, we appreciate the opportunity to serve you and welcome any questions or comments you might have.
Sincerely,
 |  | |
| John W.Rogers, Jr. | Mellody Hobson | |
| Chairman and Co-CEO | Co-CEO and President |
ARIELINVESTMENTS.COM 5
Table of Contents
Ariel Fund performance summary
| INCEPTION: 11/06/86
| |
| ||
 |  |  | ||
| John W. Rogers, Jr. | John P. Miller, CFA | Kenneth E. Kuhrt, CPA | ||
| Lead portfolio | Portfolio | Portfolio | ||
| manager | manager | manager | ||
Composition of equity holdings (%)
| Ariel Fund | Russell 2500 Value Index | Russell 2500 Index | S&P 500 Index | |||||
Consumer discretionary | 27.29 | 18.32 | 16.67 | 16.49 | ||||
Financials | 22.48 | 20.96 | 14.40 | 10.86 | ||||
Industrials | 20.21 | 19.54 | 18.56 | 14.13 | ||||
Health care | 7.33 | 6.02 | 14.40 | 12.43 | ||||
Real estate | 5.46 | 11.31 | 8.13 | 2.46 | ||||
Consumer staples | 3.12 | 3.22 | 3.02 | 5.47 | ||||
Utilities | 3.10 | 3.85 | 3.00 | 2.88 | ||||
Basic materials | 1.34 | 5.32 | 4.18 | 1.91 | ||||
Energy | 1.21 | 4.34 | 3.59 | 2.87 | ||||
Technology | 0.00 | 6.04 | 12.79 | 27.05 | ||||
Telecommunications | 0.00 | 1.09 | 1.27 | 3.45 | ||||
Sector weightings for the Fund are calculated based on equity holdings as a percentage of total net assets.
Average annual total returns (%) as of 3/31/21
| Quarter | 1-year | 3-year | 5-year | 10-year | 20-year | Since inception | ||||||||||||||||||||||
Ariel Fund–Investor Class |
| 19.50 |
|
| 102.70 |
|
| 11.97 |
|
| 13.71 |
|
| 11.09 |
|
| 9.39 |
|
| 11.49 |
| |||||||
Ariel Fund–Institutional Class+ |
| 19.59 |
|
| 103.37 |
|
| 12.32 |
|
| 14.05 |
|
| 11.41 |
|
| 9.55 |
|
| 11.58 |
| |||||||
Russell 2500TM Value Index |
| 16.83 |
|
| 87.47 |
|
| 10.88 |
|
| 12.15 |
|
| 10.23 |
|
| 9.89 |
|
| 11.18 |
| |||||||
Russell 2500TM Index |
| 10.93 |
|
| 89.40 |
|
| 15.34 |
|
| 15.93 |
|
| 12.20 |
|
| 10.51 |
|
| 11.23 |
| |||||||
S&P 500® Index |
| 6.17 |
|
| 56.35 |
|
| 16.78 |
|
| 16.29 |
|
| 13.91 |
|
| 8.47 |
|
| 10.89 |
| |||||||
Performance data quoted represents past performance and does not guarantee future results. All performance assumes the reinvestment of dividends and capital gains. The investment return and principal value of an investment will fluctuate so that an investor’s shares, when redeemed, may be worth more or less than their original cost. Current performance may be lower or higher than the performance data quoted. Any extraordinary performance shown for short-term periods may not be sustainable and is not representative of the performance over longer periods. To access performance data current to the most recent month-end, visit arielinvestments.com.
Growth of a $10,000 investment since inception (Investor Class)
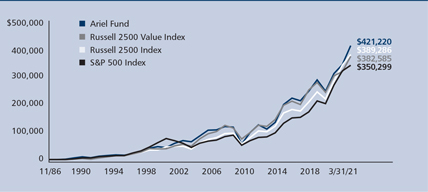
The graph and performance table do not reflect the deduction of taxes that a shareholder would pay on fund distributions or the redemption of fund shares. Total return does not reflect a maximum 4.75% sales load charged prior to 7/15/94.
| Expense ratio (as of 9/30/20) | ||||||||
Investor Class |
| 1.04 | % | |||||
Institutional Class |
| 0.72 | % | |||||
| Top ten equity holdings (% of net assets) | ||||||||||||
| 1. | Lazard Ltd., Class A | 4.3 | 6. | Envista Holdings Corp. | 3.2 | |||||||
| 2. | Mohawk Industries, Inc. | 4.1 | 7. | JLL | 3.2 | |||||||
| 3. | First American Financial Corp. | 3.6 | 8. | Meredith Corp. | 3.1 | |||||||
| 4. | Nielsen Holdings plc | 3.4 | 9. | Affiliated Managers Group, Inc. | 3.1 | |||||||
| 5. | Interpublic Group of Cos., Inc. | 3.3 | 10. | J.M. Smucker Co. | 3.1 | |||||||
| + | The inception date for the Institutional Class shares is December 30, 2011. Performance information for the Institutional Class prior to that date reflects the actual performance of the Fund’s Investor Class (and uses the actual expenses of the Fund’s Investor Class, for such period of time), without any adjustments. For any such period of time, the performance of the Fund’s Institutional Class would have been substantially similar to, yet higher than, the performance of the Fund’s Investor Class, because the shares of both classes are invested in the same portfolio of securities, but the classes bear different expenses, which are primarily differences in distribution and service fees. |
6 SLOW AND STEADY WINS THE RACE
Table of Contents
| ||
Ariel Appreciation Fund performance summary
| INCEPTION: 12/01/89
| |
| ||
|  | |||
| John W. Rogers, Jr. | Timothy R. Fidler,CFA | |||
| Co-portfolio | Co-portfolio | |||
| manager | manager | |||
Composition of equity holdings (%)
| Ariel Apprec- iation Fund | Russell Midcap Value Index | Russell Midcap Index | S&P 500 Index | |||||
Financials | 32.96 | 15.62 | 11.71 | 10.86 | ||||
Consumer discretionary | 22.63 | 16.88 | 16.37 | 16.49 | ||||
Industrials | 14.42 | 19.40 | 18.35 | 14.13 | ||||
Health Care | 13.05 | 6.84 | 11.20 | 12.43 | ||||
Consumer staples | 7.37 | 4.49 | 4.49 | 5.47 | ||||
Utilities | 3.04 | 7.58 | 5.08 | 2.88 | ||||
Real estate | 1.98 | 10.17 | 7.75 | 2.46 | ||||
Energy | 1.40 | 4.38 | 3.40 | 2.87 | ||||
Technology | 0.00 | 8.11 | 16.09 | 27.05 | ||||
Basic materials | 0.00 | 4.81 | 3.70 | 1.91 | ||||
Telecommunications | 0.00 | 1.71 | 1.86 | 3.45 | ||||
Sector weightings for the Fund are calculated based on equity holdings as a percentage of total net assets.
Average annual total returns (%) as of 3/31/21
| Quarter | 1-year | 3-year | 5-year | 10-year | 20-year | Since inception | ||||||||||||||||||||||
Ariel Appreciation Fund–Investor Class |
| 15.65 |
|
| 81.07 |
|
| 10.16 |
|
| 11.28 |
|
| 10.21 |
|
| 8.97 |
|
| 10.72 |
| |||||||
Ariel Appreciation Fund–Institutional Class+ |
| 15.72 |
|
| 81.61 |
|
| 10.50 |
|
| 11.62 |
|
| 10.53 |
|
| 9.13 |
|
| 10.82 |
| |||||||
Russell Midcap® Value Index |
| 13.05 |
|
| 73.76 |
|
| 10.70 |
|
| 11.60 |
|
| 11.05 |
|
| 10.14 |
|
| 11.38 |
| |||||||
Russell Midcap® Index |
| 8.14 |
|
| 73.64 |
|
| 14.73 |
|
| 14.67 |
|
| 12.47 |
|
| 10.48 |
|
| 11.66 |
| |||||||
S&P 500® Index |
| 6.17 |
|
| 56.35 |
|
| 16.78 |
|
| 16.29 |
|
| 13.91 |
|
| 8.47 |
|
| 10.36 |
| |||||||
Performance data quoted represents past performance and does not guarantee future results. All performance assumes the reinvestment of dividends and capital gains. The investment return and principal value of an investment will fluctuate so that an investor’s shares, when redeemed, may be worth more or less than their original cost. Current performance may be lower or higher than the performance data quoted. Any extraordinary performance shown for short-term periods may not be sustainable and is not representative of the performance over longer periods. To access performance data current to the most recent month-end, visit arielinvestments.com.
Growth of a $10,000 investment since inception (Investor Class)
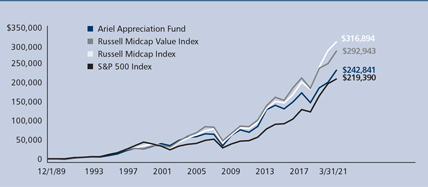
The graph and performance table do not reflect the deduction of taxes that a shareholder would pay on fund distributions or the redemption of fund shares. Total return does not reflect a maximum 4.75% sales load charged prior to 7/15/94.
| Expense ratio (as of 9/30/20) | ||||||||
Investor Class |
| 1.15 | % | |||||
Institutional Class |
| 0.84 | % | |||||
| Top ten equity holdings (% of net assets) | ||||||||||||
| 1. | Northern Trust Corp. | 4.0 | 6. | Interpublic Group of Cos., Inc. | 3.6 | |||||||
| 2. | BOK Financial Corp. | 3.9 | 7. | The Charles Schwab Corp. | 3.5 | |||||||
| 3. | Aflac, Inc. | 3.7 | 8. | Laboratory Corp. of America Holdings | 3.5 | |||||||
| 4. | Goldman Sachs Group, Inc. | 3.7 | 9. | Progressive Corp. | 3.5 | |||||||
| 5. | Lazard Ltd., Class A | 3.6 | 10. | Walgreens Boots Alliance, Inc. | 3.5 | |||||||
| + | The inception date for the Institutional Class shares is December 30, 2011. Performance information for the Institutional Class prior to that date reflects the actual performance of the Fund’s Investor Class (and uses the actual expenses of the Fund’s Investor Class, for such period of time), without any adjustments. For any such period of time, the performance of the Fund’s Institutional Class would have been substantially similar to, yet higher than, the performance of the Fund’s Investor Class, because the shares of both classes are invested in the same portfolio of securities, but the classes bear different expenses, which are primarily differences in distribution and service fees. |
ARIELINVESTMENTS.COM 7
Table of Contents


Charles K. Bobrinskoy
Vice Chairman
Portfolio Manager
Average annual total returns as of 03/31/21
1Q21
| 1-year
| 3-year
| 5-year
| 10-year
| Since
| |||||||||||||||||||
Ariel Focus Fund |
| 16.48 | % |
| 85.57 | % |
| 11.00 | % |
| 13.20 | % |
| 9.48 | % |
| 6.90 | % | ||||||
Russell 1000® Value Index |
| 11.26 |
|
| 56.09 |
|
| 10.96 |
|
| 11.74 |
|
| 10.99 |
|
| 8.05 |
| ||||||
S&P 500® Index |
| 6.17 |
|
| 56.35 |
|
| 16.78 |
|
| 16.29 |
|
| 13.91 |
|
| 10.20 |
| ||||||
* The inception date for Ariel Focus Fund is 06/30/05.
DEAR FELLOW SHAREHOLDER:
Ariel Focus Fund continued a period of strong relative and absolute performance returning +16.48% in the first quarter and +85.57% for the year ended March 31, 2021, outperforming the Russell 1000 Value as well as the S&P 500 for both periods. The three holdings contributing most to first quarter returns were ViacomCBS, Inc. (VIAC), The Mosaic Company (MOS) and Snap-On Inc. (SNA). Only two holdings had negative returns during the quarter—NOV Inc. (NOV) and Madison Square Garden Entertainment Corp. (MSGE).
The last twelve months have been challenging. In addition to the hundreds of thousands of deaths caused by the pandemic,
the negative impact on mental health, student achievement and the overall economy will likely be felt for years to come. This past year did, however, offer a real-time illustration of how our core investment strategy can, in the right circumstances, produce strong investment results. At Ariel, we seek to buy high quality companies whose stock price has been driven well below intrinsic value by Wall Street’s excessive focus on a short-term problem or factor. Although the market is very efficient, an excessive focus on the short-term can create inefficiencies or opportunities. A temporary factor might be a downturn in the high-yield bond market driving up LBO financing costs for KKR & Co. Inc. (KKR), start-up costs for Lockheed Martin Corp.’s (LMT) new F-35 jet pressuring near-term margins or the decline in 2021 GAAP revenue for
Performance data quoted represents past performance. Past performance does not guarantee future results. All performance assumes the reinvestment of dividends and capital gains and represents returns of the Investor Class shares. The investment return and principal value of an investment will fluctuate so that an investor’s shares, when redeemed, may be worth more or less than their original cost. Current performance may be lower or higher than the performance data quoted. Any extraordinary performance shown for short-term periods may not be sustainable and is not representative of the performance over longer periods. Performance data current to the most recent month-end for Ariel Focus Fund may be obtained by visiting our website, arielinvestments.com.
8 SLOW AND STEADY WINS THE RACE
Table of Contents
Oracle Corporation (ORCL) due to a change in accounting methods. In all these examples, stock prices were driven well-below our calculations of intrinsic value. We invested in each company with good outcomes. Later, we will offer instances when this strategy is not successful.
THREE IS THE MAGIC NUMBER
In early 2020, the pandemic provided us the opportunity to initiate or add to positions in companies that would experience earnings pressure in the short-term but should rebound once the economy reopened. As written in prior letters, we divided companies into four groups. First, those who would benefit from a lock-down (e.g. online retailers). Second, those that would be generally unaffected (e.g. electric utilities). Next, companies that would be hurt in the short-term, but only temporarily. Lastly, companies that might be permanently harmed, either because they had too much debt or because demand for their products or services was forever impaired. Our core investment strategy pointed us to the third group, companies that would be hurt by COVID-19 in the short-term but should recover in a reopening.
Our largest positions over the last quarter demonstrate our emphasis on these stocks. In our opinion, all ten of our largest holdings fall into this category. Eight out of ten saw a significant drop in profits due to Covid-19. Each saw a material drop in its stock price. As 2020 progressed and signs of an economic reopening became undeniable, nine of these companies saw solid improvement in their operating performance. All except MSGE had operating profits exceed pre-Covid levels.
Our largest holding, Snap-On, Inc.’s tool business faced clear short-term headwinds in March of 2020. Its auto-repair shop customers experienced a sharp drop in business given the -41% decline in miles driven from February to April. Fewer miles driven means fewer accidents, less wear and tear and therefore less business for auto mechanics. Investors feared repair shops would cut their purchases of Snap-On tools and diagnostic systems. And in the short-term, they did. In the second quarter of 2020 Snap-On’s operating profit slumped a sobering -39% from the same quarter a year prior. Their stock declined even more—falling from $170 in January 2020 to a low of $91 in March. We added to our position based upon our belief that the downturn in miles driven and automobile servicing was temporary and that demand for Snap-On’s tools would be just as strong post-reopening. The company rewarded our confidence, posting fourth quarter operating profits that were +22% above pre-Covid levels a year earlier. Its stock also more than doubled from its 2020 low to an all-time high of $231 as we go to print.
PENT-UP DEMAND FOR GROUP THREE COMPANIES
This strength in fourth quarter earnings across many of our largest positions contributed to our strong first quarter performance. Table 1 below shows the change in operating income versus a year prior in both last year’s second and fourth quarters. Note how many were “Group Three Companies,” hit hard by Covid-19 lockdowns but able to significantly recover with an economic reopening.
Table 1:
Rebound in Operating Income for Ten Largest Average Holdings
| 1st Quarter Portfolio Average Weight | 1st Quarter Portfolio Total Return* | June 2020 2nd Quarter Operating Income Percentage Decline Versus Prior Year 2nd Quarter | December 2020 4th Quarter Operating Income Percentage Increase Versus Prior Year 4th Quarter | |||||
Madison Square Garden Entertainment Corp. | 5.46 | -22.12 | N/A Note 1 | N/A Note 1 | ||||
Snap-on Incorporated | 5.29 | 35.68 | -39 | 22 | ||||
Goldman Sachs Group, Inc. | 5.23 | 24.47 | 33 | 63 | ||||
Mosaic Company | 5.18 | 37.59 | 9 | N/A Note 2 | ||||
Nielsen Holdings Plc | 4.96 | 20.81 | -40 | 18 | ||||
Lazard Ltd Class A | 4.77 | 4.02 | -10 | 58 | ||||
Oracle Corporation | 4.66 | 8.89 | -1 | 16 Note 3 | ||||
BorgWarner Inc. | 4.40 | 20.43 | -104 | 24 | ||||
BOK Financial Corporation | 4.38 | 31.25 | -54 | 42 | ||||
Western Union Company | 4.02 | 13.46 | -13 | 16 |
Note 1: MSGE reported operating losses in both the quarter ending June 2020 and the quarter ending December 2020.
Note 2: Mosaic reported positive operating income in the quarter ended December 2020 versus a loss in the same quarter a year ago.
Note 3: Oracle has a May Fiscal year. Results shown here are for the May and November quarters.
Source: FactSet.
| * | The portfolio total return represents the total return during the quarter of each stock for the period held in the Fund. It does not represent performance of the Fund. |
The holdings shown do not represent all the securities purchased, sold, or recommended for shareholders. |
ARIELINVESTMENTS.COM 9
Table of Contents
While this strategy of purchasing companies with near-term headwinds has worked well over the last year, it does not always drive outperformance in every holding. Sometimes short-term factors become longer-term headwinds or headaches. A good example of this is the relationship between natural gas prices and oil. For a long time, the market price of a barrel of oil was very close to six times the price of one thousand cubic feet (”mcf”) of natural gas. This correlation seemed logical and stable because the British Thermal Unit energy content of a barrel of oil is approximately six times that of an MCF of natural gas. In 2009, this pricing broke down, with natural gas plummeting to 1/14th oil ($3.80 for gas, $54 for oil). Believing this free-fall to be temporary, we bought shares of companies whose profits would increase as natural gas prices rose. Unfortunately, this “temporary” factor of cheap natural gas has continued for 12 years and has even gotten worse. Today natural gas sells for 1/23rd the price of oil ($2.74 for gas, $63 for oil).
“At Ariel, we seek to buy high quality companies whose stock price has been driven well below intrinsic value by Wall Street’s excessive focus on a short-term problem or factor.”
We exited our position in Exxon Mobil Corp. (XOM) in the third quarter of 2020 and sold our last shares of NOV, Inc. during the first quarter of 2021, both at prices below our average cost.
Madison Square Garden Entertainment was the biggest detractor from first quarter performance, declining -22%. After its separation from the MSG sister companies in April of 2020, its share price rose from a low of $58 to a high of $121 on March 12th of this year. Through additional purchases and strong price appreciation, MSGE became our largest holding. Soon after reaching its recent high, MSGE and its former sister company, MSG Networks, Inc. (MSGN) confirmed they were recombining less than a year after both had separated to become standalone companies. The market did not react well and the share prices of both companies fell sharply lower. MSGE will
assume the debt of MSGN in the deal which negates our thesis of a pristine MSGE balance sheet. Stay tuned.
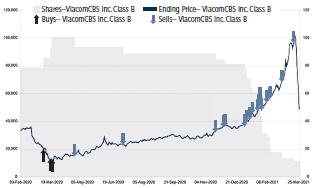
Earlier in this letter, we noted that ViacomCBS, Inc. was the largest contributor to performance. And yet, over the last month, the company’s stock has fallen over 60% from its recent high. VIAC was at the center of the Archegos family office liquidation, with several Wall Street firms forced to sell large blocks of its shares at falling prices. Previously, VIAC shares were driven dramatically higher by the announcement of Paramount+ and a short-squeeze some commentators tied to the Reddit website. Chart 1 shows VIAC stock performance over this period, with black upwards arrows indicating our purchases, and blue downward arrows showing our sales. The gray area indicates the number of shares owned on any given date. In March of 2020, we increased our holding by 25% at prices below $20. By year-end, the stock had more than tripled to $36.90 from its 2020 low of $10.10 on March 16th. We trimmed our position modestly. VIAC remained our largest position at year-end. In January and February, the stock continued higher trading through $50, then $70 before reaching a high of $101.97 on March 15, 2021.
We were aggressive sellers and sold 88% of our shares by quarter-end before the recent sell off in its shares.
Chart 1:
Shares
Security Name
31-JAN-2020 to 26-MAR-2021
Portfolio Holdings As Of Date: ARIEL FOCUS FUND 31-JAN-2020 through 25-MAR-2021
Benchmark Holdings As Of Date: Russell 1000 Value 03-FEB-2020 through 26-MAR-2021
Hidden: Benchmark Only Securities and Groups
Adv: Universe Options: Derivatives > Futures > Apply Special Returns for Futures | Other > Contract
for Difference > Apply Special Returns for CFDs
Composite Assets: None
Portfolio Pricing Sources: FactSet – Equity|Client Portfolio
Benchmark Pricing Sources: Russell – U.S.|FactSet – Equity
Additional Pricing Options: Calculate Returns with Missing Accrued Interest
Calendar: United States
Portfolio Analytics Sources: FactSet – Equity|Client Portfolio
Benchmark Analytics Sources: Russell – U.S.|FactSet – Equity
Past performance does not guarantee future results.
10 SLOW AND STEADY WINS THE RACE
Table of Contents
INFLATION’S TIME HAS COME
We have been predicting a sharp increase in consumer prices for some time. Inflation came this March, as the CPI report showed prices are up +2.6% from a year ago. These numbers are well above the Federal Reserve target of 2.0%. Inflation skeptics have changed their talking point from “there is no inflation in sight” to “the inflation we are seeing is temporary.” We do not believe this inflation is temporary. Rather, we think inflation will move higher from here. The factors influencing inflation are almost all pushing higher. Monetarists point to an expanding money supply and increasing monetary velocity. Keynesians look to fiscal policy and see trillion dollar deficit spending during an economic expansion. Supply-side economists note the reductions in capacity made over the past year to cut costs during the pandemic. Every school of economics recognizes the inflationary impact of a tightening labor supply and perhaps a reduction in globalization with higher tariffs.
Higher inflation means higher interest rates. Higher rates are good for value stocks relative to growth companies. The trend is also better for businesses with strong balance sheets. Those with hard assets—such as Mosaic and MSGE—should also outperform in our opinion.
As always, we appreciate the opportunity to serve you and welcome any questions or comments you might have.
Sincerely,

Charles K. Bobrinskoy
Vice Chairman and Portfolio Manager
ARIELINVESTMENTS.COM 11
Table of Contents
Ariel Focus Fund performance summary
| INCEPTION: 06/30/05
| |
| ||
| ||
|
| Charles K. Bobrinskoy |
| portfolio manager |
Composition of equity holdings (%)
| Ariel Focus Fund | Russell 1000 Value Index | S&P 500 Index | ||||
Financials | 25.30 | 19.71 | 10.86 | |||
Industrials | 21.93 | 16.06 | 14.13 | |||
Consumer discretionary | 14.80 | 12.74 | 16.49 | |||
Health care | 14.03 | 11.90 | 12.43 | |||
Consumer staples | 9.22 | 6.75 | 5.47 | |||
Basic materials | 5.43 | 3.53 | 1.91 | |||
Technology | 4.81 | 8.41 | 27.05 | |||
Energy | 3.23 | 5.17 | 2.87 | |||
Telecommunications | 0.00 | 5.86 | 3.45 | |||
Utilities | 0.00 | 5.41 | 2.88 | |||
Real estate | 0.00 | 4.47 | 2.46 | |||
Sector weightings for the Fund are calculated based on equity holdings as a percentage of total net assets.
Average annual total returns (%) as of 3/31/21
| Quarter | 1-year | 3-year | 5-year | 10-year | Since inception | |||||||||||||||||||
Ariel Focus Fund–Investor Class |
| 16.48 |
|
| 85.57 |
|
| 11.00 |
|
| 13.20 |
|
| 9.48 |
|
| 6.90 |
| ||||||
Ariel Focus Fund–Institutional Class+ |
| 16.55 |
|
| 86.15 |
|
| 11.28 |
|
| 13.48 |
|
| 9.74 |
|
| 7.06 |
| ||||||
Russell 1000® Value Index |
| 11.26 |
|
| 56.09 |
|
| 10.96 |
|
| 11.74 |
|
| 10.99 |
|
| 8.05 |
| ||||||
S&P 500® Index |
| 6.17 |
|
| 56.35 |
|
| 16.78 |
|
| 16.29 |
|
| 13.91 |
|
| 10.20 |
| ||||||
Performance data quoted represents past performance and does not guarantee future results. All performance assumes the reinvestment of dividends and capital gains. The investment return and principal value of an investment will fluctuate so that an investor’s shares, when redeemed, may be worth more or less than their original cost. Current performance may be lower or higher than the performance data quoted. Any extraordinary performance shown for short-term periods may not be sustainable and is not representative of the performance over longer periods. To access performance data current to the most recent month-end, visit arielinvestments.com.
Growth of a $10,000 investment since inception (Investor Class)
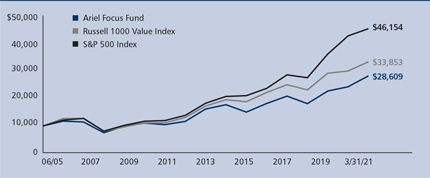
The graph and performance table do not reflect the deduction of taxes that a shareholder would pay on fund distributions or the redemption of fund shares.
| Expense ratio (as of 9/30/20) | Net | Gross | ||||||
Investor Class |
| 1.00 | % |
| 1.25% |
| ||
Institutional Class |
| 0.75 | % |
| 0.89% |
| ||
Currently, expense ratio caps of 1.00% for the Investor Class and 0.75% for the Institutional Class are in place to waive fees and reimburse certain expenses that exceed these caps. Ariel Investments, LLC (the Adviser) is contractually obligated to maintain these expense ratio caps through September 30, 2022. Prior to February 1, 2014, the fee waiver was 1.25% for the Investor Class and 1.00% for the Institutional Class.
Top ten equity holdings (% of net assets)
| 1. | Snap-on, Inc. | 6.0 | 6. | Walgreens Boots Alliance, Inc. | 4.7 | |||||||
| 2. | Mosaic Co. | 5.4 | 7. | Lazard Ltd., Class A | 4.7 | |||||||
| 3. | Nielsen Holdings plc | 5.1 | 8. | BorgWarner, Inc. | 4.6 | |||||||
| 4. | Oracle Corp. | 4.8 | 9. | J.M. Smucker Co. | 4.5 | |||||||
| 5. | Goldman Sachs Group, Inc. | 4.8 | 10. | BOK Financial Corp. | 4.5 | |||||||
| + | The inception date for the Institutional Class shares is December 30, 2011. Performance information for the Institutional Class prior to that date reflects the actual performance of the Fund’s Investor Class (and uses the actual expenses of the Fund’s Investor Class, for such period of time), without any adjustments. For any such period of time, the performance of the Fund’s Institutional Class would have been substantially similar to, yet higher than, the performance of the Fund’s Investor Class, because the shares of both classes are invested in the same portfolio of securities, but the classes bear different expenses, which are primarily differences in distribution and service fees. |
12 SLOW AND STEADY WINS THE RACE
Table of Contents


Rupal J. Bhansali
Chief Investment Officer
International and Global Equities
Average annual total returns as of 03/31/21
1Q21
| 1-year
| 3-year
| 5-year
| Since inception*
| |||||||||||||||||||||
Ariel International Fund | 0.14% | 23.89% | 2.42% | 4.41% | 5.77% | ||||||||||||||||||||
MSCI EAFE Net Index | 3.48 | 44.57 | 6.02 | 8.85 | 7.86 | ||||||||||||||||||||
MSCI ACWI ex-US Net Index | 3.49 | 49.41 | 6.51 | 9.76 | 7.42 | ||||||||||||||||||||
* The inception date for Ariel International Fund is 12/30/11.
Average annual total returns as of 03/31/21
1Q21
| 1-year
| 3-year
| 5-year
| Since inception*
| |||||||||||||||||||||
Ariel Global Fund | 3.47% | 28.51% | 6.60% | 7.62% | 8.38% | ||||||||||||||||||||
MSCI ACWI Net Index | 4.57 | 54.60 | 12.07 | 13.21 | 11.35 | ||||||||||||||||||||
* The inception date for the Ariel Global Fund is 12/30/11.
DEAR FELLOW SHAREHOLDER:
Markets worldwide continued their march higher in the first quarter, despite a wild ride of volatility. Building on the rotation toward cyclical sectors that began in November of last year, value bested growth, small cap issues outperformed their large cap brethren and investors
increased their appetite for risk. Rampant speculation across small-cap meme stocks, cryptocurrencies and blank check, special purpose acquisition companies (SPACs), as well as the dramatic fire sale of leveraged equity bets made by Archegos Capital Management sent shock waves across global markets—drawing regulatory scrutiny. Nonetheless,
Performance data quoted represents past performance. Past performance does not guarantee future results. All performance assumes the reinvestment of dividends and capital gains and represents returns of the Investor Class shares. The investment return and principal value of an investment will fluctuate so that an investor’s shares, when redeemed, may be worth more or less than their original cost. Current performance may be lower or higher than the performance data quoted. Performance data current to the most recent month-end for Ariel International Fund and Ariel Global Fund may be obtained by visiting our website, arielinvestments.com.
ARIELINVESTMENTS.COM 13
Table of Contents
the recovery moved forward as positive news of strong COVID-19 vaccine efficacy, along with a new U.S. fiscal stimulus package fueled a global reflation trade in favor of stocks sensitive to economic momentum. While we are disappointed, we are not surprised that our global portfolios, which are currently weighted towards high quality and more defensive larger cap names with secular growth prospects struggled to keep pace in a market rewarding small cap, cyclical growth and low quality, as well as flows, over fundamentals.
THE REFLATION TRADE
Overall, global equities are up over 64% from their pandemic lows, buoyed by record levels of fiscal stimulus, ultra-low rates and rosy expectations for a vaccine-led reopening of economies. While high-flying large cap growth and momentum stocks led the way through most of 2020, in early November, the pendulum began swinging in the opposite direction. Market participants piled into the distressed cyclicals and deep value stocks hardest hit by the pandemic.
As investors bid up issues across the Energy, Financials, Industrials, Materials and Consumer Discretionary sectors, valuations soared indiscriminately. Low quality, highly levered companies with mediocre normalized returns on invested capital reaped similar rewards to those demonstrating strong fundamentals and solid earnings trends. Today, the cyclical trade appears to be increasingly stretched. Exhibit 1 below highlights the relative 2-year forward price-to-earnings ratio of cyclicals relative to defensives is close to a record-high. Exhibit 2 showcases the only time cyclicals have been more expensive relative to defensives on price-to-book value (PBV) was during the dotcom bubble.1
Exhibit 1:
Relative PE of Cyclicals vs Defensives has only been higher in 2009…

Source: MSCI, IBES, Morgan Stanley Research
Exhibit 2:
…while the relative PBV of Cyclicals vs Defensives has only ever been higher in the TMT bubble
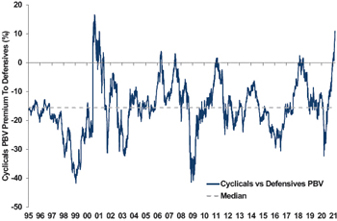
Source: MSCI, Morgan Stanley Research
| 1 | Garman, Matthew, et al. “Upgrading Pharma, downgrading Consumer Services and Transport.” Morgan Stanley & Co. International Research. 31 March 2021. |
14 SLOW AND STEADY WINS THE RACE
Table of Contents
SUCCESS STARTS WITH DISCIPLINE
We view the equity landscape as conceptually analogous to a barbell, with consensus gravitating towards two extremes—hyper growth and distressed cyclicals—in the last twelve months. Over this time frame, underweighting both ends and positioning in high quality, steady growth companies resulted in our global portfolios underperforming their respective benchmarks.
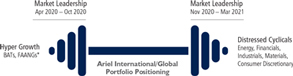
* BATs: Baidu Inc., Alibaba Group Holding Ltd.and Tencent Holdings Ltd. FAANG: Facebook, Amazon, Apple, Netflix and Alphabet
While markets may change from one period to the next, our investment discipline remains the same. We are biased towards undervalued, out-of-favor, franchise-quality companies that are misunderstood and therefore mispriced by the market. We seek to reduce risk by avoiding those businesses that are likely to experience operational or financial distress, become marginalized over time, or are too risky to justify blue sky forecasts. We place a rigorous focus on normalized growth and return prospects, sustainable business models and balance sheet resilience. We do not define ‘value’ by statistical cheapness as reflected by a headline valuation multiple. Instead, our approach focuses on margin of safety2 as measured by discount to intrinsic worth.
“Today, the cyclical trade appears to be increasingly stretched.”
As such, our philosophy and bottom-up fundamental research has our global portfolios positioned in the middle of the barbell—overweight steady but not heady growth
companies, at reasonable but not bargain-basement valuation multiples. These characteristics are presently found in defensive sectors—Health Care, Communication Services and Consumer Staples. Notably, the value spread for our current positioning has materially improved as—“the relative two-year forward price-to-earnings ratio of defensives is at its lowest level since 2010, and defensives are offering a dividend yield above the wider market for the first time in seven years.”3
LOSE THE BATTLE TO WIN THE WAR
While current portfolio positioning appears to be out of fashion with what is in vogue, it is consistent with our time-tested investment strategy. Our portfolios are constructed around stocks where we believe our differentiated, non-consensus view will drive idiosyncratic alpha generation. The current characteristics of the stocks in our portfolios are a testament to this and offer higher returns on equity4, lower financial leverage and attractive dividend yields relative to stocks included in the benchmark.
We view our recent underperformance as the price we are paying for staying the course. Although we may have lost the battle, we aim to win the war. We believe our superior portfolio characteristics will pave the way for portfolio outperformance over a full market cycle.
In the words of Harriet Beecher Stowe, “Never give up, for that is just the place and time that the tide will turn.”
As always, we appreciate the opportunity to serve you and welcome any questions or comments you might have.
Sincerely,

Rupal J. Bhansali
Chief Investment Officer
International and Global Equities
| 2 | Attempting to purchase with a margin of safety on price cannot protect investors from the volatility associated with stocks, incorrect assumptions or estimations on our part, declining fundamentals or external forces. |
| 3 | Garman, Matthew, et al. “Upgrading Pharma, downgrading Consumer Services and Transport.” Morgan Stanley & Co. International Research. 31 March 2021. |
| 4 | A stock’s return on equity is a measure of the company’s profitability that reveals how much profit the company generates with the money shareholders have invested. |
ARIELINVESTMENTS.COM 15
Table of Contents
Ariel International Fund performance summary
| INCEPTION: 12/30/11
| |
| ||
Rupal J. Bhansali
Portfolio manager
Composition of equity holdings (%)
| MSCI | ||||||
| Ariel | MSCI | ACWI | ||||
| International | EAFE | ex-US | ||||
Fund
| Index
| Index
| ||||
Communication services | 20.16 | 5.22 | 7.08 | |||
Health care | 15.64 | 11.95 | 8.93 | |||
Consumer staples | 14.78 | 10.26 | 8.42 | |||
Consumer discretionary | 13.00 | 12.81 | 13.74 | |||
Utilities | 12.37 | 3.65 | 3.18 | |||
Financials | 10.55 | 17.29 | 18.94 | |||
Information technology | 2.76 | 8.96 | 12.59 | |||
Industrials | 2.38 | 15.49 | 11.78 | |||
Energy | 0.89 | 3.32 | 4.48 | |||
Real estate | 0.87 | 3.09 | 2.64 | |||
Materials | 0.00 | 7.95 | 8.21 |
Sector weightings for the Fund are calculated based on equity holdings as a percentage of total net assets. The sectors above are the Global Industry Classification Standard (“GICS”) sector classifications.
Average annual total returns (%) as of 3/31/21
Quarter
| 1-year
| 3-year
| 5-year
|
Since
| ||||||||||||||||
Ariel International Fund–Investor Class | 0.14 | 23.89 | 2.42 | 4.41 | 5.77 | |||||||||||||||
Ariel International Fund–Institutional Class | 0.21 | 24.26 | 2.68 | 4.68 | 6.03 | |||||||||||||||
MSCI EAFE Index (net) |
| 3.48 |
|
| 44.57 |
|
| 6.02 |
|
| 8.85 |
|
| 7.86 |
| |||||
MSCI ACWI ex-US Index (net) |
| 3.49 |
|
| 49.41 |
|
| 6.51 |
|
| 9.76 |
|
| 7.42 |
| |||||
Performance data quoted represents past performance and does not guarantee future results. All performance assumes the reinvestment of dividends and capital gains. The investment return and principal value of an investment will fluctuate so that an investor’s shares, when redeemed, may be worth more or less than their original cost. Current performance may be lower or higher than the performance data quoted. To access performance data current to the most recent month-end, visit arielinvestments.com.
Growth of a $10,000 investment since inception (Investor Class)
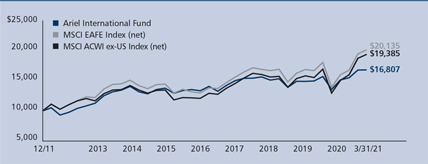
The graph and performance table do not reflect the deduction of taxes that a shareholder would pay on fund distributions or the redemption of fund shares.
Expense ratio (as of 9/30/20) | Net | Gross | ||||||||||||||
Investor Class |
| 1.13 | % |
| 1.33% |
| ||||||||||
Institutional Class |
| 0.88 | % |
| 0.96% |
|
|
|
|
Currently, expense ratio caps of 1.13% for the Investor Class and 0.88% for the Institutional Class are in place to waive fees and reimburse certain expenses that exceed these caps. Ariel Investments, LLC (the Adviser) is contractually obligated to maintain these expense ratio caps through September 30, 2022. Prior to November 29, 2016, the fee waiver was 1.25% of net assets for the Investor Class and 1.00% for the Institutional Class, and, prior to February 1, 2014, the fee waiver was 1.40% for the Investor Class and 1.15% for the Institutional Class.
Top ten companies (% of net assets)
| 1. | Roche Holding AG | 6.8 | 6. | Michelin (CGDE) | 5.3 | |||||||||||||
| 2. | Deutsche Boerse AG | 6.6 | 7. | GlaxoSmithKline plc | 5.2 | |||||||||||||
| 3. | Nintendo Co., Ltd. | 6.1 | 8. | Koninklijke Ahold Delhaize N.V. | 5.1 | |||||||||||||
| 4. | Philip Morris Intl, Inc. | 5.8 | 9. | Snam SpA | 4.8 | |||||||||||||
| 5. | Baidu, Inc. ADR | 5.5 | 10. | Subaru Corp. | 4.4 |
For the purposes of determining the Fund’s top ten, securities of the same issuer are aggregated.
Top ten country weightings (% of net assets) | ||||||||||
Japan | 19.40 | United States | 6.51 | |||||||
Germany | 11.32 | Italy | 5.57 | |||||||
Switzerland | 11.06 | China | 5.50 | |||||||
France | 8.56 | Netherlands | 5.06 | |||||||
United Kingdom | 8.47 | Spain | 4.99 | |||||||
16 SLOW AND STEADY WINS THE RACE
Table of Contents
Ariel Global Fund performance summary
| INCEPTION: 12/30/11
| |
| ||
Rupal J. Bhansali |
| Portfolio manager |
Composition of equity holdings (%)
Ariel Global Fund | MSCI ACWI Index | |||
Health care | 24.42 | 11.39 | ||
Information technology | 16.44 | 21.22 | ||
Communication services | 15.99 | 9.41 | ||
Financials | 11.03 | 14.32 | ||
Consumer staples | 10.30 | 6.99 | ||
Consumer discretionary | 8.44 | 12.80 | ||
Utilities | 5.50 | 2.86 | ||
Real estate | 1.39 | 2.62 | ||
Industrials | 0.57 | 10.02 | ||
Materials | 0.00 | 4.99 | ||
Energy | 0.00 | 3.38 |
Sector weightings for the Fund are calculated based on equity holdings as a percentage of total net assets. The sectors above are the Global Industry Classification Standard (“GICS”) sector classifications.
Average annual total returns (%) as of 3/31/21
Quarter
| 1-year
| 3-year
| 5-year
|
Since
| ||||||||||||||||
Ariel Global Fund–Investor Class | 3.47 | 28.51 | 6.60 | 7.62 | 8.38 | |||||||||||||||
Ariel Global Fund–Institutional Class | 3.52 | 28.90 | 6.88 | 7.89 | 8.66 | |||||||||||||||
MSCI ACWI Index (net) |
| 4.57 |
|
| 54.60 |
|
| 12.07 |
|
| 13.21 |
|
| 11.35 |
| |||||
Performance data quoted represents past performance and does not guarantee future results. All performance assumes the reinvestment of dividends and capital gains. The investment return and principal value of an investment will fluctuate so that an investor’s shares, when redeemed, may be worth more or less than their original cost. Current performance may be lower or higher than the performance data quoted. To access performance data current to the most recent month-end, visit arielinvestments.com.
Growth of a $10,000 investment since inception (Investor Class)
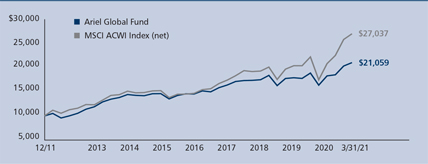
The graph and performance table do not reflect the deduction of taxes that a shareholder would pay on fund distributions or the redemption of fund shares.
| Expense ratio (as of 9/30/20) | Net | Gross | ||||||||||
Investor Class |
| 1.13 | % |
| 1.46% |
| ||||||
Institutional Class |
| 0.88 | % |
| 1.01% |
|
|
|
| |||
Currently expense ratio caps of 1.13% for the Investor Class and 0.88% for the Institutional Class are in place to waive fees and reimburse certain expenses that exceed those caps. Ariel Investments, LLC (the Adviser) is contractually obligated to maintain these expense ratio caps through September 30, 2022. Prior to November 29, 2016, the fee waiver was 1.25% of net assets for the Investor Class and 1.00% for the Institutional Class, and, prior to February 1, 2014, the fee waiver was 1.40% for the Investor Class and 1.15% for the Institutional Class.
| Top ten companies (% of net assets) | ||||||||||||
| 1. | Microsoft Corp. | 9.8 | 6. | GlaxoSmithKline plc | 5.4 | |||||||
| 2. | Baidu, Inc. ADR | 7.7 | 7. | Johnson & Johnson | 4.1 | |||||||
| 3. | Roche Holding AG | 6.5 | 8. | Berkshire Hathaway, Inc., Class B | 4.0 | |||||||
| 4. | Philip Morris Intl, Inc. | 5.8 | 9. | Michelin (CGDE) | 3.9 | |||||||
| 5. | Gilead Sciences, Inc. | 5.6 | 10. | Deutsche Boerse AG | 3.2 | |||||||
For the purposes of determining the Fund’s top ten, securities of the same issuer are aggregated.
Top ten country weightings (% of net assets) | ||||||||||
United States | 39.85 | France | 5.37 | |||||||
Japan | 8.33 | Germany | 4.16 | |||||||
China | 7.75 | Spain | 2.71 | |||||||
Switzerland | 7.64 | Brazil | 2.70 | |||||||
United Kingdom | 7.00 | South Korea | 1.50 | |||||||
ARIELINVESTMENTS.COM 17
Table of Contents

|
| Aaron Diaz Bianco, JD/CFA®
Research Analyst |


Axalta Coating Systems is an industry icon built on a legacy of more than 150 years. The company is a leading global supplier of liquid and powder coatings for automotive and commercial vehicles, as well as other products that require protection from harsh environments. Axalta’s roots date back to the 19th century, when the company developed protectants for carriages. Today it is a global brand that has changed the automotive industry. The company invented the first-ever spray-applied, quick-dry paints for vehicles, which help car manufacturers and repair shops work more efficiently. Axalta is the #1 supplier to the automotive refinish market. Its superior technology and scale provide enduring competitive advantages that are undervalued in the current market.
INNOVATION IS AN UNDERAPPRECIATED COMPETITIVE ADVANTAGE
Despite its storied history, Axalta continues to innovate and adapt to evolving customer needs. The key to profit growth is ensuring adequate supply of defect-free coatings. Superior products are tailored to meet customer preferences and improve the durability of the vehicles and industrial goods they protect. Successful coatings also enhance productivity and reduce energy usage for both manufacturers and their end users. Technological leadership is what separates the ‘good’ from the ‘great’ in the coatings industry. Axalta has developed industry-leading technology that is personalized to its customers, and the company continues to invest in R&D in this area. In fact, 10 percent of its 13,000 employees are highly skilled scientists, engineers and technicians. Technology is the driving force behind Axalta’s breadth, scale, low-cost production and customer service.
COMPLEX COLOR MATCHING IS SIMPLIFIED AND DIGITIZED
In a body shop, the quality of a repair is judged by how well the new surface matches the rest of the vehicle. This requires precise color reproduction. Axalta delivers enhanced accuracy, efficiency and control over the color-matching process through its digital coatings identification system. To do so, Axalta maintains the world’s leading digital coatings formulation database. This database enables it to find precise formulaic
matches from billions of permutations. Customers use Axalta’s proprietary device, called the “spectrophotometer,” to match colors. When the device is held against any vehicle, it identifies a digital formulation to match the precise combination of colors and textures. Then, the spectrophotometer sends a specialized digital code to the appropriate equipment to begin mixing the formulation, allowing customers to seamlessly recreate coatings without headaches, wasted time or materials.
BEHIND A PANDEMIC CLOUD
Throughout its history, Axalta’s largest and highest margin business, called “automotive refinish,” has remained relatively resilient during recessions. The COVID-19 pandemic has been an exception. Due to federal restrictions on non-essential travel over the past year, automotive use declined across the globe. While travel has rebounded and driving has recovered, volumes have only increased to approximately 85% of pre-pandemic levels. Some experts argue that work-from-home trends will shift populations away from urban areas, keeping many permanently off the roads. Our experience has shown that extreme outcomes are usually unlikely. However, it is worth noting that historically, there has been a strong inverse correlation between population density and vehicle ownership.
THE LIGHT BEYOND THE CLOUD
Axalta shares are still trading at a substantial discount to the company’s normalized earnings power. Three of Axalta’s four end-markets (light vehicle, commercial vehicle and industrial) were experiencing cyclical downturns even before the pandemic. While the pandemic exacerbated these downturns and upended the normally stable refinish market, Axalta executed meaningful structural cost improvements, setting the stage for long-term margin improvement. Also, the company’s balance sheet has steadily strengthened. Axalta will require relatively little incremental investment to meet recovering demand in its various end markets. These factors, combined with its strong competitive advantages, translate to substantially higher long-term returns on invested capital than are currently reflected in its share price.
18 SLOW AND STEADY WINS THE RACE
Table of Contents

|
| Kenneth E. Kuhrt, CPA
Executive Vice President Portfolio Manager, Investment Group |


Since its founding over a century ago, Snap-on has revolutionized the tool industry. The company was born from a simple but ingenious idea—wrench handles with interchangeable sockets that would “snap on.” This concept was novel for the industry in 1920, and the company continues to innovate today. Snap-on is a leading manufacturer of tools, equipment, diagnostics, repair information and systems solutions. The company predominately serves independent automotive vehicle repair centers. Snap-on offers more than 65,000 SKUs in its product line, which spans 130 countries around the world. Its highly respected brand has remained strong through an intimate and direct connection with customers. We are optimistic about its potential to capitalize on key organic revenue growth drivers.
A RESPECTED AND RELIABLE BRAND BUILT OVER A CENTURY
The Snap-on brand is known by automotive mechanics for its reliability and trust. Customers are confident in the quality of Snap-on’s product suite. As a result, the company holds significant pricing power over its competitors. For example, a Snap-on wrench sells for a price that is several times higher than the average comparable tool. The company continues to experience strong sales from loyal customers due to its superior materials, best-in-class designs and unmatched product durability. Snap-on builds on its legacy by consistently creating new offerings to meet evolving customer needs. These factors reinforce brand loyalty.
UNIQUE DISTRIBUTION CHAIN OFFERS ACCESS AND DATA
Snap-on utilizes a franchise structure for a significant portion of its product sales and distribution. The company’s
franchisees carry Snap-on inventory in over 4,500 customized vans and make weekly visits to current and prospective customers. The vans sell products to both mechanics and garage owners. These frequent and personalized interactions between franchisees and mechanics offer Snap-on a unique understanding of customer needs. This competitive advantage also provides the company with greater insight into customer credit risk.
ORGANIC REVENUE GROWTH DRIVERS
Snap-on tools typically last for decades, which is why its customers are willing to pay a premium. However, that same quality and durability periodically raises investor concerns around the company’s growth prospects. Fortunately, as vehicle designs continue to evolve, so does the automotive industry’s need for differentiated tools. For example, the shift from gas combustion engines to hybrid and electrical vehicles presents an opportunity for Snap-on to offer mechanics new tools and diagnostic capabilities with enhanced efficiency and safety from electrical shock. The market also continues to underappreciate several other growth tailwinds for Snap-on, including market share gains by independent garages and the increasing age of vehicles on the road.
INTRIGUING OPPORTUNITY
We believe Wall Street is underestimating Snap-on’s ability to evolve its product offering and grow organic revenue. We are confident the company will continue to innovate, and we like its conservative balance sheet. Snap-on is a company we view as a long term holding that will continue to grow.
As of March 31, 2021, shares traded at $230.74, an 18.7x forward P/E.
ARIELINVESTMENTS.COM 19
Table of Contents

|
| Sabrina Carollo, CFA®
Senior Vice President
Director of Research Operations
|


Stericycle is a market leader in regulated waste management services and secure information destruction. For more than three decades, the company has served customers across several industries with operations around the world. Stericycle’s key offerings include: medical waste (e.g., needles and blood products, expired pharmaceuticals, and hazardous chemicals and solutions); and secure information destruction (e.g., collection of confidential material). While the company’s stock remains under a cloud after a challenging year of pandemic-related headwinds, Stericycle is beginning to turn the corner on its long-term mission to rebuild. A new management team is now well-positioned to deliver revenue, earnings and free cash flow improvements. We expect Stericycle to deliver long-term results to patient investors.
TRANSFORMATION IS UNDERWAY AND ONGOING
Since we initiated our investment in Stericycle in 2018, we anticipated the company would overcome surmountable barriers to uncovering the true value of the business. Stericycle has successfully executed on these initiatives, including small-customer pricing settlements and a rationalization of the company’s service portfolio. While there has been significant progress, Stericycle’s transformation is ongoing.
In May 2019, Cindy Miller became President and Chief Executive Officer. Miller brings 30 years of experience at UPS and a dynamic leadership style to the organization. She is focused on achieving operational excellence. This includes addressing the high-cost infrastructure required to maintain the company’s 450+ business applications and 65+ financial systems. In 2019, Janet Zelenka was also appointed Chief Financial Officer. Zelenka took on the additional role of Chief Information Officer to capitalize on her extensive informational technology experience. She is leading the organization through the implementation of an Enterprise Resource Planning (ERP) software system. While this program is costly and disruptive in the short-term, it should deliver meaningful operating efficiencies and margin upside.
The company is focused on several other initiatives that will increase efficiency and profitability, including: right-sizing its
fleet and facilities; standardizing processes; optimizing route planning; and expanding service options. Growth in service offerings should improve customer retention rates and allow Stericycle’s team to focus on acquiring new client relationships. Additionally, Stericycle has sold eight businesses since February 2019. These divestitures have helped the company pay down debt, improved its balance sheet metrics and enabled management to focus on the core regulated waste and destruction service businesses.
TEMPORARY IMPACT OF COVID-19
Stericycle, like many organizations serving industries that were hurt by the pandemic, was negatively impacted by COVID-19. Office closures caused a significant drop in the company’s Secured Information Destruction business. However, management proactively sought opportunities to offset pressure on the business and help fight the pandemic. When the implementation of the new ERP system in the U.S. and Canada was shifted to begin in 2021 due to social distancing restrictions, the management team took this opportunity to use free cash flow to pay down debt. The company also aggressively engaged with large quarantine sites, testing facilities, vaccine centers and temporary hospitals.
THE PATH TO LONG TERM GROWTH
Even in the difficult environment over the last year, the company has maintained its strong market share position, increased operating efficiency, lowered debt levels and produced solid free cash flow. The company’s transformation will lead to revenue, earnings and free cash flow improvements. We believe our patience will be significantly rewarded in the long-term. Even though the cloud continues to pressure the stock as the company implements its transformation strategy, we believe this contrarian call will bear fruit as the new management team’s initiatives succeed over the next several years.
As of March 31, 2021, Stericycle shares traded at $67.51, a 28% discount to our $93.39 private market value estimate.
20 SLOW AND STEADY WINS THE RACE
Table of Contents
| 03/31/21 (UNAUDITED)
| |
| ||
| ||
Ariel Fund
| ||
| Number of shares | Common stocks—91.54% | Value | ||||||
| Basic materials—1.34% | ||||||||
3,080,879 | U.S. Silica Holdings, Inc.(a) | $37,864,003 | ||||||
|
|
| ||||||
| Consumer discretionary—27.29% | ||||||||
3,827,235 | Nielsen Holdings plc | 96,254,960 | ||||||
3,173,966 | Interpublic Group of Cos., Inc. | 92,679,807 | ||||||
2,969,823 | Meredith Corp.(a) | 88,441,329 | ||||||
4,383,989 | Mattel, Inc.(a) | 87,329,061 | ||||||
2,108,099 | Adtalem Global Education, Inc.(a) | 83,354,234 | ||||||
1,016,024 | Madison Square Garden Entertainment Corp.(a) | 83,110,763 | ||||||
4,408,277 | TEGNA, Inc. | 83,007,856 | ||||||
4,019,741 | MSG Networks, Inc.(a) | 60,456,905 | ||||||
402,940 | Royal Caribbean Cruises Ltd.(a) | 34,495,693 | ||||||
552,765 | ViacomCBS, Inc. | 24,929,702 | ||||||
1,012,665 | Knowles Corp.(a) | 21,184,952 | ||||||
64,769 | Vail Resorts, Inc.(a) | 18,890,526 | ||||||
|
|
| ||||||
| 774,135,788 | ||||||||
|
|
| ||||||
| Consumer staples—3.12% | ||||||||
698,786 | J.M. Smucker Co. | 88,417,393 | ||||||
|
|
| ||||||
| Energy—1.21% | ||||||||
1,190,310 | Core Laboratories N.V. | 34,269,025 | ||||||
|
|
| ||||||
| Financials—22.48% | ||||||||
2,817,703 | Lazard Ltd., Class A | 122,598,258 | ||||||
1,785,088 | First American Financial Corp. | 101,125,235 | ||||||
593,300 | Affiliated Managers Group, Inc. | 88,419,499 | ||||||
1,794,939 | KKR & Co., Inc. | 87,682,770 | ||||||
947,307 | BOK Financial Corp. | 84,613,461 | ||||||
732,600 | Northern Trust Corp. | 77,003,586 | ||||||
2,449,383 | Janus Henderson Group plc | 76,298,280 | ||||||
|
|
| ||||||
| 637,741,089 | ||||||||
|
|
| ||||||
| Health care—7.33% | ||||||||
2,223,415 | Envista Holdings Corp.(a) | 90,715,332 | ||||||
285,500 | Laboratory Corp. of America Holdings(a) | 72,811,065 | ||||||
84,706 | Charles River Laboratories Intl, Inc.(a) | 24,550,340 | ||||||
34,781 | Bio-Rad Laboratories, Inc.(a) | 19,865,864 | ||||||
|
|
| ||||||
| 207,942,601 | ||||||||
|
|
| ||||||
| Industrials—20.21% | ||||||||
601,704 | Mohawk Industries, Inc.(a) | 115,713,696 | ||||||
365,463 | Snap-on, Inc. | 84,326,933 | ||||||
1,372,100 | Masco Corp. | 82,188,790 | ||||||
2,718,400 | Axalta Coating Systems, Ltd.(a) | 80,410,272 | ||||||
1,992,141 | Kennametal, Inc. | 79,625,876 | ||||||
372,985 | Keysight Technologies, Inc.(a) | 53,486,049 | ||||||
105,900 | Zebra Technologies Corp.(a) | 51,380,562 | ||||||
252,747 | Simpson Manufacturing Co., Inc. | 26,217,446 | ||||||
|
|
| ||||||
| 573,349,624 | ||||||||
|
|
| ||||||
| Real estate—5.46% | ||||||||
500,299 | JLL(a) | 89,573,533 | ||||||
824,253 | CBRE Group, Inc., Class A(a) | 65,206,655 | ||||||
|
|
| ||||||
| 154,780,188 | ||||||||
|
|
| ||||||
The accompanying notes are an integral part of the financial statements.
ARIELINVESTMENTS.COM 21
Table of Contents
Schedules of investments
| 03/31/21 (UNAUDITED)
| |
| ||
| ||
Ariel Fund (continued)
| ||
| Number of shares | Common stocks—91.54% | Value | ||||||
| Utilities—3.10% | ||||||||
1,303,500 | Stericycle, Inc.(a) | $87,999,285 | ||||||
|
|
| ||||||
| Total common stocks (Cost $1,439,513,777) | 2,596,498,996 | |||||||
|
|
| ||||||
| Number of shares | Short-term investments—9.76% | Value | ||||||
276,892,219 | Northern Institutional Treasury Portfolio, 0.01%(b) | $276,892,219 | ||||||
|
|
| ||||||
| Total short-term investments (Cost $276,892,219) | 276,892,219 | |||||||
|
|
| ||||||
| Total Investments—101.30% (Cost $1,716,405,996) | 2,873,391,215 | |||||||
| Other Assets less Liabilities—(1.30)% | (36,883,305 | ) | ||||||
|
|
| ||||||
| Net Assets—100.00% | $2,836,507,910 | |||||||
|
|
| ||||||
Ariel Appreciation Fund
| ||||||||
| Number of shares | Common stocks—96.85% | Value | ||||||
| Consumer discretionary—22.63% | ||||||||
1,666,530 | Interpublic Group of Cos., Inc. | $48,662,676 | ||||||
2,237,200 | Mattel, Inc.(a) | 44,565,024 | ||||||
846,000 | BorgWarner, Inc. | 39,220,560 | ||||||
1,204,224 | Nielsen Holdings plc | 30,286,234 | ||||||
219,000 | CarMax, Inc.(a) | 29,052,540 | ||||||
375,700 | Omnicom Group, Inc. | 27,858,155 | ||||||
1,150,900 | Knowles Corp.(a) | 24,076,828 | ||||||
1,481,137 | MSG Networks, Inc.(a) | 22,276,300 | ||||||
264,088 | Madison Square Garden Entertainment Corp.(a) | 21,602,398 | ||||||
62,500 | Vail Resorts, Inc.(a) | 18,228,750 | ||||||
|
|
| ||||||
| 305,829,465 | ||||||||
|
|
| ||||||
| Consumer staples—7.37% | ||||||||
850,800 | Walgreens Boots Alliance, Inc. | 46,708,920 | ||||||
255,275 | J.M. Smucker Co. | 32,299,946 | ||||||
401,500 | Molson Coors Brewing Co.(a) | 20,536,725 | ||||||
|
|
| ||||||
| 99,545,591 | ||||||||
|
|
| ||||||
| Energy—1.40% | ||||||||
1,374,900 | NOV, Inc.(a) | 18,863,628 | ||||||
|
|
| ||||||
| Financials—32.96% | ||||||||
519,400 | Northern Trust Corp. | 54,594,134 | ||||||
591,289 | BOK Financial Corp. | 52,813,933 | ||||||
971,100 | Aflac, Inc. | 49,700,898 | ||||||
151,000 | Goldman Sachs Group, Inc. | 49,377,000 | ||||||
1,120,420 | Lazard Ltd., Class A | 48,749,474 | ||||||
729,200 | The Charles Schwab Corp. | 47,529,256 | ||||||
491,900 | Progressive Corp. | 47,030,559 | ||||||
692,050 | First American Financial Corp. | 39,204,633 | ||||||
605,368 | KKR & Co., Inc. | 29,572,227 | ||||||
251,489 | Houlihan Lokey, Inc. | 16,726,533 | ||||||
43,954 | Willis Towers Watson plc | 10,060,193 | ||||||
|
|
| ||||||
| 445,358,840 | ||||||||
|
|
| ||||||
The accompanying notes are an integral part of the financial statements.
22 SLOW AND STEADY WINS THE RACE
Table of Contents
Schedules of investments
| 03/31/21 (UNAUDITED)
| |
| ||
| ||
Ariel Appreciation Fund (continued)
| ||
| Number of shares | Common stocks—96.85% | Value | ||||||
| Health care—13.05% | ||||||||
185,700 | Laboratory Corp. of America Holdings(a) | $47,359,071 | ||||||
639,415 | Cardinal Health, Inc. | 38,844,461 | ||||||
228,700 | Zimmer Biomet Holdings, Inc. | 36,610,296 | ||||||
893,122 | Envista Holdings Corp.(a) | 36,439,378 | ||||||
58,980 | Charles River Laboratories Intl, Inc.(a) | 17,094,173 | ||||||
|
|
| ||||||
| 176,347,379 | ||||||||
|
|
| ||||||
| Industrials—14.42% | ||||||||
1,017,900 | Kennametal, Inc. | 40,685,463 | ||||||
178,799 | Stanley Black & Decker, Inc. | 35,700,796 | ||||||
113,100 | Snap-on, Inc. | 26,096,694 | ||||||
776,600 | Axalta Coating Systems, Ltd.(a) | 22,971,828 | ||||||
732,477 | nVent Electric plc | 20,443,433 | ||||||
138,115 | Keysight Technologies, Inc.(a) | 19,805,691 | ||||||
71,200 | Littelfuse, Inc. | 18,828,128 | ||||||
182,100 | FLIR Systems, Inc. | 10,283,187 | ||||||
|
|
| ||||||
| 194,815,220 | ||||||||
|
|
| ||||||
| Real estate—1.98% | ||||||||
338,150 | CBRE Group, Inc., Class A(a) | 26,751,046 | ||||||
|
|
| ||||||
| Utilities—3.04% | ||||||||
608,600 | Stericycle, Inc.(a) | 41,086,586 | ||||||
|
|
| ||||||
| Total common stocks (Cost $741,067,582) | 1,308,597,755 | |||||||
|
|
| ||||||
| Number of shares | Short-term investments—2.76% | Value | ||||||
37,275,429 | Northern Institutional Treasury Portfolio, 0.01%(b) | $37,275,429 | ||||||
|
|
| ||||||
| Total short-term investments (Cost $37,275,429) | 37,275,429 | |||||||
|
|
| ||||||
| Total Investments—99.61% (Cost $778,343,011) | 1,345,873,184 | |||||||
| Other Assets less Liabilities—0.39% | 5,253,801 | |||||||
|
|
| ||||||
| Net Assets—100.00% | $1,351,126,985 | |||||||
|
|
| ||||||
Ariel Focus Fund
| ||||||||
| Number of shares | Common stocks—98.75% | Value | ||||||
| Basic materials—5.43% | ||||||||
105,800 | Mosaic Co. | $3,344,338 | ||||||
|
|
| ||||||
| Consumer discretionary—14.80% | ||||||||
123,900 | Nielsen Holdings plc | 3,116,085 | ||||||
61,700 | BorgWarner, Inc. | 2,860,412 | ||||||
31,900 | Madison Square Garden Entertainment Corp.(a) | 2,609,420 | ||||||
11,572 | ViacomCBS, Inc. | 521,897 | ||||||
|
|
| ||||||
| 9,107,814 | ||||||||
|
|
| ||||||
| Consumer staples—9.22% | ||||||||
52,400 | Walgreens Boots Alliance, Inc. | 2,876,760 | ||||||
22,100 | J.M. Smucker Co. | 2,796,313 | ||||||
|
|
| ||||||
| 5,673,073 | ||||||||
|
|
| ||||||
| Energy—3.23% | ||||||||
110,900 | APA Corp. | 1,985,110 | ||||||
|
|
| ||||||
The accompanying notes are an integral part of the financial statements.
ARIELINVESTMENTS.COM 23
Table of Contents
Schedules of investments
| 03/31/21 (UNAUDITED)
| |
| ||
| ||
Ariel Focus Fund (continued)
| ||
| Number of shares | Common stocks—98.75% | Value | ||||||
| Financials—25.30% | ||||||||
8,950 | Goldman Sachs Group, Inc. | $2,926,650 | ||||||
65,900 | Lazard Ltd., Class A | 2,867,309 | ||||||
30,900 | BOK Financial Corp. | 2,759,988 | ||||||
36,900 | Bank of New York Mellon Corp. | 1,745,001 | ||||||
15,300 | Progressive Corp. | 1,462,833 | ||||||
25,300 | First American Financial Corp. | 1,433,245 | ||||||
25,800 | KKR & Co., Inc. | 1,260,330 | ||||||
10,600 | Northern Trust Corp. | 1,114,166 | ||||||
|
|
| ||||||
| 15,569,522 | ||||||||
|
|
| ||||||
| Health care—14.03% | ||||||||
10,400 | Laboratory Corp. of America Holdings(a) | 2,652,312 | ||||||
14,450 | Zimmer Biomet Holdings, Inc. | 2,313,156 | ||||||
11,250 | Johnson & Johnson | 1,848,938 | ||||||
79,800 | Hanger, Inc.(a) | 1,821,036 | ||||||
|
|
| ||||||
| 8,635,442 | ||||||||
|
|
| ||||||
| Industrials—21.93% | ||||||||
15,900 | Snap-on, Inc. | 3,668,766 | ||||||
100,300 | Western Union Co. | 2,473,398 | ||||||
12,600 | Mohawk Industries, Inc.(a) | 2,423,106 | ||||||
6,281 | Lockheed Martin Corp. | 2,320,830 | ||||||
7,600 | Stanley Black & Decker, Inc. | 1,517,492 | ||||||
95,000 | Team, Inc.(a) | 1,095,350 | ||||||
|
|
| ||||||
| 13,498,942 | ||||||||
|
|
| ||||||
| Technology—4.81% | ||||||||
42,200 | Oracle Corp. | 2,961,174 | ||||||
|
|
| ||||||
| Total common stocks (Cost $41,017,200) | 60,775,415 | |||||||
|
|
| ||||||
| Number of shares | Short-term investments—1.33% | Value | ||||||
819,322 | Northern Institutional Treasury Portfolio, 0.01%(b) | $819,322 | ||||||
|
|
| ||||||
| Total short-term investments (Cost $819,322) | 819,322 | |||||||
|
|
| ||||||
| Total Investments—100.08% (Cost $41,836,522) | 61,594,737 | |||||||
| Other Assets less Liabilities—(0.08)% | (48,241 | ) | ||||||
|
|
| ||||||
| Net Assets—100.00% | $61,546,496 | |||||||
|
|
| ||||||
Ariel International Fund
| ||||||||
| Number of shares | Common stocks—93.40% | Value | ||||||
| Belgium—0.57% | ||||||||
63,023 | KBC Group NV(a) | $4,582,239 | ||||||
|
|
| ||||||
| Brazil—0.76% | ||||||||
767,989 | Telefonica Brasil SA ADR | 6,044,073 | ||||||
|
|
| ||||||
| Canada—0.48% | ||||||||
180,106 | Element Fleet Management Corp. | 1,970,604 | ||||||
61,471 | IGM Financial, Inc. | 1,873,430 | ||||||
|
|
| ||||||
| 3,844,034 | ||||||||
|
|
| ||||||
| China—5.50% | ||||||||
201,639 | Baidu, Inc. ADR(a) | 43,866,564 | ||||||
|
|
| ||||||
The accompanying notes are an integral part of the financial statements.
24 SLOW AND STEADY WINS THE RACE
Table of Contents
Schedules of investments
| 03/31/21 (UNAUDITED)
| |
| ||
| ||
Ariel International Fund (continued)
| ||
| Number of shares | Common stocks—93.40% | Value | ||||||
| Denmark—0.88% | ||||||||
103,607 | Novo Nordisk A/S | $7,019,290 | ||||||
|
|
| ||||||
| Finland—2.05% | ||||||||
2,271,400 | Nokia Corp.(a) | 9,068,467 | ||||||
1,834,603 | Nokia Corp. ADR(a) | 7,265,028 | ||||||
|
|
| ||||||
| 16,333,495 | ||||||||
|
|
| ||||||
| France—8.56% | ||||||||
280,473 | Michelin (CGDE) | 41,985,450 | ||||||
109,004 | Sanofi | 10,769,593 | ||||||
58,621 | Thales SA | 5,824,063 | ||||||
107,861 | Vivendi SA | 3,541,681 | ||||||
49,549 | BNP Paribas SA(a) | 3,014,545 | ||||||
15,699 | Safran SA(a) | 2,136,506 | ||||||
18,608 | Societe BIC SA | 1,089,334 | ||||||
|
|
| ||||||
| 68,361,172 | ||||||||
|
|
| ||||||
| Germany—11.32% | ||||||||
317,154 | Deutsche Boerse AG | 52,701,985 | ||||||
8,876,020 | Telefonica Deutschland Holding | 26,022,272 | ||||||
28,085 | Muenchener Rueckversicherungs-Gesellschaft AG | 8,648,804 | ||||||
26,779 | Fresenius Medical Care AG & Co. KGaA | 1,969,642 | ||||||
9,572 | Beiersdorf AG | 1,011,380 | ||||||
|
|
| ||||||
| 90,354,083 | ||||||||
|
|
| ||||||
| Hong Kong—1.30% | ||||||||
1,066,500 | CLP Holdings Ltd. | 10,357,566 | ||||||
|
|
| ||||||
| Italy—5.57% | ||||||||
6,866,918 | Snam SpA | 38,073,803 | ||||||
847,826 | Italgas SpA | 5,503,149 | ||||||
96,355 | Banca Mediolanum SpA(a) | 909,614 | ||||||
|
|
| ||||||
| 44,486,566 | ||||||||
|
|
| ||||||
| Japan—19.40% | ||||||||
86,600 | Nintendo Co., Ltd. | 48,342,705 | ||||||
1,758,700 | Subaru Corp. | 35,007,223 | ||||||
589,500 | Bridgestone Corp. | 23,824,904 | ||||||
1,163,500 | Japan Tobacco, Inc. | 22,329,533 | ||||||
118,000 | Secom Co., Ltd. | 9,924,895 | ||||||
60,200 | Daito Trust Construction Co., Ltd. | 6,975,534 | ||||||
111,700 | Sankyo Co., Ltd. | 2,958,827 | ||||||
76,000 | Ono Pharmaceutical Co., Ltd. | 1,983,653 | ||||||
74,700 | Nippon Telegraph & Telephone Corp. | 1,917,339 | ||||||
52,800 | KDDI Corp. | 1,618,930 | ||||||
|
|
| ||||||
| 154,883,543 | ||||||||
|
|
| ||||||
| Luxembourg—0.36% | ||||||||
48,734 | RTL Group(a) | 2,855,232 | ||||||
|
|
| ||||||
| Netherlands—5.06% | ||||||||
1,450,775 | Koninklijke Ahold Delhaize N.V. | 40,406,442 | ||||||
|
|
| ||||||
| Peru—0.23% | ||||||||
13,097 | Credicorp Ltd. | 1,788,657 | ||||||
|
|
| ||||||
| Portugal—0.20% | ||||||||
96,592 | Jeronimo Martins SGPS SA | 1,625,474 | ||||||
|
|
| ||||||
| Singapore—0.13% | ||||||||
142,000 | Singapore Exchange Ltd. | 1,052,438 | ||||||
|
|
| ||||||
The accompanying notes are an integral part of the financial statements.
ARIELINVESTMENTS.COM 25
Table of Contents
Schedules of investments
| 03/31/21 (UNAUDITED)
| |
| ||
| ||
Ariel International Fund (continued)
| ||
| Number of shares | Common stocks—93.40% | Value | ||||||
| Spain—4.99% | ||||||||
1,235,753 | Endesa SA | $32,693,220 | ||||||
488,436 | Tecnicas Reunidas SA(a) | 7,136,950 | ||||||
|
|
| ||||||
| 39,830,170 | ||||||||
|
|
| ||||||
| Switzerland—11.06% | ||||||||
167,411 | Roche Holding AG | 54,103,253 | ||||||
39,447 | Swisscom AG | 21,160,270 | ||||||
57,077 | Nestle SA | 6,361,415 | ||||||
70,580 | Novartis AG | 6,031,579 | ||||||
7,648 | Novartis AG ADR | 653,750 | ||||||
|
|
| ||||||
| 88,310,267 | ||||||||
|
|
| ||||||
| United Kingdom—8.47% | ||||||||
2,359,552 | GlaxoSmithKline plc | 41,897,078 | ||||||
1,015,258 | National Grid plc | 12,092,845 | ||||||
1,405,796 | Direct Line Insurance Group plc | 6,071,850 | ||||||
3,062,768 | Vodafone Group plc | 5,568,412 | ||||||
91,017 | St. James’s Place plc | 1,598,565 | ||||||
7,815 | AstraZeneca plc ADR | 388,561 | ||||||
|
|
| ||||||
| 67,617,311 | ||||||||
|
|
| ||||||
| United States—6.51% | ||||||||
521,309 | Philip Morris Intl, Inc. | 46,260,961 | ||||||
51,157 | Check Point Software Technologies Ltd.(a) | 5,728,049 | ||||||
|
|
| ||||||
| 51,989,010 | ||||||||
|
|
| ||||||
| Total common stocks (Cost $640,864,073) | 745,607,626 | |||||||
|
|
| ||||||
| Number of shares | Short-term investments—5.41% | Value | ||||||
43,180,078 | Northern Institutional Treasury Portfolio, 0.01%(b) | $43,180,078 | ||||||
|
|
| ||||||
| Total short-term investments (Cost $43,180,078) | 43,180,078 | |||||||
|
|
| ||||||
| Total Investments—98.81% (Cost $684,044,151) | 788,787,704 | |||||||
| Cash, Foreign Currency, Other Assets less Liabilities—1.19% | 9,488,819 | |||||||
|
|
| ||||||
| Net Assets—100.00% | $798,276,523 | |||||||
|
|
| ||||||
The accompanying notes are an integral part of the financial statements.
26 SLOW AND STEADY WINS THE RACE
Table of Contents
Schedules of investments
| 03/31/21 (UNAUDITED)
| |
| ||
| ||
Ariel International Fund (continued)
| ||
Open foreign currency contracts as of March 31, 2021
Contract settlement date
| Counterparty
| Currency to
| Amount to be
| Currency to
| Amount to
| Unrealized
| ||||||||||||||||||
Open forward currency contracts with unrealized appreciation |
| |||||||||||||||||||||||
04/28/2021 | UBS AG | USD | 27,981,778 | CNH | 181,425,731 | $405,278 | ||||||||||||||||||
04/28/2021 | UBS AG | NOK | 10,620,619 | EUR | 1,021,694 | 42,904 | ||||||||||||||||||
04/28/2021 | UBS AG | GBP | 29,787,887 | USD | 40,869,309 | 200,166 | ||||||||||||||||||
04/28/2021 | UBS AG | NOK | 25,830,712 | USD | 3,019,205 | 868 | ||||||||||||||||||
|
|
| ||||||||||||||||||||||
Subtotal UBS AG | 649,216 | |||||||||||||||||||||||
|
|
| ||||||||||||||||||||||
04/28/2021 | Northern Trust | USD | 2,213,458 | CNH | 14,354,164 | 31,642 | ||||||||||||||||||
|
|
| ||||||||||||||||||||||
Subtotal Northern Trust | 31,642 | |||||||||||||||||||||||
|
|
| ||||||||||||||||||||||
04/28/2021 | JPMorgan Chase | USD | 962,889 | CAD | 1,208,342 | 1,312 | ||||||||||||||||||
04/28/2021 | JPMorgan Chase | AUD | 1,910,746 | CHF | 1,301,000 | 73,990 | ||||||||||||||||||
04/28/2021 | JPMorgan Chase | SGD | 1,731,797 | EUR | 1,085,288 | 13,746 | ||||||||||||||||||
04/28/2021 | JPMorgan Chase | USD | 3,900,845 | EUR | 3,270,590 | 63,196 | ||||||||||||||||||
04/28/2021 | JPMorgan Chase | USD | 2,403,101 | EUR | 2,020,057 | 32,804 | ||||||||||||||||||
04/28/2021 | JPMorgan Chase | USD | 3,611,509 | EUR | 3,051,385 | 31,071 | ||||||||||||||||||
|
|
| ||||||||||||||||||||||
Subtotal JPMorgan Chase | 216,119 | |||||||||||||||||||||||
|
|
| ||||||||||||||||||||||
Subtotal - Open forward currency contracts with unrealized appreciation |
| $896,977 | ||||||||||||||||||||||
|
|
| ||||||||||||||||||||||
Open forward currency contracts with unrealized depreciation |
| |||||||||||||||||||||||
04/28/2021 | UBS AG | AUD | 12,750,203 | EUR | 8,291,143 | (42,709) | ||||||||||||||||||
04/28/2021 | UBS AG | SEK | 22,454,418 | EUR | 2,217,036 | (29,673) | ||||||||||||||||||
04/28/2021 | UBS AG | AUD | 10,528,907 | USD | 8,077,830 | (79,321) | ||||||||||||||||||
04/28/2021 | UBS AG | AUD | 42,056,869 | USD | 32,266,240 | (316,842) | ||||||||||||||||||
04/28/2021 | UBS AG | SEK | 96,531,297 | USD | 11,586,224 | (530,275) | ||||||||||||||||||
|
|
| ||||||||||||||||||||||
Subtotal UBS AG | (998,820) | |||||||||||||||||||||||
|
|
| ||||||||||||||||||||||
04/28/2021 | Northern Trust | SEK | 42,836,547 | USD | 5,140,437 | (234,270) | ||||||||||||||||||
04/28/2021 | Northern Trust | SGD | 7,436,132 | USD | 5,599,518 | (72,423) | ||||||||||||||||||
|
|
| ||||||||||||||||||||||
Subtotal Northern Trust | (306,693) | |||||||||||||||||||||||
|
|
| ||||||||||||||||||||||
04/28/2021 | JPMorgan Chase | USD | 963,129 | CAD | 1,230,330 | (15,946) | ||||||||||||||||||
04/28/2021 | JPMorgan Chase | USD | 1,912,608 | CAD | 2,443,223 | (31,665) | ||||||||||||||||||
04/28/2021 | JPMorgan Chase | JPY | 1,078,594,593 | CNH | 66,915,731 | (426,955) | ||||||||||||||||||
04/28/2021 | JPMorgan Chase | AUD | 2,078,853 | USD | 1,593,320 | (14,075) | ||||||||||||||||||
04/28/2021 | JPMorgan Chase | JPY | 3,301,325,161 | USD | 31,576,973 | (1,752,389) | ||||||||||||||||||
|
|
| ||||||||||||||||||||||
Subtotal JPMorgan Chase | (2,241,030) | |||||||||||||||||||||||
|
|
| ||||||||||||||||||||||
Subtotal - Open forward currency contracts with unrealized depreciation |
| $(3,546,543) | ||||||||||||||||||||||
|
|
| ||||||||||||||||||||||
Net unrealized appreciation (depreciation) on forward currency contracts |
| $(2,649,566) | ||||||||||||||||||||||
|
|
| ||||||||||||||||||||||
The accompanying notes are an integral part of the financial statements.
ARIELINVESTMENTS.COM 27
Table of Contents
Schedules of investments
| 03/31/21 (UNAUDITED)
| |
| ||
| ||
Ariel Global Fund
| ||
Number of shares
| Common stocks—94.09%
| Value
| ||||
| Belgium—0.10% | ||||||
1,954 | KBC Group NV(a) | $142,071 | ||||
|
|
| ||||
| Brazil—2.70% | ||||||
407,354 | BB Seguridade Participacoes SA | 1,755,010 | ||||
141,600 | Telefonica Brasil SA | 1,112,695 | ||||
410,513 | TIM SA of Brazil(a) | 924,058 | ||||
|
|
| ||||
| 3,791,763 | ||||||
|
|
| ||||
| Canada—0.23% | ||||||
10,755 | IGM Financial, Inc. | 327,776 | ||||
|
|
| ||||
| Chile—0.30% | ||||||
17,289 | Banco Santander-Chile ADR | 429,286 | ||||
|
|
| ||||
| China—7.75% | ||||||
49,474 | Baidu, Inc. ADR(a) | 10,763,069 | ||||
2,853 | Weibo Corp. ADR(a) | 143,962 | ||||
|
|
| ||||
| 10,907,031 | ||||||
|
|
| ||||
| Denmark—0.34% | ||||||
6,995 | Novo Nordisk A/S | 473,906 | ||||
|
|
| ||||
| Finland—1.46% | ||||||
370,934 | Nokia Corp.(a) | 1,480,938 | ||||
144,316 | Nokia Corp. ADR(a) | 571,491 | ||||
|
|
| ||||
| 2,052,429 | ||||||
|
|
| ||||
| France—5.37% | ||||||
36,217 | Michelin (CGDE) | 5,421,509 | ||||
11,882 | Sanofi | 1,173,941 | ||||
13,478 | Vivendi SA | 442,558 | ||||
2,678 | Safran SA(a) | 364,454 | ||||
1,581 | Thales SA | 157,074 | ||||
|
|
| ||||
| 7,559,536 | ||||||
|
|
| ||||
| Germany—4.16% | ||||||
27,421 | Deutsche Boerse AG | 4,556,591 | ||||
265,200 | Telefonica Deutschland Holding | 777,500 | ||||
1,681 | Muenchener Rueckversicherungs-Gesellschaft AG | 517,666 | ||||
|
|
| ||||
| 5,851,757 | ||||||
|
|
| ||||
| Hong Kong—0.56% | ||||||
81,000 | CLP Holdings Ltd. | 786,651 | ||||
|
|
| ||||
| Italy—1.19% | ||||||
278,059 | Snam SpA | 1,541,705 | ||||
20,037 | Italgas SpA | 130,058 | ||||
|
|
| ||||
| 1,671,763 | ||||||
|
|
| ||||
| Japan—8.33% | ||||||
7,250 | Nintendo Co., Ltd. | 4,047,166 | ||||
150,100 | Subaru Corp. | 2,987,766 | ||||
106,400 | Japan Tobacco, Inc. | 2,041,996 | ||||
48,400 | Bridgestone Corp. | 1,956,107 | ||||
3,400 | Secom Co., Ltd. | 285,972 | ||||
2,200 | Daito Trust Construction Co., Ltd. | 254,920 | ||||
5,400 | Nippon Telegraph & Telephone Corp. | 138,604 | ||||
|
|
| ||||
| 11,712,531 | ||||||
|
|
| ||||
| Mexico—0.30% | ||||||
134,529 | Wal-Mart de Mexico SAB de CV | 424,330 | ||||
|
|
| ||||
The accompanying notes are an integral part of the financial statements.
28 SLOW AND STEADY WINS THE R ACE
Table of Contents
Schedules of investments
| 03/31/21 (UNAUDITED)
| |
| ||
| ||
Ariel Global Fund (continued)
| ||
Number of shares
| Common stocks—94.09%
| Value
| ||||
| Netherlands—0.72% | ||||||
36,529 | Koninklijke Ahold Delhaize N.V. | $1,017,392 | ||||
|
| |||||
| Peru—0.75% | ||||||
7,767 | Credicorp Ltd. | 1,060,739 | ||||
|
| |||||
| South Africa—0.40% | ||||||
137,907 | Sanlam Ltd. | 556,206 | ||||
|
| |||||
| South Korea—1.50% | ||||||
29,415 | KT&G Corp. | 2,115,645 | ||||
|
| |||||
| Spain—2.71% | ||||||
144,243 | Endesa SA | 3,816,109 | ||||
|
| |||||
| Switzerland—7.64% | ||||||
28,184 | Roche Holding AG | 9,108,398 | ||||
6,946 | Nestle SA | 774,154 | ||||
1,029 | Swisscom AG | 551,979 | ||||
3,652 | Novartis AG | 312,090 | ||||
|
| |||||
| 10,746,621 | ||||||
|
| |||||
| Taiwan—0.73% | ||||||
138,000 | Catcher Technology Co., Ltd. | 1,022,921 | ||||
|
| |||||
| United Kingdom—7.00% | ||||||
427,877 | GlaxoSmithKline plc | 7,597,542 | ||||
123,029 | National Grid plc | 1,465,411 | ||||
31,640 | Vodafone Group plc ADR | 583,125 | ||||
110,831 | Vodafone Group plc | 201,502 | ||||
69 | Direct Line Insurance Group plc | 298 | ||||
|
| |||||
| 9,847,878 | ||||||
|
| |||||
| United States—39.85% | ||||||
58,407 | Microsoft Corp. | 13,770,618 | ||||
91,417 | Philip Morris Intl, Inc. | 8,112,345 | ||||
122,597 | Gilead Sciences, Inc. | 7,923,444 | ||||
35,320 | Johnson & Johnson | 5,804,842 | ||||
21,797 | Berkshire Hathaway, Inc., Class B(a) | 5,568,480 | ||||
42,316 | Amdocs Ltd. | 2,968,467 | ||||
48,339 | Verizon Communications, Inc. | 2,810,913 | ||||
30,594 | NetApp, Inc. | 2,223,266 | ||||
31,173 | Bristol-Myers Squibb Co. | 1,967,951 | ||||
61,161 | Equity Commonwealth | 1,700,276 | ||||
36,764 | Tapestry, Inc.(a) | 1,515,044 | ||||
8,299 | Check Point Software Technologies Ltd.(a) | 929,239 | ||||
10,976 | U.S. Bancorp | 607,083 | ||||
3,024 | Cisco Systems, Inc. | 156,371 | ||||
|
| |||||
| 56,058,339 | ||||||
|
| |||||
| Total common stocks (Cost $100,375,423) | 132,372,680 | |||||
|
| |||||
The accompanying notes are an integral part of the financial statements.
ARIELINVESTMENTS.COM 29
Table of Contents
Schedules of investments
| 03/31/21 (UNAUDITED)
| |
| ||
| ||
Ariel Global Fund (continued)
| ||
| Number of shares | Short-term investments—4.11% | Value | ||||
5,776,601 | Northern Institutional Treasury Portfolio, 0.01%(b) | $5,776,601 | ||||
|
|
| ||||
| Total short-term investments (Cost $5,776,601) | 5,776,601 | |||||
|
|
| ||||
| Total Investments—98.20% (Cost $106,152,024) | 138,149,281 | |||||
| Cash, Foreign Currency, Other Assets less Liabilities—1.80% | 2,535,143 | |||||
|
|
| ||||
| Net Assets—100.00% | $140,684,424 | |||||
|
|
| ||||
Open foreign currency contracts as of March 31, 2021
Contract settlement date | Counterparty | Currency to be received | Amount to be received | Currency to be delivered | Amount to be delivered | Unrealized appreciation (depreciation) | ||||||||||||||||||
Open forward currency contracts with unrealized appreciation |
| |||||||||||||||||||||||
04/28/2021 | UBS AG | USD | 3,894,332 | CNH | 25,249,719 | $56,404 | ||||||||||||||||||
04/28/2021 | UBS AG | CAD | 1,182,874 | EUR | 761,334 | 47,975 | ||||||||||||||||||
04/28/2021 | UBS AG | NOK | 1,929,155 | EUR | 185,583 | 7,793 | ||||||||||||||||||
04/28/2021 | UBS AG | CAD | 486,199 | USD | 380,597 | 6,312 | ||||||||||||||||||
|
|
| ||||||||||||||||||||||
Subtotal UBS AG | 118,484 | |||||||||||||||||||||||
|
|
| ||||||||||||||||||||||
04/28/2021 | Northern Trust | USD | 1,293,307 | CHF | 1,203,156 | 19,360 | ||||||||||||||||||
04/28/2021 | Northern Trust | USD | 609,640 | CNH | 3,953,482 | 8,715 | ||||||||||||||||||
|
|
| ||||||||||||||||||||||
Subtotal Northern Trust | 28,075 | |||||||||||||||||||||||
|
|
| ||||||||||||||||||||||
04/28/2021 | JPMorgan Chase | AUD | 643,059 | CHF | 437,754 | 25,003 | ||||||||||||||||||
04/28/2021 | JPMorgan Chase | AUD | 503,866 | CHF | 343,000 | 19,591 | ||||||||||||||||||
04/28/2021 | JPMorgan Chase | CAD | 1,494,873 | CHF | 1,039,665 | 88,756 | ||||||||||||||||||
04/28/2021 | JPMorgan Chase | CAD | 586,259 | CHF | 407,753 | 34,790 | ||||||||||||||||||
04/28/2021 | JPMorgan Chase | USD | 739,854 | CHF | 657,314 | 43,864 | ||||||||||||||||||
04/28/2021 | JPMorgan Chase | USD | 375,021 | CHF | 332,921 | 22,512 | ||||||||||||||||||
04/28/2021 | JPMorgan Chase | USD | 343,652 | CNH | 2,229,493 | 4,772 | ||||||||||||||||||
04/28/2021 | JPMorgan Chase | AUD | 1,655,723 | EUR | 1,043,745 | 33,094 | ||||||||||||||||||
04/28/2021 | JPMorgan Chase | USD | 2,527,749 | EUR | 2,107,633 | 54,691 | ||||||||||||||||||
04/28/2021 | JPMorgan Chase | USD | 819,027 | EUR | 673,505 | 28,749 | ||||||||||||||||||
04/28/2021 | JPMorgan Chase | USD | 766,745 | EUR | 630,512 | 26,914 | ||||||||||||||||||
04/28/2021 | JPMorgan Chase | USD | 757,516 | EUR | 622,923 | 26,590 | ||||||||||||||||||
04/28/2021 | JPMorgan Chase | USD | 568,758 | EUR | 467,703 | 19,964 | ||||||||||||||||||
04/28/2021 | JPMorgan Chase | USD | 1,120,237 | JPY | 117,119,139 | 62,168 | ||||||||||||||||||
04/28/2021 | JPMorgan Chase | USD | 415,511 | JPY | 43,441,045 | 23,059 | ||||||||||||||||||
04/28/2021 | JPMorgan Chase | USD | 372,624 | JPY | 38,957,271 | 20,679 | ||||||||||||||||||
|
|
| ||||||||||||||||||||||
Subtotal JPMorgan Chase | 535,196 | |||||||||||||||||||||||
|
|
| ||||||||||||||||||||||
Subtotal - Open forward currency contracts with unrealized appreciation |
| $681,755 | ||||||||||||||||||||||
|
|
| ||||||||||||||||||||||
Open forward currency contracts with unrealized depreciation |
| |||||||||||||||||||||||
04/28/2021 | UBS AG | SEK | 3,330,057 | EUR | 328,793 | (4,401) | ||||||||||||||||||
04/28/2021 | UBS AG | USD | 707,991 | GBP | 516,024 | (3,468) | ||||||||||||||||||
|
|
| ||||||||||||||||||||||
Subtotal UBS AG | (7,869) | |||||||||||||||||||||||
|
|
| ||||||||||||||||||||||
04/28/2021 | Northern Trust | SEK | 2,114,964 | GBP | 185,007 | (12,843) | ||||||||||||||||||
04/28/2021 | Northern Trust | USD | 440,964 | GBP | 321,420 | (2,187) | ||||||||||||||||||
04/28/2021 | Northern Trust | CNH | 3,953,482 | USD | 605,374 | (4,449) | ||||||||||||||||||
The accompanying notes are an integral part of the financial statements.
30 SLOW AND STEADY WINS THE RACE
Table of Contents
Schedules of investments
| 03/31/21 (UNAUDITED)
| |
| ||
| ||
Ariel Global Fund (continued)
| ||
Contract settlement date | Counterparty | Currency to be received | Amount to be received | Currency to be delivered | Amount to be delivered | Unrealized appreciation (depreciation) | ||||||||||||||||||
04/28/2021 | Northern Trust | SGD | 724,321 | USD | 545,361 | $(6,991) | ||||||||||||||||||
|
|
| ||||||||||||||||||||||
Subtotal Northern Trust | (26,470) | |||||||||||||||||||||||
|
|
| ||||||||||||||||||||||
04/28/2021 | JPMorgan Chase | USD | 541,149 | GBP | 393,960 | (2,015) | ||||||||||||||||||
04/28/2021 | JPMorgan Chase | USD | 1,061,750 | GBP | 773,864 | (5,200) | ||||||||||||||||||
04/28/2021 | JPMorgan Chase | CNH | 2,229,493 | USD | 341,393 | (2,513) | ||||||||||||||||||
|
|
| ||||||||||||||||||||||
Subtotal JPMorgan Chase | (9,728) | |||||||||||||||||||||||
|
|
| ||||||||||||||||||||||
Subtotal - Open forward currency contracts with unrealized depreciation |
| $(44,067) | ||||||||||||||||||||||
|
|
| ||||||||||||||||||||||
Net unrealized appreciation (depreciation) on forward currency contracts |
| $637,688 | ||||||||||||||||||||||
|
|
| ||||||||||||||||||||||
ADR American Depositary Receipt
(a)Non-income producing.
(b)The rate presented is the 7-day current yield as of March 31, 2021.
A category may contain multiple industries as defined by the Global Industry Classification Standards.
The accompanying notes are an integral part of the financial statements.
ARIELINVESTMENTS.COM 31
Table of Contents
Statements of assets & liabilities
|
| 03/31/21
| (UNAUDITED)
| |
|
| |||
| Ariel Fund | Ariel Appreciation Fund | Ariel Focus Fund | ||||||||||
Assets: | ||||||||||||
Investments in unaffiliated issuers, at value | $2,596,498,996 | $1,308,597,755 | $60,775,415 | |||||||||
Short-term investments, at value (cost $276,892,219, $37,275,429 and $819,322, respectively) | 276,892,219 | 37,275,429 | 819,322 | |||||||||
Dividends and interest receivable | 1,083,866 | 1,015,115 | 14,106 | |||||||||
Receivable for fund shares sold | 7,675,243 | 1,219,249 | 7,044 | |||||||||
Receivable for securities sold | — | 3,977,457 | — | |||||||||
Prepaid and other assets | 45,158 | 15,322 | 12,381 | |||||||||
|
|
|
|
|
|
|
|
| ||||
Total assets | 2,882,195,482 | 1,352,100,327 | 61,628,268 | |||||||||
|
|
|
|
|
|
|
|
| ||||
Liabilities: | ||||||||||||
Payable for securities purchased | 41,732,898 | — | — | |||||||||
Payable for fund shares redeemed | 3,470,172 | 634,884 | 50,025 | |||||||||
Other liabilities | 484,502 | 338,458 | 31,747 | |||||||||
|
|
|
|
|
|
|
|
| ||||
Total liabilities | 45,687,572 | 973,342 | 81,772 | |||||||||
|
|
|
|
|
|
|
|
| ||||
Net assets | $2,836,507,910 | $1,351,126,985 | $61,546,496 | |||||||||
|
|
|
|
|
|
|
|
| ||||
Net assets consist of: | ||||||||||||
Paid-in capital | $1,673,831,908 | $706,156,277 | $40,350,592 | |||||||||
Distributable earnings | 1,162,676,002 | 644,970,708 | 21,195,904 | |||||||||
|
|
|
|
|
|
|
|
| ||||
Net assets | $2,836,507,910 | $1,351,126,985 | $61,546,496 | |||||||||
|
|
|
|
|
|
|
|
| ||||
Investor class shares: | ||||||||||||
Net assets | $1,675,428,201 | $1,059,110,151 | $43,804,724 | |||||||||
Shares outstanding (no par value, unlimited authorized) | 20,740,797 | 21,139,881 | 2,614,766 | |||||||||
Net asset value, offering and redemption price per share | $80.78 | $50.10 | $16.75 | |||||||||
Institutional class shares: | ||||||||||||
Net assets | $1,161,079,709 | $292,016,834 | $17,741,772 | |||||||||
Shares outstanding (no par value, unlimited authorized) | 14,354,630 | 5,818,106 | 1,058,406 | |||||||||
Net asset value, offering and redemption price per share | $80.89 | $50.19 | $16.76 | |||||||||
The accompanying notes are an integral part of the financial statements.
32 SLOW AND STEADY WINS THE RACE
Table of Contents
Statements of assets & liabilities
|
| 03/31/21
| (UNAUDITED)
| |
|
| |||
| Ariel International Fund | Ariel Global Fund | |||||||||||
Assets: | ||||||||||||
Investments in unaffiliated issuers, at value (cost $640,864,073 and $100,375,423, respectively) | $745,607,626 | $132,372,680 | ||||||||||
Short-term investments, at value (cost $43,180,078 and $5,776,601, respectively) | 43,180,078 | 5,776,601 | ||||||||||
Foreign currencies (cost $5,783,093 and $449,170, respectively) | 5,688,351 | 439,172 | ||||||||||
Dividends and interest receivable | 2,902,281 | 472,823 | ||||||||||
Receivable for dividend reclaims | 3,099,848 | 341,008 | ||||||||||
Receivable for fund shares sold | 915,271 | 1,030,133 | ||||||||||
Receivable for securities and foreign currencies sold | — | 177 | ||||||||||
Unrealized appreciation on forward currency contracts | 896,977 | 681,755 | ||||||||||
Prepaid and other assets | 17,980 | 11,895 | ||||||||||
|
|
|
| |||||||||
Total assets | 802,308,412 | 141,126,244 | ||||||||||
|
|
|
| |||||||||
Liabilities: | ||||||||||||
Payable for securities and foreign currencies purchased | 365,519 | 351,318 | ||||||||||
Payable for fund shares redeemed | 10,152 | — | ||||||||||
Unrealized depreciation on forward currency contracts | 3,546,543 | 44,067 | ||||||||||
Other liabilities | 109,675 | 46,435 | ||||||||||
|
|
|
| |||||||||
Total liabilities | 4,031,889 | 441,820 | ||||||||||
|
|
|
| |||||||||
Net assets | $798,276,523 | $140,684,424 | ||||||||||
|
|
|
| |||||||||
Net assets consist of: | ||||||||||||
Paid-in capital | $744,465,600 | $111,410,167 | ||||||||||
Distributable earnings | 53,810,923 | 29,274,257 | ||||||||||
|
|
|
| |||||||||
Net assets | $798,276,523 | $140,684,424 | ||||||||||
|
|
|
| |||||||||
Investor class shares: | ||||||||||||
Net assets | $24,403,409 | $12,890,463 | ||||||||||
Shares outstanding (no par value, unlimited authorized) | 1,670,025 | 744,962 | ||||||||||
Net asset value, offering and redemption price per share | $14.61 | $17.30 | ||||||||||
Institutional class shares: | ||||||||||||
Net assets | $773,873,114 | $127,793,961 | ||||||||||
Shares outstanding (no par value, unlimited authorized) | 54,146,769 | 7,630,206 | ||||||||||
Net asset value, offering and redemption price per share | $14.29 | $16.75 | ||||||||||
The accompanying notes are an integral part of the financial statements.
ARIELINVESTMENTS.COM 33
Table of Contents
| SIX MONTHS ENDED 03/31/21 (UNAUDITED)
| |
| ||
| Ariel Fund | Ariel Appreciation Fund | Ariel Focus Fund | ||||||||||
Investment income: | ||||||||||||
Dividends | ||||||||||||
Unaffiliated issuers | $11,935,081 | $11,370,388 | $544,778 | |||||||||
|
|
|
|
|
|
|
|
| ||||
Total investment income | 11,935,081 | 11,370,388 | 544,778 | |||||||||
|
|
|
|
|
|
|
|
| ||||
Expenses: | ||||||||||||
Management fees | 6,116,641 | 4,177,839 | 172,901 | |||||||||
Distribution fees (Investor Class) | 1,618,212 | 1,159,103 | 47,401 | |||||||||
Shareholder service fees | ||||||||||||
Investor Class | 511,175 | 330,747 | 9,233 | |||||||||
Institutional Class | 181,293 | 47,716 | 1,507 | |||||||||
Transfer agent fees and expenses | ||||||||||||
Investor Class | 122,921 | 98,695 | 7,473 | |||||||||
Institutional Class | 47,521 | 15,333 | 1,386 | |||||||||
Printing and postage expenses | ||||||||||||
Investor Class | 169,715 | 124,069 | 8,596 | |||||||||
Institutional Class | 24,008 | 13,040 | 590 | |||||||||
Trustees’ fees and expenses | 213,885 | 128,202 | 5,856 | |||||||||
Professional fees | 79,722 | 53,140 | 15,216 | |||||||||
Custody fees and expenses | 11,996 | 7,866 | 2,600 | |||||||||
Federal and state registration fees | 27,717 | 21,877 | 18,761 | |||||||||
Interest expense | — | — | 53 | |||||||||
Miscellaneous expenses | 124,155 | 76,109 | 7,274 | |||||||||
|
|
|
|
|
|
|
|
| ||||
Total expenses before reimbursements | 9,248,961 | 6,253,736 | 298,847 | |||||||||
Expense reimbursements | — | — | (51,944) | |||||||||
|
|
|
|
|
|
|
|
| ||||
Net expenses | 9,248,961 | 6,253,736 | 246,903 | |||||||||
|
|
|
|
|
|
|
|
| ||||
Net investment income | 2,686,120 | 5,116,652 | 297,875 | |||||||||
|
|
|
|
|
|
|
|
| ||||
Realized and unrealized gain (loss): | ||||||||||||
Net realized gain (loss) on investments | ||||||||||||
Unaffiliated issuers | 84,377,916 | 87,049,327 | 2,026,675 | |||||||||
Affiliated issuers | (15,005,828)(a) | — | — | |||||||||
Change in net unrealized appreciation (depreciation) on investments | ||||||||||||
Unaffiliated issuers | 759,255,118 | 317,662,098 | 16,005,344 | |||||||||
Affiliated issuers | 59,950,501(a) | — | — | |||||||||
|
|
|
|
|
|
|
|
| ||||
Net gain (loss) on investments | 888,577,707 | 404,711,425 | 18,032,019 | |||||||||
|
|
|
|
|
|
|
|
| ||||
Net increase (decrease) in net assets resulting from operations | $891,263,827 | $409,828,077 | $18,329,894 | |||||||||
|
|
|
|
|
|
|
|
| ||||
(a)See Note Seven, Transactions with Affiliated Companies, for information on affiliated issuers.
The accompanying notes are an integral part of the financial statements.
34 SLOW AND STEADY WINS THE RACE
Table of Contents
Statements of operations
|
| SIX MONTHS ENDED 03/31/21
| (UNAUDITED)
| |
|
| |||
| Ariel International Fund | Ariel Global Fund | |||||||
Investment income: | ||||||||
Dividends | ||||||||
Unaffiliated issuers | $8,749,180(a) | $1,629,406(a) | ||||||
|
|
|
| |||||
Total investment income | 8,749,180 | 1,629,406 | ||||||
|
|
|
| |||||
Expenses: | ||||||||
Management fees | 2,881,070 | 525,408 | ||||||
Distribution fees (Investor Class) | 28,755 | 14,892 | ||||||
Shareholder service fees | ||||||||
Investor Class | 10,732 | 4,743 | ||||||
Institutional Class | 83,392 | 6,694 | ||||||
Transfer agent fees and expenses | ||||||||
Investor Class | 3,315 | 2,665 | ||||||
Institutional Class | 44,653 | 7,196 | ||||||
Printing and postage expenses | ||||||||
Investor Class | 5,675 | 3,787 | ||||||
Institutional Class | 5,477 | 798 | ||||||
Trustees’ fees and expenses | 79,300 | 14,003 | ||||||
Professional fees | 40,183 | 21,028 | ||||||
Custody fees and expenses | 128,360 | 16,178 | ||||||
Administration fees | 24,110 | 8,306 | ||||||
Fund accounting fees | 16,900 | 6,116 | ||||||
Federal and state registration fees | 22,476 | 19,609 | ||||||
Miscellaneous expenses | 47,864 | 11,596 | ||||||
|
|
|
| |||||
Total expenses before reimbursements | 3,422,262 | 663,019 | ||||||
Expense reimbursements | (224,326) | (70,176) | ||||||
|
|
|
| |||||
Net expenses | 3,197,936 | 592,843 | ||||||
|
|
|
| |||||
Net investment income | 5,551,244 | 1,036,563 | ||||||
|
|
|
| |||||
Realized and unrealized gain (loss): | ||||||||
Net realized gain (loss) on: | ||||||||
Investments | (7,187,099) | (10,507) | ||||||
Translation of assets and liabilities in foreign currencies | 1,417,452 | (101,690) | ||||||
Forward currency contracts | 531,807 | (447,227) | ||||||
|
|
|
| |||||
Total | (5,237,840) | (559,424) | ||||||
|
|
|
| |||||
Change in net unrealized appreciation (depreciation) on: | ||||||||
Investments | 55,703,945 | 15,969,578 | ||||||
Translation of assets and liabilities in foreign currencies | (243,995) | (26,951) | ||||||
Forward currency contracts | (564,163) | 742,984 | ||||||
|
|
|
| |||||
Total | 54,895,787 | 16,685,611 | ||||||
|
|
|
| |||||
Net gain (loss) on investments | 49,657,947 | 16,126,187 | ||||||
|
|
|
| |||||
Net increase (decrease) in net assets resulting from operations | $55,209,191 | $17,162,750 | ||||||
|
|
|
| |||||
(a)Net of $834,290 and $112,032 in foreign taxes withheld, respectively.
The accompanying notes are an integral part of the financial statements.
ARIELINVESTMENTS.COM 35
Table of Contents
Statements of changes in net assets
| ||
| ||
| Ariel Fund | Ariel Appreciation Fund | |||||||||||||||||
| Six Months Ended March 31, 2021 (Unaudited) | Year Ended September 30, 2020 | Six Months Ended March 31, 2021 (Unaudited) | Year Ended September 30, 2020 | |||||||||||||||
Operations: | ||||||||||||||||||
Net investment income (loss) | $2,686,120 | $14,662,224 | $5,116,652 | $11,394,094 | ||||||||||||||
Net realized gain (loss) on investments | 69,372,088 | 78,895,856 | 87,049,327 | 96,520,017 | ||||||||||||||
Change in net unrealized appreciation (depreciation) on investments | 819,205,619 | (268,658,724 | ) | 317,662,098 | (180,263,930 | ) | ||||||||||||
|
|
|
|
|
|
|
|
|
|
|
| |||||||
Net increase (decrease) in net assets from operations | 891,263,827 | (175,100,644 | ) | 409,828,077 | (72,349,819 | ) | ||||||||||||
|
|
|
|
|
|
|
|
|
|
|
| |||||||
Distributions to shareholders: | ||||||||||||||||||
Investor Class | (64,581,986 | ) | (76,888,411 | ) | (84,552,421 | ) | (75,047,808 | ) | ||||||||||
Institutional Class | (39,817,967 | ) | (46,679,751 | ) | (22,647,630 | ) | (22,869,083 | ) | ||||||||||
|
|
|
|
|
|
|
|
|
|
|
| |||||||
Total distributions | (104,399,953 | ) | (123,568,162 | ) | (107,200,051 | ) | (97,916,891 | ) | ||||||||||
|
|
|
|
|
|
|
|
|
|
|
| |||||||
Share transactions: | ||||||||||||||||||
Value of shares issued | ||||||||||||||||||
Investor Class | 236,862,500 | 79,382,425 | 30,911,385 | 48,222,602 | ||||||||||||||
Institutional Class | 329,656,520 | 99,895,664 | 52,649,999 | 38,142,541 | ||||||||||||||
Value of shares issued in reinvestment of dividends and distributions | ||||||||||||||||||
Investor Class | 63,007,966 | 74,932,867 | 82,432,501 | 73,132,225 | ||||||||||||||
Institutional Class | 38,667,730 | 45,595,738 | 21,745,195 | 21,956,039 | ||||||||||||||
Value of shares redeemed | ||||||||||||||||||
Investor Class | (112,934,334 | ) | (268,767,987 | ) | (71,909,978 | ) | (206,912,734 | ) | ||||||||||
Institutional Class | (98,122,665 | ) | (185,472,150 | ) | (40,743,585 | ) | (125,868,943 | ) | ||||||||||
|
|
|
|
|
|
|
|
|
|
|
| |||||||
Net increase (decrease) in net assets from share transactions | 457,137,717 | (154,433,443 | ) | 75,085,517 | (151,328,270 | ) | ||||||||||||
|
|
|
|
|
|
|
|
|
|
|
| |||||||
Total increase (decrease) in net assets | 1,244,001,591 | (453,102,249 | ) | 377,713,543 | (321,594,980 | ) | ||||||||||||
Net assets: | ||||||||||||||||||
Beginning of period | 1,592,506,319 | 2,045,608,568 | 973,413,442 | 1,295,008,422 | ||||||||||||||
|
|
|
|
|
|
|
|
|
|
|
| |||||||
End of period | $2,836,507,910 | $1,592,506,319 | $1,351,126,985 | $973,413,442 | ||||||||||||||
|
|
|
|
|
|
|
|
|
|
|
| |||||||
Capital share transactions: | ||||||||||||||||||
Investor shares | ||||||||||||||||||
Shares sold | 3,074,232 | 1,417,055 | 685,278 | 1,211,421 | ||||||||||||||
Shares issued to holders in reinvestment of dividends | 1,024,148 | 1,185,100 | 2,028,460 | 1,681,654 | ||||||||||||||
Shares redeemed | (1,664,608 | ) | (4,841,850 | ) | (1,631,838 | ) | (5,270,167 | ) | ||||||||||
|
|
|
|
|
|
|
|
|
|
|
| |||||||
Net increase (decrease) | 2,433,772 | (2,239,695 | ) | 1,081,900 | (2,377,092 | ) | ||||||||||||
|
|
|
|
|
|
|
|
|
|
|
| |||||||
Institutional shares | ||||||||||||||||||
Shares sold | 4,317,728 | 1,856,746 | 1,175,701 | 998,772 | ||||||||||||||
Shares issued to holders in reinvestment of dividends | 624,851 | 718,813 | 532,800 | 503,224 | ||||||||||||||
Shares redeemed | (1,530,120 | ) | (3,323,374 | ) | (933,875 | ) | (3,152,070 | ) | ||||||||||
|
|
|
|
|
|
|
|
|
|
|
| |||||||
Net increase (decrease) | 3,412,459 | (747,815 | ) | 774,626 | (1,650,074 | ) | ||||||||||||
|
|
|
|
|
|
|
|
|
|
|
| |||||||
The accompanying notes are an integral part of the financial statements.
36 SLOW AND STEADY WINS THE RACE
Table of Contents
Statements of changes in net assets
| ||
| ||
Ariel Focus Fund | ||||||||
| Six Months Ended March 31, 2021 (Unaudited) | Year Ended September 30, 2020 | |||||||
Operations: | ||||||||
Net investment income (loss) | $297,875 | $657,603 | ||||||
Net realized gain (loss) on investments | 2,026,675 | 606,889 | ||||||
Change in net unrealized appreciation (depreciation) on investments | 16,005,344 | (5,065,029) | ||||||
|
|
|
| |||||
Net increase (decrease) in net assets from operations | 18,329,894 | (3,800,537) | ||||||
|
|
|
| |||||
Distributions to shareholders: | ||||||||
Investor Class | (904,539) | (449,140) | ||||||
Institutional Class | (385,448) | (190,860) | ||||||
|
|
|
| |||||
Total distributions | (1,289,987) | (640,000) | ||||||
|
|
|
| |||||
Share transactions: | ||||||||
Value of shares issued | ||||||||
Investor Class | 2,246,762 | 8,769,052 | ||||||
Institutional Class | 166,372 | 291,013 | ||||||
Value of shares issued in reinvestment of dividends and distributions | ||||||||
Investor Class | 774,921 | 391,077 | ||||||
Institutional Class | 382,043 | 182,516 | ||||||
Value of shares redeemed | ||||||||
Investor Class | (3,213,236) | (14,491,053) | ||||||
Institutional Class | (434,559) | (2,439,574) | ||||||
|
|
|
| |||||
Net increase (decrease) in net assets from share transactions | (77,697) | (7,296,969) | ||||||
|
|
|
| |||||
Total increase (decrease) in net assets | 16,962,210 | (11,737,506) | ||||||
Net assets: | ||||||||
Beginning of period | 44,584,286 | 56,321,792 | ||||||
|
|
|
| |||||
End of period | $61,546,496 | $44,584,286 | ||||||
|
|
|
| |||||
Capital share transactions: | ||||||||
Investor shares | ||||||||
Shares sold | 145,439 | 723,170 | ||||||
Shares issued to holders in reinvestment of dividends | 57,611 | 28,587 | ||||||
Shares redeemed | (213,218) | (1,289,759) | ||||||
|
|
|
| |||||
Net increase (decrease) | (10,168) | (538,002) | ||||||
|
|
|
| |||||
Institutional shares | ||||||||
Shares sold | 11,691 | 24,788 | ||||||
Shares issued to holders in reinvestment of dividends | 28,339 | 13,361 | ||||||
Shares redeemed | (30,003) | (196,443) | ||||||
|
|
|
| |||||
Net increase (decrease) | 10,027 | (158,294) | ||||||
|
|
|
| |||||
The accompanying notes are an integral part of the financial statements.
ARIELINVESTMENTS.COM 37
Table of Contents
Statements of changes in net assets
| ||
| ||
Ariel International Fund |
Ariel Global Fund | |||||||||||||||||
| Six Months Ended March 31, 2021 (Unaudited) | Year Ended September 30, 2020 | Six Months Ended March 31, 2021 (Unaudited) | Year Ended September 30, 2020 | |||||||||||||||
Operations: | ||||||||||||||||||
Net investment income (loss) | $5,551,244 | $13,016,050 | $1,036,563 | $1,904,307 | �� | |||||||||||||
Net realized gain (loss) on investments, foreign currency translations and forward currency contracts | (5,237,840) | (35,687,524) | (559,424) | (2,057,107) | ||||||||||||||
Change in net unrealized appreciation (depreciation) on investments, foreign currency translations and forward currency contracts | 54,895,787 | 39,281,354 | 16,685,611 | 4,200,436 | ||||||||||||||
|
|
|
|
|
|
|
| |||||||||||
Net increase (decrease) in net assets from operations | 55,209,191 | 16,609,880 | 17,162,750 | 4,047,636 | ||||||||||||||
|
|
|
|
|
|
|
| |||||||||||
Distributions to shareholders: | ||||||||||||||||||
Investor Class | (325,333) | (386,371) | (102,891) | (534,437) | ||||||||||||||
Institutional Class | (11,974,667) | (14,313,629) | (1,247,109) | (4,196,383) | ||||||||||||||
|
|
|
|
|
|
|
| |||||||||||
Total distributions | (12,300,000) | (14,700,000) | (1,350,000) | (4,730,820) | ||||||||||||||
|
|
|
|
|
|
|
| |||||||||||
Share transactions: | ||||||||||||||||||
Value of shares issued | ||||||||||||||||||
Investor Class | 5,451,264 | 5,222,931 | 1,199,167 | 1,499,744 | ||||||||||||||
Institutional Class | 158,115,441 | 92,622,193 | 24,953,148 | 19,949,287 | ||||||||||||||
Value of shares issued in reinvestment of dividends and distributions | ||||||||||||||||||
Investor Class | 301,565 | 355,381 | 87,285 | 461,661 | ||||||||||||||
Institutional Class | 11,521,695 | 13,880,644 | 1,242,779 | 4,177,327 | ||||||||||||||
Value of shares redeemed | ||||||||||||||||||
Investor Class | (4,680,178) | (8,896,414) | (519,392) | (3,140,666) | ||||||||||||||
Institutional Class | (36,989,645) | (230,913,115) | (8,053,708) | (2,185,004) | ||||||||||||||
|
|
|
|
|
|
|
| |||||||||||
Net increase (decrease) in net assets from share transactions | 133,720,142 | (127,728,380) | 18,909,279 | 20,762,349 | ||||||||||||||
|
|
|
|
|
|
|
| |||||||||||
Total increase (decrease) in net assets | 176,629,333 | (125,818,500) | 34,722,029 | 20,079,165 | ||||||||||||||
Net assets: | ||||||||||||||||||
Beginning of period | 621,647,190 | 747,465,690 | 105,962,395 | 85,883,230 | ||||||||||||||
|
|
|
|
|
|
|
| |||||||||||
End of period | $798,276,523 | $621,647,190 | $140,684,424 | $105,962,395 | ||||||||||||||
|
|
|
|
|
|
|
| |||||||||||
Capital share transactions: | ||||||||||||||||||
Investor shares | ||||||||||||||||||
Shares sold | 374,735 | 392,295 | 72,120 | 98,772 | ||||||||||||||
Shares issued to holders in reinvestment of dividends | 21,163 | 25,787 | 5,338 | 29,826 | ||||||||||||||
Shares redeemed | (325,177) | (669,750) | (31,344) | (219,556) | ||||||||||||||
|
|
|
|
|
|
|
| |||||||||||
Net increase (decrease) | 70,721 | (251,668) | 46,114 | (90,958) | ||||||||||||||
|
|
|
|
|
|
|
| |||||||||||
Institutional shares | ||||||||||||||||||
Shares sold | 11,164,404 | 7,029,709 | 1,638,836 | 1,334,079 | ||||||||||||||
Shares issued to holders in reinvestment of dividends | 827,708 | 1,033,555 | 78,558 | 279,454 | ||||||||||||||
Shares redeemed | (2,628,141) | (18,115,827) | (490,601) | (151,791) | ||||||||||||||
|
|
|
|
|
|
|
| |||||||||||
Net increase (decrease) | 9,363,971 | (10,052,563) | 1,226,793 | 1,461,742 | ||||||||||||||
|
|
|
|
|
|
|
| |||||||||||
The accompanying notes are an integral part of the financial statements.
38 SLOW AND STEADY WINS THE RACE
Table of Contents
Financial highlights For a share outstanding throughout each period
| ||
| ||
Year ended September 30 | ||||||||||||||||||||||||||
Ariel Fund (Investor Class) | Six months ended March 31, 2021 (Unaudited) | 2020 | 2019 | 2018 | 2017 | 2016 | ||||||||||||||||||||
Net asset value, beginning of period | $54.40 | $63.40 | $74.58 | $69.11 | $63.74 | $63.93 | ||||||||||||||||||||
Income from investment operations: | ||||||||||||||||||||||||||
Net investment income (loss) | (0.10 | ) | 0.50 | 0.65 | 0.57 | 0.52 | 0.62 | |||||||||||||||||||
Net realized and unrealized gain (loss) on investments | 30.08 | (5.72 | ) | (6.10 | ) | 9.31 | 9.07 | 8.86 | ||||||||||||||||||
|
|
|
|
|
|
|
|
|
|
|
|
|
|
|
|
|
| |||||||||
Total from investment operations | 29.98 | (5.22 | ) | (5.45 | ) | 9.88 | 9.59 | 9.48 | ||||||||||||||||||
Distributions to shareholders: | ||||||||||||||||||||||||||
Dividends from net investment income | (0.20 | ) | (0.55 | ) | (0.59 | ) | (0.48 | ) | (0.18 | ) | (0.41 | ) | ||||||||||||||
Distributions from capital gains | (3.40 | ) | (3.23 | ) | (5.14 | ) | (3.93 | ) | (4.04 | ) | (9.26 | ) | ||||||||||||||
|
|
|
|
|
|
|
|
|
|
|
|
|
|
|
|
|
| |||||||||
Total distributions | (3.60 | ) | (3.78 | ) | (5.73 | ) | (4.41 | ) | (4.22 | ) | (9.67 | ) | ||||||||||||||
|
|
|
|
|
|
|
|
|
|
|
|
|
|
|
|
|
| |||||||||
Net asset value, end of period | $80.78 | $54.40 | $63.40 | $74.58 | $69.11 | $63.74 | ||||||||||||||||||||
|
|
|
|
|
|
|
|
|
|
|
|
|
|
|
|
|
| |||||||||
Total return | 57.21% | (a) | (9.03 | )% | (7.17 | )% | 14.98% | 15.76% | 15.55% | |||||||||||||||||
Supplemental data and ratios: | ||||||||||||||||||||||||||
Net assets, end of period, in thousands | $1,675,428 | $995,861 | $1,302,745 | $1,587,936 | $1,542,730 | $1,467,270 | ||||||||||||||||||||
Ratio of expenses to average net assets | 1.00% | (b) | 1.04% | 1.02% | 1.01% | 1.01% | 1.02% | |||||||||||||||||||
Ratio of net investment income to average net assets | 0.14% | (b) | 0.70% | 0.97% | 0.74% | 0.72% | 1.02% | |||||||||||||||||||
Portfolio turnover rate | 15% | (a) | 23% | 22% | 19% | 14% | 20% | |||||||||||||||||||
Year ended September 30 | ||||||||||||||||||||||||||
Ariel Fund (Institutional Class) | Six months ended March 31, 2021 (Unaudited) | 2020 | 2019 | 2018 | 2017 | 2016 | ||||||||||||||||||||
Net asset value, beginning of period | $54.53 | $63.55 | $74.78 | $69.28 | $63.87 | $64.08 | ||||||||||||||||||||
Income from investment operations: | ||||||||||||||||||||||||||
Net investment income (loss) | 0.07 | 0.58 | 0.74 | 0.73 | 0.63 | 0.77 | ||||||||||||||||||||
Net realized and unrealized gain (loss) on investments | 30.07 | (5.62 | ) | (6.03 | ) | 9.38 | 9.19 | 8.91 | ||||||||||||||||||
|
|
|
|
|
|
|
|
|
|
|
|
|
|
|
|
|
| |||||||||
Total from investment operations | 30.14 | (5.04 | ) | (5.29 | ) | 10.11 | 9.82 | 9.68 | ||||||||||||||||||
Distributions to shareholders: | ||||||||||||||||||||||||||
Dividends from net investment income | (0.38 | ) | (0.75 | ) | (0.80 | ) | (0.68 | ) | (0.37 | ) | (0.63 | ) | ||||||||||||||
Distributions from capital gains | (3.40 | ) | (3.23 | ) | (5.14 | ) | (3.93 | ) | (4.04 | ) | (9.26 | ) | ||||||||||||||
|
|
|
|
|
|
|
|
|
|
|
|
|
|
|
|
|
| |||||||||
Total distributions | (3.78 | ) | (3.98 | ) | (5.94 | ) | (4.61 | ) | (4.41 | ) | (9.89 | ) | ||||||||||||||
|
|
|
|
|
|
|
|
|
|
|
|
|
|
|
|
|
| |||||||||
Net asset value, end of period | $80.89 | $54.53 | $63.55 | $74.78 | $69.28 | $63.87 | ||||||||||||||||||||
|
|
|
|
|
|
|
|
|
|
|
|
|
|
|
|
|
| |||||||||
Total return | 57.46% | (a) | (8.74 | )% | (6.86 | )% | 15.30% | 16.11% | 15.87% | |||||||||||||||||
Supplemental data and ratios: | ||||||||||||||||||||||||||
Net assets, end of period, in thousands | $1,161,080 | $596,645 | $742,864 | $673,273 | $593,887 | $521,595 | ||||||||||||||||||||
Ratio of expenses to average net assets | 0.69% | (b) | 0.72% | 0.70% | 0.72% | 0.71% | 0.72% | |||||||||||||||||||
Ratio of net investment income to average net assets | 0.45% | (b) | 1.01% | 1.31% | 1.03% | 1.01% | 1.31% | |||||||||||||||||||
Portfolio turnover rate | 15% | (a) | 23% | 22% | 19% | 14% | 20% | |||||||||||||||||||
| (a) | Not annualized. |
| (b) | Annualized. |
The accompanying notes are an integral part of the financial statements.
ARIELINVESTMENTS.COM 39
Table of Contents
Financial highlights For a share outstanding throughout each period
| ||
| ||
Year ended September 30 | ||||||||||||||||||||||||||
Ariel Appreciation Fund (Investor Class) | Six months ended March 31, 2021 (Unaudited) | 2020 | 2019 | 2018 | 2017 | 2016 | ||||||||||||||||||||
Net asset value, beginning of period | $38.76 | $44.43 | $49.48 | $50.91 | $48.90 | $48.01 | ||||||||||||||||||||
Income from investment operations: | ||||||||||||||||||||||||||
Net investment income (loss) | 0.06 | 0.48 | 0.62 | 0.40 | 0.51 | 0.70 | ||||||||||||||||||||
Net realized and unrealized gain (loss) on investments | 15.54 | (2.77 | ) | (2.83 | ) | 4.17 | 5.21 | 5.62 | ||||||||||||||||||
|
|
|
|
|
|
|
|
|
|
|
|
|
|
|
|
|
| |||||||||
Total from investment operations | 15.60 | (2.29 | ) | (2.21 | ) | 4.57 | 5.72 | 6.32 | ||||||||||||||||||
Distributions to shareholders: | ||||||||||||||||||||||||||
Dividends from net investment income | (0.24 | ) | (0.42 | ) | (0.42 | ) | (0.39 | ) | (0.30 | ) | (0.50 | ) | ||||||||||||||
Distributions from capital gains | (4.02 | ) | (2.96 | ) | (2.42 | ) | (5.61 | ) | (3.41 | ) | (4.93 | ) | ||||||||||||||
|
|
|
|
|
|
|
|
|
|
|
|
|
|
|
|
|
| |||||||||
Total distributions | (4.26 | ) | (3.38 | ) | (2.84 | ) | (6.00 | ) | (3.71 | ) | (5.43 | ) | ||||||||||||||
|
|
|
|
|
|
|
|
|
|
|
|
|
|
|
|
|
| |||||||||
Net asset value, end of period | $50.10 | $38.76 | $44.43 | $49.48 | $50.91 | $48.90 | ||||||||||||||||||||
|
|
|
|
|
|
|
|
|
|
|
|
|
|
|
|
|
| |||||||||
Total return | 42.91% | (a) | (5.93 | )% | (4.23 | )% | 9.90% | 12.41% | 13.66% | |||||||||||||||||
Supplemental data and ratios: | ||||||||||||||||||||||||||
Net assets, end of period, in thousands | $1,059,110 | $777,404 | $996,797 | $1,321,843 | $1,450,735 | $1,483,144 | ||||||||||||||||||||
Ratio of expenses to average net assets | 1.13% | (b) | 1.15% | 1.14% | 1.13% | 1.12% | 1.12% | |||||||||||||||||||
Ratio of net investment income to average net assets | 0.81% | (b) | 0.98% | 1.05% | 0.72% | 0.94% | 1.43% | |||||||||||||||||||
Portfolio turnover rate | 14% | (a) | 24% | 18% | 11% | 20% | 14% | |||||||||||||||||||
Year ended September 30 | ||||||||||||||||||||||||||
Ariel Appreciation Fund (Institutional Class) | Six months ended March 31, 2021 (Unaudited) | 2020 | 2019 | 2018 | 2017 | 2016 | ||||||||||||||||||||
Net asset value, beginning of period | $38.86 | $44.55 | $49.64 | $51.07 | $49.03 | $48.17 | ||||||||||||||||||||
Income from investment operations: | ||||||||||||||||||||||||||
Net investment income (loss) | 0.15 | 0.60 | 0.59 | 0.48 | 0.59 | 0.72 | ||||||||||||||||||||
Net realized and unrealized gain (loss) on investments | 15.56 | (2.77 | ) | (2.68 | ) | 4.25 | 5.30 | 5.76 | ||||||||||||||||||
|
|
|
|
|
|
|
|
|
|
|
|
|
|
|
|
|
| |||||||||
Total from investment operations | 15.71 | (2.17 | ) | (2.09 | ) | 4.73 | 5.89 | 6.48 | ||||||||||||||||||
Distributions to shareholders: | ||||||||||||||||||||||||||
Dividends from net investment income | (0.36 | ) | (0.56 | ) | (0.58 | ) | (0.55 | ) | (0.44 | ) | (0.69 | ) | ||||||||||||||
Distributions from capital gains | (4.02 | ) | (2.96 | ) | (2.42 | ) | (5.61 | ) | (3.41 | ) | (4.93 | ) | ||||||||||||||
|
|
|
|
|
|
|
|
|
|
|
|
|
|
|
|
|
| |||||||||
Total distributions | (4.38 | ) | (3.52 | ) | (3.00 | ) | (6.16 | ) | (3.85 | ) | (5.62 | ) | ||||||||||||||
|
|
|
|
|
|
|
|
|
|
|
|
|
|
|
|
|
| |||||||||
Net asset value, end of period | $50.19 | $38.86 | $44.55 | $49.64 | $51.07 | $49.03 | ||||||||||||||||||||
|
|
|
|
|
|
|
|
|
|
|
|
|
|
|
|
|
| |||||||||
Total return | 43.14% | (a) | (5.65 | )% | (3.91 | )% | 10.21% | 12.78% | 14.01% | |||||||||||||||||
Supplemental data and ratios: | ||||||||||||||||||||||||||
Net assets, end of period, in thousands | $292,017 | $196,009 | $298,211 | $267,831 | $247,526 | $219,206 | ||||||||||||||||||||
Ratio of expenses to average net assets | 0.83% | (b) | 0.84% | 0.82% | 0.82% | 0.81% | 0.82% | |||||||||||||||||||
Ratio of net investment income to average net assets | 1.12% | (b) | 1.26% | 1.39% | 1.03% | 1.25% | 1.73% | |||||||||||||||||||
Portfolio turnover rate | 14% | (a) | 24% | 18% | 11% | 20% | 14% | |||||||||||||||||||
| (a) | Not annualized. |
| (b) | Annualized. |
The accompanying notes are an integral part of the financial statements.
40 SLOW AND STEADY WINS THE RACE
Table of Contents
Financial highlights For a share outstanding throughout each period
| ||
| ||
Year ended September 30 | ||||||||||||||||||||||||||
Ariel Focus Fund (Investor Class) | Six months ended March 31, 2021 (Unaudited) | 2020 | 2019 | 2018 | 2017 | 2016 | ||||||||||||||||||||
Net asset value, beginning of period | $12.13 | $12.89 | $14.77 | $13.71 | $11.83 | $11.70 | ||||||||||||||||||||
Income from investment operations: | ||||||||||||||||||||||||||
Net investment income (loss) | 0.07 | 0.18 | 0.16 | 0.13 | 0.13 | 0.13 | ||||||||||||||||||||
Net realized and unrealized gain (loss) on investments | 4.89 | (0.80 | ) | (1.20 | ) | 1.71 | 1.88 | 1.46 | ||||||||||||||||||
|
|
|
|
|
|
|
|
|
|
|
|
|
|
|
|
|
| |||||||||
Total from investment operations | 4.96 | (0.62 | ) | (1.04 | ) | 1.84 | 2.01 | 1.59 | ||||||||||||||||||
Distributions to shareholders: | ||||||||||||||||||||||||||
Dividends from net investment income | (0.12 | ) | (0.14 | ) | (0.13 | ) | (0.11 | ) | (0.13 | ) | (0.13 | ) | ||||||||||||||
Distributions from capital gains | (0.22 | ) | — | (0.71 | ) | (0.67 | ) | — | (1.33 | ) | ||||||||||||||||
|
|
|
|
|
|
|
|
|
|
|
|
|
|
|
|
|
| |||||||||
Total distributions | (0.34 | ) | (0.14 | ) | (0.84 | ) | (0.78 | ) | (0.13 | ) | (1.46 | ) | ||||||||||||||
|
|
|
|
|
|
|
|
|
|
|
|
|
|
|
|
|
| |||||||||
Net asset value, end of period | $16.75 | $12.13 | $12.89 | $14.77 | $13.71 | $11.83 | ||||||||||||||||||||
|
|
|
|
|
|
|
|
|
|
|
|
|
|
|
|
|
| |||||||||
Total return | 41.66%(a) | (4.91)% | (6.86)% | 14.26% | 17.09% | 14.59% | ||||||||||||||||||||
Supplemental data and ratios: | ||||||||||||||||||||||||||
Net assets, end of period, in thousands | $43,804 | $31,852 | $40,770 | $44,964 | $40,607 | $36,173 | ||||||||||||||||||||
Ratio of expenses to average net assets, including waivers | 1.00% | (b) | 1.00% | 1.00% | 1.00% | 1.00% | 1.00% | |||||||||||||||||||
Ratio of expenses to average net assets, excluding waivers | 1.22% | (b) | 1.25% | 1.23% | 1.20% | 1.19% | 1.35% | |||||||||||||||||||
Ratio of net investment income to average net assets, including waivers | 1.05% | (b) | 1.23% | 1.30% | 0.98% | 0.93% | 1.23% | |||||||||||||||||||
Ratio of net investment income to average net assets, excluding waivers | 0.83% | (b) | 0.98% | 1.07% | 0.78% | 0.74% | 0.88% | |||||||||||||||||||
Portfolio turnover rate | 16% | (a) | 22% | 18% | 27% | 35% | 20% | |||||||||||||||||||
Year ended September 30 | ||||||||||||||||||||||||||
Ariel Focus Fund (Institutional Class) | Six months ended March 31, 2021 (Unaudited) | 2020 | 2019 | 2018 | 2017 | 2016 | ||||||||||||||||||||
Net asset value, beginning of period | $12.14 | $12.89 | $14.77 | $13.69 | $11.81 | $11.71 | ||||||||||||||||||||
Income from investment operations: | ||||||||||||||||||||||||||
Net investment income (loss) | 0.09 | 0.19 | 0.19 | 0.17 | 0.15 | 0.15 | ||||||||||||||||||||
Net realized and unrealized gain (loss) on investments | 4.89 | (0.78 | ) | (1.20 | ) | 1.71 | 1.89 | 1.46 | ||||||||||||||||||
|
|
|
|
|
|
|
|
|
|
|
|
|
|
|
|
|
| |||||||||
Total from investment operations | 4.98 | (0.59 | ) | (1.01 | ) | 1.88 | 2.04 | 1.61 | ||||||||||||||||||
Distributions to shareholders: | ||||||||||||||||||||||||||
Dividends from net investment income | (0.14 | ) | (0.16 | ) | (0.16 | ) | (0.13 | ) | (0.16 | ) | (0.18 | ) | ||||||||||||||
Distributions from capital gains | (0.22 | ) | — | (0.71 | ) | (0.67 | ) | — | (1.33 | ) | ||||||||||||||||
|
|
|
|
|
|
|
|
|
|
|
|
|
|
|
|
|
| |||||||||
Total distributions | (0.36 | ) | (0.16 | ) | (0.87 | ) | (0.80 | ) | (0.16 | ) | (1.51 | ) | ||||||||||||||
|
|
|
|
|
|
|
|
|
|
|
|
|
|
|
|
|
| |||||||||
Net asset value, end of period | $16.76 | $12.14 | $12.89 | $14.77 | $13.69 | $11.81 | ||||||||||||||||||||
|
|
|
|
|
|
|
|
|
|
|
|
|
|
|
|
|
| |||||||||
Total return | 41.83%(a) | (4.69)% | (6.56)% | 14.54% | 17.40% | 14.83% | ||||||||||||||||||||
Supplemental data and ratios: | ||||||||||||||||||||||||||
Net assets, end of period, in thousands | $17,742 | $12,732 | $15,552 | $20,929 | $14,378 | $11,618 | ||||||||||||||||||||
Ratio of expenses to average net assets, including waivers | 0.75% | (b) | 0.75% | 0.75% | 0.75% | 0.75% | 0.75% | |||||||||||||||||||
Ratio of expenses to average net assets, excluding waivers | 0.88% | (b) | 0.89% | 0.89% | 0.86% | 0.90% | 1.08% | |||||||||||||||||||
Ratio of net investment income to average net assets, including waivers | 1.30% | (b) | 1.47% | 1.54% | 1.24% | 1.18% | 1.48% | |||||||||||||||||||
Ratio of net investment income to average net assets, excluding waivers | 1.17% | (b) | 1.33% | 1.40% | 1.13% | 1.03% | 1.15% | |||||||||||||||||||
Portfolio turnover rate | 16% | (a) | 22% | 18% | 27% | 35% | 20% | |||||||||||||||||||
| (a) | Not annualized. |
| (b) | Annualized. |
The accompanying notes are an integral part of the financial statements.
ARIELINVESTMENTS.COM 41
Table of Contents
Financial highlights For a share outstanding throughout each period
| ||
| ||
Year ended September 30 | ||||||||||||||||||||||||||
Ariel International Fund (Investor Class) | Six months ended March 31, 2021 (Unaudited) | 2020 | 2019 | 2018 | 2017 | 2016 | ||||||||||||||||||||
Net asset value, beginning of period | $13.68 | $13.42 | $13.91 | $14.23 | $13.21 | $12.17 | ||||||||||||||||||||
Income from investment operations: | ||||||||||||||||||||||||||
Net investment income (loss) | 0.06 | 0.36 | 0.79 | 0.37 | 0.26 | 0.14 | ||||||||||||||||||||
Net realized and unrealized gain (loss) on investments | 1.08 | 0.12 | (1.13 | ) | (0.44 | ) | 0.96 | 0.93 | ||||||||||||||||||
|
|
|
|
|
|
|
|
|
|
|
|
|
|
|
|
|
| |||||||||
Total from investment operations | 1.14 | 0.48 | (0.34 | ) | (0.07 | ) | 1.22 | 1.07 | ||||||||||||||||||
Distributions to shareholders: | ||||||||||||||||||||||||||
Dividends from net investment income | (0.21 | ) | (0.22 | ) | (0.12 | ) | (0.10 | ) | (0.17 | ) | (0.02 | ) | ||||||||||||||
Distributions from capital gains | — | — | (0.03 | ) | (0.15 | ) | (0.03 | ) | (0.01 | ) | ||||||||||||||||
|
|
|
|
|
|
|
|
|
|
|
|
|
|
|
|
|
| |||||||||
Total distributions | (0.21 | ) | (0.22 | ) | (0.15 | ) | (0.25 | ) | (0.20 | ) | (0.03 | ) | ||||||||||||||
|
|
|
|
|
|
|
|
|
|
|
|
|
|
|
|
|
| |||||||||
Net asset value, end of period | $14.61 | $13.68 | $13.42 | $13.91 | $14.23 | $13.21 | ||||||||||||||||||||
|
|
|
|
|
|
|
|
|
|
|
|
|
|
|
|
|
| |||||||||
Total return | 8.41%(a) | 3.57% | (2.39)% | (0.49)% | 9.55% | 8.76% | ||||||||||||||||||||
Supplemental data and ratios: | ||||||||||||||||||||||||||
Net assets, end of period, in thousands | $24,403 | $21,877 | $24,849 | $54,169 | $70,616 | $72,200 | ||||||||||||||||||||
Ratio of expenses to average net assets, including waivers | 1.13% | (b) | 1.13% | 1.13% | 1.13% | 1.15% | (c) | 1.25% | ||||||||||||||||||
Ratio of expenses to average net assets, excluding waivers | 1.32% | (b) | 1.33% | 1.32% | 1.31% | 1.32% | 1.52% | |||||||||||||||||||
Ratio of net investment income to average net assets, including waivers | 1.24% | (b) | 1.69% | 1.94% | 1.80% | 1.79% | 1.94% | |||||||||||||||||||
Ratio of net investment income to average net assets, excluding waivers | 1.05% | (b) | 1.49% | 1.75% | 1.62% | 1.62% | 1.67% | |||||||||||||||||||
Portfolio turnover rate | 16% | (a) | 24% | 20% | 8% | 23% | 27% | |||||||||||||||||||
Year ended September 30 | ||||||||||||||||||||||||||
Ariel International Fund (Institutional Class) | Six months ended March 31, 2021 (Unaudited) | 2020 | 2019 | 2018 | 2017 | 2016 | ||||||||||||||||||||
Net asset value, beginning of period | $13.39 | $13.18 | $13.68 | $13.99 | $13.00 | $11.96 | ||||||||||||||||||||
Income from investment operations: | ||||||||||||||||||||||||||
Net investment income (loss) | 0.10 | 0.29 | 0.29 | 0.23 | 0.18 | 0.20 | ||||||||||||||||||||
Net realized and unrealized gain (loss) on investments | 1.04 | 0.20 | (0.60 | ) | (0.26 | ) | 1.05 | 0.87 | ||||||||||||||||||
|
|
|
|
|
|
|
|
|
|
|
|
|
|
|
|
|
| |||||||||
Total from investment operations | 1.14 | 0.49 | (0.31 | ) | (0.03 | ) | 1.23 | 1.07 | ||||||||||||||||||
Distributions to shareholders: | ||||||||||||||||||||||||||
Dividends from net investment income | (0.24 | ) | (0.28 | ) | (0.16 | ) | (0.13 | ) | (0.21 | ) | (0.02 | ) | ||||||||||||||
Distributions from capital gains | — | — | (0.03 | ) | (0.15 | ) | (0.03 | ) | (0.01 | ) | ||||||||||||||||
|
|
|
|
|
|
|
|
|
|
|
|
|
|
|
|
|
| |||||||||
Total distributions | (0.24 | ) | (0.28 | ) | (0.19 | ) | (0.28 | ) | (0.24 | ) | (0.03 | ) | ||||||||||||||
|
|
|
|
|
|
|
|
|
|
|
|
|
|
|
|
|
| |||||||||
Net asset value, end of period | $14.29 | $13.39 | $13.18 | $13.68 | $13.99 | $13.00 | ||||||||||||||||||||
|
|
|
|
|
|
|
|
|
|
|
|
|
|
|
|
|
| |||||||||
Total return | 8.58%(a) | 3.74% | (2.13)% | (0.17)% | 9.80% | 8.98% | ||||||||||||||||||||
Supplemental data and ratios: | ||||||||||||||||||||||||||
Net assets, end of period, in thousands | $773,873 | $599,770 | $722,616 | $620,017 | $431,341 | $120,904 | ||||||||||||||||||||
Ratio of expenses to average net assets, including waivers | 0.88% | (b) | 0.88% | 0.88% | 0.88% | 0.89% | (c) | 1.00% | ||||||||||||||||||
Ratio of expenses to average net assets, excluding waivers | 0.94% | (b) | 0.96% | 0.93% | 0.93% | 0.95% | 1.10% | |||||||||||||||||||
Ratio of net investment income to average net assets, including waivers | 1.55% | (b) | 1.98% | 2.49% | 2.23% | 2.52% | 2.41% | |||||||||||||||||||
Ratio of net investment income to average net assets, excluding waivers | 1.49% | (b) | 1.90% | 2.44% | 2.18% | 2.46% | 2.31% | |||||||||||||||||||
Portfolio turnover rate | 16% | (a) | 24% | 20% | 8% | 23% | 27% | |||||||||||||||||||
| (a) | Not annualized. |
| (b) | Annualized. |
| (c) | Effective November 29, 2016, the Adviser contractually agreed to waive fees and reimburse expenses in order to limit the Fund’s total annual operating expenses to 1.13% for the Investor Class and 0.88% for the Institutional Class. |
The accompanying notes are an integral part of the financial statements.
42 SLOW AND STEADY WINS THE RACE
Table of Contents
Financial highlights For a share outstanding throughout each period
| ||
| ||
Year ended September 30 | ||||||||||||||||||||||||||
Ariel Global Fund (Investor Class) | Six months ended March 31, 2021 (Unaudited) | 2020 | 2019 | 2018 | 2017 | 2016 | ||||||||||||||||||||
Net asset value, beginning of period | $15.36 | $15.40 | $16.48 | $16.05 | $14.60 | $13.11 | ||||||||||||||||||||
Income from investment operations: | ||||||||||||||||||||||||||
Net investment income (loss) | 0.12 | 0.27 | 0.32 | 0.19 | 0.22 | 0.12 | ||||||||||||||||||||
Net realized and unrealized gain (loss) on investments | 1.96 | 0.38 | (0.92 | ) | 0.94 | 1.60 | 1.48 | |||||||||||||||||||
|
|
|
|
|
|
|
|
|
|
|
|
|
|
|
|
|
| |||||||||
Total from investment operations | 2.08 | 0.65 | (0.60 | ) | 1.13 | 1.82 | 1.60 | |||||||||||||||||||
Distributions to shareholders: | ||||||||||||||||||||||||||
Dividends from net investment income | (0.14 | ) | (0.31 | ) | (0.32 | ) | (0.16 | ) | (0.21 | ) | (0.11 | ) | ||||||||||||||
Distributions from capital gains | — | (0.38 | ) | (0.16 | ) | (0.54 | ) | (0.16 | ) | — | ||||||||||||||||
|
|
|
|
|
|
|
|
|
|
|
|
|
|
|
|
|
| |||||||||
Total distributions | (0.14 | ) | (0.69 | ) | (0.48 | ) | (0.70 | ) | (0.37 | ) | (0.11 | ) | ||||||||||||||
|
|
|
|
|
|
|
|
|
|
|
|
|
|
|
|
|
| |||||||||
Net asset value, end of period | $17.30 | $15.36 | $15.40 | $16.48 | $16.05 | $14.60 | ||||||||||||||||||||
|
|
|
|
|
|
|
|
|
|
|
|
|
|
|
|
|
| |||||||||
Total return | 13.61%(a) | 4.23% | (3.41)% | 7.38% | 12.87% | 12.26% | ||||||||||||||||||||
Supplemental data and ratios: | ||||||||||||||||||||||||||
Net assets, end of period, in thousands | $12,890 | $10,733 | $12,159 | $14,798 | $11,459 | $9,275 | ||||||||||||||||||||
Ratio of expenses to average net assets, including waivers | 1.13% | (b) | 1.13% | 1.13% | 1.13% | 1.15% | (c) | 1.25% | ||||||||||||||||||
Ratio of expenses to average net assets, excluding waivers | 1.39% | (b) | 1.46% | 1.44% | 1.46% | 1.42% | 1.70% | |||||||||||||||||||
Ratio of net investment income to average net assets, including waivers | 1.32% | (b) | 1.61% | 1.85% | 1.60% | 1.66% | 1.34% | |||||||||||||||||||
Ratio of net investment income to average net assets, excluding waivers | 1.06% | (b) | 1.28% | 1.54% | 1.27% | 1.39% | 0.90% | |||||||||||||||||||
Portfolio turnover rate | 18% | (a) | 23% | 29% | 11% | 24% | 31% | |||||||||||||||||||
Year ended September 30 | ||||||||||||||||||||||||||
Ariel Global Fund (Institutional Class) | Six months ended March 31, 2021 (Unaudited) | 2020 | 2019 | 2018 | 2017 | 2016 | ||||||||||||||||||||
Net asset value, beginning of period | $14.87 | $14.92 | $15.98 | $15.57 | $14.21 | $12.81 | ||||||||||||||||||||
Income from investment operations: | ||||||||||||||||||||||||||
Net investment income (loss) | 0.07 | 0.21 | 0.39 | 0.24 | 0.25 | 0.20 | ||||||||||||||||||||
Net realized and unrealized gain (loss) on investments | 1.97 | 0.45 | (0.93 | ) | 0.89 | 1.55 | 1.40 | |||||||||||||||||||
|
|
|
|
|
|
|
|
|
|
|
|
|
|
|
|
|
| |||||||||
Total from investment operations | 2.04 | 0.66 | (0.54 | ) | 1.13 | 1.80 | 1.60 | |||||||||||||||||||
Distributions to shareholders: | ||||||||||||||||||||||||||
Dividends from net investment income | (0.16 | ) | (0.33 | ) | (0.36 | ) | (0.18 | ) | (0.28 | ) | (0.20 | ) | ||||||||||||||
Distributions from capital gains | — | (0.38 | ) | (0.16 | ) | (0.54 | ) | (0.16 | ) | — | ||||||||||||||||
|
|
|
|
|
|
|
|
|
|
|
|
|
|
|
|
|
| |||||||||
Total distributions | (0.16 | ) | (0.71 | ) | (0.52 | ) | (0.72 | ) | (0.44 | ) | (0.20 | ) | ||||||||||||||
|
|
|
|
|
|
|
|
|
|
|
|
|
|
|
|
|
| |||||||||
Net asset value, end of period | $16.75 | $14.87 | $14.92 | $15.98 | $15.57 | $14.21 | ||||||||||||||||||||
|
|
|
|
|
|
|
|
|
|
|
|
|
|
|
|
|
| |||||||||
Total return | 13.81%(a) | 4.48% | (3.18)% | 7.63% | 13.10% | 12.56% | ||||||||||||||||||||
Supplemental data and ratios: | ||||||||||||||||||||||||||
Net assets, end of period, in thousands | $127,794 | $95,229 | $73,724 | $119,609 | $89,898 | $73,166 | ||||||||||||||||||||
Ratio of expenses to average net assets, including waivers | 0.88% | (b) | 0.88% | 0.88% | 0.88% | 0.90% | (c) | 1.00% | ||||||||||||||||||
Ratio of expenses to average net assets, excluding waivers | 0.97% | (b) | 1.01% | 0.99% | 0.98% | 1.01% | 1.14% | |||||||||||||||||||
Ratio of net investment income to average net assets, including waivers | 1.60% | (b) | 1.93% | 2.07% | 1.88% | 1.91% | 1.60% | |||||||||||||||||||
Ratio of net investment income to average net assets, excluding waivers | 1.51% | (b) | 1.80% | 1.96% | 1.78% | 1.80% | 1.47% | |||||||||||||||||||
Portfolio turnover rate | 18% | (a) | 23% | 29% | 11% | 24% | 31% | |||||||||||||||||||
(a) Not annualized.
(b) Annualized.
| (c) | Effective November 29, 2016, the Adviser contractually agreed to waive fees and reimburse expenses in order to limit the Fund’s total annual operating expenses to 1.13% for the Investor Class and 0.88% for the Institutional Class. |
The accompanying notes are an integral part of the financial statements.
ARIELINVESTMENTS.COM 43
Table of Contents
Notes to the financial statements
| 03/31/21 (UNAUDITED)
| |
| ||
NOTE ONE | ORGANIZATION
Ariel Investment Trust (the “Trust”) is a Massachusetts business trust registered under the Investment Company Act of 1940, as amended (the “1940 Act”), as an open-end management investment company. Ariel Fund, Ariel Appreciation Fund, Ariel Focus Fund, Ariel International Fund and Ariel Global Fund (each, a “Fund” and collectively, the “Funds”) are series of the Trust. Ariel Focus Fund is a non-diversified Fund, all other Funds are diversified. The Funds issue two classes of shares: an Investor Class and an Institutional Class.
The Northern Trust Company (“Northern Trust”) provides fund administration and tax reporting services for the Funds in its role as sub-fund administrator engaged by the Adviser for Ariel Fund, Ariel Appreciation Fund and Ariel Focus Fund and as fund administrator engaged by the Trust for Ariel International Fund and Ariel Global Fund. Northern Trust also acts as the Funds’ accounting agent and custodian. U.S. Bank Global Fund Services serves as the Funds’ transfer agent.
NOTE TWO | SIGNIFICANT ACCOUNTING POLICIES
The following is a summary of significant accounting policies consistently followed by the Funds in the preparation of their financial statements. The Funds are investment companies and follow accounting and reporting guidance in the Financial Accounting Standards Board (FASB) Accounting Standards CodificationTM Topic 946 (ASC 946). The accompanying financial statements were prepared in accordance with accounting principles generally accepted in the United States of America (GAAP), including but not limited to ASC 946. GAAP requires management to make certain estimates and assumptions at the date of the financial statements. Actual results may differ from such estimates.
Securities valuation—Securities for which market quotations are readily available are valued at the last sale price on the national securities exchange on which such securities are primarily traded and, in the case of securities reported on the Nasdaq system, are valued based on the Nasdaq Official Closing Price. If a last sale price or a closing price is not reported, a security shall be valued using i) the closing price on another exchange on which the security traded (if such price is made available by the pricing vendor) or ii) the mean between the bid and ask prices for securities for which reliable bid and ask quotations are available.
Certain common stocks that trade on foreign exchanges are subject to valuation adjustments to account for the market movement between the close of a foreign market in which the security is traded and the close of the New York Stock Exchange. In the event the Funds become aware of a significant event that may materially affect the value of a security, a fair value of such security will be determined in accordance with procedures established by the Board of Trustees.
Investments in money market funds are valued at their closing net asset value each business day.
Debt securities having a maturity over 60 days are valued using evaluated prices or matrix pricing methods determined by a pricing service which take into consideration factors such as yield, maturity, ratings, and traded prices in identical or similar securities. Short-term debt obligations having a maturity of 60 days or less are valued at amortized cost, so long as it approximates fair value.
Securities and assets for which market quotations are not readily available are valued at fair value as determined in good faith by or under the direction of the Board of Trustees.
Securities transactions and investment income—Securities transactions are accounted for on a trade date basis. Realized gains and losses from securities transactions are recorded on the identified cost basis. Dividend income is recorded on the ex-dividend date and interest income is recognized on an accrual basis. Dividends from foreign securities are recorded on the ex-dividend date, or as soon as the information is available.
Subsequent events—In preparing these financial statements, the Trust has evaluated subsequent events occurring after March 31, 2021 through the date the financial statements were issued and determined that there were no such events that would require adjustment to or additional disclosure in these financial statements.
Fair value measurements—Accounting Standards CodificationTM Topic 820-10 (ASC 820-10) establishes a three-tier framework for measuring fair value based on a hierarchy of inputs. The hierarchy distinguishes between market data obtained from independent sources (observable inputs) and the Funds’ own market assumptions (unobservable inputs). These inputs are used in determining the value of the Funds’ investments and are summarized below:
Level 1 – quoted prices in active markets for identical securities
Level 2 – other significant observable inputs (including quoted prices for similar securities, “quoted” prices in inactive markets, dealer indications, and inputs corroborated by observable market data)
Level 3 – significant unobservable inputs (including the Funds’ own assumptions in determining the fair value of investments) The inputs or methodology used for valuing securities are not necessarily an indication of the risk associated with investing in those securities.
44 SLOW AND STEADY WINS THE RACE
Table of Contents
Notes to the financial statements
| 03/31/21 (UNAUDITED)
| |
| ||
The following tables summarize the inputs used as of March 31, 2021, in valuing the Funds’ investments carried at fair value:
Ariel Fund
|
Ariel Appreciation Fund
|
Ariel Focus Fund
| ||||||||||
Level 1 | $2,873,391,215 | $1,345,873,184 | $61,594,737 | |||||||||
Level 2 | — | — | — | |||||||||
Level 3 | — | — | — | |||||||||
|
|
|
|
|
| |||||||
Total Investments | $2,873,391,215 | $1,345,873,184 | $61,594,737 | |||||||||
|
|
|
|
|
| |||||||
Industry classifications for Ariel Fund, Ariel Appreciation Fund, and Ariel Focus Fund are included in the Schedules of Investments for the respective Fund.
Ariel International Fund
| Level 1
| Level 2 *
| Level 3
| Total
| ||||||||||||
Common stocks | ||||||||||||||||
Communication services | $160,937,478 | $— | $— | $160,937,478 | ||||||||||||
Consumer discretionary | 103,776,404 | — | — | 103,776,404 | ||||||||||||
Consumer staples | 117,995,205 | — | — | 117,995,205 | ||||||||||||
Energy | 7,136,950 | — | — | 7,136,950 | ||||||||||||
Financials | 84,212,731 | — | — | 84,212,731 | ||||||||||||
Health care | 124,816,399 | — | — | 124,816,399 | ||||||||||||
Industrials | 18,974,798 | — | — | 18,974,798 | ||||||||||||
Information technology | 22,061,544 | — | — | 22,061,544 | ||||||||||||
Real estate | 6,975,534 | — | — | 6,975,534 | ||||||||||||
Utilities | 98,720,583 | — | — | 98,720,583 | ||||||||||||
|
|
|
|
|
|
|
|
|
|
|
| |||||
Total common stocks | $745,607,626 | $— | $— | $745,607,626 | ||||||||||||
Short-term investments | 43,180,078 | — | — | 43,180,078 | ||||||||||||
|
|
|
|
|
|
|
|
|
|
|
| |||||
Total investments | $788,787,704 | $— | $— | $788,787,704 | ||||||||||||
|
|
|
|
|
|
|
|
|
|
|
| |||||
Other financial instruments | ||||||||||||||||
Forward currency contracts^
|
| $—
|
|
| $(2,649,566
| )
|
| $—
|
|
| $(2,649,566
| )
| ||||
Ariel Global Fund
| Level 1
| Level 2 *
| Level 3
| Total
| ||||||||||||
Common stocks | ||||||||||||||||
Communication services | $22,497,131 | $— | $— | $22,497,131 | ||||||||||||
Consumer discretionary | 11,880,426 | — | — | 11,880,426 | ||||||||||||
Consumer staples | 14,485,862 | — | — | 14,485,862 | ||||||||||||
Financials | 15,521,206 | — | — | 15,521,206 | ||||||||||||
Health care | 34,362,114 | — | — | 34,362,114 | ||||||||||||
Industrials | 807,500 | — | — | 807,500 | ||||||||||||
Information technology | 23,123,311 | — | — | 23,123,311 | ||||||||||||
Real estate | 1,955,196 | — | — | 1,955,196 | ||||||||||||
Utilities | 7,739,934 | — | — | 7,739,934 | ||||||||||||
|
|
|
|
|
|
|
|
|
|
|
| |||||
Total common stocks | $132,372,680 | $— | $— | $132,372,680 | ||||||||||||
Short-term investments | 5,776,601 | — | — | 5,776,601 | ||||||||||||
|
|
|
|
|
|
|
|
|
|
|
| |||||
Total investments | $138,149,281 | $— | $— | $138,149,281 | ||||||||||||
|
|
|
|
|
|
|
|
|
|
|
| |||||
Other financial instruments | ||||||||||||||||
Forward currency contracts^ | $— | $637,688 | $— | $637,688 | ||||||||||||
| * | As of March 31, 2021, the Level 2 investments held were foreign forward currency contracts. See Schedules of Investments. |
| ^ | Forward currency contracts derive their value from underlying exchange rates. These instruments are normally valued by pricing vendors using pricing models. The pricing models typically use inputs that are observed from trading in active forward foreign currency markets. As such, forward currency contracts are categorized as Level 2. The value of forward currency contracts that is disclosed in this table is equal to the difference between Open forward currency contracts with unrealized appreciation and Open forward currency contracts with unrealized depreciation shown in the Schedules of Investments. |
Offsetting assets and liabilities—The Funds are subject to various master netting agreements (“Master Netting Agreements”), which govern the terms of certain transactions with select counterparties. Master Netting Agreements seek to reduce the counterparty risk associated with relevant transactions by allowing the Funds to close out and net their total exposure to a counterparty in the event of a
ARIELINVESTMENTS.COM 45
Table of Contents
Notes to the financial statements
| 03/31/21 (UNAUDITED)
| |
| ||
default by the other party or a termination event. Termination events include, but are not limited to, a failure to pay or deliver or a breach of the terms of the agreement with respect to transactions governed under a single agreement with that counterparty. The Master Netting Agreements may also specify collateral posting arrangements at pre-arranged exposure levels. The Funds are not currently collateralizing their exposures related to foreign exchange trades. For financial reporting purposes, the Funds do not offset financial assets and liabilities that are subject to the Master Netting Agreements in the Statements of Assets and Liabilities. Gross exposure relating to open forward currency contracts by counterparty is disclosed in the Schedules of Investments as Open forward currency contracts with unrealized appreciation (assets) and Open forward currency contracts with unrealized depreciation (liabilities) and in total by Fund on the Statements of Assets and Liabilities as Unrealized appreciation on forward currency contracts (assets) and Unrealized depreciation on forward currency contracts (liabilities). The net recognized asset (appreciation) or liability (depreciation) is shown in the Schedules of Investments as Net unrealized appreciation (depreciation) on forward currency contracts.
Foreign currency—Securities and other assets and liabilities denominated in foreign currencies are translated into U.S. dollars on a daily basis using exchange rates obtained from an independent third party. Net realized gain (loss) and Net unrealized appreciation (depreciation) on investments include the effects of changes in exchange rates on the underlying investments. Fluctuations in the value of other assets and liabilities resulting from changes in exchange rates are included as Distributable earnings on the Statements of Assets and Liabilities until the underlying assets or liabilities are settled in cash, at which time they are recorded as Net realized gain (loss) on translation of assets and liabilities in foreign currencies on the Statements of Operations.
Forward currency contracts—Ariel International Fund and Ariel Global Fund enter into forward currency contracts to provide the appropriate currency exposure related to protecting the value of securities and related receivables and payables against changes in foreign exchange rates. The primary risk associated with a Fund’s use of these contracts is that a counterparty will fail to fulfill its obligation to pay gains due to the Fund under the contracts. This counterparty risk is mitigated by entering into forward currency contracts only with highly rated counterparties. Forward currency contracts are “marked-to-market” daily, and as noted above, any resulting unrealized gain (loss) is recorded as Net unrealized appreciation (depreciation) on forward currency contracts as disclosed in the Schedules of Investments and in the Statements of Assets and Liabilities as a component of Distributable earnings. The Funds record realized gain (loss) when a forward currency contract is settled or closed and disclose such realized gain (loss) on the Statements of Operations as Net realized gain (loss) on forward currency contracts.
Class and expense allocations—Each class of shares of the Funds has equal rights as to assets and earnings, except that shareholders of each class bear certain class-specific expenses related to marketing and distribution and shareholder servicing and communication. Income, other non-class-specific expense, and realized and unrealized gains and losses on investments are allocated to each class of shares based on its relative net assets. Expenses that are not directly attributable to one or more Funds are allocated among applicable Funds on an equitable and consistent basis considering such things as the nature and type of expense and the relative net assets of the Funds.
Ariel Fund, Ariel Appreciation Fund and Ariel Focus Fund pay all operating expenses not expressly assumed by the Adviser, including custodial and transfer agency fees, federal and state securities registration fees, legal and audit fees, and brokerage commissions and other costs associated with the purchase and sale of portfolio securities. Ariel International Fund and Ariel Global Fund pay all operating expenses not expressly assumed by the Adviser, including custodial and transfer agency fees, fund administration, fund accounting, federal and state securities registration fees, legal and audit fees, and brokerage commissions and other costs associated with the purchase and sale of portfolio securities.
Distributions to shareholders—Dividends from net investment income and net realized capital gains, if any, are declared and paid to shareholders at least annually and are recorded on ex-dividend date.
NOTE THREE | INVESTMENT TRANSACTIONS
Purchases and sales—Cost of purchases and proceeds from sales of securities, excluding short-term investments, for the six months ended March 31, 2021 were as follows:
Ariel Fund
| Ariel Appreciation
| Ariel Focus Fund
| Ariel International
| Ariel Global Fund
| ||||||
Purchases | $442,670,122 | $156,362,696 | $8,243,894 | $249,423,973 | $40,130,516 | |||||
Sales | 297,068,847 | 215,093,488 | 9,505,811 | 103,823,543 | 20,903,790 | |||||
NOTE FOUR | INCOME TAX MATTERS AND DISTRIBUTIONS TO SHAREHOLDERS
Income Tax Matters—It is the Funds’ policy to comply with the requirements of the Internal Revenue Code applicable to regulated investment companies and to distribute substantially all taxable income to shareholders. The Funds file U.S. federal income tax returns in addition to state and local tax returns that may be required. Management has analyzed the Funds’ tax positions taken for all open federal income tax years (September 30, 2017 – 2020), and has concluded that no provision for federal income tax is required in the financial statements.
46 SLOW AND STEADY WINS THE RACE
Table of Contents
Notes to the financial statements
| 03/31/21 (UNAUDITED)
| |
| ||
The cost and unrealized appreciation and depreciation of investments (including derivative instruments) on a federal income tax basis at March 31, 2021 were as follows:
| Ariel Fund | Ariel Appreciation Fund | Ariel Focus Fund | Ariel International Fund | Ariel Global Fund | ||||||||||||||||
Cost of investments | $ | 1,757,137,726 | $ | 782,599,721 | $ | 42,180,082 | $ | 692,587,805 | $ | 107,259,733 | ||||||||||
|
|
|
|
|
|
|
|
|
|
|
|
|
| |||||||
Gross unrealized appreciation | 1,116,253,489 | 584,256,888 | 20,125,348 | 120,854,333 | 33,770,020 | |||||||||||||||
Gross unrealized depreciation | — | (20,983,425) | (710,693) | (24,654,434) | (2,880,472) | |||||||||||||||
|
|
|
|
|
|
|
|
|
|
|
|
|
| |||||||
Net unrealized appreciation (depreciation) | $ | 1,116,253,489 | $ | 563,273,463 | $ | 19,414,655 | $ | 96,199,899 | $ | 30,889,548 | ||||||||||
|
|
|
|
|
|
|
|
|
|
|
|
|
| |||||||
The difference between book basis and tax basis unrealized appreciation and depreciation is attributable primarily to the deferral of losses due to wash sales and partnership adjustments.
Tax adjustments are calculated annually. For interim periods, the Funds determine an estimate of tax cost adjustments based on a review of accounting reports for the interim period to identify changes from the adjustments calculated at the fiscal year end. For the previous fiscal year’s federal income tax information, please refer to the Notes to Financial Statements section in the Fund’s most recent annual report.
Distributions to shareholders—Reclassifications between net asset accounts are made at the end of the fiscal year for such differences that are permanent in nature. These differences are primarily due to distribution reclassifications, net operating loss, or foreign currency.
Distributions —The tax character of distributions paid during the periods ended March 31, 2021 and September 30, 2020 was as follows:
Ariel Fund
| Ariel Appreciation Fund
| Ariel Focus Fund
| ||||||||||||||||||||||
| 03/31/21 | 09/30/20 | 03/31/21 | 09/30/20 | 03/31/21 | 09/30/20 | |||||||||||||||||||
Distributions from: | ||||||||||||||||||||||||
Ordinary income | $8,000,000 | $24,668,121 | $7,200,000 | $14,116,870 | $470,000 | $640,000 | ||||||||||||||||||
Long-term capital gains | 96,399,953 | 98,900,041 | 100,000,050 | 83,800,021 | 819,987 | — | ||||||||||||||||||
|
|
|
|
|
|
|
|
|
|
|
| |||||||||||||
Total distributions | $104,399,953 | $123,568,162 | $107,200,051 | $97,916,891 | $1,289,987 | $640,000 | ||||||||||||||||||
|
|
|
|
|
|
|
|
|
|
|
| |||||||||||||
Ariel International Fund
| Ariel Global Fund
| |||||||||||||||||||||||
| 03/31/21 | 09/30/20 | 03/31/21 | 09/30/20 | |||||||||||||||||||||
| Distributions from: | ||||||||||||||||||||||||
Ordinary income | $12,300,000 | $14,700,000 | $1,350,000 | $2,250,000 | ||||||||||||||||||||
Long-term capital gains | — | — | — | 2,480,820 | ||||||||||||||||||||
|
|
|
|
|
|
|
| |||||||||||||||||
Total distributions | $12,300,000 | $14,700,000 | $1,350,000 | $4,730,820 | ||||||||||||||||||||
|
|
|
|
|
|
|
| |||||||||||||||||
NOTE FIVE | INVESTMENT ADVISORY AND OTHER TRANSACTIONS WITH RELATED PARTIES
Management fees—Ariel Investments, LLC (the “Adviser”) provides investment advisory and administrative services to Ariel Fund, Ariel Appreciation Fund and Ariel Focus Fund under a Management Agreement. The Adviser provides investment advisory services to Ariel International Fund and Ariel Global Fund under an Advisory Agreement (collectively, the “Agreements”). Pursuant to the Agreements, the Adviser is paid a monthly fee on average daily net assets at the annual rates shown below:
Management fees
| Ariel Fund
| Ariel Appreciation
| Ariel Focus Fund
| Ariel International
| Ariel Global Fund
| |||||||||||||||
Average daily net assets: |
| |||||||||||||||||||
First $500 million | 0.65 | % | 0.75 | % | 0.65 | % | 0.80 | % | 0.80 | % | ||||||||||
Next $500 million | 0.60 | % | 0.70 | % | 0.60 | % | 0.80 | % | 0.80 | % | ||||||||||
Over $1 billion | 0.55 | % | 0.65 | % | 0.55 | % | 0.75 | % | 0.75 | % | ||||||||||
ARIELINVESTMENTS.COM 47
Table of Contents
Notes to the financial statements
| 03/31/21 (UNAUDITED)
| |
| ||
The Adviser has contractually agreed to reimburse the Funds to the extent their respective total annual operating expenses (excluding brokerage, interest, taxes, distribution plan expenses and extraordinary items) exceed certain limits as shown below:
| Ariel Focus Fund | ||||||||||||||||
| Ariel Fund Investor Class | Ariel Appreciation Fund Investor Class | Investor Class | Institutional Class | |||||||||||||
First $30 million | 1.50% | 1.50% | — | — | ||||||||||||
Over $30 million | 1.00% | 1.00% | — | — | ||||||||||||
On average daily net assets | — | — | 1.00% | 0.75% | ||||||||||||
Expiration of waivers* | — | — | 2022 | 2022 | ||||||||||||
| Ariel International Fund | Ariel Global Fund | |||||||||||||||
Investor Class
| Institutional Class
| Investor Class
| Institutional Class
| |||||||||||||
On average daily net assets | 1.13% | 0.88% | 1.13% | 0.88% | ||||||||||||
Expiration of waivers* | 2022 | 2022 | 2022 | 2022 | ||||||||||||
| * | Through September 30 of the respective year. After this date, there is no assurance that such expenses will be limited. The Adviser has no right to recapture previously-waived fees. |
Distribution fees—Ariel Distributors, LLC is the Funds’ distributor and principal underwriter (the “Distributor”). The Trust has adopted a plan of distribution under Rule 12b-1 of the 1940 Act for the Investor Class of the Funds. Under the plan, the Investor Class of each Fund pays 12b-1 distribution fees calculated at an annual rate of 0.25% of average daily net assets on a weekly basis to the Distributor for its services. For the six months ended March 31, 2021 distribution fee expenses were as follows:
| Ariel Fund | Ariel Appreciation Fund | Ariel Focus Fund | Ariel International Fund | Ariel Global Fund | ||||||||||||||||
Paid to Distributor | $1,618,212 | $1,159,103 | $47,401 | $28,755 | $14,892 | |||||||||||||||
Paid to broker/dealers | 1,239,179 | 845,328 | 22,413 | 22,916 | 9,329 | |||||||||||||||
The remaining amounts were used by the Distributor to offset the costs of marketing, advertising, and other distribution expenses.
Trustees’ fees—Trustees’ fees and expenses represent only those expenses of disinterested (independent) trustees of the Funds.
NOTE SIX | FORWARD CURRENCY CONTRACTS
Net realized gain (loss) and the Change in net unrealized appreciation (depreciation) on forward currency contracts as reflected in the Statements of Operations as well as the Volume of forward currency contracts measured by the number of trades during the year, and the Average notional value of the forward currency contracts for the six months ended March 31, 2021 were:
| Ariel International Fund | Ariel Global Fund | |||||||
Net realized gain (loss) on forward currency contracts | $531,807 | $(447,227) | ||||||
Change in net unrealized appreciation (depreciation) on forward currency contracts | $(564,163) | $742,984 | ||||||
Volume of forward currency contracts | 51 | 67 | ||||||
Average notional value of forward currency contracts | $8,552,809 | $726,026 | ||||||
Complete lists of forward currency contracts open as of March 31, 2021 are included in the Schedules of Investments for the respective Fund.
48 SLOW AND STEADY WINS THE RACE
Table of Contents
Notes to the financial statements
| 03/31/21 (UNAUDITED)
| |
| ||
NOTE SEVEN | TRANSACTIONS WITH AFFILIATED COMPANIES
If a fund’s holding represents ownership of 5% or more of the voting securities of a company, the company is deemed to be an affiliate of a fund as defined in the 1940 Act. The following transactions were made during the six months ended March 31, 2021 in the security that was deemed to be an affiliated company:
Share activity | Six months ended March 31, 2021 | |||||||||||||||||||||||||||||||||||
| Security name | Balance September 30, 2020 | Purchases | Sales | Balance March 31, 2021 | Value | Dividends credited to income | Amount of gain (loss) realized on sale of shares | Amount of change in unrealized gain (loss) on shares | Percent of net assets | |||||||||||||||||||||||||||
Ariel Fund | ||||||||||||||||||||||||||||||||||||
U.S. Silica Holdings, Inc. (Basic materials)^ | 5,477,884 | — | 2,397,005 | 3,080,879 | $— | $— | $(15,005,828) | $59,950,501 | —% | |||||||||||||||||||||||||||
|
|
|
|
|
|
|
|
|
| |||||||||||||||||||||||||||
| $— | $— | $(15,005,828) | $59,950,501 | —% | ||||||||||||||||||||||||||||||||
|
|
|
|
|
|
|
|
|
| |||||||||||||||||||||||||||
^This security is no longer deemed to be an affiliate of the Fund as of March 31, 2021.
NOTE EIGHT | LINE OF CREDIT
The Funds have a $125,000,000 Line of Credit (the “Line”), which is uncommitted, with Northern Trust. The Line is for temporary or emergency purposes such as to provide liquidity for shareholder redemptions. The Funds incur interest expense to the extent of amounts drawn (borrowed) under the Line. Interest is based on the sum of 1.00% and the Federal Funds Effective Rate.
For the six months ended March 31, 2021, no Funds utilized the line of credit.
NOTE NINE | CORONAVIRUS (COVID-19) PANDEMIC
The global outbreak of COVID-19 has disrupted economic markets and the economic impact, duration and spread of the COVID-19 virus remains uncertain at this time. The operational and financial performance of the issuers of securities in which the Funds invest may be significantly impacted by COVID-19, which may in turn impact the value of the Funds’ investments.
ARIELINVESTMENTS.COM 49
Table of Contents
Important supplemental information
| 03/31/21 (UNAUDITED)
| |
| ||
PROXY VOTING POLICIES, PROCEDURES, AND RECORD
Both a description of the policies and procedures that the Funds’ investment adviser uses to determine how to vote proxies relating to portfolio securities and information regarding how the Funds voted proxies relating to portfolio securities during the most recent 12-month period ended June 30 are available upon request by calling 800-292-7435. Such information for the Funds is also available on the Securities and Exchange Commission’s (“SEC”) web site at www.sec.gov.
SHAREHOLDER STATEMENTS AND REPORTS
The Funds attempt to reduce the volume of mail sent to shareholders by sending one copy of financial reports, prospectuses and other regulatory materials to two or more account holders who share the same address. We will send you a notice at least 60 days before sending only one copy of these documents if we have not received written consent from you previously. Should you wish to receive individual copies of materials, please contact us at 800-292-7435. Once we have received your instructions, we will begin sending individual copies for each account within 30 days.
AVAILABILITY OF QUARTERLY PORTFOLIO SCHEDULES
The Funds file complete schedules of investments with the SEC for the quarters ended December 31 and June 30 of each fiscal year as an exhibit to its reports on Form N-PORT. Previously, the Funds filed complete schedules of investments with the SEC for the quarters ended December 31 and June 30 of each fiscal year on Form N-Q. The Fund’s Forms N-PORT and N-Q are available on the SEC’s website at www.sec.gov.
All of the Funds’ quarterly reports contain a complete schedule of portfolio holdings. All quarterly reports are made available to shareholders on the Funds’ web site at www.arielinvestments.com. Shareholders also may obtain copies of shareholder reports upon request by calling 800-292-7435 or by writing to Ariel Investment Trust, c/o U.S. Bank Global Fund Services, P.O. Box 701, Milwaukee, Wisconsin, 53201-0701.
LIQUIDITY NARRATIVE FOR SHAREHOLDERS
Consistent with Rule 22e-4 under the Investment Company Act of 1940, as amended, the Funds have established a liquidity risk management program to govern their approach to managing liquidity risk (“Program”). The Program is overseen by the Liquidity Risk Management Committee (“LRMC”), a committee comprised of representatives of the Funds’ investment adviser, Ariel Investments, LLC. The Funds’ Board of Trustees (“Board”) has approved the designation of the LRMC to oversee the Program.
The Program’s principal objectives include supporting each Fund’s compliance with limits on investments in illiquid assets and mitigating the risk that a Fund will be unable to meet its redemption obligations timely. The Program also includes a number of elements that support the management and assessment of liquidity risk, including an annual assessment of factors that influence a Fund’s liquidity and the periodic classification and re-classification of a Fund’s investments into groupings that reflect the LRMC’s assessment of their relative liquidity under current market conditions.
During the period covered by the report, there were no liquidity events that impacted the Funds or their respective ability to timely meet redemptions without dilution to existing shareholders. The LRMC has determined, and reported to the Board, that the Program has operated adequately and effectively to manage the Funds’ liquidity risk during the year ended December 31, 2020.
There can be no assurance that the Program will achieve its objectives in the future. Please refer to your Fund’s prospectus for more information regarding the Fund’s exposure to liquidity risk and other principal risks to which an investment in the Fund may be subject.
APPROVAL OF THE MANAGEMENT AGREEMENTS
Each year the Board of Trustees of the Trust (the “Board”), including a majority of the Trustees who are not “interested persons” of the Adviser or the Funds (“Independent Trustees”), is required by the 1940 Act to determine whether to continue each Fund’s management and advisory agreements with the Adviser (together the “Agreements”). At a meeting held in December 2020, the Board, including all of the Independent Trustees, upon recommendation of the Board’s Management Contracts Committee (the “Committee”), determined that the continuation of the Agreements was in the best interest of each Fund and its shareholders, and approved the continuation of each Agreement.
The Committee, which is comprised entirely of Independent Trustees and includes all Independent Trustees, led the Board in its consideration of the Agreements. In evaluating the Agreements with respect to each Fund, both the Committee and the Board held meetings in November and December 2020 to review and evaluate materials provided by the Adviser in response to questions submitted
50 SLOW AND STEADY WINS THE RACE
Table of Contents
Important supplemental information
| 03/31/21��(UNAUDITED)
| |
| ||
by the Independent Trustees and counsel that is independent of the Adviser (“Independent Counsel”). At its meetings, the Committee received presentations from members of management of the Adviser and from the portfolio manager(s) of each Fund. In addition, the Committee members received a memorandum from Independent Counsel describing the factors they should consider in performing their review, a supplemental report (the “Broadridge Report”) prepared by Broadridge, an independent provider of investment company data, and additional written material and presentations from the Adviser. During the meetings, the Committee was advised by, and met in executive session with, Independent Counsel. In connection with its deliberations, the Committee also considered a broad range of information relevant to the Board’s annual review of the Agreements that is provided to the Board and its various standing committees at meetings throughout the year, including investment performance reports and related portfolio information for each Fund, as well as periodic reports on, among other matters, pricing and valuation; brokerage and execution; compliance; and shareholder and other services provided by the Adviser, its affiliates, and the Funds’ other service providers.
Nature, Extent and Quality of Services. The Committee considered the Adviser’s specific responsibilities in the day-to-day management of the Funds, also taking into account information received at quarterly Board meetings related to the services rendered by the Adviser and the Independent Trustees’ knowledge of the Adviser’s operations. In addition, the Committee considered the Adviser’s historical approach in managing the Funds; the consistency of the Adviser’s investment approach; the background, education and experience of the Adviser’s investment personnel; the nature and quality of the Adviser’s services, including, among other things, compliance matters such as the Funds’ Liquidity Risk Management Program, trading practices, broker approval and selection, shareholder communications, Fund marketing and distribution strategies, information technology, and cybersecurity protections; and the Adviser’s commitment to diversity and civic affairs. The Committee also considered whether each Fund had operated within its investment objectives and each Fund’s record of compliance with its investment restrictions and other regulatory requirements. The Committee also considered information regarding the structure of the Adviser’s compensation program for portfolio managers and certain other employees, including with respect to the Adviser’s ability to attract and retain quality personnel. The Committee also considered the personal investments made by the Adviser’s personnel in the Funds, which aligns the interests of the Adviser and its personnel with those of the Funds’ shareholders.
Investment Performance. The Committee discussed with the Adviser’s portfolio managers factors that contributed to each Fund’s comparative performance as measured against its Broadridge Peer Group. The Committee considered the investment performance of both the Investor and Institutional Classes of each Fund over time, including information provided in the Broadridge Report, comparing each Fund’s performance with that of comparable funds selected by Broadridge (the “Peer Group” or “Broadridge Peer Group”) as well as an analysis of Fund performance as compared to the performance of its benchmark over specific historical periods. For each period, the Broadridge report ranks each fund with the highest investment performance at the top, the fund with the lowest investment performance at the bottom and separates the Peer Group into five levels that each contain 20% of the universe (“quintiles”), with the top 20% being the first quintile and the bottom 20% being the fifth quintile. Where applicable, the Committee considered the one-, two-, three-, four-, five-, and ten-year periods for the fiscal year ended September 30, 2020. The Committee noted that there was not yet ten-year performance for the Institutional Class shares of all Funds or for the Investor Class shares of Ariel International Fund and Ariel Global Fund. In the case of those Funds that underperformed their Broadridge Peer Group in one or more periods, the Committee discussed with the Adviser factors that caused such underperformance; considered the Adviser’s long-term investment process; and noted that the long-term track records supported the investment philosophy that, over time, consistent implementation of the investment approach should result in positive performance, but also would involve periods of underperformance.
Fees and Expenses. The Committee considered comparative fee and expense information for each Fund’s Expense Group, as selected and analyzed in the Broadridge Report, which ranks funds with the lowest fee at the top, the funds with the highest fee at the bottom and separates the Expense Group into five levels that each contain 20% of the universe (“quintiles”), with the top being the first quintile and the bottom being the fifth quintile. The Committee also considered the historical expenses with respect to economies of scale realized by the Adviser and whether such benefits were being passed on to shareholders, such as through the use of breakpoints in the Adviser’s management fees. The Committee considered the impact of the Rule 12b-1 distribution services (“12b-1”) fees on the total expense ratio of the Investor Class of shares for all Funds and the resulting negative impact on the Funds’ Investor Class total expense ratio when compared to funds in their respective Broadridge Expense Groups that do not impose 12b-1 fees. The Committee observed that the Peer Group comparisons for the Funds’ Institutional Class shares were more illustrative since the Institutional Class does not charge 12b-1 fees.
The Committee considered the fees charged and services provided by Ariel to other types of clients and the rationale for any differences between those fees. The Committee also considered the revenue sharing payments made by the Adviser.
The Committee considered the following with respect to the investment performance and fees and expenses of each Fund for the fiscal year ended September 30, 2020:
ARIELINVESTMENTS.COM 51
Table of Contents
Important supplemental information
| 03/31/21 (UNAUDITED)
| |
| ||
Ariel Fund. Ariel Fund’s Investor Class performance ranked in the second quintile for the one-year, five-year and ten-year periods as compared to its Broadridge Peer Group. The Fund’s Institutional Class performance ranked in the second quintile for the one-year and five-year periods as compared to its Broadridge Peer Group.
The actual management fees for Ariel Fund (both share classes) ranked in the second quintile as compared to its Broadridge Expense Group. The total expenses for the Ariel Fund’s Investor Class ranked in the third quintile, and the Fund’s Institutional Class ranked in the second quintile as compared to its Broadridge Expense Group.
Ariel Appreciation Fund. Ariel Appreciation Fund’s Investor Class performance ranked in the top quintile for the one-year period and the third quintile for the five-year and ten-year periods as compared to its Broadridge Peer Group. The Fund’s Institutional Class performance ranked in the top quintile for the one-year period and the third quintile for the five-year period as compared to its Broadridge Peer Group.
The actual management fees for Ariel Appreciation Fund (both share classes) ranked in the second quintile as compared to its Broadridge Expense Group. The total expenses for the Ariel Appreciation Fund’s Investor Class ranked in the fourth quintile and the Fund’s Institutional Class ranked in the second quintile as compared to its Broadridge Expense Group.
Ariel Focus Fund. Ariel Focus Fund’s Investor Class performance ranked in the second quintile for the one-year period, the third quintile for the five-year period and the fourth quintile for the ten-year period as compared to its Broadridge Peer Group. The Fund’s Institutional Class performance ranked in the second quintile for the one-year period and in the third quintile for the five-year period as compared to its Broadridge Peer Group.
The Fund had fee reimbursements and expense limitations in place which resulted in reduced fees and/or expenses. The actual management fees for Ariel Focus Fund’s Investor Class ranked in the top quintile and the Fund’s Institutional Class ranked in the third quintile as compared to its Broadridge Expense Group. The total expenses for the Ariel Focus Fund (both share classes) ranked in the top quintile as compared to its Broadridge Expense Group.
Ariel International Fund. Ariel International Fund’s Investor Class performance ranked in the second quintile for the one-year period and the fourth quintile for five-year period as compared to its Broadridge Peer Group. The Fund’s Institutional Class performance ranked in the second quintile for the one-year period and the fourth quintile for the five-year period as compared to its Broadridge Peer Group.
The Fund had fee reimbursements and expense limitations in place which resulted in reduced fees and/or expenses. The actual management fees for Ariel International Fund (both share classes) ranked in the second quintile as compared to its Broadridge Expense Group. The total expenses for the Ariel International Fund (both share classes) ranked in the third quintile as compared to its Broadridge Expense Group.
Ariel Global Fund. Ariel Global Fund’s Investor Class performance ranked in the second quintile for the one-year period and in the third quintile for the five-year period as compared to its Broadridge Peer Group. The Fund’s Institutional Class performance ranked in the second quintile for the one-year period and in the third quintile for the five-year period as compared to its Broadridge Peer Group.
The Fund had fee reimbursements and expense limitations in place, which resulted in reduced fees and/or expenses. The actual management fees for Ariel Global Fund’s Investor Class ranked in the second quintile and the Fund’s Institutional Class ranked in the fifth quintile as compared to its Broadridge Expense Group. The total expenses for the Ariel Global Fund’s Investor Class ranked in the third quintile and the Fund’s Institutional Class ranked in the second quintile as compared to its Broadridge Expense Group.
Profitability and Economies of Scale. The Committee considered the profitability to the Adviser from its relationship with each Fund, including the methodology by which that profitability analysis was calculated. The Committee also considered the fee reimbursements and expense limitations in place for Ariel Focus Fund, Ariel International Fund, and Ariel Global Fund. The Committee considered the extent to which economies of scale may be realized as Funds increase in size and that the management fee schedule for each Fund contains breakpoints at different levels. The Committee considered the effective advisory fee rates for the Funds and whether the advisory fee schedules provide an appropriate sharing between the Funds and the Adviser of such economies of scale as may exist under the Agreements. The Committee considered information about the Funds’ soft dollar arrangements that benefit the Adviser, as well as the Adviser’s brokerage and trading practices. The Committee also considered ancillary benefits, including whether the Funds benefited from Mr. Rogers’ and Ms. Hobson’s high media profiles.
Approval. After full consideration of the above factors, as well as other factors that were instructive in evaluating the Agreements, the Board, including all of the Independent Trustees, concluded that continuation of each Fund’s Agreement was in the best interests of each Fund and its respective shareholders, and the Board approved the continuation of each Agreement. In reaching this determination, the Board considered that the nature, extent and quality of the services provided by the Adviser to each Fund were appropriate and consistent
52 SLOW AND STEADY WINS THE RACE
Table of Contents
Important supplemental information
| 03/31/21 (UNAUDITED)
| |
| ||
with the Fund’s Agreement; the Adviser’s commitment to its stated investment strategy and identified circle of competency, and its calm, reasoned and long-term approach to investing; that the management fees paid by each Fund were reasonable in light of the services provided; that the breakpoints in the fee schedule for each Fund have the potential to allow shareholders to benefit from economies of scale; that the profitability associated with the Adviser’s relationship with the Trust was within a reasonable range and was neither excessive nor so low that the Adviser could not be expected to continue to service the Funds effectively; and that the benefits accruing to the Adviser by virtue of its relationship with the Funds were reasonable in light of the costs of providing the investment management services and the benefits accruing to each Fund. The Board’s determinations were based upon a comprehensive consideration of all information provided to it, including both quantitative measures and qualitative factors, and were not the result of any single factor.
ARIELINVESTMENTS.COM 53
Table of Contents
| 03/31/21 (UNAUDITED)
| |
| ||
EXAMPLE
As a shareholder of the Funds, you incur ongoing costs, including management fees, distribution and service (12b-1) fees and other Fund expenses. The Funds currently do not charge any transaction costs, such as sales charges (loads) on subscriptions, reinvested dividends or other distributions, redemption fees or exchange fees. The following example is intended to help you understand your ongoing costs (in dollars) of investing in each of the Funds and to compare these costs with the ongoing costs of investing in other mutual funds. Please note that IRA, 403(b) and Coverdell ESA account holders are charged an annual $15 recordkeeping fee or a one-time, lifetime $60 fee. If these fees were included in either the Actual Expense or Hypothetical Example below, your costs would be higher.
The example is based on an investment of $1,000 invested at the beginning of the period and held for the entire period of October 1, 2020 - March 31, 2021.
ACTUAL EXPENSES
The left portion of the table below for each Fund provides information about actual account values and actual expenses for that particular Fund. You may use the information in each of these lines, together with the amount you invested, to estimate the expenses that you paid over the period in each Fund. Simply divide your account value by $1,000 (for example, an $8,600 account value divided by $1,000=8.6), then multiply the result by the number under the heading, entitled “Expenses Paid During Period”, to estimate the expenses you paid on your account during this period in each Fund.
HYPOTHETICAL EXAMPLE FOR COMPARISON PURPOSES
The right portion of the table below for each Fund provides information about hypothetical account values and hypothetical expenses based on each Fund’s actual expense ratio and an assumed rate of return of 5% per year before expenses, which is not the actual return. The hypothetical account values and expenses may not be used to estimate the actual ending account balance or expenses you paid for the period. You may use this information to compare the ongoing costs of investing in each of the Funds to other funds. To do so, compare this 5% hypothetical example with the 5% hypothetical examples that appear in the shareholder reports of other funds.
Please note that the expenses shown in the table are meant to highlight only your ongoing costs in each of the Funds. Therefore, the right portion of the table for each Fund is useful in comparing ongoing costs only, and will not help you determine the relative total costs of owning different funds.
| Actual* | Hypothetical (5% return before expenses) | |||||||||||||||||||||||
| Fund and return |
Beginning |
Ending |
Expenses |
Ending |
Expenses |
Annualized | ||||||||||||||||||
Ariel Fund | ||||||||||||||||||||||||
Investor Class | $1,000.00 | $1,572.10 | $6.41 | $1,019.95 | $5.04 | 1.00 | % | |||||||||||||||||
Institutional Class | 1,000.00 | 1,574.60 | 4.43 | 1,021.49 | 3.48 | 0.69 | % | |||||||||||||||||
Ariel Appreciation Fund | ||||||||||||||||||||||||
Investor Class | $1,000.00 | $1,429.10 | $6.84 | $1,019.30 | $5.69 | 1.13 | % | |||||||||||||||||
Institutional Class | 1,000.00 | 1,431.40 | 5.03 | 1,020.79 | 4.18 | 0.83 | % | |||||||||||||||||
Ariel Focus Fund | ||||||||||||||||||||||||
Investor Class | $1,000.00 | $1,416.60 | $6.02 | $1,019.95 | $5.04 | 1.00 | % | |||||||||||||||||
Institutional Class | 1,000.00 | 1,418.30 | 4.52 | 1,021.19 | 3.78 | 0.75 | % | |||||||||||||||||
Ariel International Fund | ||||||||||||||||||||||||
Investor Class | $1,000.00 | $1,084.10 | $5.87 | $1,019.30 | $5.69 | 1.13 | % | |||||||||||||||||
Institutional Class | 1,000.00 | 1,085.80 | 4.58 | 1,020.54 | 4.43 | 0.88 | % | |||||||||||||||||
Ariel Global Fund | ||||||||||||||||||||||||
Investor Class | $1,000.00 | $1,136.10 | $6.02 | $1,019.30 | $5.69 | 1.13 | % | |||||||||||||||||
Institutional Class | 1,000.00 | 1,138.10 | 4.69 | 1,020.54 | 4.43 | 0.88 | % | |||||||||||||||||
* Expenses are calculated using each Portfolio’s annualized expense ratio (as disclosed in the table), multiplied by the average account value for the period, multiplied by the number of days in the most recent half fiscal year (182), and divided by the number of days in the current year (365).
54 SLOW AND STEADY WINS THE RACE
Table of Contents
| ||||
|
| |||
| Name and age | Position(s) held with Fund | Term of office and length of time served | Principal occupation(s) during past 5 years | Other directorships | ||||
INDEPENDENT TRUSTEES: | ||||||||
William C. Dietrich Age: 71 | Lead Independent Trustee, Chair of Executive Committee, Member of Management Contracts and Audit Committees | Indefinite, until successor elected Trustee since 1986; Member of Management Contracts Committee and Audit Committee since 1986; Lead Independent Trustee and Executive Committee Chair since 2014
| Retired Executive Director, Shalem Institute for Spiritual Formation, Inc., 2006 to 2009 | |||||
Eric H. Holder, Jr. Age: 70 | Trustee, Member of Management Contracts and Governance Committee | Indefinite, until successor elected Trustee since 2019; Member of Management Contracts Committee since 2019; Governance Committee since 2020
| Partner, Covington & Burling since 2015 | |||||
Christopher G. Kennedy Age: 57 | Trustee, Chair of Audit Committee, Member of Management Contracts, Governance, and Executive Committees | Indefinite, until successor elected Trustee since 1995; Member of Management Contracts Committee since 1995; Audit Committee Chair since 2014 (member since 1995); Member of Executive Committee since 2015
| Chair, Joseph P. Kennedy Enterprises, Inc. since 2012; Founder and Chair, Top Box Foods since 2012 | Interface Inc.; Knoll, Inc. | ||||
Kim Y. Lew Age: 54 | Trustee, Member of Management Contracts and Audit Committees | Indefinite, until successor elected Trustee since 2014; Member of Management Contracts Committee and Audit Committee since 2014 | President and Chief Executive Officer of the Columbia Investment Management Company since 2020; Vice President and Chief Investment Officer, Carnegie Corporation of New York 2016 to 2020
| |||||
Stephen C. Mills Age: 61 | Trustee, Member of Management Contracts and Audit Committees | Indefinite, until successor elected Trustee since 2015; Management Contracts Committee since 2015; Audit Committee since 2019 | President of Basketball Operations, New York Knicks, 2017 to 2020; NBA Alternate Governor, New York Knicks, 2013 to 2020; General Manager, New York Knicks, 2013 to 2017
| Selective Insurance Group, Inc.; Madison Square Garden Sports Corp.; and MSG Networks Inc. | ||||
James M. Williams Age: 73 | Trustee, Chair of Management Contracts Committee, Member of Governance Committee | Indefinite, until successor elected Trustee since 2006; Management Contracts Committee Chair since 2007; Member of Governance Committee since 2013 | Vice President and Chief Investment Officer, J. Paul Getty Trust since 2002 | SEI Mutual Funds (Mr. Williams oversees a total of 93 SEI Mutual Fund portfolios) | ||||
INTERESTED TRUSTEES: | ||||||||
Mellody L. Hobson Age: 51 | Chair of the Board of Trustees and President, Member of Executive Committee
| Indefinite, until successor elected Trustee since 1993; President since 2002; Chair since 2006 | Co-CEO since 2019 and President since 2000, Ariel Investments, LLC | Starbucks Corporation; JPMorgan Chase & Co. | ||||
John W. Rogers, Jr. Age: 63 | Trustee | Indefinite, until successor elected Trustee since 2000 and from 1986 to 1993 | Founder, Chairman, Chief Investment Officer since 1983, and Co-CEO since 2019 (formerly CEO, 1983-2019) Ariel Investments, LLC; Lead Portfolio Manager, Ariel Fund since 1986 and Co-Portfolio Manager, Ariel Appreciation Fund since 2002
| McDonald’s Corporation; Nike, Inc.; The New York Times Company | ||||
The Statement of Additional Information (SAI) for Ariel Investment Trust includes additional information about the Funds’ Trustees. The SAI is available without charge by calling 800.292.7435 or by logging on to our website, arielinvestments.com.
Note: Number of portfolios in complex overseen by all Trustees is five. Address for all Trustees is 200 East Randolph Street, Suite 2900, Chicago, IL 60601-6505.
ARIELINVESTMENTS.COM 55
Table of Contents
|
|
|
| |
|
| |||
| Name and age | Position(s) held with Fund | Term of office and length of time served | Principal occupation(s) during past 5 years | Other directorships | ||||
Mareilé B. Cusack Age: 62 | Vice President, Anti-Money Laundering Officer and Secretary | Indefinite, until successor elected Vice President since 2008; Anti-Money Laundering Officer since 2010; Secretary since 2014; Assistant Secretary, 2008 to 2014 | Chief Privacy Officer, Ariel Investments, LLC since 2019; Senior Vice President, Ariel Investments, LLC since 2012; Anti-Money Laundering Officer, Ariel Investments, LLC since 2010; General Counsel, Ariel Investments, LLC since 2008 | |||||
Wendy D. Fox Age: 58 | Chief Compliance Officer and Vice President | Indefinite, until successor elected Chief Compliance Officer and Vice President since 2014 | Senior Vice President, Ariel Investments, LLC, since 2017; Chief Compliance Officer, Ariel Investments, LLC since 2004; Vice President, Ariel Investments, LLC, 2004 to 2017 | |||||
James R. Rooney Age: 62 | Chief Financial Officer, Vice President and Treasurer | Indefinite, until successor elected Chief Financial Officer, Vice President and Treasurer since 2015 | Senior Vice President, Fund Administration, Ariel Investments, LLC since 2017; Vice President, Fund Administration, Ariel Investments, LLC, 2015 to 2017 |
Note: Number of portfolios in complex overseen by all Officers is five. Address for all officers is 200 East Randolph Street, Suite 2900, Chicago, IL 60601-6505.
56 SLOW AND STEADY WINS THE RACE
Table of Contents
Risks of investing in the Funds
The intrinsic value of the stocks in which the Funds invest may never be recognized by the broader market. The Funds are often concentrated in fewer sectors than their benchmarks, and their performance may suffer if these sectors underperform the overall stock market. Equity investments are affected by market conditions. Ariel Fund, Ariel Appreciation Fund and Ariel Focus Fund invest in small and/or mid-cap companies, which is riskier and more volatile than investing in large cap stocks. Ariel Focus Fund is a non-diversified fund and therefore may be more volatile than a more diversified investment. Ariel International Fund and Ariel Global Fund invest in foreign securities and may use currency derivatives and ETFs. Investments in foreign securities may underperform and may be more volatile than comparable U.S. stocks because of the risks involving foreign economies and markets, foreign political systems, foreign regulatory standards, foreign currencies and taxes. The International and Global Funds’ use of currency derivatives and ETFs may increase investment losses and expenses and create more volatility. The International and Global Funds’ investments in emerging markets present additional risks, such as difficulties selling on a timely basis and at an acceptable price.
Specific stocks held by the Funds
In this report, we candidly discuss specific stocks held by the Funds. Our opinions are current as of the date they were written but are subject to change. We want to remind investors that the information in this report is not sufficient on which to base an investment decision and should not be considered a recommendation to purchase or sell any particular security.
Please read the Funds’ prospectuses
Investors should consider carefully the investment objectives, risks, and charges and expenses before investing. For a current summary prospectus or full prospectus which contains this and other information about the Funds offered by Ariel Investment Trust, call us at 800.292.7435 or visit our website, arielinvestments.com. Please read the summary prospectus or full prospectus carefully before investing. Distributed by Ariel Distributors, LLC, a wholly owned subsidiary of Ariel Investments, LLC. Ariel Distributors, LLC is a member of the Securities Investor Protection Corporation.
ARIELINVESTMENTS.COM 57
Table of Contents
INFORMATION ABOUT THE FUNDS’ INDEXES AND THE GICS SECTOR CLASSIFICATION STANDARDS
The Russell 2500™ Value Index measures the performance of the small to mid-cap value segment of the U.S. equity universe. It includes those Russell 2500 companies with lower price-to-book ratios and lower forecasted growth values. This index pertains to Ariel Fund.
The Russell 2500™ Index measures the performance of the small to mid-cap segment of the U.S. equity universe, commonly referred to as “smid” cap. The Russell 2500 Index is a subset of the Russell 3000® Index. It includes approximately 2,500 of the smallest securities based on a combination of their market cap and current index membership. This index pertains to Ariel Fund.
The Russell Midcap® Index measures the performance of the mid-cap segment of the U.S. equity universe. The Russell Midcap Index is a subset of the Russell 1000® Index. It includes approximately 800 of the smallest securities based on a combination of their market cap and current index membership. This index pertains to Ariel Appreciation Fund.
The Russell Midcap® Value Index measures the performance of the mid-cap value segment of the U.S. equity universe. It includes those Russell Midcap Index companies with lower price-to-book ratios and lower forecasted growth values. This index pertains to Ariel Appreciation Fund.
The Russell 1000® Value Index measures the performance of the large-cap value segment of the U.S. equity universe. It includes those Russell 1000 companies with lower price-to-book ratios and lower expected growth values. This index pertains to Ariel Focus Fund.
The S&P 500® Index is the most widely accepted barometer of large cap U.S. equities. It includes 500 leading companies. This index pertains to Ariel Fund, Ariel Appreciation Fund and Ariel Focus Fund.
MSCI EAFE Index is an unmanaged, market-weighted index of companies in developed markets, excluding the U.S. and Canada. The MSCI EAFE Index net returns reflect the reinvestment of income and other earnings, including the dividends net of the maximum withholding tax applicable to non-resident institutional investors that do not benefit from double taxation treaties. MSCI uses the maximum tax rate applicable to institutional investors, as determined by the companies’ country of incorporation. This index pertains to Ariel International Fund.
The MSCI ACWI (All Country World Index) ex-US Index is an unmanaged, market-weighted index of global developed and emerging markets, excluding the United States. The MSCI ACWI ex-US Index net returns reflect the reinvestment of income and other earnings, including the dividends net of the maximum withholding tax applicable to non-resident institutional investors that do not benefit from double taxation treaties. MSCI uses the maximum tax rate applicable to institutional investors, as determined by the companies’ country of incorporation. This index pertains to Ariel International Fund.
MSCI ACWI (All Country World Index) Index is an unmanaged, market weighted index of global developed and emerging markets. The MSCI ACWI Index net returns reflect the reinvestment of income and other earnings, including the dividends net of the maximum withholding tax applicable to non-resident institutional investors that do not benefit from double taxation treaties. MSCI uses the maximum tax rate applicable to institutional investors, as determined by the companies’ country of incorporation. This index pertains to Ariel Global Fund.
Indexes are unmanaged. An investor cannot invest directly in an index.
Frank Russell Company (“Russell”) is the source and owner of the trademarks, service marks and copyrights related to the Russell Indexes. Russell® is a trademark of Frank Russell Company. Neither Russell nor its licensors accept any liability for any errors or omissions in the Russell Indexes or underlying data and no party may rely on any Russell Indexes and/or underlying data contained in this communication. No further distribution of Russell data is permitted without Russell’s express written consent. Russell does not promote, sponsor or endorse the content of this communication.
MSCI makes no express or implied warranties or representations and shall have no liability whatsoever with respect to any MSCI data contained herein. The MSCI data may not be further redistributed or used to create indices or financial products. This report is not approved or produced by MSCI. Source: MSCI.
GICS was developed by and is the exclusive property and a service mark of MSCI Inc. (“MSCI”) and Standard & Poor’s, a division of The McGraw-Hill Companies, Inc. (“S&P”) and is licensed for use by Ariel Investments, LLC. Neither MSCI, S&P nor any third party involved in making or compiling the GICS or any GICS classifications makes any express or implied warranties or representations with respect to such standard or classification (or the results to be obtained by the use thereof), and all such parties hereby expressly disclaim all warranties of originality, accuracy, completeness, merchantability and fitness for a particular purpose with respect to any of such standard or classification. Without limiting any of the foregoing, in no event shall MSCI, S&P, any of their affiliates or any third party involved in making or compiling the GICS or any GICS classifications have any liability for any direct, indirect, special, punitive, consequential or any other damages (including lost profits) even if notified of the possibility of such damages.
58 SLOW AND STEADY WINS THE RACE
Table of Contents
Table of Contents
Table of Contents
The materials used to produce this report were sourced responsibly.
The paper used along with the packaging are all recyclable.
Table of Contents
Ariel Investment Trust
c/o U.S. Bank Global Fund Services
P.O. Box 701
Milwaukee, WI 53201-0701
800.292.7435
• arielinvestments.com
• linkedin.com/company/ariel-investments
• instagram.com/arielinvestments
• twitter.com/arielinvests
What’s inside
| • | Value Takes Center Stage Co-CEOs John W. Rogers, Jr. and Mellody Hobson reflect on Ariel’s triple-digit 12-month gains* and renewed investor interest in undervalued small and mid-cap companies. |
| • | The Reflation Trade As valuations reach multi-year highs, Rupal Bhansali, Chief Investment Officer of International and Global Equities, examines the stretched cyclical trade. |
| • | Pent-Up Demand Vice Chairman Charlie Bobrinskoy analyzes companies that were initially challenged by pandemic headwinds, then significantly recovered as the economy began to reopen. |
| • | Company Spotlights Perspectives from our research team on Axalta (NYSE: AXTA), Snap-On (NYSE: SNA) and Stericycle (NASDAQ: SRCL). |
| * | Past performance does not guarantee future results. Any extraordinary performance shown for short-term periods may not be sustainable and is not representative of the performance over longer periods. |
 | Slow and steady wins the race. |
TPI (2,173) ©05/21 AI–01 |
Table of Contents
(b) Not applicable.
Item 2. Code of Ethics.
Not applicable for the reporting period.
Item 3. Audit Committee Financial Expert.
Not applicable for the reporting period.
Item 4. Principal Accountant Fees and Services.
Not applicable for the reporting period.
Item 5. Audit Committee of Listed Registrants.
Not applicable.
Item 6. Investments.
(a) Included as part of the report to shareholders filed under Item 1(a) of this Form.
(b) Not applicable.
Item 7. Disclosure of Proxy Voting Policies and Procedures for Closed-End Management Investment Companies.
Not applicable.
Item 8. Portfolio Managers of Closed-End Management Investment Companies.
Not applicable.
Item 9. Purchases of Equity Securities by Closed-End Management Investment Company and Affiliated Purchasers.
Not applicable.
Item 10. Submission of Matters to a Vote of Security Holders.
There have been no changes to the procedures by which shareholders may recommend nominees to the registrant’s Board of Trustees.
Table of Contents
Item 11. Controls and Procedures.
(a) The registrant’s certifying officers have reasonably designed such disclosure controls and procedures to ensure material information relating to the registrant is made known to them by others, particularly during the period in which this report is being prepared. The registrant’s certifying officers have determined that the registrant’s disclosure controls and procedures are effective based on their evaluation of these controls and procedures as of a date within 90 days prior to the filing date of this report.
(b) There were no significant changes in the registrant’s internal controls over financial reporting, or in other factors that could significantly affect these controls, that occurred during the period covered by this report, including any corrective actions with regard to significant deficiencies and material weaknesses.
Item 12. Disclosure of Securities Lending Activities for Closed-End Management Investment Companies.
Not applicable.
Item 13. Exhibits.
(a)(1) Code of Ethics – Not applicable for the reporting period.
(a)(3) Written solicitation to purchase securities under Rule 23c-1 – Not applicable.
(a) (4) There has been no change to the registrant’s independent public accountant.
Table of Contents
SIGNATURES
Pursuant to the requirements of the Securities Exchange Act of 1934 and the Investment Company Act of 1940, the registrant has duly caused this report to be signed on its behalf by the undersigned, thereunto duly authorized.
| Ariel Investment Trust | ||
| By: | /s/ Mellody L. Hobson | |
| Mellody L. Hobson | ||
| President | ||
| (Principal Executive Officer) | ||
Date: August 2, 2021
Pursuant to the requirements of the Securities Exchange Act of 1934 and the Investment Company Act of 1940, this report has been signed below by the following persons on behalf of the registrant and in the capacities and on the dates indicated.
| By: | /s/ Mellody L. Hobson | |
| Mellody L. Hobson | ||
| President | ||
| (Principal Executive Officer) |
Date: August 2, 2021
| By: | /s/ James R. Rooney | |
| James R. Rooney | ||
Vice President, Chief Financial Officer and Treasurer (Principal Financial Officer) |
Date: August 2, 2021