UNITED STATES
SECURITIES AND EXCHANGE COMMISSION
WASHINGTON, D.C. 20549
FORM N-CSR
CERTIFIED SHAREHOLDER REPORT OF REGISTERED MANAGEMENT
INVESTMENT COMPANIES
Investment Company Act file number: 811-04791
ALLIANCEBERNSTEIN MUNICIPAL INCOME FUND, INC.
(Exact name of registrant as specified in charter)
1345 Avenue of the Americas, New York, New York 10105
(Address of principal executive offices) (Zip code)
Joseph J. Mantineo
AllianceBernstein L.P.
1345 Avenue of the Americas
New York, New York 10105
(Name and address of agent for service)
Registrant’s telephone number, including area code: (800) 221-5672
Date of fiscal year end: October 31, 2008
Date of reporting period: October 31, 2008
| ITEM 1. | REPORTS TO STOCKHOLDERS. |
ANNUAL REPORT
AllianceBernstein Municipal Income Fund
National Portfolio
California Portfolio
New York Portfolio
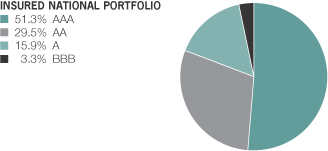
Insured National Portfolio
Insured California Portfolio

Annual Report
Investment Products Offered
| | • | | Are Not Bank Guaranteed |
The investment return and principal value of an investment in the Fund will fluctuate as the prices of the individual securities in which it invests fluctuate, so that your shares, when redeemed, may be worth more or less than their original cost. You should consider the investment objectives, risks, charges and expenses of the Fund carefully before investing. For a free copy of the Fund’s prospectus, which contains this and other information, visit our web site at www.alliancebernstein.com or call your financial advisor or AllianceBernstein® at (800) 227-4618. Please read the prospectus carefully before you invest.
You may obtain performance information current to the most recent month-end by visiting www.alliancebernstein.com.
This shareholder report must be preceded or accompanied by the Fund’s prospectus for individuals who are not current shareholders of the Fund.
You may obtain a description of the Fund’s proxy voting policies and procedures, and information regarding how the Fund voted proxies relating to portfolio securities during the most recent 12-month period ended June 30, without charge. Simply visit AllianceBernstein’s web site at www.alliancebernstein.com, or go to the Securities and Exchange Commission’s (the “Commission”) web site at www.sec.gov, or call AllianceBernstein at (800) 227-4618.
The Fund files its complete schedule of portfolio holdings with the Commission for the first and third quarters of each fiscal year on Form N-Q. The Fund’s Forms N-Q are available on the Commission’s web site at www.sec.gov. The Fund’s Forms N-Q may also be reviewed and copied at the Commission’s Public Reference Room in Washington, DC; information on the operation of the Public Reference Room may be obtained by calling (800) SEC-0330.
AllianceBernstein Investments, Inc. is an affiliate of AllianceBernstein L.P., the manager of the AllianceBernstein funds, and is a member of FINRA.
AllianceBernstein® and the AB Logo are registered trademarks and service marks used by permission of the owner, AllianceBernstein L.P.
December 15, 2008
Annual Report
This report provides management’s discussion of fund performance for the portfolios of AllianceBernstein Municipal Income Fund (the “Portfolios”) for the annual reporting period ended October 31, 2008.
Recently, the Board of Directors (the “Directors”) of the Fund approved changes to certain investment policies of the Insured National Portfolio and the Insured California Portfolio and the renaming of the Portfolios. The Directors approved elimination of the Portfolios’ policy to invest at least 80% of their net assets in insured securities. Consistent with this change in policy, the Directors approved a proposal to rename the Portfolios “National Portfolio II” and “California Portfolio II”, respectively. In light of recent credit declines and downgrades of insurers, the Fund’s adviser, AllianceBernstein L.P. (the “Adviser”), advised the Directors that it believed that most insured securities no longer offer a higher credit-quality investment than uninsured securities. In addition, the supply of insured municipal securities has declined leading to reduced availability of these securities. The Adviser concluded that it could provide better investment opportunities for the Portfolios’ shareholders, through its evaluation of the credit quality of municipal securities, without being restricted to investments primarily in insured municipal securities.
The changes to the Portfolios’ names and non-fundamental policies did not require shareholder approval under the Investment Company Act of 1940, as amended. The name and policy
changes became effective on December 1, 2008.
The Directors also approved the elimination, effective September 24, 2008, of the Insured National Portfolio’s and the Insured California Portfolio’s non-fundamental policies relating to the ratings of insured securities, including that (i) no more than 25% of the Portfolios’ assets may be invested in securities covered by policies of insurers with a claims-paying ability rated below AA by Moody’s, S&P or Fitch and (ii) no insured security purchased by the Portfolios can be covered by a policy issued by an insurer with a claims-paying ability rated below A. The Adviser advised the Directors that these restrictions might unduly limit the Portfolios’ investment opportunities in light of recent and possible future downgrades of certain insurance companies. The Portfolios will continue to invest predominantly in investment-grade securities.
The Directors also approved, and recommended to shareholders for their approval, a proposal for the California Portfolio II to be acquired by the California Portfolio, the Portfolio’s uninsured counterpart. The shareholders of the California Portfolio II approved the acquisition at a Special Meeting of Shareholders held on December 12, 2008. The acquisition is expected to occur in early 2009. Both Portfolios pursue the same investment objective and very similar investment policies. The California Portfolio II differed from the California Portfolio in that it invested
| | |
| ALLIANCEBERNSTEIN MUNICIPAL INCOME FUND • | | 1 |
principally in insured securities. Subsequent to the change in its policy discussed above, there is little difference between the Portfolios, except that the California Portfolio II invests principally in securities exempt from the federal alternative minimum tax (“AMT”) while California Portfolio may invest without limit in securities subject to the AMT. The California Portfolio does not currently invest a significant amount of its assets in AMT-subject municipal securities (approximately 10%) and the Adviser does not anticipate a significant increase in these investments. In addition, the Adviser believes that the higher after-tax distribution yields generated by the California Portfolio should offset the value to the California Portfolio II’s shareholders of investing in AMT-exempt municipal securities. Since the California Portfolio is a substantially larger fund than the California Portfolio II, with a lower expense ratio, both before and after the Adviser’s current expense waiver, it is anticipated that the acquisition should result in a significantly lower expense ratio for the California Portfolio II’s shareholders.
Investment Objective and Policies
The investment objective of the five portfolios of this open-end fund is to earn the highest level of current income, exempt from Federal taxation and, in the case of the State Portfolios, state taxation of the respective state that is available without assuming what the Adviser considers to be undue risk. Each Portfolio invests principally in high-yielding, predominantly investment-grade municipal
securities. Each Portfolio invests, under normal circumstances, at least 80% of its net assets in municipal securities with interest that is exempt from federal income tax. These securities may pay interest that is subject to the federal Alternative Minimum Tax (“AMT”) for certain taxpayers, except for the National Portfolio II and the California Portfolio II, which have a fundamental policy to invest at least 80% of their assets in municipal securities with interest that is exempt from federal income taxes, including the AMT.
Each of the Portfolios that invest in a named state pursues its objective by investing at least 80% of its net assets in municipal securities issued by the named state or municipal securities with interest that is otherwise exempt from the named state’s income tax. The National Portfolio and National Portfolio II may invest 25% or more of their net assets in a single state. The California Portfolio II is non-diversified, meaning that it can invest more of its assets in a fewer number of issuers.
Investment Results
The tables on pages 7-11 show performance for each Portfolio compared with its benchmark, the Barclays Capital (BC) Municipal Index, for the six- and 12-month periods ended October 31, 2008.
For both the six- and 12-month periods ended October 31, 2008, all of the Portfolios’ Class A shares without sales charges underperformed the benchmark, the BC Municipal Index,
| | |
| 2 | | • ALLIANCEBERNSTEIN MUNICIPAL INCOME FUND |
which represents the U.S. municipal market and posted negative returns of -4.70% and -3.30% for the respective time periods, except for the Insured National Portfolio, which outperformed. (All of the Portfolios and the benchmark posted negative returns for both periods.)
Though the Portfolios’ Municipal Bond Investment Team (the “Team”) primarily bought higher credit quality bonds, the Portfolios’ weights in lower-credit quality bonds across various sectors, compared with the benchmark’s, detracted from relative performance as credit spreads widened. The Team focused new purchases on high credit quality bonds and generally avoided the longest maturity bonds. This was beneficial to the Portfolios’ performance during the six- and 12-month periods because higher-credit quality bonds outperformed lower-credit quality bonds and shorter-maturity bonds outperformed longer-maturity bonds. Overall, the Portfolios benefited from relatively less interest-rate exposure compared with the benchmark. A more detailed description of the contribution to each Portfolio’s relative performance due to security and sector selection versus the benchmark for the annual reporting period ended October 31, 2008 follows.
National Portfolio – The National Portfolio’s underperformance compared with the benchmark was primarily the result of security selection in the hospital, education, housing and general obligation sectors. The Portfolio’s relative underweight in the general obligation sector and overweight
in the hospital sector also detracted from the Portfolio’s performance.
California Portfolio – The California Portfolio’s underperformance compared with the benchmark was primarily the result of security selection in the general obligation, special tax, housing and education sectors. The Portfolio’s relative overweight in the housing sector also detracted from the Portfolio’s performance, while its relative overweight in the pre-refunded sector and underweight in the industrial revenue bond sector were beneficial to the Portfolio’s performance.
New York Portfolio – The New York Portfolio’s underperformance compared with the benchmark was primarily the result of security selection in the transportation, airport, general obligation, education and insured sectors. The Portfolio’s relative overweight in the housing sector and underweight in the general obligation sector also detracted from the Portfolio’s performance.
Insured National Portfolio – The Insured National Portfolio’s relative outperformance compared with the benchmark was partially the result of security selection within the power sector. The Portfolio’s relative overweight in the pre-refunded sector, and underweights in the industrial revenue bond, hospital and housing sectors were also beneficial to the Portfolio’s performance.
Insured California Portfolio – The Insured California Portfolio’s underperformance was primarily the result
| | |
| ALLIANCEBERNSTEIN MUNICIPAL INCOME FUND • | | 3 |
of the Portfolio’s relative underweight and security selection in the general obligation sector, as well as security selection in the insured sector. The Portfolio’s underweight in the industrial revenue bond and hospital sectors was beneficial to the Portfolio’s performance.
Market Review & Investment Strategy
The crisis in the financial markets continued toward the end of the annual reporting period ended October 31, 2008, and created severe dislocations in the municipal market. As investors grew increasingly more risk averse, demand for lower-rated and longer-maturity bonds diminished. As a result, municipal credit spreads—the extra yield investors demand to move down in credit quality—widened sharply, and the slope of the municipal yield curve steepened dramatically over both the six- and 12-month periods. The Team’s strategies over the last year of primarily buying high credit quality bonds and avoiding the longest maturity bonds benefited performance because credit spreads widened sharply and the slope of the yield curve steepened dramatically.
Concerns about deteriorating municipal credit quality and a weakening economy contributed to investors’ sense of unease, but it was the news in September 2008 that the Reserve Primary Fund, a large “prime” money market fund, had “broken the buck” that ignited a wave of fear in all the financial markets. In the ensuing panic, investors apparently feared that similar funds would have similar problems and redeemed significant
amounts of their investments in such funds. Yields of municipal cash-equivalent securities spiked from around 2.5% to around 9% as buyers flocked to the safety of Treasury bills. As a result, three-month T-bill yields dropped to a rate of virtually zero. In light of this turmoil, municipal bond portfolios generally had low to negative returns in this environment.
As the Portfolios’ fiscal year drew to a close, regulators and policymakers across the globe were continuing work to address the financial crisis. At the same time, economic growth was beginning to slow dramatically. Historically, tax revenues have been very economically sensitive. And, there were signs that tax revenue growth was slowing quickly across the country. Fortunately, many state and local officials had successfully built up reserves to address the looming budget shortfalls. On average, state budget reserves were at 7.5% of general fund spending to start the fiscal year (July 1 for most states). States also cut spending on average this fiscal year. The average projected increase in states’ budgeted expenses was only 1%—the second lowest in 25 years.
The Portfolios may purchase municipal securities that are insured under policies issued by certain insurance companies. When issued, insured municipal securities typically receive a higher credit rating which means that the issuer of the securities pays a lower interest rate. In purchasing insured securities, the Team gives consideration to both the insurer and to the credit quality of the underlying issuer.
| | |
| 4 | | • ALLIANCEBERNSTEIN MUNICIPAL INCOME FUND |
The purpose of insurance is to reduce the credit risk of a particular municipal security by supplementing the creditworthiness of the underlying issuer and providing additional security for payment of the principal and interest. Certain of the insurance companies that insure municipal securities insure other types of securities, including some involving subprime mortgages. The credit quality of many subprime mortgage securities has declined and some bond insurers’ risk of having to make payments to holders of subprime mortgage securities has increased. Because of this risk, the credit ratings of some insurance companies have been downgraded and may be further downgraded; it is possible that certain insurance companies may become insolvent. If an insurance company’s rating is downgraded or the company becomes insolvent, the prices of municipal securities insured by the insurance company may decline.
As of October 31, 2008, the Portfolios’ percentages of net assets in insured
bonds and in insured bonds that have been pre-refunded are as follows:
| | | | | | |
| Portfolio | | Insured
Bonds | | | Pre-Refunded Insured
Bonds | |
National | | 44 | % | | 4 | % |
California | | 44 | % | | 8 | % |
New York* | | 40 | % | | 5 | % |
Insured National** | | 89 | % | | 40 | % |
Insured California*** | | 94 | % | | 19 | % |
| * | 20% of the New York Portfolio’s insured bonds were insured by MBIA. |
| ** | 32% of the Insured National Portfolio’s insured bonds were insured by AMBAC. |
| *** | 41% and 24% of the Insured California Portfolio’s insured bonds were insured by AMBAC and MBIA, respectively. |
The Team believes that downgrades in insurance company ratings or insurance company insolvencies present limited risk to the Portfolios. The Portfolios are diversified by bond insurer, reducing the exposure to any single insurer. In addition, the Team believes that the generally investment-grade underlying credit quality of the insured municipal securities reduces the risk of a significant reduction in the value of the insured municipal security.
| | |
| ALLIANCEBERNSTEIN MUNICIPAL INCOME FUND • | | 5 |
HISTORICAL PERFORMANCE
An Important Note About the Value of Historical Performance
The performance shown on the following pages represents past performance and does not guarantee future results. Current performance may be lower or higher than the performance information shown. You may obtain performance information current to the most recent month-end by visiting www.alliancebernstein.com.
The investment return and principal value of an investment in the Portfolios will fluctuate, so that your shares, when redeemed, may be worth more or less than their original cost. You should consider the investment objectives, risks, charges and expenses of the Portfolios carefully before investing. For a free copy of the Portfolios’ prospectus, which contains this and other information, visit our website at www.alliancebernstein.com or call your financial advisor or AllianceBernstein Investments at 800.227.4618. You should read the prospectus carefully before you invest.
All fees and expenses related to the operation of the Portfolios have been deducted. NAV returns do not reflect sales charges; if sales charges were reflected, the Portfolios’ quoted performance would be lower. SEC returns reflect the applicable sales charges for each share class: a 4.25% maximum front-end sales charge for Class A shares; the applicable contingent deferred sales charge for Class B shares (3% year 1, 2% year 2, 1% year 3, 0% year 4); a 1% 1 year contingent deferred sales charge for Class C shares. Returns for the different share classes will vary due to different expenses associated with each class. Performance assumes reinvestment of distributions and does not account for taxes.
Benchmark Disclosure
The unmanaged Barclays Capital (BC) Municipal Index does not reflect fees and expenses associated with the active management of a mutual fund portfolio. The Index is a total return performance benchmark for the long-term investment grade, tax-exempt bond market. An investor cannot invest directly in an index, and its results are not indicative of the performance for any specific investment, including the Portfolios.
A Word About Risk
Price fluctuation in the Portfolios’ securities may be caused by changes in the general level of interest rates or changes in bond credit quality ratings. Changes in interest rates have a greater effect on bonds with longer maturities than on those with shorter maturities. Please note, as interest rates rise, existing bond prices fall and can cause the value of an investment in the Portfolios to decline. The yield or value of the Portfolios’ investments in municipal securities may be affected by political or legislative changes and uncertainties related to the tax status of municipal securities or the rights of investors in these securities. Individual state municipal portfolios are non-diversified and are subject to geographic risk based on their narrow investment objectives. The Portfolios may invest in high yield bonds (i.e., “junk bonds”) which involves a greater risk of default and price volatility than other bonds. Investing in non-investment grade debt presents special risks, including credit risk. While the Portfolios invest principally in bonds and other fixed-income securities, in order to achieve their investment objectives, the Portfolios may at times use certain types of investment derivatives, such as options, futures, forwards and swaps. These instruments involve risks different from, and in certain cases, greater than, the risks presented by more traditional investments. These risks are fully discussed in the Portfolios’ prospectus.
(Historical Performance continued on next page)
| | |
| 6 | | • ALLIANCEBERNSTEIN MUNICIPAL INCOME FUND |
Historical Performance
NATIONAL PORTFOLIO
HISTORICAL PERFORMANCE
(continued from previous page)
| | | | | | | |
| | | | | | | |
THE PORTFOLIO VS. ITS BENCHMARK PERIODS ENDED OCTOBER 31, 2008 | | Returns | | |
| | 6 Months | | | 12 Months | | |
National Portfolio | | | | | | | |
Class A | | -7.25% | | | -7.32% | | |
| |
Class B* | | -7.58% | | | -7.97% | | |
| |
Class C | | -7.59% | | | -7.98% | | |
| |
Advisor Class** | | -6.79% | † | | | | |
| |
BC Municipal Index†† | | -4.70% | | | -3.30% | | |
| |
* Effective January 31, 2009, Class B shares will no longer be available for purchase to new investors. For additional information, please contact your financial advisor or visit www.alliancebernstein.com. ** Please note that this share class is for investors purchasing shares through accounts established under certain fee-based programs sponsored and maintained by certain broker-dealers and financial intermediaries, institutional pension plans and/or investment advisory clients of, and certain other persons associated with, the Adviser and its affiliates or the Funds. † This return is since the share class’s inception on 8/6/08. †† As of September 2008, all indices with the Lehman Brothers name were changed to Barclays Capital (BC) as part of an acquisition of Lehman Brothers’ North American investment banking and capital markets businesses by Barclays Capital. |
|
GROWTH OF A $10,000 INVESTMENT IN THE PORTFOLIO
10/31/98 TO 10/31/08
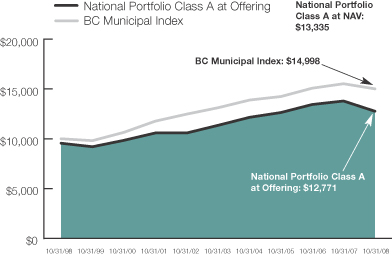
This chart illustrates the total value of an assumed $10,000 investment in AllianceBernstein Municipal Income Fund National Portfolio Class A shares (from 10/31/98 to 10/31/08) as compared to the performance of the Portfolio’s benchmark. The chart assumes the reinvestment of dividends and capital gains distributions.
See Historical Performance and Benchmark disclosures on page 6.
(Historical Performance continued on next page)
| | |
| ALLIANCEBERNSTEIN MUNICIPAL INCOME FUND • | | 7 |
Historical Performance
CALIFORNIA PORTFOLIO
HISTORICAL PERFORMANCE
(continued from previous page)
| | | | | | | |
| | | | |
THE PORTFOLIO VS. ITS BENCHMARK PERIODS ENDED OCTOBER 31, 2008 | | Returns | | |
| | 6 Months | | | 12 Months | | |
California Portfolio | | | | | | | |
Class A | | -5.47% | | | -5.52% | | |
| |
Class B* | | -5.89% | | | -6.18% | | |
| |
Class C | | -5.90% | | | -6.28% | | |
| |
Advisor Class** | | -5.20% | † | | | | |
| |
BC Municipal Index†† | | -4.70% | | | -3.30% | | |
| |
* Effective January 31, 2009, Class B shares will no longer be available for purchase to new investors. For additional information, please contact your financial advisor or visit www.alliancebernstein.com. ** Please note that this share class is for investors purchasing shares through accounts established under certain fee-based programs sponsored and maintained by certain broker-dealers and financial intermediaries, institutional pension plans and/or investment advisory clients of, and certain other persons associated with, the Adviser and its affiliates or the Funds. |
† This return is since the share class’s inception on 8/6/08. |
†† As of September 2008, all indices with the Lehman Brothers name were changed to Barclays Capital (BC) as part of an acquisition of Lehman Brothers’ North American investment banking and capital markets businesses by Barclays Capital. |
|
GROWTH OF A $10,000 INVESTMENT IN THE PORTFOLIO
10/31/98 TO 10/31/08
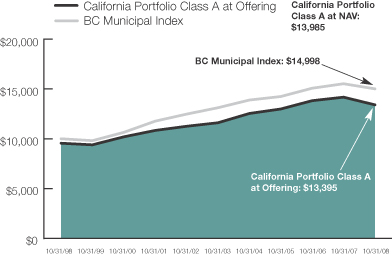
This chart illustrates the total value of an assumed $10,000 investment in AllianceBernstein Municipal Income Fund California Portfolio Class A shares (from 10/31/98 to 10/31/08) as compared to the performance of the Portfolio’s benchmark. The chart assumes the reinvestment of dividends and capital gains distributions.
See Historical Performance and Benchmark disclosures on page 6.
(Historical Performance continued on next page)
| | |
| 8 | | • ALLIANCEBERNSTEIN MUNICIPAL INCOME FUND |
Historical Performance
NEW YORK PORTFOLIO
HISTORICAL PERFORMANCE
(continued from previous page)
| | | | | | | |
| | | | | | | |
THE PORTFOLIO VS. ITS BENCHMARK PERIODS ENDED OCTOBER 31, 2008 | | Returns | | |
| | 6 Months | | | 12 Months | | |
New York Portfolio | | | | | | | |
Class A | | -5.11% | | | -4.31% | | |
| |
Class B* | | -5.45% | | | -4.88% | | |
| |
Class C | | -5.45% | | | -4.88% | | |
| |
Advisor Class** | | -4.98% | † | | | | |
| |
BC Municipal Index†† | | -4.70% | | | -3.30% | | |
| |
* Effective January 31, 2009, Class B shares will no longer be available for purchase to new investors. For additional information, please contact your financial advisor or visit www.alliancebernstein.com. ** Please note that this share class is for investors purchasing shares through accounts established under certain fee-based programs sponsored and maintained by certain broker-dealers and financial intermediaries, institutional pension plans and/or investment advisory clients of, and certain other persons associated with, the Adviser and its affiliates or the Funds. † This return is since the share class’s inception on 8/6/08. †† As of September 2008, all indices with the Lehman Brothers name were changed to Barclays Capital (BC) as part of an acquisition of Lehman Brothers’ North American investment banking and capital markets businesses by Barclays Capital. |
|
GROWTH OF A $10,000 INVESTMENT IN THE PORTFOLIO
10/31/98 TO 10/31/08
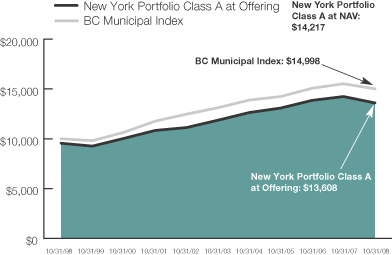
This chart illustrates the total value of an assumed $10,000 investment in AllianceBernstein Municipal Income Fund New York Portfolio Class A shares (from 10/31/98 to 10/31/08) as compared to the performance of the Portfolio’s benchmark. The chart assumes the reinvestment of dividends and capital gains distributions.
See Historical Performance and Benchmark disclosures on page 6.
(Historical Performance continued on next page)
| | |
| ALLIANCEBERNSTEIN MUNICIPAL INCOME FUND • | | 9 |
Historical Performance
INSURED NATIONAL PORTFOLIO
HISTORICAL PERFORMANCE
(continued from previous page)
| | | | | | |
| | | | | | |
THE PORTFOLIO VS. ITS BENCHMARK PERIODS ENDED OCTOBER 31, 2008 | | Returns | | |
| | 6 Months | | 12 Months | | |
Insured National Portfolio | | | | | | |
Class A | | -2.96% | | -2.05% | | |
| |
Class B* | | -3.20% | | -2.72% | | |
| |
Class C | | -3.31% | | -2.74% | | |
| |
BC Municipal Index** | | -4.70% | | -3.30% | | |
| |
* Effective January 31, 2009, Class B shares will no longer be available for purchase to new investors. For additional information, please contact your financial advisor or visit www.alliancebernstein.com. ** As of September 2008, all indices with the Lehman Brothers name were changed to Barclays Capital (BC) as part of an acquisition of Lehman Brothers’ North American investment banking and capital markets businesses by Barclays Capital. |
|
GROWTH OF A $10,000 INVESTMENT IN THE PORTFOLIO
10/31/98 TO 10/31/08
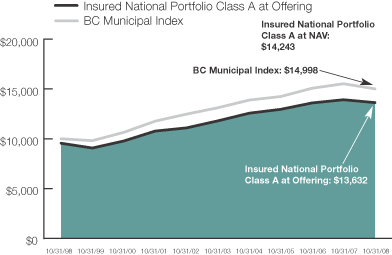
This chart illustrates the total value of an assumed $10,000 investment in AllianceBernstein Municipal Income Fund Insured National Portfolio Class A shares (from 10/31/98 to 10/31/08) as compared to the performance of the Portfolio’s benchmark. The chart assumes the reinvestment of dividends and capital gains distributions.
See Historical Performance and Benchmark disclosures on page 6.
(Historical Performance continued on next page)
| | |
| 10 | | • ALLIANCEBERNSTEIN MUNICIPAL INCOME FUND |
Historical Performance
INSURED CALIFORNIA PORTFOLIO
HISTORICAL PERFORMANCE
(continued from previous page)
| | | | | | |
| | | | | | |
THE PORTFOLIO VS. ITS BENCHMARK PERIODS ENDED OCTOBER 31, 2008 | | Returns | | |
| | 6 Months | | 12 Months | | |
Insured California Portfolio | | | | | | |
Class A | | -5.48% | | -4.93% | | |
| |
Class B* | | -5.82% | | -5.61% | | |
| |
Class C | | -5.82% | | -5.61% | | |
| |
BC Municipal Index** | | -4.70% | | -3.30% | | |
| |
* Effective January 31, 2009, Class B shares will no longer be available for purchase to new investors. For additional information, please contact your financial advisor or visit www.alliancebernstein.com. ** As of September 2008, all indices with the Lehman Brothers name were changed to Barclays Capital (BC) as part of an acquisition of Lehman Brothers’ North American investment banking and capital markets businesses by Barclays Capital. |
|
GROWTH OF A $10,000 INVESTMENT IN THE PORTFOLIO
10/31/98 TO 10/31/08
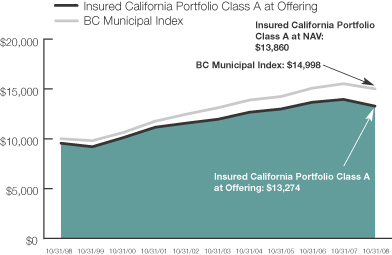
This chart illustrates the total value of an assumed $10,000 investment in AllianceBernstein Municipal Income Fund Insured California Portfolio Class A shares (from 10/31/98 to 10/31/08) as compared to the performance of the Portfolio’s benchmark. The chart assumes the reinvestment of dividends and capital gains distributions.
See Historical Performance and Benchmark disclosures on page 6.
(Historical Performance continued on next page)
| | |
| ALLIANCEBERNSTEIN MUNICIPAL INCOME FUND • | | 11 |
Historical Performance
NATIONAL PORTFOLIO
HISTORICAL PERFORMANCE
(continued from previous page)
| | | | | | | | | | | | |
| AVERAGE ANNUAL RETURNS AS OF OCTOBER 31, 2008 | |
| | | NAV
Returns | | | SEC
Returns | | | SEC
Yields** | | | Taxable
Equivalent
Yields*** | |
| | | | | | | | | | | | |
| Class A Shares | | | | | | | | 5.04 | % | | 7.75 | % |
1 Year | | -7.32 | % | | -11.30 | % | | | | | | |
5 Years | | 2.36 | % | | 1.48 | % | | | | | | |
10 Years | | 2.92 | % | | 2.48 | % | | | | | | |
| | | | | | | | | | | | |
| Class B Shares | | | | | | | | 4.57 | % | | 7.03 | % |
1 Year | | -7.97 | % | | -10.63 | % | | | | | | |
5 Years | | 1.66 | % | | 1.66 | % | | | | | | |
10 Years(a) | | 2.49 | % | | 2.49 | % | | | | | | |
| | | | | | | | | | | | |
| Class C Shares | | | | | | | | 4.57 | % | | 7.03 | % |
1 Year | | -7.98 | % | | -8.87 | % | | | | | | |
5 Years | | 1.65 | % | | 1.65 | % | | | | | | |
10 Years | | 2.22 | % | | 2.22 | % | | | | | | |
| | | | | | | | | | | | |
| Advisor Class Shares† | | | | | | | | 5.57 | % | | 8.57 | % |
Since Inception* | | -6.79 | % | | -6.79 | % | | | | | | |
The Portfolio’s current prospectus fee table shows the Portfolio’s total annual operating expense ratios as 0.92%, 1.63%, 1.62% and 0.62% for Class A, Class B, Class C and Advisor Class, respectively, gross of any fee waivers or expense reimbursements. Until January 1, 2009 contractual fee waivers and/or expense reimbursements limit the Portfolio’s annual operating expense ratios to 0.68%, 1.38%, 1.38% and 0.38% for Class A, Class B, Class C and Advisor Class, respectively. Effective January 1, 2009, contractual fee waivers and/or expense reimbursements will limit the Portfolio’s annual operating expenses to 0.75%, 1.45%, 1.45% and 0.45% for Class A, Class B, Class C and Advisor Class, respectively. These waivers/reimbursements extend through the Portfolio’s current fiscal year and may be extended by the Adviser for additional one-year terms. Absent reimbursements or waivers, performance would have been lower. The Financial Highlights section of this report sets forth expense ratio data for the current reporting period; the expense ratios shown above may differ from the expense ratios in the Financial Highlights section since they are based on different time periods.
| (a) | Assumes conversion of Class B shares into Class A shares after six years. |
| * | Inception Date: 8/6/08 for Advisor Class shares. |
| ** | SEC Yields are calculated based on SEC guidelines for the 30-day period ended October 31, 2008. |
| *** | Taxable equivalent yields are based on SEC yields and a 35% marginal Federal income tax rate and maximum state taxes where applicable. |
| † | This share class is offered at net asset value (NAV) to eligible investors and its SEC returns are the same as the NAV returns. Please note that this share class is for investors purchasing shares through accounts established under certain fee-based programs sponsored and maintained by certain broker-dealers and financial intermediaries, institutional pension plans and/or investment advisory clients of, and certain other persons associated with, the Adviser and its affiliates or the Funds. The inception date for Advisor Class is listed above. |
See Historical Performance disclosures on page 6.
(Historical Performance continued on next page)
| | |
| 12 | | • ALLIANCEBERNSTEIN MUNICIPAL INCOME FUND |
Historical Performance
NATIONAL PORTFOLIO
HISTORICAL PERFORMANCE
(continued from previous page)
| | | |
| SEC AVERAGE ANNUAL RETURNS (WITH ANY APPLICABLE SALES CHARGES) AS OF THE MOST RECENT CALENDAR QUARTER-END (SEPTEMBER 30, 2008) | |
| | | SEC Returns | |
| | | |
| Class A Shares | | | |
1 Year | | -8.60 | % |
5 Years | | 2.05 | % |
10 Years | | 2.71 | % |
| | | |
| Class B Shares | | | |
1 Year | | -7.99 | % |
5 Years | | 2.23 | % |
10 Years(a) | | 2.73 | % |
| | | |
| Class C Shares | | | |
1 Year | | -6.17 | % |
5 Years | | 2.22 | % |
10 Years | | 2.45 | % |
| | | |
| Advisor Class Shares† | | | |
Since Inception* | | -4.51 | % |
| (a) | Assumes conversion of Class B shares into Class A shares after six years. |
| * | Inception Date: 8/6/08 for Advisor Class shares. |
| † | Please note that this share class is for investors purchasing shares through accounts established under certain fee-based programs sponsored and maintained by certain broker-dealers and financial intermediaries, institutional pension plans and/or investment advisory clients of, and certain other persons associated with, the Adviser and its affiliates or the Funds. The inception date for Advisor Class is listed above. |
See Historical Performance disclosures on page 6.
(Historical Performance continued on next page)
| | |
| ALLIANCEBERNSTEIN MUNICIPAL INCOME FUND • | | 13 |
Historical Performance
CALIFORNIA PORTFOLIO
HISTORICAL PERFORMANCE
(continued from previous page)
| | | | | | | | | | | | |
| AVERAGE ANNUAL RETURNS AS OF OCTOBER 31, 2008 | |
| | | NAV
Returns | | | SEC
Returns | | | SEC
Yields** | | | Taxable
Equivalent
Yields*** | |
| | | | | | | | | | | | |
| Class A Shares | | | | | | | | 4.82 | % | | 8.27 | % |
1 Year | | -5.52 | % | | -9.51 | % | | | | | | |
5 Years | | 2.88 | % | | 1.99 | % | | | | | | |
10 Years | | 3.41 | % | | 2.97 | % | | | | | | |
| | | | | | | | | | | | |
| Class B Shares | | | | | | | | 4.34 | % | | 7.44 | % |
1 Year | | -6.18 | % | | -8.89 | % | | | | | | |
5 Years | | 2.15 | % | | 2.15 | % | | | | | | |
10 Years(a) | | 2.96 | % | | 2.96 | % | | | | | | |
| | | | | | | | | | | | |
| Class C Shares | | | | | | | | 4.34 | % | | 7.44 | % |
1 Year | | -6.28 | % | | -7.18 | % | | | | | | |
5 Years | | 2.14 | % | | 2.14 | % | | | | | | |
10 Years | | 2.69 | % | | 2.69 | % | | | | | | |
| | | | | | | | | | | | |
| Advisor Class Shares† | | | | | | | | 5.33 | % | | 9.14 | % |
Since Inception* | | -5.20 | % | | -5.20 | % | | | | | | |
The Portfolio’s current prospectus fee table shows the Portfolio’s total annual operating expense ratios as 0.85%, 1.56%, 1.55% and 0.55% for Class A, Class B, Class C and Advisor Class, respectively, gross of any fee waivers or expense reimbursements. Until January 1, 2009, contractual fee waivers and/or expense reimbursements limit the Portfolio’s annual operating expense ratios to 0.77%, 1.47%, 1.47% and 0.47% for Class A, Class B, Class C and Advisor Class, respectively. Effective January 1, 2009, contractual fee waivers and/or expense reimbursements will limit the Portfolio’s annual operating expenses to 0.75%, 1.45%, 1.45% and 0.45% for Class A, Class B, Class C and Advisor Class, respectively. These waivers/reimbursements extend through the Portfolio’s current fiscal year and may be extended by the Adviser for additional one-year terms. Absent reimbursements or waivers, performance would have been lower. The Financial Highlights section of this report sets forth expense ratio data for the current reporting period; the expense ratios shown above may differ from the expense ratios in the Financial Highlights section since they are based on different time periods.
| (a) | Assumes conversion of Class B shares into Class A shares after six years. |
| * | Inception Date: 8/6/08 for Advisor Class shares. |
| ** | SEC Yields are calculated based on SEC guidelines for the 30-day period ended October 31, 2008. |
| *** | Taxable equivalent yields are based on SEC yields and a 35% marginal Federal income tax rate and maximum state taxes where applicable. |
| † | This share class is offered at net asset value (NAV) to eligible investors and its SEC returns are the same as the NAV returns. Please note that this share class is for investors purchasing shares through accounts established under certain fee-based programs sponsored and maintained by certain broker-dealers and financial intermediaries, institutional pension plans and/or investment advisory clients of, and certain other persons associated with, the Adviser and its affiliates or the Funds. The inception date for Advisor Class is listed above. |
See Historical Performance disclosures on page 6.
(Historical Performance continued on next page)
| | |
| 14 | | • ALLIANCEBERNSTEIN MUNICIPAL INCOME FUND |
Historical Performance
CALIFORNIA PORTFOLIO
HISTORICAL PERFORMANCE
(continued from previous page)
| | | |
| SEC AVERAGE ANNUAL RETURNS (WITH ANY APPLICABLE SALES CHARGES) AS OF THE MOST RECENT CALENDAR QUARTER-END (SEPTEMBER 30, 2008) | |
| | | SEC Returns | |
| | | |
| Class A Shares | | | |
1 Year | | -7.39 | % |
5 Years | | 2.28 | % |
10 Years | | 3.13 | % |
| | | |
| Class B Shares | | | |
1 Year | | -6.74 | % |
5 Years | | 2.47 | % |
10 Years(a) | | 3.15 | % |
| | | |
| Class C Shares | | | |
1 Year | | -4.90 | % |
5 Years | | 2.46 | % |
10 Years | | 2.87 | % |
| | | |
| Advisor Class Shares† | | | |
Since Inception* | | -3.42 | % |
| (a) | Assumes conversion of Class B shares into Class A shares after six years. |
| * | Inception Date: 8/6/08 for Advisor Class shares. |
| † | Please note that this share class is for investors purchasing shares through accounts established under certain fee-based programs sponsored and maintained by certain broker-dealers and financial intermediaries, institutional pension plans and/or investment advisory clients of, and certain other persons associated with, the Adviser and its affiliates or the Funds. The inception date for Advisor Class is listed above. |
See Historical Performance disclosures on page 6.
(Historical Performance continued on next page)
| | |
| ALLIANCEBERNSTEIN MUNICIPAL INCOME FUND • | | 15 |
Historical Performance
NEW YORK PORTFOLIO
HISTORICAL PERFORMANCE
(continued from previous page)
| | | | | | | | | | | | |
| AVERAGE ANNUAL RETURNS AS OF OCTOBER 31, 2008 | |
| | | NAV
Returns | | | SEC
Returns | | | SEC
Yields** | | | Taxable
Equivalent
Yields*** | |
| | | | | | | | | | | | |
| Class A Shares | | | | | | | | 4.72 | % | | 7.80 | % |
1 Year | | -4.31 | % | | -8.42 | % | | | | | | |
5 Years | | 2.80 | % | | 1.92 | % | | | | | | |
10 Years | | 3.58 | % | | 3.13 | % | | | | | | |
| | | | | | | | | | | | |
| Class B Shares | | | | | | | | 4.23 | % | | 6.99 | % |
1 Year | | -4.88 | % | | -7.63 | % | | | | | | |
5 Years | | 2.10 | % | | 2.10 | % | | | | | | |
10 Years(a) | | 3.13 | % | | 3.13 | % | | | | | | |
| | | | | | | | | | | | |
| Class C Shares | | | | | | | | 4.23 | % | | 6.99 | % |
1 Year | | -4.88 | % | | -5.80 | % | | | | | | |
5 Years | | 2.11 | % | | 2.11 | % | | | | | | |
10 Years | | 2.85 | % | | 2.85 | % | | | | | | |
| | | | | | | | | | | | |
| Advisor Class Shares† | | | | | | | | 5.23 | % | | 8.64 | % |
Since Inception* | | -4.98 | % | | -4.98 | % | | | | | | |
The Portfolio’s current prospectus fee table shows the Portfolio’s total annual operating expense ratios as 0.90%, 1.61%, 1.60% and 0.60% for Class A, Class B, Class C and Advisor Class, respectively, gross of any fee waivers or expense reimbursements. Until January 1, 2009, contractual fee waivers and/or expense reimbursements limit the Portfolio’s annual operating expense ratios to 0.58%, 1.28%, 1.28% and 0.28% for Class A, Class B, Class C and Advisor Class, respectively. Effective January 1, 2009, contractual fee waivers and/or expense reimbursements will limit the Portfolio’s annual operating expenses to 0.75%, 1.45%, 1.45% and 0.45% for Class A, Class B, Class C and Advisor Class, respectively. These waivers/reimbursements extend through the Portfolio’s current fiscal year and may be extended by the Adviser for additional one-year terms. Absent reimbursements or waivers, performance would have been lower. The Financial Highlights section of this report sets forth expense ratio data for the current reporting period; the expense ratios shown above may differ from the expense ratios in the Financial Highlights section since they are based on different time periods.
| (a) | Assumes conversion of Class B shares into Class A shares after six years. |
| * | Inception Date: 8/6/08 for Advisor Class shares. |
| ** | SEC Yields are calculated based on SEC guidelines for the 30-day period ended October 31, 2008. |
| *** | Taxable equivalent yields are based on SEC yields and a 35% marginal Federal income tax rate and maximum state taxes where applicable. |
| † | This share class is offered at net asset value (NAV) to eligible investors and its SEC returns are the same as the NAV returns. Please note that this share class is for investors purchasing shares through accounts established under certain fee-based programs sponsored and maintained by certain broker-dealers and financial intermediaries, institutional pension plans and/or investment advisory clients of, and certain other persons associated with, the Adviser and its affiliates or the Funds. The inception date for Advisor Class is listed above. |
See Historical Performance disclosures on page 6.
(Historical Performance continued on next page)
| | |
| 16 | | • ALLIANCEBERNSTEIN MUNICIPAL INCOME FUND |
Historical Performance
NEW YORK PORTFOLIO
HISTORICAL PERFORMANCE
(continued from previous page)
| | | |
| SEC AVERAGE ANNUAL RETURNS (WITH ANY APPLICABLE SALES CHARGES) AS OF THE MOST RECENT CALENDAR QUARTER-END (SEPTEMBER 30, 2008) | |
| | | SEC Returns | |
| | | |
| Class A Shares | | | |
1 Year | | -6.46 | % |
5 Years | | 2.25 | % |
10 Years | | 3.30 | % |
| | | |
| Class B Shares | | | |
1 Year | | -5.65 | % |
5 Years | | 2.45 | % |
10 Years(a) | | 3.29 | % |
| | | |
| Class C Shares | | | |
1 Year | | -3.89 | % |
5 Years | | 2.44 | % |
10 Years | | 3.01 | % |
| | | |
| Advisor Class Shares† | | | |
Since Inception* | | -3.51 | % |
| (a) | Assumes conversion of Class B shares into Class A shares after six years. |
| * | Inception Date: 8/6/08 for Advisor Class shares. |
| † | Please note that this share class is for investors purchasing shares through accounts established under certain fee-based programs sponsored and maintained by certain broker-dealers and financial intermediaries, institutional pension plans and/or investment advisory clients of, and certain other persons associated with, the Adviser and its affiliates or the Funds. The inception date for Advisor Class is listed above. |
See Historical Performance disclosures on page 6.
(Historical Performance continued on next page)
| | |
| ALLIANCEBERNSTEIN MUNICIPAL INCOME FUND • | | 17 |
Historical Performance
INSURED NATIONAL PORTFOLIO
HISTORICAL PERFORMANCE
(continued from previous page)
| | | | | | | | | | | | |
| AVERAGE ANNUAL RETURNS AS OF OCTOBER 31, 2008 | |
| | | NAV
Returns | | | SEC
Returns | | | SEC
Yields** | | | Taxable
Equivalent
Yields*** | |
| | | | | | | | | | | | |
| Class A Shares | | | | | | | | 3.55 | % | | 5.46 | % |
1 Year | | -2.05 | % | | -6.22 | % | | | | | | |
5 Years | | 2.92 | % | | 2.03 | % | | | | | | |
10 Years | | 3.60 | % | | 3.15 | % | | | | | | |
| | | | | | | | | | | | |
| Class B Shares | | | | | | | | 3.02 | % | | 4.65 | % |
1 Year | | -2.72 | % | | -5.55 | % | | | | | | |
5 Years | | 2.22 | % | | 2.22 | % | | | | | | |
10 Years(a) | | 3.15 | % | | 3.15 | % | | | | | | |
| | | | | | | | | | | | |
| Class C Shares | | | | | | | | 3.02 | % | | 4.65 | % |
1 Year | | -2.74 | % | | -3.68 | % | | | | | | |
5 Years | | 2.21 | % | | 2.21 | % | | | | | | |
10 Years | | 2.88 | % | | 2.88 | % | | | | | | |
The Portfolio’s current prospectus fee table shows the Portfolio’s total annual operating expense ratios as 1.06%, 1.77% and 1.77% for Class A, Class B and Class C, respectively, gross of any fee waivers or expense reimbursements. Contractual fee waivers and/or expense reimbursements limit the Portfolio’s annual operating expense ratios to 1.04%, 1.74% and 1.74% for Class A, Class B and Class C, respectively. These waivers/reimbursements extend through the Portfolio’s current fiscal year and may be extended by the Adviser for additional one-year terms. Absent reimbursements or waivers, performance would have been lower. The Financial Highlights section of this report sets forth expense ratio data for the current reporting period; the expense ratios shown above may differ from the expense ratios in the Financial Highlights section since they are based on different time periods.
| (a) | Assumes conversion of Class B shares into Class A shares after six years. |
| ** | SEC Yields are calculated based on SEC guidelines for the 30-day period ended October 31, 2008. |
| *** | Taxable equivalent yields are based on SEC yields and a 35% marginal Federal income tax rate and maximum state taxes where applicable. |
See Historical Performance disclosures on page 6.
(Historical Performance continued on next page)
| | |
| 18 | | • ALLIANCEBERNSTEIN MUNICIPAL INCOME FUND |
Historical Performance
INSURED NATIONAL PORTFOLIO
HISTORICAL PERFORMANCE
(continued from previous page)
| | | |
| SEC AVERAGE ANNUAL RETURNS (WITH ANY APPLICABLE SALES CHARGES) AS OF THE MOST RECENT CALENDAR QUARTER-END (SEPTEMBER 30, 2008) | |
| | | SEC Returns | |
| | | |
| Class A Shares | | | |
1 Year | | -6.15 | % |
5 Years | | 1.88 | % |
10 Years | | 3.09 | % |
| | | |
| Class B Shares | | | |
1 Year | | -5.58 | % |
5 Years | | 2.04 | % |
10 Years(a) | | 3.10 | % |
| | | |
| Class C Shares | | | |
1 Year | | -3.60 | % |
5 Years | | 2.04 | % |
10 Years | | 2.82 | % |
| (a) | Assumes conversion of Class B shares into Class A shares after six years. |
See Historical Performance disclosures on page 6.
(Historical Performance continued on next page)
| | |
| ALLIANCEBERNSTEIN MUNICIPAL INCOME FUND • | | 19 |
Historical Performance
INSURED CALIFORNIA PORTFOLIO
HISTORICAL PERFORMANCE
(continued from previous page)
| | | | | | | | | | | | |
| AVERAGE ANNUAL RETURNS AS OF OCTOBER 31, 2008 | |
| | | NAV
Returns | | | SEC
Returns | | | SEC
Yields** | | | Taxable
Equivalent
Yields*** | |
| | | | | | | | | | | | |
| Class A Shares | | | | | | | | 4.12 | % | | 7.07 | % |
1 Year | | -4.93 | % | | -8.95 | % | | | | | | |
5 Years | | 2.08 | % | | 1.20 | % | | | | | | |
10 Years | | 3.32 | % | | 2.87 | % | | | | | | |
| | | | | | | | | | | | |
| Class B Shares | | | | | | | | 3.61 | % | | 6.19 | % |
1 Year | | -5.61 | % | | -8.34 | % | | | | | | |
5 Years | | 1.37 | % | | 1.37 | % | | | | | | |
10 Years(a) | | 2.87 | % | | 2.87 | % | | | | | | |
| | | | | | | | | | | | |
| Class C Shares | | | | | | | | 3.62 | % | | 6.21 | % |
1 Year | | -5.61 | % | | -6.52 | % | | | | | | |
5 Years | | 1.37 | % | | 1.37 | % | | | | | | |
10 Years | | 2.58 | % | | 2.28 | % | | | | | | |
The Portfolio’s current prospectus fee table shows the Portfolio’s total annual operating expense ratios as 1.08%, 1.79% and 1.78% for Class A, Class B and Class C, respectively. The Financial Highlights section of this report sets forth expense ratio data for the current reporting period; the expense ratios shown above may differ from the expense ratios in the Financial Highlights section since they are based on different time periods.
| (a) | Assumes conversion of Class B shares into Class A shares after six years. |
| ** | SEC Yields are calculated based on SEC guidelines for the 30-day period ended October 31, 2008. |
| *** | Taxable equivalent yields are based on SEC yields and a 35% marginal Federal income tax rate and maximum state taxes where applicable. |
See Historical Performance disclosures on page 6.
(Historical Performance continued on next page)
| | |
| 20 | | • ALLIANCEBERNSTEIN MUNICIPAL INCOME FUND |
Historical Performance
INSURED CALIFORNIA PORTFOLIO
HISTORICAL PERFORMANCE
(continued from previous page)
| | | |
| SEC AVERAGE ANNUAL RETURNS (WITH ANY APPLICABLE SALES CHARGES) AS OF THE MOST RECENT CALENDAR QUARTER-END (SEPTEMBER 30, 2008) | |
| | | SEC Returns | |
| | | |
| Class A Shares | | | |
1 Year | | -8.01 | % |
5 Years | | 1.26 | % |
10 Years | | 2.91 | % |
| | | |
| Class B Shares | | | |
1 Year | | -7.38 | % |
5 Years | | 1.45 | % |
10 Years(a) | | 2.91 | % |
| | | |
| Class C Shares | | | |
1 Year | | -5.55 | % |
5 Years | | 1.44 | % |
10 Years | | 2.62 | % |
| | | |
| (a) | Assumes conversion of Class B shares into Class A shares after six years. |
See Historical Performance disclosures on page 6.
| | |
| ALLIANCEBERNSTEIN MUNICIPAL INCOME FUND • | | 21 |
Historical Performance
FUND EXPENSES
As a shareholder of the Fund, you incur two types of costs: (1) transaction costs, including sales charges (loads) on purchase payments, contingent deferred sales charges on redemptions and (2) ongoing costs, including management fees; distribution (12b-1) fees; and other Fund expenses. This example is intended to help you understand your ongoing costs (in dollars) of investing in the Fund and to compare these costs with the ongoing costs of investing in other mutual funds.
The Example is based on an investment of $1,000 invested at the beginning of the period and held for the entire period as indicated below.
Actual Expenses
The first line of the table below provides information about actual account values and actual expenses. You may use the information in this line, together with the amount you invested, to estimate the expenses that you paid over the period. Simply divide your account value by $1,000 (for example, an $8,600 account value divided by $1,000 = 8.6), then multiply the result by the number in the first line under the heading entitled “Expenses Paid During Period” to estimate the expenses you paid on your account during this period.
Hypothetical Example for Comparison Purposes
The second line of the table below provides information about hypothetical account values and hypothetical expenses based on the Fund’s actual expense ratio and an assumed annual rate of return of 5% before expenses, which is not the Fund’s actual return. The hypothetical account values and expenses may not be used to estimate the actual ending account balance or expenses you paid for the period. You may use this information to compare the ongoing costs of investing in the Fund and other funds by comparing this 5% hypothetical example with the 5% hypothetical examples that appear in the shareholder reports of other funds.
Please note that the expenses shown in the table are meant to highlight your ongoing costs only and do not reflect any transactional costs, such as sales charges (loads), or contingent deferred sales charges on redemptions. Therefore, the second line of the table is useful in comparing ongoing costs only, and will not help you determine the relative total costs of owning different funds. In addition, if these transactional costs were included, your costs would have been higher.
| | | | | | | | | |
| | | Beginning
Account Value
May 1,
2008 | | Ending
Account Value
October 31,
2008 | | Expenses
Paid During
Period* |
| National Portfolio | | | | | | | | | |
| Class A | | | | | | | | | |
Actual | | $ | 1,000 | | $ | 927.51 | | $ | 3.29 |
Hypothetical (5% return before expenses) | | $ | 1,000 | | $ | 1,021.72 | | $ | 3.46 |
| Class B | | | | | | | | | |
Actual | | $ | 1,000 | | $ | 924.18 | | $ | 6.67 |
Hypothetical (5% return before expenses) | | $ | 1,000 | | $ | 1,018.20 | | $ | 7.00 |
| Class C | | | | | | | | | |
Actual | | $ | 1,000 | | $ | 924.14 | | $ | 6.67 |
Hypothetical (5% return before expenses) | | $ | 1,000 | | $ | 1,018.20 | | $ | 7.00 |
| Advisor Class ** | | | | | | | | | |
Actual | | $ | 1,000 | | $ | 932.12 | | $ | 1.84 |
Hypothetical (5% return before expenses) | | $ | 1,000 | | $ | 1,021.06 | | $ | 4.12 |
| | |
| 22 | | • ALLIANCEBERNSTEIN MUNICIPAL INCOME FUND |
Fund Expenses
FUND EXPENSES
(continued from previous page)
| | | | | | | | | |
| | | Beginning
Account Value
May 1,
2008 | | Ending
Account Value
October 31,
2008 | | Expenses
Paid During
Period* |
| California Portfolio | | | | | | | | | |
| Class A | | | | | | | | | |
Actual | | $ | 1,000 | | $ | 945.30 | | $ | 3.77 |
Hypothetical (5% return before expenses) | | $ | 1,000 | | $ | 1,021.27 | | $ | 3.91 |
| Class B | | | | | | | | | |
Actual | | $ | 1,000 | | $ | 941.08 | | $ | 7.17 |
Hypothetical (5% return before expenses) | | $ | 1,000 | | $ | 1,017.75 | | $ | 7.46 |
| Class C | | | | | | | | | |
Actual | | $ | 1,000 | | $ | 941.01 | | $ | 7.17 |
Hypothetical (5% return before expenses) | | $ | 1,000 | | $ | 1,017.75 | | $ | 7.46 |
| Advisor Class** | | | | | | | | | |
Actual | | $ | 1,000 | | $ | 947.97 | | $ | 1.05 |
Hypothetical (5% return before expenses) | | $ | 1,000 | | $ | 1,022.82 | | $ | 2.34 |
| New York Portfolio | | | | | | | | | |
| Class A | | | | | | | | | |
Actual | | $ | 1,000 | | $ | 948.88 | | $ | 2.84 |
Hypothetical (5% return before expenses) | | $ | 1,000 | | $ | 1,022.22 | | $ | 2.95 |
| Class B | | | | | | | | | |
Actual | | $ | 1,000 | | $ | 945.53 | | $ | 6.26 |
Hypothetical (5% return before expenses) | | $ | 1,000 | | $ | 1,018.70 | | $ | 6.50 |
| Class C | | | | | | | | | |
Actual | | $ | 1,000 | | $ | 945.54 | | $ | 6.26 |
Hypothetical (5% return before expenses) | | $ | 1,000 | | $ | 1,018.70 | | $ | 6.50 |
| Advisor Class** | | | | | | | | | |
Actual | | $ | 1,000 | | $ | 950.17 | | $ | 1.37 |
Hypothetical (5% return before expenses) | | $ | 1,000 | | $ | 1,022.12 | | $ | 3.05 |
| Insured National Portfolio | | | | | | | | | |
| Class A | | | | | | | | | |
Actual | | $ | 1,000 | | $ | 970.43 | | $ | 5.15 |
Hypothetical (5% return before expenses) | | $ | 1,000 | | $ | 1,019.91 | | $ | 5.28 |
| Class B | | | | | | | | | |
Actual | | $ | 1,000 | | $ | 967.96 | | $ | 8.61 |
Hypothetical (5% return before expenses) | | $ | 1,000 | | $ | 1,016.39 | | $ | 8.82 |
| Class C | | | | | | | | | |
Actual | | $ | 1,000 | | $ | 966.91 | | $ | 8.60 |
Hypothetical (5% return before expenses) | | $ | 1,000 | | $ | 1,016.39 | | $ | 8.82 |
| Insured California Portfolio | | | | | | | | | |
| Class A | | | | | | | | | |
Actual | | $ | 1,000 | | $ | 945.21 | | $ | 7.73 |
Hypothetical (5% return before expenses) | | $ | 1,000 | | $ | 1,017.19 | | $ | 8.01 |
| Class B | | | | | | | | | |
Actual | | $ | 1,000 | | $ | 941.81 | | $ | 10.84 |
Hypothetical (5% return before expenses) | | $ | 1,000 | | $ | 1,013.98 | | $ | 11.24 |
| Class C | | | | | | | | | |
Actual | | $ | 1,000 | | $ | 941.82 | | $ | 11.13 |
Hypothetical (5% return before expenses) | | $ | 1,000 | | $ | 1,013.67 | | $ | 11.54 |
| | |
| ALLIANCEBERNSTEIN MUNICIPAL INCOME FUND • | | 23 |
Fund Expenses
FUND EXPENSES
(continued from previous page)
| * | With the exception of the Advisor class, expenses are equal to the classes’ annualized expense ratios, shown in the table below, multiplied by the average account value over the period, multiplied by 184/366 (to reflect the one-half year period). |
| ** | For the Advisor Class shares, expenses are equal to the classes’ annualized expense ratio of 0.81%, 0.46% and 0.60%, respectively |
The “Actual” expenses paid are based on the period from August 6, 2008 (commencement of distribution) to October 31, 2008. Actual expenses are equal to each class’ annualized expense ratio, multiplied by the average account value over the period, multiplied by 86/366 (to reflect the since inception period).
Hypothetical expenses are equal to each class’ annualized expense ratio, multiplied by the average account value over the period, multiplied by 184/366 (to reflect the one-half year period).
| | | | | | | | | | | | | | | |
| | | Annualized Expense Ratio | |
| | | National | | | California | | | New York | | | Insured
National | | | Insured
California | |
| Class A | | 0.68 | % | | 0.77 | % | | 0.58 | % | | 1.04 | % | | 1.58 | % |
| Class B | | 1.38 | % | | 1.47 | % | | 1.28 | % | | 1.74 | % | | 2.22 | % |
| Class C | | 1.38 | % | | 1.47 | % | | 1.28 | % | | 1.74 | % | | 2.28 | % |
| | |
| 24 | | • ALLIANCEBERNSTEIN MUNICIPAL INCOME FUND |
Fund Expenses
BOND RATING SUMMARY*
October 31, 2008
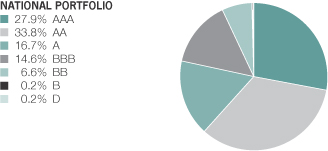
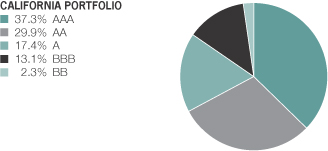
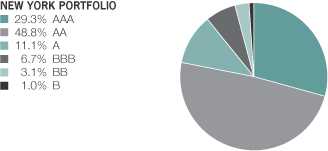
| * | All data are as of October 31, 2008. Each Portfolio’s quality rating distribution is expressed as a percentage of the Portfolio’s total investments rated in particular ratings categories by Standard & Poor’s Rating Services, Moody’s Investors Service, Inc. and Fitch Ratings, Ltd. The distributions may vary over time. If ratings are not available, the Fund’s Adviser will assign ratings that are considered to be of equivalent quality to such ratings. Pre-refunded bonds, which are escrowed by U.S. Government Securities, have been rated AAA by the Adviser. |
| | |
| ALLIANCEBERNSTEIN MUNICIPAL INCOME FUND • | | 25 |
Bond Rating Summary
BOND RATING SUMMARY*
October 31, 2008
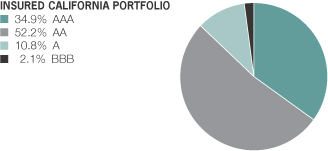
| * | All data are as of October 31, 2008. Each Portfolio’s quality rating distribution is expressed as a percentage of the Portfolio’s total investments rated in particular ratings categories by Standard & Poor’s Rating Services, Moody’s Investors Service, Inc. and Fitch Ratings, Ltd. The distributions may vary over time. If ratings are not available, the Fund’s Adviser will assign ratings that are considered to be of equivalent quality to such ratings. Pre-refunded bonds, which are escrowed by U.S. Government Securities, have been rated AAA by the Adviser. |
| | |
| 26 | | • ALLIANCEBERNSTEIN MUNICIPAL INCOME FUND |
Bond Rating Summary
NATIONAL PORTFOLIO
PORTFOLIO OF INVESTMENTS
October 31, 2008
| | | | | | |
| | | Principal
Amount
(000) | | U.S. $ Value |
| |
| | | | | | |
MUNICIPAL OBLIGATIONS – 98.3% | | | | | | |
Long – Term Municipal Bonds – 98.3% | | | | | | |
Alabama – 2.0% | | | | | | |
Jefferson Cnty Ltd Oblig Sch Warrants
FSA Series 2004
5.50%, 1/01/21 | | $ | 1,000 | | $ | 895,480 |
Series 04A
5.25%, 1/01/18-1/01/23 | | | 3,900 | | | 3,232,695 |
Montgomery Spl Care Fac Fin Auth
(Baptist Hlth)
(Prerefunded)
Series 04C
5.25%, 11/15/29 | | | 2,190 | | | 2,368,200 |
Univ of Alabama Brd of Trustees
(Univ of Alabama Hosp)
Series 08A
5.75%, 9/01/22(a) | | | 3,000 | | | 2,876,010 |
| | | | | | |
| | | | | | 9,372,385 |
| | | | | | |
Arizona – 2.6% | | | | | | |
Arizona Hlth Fac Auth
(Phoenix Children’s Hosp)
2.82%, 2/01/42(b) | | | 2,600 | | | 2,283,814 |
Estrella Mtn Ranch CFD
(Desert Village)
7.375%, 7/01/27 | | | 2,594 | | | 2,325,132 |
Phoenix Civic Impr Corp. Wastewtr Sys
MBIA Series 04
5.00%, 7/01/23 | | | 1,750 | | | 1,731,975 |
Pima Cnty IDA
(Horizon Comnty Learning Ctr)
Series 05
5.125%, 6/01/20 | | | 3,310 | | | 2,753,754 |
Queen Creek Impr Dist No 1
5.00%, 1/01/26 | | | 1,300 | | | 1,020,695 |
Salt Verde Fin Corp.
(Prepaid Gas)
5.25%, 12/01/23 | | | 2,560 | | | 1,874,509 |
Sundance CFD No 1
Series 02
7.75%, 7/01/22 | | | 600 | | | 564,402 |
| | | | | | |
| | | | | | 12,554,281 |
| | | | | | |
California – 3.1% | | | | | | |
California
(Prerefunded)
5.25%, 4/01/30 | | | 810 | | | 873,463 |
AMBAC
5.00%, 4/01/27 | | | 910 | | | 973,964 |
| | |
| ALLIANCEBERNSTEIN MUNICIPAL INCOME FUND • | | 27 |
National Portfolio—Portfolio of Investments
| | | | | | |
| | | Principal
Amount
(000) | | U.S. $ Value |
| |
| | | | | | |
California
(Unrefunded)
5.25%, 4/01/30 | | $ | 15 | | $ | 14,224 |
AMBAC
5.00%, 4/01/27 | | | 1,740 | | | 1,626,621 |
California Dept of Wtr Res
(Pwr Sup Rev)
(Prerefunded)
Series 02A
5.375%, 5/01/22 | | | 2,000 | | | 2,186,800 |
Chula Vista IDR
(San Diego Gas)
Series 96A
5.30%, 7/01/21 | | | 4,000 | | | 3,540,560 |
Manteca Uni Sch Dist
MBIA Series 01
Zero Coupon, 9/01/31 | | | 11,910 | | | 2,803,257 |
San Diego Cnty Wtr Auth
FSA Series 08A
5.00%, 5/01/25 | | | 3,000 | | | 2,914,680 |
| | | | | | |
| | | | | | 14,933,569 |
| | | | | | |
Colorado – 1.6% | | | | | | |
Colorado Ed & Cultural Fac Auth
(Knowledge Quest Charter Sch)
Series 05
6.50%, 5/01/36 | | | 495 | | | 381,868 |
Colorado HFA SFMR
(Mtg Rev) AMT
Series 99A-2
6.45%, 4/01/30 | | | 485 | | | 439,230 |
Colorado Hlth Fac Auth
(Evangelical Lutheran Proj)
5.25%, 6/01/19 | | | 1,500 | | | 1,344,195 |
Colorado Hlth Fac Auth
(Parkview Med Ctr)
Series 04
5.00%, 9/01/25 | | | 690 | | | 545,983 |
Park Creek Metro Dist Rev Ltd
(Ref-Sr-Ltd Tax Ppty Tax)
Series 05
5.50%, 12/01/30 | | | 1,900 | | | 1,510,158 |
PV Wtr & Sanitation Metro Dist Capital
Appreciation
Series 06
Zero Coupon, 12/15/17 | | | 3,672 | | | 1,953,798 |
Todd Creek Farms Metro Dist No 1
6.125%, 12/01/22 | | | 1,210 | | | 992,055 |
Series 04
6.125%, 12/01/19 | | | 820 | | | 707,849 |
| | | | | | |
| | | | | | 7,875,136 |
| | | | | | |
| | |
| 28 | | • ALLIANCEBERNSTEIN MUNICIPAL INCOME FUND |
National Portfolio—Portfolio of Investments
| | | | | | |
| | | Principal
Amount
(000) | | U.S. $ Value |
| |
| | | | | | |
Connecticut – 0.1% | | | | | | |
Connecticut HEFA
(Griffin Hosp)
RADIAN Series 05B
5.00%, 7/01/23 | | $ | 750 | | $ | 616,785 |
| | | | | | |
| | |
District Of Columbia – 2.4% | | | | | | |
Dist of Columbia
ACA
5.00%, 6/01/26 | | | 1,000 | | | 721,670 |
FSA Series 2007C
5.00%, 6/01/23 | | | 7,775 | | | 7,578,448 |
Dist of Columbia Wtr & Swr Auth
ASSURED GTY Series 2008A
5.00%, 10/01/23 | | | 3,220 | | | 3,117,926 |
| | | | | | |
| | | | | | 11,418,044 |
| | | | | | |
Florida – 8.9% | | | | | | |
Beacon Tradeport CDD
Series 02B
7.25%, 5/01/33 | | | 150 | | | 131,364 |
Bonnet Creek Resort CDD
Series 02
7.25%, 5/01/18 | | | 2,000 | | | 1,868,880 |
Collier Cnty CFD
(Fiddler’s Creek)
Series 02A
6.875%, 5/01/33 | | | 1,120 | | | 941,741 |
Series 02B
6.625%, 5/01/33 | | | 480 | | | 391,243 |
Collier Cnty IDA
(Southern St Util) AMT
Series 96
6.50%, 10/01/25 | | | 705 | | | 705,056 |
Crossings At Fleming Island CDD
Series 00C
7.05%, 5/01/15 | | | 1,550 | | | 1,471,322 |
Gateway CDD
(Sun City Ctr)
Series 03B
5.50%, 5/01/10 | | | 255 | | | 255,000 |
Indian Trace Dev Dist
(Wtr Mgmt Spl Benefit)
MBIA Series 05
5.00%, 5/01/22 | | | 320 | | | 310,230 |
Indian Trace Dev Dist Spl Assmt
(Wtr Mgmt Spl Benefit)
MBIA Series 05
5.00%, 5/01/23 | | | 1,480 | | | 1,413,311 |
| | |
| ALLIANCEBERNSTEIN MUNICIPAL INCOME FUND • | | 29 |
National Portfolio—Portfolio of Investments
| | | | | | |
| | | Principal
Amount
(000) | | U.S. $ Value |
| |
| | | | | | |
Jacksonville Hosp Rev
(Mayo Clinic)
Series 01C
5.50%, 11/15/36 | | $ | 6,750 | | $ | 5,806,823 |
Lee Cnty CFD
(Herons Glen)
(Prerefunded)
Series 99
6.00%, 5/01/29 | | | 6,090 | | | 6,280,373 |
Lee Cnty HFA SFMR
(Mtg Rev) AMT
GNMA/ FNMA Series 00A-1
7.20%, 3/01/33 | | | 70 | | | 69,957 |
Marshall Creek CDD
Series 02A
6.625%, 5/01/32 | | | 1,645 | | | 1,405,504 |
Miami Beach Hlth Fac Auth
(Mt Sinai Med Ctr)
Series 01A
6.80%, 11/15/31 | | | 3,500 | | | 2,729,195 |
Miami-Dade Cnty Ed Fac Auth
(Univ of Miami)
Series 08A
5.20%, 4/01/24 | | | 2,500 | | | 2,339,925 |
Miromar Lakes CDD
Series 00A
7.25%, 5/01/12 | | | 3,195 | | | 3,050,746 |
Orange Cnty HFA MFHR
(Seminole Proj) AMT
Series 99L
5.80%, 6/01/32 | | | 4,990 | | | 3,847,041 |
Orlando Assess Dist
(Conroy Rd Proj)
Series 98A
5.80%, 5/01/26 | | | 3,250 | | | 2,562,365 |
Pasco Cnty HFA MFHR
(Pasco Woods Apts) AMT
Series 99A
5.90%, 8/01/39 | | | 3,690 | | | 3,062,885 |
Pier Park CDD
Series 02-1
7.15%, 5/01/34 | | | 3,245 | | | 2,842,685 |
Preserve at Wildnerness Lake CDD
Series 02B
6.20%, 11/01/08 | | | 25 | | | 25,000 |
Tara CDD No 1
Series 00A
7.15%, 5/01/31 | | | 1,755 | | | 1,575,358 |
| | | | | | |
| | | | | | 43,086,004 |
| | | | | | |
| | |
| 30 | | • ALLIANCEBERNSTEIN MUNICIPAL INCOME FUND |
National Portfolio—Portfolio of Investments
| | | | | | |
| | | Principal
Amount
(000) | | U.S. $ Value |
| |
| | | | | | |
Illinois – 9.6% | | | | | | |
Chicago
Series 08A
5.25%, 1/01/23 | | $ | 10,000 | | $ | 10,093,400 |
Chicago Arpt Rev
(O’Hare Int’l Arpt)
XLCA Series 03B-1
5.25%, 1/01/34 | | | 3,400 | | | 2,975,136 |
Chicago Brd of Ed
Series 07
5.00%, 12/01/24 | | | 15,000 | | | 14,852,400 |
Chicago HFA SFMR
(Mtg Rev)
GNMA/ FNMA/ FHLMC Series 99C
7.05%, 10/01/30 | | | 45 | | | 45,144 |
Chicago HFA SFMR
(Mtg Rev) AMT
GNMA/ FNMA/ FHLMC Series 98A
6.45%, 9/01/29 | | | 225 | | | 221,546 |
GNMA/ FNMA/ FHLMC Series 98C-1
6.30%, 9/01/29 | | | 165 | | | 164,543 |
GNMA/ FNMA/ FHLMC Series 99 A
6.35%, 10/01/30 | | | 230 | | | 196,266 |
Chicago Incr Alloc
(Diversey/Narragansett Redev Proj)
7.46%, 2/15/26 | | | 1,770 | | | 1,696,952 |
Chicago Sales Tax Rev
FSA Series 05
5.00%, 1/01/25 | | | 6,905 | | | 6,534,201 |
Chicago Spec Assess
(Lake Shore East)
Series 03
6.75%, 12/01/32 | | | 3,500 | | | 2,970,240 |
Gilberts Spl Svc Area No 15 Spl Tax
(Gilberts Town Ctr Proj)
Series 03
6.00%, 3/01/28 | | | 2,430 | | | 1,876,956 |
Hampshire Spl Svc Area No 14
5.80%, 3/01/26 | | | 1,595 | | | 1,234,227 |
Illinois Fin Auth
(Illinois Inst of Technology)
Series 06A
5.00%, 4/01/31 | | | 750 | | | 567,757 |
Manhattan
(No 04-1 Brookstone Springs Proj)
Series 05
5.875%, 3/01/28 | | | 1,667 | | | 1,307,595 |
| | |
| ALLIANCEBERNSTEIN MUNICIPAL INCOME FUND • | | 31 |
National Portfolio—Portfolio of Investments
| | | | | | |
| | | Principal
Amount
(000) | | U.S. $ Value |
| |
| | | | | | |
Metro Pier & Expo Auth
(McCormick Place)
MBIA Series 02A
5.25%, 6/15/42 | | $ | 1,750 | | $ | 1,670,323 |
| | | | | | |
| | | | | | 46,406,686 |
| | | | | | |
Indiana – 0.6% | | | | | | |
Hendricks Cnty Bldg Fac Corp.
5.50%, 7/15/23 | | | 1,165 | | | 1,191,154 |
Indiana Dev Fin Auth
(Inland Steel)
Series 97
5.75%, 10/01/11 | | | 1,825 | | | 1,762,567 |
| | | | | | |
| | | | | | 2,953,721 |
| | | | | | |
Iowa – 0.0% | | | | | | |
Coralville Urban Rev Tax Incr
Series 07C
5.00%, 6/01/18 | | | 140 | | | 133,886 |
| | | | | | |
| | |
Kansas – 0.1% | | | | | | |
Lenexa Hlth Care Fac
(Lakeview Village Inc.)
5.25%, 5/15/22 | | | 870 | | | 637,327 |
| | | | | | |
| | |
Louisiana – 3.5% | | | | | | |
De Soto Parish PCR
(Int’l Paper Co)
Series A-2
5.00%, 10/01/12 | | | 2,200 | | | 1,995,092 |
Lafayette
(Communications Sys Rev)
XLCA
5.25%, 11/01/20 | | | 1,550 | | | 1,545,892 |
Lafayette LA Communications
(Communications Sys Rev)
XLCA
5.25%, 11/01/21-11/01/23 | | | 3,450 | | | 3,397,731 |
Louisiana Arpt Fac
(Cargo ACQ Grp) AMT
Series 02
6.65%, 1/01/25 | | | 800 | | | 667,464 |
New Orleans
MBIA Series 05
5.00%, 12/01/29 | | | 3,420 | | | 2,937,130 |
5.25%, 12/01/21 | | | 3,360 | | | 3,111,058 |
RADIAN
5.00%, 12/01/18-12/01/19 | | | 2,590 | | | 2,309,011 |
RADIAN Series A
5.00%, 12/01/22 | | | 1,060 | | | 885,895 |
| | | | | | |
| | | | | | 16,849,273 |
| | | | | | |
| | |
| 32 | | • ALLIANCEBERNSTEIN MUNICIPAL INCOME FUND |
National Portfolio—Portfolio of Investments
| | | | | | |
| | | Principal
Amount
(000) | | U.S. $ Value |
| |
| | | | | | |
Maryland – 1.4% | | | | | | |
Maryland CDA SFMR
(Mtg Rev) AMT
Series 00A
6.10%, 7/01/38 | | $ | 6,285 | | $ | 5,415,408 |
Maryland IDR
(Med Waste Assoc) AMT
Series 89
8.75%, 11/15/10(c)(d) | | | 1,225 | | | 1,059,196 |
| | | | | | |
| | | | | | 6,474,604 |
| | | | | | |
Massachusetts – 3.7% | | | | | | |
Massachusetts
(Prerefunded)
Series 02C
5.25%, 11/01/30 | | | 5,000 | | | 5,319,300 |
Massachusetts Dev Fin Agy
(Seven Hills Fndtn)
RADIAN Series 99
5.15%, 9/01/28 | | | 6,035 | | | 5,128,603 |
Massachusetts Port Auth AMT
Series 99D
6.00%, 7/01/29 | | | 7,500 | | | 7,394,550 |
| | | | | | |
| | | | | | 17,842,453 |
| | | | | | |
Michigan – 4.6% | | | | | | |
Detroit Wtr Sup Sys
FSA Series 2006A
5.00%, 7/01/24 | | | 7,005 | | | 6,496,017 |
Kent Hosp Fin Auth
(Metro Hosp Proj)
Series 05A
5.75%, 7/01/25 | | | 710 | | | 576,619 |
Michigan HDA MFHR
(Rental Rev) AMT
AMBAC Series 97A
6.10%, 10/01/33 | | | 330 | | | 286,968 |
Michigan Hosp Fin Auth
(Sparrow Med Ctr)
(Prerefunded)
Series 01
5.625%, 11/15/36 | | | 2,650 | | | 2,858,078 |
Michigan Hosp Fin Auth
(Trinity Hlth)
Series 00A
6.00%, 12/01/27 | | | 4,515 | | | 4,336,071 |
Plymouth Ed Ctr Charter Sch Pub
Academy Rev
Series 05
5.375%, 11/01/30 | | | 2,000 | | | 1,480,400 |
| | |
| ALLIANCEBERNSTEIN MUNICIPAL INCOME FUND • | | 33 |
National Portfolio—Portfolio of Investments
| | | | | | |
| | | Principal
Amount
(000) | | U.S. $ Value |
| |
| | | | | | |
Saginaw Hosp Fin Auth
(Covenant Med Ctr)
Series 00F
6.50%, 7/01/30 | | $ | 6,125 | | $ | 6,082,125 |
| | | | | | |
| | | | | | 22,116,278 |
| | | | | | |
Minnesota – 1.6% | | | | | | |
Minneapolis & St. Paul Arpt AMT
FGIC Series 00B
6.00%, 1/01/21 | | | 3,520 | | | 3,454,282 |
Shakopee Hlth Care Fac
(St Francis Regl Med Ctr)
Series 04
5.10%, 9/01/25 | | | 2,700 | | | 2,069,037 |
St. Paul Hsg & Redev Auth
(Hltheast Proj)
Series 05
6.00%, 11/15/25 | | | 500 | | | 431,540 |
Western Minnesota Muni Pwr Agy
FSA
5.00%, 1/01/17 | | | 1,400 | | | 1,469,678 |
| | | | | | |
| | | | | | 7,424,537 |
| | | | | | |
Missouri – 2.5% | | | | | | |
Kansas City
(Downtown Arena Proj)
Series 08C
5.00%, 4/01/28 | | | 10,500 | | | 9,421,125 |
Kansas City Arpt Fac Rev
(Cargo ACQ Grp)
Series 02
6.25%, 1/01/30 | | | 1,965 | | | 1,519,770 |
Missouri Dev Fin Brd
(Crackerneck Creek Proj)
Series 05C
5.00%, 3/01/26 | | | 1,000 | | | 891,500 |
Riverside IDA
(Riverside Horizons Proj)
ACA Series 07A
5.00%, 5/01/27 | | | 370 | | | 299,933 |
| | | | | | |
| | | | | | 12,132,328 |
| | | | | | |
Nevada – 7.1% | | | | | | |
Carson City Hosp Rev
(Carson-Tahoe Hosp Proj)
RADIAN Series 03A
5.125%, 9/01/29 | | | 2,700 | | | 2,205,306 |
Clark Cnty
AMBAC Series 2006
5.00%, 11/01/23 | | | 6,000 | | | 5,845,620 |
| | |
| 34 | | • ALLIANCEBERNSTEIN MUNICIPAL INCOME FUND |
National Portfolio—Portfolio of Investments
| | | | | | |
| | | Principal
Amount
(000) | | U.S. $ Value |
| |
| | | | | | |
Clark Cnty Passenger Fac
5.25%, 7/01/18 | | $ | 9,090 | | $ | 8,981,011 |
Clark Cnty Sch Dist
FGIC
5.00%, 6/15/22 | | | 5,720 | | | 5,653,019 |
Las Vegas Valley Wtr Dist
FGIC Series 05
5.00%, 6/01/27 | | | 5,000 | | | 4,795,400 |
Nevada Sys of Hgr Ed
AMBAC
5.00%, 7/01/25 | | | 6,985 | | | 6,587,414 |
| | | | | | |
| | | | | | 34,067,770 |
| | | | | | |
New Hampshire – 1.1% | | | | | | |
New Hampshire Bus Fin Auth PCR
(Public Svc Co) AMT
Series 93E
6.00%, 5/01/21 | | | 4,000 | | | 3,768,880 |
New Hampshire HEFA
(Covenant Hlth)
Series 04
5.375%, 7/01/24 | | | 1,680 | | | 1,468,790 |
| | | | | | |
| | | | | | 5,237,670 |
| | | | | | |
New Jersey – 3.9% | | | | | | |
Morris-Union Jointure COP
RADIAN Series 04
5.00%, 5/01/27 | | | 5,175 | | | 4,247,692 |
New Jersey Ed Fac Auth
(Prerefunded)
AMBAC Series 02A
5.25%, 9/01/21 | | | 8,005 | | | 8,599,531 |
New Jersey EDA
(New Jersey St Contract)
Series 05
5.25%, 3/01/25 | | | 6,200 | | | 6,086,292 |
| | | | | | |
| | | | | | 18,933,515 |
| | | | | | |
New Mexico – 1.4% | | | | | | |
Clayton Jail Proj Rev
CIFG
5.00%, 11/01/25-11/01/27 | | | 8,475 | | | 6,843,254 |
| | | | | | |
| | |
New York – 4.1% | | | | | | |
Erie Cnty IDA
(Buffalo Sch Dist Proj)
FSA Series 04
5.75%, 5/01/25-5/01/26 | | | 3,800 | | | 3,822,793 |
New York City
5.25%, 9/01/23 | | | 5,000 | | | 4,923,750 |
| | |
| ALLIANCEBERNSTEIN MUNICIPAL INCOME FUND • | | 35 |
National Portfolio—Portfolio of Investments
| | | | | | |
| | | Principal
Amount
(000) | | U.S. $ Value |
| |
| | | | | | |
Series 03A
5.50%, 8/01/21 | | $ | 5,000 | | $ | 5,053,500 |
Series 04G
5.00%, 12/01/23 | | | 895 | | | 851,709 |
New York City
(Unrefunded)
Series 1
5.75%, 3/01/17 | | | 420 | | | 436,703 |
New York City IDA
(Lycee Francais)
ACA Series 02C
6.80%, 6/01/28 | | | 2,500 | | | 2,255,600 |
New York Liberty Dev Corp.
(National Sports Museum Proj)
6.125%, 2/15/19(c)* | | | 850 | | | 127,500 |
New York St Dorm Auth
(Orange Regl Med Ctr)
Series 2008
6.50%, 12/01/21 | | | 1,300 | | | 1,164,878 |
New York St HFA
(Econ Dev & Hsg)
FGIC Series 05A
5.00%, 9/15/25 | | | 1,200 | | | 1,160,112 |
| | | | | | |
| | | | | | 19,796,545 |
| | | | | | |
North Carolina – 0.2% | | | | | | |
Iredell Cnty COP
FSA Series 08
5.25%, 6/01/22 | | | 720 | | | 728,071 |
| | | | | | |
| | |
North Dakota – 0.2% | | | | | | |
Ward Cnty Hlth Care Fac
(Trinity Hlth)
5.125%, 7/01/18-7/01/20 | | | 1,380 | | | 1,141,114 |
| | | | | | |
| | |
Ohio – 2.9% | | | | | | |
Cleveland Cuyahoga Port Auth
(Univ Heights Ohio-Pub Parking Proj)
Series 01
7.35%, 12/01/31 | | | 5,400 | | | 4,810,644 |
Cleveland Pub Pwr Sys
FGIC Series 06A
5.00%, 11/15/18 | | | 2,335 | | | 2,316,810 |
Franklin Cnty
(OCLC Online Computer Library Ctr)
Series 98A
5.20%, 10/01/20 | | | 1,200 | | | 1,199,940 |
Toledo Lucas Cnty Port Auth
(CSX Transp)
Series 92
6.45%, 12/15/21 | | | 6,730 | | | 5,827,709 |
| | | | | | |
| | | | | | 14,155,103 |
| | | | | | |
| | |
| 36 | | • ALLIANCEBERNSTEIN MUNICIPAL INCOME FUND |
National Portfolio—Portfolio of Investments
| | | | | | |
| | | Principal
Amount
(000) | | U.S. $ Value |
| |
| | | | | | |
Oregon – 0.9% | | | | | | |
Forest Grove Rev
(Ref & Campus Impr Pacific Proj A)
RADIAN Series 05A
5.00%, 5/01/28 | | $ | 2,995 | | $ | 2,468,030 |
Oregon Hsg Dev Agy SFMR
(Mtg Rev) AMT
Series 02B
5.45%, 7/01/32 | | | 2,200 | | | 1,724,580 |
| | | | | | |
| | | | | | 4,192,610 |
| | | | | | |
Pennsylvania – 4.2% | | | | | | |
Allegheny Cnty Hosp Dev Auth
(West Pennsylvania Hlth Sys)
Series 07A
5.00%, 11/15/17 | | | 2,900 | | | 2,312,866 |
Ephrata Area Sch Dist
(Prerefunded)
FGIC Series 05
5.00%, 3/01/22 | | | 2,565 | | | 2,740,882 |
Harrisburg Arpt Auth
(Susquehanna Arpt Proj) AMT
Series 99
5.50%, 1/01/24 | | | 500 | | | 369,670 |
Montgomery Cnty Hosp
(Abington Mem Hosp)
Series 02A
5.125%, 6/01/32 | | | 2,000 | | | 1,523,920 |
Montgomery Cnty IDA
(Whitemarsh Continuing Care Ret Comnty)
6.00%, 2/01/21 | | | 1,210 | | | 985,593 |
Pennsylvania Hgr Ed Fac Auth
(UPMC Hlth Sys)
Series 01A
6.00%, 1/15/31 | | | 3,845 | | | 3,659,248 |
Pennsylvania IDA
(St Revolving Fd)
Series 08A
5.50%, 7/01/23 | | | 3,940 | | | 3,824,046 |
Philadelphia IDA
(Leadership Learning Partners)
Series 05A
5.25%, 7/01/24 | | | 1,030 | | | 784,819 |
South Ctr Gen Auth
(Wellspan Hlth)
MBIA Series 01
5.25%, 5/15/31 | | | 685 | | | 689,583 |
| | |
| ALLIANCEBERNSTEIN MUNICIPAL INCOME FUND • | | 37 |
National Portfolio—Portfolio of Investments
| | | | | | |
| | | Principal
Amount
(000) | | U.S. $ Value |
| |
| | | | | | |
South Ctr Gen Auth
(Wellspan Hlth)
(Prerefunded)
MBIA Series 01
5.25%, 5/15/31 | | $ | 3,115 | | $ | 3,344,856 |
| | | | | | |
| | | | | | 20,235,483 |
| | | | | | |
Puerto Rico – 1.6% | | | | | | |
Puerto Rico
(Pub Impr)
5.25%, 7/01/23 | | | 1,100 | | | 968,198 |
Series 01A
5.50%, 7/01/19 | | | 500 | | | 475,175 |
Series 03A
5.25%, 7/01/23 | | | 500 | | | 440,090 |
Series 04A
5.25%, 7/01/19 | | | 1,920 | | | 1,778,765 |
Puerto Rico Govt Dev Bank
(Sr Notes)
Series 06B
5.00%, 12/01/15 | | | 500 | | | 484,015 |
Puerto Rico HFA
5.125%, 12/01/27 | | | 370 | | | 348,307 |
Univ of Puerto Rico
Series 06Q
5.00%, 6/01/19-6/01/20 | | | 3,730 | | | 3,381,421 |
| | | | | | |
| | | | | | 7,875,971 |
| | | | | | |
South Carolina – 1.9% | | | | | | |
Dorchester Cnty Sch Dist No 2
(Installment Pur Rev)
Series 06
5.00%, 12/01/30 | | | 1,500 | | | 1,284,555 |
Newberry Investing in Childrens Ed
(Newberry Cnty Sch Dist Proj)
ASSURED GTY Series 05
5.00%, 12/01/27 | | | 3,890 | | | 3,533,443 |
Series 05
5.00%, 12/01/30 | | | 335 | | | 277,306 |
Scago Ed Fac Corp.
(Calhoun Sch Dist)
RADIAN
5.00%, 12/01/21 | | | 4,300 | | | 3,943,788 |
| | | | | | |
| | | | | | 9,039,092 |
| | | | | | |
Tennessee – 0.2% | | | | | | |
Sullivan Cnty Hlth Ed
(Wellmont Hlth Sys)
Series 06C
5.00%, 9/01/22 | | | 1,265 | | | 916,189 |
5.25%, 9/01/26 | | | 275 | | | 193,083 |
| | | | | | |
| | | | | | 1,109,272 |
| | | | | | |
| | |
| 38 | | • ALLIANCEBERNSTEIN MUNICIPAL INCOME FUND |
National Portfolio—Portfolio of Investments
| | | | | | |
| | | Principal
Amount
(000) | | U.S. $ Value |
| |
| | | | | | |
Texas – 12.7% | | | | | | |
Bexar Cnty Hlth Fac Dev Corp.
5.00%, 7/01/27 | | $ | 325 | | $ | 222,176 |
Camino Real Regl Mobility Auth
5.00%, 2/15/21 | | | 3,000 | | | 2,829,240 |
Series 2008
5.00%, 8/15/21 | | | 1,790 | | | 1,674,617 |
Corpus Christi Arpt Rev
(Corpus Christi Int’l)
FSA Series 00B
5.375%, 2/15/30 | | | 7,100 | | | 6,910,785 |
Dallas-Fort Worth Arpt Rev
(Int’l Arpt)
FGIC Series 01
5.50%, 11/01/35 | | | 13,400 | | | 10,609,718 |
Ector Cnty ISD
5.25%, 8/15/27 | | | 160 | | | 161,061 |
Ector Cnty ISD
(Prerefunded)
5.25%, 8/15/27 | | | 2,840 | | | 3,077,566 |
El Paso Cnty Hosp Dist
ASSURED GTY Series 2008A
5.00%, 8/15/23 | | | 5,000 | | | 4,922,650 |
Garza Cnty Pub Fac Corp.
5.50%, 10/01/19 | | | 535 | | | 478,589 |
Grapevine Arpt Rev
6.50%, 1/01/24 | | | 995 | | | 829,999 |
Guadalupe-Blanco River Auth
(Contract & Sub Wtr Res)
MBIA Series 04A
5.00%, 8/15/24 | | | 1,440 | | | 1,344,931 |
Hidalgo Cnty Hlth Svc
(Mission Hosp Inc Proj)
Series 05
5.00%, 8/15/14-8/15/19 | | | 730 | | | 645,560 |
Houston Arpt Rev
(Cargo ACQ Grp) AMT
Series 02
6.375%, 1/01/23 | | | 3,000 | | | 2,497,650 |
Laredo ISD
AMBAC Series 04A
5.00%, 8/01/24 | | | 1,000 | | | 968,160 |
North Texas Hlth Fac Dev Corp
(United Regl Hlth Care Sys)
FSA Series 07
5.00%, 9/01/24 | | | 570 | | | 515,508 |
Richardson Hosp Auth
(Richardson Regl Med Ctr)
FSA Series 04
5.875%, 12/01/24 | | | 2,310 | | | 1,911,941 |
| | |
| ALLIANCEBERNSTEIN MUNICIPAL INCOME FUND • | | 39 |
National Portfolio—Portfolio of Investments
| | | | | | |
| | | Principal
Amount
(000) | | U.S. $ Value |
| |
| | | | | | |
San Antonio
(Elec & Gas Rev)
Series 08
5.00%, 2/01/26 | | $ | 6,830 | | $ | 6,629,813 |
San Antonio
(Unrefunded)
Series 02
5.00%, 2/01/22 | | | 3,060 | | | 3,066,120 |
Seguin Hgr Ed Auth
(Texas Lutheran Univ Proj)
Series 04
5.25%, 9/01/28 | | | 1,000 | | | 794,820 |
Texas Trpk Auth
AMBAC Series 02A
5.50%, 8/15/39 | | | 7,500 | | | 6,965,700 |
Tyler Hosp Rev
(Mother Francis Regl Hlth)
(Prerefunded)
Series 01
6.00%, 7/01/31 | | | 3,900 | | | 4,270,890 |
| | | | | | |
| | | | | | 61,327,494 |
| | | | | | |
Utah – 0.7% | | | | | | |
Intermountain Pwr Agy
Series 2008A
5.25%, 7/01/23 | | | 2,750 | | | 2,708,392 |
Spanish Fork City Charter Sch Rev
5.55%, 11/15/21 | | | 860 | | | 710,197 |
| | | | | | |
| | | | | | 3,418,589 |
| | | | | | |
Virgin Islands – 1.6% | | | | | | |
Virgin Islands Pub Fin Auth
(Virgin Islands Gross Receipts Taxes Loan Note)
FSA Series 03
5.00%, 10/01/13-10/01/14 | | | 2,025 | | | 2,069,888 |
5.25%, 10/01/15-10/01/17 | | | 5,460 | | | 5,526,999 |
| | | | | | |
| | | | | | 7,596,887 |
| | | | | | |
Virginia – 0.9% | | | | | | |
Arlington IDA
(Arlington Hlth Sys)
(Prerefunded)
Series 01
5.25%, 7/01/31(e) | | | 1,000 | | | 1,070,200 |
Bell Creek CDD
Series 03A
6.75%, 3/01/22 | | | 602 | | | 592,789 |
Broad Street CDD
(Parking Fac)
Series 03
7.50%, 6/01/33 | | | 3,000 | | | 2,770,290 |
| | | | | | |
| | | | | | 4,433,279 |
| | | | | | |
| | |
| 40 | | • ALLIANCEBERNSTEIN MUNICIPAL INCOME FUND |
National Portfolio—Portfolio of Investments
| | | | | | |
| | | Principal
Amount
(000) | | U.S. $ Value |
| |
| | | | | | |
Washington – 3.2% | | | | | | |
Energy Northwest Wind
AMBAC
5.00%, 7/01/21 | | $ | 7,845 | | $ | 7,507,273 |
Spokane
AMBAC
5.00%, 12/01/22 | | | 5,550 | | | 5,290,870 |
Tacoma SWFR
XLCA Series 06
5.00%, 12/01/18 | | | 2,750 | | | 2,717,798 |
| | | | | | |
| | | | | | 15,515,941 |
| | | | | | |
Wisconsin – 1.2% | | | | | | |
Milwaukee Arpt Rev
(Cargo ACQ Corp) AMT
Series 02
6.50%, 1/01/25 | | | 2,315 | | | 1,875,428 |
Wisconsin HEFA
(Bell Tower Residence Proj)
FHLB Series 05
5.00%, 7/01/25 | | | 1,270 | | | 1,098,436 |
Wisconsin HEFA
(Wheaton Franciscan)
MBIA
5.25%, 8/15/20 | | | 3,400 | | | 2,655,332 |
| | | | | | |
| | | | | | 5,629,196 |
| | | | | | |
| | |
Total Investments – 98.3%
(cost $522,563,607) | | | | | | 474,104,153 |
Other assets less liabilities – 1.7% | | | | | | 7,955,685 |
| | | | | | |
| | |
Net Assets – 100.0% | | | | | $ | 482,059,838 |
| | | | | | |
INTEREST RATE SWAP TRANSACTIONS (see Note D)
| | | | | | | | | | | | | | |
| | | | | | | Rate Type | | | |
Swap
Counterparty | | Notional
Amount
(000) | | Termination
Date | | Payments
made
by the
Portfolio | | | Payments
received
by the
Portfolio | | | Unrealized
Appreciation/
(Depreciation) |
Merrill Lynch | | $ | 3,205 | | 2/12/12 | | SIFMA | ** | | 3.548 | % | | $ | 105,575 |
| (a) | Variable rate coupon, rate shown as of October 31, 2008. |
| (b) | Floating Rate Security. Stated interest rate was in effect at October 31, 2008. |
| (c) | Illiquid security, valued at fair value. (See note A) |
| (d) | Security is in default and is non-income producing. |
| (e) | Position, or a portion thereof, has been segregated to collateralize interest rate swaps. |
| * | The obligor of this holding, which represents 0.03% of the Portfolio’s net assets, has disclosed that it is in default of certain payments under the loan agreement, and is in early discussions with bond holders with respect to a restructuring of the terms of the bonds, and with equity holders with respect to additional equity contributions. |
| ** | Variable interest rate based on the Securities Industry & Financial Markets Association (SIFMA). |
As of October 31, 2008, the Portfolio held 44% of net assets in insured bonds (of this amount 4% represents the Portfolio’s holding in pre-refunded insured bonds).
| | |
| ALLIANCEBERNSTEIN MUNICIPAL INCOME FUND • | | 41 |
National Portfolio—Portfolio of Investments
Glossary:
ACA – ACA Capital
AMBAC – American Bond Assurance Corporation
AMT – Alternative Minimum Tax (subject to)
ASSURED GTY – Assured Guaranty
CDA – Community Development Administration
CDD – Community Development District
CFD – Community Facilities District
CIFG – CIFG Assurance North America, Inc.
COP – Certificate of Participation
EDA – Economic Development Agency
FGIC – Financial Guaranty Insurance Company
FHLB – Federal Home Loan Bank
FHLMC – Federal Home Loan Mortgage Corporation
FNMA – Federal National Mortgage Association
FSA – Financial Security Assurance Inc.
GNMA – Government National Mortgage Association
HDA – Housing Development Authority
HEFA – Health & Education Facility Authority
HFA – Housing Finance Authority
IDA – Industrial Development Authority/Agency
IDR – Industrial Development Revenue
ISD – Independent School District
MBIA – Municipal Bond Investors Assurance
MFHR – Multi-Family Housing Revenue
PCR – Pollution Control Revenue Bond
RADIAN – Radian Group, Inc.
SFMR – Single Family Mortgage Revenue
SWFR – Solid Waste Facility Revenue
XLCA – XL Capital Assurance Inc.
See notes to financial statements.
| | |
| 42 | | • ALLIANCEBERNSTEIN MUNICIPAL INCOME FUND |
National Portfolio—Portfolio of Investments
INSURED NATIONAL PORTFOLIO
PORTFOLIO OF INVESTMENTS
October 31, 2008
| | | | | | |
| | | Principal
Amount
(000) | | U.S. $ Value |
| | | | | | | |
| | | | | | |
MUNICIPAL OBLIGATIONS – 98.9% | | | | | | |
Long-Term Municipal Bonds – 94.9% | | | | | | |
Alabama – 0.7% | | | | | | |
Jefferson Cnty Swr Rev
(Capital Impr Warrants)
(Prerefunded)
FGIC Series 02
5.00%, 2/01/41 | | $ | 375 | | $ | 391,721 |
FGIC Series 02B
5.00%, 2/01/41 | | | 625 | | | 658,450 |
| | | | | | |
| | | | | | 1,050,171 |
| | | | | | |
California – 6.4% | | | | | | |
California
FSA Series 03
5.00%, 2/01/29 | | | 1,445 | | | 1,355,367 |
California
(Prerefunded)
5.125%, 2/01/28 | | | 1,500 | | | 1,635,915 |
AMBAC
5.00%, 4/01/27 | | | 1,035 | | | 1,107,750 |
California
(Unrefunded)
AMBAC
5.00%, 4/01/27 | | | 1,965 | | | 1,836,960 |
Golden St Tobacco Securitization Corp.
(Prerefunded)
XLCA Series 03B
5.50%, 6/01/33 | | | 2,000 | | | 2,137,180 |
San Bernardino Cnty Redev ETM
(Ontario Proj #1)
MBIA Series 93
5.80%, 8/01/23 | | | 1,000 | | | 1,024,290 |
| | | | | | |
| | | | | | 9,097,462 |
| | | | | | |
Colorado – 5.9% | | | | | | |
Northwest Parkway Toll Rev
(Prerefunded)
FSA Series 01C
Zero Coupon, 6/15/25(a) | | | 9,000 | | | 8,335,620 |
| | | | | | |
| | |
District Of Columbia – 0.6% | | | | | | |
Dist of Columbia
(Georgetown Univ)
AMBAC Series C-1
15.00%, 4/01/41(b)+ | | | 25 | | | 25,000 |
Dist of Columbia Wtr & Swr Auth
ASSURED GTY Series 2008A
5.00%, 10/01/23 | | | 905 | | | 876,311 |
| | | | | | |
| | | | | | 901,311 |
| | | | | | |
| | |
| ALLIANCEBERNSTEIN MUNICIPAL INCOME FUND • | | 43 |
Insured National Portfolio—Portfolio of Investments
| | | | | | |
| | | Principal
Amount
(000) | | U.S. $ Value |
| | | | | | | |
| | | | | | |
Florida – 4.5% | | | | | | |
Hollywood Comnty Redev Agy
XLCA
5.00%, 3/01/24 | | $ | 5,000 | | $ | 4,534,650 |
Volusia Cnty Hlth Fac
(John Knox Village)
RADIAN Series 96A
6.00%, 6/01/17 | | | 1,905 | | | 1,907,496 |
| | | | | | |
| | | | | | 6,442,146 |
| | | | | | |
Illinois – 6.6% | | | | | | |
Chicago Arpt Rev
(O’Hare Int’l Arpt)
XLCA Series 03B-1
5.25%, 1/01/34 | | | 1,700 | | | 1,487,568 |
Illionois Sport Fac Rev
(Chicago Stadium Soldier Field)
AMBAC Series 01
Zero Coupon, 6/15/30(a) | | | 7,000 | | | 6,259,470 |
Metro Pier & Expo Auth
(McCormick Place)
MBIA Series 02A
5.25%, 6/15/42 | | | 1,750 | | | 1,670,322 |
| | | | | | |
| | | | | | 9,417,360 |
| | | | | | |
Louisiana – 2.1% | | | | | | |
Lafayette LA Communications
(Communications Sys Rev)
XLCA
5.25%, 11/01/23 | | | 1,550 | | | 1,513,869 |
New Orleans
MBIA Series 05
5.00%, 12/01/29 | | | 570 | | | 489,522 |
5.25%, 12/01/21 | | | 1,135 | | | 1,050,908 |
| | | | | | |
| | | | | | 3,054,299 |
| | | | | | |
Massachusetts – 5.4% | | | | | | |
Massachusetts HEFA
(Berkshire Hlth Sys)
RADIAN Series 01E
5.70%, 10/01/25 | | | 5,800 | | | 5,232,934 |
Massachusetts HEFA
(Cape Cod Hlthcare)
RADIAN Series 01C
5.25%, 11/15/31 | | | 1,600 | | | 1,288,640 |
Massachusetts HEFA
(Care Group Inc.)
MBIA Series 08
5.375%, 2/01/26 | | | 1,250 | | | 1,199,037 |
| | | | | | |
| | | | | | 7,720,611 |
| | | | | | |
| | |
| 44 | | • ALLIANCEBERNSTEIN MUNICIPAL INCOME FUND |
Insured National Portfolio—Portfolio of Investments
| | | | | | |
| | | Principal
Amount
(000) | | U.S. $ Value |
| | | | | | | |
| | | | | | |
Michigan – 4.3% | | | | | | |
Detroit Wtr Sup Sys
(Prerefunded)
FGIC Series 01B
5.50%, 7/01/33(c) | | $ | 1,450 | | $ | 1,557,126 |
Kalamazoo Hosp Fin Auth
(Borgess Med Ctr) ETM
FGIC Series 94A
0.208%, 6/01/11(d) | | | 3,440 | | | 3,446,536 |
Michigan
(Trunk Line Fund)
(Prerefunded)
FSA Series 01A
5.25%, 11/01/30 | | | 1,000 | | | 1,069,780 |
| | | | | | |
| | | | | | 6,073,442 |
| | | | | | |
Minnesota – 4.5% | | | | | | |
Waconia Hlth Care Fac
(Ridgeview Med Ctr)
(Prerefunded)
RADIAN Series 99A
6.125%, 1/01/29 | | | 6,095 | | | 6,335,631 |
| | | | | | |
| | |
Missouri – 0.1% | | | | | | |
Riverside IDA
(Riverside Horizons Proj)
ACA Series 07A
5.00%, 5/01/27 | | | 120 | | | 97,276 |
| | | | | | |
| | |
Nevada – 9.1% | | | | | | |
Carson City Hosp Rev
(Carson-Tahoe Hosp Proj)
RADIAN Series 03A
5.125%, 9/01/29 | | | 2,100 | | | 1,715,238 |
Clark Cnty
AMBAC Series 2006
5.00%, 11/01/23 | | | 5,000 | | | 4,871,350 |
Nevada Sys of Hgr Ed
AMBAC Series 2005B
5.00%, 7/01/26 | | | 6,715 | | | 6,297,394 |
| | | | | | |
| | | | | | 12,883,982 |
| | | | | | |
New Hampshire – 1.5% | | | | | | |
New Hampshire HEFA
(Mary Hitchcock Hosp)
FSA Series 02
5.50%, 8/01/27 | | | 2,250 | | | 2,193,323 |
| | | | | | |
| | |
| ALLIANCEBERNSTEIN MUNICIPAL INCOME FUND • | | 45 |
Insured National Portfolio—Portfolio of Investments
| | | | | | |
| | | Principal
Amount
(000) | | U.S. $ Value |
| | | | | | | |
| | | | | | |
New Jersey – 1.9% | | | | | | |
New Jersey Ed Fac Auth
(Hgr Ed Cap Impr)
(Prerefunded)
AMBAC Series 02A
5.125%, 9/01/22 | | $ | 2,500 | | $ | 2,674,525 |
| | | | | | |
| | |
New York – 6.5% | | | | | | |
Erie Cnty IDA
(Buffalo Sch Dist Proj)
FSA Series 04
5.75%, 5/01/26 | | | 1,300 | | | 1,307,267 |
Nassau Cnty Hlth Fac
(Nassau Hlth Sys Rev)
(Prerefunded)
FSA Series 99
5.75%, 8/01/29 | | | 7,600 | | | 7,957,504 |
| | | | | | |
| | | | | | 9,264,771 |
| | | | | | |
North Carolina – 0.8% | | | | | | |
Iredell Cnty COP
FSA Series 08
5.25%, 6/01/22 | | | 200 | | | 202,242 |
North Carolina Eastern Muni Pwr Agy
AMBAC Series 05A
5.25%, 1/01/20 | | | 1,000 | | | 939,500 |
| | | | | | |
| | | | | | 1,141,742 |
| | | | | | |
Ohio – 5.5% | | | | | | |
Cleveland Pub Pwr Sys
FGIC Series 06A
5.00%, 11/15/18 | | | 500 | | | 496,105 |
Hamilton Cnty
(Prerefunded)
AMBAC Series B
5.25%, 12/01/32 | | | 5,660 | | | 5,974,696 |
Hamilton Cnty
(Unrefunded)
AMBAC Series B
5.25%, 12/01/32 | | | 1,440 | | | 1,401,581 |
| | | | | | |
| | | | | | 7,872,382 |
| | | | | | |
Pennsylvania – 8.9% | | | | | | |
Allegheny Cnty Hgr Ed Bldg Auth
(Carnegie Mellon Univ)
Series 02
5.50%, 3/01/28 | | | 5,665 | | | 5,708,904 |
Pennsylvania Trpk Transp Rev
(Prerefunded)
AMBAC Series 01
5.25%, 7/15/41 | | | 6,500 | | | 6,961,760 |
| | | | | | |
| | | | | | 12,670,664 |
| | | | | | |
| | |
| 46 | | • ALLIANCEBERNSTEIN MUNICIPAL INCOME FUND |
Insured National Portfolio—Portfolio of Investments
| | | | | | |
| | | Principal
Amount
(000) | | U.S. $ Value |
| | | | | | | |
| | | | | | |
Puerto Rico – 5.3% | | | | | | |
Puerto Rico Elec Pwr Auth
(Prerefunded)
XLCA Series 02-1
5.25%, 7/01/22 | | $ | 6,935 | | $ | 7,515,737 |
| | | | | | |
| | |
Rhode Island – 3.9% | | | | | | |
Rhode Island EDA
(Providence Place Mall Proj)
ASSET GTY Series 00
6.125%, 7/01/20 | | | 5,500 | | | 5,572,050 |
| | | | | | |
| | |
South Carolina – 5.3% | | | | | | |
Dorchester Cnty Sch Dist No 2
ASSURED GTY
5.00%, 12/01/29 | | | 400 | | | 365,404 |
Newberry Investing in Childrens Ed
(Newberry Cnty Sch Dist Proj)
ASSURED GTY Series 05
5.00%, 12/01/27 | | | 2,335 | | | 2,120,974 |
Series 05
5.00%, 12/01/30 | | | 115 | | | 95,195 |
South Carolina Pub Svc Auth
AMBAC Series 2007A
5.00%, 1/01/25 | | | 5,000 | | | 4,923,450 |
| | | | | | |
| | | | | | 7,505,023 |
| | | | | | |
Texas – 2.8% | | | | | | |
Guadalupe-Blanco River Auth
(Contract & Sub Wtr Res)
MBIA Series 04A
5.00%, 8/15/24 | | | 455 | | | 424,961 |
North Texas Hlth Fac Dev Corp
(United Regl Hlth Care Sys)
FSA Series 07
5.00%, 9/01/24 | | | 180 | | | 162,792 |
San Antonio
Series 02
5.00%, 2/01/23 | | | 1,485 | | | 1,483,381 |
Texas Trpk Auth
AMBAC Series 02A
5.50%, 8/15/39 | | | 2,000 | | | 1,857,520 |
| | | | | | |
| | | | | | 3,928,654 |
| | | | | | |
Washington – 0.6% | | | | | | |
Tacoma SWFR
XLCA Series 06
5.00%, 12/01/18 | | | 865 | | | 854,871 |
| | | | | | |
| | |
| ALLIANCEBERNSTEIN MUNICIPAL INCOME FUND • | | 47 |
Insured National Portfolio—Portfolio of Investments
| | | | | | |
| | | Principal
Amount
(000) | | U.S. $ Value |
| | | | | | | |
| | | | | | |
West Virginia – 1.7% | | | | | | |
Fairmont Hgr Ed
(Fairmont St Coll)
FGIC Series 02A
5.375%, 6/01/27 | | $ | 2,500 | | $ | 2,393,725 |
| | | | | | |
| | |
Total Long-Term Municipal Bonds
(cost $136,200,327) | | | | | | 134,996,778 |
| | | | | | |
| | |
SHORT-TERM MUNICIPAL NOTES – 4.0% | | | | | | |
Alaska – 0.5% | | | | | | |
Valdez Marine Term Rev
0.80%, 12/01/33(e) | | | 700 | | | 700,000 |
| | | | | | |
| | |
Florida – 1.9% | | | | | | |
Orange Cnty IDA
(Lake Highland Prep Sch)
1.50%, 8/01/32(e) | | | 2,700 | | | 2,700,000 |
| | | | | | |
| | |
Kentucky – 0.8% | | | | | | |
Shelby Cnty
1.20%, 9/01/34(e) | | | 1,100 | | | 1,100,000 |
| | | | | | |
| | |
Ohio – 0.5% | | | | | | |
Allen Cnty
(Catholic Hlthcare Partners)
Series A
0.70%, 10/01/31(e) | | | 700 | | | 700,000 |
| | | | | | |
| | |
South Carolina – 0.3% | | | | | | |
Charleston Cnty
0.85%, 8/15/30(e) | | | 500 | | | 500,000 |
| | | | | | |
| | |
Total Short-Term Municipal Notes
(cost $5,700,000) | | | | | | 5,700,000 |
| | | | | | |
| | |
Total Investments—98.9%
(cost $141,900,327) | | | | | | 140,696,778 |
Other assets less liabilities – 1.1% | | | | | | 1,595,244 |
| | | | | | |
| | |
Net Assets—100.0% | | | | | $ | 142,292,022 |
| | | | | | |
| | |
| 48 | | • ALLIANCEBERNSTEIN MUNICIPAL INCOME FUND |
Insured National Portfolio—Portfolio of Investments
INTEREST RATE SWAP TRANSACTIONS (see Note D)
| | | | | | | | | | | | | | | |
| | | | | | | Rate Type | | | | |
Swap
Counterparty | | Notional
Amount
(000) | | Termination
Date | | Payments
made
by the
Portfolio | | | Payments
received
by the
Portfolio | | | Unrealized
Appreciation/
(Depreciation) | |
Merrill Lynch | | $ | 1,000 | | 10/21/16 | | SIFMA | * | | 4.128 | % | | $ | 53,254 | |
Merrill Lynch | | | 2,500 | | 7/30/26 | | 4.090 | % | | SIFMA | * | | | (110,192 | ) |
Merrill Lynch | | | 2,500 | | 11/15/26 | | 4.377 | % | | SIFMA | * | | | (203,000 | ) |
| (a) | Indicates a security that has a zero coupon that remains in effect until a predetermined date at which time the stated coupon rate becomes effective until final maturity. |
| (b) | Variable rate coupon, rate shown as of October 31, 2008. |
| (c) | Position, or a portion thereof, has been segregated to collateralize interest rate swaps. |
| (d) | Inverse Floater Security—Security with variable or floating interest rate that moves in the opposite direction of short-term interest rates. |
| (e) | Variable Rate Demand Notes (VRDN) are instruments whose interest rates change on a specific date (such as coupon date or interest payment date) or whose interest rates vary with changes in a designated base rate (such as the prime interest rate). This instrument is payable on demand and is secured by letters of credit or other credit support agreements from major banks. |
| * | Variable interest rate based on the Securities Industry & Financial Markets Association (SIFMA). |
| + | An auction rate security whose interest rate resets at each auction date. Auctions are typically held every week or month. The rate shown is as of October 31, 2008 and the aggregate market value of this security amounted to $25,000 or 0.02% of net assets. |
As of October 31, 2008, the Portfolio held 89% of net assets in insured bonds (of this amount 40% represents the Portfolio’s holding in pre-refunded insured bonds). 32% of the Portfolio’s insured bonds were insured by AMBAC.
Glossary:
ACA – ACA Capital
AMBAC – American Bond Assurance Corporation
ASSET GTY – Asset Guaranty Insurance Company AKA Radian
ASSURED GTY – Assured Guaranty
COP – Certificate of Participation
EDA – Economic Development Agency
ETM – Escrow to Maturity
FGIC – Financial Guaranty Insurance Company
FSA – Financial Security Assurance Inc.
HEFA – Health & Education Facility Authority
IDA – Industrial Development Authority/Agency
MBIA – Municipal Bond Investors Assurance
RADIAN – Radian Group, Inc.
SFMR – Single Family Mortgage Revenue
SWFR – Solid Waste Facility Revenue
XLCA – XL Capital Assurance Inc.
See notes to financial statements.
| | |
| ALLIANCEBERNSTEIN MUNICIPAL INCOME FUND • | | 49 |
Insured National Portfolio—Portfolio of Investments
NEW YORK PORTFOLIO
PORTFOLIO OF INVESTMENTS
October 31, 2008
| | | | | | |
| | | Principal
Amount
(000) | | U.S. $ Value |
| |
| | | | | | |
MUNICIPAL OBLIGATIONS – 97.6% | | | | | | |
Long-Term Municipal Bonds – 95.2% | | | | | | |
New York – 82.2% | | | | | | |
Albany IDA
(St. Peters Hosp Proj)
Series A
5.75%, 11/15/22 | | $ | 795 | | $ | 692,962 |
Cattaraugus Cnty Hgr Ed
(Jamestown)
(Prerefunded)
Series 00A
6.50%, 7/01/30 | | | 1,000 | | | 1,084,830 |
Cortland Cnty IDA
(Cortland Mem Hosp)
RADIAN
Series 02
5.25%, 7/01/32 | | | 2,700 | | | 2,381,643 |
Dutchess Cnty IDA
(Civil Fac Rev)
5.00%, 8/01/19-8/01/21 | | | 1,450 | | | 1,408,458 |
Erie Cnty
(Pub Impr)
MBIA Series 05A
5.00%, 12/01/20 | | | 5,990 | | | 5,664,803 |
Erie Cnty IDA
(Buffalo Sch Dist Proj)
FSA Series 04
5.75%, 5/01/25 | | | 1,400 | | | 1,409,800 |
Glen Cove IDR
(The Regency at Glen Cove) ETM
Series 92B
Zero Coupon, 10/15/19 | | | 11,745 | | | 6,929,198 |
Hempstead IDA
(Adelphi Univ Civic Fac)
Series 02
5.50%, 6/01/32 | | | 1,000 | | | 965,400 |
Herkimer Cnty IDR
(Herkimer CC Stud Hsg)
Series 00
6.50%, 11/01/30 | | | 2,000 | | | 2,059,940 |
Long Island Pwr Auth
FGIC Series 06A
5.00%, 12/01/19-12/01/24 | | | 8,300 | | | 7,844,265 |
Long Island Pwr Auth
(Prerefunded)
FSA Series 01A
5.25%, 9/01/28 | | | 10,000 | | | 10,688,100 |
| | |
| 50 | | • ALLIANCEBERNSTEIN MUNICIPAL INCOME FUND |
New York Portfolio—Portfolio of Investments
| | | | | | |
| | | Principal
Amount
(000) | | U.S. $ Value |
| |
| | | | | | |
Metro Transp Auth Dedicated Tax Fund
MBIA
5.00%, 11/15/18-11/15/21 | | $ | 11,890 | | $ | 11,965,550 |
Series 02
5.25%, 11/15/31 | | | 5,000 | | | 4,569,950 |
Series 02A
5.125%, 11/15/31 | | | 5,500 | | | 4,973,210 |
Series Ser
5.25%, 11/15/30 | | | 10,000 | | | 9,247,000 |
Monroe Cnty MFHR
(Southview Towers Proj) AMT
SONYMA Series 00
6.25%, 2/01/31 | | | 1,130 | | | 1,124,486 |
Montgomery Cnty IDA
(HFM Boces)
XLCA Series 05A
5.00%, 7/01/24 | | | 1,500 | | | 1,408,335 |
Nassau Cnty IDA
(Continuing Care Ret)
6.50%, 1/01/27 | | | 1,000 | | | 829,280 |
New York City
5.00%, 1/01/21 | | | 5,000 | | | 4,875,200 |
FSA Series 04E
5.00%, 11/01/21 | | | 4,000 | | | 3,969,800 |
Series 04G
5.00%, 12/01/23 | | | 3,225 | | | 3,069,007 |
Series 04I
5.00%, 8/01/21 | | | 11,400 | | | 11,095,506 |
Series 05J
5.00%, 3/01/24 | | | 5,000 | | | 4,720,850 |
XLCA Series 04I
5.00%, 8/01/18 | | | 10,000 | | | 10,024,000 |
New York City
(Prerefunded)
Series 01B
5.50%, 12/01/31(a) | | | 11,995 | | | 12,978,590 |
Series 03
5.75%, 3/01/15 | | | 2,350 | | | 2,590,992 |
New York City
(Unrefunded)
Series 01B
5.50%, 12/01/31 | | | 5 | | | 4,847 |
Series 1
5.75%, 3/01/17 | | | 420 | | | 436,703 |
New York City HDC
(NYC Hsg Auth)
FGIC Series 05P6-A
5.00%, 7/01/19 | | | 10,000 | | | 9,991,200 |
| | |
| ALLIANCEBERNSTEIN MUNICIPAL INCOME FUND • | | 51 |
New York Portfolio—Portfolio of Investments
| | | | | | |
| | | Principal
Amount
(000) | | U.S. $ Value |
| |
| | | | | | |
New York City HDC MFHR
(Rental Hsg) AMT
Series 01C-2
5.40%, 11/01/33 | | $ | 3,030 | | $ | 2,368,399 |
Series 02A
5.50%, 11/01/34 | | | 1,250 | | | 982,300 |
New York City Hlth & Hosp Corp.
(Hlth Care Sys Rev)
FSA Series 02A
5.125%, 2/15/23 | | | 1,500 | | | 1,409,415 |
New York City Hlth & Hosp Corp.
(Hlth Care Sys Rev)
AMBAC Series 03A
5.25%, 2/15/22 | | | 5,700 | | | 5,699,544 |
New York City IDA
(Airis JFK Proj)
Series 01A
5.50%, 7/01/28 | | | 9,000 | | | 6,302,790 |
New York City IDA
(Brooklyn Navy Yard) AMT
Series 97
5.75%, 10/01/36 | | | 3,000 | | | 2,315,550 |
New York City IDA
(Lycee Francais)
ACA Series 02C
6.80%, 6/01/28 | | | 2,500 | | | 2,255,600 |
New York City IDA
(Magen David Yeshivah Proj)
ACA Series 02
5.70%, 6/15/27 | | | 1,600 | | | 1,275,424 |
New York City IDA
(Spence Sch)
5.20%, 7/01/34 | | | 3,155 | | | 3,054,923 |
New York City IDA
(Staten Island Hosp)
Series 01B
6.375%, 7/01/31 | | | 1,925 | | | 1,542,406 |
New York City IDA
(Terminal One Group Assoc Proj)
Series 05
5.50%, 1/01/24(b) | | | 800 | | | 719,232 |
New York City Muni Wtr Fin Auth
Series 03A
5.00%, 6/15/27 | | | 1,000 | | | 971,630 |
New York City TFA
5.00%, 7/15/21 | | | 7,000 | | | 6,826,120 |
MBIA Series 03D
5.25%, 2/01/18 | | | 10,000 | | | 10,243,100 |
| | |
| 52 | | • ALLIANCEBERNSTEIN MUNICIPAL INCOME FUND |
New York Portfolio—Portfolio of Investments
| | | | | | |
| | | Principal
Amount
(000) | | U.S. $ Value |
| |
| | | | | | |
Series 02A
5.50%, 11/01/26(b) | | $ | 5,000 | | $ | 5,229,350 |
New York City TFA
(Prerefunded)
Series 00B
6.00%, 11/15/29 | | | 6,000 | | | 6,409,980 |
New York City Trust for Cultural Res
(Museum of Modern Art)
AMBAC Series 01D
5.125%, 7/01/31 | | | 14,000 | | | 13,446,160 |
New York Conv Ctr Dev Corp.
(Hotel Unit Fee Secured)
AMBAC Series 05
5.00%, 11/15/30 | | | 10,000 | | | 9,069,100 |
New York Dorm Auth
(Mount Sinai Hlth Sys)
Series 00
6.50%, 7/01/25 | | | 4,000 | | | 3,574,680 |
New York Liberty Dev Corp.
(National Sports Museum Proj)
6.125%, 2/15/19(c)* | | | 900 | | | 135,000 |
New York St Dorm Auth
(Cabrini of Westchester)
GNMA
5.10%, 2/15/26 | | | 1,900 | | | 1,699,892 |
New York St Dorm Auth
(Eger Rehab Ctr) FHA
FHA Series 00
6.10%, 8/01/37 | | | 3,065 | | | 3,088,018 |
New York St Dorm Auth
(FHA Insured Maimonides)
MBIA Series 04
5.75%, 8/01/29 | | | 3,515 | | | 3,630,644 |
New York St Dorm Auth
(Leake & Watts Svc Inc.)
MBIA Series 04
5.00%, 7/01/22-7/01/23 | | | 3,275 | | | 3,091,101 |
New York St Dorm Auth
(Master Boces Program Wayne Finger)
FSA Series 04
5.00%, 8/15/23 | | | 3,175 | | | 3,158,363 |
New York St Dorm Auth
(Memorial Sloan-Kettering Ctr)
MBIA Series 03A
5.00%, 7/01/22 | | | 5,000 | | | 4,999,650 |
New York St Dorm Auth
(Montefiore Hosp)
FGIC FHA Series 04
5.00%, 8/01/23 | | | 5,000 | | | 4,619,500 |
| | |
| ALLIANCEBERNSTEIN MUNICIPAL INCOME FUND • | | 53 |
New York Portfolio—Portfolio of Investments
| | | | | | |
| | | Principal
Amount
(000) | | U.S. $ Value |
| |
| | | | | | |
New York St Dorm Auth
(New York Univ)
FGIC Series 04A
5.00%, 7/01/24 | | $ | 2,240 | | $ | 2,168,947 |
New York St Dorm Auth
(Non St Supported Debt Ozanam)
5.00%, 11/01/21 | | | 1,000 | | | 928,790 |
New York St Dorm Auth
(North Shore-Long Island Jewish Oblig Group)
5.00%, 5/01/22 | | | 1,405 | | | 1,177,587 |
New York St Dorm Auth
(Nursing Home)
(Prerefunded)
FHA Series 02-34
5.20%, 2/01/32 | | | 3,965 | | | 4,356,108 |
New York St Dorm Auth
(NYU Hosp Ctr)
Series 07A
5.00%, 7/01/22 | | | 1,200 | | | 921,456 |
Series B
5.25%, 7/01/24 | | | 800 | | | 614,320 |
New York St Dorm Auth
(Orange Regl Med Ctr)
Series 2008
6.50%, 12/01/21 | | | 1,240 | | | 1,111,114 |
New York St Dorm Auth
(Personal Income Tax)
5.00%, 3/15/27 | | | 2,350 | | | 2,283,848 |
New York St Dorm Auth
(Rochester Univ)
Series 04A
5.25%, 7/01/23-7/01/24 | | | 1,250 | | | 1,232,149 |
New York St Dorm Auth
(Rochester Univ)
(Prerefunded)
Series 04A
5.25%, 7/01/21 | | | 575 | | | 628,360 |
New York St Dorm Auth
(St Univ of New York)
(Prerefunded)
Series 02
5.00%, 7/01/32 | | | 4,000 | | | 4,264,880 |
New York St Dorm Auth
(Westchester Cnty Court Fac Lease)
Series 06A
5.00%, 8/01/17 | | | 9,510 | | | 9,950,028 |
New York St Dorm Auth MFHR
(Joachim & Anne Residence)
Series 02
5.25%, 7/01/27 | | | 1,000 | | | 885,160 |
| | |
| 54 | | • ALLIANCEBERNSTEIN MUNICIPAL INCOME FUND |
New York Portfolio—Portfolio of Investments
| | | | | | |
| | | Principal
Amount
(000) | | U.S. $ Value |
| |
| | | | | | |
New York St Energy Res & Dev Auth
(Long Island Ltg Co.) AMT
Series 95A
5.30%, 8/01/25 | | $ | 7,500 | | $ | 6,927,750 |
New York St Mtg Agy SFMR
(Mtg Rev) AMT
Series 01-29
5.45%, 4/01/31 | | | 9,000 | | | 7,048,620 |
Series 01-31A
5.30%, 10/01/31 | | | 8,500 | | | 6,567,780 |
New York St Pwr Auth
MBIA
5.00%, 11/15/21 | | | 3,000 | | | 3,006,420 |
MBIA Series C
5.00%, 11/15/19 | | | 680 | | | 694,355 |
New York St SFMR
(Mtg Rev) AMT
Series 82
5.65%, 4/01/30 | | | 2,810 | | | 2,742,757 |
New York St Thruway Auth
(Personal Income Tax Rev)
(Transp)
5.00%, 3/15/26-3/15/27 | | | 11,000 | | | 10,711,750 |
AMBAC Series 04A
5.00%, 3/15/24 | | | 5,000 | | | 4,869,000 |
AMBAC Series 05B
5.00%, 4/01/21 | | | 7,500 | | | 7,451,700 |
FGIC Series 05B
5.00%, 4/01/17 | | | 12,750 | | | 13,162,463 |
New York St Urban Dev Corp
(Personal Income Tax)
(Prerefunded)
Series 02A
5.25%, 3/15/32 | | | 3,945 | | | 4,224,030 |
Niagara Frontier Transp Auth
(Buffalo Niagara Int’l Arpt) AMT
MBIA
5.625%, 4/01/29 | | | 2,500 | | | 2,230,375 |
Onondaga Cnty IDA
(Anheuser Busch) AMT
Series 99
6.25%, 12/01/34 | | | 2,000 | | | 2,007,060 |
Onondaga Cnty IDA
(Cargo ACQ) AMT
Series 02
6.125%, 1/01/32 | | | 1,000 | | | 750,630 |
Onondaga Cnty PCR
(Bristol-Meyers Squibb) AMT
5.75%, 3/01/24 | | | 4,000 | | | 3,792,920 |
Sachem Ctr Sch Dist of Holbrook
5.00%, 10/15/21-10/15/22 | | | 5,415 | | | 5,246,694 |
| | |
| ALLIANCEBERNSTEIN MUNICIPAL INCOME FUND • | | 55 |
New York Portfolio—Portfolio of Investments
| | | | | | |
| | | Principal
Amount
(000) | | U.S. $ Value |
| |
| | | | | | |
Seneca Cnty IDA
(New York Chiropractic Coll)
5.00%, 10/01/27 | | $ | 925 | | $ | 815,489 |
Spencerport Uni Sch Dist
(Prerefunded)
MBIA Series 02
5.00%, 6/15/21 | | | 2,500 | | | 2,653,700 |
Tobacco Settlement Fin Corp.
Series 03A-1
5.50%, 6/01/14 | | | 5,000 | | | 5,025,500 |
Triborough Brdg & Tunnel Auth
5.00%, 11/15/24-11/15/26 | | | 16,715 | | | 16,427,217 |
Ulster Cnty IDA
(Kingston Regl Sr Living Corp.-Woodland
Pond at New Patlz Proj)
6.00%, 9/15/27 | | | 1,175 | | | 915,783 |
Yonkers IDA
(Malotz Pavillion Proj)
MBIA Series 99
5.65%, 2/01/39 | | | 700 | | | 673,470 |
| | | | | | |
| | | | | | 385,589,986 |
| | | | | | |
Arizona – 0.2% | | | | | | |
Goodyear IDA
(Litchfield Pk Svc Proj) AMT
Series 01
6.75%, 10/01/31 | | | 1,000 | | | 884,750 |
| | | | | | |
| | |
California – 0.2% | | | | | | |
California
Series 03
5.25%, 11/01/25 | | | 650 | | | 633,600 |
Series 04
5.20%, 4/01/26 | | | 350 | | | 337,176 |
| | | | | | |
| | | | | | 970,776 |
| | | | | | |
Florida – 2.3% | | | | | | |
Collier Cnty CFD
(Fiddler’s Creek)
Series 02A
6.875%, 5/01/33 | | | 1,090 | | | 916,516 |
Series 02B
6.625%, 5/01/33 | | | 465 | | | 379,017 |
Crossings at Fleming Island CDD
(Eagle Harbor)
Series 00C
7.10%, 5/01/30 | | | 5,500 | | | 4,908,475 |
Fiddlers Creek CDD
(Prerefunded)
Series 99B
5.80%, 5/01/21 | | | 670 | | | 555,383 |
| | |
| 56 | | • ALLIANCEBERNSTEIN MUNICIPAL INCOME FUND |
New York Portfolio—Portfolio of Investments
| | | | | | |
| | | Principal
Amount
(000) | | U.S. $ Value |
| |
| | | | | | |
Hammock Bay CDD
(Spl Assmt)
Series 04A
6.15%, 5/01/24 | | $ | 800 | | $ | 668,016 |
Highlands Cnty Hlth Fac Auth
(Adventist/Sunbelt Hosp)
FSA Series 2005G
15.00%, 11/15/35(b)+ | | | 575 | | | 575,000 |
Marshall Creek CDD
Series 02A
6.625%, 5/01/32 | | | 935 | | | 798,873 |
Midtown Miami CDD
Series 04A
6.00%, 5/01/24 | | | 2,475 | | | 1,965,521 |
| | | | | | |
| | | | | | 10,766,801 |
| | | | | | |
Georgia – 0.1% | | | | | | |
Atlanta
(Tax Alloc Bonds Eastside Proj)
Series 05B
5.60%, 1/01/30 | | | 500 | | | 354,480 |
| | | | | | |
| | |
Guam – 0.1% | | | | | | |
Guam Govt
(Wtr & Waste Sys Rev)
Series 05
6.00%, 7/01/25 | | | 500 | | | 448,510 |
| | | | | | |
| | |
Illinois – 0.7% | | | | | | |
Antioch Village Spl Svc Area
(Clublands Proj)
Series 03
6.625%, 3/01/33 | | | 993 | | | 728,127 |
Plano Spl Svc Area No. 3
(Lakewood Springs Proj)
Series 05A
5.95%, 3/01/28 | | | 1,350 | | | 1,070,955 |
Yorkville CFD
(Raintree Village)
Series 03
6.875%, 3/01/33 | | | 1,894 | | | 1,638,083 |
| | | | | | |
| | | | | | 3,437,165 |
| | | | | | |
Nevada – 0.3% | | | | | | |
Clark Cnty Impr Dist No. 142
Series 03
6.10%, 8/01/18 | | | 1,460 | | | 1,295,356 |
| | | | | | |
| | |
| ALLIANCEBERNSTEIN MUNICIPAL INCOME FUND • | | 57 |
New York Portfolio—Portfolio of Investments
| | | | | | |
| | | Principal
Amount
(000) | | U.S. $ Value |
| |
| | | | | | |
New Jersey – 1.2% | | | | | | |
Port Auth NY & NJ
(JFK Int’l Arpt Proj) AMT
MBIA Series 97-6
5.75%, 12/01/22 | | $ | 6,820 | | $ | 5,867,519 |
| | | | | | |
| | |
Ohio – 0.2% | | | | | | |
Port Auth of Columbiana Cnty SWFR
(Apex Enviro LLC) AMT
Series 04A
7.125%, 8/01/25 | | | 1,200 | | | 1,041,852 |
| | | | | | |
| | |
Puerto Rico – 7.1% | | | | | | |
Puerto Rico
(Pub Impr)
5.25%, 7/01/23 | | | 1,600 | | | 1,408,288 |
Series 01A
5.50%, 7/01/19 | | | 915 | | | 869,570 |
Puerto Rico Elec Pwr Auth
5.00%, 7/01/22 | | | 2,085 | | | 1,848,686 |
5.375%, 7/01/24 | | | 5,225 | | | 4,730,715 |
Series 08WW
5.375%, 7/01/23 | | | 405 | | | 368,250 |
Puerto Rico Elec Pwr Auth
(Prerefunded)
XLCA Series 02-1
5.25%, 7/01/22 | | | 10,000 | | | 10,837,400 |
Puerto Rico Govt Dev Bank
(Sr Notes)
Series 06B
5.00%, 12/01/15 | | | 500 | | | 484,015 |
Puerto Rico HFA
5.00%, 12/01/20 | | | 1,795 | | | 1,616,093 |
5.125%, 12/01/27 | | | 1,495 | | | 1,407,348 |
Puerto Rico HFA
(Prerefunded)
5.00%, 12/01/20 | | | 3,420 | | | 3,617,334 |
Puerto Rico HFC SFMR
(Mtg Rev)
GNMA/ FNMA/ FHLMC Series 01A
5.20%, 12/01/33 | | | 1,690 | | | 1,380,899 |
Puerto Rico Muni Fin Agy
Series 05A
5.25%, 8/01/23 | | | 935 | | | 822,660 |
Univ of Puerto Rico
5.00%, 6/01/22 | | | 255 | | | 223,689 |
Series 06Q
5.00%, 6/01/20 | | | 4,225 | | | 3,793,923 |
| | | | | | |
| | | | | | 33,408,870 |
| | | | | | |
| | |
| 58 | | • ALLIANCEBERNSTEIN MUNICIPAL INCOME FUND |
New York Portfolio—Portfolio of Investments
| | | | | | |
| | | Principal
Amount
(000) | | U.S. $ Value |
| |
| | | | | | |
Virginia – 0.6% | | | | | | |
Bell Creek CDD
Series 03A
6.75%, 3/01/22 | | $ | 201 | | $ | 197,925 |
Broad Street CDD
(Parking Fac)
Series 03
7.50%, 6/01/33 | | | 2,680 | | | 2,474,792 |
| | | | | | |
| | | | | | 2,672,717 |
| | | | | | |
Total Long-Term Municipal Bonds
(cost $473,796,801) | | | | | | 446,738,782 |
| | | | | | |
| | |
Short-Term Municipal Notes – 2.4% | | | | | | |
New York – 0.9% | | | | | | |
New York City
FSA Series A6
1.90%, 11/01/26(d) | | | 1,000 | | | 1,000,000 |
New York City Muni Wtr Fin Auth
2.15%, 6/15/32(d) | | | 2,000 | | | 2,000,000 |
Syracuse IDA
(Syracuse Univ)
1.05%, 7/01/37(d) | | | 1,000 | | | 1,000,000 |
| | | | | | |
| | | | | | 4,000,000 |
| | | | | | |
Colorado – 1.5% | | | | | | |
Colorado Ed & Cultural Fac Auth
(National Jewish Federation Brd Program)
0.80%, 5/01/38(d) | | | 7,070 | | | 7,070,000 |
| | | | | | |
Total Short-Term Municipal Notes
(cost $11,070,000) | | | | | | 11,070,000 |
| | | | | | |
| | |
Total Investments – 97.6%
(cost $484,866,801) | | | | | | 457,808,782 |
Other assets less liabilities – 2.4% | | | | | | 11,403,903 |
| | | | | | |
| | |
Net Assets – 100.0% | | | | | $ | 469,212,685 |
| | | | | | |
INTEREST RATE SWAP TRANSACTIONS (see Note D)
| | | | | | | | | | | | | | | |
| | | | | | | Rate Type | | | | |
Swap
Counterparty | | Notional
Amount
(000) | | Termination
Date | | Payments
made
by the
Portfolio | | | Payments
received
by the
Portfolio | | | Unrealized
Appreciation/
(Depreciation) | |
Citigroup | | $ | 2,200 | | 1/25/26 | | SIFMA | * | | 4.108 | % | | $ | 99,434 | |
JP Morgan Chase | | | 4,500 | | 6/15/15 | | 3.777 | % | | SIFMA | * | | | (174,628 | ) |
Merrill Lynch | | | 3,100 | | 10/01/16 | | SIFMA | * | | 4.147 | % | | | 167,912 | |
| | |
| ALLIANCEBERNSTEIN MUNICIPAL INCOME FUND • | | 59 |
New York Portfolio—Portfolio of Investments
| (a) | Position, or a portion thereof, has been segregated to collateralize interest rate swaps. |
| (b) | Variable rate coupon, rate shown as of October 31, 2008. |
| (c) | Illiquid security, valued at fair value. (See note A) |
| (d) | Variable Rate Demand Notes (VRDN) are instruments whose interest rates change on a specific date (such as coupon date or interest payment date) or whose interest rates vary with changes in a designated base rate (such as the prime interest rate). This instrument is payable on demand and is secured by letters of credit or other credit support agreements from major banks. |
| * | The obligor of this holding, which represents 0.03% of the Portfolio’s net assets, has disclosed that it is in default of certain payments under the loan agreement, and is in early discussions with bond holders with respect to a restructuring of the terms of the bonds, and with equity holders with respect to additional equity contribution. |
| ** | Variable interest rate based on the Securities Industry & Financial Markets Association (SIFMA). |
| + | An auction rate security whose interest rate resets at each auction date. Auctions are typically held every week or month. The rate shown is as of October 31, 2008 and the aggregate market value of this security amounted to $575,000 or 0.12% of net assets. |
As of October 31, 2008, the Portfolio held 40% of net assets in insured bonds (of this amount 5% represents the Portfolio’s holding in pre-refunded insured bonds). 20% of the Portfolio’s insured bonds were insured by MBIA.
Glossary:
ACA – ACA Capital
AMBAC – American Bond Assurance Corporation
AMT – Alternative Minimum Tax (subject to)
CDD – Community Development District
CFD – Community Facilities District
ETM – Escrow to Maturity
FGIC – Financial Guaranty Insurance Company
FHA – Federal Housing Administration
FHLMC – Federal Home Loan Mortgage Corporation
FNMA – Federal National Mortgage Association
FSA – Financial Security Assurance Inc.
GNMA – Government National Mortgage Association
HDC – Housing Development Corporation
HFA – Housing Finance Authority
HFC – Housing Finance Corporation
IDA – Industrial Development Authority/Agency
IDR – Industrial Development Revenue
MBIA – Municipal Bond Investors Assurance
MFHR – Multi–Family Housing Revenue
PCR – Pollution Control Revenue Bond
RADIAN – Radian Group, Inc.
SFMR – Single Family Mortgage Revenue
SONYMA – State of New York Mortgage Agency
SWFR – Solid Waste Facility Revenue
XLCA – XL Capital Assurance Inc.
See notes to financial statements.
| | |
| 60 | | • ALLIANCEBERNSTEIN MUNICIPAL INCOME FUND |
New York Portfolio—Portfolio of Investments
CALIFORNIA PORTFOLIO
PORTFOLIO OF INVESTMENTS
October 31, 2008
| | | | | | |
| | | Principal
Amount
(000) | | U.S. $ Value |
| |
| | | | | | |
MUNICIPAL OBLIGATIONS – 99.4% | | | | | | |
Long-Term Municipal Bonds – 99.4% | | | | | | |
California – 95.7% | | | | | | |
Acalanes Union High Sch Dist
(Ref-2013 Crossover)
FSA Series 05B
5.25%, 8/01/24 | | $ | 3,000 | | $ | 3,031,950 |
Banning Util Auth
(Wtr & Enterprise Rev)
FGIC Series 05
5.25%, 11/01/30 | | | 7,265 | | | 6,718,381 |
Bay Area Infra Fin Auth
FGIC
5.00%, 8/01/17 | | | 2,000 | | | 2,014,080 |
Beaumont Fin Auth
AMBAC Series C
5.00%, 9/01/26 | | | 2,900 | | | 2,490,578 |
California
5.00%, 8/01/22-2/01/32 | | | 28,200 | | | 26,386,086 |
MBIA
5.00%, 6/01/18 | | | 5,000 | | | 5,055,400 |
MBIA-IBC Series 03
5.25%, 2/01/16 | | | 2,050 | | | 2,110,987 |
Series 03
5.25%, 2/01/24 | | | 3,500 | | | 3,434,970 |
California
(Prerefunded)
5.00%, 2/01/33 | | | 6,925 | | | 7,511,063 |
5.125%, 6/01/31 | | | 1,710 | | | 1,825,528 |
5.25%, 2/01/30-4/01/30 | | | 1,200 | | | 1,293,854 |
5.30%, 4/01/29 | | | 6,395 | | | 7,029,896 |
MBIA Series 02
5.00%, 2/01/32 | | | 3,500 | | | 3,728,865 |
California
(Unrefunded)
5.125%, 6/01/31 | | | 20 | | | 18,525 |
5.25%, 2/01/30-4/01/30 | | | 13,975 | | | 13,254,306 |
5.30%, 4/01/29 | | | 5 | | | 4,830 |
California Dept of Veteran Affairs
(Home Purchase Rev)
AMBAC Series 02A
5.35%, 12/01/27 | | | 22,320 | | | 20,040,458 |
California Dept of Wtr Res
(Prerefunded)
Series 02A
5.375%, 5/01/21 | | | 3,000 | | | 3,280,200 |
| | |
| ALLIANCEBERNSTEIN MUNICIPAL INCOME FUND • | | 61 |
California Portfolio—Portfolio of Investments
| | | | | | |
| | | Principal
Amount
(000) | | U.S. $ Value |
| |
| | | | | | |
California Dept of Wtr Res
(Pwr Sup Rev)
5.00%, 12/01/24 | | $ | 5,000 | | $ | 4,913,150 |
California Dept of Wtr Res
(Pwr Sup Rev)
(Prerefunded)
FGIC Series 02A
5.125%, 5/01/18 | | | 10,000 | | | 10,834,100 |
California Ed Fac Auth
(Coll of Arts & Crafts)
Series 01
5.875%, 6/01/30 | | | 2,200 | | | 1,796,410 |
California Ed Fac Auth
(Univ of the Pacific)
5.00%, 11/01/21 | | | 990 | | | 916,433 |
Series 04
5.00%, 11/01/20 | | | 1,000 | | | 959,370 |
5.25%, 5/01/34 | | | 1,000 | | | 916,030 |
California HFA SFMR
(Mtg Rev) AMT
Series 99A-2
5.25%, 8/01/26 | | | 1,705 | | | 1,374,366 |
California Hlth Fac Fin Auth
(Catholic Hlthcare West)
Series G
5.50%, 7/01/25 | | | 2,000 | | | 1,768,620 |
California Hlth Fac Fin Auth
(Cottage Hlth Sys)
MBIA Series 03B
5.00%, 11/01/23 | | | 2,500 | | | 2,201,175 |
California Hlth Fac Fin Auth
(Lucile Salter Packard Hosp)
AMBAC Series 03C
5.00%, 8/15/21 | | | 3,365 | | | 3,204,893 |
California Infra & Econ Dev Bank
(Kaiser Hosp)
Series 01A
5.55%, 8/01/31 | | | 18,000 | | | 15,496,560 |
California Pollution Ctl Fin Auth
(Pacific Gas & Elec) AMT
MBIA Series 96A
5.35%, 12/01/16 | | | 15,500 | | | 14,909,915 |
California Pollution Ctl Fin Auth
(So Calif Edison) AMT
MBIA Series 99C
5.55%, 9/01/31 | | | 7,950 | | | 6,420,897 |
| | |
| 62 | | • ALLIANCEBERNSTEIN MUNICIPAL INCOME FUND |
California Portfolio—Portfolio of Investments
| | | | | | |
| | | Principal
Amount
(000) | | U.S. $ Value |
| |
| | | | | | |
California Pollution Ctl Fin Auth
(Tracy Material Recovery) AMT
ACA Series 99A
5.70%, 8/01/14 | | $ | 3,670 | | $ | 3,468,700 |
California Pub Wks Brd
(Dept of Hlth Svcs-Richmond Lab)
XLCA Series 05B
5.00%, 11/01/30 | | | 1,270 | | | 1,135,710 |
California Pub Wks Brd
(Dept of Mental Hlth-Coalinga)
Series 04A
5.50%, 6/01/22-6/01/23 | | | 6,790 | | | 6,757,390 |
California Pub Wks Brd
(Univ of Calif Proj)
Series 05C
5.00%, 4/01/23 | | | 3,130 | | | 3,060,733 |
California Pub Wks Brd
(Various Univ Calif Proj)
Series 04F
5.00%, 11/01/26 | | | 8,065 | | | 7,759,417 |
California Rural MFA SFMR
(Mtg Rev) AMT
GNMA/ FNMA Series 00B
6.25%, 12/01/31 | | | 70 | | | 67,480 |
GNMA/ FNMA Series 00D
6.00%, 12/01/31 | | | 245 | | | 244,701 |
GNMA/ FNMA Series 99A
5.40%, 12/01/30 | | | 290 | | | 227,424 |
MBIA Series 99A
5.40%, 12/01/30 | | | 720 | | | 560,340 |
California State Univ
AMBAC Series A
5.00%, 11/01/19 | | | 6,025 | | | 6,038,195 |
FGIC Series 03A
5.00%, 11/01/22 | | | 6,000 | | | 5,829,480 |
California Statewide CDA
(Drew Coll Prep)
(Prerefunded)
Series 00
7.25%, 10/01/30 | | | 7,610 | | | 8,159,366 |
California Statewide CDA
(Saint Mark’s Sch)
Series 01
6.75%, 6/01/28 | | | 2,400 | | | 2,319,072 |
California Statewide CDA
(San Diego Space & Science)
Series 96
7.50%, 12/01/16 | | | 2,240 | | | 2,253,866 |
| | |
| ALLIANCEBERNSTEIN MUNICIPAL INCOME FUND • | | 63 |
California Portfolio—Portfolio of Investments
| | | | | | |
| | | Principal
Amount
(000) | | U.S. $ Value |
| |
| | | | | | |
California Statewide CDA
(Wildwood Elem Sch)
Series 01
7.00%, 11/01/29 | | $ | 3,770 | | $ | 3,311,455 |
California Statewide CDA MFHR
(Highland Creek Apts) AMT
FNMA Series 01K
5.40%, 4/01/34 | | | 5,745 | | | 4,956,499 |
California Statewide CDA MFHR
(Santa Paula Villl Apts)
FNMA Series 98D
5.43%, 5/01/28 | | | 2,090 | | | 1,729,517 |
Castaic Lake Wtr Agy
AMBAC Series 04A
5.00%, 8/01/16-8/01/18 | | | 4,325 | | | 4,368,689 |
MBIA Series 01A
5.20%, 8/01/30 | | | 1,625 | | | 1,543,717 |
Chino Hills CFD
(Fairfield Ranch 10)
Series 00
6.95%, 9/01/30 | | | 5,200 | | | 4,861,168 |
Commerce Joint Pwr Fin Auth
(Comnty Ctr Proj)
XLCA Series 04
5.00%, 10/01/34 | | | 2,015 | | | 1,636,664 |
Corona CFD
(Eagle Glen 97-2) ETM
Series 98
5.875%, 9/01/23 | | | 5,795 | | | 4,965,388 |
East Palo Alto Pub Fin Auth
(Univ Circle Gateway 101)
RADIAN Series 05A
5.00%, 10/01/25 | | | 4,390 | | | 3,670,128 |
Eastern Wtr Dist Impr Area A
(Morningstar Ranch)
Series 02
6.40%, 9/01/32 | | | 3,610 | | | 2,993,412 |
El Centro Fin Auth
(El Centro Med Ctr)
Series 01
5.375%, 3/01/26 | | | 18,000 | | | 18,004,320 |
Encinitas Rec Ranch Golf Auth
(Encinitas Ranch Golf Course)
Series 04
5.50%, 9/01/23-9/01/24 | | | 1,110 | | | 902,664 |
5.60%, 9/01/26 | | | 1,000 | | | 798,100 |
| | |
| 64 | | • ALLIANCEBERNSTEIN MUNICIPAL INCOME FUND |
California Portfolio—Portfolio of Investments
| | | | | | |
| | | Principal
Amount
(000) | | U.S. $ Value |
| |
| | | | | | |
Fontana CFD 11
(Heritage West End)
Series B
6.50%, 9/01/28 | | $ | 8,390 | | $ | 7,490,089 |
Fontana Pub Fin Auth
(North Fontana Redev Proj)
AMBAC Series 03A
5.50%, 9/01/32 | | | 1,000 | | | 951,530 |
Foothill Eastern Transp Corridor Agy
Series 95
Zero Coupon, 1/01/24 | | | 10,255 | | | 4,473,539 |
Zero Coupon, 1/01/25 | | | 15,000 | | | 6,175,500 |
Fremont Uni Sch Dist of Alameda Cnty
FSA Series 05B
5.00%, 8/01/26 | | | 1,745 | | | 1,683,192 |
Fresno Joint Pwr
(Lease Rev)
XLCA Series 04A
5.25%, 10/01/21-10/01/24 | | | 3,425 | | | 3,384,743 |
5.375%, 10/01/17 | | | 1,315 | | | 1,363,681 |
Fullerton Redev Agy COP
RADIAN
5.00%, 4/01/21 | | | 2,225 | | | 1,935,127 |
Gilroy Uni Sch Dist
FGIC
5.00%, 8/01/27 | | | 1,500 | | | 1,391,040 |
Huntington Park Pub Fin Auth
FSA Series 04A
5.25%, 9/01/17 | | | 1,000 | | | 1,056,350 |
Kaweah Delta Hlth Care Dist
MBIA Series 04
5.25%, 8/01/25-8/01/26 | | | 3,780 | | | 3,657,136 |
La Verne CFD 88-1
Series 98
5.875%, 3/01/14 | | | 3,910 | | | 3,764,470 |
Lammersville Sch Dist CFD
(Mountain House)
Series 02
6.375%, 9/01/32 | | | 4,250 | | | 3,602,130 |
Lancaster Redev Agy Tax Alloc Rev
(Fire Protn Fac Proj)
XLCA Series 04
5.00%, 12/01/23 | | | 1,120 | | | 1,041,421 |
Lancaster Redev Agy Tax Alloc Rev
(Sheriffs Fac Proj)
XLCA Series 04
5.00%, 12/01/23 | | | 1,875 | | | 1,743,450 |
| | |
| ALLIANCEBERNSTEIN MUNICIPAL INCOME FUND • | | 65 |
California Portfolio—Portfolio of Investments
| | | | | | |
| | | Principal
Amount
(000) | | U.S. $ Value |
| |
| | | | | | |
Loma Linda
(Loma Linda Univ Med Ctr)
Series 05A
5.00%, 12/01/23 | | $ | 2,000 | | $ | 1,481,220 |
Los Angeles Cnty Metro Transp Auth
(Prerefunded)
FGIC Series 00A
5.25%, 7/01/30 | | | 2,750 | | | 2,906,035 |
Los Angeles Comnty Redev Agy
Series 04L
5.00%, 3/01/17 | | | 2,565 | | | 2,426,875 |
5.10%, 3/01/19 | | | 1,350 | | | 1,241,946 |
Los Angeles Dept of Wtr & Pwr
(Pwr Sys)
AMBAC
5.00%, 7/01/24 | | | 5,325 | | | 5,205,933 |
MBIA Series 01A
5.00%, 7/01/24 | | | 1,500 | | | 1,466,460 |
Los Angeles MFHR
(Park Plaza West) AMT
GNMA
5.50%, 1/20/43 | | | 5,000 | | | 3,872,450 |
Los Angeles Uni Sch Dist
AMBAC Series B
5.00%, 7/01/19-7/01/21 | | | 13,685 | | | 13,686,423 |
Manteca Uni Sch Dist
(Prerefunded)
FSA Series 04
5.25%, 8/01/22 | | | 1,390 | | | 1,528,291 |
Marin Wtr Dist
AMBAC Series 04
5.25%, 7/01/20 | | | 3,040 | | | 3,081,314 |
Murrieta Valley Uni Sch Dist
(Election 2002)
FSA Series 05B
5.125%, 9/01/29 | | | 1,275 | | | 1,214,540 |
Norco Redev Agy Tax Alloc Rev
(Norco Redev Proj Area No 1)
AMBAC Series 05
5.00%, 3/01/26 | | | 1,360 | | | 1,312,536 |
RADIAN Series 04
5.00%, 3/01/24 | | | 3,060 | | | 2,593,931 |
Oakland Uni Sch Dist
(Alameda Cnty)
FGIC
5.00%, 8/01/22 | | | 8,975 | | | 8,044,921 |
MBIA Series 05
5.00%, 8/01/25 | | | 7,455 | | | 6,549,739 |
| | |
| 66 | | • ALLIANCEBERNSTEIN MUNICIPAL INCOME FUND |
California Portfolio—Portfolio of Investments
| | | | | | |
| | | Principal
Amount
(000) | | U.S. $ Value |
| |
| | | | | | |
Ontario Assmt Dist
(Calif Commerce Ctr)
7.70%, 9/02/10 | | $ | 1,695 | | $ | 1,681,542 |
Ontario COP
(Wtr Sys Impr Proj)
MBIA Series 04
5.25%, 7/01/21 | | | 1,700 | | | 1,718,088 |
Orange Cnty CFD 99-1
(Ladera Ranch)
(Prerefunded)
Series 99A
6.70%, 8/15/29 | | | 3,000 | | | 3,172,080 |
Palm Springs COP ETM
Series 91B
Zero Coupon, 4/15/21 | | | 37,500 | | | 19,820,250 |
Palmdale Wtr Dist COP
FGIC Series 04
5.00%, 10/01/24 | | | 1,775 | | | 1,632,894 |
Pittsburg Redev Agy
(Los Medanos Proj)
MBIA Series 03A
5.00%, 8/01/21 | | | 6,410 | | | 6,139,883 |
Placentia-Yorba Linda Uni Sch Dist
FGIC Series 06
5.00%, 10/01/27 | | | 4,200 | | | 3,721,536 |
Port of Oakland AMT
FGIC Series 02L
5.375%, 11/01/27 | | | 2,500 | | | 2,059,750 |
Rancho Etiwanda Pub Fac CFD 1
(Rancho Etiwanda)
Series 01
(Prerefunded)
6.40%, 9/01/31 | | | 8,000 | | | 8,609,280 |
Rancho Etiwanda Pub Fac CFD 1
(Rancho Etiwanda) ETM
(Prerefunded)
Series 01
6.40%, 9/01/31 | | | 3,080 | | | 3,306,134 |
Riverside CFD No 89-1
(MTN Cove)
(Prerefunded)
Series 00
6.50%, 9/01/25 | | | 3,390 | | | 3,578,925 |
Riverside Cnty Pub Fin Auth Tax Alloc Rev
XLCA Series 04
5.00%, 10/01/35 | | | 2,475 | | | 2,011,160 |
| | |
| ALLIANCEBERNSTEIN MUNICIPAL INCOME FUND • | | 67 |
California Portfolio—Portfolio of Investments
| | | | | | |
| | | Principal
Amount
(000) | | U.S. $ Value |
| |
| | | | | | |
Riverside Comnty Coll Dist
MBIA Series C
5.00%, 8/01/25 | | $ | 1,720 | | $ | 1,630,233 |
Riverside Comnty Coll Dist
(Prerefunded)
MBIA Series 04A
5.25%, 8/01/25-8/01/26 | | | 1,980 | | | 2,166,179 |
Rocklin Uni Sch Dist CFD
MBIA Series 04
5.00%, 9/01/25 | | | 1,000 | | | 941,600 |
Roseville CFD
(No 1 Central Roseville Highland Park)
Series 99-A
5.80%, 9/01/17 | | | 6,630 | | | 6,242,543 |
Roseville High Sch Dist
Series 01E
5.25%, 8/01/26 | | | 2,435 | | | 2,432,005 |
Sacramento CFD 97-01B
(N Natomas Drain)
(Prerefunded)
Series 00B
7.25%, 9/01/30 | | | 5,375 | | | 5,737,275 |
Sacramento City Uni Sch Dist
FSA Series 04D
5.25%, 7/01/21-7/01/23 | | | 8,525 | | | 8,602,133 |
Sacramento Cnty Hsg Auth MFHR
(Cottage Estates) AMT
FNMA Series 00B
6.00%, 2/01/33 | | | 5,300 | | | 4,544,220 |
Sacramento Cnty Hsg Auth MFHR
(Verandas Apts) AMT
FNMA Series 00H
5.70%, 3/01/34 | | | 2,875 | | | 2,324,409 |
Sacramento Muni Util Dist
(Elec Rev)
MBIA Series 03S
5.00%, 11/15/17 | | | 5,000 | | | 5,091,050 |
MBIA Series 04R-289-2
5.00%, 8/15/17 | | | 10,000 | | | 10,173,400 |
San Bernardino Cnty CFD 2002-1
(Kaiser Commerce Ctr)
Series 02-1
5.90%, 9/01/33 | | | 4,750 | | | 3,954,470 |
San Bernardino SFMR
(Mtg Rev) AMT
GNMA/ FNMA Series 01-A1
6.35%, 7/01/34(a) | | | 455 | | | 454,709 |
| | |
| 68 | | • ALLIANCEBERNSTEIN MUNICIPAL INCOME FUND |
California Portfolio—Portfolio of Investments
| | | | | | |
| | | Principal
Amount
(000) | | U.S. $ Value |
| |
| | | | | | |
San Diego Cnty COP
Series 04A
5.50%, 9/01/44 | | $ | 5,000 | | $ | 4,320,650 |
San Diego HFA MFHR
(Rental Rev) AMT
GNMA/ FNMA Series 98C
5.25%, 1/20/40 | | | 6,105 | | | 4,556,039 |
San Diego HFA MFHR
(Vista La Rosa Apt) AMT
GNMA Series 00A
6.00%, 7/20/41 | | | 10,230 | | | 8,615,297 |
San Diego Uni Sch Dist
(Election of 1998)
MBIA Series 04E-1
5.00%, 7/01/23-7/01/24 | | | 2,240 | | | 2,187,864 |
San Francisco City & Cnty Airport Comm
(San Francisco Int’l Arpt) AMT
FSA Series 00A
6.125%, 1/01/27 | | | 1,480 | | | 1,481,406 |
San Francisco Univ Funding, Inc.
(Prerefunded)
5.25%, 7/01/32 | | | 16,650 | | | 17,220,262 |
San Joaquin Hills Transp Corr Agy
(Toll Road Rev)
MBIA Series A
Zero Coupon, 1/15/36 | | | 47,415 | | | 7,204,709 |
San Joaquin Hills Transp Corr Agy ETM
Series 93
Zero Coupon, 1/01/20 | | | 20,000 | | | 11,292,200 |
Zero Coupon, 1/01/21 | | | 20,000 | | | 10,577,200 |
Zero Coupon, 1/01/23 | | | 25,000 | | | 11,630,750 |
San Jose Redev Agy
(Tax Alloc Rev)
MBIA Series 04A
5.25%, 8/01/19 | | | 5,000 | | | 4,915,100 |
San Mateo Cnty Comnty Coll Dist COP
(Prerefunded)
MBIA Series 04
5.25%, 10/01/20(b) | | | 2,870 | | | 3,155,048 |
Santa Ana Uni Sch Dist
Series A
5.25%, 8/01/28 | | | 5,400 | | | 5,063,526 |
Santa Margarita Wtr Dist
(Prerefunded)
6.25%, 9/01/29 | | | 3,130 | | | 3,307,440 |
(unrefunded)
6.25%, 9/01/29 | | | 8,420 | | | 7,812,833 |
| | |
| ALLIANCEBERNSTEIN MUNICIPAL INCOME FUND • | | 69 |
California Portfolio—Portfolio of Investments
| | | | | | |
| | | Principal
Amount
(000) | | U.S. $ Value |
| |
| | | | | | |
Semitropic Impr Dist Wtr Storage
XLCA Series 04A
5.50%, 12/01/23 | | $ | 1,640 | | $ | 1,633,276 |
South Gate Pub Fin Auth
(South Gate Redev Proj No 1)
XLCA Series 02
5.125%, 9/01/24 | | | 1,800 | | | 1,608,876 |
Tejon Ranch Pub Fac Fin Auth CFD 1
(Tejon Indl Complex)
Series 00A
7.20%, 9/01/30 | | | 9,850 | | | 9,441,178 |
Tejon Ranch Pub Fac Fin Auth CFD 2000-1
Series 03
6.125%, 9/01/27 | | | 1,000 | | | 816,180 |
6.20%, 9/01/33 | | | 2,375 | | | 1,886,676 |
Torrance COP
(Ref & Pub Impt Proj)
AMBAC Series 05B
5.00%, 6/01/24 | | | 2,900 | | | 2,805,431 |
Univ of California
FSA Series 05B
5.00%, 5/15/24 | | | 3,600 | | | 3,446,028 |
Series K
5.00%, 5/15/21 | | | 5,525 | | | 5,509,640 |
Univ of California
(Prerefunded)
FGIC Series 01M
5.125%, 9/01/30 | | | 12,270 | | | 12,763,377 |
West Contra Costa Hlthcare Dist COP
AMBAC Series 04
5.375%, 7/01/21-7/01/24 | | | 4,720 | | | 4,240,695 |
West Kern Cnty Wtr Rev
(Prerefunded)
Series 01
5.625%, 6/01/31 | | | 3,000 | | | 3,195,060 |
Westminster Redev Agy MFHR
(Rose Garden Apt) AMT
Series 93A
6.75%, 8/01/24 | | | 4,300 | | | 4,303,956 |
| | | | | | |
| | | | | | 643,627,928 |
| | | | | | |
Florida – 0.3% | | | | | | |
Collier Cnty CFD
(Fiddler’s Creek)
Series 02A
6.875%, 5/01/33 | | | 1,560 | | | 1,311,710 |
Series 02B 6.625%, 5/01/33 | | | 665 | | | 542,035 |
| | | | | | |
| | | | | | 1,853,745 |
| | | | | | |
| | |
| 70 | | • ALLIANCEBERNSTEIN MUNICIPAL INCOME FUND |
California Portfolio—Portfolio of Investments
| | | | | | |
| | | Principal
Amount
(000) | | U.S. $ Value |
| |
| | | | | | |
Puerto Rico – 3.4% | | | | | | |
Puerto Rico
(Pub Impr)
5.25%, 7/01/23 | | $ | 3,000 | | $ | 2,640,540 |
Series 01A
5.50%, 7/01/19 | | | 1,880 | | | 1,786,658 |
Series 03A
5.25%, 7/01/23 | | | 800 | | | 704,144 |
Puerto Rico Conv Ctr Auth
AMBAC Series A
5.00%, 7/01/17 | | | 10,730 | | | 10,290,284 |
Puerto Rico Govt Dev Bank
(Sr Notes)
Series 06B
5.00%, 12/01/15 | | | 500 | | | 484,015 |
Puerto Rico HFA
5.125%, 12/01/27 | | | 295 | | | 277,704 |
Univ of Puerto Rico
5.00%, 6/01/18 | | | 4,930 | | | 4,562,666 |
Series 06Q
5.00%, 6/01/19 | | | 2,490 | | | 2,281,861 |
| | | | | | |
| | | | | | 23,027,872 |
| | | | | | |
| | |
Total Investments – 99.4%
(cost $693,021,338) | | | | | | 668,509,545 |
Other assets less liabilities – 0.6% | | | | | | 3,884,565 |
| | | | | | |
| | |
Net Assets – 100.0% | | | | | $ | 672,394,110 |
| | | | | | |
INTEREST RATE SWAP TRANSACTIONS (see Note D)
| | | | | | | | | | | | | | | |
| | | | | | | Rate Type | | | | |
Swap
Counterparty | | Notional
Amount
(000) | | Termination
Date | | Payments
made
by the
Portfolio | | | Payments
received
by the
Portfolio | | | Unrealized
Appreciation/
(Depreciation) | |
Citigroup | | $ | 5,600 | | 1/25/26 | | SIFMA | * | | 4.108 | % | | $ | 253,104 | |
Merrill Lynch | | | 2,800 | | 10/01/16 | | SIFMA | * | | 4.147 | % | | | 151,663 | |
Merrill Lynch | | | 13,800 | | 7/30/26 | | 4.090 | % | | SIFMA | * | | | (608,259 | ) |
Merrill Lynch | | | 10,200 | | 8/09/26 | | 4.063 | % | | SIFMA | * | | | (424,480 | ) |
Merrill Lynch | | | 13,400 | | 11/15/26 | | 4.377 | % | | SIFMA | * | | | (1,088,082 | ) |
| (a) | Variable rate coupon, rate shown as of October 31, 2008. |
| (b) | Position, or a portion thereof, has been segregated to collateralize interest rate swaps. |
| * | Variable interest rate based on the Securities Industry & Financial Markets Association (SIFMA). |
| | |
| ALLIANCEBERNSTEIN MUNICIPAL INCOME FUND • | | 71 |
California Portfolio—Portfolio of Investments
As of October 31, 2008, the Portfolio held 44% of net assets in insured bonds (of this amount 8% represents the Portfolio’s holding in pre-refunded insured bonds).
Glossary:
ACA – ACA Capital
AMBAC – American Bond Assurance Corporation
AMT – Alternative Minimum Tax (subject to)
CDA – Community Development Administration
CFD – Community Facilities District
COP – Certificate of Participation
ETM – Escrow to Maturity
FGIC – Financial Guaranty Insurance Company
FNMA – Federal National Mortgage Association
FSA – Financial Security Assurance Inc.
GNMA – Government National Mortgage Association
HFA – Housing Finance Authority
MBIA – Municipal Bond Investors Assurance
MFA – Mortgage Finanace Authority
MFHR – Multi-Family Housing Revenue
RADIAN – Radian Group, Inc.
SFMR – Single Family Mortgage Revenue
XLCA – XL Capital Assurance Inc.
See notes to financial statements.
| | |
| 72 | | • ALLIANCEBERNSTEIN MUNICIPAL INCOME FUND |
California Portfolio—Portfolio of Investments
INSURED CALIFORNIA PORTFOLIO
PORTFOLIO OF INVESTMENTS
October 31, 2008
| | | | | | |
| | | Principal
Amount
(000) | | U.S. $ Value |
| |
| | | | | | |
MUNICIPAL OBLIGATIONS – 96.8% | | | | | | |
Long-Term Municipal Bonds – 94.4% | | | | | | |
California – 91.3% | | | | | | |
Acalanes Union High Sch Dist
(Ref-2013 Crossover)
FSA Series 05B
5.25%, 8/01/24 | | $ | 2,000 | | $ | 2,021,300 |
Banning Util Auth
(Wtr & Enterprise Rev)
FGIC Series 05
5.25%, 11/01/30 | | | 1,140 | | | 1,054,226 |
Bay Area Infra Fin Auth
FGIC
5.00%, 8/01/17 | | | 4,000 | | | 4,028,160 |
Beaumont Fin Auth
AMBAC Series C
5.00%, 9/01/26 | | | 405 | | | 347,822 |
Butte-Glenn Comnty Coll Dist
(Election 2002)
MBIA Series 05B
5.00%, 8/01/25 | | | 3,620 | | | 3,409,026 |
California HFA MFHR
(Mtg Rev)
AMBAC Series 95A
6.25%, 2/01/37 | | | 1,235 | | | 1,193,603 |
California Pub Wks Brd
(Dept of Hlth Svcs-Richmond Lab)
XLCA Series 05B
5.00%, 11/01/30 | | | 3,000 | | | 2,682,780 |
Capistrano Uni Sch Dist Sch Fac Impr Dist
No 1
FGIC Series 00A
6.00%, 8/01/24 | | | 1,550 | | | 1,532,749 |
Capistrano Uni Sch Dist Schl Fac Impr Dist
No 1
FSA Series 01B
Zero Coupon, 8/01/25 | | | 8,000 | | | 2,993,280 |
Chino Redev Agy Spl Tax ETM
AMBAC Series 01B
5.25%, 9/01/30 | | | 5,090 | | | 4,897,751 |
Coachella Valley Uni Sch Dist
AMBAC
5.00%, 9/01/23 | | | 2,500 | | | 2,309,250 |
East Palo Alto Pub Fin Auth
(Univ Circle Gateway 101)
RADIAN Series 05A
5.00%, 10/01/25 | | | 680 | | | 568,494 |
| | |
| ALLIANCEBERNSTEIN MUNICIPAL INCOME FUND • | | 73 |
Insured California Portfolio—Portfolio of Investments
| | | | | | |
| | | Principal
Amount
(000) | | U.S. $ Value |
| |
| | | | | | |
Fontana Pub Fin Auth
(North Fontana Redev Proj)
AMBAC Series 03A
5.50%, 9/01/32 | | $ | 4,200 | | $ | 3,996,426 |
Franklin-McKinley Sch Dist
(Prerefunded)
FSA Series 02B
5.00%, 8/01/27 | | | 700 | | | 756,882 |
Fullerton Redev Agy COP
RADIAN
5.00%, 4/01/21 | | | 1,025 | | | 891,463 |
Golden St Tobacco Securitization Corp.
(Prerefunded)
RADIAN Series 03
5.50%, 6/01/43 | | | 1,400 | | | 1,496,026 |
Jurupa Uni Sch Dist
FGIC Series 04
5.00%, 8/01/22 | | | 1,340 | | | 1,279,660 |
Long Beach Fin Auth
(Aquarium of the Pacific Proj)
AMBAC Series 01
5.25%, 11/01/30 | | | 6,500 | | | 5,938,985 |
Los Angeles Dept of Wtr & Pwr
(Pwr Sys)
MBIA Series 01A
5.00%, 7/01/24 | | | 4,900 | | | 4,790,436 |
Murrieta Valley Uni Sch Dist
(Election 2002)
FSA Series 05B
5.125%, 9/01/29 | | | 225 | | | 214,330 |
Norco Redev Agy Tax Alloc Rev
(Norco Redev Proj Area No 1)
AMBAC Series 05
5.00%, 3/01/26 | | | 540 | | | 521,154 |
Orange Cnty COP
(Loma Ridge Data Ctr Proj)
(Prerefunded)
AMBAC
6.00%, 6/01/21 | | | 1,000 | | | 1,114,220 |
Poway Redev Agy
(Paguay Proj) ETM
AMBAC Series 01
5.375%, 12/15/31 | | | 5,875 | | | 5,382,088 |
Rancho Cordova COP
(City Hall Fac Acq Proj)
(Prerefunded)
XLCA Series 05
5.00%, 2/01/24 | | | 2,645 | | | 2,839,434 |
| | |
| 74 | | • ALLIANCEBERNSTEIN MUNICIPAL INCOME FUND |
Insured California Portfolio—Portfolio of Investments
| | | | | | |
| | | Principal
Amount
(000) | | U.S. $ Value |
| |
| | | | | | |
Redding Elec Sys Rev
MBIA Series 92A
6.223%, 7/01/22 (a)(b) | | $ | 1,550 | | $ | 1,911,894 |
Riverside Cnty Pub Fin Auth
(Tax Alloc Rev)
XLCA Series 04
5.00%, 10/01/23 | | | 1,955 | | | 1,713,792 |
Riverside Cnty Redev Agy
(Jurupa Valley Proj)
(Prerefunded)
AMBAC Series 01
5.125%, 10/01/35 | | | 2,500 | | | 2,721,875 |
Riverside Cnty Redev Agy
(Jurupa Valley Proj) ETM
(Prerefunded)
AMBAC Series 01
5.25%, 10/01/35 | | | 5,000 | | | 5,461,150 |
San Diego Uni Sch Dist
(Election of 1998)
MBIA Series 04E-1
5.00%, 7/01/23 | | | 1,000 | | | 975,590 |
Southwestern Comnty Coll Dist
MBIA Series 05
5.00%, 8/01/24 | | | 1,000 | | | 937,550 |
Stockton Pub Fin Auth
RADIAN Series 06A
5.00%, 9/01/17-9/01/21 | | | 5,060 | | | 4,601,993 |
Torrance COP
(Ref & Pub Impt Proj)
AMBAC Series 05B
5.00%, 6/01/24 | | | 465 | | | 449,836 |
Univ of California
FSA Series 05B
5.00%, 5/15/24 | | | 1,400 | | | 1,340,122 |
| | | | | | |
| | | | | | 76,373,347 |
| | | | | | |
| | |
Nevada – 3.1% | | | | | | |
Henderson Loc Impr Dist
FSA Series A
5.00%, 3/01/22 | | | 2,660 | | | 2,609,114 |
| | | | | | |
| | |
Total Long-Term Municipal Bonds
(cost $82,235,169) | | | | | | 78,982,461 |
| | | | | | |
| | |
| ALLIANCEBERNSTEIN MUNICIPAL INCOME FUND • | | 75 |
Insured California Portfolio—Portfolio of Investments
| | | | | | |
| | | Principal
Amount
(000) | | U.S. $ Value |
| |
| | | | | | |
Short-Term Municipal Notes – 2.4% | | | | | | |
California – 2.4% | | | | | | |
Irvine Ca Asses Dist Frn Dd
Series 00
0.60%, 9/02/25(c)
(cost $2,000,000) | | $ | 2,000 | | $ | 2,000,000 |
| | | | | | |
| | |
Total Investments – 96.8%
(cost $84,235,169) | | | | | | 80,982,461 |
Other assets less liabilities – 3.2% | | | | | | 2,666,642 |
| | | | | | |
| | |
Net Assets – 100.0% | | | | | $ | 83,649,103 |
| | | | | | |
INTEREST RATE SWAP TRANSACTIONS (see Note D)
| | | | | | | | | | | | | | | |
| | | | | | | Rate Type | | | | |
Swap
Counterparty | | Notional
Amount
(000) | | Termination
Date | | Payments
made
by the
Portfolio | | | Payments
received
by the
Portfolio | | | Unrealized
Appreciation/
(Depreciation) | |
Citigroup | | $ | 900 | | 1/25/26 | | SIFMA | * | | 4.108 | % | | $ | 40,677 | |
Merrill Lynch | | | 3,100 | | 10/21/16 | | SIFMA | * | | 4.128 | % | | | 165,087 | |
Merrill Lynch | | | 700 | | 7/30/26 | | 4.090 | % | | SIFMA | * | | | (30,854 | ) |
Merrill Lynch | | | 1,600 | | 11/15/26 | | 4.377 | % | | SIFMA | * | | | (129,920 | ) |
| (a) | Variable rate coupon, rate shown as of October 31, 2008. |
| (b) | Inverse Floater Security—Security with variable or floating interest rate that moves in the opposite direction of short-term interest rates. |
| (c) | Variable Rate Demand Notes (VRDN) are instruments whose interest rates change on a specific date (such as coupon date or interest payment date) or whose interest rates vary with changes in a designated base rate (such as the prime interest rate). This instrument is payable on demand and is secured by letters of credit or other credit support agreements from major banks. |
| * | Variable interest rate based on the Securities Industry & Financial Markets Association (SIFMA). |
As of October 31, 2008, the Portfolio held 94% of net assets in insured bonds (of this amount 19% represents the Portfolio’s holding in pre-refunded insured bonds). 41% and 24% of the Portfolio’s insured bonds were insured by AMBAC and MBIA, respectively.
Glossary:
AMBAC – American Bond Assurance Corporation
COP – Certificate of Participation
ETM – Escrow to Maturity
FGIC – Financial Guaranty Insurance Company
FSA – Financial Security Assurance Inc.
HFA – Housing Finance Authority
MBIA – Municipal Bond Investors Assurance
MFHR – Multi-Family Housing Revenue
RADIAN – Radian Group, Inc.
XLCA – XL Capital Assurance Inc.
See notes to financial statements.
| | |
| 76 | | • ALLIANCEBERNSTEIN MUNICIPAL INCOME FUND |
Insured California Portfolio—Portfolio of Investments
STATEMENT OF ASSETS & LIABILITIES
October 31, 2008
| | | | | | | | |
| | | National | | | Insured
National | |
| Assets | | | | | | | | |
Investments in securities, at value (cost $522,563,607 and $141,900,327, respectively) | | $ | 474,104,153 | | | $ | 140,696,778 | |
Cash | | | 71,188 | | | | 197,389 | |
Interest receivable | | | 9,659,718 | | | | 1,935,615 | |
Receivable for capital stock sold | | | 1,499,573 | | | | 382,153 | |
Receivable for investment securities sold | | | 130,000 | | | | – 0 | – |
Unrealized appreciation of interest rate swap contracts | | | 105,575 | | | | 53,254 | |
| | | | | | | | |
Total assets | | | 485,570,207 | | | | 143,265,189 | |
| | | | | | | | |
| Liabilities | | | | | | | | |
Payable for capital stock redeemed | | | 1,263,860 | | | | 317,154 | |
Payable for investment securities purchased | | | 1,198,652 | | | | – 0 | – |
Dividends payable | | | 691,487 | | | | 162,135 | |
Distribution fee payable | | | 169,030 | | | | 45,238 | |
Advisory fee payable | | | 57,762 | | | | 52,801 | |
Administrative fee payable | | | 29,707 | | | | 29,930 | |
Transfer Agent fee payable | | | 13,824 | | | | 731 | |
Unrealized depreciation of interest rate swap contracts | | | – 0 | – | | | 313,192 | |
Accrued expenses | | | 86,047 | | | | 51,986 | |
| | | | | | | | |
Total liabilities | | | 3,510,369 | | | | 973,167 | |
| | | | | | | | |
Net Assets | | $ | 482,059,838 | | | $ | 142,292,022 | |
| | | | | | | | |
| Composition of Net Assets | | | | | | | | |
Capital stock, at par | | $ | 54,166 | | | $ | 14,931 | |
Additional paid-in capital | | | 554,399,570 | | | | 144,161,759 | |
Undistributed/(distributions in excess of) net investment income | | | (218,063 | ) | | | 218,343 | |
Accumulated net realized loss on investment transactions | | | (23,821,560 | ) | | | (639,524 | ) |
Net unrealized depreciation on investments | | | (48,354,275 | ) | | | (1,463,487 | ) |
| | | | | | | | |
| | $ | 482,059,838 | | | $ | 142,292,022 | |
| | | | | | | | |
See notes to financial statements.
| | |
| ALLIANCEBERNSTEIN MUNICIPAL INCOME FUND • | | 77 |
Statement of Assets & Liabilities
| | | | | | | | |
| | | New York | | | California | |
| Assets | | | | | | | | |
Investments in securities, at value (cost $484,866,801 and $693,021,338, respectively) | | $ | 457,808,782 | | | $ | 668,509,545 | |
Cash | | | 5,941,306 | | | | – 0 | – |
Interest receivable | | | 7,525,089 | | | | 9,350,086 | |
Receivable for capital stock sold | | | 2,156,433 | | | | 2,531,659 | |
Unrealized appreciation of interest rate swap contracts | | | 267,346 | | | | 404,767 | |
Receivable for investment securities sold | | | – 0 | – | | | 130,000 | |
| | | | | | | | |
Total assets | | | 473,698,956 | | | | 680,926,057 | |
| | | | | | | | |
| Liabilities | | | | | | | | |
Due to custodian | | | – 0 | – | | | 15,215 | |
Payable for capital stock redeemed | | | 2,144,980 | | | | 3,248,323 | |
Payable for investment securities purchased | | | 1,164,976 | | | | 1,666,935 | |
Dividends payable | | | 612,241 | | | | 920,646 | |
Distribution fee payable | | | 175,482 | | | | 241,662 | |
Unrealized depreciation of interest rate swap contracts | | | 174,628 | | | | 2,120,821 | |
Advisory fee payable | | | 106,529 | | | | 203,245 | |
Administrative fee payable | | | 29,684 | | | | 29,668 | |
Transfer Agent fee payable | | | 12,134 | | | | 11,353 | |
Accrued expenses | | | 65,617 | | | | 74,079 | |
| | | | | | | | |
Total liabilities | | | 4,486,271 | | | | 8,531,947 | |
| | | | | | | | |
Net Assets | | $ | 469,212,685 | | | $ | 672,394,110 | |
| | | | | | | | |
| Composition of Net Assets | | | | | | | | |
Capital stock, at par | | $ | 52,059 | | | $ | 68,299 | |
Additional paid-in capital | | | 507,417,527 | | | | 714,481,375 | |
Distributions in excess of net investment income | | | (378,391 | ) | | | (742,111 | ) |
Accumulated net realized loss on investment transactions | | | (10,913,209 | ) | | | (15,185,606 | ) |
Net unrealized depreciation on investments | | | (26,965,301 | ) | | | (26,227,847 | ) |
| | | | | | | | |
| | $ | 469,212,685 | | | $ | 672,394,110 | |
| | | | | | | | |
See notes to financial statements.
| | |
| 78 | | • ALLIANCEBERNSTEIN MUNICIPAL INCOME FUND |
Statement of Assets & Liabilities
| | | | |
| | | Insured
California | |
| Assets | | | | |
Investments in securities, at value (cost $84,235,169) | | $ | 80,982,461 | |
Cash | | | 3,947,310 | |
Interest receivable | | | 1,065,381 | |
Receivable for capital stock sold | | | 303,848 | |
Unrealized appreciation of interest rate swap contracts | | | 205,764 | |
| | | | |
Total assets | | | 86,504,764 | |
| | | | |
| Liabilities | | | | |
Payable for investment securities purchased | | | 2,002,814 | |
Payable for capital stock redeemed | | | 242,019 | |
Unrealized depreciation of interest rate swap contracts | | | 160,774 | |
Dividends payable | | | 100,553 | |
Advisory fee payable | | | 31,908 | |
Administrative fee payable | | | 30,292 | |
Distribution fee payable | | | 30,037 | |
Transfer Agent fee payable | | | 2,027 | |
Accrued expenses | | | 255,237 | |
| | | | |
Total liabilities | | | 2,855,661 | |
| | | | |
Net Assets | | $ | 83,649,103 | |
| | | | |
| Composition of Net Assets | | | | |
Capital stock, at par | | $ | 6,743 | |
Additional paid-in capital | | | 86,846,605 | |
Distributions in excess of net investment income | | | (99,161 | ) |
Accumulated net realized gain on investment transactions | | | 102,634 | |
Net unrealized depreciation on investments | | | (3,207,718 | ) |
| | | | |
| | $ | 83,649,103 | |
| | | | |
See notes to financial statements.
| | |
| ALLIANCEBERNSTEIN MUNICIPAL INCOME FUND • | | 79 |
Statement of Assets & Liabilities
Net Asset Value Per Share—45,350,000,000 shares of capital stock authorized, $.001 par value
| | | | | | | | | |
| | | Net Assets | | Shares
Outstanding | | Net Asset
Value | |
National Portfolio | | | | | | | | | |
| | |
| Class A | | $ | 401,886,184 | | 45,150,768 | | $ | 8.90 | * |
| | |
| Class B | | $ | 14,988,548 | | 1,685,781 | | $ | 8.89 | |
| | |
| Class C | | $ | 63,703,512 | | 7,162,706 | | $ | 8.89 | |
| | |
| Advisor Class | | $ | 1,481,594 | | 166,525 | | $ | 8.90 | |
| | |
| | | |
Insured National Portfolio | | | | | | | | | |
| | |
| Class A | | $ | 125,910,374 | | 13,208,426 | | $ | 9.53 | * |
| | |
| Class B | | $ | 3,450,143 | | 362,890 | | $ | 9.51 | |
| | |
| Class C | | $ | 12,931,505 | | 1,359,550 | | $ | 9.51 | |
| | |
| | | |
New York Portfolio | | | | | | | | | |
| | |
| Class A | | $ | 368,523,952 | | 40,880,203 | | $ | 9.01 | * |
| | |
| Class B | | $ | 46,000,156 | | 5,108,869 | | $ | 9.00 | |
| | |
| Class C | | $ | 49,820,904 | | 5,530,499 | | $ | 9.01 | |
| | |
| Advisor Class | | $ | 4,867,673 | | 539,927 | | $ | 9.02 | |
| | |
| | | |
California Portfolio | | | | | | | | | |
| | |
| Class A | | $ | 553,120,433 | | 56,181,736 | | $ | 9.85 | * |
| | |
| Class B | | $ | 16,412,744 | | 1,667,423 | | $ | 9.84 | |
| | |
| Class C | | $ | 101,125,760 | | 10,273,814 | | $ | 9.84 | |
| | |
| Advisor Class | | $ | 1,735,173 | | 176,191 | | $ | 9.85 | |
| | |
| | | |
Insured California Portfolio | | | | | | | | | |
| | |
| Class A | | $ | 68,811,180 | | 5,546,344 | | $ | 12.41 | * |
| | |
| Class B | | $ | 1,917,025 | | 154,580 | | $ | 12.40 | |
| | |
| Class C | | $ | 12,920,898 | | 1,042,139 | | $ | 12.40 | |
| | |
| * | The maximum offering price per share for Class A of National Portfolio, Insured National Portfolio, New York Portfolio, California Portfolio and Insured California Portfolio were $9.30, $9.95, $9.41, $10.29, $12.96, respectively, which reflects a sales charge of 4.25%. |
See notes to financial statements.
| | |
| 80 | | • ALLIANCEBERNSTEIN MUNICIPAL INCOME FUND |
Statement of Assets & Liabilities
STATEMENT OF OPERATIONS
Year Ended October 31, 2008
| | | | | | | | |
| | | National | | | Insured
National | |
| Investment Income | | | | | | | | |
Interest | | $ | 24,855,797 | | | $ | 6,939,141 | |
| | | | | | | | |
| Expenses | | | | | | | | |
Advisory fee (see Note B) | | | 2,243,000 | | | | 636,370 | |
Distribution fee—Class A | | | 1,241,691 | | | | 373,832 | |
Distribution fee—Class B | | | 200,377 | | | | 46,857 | |
Distribution fee—Class C | | | 643,392 | | | | 121,190 | |
Transfer agency—Class A | | | 230,089 | | | | 64,660 | |
Transfer agency—Class B | | | 14,674 | | | | 3,286 | |
Transfer agency—Class C | | | 39,109 | | | | 6,993 | |
Transfer agency—Advisor Class | | | 137 | | | | – 0 | – |
Custodian | | | 172,984 | | | | 120,780 | |
Registration fees | | | 110,824 | | | | 51,041 | |
Administrative | | | 94,932 | | | | 93,764 | |
Audit | | | 51,500 | | | | 50,712 | |
Printing | | | 32,515 | | | | 8,247 | |
Legal | | | 27,717 | | | | 36,267 | |
Directors’ fees | | | 10,537 | | | | 9,596 | |
Miscellaneous | | | 15,009 | | | | 8,859 | |
| | | | | | | | |
Total expenses | | | 5,128,487 | | | | 1,632,454 | |
Less: advisory fee waived (see Note B) | | | (1,143,603 | ) | | | (42,674 | ) |
Less: expense offset arrangement
(see Note B) | | | (5,334 | ) | | | (1,427 | ) |
| | | | | | | | |
Net expenses | | | 3,979,550 | | | | 1,588,353 | |
| | | | | | | | |
Net investment income | | | 20,876,247 | | | | 5,350,788 | |
| | | | | | | | |
| Realized and Unrealized Gain (Loss) on Investment Transactions | | | | | | | | |
Net realized gain (loss) on: | | | | | | | | |
Investment transactions | | | 196,731 | | | | (283,547 | ) |
Futures contracts | | | (119,256 | ) | | | (34,768 | ) |
Swap contracts | | | 344,924 | | | | 37,738 | |
Net change in unrealized
appreciation/depreciation of: | | | | | | | | |
Investments | | | (60,729,249 | ) | | | (8,232,177 | ) |
Swap contracts | | | (96,468 | ) | | | (196,248 | ) |
| | | | | | | | |
Net loss on investment transactions | | | (60,403,318 | ) | | | (8,709,002 | ) |
| | | | | | | | |
Net Decrease in Net Assets from Operations | | $ | (39,527,071 | ) | | $ | (3,358,214 | ) |
| | | | | | | | |
See notes to financial statements.
| | |
| ALLIANCEBERNSTEIN MUNICIPAL INCOME FUND • | | 81 |
Statement of Operations
| | | | | | | | |
| | | New York | | | California | |
| Investment Income | | | | | | | | |
Interest | | $ | 22,913,296 | | | $ | 37,251,334 | |
| | | | | | | | |
| Expenses | | | | | | | | |
Advisory fee (see Note B) | | | 2,172,556 | | | | 3,306,951 | |
Distribution fee—Class A | | | 1,109,636 | | | | 1,777,470 | |
Distribution fee—Class B | | | 620,900 | | | | 312,273 | |
Distribution fee—Class C | | | 502,586 | | | | 1,109,766 | |
Transfer agency—Class A | | | 174,404 | | | | 211,769 | |
Transfer agency—Class B | | | 39,179 | | | | 15,417 | |
Transfer agency—Class C | | | 25,514 | | | | 43,346 | |
Transfer agency—Advisor Class | | | 215 | | | | 75 | |
Custodian | | | 165,898 | | | | 208,854 | |
Administrative | | | 94,478 | | | | 96,522 | |
Audit | | | 50,694 | | | | 50,213 | |
Legal | | | 29,236 | | | | 31,318 | |
Printing | | | 24,180 | | | | 38,247 | |
Registration fees | | | 19,678 | | | | 20,715 | |
Directors’ fees | | | 10,390 | | | | 6,625 | |
Miscellaneous | | | 16,084 | | | | 26,068 | |
| | | | | | | | |
Total expenses | | | 5,055,628 | | | | 7,255,629 | |
Less: advisory fee waived (see Note B) | | | (1,466,127 | ) | | | (597,677 | ) |
Less: expense offset arrangement
(see Note B) | | | (4,566 | ) | | | (4,516 | ) |
| | | | | | | | |
Net expenses | | | 3,584,935 | | | | 6,653,436 | |
| | | | | | | | |
Net investment income | | | 19,328,361 | | | | 30,597,898 | |
| | | | | | | | |
| Realized and Unrealized Gain (Loss) on Investment Transactions | | | | | | | | |
Net realized gain (loss) on: | | | | | | | | |
Investment transactions | | | 209,087 | | | | (93,008 | ) |
Futures contracts | | | (125,471 | ) | | | (197,529 | ) |
Swap contracts | | | 390,830 | | | | 125,686 | |
Net change in unrealized
appreciation/depreciation of: | | | | | | | | |
Investments | | | (42,076,012 | ) | | | (70,975,923 | ) |
Swap contracts | | | (189,957 | ) | | | (1,273,841 | ) |
| | | | | | | | |
Net loss on investment transactions | | | (41,791,523 | ) | | | (72,414,615 | ) |
| | | | | | | | |
Net Decrease in Net Assets from Operations | | $ | (22,463,162 | ) | | $ | (41,816,717 | ) |
| | | | | | | | |
See notes to financial statements.
| | |
| 82 | | • ALLIANCEBERNSTEIN MUNICIPAL INCOME FUND |
Statement of Operations
| | | | |
| | | Insured
California | |
| Investment Income | | | | |
Interest | | $ | 4,544,579 | |
| | | | |
| Expenses | | | | |
Advisory fee (see Note B) | | | 429,584 | |
Distribution fee—Class A | | | 234,008 | |
Distribution fee—Class B | | | 37,208 | |
Distribution fee—Class C | | | 137,395 | |
Transfer agency—Class A | | | 24,795 | |
Transfer agency—Class B | | | 1,749 | |
Transfer agency—Class C | | | 4,655 | |
Merger related fees | | | 205,000 | |
Custodian | | | 126,322 | |
Administrative | | | 93,579 | |
Audit | | | 53,366 | |
Legal | | | 32,377 | |
Registration fees | | | 15,262 | |
Directors’ fees | | | 9,566 | |
Printing | | | 5,124 | |
Miscellaneous | | | 9,760 | |
| | | | |
Total expenses | | | 1,419,750 | |
Less: expense offset arrangement (see Note B) | | | (636 | ) |
| | | | |
Net expenses | | | 1,419,114 | |
| | | | |
Net investment income | | | 3,125,465 | |
| | | | |
| Realized and Unrealized Gain (Loss) on Investment Transactions | | | | |
Net realized gain (loss) on: | | | | |
Investment transactions | | | 62,887 | |
Futures contracts | | | (27,968 | ) |
Swap contracts | | | 104,294 | |
Net change in unrealized appreciation/depreciation of: | | | | |
Investments | | | (7,907,621 | ) |
Swap contracts | | | (41,732 | ) |
| | | | |
Net loss on investment transactions | | | (7,810,140 | ) |
| | | | |
Net Decrease in Net Assets from Operations | | $ | (4,684,675 | ) |
| | | | |
See notes to financial statements.
| | |
| ALLIANCEBERNSTEIN MUNICIPAL INCOME FUND • | | 83 |
Statement of Operations
STATEMENT OF CHANGES IN NET ASSETS
| | | | | | | | |
| | | National | |
| | | Year Ended
October 31,
2008 | | | Year Ended
October 31,
2007 | |
Increase (Decrease) in Net Assets
from Operations | | | | | | | | |
Net investment income | | $ | 20,876,247 | | | $ | 18,822,001 | |
Net realized gain on investment transactions | | | 422,399 | | | | 1,803,968 | |
Net change in unrealized appreciation/depreciation of investments | | | (60,825,717 | ) | | | (10,396,541 | ) |
| | | | | | | | |
Net increase (decrease) in net assets from operations | | | (39,527,071 | ) | | | 10,229,428 | |
| Dividends to Shareholders from | | | | | | | | |
Net investment income | | | | | | | | |
Class A | | | (17,862,958 | ) | | | (15,320,135 | ) |
Class B | | | (724,591 | ) | | | (1,183,292 | ) |
Class C | | | (2,331,399 | ) | | | (2,249,586 | ) |
Advisor Class | | | (8,851 | ) | | | – 0 | – |
| Capital Stock Transactions | | | | | | | | |
Net increase | | | 94,866,571 | | | | 6,429,782 | |
| Capital Contributions | | | | | | | | |
Proceeds from third party regulatory settlement (see Note E) | | | 2,177 | | | | 10,166 | |
| | | | | | | | |
Total increase (decrease) | | | 34,413,878 | | | | (2,083,637 | ) |
| Net Assets | | | | | | | | |
Beginning of period | | | 447,645,960 | | | | 449,729,597 | |
| | | | | | | | |
End of period (including distributions in excess of net investment income of ($218,063) and ($203,841), respectively) | | $ | 482,059,838 | | | $ | 447,645,960 | |
| | | | | | | | |
See notes to financial statements.
| | |
| 84 | | • ALLIANCEBERNSTEIN MUNICIPAL INCOME FUND |
Statement of Changes in Net Assets
| | | | | | | | |
| | | Insured National | |
| | | Year Ended
October 31,
2008 | | | Year Ended
October 31,
2007 | |
Increase (Decrease) in Net Assets
from Operations | | | | | | | | |
Net investment income | | $ | 5,350,788 | | | $ | 5,476,261 | |
Net realized gain (loss) on investment transactions | | | (280,577 | ) | | | 768,937 | |
Net change in unrealized appreciation/depreciation of investments | | | (8,428,425 | ) | | | (3,006,798 | ) |
| | | | | | | | |
Net increase (decrease) in net assets from operations | | | (3,358,214 | ) | | | 3,238,400 | |
| Dividends to Shareholders from | | | | | | | | |
Net investment income | | | | | | | | |
Class A | | | (4,765,462 | ) | | | (4,771,707 | ) |
Class B | | | (147,037 | ) | | | (304,144 | ) |
Class C | | | (379,626 | ) | | | (353,557 | ) |
| Capital Stock Transactions | | | | | | | | |
Net increase (decrease) | | | 16,778,356 | | | | (11,366,252 | ) |
| | | | | | | | |
Total increase (decrease) | | | 8,128,017 | | | | (13,557,260 | ) |
| Net Assets | | | | | | | | |
Beginning of period | | | 134,164,005 | | | | 147,721,265 | |
| | | | | | | | |
End of period (including undistributed net investment income of $218,343 and $220,718, respectively) | | $ | 142,292,022 | | | $ | 134,164,005 | |
| | | | | | | | |
See notes to financial statements.
| | |
| ALLIANCEBERNSTEIN MUNICIPAL INCOME FUND • | | 85 |
Statement of Changes in Net Assets
| | | | | | | | |
| | | New York | |
| | | Year Ended
October 31,
2008 | | | Year Ended
October 31,
2007 | |
Increase (Decrease) in Net Assets
from Operations | | | | | | | | |
Net investment income | | $ | 19,328,361 | | | $ | 18,583,548 | |
Net realized gain (loss) on investment transactions | | | 474,446 | | | | (9,395 | ) |
Net change in unrealized appreciation/depreciation of investments | | | (42,265,969 | ) | | | (7,728,392 | ) |
| | | | | | | | |
Net increase (decrease) in net assets from operations | | | (22,463,162 | ) | | | 10,845,761 | |
| Dividends to Shareholders from | | | | | | | | |
Net investment income | | | | | | | | |
Class A | | | (15,447,215 | ) | | | (13,544,965 | ) |
Class B | | | (2,156,261 | ) | | | (3,376,635 | ) |
Class C | | | (1,748,224 | ) | | | (1,612,235 | ) |
Advisor Class | | | (27,897 | ) | | | – 0 | – |
| Capital Stock Transactions | | | | | | | | |
Net increase | | | 33,419,145 | | | | 2,594,723 | |
| | | | | | | | |
Total decrease | | | (8,423,614 | ) | | | (5,093,351 | ) |
| Net Assets | | | | | | | | |
Beginning of period | | | 477,636,299 | | | | 482,729,650 | |
| | | | | | | | |
End of period (including distributions in excess of net investment income of ($378,391) and ($382,862), respectively) | | $ | 469,212,685 | | | $ | 477,636,299 | |
| | | | | | | | |
See notes to financial statements.
| | |
| 86 | | • ALLIANCEBERNSTEIN MUNICIPAL INCOME FUND |
Statement of Changes in Net Assets
| | | | | | | | |
| | | California | |
| | | Year Ended
October 31,
2008 | | | Year Ended
October 31,
2007 | |
Increase (Decrease) in Net Assets
from Operations | | | | | | | | |
Net investment income | | $ | 30,597,898 | | | $ | 31,296,031 | |
Net realized gain (loss) on investment transactions | | | (164,851 | ) | | | 3,100,022 | |
Net change in unrealized appreciation/depreciation of investments | | | (72,249,764 | ) | | | (17,449,810 | ) |
| | | | | | | | |
Net increase (decrease) in net assets from operations | | | (41,816,717 | ) | | | 16,946,243 | |
| Dividends to Shareholders from | | | | | | | | |
Net investment income | | | | | | | | |
Class A | | | (25,140,157 | ) | | | (24,791,280 | ) |
Class B | | | (1,098,220 | ) | | | (2,221,530 | ) |
Class C | | | (3,930,686 | ) | | | (4,008,352 | ) |
Advisor Class | | | (9,206 | ) | | | – 0 | – |
| Capital Stock Transactions | | | | | | | | |
Net decrease | | | (4,929,015 | ) | | | (32,416,454 | ) |
| | | | | | | | |
Total decrease | | | (76,924,001 | ) | | | (46,491,373 | ) |
| Net Assets | | | | | | | | |
Beginning of period | | | 749,318,111 | | | | 795,809,484 | |
| | | | | | | | |
End of period (including distributions in excess of net investment income of ($742,111) and ($738,583), respectively) | | $ | 672,394,110 | | | $ | 749,318,111 | |
| | | | | | | | |
See notes to financial statements.
| | |
| ALLIANCEBERNSTEIN MUNICIPAL INCOME FUND • | | 87 |
Statement of Changes in Net Assets
| | | | | | | | |
| | | Insured California | |
| | | Year Ended
October 31,
2008 | | | Year Ended
October 31,
2007 | |
Increase (Decrease) in Net Assets
from Operations | | | | | | | | |
Net investment income | | $ | 3,125,465 | | | $ | 3,744,924 | |
Net realized gain on investment
transactions | | | 139,213 | | | | 509,556 | |
Net change in unrealized appreciation/depreciation of investments | | | (7,949,353 | ) | | | (2,083,399 | ) |
| | | | | | | | |
Net increase (decrease) in net assets from operations | | | (4,684,675 | ) | | | 2,171,081 | |
Dividends and Distributions to
Shareholders from | | | | | | | | |
Net investment income | | | | | | | | |
Class A | | | (2,844,832 | ) | | | (3,061,927 | ) |
Class B | | | (108,184 | ) | | | (239,472 | ) |
Class C | | | (405,182 | ) | | | (427,742 | ) |
Net realized gain on investment
transactions | | | | | | | | |
Class A | | | (422,083 | ) | | | (995,859 | ) |
Class B | | | (24,199 | ) | | | (114,063 | ) |
Class C | | | (70,498 | ) | | | (179,622 | ) |
| Capital Stock Transactions | | | | | | | | |
Net decrease | | | (13,375,386 | ) | | | (8,265,941 | ) |
| | | | | | | | |
Total decrease | | | (21,935,039 | ) | | | (11,113,545 | ) |
| Net Assets | | | | | | | | |
Beginning of period | | | 105,584,142 | | | | 116,697,687 | |
| | | | | | | | |
End of period (including distributions in
excess of net investment income of
($99,161) and ($88,332), respectively) | | $ | 83,649,103 | | | $ | 105,584,142 | |
| | | | | | | | |
See notes to financial statements.
| | |
| 88 | | • ALLIANCEBERNSTEIN MUNICIPAL INCOME FUND |
Statement of Changes in Net Assets
NOTES TO FINANCIAL STATEMENTS
October 31, 2008
NOTE A
Significant Accounting Policies
AllianceBernstein Municipal Income Fund, Inc. (the “Fund”) is registered under the Investment Company Act of 1940 as an open-end management investment company. The Fund, which is a Maryland corporation, operates as a series company currently comprised of the diversified National Portfolio, Insured National Portfolio, New York Portfolio and California Portfolio and the non-diversified Insured California Portfolio (the “Portfolios”). Each series is considered to be a separate entity for financial reporting and tax purposes. Each Portfolio offers the following classes of shares: Class A, Class B, and Class C. Effective August 6, 2008, National Portfolio, New York Portfolio and California Portfolio also offers Advisor Class Shares. Class A shares are sold with a front-end sales charge of up to 4.25% for purchases not exceeding $1,000,000. With respect to purchases of $1,000,000 or more, Class A shares redeemed within one year of purchase may be subject to a contingent deferred sales charge of 1%. Class B shares are currently sold with a contingent deferred sales charge which declines from 3% to zero depending on the period of time the shares are held. Class B shares will automatically convert to Class A shares six years after the end of the calendar month of purchase. Class C shares are subject to a contingent deferred sales charge of 1% on redemptions made within the first year after purchase. Advisor Class shares are sold without any initial or contingent deferred sales charge and are not subject to ongoing distribution expenses. All four classes of shares have identical voting, dividend, liquidation and other rights, except that the classes bear different distribution and transfer agency expenses. Each class has exclusive voting rights with respect to its distribution plan. The financial statements have been prepared in conformity with U.S. generally accepted accounting principles which require management to make certain estimates and assumptions that affect the reported amounts of assets and liabilities in the financial statements and amounts of income and expenses during the reporting period. Actual results could differ from those estimates. The following is a summary of significant accounting policies followed by the Fund.
1. Security Valuation
Portfolio securities are valued at their current market value determined on the basis of market quotations or, if market quotations are not readily available or are deemed unreliable, at “fair value” as determined in accordance with procedures established by and under the general supervision of the Fund’s Board of Directors.
In general, the market value of securities which are readily available and deemed reliable are determined as follows. Securities listed on a national securities exchange (other than securities listed on the NASDAQ Stock Market, Inc. (“NASDAQ”)) or on a foreign securities exchange are valued at the last sale price at the close of the exchange or foreign securities exchange. If there has been no sale on such day, the securities are valued at the mean of the closing bid and asked prices on such day. Securities listed on more than one exchange are valued by reference to the principal exchange on which the securities are traded;
| | |
| ALLIANCEBERNSTEIN MUNICIPAL INCOME FUND • | | 89 |
Notes to Financial Statements
securities listed only on NASDAQ are valued in accordance with the NASDAQ Official Closing Price; listed put or call options are valued at the last sale price. If there has been no sale on that day, such securities will be valued at the closing bid prices on that day; open futures contracts and options thereon are valued using the closing settlement price or, in the absence of such a price, the most recent quoted bid price. If there are no quotations available for the day of valuation, the last available closing settlement price is used; securities traded in the over-the-counter market (“OTC”) are valued at the mean of the current bid and asked prices as reported by the National Quotation Bureau or other comparable sources; U.S. government securities and other debt instruments having 60 days or less remaining until maturity are valued at amortized cost if their original maturity was 60 days or less; or by amortizing their fair value as of the 61st day prior to maturity if their original term to maturity exceeded 60 days; fixed-income securities, including mortgage backed and asset backed securities, may be valued on the basis of prices provided by a pricing service or at a price obtained from one or more of the major broker/dealers. In cases where broker/dealer quotes are obtained, AllianceBernstein L.P. (the “Adviser”) may establish procedures whereby changes in market yields or spreads are used to adjust, on a daily basis, a recently obtained quoted price on a security; and OTC and other derivatives are valued on the basis of a quoted bid price or spread from a major broker/dealer in such security. Investments in money market funds are valued at their net asset value each day.
Securities for which market quotations are not readily available (including restricted securities) or are deemed unreliable are valued at fair value. Factors considered in making this determination may include, but are not limited to, information obtained by contacting the issuer, analysts, analysis of the issuer’s financial statements or other available documents. In addition, the Fund may use fair value pricing for securities primarily traded in non-U.S. markets because most foreign markets close well before the Fund values its securities at 4:00 p.m., Eastern Time. The earlier close of these foreign markets gives rise to the possibility that significant events, including broad market moves, may have occurred in the interim and may materially affect the value of those securities.
2. Taxes
It is each Portfolios’ policy to meet the requirements of the Internal Revenue Code applicable to regulated investment companies and to distribute all of its investment company taxable income and net realized gains, if any, to shareholders. Therefore, no provisions for federal income or excise taxes are required.
In accordance with the Financial Accounting Standards Board (“FASB”) Interpretation No. 48, “Accounting for Uncertainties in Income Taxes” (“FIN 48”), management has analyzed the Portfolios’ tax positions taken on federal and state income tax returns for all open tax years (the current and the prior three tax years) and has concluded that no provision for income tax is required in the Portfolios’ financial statements.
| | |
| 90 | | • ALLIANCEBERNSTEIN MUNICIPAL INCOME FUND |
Notes to Financial Statements
3. Investment Income and Investment Transactions
Interest income is accrued daily. Investment transactions are accounted for on the date the securities are purchased or sold. Each portfolio may buy and sell securities from other affiliated funds in accordance with the requirements of Rule 17a-7 of the Investment Company Act of 1940. Each Portfolio has adopted procedures to ensure that all such transactions are done in accordance with the requirements of Rule 17a-7. Investment gains and losses are determined on the identified cost basis. The Portfolios amortize premiums and accrete original issue discount and market discount as adjustments to interest income.
The New York, Insured California and California Portfolios follow an investment policy of investing primarily in municipal obligations of one state. Economic changes affecting the state and certain of its public bodies and municipalities may affect the ability of issuers within the state to pay interest on, or repay principal of, municipal obligations held by the Portfolios.
4. Class Allocations
All income earned and expenses incurred by the Portfolios are borne on a pro-rata basis by each settled class of shares, based on the proportionate interest in each Portfolio represented by the net assets of such class, except for class specific expenses which are allocated to the respective class. Expenses of the Fund are charged to each Portfolio in proportion to net assets. Realized and unrealized gains and losses are allocated among the various share classes based on respective net assets.
5. Dividends and Distributions
Dividends and distributions to shareholders, if any, are recorded on the ex-dividend date. Income dividends and capital gains distributions are determined in accordance with federal tax regulations and may differ from those determined in accordance with U.S. generally accepted accounting principles. To the extent these differences are permanent, such amounts are reclassified within the capital accounts based on their federal tax basis treatment; temporary differences do not require such reclassification.
NOTE B
Advisory Fee and Other Transactions with Affiliates
Under the terms of the investment advisory agreement, the Fund pays the Adviser an advisory fee at an annual rate of .45% of the first $2.5 billion, .40% of the next $2.5 billion and .35% in excess of $5 billion, of each Portfolio’s average daily net assets. Such fee is accrued daily and paid monthly.
| | |
| ALLIANCEBERNSTEIN MUNICIPAL INCOME FUND • | | 91 |
Notes to Financial Statements
Effective June 16, 2004, the Adviser has agreed to waive its fees and bear certain expenses to the extent necessary to limit the total portfolio operating expenses on an annual basis as follows:
| | | | | | | | |
| Portfolio | | Class A | | Class B | | Class C | | Advisor
Class(a) |
National | | .68% | | 1.38% | | 1.38% | | .38% |
Insured National | | 1.04% | | 1.74% | | 1.74% | | N/A |
New York | | .58% | | 1.28% | | 1.28% | | .28% |
California | | .77% | | 1.47% | | 1.47% | | .47% |
(a) | Commenced distributions on August 6, 2008. |
For the year ended October 31, 2008, such reimbursement waivers amounted to $1,143,603, $42,674, $1,466,127 and $597,677 for National, Insured National, New York and California Portfolios, respectively.
Pursuant to the investment advisory agreement, the Portfolios paid to the Adviser: National Portfolio, $94,932; Insured National Portfolio, $93,764; New York Portfolio, $94,478; California Portfolio, $96,522 and Insured California Portfolio, $93,579 representing the cost of certain legal and accounting services provided to each Portfolio by the Adviser for the year ended October 31, 2008.
The Portfolios compensate AllianceBernstein Investor Services, Inc. (“ABIS”), a wholly-owned subsidiary of the Adviser, under a Transfer Agency Agreement for providing personnel and facilities to perform transfer agency services for the Portfolios. ABIS may make payments to intermediaries that provide omnibus account services, sub-accounting services and/or networking services. Such compensation retained by ABIS amounted to: National Portfolio, $166,436; Insured National Portfolio, $44,687; New York Portfolio, $140,166; California Portfolio, $135,397 and Insured California Portfolio, $19,802 for the year ended October 31, 2008.
For the year ended October 31, 2008, the Portfolios’ expenses were reduced by: National Portfolio, $5,334; Insured National Portfolio, $1,427; New York Portfolio, $4,566; California Portfolio, $4,516 and Insured California Portfolio, $636 under an expense offset arrangement with ABIS.
AllianceBernstein Investments, Inc. (the “Distributor”), a wholly-owned subsidiary of the Adviser, serves as the distributor of the Fund’s shares. The Distributor has advised the Fund that it has retained front-end sales charges from the sale of Class A shares and received contingent deferred sales charges imposed upon redemptions by shareholders of Class A, Class B and Class C shares for each Portfolio for the year ended October 31, 2008 as follows:
| | | | | | | | | | | | | |
| | | Front-End Sales
Charges | | Contingent Deferred Sales
Charges |
| Portfolio | | Class A | | Class A | | | Class B | | Class C |
National | | $ | 41,671 | | $ | 24,996 | | | $ | 8,764 | | $ | 22,700 |
Insured National | | | 10,671 | | | 4,872 | | | | 36,017 | | | 439 |
New York | | | 43,027 | | | 19,304 | | | | 56,151 | | | 13,147 |
California | | | 35,856 | | | 65,171 | | | | 4,284 | | | 7,287 |
Insured California | | | 4,440 | | | – 0 | – | | | 621 | | | 432 |
| | |
| 92 | | • ALLIANCEBERNSTEIN MUNICIPAL INCOME FUND |
Notes to Financial Statements
NOTE C
Distribution Services Agreement
The Fund has adopted a Distribution Services Agreement (the “Agreement”) pursuant to Rule 12b-1 under the Investment Company Act of 1940. Under the Agreement, the Portfolio pays distribution and servicing fees to the Distributor at an annual rate of .30 of 1% of the Portfolios’ average daily net assets attributable to Class A shares and 1% of the Portfolios’ average daily net assets attributable to both Class B and Class C shares. There are no distribution and servicing fees on the Advisor Class shares. The fees are accrued daily and paid monthly. The Agreement provides that the Distributor will use such payments in their entirety for distribution assistance and promotional activities. The distributor has incurred expenses in excess of the distribution costs reimbursed by each Portfolio as follows:
| | | | | | |
| Portfolio | | Class B | | Class C |
National | | $ | 3,777,548 | | $ | 5,147,313 |
Insured National | | | 3,545,321 | | | 2,104,082 |
New York | | | 6,788,906 | | | 3,122,906 |
California | | | 6,626,217 | | | 6,177,645 |
Insured California | | | 3,040,244 | | | 2,076,803 |
While such costs may be recovered from the Portfolios in future periods so long as the Agreement is in effect, the rate of the distribution and servicing fees payable under the Agreement may not be increased without a shareholder vote. In accordance with the Agreement, there is no provision for recovery of unreimbursed distribution costs incurred by the Distributor beyond the current fiscal year for Class A shares. The Agreement also provides that the Adviser may use its own resources to finance the distribution of the Portfolios’ shares.
NOTE D
Investment Transactions
Purchases and sales of investment securities (excluding short-term investments) for the year ended October 31, 2008, were as follows:
| | | | | | |
| Portfolio | | Purchases | | Sales |
National | | $ | 219,309,055 | | $ | 112,555,436 |
Insured National | | | 48,725,166 | | | 38,180,232 |
New York | | | 80,093,779 | | | 47,327,707 |
California | | | 18,975,492 | | | 17,625,344 |
Insured California | | | 1,890,000 | | | 18,277,066 |
There were no purchases or sales of U.S. government and government agency obligations for the year ended October 31, 2008.
| | |
| ALLIANCEBERNSTEIN MUNICIPAL INCOME FUND • | | 93 |
Notes to Financial Statements
The cost of investments for federal income tax purposes, gross unrealized appreciation and unrealized depreciation (excluding swap transactions) are as follows:
| | | | | | | | | | | | | | |
| | | | | Gross Unrealized | | | Net
Unrealized
(Depreciation) | |
Portfolio | | Cost | | Appreciation | | (Depreciation) | | |
National | | $ | 522,925,312 | | $ | 3,038,944 | | $ | (51,860,103 | ) | | $ | (48,821,159 | ) |
Insured National | | | 141,900,327 | | | 4,075,814 | | | (5,279,363 | ) | | | (1,203,549 | ) |
New York | | | 485,034,378 | | | 6,031,782 | | | (33,257,378 | ) | | | (27,225,596 | ) |
California | | | 693,292,914 | | | 22,131,209 | | | (46,914,578 | ) | | | (24,783,369 | ) |
Insured California | | | 84,235,169 | | | 1,610,493 | | | (4,863,200 | ) | | | (3,252,707 | ) |
1. Financial Futures Contracts
The Fund may buy or sell financial futures contracts for the purpose of hedging its portfolio against adverse effects of anticipated movements in the market. The Fund bears the market risk that arises from changes in the value of these financial instruments and the imperfect correlation between movements in the price of the futures contracts and movements in the price of the securities hedged or used for cover.
At the time the Fund enters into a futures contract, the Fund deposits and maintains as collateral an initial margin with the broker, as required by the exchange on which the transaction is effected. Pursuant to the contract, the Fund agrees to receive from or pay to the broker an amount of cash equal to the daily fluctuation in the value of the contract. Such receipts or payments are known as variation margin and are recorded by the Fund as unrealized gains or losses. Risks may arise from the potential inability of a counterparty to meet the terms of the contract. When the contract is closed, the Fund records a realized gain or loss equal to the difference between the value of the contract at the time it was opened and the time it was closed.
2. Swap Agreements
The Fund may enter into swaps to hedge its exposure to interest rates and credit risk or for investment purposes. A swap is an agreement that obligates two parties to exchange a series of cash flows at specified intervals based upon or calculated by reference to changes in specified prices or rates for a specified amount of an underlying asset. The payment flows are usually netted against each other, with the difference being paid by one party to the other.
Risks may arise as a result of the failure of the counterparty to the swap contract to comply with the terms of the swap contract. The loss incurred by the failure of a counterparty is generally limited to the net interim payment to be received by the Fund, and/or the termination value at the end of the contract. Therefore, the Fund considers the creditworthiness of each counterparty to a swap contract in evaluating potential credit risk. Additionally, risks may arise from unanticipated movements in interest rates or in the value of the underlying securities.
The Fund accrues for the interim payments on swap contracts on a daily basis, with the net amount recorded within unrealized appreciation/depreciation of swap contracts on the statement of assets and liabilities. Once the interim
| | |
| 94 | | • ALLIANCEBERNSTEIN MUNICIPAL INCOME FUND |
Notes to Financial Statements
payments are settled in cash, the net amount is recorded as realized gain/loss on swaps, in addition to realized gain/loss recorded upon termination of swap contracts on the statement of operations. Fluctuations in the value of swap contracts are recorded as a component of net change in unrealized appreciation/depreciation of investments.
NOTE E
Capital Stock
The Fund has allocated 9,100,000,000 of authorized shares each to the National Portfolio and Insured National Portfolio of which 3,000,000,000 is allocated to each of Class A, Class B and Class C shares and 100,000,000 is allocated to Advisor Class shares and 9,050,000,000 each of authorized shares to the New York Portfolio, California Portfolio and Insured California Portfolio of which 3,000,000,000 is allocated to each of Class A, Class B and Class C shares and 50,000,000 is allocated to Advisor Class shares. Transactions in capital shares for each class were as follows:
| | | | | | | | | | | | | | | | | | |
| | | | | | | | | | | | | | | | | | |
| | | Shares | | | | | Amount | | | |
| | | Year Ended
October 31,
2008 | | | Year Ended
October 31,
2007 | | | | | Year Ended
October 31,
2008 | | | Year Ended
October 31,
2007 | | | |
| | | | | |
| National Portfolio* | | | | | | | | | | | | | | | | | | |
| Class A | | | | | | | | | | | | | | | | | | |
Shares sold | | 16,205,028 | | | 5,004,964 | | | | | $ | 158,987,627 | | | $ | 50,536,910 | | | |
| | | | |
Shares issued in reinvestment of dividends | | 1,091,999 | | | 840,876 | | | | | | 10,565,102 | | | | 8,498,439 | | | |
| | | | |
Shares converted from Class B | | 779,312 | | | 1,002,435 | | | | | | 7,573,059 | | | | 10,120,115 | | | |
| | | | |
Shares redeemed | | (8,998,669 | ) | | (5,008,770 | ) | | | | | (86,518,392 | ) | | | (50,622,785 | ) | | |
| | | | |
Net increase | | 9,077,670 | | | 1,839,505 | | | | | $ | 90,607,396 | | | $ | 18,532,679 | | | |
| | | | |
| | | | | | | | | | | | | | | | | | |
| Class B | | | | | | | | | | | | | | | | | | |
Shares sold | | 393,900 | | | 416,933 | | | | | $ | 3,815,329 | | | $ | 4,216,929 | | | |
| | | | |
Shares issued in reinvestment of dividends | | 42,131 | | | 68,094 | | | | | | 409,237 | | | | 688,262 | | | |
| | | | |
Shares converted to Class A | | (780,177 | ) | | (1,003,487 | ) | | | | | (7,573,059 | ) | | | (10,120,115 | ) | | |
| | | | |
Shares redeemed | | (499,333 | ) | | (615,715 | ) | | | | | (4,868,688 | ) | | | (6,221,228 | ) | | |
| | | | |
Net decrease | | (843,479 | ) | | (1,134,175 | ) | | | | $ | (8,217,181 | ) | | $ | (11,436,152 | ) | | |
| | | | |
| | | | | | | | | | | | | | | | | | |
| Class C | | | | | | | | | | | | | | | | | | |
Shares sold | | 2,191,949 | | | 785,190 | | | | | $ | 21,271,823 | | | $ | 7,918,699 | | | |
| | | | |
Shares issued in reinvestment of dividends | | 153,205 | | | 131,224 | | | | | | 1,480,232 | | | | 1,325,544 | | | |
| | | | |
Shares redeemed | | (1,232,242 | ) | | (981,470 | ) | | | | | (11,857,316 | ) | | | (9,910,988 | ) | | |
| | | | |
Net increase (decrease) | | 1,112,912 | | | (65,056 | ) | | | | $ | 10,894,739 | | | $ | (666,745 | ) | | |
| | | | |
| | |
| ALLIANCEBERNSTEIN MUNICIPAL INCOME FUND • | | 95 |
Notes to Financial Statements
| | | | | | | | | | | | | | | |
| | | | | | | | | | | | | | | |
| | | Shares | | | | Amount | | |
| | | August 6,
2008(a) to,
October 31,
2008 | | | | | | | August 6,
2008(a) to,
October 31,
2008 | | | | | |
| | | | |
| National Portfolio* | | | | | | | | | | | | | | | |
| Advisor Class | | | | | | | | | | | | | | | |
Shares sold | | 188,177 | | | | | | | $ | 1,770,250 | | | | | |
| | | |
Shares issued in reinvestment of dividends | | 418 | | | | | | | | 3,606 | | | | | |
| | | |
Shares redeemed | | (22,070 | ) | | | | | | | (192,239 | ) | | | | |
| | | |
Net increase | | 166,525 | | | | | | | $ | 1,581,617 | | | | | |
| | | |
| * | For the year ended October 31, 2008 and the year ended October 31, 2007, the Portfolio received $2,177 and $10,166, respectively, related to a third-party’s settlement of regulatory proceedings involving allegations of improper trading. These amounts are presented in the Portfolio’s statement of changes in net assets. Neither the Portfolio nor its affiliates were involved in the proceedings or the calculation of the payment. |
(a) | Commencement of distributions. |
| | | | | | | | | | | | | | | | | | |
| | | | | | | | | | | | | | | | | | |
| | | Shares | | | | | Amount | | | |
| | | Year Ended
October 31,
2008 | | | Year Ended
October 31,
2007 | | | | | Year Ended
October 31,
2008 | | | Year Ended
October 31,
2007 | | | |
| | | | | |
| Insured National Portfolio | | | | | | | | | | | | | | | | | | |
| Class A | | | | | | | | | | | | | | | | | | |
Shares sold | | 2,972,228 | | | 1,252,074 | | | | | $ | 29,588,596 | | | $ | 12,733,841 | | | |
| | | | |
Shares issued in reinvestment of dividends | | 257,086 | | | 245,756 | | | | | | 2,554,204 | | | | 2,500,018 | | | |
| | | | |
Shares converted from Class B | | 261,170 | | | 332,456 | | | | | | 2,612,521 | | | | 3,375,982 | | | |
| | | | |
Shares redeemed | | (1,833,538 | ) | | (2,442,457 | ) | | | | | (18,013,006 | ) | | | (24,863,214 | ) | | |
| | | | |
Net increase (decrease) | | 1,656,946 | | | (612,171 | ) | | | | $ | 16,742,315 | | | $ | (6,253,373 | ) | | |
| | | | |
| | | | | | | | | | | | | | | | | | |
| Class B | | | | | | | | | | | | | | | | | | |
Shares sold | | 100,754 | | | 37,415 | | | | | $ | 986,942 | | | $ | 377,209 | | | |
| | | | |
Shares issued in reinvestment of dividends | | 9,288 | | | 18,370 | | | | | | 92,412 | | | | 186,543 | | | |
| | | | |
Shares converted to Class A | | (261,803 | ) | | (333,225 | ) | | | | | (2,612,521 | ) | | | (3,375,982 | ) | | |
| | | | |
Shares redeemed | | (124,603 | ) | | (203,372 | ) | | | | | (1,229,254 | ) | | | (2,064,993 | ) | | |
| | | | |
Net decrease | | (276,364 | ) | | (480,812 | ) | | | | $ | (2,762,421 | ) | | $ | (4,877,223 | ) | | |
| | | | |
| | | | | | | | | | | | | | | | | | |
| Class C | | | | | | | | | | | | | | | | | | |
Shares sold | | 504,749 | | | 103,621 | | | | | $ | 4,985,073 | | | $ | 1,048,501 | | | |
| | | | |
Shares issued in reinvestment of dividends | | 22,133 | | | 18,632 | | | | | | 219,361 | | | | 189,120 | | | |
| | | | |
Shares redeemed | | (244,545 | ) | | (145,142 | ) | | | | | (2,405,972 | ) | | | (1,473,277 | ) | | |
| | | | |
Net increase (decrease) | | 282,337 | | | (22,889 | ) | | | | $ | 2,798,462 | | | $ | (235,656 | ) | | |
| | | | |
| | |
| 96 | | • ALLIANCEBERNSTEIN MUNICIPAL INCOME FUND |
Notes to Financial Statements
| | | | | | | | | | | | | | | | | | |
| | | | | | | | | | | | | | | | | | |
| | | Shares | | | | | Amount | | | |
| | | Year Ended
October 31,
2008 | | | Year Ended
October 31,
2007 | | | | | Year Ended
October 31,
2008 | | | Year Ended
October 31,
2007 | | | |
| | | | | |
New York Portfolio Class A | | | | | | | | | | | | | | | | | | |
Shares sold | | 12,260,226 | | | 6,738,125 | | | | | $ | 117,112,741 | | | $ | 66,529,207 | | | |
| | | | |
Shares issued in reinvestment of dividends | | 1,020,541 | | | 876,434 | | | | | | 9,806,687 | | | | 8,645,281 | | | |
| | | | |
Shares converted from Class B | | 2,018,828 | | | 2,763,070 | | | | | | 19,419,284 | | | | 27,170,644 | | | |
| | | | |
Shares redeemed | | (10,790,751 | ) | | (6,161,717 | ) | | | | | (102,506,647 | ) | | | (60,671,945 | ) | | |
| | | | |
Net increase | | 4,508,844 | | | 4,215,912 | | | | | $ | 43,832,065 | | | $ | 41,673,187 | | | |
| | | | |
| | | | | | | | | | | | | | | | | | |
| Class B | | | | | | | | | | | | | | | | | | |
Shares sold | | 806,336 | | | 708,353 | | | | | $ | 7,793,419 | | | $ | 6,995,261 | | | |
| | | | |
Shares issued in reinvestment of dividends | | 163,236 | | | 241,916 | | | | | | 1,570,916 | | | | 2,385,924 | | | |
| | | | |
Shares converted to Class A | | (2,021,087 | ) | | (2,767,069 | ) | | | | | (19,419,284 | ) | | | (27,170,644 | ) | | |
| | | | |
Shares redeemed | | (1,423,036 | ) | | (2,061,311 | ) | | | | | (13,556,046 | ) | | | (20,327,480 | ) | | |
| | | | |
Net decrease | | (2,474,551 | ) | | (3,878,111 | ) | | | | $ | (23,610,995 | ) | | $ | (38,116,939 | ) | | |
| | | | |
| | | | | | | | | | | | | | | | | | |
| Class C | | | | | | | | | | | | | | | | | | |
Shares sold | | 1,620,867 | | | 685,977 | | | | | $ | 15,701,073 | | | $ | 6,764,276 | | | |
| | | | |
Shares issued in reinvestment of dividends | | 120,006 | | | 109,373 | | | | | | 1,150,690 | | | | 1,078,464 | | | |
| | | | |
Shares redeemed | | (931,475 | ) | | (894,394 | ) | | | | | (8,819,449 | ) | | | (8,804,265 | ) | | |
| | | | |
Net increase (decrease) | | 809,398 | | | (99,044 | ) | | | | $ | 8,032,314 | | | $ | (961,525 | ) | | |
| | | | |
| | | | | | |
| | | August 6,
2008(a) to
October 31,
2008 | | | | | | | | August 6,
2008(a) to
October 31,
2008 | | | | | | |
| | | | | |
| Advisor Class | | | | | | | | | | | | | | | | | | |
Shares sold | | 542,369 | | | | | | | | $ | 5,187,845 | | | | | | | |
| | | | |
Shares issued in reinvestment of dividends | | 2,395 | | | | | | | | | 20,733 | | | | | | | |
| | | | |
Shares redeemed | | (4,837 | ) | | | | | | | | (42,816 | ) | | | | | | |
| | | | |
Net increase | | 539,927 | | | | | | | | $ | 5,165,762 | | | | | | | |
| | | | |
(a) | Commencement of distributions. |
| | |
| ALLIANCEBERNSTEIN MUNICIPAL INCOME FUND • | | 97 |
Notes to Financial Statements
| | | | | | | | | | | | | | | | | | |
| | | | | | | | | | | | | | | | | | |
| | | Shares | | | | | Amount | | | |
| | | Year Ended
October 31,
2008 | | | Year Ended
October 31,
2007 | | | | | Year Ended
October 31,
2008 | | | Year Ended
October 31,
2007 | | | |
| | | | | |
| California Portfolio | | | | | | | | | | | | | | | | | | |
| Class A | | | | | | | | | | | | | | | | | | |
Shares sold | | 8,482,348 | | | 5,179,042 | | | | | $ | 90,030,429 | | | $ | 56,853,929 | | | |
| | | | |
Shares issued in reinvestment of dividends | | 1,248,043 | | | 1,156,653 | | | | | | 13,175,678 | | | | 12,655,065 | | | |
| | | | |
Shares converted from Class B | | 2,000,493 | | | 2,389,111 | | | | | | 21,094,107 | | | | 26,123,609 | | | |
| | | | |
Shares redeemed | | (10,160,080 | ) | | (7,776,383 | ) | | | | | (106,552,264 | ) | | | (84,977,233 | ) | | |
| | | | |
Net increase | | 1,570,804 | | | 948,423 | | | | | $ | 17,747,950 | | | $ | 10,655,370 | | | |
| | | | |
| | | | | | | | | | | | | | | | | | |
| Class B | | | | | | | | | | | | | | | | | | |
Shares sold | | 155,794 | | | 186,531 | | | | | $ | 1,657,194 | | | $ | 2,042,124 | | | |
| | | | |
Shares issued in reinvestment of dividends | | 66,847 | | | 126,875 | | | | | | 709,808 | | | | 1,389,916 | | | |
| | | | |
Shares converted to Class A | | (2,000,838 | ) | | (2,390,298 | ) | | | | | (21,094,107 | ) | | | (26,123,609 | ) | | |
| | | | |
Shares redeemed | | (561,937 | ) | | (1,227,148 | ) | | | | | (5,967,182 | ) | | | (13,430,443 | ) | | |
| | | | |
Net decrease | | (2,340,134 | ) | | (3,304,040 | ) | | | | $ | (24,694,287 | ) | | $ | (36,122,012 | ) | | |
| | | | |
| | | | | | | | | | | | | | | | | | |
| Class C | | | | | | | | | | | | | | | | | | |
Shares sold | | 1,384,009 | | | 659,274 | | | | | $ | 14,741,457 | | | $ | 7,227,021 | | | |
| | | | |
Shares issued in reinvestment of dividends | | 203,328 | | | 193,698 | | | | | | 2,145,714 | | | | 2,119,210 | | | |
| | | | |
Shares redeemed | | (1,584,415 | ) | | (1,488,656 | ) | | | | | (16,700,404 | ) | | | (16,296,043 | ) | | |
| | | | |
Net increase (decrease) | | 2,922 | | | (635,684 | ) | | | | $ | 186,767 | | | $ | (6,949,812 | ) | | |
| | | | |
| | | | | | |
| | | August 6,
2008(a) to,
October 31,
2008 | | | | | | | | August 6,
2008(a) to,
October 31,
2008 | | | | | | |
| | | | | |
| Advisor Class | | | | | | | | | | | | | | | | | | |
Shares sold | | 177,499 | | | | | | | | $ | 1,843,959 | | | | | | | |
| | | | |
Shares issued in reinvestment of dividends | | 436 | | | | | | | | | 4,155 | | | | | | | |
| | | | |
Shares redeemed | | (1,744 | ) | | | | | | | | (17,559 | ) | | | | | | |
| | | | |
Net increase | | 176,191 | | | | | | | | $ | 1,830,555 | | | | | | | |
| | | | |
(a) | Commencement of distributions. |
| | |
| 98 | | • ALLIANCEBERNSTEIN MUNICIPAL INCOME FUND |
Notes to Financial Statements
| | | | | | | | | | | | | | | | | | |
| | | | | | | | | | | | | | | | | | |
| | | Shares | | | | | Amount | | | |
| | | Year Ended
October 31,
2008 | | | Year Ended
October 31,
2007 | | | | | Year Ended
October 31,
2008 | | | Year Ended
October 31,
2007 | | | |
| | | | | |
| Insured California Portfolio | | | | | | | | | | | | | | | | | | |
| Class A | | | | | | | | | | | | | | | | | | |
Shares sold | | 426,516 | | | 260,519 | | | | | $ | 5,683,672 | | | $ | 3,569,049 | | | |
| | | | |
Shares issued in reinvestment of dividends and distributions | | 131,179 | | | 160,099 | | | | | | 1,741,746 | | | | 2,199,313 | | | |
| | | | |
Shares converted from Class B | | 181,742 | | | 209,597 | | | | | | 2,415,290 | | | | 2,861,292 | | | |
| | | | |
Shares redeemed | | (1,455,944 | ) | | (781,504 | ) | | | | | (19,237,739 | ) | | | (10,688,596 | ) | | |
| | | | |
Net decrease | | (716,507 | ) | | (151,289 | ) | | | | $ | (9,397,031 | ) | | $ | (2,058,942 | ) | | |
| | | | |
| | | | | | | | | | | | | | | | | | |
| Class B | | | | | | | | | | | | | | | | | | |
Shares sold | | 14,314 | | | 7,286 | | | | | $ | 193,207 | | | $ | 100,332 | | | |
| | | | |
Shares issued in reinvestment of dividends and distributions | | 7,252 | | | 19,125 | | | | | | 96,870 | | | | 262,969 | | | |
| | | | |
Shares converted to Class A | | (181,832 | ) | | (209,661 | ) | | | | | (2,415,290 | ) | | | (2,861,292 | ) | | |
| | | | |
Shares redeemed | | (129,583 | ) | | (161,958 | ) | | | | | (1,726,752 | ) | | | (2,227,167 | ) | | |
| | | | |
Net decrease | | (289,849 | ) | | (345,208 | ) | | | | $ | (3,851,965 | ) | | $ | (4,725,158 | ) | | |
| | | | |
| | | | | | | | | | | | | | | | | | |
| Class C | | | | | | | | | | | | | | | | | | |
Shares sold | | 69,480 | | | 50,367 | | | | | $ | 929,349 | | | $ | 686,914 | | | |
| | | | |
Shares issued in reinvestment of dividends and distributions | | 20,866 | | | 24,002 | | | | | | 276,717 | | | | 329,546 | | | |
| | | | |
Shares redeemed | | (99,590 | ) | | (183,564 | ) | | | | | (1,332,456 | ) | | | (2,498,301 | ) | | |
| | | | |
Net decrease | | (9,244 | ) | | (109,195 | ) | | | | $ | (126,390 | ) | | $ | (1,481,841 | ) | | |
| | | | |
NOTE F
Risks Involved in Investing in the Fund
Concentration of Credit Risk—Certain Portfolios of the AllianceBernstein Municipal Income Fund are State Portfolios that may invest a large portion of their assets in a particular state’s municipal securities and their various political subdivisions, and the performance of each of these Portfolios may be closely tied to economic conditions within the applicable state and the financial condition of that state and its agencies and municipalities.
The Fund may purchase municipal securities that are insured under policies issued by certain insurance companies. When issued, insured municipal securities typically receive a higher credit rating which means that the issuer of the securities pays a lower interest rate. In purchasing insured securities, the Adviser gives consideration to both the insurer and the credit quality of the
| | |
| ALLIANCEBERNSTEIN MUNICIPAL INCOME FUND • | | 99 |
Notes to Financial Statements
underlying issuer. The purpose of the insurance is to reduce the credit risk for a particular municipal security by supplementing the creditworthiness of the underlying issuer and providing additional security for payment of the principal and interest. Certain of the insurance companies that insure municipal securities insure other types of securities, including some involving subprime mortgages. The credit quality of subprime mortgage securities has declined and some bond insurers’ risk of having to make payments to holders of subprime mortgage securities has increased. Because of this risk, the credit ratings of some insurance companies have been downgraded and may be further downgraded; it is possible that certain insurance companies may become insolvent. If an insurance company’s rating is downgraded or the company becomes insolvent, the prices of municipal securities insured by the insurance company may decline.
The Adviser believes that downgrades in insurance company ratings or insurance company insolvencies present limited risk to the Fund. The Fund is diversified by bond insurer, reducing the exposure to any single insurer. In addition, the Adviser believes that the generally investment grade underlying credit quality of the insured municipal securities reduces the risk of a significant reduction in the value of the insured municipal security.
Indemnification Risk—In the ordinary course of business, the Fund enters into contracts that contain a variety of indemnifications. The Fund’s maximum exposure under these arrangements is unknown. However, the Fund has not had prior claims or losses pursuant to these indemnification provisions and expects the risk of loss thereunder to be remote.
NOTE G
Joint Credit Facility
A number of open-end mutual funds managed by the Adviser, including the Fund, participate in a $250 million revolving credit facility (the “Facility”) intended to provide short-term financing, if necessary, subject to certain restrictions in connection with abnormal redemption activity. Commitment fees related to the Facility are paid by the participating funds and are included in miscellaneous expenses in the statement of operations. The Fund did not utilize the Facility during the year ended October 31, 2008.
NOTE H
Distributions to Shareholders
The tax character of distributions paid during the fiscal years ended October 31, 2008 and October 31, 2007 were as follows:
| | | | | | |
| National | | 2008 | | 2007 |
Distributions paid from: | | | | | | |
Ordinary income | | $ | 101,705 | | $ | 65,962 |
Tax-exempt income | | | 20,826,094 | | | 18,687,051 |
| | | | | | |
Total distributions paid | | $ | 20,927,799 | | $ | 18,753,013 |
| | | | | | |
| | |
| 100 | | • ALLIANCEBERNSTEIN MUNICIPAL INCOME FUND |
Notes to Financial Statements
As of October 31, 2008, the components of accumulated earnings/(deficit) on a tax basis were as follows:
| | | | |
Undistributed tax-exempt net investment income | | $ | 474,538 | |
Accumulated capital and other losses | | | (23,459,855 | )(a) |
Unrealized appreciation/(depreciation) | | | (48,717,094 | )(b) |
| | | | |
Total accumulated earnings/(deficit) | | $ | (71,702,411 | )(c) |
| | | | |
(a) | On October 31, 2008, the Portfolio had a net capital loss carryforward of $23,459,855 of which $12,984,821 expires in the year 2010, and $10,475,034 expires in the year 2011. To the extent future capital gains are offset by capital loss carryforward, such gains will not be distributed. During the fiscal year ended October 31, 2008, the Portfolio utilized capital loss carryforwards of $384,073. The Portfolio had $18,424,664 of capital loss carryforwards expire in the fiscal year. |
(b) | The difference between book-basis and tax-basis unrealized appreciation/(depreciation) is attributable primarily to the tax deferral of losses on wash sales, and the difference between the book and tax treatment of swap income. |
(c) | The difference between book-basis and tax-basis components of accumulated earnings/(deficit) is attributable primarily to dividends payable. |
During the current fiscal year, permanent differences primarily due to the tax treatment of swap income and capital loss carryover expiration resulted in a net decrease in distributions in excess of net investment income, a net decrease in accumulated net realized loss on investment transactions and a net decrease to additional paid-in capital. This reclassification had no effect on net assets.
| | | | | | |
| Insured National | | 2008 | | 2007 |
Distributions paid from: | | | | | | |
Ordinary income | | $ | 38,113 | | $ | 27,021 |
Tax-exempt income | | | 5,254,012 | | | 5,402,387 |
| | | | | | |
Total distributions paid | | $ | 5,292,125 | | $ | 5,429,408 |
| | | | | | |
As of October 31, 2008, the components of accumulated earnings/(deficit) on a tax basis were as follows:
| | | | |
Undistributed tax-exempt net investment income | | $ | 375,779 | |
Accumulated capital and other losses | | | (639,523 | )(a) |
Unrealized appreciation/(depreciation) | | | (1,458,788 | )(b) |
| | | | |
Total accumulated earnings/(deficit) | | $ | (1,722,532 | )(c) |
| | | | |
(a) | On October 31, 2008, the Portfolio had a net capital loss carryforward of $639,523 of which $419,984 expires in the year 2010, and $219,539 expires in the year 2016. To the extent future capital gains are offset by capital loss carryforward, such gains will not be distributed. The Portfolio had $1,312,177 of capital loss carryforwards expire in the fiscal year. |
(b) | The difference between book-basis and tax-basis unrealized appreciation/(depreciation) is attributable primarily to the difference between the book and tax treatment of swap income. |
(c) | The difference between book-basis and tax-basis components of accumulated earnings/(deficit) is attributable primarily to dividends payable. |
| | |
| ALLIANCEBERNSTEIN MUNICIPAL INCOME FUND • | | 101 |
Notes to Financial Statements
During the current fiscal year, permanent differences primarily due to the tax treatment of swap income and capital loss carryforward expiration resulted in a net decrease in undistributed net investment income, a net decrease in accumulated net realized loss on investment transactions, and a net decrease in additional paid in capital. This reclassification had no effect on net assets.
| | | | | | |
| New York | | 2008 | | 2007 |
Distributions paid from: | | | | | | |
Ordinary income | | $ | 125,341 | | $ | 61,877 |
Tax-exempt income | | | 19,254,256 | | | 18,471,958 |
| | | | | | |
Total distributions paid | | $ | 19,379,597 | | $ | 18,533,835 |
| | | | | | |
As of October 31, 2008, the components of accumulated earnings/(deficit) on a tax basis were as follows:
| | | | |
Undistributed tax-exempt net investment income | | $ | 216,232 | |
Accumulated capital and other losses | | | (10,745,632 | )(a) |
Unrealized appreciation/(depreciation) | | | (27,115,260 | )(b) |
| | | | |
Total accumulated earnings/(deficit) | | $ | (37,644,660 | )(c) |
| | | | |
(a) | On October 31, 2008, the Portfolio had a net capital loss carryforward of $10,745,632 of which $6,973,404 expires in the year 2009, $3,771,908 expires in the year 2011, and $320 expires in the year 2015. To the extent future capital gains are offset by capital loss carryforward, such gains will not be distributed. During the fiscal year ended October 31, 2008, the Portfolio utilized capital loss carryforwards of $418,739. The Portfolio had $1,104,836 of capital loss carryforwards expire in the fiscal year. |
(b) | The difference between book-basis and tax-basis unrealized appreciation/(depreciation) is attributable primarily to the tax deferral of losses on wash sales, and the difference between the book and tax treatment of swap income. |
(c) | The difference between book-basis and tax-basis components of accumulated earnings/(deficit) is attributable primarily to dividends payable. |
During the current fiscal year, permanent differences primarily due to the tax treatment of swap income and capital loss carryforward expiration resulted in a net decrease in distributions in excess of net investment income, a net decrease in accumulated net realized loss on investment transactions, and a net decrease in additional paid in capital. This reclassification had no effect on net assets.
| | | | | | |
| California | | 2008 | | 2007 |
Distributions paid from: | | | | | | |
Ordinary income | | $ | 259,921 | | $ | 167,610 |
Tax-exempt income | | | 29,918,348 | | | 30,853,552 |
| | | | | | |
Total distributions paid | | $ | 30,178,269 | | $ | 31,021,162 |
| | | | | | |
| | |
| 102 | | • ALLIANCEBERNSTEIN MUNICIPAL INCOME FUND |
Notes to Financial Statements
As of October 31, 2008, the components of accumulated earnings/(deficit) on a tax basis were as follows:
| | | | |
Undistributed tax-exempt net investment income | | $ | 135,306 | |
Accumulated capital and other losses | | | (14,914,027 | )(a) |
Unrealized appreciation/(depreciation) | | | (26,456,194 | )(b) |
| | | | |
Total accumulated earnings/(deficit) | | $ | (41,234,915 | )(c) |
| | | | |
(a) | On October 31, 2008, the Portfolio had a net capital loss carryforward of $14,914,027, of which $10,406,492 expires in the year 2009, and $4,507,535 expires in the year 2010. To the extent future capital gains are offset by capital loss carryforward, such gains will not be distributed. During the fiscal year ended October 31, 2008 the Portfolio utilized capital loss carryforwards of $256,698. The Portfolio had $3,455,567 of capital loss carryforwards expire in the fiscal year. |
(b) | The difference between book-basis and tax-basis unrealized appreciation/(depreciation) is attributable primarily to the tax deferral of losses on wash sales, and the difference between the book and tax treatment of swap income. |
(c) | The difference between book-basis and tax-basis components of accumulated earnings/(deficit) is attributable primarily to dividends payable. |
During the current fiscal year, permanent differences primarily due to the tax treatment of swap income and capital loss carryforward expiration resulted in a net increase in distributions in excess of net investment income, a net decrease in accumulated net realized loss on investment transactions, and a net decrease in additional paid in capital. This reclassification had no effect on net assets.
| | | | | | |
| Insured California | | 2008 | | 2007 |
Distributions paid from: | | | | | | |
Ordinary income | | $ | 256,915 | | $ | 30,236 |
Tax-exempt income | | | 3,101,283 | | | 3,698,905 |
Long-term capital gains | | | 516,780 | | | 1,289,544 |
| | | | | | |
Total distributions paid | | $ | 3,874,978 | | $ | 5,018,685 |
| | | | | | |
As of October 31, 2008, the components of accumulated earnings/(deficit) on a tax basis were as follows:
| | | | |
Undistributed ordinary income | | $ | 16,295 | |
Undistributed long-term capital gains | | | 86,339 | |
Unrealized appreciation/(depreciation) | | | (3,206,326 | )(a) |
| | | | |
Total accumulated earnings/(deficit) | | $ | (3,103,692 | )(b) |
| | | | |
(a) | The difference between book-basis and tax-basis unrealized appreciation/(depreciation) is attributable primarily to the difference between the book and tax treatment of swap income. |
(b) | The difference between book-basis and tax-basis components of accumulated earnings/(deficit) is attributable primarily to dividends payable. |
During the current fiscal year, permanent differences primarily due to the tax treatment of swap income, and taxable overdistribution resulted in a net decrease in distributions in excess of net investment income, a net decrease in accumulated net realized gain on investment transactions, and a net decrease in additional paid in capital. This reclassification had no effect on net assets.
| | |
| ALLIANCEBERNSTEIN MUNICIPAL INCOME FUND • | | 103 |
Notes to Financial Statements
NOTE I
Legal Proceedings
On October 2, 2003, a purported class action complaint entitled Hindo, et al. v. AllianceBernstein Growth & Income Fund, et al. (“Hindo Complaint”) was filed against the Adviser, Alliance Capital Management Holding L.P. (“Alliance Holding”), Alliance Capital Management Corporation, AXA Financial, Inc., the AllianceBernstein Funds, certain officers of the Adviser (“AllianceBernstein defendants”), and certain other unaffiliated defendants, as well as unnamed Doe defendants. The Hindo Complaint was filed in the United States District Court for the Southern District of New York by alleged shareholders of two of the AllianceBernstein Funds. The Hindo Complaint alleges that certain of the AllianceBernstein defendants failed to disclose that they improperly allowed certain hedge funds and other unidentified parties to engage in “late trading” and “market timing” of AllianceBernstein Fund securities, violating Sections 11 and 15 of the Securities Act, Sections 10(b) and 20(a) of the Exchange Act and Sections 206 and 215 of the Advisers Act. Plaintiffs seek an unspecified amount of compensatory damages and rescission of their contracts with the Adviser, including recovery of all fees paid to the Adviser pursuant to such contracts.
Following October 2, 2003, 43 additional lawsuits making factual allegations generally similar to those in the Hindo Complaint were filed in various federal and state courts against the Adviser and certain other defendants. On September 29, 2004, plaintiffs filed consolidated amended complaints with respect to four claim types: mutual fund shareholder claims; mutual fund derivative claims; derivative claims brought on behalf of Alliance Holding; and claims brought under ERISA by participants in the Profit Sharing Plan for Employees of the Adviser. All four complaints include substantially identical factual allegations, which appear to be based in large part on the Order of the SEC dated December 18, 2003 as amended and restated January 15, 2004 (“SEC Order”) and the New York State Attorney General Assurance of Discontinuance dated September 1, 2004 (“NYAG Order”).
On April 21, 2006, the Adviser and attorneys for the plaintiffs in the mutual fund shareholder claims, mutual fund derivative claims, and ERISA claims entered into a confidential memorandum of understanding containing their agreement to settle these claims. The agreement will be documented by a stipulation of settlement and will be submitted for court approval at a later date. The settlement amount ($30 million), which the Adviser previously accrued and disclosed, has been disbursed. The derivative claims brought on behalf of Alliance Holding, in which plaintiffs seek an unspecified amount of damages, remain pending.
It is possible that these matters and/or other developments resulting from these matters could result in increased redemptions of the AllianceBernstein Mutual Funds’ shares or other adverse consequences to the AllianceBernstein Mutual Funds. This may require the AllianceBernstein Mutual Funds to sell investments
| | |
| 104 | | • ALLIANCEBERNSTEIN MUNICIPAL INCOME FUND |
Notes to Financial Statements
held by those funds to provide for sufficient liquidity and could also have an adverse effect on the investment performance of the AllianceBernstein Mutual Funds. However, the Adviser believes that these matters are not likely to have a material adverse effect on its ability to perform advisory services relating to the AllianceBernstein Mutual Funds.
NOTE J
Recent Accounting Pronouncements
On September 20, 2006, the FASB released Statement of Financial Accounting Standards No. 157 “Fair Value Measurements” (“FAS 157”). FAS 157 establishes an authoritative definition of fair value, sets out a framework for measuring fair value, and requires additional disclosures about fair-value measurements. The application of FAS 157 is required for fiscal years beginning after November 15, 2007 and interim periods within those fiscal years. As of October 31, 2008, management believes the adoption of FAS 157 will not impact the amounts reported in the financial statements. However, additional disclosures will be required.
On March 19, 2008, the FASB released Statement of Financial Accounting Standards No. 161, “Disclosures about Derivative Instruments and Hedging Activities” (“FAS 161”). FAS 161 requires qualitative disclosures about objectives and strategies for using derivatives, quantitative disclosures about fair value amounts of and gains and losses on derivative instruments, and disclosures about credit-risk-related contingent features in derivative agreements. The application of FAS 161 is required for fiscal years beginning after November 15, 2008 and interim periods within those fiscal years. At this time, management is evaluating the implications of FAS 161 and believes the adoption of FAS 161 will have no material impact on the Portfolios’ financial statements.
NOTE K
Subsequent Events
On December 1, 2008, Insured National Portfolio was renamed National Portfolio II and Insured California Portfolio was renamed California Portfolio II.
At a Special Meeting of Shareholders held on December 12, 2008, the shareholders of California Portfolio II approved the acquisition of California Portfolio II by California Portfolio. The acquisition is expected to occur in early 2009.
Effective January 1, 2009, new fee waivers and/or expense reimbursements will be implemented for National Portfolio, New York Portfolio and California Portfolio. Under the new arrangement, the Adviser has contractually agreed to waive its fees and bear certain expenses so that total operating expenses of the Portfolios do not exceed .75% for Class A shares, 1.45% for Class B shares, 1.45% for Class C shares and .45% for Advisor Class shares. This represents a decrease in the fee waivers and/or expense reimbursements for National Portfolio and New York Portfolio, which currently limit operating expenses to, respectively, .68%
| | |
| ALLIANCEBERNSTEIN MUNICIPAL INCOME FUND • | | 105 |
Notes to Financial Statements
for Class A shares, 1.38% for Class B and Class C and .38% for Advisor Class shares and .58% for Class A shares, 1.28% for Class B and C shares and ..28% for Advisor Class shares and an increase in the fee waiver and/or expense reimbursement for California Portfolio, which currently limit operating expense to .77% for Class A shares 1.47% for Class B and C shares and .47% for Advisor Class shares. This contractual agreement extends through the end of the Portfolios’ fiscal year and may be extended by the Adviser for additional one-year terms.
Effective January 31, 2009, sales of Class B shares of the Fund to new investors will be suspended. Class B shares will only be issued (i) upon the exchange of Class B shares from another AllianceBernstein Fund, (ii) for purposes of dividend reinvestment, (iii) through the Fund’s Automatic Investment Program (the “Program”) for accounts that established the Program prior to January 31, 2009, and (iv) for purchases of additional shares by Class B shareholders as of January 31, 2009. The ability to establish a new Automatic Investment Program for accounts containing Class B shares will be suspended as of January 31, 2009.
| | |
| 106 | | • ALLIANCEBERNSTEIN MUNICIPAL INCOME FUND |
Notes to Financial Statements
FINANCIAL HIGHLIGHTS
Selected Data For A Share Of Capital Stock Outstanding Throughout The Period
| | | | | | | | | | | | | | | |
| | | National Portfolio | |
| | | Class A | |
| | | Year Ended October 31, | |
| | | 2008 | | | 2007 | | | 2006 | | | 2005 | | | 2004(a) | |
| | | |
| | | | | | | | | | | | | | | |
Net asset value,
beginning of period | | $ 10.03 | | | $ 10.22 | | | $ 10.05 | | | $ 10.13 | | | $ 9.96 | |
| | | |
Income From Investment Operations | | | | | | | | | | | | | | | |
Net investment income(b)(c) | | .42 | | | .44 | | | .46 | | | .47 | | | .50 | |
Net realized and unrealized gain (loss) on investment transactions | | (1.13 | ) | | (.19 | ) | | .17 | | | (.07 | ) | | .17 | |
| | | |
Net increase (decrease) in net asset value from operations | | (.71 | ) | | .25 | | | .63 | | | .40 | | | .67 | |
| | | |
Less: Dividends | | | | | | | | | | | | | | | |
Dividends from net investment income | | (.42 | ) | | (.44 | ) | | (.46 | ) | | (.48 | ) | | (.50 | ) |
| | | |
Net asset value, end of period | | $ 8.90 | | | $ 10.03 | | | $ 10.22 | | | $ 10.05 | | | $ 10.13 | |
| | | |
Total Return | | | | | | | | | | | | | | | |
Total investment return based on net asset value(d) | | (7.32 | )% | | 2.52 | % | | 6.43 | % | | 3.95 | % | | 6.92 | % |
Ratios/Supplemental Data | | | | | | | | | | | | | | | |
Net assets, end of period (000’s omitted) | | $401,886 | | | $361,701 | | | $349,884 | | | $337,201 | | | $344,557 | |
Ratio to average net assets of: | | | | | | | | | | | | | | | |
Expenses, net of fee waivers and interest expense | | .68 | % | | .68 | % | | .68 | %(e) | | .68 | % | | .68 | % |
Expenses, before fee waivers | | .91 | % | | .92 | % | | 1.01 | %(e) | | .93 | %(f) | | 1.08 | % |
Expenses, before waivers, excluding interest expense | | .91 | % | | .92 | % | | .92 | % | | .93 | % | | 1.08 | % |
Net investment income(b) | | 4.31 | % | | 4.38 | % | | 4.56 | %(e) | | 4.65 | % | | 4.94 | % |
Portfolio turnover rate | | 24 | % | | 15 | % | | 22 | % | | 25 | % | | 47 | % |
See footnote summary on pages 125-126.
| | |
| ALLIANCEBERNSTEIN MUNICIPAL INCOME FUND • | | 107 |
Financial Highlights
Selected Data For A Share Of Capital Stock Outstanding Throughout The Period
| | | | | | | | | | | | | | | |
| | | National Portfolio | |
| | | Class B | |
| | | Year Ended October 31, | |
| | | 2008 | | | 2007 | | | 2006 | | | 2005 | | | 2004(a) | |
| | | |
| | | | | | | | | | | | | | | |
Net asset value,
beginning of period | | $ 10.02 | | | $ 10.21 | | | $ 10.04 | | | $ 10.12 | | | $ 9.95 | |
| | | |
Income From Investment Operations | | | | | | | | | | | | | | | |
Net investment income(b)(c) | | .35 | | | .37 | | | .39 | | | .40 | | | .43 | |
Net realized and unrealized gain (loss) on investment transactions | | (1.13 | ) | | (.19 | ) | | .17 | | | (.07 | ) | | .17 | |
| | | |
Net increase (decrease) in net asset value from operations | | (.78 | ) | | .18 | | | .56 | | | .33 | | | .60 | |
| | | |
Less: Dividends | | | | | | | | | | | | | | | |
Dividends from net investment income | | (.35 | ) | | (.37 | ) | | (.39 | ) | | (.41 | ) | | (.43 | ) |
| | | |
Net asset value, end of period | | $ 8.89 | | | $ 10.02 | | | $ 10.21 | | | $ 10.04 | | | $ 10.12 | |
| | | |
Total Return | | | | | | | | | | | | | | | |
Total investment return based on net asset value(d) | | (7.97 | )% | | 1.81 | % | | 5.70 | % | | 3.25 | % | | 6.18 | % |
Ratios/Supplemental Data | | | | | | | | | | | | | | | |
Net assets, end of period (000’s omitted) | | $14,988 | | | $25,332 | | | $37,399 | | | $49,801 | | | $72,264 | |
Ratio to average net assets of: | | | | | | | | | | | | | | | |
Expenses, net of fee waivers and interest expense | | 1.38 | % | | 1.38 | % | | 1.38 | %(e) | | 1.38 | % | | 1.39 | % |
Expenses, before fee waivers | | 1.63 | % | | 1.63 | % | | 1.73 | %(e) | | 1.64 | %(f) | | 1.79 | % |
Expenses, before waivers, excluding interest expense | | 1.63 | % | | 1.63 | % | | 1.64 | % | | 1.64 | % | | 1.79 | % |
Net investment income(b) | | 3.61 | % | | 3.69 | % | | 3.89 | %(e) | | 3.96 | % | | 4.24 | % |
Portfolio turnover rate | | 24 | % | | 15 | % | | 22 | % | | 25 | % | | 47 | % |
See footnote summary on pages 125-126.
| | |
| 108 | | • ALLIANCEBERNSTEIN MUNICIPAL INCOME FUND |
Financial Highlights
Selected Data For A Share Of Capital Stock Outstanding Throughout The Period
| | | | | | | | | | | | | | | |
| | | National Portfolio | |
| | | Class C | |
| | | Year Ended October 31, | |
| | | 2008 | | | 2007 | | | 2006 | | | 2005 | | | 2004(a) | |
| | | |
| | | | | | | | | | | | | | | |
Net asset value,
beginning of period | | $ 10.02 | | | $ 10.21 | | | $ 10.05 | | | $ 10.13 | | | $ 9.95 | |
| | | |
Income From Investment Operations | | | | | | | | | | | | | | | |
Net investment income(b)(c) | | .35 | | | .37 | | | .39 | | | .40 | | | .43 | |
Net realized and unrealized gain (loss) on investment transactions | | (1.13 | ) | | (.19 | ) | | .16 | | | (.07 | ) | | .18 | |
| | | |
Net increase (decrease) in net asset value from operations | | (.78 | ) | | .18 | | | .55 | | | .33 | | | .61 | |
| | | |
Less: Dividends | | | | | | | | | | | | | | | |
Dividends from net investment income | | (.35 | ) | | (.37 | ) | | (.39 | ) | | (.41 | ) | | (.43 | ) |
| | | |
Net asset value, end of period | | $ 8.89 | | | $ 10.02 | | | $ 10.21 | | | $ 10.05 | | | $ 10.13 | |
| | | |
Total Return | | | | | | | | | | | | | | | |
Total investment return based on net asset value(d) | | (7.98 | )% | | 1.81 | % | | 5.59 | % | | 3.24 | % | | 6.28 | % |
Ratios/Supplemental Data | | | | | | | | | | | | | | | |
Net assets, end of period (000’s omitted) | | $63,704 | | | $60,613 | | | $62,447 | | | $61,622 | | | $68,769 | |
Ratio to average net assets of: | | | | | | | | | | | | | | | |
Expenses, net of fee waivers and interest expense | | 1.38 | % | | 1.38 | % | | 1.38 | %(e) | | 1.38 | % | | 1.38 | % |
Expenses, before fee waivers | | 1.61 | % | | 1.62 | % | | 1.72 | %(e) | | 1.64 | %(f) | | 1.78 | % |
Expenses, before waivers, excluding interest expense | | 1.61 | % | | 1.62 | % | | 1.63 | % | | 1.64 | % | | 1.78 | % |
Net investment income(b) | | 3.61 | % | | 3.68 | % | | 3.87 | %(e) | | 3.96 | % | | 4.24 | % |
Portfolio turnover rate | | 24 | % | | 15 | % | | 22 | % | | 25 | % | | 47 | % |
See footnote summary on pages 125-126.
| | |
| ALLIANCEBERNSTEIN MUNICIPAL INCOME FUND • | | 109 |
Financial Highlights
Selected Data For A Share Of Capital Stock Outstanding Throughout The Period
| | | |
| | | National Portfolio | |
| | | Advisor Class | |
| | | August 6,
2008 to
October 31,
2008(g) | |
Net asset value, beginning of period | | $ 9.66 | |
| | | |
Income From Investment Operations | | | |
Net investment income(b)(c) | | .09 | |
Net realized and unrealized loss on investment transactions | | (.74 | ) |
| | | |
Net decrease in net asset value from operations | | (.65 | ) |
| | | |
Less: Dividends | | | |
Dividends from net investment income | | (.11 | ) |
| | | |
Net asset value, end of period | | $ 8.90 | |
| | | |
Total Return | | | |
Total investment return based on net asset value(d) | | (6.79 | )% |
Ratios/Supplemental Data | | | |
Net assets, end of period (000’s omitted) | | $1,482 | |
Ratio to average net assets of: | | | |
Expenses, net of fee waivers | | .38 | %(h) |
Expenses, before fee waivers | | .69 | %(h) |
Net investment income(b) | | 5.19 | %(h) |
Portfolio turnover rate | | 24 | % |
See footnote summary on pages 125-126.
| | |
| 110 | | • ALLIANCEBERNSTEIN MUNICIPAL INCOME FUND |
Financial Highlights
Selected Data For A Share Of Capital Stock Outstanding Throughout Each Period
| | | | | | | | | | | | | | | |
| | | Insured National Portfolio | |
| | | Class A | |
| | | Year Ended October 31, | |
| | | 2008 | | | 2007 | | | 2006 | | | 2005 | | | 2004(a) | |
| | | |
| | | | | | | | | | | | | | | |
Net asset value,
beginning of period | | $ 10.11 | | | $ 10.27 | | | $ 10.18 | | | $ 10.29 | | | $ 10.11 | |
| | | |
Income From Investment Operations | | | | | | | | | | | | | | | |
Net investment income(b)(c) | | .39 | | | .41 | | | .41 | | | .42 | | | .44 | |
Net realized and unrealized gain (loss) on investment transactions | | (.59 | ) | | (.17 | ) | | .09 | | | (.11 | ) | | .20 | |
| | | |
Net increase (decrease) in net asset value from operations | | (.20 | ) | | .24 | | | .50 | | | .31 | | | .64 | |
| | | |
Less: Dividends | | | | | | | | | | | | | | | |
Dividends from net investment income | | (.38 | ) | | (.40 | ) | | (.41 | ) | | (.42 | ) | | (.46 | ) |
| | | |
Net asset value, end of period | | $ 9.53 | | | $ 10.11 | | | $ 10.27 | | | $ 10.18 | | | $ 10.29 | |
| | | |
Total Return | | | | | | | | | | | | | | | |
Total investment return based on net asset value(d) | | (2.05 | )% | | 2.42 | % | | 4.98 | % | | 3.05 | % | | 6.42 | % |
Ratios/Supplemental Data | | | | | | | | | | | | | | | |
Net assets, end of period (000’s omitted) | | $125,910 | | | $116,843 | | | $124,967 | | | $124,957 | | | $129,888 | |
Ratio to average net
assets of: | | | | | | | | | | | | | | | |
Expenses, net of fee waivers | | 1.04 | % | | 1.04 | % | | 1.04 | %(e) | | 1.04 | % | | 1.03 | % |
Expenses, before fee waivers | | 1.07 | % | | 1.06 | % | | 1.04 | %(e) | | 1.04 | % | | 1.18 | % |
Net investment income(b) | | 3.87 | % | | 4.00 | % | | 4.00 | %(e) | | 4.07 | % | | 4.28 | % |
Portfolio turnover rate | | 29 | % | | 12 | % | | 10 | % | | 17 | % | | 12 | % |
See footnote summary on pages 125-126.
| | |
| ALLIANCEBERNSTEIN MUNICIPAL INCOME FUND • | | 111 |
Financial Highlights
Selected Data For A Share Of Capital Stock Outstanding Throughout Each Period
| | | | | | | | | | | | | | | |
| | | Insured National Portfolio | |
| | | Class B | |
| | | Year Ended October 31, | |
| | | 2008 | | | 2007 | | | 2006 | | | 2005 | | | 2004(a) | |
| | | | | | |
| | | | | | | | | | | | | | | |
Net asset value,
beginning of period | | $ 10.09 | | | $ 10.25 | | | $ 10.15 | | | $ 10.26 | | | $ 10.09 | |
| | | |
Income From Investment Operations | | | | | | | | | | | | | | | |
Net investment income(b)(c) | | .31 | | | .34 | | | .34 | | | .35 | | | .36 | |
Net realized and unrealized gain (loss) on investment transactions | | (.58 | ) | | (.17 | ) | | .10 | | | (.11 | ) | | .19 | |
| | | |
Net increase (decrease) in net asset value from operations | | (.27 | ) | | .17 | | | .44 | | | .24 | | | .55 | |
| | | |
Less: Dividends | | | | | | | | | | | | | | | |
Dividends from net investment income | | (.31 | ) | | (.33 | ) | | (.34 | ) | | (.35 | ) | | (.38 | ) |
| | | |
Net asset value, end of period | | $ 9.51 | | | $ 10.09 | | | $ 10.25 | | | $ 10.15 | | | $ 10.26 | |
| | | |
Total Return | | | | | | | | | | | | | | | |
Total investment return based on net asset value(d) | | (2.72 | )% | | 1.72 | % | | 4.36 | % | | 2.34 | % | | 5.60 | % |
Ratios/Supplemental Data | | | | | | | | | | | | | | | |
Net assets, end of period (000’s omitted) | | $3,450 | | | $6,449 | | | $11,477 | | | $16,375 | | | $22,968 | |
Ratio to average net
assets of: | | | | | | | | | | | | | | | |
Expenses, net of fee waivers | | 1.74 | % | | 1.74 | % | | 1.74 | %(e) | | 1.74 | % | | 1.74 | % |
Expenses, before fee waivers | | 1.79 | % | | 1.77 | % | | 1.75 | %(e) | | 1.75 | % | | 1.89 | % |
Net investment income(b) | | 3.17 | % | | 3.31 | % | | 3.32 | %(e) | | 3.39 | % | | 3.58 | % |
Portfolio turnover rate | | 29 | % | | 12 | % | | 10 | % | | 17 | % | | 12 | % |
See footnote summary on pages 125-126.
| | |
| 112 | | • ALLIANCEBERNSTEIN MUNICIPAL INCOME FUND |
Financial Highlights
Selected Data For A Share Of Capital Stock Outstanding Throughout Each Period
| | | | | | | | | | | | | | | |
| | | Insured National Portfolio | |
| | | Class C | |
| | | Year Ended October 31, | |
| | | 2008 | | | 2007 | | | 2006 | | | 2005 | | | 2004(a) | |
| | | |
| | | | | | | | | | | | | | | |
Net asset value,
beginning of period | | $ 10.09 | | | $ 10.25 | | | $ 10.16 | | | $ 10.27 | | | $ 10.09 | |
| | | |
Income From Investment Operations | | | | | | | | | | | | | | | |
Net investment income(b)(c) | | .32 | | | .34 | | | .34 | | | .35 | | | .37 | |
Net realized and unrealized gain (loss) on investment transactions | | (.59 | ) | | (.17 | ) | | .09 | | | (.11 | ) | | .19 | |
| | | |
Net increase (decrease) in net asset value from operations | | (.27 | ) | | .17 | | | .43 | | | .24 | | | .56 | |
| | | |
Less: Dividends | | | | | | | | | | | | | | | |
Dividends from net investment income | | (.31 | ) | | (.33 | ) | | (.34 | ) | | (.35 | ) | | (.38 | ) |
| | | |
Net asset value, end of period | | $ 9.51 | | | $ 10.09 | | | $ 10.25 | | | $ 10.16 | | | $ 10.27 | |
| | | |
Total Return | | | | | | | | | | | | | | | |
Total investment return based on net asset value(d) | | (2.74 | )% | | 1.71 | % | | 4.26 | % | | 2.34 | % | | 5.71 | % |
Ratios/Supplemental Data | | | | | | | | | | | | | | | |
Net assets, end of period (000’s omitted) | | $12,932 | | | $10,872 | | | $11,277 | | | $11,732 | | | $12,198 | |
Ratio to average net
assets of: | | | | | | | | | | | | | | | |
Expenses, net of fee waivers | | 1.74 | % | | 1.74 | % | | 1.74 | %(e) | | 1.74 | % | | 1.73 | % |
Expenses, before fee waivers | | 1.78 | % | | 1.77 | % | | 1.74 | %(e) | | 1.75 | % | | 1.88 | % |
Net investment income(b) | | 3.17 | % | | 3.31 | % | | 3.31 | %(e) | | 3.38 | % | | 3.59 | % |
Portfolio turnover rate | | 29 | % | | 12 | % | | 10 | % | | 17 | % | | 12 | % |
See footnote summary on pages 125-126.
| | |
| ALLIANCEBERNSTEIN MUNICIPAL INCOME FUND • | | 113 |
Financial Highlights
Selected Data For A Share Of Capital Stock Outstanding Throughout Each Period
| | | | | | | | | | | | | | | |
| | | New York Portfolio | |
| | | Class A | |
| | | Year Ended October 31, | |
| | | 2008 | | | 2007 | | | 2006 | | | 2005 | | | 2004(a) | |
| | | |
| | | | | | | | | | | | | | | |
Net asset value,
beginning of period | | $ 9.82 | | | $ 9.97 | | | $ 9.81 | | | $ 9.93 | | | $ 9.79 | |
| | | |
Income From Investment Operations | | | | | | | | | | | | | | | |
Net investment income(b)(c) | | .40 | | | .41 | | | .42 | | | .46 | | | .48 | |
Net realized and unrealized gain (loss) on investment transactions | | (.81 | ) | | (.15 | ) | | .16 | | | (.12 | ) | | .15 | |
| | | |
Net increase (decrease) in
net asset value from operations | | (.41 | ) | | .26 | | | .58 | | | .34 | | | .63 | |
| | | |
Less: Dividends | | | | | | | | | | | | | | | |
Dividends from net investment income | | (.40 | ) | | (.41 | ) | | (.42 | ) | | (.46 | ) | | (.49 | ) |
| | | |
Net asset value, end of period | | $ 9.01 | | | $ 9.82 | | | $ 9.97 | | | $ 9.81 | | | $ 9.93 | |
| | | |
Total Return | | | | | | | | | | | | | | | |
Total investment return
based on net asset value(d) | | (4.31 | )% | | 2.62 | % | | 6.06 | % | | 3.46 | % | | 6.58 | % |
Ratios/Supplemental
Data | | | | | | | | | | | | | | | |
Net assets, end of period (000’s omitted) | | $368,524 | | | $356,989 | | | $320,580 | | | $294,005 | | | $280,213 | |
Ratio to average net
assets of: | | | | | | | | | | | | | | | |
Expenses, net of fee waivers | | .58 | % | | .58 | % | | .58 | %(e) | | .58 | % | | .59 | % |
Expenses, before fee waivers | | .88 | % | | .90 | % | | .89 | %(e) | | .91 | % | | 1.05 | % |
Net investment
income(b) | | 4.17 | % | | 4.12 | % | | 4.27 | %(e) | | 4.62 | % | | 4.93 | % |
Portfolio turnover rate | | 10 | % | | 5 | % | | 39 | % | | 19 | % | | 33 | % |
See footnote summary on pages 125-126.
| | |
| 114 | | • ALLIANCEBERNSTEIN MUNICIPAL INCOME FUND |
Financial Highlights
Selected Data For A Share Of Capital Stock Outstanding Throughout Each Period
| | | | | | | | | | | | | | | |
| | | New York Portfolio | |
| | | Class B | |
| | | Year Ended October 31, | |
| | | 2008 | | | 2007 | | | 2006 | | | 2005 | | | 2004(a) | |
| | | |
| | | | | | | | | | | | | | | |
Net asset value,
beginning of period | | $ 9.80 | | | $ 9.96 | | | $ 9.80 | | | $ 9.92 | | | $ 9.78 | |
| | | |
Income From Investment Operations | | | | | | | | | | | | | | | |
Net investment income(b)(c) | | .33 | | | .34 | | | .35 | | | .39 | | | .41 | |
Net realized and unrealized gain (loss) on investment transactions | | (.79 | ) | | (.16 | ) | | .16 | | | (.12 | ) | | .15 | |
| | | |
Net increase (decrease) in
net asset value from operations | | (.46 | ) | | .18 | | | .51 | | | .27 | | | .56 | |
| | | |
Less: Dividends | | | | | | | | | | | | | | | |
Dividends from net investment income | | (.34 | ) | | (.34 | ) | | (.35 | ) | | (.39 | ) | | (.42 | ) |
| | | |
Net asset value, end of period | | $ 9.00 | | | $ 9.80 | | | $ 9.96 | | | $ 9.80 | | | $ 9.92 | |
| | | |
Total Return | | | | | | | | | | | | | | | |
Total investment return
based on net asset value(d) | | (4.88 | )% | | 1.82 | % | | 5.33 | % | | 2.75 | % | | 5.85 | % |
Ratios/Supplemental
Data | | | | | | | | | | | | | | | |
Net assets, end of period (000’s omitted) | | $46,000 | | | $74,342 | | | $114,128 | | | $133,746 | | | $151,474 | |
Ratio to average net
assets of: | | | | | | | | | | | | | | | |
Expenses, net of fee waivers | | 1.28 | % | | 1.28 | % | | 1.28 | %(e) | | 1.28 | % | | 1.30 | % |
Expenses, before fee waivers | | 1.60 | % | | 1.61 | % | | 1.60 | %(e) | | 1.62 | % | | 1.76 | % |
Net investment
income(b) | | 3.46 | % | | 3.42 | % | | 3.59 | %(e) | | 3.93 | % | | 4.22 | % |
Portfolio turnover rate | | 10 | % | | 5 | % | | 39 | % | | 19 | % | | 33 | % |
See footnote summary on pages 125-126.
| | |
| ALLIANCEBERNSTEIN MUNICIPAL INCOME FUND • | | 115 |
Financial Highlights
Selected Data For A Share Of Capital Stock Outstanding Throughout Each Period
| | | | | | | | | | | | | | | |
| | | New York Portfolio | |
| | | Class C | |
| | | Year Ended October 31, | |
| | | 2008 | | | 2007 | | | 2006 | | | 2005 | | | 2004(a) | |
| | | |
| | | | | | | | | | | | | | | |
Net asset value,
beginning of period | | $ 9.81 | | | $ 9.96 | | | $ 9.80 | | | $ 9.92 | | | $ 9.78 | |
| | | |
Income From Investment Operations | | | | | | | | | | | | | | | |
Net investment income(b)(c) | | .33 | | | .34 | | | .35 | | | .39 | | | .41 | |
Net realized and unrealized gain (loss) on investment transactions | | (.79 | ) | | (.15 | ) | | .16 | | | (.12 | ) | | .15 | |
| | | |
Net increase (decrease) in
net asset value from operations | | (.46 | ) | | .19 | | | .51 | | | .27 | | | .56 | |
| | | |
Less: Dividends | | | | | | | | | | | | | | | |
Dividends from net investment income | | (.34 | ) | | (.34 | ) | | (.35 | ) | | (.39 | ) | | (.42 | ) |
| | | |
Net asset value, end of period | | $ 9.01 | | | $ 9.81 | | | $ 9.96 | | | $ 9.80 | | | $ 9.92 | |
| | | |
Total Return | | | | | | | | | | | | | | | |
Total investment return
based on net asset value(d) | | (4.88 | )% | | 1.91 | % | | 5.32 | % | | 2.74 | % | | 5.85 | % |
Ratios/Supplemental
Data | | | | | | | | | | | | | | | |
Net assets, end of period (000’s omitted) | | $49,821 | | | $46,305 | | | $48,022 | | | $45,956 | | | $45,121 | |
Ratio to average net
assets of: | | | | | | | | | | | | | | | |
Expenses, net of fee waivers | | 1.28 | % | | 1.28 | % | | 1.28 | %(e) | | 1.28 | % | | 1.29 | % |
Expenses, before fee waivers | | 1.58 | % | | 1.60 | % | | 1.60 | %(e) | | 1.61 | % | | 1.75 | % |
Net investment
income(b) | | 3.47 | % | | 3.43 | % | | 3.58 | %(e) | | 3.92 | % | | 4.23 | % |
Portfolio turnover rate | | 10 | % | | 5 | % | | 39 | % | | 19 | % | | 33 | % |
See footnote summary on pages 125-126.
| | |
| 116 | | • ALLIANCEBERNSTEIN MUNICIPAL INCOME FUND |
Financial Highlights
Selected Data For A Share Of Capital Stock Outstanding Throughout The Period
| | | |
| | | New York Portfolio | |
| | | Advisor Class | |
| | | August 6,
2008 to
October 31,
2008(g) | |
Net asset value, beginning of period | | $ 9.60 | |
| | | |
Income From Investment Operations | | | |
Net investment income(b)(c) | | .08 | |
Net realized and unrealized loss on investment transactions | | (.56 | ) |
| | | |
Net decrease in net asset value from operations | | (.48 | ) |
| | | |
Less: Dividends | | | |
Dividends from net investment income | | (.10 | ) |
| | | |
Net asset value, end of period | | $ 9.02 | |
| | | |
Total Return | | | |
Total investment return based on net asset value(d) | | (4.98 | )% |
Ratios/Supplemental Data | | | |
Net assets, end of period (000’s omitted) | | $4,868 | |
Ratio to average net assets of: | | | |
Expenses, net of fee waivers | | .28 | %(h) |
Expenses, before fee waivers | | .49 | %(h) |
Net investment income(b) | | 4.95 | %(h) |
Portfolio turnover rate | | 10 | % |
See footnote summary on pages 125-126.
| | |
| ALLIANCEBERNSTEIN MUNICIPAL INCOME FUND • | | 117 |
Financial Highlights
Selected Data For A Share Of Capital Stock Outstanding Throughout Each Period
| | | | | | | | | | | | | | | |
| | | California Portfolio | |
| | | Class A | |
| | | Year Ended October 31, | |
| | | 2008 | | | 2007 | | | 2006 | | | 2005 | | | 2004(a) | |
| | | |
| | | | | | | | | | | | | | | |
Net asset value,
beginning of period | | $ 10.88 | | | $ 11.07 | | | $ 10.86 | | | $ 10.93 | | | $ 10.63 | |
| | | |
Income From Investment Operations | | | | | | | | | | | | | | | |
Net investment income(b)(c) | | .46 | | | .46 | | | .47 | | | .48 | | | .51 | |
Net realized and unrealized gain (loss) on investment transactions | | (1.04 | ) | | (.20 | ) | | .21 | | | (.07 | ) | | .30 | |
| | | |
Net increase (decrease) in
net asset value from operations | | (.58 | ) | | .26 | | | .68 | | | .41 | | | .81 | |
| | | |
Less: Dividends | | | | | | | | | | | | | | | |
Dividends from net investment income | | (.45 | ) | | (.45 | ) | | (.47 | ) | | (.48 | ) | | (.51 | ) |
| | | |
Net asset value, end of period | | $ 9.85 | | | $ 10.88 | | | $ 11.07 | | | $ 10.86 | | | $ 10.93 | |
| | | |
Total Return | | | | | | | | | | | | | | | |
Total investment return
based on net asset value(d) | | (5.52 | )% | | 2.45 | % | | 6.42 | % | | 3.78 | % | | 7.80 | % |
Ratios/Supplemental
Data | | | | | | | | | | | | | | | |
Net assets, end of period (000’s omitted) | | $553,120 | | | $594,039 | | | $594,150 | | | $590,042 | | | $587,874 | |
Ratio to average net
assets of: | | | | | | | | | | | | | | | |
Expenses, net of fee waivers | | .77 | % | | .77 | % | | .77 | %(e) | | .77 | % | | .78 | % |
Expenses, before fee waivers | | .85 | % | | .85 | % | | .85 | %(e) | | .86 | % | | 1.01 | % |
Net investment
income(b) | | 4.30 | % | | 4.19 | % | | 4.33 | %(e) | | 4.36 | % | | 4.75 | % |
Portfolio turnover rate | | 2 | % | | 21 | % | | 10 | % | | 17 | % | | 34 | % |
See footnote summary on pages 125-126.
| | |
| 118 | | • ALLIANCEBERNSTEIN MUNICIPAL INCOME FUND |
Financial Highlights
Selected Data For A Share Of Capital Stock Outstanding Throughout Each Period
| | | | | | | | | | | | | | | |
| | | California Portfolio | |
| | | Class B | |
| | | Year Ended October 31, | |
| | | 2008 | | | 2007 | | | 2006 | | | 2005 | | | 2004(a) | |
| | | |
| | | | | | | | | | | | | | | |
Net asset value,
beginning of period | | $ 10.87 | | | $ 11.07 | | | $ 10.86 | | | $ 10.93 | | | $ 10.63 | |
| | | |
Income From Investment Operations | | | | | | | | | | | | | | | |
Net investment income(b)(c) | | .38 | | | .38 | | | .40 | | | .40 | | | .44 | |
Net realized and unrealized gain (loss) on investment transactions | | (1.03 | ) | | (.20 | ) | | .21 | | | (.07 | ) | | .30 | |
| | | |
Net increase (decrease) in
net asset value from operations | | (.65 | ) | | .18 | | | .61 | | | .33 | | | .74 | |
| | | |
Less: Dividends | | | | | | | | | | | | | | | |
Dividends from net investment income | | (.38 | ) | | (.38 | ) | | (.40 | ) | | (.40 | ) | | (.44 | ) |
| | | |
Net asset value, end of period | | $ 9.84 | | | $ 10.87 | | | $ 11.07 | | | $ 10.86 | | | $ 10.93 | |
| | | |
Total Return | | | | | | | | | | | | | | | |
Total investment return
based on net asset value(d) | | (6.18 | )% | | 1.65 | % | | 5.69 | % | | 3.06 | % | | 7.05 | % |
Ratios/Supplemental
Data | | | | | | | | | | | | | | | |
Net assets, end of period (000’s omitted) | | $16,413 | | | $43,581 | | | $80,928 | | | $122,128 | | | $175,215 | |
Ratio to average net
assets of: | | | | | | | | | | | | | | | |
Expenses, net of fee waivers | | 1.47 | % | | 1.47 | % | | 1.47 | %(e) | | 1.47 | % | | 1.48 | % |
Expenses, before fee waivers | | 1.56 | % | | 1.56 | % | | 1.56 | %(e) | | 1.56 | % | | 1.71 | % |
Net investment
income(b) | | 3.57 | % | | 3.48 | % | | 3.64 | %(e) | | 3.66 | % | | 4.05 | % |
Portfolio turnover rate | | 2 | % | | 21 | % | | 10 | % | | 17 | % | | 34 | % |
See footnote summary on pages 125-126.
| | |
| ALLIANCEBERNSTEIN MUNICIPAL INCOME FUND • | | 119 |
Financial Highlights
Selected Data For A Share Of Capital Stock Outstanding Throughout Each Period
| | | | | | | | | | | | | | | |
| | | California Portfolio | |
| | | Class C | |
| | | Year Ended October 31, | |
| | | 2008 | | | 2007 | | | 2006 | | | 2005 | | | 2004(a) | |
| | | |
| | | | | | | | | | | | | | | |
Net asset value,
beginning of period | | $ 10.88 | | | $ 11.07 | | | $ 10.86 | | | $ 10.93 | | | $ 10.63 | |
| | | |
Income From Investment Operations | | | | | | | | | | | | | | | |
Net investment income(b)(c) | | .38 | | | .38 | | | .40 | | | .40 | | | .44 | |
Net realized and unrealized gain (loss) on investment transactions | | (1.04 | ) | | (.19 | ) | | .21 | | | (.07 | ) | | .30 | |
| | | |
Net increase (decrease) in
net asset value from operations | | (.66 | ) | | .19 | | | .61 | | | .33 | | | .74 | |
| | | |
Less: Dividends | | | | | | | | | | | | | | | |
Dividends from net investment income | | (.38 | ) | | (.38 | ) | | (.40 | ) | | (.40 | ) | | (.44 | ) |
| | | |
Net asset value, end of period | | $ 9.84 | | | $ 10.88 | | | $ 11.07 | | | $ 10.86 | | | $ 10.93 | |
| | | |
Total Return | | | | | | | | | | | | | | | |
Total investment return
based on net asset value(d) | | (6.28 | )% | | 1.73 | % | | 5.69 | % | | 3.06 | % | | 7.05 | % |
Ratios/Supplemental
Data | | | | | | | | | | | | | | | |
Net assets, end of period (000’s omitted) | | $101,126 | | | $111,697 | | | $120,731 | | | $125,067 | | | $141,031 | |
Ratio to average net
assets of: | | | | | | | | | | | | | | | |
Expenses, net of fee waivers | | 1.47 | % | | 1.47 | % | | 1.47 | %(e) | | 1.47 | % | | 1.48 | % |
Expenses, before fee waivers | | 1.55 | % | | 1.55 | % | | 1.56 | %(e) | | 1.56 | % | | 1.71 | % |
Net investment
income(b) | | 3.60 | % | | 3.49 | % | | 3.64 | %(e) | | 3.66 | % | | 4.05 | % |
Portfolio turnover rate | | 2 | % | | 21 | % | | 10 | % | | 17 | % | | 34 | % |
See footnote summary on pages 125-126.
| | |
| 120 | | • ALLIANCEBERNSTEIN MUNICIPAL INCOME FUND |
Financial Highlights
Selected Data For A Share Of Capital Stock Outstanding Throughout The Period
| | | |
| | | California Portfolio | |
| | | Advisor Class | |
| | | August 6,
2008 to
October 31,
2008(g) | |
Net asset value, beginning of period | | $ 10.51 | |
| | | |
Income From Investment Operations | | | |
Net investment income(b)(c) | | .08 | |
Net realized and unrealized loss on investment transactions | | (.63 | ) |
| | | |
Net decrease in net asset value from operations | | (.55 | ) |
| | | |
Less: Dividends | | | |
Dividends from net investment income | | (.11 | ) |
| | | |
Net asset value, end of period | | $ 9.85 | |
| | | |
Total Return | | | |
Total investment return based on net asset value(d) | | (5.20 | )% |
Ratios/Supplemental Data | | | |
Net assets, end of period (000’s omitted) | | $1,735 | |
Ratio to average net assets of: | | | |
Expenses, net of fee waivers | | .47 | %(h) |
Expenses, before fee waivers | | .55 | %(h) |
Net investment income(b) | | 4.98 | %(h) |
Portfolio turnover rate | | 2 | % |
See footnote summary on pages 125-126.
| | |
| ALLIANCEBERNSTEIN MUNICIPAL INCOME FUND • | | 121 |
Financial Highlights
Selected Data For A Share Of Capital Stock Outstanding Throughout Each Period
| | | | | | | | | | | | | | | |
| | | Insured California Portfolio | |
| | | Class A | |
| | | Year Ended October 31, | |
| | | 2008 | | | 2007 | | | 2006 | | | 2005 | | | 2004(a) | |
| | | |
| | | | | | | | | | | | | | | |
Net asset value,
beginning of period | | $ 13.61 | | | $ 13.95 | | | $ 14.01 | | | $ 14.21 | | | $ 14.03 | |
| | | |
Income From Investment Operations | | | | | | | | | | | | | | | |
Net investment income(c) | | .45 | | | .48 | | | .53 | | | .57 | | | .61 | (b) |
Net realized and unrealized gain (loss) on investment transactions | | (1.10 | ) | | (.18 | ) | | .17 | | | (.20 | ) | | .18 | |
| | | |
Net increase (decrease) in net asset value from operations | | (.65 | ) | | .30 | | | .70 | | | .37 | | | .79 | |
| | | |
Less: Dividends and Distributions | | | | | | | | | | | | | | | |
Dividends from net investment income | | (.48 | ) | | (.48 | ) | | (.53 | ) | | (.57 | ) | | (.61 | ) |
Distributions from net realized gain on investment transactions | | (.07 | ) | | (.16 | ) | | (.23 | ) | | – 0 | – | | – 0 | – |
| | | |
Total dividends and distributions | | (.55 | ) | | (.64 | ) | | (.76 | ) | | (.57 | ) | | (.61 | ) |
| | | |
Net asset value, end of period | | $ 12.41 | | | $ 13.61 | | | $ 13.95 | | | $ 14.01 | | | $ 14.21 | |
| | | |
Total Return | | | | | | | | | | | | | | | |
Total investment return based on net asset value(d) | | (4.93 | )% | | 2.17 | % | | 5.19 | % | | 2.60 | % | | 5.75 | % |
Ratios/Supplemental Data | | | | | | | | | | | | | | | |
Net assets, end of period (000’s omitted) | | $68,811 | | | $85,238 | | | $89,501 | | | $97,079 | | | $103,414 | |
Ratio to average net assets of: | | | | | | | | | | | | | | | |
Expenses, net of fee waivers | | 1.36 | % | | 1.08 | % | | 1.03 | %(e) | | 1.02 | % | | 1.00 | % |
Expenses, before fee waivers | | 1.36 | % | | 1.08 | % | | 1.03 | %(e) | | 1.02 | % | | 1.07 | % |
Net investment
income | | 3.40 | % | | 3.52 | % | | 3.85 | %(e) | | 3.99 | % | | 4.29 | %(b) |
Portfolio turnover rate | | 2 | % | | 18 | % | | 26 | % | | 37 | % | | 5 | % |
See footnote summary on pages 125-126.
| | |
| 122 | | • ALLIANCEBERNSTEIN MUNICIPAL INCOME FUND |
Financial Highlights
Selected Data For A Share Of Capital Stock Outstanding Throughout Each Period
| | | | | | | | | | | | | | | |
| | | Insured California Portfolio | |
| | | Class B | |
| | | Year Ended October 31, | |
| | | 2008 | | | 2007 | | | 2006 | | | 2005 | | | 2004(a) | |
| | | |
| | | | | | | | | | | | | | | |
Net asset value,
beginning of period | | $ 13.60 | | | $ 13.95 | | | $ 14.01 | | | $ 14.20 | | | $ 14.02 | |
| | | |
Income From Investment Operations | | | | | | | | | | | | | | | |
Net investment income(c) | | .36 | | | .38 | | | .44 | | | .47 | | | .50 | (b) |
Net realized and unrealized gain (loss) on investment transactions | | (1.10 | ) | | (.19 | ) | | .16 | | | (.19 | ) | | .19 | |
| | | |
Net increase (decrease) in net asset value from operations | | (.74 | ) | | .19 | | | .60 | | | .28 | | | .69 | |
| | | |
Less: Dividends and Distributions | | | | | | | | | | | | | | | |
Dividends from net investment income | | (.39 | ) | | (.38 | ) | | (.43 | ) | | (.47 | ) | | (.51 | ) |
Distributions from net realized gain on investment transactions | | (.07 | ) | | (.16 | ) | | (.23 | ) | | – 0 | – | | – 0 | – |
| | | |
Total dividends and distributions | | (.46 | ) | | (.54 | ) | | (.66 | ) | | (.47 | ) | | (.51 | ) |
| | | |
Net asset value, end of period | | $ 12.40 | | | $ 13.60 | | | $ 13.95 | | | $ 14.01 | | | $ 14.20 | |
| | | |
Total Return | | | | | | | | | | | | | | | |
Total investment return based on net asset value(d) | | (5.61 | )% | | 1.38 | % | | 4.45 | % | | 1.96 | % | | 5.02 | % |
Ratios/Supplemental Data | | | | | | | | | | | | | | | |
Net assets, end of period (000’s omitted) | | $1,917 | | | $6,046 | | | $11,013 | | | $15,626 | | | $21,559 | |
Ratio to average net assets of: | | | | | | | | | | | | | | | |
Expenses, net of fee waivers | | 2.01 | % | | 1.79 | % | | 1.74 | %(e) | | 1.73 | % | | 1.71 | % |
Expenses, before fee waivers | | 2.01 | % | | 1.79 | % | | 1.74 | %(e) | | 1.73 | % | | 1.77 | % |
Net investment
income | | 2.74 | % | | 2.81 | % | | 3.15 | %(e) | | 3.29 | % | | 3.58 | %(b) |
Portfolio turnover rate | | 2 | % | | 18 | % | | 26 | % | | 37 | % | | 5 | % |
See footnote summary on pages 125-126.
| | |
| ALLIANCEBERNSTEIN MUNICIPAL INCOME FUND • | | 123 |
Financial Highlights
Selected Data For A Share Of Capital Stock Outstanding Throughout Each Period
| | | | | | | | | | | | | | | |
| | | Insured California Portfolio | |
| | | Class C | |
| | | Year Ended October 31, | |
| | | 2008 | | | 2007 | | | 2006 | | | 2005 | | | 2004(a) | |
| | | |
| | | | | | | | | | | | | | | |
Net asset value,
beginning of period | | $ 13.60 | | | $ 13.94 | | | $ 14.00 | | | $ 14.20 | | | $ 14.02 | |
| | | |
Income From Investment Operations | | | | | | | | | | | | | | | |
Net investment income(c) | | .36 | | | .39 | | | .43 | | | .47 | | | .51 | (b) |
Net realized and unrealized gain (loss) on investment transactions | | (1.10 | ) | | (.19 | ) | | .17 | | | (.20 | ) | | .18 | |
| | | |
Net increase (decrease) in net asset value from operations | | (.74 | ) | | .20 | | | .60 | | | .27 | | | .69 | |
| | | |
Less: Dividends and Distributions | | | | | | | | | | | | | | | |
Dividends from net investment income | | (.39 | ) | | (.38 | ) | | (.43 | ) | | (.47 | ) | | (.51 | ) |
Distributions from net realized gain on investment transactions | | (.07 | ) | | (.16 | ) | | (.23 | ) | | – 0 | – | | – 0 | – |
| | | |
Total dividends and distributions | | (.46 | ) | | (.54 | ) | | (.66 | ) | | (.47 | ) | | (.51 | ) |
| | | |
Net asset value, end of period | | $ 12.40 | | | $ 13.60 | | | $ 13.94 | | | $ 14.00 | | | $ 14.20 | |
| | | |
Total Return | | | | | | | | | | | | | | | |
Total investment return based on net asset value(d) | | (5.61 | )% | | 1.46 | % | | 4.46 | % | | 1.88 | % | | 5.02 | % |
Ratios/Supplemental Data | | | | | | | | | | | | | | | |
Net assets, end of period (000’s omitted) | | $12,921 | | | $14,300 | | | $16,184 | | | $18,204 | | | $19,603 | |
Ratio to average net assets of: | | | | | | | | | | | | | | | |
Expenses, net of fee waivers | | 2.07 | % | | 1.78 | % | | 1.73 | %(e) | | 1.73 | % | | 1.70 | % |
Expenses, before fee waivers | | 2.07 | % | | 1.78 | % | | 1.73 | %(e) | | 1.73 | % | | 1.77 | % |
Net investment
income | | 2.70 | % | | 2.82 | % | | 3.15 | %(e) | | 3.29 | % | | 3.59 | %(b) |
Portfolio turnover rate | | 2 | % | | 18 | % | | 26 | % | | 37 | % | | 5 | % |
See footnote summary on pages 125-126.
| | |
| 124 | | • ALLIANCEBERNSTEIN MUNICIPAL INCOME FUND |
Financial Highlights
| (a) | As of November 1, 2003, the Fund has adopted the method of accounting for interim payments on swap contracts in accordance with Financial Accounting standards Board Statement No. 133. These interim payments are reflected within net realized and unrealized gain (loss) on swap contracts, however prior to November 1, 2003, these interim payments were reflected within interest income/expense on the statement of operations. The effects of these changes for the year ended October 31, 2004 were as follows: |
| | | | | | | | | |
| | | Investment
Income
Per Share* | | Realized
and Unrealized
Gain (Loss) on
Investment
Transactions
Per Share* | | Ratio of Net
Investment
Income
to Average
Net Assets | |
National Portfolio | | | | | | | | | |
Class A | | $ | .00 | | $ | .00 | | .01 | % |
Class B | | | .00 | | | .00 | | .01 | % |
Class C | | | .00 | | | .00 | | .01 | % |
Insured National Portfolio | | | | | | | | | |
Class A | | | .00 | | | .00 | | .01 | % |
Class B | | | .00 | | | .00 | | .01 | % |
Class C | | | .00 | | | .00 | | .01 | % |
New York Portfolio | | | | | | | | | |
Class A | | | .00 | | | .00 | | .05 | % |
Class B | | | .00 | | | .00 | | .05 | % |
Class C | | | .00 | | | .00 | | .05 | % |
California Portfolio | | | | | | | | | |
Class A | | | .00 | | | .00 | | .00 | %† |
Class B | | | .00 | | | .00 | | .00 | %† |
Class C | | | .00 | | | .00 | | .00 | %† |
Insured California Portfolio | | | | | | | | | |
Class A | | | .00 | | | .00 | | .00 | %† |
Class B | | | .00 | | | .00 | | .00 | %† |
Class C | | | .00 | | | .00 | | .00 | %† |
| * | Per share amounts less than $0.01 |
| † | Amount is less than .01% |
| (b) | Net of fees waived by the Adviser. |
| (c) | Based on average shares outstanding. |
| (d) | Total investment return is calculated assuming an initial investment made at the net asset value at the beginning of the period, reinvestment of all dividends and distributions at net asset value during the period, and redemption on the last day of the period. Initial sales charges or contingent deferred sales charges are not reflected in the calculation of total investment return. Total return does not reflect the deduction of taxes that a shareholder would pay on fund distributions or the redemption of fund shares. Total investment return calculated for a period of less than one year is not annualized. |
| (e) | The ratio includes expenses attributable to cost of proxy solicitation. |
| (f) | During 2006, the Fund determined that the criteria for sale accounting in Statement of Financial Accounting Standards No. 140 Accounting for Transfers and Servicing of Financial Assets and Extinguishments of Liabilities, had not been met for certain transfers of municipal bonds and that the transfers should have been accounted for as secured borrowings rather than as sales. Accordingly, the National Portfolio has restated the expense ratios (see table next page) for the year ended October 31, 2005 to give effect to recording the transfers of the municipal bonds as secured borrowings. The effects of the restatement have no effect on the previously reported net assets. |
| | |
| ALLIANCEBERNSTEIN MUNICIPAL INCOME FUND • | | 125 |
Financial Highlights
| | | | | | | | | | | | | | | | | | |
| | | Class A | | | Class B | | | Class C | |
| | | Previously
Reported | | | Restated | | | Previously
Reported | | | Restated | | | Previously
Reported | | | Restated | |
Ratio to average net assets of: | | | | | | | | | | | | | | | | | | |
Expenses, before fee waivers | | .93 | % | | 1.14 | % | | 1.64 | % | | 1.85 | % | | 1.64 | % | | 1.85 | % |
Expense, before waivers excluding interest expense | | N/A | | | .94 | % | | N/A | | | 1.65 | % | | N/A | | | 1.65 | % |
| (g) | Commencement of distributions |
| | |
| 126 | | • ALLIANCEBERNSTEIN MUNICIPAL INCOME FUND |
Financial Highlights
REPORT OF INDEPENDENT REGISTERED
PUBLIC ACCOUNTING FIRM
To the Shareholders and Board of Directors of AllianceBernstein Municipal Income Fund, Inc.
We have audited the accompanying statements of assets and liabilities, including the portfolios of investments, of AllianceBernstein Municipal Income Fund, Inc. (the “Fund”) (comprising, respectively, the National, Insured National, New York, California, and Insured California Portfolios) as of October 31, 2008, and the related statements of operations for the year then ended, the statements of changes in net assets for each of the two years in the period then ended, and the financial highlights for each of the five years then ended. These financial statements and financial highlights are the responsibility of the Fund’s management. Our responsibility is to express an opinion on these financial statements and financial highlights based on our audits.
We conducted our audits in accordance with the standards of the Public Company Accounting Oversight Board (United States). Those standards require that we plan and perform the audit to obtain reasonable assurance about whether the financial statements and financial highlights are free of material misstatement. We were not engaged to perform an audit of the Fund’s internal control over financial reporting. Our audits included consideration of internal control over financial reporting as a basis for designing audit procedures that are appropriate in the circumstances, but not for the purpose of expressing an opinion on the effectiveness of the Fund’s internal control over financial reporting. Accordingly, we express no such opinion. An audit also includes examining, on a test basis, evidence supporting the amounts and disclosures in the financial statements and financial highlights, assessing the accounting principles used and significant estimates made by management, and evaluating the overall financial statement presentation. Our procedures included confirmation of securities owned as of October 31, 2008 by correspondence with the custodian and others, or by other appropriate auditing procedures where replies from others were not received. We believe that our audits provide a reasonable basis for our opinion.
In our opinion, the financial statements and financial highlights referred to above present fairly, in all material respects, the financial position of each of the portfolios constituting the AllianceBernstein Municipal Income Fund, Inc. at October 31, 2008, the results of their operations for the year then ended, the changes in their net assets for each of the two years in the period then ended, and their financial highlights for each of the five years then ended, in conformity with U.S. generally accepted accounting principles.

New York, New York
December 23, 2008
| | |
| ALLIANCEBERNSTEIN MUNICIPAL INCOME FUND • | | 127 |
Report of Independent Registered Public Accounting Firm
BOARD OF DIRECTORS
William H. Foulk, Jr.(1), Chairman
Marc O. Mayer
John H. Dobkin(1)
Michael J. Downey(1)
D. James Guzy(1)
Nancy P. Jacklin(1)
Garry L. Moody(1)
Marshall C. Turner, Jr.(1)
Earl D. Weiner(1)
OFFICERS
Robert M. Keith, President and Chief Executive Officer
Philip L. Kirstein, Senior Vice President and Independent Compliance Officer
Robert B. (Guy) Davidson, III(2), Senior Vice President
Douglas J. Peebles, Senior Vice President
Jeffrey S. Phlegar, Senior Vice President
Michael G. Brooks(2), Vice President
Fred S. Cohen(2), Vice President
Terrance T. Hults(2), Vice President
Emilie D. Wrapp, Secretary
Joseph J. Mantineo, Treasurer and Chief Financial Officer
Thomas R. Manley, Controller
| | |
Custodian and Accounting Agent State Street Bank and Trust Company
One Lincoln Street
Boston, MA 02111 Principal Underwriter AllianceBernstein Investments, Inc.
1345 Avenue of the Americas
New York, NY 10105 Legal Counsel Seward & Kissel LLP
One Battery Park Plaza
New York, NY 10004 | | Independent Registered Public Accounting Firm Ernst & Young LLP
5 Times Square
New York, NY 10036 Transfer Agent AllianceBernstein Investor
Services, Inc. P.O. Box 786003
San Antonio, TX 78278-6003
Toll-free (800) 221-5672 |
| (1) | Member of the Audit Committee, the Governance and Nominating Committee and the Independent Directors Committee. Mr. Foulk is the sole member of the Fair Value Pricing Committee. |
| (2) | The day-to-day management of, and investment decisions for, the Portfolios’ portfolios are made by the Municipal Bond Investment Team. Messrs. Brooks, Cohen, Davidson and Hults are the investment professionals with the most significant responsibility for the day-to-day management of the Portfolios’ portfolios. |
| | |
| 128 | | • ALLIANCEBERNSTEIN MUNICIPAL INCOME FUND |
Board of Directors
MANAGEMENT OF THE FUND
Board of Directors Information
The business and affairs of the Fund are managed under the direction of the Board of Directors. Certain information concerning the Fund’s Directors is set forth below.
| | | | | | |
NAME,
ADDRESS* AND AGE
(FIRST YEAR ELECTED**) | | PRINCIPAL
OCCUPATION(S)
DURING PAST 5 YEARS | | PORTFOLIOS
IN FUND
COMPLEX
OVERSEEN BY
DIRECTOR | | OTHER
DIRECTORSHIPS
HELD BY
DIRECTOR |
| INTERESTED DIRECTOR |
Marc O. Mayer,***
1345 Avenue of the Americas New York, NY 10105
51
(2003) | | Executive Vice President of AllianceBernstein L.P. (“AllianceBernstein”) since 2000 and Chief Investment Officer of Blend Solutions since June 2008. Previously, Executive Managing Director of AllianceBernstein Investments, Inc. (“ABI”) since 2003; prior thereto, he was head of AllianceBernstein Institutional Investments, a unit of AllianceBernstein, from 2001-2003. Prior to 2001, Chief Executive Officer of Sanford C. Bernstein & Co., LLC (institutional research and brokerage arm of Bernstein & Co. LLC) and its predecessor. | | 92 | | SCB Partners, Inc. and SCB Inc. |
| | | | | | |
| DISINTERESTED DIRECTORS |
William H. Foulk, Jr., #,+
Chairman of the Board
76
(1998)
| | Investment Adviser and an Independent Consultant. Formerly, Senior Manager of Barrett Associates, Inc., a registered investment adviser, with which he had been associated since prior to 2003. He was formerly Deputy Comptroller and Chief Investment Officer of the State of New York and, prior thereto, Chief Investment Officer of the New York Bank for Savings. | | 94 | | None |
| | |
| ALLIANCEBERNSTEIN MUNICIPAL INCOME FUND • | | 129 |
Management of the Fund
| | | | | | |
NAME,
ADDRESS* AND AGE
(FIRST YEAR ELECTED**) | | PRINCIPAL
OCCUPATION(S)
DURING PAST 5 YEARS | | PORTFOLIOS
IN FUND
COMPLEX
OVERSEEN BY
DIRECTOR | | OTHER
DIRECTORSHIPS
HELD BY
DIRECTOR |
DISINTERESTED DIRECTORS
(continued) |
John H. Dobkin, #
65
(1998) | | Consultant. Formerly, President of Save Venice, Inc. (preservation organization) from 2001-2002, Senior Advisor from June 1999-June 2000 and President of Historic Hudson Valley (historic preservation) from December 1989-May 1999. Previously, Director of the National Academy of Design. | | 92 | | None |
| | | | | | |
Michael J. Downey, #
64
(2005) | | Private Investor since January 2004. Formerly, managing partner of Lexington Capital, LLC (investment advisory firm) from December 1997 until December 2003. From 1987 until 1993, Chairman and CEO of Prudential Mutual Fund Management. | | 92 | | Asia Pacific Fund, Inc., The Merger Fund and Prospect Acquisition Corp. (financial services) |
| | | | | | |
D. James Guzy, #
72
(2005) | | Chairman of the Board of PLX Technology (semi-conductors) and of SRC Computers Inc., with which he has been associated since prior to 2003. | | 92 | | Intel Corporation (semi-conductors) and Cirrus Logic Corporation (semi-conductors) |
| | |
| 130 | | • ALLIANCEBERNSTEIN MUNICIPAL INCOME FUND |
Management of the Fund
| | | | | | |
NAME,
ADDRESS* AND AGE
(FIRST YEAR ELECTED**) | | PRINCIPAL
OCCUPATION(S)
DURING PAST 5 YEARS | | PORTFOLIOS
IN FUND
COMPLEX
OVERSEEN BY
DIRECTOR | | OTHER
DIRECTORSHIPS
HELD BY
DIRECTOR |
DISINTERESTED DIRECTORS
(continued) |
Nancy P. Jacklin, #
60
(2006) | | Professorial lecturer at the Johns Hopkins School of Advanced International Studies and Adjunct Professor at Georgetown University Law Center in the 2008-2009 academic year. Formerly, U.S. Executive Director of the International Monetary Fund (December 2002-May 2006); Partner, Clifford Chance (1992-2002); Sector Counsel, International Banking and Finance, and Associate General Counsel, Citicorp (1985-1992); Assistant General Counsel (International), Federal Reserve Board of Governors (1982-1985); and Attorney Advisor, U.S. Department of the Treasury (1973-1982). Member of the Bar of the District of Columbia and of New York; and member of the Council on Foreign Relations. | | 92 | | None |
| | | | | | |
Garry L. Moody, # 56 (2007) | | Formerly, Partner, Deloitte & Touche LLP, Vice-Chairman, and U.S. and Global Managing Partner, Investment Management Services Group 1995-2008. | | 91 | | None |
| | | | | | |
Marshall C. Turner, Jr., #
67
(2005) | | Interim CEO of MEMC Electronic Materials, Inc. (semi-conductor and solar cell substrates) since November 2008. He was Chairman and CEO of Dupont Photomasks, Inc. (components of semi-conductor manufacturing), 2003-2005, and President and CEO, 2005-2006, after the company was renamed Toppan Photomasks, Inc. | | 92 | | Xilinx, Inc. (programmable logic semi-conductors) and MEMC Electronic Materials, Inc. |
| | |
| ALLIANCEBERNSTEIN MUNICIPAL INCOME FUND • | | 131 |
Management of the Fund
| | | | | | |
NAME,
ADDRESS* AND AGE
(FIRST YEAR ELECTED**) | | PRINCIPAL
OCCUPATION(S)
DURING PAST 5 YEARS | | PORTFOLIOS
IN FUND
COMPLEX
OVERSEEN BY
DIRECTOR | | OTHER
DIRECTORSHIPS
HELD BY
DIRECTOR |
DISINTERESTED DIRECTORS
(continued) |
Earl D. Weiner, #
69
(2007) | | Of Counsel, and Partner prior to January 2007, of the law firm Sullivan & Cromwell LLP, member of ABA Federal Regulation of Securities Committee Task Force on Fund Director’s Guidebook; and member of Advisory Board of Sustainable Forestry Management Limited. | | 92 | | None |
| * | The address for each of the Fund’s disinterested Directors is c/o AllianceBernstein L.P., Attention: Philip L. Kirstein, 1345 Avenue of the Americas, New York, NY 10105. |
| ** | There is no stated term of office for the Fund’s Directors. |
| *** | Mr. Mayer is an “interested person”, as defined in the Investment Company Act of 1940 (the “1940 Act”), due to his position as an Executive Vice President of the Adviser. |
| # | Member of the Audit Committee, the Governance and Nominating Committee and the Independent Directors Committee. |
| + | Member of the Fair Value Pricing Committee. |
| | |
| 132 | | • ALLIANCEBERNSTEIN MUNICIPAL INCOME FUND |
Management of the Fund
Officer Information
Certain information concerning the Fund’s Officers is listed below.
| | | | |
NAME, ADDRESS*
AND AGE | | POSITION(S)
HELD WITH FUND | | PRINCIPAL OCCUPATION(S)
DURING PAST 5 YEARS |
Robert M. Keith
48 | | President and Chief Executive Officer | | Executive Vice President of the Adviser** since July 2008; Executive Managing Director of ABI** since 2006 and the head of ABI since July 2008. Prior to joining ABI in 2006, Executive Managing Director of Bernstein Global Wealth Management, and prior thereto, Senior Managing Director and Global Head of Client Service and Sales of AllianceBernstein’s institutional investment management business since 2004. Prior thereto, he was a Managing Director and Head of North American Client Service and Sales in AllianceBernstein’s institutional investment management business, with which he had been associated since prior to 2003. |
| | | | |
Philip L. Kirstein
63 | | Senior Vice President and Independent Compliance Officer | | Senior Vice President and Independent Compliance Officer of the AllianceBernstein Funds, with which he has been associated since October 2004. Prior thereto, he was Of Counsel to Kirkpatrick & Lockhart, LLP from October 2003 to October 2004, and General Counsel of Merrill Lynch Investment Managers, L.P. since prior to March 2003. |
| | | | |
Robert B. (Guy) Davidson, III
47 | | Senior Vice President | | Senior Vice President of the Adviser**, with which he has been associated since prior to 2003. |
| | | | |
Douglas J. Peebles
43 | | Senior Vice President | | Executive Vice President of the Adviser**, with which he has been associated since prior to 2003. |
| | | | |
Jeffrey S. Phlegar
42 | | Senior Vice President | | Executive Vice President of the Adviser**, with which he has been associated since prior to 2003. |
| | | | |
Michael G. Brooks
60 | | Vice President | | Senior Vice President of the Adviser**, with which he has been associated since prior to 2003. |
| | | | |
Fred S. Cohen
50 | | Vice President | | Senior Vice President of the Adviser**, with which he has been associated since prior to 2003. |
| | | | |
Terrance T. Hults
42 | | Vice President | | Senior Vice President of the Adviser**, with which he has been associated since prior to 2003. |
| | |
| ALLIANCEBERNSTEIN MUNICIPAL INCOME FUND • | | 133 |
Management of the Fund
| | | | |
NAME, ADDRESS*
AND AGE | | POSITION(S)
HELD WITH FUND | | PRINCIPAL OCCUPATION(S)
DURING PAST 5 YEARS |
Emilie D. Wrapp
52 | | Secretary | | Senior Vice President, Assistant General Counsel and Assistant Secretary of ABI**, with which she has been associated since prior to 2003. |
| | | | |
Joseph J. Mantineo
49 | | Treasurer and Chief Financial Officer | | Senior Vice President of ABIS**, with which he has been associated since prior to 2003. |
| | | | |
Thomas R. Manley
57 | | Controller | | Vice President of the Adviser**, with which he has been associated since prior to 2003. |
| * | The address for each of the Fund’s Officers is 1345 Avenue of the Americas, New York, NY 10105. |
| ** | The Adviser, ABI and ABIS are affiliates of the Fund. |
The Fund’s Statement of Additional Information (“SAI”) has additional information about the Fund’s Directors and Officers and is available without a charge upon request. Contact your financial representative or AllianceBernstein at (800) 227-4618 for a free prospectus or SAI.
| | |
| 134 | | • ALLIANCEBERNSTEIN MUNICIPAL INCOME FUND |
Management of the Fund
THE FOLLOWING IS NOT PART OF THE SHAREHOLDER REPORT OR THE FINANCIAL STATEMENTS
SUMMARY OF SENIOR OFFICER’S EVALUATION OF INVESTMENT ADVISORY AGREEMENT1
The following is a summary of the evaluation of the Investment Advisory Agreement between AllianceBernstein L.P. (the “Adviser”) and AllianceBernstein Municipal Income Fund, Inc. (the “Fund”), in respect of the following Portfolios: 2
California Portfolio
Insured California Portfolio
Insured National Portfolio
National Portfolio
New York Portfolio
The evaluation of the Investment Agreement was prepared by Philip L. Kirstein, the Senior Officer of the Fund, for the Directors of the Fund, as required by the September 1, 2004 agreement between the Adviser and the New York State Attorney General (the “NYAG”). The Senior Officer’s evaluation of the Investment Advisory Agreement is not meant to diminish the responsibility or authority of the Board of Directors of the Fund to perform its duties pursuant to Section 15 of the Investment Company Act of 1940 (the ‘40 Act) and applicable state law. The purpose of the summary is to provide shareholders with a synopsis of the independent evaluation of the reasonableness of the advisory fees proposed to be paid by the Portfolios which was provided to the Directors in connection with their review of the proposed approval of the continuance of the Investment Advisory Agreement. The Senior Officer’s evaluation considered the following factors:
| | 1. | Advisory fees charged to institutional and other clients of the Adviser for like services; |
| | 2. | Advisory fees charged by other mutual fund companies for like services; |
| | 3. | Costs to the Adviser and its affiliates of supplying services pursuant to the advisory agreements, excluding any intra-corporate profit; |
| | 4. | Profit margins of the Adviser and its affiliates from supplying such services; |
| | 5. | Possible economies of scale as the Portfolios grow larger; and |
| 1 | It should be noted that the Senior Officer’s fee evaluation was completed on October 22, 2008. |
| 2 | Future references to the Portfolios do not include “AllianceBernstein.” References in the fee summary pertaining to performance and expense ratios refer to the Class A shares of the Portfolios. |
| | |
| ALLIANCEBERNSTEIN MUNICIPAL INCOME FUND • | | 135 |
| | 6. | Nature and quality of the Adviser’s services including the performance of the Portfolios. |
PORTFOLIO ADVISORY FEES, EXPENSE CAPS, REIMBURSEMENTS, & RATIOS
The Adviser proposed that the Portfolios pay the advisory fee set forth in the table below for receiving the services to be provided pursuant to the Investment Advisory Agreement. The fee schedule below, implemented in January 2004 in consideration of the Adviser’s settlement with the NYAG in December 2003, is based on a master schedule that contemplates eight categories of funds with almost all funds in each category having the same advisory fee schedule.3
| | | | |
| Category | | Advisory Fee | | Fund |
| Low Risk Income | | 45 bp on 1st $2.5 billion 40 bp on next $2.5 billion 35 bp on the balance | | Municipal Income Fund, Inc. |
The Portfolios’ net assets on September 30, 2008 are set forth below:
| | | |
| Portfolio | | Net Assets ($MM) |
| California Portfolio | | $ | 704.2 |
| Insured California Portfolio | | $ | 87.8 |
| Insured National Portfolio | | $ | 142.8 |
| National Portfolio | | $ | 501.4 |
| New York Portfolio | | $ | 485.8 |
The Adviser is reimbursed as specified in the Investment Advisory Agreement for certain clerical, legal, accounting, administrative, and other services provided to the Portfolios. Indicated below are the reimbursement amounts which the Adviser received from the Portfolios during their most recently completed fiscal year:
| | | | | | |
| Portfolio | | Amount | | As a % of Average Daily Net Assets | |
| California Portfolio | | $ | 47,000 | | 0.01 | % |
| Insured California Portfolio | | $ | 49,000 | | 0.08 | % |
| Insured National Portfolio | | $ | 47,000 | | 0.07 | % |
| National Portfolio | | $ | 49,000 | | 0.02 | % |
| New York Portfolio | | $ | 50,000 | | 0.02 | % |
The Adviser has agreed to waive that portion of its advisory fees and/or reimburse certain of the Portfolios for that portion of the Portfolios’ total operating expenses to the degree necessary to limit each Portfolio’s expense ratios to the amounts set forth below for each Portfolio’s current fiscal year. The waiver agreement is terminable by the Adviser at the end of the Portfolios’ fiscal
| 3 | Most of the AllianceBernstein Mutual Funds, which the Adviser manages, were affected by the Adviser’s settlement with the NYAG. |
| | |
| 136 | | • ALLIANCEBERNSTEIN MUNICIPAL INCOME FUND |
year upon at least 60 days written notice. In addition, set forth below are the Portfolios’ gross expense ratios, annualized for the most recent semi-annual period:
| | | | | | | | | | |
| Portfolio | | Expense Cap
Pursuant to
Expense Limitation
Undertaking | | | Gross
Expense
Ratio | | | Fiscal
Year End |
| California Portfolio4 | | Advisor Class A Class B Class C | | 0.47
0.77 1.47 1.47 | %
% % % | | 0.51
0.86 1.57 1.56 | %5
% % % | | October 31 |
| | | | | | | | | | |
| Insured National Portfolio | | Class A Class B Class C | | 1.04
1.74 1.74 | %
% % | | 1.08
1.80 1.79 | %
% % | | October 31 |
| | | | | | | | | | |
| National Portfolio4 | | Advisor Class A Class B Class C | | 0.38
0.68 1.38 1.38 | %
% % % | | 0.56
0.92 1.64 1.63 | %5
% % % | | October 31 |
| | | | | | | | | | |
| New York Portfolio4 | | Advisor Class A Class B Class C | | 0.28
0.58 1.28 1.28 | %
% % % | | 0.59
0.90 1.62 1.61 | %5
% % % | | October 31 |
Set forth below are annualized total expense ratios of Insured California Portfolio, which does not have an expense limitation undertaking:
| | | | | | | |
| Portfolio | | Total Expense
Ratios | | | Fiscal
Year End |
| Insured California Portfolio | | Class A Class B Class C | | 1.08
1.79 1.78 | %
% % | | October 31 |
| | I. | ADVISORY FEES CHARGED TO INSTITUTIONAL AND OTHER CLIENTS |
The advisory fees charged to investment companies which the Adviser manages and sponsors are normally higher than those charged to similar sized institutional accounts, including pension plans and sub-advised investment companies. The fee differential reflects, among other things, different services provided to such clients, and different liabilities assumed. Services provided by the Adviser to the Portfolios that are not provided to non-investment company clients include providing office space and personnel to serve as Fund Officers, who among other responsibilities make the certifications required under the Sarbanes–Oxley Act of
| 4 | Effective January 1, 2009, the expense caps for the California Portfolio, National Portfolio and New York Portfolio will be 0.75%, 1.45%, and 1.45% for Classes A, B, and C, respectively. |
| 5 | Advisor Class inception date: August 7, 2008. Gross expense ratio based on the period August 7, 2008 through August 31, 2008. |
| | |
| ALLIANCEBERNSTEIN MUNICIPAL INCOME FUND • | | 137 |
2002, and coordinating with and monitoring the Portfolios’ third party service providers such as Fund counsel, auditors, custodians, transfer agents and pricing services. The accounting, administrative, legal and compliance requirements for the Portfolios are more costly than those for institutional client assets due to the greater complexities and time required for investment companies, although as previously noted, a portion of these expenses are reimbursed by the Portfolios to the Adviser. Also, retail mutual funds managed by the Adviser are widely held. Servicing the Portfolios’ investors is more time consuming and labor intensive compared to institutional clients since the Adviser needs to communicate with a more extensive network of financial intermediaries and shareholders. The Adviser also believes that it incurs substantial entrepreneurial risk when offering a new mutual fund since establishing a new mutual fund requires a large upfront investment, and it may take a long time for the fund to achieve profitability since the fund must be priced to scale from inception in order to be competitive and assets are acquired one account at a time. In addition, managing the cash flow of an investment company may be more difficult than that of a stable pool of assets, such as an institutional account with little cash movement in either direction, particularly, if a fund is in net redemption and the Adviser is frequently forced to sell securities to raise cash for redemptions. However, managing a fund with positive cash flow may be easier at times than managing a stable pool of assets. Finally, in recent years, investment advisers have been sued by institutional clients and have suffered reputational damage both by the attendant publicity and outcomes other than complete victories. Accordingly, the legal and reputational risks associated with institutional accounts are greater than previously thought, although still not equal to those related to the mutual fund industry.
Notwithstanding the Adviser’s view that managing an investment company is not comparable to managing other institutional accounts because the services provided are different, it is worth considering information regarding the advisory fees charged to institutional accounts with substantially similar investment styles as the Portfolios. However, with respect to the Portfolios, the Adviser represented that there is no institutional product in the Adviser’s Form ADV that has a substantially similar investment style as any of the Portfolios. It should be noted that the Adviser has represented that it does manage separately managed accounts that invest principally in municipal securities but those mandates have substantially lower risk profile (credit and interest rate risk) than the Portfolios.
The Adviser manages Sanford C. Bernstein Fund, Inc. (“SCB Fund”), an open-end management investment company. Several portfolios of SCB Fund have a somewhat similar investment style to certain of the Portfolios and their advisory fee schedules are set forth below. Also presented are what would have been the effective advisory fees of the Portfolios had the SCB Fund fee schedule been applicable to those Portfolios versus the Portfolios’ advisory fees based on September 30, 2008 net assets.
| | |
| 138 | | • ALLIANCEBERNSTEIN MUNICIPAL INCOME FUND |
| | | | | | | | |
| Portfolio | | SCB Fund
Portfolio | | Fee Schedule | | SCB
Fund
Effective
Fee | | Portfolio
Advisory
Fee |
| California Portfolio | | Short Duration California Municipal Portfolio | | 45 bp on 1st $750 million 40 bp thereafter | | 0.450% | | 0.450% |
| | | | | | | | |
| California Portfolio | | California Municipal Portfolio | | 50 bp on 1st $1 billion 45 bp on next $2 billion 40 bp on next $2 billion 35 bp thereafter | | 0.500% | | 0.450% |
| | | | | | | | |
| National Portfolio | | Short Duration Diversified Municipal Portfolio | | 45 bp on 1st $750 million 40 bp thereafter | | 0.450% | | 0.450% |
| | | | | | | | |
| National Portfolio | | Diversified Municipal Portfolio | | 50 bp on 1st $1 billion 45 bp on next $2 billion 40 bp on next $2 billion 35 bp thereafter | | 0.500% | | 0.450% |
| | | | | | | | |
| New York Portfolio | | Short Duration New York Municipal Portfolio | | 45 bp on 1st $750 million 40 bp thereafter | | 0.450% | | 0.450% |
| | | | | | | | |
| New York Portfolio | | New York Municipal Portfolio | | 50 bp on 1st $1 billion 45 bp on next $2 billion 40 bp on next $2 billion 35 bp thereafter | | 0.500% | | 0.450% |
The Adviser represented that it does not sub-advise any registered investment company that has a similar investment strategy as any of the Portfolios.
| II. | MANAGEMENT FEES CHARGED BY OTHER MUTUAL FUNDS COMPANIES FOR LIKE SERVICES. |
Lipper, Inc. (“Lipper”), an analytical service that is not affiliated with the Adviser, compared the fees charged to the Portfolios with fees charged to other investment companies for similar services by other investment advisers. Lipper’s analysis included the Portfolios’ rankings with respect to the proposed management fee relative to the median of the Portfolios’ Lipper Expense Group (“EG”) at the approximate current asset level of the Portfolio.6
Lipper describes an EG as a representative sample of comparable funds. Lipper’s standard methodology for screening funds to be included in an EG entails the
| 6 | The contractual management fee is calculated by Lipper using the Portfolios’ contractual management fee rate at a hypothetical asset level. The hypothetical asset level is based on the combined net assets of all classes of the Portfolio, rounded up to the next $25 million. Lipper’s total expense ratio information is based on the most recent annual report except as otherwise noted. A ranking of “1” means that the Portfolio has the lowest effective fee rate in the Lipper peer group. |
| | |
| ALLIANCEBERNSTEIN MUNICIPAL INCOME FUND • | | 139 |
consideration of several fund criteria, including fund type, investment classification/objective, load type and similar 12b-1/non-12b-1 service fees, asset (size) comparability, and expense components and attributes.7 An EG will typically consist of seven to twenty funds.
The original EG of Insured California Portfolio had an insufficient number of peers, in the view of the Senior Officer and the Adviser. Consequently, at the request of the Senior Officer and the Adviser, Lipper expanded the Portfolio’s EG to include peers that had a similar but not the same Lipper investment classification/objective.
| | | | | | |
| Portfolio | | Contractual Management
Fee (%)8 | | Lipper Exp. Group Median (%) | | Rank |
| California Portfolio | | 0.450 | | 0.497 | | 4/13 |
| Insured California Portfolio | | 0.450 | | 0.525 | | 1/8 |
| Insured National Portfolio | | 0.450 | | 0.500 | | 1/7 |
| National Portfolio | | 0.450 | | 0.545 | | 2/17 |
| New York Portfolio9 | | 0.450 | | 0.533 | | 3/11 |
Because Lipper had expanded Insured California Portfolio’s EG, under Lipper’s standard guidelines, the Portfolio’s Lipper Expense Universe (“EU”) was also expanded to include universes of those peers that had a similar but not the same Lipper investment objective/classification.10 A “normal” EU will include funds that have the same investment objective/classification as the subject fund. 11 Set forth below is a comparison of the Portfolios’ total expense ratios and the
| 7 | Lipper does not consider average account size when constructing EGs. Funds with relatively small average account sizes tend to have higher transfer agent expense ratios than comparable sized funds that have relatively large average account sizes. Note that there are limitations on Lipper expense category data because different funds categorize expenses differently. |
| 8 | The contractual management fee rate for the Portfolio does not reflect any expense reimbursements made by the Portfolio to the Adviser for certain clerical, legal, accounting, administrative, and other services. In addition, the contractual management fee does not reflect any management waivers or expense reimbursements for expense caps that effectively reduce the effective (actual) advisory fee rate. |
| 9 | Note that one of the Portfolio’s peers is excluded in the contractual management fee rankings because Lipper is unable to calculate the fund’s contractual management fee due to the fund’s breakpoint gross income component. |
| 10 | The expansion of the Portfolio’s EU was not requested by the Adviser or the Senior Officer. They requested only that the EGs be expanded. |
| 11 | Except for asset size comparability, Lipper uses the same criteria for selecting an EG peer when selecting an EU peer. Unlike the EG, the EU allows for the same adviser to be represented by more than just one fund. |
| | |
| 140 | | • ALLIANCEBERNSTEIN MUNICIPAL INCOME FUND |
medians of the Portfolios’ EG and EU. The Portfolios’ total expense ratio rankings are also shown:
| | | | | | | | | | |
| Portfolio | | Expense Ratio (%)12 | | Lipper Exp. Group
Median (%) | | Lipper Group Rank | | Lipper Exp. Universe Median (%) | | Lipper
Universe Rank |
| California Portfolio | | 0.769 | | 0.785 | | 6/13 | | 0.820 | | 10/31 |
pro-forma13 | | 0.750 | | 0.785 | | 6/13 | | 0.820 | | 10/31 |
| | | | | | | | | | |
| Insured California Portfolio14 | | 1.081 | | 0.916 | | 7/8 | | 0.796 | | 43/45 |
| | | | | | | | | | |
| Insured National Portfolio | | 1.040 | | 0.905 | | 6/7 | | 0.874 | | 11/13 |
| | | | | | | | | | |
| National Portfolio | | 0.679 | | 0.834 | | 1/17 | | 0.824 | | 7/57 |
pro-forma14 | | 0.750 | | 0.834 | | 2/17 | | 0.824 | | 13/57 |
| | | | | | | | | | |
| New York Portfolio | | 0.579 | | 0.755 | | 1/12 | | 0.780 | | 1/26 |
pro-forma14 | | 0.750 | | 0.755 | | 5/12 | | 0.780 | | 9/26 |
Based on this analysis, except for National Portfolio, which has equally favorable rankings on a pro-forma basis for total expense ratio, the Portfolios have a more favorable ranking on a management fee basis than they do on a total expense ratio basis.
| III. | COSTS TO THE ADVISER AND ITS AFFILIATES OF SUPPLYING SERVICES PURSUANT TO THE ADVISORY FEE ARRANGEMENT, EXCLUDING ANY INTRA-CORPORATE PROFIT. |
The Adviser utilizes two profitability reporting systems, which operate independently but are aligned with each other, to estimate the Adviser’s profitability in connection with investment advisory services provided to the Portfolios. The Senior Officer has retained a consultant to provide independent advice regarding the alignment of the two profitability systems as well as the methodologies and allocations utilized by both profitability systems. See Section IV for additional discussion.
| IV. | PROFIT MARGINS OF THE ADVISER AND ITS AFFILIATES FOR SUPPLYING SUCH SERVICES. |
The profitability information for the Portfolios prepared by the Adviser for the Board of Directors was reviewed by the Senior Officer and the consultant. The Adviser’s profitability from providing investment advisory services to all of the Portfolios decreased during calendar year 2007 relative to 2006.
In addition to the Adviser’s direct profits from managing the Portfolios, certain of the Adviser’s affiliates have business relationships with the Portfolios and may
| 12 | Most recently completed fiscal year Class A share total expense ratio. |
| 13 | Pro-forma shows what the total expense ratio of the Portfolio would have been had changes made to the expense cap been in effect during the Portfolio’s entire fiscal year. |
| 14 | The Portfolio’s EU was expanded by Lipper under standard Lipper guidelines. |
| | |
| ALLIANCEBERNSTEIN MUNICIPAL INCOME FUND • | | 141 |
earn a profit from providing other services to the Portfolios. The courts have referred to this type of business opportunity as “fall-out benefits” to the Adviser and indicated that they should be factored into the evaluation of the total relationship between the Portfolios and the Adviser. Neither case law nor common business practice precludes the Adviser’s affiliates from earning a reasonable profit on this type of relationship. These affiliates provide transfer agent and distribution related services to the Portfolios and receive transfer agent fees, Rule 12b-1 payments, front-end sales loads and contingent deferred sales charges (“CDSC”).
AllianceBernstein Investments, Inc. (“ABI”), an affiliate of the Adviser, is the Portfolios’ principal underwriter. ABI and the Adviser have disclosed in the Portfolios’ prospectus that they may make revenue sharing payments from their own resources, in addition to resources derived from sales loads and Rule 12b-1 fees, to firms that sell shares of the Portfolios. In 2007, ABI paid approximately 0.04% of the average monthly assets of the AllianceBernstein Mutual Funds or approximately $24 million for distribution services and educational support (revenue sharing payments). For 2008, it is anticipated, ABI will pay approximately 0.04% of the average monthly assets of the AllianceBernstein Mutual Funds or approximately $28 million.15
ABI retained the following amounts for Class A front-end load sales charges from sales of the Portfolios’ Class A shares during the Portfolios’ most recently completed fiscal year:
| | | |
| Portfolio | | Amount Received |
| California Portfolio | | $ | 40,665 |
| Insured California Portfolio | | $ | 2,396 |
| Insured National Portfolio | | $ | 5,397 |
| National Portfolio | | $ | 27,889 |
| New York Portfolio | | $ | 29,443 |
ABI received the following Rule 12b-1 fees and CDSC for the Portfolios during the Portfolios’ most recently completed fiscal year:
| | | | | | |
| Portfolio | | 12b-1 Fee Received | | CDSC Received |
| California Portfolio | | $ | 3,596,988 | | $ | 26,308 |
| Insured California Portfolio | | $ | 500,559 | | $ | 26,308 |
| Insured National Portfolio | | $ | 562,063 | | $ | 7,160 |
| National Portfolio | | $ | 1,988,826 | | $ | 34,915 |
| New York Portfolio | | $ | 2,450,112 | | $ | 65,597 |
| 15 | ABI currently inserts the “Advance” in quarterly account statements and pays the incremental costs associated with the mailing. The incremental cost is less than what an “independent mailing” would cost. |
| | |
| 142 | | • ALLIANCEBERNSTEIN MUNICIPAL INCOME FUND |
Fees and reimbursements for out of pocket expenses charged by AllianceBernstein Investor Services, Inc. (“ABIS”), the affiliated transfer agent for the Portfolios, are charged on a per account basis, based on the level of the service provided and the class of share held by the account. ABIS also receives a fee per shareholder sub-account for each account maintained by an intermediary on an omnibus basis. Set forth below are the net fees which ABIS retained from the Portfolios during the Portfolios’ most recently completed fiscal year:16
| | | | | | |
| Portfolio | | ABIS Fee | | Expense Offset |
| California Portfolio | | $ | 151,315 | | $ | 13,532 |
| Insured California Portfolio | | $ | 22,129 | | $ | 1,964 |
| Insured National Portfolio | | $ | 49,443 | | $ | 5,654 |
| National Portfolio | | $ | 175,149 | | $ | 20,121 |
| New York Portfolio | | $ | 149,818 | | $ | 17,733 |
| V. | POSSIBLE ECONOMIES OF SCALE |
The Adviser has indicated that economies of scale are being shared with shareholders through fee structures,17 subsidies and enhancement to services. Based on some of the professional literature that has considered economies of scale in the mutual fund industry, it is thought that to the extent economies of scale exist, they may more often exist across a fund family as opposed to a specific fund. This is because the costs incurred by the Adviser, such as investment research or technology for trading or compliance systems, can be spread across a greater asset base as the fund family increases in size. It is also possible that as the level of services required to operate a successful investment company has increased over time, and advisory firms have made such investments in their business to provide services, there may be a sharing of economies of scale without a reduction in advisory fees.
An independent consultant, retained by the Senior Officer, provided the Board of Directors an update of the Deli18 study on advisory fees and various fund characteristics. The independent consultant first reiterated the results of his previous two dimensional comparison analysis (fund size and family size) with the Board of Directors.19 The independent consultant then discussed the results of
| 16 | The fees disclosed are net of any expense offsets with ABIS. An expense offset is created by the interest earned on the positive cash balance that occur within the transfer agent account as there is a one day lag with regards to money movement from the shareholder’s account to the transfer agent’s account and then from the transfer agent’s account to the Portfolio’s account. |
| 17 | Fee structures include fee reductions, pricing at scale and breakpoints in advisory fee schedules. |
| 18 | The Deli study was originally published in 2002 based on 1997 data. |
| 19 | The two dimensional analysis showed patterns of lower advisory fees for funds with larger asset sizes and funds from larger family sizes compared to funds with smaller asset sizes and funds from smaller family sizes, which according to the independent consultant is indicative of a sharing of economies of scale and scope. However, in less liquid and active markets, such is not the case, as the empirical analysis showed potential for diseconomies of scale in those markets. The empirical analysis also showed diminishing economies of scale and scope as funds surpassed a certain high level of assets. |
| | |
| ALLIANCEBERNSTEIN MUNICIPAL INCOME FUND • | | 143 |
the regression model that was utilized to study the effects of various factors on advisory fees. The regression model output indicated that the bulk of the variation in fees predicted were explained by various factors, but substantially by fund assets under management (“AUM”), family AUM, index fund indicator and investment style. The independent consultant also compared the advisory fees of the AllianceBernstein Mutual Funds to similar funds managed by 19 other large asset managers, regardless of fund size and the large asset manager’s proportion of mutual fund assets to non-mutual fund assets.
| VI. | NATURE AND QUALITY OF THE ADVISER’S SERVICES INCLUDING THE PERFORMANCE OF THE PORTFOLIOS. |
With assets under management of $590 billion as of September 30, 2008, the Adviser has the investment experience to manage and provide non-investment services (described in Section I) to the Portfolios.
The information below, prepared by Lipper, shows the 1, 3, 5 and 10 year performance returns and rankings of the Portfolios20 relative to their Lipper Performance Group (“PG”) and Lipper Performance Universe (“PU”)21 for the periods ended July 31, 2008.22
| | | | | | | | | | |
| California Portfolio | | Portfolio Return
(%) | | PG Median
(%) | | PU Median
(%) | | PG Rank | | PU Rank |
1 year | | 1.01 | | 0.52 | | 0.04 | | 4/13 | | 10/34 |
3 year | | 2.75 | | 2.29 | | 2.14 | | 2/13 | | 3/32 |
5 year | | 4.74 | | 3.84 | | 3.88 | | 1/12 | | 1/31 |
10 year | | 4.24 | | 4.20 | | 4.17 | | 5/11 | | 9/26 |
| | | | | | | | | | |
Insured California
Portfolio | | Portfolio Return
(%) | | PG Median
(%) | | PU Median
(%) | | PG Rank | | PU Rank |
1 year | | 1.15 | | -0.50 | | 2.65 | | 1/3 | | 29/34 |
3 year | | 2.20 | | 1.76 | | 2.65 | | 1/3 | | 29/33 |
5 year | | 3.76 | | 3.27 | | 3.60 | | 1/3 | | 11/33 |
10 year | | 4.13 | | 3.89 | | 4.28 | | 1/3 | | 22/33 |
| 20 | The performance returns and rankings are for the Class A shares of the Portfolios. It should be noted that the performance returns of the Portfolios that were shown were provided by the Adviser. Lipper maintains its own database that includes the Portfolios’ performance returns. However, differences in distribution price (ex-date versus payable date) and rounding differences may cause the Adviser’s own performance returns of the Portfolios to be one or two basis points different from Lipper. To maintain consistency in this evaluation, the performance returns of the Portfolios, as reported by the Adviser, are provided instead of Lipper. |
| 21 | The Portfolios PG/PU may not be necessarily identical to the Portfolios EG/EU as the criteria for including or excluding a fund in/from a PG/PU are somewhat different than that of an EU/EG. |
| 22 | Note that the current Lipper investment classification/objective dictates the PG and PU throughout the life of each Portfolio even if the Portfolio may have had a different investment classification/objective at different points in time. |
| | |
| 144 | | • ALLIANCEBERNSTEIN MUNICIPAL INCOME FUND |
| | | | | | | | | | |
Insured National
Portfolio | | Portfolio Return
(%) | | PG Median
(%) | | PU Median
(%) | | PG Rank | | PU Rank |
1 year | | 2.07 | | 2.31 | | 2.02 | | 5/7 | | 6/13 |
3 year | | 2.75 | | 2.52 | | 2.35 | | 2/7 | | 2/13 |
5 year | | 4.67 | | 3.45 | | 3.44 | | 1/7 | | 1/13 |
10 year | | 4.14 | | 4.06 | | 4.03 | | 3/7 | | 4/13 |
| | | | | | | | | | |
| National Portfolio | | Portfolio Return
(%) | | PG Median
(%) | | PU Median
(%) | | PG Rank | | PU Rank |
1 year | | 0.62 | | 0.62 | | 1.00 | | 9/17 | | 38/61 |
3 year | | 2.79 | | 2.22 | | 2.32 | | 4/17 | | 14/59 |
5 year | | 4.66 | | 3.64 | | 3.64 | | 1/16 | | 2/58 |
10 year | | 3.85 | | 3.85 | | 4.04 | | 8/15 | | 33/49 |
| | | | | | | | | | |
| New York Portfolio | | Portfolio Return
(%) | | PG Median
(%) | | PU Median
(%) | | PG Rank | | PU Rank |
1 year | | 2.29 | | 1.79 | | 1.60 | | 5/12 | | 10/29 |
3 year | | 3.09 | | 2.54 | | 2.46 | | 2/11 | | 3/27 |
5 year | | 4.66 | | 3.85 | | 3.86 | | 1/11 | | 2/27 |
10 year | | 4.36 | | 4.29 | | 4.26 | | 4/10 | | 8/23 |
Set forth below are the 1, 3, 5, 10 year and since inception net performance returns of the Portfolios (in bold)23 versus its benchmarks.24 Portfolio and benchmark volatility and reward-to-variability ratio (“Sharpe Ratio”)
| 23 | The performance returns and risk measures shown in the table are for the Class A shares of the Portfolios. |
| 24 | The Adviser provided Portfolio and benchmark performance return information for the periods through July 31, 2008. |
| | |
| ALLIANCEBERNSTEIN MUNICIPAL INCOME FUND • | | 145 |
information is also shown.25 Note that each Portfolio’s benchmark is the Lehman Brothers Municipal Bond Index.
| | | | | | | | | | | | | | | | |
| | | Periods Ending July 31, 2008
Annualized Net Performance |
| | | 1 Year
(%) | | 3 Year
(%) | | 5 Year
(%) | | 10 Year
(%) | | Since
Inception
(%) | | Annualized | | Risk
Period
(Year) |
| | | | | | | | Volatility
(%) | | Sharpe
(%) | |
| California Portfolio | | 1.01 | | 2.75 | | 4.74 | | 4.24 | | 6.32 | | 4.44 | | 0.16 | | 10 |
| Lehman Brothers Municipal Bond Index | | 2.83 | | 3.22 | | 4.35 | | 4.91 | | 6.44 | | 4.04 | | 0.33 | | 10 |
| Inception Date: December 29, 1986 | | | | | | |
| | | | | | | | |
| Insured California Portfolio | | 1.15 | | 2.20 | | 3.76 | | 4.13 | | 6.21 | | 5.34 | | 0.12 | | 10 |
| Lehman Brothers Municipal Bond Index | | 2.83 | | 3.22 | | 4.35 | | 4.91 | | 6.99 | | 4.04 | | 0.33 | | 10 |
| Inception Date: November 21, 1985 | | | | | | |
| | | | | | | | |
| Insured National Portfolio | | 2.07 | | 2.75 | | 4.67 | | 4.14 | | 6.09 | | 4.45 | | 0.14 | | 10 |
| Lehman Brothers Municipal Bond Index | | 2.83 | | 3.22 | | 4.35 | | 4.91 | | 6.44 | | 4.04 | | 0.33 | | 10 |
| Inception Date: December 29, 1986 | | | | | | |
| | | | | | | | |
| National Portfolio | | 0.62 | | 2.79 | | 4.66 | | 3.85 | | 6.16 | | 3.96 | | 0.08 | | 10 |
| Lehman Brothers Municipal Bond Index | | 2.83 | | 3.22 | | 4.35 | | 4.91 | | 6.44 | | 4.04 | | 0.33 | | 10 |
| Inception Date: December 29, 1986 | | | | | | |
| | | | | | | | |
| New York Portfolio | | 2.29 | | 3.09 | | 4.66 | | 4.36 | | 5.97 | | 3.93 | | 0.20 | | 10 |
| Lehman Brothers Municipal Bond Index | | 2.83 | | 3.22 | | 4.35 | | 4.91 | | 6.44 | | 4.04 | | 0.33 | | 10 |
| Inception Date: December 29, 1986 | | | | | | |
| 25 | Portfolio and benchmark volatility and Sharpe Ratio information was obtained through Lipper LANA, a database maintained by Lipper. Volatility is a statistical measure of the tendency of a market price or yield to vary over time. A Sharpe Ratio is a risk adjusted measure of return that divides a fund’s return in excess of the riskless return by the fund’s standard deviation. A fund with a greater volatility would be seen as more risky than a fund with equivalent performance but lower volatility; for that reason, a greater return would be demanded for the more risky fund. A fund with a higher Sharpe Ratio would be viewed as better performing than a fund with a lower Sharpe Ratio. |
| | |
| 146 | | • ALLIANCEBERNSTEIN MUNICIPAL INCOME FUND |
CONCLUSION:
Based on the factors discussed above the Senior Officer’s conclusion is that the proposed advisory fees for the Portfolios are reasonable and within the range of what would have been negotiated at arms-length in light of all the surrounding circumstances. This conclusion in respect of the Portfolios is based on an evaluation of all of these factors and no single factor was dispositive.
Dated: November 25, 2008
| | |
| ALLIANCEBERNSTEIN MUNICIPAL INCOME FUND • | | 147 |
THIS PAGE IS NOT PART OF THE SHAREHOLDER REPORT OR THE FINANCIAL STATEMENTS
ALLIANCEBERNSTEIN FAMILY OF FUNDS
Wealth Strategies Funds
Balanced Wealth Strategy
Wealth Appreciation Strategy
Wealth Preservation Strategy
Tax-Managed Balanced Wealth Strategy
Tax-Managed Wealth Appreciation Strategy
Tax-Managed Wealth Preservation Strategy
Blended Style Funds
U.S. Large Cap Portfolio
International Portfolio
Tax-Managed International Portfolio
Growth Funds
Domestic
Growth Fund
Large Cap Growth Fund
Small Cap Growth Portfolio
Small/Mid Cap Growth Fund*
Global & International
Global Growth Fund*
Global Thematic Growth Fund*
Greater China ‘97 Fund
International Growth Fund
Value Funds
Domestic
Balanced Shares
Focused Growth & Income Fund
Growth & Income Fund
Small/Mid Cap Value Fund
Utility Income Fund
Value Fund
Global & International
Global Real Estate Investment Fund
Global Value Fund
International Value Fund
Taxable Bond Funds
Diversified Yield Fund
Global Bond Fund
High Income Fund*
Intermediate Bond Portfolio
Short Duration Portfolio
Municipal Bond Funds
| | |
National
National II*
Arizona
California
California II*
Florida
Massachusetts | | Michigan
Minnesota
New Jersey
New York
Ohio
Pennsylvania
Virginia |
Intermediate Municipal Bond Funds
Intermediate California
Intermediate Diversified
Intermediate New York
Closed-End Funds
AllianceBernstein Global High Income Fund
AllianceBernstein Income Fund
AllianceBernstein National Municipal Income Fund
ACM Managed Dollar Income Fund
Alliance California Municipal Income Fund
Alliance New York Municipal Income Fund
The Spain Fund
Retirement Strategies Funds
| | | | |
2000 Retirement Strategy | | 2020 Retirement Strategy | | 2040 Retirement Strategy |
2005 Retirement Strategy | | 2025 Retirement Strategy | | 2045 Retirement Strategy |
2010 Retirement Strategy | | 2030 Retirement Strategy | | 2050 Retirement Strategy |
2015 Retirement Strategy | | 2035 Retirement Strategy | | 2055 Retirement Strategy |
We also offer Exchange Reserves,** which serves as the money market fund exchange vehicle for the AllianceBernstein mutual funds.
You should consider the investment objectives, risks, charges and expenses of any AllianceBernstein fund/portfolio carefully before investing. For free copies of our prospectuses, which contain this and other information, visit us online at www.alliancebernstein.com or contact your financial advisor. Please read the prospectus carefully before investing.
| * | | Prior to January 28, 2008, High Income Fund was named Emerging Market Debt Fund. Prior to November 3, 2008, Small/Mid Cap Growth Fund was named Mid-Cap Growth Fund, Global Growth Fund was named Global Research Growth Fund, and Global Thematic Growth Fund was named Global Technology Fund. Prior to December 1, 2008, National II was named Insured National and California II was named Insured California. |
| ** | An investment in the Fund is not a deposit in a bank and is not insured or guaranteed by the Federal Deposit Insurance Corporation or any other government agency. Although the Fund seeks to preserve the value of your investment at $1.00 per share, it is possible to lose money by investing in the Fund. |
| | |
| 148 | | • ALLIANCEBERNSTEIN MUNICIPAL INCOME FUND |
AllianceBernstein Family of Funds
ALLIANCEBERNSTEIN MUNICIPAL INCOME FUND
1345 Avenue of the Americas
New York, NY 10105 800.221.5672
| | |
| |
| MI-0151-1008 | |  |
(a) The registrant has adopted a code of ethics that applies to its principal executive officer, principal financial officer and principal accounting officer. A copy of the registrant’s code of ethics is filed herewith as Exhibit 12(a)(1).
(b) During the period covered by this report, no material amendments were made to the provisions of the code of ethics adopted in 2(a) above.
(c) During the period covered by this report, no implicit or explicit waivers to the provisions of the code of ethics adopted in 2(a) above were granted.
| ITEM 3. | AUDIT COMMITTEE FINANCIAL EXPERT. |
The registrant’s Board of Directors has determined that independent directors Garry L. Moody and William H. Foulk, Jr. qualify as audit committee financial experts.
| ITEM 4. | PRINCIPAL ACCOUNTANT FEES AND SERVICES. |
(a) - (c) The following table sets forth the aggregate fees billed by the independent registered public accounting firm Ernst & Young LLP, for the Fund’s last two fiscal years for professional services rendered for: (i) the audit of the Fund’s annual financial statements included in the Fund’s annual report to stockholders; (ii) assurance and related services that are reasonably related to the performance of the audit of the Fund’s financial statements and are not reported under (i), which include advice and education related to accounting and auditing issues and quarterly press release review (for those Funds which issue press releases), and preferred stock maintenance testing (for those Funds that issue preferred stock); and (iii) tax compliance, tax advice and tax return preparation.
| | | | | | | | | | | |
| | | | | Audit Fees | | Audit-Related
Fees | | Tax Fees |
-California Portfolio | | 2007 | | $ | 33,200 | | $ | 4,562 | | $ | 13,575 |
| | 2008 | | $ | 35,110 | | $ | 3,440 | | $ | 13,625 |
-California Portfolio II | | 2007 | | $ | 33,200 | | $ | 4,548 | | $ | 13,575 |
| | 2008 | | $ | 35,110 | | $ | 3,440 | | $ | 13,625 |
-National Portfolio II | | 2007 | | $ | 33,200 | | $ | 4,548 | | $ | 13,575 |
| | 2008 | | $ | 35,110 | | $ | 3,440 | | $ | 13,625 |
-National Portfolio | | 2007 | | $ | 33,200 | | $ | 4,556 | | $ | 13,575 |
| | 2008 | | $ | 35,110 | | $ | 3,440 | | $ | 13,625 |
-New York Portfolio | | 2007 | | $ | 33,200 | | $ | 4,557 | | $ | 13,575 |
| | 2008 | | $ | 35,110 | | $ | 3,440 | | $ | 13,625 |
(d) Not applicable.
(e) (1) Beginning with audit and non-audit service contracts entered into on or after May 6, 2003, the Fund’s Audit Committee policies and procedures require the pre-approval of all audit and non-audit services provided to the Fund by the Fund’s independent registered public accounting firm. The Fund’s Audit Committee policies and procedures also require pre-approval of all audit and non-audit services provided to the Adviser and Service Affiliates to the extent that these services are directly related to the operations or financial reporting of the Fund.
(e) (2) All of the amounts for Audit Fees, Audit-Related Fees and Tax Fees in the table under Item 4 (a) – (c) are for services pre-approved by the Fund’s Audit Committee.
(f) Not applicable.
(g) The following table sets forth the aggregate non-audit services provided to the Fund, the Fund’s Adviser and entities that control, are controlled by or under common control with the Adviser that provide ongoing services to the Fund, which include preparing an annual internal control report pursuant to Statement on Auditing Standards No. 70 (“Service Affiliates”):
| | | | | | | | | |
| | | | | All Fees for
Non-Audit Services
Provided to the
Portfolio, the Adviser
and Service Affiliates | | Total Amount of
Foregoing Column Pre-approved
by the Audit Committee
(Portion Comprised of Audit
Related Fees)
(Portion Comprised of Tax Fees) | |
-California Portfolio | | 2007 | | $ | 890,755 | | $ | 119,520 | |
| | | | | | | $ | (119,520 | ) |
| | | | | | | $ | — | |
| | 2008 | | $ | 977,410 | | $ | 160,184 | |
| | | | | | | $ | (146,559 | ) |
| | | | | | | $ | (13,625 | ) |
-California Portfolio II | | 2007 | | $ | 890,755 | | $ | 119,520 | |
| | | | | | | $ | (119,520 | ) |
| | | | | | | $ | — | |
| | 2008 | | $ | 977,410 | | $ | 160,184 | |
| | | | | | | $ | (146,559 | ) |
| | | | | | | $ | (13,625 | ) |
-National Portfolio II | | 2007 | | $ | 890,755 | | $ | 119,520 | |
| | | | | | | $ | (119,520 | ) |
| | | | | | | $ | — | |
| | 2008 | | $ | 977,410 | | $ | 160,184 | |
| | | | | | | $ | (146,559 | ) |
| | | | | | | $ | (13,625 | ) |
-National Portfolio | | 2007 | | $ | 890,755 | | $ | 119,520 | |
| | | | | | | $ | (119,520 | ) |
| | | | | | | $ | — | |
| | 2008 | | $ | 977,410 | | $ | 160,184 | |
| | | | | | | $ | (146,559 | ) |
| | | | | | | $ | (13,625 | ) |
-New York Portfolio | | 2007 | | $ | 890,755 | | $ | 119,520 | |
| | | | | | | $ | (119,520 | ) |
| | | | | | | $ | — | |
| | 2008 | | $ | 977,410 | | $ | 160,184 | |
| | | | | | | $ | (146,559 | ) |
| | | | | | | $ | (13,625 | ) |
(h) The Audit Committee of the Fund has considered whether the provision of any non-audit services not pre-approved by the Audit Committee provided by the Fund’s independent registered public accounting firm to the Adviser and Service Affiliates is compatible with maintaining the auditor’s independence.
| ITEM 5. | AUDIT COMMITTEE OF LISTED REGISTRANTS. |
Not applicable to the registrant.
| ITEM 6. | SCHEDULE OF INVESTMENTS. |
Please see Schedule of Investments contained in the Report to Shareholders included under Item 1 of this Form N-CSR.
| ITEM 7. | DISCLOSURE OF PROXY VOTING POLICIES AND PROCEDURES FOR CLOSED-END MANAGEMENT INVESTMENT COMPANIES. |
Not applicable to the registrant.
| ITEM 8. | PORTFOLIO MANAGERS OF CLOSED-END MANAGEMENT INVESTMENT COMPANIES. |
Not applicable to the registrant.
| ITEM 9. | PURCHASES OF EQUITY SECURITIES BY CLOSED-END MANAGEMENT INVESTMENT COMPANY AND AFFILIATED PURCHASERS. |
Not applicable to the registrant.
| ITEM 10. | SUBMISSION OF MATTERS TO A VOTE OF SECURITY HOLDERS. |
There have been no material changes to the procedures by which shareholders may recommend nominees to the Fund’s Board of Directors since the Fund last provided disclosure in response to this item.
| ITEM 11. | CONTROLS AND PROCEDURES. |
(a) The registrant’s principal executive officer and principal financial officer have concluded that the registrant’s disclosure controls and procedures (as defined in Rule 30a-3 (c) under the Investment Company Act of 1940, as amended) are effective at the reasonable assurance level based on their evaluation of these controls and procedures as of a date within 90 days of the filing date of this document.
(b) There were no changes in the registrant’s internal controls over financial reporting that occurred during the second fiscal quarter of the period that has materially affected, or is reasonably likely to materially affect, the registrant’s internal control over financial reporting.
The following exhibits are attached to this Form N-CSR:
| | |
| EXHIBIT NO. | | DESCRIPTION OF EXHIBIT |
| |
| 12 (a) (1) | | Code of Ethics that is subject to the disclosure of Item 2 hereof |
| |
| 12 (b) (1) | | Certification of Principal Executive Officer Pursuant to Section 302 of the Sarbanes-Oxley Act of 2002 |
| |
| 12 (b) (2) | | Certification of Principal Financial Officer Pursuant to Section 302 of the Sarbanes-Oxley Act of 2002 |
| |
| 12 (c) | | Certification of Principal Executive Officer and Principal Financial Officer Pursuant to Section 906 of the Sarbanes-Oxley Act of 2002 |
SIGNATURES
Pursuant to the requirements of the Securities Exchange Act of 1934 and the Investment Company Act of 1940, the registrant has duly caused this report to be signed on its behalf by the undersigned, thereunto duly authorized.
(Registrant): AllianceBernstein Municipal Income Fund, Inc.
| | |
| |
| By: | | /s/ Robert M. Keith |
| | Robert M. Keith President |
| |
| Date: | | December 27, 2008 |
Pursuant to the requirements of the Securities Exchange Act of 1934 and the Investment Company Act of 1940, this report has been signed below by the following persons on behalf of the registrant and in the capacities and on the dates indicated.
| | |
| |
| By: | | /s/ Robert M. Keith |
| | Robert M. Keith |
| | President |
| |
| Date: | | December 27, 2008 |
| |
| By: | | /s/ Joseph J. Mantineo |
| | Joseph J. Mantineo |
| | Treasurer and Chief Financial Officer |
| |
| Date: | | December 27, 2008 |