UNITED STATES
SECURITIES AND EXCHANGE COMMISSION
WASHINGTON, D.C. 20549
FORM N-CSR
CERTIFIED SHAREHOLDER REPORT OF REGISTERED
MANAGEMENT INVESTMENT COMPANIES
Investment Company Act file number: 811-04791
AB MUNICIPAL INCOME FUND, INC.
(Exact name of registrant as specified in charter)
1345 Avenue of the Americas, New York, New York 10105
(Address of principal executive offices) (Zip code)
Joseph J. Mantineo
AllianceBernstein L.P.
1345 Avenue of the Americas
New York, New York 10105
(Name and address of agent for service)
Registrant’s telephone number, including area code: (800) 221-5672
Date of fiscal year end: May 31, 2015
Date of reporting period: May 31, 2015
| ITEM 1. | REPORTS TO STOCKHOLDERS. |
MAY 05.31.15
ANNUAL REPORT
AB MUNICIPAL INCOME FUND
| + | | AB CALIFORNIA PORTFOLIO |
| + | | AB HIGH INCOME MUNICIPAL PORTFOLIO |
Investment Products Offered
|
• Are Not FDIC Insured • May Lose Value • Are Not Bank Guaranteed |
Investors should consider the investment objectives, risks, charges and expenses of the Fund carefully before investing. For copies of our prospectus or summary prospectus, which contain this and other information, visit us online at www.abglobal.com or contact your AB representative. Please read the prospectus and/or summary prospectus carefully before investing.
This shareholder report must be preceded or accompanied by the Fund’s prospectus for individuals who are not current shareholders of the Fund.
You may obtain a description of the Fund’s proxy voting policies and procedures, and information regarding how the Fund voted proxies relating to portfolio securities during the most recent 12-month period ended June 30, without charge. Simply visit AB’s website at www.abglobal.com, or go to the Securities and Exchange Commission’s (the “Commission”) website at www.sec.gov, or call AB at (800) 227-4618.
The Fund files its complete schedule of portfolio holdings with the Commission for the first and third quarters of each fiscal year on Form N-Q. The Fund’s Forms N-Q are available on the Commission’s website at www.sec.gov. The Fund’s Forms N-Q may also be reviewed and copied at the Commission’s Public Reference Room in Washington, DC; information on the operation of the Public Reference Room may be obtained by calling (800) SEC-0330. AB publishes full portfolio holdings for the Fund monthly at www.abglobal.com.
AllianceBernstein Investments, Inc. (ABI) is the distributor of the AB family of mutual funds. ABI is a member of FINRA and is an affiliate of AllianceBernstein L.P., the Adviser of the funds.
The [A/B] logo is service mark of AllianceBernstein and AllianceBernstein® is a registered trademark used by permission of the owner, AllianceBernstein L.P.
July 8, 2015
Annual Report
This report provides management’s discussion of fund performance for the portfolios of AB Municipal Income Fund (the “Fund”) for the annual reporting period ended May 31, 2015. Effective January 20, 2015, the Fund’s name changed from AllianceBernstein Municipal Income Fund to AB Municipal Income Fund. The Fund has four portfolios: AB California Portfolio, AB High Income Municipal Portfolio, AB National Portfolio and AB New York Portfolio (together, the “Portfolios”).*
Investment Objective and Policies
The investment objective of the California, National and New York Portfolios is to earn the highest level of current income, exempt from federal income tax, and in the case of the California and New York Portfolios, state taxation of the respective state, that is available without assuming what AllianceBernstein L.P. (the “Adviser”) considers to be undue risk to principal or income. Each of the California Portfolio, National Portfolio and New York Portfolio invests principally in high-yielding, predominantly investment-grade municipal securities. The investment objective of the High Income Municipal Portfolio is to earn the highest level of current income, exempt from federal income tax, that is available consistent with what the Adviser considers to be an appropriate level of risk. The High Income Municipal Portfolio invests principally in high-yielding municipal securities that may be non-investment grade or investment grade.
Each Portfolio invests, under normal circumstances, at least 80% of its net assets in municipal securities with interest that is exempt from federal income tax. These securities may pay interest that is subject to the federal Alternative Minimum Tax for certain taxpayers. Each of the Portfolios that invest in a named state pursues its objective by investing at least 80% of its net assets in municipal securities issued by the named state or municipal securities with interest that is otherwise exempt from the named state’s income tax. The National Portfolio may invest 25% or more of its net assets in a single state.
The California, National and New York Portfolios may also invest in forward commitments, Tender Option Bond transactions (“TOBs”), zero coupon municipal securities and variable, floating and inverse floating rate municipal securities and derivatives, such as options, futures, forwards and swaps.
The High Income Municipal Portfolio may invest without limit in lower-rated securities (“junk bonds”), which may include securities having the lowest rating, and in unrated securities that, in the Adviser’s judgment, would be lower-rated securities if rated. The High Income Municipal Portfolio may invest in fixed-income securities with any maturity or duration. The Portfolio will seek to increase income for shareholders by investing in longer-maturity bonds. Consistent with its
| * | | The Fund’s Board of Directors recently approved a change to the Portfolios’ fiscal year ends from October 31 to May 31. The change was approved for tax planning and efficiency purposes. |
| | | | |
| AB MUNICIPAL INCOME FUND • | | | 1 | |
objective of seeking a higher level of income, the Portfolio may experience greater volatility and a higher risk of loss of principal than other municipal funds. The Portfolio may also invest in forward commitments; zero coupon municipal securities and variable, floating and inverse floating rate municipal securities and certain types of mortgage related securities. The Portfolio may invest in derivatives, such as options, futures, forwards and swaps. The Portfolio may make short sales of securities or maintain a short position, and may use other investment techniques. The Portfolio may use leverage for investment purposes to increase income through the use of TOBs and derivative instruments, such as interest rate swaps.
Investment Results
The tables on pages 8-11 show performance for each Portfolio compared with its benchmark, the Barclays Municipal Bond Index, for the six-, seven- and 12-month periods ended May 31, 2015.
AB California Portfolio – For both the six- and seven-month periods, all share classes underperformed the benchmark. For the 12-month period, Class A and Advisor Class shares outperformed the benchmark, while Class B and C shares underperformed. In the six-month period, security selection in the pre-refunded and power sectors detracted from returns compared to the benchmark, as did an underweight in health care. Security selection within the leasing, special tax and water sectors had a positive impact on performance. In the seven-month
period, security selection within the pre-refunded and water sectors detracted from returns, as did an underweight in health care. Security selection in the leasing and local general obligation sectors contributed to returns. In the 12-month period, security selection within the transportation, leasing, special tax and local general obligation sectors contributed to performance. An underweight in the state general obligation sector also had a positive impact on returns. Security selection in the pre-refunded and water sectors detracted, as did an underweight in health care and overweight in the pre-refunded sector. The Portfolio utilized interest rate swaps for hedging purposes, which detracted from absolute performance for the six-, seven and 12-month periods.
AB High Income Municipal Portfolio – For the six-, seven- and 12-month periods, all share classes outperformed the benchmark. Across all three time periods, an overweight to higher yielding, more credit-sensitive holdings contributed positively to performance compared to the benchmark, as these holdings outperformed the general market. During the six- and seven-month periods, security selection within the health care, industrials, education, water and special tax sectors contributed to performance. Overweights in the health care and industrials sectors also had a positive impact on returns. In the 12-month period, security selection within the health care, education, special tax and water sectors contributed to performance. Overweights in the health care and
| | |
| 2 | | • AB MUNICIPAL INCOME FUND |
industrials sectors also impacted returns positively, as did an underweight in the state general obligation sector. Security selection within the power sector detracted from performance in the 12-month period. The Portfolio utilized interest rate swaps for hedging purposes, that detracted from absolute performance for the six-, seven- and 12-month periods. Credit default swaps were used for investment purposes, which added to performance for the three periods. Purchased options were used for hedging purposes, which had no material impact on performance for the six- or seven-month periods, and detracted for the 12-month periods. Written options were used for investment purposes, which had no material impact on performance for the three periods.
AB National Portfolio – For both the six- and seven-month periods, all share classes underperformed the benchmark. In the 12-month period, Advisor Class shares outperformed the benchmark, while all other share classes underperformed. In the six- and seven-month periods, security selection within the transportation and health care sectors detracted from performance, versus the benchmark. Security selection in the leasing sector contributed positively to returns. In the 12-month period, security selection within the power sector detracted from performance. Security selection in the special tax and leasing sectors contributed to returns, as did an underweight in the state general obligation sector. The Portfolio utilized interest rate swaps for hedging purposes, that
had no material impact on absolute performance for the six-, seven or 12-month periods.
AB New York Portfolio – For the six- and seven-month periods, Class A and Advisor Class shares outperformed the benchmark, while Class B and C shares underperformed. For the 12-month period, Advisor Class shares outperformed the benchmark, while all other share classes underperformed. In the six-month period, security selection within the education and health care sectors contributed positively to returns, versus the benchmark. Security selection in the transportation and pre-refunded sectors detracted from performance. In the seven-month period, security selection in the education and health care sectors contributed to performance, while selection in the pre-refunded, special tax and transportation sectors detracted. In the 12-month period, security selection within the power and pre-refunded sectors detracted from performance. Security selection in the education and health care sectors contributed to returns. An underweight in the state general obligation sector also had a positive impact on performance. The Portfolio utilized interest rate swaps for hedging purposes, that had no material impact on absolute performance for the six-, seven or 12-month periods.
Market Review and Investment Strategy
Bond markets experienced substantial volatility during the
12-month period ended May 31, 2015. Oil prices plunged, prompting concerns about global economic growth and deflation
| | | | |
| AB MUNICIPAL INCOME FUND • | | | 3 | |
in many oil-producing regions. So far in 2015, more than 20 central banks worldwide have eased monetary policy and several have engaged in some form of quantitative easing. In response, 10-year Treasury yields fell 10 basis points (“bps”) during the six- month period, 24 bps during the seven-month period and 36 bps over the 12-month period. High-grade municipal yields rose by 12 bps over the six-month period, rose 12 bps during the seven-month period and rose 5 bps over the 12-month period. The market has started to anticipate an increase in the U.S. Federal Funds target rate; consequently, short-maturity municipal yields have risen more than longer-maturity municipal yields over the three periods. Investor demand for municipals has remained positive, but new supply has also increased as municipal issuers sold bonds to lower their interest costs by refinancing existing bonds.
Mid-grade and high-yield municipal bonds outperformed comparable high-grade credits as investors seemed to view lower oil prices and easing monetary policy globally to be ultimately beneficial to the health of the U.S. economy.
The Portfolios may purchase municipal securities that are insured under policies issued by certain insurance companies. Historically, insured municipal securities typically received a higher credit rating, which meant that the issuer of the securities paid a lower interest rate. As a result of declines in the credit quality
and associated downgrades of most fund insurers, insurance has less value than it did in the past. The market now values insured municipal securities primarily based on the credit quality of the issuer of the security with little value given to the insurance feature. In purchasing such insured securities, the Adviser evaluates the risk and return of municipal securities through its own research. The ratings of most insurance companies have been downgraded and it is possible that an insurance company may become insolvent. If an insurance company’s rating is downgraded or the company becomes insolvent, the prices of municipal securities insured by the insurance company may decline. The Municipal Bond Investment Team believes that downgrades in insurance company ratings or insurance insolvencies present limited risk to the Portfolios.
As of May 31, 2015, the Portfolios’ percentages of total investments in insured bonds and in insured bonds that have been pre-refunded are as follows:
| | | | | | | | |
| Portfolio | | Insured
Bonds* | | | Pre-refunded/
ETM†/
insured Bonds* | |
California | | | 14.82 | % | | | 0.75 | % |
High Income Municipal | | | 4.00 | | | | 0.48 | |
National | | | 14.44 | | | | 1.81 | |
New York | | | 12.85 | | | | 0.20 | |
| * | | Breakdowns expressed as a percentage of investments in municipal bonds. |
| | |
| 4 | | • AB MUNICIPAL INCOME FUND |
DISCLOSURES AND RISKS
Benchmark Disclosure
The unmanaged Barclays Municipal Bond Index does not reflect fees and expenses associated with the active management of a mutual fund portfolio. The Barclays Municipal Bond Index represents the performance of the long-term tax-exempt bond market consisting of investment grade bonds. An investor cannot invest directly in an index, and its results are not indicative of the performance for any specific investment, including the Portfolios.
A Word About Risk
Market Risk: The value of the Portfolios’ assets will fluctuate as the bond market fluctuates. The value of the Portfolios’ investments may decline, sometimes rapidly and unpredictably, simply because of economic changes or other events that affect large portions of the market.
Credit Risk: An issuer or guarantor of a fixed-income security, or the counterparty to a derivatives or other contract, may be unable or unwilling to make timely payments of interest or principal, or to otherwise honor its obligations. The issuer or guarantor may default, causing a loss of the full principal amount of a security. The degree of risk for a particular security may be reflected in its credit rating. There is the possibility that the credit rating of a fixed-income security may be downgraded after purchase, which may adversely affect the value of the security. Investments in fixed income securities with lower ratings tend to have a higher probability that an issuer will default or fail to meet its payment obligations.
Below Investment Grade Securities Risk: (High Income Municipal Portfolio) Investments in fixed-income securities with lower ratings (commonly known as “junk bonds”) tend to have a higher probability that an issuer will default or fail to meet its payment obligations. These securities may be subject to greater price volatility due to such factors as specific corporate developments, interest rate sensitivity, negative performance of the junk bond market generally and less secondary market liquidity.
Leverage Risk (High Income Municipal Portfolio): To the extent the Portfolio uses leveraging techniques, such as TOBs, its net asset value (“NAV”) may be more volatile because leverage tends to exaggerate the effect of changes in interest rates and any increase or decrease in the value of the Portfolio’s investments.
Municipal Market Risk: This is the risk that special factors may adversely affect the value of municipal securities and have a significant effect on the yield or value of the Portfolios’ investments in municipal securities. These factors include economic conditions, political or legislative changes, uncertainties related to the tax status of municipal securities, or the rights of investors in these securities. To the extent that the Portfolios invest more of its assets in a particular state’s municipal securities, the Portfolios may be vulnerable to events adversely affecting that state, including economic, political and regulatory occurrences, court decisions, terrorism and catastrophic natural disasters, such as hurricanes or earthquakes. The Portfolios’ investments in certain municipal securities with principal and interest payments that are made from the revenues of a specific project or facility, and not general tax revenues, may have increased risks. Factors affecting the project or facility, such as local business or economic conditions, could have a significant effect on the project’s ability to make payments of principal and interest on these securities.
The Portfolios may invest in the municipal securities of Puerto Rico and other U.S. territories, which are exempt from federal, state, and, where applicable, local income taxes. Like many U.S. states and municipalities, Puerto Rico experienced a significant downturn during the recent recession. As a result of Puerto Rico’s challenging economic and fiscal environment, many ratings organizations have downgraded a number of municipal securities issued in Puerto Rico or placed them on a “negative
(Disclosures, Risks and Note about Historical Performance continued on next page)
| | | | |
| AB MUNICIPAL INCOME FUND • | | | 5 | |
Disclosures and Risks
DISCLOSURES AND RISKS
(continued from previous page)
watch”. If the economic situation in Puerto Rico persists or worsens, the volatility, credit quality and performance of the Portfolios could be adversely affected.
Tax Risk: There is no guarantee that all of the Portfolios’ income will remain exempt from federal or state income taxes. From time to time, the U.S. Government and the U.S. Congress consider changes in federal tax law that could limit or eliminate the federal tax exemption for municipal bond income, which would in effect reduce the income received by shareholders from the Portfolios by increasing taxes on that income. In such event, the Portfolios’ NAV could also decline as yields on municipal bonds, which are typically lower than those on taxable bonds, would be expected to increase to approximately the yield of comparable taxable bonds. Actions or anticipated actions affecting the tax exempt status of municipal bonds could also result in significant shareholder redemptions of the Portfolios’ shares as investors anticipate adverse effects on the Portfolios or seek higher yields to offset the potential loss of the tax deduction. As a result, the Portfolios would be required to maintain higher levels of cash to meet the redemptions, which would negatively affect the Portfolios’ yield.
Interest Rate Risk: Changes in interest rates will affect the value of investments in fixed-income securities. When interest rates rise, the value of investments in fixed income securities tends to fall and this decrease in value may not be offset by higher income from new investments. The Portfolios may be subject to a heightened risk of rising interest rates as the current period of historically low rates is expected to end, and rates are expected to begin rising in the near future. Interest rate risk is generally greater for fixed-income securities with longer maturities or durations.
Duration Risk: Duration is a measure that relates the expected price volatility of a fixed-income security to changes in interest rates. The duration of a fixed-income security may be shorter than or equal to full maturity of a fixed-income security. Fixed-income securities with longer durations have more risk and will decrease in price as interest rates rise. For example, a fixed-income security with a duration of three years will decrease in value by approximately 3% if interest rates increase by 1%.
Inflation Risk: This is the risk that the value of assets or income from investments will be less in the future as inflation decreases the value of money. As inflation increases, the value of the Portfolios’ assets can decline as can the value of the Portfolios’ distributions. This risk is significantly greater for fixed-income securities with longer maturities.
Liquidity Risk: Liquidity risk occurs when certain investments become difficult to purchase or sell. Difficulty in selling less liquid securities may result in sales at disadvantageous prices affecting the value of your investment in the Portfolios. Causes of liquidity risk may include low trading volumes and large positions. Municipal securities may have more liquidity risk than other fixed-income securities because they trade less frequently and the market for municipal securities is generally smaller than many other markets.
Derivatives Risk: Investments in derivatives may be illiquid, difficult to price, and leveraged so that small changes may produce disproportionate losses for the Portfolios, and may be subject to counterparty risk to a greater degree than more traditional investments.
Management Risk: The Portfolios are subject to management risk because it is an actively managed investment fund. The Adviser will apply its investment techniques and risk analyses in making investment decisions, but there is no guarantee that its techniques will produce the intended results.
These risks are fully discussed in the Portfolios’ prospectus. As with all investments, you may lose money by investing in the Portfolios.
(Disclosures, Risks and Note about Historical Performance continued on next page)
| | |
| 6 | | • AB MUNICIPAL INCOME FUND |
Disclosures and Risks
DISCLOSURES AND RISKS
(continued from previous page)
An Important Note About Historical Performance
The investment return and principal value of an investment in the Portfolios will fluctuate, so that shares, when redeemed, may be worth more or less than their original cost. Performance shown on the following pages represents past performance and does not guarantee future results. Current performance may be lower or higher than the performance information shown. You may obtain performance information current to the most recent month-end by visiting www.abglobal.com.
All fees and expenses related to the operation of the Portfolios have been deducted. NAV returns do not reflect sales charges; if sales charges were reflected, the Portfolios’ quoted performance would be lower. SEC returns and the Portfolios’ returns shown in the line graphs reflect the applicable sales charges for each share class: a 3% maximum front-end sales charge for Class A shares; the applicable contingent deferred sales charge for Class B shares (3% year 1, 2% year 2, 1% year 3, 0% year 4); a 1% 1 year contingent deferred sales charge for Class C shares. Prior to October 1, 2009, the maximum front-end sales charge for Class A shares of the Portfolio was 4.25%. If the Class A annualized returns for the National, California and New York Portfolios returns shown in the line graphs reflected the deduction of the former maximum front-end sales charge, their returns would be lower. Returns for the different share classes will vary due to their different expenses associated with each class. Performance assumes reinvestment of distributions and does not account for taxes.
| | | | |
| AB MUNICIPAL INCOME FUND • | | | 7 | |
Disclosures and Risks
AB CALIFORNIA PORTFOLIO
HISTORICAL PERFORMANCE
| | | | | | | | | | | | | | |
| | | | | | | | | | | | | | |
THE PORTFOLIO VS. ITS BENCHMARK
PERIODS ENDED MAY 31, 2015 (unaudited) | | NAV Returns | | | |
| | 6 Month | | | 7 Month | | | 12 Month | | | |
| AB California Portfolio | | | | | | | | | | | | | | |
Class A | | | 0.36% | | | | 0.46% | | | | 3.72% | | | |
|
Class B* | | | 0.09% | | | | 0.13% | | | | 3.07% | | | |
|
Class C | | | 0.09% | | | | 0.13% | | | | 2.98% | | | |
|
Advisor Class† | | | 0.50% | | | | 0.62% | | | | 4.01% | | | |
|
| Barclays Municipal Bond Index | | | 0.71% | | | | 0.89% | | | | 3.18% | | | |
|
* Effective January 31, 2009, Class B shares are no longer available for purchase to new investors. Please see Note A for more information. † Please note that this share class is for investors purchasing shares through accounts established under certain fee-based programs sponsored and maintained by certain broker dealers and financial intermediaries, institutional pension plans and/or investment advisory clients of, and certain other persons associated with, the Adviser and its affiliates or the Portfolios. |
| | | | | | | | | | | | | | |
GROWTH OF A $10,000 INVESTMENT IN THE PORTFOLIO 5/31/05 TO 5/31/15 (unaudited)
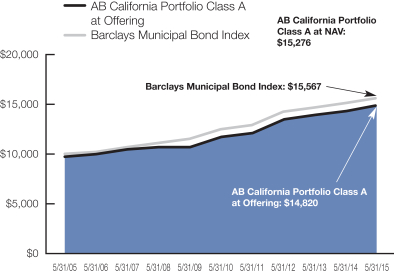
This chart illustrates the total value of an assumed $10,000 investment in AB California Portfolio Class A shares (from 5/31/05 to 5/31/15) as compared to the performance of the Portfolio’s benchmark. The chart showing the Class A at Offering reflects the deduction of the maximum 3% sales charge from the initial $10,000 investment in the Portfolio and assumes the reinvestment of dividends and capital gains distributions.
See Disclosures, Risks and Note about Historical Performance on pages 5-7.
(Historical Performance continued on next page)
| | |
| 8 | | • AB MUNICIPAL INCOME FUND |
Historical Performance
AB HIGH INCOME MUNICIPAL PORTFOLIO
HISTORICAL PERFORMANCE
(continued from previous page)
| | | | | | | | | | | | | | |
| | | | | | | | | | | | | | |
THE PORTFOLIO VS. ITS BENCHMARK PERIODS ENDED MAY 31, 2015 (unaudited) | | NAV Returns | | | |
| | 6 Months | | | 7 Months | | | 12 Months | | | |
| AB High Income Municipal Portfolio | | | | | | | | | | | | | | |
Class A | | | 1.97% | | | | 2.45% | | | | 6.13% | | | |
|
Class C | | | 1.69% | | | | 2.02% | | | | 5.38% | | | |
|
Advisor Class* | | | 2.20% | | | | 2.61% | | | | 6.44% | | | |
|
| Barclays Municipal Bond Index | | | 0.71% | | | | 0.89% | | | | 3.18% | | | |
|
* Please note that this share class is for investors purchasing shares through accounts established under certain fee-based programs sponsored and maintained by certain broker dealers and financial intermediaries, institutional pension plans and/or investment advisory clients of, and certain other persons associated with, the Adviser and its affiliates or the Portfolios. |
| | | | | | | | | | | | | | |
GROWTH OF A $10,000 INVESTMENT IN THE PORTFOLIO 1/26/10* TO 5/31/15 (unaudited)
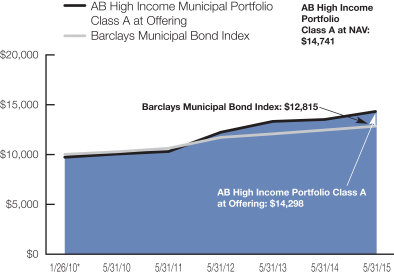
This chart illustrates the total value of an assumed $10,000 investment in AB High Income Municipal Portfolio Class A shares (from 1/26/10* to 5/31/15) as compared to the performance of the Portfolio’s benchmark. The chart showing the Class A at Offering reflects the deduction of the maximum 3% sales charge from the initial $10,000 investment in the Portfolio and assumes the reinvestment of dividends and capital gains distributions.
| * | | Inception date: 1/26/2010. |
See Disclosures, Risks and Note about Historical Performance on pages 5-7.
(Historical Performance continued on next page)
| | | | |
| AB MUNICIPAL INCOME FUND • | | | 9 | |
Historical Performance
AB NATIONAL PORTFOLIO
HISTORICAL PERFORMANCE
(continued from previous page)
| | | | | | | | | | | | | | |
| | | | | | | | | | | | | | |
THE PORTFOLIO VS. ITS BENCHMARK PERIODS ENDED MAY 31, 2015 (unaudited) | | NAV Returns | | | |
| | 6 Months | | | 7 Months | | | 12 Months | | | |
| AB National Portfolio | | | | | | | | | | | | | | |
Class A | | | 0.44% | | | | 0.62% | | | | 3.10% | | | |
|
Class B* | | | 0.07% | | | | 0.30% | | | | 2.38% | | | |
|
Class C | | | 0.07% | | | | 0.20% | | | | 2.37% | | | |
|
Advisor Class† | | | 0.67% | | | | 0.88% | | | | 3.50% | | | |
|
| Barclays Municipal Bond Index | | | 0.71% | | | | 0.89% | | | | 3.18% | | | |
|
* Effective January 31, 2009, Class B shares are no longer available for purchase to new investors. Please see Note A for more information. † Please note that this share class is for investors purchasing shares through accounts established under certain fee-based programs sponsored and maintained by certain broker dealers and financial intermediaries, institutional pension plans and/or investment advisory clients of, and certain other persons associated with, the Adviser and its affiliates or the Portfolios. |
| | | | | | | | | | | | | | |
GROWTH OF A $10,000 INVESTMENT IN THE PORTFOLIO 5/31/05 TO 5/31/15 (unaudited)
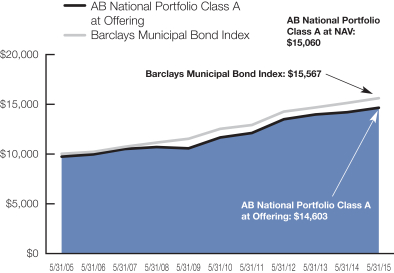
This chart illustrates the total value of an assumed $10,000 investment in AB National Portfolio Class A shares (from 5/31/05 to 5/31/15) as compared to the performance of the Portfolio’s benchmark. The chart showing the Class A at Offering reflects the deduction of the maximum 3% sales charge from the initial $10,000 investment in the Portfolio and assumes the reinvestment of dividends and capital gains distributions.
See Disclosures, Risks and Note about Historical Performance on pages 5-7.
(Historical Performance continued on next page)
| | |
| 10 | | • AB MUNICIPAL INCOME FUND |
Historical Performance
AB NEW YORK PORTFOLIO
HISTORICAL PERFORMANCE
(continued from previous page)
| | | | | | | | | | | | | | |
| | | | | | | | | | | | | | |
THE PORTFOLIO VS. ITS BENCHMARK
PERIODS ENDED MAY 31, 2015 (unaudited) | | NAV Returns | | | |
| | 6 Months | | | 7 Months | | | 12 Months | | | |
| AB New York Portfolio | | | | | | | | | | | | | | |
Class A | | | 0.91% | | | | 0.97% | | | | 2.87% | | | |
|
Class B* | | | 0.54% | | | | 0.55% | | | | 2.15% | | | |
|
Class C | | | 0.55% | | | | 0.65% | | | | 2.25% | | | |
|
Advisor Class† | | | 1.04% | | | | 1.23% | | | | 3.27% | | | |
|
| Barclays Municipal Bond Index | | | 0.71% | | | | 0.89% | | | | 3.18% | | | |
|
* Effective January 31, 2009, Class B shares are no longer available for purchase to new investors. Please see Note A for more information. † Please note that this share class is for investors purchasing shares through accounts established under certain fee-based programs sponsored and maintained by certain broker dealers and financial intermediaries, institutional pension plans and/or investment advisory clients of, and certain other persons associated with, the Adviser and its affiliates or the Portfolios. |
|
GROWTH OF A $10,000 INVESTMENT IN THE PORTFOLIO
5/31/05 TO 5/31/15 (unaudited)
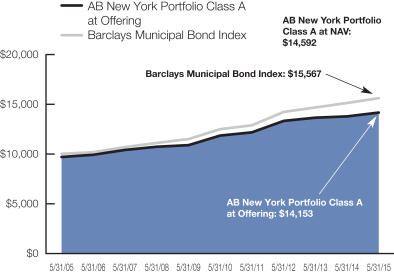
This chart illustrates the total value of an assumed $10,000 investment in AB New York Portfolio Class A shares (from 5/31/05 to 5/31/15) as compared to the performance of the Portfolio’s benchmark. The chart showing the Class A at Offering reflects the deduction of the maximum 3% sales charge from the initial $10,000 investment in the Portfolio and assumes the reinvestment of dividends and capital gains distributions.
See Disclosures, Risks and Note about Historical Performance on pages 5-7.
(Historical Performance continued on next page)
| | | | |
| AB MUNICIPAL INCOME FUND • | | | 11 | |
Historical Performance
AB CALIFORNIA PORTFOLIO
HISTORICAL PERFORMANCE
(continued from previous page)
| | | | | | | | | | | | | | | | |
| AVERAGE ANNUAL RETURNS AS OF MAY 31, 2015 (unaudited) | |
| | | NAV Returns | | | SEC Returns
(reflects applicable
sales charges) | | | SEC Yields* | | | Taxable
Equivalent
Yields† | |
| | | | | | | | | | | | | | | | |
| Class A Shares | | | | | | | | | | | 1.52 | % | | | 2.70 | % |
1 Year | | | 3.72 | % | | | 0.59 | % | | | | | | | | |
5 Years | | | 4.86 | % | | | 4.22 | % | | | | | | | | |
10 Years | | | 4.33 | % | | | 4.01 | % | | | | | | | | |
| | | | | | | | | | | | | | | | |
| Class B Shares | | | | | | | | | | | 0.84 | % | | | 1.49 | % |
1Year | | | 3.07 | % | | | 0.07 | % | | | | | | | | |
5 Years | | | 4.14 | % | | | 4.14 | % | | | | | | | | |
10 Years(a) | | | 3.90 | % | | | 3.90 | % | | | | | | | | |
| | | | | | | | | | | | | | | | |
| Class C Shares | | | | | | | | | | | 0.83 | % | | | 1.47 | % |
1 Year | | | 2.98 | % | | | 1.98 | % | | | | | | | | |
5 Years | | | 4.12 | % | | | 4.12 | % | | | | | | | | |
10 Years | | | 3.60 | % | | | 3.60 | % | | | | | | | | |
| | | | | | | | | | | | | | | | |
| Advisor Class Shares‡ | | | | | | | | | | | 1.82 | % | | | 3.23 | % |
1 Year | | | 4.01 | % | | | 4.01 | % | | | | | | | | |
5 Years | | | 5.16 | % | | | 5.16 | % | | | | | | | | |
Since Inception^ | | | 5.41 | % | | | 5.41 | % | | | | | | | | |
| | | | | | | | | | | | | | | | |
SEC AVERAGE ANNUAL RETURNS AS OF THE MOST RECENT CALENDAR QUARTER-END
JUNE 30, 2015 (unaudited) | |
| | | | | | | | | | | | SEC Returns
(reflects applicable
sales charges) | |
| | | | | | | | | | | | | | | | |
| Class A Shares | | | | | | | | | | | | | | | | |
1 Year | | | | | | | | | | | | | | | 0.49 | % |
5 Years | | | | | | | | | | | | | | | 4.21 | % |
10 Years | | | | | | | | | | | | | | | 3.94 | % |
| | | | | | | | | | | | | | | | |
| Class B Shares | | | | | | | | | | | | | | | | |
1Year | | | | | | | | | | | | | | | -0.11 | % |
5 Years | | | | | | | | | | | | | | | 4.13 | % |
10 Years(a) | | | | | | | | | | | | | | | 3.82 | % |
| | | | | | | | | | | | | | | | |
| Class C Shares | | | | | | | | | | | | | | | | |
1 Year | | | | | | | | | | | | | | | 1.97 | % |
5 Years | | | | | | | | | | | | | | | 4.13 | % |
10 Years | | | | | | | | | | | | | | | 3.53 | % |
| | | | | | | | | | | | | | | | |
(Historical Performance continued on next page)
| | |
| 12 | | • AB MUNICIPAL INCOME FUND |
Historical Performance
AB CALIFORNIA PORTFOLIO
HISTORICAL PERFORMANCE
(continued from previous page)
| | | | | | | | | | |
SEC AVERAGE ANNUAL RETURNS AS OF THE MOST RECENT CALENDAR QUARTER-END JUNE 30, 2015 (unaudited) | |
| | | | | | | | | SEC Returns
(reflects applicable
sales charges) | |
| Advisor Class Shares‡ | | | | | | | | | | |
1 Year | | | | | | | | | 3.91 | % |
5 Years | | | | | | | | | 5.15 | % |
Since Inception^ | | | | | | | | | 5.35 | % |
The Portfolio’s current prospectus fee table shows the Portfolio’s total annual operating expense ratios as 0.81%, 1.56%, 1.56% and 0.56% for Class A, Class B, Class C and Advisor Class shares, respectively, gross of any fee waivers or expense reimbursements. Contractual fee waivers and/or expense reimbursements will limit the Portfolio’s annual operating expenses, excluding any interest expense, to 0.75%, 1.50%, 1.50% and 0.50% for Class A, Class B, Class C and Advisor Class shares, respectively. These waivers/ reimbursements may not be terminated prior to January 30, 2016 and may be extended by the Adviser for additional one-year terms. Absent reimbursements or waivers, performance would have been lower. The Financial Highlights section of this report sets forth expense ratio data for the current reporting period; the expense ratios shown above may differ from the expense ratios in the Financial Highlights section since they are based on different time periods.
| * | | SEC yields are calculated based on SEC guidelines for the 30-day period ended May 31, 2015. |
| † | | Taxable equivalent yields are based on SEC yields and a 35% marginal federal income tax rate and maximum state taxes where applicable. |
| (a) | | Assumes conversion of Class B shares into Class A shares after six years. |
| ‡ | | This share class is offered at NAV to eligible investors and its SEC returns are the same as the NAV returns. Please note that this share class is for investors purchasing shares through accounts established under certain fee-based programs sponsored and maintained by certain broker-dealers and financial intermediaries, institutional pension plans and/or investment advisory clients of, and certain other persons associated with, the Adviser and its affiliates or the Portfolios. The inception date for Advisor Class shares is listed below. |
| ^ | | Inception Date: 8/6/2008. |
See Disclosures, Risks and Note about Historical Performance on pages 5-7.
(Historical Performance continued on next page)
| | | | |
| AB MUNICIPAL INCOME FUND • | | | 13 | |
Historical Performance
AB HIGH INCOME MUNICIPAL PORTFOLIO
HISTORICAL PERFORMANCE
(continued from previous page)
| | | | | | | | | | | | | | | | |
| AVERAGE ANNUAL RETURNS AS OF MAY 31, 2015 (unaudited) | |
| | | NAV Returns | | | SEC Returns
(reflects applicable
sales charges) | | | SEC Yields* | | | Taxable Equivalent Yields† | |
| | | | | | | | | | | | | | | | |
| Class A Shares | | | | | | | | | | | 3.59 | % | | | 5.52 | % |
1 Year | | | 6.13 | % | | | 2.96 | % | | | | | | | | |
5 Years | | | 7.32 | % | | | 6.68 | % | | | | | | | | |
Since Inception^ | | | 7.53 | % | | | 6.92 | % | | | | | | | | |
| | | | | | | | | | | | | | | | |
| Class C Shares | | | | | | | | | | | 2.95 | % | | | 4.54 | % |
1 Year | | | 5.38 | % | | | 4.38 | % | | | | | | | | |
5 Years | | | 6.58 | % | | | 6.58 | % | | | | | | | | |
Since Inception^ | | | 6.79 | % | | | 6.79 | % | | | | | | | | |
| | | | | | | | | | | | | | | | |
| Advisor Class Shares‡ | | | | | | | | | | | 3.95 | % | | | 6.08 | % |
1 Year | | | 6.44 | % | | | 6.44 | % | | | | | | | | |
5 Years | | | 7.64 | % | | | 7.64 | % | | | | | | | | |
Since Inception^ | | | 7.86 | % | | | 7.86 | % | | | | | | | | |
| | | | | | | | | | | | | | | | |
SEC AVERAGE ANNUAL RETURNS AS OF THE MOST RECENT CALENDAR QUARTER-END
JUNE 30, 2015 (unaudited) | |
| | | | | | | | | | | | SEC Returns
(reflects applicable
sales charges) | |
| | | | | | | | | | | | | | | | |
| Class A Shares | | | | | | | | | | | | | | | | |
1 Year | | | | | | | | | | | | | | | 2.57 | % |
5 Years | | | | | | | | | | | | | | | 6.50 | % |
Since Inception^ | | | | | | | | | | | | | | | 6.74 | % |
| | | | | | | | | | | | | | | | |
| Class C Shares | | | | | | | | | | | | | | | | |
1 Year | | | | | | | | | | | | | | | 3.89 | % |
5 Years | | | | | | | | | | | | | | | 6.38 | % |
Since Inception^ | | | | | | | | | | | | | | | 6.58 | % |
| | | | | | | | | | | | | | | | |
| Advisor Class Shares‡ | | | | | | | | | | | | | | | | |
1 Year | | | | | | | | | | | | | | | 5.94 | % |
5 Years | | | | | | | | | | | | | | | 7.44 | % |
Since Inception^ | | | | | | | | | | | | | | | 7.65 | % |
(Historical Performance continued on next page)
| | |
| 14 | | • AB MUNICIPAL INCOME FUND |
Historical Performance
AB HIGH INCOME MUNICIPAL PORTFOLIO
HISTORICAL PERFORMANCE
(continued from previous page)
The Portfolio’s current prospectus fee table shows the Portfolio’s total annual operating expense ratios as 0.91%, 1.66%, and 0.66% for Class A, Class C and Advisor Class shares, respectively, gross of any fee waivers or expense reimbursements. Contractual fee waivers and/or expense reimbursements will limit the Portfolio’s annual operating expenses, excluding any interest expense, to 0.80%, 1.55% and 0.55% for Class A, Class C and Advisor Class shares, respectively. These waivers/ reimbursements may not be terminated prior to January 30, 2016 and may be extended by the Adviser for additional one-year terms. Absent reimbursements or waivers, performance would have been lower. The Financial Highlights section of this report sets forth expense ratio data for the current reporting period; the expense ratios shown above may differ from the expense ratios in the Financial Highlights section since they are based on different time periods.
| * | | SEC yields are calculated based on SEC guidelines for the 30-day period ended May 31, 2015. |
| † | | Taxable equivalent yields are based on SEC yields and a 35% marginal federal income tax rate and maximum state taxes where applicable. |
| ‡ | | This share class is offered at NAV to eligible investors and its SEC returns are the same as the NAV returns. Please note that this share class is for investors purchasing shares through accounts established under certain fee-based programs sponsored and maintained by certain broker-dealers and financial intermediaries, institutional pension plans and/or investment advisory clients of, and certain other persons associated with, the Adviser and its affiliates or the Portfolios. The inception date for Advisor Class shares is listed below. |
| ^ | | Inception date: 1/26/2010. |
See Disclosures, Risks and Note about Historical Performance on pages 5-7.
(Historical Performance continued on next page)
| | | | |
| AB MUNICIPAL INCOME FUND • | | | 15 | |
Historical Performance
AB NATIONAL PORTFOLIO
HISTORICAL PERFORMANCE
(continued from previous page)
| | | | | | | | | | | | | | | | |
| AVERAGE ANNUAL RETURNS AS OF MAY 31, 2015 (unaudited) | |
| | | NAV Returns | | | SEC Returns
(reflects applicable
sales charges) | | | SEC Yields* | | | Taxable Equivalent Yields† | |
| | | | | | | | | | | | | | | | |
| Class A Shares | | | | | | | | | | | 2.04 | % | | | 3.14 | % |
1 Year | | | 3.10 | % | | | -0.02 | % | | | | | | | | |
5 Years | | | 4.65 | % | | | 4.03 | % | | | | | | | | |
10 Years | | | 4.18 | % | | | 3.86 | % | | | | | | | | |
| | | | | | | | | | | | | | | | |
| Class B Shares | | | | | | | | | | | 1.37 | % | | | 2.11 | % |
1 Year | | | 2.38 | % | | | -0.61 | % | | | | | | | | |
5 Years | | | 3.93 | % | | | 3.93 | % | | | | | | | | |
10 Years(a) | | | 3.74 | % | | | 3.74 | % | | | | | | | | |
| | | | | | | | | | | | | | | | |
| Class C Shares | | | | | | | | | | | 1.36 | % | | | 2.09 | % |
1 Year | | | 2.37 | % | | | 1.38 | % | | | | | | | | |
5 Years | | | 3.93 | % | | | 3.93 | % | | | | | | | | |
10 Years | | | 3.46 | % | | | 3.46 | % | | | | | | | | |
| | | | | | | | | | | | | | | | |
| Advisor Class Shares‡ | | | | | | | | | | | 2.35 | % | | | 3.62 | % |
1 Year | | | 3.50 | % | | | 3.50 | % | | | | | | | | |
5 Years | | | 4.98 | % | | | 4.98 | % | | | | | | | | |
Since Inception^ | | | 5.23 | % | | | 5.23 | % | | | | | | | | |
| | | | | | | | | | | | | | | | |
SEC AVERAGE ANNUAL RETURNS AS OF THE MOST RECENT CALENDAR QUARTER-END
JUNE 30, 2015 (unaudited) | |
| | | | | | | | | | | | SEC Returns
(reflects applicable
sales charges) | |
| | | | | | | | | | | | | | | | |
| Class A Shares | | | | | | | | | | | | | | | | |
1 Year | | | | | | | | | | | | | | | -0.24 | % |
5 Years | | | | | | | | | | | | | | | 3.93 | % |
10 Years | | | | | | | | | | | | | | | 3.77 | % |
| | | | | | | | | | | | | | | | |
| Class B Shares | | | | | | | | | | | | | | | | |
1 Year | | | | | | | | | | | | | | | -0.73 | % |
5 Years | | | | | | | | | | | | | | | 3.84 | % |
10 Years(a) | | | | | | | | | | | | | | | 3.65 | % |
| | | | | | | | | | | | | | | | |
| Class C Shares | | | | | | | | | | | | | | | | |
1 Year | | | | | | | | | | | | | | | 1.26 | % |
5 Years | | | | | | | | | | | | | | | 3.83 | % |
10 Years | | | | | | | | | | | | | | | 3.37 | % |
| | | | | | | | | | | | | | | | |
| Advisor Class Shares‡ | | | | | | | | | | | | | | | | |
1 Year | | | | | | | | | | | | | | | 3.17 | % |
5 Years | | | | | | | | | | | | | | | 4.87 | % |
Since Inception^ | | | | | | | | | | | | | | | 5.12 | % |
(Historical Performance continued on next page)
| | |
| 16 | | • AB MUNICIPAL INCOME FUND |
Historical Performance
AB NATIONAL PORTFOLIO
HISTORICAL PERFORMANCE
(continued from previous page)
The Portfolio’s current prospectus fee table shows the Portfolio’s total annual operating expense ratios as 0.81%, 1.57%, 1.56% and 0.55% for Class A, Class B, Class C and Advisor Class shares, respectively, gross of any fee waivers or expense reimbursements. Contractual fee waivers and/or expense reimbursements will limit the Portfolio’s annual operating expenses, excluding any interest expense, to 0.75%, 1.50%, 1.50% and 0.50% for Class A, Class B, Class C and Advisor Class shares, respectively. These waivers/reimbursements may not be terminated prior to January 30, 2016 and may be extended by the Adviser for additional one-year terms. Absent reimbursements or waivers, performance would have been lower. The Financial Highlights section of this report sets forth expense ratio data for the current reporting period; the expense ratios shown above may differ from the expense ratios in the Financial Highlights section since they are based on different time periods.
| * | | SEC yields are calculated based on SEC guidelines for the 30-day period ended May 31, 2015. |
| † | | Taxable equivalent yields are based on SEC yields and a 35% marginal federal income tax rate and maximum state taxes where applicable. |
| (a) | | Assumes conversion of Class B shares into Class A shares after six years. |
| ‡ | | This share class is offered at NAV to eligible investors and its SEC returns are the same as the NAV returns. Please note that this share class is for investors purchasing shares through accounts established under certain fee-based programs sponsored and maintained by certain broker-dealers and financial intermediaries, institutional pension plans and/or investment advisory clients of, and certain other persons associated with, the Adviser and its affiliates or the Portfolios. The inception date for Advisor Class shares is listed below. |
| ^ | | Inception Date: 8/6/2008. |
See Disclosures, Risks and Note about Historical Performance on pages 5-7.
(Historical Performance continued on next page)
| | | | |
| AB MUNICIPAL INCOME FUND • | | | 17 | |
Historical Performance
AB NEW YORK PORTFOLIO
HISTORICAL PERFORMANCE
(continued from previous page)
| | | | | | | | | | | | | | | | |
| AVERAGE ANNUAL RETURNS AS OF MAY 31, 2015 (unaudited) | |
| | | NAV Returns | | | SEC Returns
(reflects applicable
sales charges) | | | SEC Yields* | | | Taxable
Equivalent
Yields† | |
| | | | | | | | | | | | | | | | |
| Class A Shares | | | | | | | | | | | 1.63 | % | | | 2.75 | % |
1 Year | | | 2.87 | % | | | -0.23 | % | | | | | | | | |
5 Years | | | 3.65 | % | | | 3.02 | % | | | | | | | | |
10 Years | | | 3.85 | % | | | 3.53 | % | | | | | | | | |
| | | | | | | | | | | | | | | | |
| Class B Shares | | | | | | | | | | | 0.96 | % | | | 1.62 | % |
1 Year | | | 2.15 | % | | | -0.84 | % | | | | | | | | |
5 Years | | | 2.96 | % | | | 2.96 | % | | | | | | | | |
10 Years(a) | | | 3.43 | % | | | 3.43 | % | | | | | | | | |
| | | | | | | | | | | | | | | | |
| Class C Shares | | | | | | | | | | | 0.93 | % | | | 1.57 | % |
1 Year | | | 2.25 | % | | | 1.25 | % | | | | | | | | |
5 Years | | | 2.95 | % | | | 2.95 | % | | | | | | | | |
10 Years | | | 3.14 | % | | | 3.14 | % | | | | | | | | |
| | | | | | | | | | | | | | | | |
| Advisor Class Shares‡ | | | | | | | | | | | 1.92 | % | | | 3.24 | % |
1 Year | | | 3.27 | % | | | 3.27 | % | | | | | | | | |
5 Years | | | 3.98 | % | | | 3.98 | % | | | | | | | | |
Since Inception^ | | | 4.57 | % | | | 4.57 | % | | | | | | | | |
| | | | | | | | | | | | | | | | |
SEC AVERAGE ANNUAL RETURNS AS OF THE MOST RECENT CALENDAR QUARTER-END
JUNE 30, 2015 (unaudited) | |
| | | | | | | | | | | | SEC Returns
(reflects applicable
sales charges) | |
| | | | | | | | | | | | | | | | |
| Class A Shares | | | | | | | | | | | | | | | | |
1 Year | | | | | | | | | | | | | | | -0.17 | % |
5 Years | | | | | | | | | | | | | | | 2.94 | % |
10 Years | | | | | | | | | | | | | | | 3.44 | % |
| | | | | | | | | | | | | | | | |
| Class B Shares | | | | | | | | | | | | | | | | |
1 Year | | | | | | | | | | | | | | | -0.77 | % |
5 Years | | | | | | | | | | | | | | | 2.88 | % |
10 Years(a) | | | | | | | | | | | | | | | 3.33 | % |
| | | | | | | | | | | | | | | | |
| Class C Shares | | | | | | | | | | | | | | | | |
1 Year | | | | | | | | | | | | | | | 1.32 | % |
5 Years | | | | | | | | | | | | | | | 2.88 | % |
10 Years | | | | | | | | | | | | | | | 3.03 | % |
| | | | | | | | | | | | | | | | |
| Advisor Class Shares‡ | | | | | | | | | | | | | | | | |
1 Year | | | | | | | | | | | | | | | 3.24 | % |
5 Years | | | | | | | | | | | | | | | 3.89 | % |
Since Inception^ | | | | | | | | | | | | | | | 4.47 | % |
(Historical Performance continued on next page)
| | |
| 18 | | • AB MUNICIPAL INCOME FUND |
Historical Performance
AB NEW YORK PORTFOLIO
HISTORICAL PERFORMANCE
(continued from previous page)
The Portfolio’s current prospectus fee table shows the Portfolio’s total annual operating expense ratios as 0.82%, 1.58%, 1.57% and 0.57% for Class A, Class B, Class C and Advisor Class shares, respectively, gross of any fee waivers or expense reimbursements. Contractual fee waivers and/or expense reimbursements will limit the Portfolio’s annual operating expenses excluding any interest expense to 0.75%, 1.50%, 1.50% and 0.50% for Class A, Class B, Class C and Advisor Class shares, respectively. These waivers/ reimbursements may not be terminated prior to January 30, 2016 and may be extended by the Adviser for additional one-year terms. Absent reimbursements or waivers, performance would have been lower. The Financial Highlights section of this report sets forth expense ratio data for the current reporting period; the expense ratios shown above may differ from the expense ratios in the Financial Highlights section since they are based on different time periods.
| * | | SEC yields are calculated based on SEC guidelines for the 30-day period ended May 31, 2015. |
| † | | Taxable equivalent yields are based on SEC yields and a 35% marginal federal income tax rate and maximum state taxes where applicable. |
| (a) | | Assumes conversion of Class B shares into Class A shares after six years. |
| ‡ | | This share class is offered at NAV to eligible investors and its SEC returns are the same as the NAV returns. Please note that this share class is for investors purchasing shares through accounts established under certain fee-based programs sponsored and maintained by certain broker-dealers and financial intermediaries, institutional pension plans and/or investment advisory clients of, and certain other persons associated with, the Adviser and its affiliates or the Portfolios. The inception date for Advisor Class shares is listed below. |
| ^ | | Inception Date: 8/6/2008. |
See Disclosures, Risks and Historical Performance on pages 5-7.
| | | | |
| AB MUNICIPAL INCOME FUND • | | | 19 | |
Historical Performance
EXPENSE EXAMPLE
(unaudited)
As a shareholder of the Fund, you incur two types of costs: (1) transaction costs, including sales charges (loads) on purchase payments, contingent deferred sales charges on redemptions and (2) ongoing costs, including management fees; distribution (12b-1) fees; and other Fund expenses. This example is intended to help you understand your ongoing costs (in dollars) of investing in the Fund and to compare these costs with the ongoing costs of investing in other mutual funds.
The Example is based on an investment of $1,000 invested at the beginning of the period and held for the entire period as indicated below.
Actual Expenses
The first line of the table below provides information about actual account values and actual expenses. You may use the information in this line, together with the amount you invested, to estimate the expenses that you paid over the period. Simply divide your account value by $1,000 (for example, an $8,600 account value divided by $1,000 = 8.6), then multiply the result by the number in the first line under the heading entitled “Expenses Paid During Period” to estimate the expenses you paid on your account during this period.
Hypothetical Example for Comparison Purposes
The second line of the table below provides information about hypothetical account values and hypothetical expenses based on the Fund’s actual expense ratio and an assumed annual rate of return of 5% before expenses, which is not the Fund’s actual return. The hypothetical account values and expenses may not be used to estimate the actual ending account balance or expenses you paid for the period. You may use this information to compare the ongoing costs of investing in the Fund and other funds by comparing this 5% hypothetical example with the 5% hypothetical examples that appear in the shareholder reports of other funds.
Please note that the expenses shown in the table are meant to highlight your ongoing costs only and do not reflect any transactional costs, such as sales charges (loads), or contingent deferred sales charges on redemptions. Therefore, the second line of the table is useful in comparing ongoing costs only, and will not help you determine the relative total costs of owning different funds. In addition, if these transactional costs were included, your costs would have been higher.
| | | | | | | | | | | | | | | | |
| | | Beginning
Account Value
December 1, 2014 | | | Ending
Account Value
May 31, 2015 | | | Expenses
Paid During
Period* | | | Annualized
Expense
Ratio* | |
| AB National Portfolio | | | | | | | | | | | | | | | | |
| Class A | | | | | | | | | | | | | | | | |
Actual | | $ | 1,000 | | | $ | 1,004.40 | | | $ | 3.85 | | | | 0.77 | % |
Hypothetical** | | $ | 1,000 | | | $ | 1,021.09 | | | $ | 3.88 | | | | 0.77 | % |
| Class B | | | | | | | | | | | | | | | | |
Actual | | $ | 1,000 | | | $ | 1,000.70 | | | $ | 7.53 | | | | 1.51 | % |
Hypothetical** | | $ | 1,000 | | | $ | 1,017.40 | | | $ | 7.59 | | | | 1.51 | % |
| Class C | | | | | | | | | | | | | | | | |
Actual | | $ | 1,000 | | | $ | 1,000.70 | | | $ | 7.53 | | | | 1.51 | % |
Hypothetical** | | $ | 1,000 | | | $ | 1,017.40 | | | $ | 7.59 | | | | 1.51 | % |
| Advisor Class | | | | | | | | | | | | | | | | |
Actual | | $ | 1,000 | | | $ | 1,006.70 | | | $ | 2.55 | | | | 0.51 | % |
Hypothetical** | | $ | 1,000 | | | $ | 1,022.39 | | | $ | 2.57 | | | | 0.51 | % |
| | |
| 20 | | • AB MUNICIPAL INCOME FUND |
Expense Example
EXPENSE EXAMPLE
(unaudited)
(continued from previous page)
| | | | | | | | | | | | | | | | |
| | | Beginning
Account Value
December 1, 2014 | | | Ending
Account Value
May 31, 2015 | | | Expenses
Paid During
Period* | | | Annualized
Expense
Ratio* | |
| AB High Income Municipal Portfolio | | | | | | | | | | | | | | | | |
| Class A | | | | | | | | | | | | | | | | |
Actual | | $ | 1,000 | | | $ | 1,019.70 | | | $ | 4.33 | | | | 0.86 | % |
Hypothetical** | | $ | 1,000 | | | $ | 1,020.64 | | | $ | 4.33 | | | | 0.86 | % |
| Class C | | | | | | | | | | | | | | | | |
Actual | | $ | 1,000 | | | $ | 1,016.90 | | | $ | 8.00 | | | | 1.59 | % |
Hypothetical** | | $ | 1,000 | | | $ | 1,017.00 | | | $ | 8.00 | | | | 1.59 | % |
| Advisor Class | | | | | | | | | | | | | | | | |
Actual | | $ | 1,000 | | | $ | 1,022.00 | | | $ | 2.97 | | | | 0.59 | % |
Hypothetical** | | $ | 1,000 | | | $ | 1,021.99 | | | $ | 2.97 | | | | 0.59 | % |
| AB California Portfolio | | | | | | | | | | | | | | | | |
| Class A | | | | | | | | | | | | | | | | |
Actual | | $ | 1,000 | | | $ | 1,003.60 | | | $ | 3.85 | | | | 0.77 | % |
Hypothetical** | | $ | 1,000 | | | $ | 1,021.09 | | | $ | 3.88 | | | | 0.77 | % |
| Class B | | | | | | | | | | | | | | | | |
Actual | | $ | 1,000 | | | $ | 1,000.90 | | | $ | 7.53 | | | | 1.51 | % |
Hypothetical** | | $ | 1,000 | | | $ | 1,017.40 | | | $ | 7.59 | | | | 1.51 | % |
| Class C | | | | | | | | | | | | | | | | |
Actual | | $ | 1,000 | | | $ | 1,000.90 | | | $ | 7.53 | | | | 1.51 | % |
Hypothetical** | | $ | 1,000 | | | $ | 1,017.40 | | | $ | 7.59 | | | | 1.51 | % |
| Advisor Class | | | | | | | | | | | | | | | | |
Actual | | $ | 1,000 | | | $ | 1,005.00 | | | $ | 2.55 | | | | 0.51 | % |
Hypothetical** | | $ | 1,000 | | | $ | 1,022.39 | | | $ | 2.57 | | | | 0.51 | % |
| AB New York Portfolio | | | | | | | | | | | | | | | | |
| Class A | | | | | | | | | | | | | | | | |
Actual | | $ | 1,000 | | | $ | 1,009.10 | | | $ | 3.91 | | | | 0.78 | % |
Hypothetical** | | $ | 1,000 | | | $ | 1,021.04 | | | $ | 3.93 | | | | 0.78 | % |
| Class B | | | | | | | | | | | | | | | | |
Actual | | $ | 1,000 | | | $ | 1,005.40 | | | $ | 7.55 | | | | 1.51 | % |
Hypothetical** | | $ | 1,000 | | | $ | 1,017.40 | | | $ | 7.59 | | | | 1.51 | % |
| Class C | | | | | | | | | | | | | | | | |
Actual | | $ | 1,000 | | | $ | 1,005.50 | | | $ | 7.55 | | | | 1.51 | % |
Hypothetical** | | $ | 1,000 | | | $ | 1,017.40 | | | $ | 7.59 | | | | 1.51 | % |
| Advisor Class | | | | | | | | | | | | | | | | |
Actual | | $ | 1,000 | | | $ | 1,010.40 | | | $ | 2.56 | | | | 0.51 | % |
Hypothetical** | | $ | 1,000 | | | $ | 1,022.39 | | | $ | 2.57 | | | | 0.51 | % |
| * | | Expenses are equal to the classes’ annualized expense ratios multiplied by the average account value over the period, multiplied by 182/365 (to reflect the one-half year period). |
| ** | | Assumes 5% annual return before expenses. |
| | | | |
| AB MUNICIPAL INCOME FUND • | | | 21 | |
Expense Example
PORTFOLIO SUMMARY
May 31, 2015 (unaudited)
QUALITY RATING BREAKDOWN*
Highest of S&P, Moody’s and Fitch
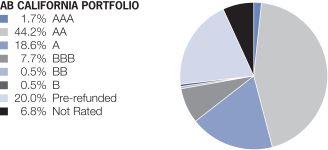
| * | | All data are as of May 31, 2015. The Portfolio’s quality rating breakdown is expressed as a percentage of the Portfolio’s total investments in municipal securities and may vary over time. The Portfolio also enters into derivative transactions, which may be used for hedging or investment purposes (see “Portfolio of Investments” section of the report for additional details). The quality ratings are determined by using the Standard & Poor’s Ratings Services (“S&P”), Moody’s Investors Services, Inc. (“Moody’s”) and Fitch Ratings, Ltd. (“Fitch”). The Portfolio considers the credit ratings issued by S&P, Moody’s and Fitch and uses the highest rating issued by the agencies, including when there is a split rating. These ratings are a measure of the quality and safety of a bond or portfolio, based on the issuer’s financial condition. AAA is the highest (best) and D is the lowest (worst). If applicable, the pre-refunded category includes bonds which are secured by U.S. Government Securities and therefore are deemed high-quality investment grade by the Adviser. If applicable, Not Applicable (N/A) includes non creditworthy investments; such as, equities, currency contracts, futures and options. If applicable, the Not Rated category includes bonds that are not rated by a Nationally Recognized Statistical Rating Organization. The Adviser evaluates the creditworthiness of non-rated securities based on a number of factors including, but not limited to, cash flows, enterprise value and economic environment. |
| | |
| 22 | | • AB MUNICIPAL INCOME FUND |
Portfolio Summary
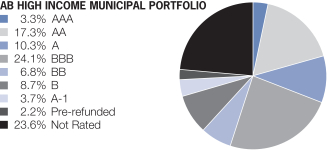
PORTFOLIO SUMMARY
May 31, 2015 (unaudited)
QUALITY RATING BREAKDOWN*
Highest of S&P, Moody’s and Fitch
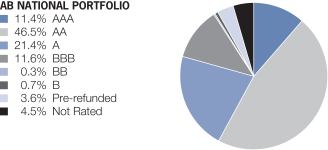
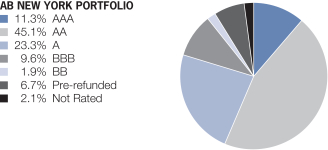
| * | | All data are as of May 31, 2015. The Portfolio’s quality rating breakdown is expressed as a percentage of the Portfolio’s total investments in municipal securities and may vary over time. The Portfolio also enters into derivative transactions, which may be used for hedging or investment purposes (see “Portfolio of Investments” section of the report for additional details). The quality ratings are determined by using the Standard & Poor’s Ratings Services (“S&P”), Moody’s Investors Services, Inc. (“Moody’s”) and Fitch Ratings, Ltd. (“Fitch”). The Portfolio considers the credit ratings issued by S&P, Moody’s and Fitch and uses the highest rating issued by the agencies, including when there is a split rating. These ratings are a measure of the quality and safety of a bond or portfolio, based on the issuer’s financial condition. AAA is the highest (best) and D is the lowest (worst). If applicable, the pre-refunded category includes bonds which are secured by U.S. Government Securities and therefore are deemed high-quality investment grade by the Adviser. If applicable, Not Applicable (N/A) includes non creditworthy investments; such as, equities, currency contracts, futures and options. If applicable, the Not Rated category includes bonds that are not rated by a Nationally Recognized Statistical Rating Organization. The Adviser evaluates the creditworthiness of non-rated securities based on a number of factors including, but not limited to, cash flows, enterprise value and economic environment. |
| | | | |
| AB MUNICIPAL INCOME FUND • | | | 23 | |
Portfolio Summary
AB NATIONAL PORTFOLIO
PORTFOLIO OF INVESTMENTS
May 31, 2015
| | | | | | | | |
| | | Principal
Amount
(000) | | | U.S. $ Value | |
| |
| | | | | | | | |
MUNICIPAL OBLIGATIONS – 98.6% | | | | | | | | |
Long-Term Municipal Bonds – 98.6% | | | | | | | | |
Alabama – 2.3% | | | | | | | | |
Birmingham Water Works Board
Series 2011
5.00%, 1/01/31 | | $ | 10,000 | | | $ | 11,095,900 | |
Series 2015A
5.00%, 1/01/33-1/01/34 | | | 4,390 | | | | 4,908,362 | |
County of Jefferson AL
(County of Jefferson AL Sch Warrants)
Series 2004A
5.25%, 1/01/18-1/01/23 | | | 3,900 | | | | 3,953,355 | |
AGM Series 2004
5.50%, 1/01/21 | | | 1,000 | | | | 1,018,960 | |
University of Alabama (The)
Series 2008A
5.75%, 9/01/22 | | | 3,000 | | | | 3,398,130 | |
| | | | | | | | |
| | | | | | | 24,374,707 | |
| | | | | | | | |
Arizona – 2.3% | | | | | | | | |
Arizona Health Facilities Authority
(Scottsdale Healthcare Hospitals Obligated Group)
Series 2014A
5.00%, 12/01/33-12/01/34 | | | 12,615 | | | | 14,031,552 | |
Dove Mountain Resort Community Facilities District
Series 2001
6.75%, 12/01/16 | | | 910 | | | | 874,546 | |
Estrella Mountain Ranch Community Facilities District
(Estrella Mountain Ranch CFD Desert Village)
Series 2002
7.375%, 7/01/27 | | | 1,917 | | | | 1,921,965 | |
Industrial Development Authority of the County of Pima (The)
(Horizon Community Learning Center)
Series 2005
5.125%, 6/01/20 | | | 2,825 | | | | 2,832,430 | |
Salt Verde Financial Corp.
(Citigroup, Inc.)
Series 2007
5.25%, 12/01/23 | | | 3,685 | | | | 4,387,877 | |
Sundance Community Facilities District Assessment District No 1
Series 2002
7.75%, 7/01/22 | | | 169 | | | | 169,111 | |
| | | | | | | | |
| | | | | | | 24,217,481 | |
| | | | | | | | |
| | |
| 24 | | • AB MUNICIPAL INCOME FUND |
AB National Portfolio—Portfolio of Investments
| | | | | | | | |
| | |
| | | Principal
Amount
(000) | | | U.S. $ Value | |
| |
| | | | | | | | |
California – 14.5% | | | | | | | | |
Bay Area Toll Authority
Series 2013S
5.00%, 4/01/31 | | $ | 5,560 | | | $ | 6,280,798 | |
California Econ Recovery
Series 2009A
5.25%, 7/01/19 (Pre-refunded/ETM) | | | 1,510 | | | | 1,750,694 | |
California Pollution Control Financing Authority
(Poseidon Resources Channelside LP)
Series 2012
5.00%, 7/01/37-11/21/45(a) | | | 11,130 | | | | 11,755,586 | |
California Statewide Communities Development Authority
(Enloe Medical Center)
Series 2008
6.25%, 8/15/28 | | | 1,715 | | | | 1,966,813 | |
Series 2008A
5.50%, 8/15/23 | | | 80 | | | | 90,604 | |
City of Chula Vista CA
(San Diego Gas & Electric Co.)
Series 1996A
5.30%, 7/01/21 | | | 4,000 | | | | 4,044,760 | |
City of Los Angeles CA Wastewater System Revenue
Series 2013A
5.00%, 6/01/33 | | | 9,310 | | | | 10,617,683 | |
City of Los Angeles Department of Airports
(Los Angeles Intl Airport)
Series 2009A
5.25%, 5/15/29 | | | 9,260 | | | | 10,563,901 | |
County of San Bernardino CA COP
Series 2009A
5.25%, 8/01/26 | | | 1,910 | | | | 2,151,730 | |
Los Angeles Community College District/CA
Series 2015A
4.00%, 8/01/33 | | | 10,000 | | | | 10,460,500 | |
Los Angeles Department of Water & Power PWR
Series 2013B
5.00%, 7/01/29-7/01/30 | | | 15,630 | | | | 18,115,530 | |
Los Angeles Department of Water & Power WTR
Series 2013A
5.00%, 7/01/31 | | | 9,115 | | | | 10,395,293 | |
Series 2013B
5.00%, 7/01/32 | | | 1,900 | | | | 2,175,158 | |
| | | | |
| AB MUNICIPAL INCOME FUND • | | | 25 | |
AB National Portfolio—Portfolio of Investments
| | | | | | | | |
| | |
| | | Principal
Amount
(000) | | | U.S. $ Value | |
| |
| | | | | | | | |
Manteca Unified School District
(Manteca Unified School District CFD No 89-1)
NATL Series 2001
Zero Coupon, 9/01/31 | | $ | 11,910 | | | $ | 5,576,143 | |
Ontario Redevelopment Financing Authority
NATL Series 1993
5.80%, 8/01/23 (Pre-refunded/ETM) | | | 1,000 | | | | 1,123,260 | |
Port of Los Angeles
Series 2009C
5.25%, 8/01/24 | | | 17,205 | | | | 19,895,862 | |
Series 2014A
5.00%, 8/01/34 | | | 5,790 | | | | 6,475,073 | |
San Diego County Water Authority COP
AGM Series 2008A
5.00%, 5/01/25 | | | 3,000 | | | | 3,316,950 | |
San Francisco City & County Airports Comm-San Francisco International Airport
(San Francisco Intl Airport)
Series 2010A
4.90%, 5/01/29 | | | 2,800 | | | | 3,126,088 | |
State of California
Series 2007
5.00%, 11/01/32 | | | 10,000 | | | | 10,835,600 | |
Series 2013
5.00%, 11/01/29 | | | 8,000 | | | | 9,271,680 | |
University of California
Series 2013A
5.00%, 5/15/30 | | | 3,200 | | | | 3,708,480 | |
| | | | | | | | |
| | | | | | | 153,698,186 | |
| | | | | | | | |
Colorado – 2.6% | | | | | | | | |
Colorado Health Facilities Authority
(Evangelical Lutheran Good Samaritan Obligated Group)
Series 2006
5.25%, 6/01/19-6/01/23 | | | 2,200 | | | | 2,289,558 | |
Denver Urban Renewal Authority
(Stapleton Development Corp.)
Series 2010B-1
5.00%, 12/01/24-12/01/25 | | | 9,175 | | | | 9,385,767 | |
E-470 Public Highway Authority
Series 2010C
5.25%, 9/01/25 | | | 2,900 | | | | 3,303,361 | |
5.375%, 9/01/26 | | | 3,600 | | | | 4,111,308 | |
Park Creek Metropolitan District
Series 2005
5.50%, 12/01/30 | | | 1,900 | | | | 1,936,290 | |
| | |
| 26 | | • AB MUNICIPAL INCOME FUND |
AB National Portfolio—Portfolio of Investments
| | | | | | | | |
| | |
| | | Principal
Amount
(000) | | | U.S. $ Value | |
| | | | | | | | |
| | | | | | | | |
PV Water & Sanitation Metropolitan District
Series 2006
Zero Coupon, 12/15/17(b)(c) | | $ | 3,122 | | | $ | 1,092,700 | |
Regional Transportation District
(Denver Transit Partners LLC)
Series 2010
6.00%, 1/15/41 | | | 2,400 | | | | 2,720,808 | |
Three Springs Metropolitan District No 3
Series 2010
7.75%, 12/01/39 | | | 1,950 | | | | 2,081,469 | |
Todd Creek Village Metropolitan District No 1
Series 2004
6.125%, 12/01/19(c) | | | 820 | | | | 508,400 | |
Todd Creek Village Metropolitan District No 1 COP
Series 2006
6.125%, 12/01/22(b)(c) | | | 1,210 | | | | 532,400 | |
| | | | | | | | |
| | | | | | | 27,962,061 | |
| | | | | | | | |
Connecticut – 0.7% | | | | | | | | |
State of Connecticut Special Tax Revenue
Series 2012
5.00%, 1/01/29 | | | 6,445 | | | | 7,369,084 | |
| | | | | | | | |
| | |
District of Columbia – 1.7% | | | | | | | | |
District of Columbia
(Catholic University of America (The))
Series 2010
5.00%, 10/01/34 | | | 700 | | | | 757,617 | |
District of Columbia
(District of Columbia Pers Income Tax)
Series 2009B
5.25%, 12/01/26 | | | 9,600 | | | | 11,086,656 | |
District of Columbia
(Friendship Public Charter School, Inc.)
ACA Series 2006
5.00%, 6/01/26 | | | 1,000 | | | | 1,015,320 | |
Washington Convention & Sports Authority AMBAC Series 2007A
5.00%, 10/01/23 | | | 5,000 | | | | 5,258,300 | |
| | | | | | | | |
| | | | | | | 18,117,893 | |
| | | | | | | | |
Florida – 3.7% | | | | | | | | |
Bonnet Creek Resort Community Development District
Series 2002
7.25%, 5/01/18 | | | 1,530 | | | | 1,532,280 | |
| | | | |
| AB MUNICIPAL INCOME FUND • | | | 27 | |
AB National Portfolio—Portfolio of Investments
| | | | | | | | |
| | |
| | | Principal
Amount
(000) | | | U.S. $ Value | |
| |
| | | | | | | | |
Brevard County Health Facilities Authority
(Health First, Inc. Obligated Group)
Series 2014
5.00%, 4/01/33 | | $ | 1,500 | | | $ | 1,636,200 | |
County of Miami-Dade FL Aviation Revenue
Series 2014A
5.00%, 10/01/33 | | | 1,700 | | | | 1,877,140 | |
County of Miami-Dade FL Spl Tax
Series 2012B
5.00%, 10/01/30-10/01/31 | | | 9,450 | | | | 10,547,571 | |
Hollywood Community Redevelopment Agency
(Beach Community Redevelopment Agency of Hollywood)
XLCA Series 2007
5.00%, 3/01/24 | | | 5,000 | | | | 5,223,250 | |
Marshall Creek Community Development District
Series 2002
6.625%, 5/01/32(c) | | | 2,235 | | | | 1,966,666 | |
Miami-Dade County Educational Facilities Authority
(University of Miami)
Series 2008A
5.20%, 4/01/24 | | | 2,500 | | | | 2,592,450 | |
Miami-Dade County Expressway Authority
Series 2014B
5.00%, 7/01/31 | | | 3,750 | | | | 4,230,787 | |
Miami-Dade County Housing Finance Authority
(Golden Associates Ltd.)
Series 1997A
6.00%, 11/01/32 | | | 250 | | | | 250,030 | |
6.05%, 11/01/39 | | | 750 | | | | 750,030 | |
Pasco County Housing Finance Authority
(Pasco Woods Ltd.)
Series 1999A
5.90%, 8/01/39 | | | 3,620 | | | | 3,621,014 | |
West Palm Beach Community Redevelopment Agency
Series 2005
5.00%, 3/01/25-3/01/29 | | | 4,620 | | | | 4,764,946 | |
| | | | | | | | |
| | | | | | | 38,992,364 | |
| | | | | | | | |
Guam – 0.1% | | | | | | | | |
Guam Department of Education COP
Series 2010A
6.875%, 12/01/40 | | | 515 | | | | 566,927 | |
| | | | | | | | |
| | |
| 28 | | • AB MUNICIPAL INCOME FUND |
AB National Portfolio—Portfolio of Investments
| | | | | | | | |
| | |
| | | Principal
Amount
(000) | | | U.S. $ Value | |
| | | | | | | | |
| | | | | | | | |
Illinois – 9.4% | | | | | | | | |
Chicago Board of Education
AGM Series 2007B
5.00%, 12/01/24 | | $ | 10,000 | | | $ | 10,201,800 | |
Chicago O’Hare International Airport
XLCA Series 2003B-1
5.25%, 1/01/34 | | | 5,100 | | | | 5,116,983 | |
City of Chicago IL
(Asphalt Operating Services of Chicago LLC)
Series 2010
6.125%, 12/01/18 | | | 2,960 | | | | 3,060,906 | |
City of Chicago IL
(Chicago IL SA Lakeshore East)
Series 2003
6.75%, 12/01/32 | | | 1,414 | | | | 1,416,460 | |
City of Chicago IL
(City of Chicago IL Sales Tax)
AGM Series 2005
5.00%, 1/01/25 | | | 6,905 | | | | 6,911,698 | |
Cook County Forest Preserve District
Series 2012C
5.00%, 12/15/32 | | | 7,745 | | | | 8,539,792 | |
Illinois Finance Authority
(Advocate Health Care Network Obligated Group)
Series 2014
5.00%, 8/01/33 | | | 11,500 | | | | 12,851,020 | |
Illinois Finance Authority
(Greenfields of Geneva)
Series 2010A
8.25%, 2/15/46 | | | 2,050 | | | | 2,168,388 | |
Illinois Finance Authority
(Illinois Institute of Technology)
Series 2006A
5.00%, 4/01/31 | | | 750 | | | | 751,755 | |
Illinois Finance Authority
(Park Place of Elmhurst)
Series 2010A
8.25%, 5/15/45 | | | 3,935 | | | | 2,398,382 | |
Illinois Sports Facilities Authority
AMBAC Series 2001
5.50%, 6/15/30 | | | 4,960 | | | | 5,022,347 | |
Kane Cook & DuPage Counties School District No U-46 Elgin
Series 2015D
5.00%, 1/01/34-1/01/35 | | | 4,250 | | | | 4,663,461 | |
| | | | |
| AB MUNICIPAL INCOME FUND • | | | 29 | |
AB National Portfolio—Portfolio of Investments
| | | | | | | | |
| | |
| | | Principal
Amount
(000) | | | U.S. $ Value | |
| |
| | | | | | | | |
Metropolitan Pier & Exposition Authority
Series 2012B
5.00%, 12/15/28 | | $ | 26,500 | | | $ | 28,838,360 | |
State of Illinois
Series 2012
5.00%, 3/01/31 | | | 2,000 | | | | 2,039,980 | |
Series 2014
5.00%, 5/01/35 | | | 1,000 | | | | 1,017,950 | |
Village of Manhattan IL
(Village of Manhattan IL SSA No 2004-1)
Series 2005
5.875%, 3/01/28 | | | 1,988 | | | | 2,005,634 | |
Village of Matteson IL
Series 2010
8.00%, 12/01/29(d) | | | 3,350 | | | | 3,136,538 | |
| | | | | | | | |
| | | | | | | 100,141,454 | |
| | | | | | | | |
Indiana – 2.2% | | | | | | | | |
Indiana Finance Authority
(CWA Authority, Inc.)
Series 2014A
5.00%, 10/01/32-10/01/34 | | | 12,320 | | | | 13,964,940 | |
Indiana Finance Authority
(WVB East End Partners LLC)
Series 2013A
5.00%, 7/01/44 | | | 1,930 | | | | 2,015,943 | |
Indianapolis Local Public Improvement Bond Bank
(Marion County Capital Improvement Board)
Series 2011K
5.00%, 6/01/27 | | | 6,840 | | | | 7,790,555 | |
| | | | | | | | |
| | | | | | | 23,771,438 | |
| | | | | | | | |
Kansas – 0.6% | | | | | | | | |
Kansas Development Finance Authority (Kansas Development Finance Authority State Lease)
Series 2015G
5.00%, 4/01/34 | | | 6,000 | | | | 6,606,960 | |
| | | | | | | | |
| | |
Louisiana – 2.8% | | | | | | | | |
City of New Orleans LA
AGC Series 2007A
5.00%, 12/01/18-12/01/22 | | | 5,200 | | | | 5,634,440 | |
NATL Series 2005
5.00%, 12/01/29 | | | 3,990 | | | | 4,072,114 | |
5.25%, 12/01/21 | | | 4,495 | | | | 4,598,475 | |
| | |
| 30 | | • AB MUNICIPAL INCOME FUND |
AB National Portfolio—Portfolio of Investments
| | | | | | | | |
| | |
| | | Principal
Amount
(000) | | | U.S. $ Value | |
| |
| | | | | | | | |
Louisiana Agricultural Finance Authority
Series 2007
5.25%, 9/15/17 | | $ | 910 | | | $ | 950,650 | |
Louisiana Local Government Environmental Facilities & Community Development Auth (East Baton Rouge Sewerage Commission)
Series 2014
5.00%, 2/01/44 | | | 12,000 | | | | 13,072,200 | |
Louisiana Local Government Environmental Facilities & Community Development Auth (Parish of Jefferson LA)
Series 2009A
5.00%, 4/01/26 | | | 715 | | | | 804,897 | |
| | | | | | | | |
| | | | | | | 29,132,776 | |
| | | | | | | | |
Maine – 1.0% | | | | | | | | |
Maine Health & Higher Educational Facilities Authority
(Stephens Memorial Hospital Association)
Series 2015
5.00%, 7/01/33-7/01/34 | | | 9,310 | | | | 10,137,900 | |
| | | | | | | | |
| | |
Maryland – 0.1% | | | | | | | | |
County of Anne Arundel MD
(National Business Park North)
Series 2010
6.10%, 7/01/40 | | | 885 | | | | 945,959 | |
| | | | | | | | |
| | |
Massachusetts – 0.9% | | | | | | | | |
Massachusetts Development Finance Agency
(Emerson College)
Series 2010A
5.00%, 1/01/40 | | | 2,000 | | | | 2,105,060 | |
5.50%, 1/01/30 | | | 4,750 | | | | 5,321,187 | |
Massachusetts Health & Educational Facilities Authority
(Foundation of Massachusetts Eye & Ear Obligated Group)
Series 2010C
5.375%, 7/01/35 | | | 2,245 | | | | 2,483,195 | |
| | | | | | | | |
| | | | | | | 9,909,442 | |
| | | | | | | | |
Michigan – 3.7% | | | | | | | | |
Detroit City School District
Series 2012A
5.00%, 5/01/27-5/01/30 | | | 7,965 | | | | 8,790,028 | |
| | | | |
| AB MUNICIPAL INCOME FUND • | | | 31 | |
AB National Portfolio—Portfolio of Investments
| | | | | | | | |
| | |
| | | Principal
Amount
(000) | | | U.S. $ Value | |
| |
| | | | | | | | |
Michigan Finance Authority
(City of Detroit MI Water Supply System Revenue)
Series 2014D4
5.00%, 7/01/34 | | $ | 11,225 | | | $ | 12,063,283 | |
Michigan Finance Authority
(MidMichigan Obligated Group)
Series 2014
5.00%, 6/01/34 | | | 2,000 | | | | 2,205,420 | |
Michigan Finance Authority
(Public Lighting Authority)
Series 2014B
5.00%, 7/01/33 | | | 2,485 | | | | 2,690,236 | |
Michigan Strategic Fund
(Detroit Renewable Energy Obligated Group)
Series 2013
8.50%, 12/01/30(a) | | | 6,570 | | | | 6,253,654 | |
Plymouth Educational Center Charter School
Series 2005
5.375%, 11/01/30 | | | 2,000 | | | | 1,385,700 | |
Wayne State University
Series 2009A
5.00%, 11/15/29 | | | 5,215 | | | | 5,901,659 | |
| | | | | | | | |
| | | | | | | 39,289,980 | |
| | | | | | | | |
Minnesota – 0.9% | | | | | | | | |
City of Maple Grove MN
(Maple Grove Hospital Corp.)
Series 2007
5.00%, 5/01/22 | | | 1,350 | | | | 1,434,713 | |
City of Minneapolis MN
(Minneapolis Common Bond Fund)
Series 2010-2A
6.00%, 12/01/40 | | | 3,000 | | | | 3,628,410 | |
University of Minnesota
Series 2014B
4.00%, 1/01/31-1/01/34 | | | 4,500 | | | | 4,698,285 | |
| | | | | | | | |
| | | | | | | 9,761,408 | |
| | | | | | | | |
Mississippi – 1.6% | | | | | | | | |
Mississippi Development Bank
(Mississippi Development Bank State Lease)
Series 2010D
5.25%, 8/01/27 | | | 15,000 | | | | 17,394,750 | |
| | | | | | | | |
| | |
Missouri – 1.8% | | | | | | | | |
City of Kansas City MO
(City of Kansas City MO Lease)
Series 2008C
5.00%, 4/01/28 | | | 14,000 | | | | 15,257,760 | |
| | |
| 32 | | • AB MUNICIPAL INCOME FUND |
AB National Portfolio—Portfolio of Investments
| | | | | | | | |
| | |
| | | Principal
Amount
(000) | | | U.S. $ Value | |
| |
| | | | | | | | |
Health & Educational Facilities Authority of the State of Missouri
(Lutheran Senior Services Obligated Group)
Series 2010
5.50%, 2/01/42 | | $ | 1,880 | | | $ | 2,026,903 | |
Joplin Industrial Development Authority (Freeman Health System)
Series 2015
5.00%, 2/15/35 | | | 1,485 | | | | 1,623,937 | |
| | | | | | | | |
| | | | | | | 18,908,600 | |
| | | | | | | | |
Nebraska – 0.3% | | | | | | | | |
Omaha Public Power District
Series 2014A
5.00%, 2/01/32 | | | 2,775 | | | | 3,150,125 | |
| | | | | | | | |
| | |
Nevada – 3.7% | | | | | | | | |
Clark County School District NATL
Series 2005B
5.00%, 6/15/22 | | | 5,720 | | | | 5,786,524 | |
County of Clark Department of Aviation (McCarran Intl Airport)
Series 2012B
5.00%, 7/01/29 | | | 6,070 | | | | 6,777,337 | |
County of Clark NV
AMBAC Series 2006
5.00%, 11/01/23 | | | 13,250 | | | | 14,104,757 | |
Las Vegas Valley Water District
NATL Series 2005A
5.00%, 6/01/27 | | | 5,000 | | | | 5,000,000 | |
Nevada System of Higher Education
AMBAC Series 2005B
5.00%, 7/01/25-7/01/26 | | | 1,585 | | | | 1,625,526 | |
State of Nevada
NATL Series 2007B
5.00%, 12/01/17 (Pre-refunded/ETM) | | | 5,800 | | | | 6,380,696 | |
| | | | | | | | |
| | | | | | | 39,674,840 | |
| | | | | | | | |
New Jersey – 2.4% | | | | | | | | |
Morris-Union Jointure Commission COP AGM Series 2013
5.00%, 8/01/25 | | | 2,055 | | | | 2,275,173 | |
New Jersey Economic Development Authority
Series 2014U
5.00%, 6/15/30 | | | 5,840 | | | | 5,980,627 | |
New Jersey State Turnpike Authority
Series 2014A
5.00%, 1/01/31-1/01/33 | | | 10,665 | | | | 12,032,308 | |
| | | | |
| AB MUNICIPAL INCOME FUND • | | | 33 | |
AB National Portfolio—Portfolio of Investments
| | | | | | | | |
| | |
| | | Principal
Amount
(000) | | | U.S. $ Value | |
| |
| | | | | | | | |
Union County Utilities Authority
(County of Union NJ Lease)
Series 2011A
5.25%, 12/01/31 | | $ | 4,340 | | | $ | 4,655,258 | |
| | | | | | | | |
| | | | | | | 24,943,366 | |
| | | | | | | | |
New Mexico – 1.3% | | | | | | | | |
Town of Clayton NM
(Town of Clayton NM Jail Project)
CIFG Series 2006
5.00%, 11/01/25-11/01/27 | | | 13,095 | | | | 13,722,068 | |
| | | | | | | | |
| | |
New York – 10.1% | | | | | | | | |
City of New York NY
Series 2008B-1
5.25%, 9/01/23 | | | 5,000 | | | | 5,623,650 | |
Series 2012G
5.00%, 4/01/29 | | | 9,550 | | | | 10,866,181 | |
Metropolitan Transportation Authority
Series 2012F
5.00%, 11/15/27 | | | 1,680 | | | | 1,935,494 | |
Series 2013B
5.00%, 11/15/32 | | | 5,000 | | | | 5,586,350 | |
Series 2013E
5.00%, 11/15/32 | | | 5,000 | | | | 5,618,350 | |
New York City Municipal Water Finance Authority
Series 2014D
5.00%, 6/15/35-6/15/39 | | | 5,000 | | | | 5,632,700 | |
New York City Transitional Finance Authority Future Tax Secured Revenue
Series 2012B
5.00%, 11/01/30 | | | 15,015 | | | | 17,309,292 | |
Series 2014B-1
5.00%, 8/01/32 | | | 4,000 | | | | 4,577,880 | |
Series 2014D-1
5.00%, 2/01/34 | | | 5,000 | | | | 5,651,650 | |
New York Liberty Development Corp.
(4 World Trade Center LLC)
Series 2011
5.00%, 11/15/31 | | | 2,775 | | | | 3,118,989 | |
New York Liberty Development Corp. (National Sports Museum)
Series 2006A
6.125%, 2/15/19(b)(c) | | | 1,188 | | | | 12 | |
New York NY GO
Series 2008D-1
5.125%, 12/01/27(e) | | | 1,000 | | | | 1,098,250 | |
| | |
| 34 | | • AB MUNICIPAL INCOME FUND |
AB National Portfolio—Portfolio of Investments
| | | | | | | | |
| | |
| | | Principal
Amount
(000) | | | U.S. $ Value | |
| |
| | | | | | | | |
New York State Dormitory Authority
(State of New York Pers Income Tax)
Series 2012D
5.00%, 2/15/29 | | $ | 4,960 | | | $ | 5,700,627 | |
New York State Energy Research & Development Authority
(Niagara Mohawk Holdings, Inc.)
AMBAC Series 1987A
0.454%, 3/01/27(f)(g) | | | 5,370 | | | | 5,174,409 | |
New York State Urban Development Corp.
(State of New York Pers Income Tax)
Series 2013A
5.00%, 3/15/43 | | | 12,185 | | | | 13,446,513 | |
Port Authority of New York & New Jersey
Series 2014
5.00%, 9/01/30-9/01/31 | | | 13,750 | | | | 15,497,863 | |
| | | | | | | | |
| | | | | | | 106,838,210 | |
| | | | | | | | |
North Carolina – 1.0% | | | | | | | | |
County of Iredell NC COP
AGM Series 2008
5.25%, 6/01/22 | | | 920 | | | | 1,025,239 | |
North Carolina Eastern Municipal Power Agency
AMBAC Series 2005A
5.25%, 1/01/20 | | | 1,000 | | | | 1,027,430 | |
North Carolina Medical Care Commission
Series 2005A
6.00%, 10/01/15 (Pre-refunded/ETM) | | | 3,305 | | | | 3,368,224 | |
State of North Carolina
(State of North Carolina Fed Hwy Grant)
Series 2015
5.00%, 3/01/30 | | | 5,000 | | | | 5,610,100 | |
| | | | | | | | |
| | | | | | | 11,030,993 | |
| | | | | | | | |
Ohio – 2.8% | | | | | | | | |
City of Akron OH
(City of Akron OH Income Tax)
Series 2012A
5.00%, 12/01/31 | | | 2,345 | | | | 2,656,322 | |
Series 2014
5.00%, 12/01/33 | | | 4,250 | | | | 4,788,432 | |
City of Cleveland OH
(City of Cleveland OH Income Tax)
Series 2008
5.25%, 5/15/24 | | | 5,500 | | | | 6,141,960 | |
Cleveland Department of Public Utilities Division of Public Power
NATL Series 2006A
5.00%, 11/15/18 | | | 1,350 | | | | 1,428,341 | |
| | | | |
| AB MUNICIPAL INCOME FUND • | | | 35 | |
AB National Portfolio—Portfolio of Investments
| | | | | | | | |
| | |
| | | Principal
Amount
(000) | | | U.S. $ Value | |
| |
| | | | | | | | |
Franklin County Convention Facilities Authority
(City of Columbus OH/Franklin County Lease)
Series 2014
5.00%, 12/01/31 | | $ | 3,855 | | | $ | 4,412,510 | |
Kent State University
Series 2012A
5.00%, 5/01/29 | | | 2,000 | | | | 2,241,320 | |
Toledo-Lucas County Port Authority
(CSX Transportation, Inc.)
Series 1992
6.45%, 12/15/21 | | | 6,730 | | | | 8,330,529 | |
| | | | | | | | |
| | | | | | | 29,999,414 | |
| | | | | | | | |
Oklahoma – 0.1% | | | | | | | | |
Tulsa Airports Improvement Trust
Series 2015A
5.00%, 6/01/35 | | | 1,000 | | | | 1,066,360 | |
| | | | | | | | |
| | |
Oregon – 0.3% | | | | | | | | |
Tri-County Metropolitan Transportation District
Series 2011A
5.00%, 10/01/27 | | | 3,000 | | | | 3,419,370 | |
| �� | | | | | | | |
| | |
Pennsylvania – 3.9% | | | | | | | | |
Bensalem Township School District
Series 2013
5.00%, 6/01/30 | | | 5,000 | | | | 5,692,700 | |
Montgomery County Industrial Development Authority/PA
(New Regional Medical Center, Inc.)
Series 2010
5.25%, 8/01/33 | | | 4,715 | | | | 5,427,766 | |
Pennsylvania Economic Development Financing Authority
(PA Bridges Finco LP)
Series 2015
5.00%, 12/31/34-12/31/38 | | | 5,060 | | | | 5,427,795 | |
Pennsylvania Industrial Development Authority
Series 2008
5.50%, 7/01/18 (Pre-refunded/ETM) | | | 3,940 | | | | 4,460,632 | |
Philadelphia Authority for Industrial Development
(Greater Philadelphia Health Action, Inc.)
Series 2015A
6.375%, 6/01/40(h) | | | 3,100 | | | | 3,063,730 | |
| | |
| 36 | | • AB MUNICIPAL INCOME FUND |
AB National Portfolio—Portfolio of Investments
| | | | | | | | |
| | |
| | | Principal
Amount
(000) | | | U.S. $ Value | |
| |
| | | | | | | | |
Philadelphia Authority for Industrial Development
(LLPCS Foundation)
Series 2005A
5.25%, 7/01/24(b)(c) | | $ | 1,030 | | | $ | 772,500 | |
Sports & Exhibition Authority of Pittsburgh and Allegheny County
AGM Series 2010
5.00%, 2/01/31 | | | 6,925 | | | | 7,634,605 | |
State Public School Building Authority
(School District of Philadelphia (The))
Series 2012
5.00%, 4/01/30-4/01/31 | | | 6,500 | | | | 6,970,175 | |
Township of Lower Paxton PA
Series 2014
5.00%, 4/01/31 | | | 1,685 | | | | 1,924,927 | |
| | | | | | | | |
| | | | | | | 41,374,830 | |
| | | | | | | | |
Puerto Rico – 0.1% | | | | | | | | |
Puerto Rico Housing Finance Authority
(Puerto Rico Housing Finance Authority Cap Fd Prog)
Series 2008
5.125%, 12/01/27 | | | 1,065 | | | | 1,142,521 | |
| | | | | | | | |
| | |
Rhode Island – 0.4% | | | | | | | | |
Rhode Island Commerce Corp.
(Providence Place Group LP)
AGC Series 2000
6.125%, 7/01/20 | | | 3,665 | | | | 3,678,047 | |
| | | | | | | | |
| | |
South Carolina – 0.2% | | | | | | | | |
Dorchester County School District No 2
Series 2006
5.00%, 12/01/16 (Pre-refunded/ETM) | | | 1,500 | | | | 1,599,675 | |
AGC Series 2006 5.00%, 12/01/16 (Pre-refunded/ETM) | | | 400 | | | | 426,580 | |
| | | | | | | | |
| | | | | | | 2,026,255 | |
| | | | | | | | |
South Dakota – 0.3% | | | | | | | | |
South Dakota State Building Authority
(South Dakota State Building Authority Lease)
Series 2014A
5.00%, 6/01/34 | | | 2,725 | | | | 3,089,796 | |
| | | | | | | | |
| | |
Tennessee – 0.0% | | | | | | | | |
Sullivan County Health Educational & Housing Facilities Board
(Wellmont Health System)
Series 2006C
5.25%, 9/01/26 | | | 275 | | | | 287,730 | |
| | | | | | | | |
| | | | |
| AB MUNICIPAL INCOME FUND • | | | 37 | |
AB National Portfolio—Portfolio of Investments
| | | | | | | | |
| | |
| | | Principal
Amount
(000) | | | U.S. $ Value | |
| |
| | | | | | | | |
| | |
Texas – 12.3% | | | | | | | | |
Alvin Independent School District/TX
Series 2009B
5.00%, 2/15/28 | | $ | 1,290 | | | $ | 1,433,654 | |
Bexar County Health Facilities Development Corp.
(Army Retirement Residence Obligated Group)
Series 2007
5.00%, 7/01/27 | | | 415 | | | | 437,165 | |
Camino Real Regional Mobility Authority
Series 2008
5.00%, 2/15/21 | | | 2,315 | | | | 2,320,834 | |
Central Texas Turnpike System
Series 2015C
5.00%, 8/15/34 | | | 10,000 | | | | 10,843,000 | |
City of El Paso TX Water & Sewer Revenue
Series 2014
5.00%, 3/01/30 | | | 1,000 | | | | 1,155,280 | |
City of Houston TX
(City of Houston TX Hotel Occupancy Tax)
Series 2015
5.00%, 9/01/31 | | | 2,500 | | | | 2,819,125 | |
City of Houston TX Airport System Revenue
(United Airlines, Inc.)
Series 2015B
5.00%, 7/15/30 | | | 4,650 | | | | 4,910,633 | |
City Public Service Board of San Antonio TX
Series 2008
5.00%, 2/01/26 | | | 6,830 | | | | 7,479,328 | |
Series 2009A
5.25%, 2/01/24 | | | 3,260 | | | | 3,705,088 | |
Dallas Area Rapid Transit
(Dallas Area Rapid Transit Sales Tax)
Series 2014A
5.00%, 12/01/32 | | | 5,000 | | | | 5,785,100 | |
Dallas/Fort Worth International Airport
Series 2012F
5.00%, 11/01/28 | | | 13,680 | | | | 15,188,357 | |
El Paso County Hospital District
AGC Series 2008A
5.00%, 8/15/23 | | | 5,000 | | | | 5,572,900 | |
Harrison County Health Facilities Development Corp.
(Good Shepherd Hospital Obligated Group)
Series 2010
5.25%, 7/01/28 | | | 2,435 | | | | 2,421,242 | |
| | |
| 38 | | • AB MUNICIPAL INCOME FUND |
AB National Portfolio—Portfolio of Investments
| | | | | | | | |
| | |
| | | Principal
Amount
(000) | | | U.S. $ Value | |
| |
| | | | | | | | |
North Texas Health Facilities Development Corp.
(United Regional Health Care System, Inc.) AGM Series 2007
5.00%, 9/01/24 | | $ | 1,000 | | | $ | 1,084,120 | |
North Texas Tollway Authority
Series 2015A
5.00%, 1/01/34-1/01/35 | | | 15,585 | | | | 17,083,685 | |
North Texas Tollway Authority
(North Texas Tollway Authority Special Projects System)
Series 2011D
5.00%, 9/01/30 | | | 7,500 | | | | 8,577,525 | |
Tarrant County Cultural Education Facilities Finance Corp.
(Buckingham Senior Living Community, Inc.)
Series 2007
5.50%, 11/15/22 | | | 2,210 | | | | 2,286,577 | |
Tarrant County Cultural Education Facilities Finance Corp.
(Edgemere Retirement Senior Quality Lifestyles Corp.)
Series 2015A
5.00%, 11/15/45(h) | | | 5,715 | | | | 5,784,494 | |
Series 2015B
5.00%, 11/15/36(h) | | | 1,850 | | | | 1,899,987 | |
Tarrant County Cultural Education Facilities Finance Corp.
(MRC Crestview)
Series 2010
8.125%, 11/15/44 | | | 2,150 | | | | 2,508,212 | |
Tarrant County Cultural Education Facilities Finance Corp.
(Stayton at Museum Way)
Series 2009A
8.00%, 11/15/28 | | | 2,000 | | | | 1,981,240 | |
Texas Private Activity Bond Surface Transportation Corp.
(LBJ Infrastructure Group LLC)
Series 2010
7.00%, 6/30/40 | | | 9,040 | | | | 10,843,299 | |
Texas Private Activity Bond Surface Transportation Corp.
(NTE Mobility Partners LLC)
Series 2009
6.875%, 12/31/39 | | | 2,280 | | | | 2,700,204 | |
| | | | |
| AB MUNICIPAL INCOME FUND • | | | 39 | |
AB National Portfolio—Portfolio of Investments
| | | | | | | | |
| | |
| | | Principal
Amount
(000) | | | U.S. $ Value | |
| |
| | | | | | | | |
Texas State Public Finance Authority Charter School Finance Corp.
(KIPP Austin Public Schools, Inc.)
Series 2014A
5.00%, 8/15/32-8/15/34 | | $ | 3,330 | | | $ | 3,743,069 | |
Tyler Health Facilities Development Corp.
(Mother Frances Hospital Regional Health Care Center)
Series 2007
5.25%, 7/01/26 | | | 1,750 | | | | 1,872,185 | |
Wichita Falls Independent School District | | | | | | | | |
Series 2007
5.00%, 2/01/17 (Pre-refunded/ETM) | | | 6,000 | | | | 6,437,760 | |
| | | | | | | | |
| | | | | | | 130,874,063 | |
| | | | | | | | |
Utah – 0.6% | | | | | | | | |
Timber Lakes Water Special Service District
Series 2011
8.125%, 6/15/31 | | | 775 | | | | 845,866 | |
Utah Transit Authority
(Utah Transit Authority Sales Tax)
Series 2015A
5.00%, 6/15/37 | | | 5,000 | | | | 5,611,900 | |
| | | | | | | | |
| | | | | | | 6,457,766 | |
| | | | | | | | |
Washington – 4.3% | | | | | | | | |
Clark County Public Utility District No 1
Series 2010
5.00%, 1/01/23 | | | 12,635 | | | | 14,255,565 | |
Energy Northwest
AMBAC Series 2006A
5.00%, 7/01/16 (Pre-refunded/ETM) | | | 5,970 | | | | 6,260,381 | |
Energy Northwest
(Bonneville Power Administration)
Series 2006C
5.00%, 7/01/16 (Pre-refunded/ETM) | | | 595 | | | | 624,274 | |
FYI Properties
(FYI Properties WA State Lease)
Series 2009
5.00%, 6/01/27 | | | 615 | | | | 692,804 | |
5.25%, 6/01/26 | | | 4,000 | | | | 4,562,760 | |
King County School District No 414 Lake Washington
NATL Series 2006
5.00%, 12/01/16 (Pre-refunded/ETM) | | | 4,500 | | | | 4,802,535 | |
Washington St GO
5.00%, 7/01/24(e) | | | 9,000 | | | | 10,496,070 | |
| | |
| 40 | | • AB MUNICIPAL INCOME FUND |
AB National Portfolio—Portfolio of Investments
| | | | | | | | |
| | |
| | | Principal
Amount
(000) | | | U.S. $ Value | |
| |
| | | | | | | | |
Washington State Housing Finance Commission (Skyline at First Hill Proj)
Series 2007A
5.625%, 1/01/27-1/01/38 | | $ | 3,490 | | | $ | 3,434,428 | |
| | | | | | | | |
| | | | | | | 45,128,817 | |
| | | | | | | | |
West Virginia – 0.5% | | | | | | | | |
West Virginia Economic Development Authority
(West Virginia Lottery)
Series 2010A
5.00%, 6/15/35 | | | 5,000 | | | | 5,577,700 | |
| | | | | | | | |
| | |
Wisconsin – 1.1% | | | | | | | | |
Oneida Tribe of Indians of Wisconsin
(Oneida Tribe of Indians of Wisconsin Sales Tax)
Series 2011
6.50%, 2/01/31(a) | | | 2,465 | | | | 2,935,371 | |
Wisconsin Health & Educational Facilities Authority
(Ministry Health Care, Inc.)
Series 2012C
5.00%, 8/15/32 | | | 2,300 | | | | 2,556,427 | |
Wisconsin Health & Educational Facilities Authority
(Wheaton Franciscan Services, Inc.)
Series 2006
5.25%, 8/15/20 | | | 5,000 | | | | 5,230,600 | |
Wisconsin Public Finance Authority
(Roseman University Health Sciences)
Series 2015
5.875%, 4/01/45 | | | 1,000 | | | | 977,210 | |
| | | | | | | | |
| | | | | | | 11,699,608 | |
| | | | | | | | |
Total Municipal Obligations
(cost $1,000,539,585) | | | | | | | 1,046,481,249 | |
| | | | | | | | |
| | |
| | | Shares | | | | |
SHORT-TERM INVESTMENTS – 1.2% | |
Investment Companies – 1.2% | | | | | | | | |
AB Fixed Income Shares, Inc. – Government STIF Portfolio, 0.10%(i)(j)
(cost $12,811,579) | | | 12,811,579 | | | | 12,811,579 | |
| | | | | | | | |
| | |
Total Investments – 99.8%
(cost $1,013,351,164) | | | | | | | 1,059,292,828 | |
Other assets less liabilities – 0.2% | | | | | | | 1,693,368 | |
| | | | | | | | |
Net Assets – 100.0% | | | | | | $ | 1,060,986,196 | |
| | | | | | | | |
| | | | |
| AB MUNICIPAL INCOME FUND • | | | 41 | |
AB National Portfolio—Portfolio of Investments
INTEREST RATE SWAPS (see Note D)
| | | | | | | | | | | | | | | | |
| | | | | | | | | Rate Type | | | |
Swap
Counterparty | | Notional
Amount
(000) | | | Termination
Date | | | Payments
made
by the
Fund | | Payments
received
by the
Fund | | Unrealized
Appreciation/
(Depreciation) | |
Merrill Lynch Capital Services, Inc. | | $ | 6,300 | | | | 10/21/16 | | | SIFMA* | | 4.129% | | $ | 370,060 | |
| * | | Variable interest rate based on the Securities Industry & Financial Markets Association (SIFMA) Municipal Swap Index. |
| (a) | | Security is exempt from registration under Rule 144A of the Securities Act of 1933. These securities are considered liquid and may be resold in transactions exempt from registration, normally to qualified institutional buyers. At May 31, 2015, the aggregate market value of these securities amounted to $20,944,611 or 2.0% of net assets. |
| (b) | | Security is in default and is non-income producing. |
| (d) | | Indicates a security that has a zero coupon that remains in effect until a predetermined date at which time the stated coupon rate becomes effective until final maturity. |
| (e) | | Security represents the underlying municipal obligation of an inverse floating rate obligation held by the Fund (see Note I). |
| (f) | | Variable rate coupon, rate shown as of May 31, 2015. |
| (g) | | An auction rate security whose interest rate resets at each auction date. Auctions are typically held every week or month. The rate shown is as of May 31, 2015 and the aggregate market value of this security amounted to $5,174,409 or 0.49% of net assets. |
| (h) | | When-Issued or delayed delivery security. |
| (i) | | To obtain a copy of the fund’s financial statements, please go to the Securities and Exchange Commission’s website at www.sec.gov, or call AllianceBernstein at (800) 227-4618. |
| (j) | | Investment in affiliated money market mutual fund. The rate shown represents the 7-day yield as of period end. |
As of May 31, 2015, the Fund’s percentages of investments in municipal bonds that are insured and in insured municipal bonds that have been pre-refunded or escrowed to maturity are 14.4% and 1.8%, respectively.
Glossary:
| ACA | | – ACA Financial Guaranty Corporation |
| AGC | | – Assured Guaranty Corporation |
| AGM | | – Assured Guaranty Municipal |
| AMBAC | | – Ambac Assurance Corporation |
| CFD | | – Community Facilities District |
| CIFG | | – CDC (Caisse des Dépôts et Consignations) IXIS Financial Guarantee |
| COP | | – Certificate of Participation |
| ETM | | – Escrowed to Maturity |
| NATL | | – National Interstate Corporation |
| SSA | | – Special Services Area |
| XLCA | | – XL Capital Assurance Inc. |
See notes to financial statements.
| | |
| 42 | | • AB MUNICIPAL INCOME FUND |
AB National Portfolio—Portfolio of Investments
AB HIGH INCOME MUNICIPAL PORTFOLIO
PORTFOLIO OF INVESTMENTS
May 31, 2015
| | | | | | | | |
| | | Principal
Amount
(000) | | | U.S. $ Value | |
| |
| | | | | | | | |
MUNICIPAL OBLIGATIONS – 105.2% | | | | | | | | |
Long-Term Municipal Bonds – 101.4% | | | | | | | | |
Alabama – 2.8% | | | | | | | | |
County of Jefferson AL
(County of Jefferson AL Sch Warrants)
Series 2004A
4.75%, 1/01/25 | | $ | 530 | | | $ | 532,936 | |
County of Jefferson AL Sewer Revenue
Series 2013D
6.00%, 10/01/42 | | | 45,790 | | | | 50,962,897 | |
Cullman County Health Care Authority
(Cullman Regional Medical Center, Inc.)
Series 2009A
6.25%, 2/01/23 | | | 1,000 | | | | 1,082,940 | |
7.00%, 2/01/36 | | | 3,130 | | | | 3,384,594 | |
Selma Industrial Development Board
(International Paper Co.)
Series 2010A
5.80%, 5/01/34 | | | 800 | | | | 918,088 | |
| | | | | | | | |
| | | | | | | 56,881,455 | |
| | | | | | | | |
Alaska – 0.2% | | | | | | | | |
City of Koyukuk AK
(Tanana Chiefs Conference)
Series 2011
7.75%, 10/01/41 | | | 4,550 | | | | 5,272,040 | |
| | | | | | | | |
| | |
Arizona – 2.0% | | | | | | | | |
Arizona Health Facilities Authority
(Beatitudes Campus (The))
Series 2007
5.10%, 10/01/22 | | | 3,300 | | | | 3,345,870 | |
5.20%, 10/01/37 | | | 6,855 | | | | 6,614,938 | |
Downtown Phoenix Hotel Corp.
(Downtown Phoenix Hotel Corp. Hotel Occupancy Tax)
FGIC Series 2005A
5.00%, 7/01/40 | | | 6,930 | | | | 6,979,272 | |
Industrial Development Authority of the City of Phoenix (The)
(Great Hearts Academies)
Series 2012
6.30%, 7/01/42 | | | 1,000 | | | | 1,040,280 | |
Series 2014
5.00%, 7/01/44(a) | | | 10,690 | | | | 10,916,414 | |
Mohave County Industrial Development Authority
(Mohave Prison LLC)
Series 2008
8.00%, 5/01/25 | | | 4,900 | | | | 5,621,966 | |
| | | | |
| AB MUNICIPAL INCOME FUND • | | | 43 | |
AB High Income Municipal Portfolio—Portfolio of Investments
| | | | | | | | |
| | |
| | | Principal
Amount
(000) | | | U.S. $ Value | |
| |
| | | | | | | | |
Quechan Indian Tribe of Fort Yuma
Series 2012A
9.75%, 5/01/25 | | $ | 2,400 | | | $ | 2,747,664 | |
Tempe Industrial Development Authority
(Friendship Village of Tempe)
Series 2012A
6.25%, 12/01/42-12/01/46 | | | 3,000 | | | | 3,232,455 | |
| | | | | | | | |
| | | | | | | 40,498,859 | |
| | | | | | | | |
California – 11.2% | | | | | | | | |
Abag Finance Authority for Nonprofit Corps.
(Episcopal Senior Communities)
Series 2011
6.125%, 7/01/41 | | | 2,400 | | | | 2,747,808 | |
California Municipal Finance Authority
Series 2011B
7.75%, 4/01/21 (Pre-refunded/ETM) | | | 3,005 | | | | 3,808,357 | |
California Municipal Finance Authority
(Goodwill Industries of Sacramento Valley & Northern Nevada, Inc.)
Series 2012A
6.625%, 1/01/32 | | | 1,000 | | | | 1,086,590 | |
6.875%, 1/01/42 | | | 3,500 | | | | 3,810,695 | |
Series 2014
5.00%, 1/01/35 | | | 1,050 | | | | 1,024,979 | |
5.25%, 1/01/45 | | | 3,025 | | | | 2,904,333 | |
California Municipal Finance Authority
(Partnerships Uplift Cmnty Proj)
Series 2012A
5.30%, 8/01/47 | | | 1,675 | | | | 1,715,954 | |
California Municipal Finance Authority
(Rocketship Education)
Series 2014A
7.00%, 6/01/34 | | | 3,800 | | | | 4,276,102 | |
7.25%, 6/01/43 | | | 6,565 | | | | 7,379,716 | |
California Municipal Finance Authority
(Rocketship Seven-Alma Academy)
Series 2012A
6.25%, 6/01/43 | | | 3,340 | | | | 3,622,798 | |
California Municipal Finance Authority
(UTS Bioenergy LLC)
Series 2011A-1
7.50%, 12/01/32 | | | 3,795 | | | | 3,676,748 | |
California Pollution Control Financing Authority
(Poseidon Resources Channelside LP)
Series 2012
5.00%, 11/21/45(a) | | | 31,975 | | | | 33,287,574 | |
| | |
| 44 | | • AB MUNICIPAL INCOME FUND |
AB High Income Municipal Portfolio—Portfolio of Investments
| | | | | | | | |
| | |
| | | Principal
Amount
(000) | | | U.S. $ Value | |
| |
| | | | | | | | |
California School Finance Authority
(Kipp LA)
Series 2014A
5.125%, 7/01/44 | | $ | 2,850 | | | $ | 2,947,071 | |
California School Finance Authority
(Partnerships Uplift Cmnty Valley Proj)
Series 2014A
6.40%, 8/01/34 | | | 1,000 | | | | 1,119,740 | |
6.75%, 8/01/44 | | | 6,180 | | | | 7,077,151 | |
California School Finance Authority
(TRI Valley Learning Corp.)
Series 2012A
7.00%, 6/01/47 | | | 9,085 | | | | 9,770,372 | |
California Statewide Communities Development Authority
(Amino Inglewood CA High School)
Series 2011A
7.25%, 8/01/41 | | | 2,000 | | | | 2,282,520 | |
California Statewide Communities Development Authority
(Eskaton Properties, Inc. Obligated Group)
Series 2012
5.25%, 11/15/34 | | | 3,470 | | | | 3,735,420 | |
California Statewide Communities Development Authority
(Front Porch Communities & Services)
Series 2007A
5.125%, 4/01/37(a) | | | 3,300 | | | | 3,391,047 | |
California Statewide Communities Development Authority
(Moldaw Residences)
Series 2014A
5.375%, 11/01/49 | | | 4,500 | | | | 4,517,910 | |
California Statewide Communities Development Authority
(Rocketship Four-Mosaic Elementary)
Series 2011A
8.50%, 12/01/41 | | | 4,000 | | | | 4,807,560 | |
California Statewide Communities Development Authority
(Rocklin Academy)
Series 2011A
8.25%, 6/01/41 | | | 4,050 | | | | 4,627,732 | |
California Statewide Communities Development Authority
(Terraces at San Joaquin Gardens (The))
Series 2012A
5.625%, 10/01/32 | | | 1,000 | | | | 1,065,640 | |
6.00%, 10/01/47 | | | 1,000 | | | | 1,066,330 | |
| | | | |
| AB MUNICIPAL INCOME FUND • | | | 45 | |
AB High Income Municipal Portfolio—Portfolio of Investments
| | | | | | | | |
| | |
| | | Principal
Amount
(000) | | | U.S. $ Value | |
| |
| | | | | | | | |
City of San Buenaventura CA
(Community Memorial Health System)
Series 2011
7.50%, 12/01/41 | | $ | 4,500 | | | $ | 5,511,195 | |
City of San Jose CA Airport Revenue
AMBAC Series 2007A
5.00%, 3/01/37 | | | 6,245 | | | | 6,494,425 | |
Golden State Tobacco Securitization Corp.
Series 2007A-1
5.125%, 6/01/47 | | | 10,960 | | | | 8,554,718 | |
Los Angeles CA Dept Wtr Pwr
5.00%, 7/01/31(b) | | | 9,000 | | | | 10,338,210 | |
Los Angeles Unified School District/CA
Series 2010KRY
5.25%, 7/01/25(b) | | | 1,000 | | | | 1,176,250 | |
Norco Community Redevelopment Agency Successor Agency
(Norco Redevelopment Agency Project No 1)
Series 2010
6.00%, 3/01/36 | | | 450 | | | | 517,482 | |
Oakland Unified School District/Alameda County
Series 2012A
5.50%, 8/01/32 | | | 1,500 | | | | 1,686,480 | |
Richmond Community Redevelopment Agency
Series 2010A
6.00%, 9/01/30 | | | 1,235 | | | | 1,454,805 | |
San Joaquin Hills Transportation Corridor Agency
Series 2014A
5.00%, 1/15/44 | | | 5,600 | | | | 5,964,896 | |
Series 2014B
5.25%, 1/15/44 | | | 4,000 | | | | 4,290,000 | |
Southern CA Pub Pwr Auth
(Los Angeles CA Dept W&P Pwr)
5.25%, 7/01/27(b) | | | 9,960 | | | | 11,778,696 | |
Southern California Logistics Airport Authority
XLCA Series 2006
5.00%, 12/01/36 | | | 3,600 | | | | 3,635,100 | |
State of California
Series 2013
5.00%, 11/01/43 | | | 12,840 | | | | 14,401,344 | |
Tobacco Securitization Authority of Southern California
(San Diego County Tobacco Asset Securitization Corp.)
Series 2006A1-SNR
5.125%, 6/01/46 | | | 12,700 | | | | 10,455,783 | |
| | |
| 46 | | • AB MUNICIPAL INCOME FUND |
AB High Income Municipal Portfolio—Portfolio of Investments
| | | | | | | | |
| | |
| | | Principal
Amount
(000) | | | U.S. $ Value | |
| |
| | | | | | | | |
Univ of California CA Revenues
5.00%, 5/15/33(b) | | $ | 9,000 | | | $ | 10,326,330 | |
University of California
Series 2013A
5.00%, 5/15/32(b) | | | 10,000 | | | | 11,504,300 | |
West Contra Costa Healthcare District
Series 2011
6.25%, 7/01/42 | | | 5,900 | | | | 6,582,807 | |
| | | | | | | | |
| | | | | | | 230,422,968 | |
| | | | | | | | |
Colorado – 1.6% | | | | | | | | |
Castle Oaks Metropolitan District No 3
Series 2015
6.25%, 12/01/44 | | | 1,000 | | | | 984,120 | |
Central Platte Valley Metropolitan District
Series 2014
5.00%, 12/01/43 | | | 1,250 | | | | 1,288,375 | |
Colorado Educational & Cultural Facilities Authority
(STEM School Academy)
Series 2014
5.00%, 11/01/44 | | | 890 | | | | 885,879 | |
5.125%, 11/01/49 | | | 765 | | | | 759,454 | |
Colorado Health Facilities Authority
(Catholic Health Initiatives)
Series 2013
5.25%, 1/01/40 | | | 5,795 | | | | 6,347,611 | |
Colorado Health Facilities Authority
(Evangelical Lutheran Good Samaritan Obligated Group)
Series 2012
5.00%, 12/01/42 | | | 2,690 | | | | 2,819,254 | |
E-470 Public Highway Authority
Series 2010C
5.25%, 9/01/25 | | | 600 | | | | 683,454 | |
Fitzsimons Village Metropolitan District No 1
Series 2010A
7.50%, 3/01/40 | | | 1,433 | | | | 1,573,248 | |
Foothills Metropolitan District
Series 2014
6.00%, 12/01/38 | | | 2,000 | | | | 2,107,840 | |
Park Creek Metropolitan District
Series 2005
5.50%, 12/01/30-12/01/37 | | | 3,800 | | | | 3,868,831 | |
Plaza Metropolitan District No 1
Series 2013
5.00%, 12/01/40 | | | 1,000 | | | | 1,040,670 | |
Regional Transportation District
(Denver Transit Partners LLC)
Series 2010
6.00%, 1/15/41 | | | 5,810 | | | | 6,586,623 | |
| | | | |
| AB MUNICIPAL INCOME FUND • | | | 47 | |
AB High Income Municipal Portfolio—Portfolio of Investments
| | | | | | | | |
| | |
| | | Principal
Amount
(000) | | | U.S. $ Value | |
| |
| | | | | | | | |
Tallyns Reach Metropolitan District No 3
Series 2013
5.125%, 11/01/38 | | $ | 1,035 | | | $ | 1,062,593 | |
Three Springs Metropolitan District No 3
Series 2010
7.75%, 12/01/39 | | | 2,550 | | | | 2,721,921 | |
| | | | | | | | |
| | | | | | | 32,729,873 | |
| | | | | | | | |
Connecticut – 0.4% | | | | | | | | |
State of Connecticut
Series 2013E
5.00%, 8/15/31(b) | | | 7,840 | | | | 8,934,477 | |
| | | | | | | | |
| | |
Delaware – 0.0% | | | | | | | | |
Delaware State Economic Development Authority
(Newark Charter School, Inc.)
Series 2012
5.00%, 9/01/42 | | | 575 | | | | 601,410 | |
| | | | | | | | |
| | |
District of Columbia – 1.1% | | | | | | | | |
District of Columbia
(American Society of Hematology, Inc. (The))
Series 2009
5.00%, 7/01/36 | | | 3,000 | | | | 3,185,130 | |
District of Columbia
(Center for Strategic International Studies, Inc.)
Series 2011
6.625%, 3/01/41 | | | 1,850 | | | | 2,118,324 | |
District of Columbia
(Friendship Public Charter School, Inc.)
Series 2012
5.00%, 6/01/42 | | | 2,660 | | | | 2,764,378 | |
District of Columbia
(KIPP DC)
Series 2013
6.00%, 7/01/48 | | | 2,900 | | | | 3,288,339 | |
District of Columbia Pers Income Tax
5.00%, 12/01/29(b) | | | 10,000 | | | | 11,470,700 | |
| | | | | | | | |
| | | | | | | 22,826,871 | |
| | | | | | | | |
Florida – 5.6% | | | | | | | | |
Alachua County Health Facilities Authority (Bonita Springs Retirement Village, Inc.)
Series 2011A
8.125%, 11/15/46 | | | 5,000 | | | | 5,882,350 | |
Alachua County Health Facilities Authority (East Ridge Retirement Village, Inc.)
Series 2014
6.25%, 11/15/44 | | | 3,150 | | | | 3,431,201 | |
| | |
| 48 | | • AB MUNICIPAL INCOME FUND |
AB High Income Municipal Portfolio—Portfolio of Investments
| | | | | | | | |
| | |
| | | Principal
Amount
(000) | | | U.S. $ Value | |
| |
| | | | | | | | |
Alachua County Health Facilities Authority (Oak Hammock at the University of Florida)
Series 2012A
8.00%, 10/01/42-10/01/46 | | $ | 4,065 | | | $ | 5,050,903 | |
Alachua County Health Facilities Authority (Shands Teaching Hospital and Clinics Obligated Group)
Series 2014A
5.00%, 12/01/44 | | | 4,000 | | | | 4,329,840 | |
Capital Trust Agency, Inc.
(Million Air One LLC)
Series 2011
7.75%, 1/01/41 | | | 11,905 | | | | 11,225,344 | |
City of Lakeland FL
(Florida Southern College)
Series 2012A
5.00%, 9/01/37-9/01/42 | | | 1,500 | | | | 1,575,145 | |
City of Tallahassee FL
(Tallahassee Memorial HealthCare, Inc.)
Series 2015A
5.00%, 12/01/44 | | | 6,830 | | | | 7,198,069 | |
Collier County Health Facilities Authority
(The Moorings)
Series 2015A
5.00%, 5/01/45 | | | 4,525 | | | | 4,926,910 | |
Collier County Industrial Development Authority
(Arlington of Naples (The))
Series 2014A
8.125%, 5/15/44(a) | | | 7,900 | | | | 9,331,638 | |
Florida Development Finance Corp.
(Tuscan Isle Obligated Group)
Series 2015A
7.00%, 6/01/45(a) | | | 4,200 | | | | 4,266,276 | |
Lakewood Ranch Stewardship District
Series 2015
4.875%, 5/01/35-5/01/45 | | | 2,000 | | | | 1,957,590 | |
Martin County Health Facilities Authority (Martin Memorial Medical Center)
Series 2012
5.50%, 11/15/32-11/15/42 | | | 9,050 | | | | 9,963,091 | |
Martin County Industrial Development Authority
(Indiantown Cogeneration LP)
Series 2013
4.20%, 12/15/25 | | | 6,710 | | | | 6,816,421 | |
| | | | |
| AB MUNICIPAL INCOME FUND • | | | 49 | |
AB High Income Municipal Portfolio—Portfolio of Investments
| | | | | | | | |
| | |
| | | Principal
Amount
(000) | | | U.S. $ Value | |
| |
| | | | | | | | |
Miami Beach Health Facilities Authority
(Mount Sinai Medical Center of Florida, Inc.)
Series 2012
5.00%, 11/15/29 | | $ | 4,365 | | | $ | 4,857,590 | |
Series 2014
5.00%, 11/15/44 | | | 13,350 | | | | 14,272,351 | |
Mid-Bay Bridge Authority
Series 2011A
7.25%, 10/01/21 (Pre-refunded/ETM) | | | 1,035 | | | | 1,370,164 | |
Palm Beach County Health Facilities Authority
Series 2007
5.875%, 11/15/17 (Pre-refunded/ETM) | | | 4,250 | | | | 4,751,287 | |
St Johns County Industrial Development Authority
(Presbyterian Retirement Communities, Inc. Obligated Group)
Series 2010A
5.875%, 8/01/40 | | | 4,000 | | | | 4,466,800 | |
Town of Davie FL
(Nova Southeastern University, Inc.)
Series 2013A
6.00%, 4/01/42 | | | 9,050 | | | | 10,406,504 | |
| | | | | | | | |
| | | | | | | 116,079,474 | |
| | | | | | | | |
Georgia – 0.8% | | | | | | | | |
Metro Atlanta Rapid Tran Auth GA AGM
5.00%, 7/01/29(b) | | | 10,220 | | | | 11,003,567 | |
Private Colleges & Universities Authority
(Savannah College of Art & Design, Inc.)
Series 2014
5.00%, 4/01/44 | | | 5,000 | | | | 5,345,500 | |
| | | | | | | | |
| | | | | | | 16,349,067 | |
| | | | | | | | |
Guam – 0.1% | | | | | | | | |
Guam Department of Education COP
Series 2010A
6.875%, 12/01/40 | | | 910 | | | | 1,001,755 | |
Territory of Guam
Series 2009A
7.00%, 11/15/39 | | | 1,000 | | | | 1,195,570 | |
| | | | | | | | |
| | | | | | | 2,197,325 | |
| | | | | | | | |
Idaho – 0.6% | | | | | | | | |
Idaho Health Facilities Authority
(The Terraces at Boise)
Series 2014A
8.00%, 10/01/44 | | | 7,850 | | | | 8,268,405 | |
Idaho Housing & Finance Association
(Battelle Energy Alliance LLC)
Series 2010A
7.00%, 2/01/36 | | | 4,000 | | | | 4,769,680 | |
| | | | | | | | |
| | | | | | | 13,038,085 | |
| | | | | | | | |
| | |
| 50 | | • AB MUNICIPAL INCOME FUND |
AB High Income Municipal Portfolio—Portfolio of Investments
| | | | | | | | |
| | |
| | | Principal
Amount
(000) | | | U.S. $ Value | |
| |
| | | | | | | | |
Illinois – 7.1% | | | | | | | | |
Chicago Board of Education
Series 2012A
5.00%, 12/01/42 | | $ | 5,060 | | | $ | 4,481,693 | |
Series 2015C
5.25%, 12/01/39 | | | 3,925 | | | | 3,630,076 | |
Chicago O’Hare International Airport
(Chicago O’Hare International Airport Customer Facility Charge)
Series 2013
5.75%, 1/01/43 | | | 2,055 | | | | 2,335,466 | |
Chicago Transit Authority
(Chicago Transit Authority Sales Tax)
Series 2011
5.25%, 12/01/31 | | | 5,000 | | | | 5,363,200 | |
Series 2014
5.25%, 12/01/49 | | | 8,000 | | | | 8,516,720 | |
City of Chicago IL
Series 2015-2
5.50%, 1/01/37(c) | | | 1,300 | | | | 1,285,310 | |
City of Chicago IL
(Asphalt Operating Services of Chicago LLC)
Series 2010
6.125%, 12/01/18 | | | 1,975 | | | | 2,042,328 | |
City of Chicago IL
(Goldblatts Supportive Living Project)
Series 2013
6.375%, 12/01/52(d) | | | 7,950 | | | | 7,483,335 | |
City of Chicago IL
(Metramarket of Chicago LLC)
Series 2010A
6.87%, 2/15/24 | | | 978 | | | | 979,696 | |
Illinois Finance Authority
Series 2010B
6.00%, 5/01/20 (Pre-refunded/ETM) | | | 2,025 | | | | 2,444,175 | |
Illinois Finance Authority
(Ascension Health Credit Group)
Series 2012A
5.00%, 11/15/42 | | | 6,400 | | | | 6,946,048 | |
Illinois Finance Authority
(Greenfields of Geneva)
Series 2010A
8.125%, 2/15/40 | | | 3,950 | | | | 4,178,033 | |
8.25%, 2/15/46 | | | 1,950 | | | | 2,062,613 | |
Illinois Finance Authority
(Illinois Institute of Technology)
Series 2006A
5.00%, 4/01/19-4/01/36 | | | 7,675 | | | | 7,741,374 | |
| | | | |
| AB MUNICIPAL INCOME FUND • | | | 51 | |
AB High Income Municipal Portfolio—Portfolio of Investments
| | | | | | | | |
| | |
| | | Principal
Amount
(000) | | | U.S. $ Value | |
| |
| | | | | | | | |
Illinois Finance Authority
(Lake Forest College)
Series 2012A
6.00%, 10/01/48 | | $ | 1,300 | | | $ | 1,398,644 | |
Illinois Finance Authority
(Lutheran Home & Services Obligated Group)
Series 2012
5.625%, 5/15/42 | | | 7,525 | | | | 7,842,856 | |
5.75%, 5/15/46 | | | 4,740 | | | | 4,932,302 | |
Illinois Finance Authority
(OSF Healthcare System)
Series 2010A
6.00%, 5/15/39 | | | 5,785 | | | | 6,687,113 | |
Illinois Finance Authority
(Park Place of Elmhurst)
Series 2010A
8.125%, 5/15/40 | | | 5,110 | | | | 3,114,749 | |
8.25%, 5/15/45 | | | 10,070 | | | | 6,137,665 | |
Illinois Finance Authority
(Plymouth Place, Inc.)
Series 2005
6.00%, 5/15/37 | | | 5,750 | | | | 5,721,997 | |
Series 2013
6.00%, 5/15/43 | | | 7,500 | | | | 7,345,500 | |
Illinois Finance Authority
(Silver Cross Hospital Obligated Group)
Series 2015C
5.00%, 8/15/44 | | | 4,500 | | | | 4,761,405 | |
Illinois Finance Authority
(Swedish Covenant Hospital)
Series 2010A
6.00%, 8/15/38 | | | 3,360 | | | | 3,719,386 | |
Illinois Finance Authority
(UNO Charter School Network, Inc.)
Series 2011A
6.875%, 10/01/31 | | | 3,385 | | | | 3,811,273 | |
7.125%, 10/01/41 | | | 2,500 | | | | 2,829,750 | |
State of Illinois
Series 2014
5.00%, 5/01/32-4/01/38 | | | 23,680 | | | | 24,035,780 | |
Village of Matteson IL
Series 2010
8.00%, 12/01/29(e) | | | 5,000 | | | | 4,681,400 | |
| | | | | | | | |
| | | | | | | 146,509,887 | |
| | | | | | | | |
| | |
| 52 | | • AB MUNICIPAL INCOME FUND |
AB High Income Municipal Portfolio—Portfolio of Investments
| | | | | | | | |
| | |
| | | Principal
Amount
(000) | | | U.S. $ Value | |
| |
| | | | | | | | |
Indiana – 2.2% | | | | | | | | |
Indiana Finance Authority
(Bethany Circle of King’s Daughters’ of Madison Indiana, Inc. (The))
Series 2010
5.50%, 8/15/40-8/15/45 | | $ | 8,010 | | | $ | 8,782,183 | |
Indiana Finance Authority
(I-69 Development Partners LLC)
Series 2014
5.25%, 9/01/40 | | | 5,000 | | | | 5,386,550 | |
Indiana Finance Authority
(Marquette Manor LLC)
Series 2012
4.75%, 3/01/32 | | | 5,535 | | | | 5,828,134 | |
Indiana Finance Authority
(Marquette Manor)
Series 2015A
5.00%, 3/01/39 | | | 2,675 | | | | 2,818,246 | |
Indiana Finance Authority
(WVB East End Partners LLC)
Series 2013A
5.00%, 7/01/44-7/01/48 | | | 22,595 | | | | 23,585,479 | |
| | | | | | | | |
| | | | | | | 46,400,592 | |
| | | | | | | | |
Iowa – 0.2% | | | | | | | | |
Iowa Finance Authority
(Alcoa, Inc.)
Series 2012
4.75%, 8/01/42 | | | 3,100 | | | | 3,208,221 | |
Iowa Tobacco Settlement Authority
Series 2005C
5.625%, 6/01/46 | | | 1,100 | | | | 969,672 | |
| | | | | | | | |
| | | | | | | 4,177,893 | |
| | | | | | | | |
Kansas – 0.1% | | | | | | | | |
Wyandotte County-Kansas City Unified Government
Series 2010B
Zero Coupon, 6/01/21 | | | 2,415 | | | | 1,717,548 | |
| | | | | | | | |
| | |
Kentucky – 2.5% | | | | | | | | |
Kentucky Economic Development Finance Authority
(Catholic Health Initiatives)
Series 2013
5.375%, 1/01/40 | | | 3,250 | | | | 3,602,235 | |
| | | | |
| AB MUNICIPAL INCOME FUND • | | | 53 | |
AB High Income Municipal Portfolio—Portfolio of Investments
| | | | | | | | |
| | |
| | | Principal
Amount
(000) | | | U.S. $ Value | |
| |
| | | | | | | | |
Kentucky Economic Development Finance Authority
(Masonic Homes of Kentucky, Inc. Obligated Group)
Series 2012
5.375%, 11/15/42 | | $ | 7,765 | | | $ | 7,881,320 | |
5.50%, 11/15/45 | | | 2,350 | | | | 2,397,376 | |
Kentucky Economic Development Finance Authority
(Owensboro Medical Health System, Inc.)
Series 2010A
6.00%, 6/01/30 | | | 11,110 | | | | 12,645,291 | |
6.375%, 6/01/40 | | | 2,900 | | | | 3,317,571 | |
6.50%, 3/01/45 | | | 3,725 | | | | 4,254,993 | |
Kentucky Municipal Power Agency
NATL Series 2015A
5.00%, 9/01/42 | | | 16,585 | | | | 17,908,814 | |
| | | | | | | | |
| | | | | | | 52,007,600 | |
| | | | | | | | |
Louisiana – 3.2% | | | | | | | | |
Jefferson Parish Hospital Service District No 2
Series 2011
6.375%, 7/01/41 | | | 8,240 | | | | 9,860,314 | |
Louisiana Local Government Environmental Facilities & Community Development Auth
(St James Place of Baton Rouge)
Series 2015A
6.25%, 11/15/45 | | | 7,625 | | | | 7,552,944 | |
Louisiana Local Government Environmental Facilities & Community Development Auth
(Woman’s Hospital Foundation)
Series 2010A
5.625%, 10/01/30 | | | 1,200 | | | | 1,393,068 | |
5.875%, 10/01/40 | | | 4,200 | | | | 4,895,982 | |
6.00%, 10/01/44 | | | 1,740 | | | | 2,034,373 | |
Louisiana Public Facilities Authority
(Louisiana Pellets, Inc.)
Series 2013B
10.50%, 7/01/39 | | | 7,250 | | | | 7,885,462 | |
Series 2014A
8.375%, 7/01/39 | | | 17,000 | | | | 17,404,090 | |
St Tammany Parish Finance Authority
(Christwood)
Series 2015
5.25%, 11/15/37 | | | 4,600 | | | | 4,637,352 | |
State of Louisiana Gasoline & Fuels Tax Revenue
XLCA Series 2006A
5.00%, 5/01/16 (Pre-refunded/ETM)(b) | | | 10,000 | | | | 10,425,400 | |
| | | | | | | | |
| | | | | | | 66,088,985 | |
| | | | | | | | |
| | |
| 54 | | • AB MUNICIPAL INCOME FUND |
AB High Income Municipal Portfolio—Portfolio of Investments
| | | | | | | | |
| | |
| | | Principal
Amount
(000) | | | U.S. $ Value | |
| |
| | | | | | | | |
Maine – 0.9% | | | | | | | | |
Maine Health & Higher Educational Facilities Authority
(MaineGeneral Health Obligated Group)
Series 2011
6.75%, 7/01/36-7/01/41 | | $ | 8,440 | | | $ | 9,462,977 | |
Maine Health & Higher Educational Facilities Authority
(Stephens Memorial Hospital Association)
Series 2015
5.00%, 7/01/39 | | | 8,100 | | | | 8,704,908 | |
| | | | | | | | |
| | | | | | | 18,167,885 | |
| | | | | | | | |
Maryland – 0.3% | | | | | | | | |
City of Westminster MD
(Lutheran Village at Miller’s Grant)
Series 2014A
6.00%, 7/01/34 | | | 1,500 | | | | 1,594,815 | |
6.125%, 7/01/39 | | | 750 | | | | 797,423 | |
6.25%, 7/01/44 | | | 2,000 | | | | 2,136,900 | |
County of Anne Arundel MD
(National Business Park North)
Series 2010
6.10%, 7/01/40 | | | 1,000 | | | | 1,068,880 | |
| | | | | | | | |
| | | | | | | 5,598,018 | |
| | | | | | | | |
Massachusetts – 1.6% | | | | | | | | |
Commonwealth of Massachusetts
NATL Series 2000E
0.12%, 12/01/30(f)(g) | | | 2,875 | | | | 2,683,002 | |
NATL Series 2000F
0.105%, 12/01/30(f)(g) | | | 8,275 | | | | 7,722,370 | |
Massachusetts Development Finance Agency
(Merrimack College)
Series 2012A
5.25%, 7/01/42 | | | 5,000 | | | | 5,218,800 | |
Massachusetts Development Finance Agency
(North Hill Communities, Inc. Obligated Group)
Series 2013A
6.25%, 11/15/33(a) | | | 2,000 | | | | 2,164,800 | |
6.50%, 11/15/43(a) | | | 3,750 | | | | 4,077,150 | |
Massachusetts School Building Authority
Series 2012B
5.00%, 8/15/30(b) | | | 10,000 | | | | 11,695,000 | |
| | | | | | | | |
| | | | | | | 33,561,122 | |
| | | | | | | | |
| | | | |
| AB MUNICIPAL INCOME FUND • | | | 55 | |
AB High Income Municipal Portfolio—Portfolio of Investments
| | | | | | | | |
| | |
| | | Principal
Amount
(000) | | | U.S. $ Value | |
| |
| | | | | | | | |
Michigan – 4.7% | | | | | | | | |
City of Detroit MI Sewage Disposal System Revenue
Series 2012A
5.25%, 7/01/39 | | $ | 8,600 | | | $ | 9,131,394 | |
City of Detroit MI Water Supply System Revenue
Series 2011C
5.00%, 7/01/41 | | | 1,425 | | | | 1,453,358 | |
5.25%, 7/01/27 | | | 5,000 | | | | 5,429,550 | |
Detroit City School District
Series 2012A
5.00%, 5/01/30-5/01/31 | | | 4,015 | | | | 4,367,613 | |
Michigan Finance Authority
(City of Detroit MI Sewage Disposal System Revenue)
Series 2014C-1
5.00%, 7/01/44 | | | 11,970 | | | | 12,505,897 | |
Series 2014C-2
5.00%, 7/01/44 | | | 2,000 | | | | 2,058,740 | |
Series 2014C-6
5.00%, 7/01/33 | | | 2,750 | | | | 2,959,687 | |
Michigan Finance Authority
(City of Detroit MI Water Supply System Revenue)
Series 2014D4
5.00%, 7/01/29-7/01/30 | | | 2,400 | | | | 2,613,368 | |
Michigan Finance Authority
(Public Lighting Authority)
Series 2014B
5.00%, 7/01/39 | | | 13,580 | | | | 14,519,464 | |
Michigan State Hospital Finance Authority
(Henry Ford Health System Obligated Group)
Series 2006A
5.25%, 11/15/46 | | | 1,000 | | | | 1,040,070 | |
Michigan State Hospital Finance Authority
(Presbyterian Villages of Michigan Obligated Group)
Series 2005
5.50%, 11/15/35 | | | 1,750 | | | | 1,732,990 | |
Michigan Strategic Fund
(Detroit Renewable Energy Obligated Group)
Series 2013
8.50%, 12/01/30(a) | | | 11,045 | | | | 10,513,183 | |
Series 2014
9.00%, 12/01/25 | | | 6,760 | | | | 6,721,603 | |
| | |
| 56 | | • AB MUNICIPAL INCOME FUND |
AB High Income Municipal Portfolio—Portfolio of Investments
| | | | | | | | |
| | |
| | | Principal
Amount
(000) | | | U.S. $ Value | |
| |
| | | | | | | | |
Michigan Strategic Fund
(Evangelical Homes of Michigan Obligated Group)
Series 2013
5.50%, 6/01/47 | | $ | 1,750 | | | $ | 1,794,888 | |
Michigan Tobacco Settlement Finance Authority
Series 2007A
6.00%, 6/01/48 | | | 23,470 | | | | 19,758,454 | |
| | | | | | | | |
| | | | | | | 96,600,259 | |
| | | | | | | | |
Minnesota – 0.4% | | | | | | | | |
City of St Louis Park MN
(Park Nicollet Health Services Obligated Group)
Series 2009
5.75%, 7/01/39 | | | 3,000 | | | | 3,400,740 | |
Woodbury Housing & Redevelopment Authority
(St Therese of Woodbury)
Series 2014
5.125%, 12/01/44 | | | 2,500 | | | | 2,506,525 | |
5.25%, 12/01/49 | | | 1,565 | | | | 1,588,365 | |
| | | | | | | | |
| | | | | | | 7,495,630 | |
| | | | | | | | |
Missouri – 0.2% | | | | | | | | |
Health & Educational Facilities Authority of the State of Missouri
(Lutheran Senior Services Obligated Group)
Series 2010
5.50%, 2/01/42 | | | 1,520 | | | | 1,638,773 | |
Series 2011
6.00%, 2/01/41 | | | 1,750 | | | | 1,986,285 | |
| | | | | | | | |
| | | | | | | 3,625,058 | |
| | | | | | | | |
Nebraska – 1.2% | | | | | | | | |
Central Plains Energy Project
(Goldman Sachs Group, Inc. (The))
Series 2012
5.00%, 9/01/32-9/01/42 | | | 17,050 | | | | 18,239,227 | |
5.25%, 9/01/37 | | | 1,500 | | | | 1,630,575 | |
Douglas County Hospital Authority No 2
(Madonna Rehabilitation Hospital)
Series 2014
5.00%, 5/15/44 | | | 4,015 | | | | 4,292,677 | |
| | | | | | | | |
| | | | | | | 24,162,479 | |
| | | | | | | | |
| | | | |
| AB MUNICIPAL INCOME FUND • | | | 57 | |
AB High Income Municipal Portfolio—Portfolio of Investments
| | | | | | | | |
| | |
| | | Principal
Amount
(000) | | | U.S. $ Value | |
| |
| | | | | | | | |
Nevada – 0.2% | | | | | | | | |
City of Reno NV
(Renown Regional Medical Center, Inc.)
Series 2007A
5.25%, 6/01/41 | | $ | 4,730 | | | $ | 5,151,538 | |
| | | | | | | | |
| | |
New Hampshire – 0.2% | | | | | | | | |
New Hampshire Health and Education Facilities Authority Act
(Southern New Hampshire University)
Series 2012
5.00%, 1/01/42 | | | 4,585 | | | | 4,759,047 | |
| | | | | | | | |
| | |
New Jersey – 5.6% | | | | | | | | |
Burlington County Bridge Commission
(Evergreens (The))
Series 2007
5.625%, 1/01/38 | | | 3,790 | | | | 3,904,268 | |
Gloucester County Pollution Control Financing Authority
(Logan Cogen Proj)
Series 2014A
5.00%, 12/01/24 | | | 3,000 | | | | 3,360,840 | |
New Jersey Economic Development Authority
Series 2014U
5.00%, 6/15/40 | | | 8,500 | | | | 8,573,610 | |
New Jersey Economic Development Authority
(NYNJ Link Borrower LLC)
Series 2013
5.125%, 1/01/34 | | | 9,780 | | | | 10,549,882 | |
New Jersey Economic Development Authority
(UMM Energy Partners LLC)
Series 2012A
5.125%, 6/15/43 | | | 7,515 | | | | 7,901,722 | |
New Jersey Economic Development Authority
(United Airlines, Inc.)
Series 1999
4.875%, 9/15/19 | | | 1,515 | | | | 1,595,265 | |
5.25%, 9/15/29 | | | 4,140 | | | | 4,519,555 | |
Series 2000B
5.625%, 11/15/30 | | | 13,925 | | | | 15,559,656 | |
New Jersey Health Care Facilities Financing Authority
(Holy Name Medical Center, Inc.)
Series 2010
5.00%, 7/01/25 | | | 5,240 | | | | 5,676,125 | |
| | |
| 58 | | • AB MUNICIPAL INCOME FUND |
AB High Income Municipal Portfolio—Portfolio of Investments
| | | | | | | | |
| | |
| | | Principal
Amount
(000) | | | U.S. $ Value | |
| |
| | | | | | | | |
New Jersey Health Care Facilities Financing Authority
(St Joseph’s Healthcare System Obligated Group)
Series 2008
6.625%, 7/01/38 | | $ | 1,500 | | | $ | 1,671,315 | |
New Jersey Health Care Facilities Financing Authority
(Trinitas Regional Medical Center)
Series 2007A
5.25%, 7/01/30 | | | 2,000 | | | | 2,115,660 | |
New Jersey State Turnpike Authority
Series 2012A
5.00%, 1/01/33 | | | 4,745 | | | | 5,230,129 | |
Series 2012B
5.00%, 1/01/30 | | | 9,360 | | | | 10,472,155 | |
South Jersey Transportation Authority LLC
Series 2014A
5.00%, 11/01/39 | | | 7,765 | | | | 8,138,885 | |
Tobacco Settlement Financing Corp./NJ
Series 20071A
5.00%, 6/01/41 | | | 34,040 | | | | 25,841,466 | |
| | | | | | | | |
| | | | | | | 115,110,533 | |
| | | | | | | | |
New Mexico – 0.8% | | | | | | | | |
New Mexico Hospital Equipment Loan Council
(Gerald Champion Regional Medical Center)
Series 2012
5.50%, 7/01/42 | | | 8,155 | | | | 8,159,322 | |
New Mexico Hospital Equipment Loan Council
(Presbyterian Healthcare Services Obligated Group)
Series 2012A
5.00%, 8/01/42 | | | 7,000 | | | | 7,531,090 | |
| | | | | | | | |
| | | | | | | 15,690,412 | |
| | | | | | | | |
New York – 10.5% | | | | | | | | |
Build NYC Resource Corp.
(Metropolitan College of New York)
Series 2014
5.00%, 11/01/39 | | | 6,950 | | | | 7,090,946 | |
5.50%, 11/01/44 | | | 2,875 | | | | 3,041,463 | |
City of Newburgh NY
Series 2012A
5.25%, 6/15/27 | | | 1,010 | | | | 1,102,233 | |
5.625%, 6/15/34 | | | 1,235 | | | | 1,345,113 | |
| | | | |
| AB MUNICIPAL INCOME FUND • | | | 59 | |
AB High Income Municipal Portfolio—Portfolio of Investments
| | | | | | | | |
| | |
| | | Principal
Amount
(000) | | | U.S. $ Value | |
| |
| | | | | | | | |
Metropolitan Transportation Authority
Series 2013C
5.00%, 11/15/31 | | $ | 5,000 | | | $ | 5,604,900 | |
Series 2014A
5.00%, 11/15/32 | | | 4,425 | | | | 4,972,240 | |
Series 2015A
5.00%, 11/15/34-11/15/45 | | | 18,225 | | | | 20,274,687 | |
Metropolitan Trnsp Auth NY
(Metro Trnsp Auth NY Ded Tax)
5.00%, 11/15/31(b) | | | 10,740 | | | | 12,316,310 | |
Nassau County Industrial Development Agency
(Amsterdam House Continuing Care Retirement Community, Inc.)
Series 2014A
5.875%, 1/01/23 | | | 1,121 | | | | 1,125,600 | |
6.50%, 1/01/32 | | | 1,399 | | | | 1,388,847 | |
6.70%, 1/01/49 | | | 2,049 | | | | 1,991,672 | |
Series 2014B
5.50%, 7/01/20 | | | 813 | | | | 814,572 | |
Series 2014C
2.00%, 1/01/49 | | | 1,933 | | | | 154,641 | |
Nassau County Local Economic Assistance Corp.
(Winthrop University Hospital)
Series 2012
5.00%, 7/01/37 | | | 3,380 | | | | 3,627,382 | |
New York City Industrial Development Agency
(American Airlines, Inc.)
Series 2005
7.50%, 8/01/16 | | | 415 | | | | 431,550 | |
7.75%, 8/01/31 | | | 2,000 | | | | 2,158,320 | |
8.00%, 8/01/28 | | | 5,550 | | | | 6,005,211 | |
New York City Municipal Water Finance Authority
Series 2013E
5.00%, 6/15/47 | | | 6,400 | | | | 7,048,320 | |
Series 2014E
5.00%, 6/15/36 | | | 7,075 | | | | 7,966,592 | |
New York City NY Transitional
5.00%, 11/01/28-2/01/32(b) | | | 18,640 | | | | 21,406,778 | |
New York City Water & Sewer System
Series 2013D
5.00%, 6/15/34(b) | | | 10,000 | | | | 11,319,100 | |
New York Liberty Development Corp.
(3 World Trade Center LLC)
Series 2014
5.00%, 11/15/44(a) | | | 7,850 | | | | 7,967,986 | |
| | |
| 60 | | • AB MUNICIPAL INCOME FUND |
AB High Income Municipal Portfolio—Portfolio of Investments
| | | | | | | | |
| | |
| | | Principal
Amount
(000) | | | U.S. $ Value | |
| |
| | | | | | | | |
New York Liberty Development Corp.
(7 World Trade Center II LLC)
Series 2012
5.00%, 3/15/44 | | $ | 1,900 | | | $ | 2,004,861 | |
New York NY GO
Series 2008D-1
5.125%, 12/01/27(b) | | | 7,340 | | | | 8,061,155 | |
Series 2013A-1
5.00%, 10/01/28(b) | | | 9,500 | | | | 10,943,525 | |
New York NY Transitional Fin Auth
Series 2011D-1
5.00%, 2/01/26(b) | | | 10,000 | | | | 11,522,700 | |
New York State Thruway Authority
(New York State Thruway Authority Gen Toll Road)
Series 2014J
5.00%, 1/01/33 | | | 7,050 | | | | 7,916,445 | |
Onondaga Civic Development Corp.
(St Joseph’s Hospital Health Center)
Series 2012
5.00%, 7/01/42 | | | 3,765 | | | | 3,852,687 | |
Orange County Funding Corp.
(The Hamlet at Wallkill)
Series 2013
6.50%, 1/01/46 | | | 6,375 | | | | 6,385,901 | |
Port Authority of New York & New Jersey
Series 2012
5.00%, 10/01/33 | | | 5,000 | | | | 5,496,350 | |
Port Authority of New York & New Jersey
(Delta Air Lines, Inc.)
Series 2010
6.00%, 12/01/42 | | | 2,285 | | | | 2,673,998 | |
Suffolk County Industrial Development Agency
(New York Institute of Technology)
Series 2000
5.00%, 3/01/26 | | | 50 | | | | 50,422 | |
Triborough Bridge & Tunnel Authority
Series 2012B
5.00%, 11/15/28-11/15/29(b) | | | 11,170 | | | | 12,942,346 | |
Ulster County Capital Resource Corp.
(Kingston Regional Senior Living Corp.)
Series 2014A
7.50%, 9/15/44(a)(e) | | | 2,025 | | | | 1,518,649 | |
Series 2014B
7.00%, 9/15/44(a) | | | 2,350 | | | | 2,458,100 | |
| | | | |
| AB MUNICIPAL INCOME FUND • | | | 61 | |
AB High Income Municipal Portfolio—Portfolio of Investments
| | | | | | | | |
| | |
| | | Principal
Amount
(000) | | | U.S. $ Value | |
| |
| | | | | | | | |
Ulster County Industrial Development Agency
(Kingston Regional Senior Living Corp.)
Series 2007A
5.25%, 9/15/16 | | $ | 855 | | | $ | 864,764 | |
6.00%, 9/15/27-9/15/37 | | | 10,380 | | | | 10,356,540 | |
| | | | | | | | |
| | | | | | | 216,202,906 | |
| | | | | | | | |
North Carolina – 0.4% | | | | | | | | |
North Carolina Medical Care Commission
Series 2005A
6.125%, 10/01/15 (Pre-refunded/ETM) | | | 6,350 | | | | 6,474,079 | |
North Carolina Medical Care Commission
(Pennybyrn at Maryfield)
Series 2015
5.00%, 10/01/35 | | | 1,625 | | | | 1,674,985 | |
| | | | | | | | |
| | | | | | | 8,149,064 | |
| | | | | | | | |
North Dakota – 0.2% | | | | | | | | |
County of Burleigh ND
Series 2014A
5.00%, 7/01/21 (Pre-refunded/ETM) | | | 4,120 | | | | 4,873,136 | |
| | | | | | | | |
| | |
Ohio – 4.3% | | | | | | | | |
Buckeye Tobacco Settlement Financing Authority
Series 2007A-2
5.875%, 6/01/47 | | | 35,560 | | | | 28,550,057 | |
City of Cleveland OH Airport System Revenue
Series 2012A
5.00%, 1/01/30 | | | 3,000 | | | | 3,247,620 | |
County of Erie OH
(Firelands Regional Medical Center)
Series 2006A
5.00%, 8/15/36 | | | 1,290 | | | | 1,338,594 | |
5.25%, 8/15/46 | | | 2,710 | | | | 2,736,450 | |
County of Franklin OH
(First Community Village Obligated Group)
Series 2013
5.625%, 7/01/47 | | | 11,835 | | | | 11,229,876 | |
County of Gallia OH
(Holzer Health System Obligated Group)
Series 2012A
8.00%, 7/01/42 | | | 5,000 | | | | 5,647,800 | |
County of Hamilton OH
(Life Enriching Communities Obligated Group)
Series 2012
5.00%, 1/01/42 | | | 1,000 | | | | 1,035,670 | |
| | |
| 62 | | • AB MUNICIPAL INCOME FUND |
AB High Income Municipal Portfolio—Portfolio of Investments
| | | | | | | | |
| | |
| | | Principal
Amount
(000) | | | U.S. $ Value | |
| |
| | | | | | | | |
County of Muskingum OH
(Genesis Health System Obligated Group)
Series 2013
5.00%, 2/15/44-2/15/48 | | $ | 15,760 | | | $ | 16,193,635 | |
Ohio Air Quality Development Authority
(FirstEnergy Nuclear Generation LLC)
Series 2008B
3.625%, 10/01/33 | | | 1,500 | | | | 1,555,470 | |
Ohio State Water Development Authority
(FirstEnergy Nuclear Generation LLC)
Series 2008B
3.625%, 10/01/33 | | | 1,925 | | | | 1,996,187 | |
Pinnacle Community Infrastructure Financing Authority
Series 2004A
6.00%, 12/01/22 | | | 961 | | | | 964,931 | |
6.25%, 12/01/36 | | | 3,500 | | | | 3,510,395 | |
State of Ohio
(Portsmouth Gateway Group LLC)
Series 2015
5.00%, 6/30/53 | | | 11,000 | | | | 11,522,940 | |
| | | | | | | | |
| | | | | | | 89,529,625 | |
| | | | | | | | |
Oklahoma – 0.3% | | | | | | | | |
Oklahoma Development Finance Authority
(Inverness Village an Oklahoma not for Profit Corp.)
Series 2012
5.75%, 1/01/27 | | | 2,930 | | | | 3,045,120 | |
Tulsa Airports Improvement Trust
(American Airlines, Inc.)
Series 2013A
5.50%, 6/01/35 | | | 3,875 | | | | 4,173,181 | |
| | | | | | | | |
| | | | | | | 7,218,301 | |
| | | | | | | | |
Oregon – 1.6% | | | | | | | | |
Hospital Facilities Authority of Multnomah County Oregon
(Mirabella at South Waterfront)
Series 2014A
5.40%, 10/01/44 | | | 3,000 | | | | 3,275,280 | |
5.50%, 10/01/49 | | | 7,800 | | | | 8,512,530 | |
Oregon St Dept of Transprtn
Series 2013A
5.00%, 11/15/29-11/15/30(b) | | | 10,000 | | | | 11,686,150 | |
Oregon State Lottery
Series 2011A
5.25%, 4/01/25(b) | | | 7,310 | | | | 8,610,522 | |
| | | | | | | | |
| | | | | | | 32,084,482 | |
| | | | | | | | |
| | | | |
| AB MUNICIPAL INCOME FUND • | | | 63 | |
AB High Income Municipal Portfolio—Portfolio of Investments
| | | | | | | | |
| | |
| | | Principal
Amount
(000) | | | U.S. $ Value | |
| |
| | | | | | | | |
Pennsylvania – 3.4% | | | | | | | | |
Allegheny County Higher Education Building Authority
(Chatham University)
Series 2012A
5.00%, 9/01/35 | | $ | 1,700 | | | $ | 1,813,611 | |
Allegheny County Industrial Development Authority
(United States Steel Corp.)
Series 2009
6.75%, 11/01/24 | | | 2,875 | | | | 3,272,641 | |
Cumberland County Municipal Authority
(Asbury Pennsylvania Obligated Group)
Series 2010
6.125%, 1/01/45 | | | 4,170 | | | | 4,463,359 | |
Series 2012
5.25%, 1/01/32-1/01/41 | | | 3,720 | | | | 3,846,607 | |
Montgomery County Industrial Development Authority/PA
(Philadelphia Presbytery Homes, Inc.)
Series 2010
6.50%, 12/01/25 | | | 4,000 | | | | 4,633,840 | |
Montgomery County Industrial Development Authority/PA
(Whitemarsh Continuing Care Retirement Community, Inc.)
Series 2015
5.375%, 1/01/50 | | | 3,000 | | | | 3,023,310 | |
Montour School District
AGM Series 2015A
5.00%, 4/01/41-4/01/42 | | | 8,415 | | | | 9,294,259 | |
Norristown Area School District COP
Series 2012
5.00%, 4/01/32 | | | 3,900 | | | | 4,097,496 | |
Northeastern Pennsylvania Hospital & Education Authority
(Wilkes University)
Series 2012A
5.25%, 3/01/42 | | | 2,135 | | | | 2,269,206 | |
Pennsylvania Economic Development Financing Authority
(National Railroad Passenger Corp. (The))
Series 2012A
5.00%, 11/01/41 | | | 3,620 | | | | 3,823,915 | |
| | |
| 64 | | • AB MUNICIPAL INCOME FUND |
AB High Income Municipal Portfolio—Portfolio of Investments
| | | | | | | | |
| | |
| | | Principal
Amount
(000) | | | U.S. $ Value | |
| |
| | | | | | | | |
Pennsylvania Economic Development Financing Authority
(PA Bridges Finco LP)
Series 2015
5.00%, 12/31/34-6/30/42 | | $ | 10,230 | | | $ | 10,917,647 | |
Pennsylvania St
Series 2011
5.00%, 11/15/29(b) | | | 10,000 | | | | 11,334,000 | |
Philadelphia Authority for Industrial Development
(Greater Philadelphia Health Action, Inc.)
Series 2015A
6.375%, 6/01/40(c) | | | 1,300 | | | | 1,284,790 | |
6.50%, 6/01/45(c) | | | 2,390 | | | | 2,360,484 | |
6.625%, 6/01/50(c) | | | 4,150 | | | | 4,097,129 | |
| | | | | | | | |
| | | | | | | 70,532,294 | |
| | | | | | | | |
Puerto Rico – 0.6% | | | | | | | | |
Puerto Rico Industrial Tourist Educational Medical & Envirml Ctl Facs Fing Auth
(AES Puerto Rico LP)
Series 2000
6.625%, 6/01/26 | | | 11,205 | | | | 10,631,752 | |
Puerto Rico Industrial Tourist Educational Medical & Envirml Ctl Facs Fing Auth
(Sistema Universitario Ana G Mendez Incorporado)
Series 2012
5.375%, 4/01/42 | | | 1,665 | | | | 1,424,308 | |
| | | | | | | | |
| | | | | | | 12,056,060 | |
| | | | | | | | |
Rhode Island – 0.5% | | | | | | | | |
Rhode Island Health & Educational Building Corp.
(Tockwotton Home)
Series 2011
8.375%, 1/01/46 | | | 8,500 | | | | 9,663,990 | |
| | | | | | | | |
| | |
South Carolina – 0.5% | | | | | | | | |
South Carolina St Public Svc Auth
AMBAC Series 2007A
5.00%, 1/01/32(b) | | | 10,000 | | | | 10,684,900 | |
| | | | | | | | |
| | |
Tennessee – 1.1% | | | | | | | | |
Chattanooga Health Educational & Housing Facility Board
(Catholic Health Initiatives)
Series 2013
5.25%, 1/01/45 | | | 4,850 | | | | 5,289,119 | |
| | | | |
| AB MUNICIPAL INCOME FUND • | | | 65 | |
AB High Income Municipal Portfolio—Portfolio of Investments
| | | | | | | | |
| | |
| | | Principal
Amount
(000) | | | U.S. $ Value | |
| |
| | | | | | | | |
Johnson City Health & Educational Facilities Board
(Mountain States Health Alliance Obligated Group)
Series 2012
5.00%, 8/15/42 | | $ | 2,455 | | | $ | 2,588,282 | |
Shelby County Health Educational & Housing Facilities Board
(Village at Germantown, Inc. (The))
Series 2012
5.00%, 12/01/32 | | | 2,200 | | | | 2,267,914 | |
5.25%, 12/01/42 | | | 5,700 | | | | 5,838,225 | |
5.375%, 12/01/47 | | | 1,700 | | | | 1,749,062 | |
Series 2014
5.25%, 12/01/44-12/01/49 | | | 4,325 | | | | 4,390,000 | |
| | | | | | | | |
| | | | | | | 22,122,602 | |
| | | | | | | | |
Texas – 8.1% | | | | | | | | |
Austin Convention Enterprises, Inc.
Series 2006B
6.00%, 1/01/20(a) | | | 1,195 | | | | 1,263,485 | |
Central Texas Regional Mobility Authority
Series 2011
6.00%, 1/01/41 | | | 5,600 | | | | 6,604,808 | |
City of Houston TX
(City of Houston TX Hotel Occupancy Tax)
Series 2015
5.00%, 9/01/40 | | | 4,715 | | | | 5,198,712 | |
City of Houston TX Airport System Revenue
(United Airlines, Inc.)
Series 2014
5.00%, 7/01/29 | | | 12,845 | | | | 13,484,938 | |
Series 2015B
5.00%, 7/15/30-7/15/35 | | | 4,655 | | | | 4,904,618 | |
Clifton Higher Education Finance Corp.
(IDEA Public Schools)
Series 2011
5.75%, 8/15/41 | | | 1,000 | | | | 1,101,530 | |
Series 2012
5.00%, 8/15/32-8/15/42 | | | 6,470 | | | | 6,897,438 | |
Series 2013
6.00%, 8/15/43 | | | 1,000 | | | | 1,156,740 | |
Dallas/Fort Worth International Airport
Series 2013A
5.00%, 11/01/29 | | | 5,155 | | | | 5,701,842 | |
Decatur Hospital Authority
(Wise Regional Health System)
Series 2014A
5.25%, 9/01/44 | | | 6,300 | | | | 6,678,126 | |
| | |
| 66 | | • AB MUNICIPAL INCOME FUND |
AB High Income Municipal Portfolio—Portfolio of Investments
| | | | | | | | |
| | |
| | | Principal
Amount
(000) | | | U.S. $ Value | |
| |
| | | | | | | | |
Grand Parkway Transportation Corp.
Series 2013B
5.00%, 4/01/53 | | $ | 5,100 | | | $ | 5,536,917 | |
Harrison County Health Facilities Development Corp.
(Good Shepherd Hospital Obligated Group)
Series 2010
5.25%, 7/01/28 | | | 1,565 | | | | 1,556,158 | |
Houston TX Util Sys
Series 2011D
5.00%, 11/15/28(b) | | | 9,600 | | | | 11,226,912 | |
Mesquite Health Facility Development Corp.
(Christian Care Centers, Inc.)
Series 2014
5.125%, 2/15/42 | | | 2,000 | | | | 2,070,100 | |
New Hope Cultural Education Facilities Corp.
(Wesleyan Homes, Inc.)
Series 2014
5.50%, 1/01/49 | | | 3,100 | | | | 3,104,433 | |
North Texas Education Finance Corp.
(Uplift Education)
Series 2012A
5.125%, 12/01/42 | | | 9,860 | | | | 10,506,224 | |
North Texas Tollway Authority
Series 2015A
5.00%, 1/01/38 | | | 5,000 | | | | 5,444,250 | |
Red River Health Facilities Development Corp.
(MRC Crossings Proj)
Series 2014A
7.75%, 11/15/44 | | | 2,000 | | | | 2,337,760 | |
Red River Health Facilities Development Corp.
(Wichita Falls Retirement Foundation)
Series 2012
5.125%, 1/01/41 | | | 4,360 | | | | 4,409,530 | |
Sanger Industrial Development Corp.
(Texas Pellets, Inc.)
Series 2012B
8.00%, 7/01/38 | | | 7,800 | | | | 8,745,594 | |
Tarrant County Cultural Education Facilities Finance Corp.
(Buckingham Senior Living Community, Inc.)
Series 2007
5.25%, 11/15/16 | | | 750 | | | | 761,325 | |
5.50%, 11/15/22 | | | 4,000 | | | | 4,138,600 | |
Series 2014
5.625%, 11/15/41 | | | 3,250 | | | | 3,305,868 | |
| | | | |
| AB MUNICIPAL INCOME FUND • | | | 67 | |
AB High Income Municipal Portfolio—Portfolio of Investments
| | | | | | | | |
| | |
| | | Principal
Amount
(000) | | | U.S. $ Value | |
| |
| | | | | | | | |
Tarrant County Cultural Education Facilities Finance Corp.
(MRC Crestview)
Series 2010
8.125%, 11/15/44 | | $ | 5,000 | | | $ | 5,833,050 | |
Tarrant County Cultural Education Facilities Finance Corp.
(Stayton at Museum Way)
Series 2009A
8.00%, 11/15/28 | | | 2,000 | | | | 1,981,240 | |
8.25%, 11/15/44 | | | 3,500 | | | | 3,472,945 | |
Tarrant County Cultural Education Facilities Finance Corp.
(Trinity Terrace Project)
Series 2014A-1
5.00%, 10/01/44-10/01/49 | | | 3,960 | | | | 4,182,586 | |
Texas Private Activity Bond Surface Transportation Corp.
(LBJ Infrastructure Group LLC)
Series 2010
7.00%, 6/30/40 | | | 7,810 | | | | 9,367,939 | |
Texas Private Activity Bond Surface Transportation Corp.
(NTE Mobility Partners LLC)
Series 2009
6.875%, 12/31/39 | | | 6,450 | | | | 7,638,735 | |
Travis County Cultural Education Facilities Finance Corp.
(Wayside Schools)
Series 2012A
5.00%, 8/15/27 | | | 500 | | | | 527,465 | |
5.25%, 8/15/42 | | | 2,375 | | | | 2,417,536 | |
Travis County Health Facilities Development Corp.
(Longhorn Village)
Series 2012A
7.00%, 1/01/32 | | | 8,155 | | | | 8,931,682 | |
7.125%, 1/01/46 | | | 860 | | | | 936,187 | |
Tyler Health Facilities Development Corp.
(East Texas Medical Center Regional Healthcare System)
Series 2007A
5.375%, 11/01/37 | | | 1,500 | | | | 1,561,260 | |
Viridian Municipal Management District
Series 2011
9.00%, 12/01/37 | | | 3,000 | | | | 3,638,850 | |
| | | | | | | | |
| | | | | | | 166,625,383 | |
| | | | | | | | |
| | |
| 68 | | • AB MUNICIPAL INCOME FUND |
AB High Income Municipal Portfolio—Portfolio of Investments
| | | | | | | | |
| | |
| | | Principal
Amount
(000) | | | U.S. $ Value | |
| |
| | | | | | | | |
Utah – 0.7% | | | | | | | | |
Timber Lakes Water Special Service District
Series 2011
8.125%, 6/15/31 | | $ | 3,685 | | | $ | 4,021,957 | |
Utah State Charter School Finance Authority
Series 2010
8.25%, 7/15/18 (Pre-refunded/ETM) | | | 2,000 | | | | 2,467,160 | |
Utah State Charter School Finance Authority
(Early Light Academy, Inc.)
Series 2010
8.50%, 7/15/46 | | | 2,000 | | | | 2,416,180 | |
Utah State Charter School Finance Authority
(North Star Academy)
Series 2010A
7.00%, 7/15/45 | | | 1,840 | | | | 2,044,479 | |
Utah State Charter School Finance Authority
(Vista at Entrada School of Performing Arts & Technology)
Series 2012
6.30%, 7/15/32 | | | 850 | | | | 907,052 | |
6.55%, 7/15/42 | | | 1,890 | | | | 1,998,599 | |
| | | | | | | | |
| | | | | | | 13,855,427 | |
| | | | | | | | |
Vermont – 0.1% | | | | | | | | |
Vermont Economic Development Authority
(Wake Robin Corp.)
Series 2012
5.40%, 5/01/33 | | | 3,100 | | | | 3,175,206 | |
| | | | | | | | |
| | |
Virginia – 5.1% | | | | | | | | |
Chesterfield County Economic Development Authority
(Brandermill Woods)
Series 2012
5.125%, 1/01/43 | | | 1,970 | | | | 1,990,173 | |
City of Chesapeake VA Chesapeake Expressway Toll Road Revenue
Series 2012A
5.00%, 7/15/47 | | | 4,600 | | | | 4,893,986 | |
Fairfax County Economic Development Authority
(Vinson Hall LLC)
Series 2013A
5.00%, 12/01/42-12/01/47 | | | 6,520 | | | | 6,623,807 | |
Hanover County Economic Development Authority
(Covenant Woods)
Series 2012A
5.00%, 7/01/42-7/01/47 | | | 5,970 | | | | 6,021,702 | |
| | | | |
| AB MUNICIPAL INCOME FUND • | | | 69 | |
AB High Income Municipal Portfolio—Portfolio of Investments
| | | | | | | | |
| | |
| | | Principal
Amount
(000) | | | U.S. $ Value | |
| |
| | | | | | | | |
Lower Magnolia Green Community Development Authority
Series 2015
5.00%, 3/01/45(a) | | $ | 3,750 | | | $ | 3,647,550 | |
Mosaic District Community Development Authority
Series 2011A
6.875%, 3/01/36 | | | 2,915 | | | | 3,349,160 | |
Tobacco Settlement Financing Corp./VA
Series 2007B1
5.00%, 6/01/47 | | | 40,835 | | | | 28,513,855 | |
Virginia College Bldg Auth Virginia Lease 21st Century College Prog
Series 2013A
5.00%, 2/01/28(b) | | | 9,200 | | | | 10,662,156 | |
Virginia College Building Authority
(Marymount University)
Series 2015A
5.00%, 7/01/35-7/01/45 | | | 4,310 | | | | 4,520,103 | |
Virginia Commonwealth Transp Brd Tr
Series 2011
5.00%, 5/15/26(b) | | | 8,275 | | | | 9,620,598 | |
Virginia Small Business Financing Authority
(Elizabeth River Crossings OpCo LLC)
Series 2012
5.25%, 1/01/32 | | | 6,240 | | | | 6,821,006 | |
5.50%, 1/01/42 | | | 17,045 | | | | 18,475,757 | |
| | | | | | | | |
| | | | | | | 105,139,853 | |
| | | | | | | | |
Washington – 5.1% | | | | | | | | |
Seattle WA Mun Light & Pwr
Series 2011A
5.00%, 2/01/26(b) | | | 7,500 | | | | 8,711,475 | |
Washington Health Care Facilities Authority
Series 2012
5.00%, 12/01/21 (Pre-refunded/ETM) | | | 9,390 | | | | 11,166,870 | |
Washington Health Care Facilities Authority
(Catholic Health Initiatives)
Series 2013A
5.25%, 1/01/40 | | | 3,355 | | | | 3,681,878 | |
Washington Health Care Facilities Authority
(Multicare Health System Obligated Group)
Series 2012A
5.00%, 8/15/44 | | | 4,000 | | | | 4,323,200 | |
Washington Health Care Facilities Authority
(Providence Health & Services Obligated Group)
Series 2012A
5.00%, 10/01/42(h) | | | 11,850 | | | | 12,885,808 | |
| | |
| 70 | | • AB MUNICIPAL INCOME FUND |
AB High Income Municipal Portfolio—Portfolio of Investments
| | | | | | | | |
| | |
| | | Principal
Amount
(000) | | | U.S. $ Value | |
| |
| | | | | | | | |
Washington Higher Education Facilities Authority
(Whitworth University)
Series 2012
5.25%, 10/01/46 | | $ | 3,250 | | | $ | 3,450,558 | |
Washington St GO
5.00%, 7/01/24(b) | | | 5,000 | | | | 5,831,150 | |
Series 2011B
5.00%, 7/01/25(b) | | | 10,000 | | | | 11,630,500 | |
Washington State Housing Finance Commission
(Mirabella)
Series 2012A
6.75%, 10/01/47 | | | 18,350 | | | | 19,477,791 | |
Washington State Housing Finance Commission
(Riverview Retirement Community)
Series 2012
5.00%, 1/01/48 | | | 5,315 | | | | 5,324,726 | |
Washington State Housing Finance Commission
(Rockwood Retirement Communities)
Series 2014A
7.375%, 1/01/44(a) | | | 4,185 | | | | 4,542,817 | |
Washington State Housing Finance Commission
(Skyline at First Hill Proj)
Series 2007A
5.625%, 1/01/27-1/01/38 | | | 14,055 | | | | 13,653,858 | |
| | | | | | | | |
| | | | | | | 104,680,631 | |
| | | | | | | | |
West Virginia – 0.4% | | | | | | | | |
West Virginia Hospital Finance Authority
(West Virginia United Health System, Inc.)
Series 2013A
5.50%, 6/01/44 | | | 7,050 | | | | 7,900,583 | |
| | | | | | | | |
| | |
Wisconsin – 0.7% | | | | | | | | |
Oneida Tribe of Indians of Wisconsin
(Oneida Tribe of Indians of Wisconsin Sales Tax)
Series 2011
6.50%, 2/01/31(a) | | | 435 | | | | 518,007 | |
University of Wisconsin Hospitals & Clinics Authority
Series 2013A
5.00%, 4/01/38 | | | 6,485 | | | | 7,085,381 | |
Wisconsin Public Finance Authority
(Rose Villa)
Series 2014A
5.75%, 11/15/44 | | | 1,100 | | | | 1,153,900 | |
6.00%, 11/15/49 | | | 1,500 | | | | 1,595,565 | |
| | | | |
| AB MUNICIPAL INCOME FUND • | | | 71 | |
AB High Income Municipal Portfolio—Portfolio of Investments
| | | | | | | | |
| | |
| | | Principal
Amount
(000) | | | U.S. $ Value | |
| |
| | | | | | | | |
Wisconsin Public Finance Authority
(Roseman University Health Sciences)
Series 2015
5.875%, 4/01/45 | | $ | 1,740 | | | $ | 1,700,345 | |
Wisconsin Public Finance Authority
(Seabury Retirement Community)
Series 2015A
5.00%, 9/01/38(a) | | | 1,725 | | | | 1,706,163 | |
| | | | | | | | |
| | | | | | | 13,759,361 | |
| | | | | | | | |
Total Long-Term Municipal Obligations
(cost $1,984,591,348) | | | | | | | 2,090,910,194 | |
| | | | | | | | |
| | | | | | | | |
Short-Term Municipal Notes – 3.8% | |
California – 1.5% | | | | | | | | |
City of Big Bear Lake CA
(Southwest Gas Corp.)
Series 2012A
0.10%, 12/01/28(i) | | | 30,000 | | | | 30,000,000 | |
| | | | | | | | |
| | |
Connecticut – 0.7% | | | | | | | | |
Connecticut State Health & Educational Facility Authority
(Yale University)
Series 2005Y-2
0.07%, 7/01/35(i) | | | 15,000 | | | | 15,000,000 | |
| | | | | | | | |
| | |
Mississippi – 1.0% | | | | | | | | |
Mississippi Business Finance Corp.
(Chevron USA, Inc.)
Series 2009A
0.13%, 12/01/30(i) | | | 10,800 | | | | 10,800,000 | |
Series 2009E
0.06%, 12/01/30(i) | | | 10,200 | | | | 10,200,000 | |
| | | | | | | | |
| | | | | | | 21,000,000 | |
| | | | | | | | |
| | |
Texas – 0.5% | | | | | | | | |
Gulf Coast Waste Disposal Authority
(Exxon Mobil Corp.)
Series 2001B
0.06%, 6/01/25(i) | | | 7,700 | | | | 7,700,000 | |
Lower Neches Valley Authority Industrial Development Corp.
(Exxon Mobil Corp.)
Series 2001B
0.06%, 11/01/29(i) | | | 3,690 | | | | 3,690,000 | |
| | | | | | | | |
| | | | | | | 11,390,000 | |
| | | | | | | | |
| | |
| 72 | | • AB MUNICIPAL INCOME FUND |
AB High Income Municipal Portfolio—Portfolio of Investments
| | | | | | | | |
| | |
| | | Principal
Amount
(000) | | | U.S. $ Value | |
| |
| | | | | | | | |
| | |
Wyoming – 0.1% | | | | | | | | |
County of Lincoln WY
(Exxon Mobil Corp.)
Series 1985
0.06%, 8/01/15(i) | | $ | 2,220 | | | $ | 2,220,000 | |
| | | | | | | | |
| | |
Total Short-Term Municipal Notes
(cost $79,610,000) | | | | | | | 79,610,000 | |
| | | | | | | | |
| | |
Total Municipal Obligations
(cost $2,064,201,348) | | | | | | | 2,170,520,194 | |
| | | | | | | | |
| | |
| | | Notional
Amount
(000) | | | | |
OPTIONS PURCHASED – PUTS – 0.0% | |
Swaptions – 0.0% | | | | | | | | |
IRS Swaption, Citibank, NA
Expiration: Dec 2015, Pay 3.15%,
Receive 3-Month LIBOR(j) | | | 10,000 | | | | 195,827 | |
IRS Swaption, Citibank, NA
Expiration: Aug 2015, Pay 3.42%,
Receive 3-Month LIBOR(j) | | | 30,000 | | | | 54,075 | |
IRS Swaption, Citibank, NA
Expiration: Aug 2015, Pay 3.00%,
Receive 3-Month LIBOR(j) | | | 60,000 | | | | 82,036 | |
| | | | | | | | |
| | |
Total Options Purchased Put
(premiums paid $3,873,500) | | | | | | | 331,938 | |
| | | | | | | | |
| | |
| | | Shares | | | | |
SHORT-TERM INVESTMENTS – 0.5% | | | | | | | | |
Investment Companies – 0.5% | | | | | | | | |
AB Fixed-Income Shares, Inc. – Government STIF Portfolio, 0.10%(k)(l)
(cost $9,808,372) | | | 9,808,372 | | | | 9,808,372 | |
| | | | | | | | |
| | |
Total Investments – 105.7%
(cost $2,077,883,220) | | | | | | | 2,180,660,504 | |
Other assets less liabilities – (5.7)% | | | | | | | (118,264,658 | ) |
| | | | | | | | |
| | |
Net Assets – 100.0% | | | | | | $ | 2,062,395,846 | |
| | | | | | | | |
| | | | |
| AB MUNICIPAL INCOME FUND • | | | 73 | |
AB High Income Municipal Portfolio—Portfolio of Investments
CENTRALLY CLEARED CREDIT DEFAULT SWAPS (see Note D)
| | | | | | | | | | | | | | | | | | | | |
Clearing Broker/(Exchange)
& Referenced Obligation | | Fixed
Rate
(Pay)
Receive | | | Implied
Credit
Spread at
May 31,
2015 | | | Notional
Amount
(000) | | | Market
Value | | | Unrealized
Appreciation/
(Depreciation) | |
Sale Contracts | | | | | | | | | | | | | | | | | | | | |
Morgan Stanley & Co., LLC/(INTRCONX): | | | | | | | | | | | | | | | | | | | | |
CDX-NAHY Series 24, 5 Year Index, 6/20/20* | | | 5.00 | % | | | 3.37 | % | | $ | 4,331 | | | $ | 350,221 | | | $ | 67,822 | |
CDX-NAHY Series 24, 5 Year Index, 6/20/20* | | | 5.00 | | | | 3.37 | | | | 4,331 | | | | 350,221 | | | | 64,864 | |
CDX-NAHY Series 24, 5 Year Index, 6/20/20* | | | 5.00 | | | | 3.37 | | | | 4,331 | | | | 350,221 | | | | 55,226 | |
CDX-NAHY Series 24, 5 Year Index, 6/20/20* | | | 5.00 | | | | 3.37 | | | | 4,331 | | | | 350,221 | | | | 51,142 | |
CDX-NAHY Series 24, 5 Year Index, 6/20/20* | | | 5.00 | | | | 3.37 | | | | 6,150 | | | | 497,313 | | | | 57,499 | |
CDX-NAHY Series 24, 5 Year Index, 6/20/20* | | | 5.00 | | | | 3.37 | | | | 4,331 | | | | 350,221 | | | | 43,205 | |
CDX-NAHY Series 24, 5 Year Index, 6/20/20* | | | 5.00 | | | | 3.37 | | | | 4,331 | | | | 350,221 | | | | 30,588 | |
CDX-NAHY Series 24, 5 Year Index, 6/20/20* | | | 5.00 | | | | 3.37 | | | | 4,331 | | | | 350,221 | | | | 42,591 | |
CDX-NAHY Series 24, 5 Year Index, 6/20/20* | | | 5.00 | | | | 3.37 | | | | 4,331 | | | | 350,221 | | | | 20,439 | |
CDX-NAHY Series 24, 5 Year Index, 6/20/20* | | | 5.00 | | | | 3.37 | | | | 4,331 | | | | 350,221 | | | | 25,200 | |
CDX-NAHY Series 24, 5 Year Index, 6/20/20* | | | 5.00 | | | | 3.37 | | | | 3,032 | | | | 245,179 | | | | 20,589 | |
CDX-NAHY Series 24, 5 Year Index, 6/20/20* | | | 5.00 | | | | 3.37 | | | | 4,331 | | | | 350,221 | | | | 28,147 | |
CDX-NAHY Series 24, 5 Year Index, 6/20/20* | | | 5.00 | | | | 3.37 | | | | 4,573 | | | | 369,791 | | | | 32,987 | |
CDX-NAHY Series 24, 5 Year Index, 6/20/20* | | | 5.00 | | | | 3.37 | | | | 4,331 | | | | 350,221 | | | | 20,221 | |
CDX-NAHY Series 24, 5 Year Index, 6/20/20* | | | 5.00 | | | | 3.37 | | | | 4,331 | | | | 350,221 | | | | 35,663 | |
CDX-NAHY Series 24, 5 Year Index, 6/20/20* | | | 5.00 | | | | 3.37 | | | | 16,500 | | | | 1,334,253 | | | | 255,972 | |
CDX-NAHY Series 24, 5 Year Index, 6/20/20* | | | 5.00 | | | | 3.37 | | | | 6,366 | | | | 514,779 | | | | 99,690 | |
CDX-NAHY Series 24, 5 Year Index, 6/20/20* | | | 5.00 | | | | 3.37 | | | | 2,772 | | | | 224,155 | | | | 19,308 | |
CDX-NAHY Series 24, 5 Year Index, 6/20/20* | | | 5.00 | | | | 3.37 | | | | 4,331 | | | | 350,221 | | | | 33,133 | |
| | | | | | | | | | | | | | | | | | | | |
| | | | | | | | | | | | | | $ | 7,738,343 | | | $ | 1,004,286 | |
| | | | | | | | | | | | | | | | | | | | |
| | |
| 74 | | • AB MUNICIPAL INCOME FUND |
AB High Income Municipal Portfolio—Portfolio of Investments
CENTRALLY CLEARED INTEREST RATE SWAPS (see Note D)
| | | | | | | | | | | | | | | | | | | | |
| | | | | | | | | Rate Type | | | | |
Clearing Broker/
(Exchange) | | Notional
Amount
(000) | | | Termination
Date | | | Payments
made
by the
Fund | | | Payments
received
by the
Fund | | | Unrealized
Appreciation/
(Depreciation) | |
Morgan Stanley & Co., LLC/(CME Group) | | $ | 22,500 | | | | 6/01/46 | | | | 2.72 | % | | | 3 Month LIBOR | | | $ | (2,897 | ) |
Morgan Stanley & Co., LLC/(CME Group) | | | 50,000 | | | | 6/01/26 | | | | 2.478 | % | | | 3 Month LIBOR | | | | (144,290 | ) |
| | | | | | | | | | | | | | | | | | | | |
| | | | | | | | | | | | | | | | | | $ | (147,187 | ) |
| | | | | | | | | | | | | | | | | | | | |
INTEREST RATE SWAPS (see Note D)
| | | | | | | | | | | | | | | | | | | | |
| | | | | | | | | Rate Type | | | | |
Swap
Counterparty | | Notional
Amount
(000) | | | Termination
Date | | | Payments
made
by the
Fund | | | Payments
received
by the
Fund | | | Unrealized
Appreciation/
(Depreciation) | |
JPMorgan Chase Bank | | $ | 15,000 | | | | 12/02/24 | | | | 3.013 | % | | | SIFMA | * | | $ | (1,972,286 | ) |
JPMorgan Chase Bank | | | 8,500 | | | | 7/09/25 | | | | SIFMA | * | | | 3.167 | % | | | 1,234,804 | |
Morgan Stanley Capital
Services LLC | | | 2,500 | | | | 3/17/22 | | | | SIFMA | * | | | 3.073 | % | | | 300,998 | |
Morgan Stanley Capital
Services LLC | | | 3,000 | | | | 6/11/22 | | | | SIFMA | * | | | 2.965 | % | | | 345,175 | |
| | | | | | | | | | | | | | | | | | | | |
| | | | | | | | | | | | | | | | | | $ | (91,309 | ) |
| | | | | | | | | | | | | | | | | | | | |
| * | | Variable interest rate based on the Securities Industry & Financial Markets Association (SIFMA) Municipal Swap Index. |
| (a) | | Security is exempt from registration under Rule 144A of the Securities Act of 1933. These securities are considered liquid and may be resold in transactions exempt from registration, normally to qualified institutional buyers. At May 31, 2015, the aggregate market value of these securities amounted to $101,570,839 or 4.9% of net assets. |
| (b) | | Security represents the underlying municipal obligation of an inverse floating rate obligation held by the Fund (see Note I). |
| (c) | | When-Issued or delayed delivery security. |
| (e) | | Indicates a security that has a zero coupon that remains in effect until a predetermined date at which time the stated coupon rate becomes effective until final maturity. |
| (f) | | Variable rate coupon, rate shown as of May 31, 2015. |
| (g) | | An auction rate security whose interest rate resets at each auction date. Auctions are typically held every week or month. The rate shown is as of May 31, 2015 and the aggregate market value of these securities amounted to $10,405,372 or 0.50% of net assets. |
| (h) | | Position, or a portion thereof, has been segregated to collateralize OTC derivatives outstanding. |
| (i) | | Variable Rate Demand Notes are instruments whose interest rates change on a specific date (such as coupon date or interest payment date) or whose interest rates vary with changes in a designated base rate (such as the prime interest rate). This instrument is payable on demand and is secured by letters of credit or other credit support agreements from major banks. |
| | | | |
| AB MUNICIPAL INCOME FUND • | | | 75 | |
AB High Income Municipal Portfolio—Portfolio of Investments
| (j) | | Non-income producing security. |
| (k) | | To obtain a copy of the fund’s financial statements, please go to the Securities and Exchange Commission’s website at www.sec.gov, or call AllianceBernstein at (800) 227-4618. |
| (l) | | Investment in affiliated money market mutual fund. The rate shown represents the 7-day yield as of period end. |
As of May 31, 2015, the Fund’s percentages of investments in municipal bonds that are insured and in insured municipal bonds that have been pre-refunded or escrowed to maturity are 4.0% and 0.5%, respectively.
| AGM | | – Assured Guaranty Municipal |
| AMBAC | | – Ambac Assurance Corporation |
| CDX-NAHY | | – North American High Yield Credit Default Swap Index |
| CME | | – Chicago Mercantile Exchange |
| COP | | – Certificate of Participation |
| ETM | | – Escrowed to Maturity |
| FGIC | | – Financial Guaranty Insurance Company |
| INTRCONX | | – Inter-Continental Exchange |
| LIBOR | | – London Interbank Offered Rates |
| NATL | | – National Interstate Corporation |
| OSF | | – Order of St. Francis |
| XLCA | | – XL Capital Assurance Inc. |
See notes to financial statements.
| | |
| 76 | | • AB MUNICIPAL INCOME FUND |
AB High Income Municipal Portfolio—Portfolio of Investments
AB CALIFORNIA PORTFOLIO
PORTFOLIO OF INVESTMENTS
May 31, 2015
| | | | | | | | |
| | | Principal
Amount
(000) | | | U.S. $ Value | |
| |
| | | | | | | | |
MUNICIPAL OBLIGATIONS – 102.6% | | | | | | | | |
Long-Term Municipal Bonds – 102.6% | | | | | | | | |
California – 100.5% | | | | | | | | |
Banning Utility Authority
NATL Series 2005
5.25%, 11/01/30 | | $ | 8,405 | | | $ | 8,905,434 | |
Bay Area Toll Authority
Series 2009F-1
5.25%, 4/01/19 (Pre-refunded/ETM) | | | 7,500 | | | | 8,617,725 | |
Series 2010S-2
5.00%, 10/01/30 | | | 2,350 | | | | 2,689,199 | |
Series 2013S
5.00%, 4/01/31-4/01/33 | | | 12,700 | | | | 14,315,390 | |
Beaumont Financing Authority AMBAC
Series 2007C
5.00%, 9/01/26 | | | 3,305 | | | | 3,414,032 | |
California Econ Recovery
Series 2009A
5.25%, 7/01/19 (Pre-refunded/ETM) | | | 5,725 | | | | 6,637,565 | |
California Educational Facilities Authority
(University of the Pacific)
Series 2004
5.00%, 11/01/20 | | | 1,000 | | | | 1,002,450 | |
5.25%, 5/01/34 | | | 790 | | | | 791,975 | |
Series 2006
5.00%, 11/01/21 | | | 990 | | | | 1,008,434 | |
Series 2012A
5.00%, 11/01/30 | | | 1,250 | | | | 1,410,338 | |
California Health Facilities Financing Authority
(Dignity Health Obligated Group)
Series 2008G
5.50%, 7/01/25 | | | 3,180 | | | | 3,551,996 | |
California Health Facilities Financing Authority
(St Joseph Health System Obligated Group)
Series 2013A
5.00%, 7/01/33 | | | 5,000 | | | | 5,606,200 | |
California Municipal Finance Authority
(Azusa Pacific University)
Series 2015B
5.00%, 4/01/35-4/01/41 | | | 5,960 | | | | 6,372,450 | |
California Municipal Finance Authority
(Goodwill Industries of Sacramento Valley & Northern Nevada, Inc.)
Series 2014
5.25%, 1/01/45 | | | 1,295 | | | | 1,243,342 | |
| | | | |
| AB MUNICIPAL INCOME FUND • | | | 77 | |
AB California Portfolio—Portfolio of Investments
| | | | | | | | |
| | |
| | | Principal
Amount
(000) | | | U.S. $ Value | |
| |
| | | | | | | | |
California Municipal Finance Authority
(UTS Bioenergy LLC)
Series 2011A-1
7.50%, 12/01/32 | | $ | 2,745 | | | $ | 2,659,466 | |
California Pollution Control Financing Authority
(Poseidon Resources Channelside LP)
Series 2012
5.00%, 7/01/37(a) | | | 11,550 | | | | 12,006,918 | |
California School Finance Authority
(Alliance College-Ready Public Schools Facilities Corp.)
Series 2015A
5.00%, 7/01/45(a) | | | 4,000 | | | | 4,220,200 | |
California School Finance Authority
(Kipp LA)
Series 2014A
5.00%, 7/01/34 | | | 600 | | | | 622,134 | |
California School Finance Authority
(View Park Elementary & Middle Schools)
Series 2014A
5.625%, 10/01/34 | | | 575 | | | | 582,234 | |
5.875%, 10/01/44 | | | 1,000 | | | | 1,013,880 | |
6.00%, 10/01/49 | | | 715 | | | | 724,095 | |
California State Public Works Board
(California State Public Works Board Lease)
Series 2012A
5.00%, 4/01/37 | | | 6,475 | | | | 7,092,974 | |
XLCA Series 2005B
5.00%, 11/01/30 | | | 4,270 | | | | 4,343,444 | |
California Statewide Communities Development Authority
(American Baptist Homes of the West)
Series 2015
5.00%, 10/01/26-10/01/45 | | | 5,645 | | | | 6,086,158 | |
California Statewide Communities Development Authority
(Buck Institute for Research on Aging)
AGM Series 2014
5.00%, 11/15/34-11/15/44 | | | 4,500 | | | | 5,043,695 | |
California Statewide Communities Development Authority
(Highland Creek Associates LP/CA)
Series 2001K
5.40%, 4/01/34 | | | 5,240 | | | | 5,244,454 | |
California Statewide Communities Development Authority
(KDF Santa Paula LP)
Series 1998D
5.43%, 5/01/28 | | | 1,655 | | | | 1,656,142 | |
| | |
| 78 | | • AB MUNICIPAL INCOME FUND |
AB California Portfolio—Portfolio of Investments
| | | | | | | | |
| | |
| | | Principal
Amount
(000) | | | U.S. $ Value | |
| |
| | | | | | | | |
California Statewide Communities Development Authority
(Moldaw Residences)
Series 2014A
5.25%, 11/01/44 | | $ | 1,800 | | | $ | 1,810,530 | |
5.375%, 11/01/49 | | | 2,500 | | | | 2,509,950 | |
Capistrano Unified School District School Facilities Improvement District No 1
AGM Series 2001B
Zero Coupon, 8/01/25 | | | 8,000 | | | | 5,409,200 | |
City of Encinitas CA
(City of Encinitas CA CFD No 1)
Series 2012
5.00%, 9/01/26-9/01/29 | | | 2,800 | | | | 3,056,214 | |
City of Irvine CA
(City of Irvine CA Assessment Dist No 13-1)
Series 2013
5.00%, 9/02/27-9/02/29 | | | 1,760 | | | | 1,974,974 | |
City of Long Beach CA
(City of Long Beach CA Marina Revenue)
Series 2015
5.00%, 5/15/32-5/15/45(b) | | | 5,600 | | | | 5,967,552 | |
City of Los Angeles CA Wastewater System Revenue
Series 2013B
5.00%, 6/01/31 | | | 5,000 | | | | 5,755,950 | |
City of Los Angeles Department of Airports
(Los Angeles Intl Airport)
Series 2009A
5.25%, 5/15/29 | | | 8,340 | | | | 9,514,355 | |
Series 2010A
5.00%, 5/15/25-5/15/27 | | | 12,475 | | | | 14,522,718 | |
City of Palm Springs CA COP
Series 1991B
Zero Coupon, 4/15/21 (Pre-refunded/ETM) | | | 37,500 | | | | 33,484,125 | |
City of Palo Alto CA
(City of Palo Alto CA University Avenue AD)
Series 2012
5.00%, 9/02/25-9/02/30 | | | 3,290 | | | | 3,671,703 | |
City of Redding CA
NATL Series 1992
12.185%, 7/01/22 (Pre-refunded/ETM)(c) | | | 970 | | | | 1,298,529 | |
City of Riverside CA Sewer
Series 2015
5.00%, 8/01/33 | | | 10,090 | | | | 11,271,842 | |
| | | | |
| AB MUNICIPAL INCOME FUND • | | | 79 | |
AB California Portfolio—Portfolio of Investments
| | | | | | | | |
| | |
| | | Principal
Amount
(000) | | | U.S. $ Value | |
| |
| | | | | | | | |
City of San Francisco CA Public Utilities Commission Water Revenue
Series 2009B
5.00%, 11/01/27 | | $ | 4,705 | | | $ | 5,368,546 | |
City of San Jose CA Hotel Tax Revenue
Series 2011
6.125%, 5/01/31 | | | 5,000 | | | | 5,956,800 | |
City of Santa Clara CA Electric Revenue
Series 2011A
5.00%, 7/01/30 | | | 1,810 | | | | 2,041,879 | |
Coachella Valley Unified School District/CA COP
AMBAC Series 2007
5.00%, 9/01/16 (Pre-refunded/ETM) | | | 2,500 | | | | 2,644,525 | |
County of Orange CA COP
AMBAC Series 1991
6.00%, 6/01/19 (Pre-refunded/ETM) | | | 555 | | | | 619,369 | |
County of San Bernardino CA COP
Series 2009A
5.25%, 8/01/26 | | | 1,635 | | | | 1,841,926 | |
East Palo Alto Public Finance Authority
AGC Series 2005A
5.00%, 10/01/25 | | | 5,070 | | | | 5,153,047 | |
Fullerton Redevelopment Agency Successor Agency
(Marshall B Ketchum University)
AGC Series 2004
5.00%, 4/01/21 | | | 3,250 | | | | 3,459,723 | |
Garden Grove Unified School District
Series 2013C
5.00%, 8/01/32 | | | 2,535 | | | | 2,875,932 | |
Irvine Public Facilities & Infrastructure Authority
Series 2012A
4.00%, 9/02/22 | | | 1,350 | | | | 1,396,737 | |
4.25%, 9/02/24 | | | 1,525 | | | | 1,577,948 | |
Lake Elsinore Public Financing Authority
Series 2015
5.00%, 9/01/31-9/01/35 | | | 4,925 | | | | 5,256,085 | |
Long Beach Bond Finance Authority
(Aquarium of the Pacific)
Series 2012
5.00%, 11/01/28-11/01/30 | | | 11,485 | | | | 13,120,721 | |
Los Angeles County Sanitation Districts Financing Authority
Series 2015A
5.00%, 10/01/33-10/01/34(b) | | | 6,100 | | | | 6,785,915 | |
| | |
| 80 | | • AB MUNICIPAL INCOME FUND |
AB California Portfolio—Portfolio of Investments
| | | | | | | | |
| | |
| | | Principal
Amount
(000) | | | U.S. $ Value | |
| |
| | | | | | | | |
Los Angeles Department of Water & Power PWR
AMBAC Series 2007A-2
5.00%, 7/01/24 | | $ | 5,250 | | | $ | 5,695,463 | |
Los Angeles Unified School District/CA
Series 2010KRY
5.25%, 7/01/25(d) | | | 8,000 | | | | 9,410,000 | |
Los Angeles Unified School District/CA COP
Series 2012B
5.00%, 10/01/28-10/01/29 | | | 9,220 | | | | 10,510,896 | |
Norco Community Redevelopment Agency Successor Agency
(Norco Redevelopment Agency Project No 1)
Series 2010
5.875%, 3/01/32 | | | 1,580 | | | | 1,811,012 | |
6.00%, 3/01/36 | | | 1,125 | | | | 1,293,705 | |
AMBAC Series 2005
5.00%, 3/01/26 | | | 1,900 | | | | 1,904,997 | |
Oakland Unified School District/Alameda County
NATL Series 2007
5.00%, 8/01/22 | | | 8,975 | | | | 9,728,451 | |
Orange County Transportation Authority
Series 2013
5.00%, 8/15/29 | | | 2,360 | | | | 2,684,217 | |
Oxnard Financing Authority
AGM Series 2014
5.00%, 6/01/31 | | | 5,250 | | | | 5,797,732 | |
Placentia-Yorba Linda Unified School District COP
NATL Series 2006
5.00%, 10/01/27 | | | 4,200 | | | | 4,256,994 | |
Port of Los Angeles
Series 2009C
5.00%, 8/01/26 | | | 21,450 | | | | 24,513,703 | |
Poway Unified School District
(Poway Unified School District CFD No 6)
Series 2012
5.00%, 9/01/26 | | | 975 | | | | 1,102,433 | |
Poway Unified School District Public Financing Authority
Series 2015A
5.00%, 9/01/33-9/01/34 | | | 2,500 | | | | 2,686,520 | |
Richmond Community Redevelopment Agency
Series 2010A
5.75%, 9/01/24-9/01/25 | | | 1,985 | | | | 2,327,232 | |
6.00%, 9/01/30 | | | 1,395 | | | | 1,643,282 | |
| | | | |
| AB MUNICIPAL INCOME FUND • | | | 81 | |
AB California Portfolio—Portfolio of Investments
| | | | | | | | |
| | |
| | | Principal
Amount
(000) | | | U.S. $ Value | |
| |
| | | | | | | | |
Riverside County Transportation Commission
Series 2013A
5.25%, 6/01/32 | | $ | 9,165 | | | $ | 10,713,335 | |
Rocklin Unified School District Community Facilities District
NATL Series 2004
5.00%, 9/01/25 | | | 1,000 | | | | 1,003,020 | |
Sacramento City Unified School District/CA
AGM Series 2015
5.00%, 7/01/30 | | | 5,500 | | | | 6,223,525 | |
Sacramento County Housing Authority
(Verandas A Senior Community)
Series 2000H
5.70%, 3/01/34 | | | 2,875 | | | | 2,882,360 | |
Sacramento Regional Transit District
Series 2012
5.00%, 3/01/36-3/01/42 | | | 4,250 | | | | 4,574,423 | |
San Diego County Water Authority
Series 2011B
5.00%, 5/01/29-5/01/30 | | | 16,115 | | | | 18,523,250 | |
San Diego Public Facilities Financing Authority
Series 2010A
5.25%, 3/01/25 | | | 15,000 | | | | 17,310,150 | |
San Diego Unified School District/CA
Series 2013C
5.00%, 7/01/32 | | | 3,180 | | | | 3,652,834 | |
San Francisco City & County Airports Comm-San Francisco International Airport
Series 2014A
5.00%, 5/01/40 | | | 7,500 | | | | 8,109,900 | |
San Francisco City & County Airports Comm-San Francisco International Airport
(San Francisco Intl Airport)
Series 2010A
4.90%, 5/01/29 | | | 2,200 | | | | 2,456,212 | |
Series 2012A
5.00%, 5/01/27-5/01/28 | | | 7,000 | | | | 7,854,580 | |
AGM Series 2000A
6.125%, 1/01/27 | | | 1,480 | | | | 1,485,994 | |
San Francisco City & County Redevelopment Agency
(Mission Bay South Public Imp)
Series 2013A
5.00%, 8/01/29 | | | 1,310 | | | | 1,441,301 | |
| | |
| 82 | | • AB MUNICIPAL INCOME FUND |
AB California Portfolio—Portfolio of Investments
| | | | | | | | |
| | |
| | | Principal
Amount
(000) | | | U.S. $ Value | |
| |
| | | | | | | | |
San Joaquin Hills Transportation Corridor Agency
Series 1993
Zero Coupon, 1/01/20 (Pre-refunded/ETM) | | $ | 20,000 | | | $ | 18,694,600 | |
Zero Coupon, 1/01/21 (Pre-refunded/ETM) | | | 20,000 | | | | 18,208,000 | |
Zero Coupon, 1/01/23
(Pre-refunded/ETM)(e) | | | 25,000 | | | | 21,196,250 | |
Santa Ana Unified School District
Series 2008A
5.25%, 8/01/28 | | | 5,400 | | | | 6,017,490 | |
Southern California Public Power Authority
Series 2009A
5.00%, 7/01/23 | | | 3,200 | | | | 3,598,208 | |
Southern California Public Power Authority
(Los Angeles Department of Water & Power PWR)
Series 2014A
5.00%, 7/01/33-7/01/34 | | | 8,200 | | | | 9,406,460 | |
Southwestern Community College District
NATL Series 2005
5.00%, 8/01/24 | | | 1,000 | | | | 1,027,950 | |
State of California
Series 2003
5.00%, 2/01/32 | | | 265 | | | | 265,898 | |
Series 2004
5.30%, 4/01/29 | | | 5 | | | | 5,018 | |
Series 2013
5.00%, 2/01/31-11/01/31 | | | 10,000 | | | | 11,441,100 | |
Series 2014
5.00%, 12/01/30 | | | 2,000 | | | | 2,312,580 | |
State of California Department of Water Resources
Series 2008AE
5.00%, 6/01/18 (Pre-refunded/ETM) | | | 7,485 | | | | 8,361,343 | |
Series 2009A
5.00%, 12/01/18 (Pre-refunded/ETM) | | | 1,295 | | | | 1,462,910 | |
State of California Department of Water Resources WTR
Series 2008
5.00%, 12/01/24-12/01/27 | | | 195 | | | | 216,296 | |
Series 2009A
5.00%, 12/01/29 | | | 930 | | | | 1,042,102 | |
Stockton Public Financing Authority AGC
Series 2006A
5.00%, 9/01/17 | | | 2,285 | | | | 2,305,679 | |
| | | | |
| AB MUNICIPAL INCOME FUND • | | | 83 | |
AB California Portfolio—Portfolio of Investments
| | | | | | | | |
| | |
| | | Principal
Amount
(000) | | | U.S. $ Value | |
| |
| | | | | | | | |
Tejon Ranch Public Facilities Finance Authority
Series 2012
5.25%, 9/01/26-9/01/28 | | $ | 2,375 | | | $ | 2,540,340 | |
5.50%, 9/01/30-9/01/33 | | | 2,135 | | | | 2,300,235 | |
Torrance Unified School District
Series 2015
4.00%, 8/01/32 | | | 2,500 | | | | 2,643,375 | |
University of California
Series 2013A
5.00%, 5/15/32 | | | 9,000 | | | | 10,353,870 | |
Series 2014A
5.25%, 5/15/32 | | | 5,000 | | | | 5,933,300 | |
Series 2015I
5.00%, 5/15/32 | | | 4,000 | | | | 4,627,800 | |
Walnut Energy Center Authority
Series 2014
5.00%, 1/01/31-1/01/32 | | | 7,700 | | | | 8,824,235 | |
West Contra Costa Healthcare District
AMBAC Series 2004
5.375%, 7/01/21-7/01/24 | | | 4,720 | | | | 4,735,798 | |
| | | | | | | | |
| | | | | | | 594,327,477 | |
| | | | | | | | |
Arizona – 0.2% | | | | | | | | |
Dove Mountain Resort Community Facilities District
Series 2001
6.75%, 12/01/16 | | | 975 | | | | 937,014 | |
| | | | | | | | |
| | |
Massachusetts – 0.5% | | | | | | | | |
Commonwealth of Massachusetts
NATL Series 2000G
0.105%, 12/01/30(c)(f) | | | 3,150 | | | | 2,939,794 | |
| | | | | | | | |
| | |
Nevada – 0.4% | | | | | | | | |
Henderson Local Improvement Districts
AGM Series 2007A
5.00%, 3/01/22 | | | 2,290 | | | | 2,485,818 | |
| | | | | | | | |
| | |
Puerto Rico – 0.1% | | | | | | | | |
Puerto Rico Housing Finance Authority
(Puerto Rico Housing Finance Authority Cap Fd Prog)
Series 2008
5.125%, 12/01/27 | | | 295 | | | | 316,473 | |
| | | | | | | | |
| | |
| 84 | | • AB MUNICIPAL INCOME FUND |
AB California Portfolio—Portfolio of Investments
| | | | | | | | |
| | |
| | | Principal
Amount
(000) | | | U.S. $ Value | |
| |
| | | | | | | | |
| | |
Texas – 0.9% | | | | | | | | |
Texas Private Activity Bond Surface Transportation Corp.
(LBJ Infrastructure Group LLC)
Series 2010
7.00%, 6/30/40 | | $ | 3,050 | | | $ | 3,658,414 | |
Texas Private Activity Bond Surface Transportation Corp.
(NTE Mobility Partners LLC)
Series 2009
6.875%, 12/31/39 | | | 1,525 | | | | 1,806,058 | |
| | | | | | | | |
| | | | | | | 5,464,472 | |
| | | | | | | | |
Total Municipal Obligations
(cost $550,213,812) | | | | | | | 606,471,048 | |
| | | | | | | | |
| | |
| | | Shares | | | | |
SHORT-TERM INVESTMENTS – 2.7% | | | | | | | | |
Investment Companies – 2.7% | | | | | | | | |
AB Fixed-Income Shares, Inc. –
Government STIF Portfolio, 0.10%(g)(h)
(cost $16,125,713) | | | 16,125,713 | | | | 16,125,713 | |
| | | | | | | | |
| | |
Total Investments – 105.3%
(cost $566,339,525) | | | | | | | 622,596,761 | |
Other assets less liabilities – (5.3)% | | | | | | | (31,515,329 | ) |
| | | | | | | | |
| | |
Net Assets – 100.0% | | | | | | $ | 591,081,432 | |
| | | | | | | | |
INTEREST RATE SWAPS (see Note D)
| | | | | | | | | | | | | | | | | | | | |
| | | | | | | | | Rate Type | | | | |
Swap Counterparty | | Notional
Amount
(000) | | | Termination
Date | | | Payments
made
by the
Fund | | | Payments
received
by the
Fund | | | Unrealized
Appreciation/
(Depreciation) | |
Citibank | | $ | 6,500 | | | | 1/25/26 | | | | SIFMA* | | | | 4.108% | | | $ | 1,551,769 | |
Merrill Lynch Capital Services Inc. | | | 14,500 | | | | 7/30/26 | | | | 4.090% | | | | SIFMA* | | | | (3,514,290 | ) |
Merrill Lynch Capital Services Inc. | | | 15,000 | | | | 11/15/26 | | | | 4.378% | | | | SIFMA* | | | | (4,105,873 | ) |
Merrill Lynch Capital Services, Inc. | | | 3,100 | | | | 10/21/16 | | | | SIFMA | * | | | 4.129 | % | | | 182,093 | |
| | | | | | | | | | | | | | | | | | | | |
| | | | | | | | | | | | | | | | | | $ | (5,886,301 | ) |
| | | | | | | | | | | | | | | | | | | | |
| * | | Variable interest rate based on the Securities Industry & Financial Markets Association (SIFMA) Municipal Swap Index. |
| | | | |
| AB MUNICIPAL INCOME FUND • | | | 85 | |
AB California Portfolio—Portfolio of Investments
| (a) | | Security is exempt from registration under Rule 144A of the Securities Act of 1933. These securities are considered liquid and may be resold in transactions exempt from registration, normally to qualified institutional buyers. At May 31, 2015, the aggregate market value of these securities amounted to $16,227,118 or 2.7% of net assets. |
| (b) | | When-Issued or delayed delivery security. |
| (c) | | Variable rate coupon, rate shown as of May 31, 2015. |
| (d) | | Security represents the underlying municipal obligation of an inverse floating rate obligation held by the Fund (see Note I). |
| (e) | | Position, or a portion thereof, has been segregated to collateralize OTC derivatives outstanding. |
| (f) | | An auction rate security whose interest rate resets at each auction date. Auctions are typically held every week or month. The rate shown is as of May 31, 2015 and the aggregate market value of this security amounted to $2,939,794 or 0.50% of net assets. |
| (g) | | To obtain a copy of the fund’s financial statements, please go to the Securities and Exchange Commission’s website at www.sec.gov, or call AllianceBernstein at (800) 227-4618. |
| (h) | | Investment in affiliated money market mutual fund. The rate shown represents the 7-day yield as of period end. |
As of May 31, 2015, the Fund’s percentages of investments in municipal bonds that are insured and in insured municipal bonds that have been pre-refunded or escrowed to maturity are 14.8% and 0.8%, respectively.
Glossary:
| AGC | | – Assured Guaranty Corporation |
| AGM | | – Assured Guaranty Municipal |
| AMBAC | | – Ambac Assurance Corporation |
| CFD | | – Community Facilities District |
| COP | | – Certificate of Participation |
| ETM | | – Escrowed to Maturity |
| NATL | | – National Interstate Corporation |
| XLCA | | – XL Capital Assurance Inc. |
See notes to financial statements.
| | |
| 86 | | • AB MUNICIPAL INCOME FUND |
AB California Portfolio—Portfolio of Investments
AB NEW YORK PORTFOLIO
PORTFOLIO OF INVESTMENTS
May 31, 2015
| | | | | | | | |
| | | Principal
Amount
(000) | | | U.S. $ Value | |
| |
| | | | | | | | |
MUNICIPAL OBLIGATIONS – 96.4% | | | | | | | | |
Long-Term Municipal Bonds – 96.4% | | | | | | | | |
New York – 93.3% | | | | | | | | |
Albany County Airport Authority
AGM Series 2010A
5.00%, 12/15/25-12/15/26 | | $ | 4,540 | | | $ | 5,010,971 | |
Albany Industrial Development Agency
Series 2008A
5.75%, 11/15/17 (Pre-refunded/ETM) | | | 795 | | | | 886,989 | |
Build NYC Resource Corp.
(City University of New York (The))
Series 2014A
5.00%, 6/01/30-6/01/34 | | | 2,980 | | | | 3,397,610 | |
Build NYC Resource Corp.
(Metropolitan College of New York)
Series 2014
5.25%, 11/01/29 | | | 2,305 | | | | 2,495,186 | |
5.50%, 11/01/44 | | | 1,625 | | | | 1,719,088 | |
Build NYC Resource Corp.
(YMCA of Greater New York)
Series 2012
5.00%, 8/01/32 | | | 1,000 | | | | 1,094,240 | |
City of New York NY
Series 2007C
5.00%, 1/01/21 | | | 1,575 | | | | 1,675,926 | |
Series 2014A
5.00%, 8/01/31 | | | 2,000 | | | | 2,292,360 | |
Series 2014J
5.00%, 8/01/30 | | | 10,000 | | | | 11,513,400 | |
City of Newburgh NY
Series 2012A
5.25%, 6/15/28 | | | 1,065 | | | | 1,156,089 | |
5.50%, 6/15/32 | | | 1,320 | | | | 1,435,262 | |
County of Onondaga NY
(Syracuse University)
Series 2011
5.00%, 12/01/28-12/01/29 | | | 2,135 | | | | 2,445,576 | |
Dutchess County Industrial Development Agency
(Bard College)
Series 2007A-1
5.00%, 8/01/19-8/01/21 | | | 1,450 | | | | 1,512,791 | |
Dutchess County Local Development Corp.
(Health Quest Systems, Inc.)
Series 2014A
5.00%, 7/01/44 | | | 4,175 | | | | 4,509,877 | |
| | | | |
| AB MUNICIPAL INCOME FUND • | | | 87 | |
AB New York Portfolio—Portfolio of Investments
| | | | | | | | |
| | |
| | | Principal
Amount
(000) | | | U.S. $ Value | |
| |
| | | | | | | | |
East Rochester Housing Authority
(St John’s Health Care Corp.)
Series 2010A
5.00%, 4/20/27 | | $ | 2,550 | | | $ | 2,921,535 | |
Erie County Fiscal Stability Authority
(Erie County Fiscal Stability Authority Sales Tax)
Series 2010A
5.00%, 5/15/22 | | | 5,000 | | | | 5,829,250 | |
Series 2011C
5.00%, 12/01/28 | | | 7,260 | | | | 8,464,870 | |
Glen Cove Industrial Development Agency
Series 1992B | | | | | | | | |
Zero Coupon, 10/15/19 (Pre-refunded/ETM) | | | 11,745 | | | | 11,050,870 | |
Hempstead Town Local Development Corp.
(Hofstra University)
Series 2011
5.00%, 7/01/28 | | | 650 | | | | 729,008 | |
Hempstead Town Local Development Corp.
(Molloy College)
Series 2014
5.00%, 7/01/34-7/01/39 | | | 2,945 | | | | 3,204,984 | |
Housing Development Corp./NY
Series 2002A
5.50%, 11/01/34 | | | 5 | | | | 5,005 | |
Jefferson County Industrial Development Agency
(ReEnergy Black River LLC/Old)
Series 2014
5.25%, 1/01/24 | | | 1,000 | | | | 995,860 | |
Long Island Power Authority
Series 2012B
5.00%, 9/01/27 | | | 2,500 | | | | 2,809,425 | |
Series 2014A
5.00%, 9/01/35 | | | 1,000 | | | | 1,100,940 | |
Metropolitan Transportation Authority
Series 2011D
5.00%, 11/15/29 | | | 4,300 | | | | 4,860,075 | |
Series 2012F
5.00%, 11/15/27 | | | 7,070 | | | | 8,145,206 | |
Series 2014B
5.00%, 11/15/44 | | | 12,000 | | | | 13,159,920 | |
Monroe County Industrial Development Agency
(Southview Towers LP)
Series 2000
6.25%, 2/01/31 | | | 1,130 | | | | 1,130,791 | |
| | |
| 88 | | • AB MUNICIPAL INCOME FUND |
AB New York Portfolio—Portfolio of Investments
| | | | | | | | |
| | |
| | | Principal
Amount
(000) | | | U.S. $ Value | |
| |
| | | | | | | | |
Monroe County Industrial Development Corp./NY
(Rochester General Hospital (The))
Series 2013A
5.00%, 12/01/42 | | $ | 4,010 | | | $ | 4,248,795 | |
Nassau County Industrial Development Agency
(Amsterdam House Continuing Care Retirement Community, Inc.)
Series 2014A
6.50%, 1/01/32 | | | 1,590 | | | | 1,578,743 | |
Series 2014C
2.00%, 1/01/49 | | | 572 | | | | 45,799 | |
Nassau County Local Economic Assistance Corp.
(South Nassau Communities Hospital)
Series 2012
5.00%, 7/01/31-7/01/37 | | | 6,195 | | | | 6,720,506 | |
Nassau County Local Economic Assistance Corp.
(Winthrop University Hospital)
Series 2012
5.00%, 7/01/32-7/01/42 | | | 5,435 | | | | 5,910,554 | |
New York City Municipal Water Finance Authority
Series 2009FF
5.00%, 6/15/27 | | | 15,110 | | | | 17,077,171 | |
Series 2013BB
5.00%, 6/15/46 | | | 5,000 | | | | 5,513,850 | |
New York City Transitional Finance Authority Building Aid Revenue
NATL Series 2006S-1
5.00%, 7/15/21 | | | 7,000 | | | | 7,503,020 | |
New York City Transitional Finance Authority Future Tax Secured Revenue
Series 2013I
5.00%, 5/01/23 (Pre-refunded/ETM) | | | 5 | | | | 6,084 | |
5.00%, 5/01/32-5/01/33 | | | 12,495 | | | | 14,163,948 | |
New York City Trust for Cultural Resources
(American Museum of Natural History (The))
Series 2014A
5.00%, 7/01/33 | | | 4,080 | | | | 4,689,185 | |
New York City Trust for Cultural Resources
(Whitney Museum of American Art)
Series 2011
5.00%, 7/01/31 | | | 9,675 | | | | 10,708,967 | |
| | | | |
| AB MUNICIPAL INCOME FUND • | | | 89 | |
AB New York Portfolio—Portfolio of Investments
| | | | | | | | |
| | |
| | | Principal
Amount
(000) | | | U.S. $ Value | |
| |
| | | | | | | | |
New York Convention Center Development Corp.
AMBAC Series 2005
5.00%, 11/15/30 | | $ | 10,000 | | | $ | 10,201,500 | |
New York Liberty Development Corp.
(3 World Trade Center LLC)
Series 2014
5.00%, 11/15/44(a) | | | 2,250 | | | | 2,283,817 | |
New York Liberty Development Corp.
(4 World Trade Center LLC)
Series 2011
5.00%, 11/15/31 | | | 2,225 | | | | 2,500,811 | |
New York Liberty Development Corp.
(National Sports Museum)
Series 2006A
6.125%, 2/15/19(b)(c) | | | 792 | | | | 8 | |
New York Power Authority (The)
NATL Series 2007C
5.00%, 11/15/19-11/15/21 | | | 3,680 | | | | 4,053,993 | |
New York State Dormitory Authority
Series 2007A
5.00%, 7/01/17 (Pre-refunded/ETM) | | | 1,200 | | | | 1,304,688 | |
Series 2007B
5.25%, 7/01/17 (Pre-refunded/ETM) | | | 570 | | | | 611,416 | |
Series 2008A
5.00%, 7/01/18 (Pre-refunded/ETM) | | | 4,220 | | | | 4,697,662 | |
5.75%, 7/01/18 (Pre-refunded/ETM) | | | 5,165 | | | | 5,866,252 | |
New York State Dormitory Authority
(Barnard College)
Series 2015A
4.00%, 7/01/32 | | | 1,300 | | | | 1,345,825 | |
New York State Dormitory Authority
(Cabrini of Westchester)
Series 2006
5.10%, 2/15/26 | | | 1,850 | | | | 2,025,398 | |
New York State Dormitory Authority
(Cornell University)
Series 2008B
5.00%, 7/01/27 | | | 4,925 | | | | 5,678,673 | |
Series 2008C
5.00%, 7/01/29 | | | 2,000 | | | | 2,292,480 | |
Series 2009A
5.00%, 7/01/25 | | | 2,465 | | | | 2,833,468 | |
New York State Dormitory Authority
(County of Westchester NY Lease)
Series 2006A
5.00%, 8/01/17 | | | 9,510 | | | | 10,008,229 | |
| | |
| 90 | | • AB MUNICIPAL INCOME FUND |
AB New York Portfolio—Portfolio of Investments
| | | | | | | | |
| | |
| | | Principal
Amount
(000) | | | U.S. $ Value | |
| |
| | | | | | | | |
New York State Dormitory Authority
(Eger Health Care & Rehabilitation Center)
Series 2000
6.10%, 8/01/37 | | $ | 845 | | | $ | 848,160 | |
New York State Dormitory Authority
(Manhattan College)
AGC Series 2007A
5.00%, 7/01/27 | | | 2,445 | | | | 2,620,429 | |
New York State Dormitory Authority
(Montefiore Medical Center)
NATL Series 2004
5.00%, 8/01/23 | | | 1,860 | | | | 1,866,361 | |
New York State Dormitory Authority
(Mount Sinai Hospital)
Series 2010A
5.00%, 7/01/26 | | | 6,795 | | | | 7,672,846 | |
New York State Dormitory Authority
(New York State Dormitory Authority Lease)
Series 2012A
5.00%, 5/15/27 | | | 2,700 | | | | 3,137,508 | |
Series 2013A
5.25%, 7/01/30 | | | 2,000 | | | | 2,328,440 | |
New York State Dormitory Authority
(New York State Pers Income Tax)
Series 2012A
5.00%, 12/15/30(d) | | | 7,980 | | | | 9,241,159 | |
New York State Dormitory Authority
(North Shore-Long Island Jewish Health Care, Inc.)
Series 2007A
5.00%, 5/01/22 | | | 1,405 | | | | 1,504,179 | |
New York State Dormitory Authority
(NYU Hospitals Center)
Series 2014
5.00%, 7/01/31 | | | 1,000 | | | | 1,124,870 | |
New York State Dormitory Authority
(Ozanam Hall of Queens Nursing Home, Inc.)
Series 2006
5.00%, 11/01/21 | | | 1,000 | | | | 1,030,770 | |
New York State Dormitory Authority
(Rochester Institute of Technology)
Series 2010
5.00%, 7/01/23-7/01/25 | | | 5,335 | | | | 6,168,428 | |
New York State Dormitory Authority
(Saints Joachim & Anne Nursing & Rehabilitation Center)
Series 2002
5.25%, 7/01/27 | | | 1,000 | | | | 1,000,000 | |
| | | | |
| AB MUNICIPAL INCOME FUND • | | | 91 | |
AB New York Portfolio—Portfolio of Investments
| | | | | | | | |
| | |
| | | Principal
Amount
(000) | | | U.S. $ Value | |
| |
| | | | | | | | |
New York State Dormitory Authority
(St John’s University/NY)
Series 2015A
5.00%, 7/01/33-7/01/34 | | $ | 2,000 | | | $ | 2,272,900 | |
New York State Dormitory Authority
(State of New York Pers Income Tax)
Series 2008A
5.00%, 3/15/27 | | | 2,350 | | | | 2,586,198 | |
New York State Dormitory Authority
(State University of New York)
Series 2010A
5.00%, 7/01/27-7/01/31 | | | 9,285 | | | | 10,719,706 | |
Series 2011A
5.00%, 7/01/28 | | | 6,690 | | | | 7,684,402 | |
New York State Dormitory Authority
(Teachers College)
Series 2012
5.00%, 7/01/34 | | | 2,535 | | | | 2,794,888 | |
Series 2012A
5.00%, 7/01/31 | | | 1,200 | | | | 1,339,836 | |
New York State Energy Research & Development Authority
(Consolidated Edison Co. of New York, Inc.)
XLCA Series 2004A
0.193%, 1/01/39(e)(f) | | | 3,000 | | | | 2,661,276 | |
New York State Energy Research & Development Authority
(New York State Electric & Gas Corp.)
NATL Series 2010C
0.508%, 4/01/34(e)(f) | | | 900 | | | | 847,219 | |
New York State Environmental Facilities Corp.
(New York City Municipal Water Finance Authority)
Series 2010A
5.00%, 6/15/29 | | | 2,000 | | | | 2,313,940 | |
New York State Thruway Authority
AMBAC Series 2005B
5.00%, 10/01/15 (Pre-refunded/ETM) | | | 995 | | | | 1,010,771 | |
New York State Thruway Authority
(New York State Thruway Authority Ded Tax)
AMBAC Series 2005B
5.00%, 4/01/21 | | | 6,505 | | | | 6,608,104 | |
NATL Series 2005B
5.00%, 4/01/17 | | | 10,000 | | | | 10,152,800 | |
| | |
| 92 | | • AB MUNICIPAL INCOME FUND |
AB New York Portfolio—Portfolio of Investments
| | | | | | | | |
| | |
| | | Principal
Amount
(000) | | | U.S. $ Value | |
| |
| | | | | | | | |
New York State Thruway Authority
(New York State Thruway Authority Gen Toll Road)
Series 2014
5.00%, 1/01/31-1/01/32 | | $ | 15,000 | | | $ | 17,057,050 | |
New York State Thruway Authority
(State of New York Pers Income Tax)
Series 2008A
5.00%, 3/15/26-3/15/27 | | | 11,000 | | | | 12,300,760 | |
Series 2010A
5.00%, 3/15/28 | | | 5,000 | | | | 5,764,650 | |
Onondaga Civic Development Corp.
(St Joseph’s Hospital Health Center)
Series 2012
5.00%, 7/01/42 | | | 2,610 | | | | 2,670,787 | |
Series 2014A
5.125%, 7/01/31 | | | 1,250 | | | | 1,347,225 | |
Onondaga County Industrial Development Agency
(Bristol-Myers Squibb Co.)
Series 1994
5.75%, 3/01/24 | | | 4,000 | | | | 4,944,400 | |
Orange County Funding Corp.
(Mount St Mary College)
Series 2012A
5.00%, 7/01/37 | | | 1,320 | | | | 1,397,286 | |
Otsego County Capital Resource Corp.
(Hartwick College)
Series 2015A
5.00%, 10/01/30-10/01/45 | | | 10,020 | | | | 10,719,436 | |
Port Authority of New York & New Jersey
Series 2010
5.00%, 7/15/31 | | | 13,000 | | | | 14,792,570 | |
Series 2013178
5.00%, 12/01/31 | | | 5,000 | | | | 5,613,400 | |
Series 2014
5.00%, 9/01/31 | | | 5,000 | | | | 5,617,150 | |
Port Authority of New York & New Jersey
(JFK International Air Terminal LLC)
NATL Series 1997
5.75%, 12/01/22 | | | 6,820 | | | | 6,843,052 | |
Rensselaer County Industrial Development Agency
(Rensselaer Polytechnic Institute)
Series 2006
5.00%, 3/01/26 | | | 7,505 | | | | 7,737,280 | |
Sachem Central School District
NATL Series 2006
5.00%, 10/15/21-10/15/22 | | | 5,415 | | | | 5,734,160 | |
| | | | |
| AB MUNICIPAL INCOME FUND • | | | 93 | |
AB New York Portfolio—Portfolio of Investments
| | | | | | | | |
| | |
| | | Principal
Amount
(000) | | | U.S. $ Value | |
| |
| | | | | | | | |
Seneca County Industrial Development Agency
(New York Chiropractic College)
Series 2007
5.00%, 10/01/27 | | $ | 925 | | | $ | 984,515 | |
Suffolk County Economic Development Corp.
(Catholic Health Services of Long Island Obligated Group)
Series 2011
5.00%, 7/01/28 | | | 5,990 | | | | 6,686,218 | |
Series 2014C
5.00%, 7/01/31 | | | 2,500 | | | | 2,812,175 | |
Suffolk County Economic Development Corp.
(Peconic Landing at Southold, Inc.)
Series 2010
5.875%, 12/01/30 | | | 2,340 | | | | 2,587,291 | |
Suffolk County Industrial Development Agency
(New York Institute of Technology)
Series 2000
5.00%, 3/01/26 | | | 1,150 | | | | 1,159,706 | |
Triborough Bridge & Tunnel Authority
Series 2006A
5.00%, 11/15/16 (Pre-refunded/ETM) | | | 6,715 | | | | 7,162,152 | |
Series 2008D
5.00%, 11/15/26 | | | 10,000 | | | | 11,186,800 | |
Series 2011A
5.00%, 1/01/28 | | | 5,000 | | | | 5,727,650 | |
Series 2013C
5.00%, 11/15/32 | | | 5,000 | | | | 5,695,000 | |
Troy Capital Resource Corp.
(Rensselaer Polytechnic Institute)
Series 2010A
5.00%, 9/01/30 | | | 3,000 | | | | 3,357,000 | |
Ulster County Industrial Development Agency
(Kingston Regional Senior Living Corp.)
Series 2007A
6.00%, 9/15/27 | | | 1,175 | | | | 1,178,090 | |
Utility Debt Securitization Authority
Series 2013T
5.00%, 12/15/31 | | | 10,000 | | | | 11,618,300 | |
Westchester County Healthcare Corp/NY
Series 2010B
6.00%, 11/01/30 | | | 1,000 | | | | 1,157,440 | |
Westchester County Local Development Corp.
(Kendal on Hudson)
Series 2013
5.00%, 1/01/34 | | | 1,800 | | | | 1,962,036 | |
| | |
| 94 | | • AB MUNICIPAL INCOME FUND |
AB New York Portfolio—Portfolio of Investments
| | | | | | | | |
| | |
| | | Principal
Amount
(000) | | | U.S. $ Value | |
| |
| | | | | | | | |
Yonkers Industrial Development Agency
(Michael Malotz Skilled Nursing Pavilion)
NATL Series 1999
5.65%, 2/01/39 | | $ | 655 | | | $ | 674,571 | |
| | | | | | | | |
| | | | | | | 495,447,286 | |
| | | | | | | | |
Arizona – 0.3% | | | | | | | | |
Dove Mountain Resort Community Facilities District
Series 2001
6.75%, 12/01/16 | | | 690 | | | | 663,118 | |
Goodyear Industrial Development Authority
(Liberty Utilities Litchfield Park Water & Sewer Corp.)
Series 2001
6.75%, 10/01/31 | | | 1,000 | | | | 1,003,220 | |
| | | | | | | | |
| | | | | | | 1,666,338 | |
| | | | | | | | |
Florida – 0.2% | | | | | | | | |
Hammock Bay Community Development District
Series 2004A
6.15%, 5/01/24 | | | 525 | | | | 527,777 | |
Marshall Creek Community Development District
Series 2002
6.625%, 5/01/32(c) | | | 825 | | | | 725,951 | |
| | | | | | | | |
| | | | | | | 1,253,728 | |
| | | | | | | | |
Georgia – 0.1% | | | | | | | | |
City of Atlanta GA
(Eastside Project/Atlanta)
Series 2005B
5.60%, 1/01/30 | | | 500 | | | | 501,700 | |
| | | | | | | | |
| | |
Guam – 0.1% | | | | | | | | |
Guam Government Waterworks Authority
Series 2005
6.00%, 7/01/15 (Pre-refunded/ETM) | | | 500 | | | | 502,230 | |
| | | | | | | | |
| | |
North Carolina – 0.2% | | | | | | | | |
North Carolina Medical Care Commission
Series 2005A
6.125%, 10/01/15 (Pre-refunded/ETM) | | | 1,000 | | | | 1,019,540 | |
| | | | | | | | |
| | |
Ohio – 0.2% | | | | | | | | |
Columbiana County Port Authority
(Apex Environmental LLC)
Series 2004
10.635%, 8/01/25 | | | 119 | | | | 93,077 | |
Series 2004A
7.125%, 8/01/25(c) | | | 1,200 | | | | 953,952 | |
| | | | | | | | |
| | | | | | | 1,047,029 | |
| | | | | | | | |
| | | | |
| AB MUNICIPAL INCOME FUND • | | | 95 | |
AB New York Portfolio—Portfolio of Investments
| | | | | | | | |
| | |
| | | Principal
Amount
(000) | | | U.S. $ Value | |
| |
| | | | | | | | |
Puerto Rico – 0.8% | | | | | | | | |
Puerto Rico Housing Finance Authority
(Puerto Rico Housing Finance Authority Cap Fd Prog)
Series 2003
5.00%, 12/01/20 | | $ | 1,795 | | | $ | 1,837,918 | |
Series 2008
5.125%, 12/01/27 | | | 1,495 | | | | 1,603,821 | |
Puerto Rico Industrial Tourist Educational Medical & Envirml Ctl Facs Fing Auth
(Sistema Universitario Ana G Mendez Incorporado)
Series 2012
5.125%, 4/01/32 | | | 1,000 | | | | 880,840 | |
| | | | | | | | |
| | | | | | | 4,322,579 | |
| | | | | | | | |
Texas – 1.2% | | | | | | | | |
Texas Private Activity Bond Surface Transportation Corp.
(LBJ Infrastructure Group LLC)
Series 2010
7.00%, 6/30/40 | | | 2,700 | | | | 3,238,596 | |
7.50%, 6/30/32 | | | 1,225 | | | | 1,505,353 | |
Texas Private Activity Bond Surface Transportation Corp.
(NTE Mobility Partners LLC)
Series 2009
6.875%, 12/31/39 | | | 1,350 | | | | 1,598,805 | |
| | | | | | | | |
| | | | | | | 6,342,754 | |
| | | | | | | | |
Total Municipal Obligations
(cost $483,850,132) | | | | | | | 512,103,184 | |
| | | | | | | | |
| | |
| | | Shares | | | | |
SHORT-TERM INVESTMENTS – 3.5% | | | | | |
Investment Companies – 3.5% | | | | | | | | |
AB Fixed Income Shares, Inc. – Government STIF Portfolio, 0.10%(g)(h)
(cost $18,572,175) | | | 18,572,175 | | | | 18,572,175 | |
| | | | | | | | |
| | |
Total Investments – 99.9%
(cost $502,422,307) | | | | | | | 530,675,359 | |
Other assets less liabilities – 0.1% | | | | | | | 285,207 | |
| | | | | | | | |
| | |
Net Assets – 100.0% | | | | | | $ | 530,960,566 | |
| | | | | | | | |
| | |
| 96 | | • AB MUNICIPAL INCOME FUND |
AB New York Portfolio—Portfolio of Investments
INTEREST RATE SWAPS (see Note D)
| | | | | | | | | | | | | | | | |
| | | | | | | | | Rate Type | | | |
Swap
Counterparty | | Notional
Amount
(000) | | | Termination
Date | | | Payments
made
by the
Fund | | Payments
received by the Fund | | Unrealized
Appreciation/
(Depreciation) | |
Citibank, NA | | $ | 2,200 | | | | 1/25/26 | | | SIFMA* | | 4.108% | | $ | 525,214 | |
| * | | Variable interest rate based on the Securities Industry & Financial Markets Association (SIFMA) Municipal Swap Index. |
| (a) | | Security is exempt from registration under Rule 144A of the Securities Act of 1933. This security is considered liquid and may be resold in transactions exempt from registration, normally to qualified institutional buyers. At May 31, 2015, the market value of this security amounted to $2,283,817 or 0.4% of net assets. |
| (b) | | Security is in default and is non-income producing. |
| (d) | | Security represents the underlying municipal obligation of an inverse floating rate obligation held by the Fund. |
| (e) | | Variable rate coupon, rate shown as of May 31, 2015. |
| (f) | | An auction rate security whose interest rate resets at each auction date. Auctions are typically held every week or month. The rate shown is as of May 31, 2015 and the aggregate market value of these securities amounted to $3,508,495 or 0.66% of net assets. |
| (g) | | To obtain a copy of the fund’s financial statements, please go to the Securities and Exchange Commission’s website at www.sec.gov, or call AllianceBernstein at (800) 227-4618. |
| (h) | | Investment in affiliated money market mutual fund. The rate shown represents the 7-day yield as of period end. |
As of May 31, 2015, the Fund’s percentages of investments in municipal bonds that are insured and in insured municipal bonds that have been pre-refunded or escrowed to maturity are 12.8% and 0.2%, respectively.
Glossary:
| AGC | | – Assured Guaranty Corporation |
| AGM | | – Assured Guaranty Municipal |
| AMBAC | | – Ambac Assurance Corporation |
| ETM | | – Escrowed to Maturity |
| NATL | | – National Interstate Corporation |
| XLCA | | – XL Capital Assurance Inc. |
See notes to financial statements.
| | | | |
| AB MUNICIPAL INCOME FUND • | | | 97 | |
AB New York Portfolio—Portfolio of Investments
STATEMENT OF ASSETS & LIABILITIES
May 31, 2015
| | | | | | | | |
| | | AB National | | | AB High Income
Municipal | |
| Assets | | | | | | | | |
Investments in securities, at value | | | | | | | | |
Unaffiliated issuers (cost $1,000,539,585 and $2,068,074,848, respectively) | | $ | 1,046,481,249 | | | $ | 2,170,852,132 | |
Affiliated issuers (cost $12,811,579 and $9,808,372, respectively) | | | 12,811,579 | | | | 9,808,372 | |
Cash | | | 126 | | | | 833 | |
Cash collateral due from broker | | | – 0 | – | | | 9,332,100 | |
Dividends and interest receivable | | | 15,298,417 | | | | 34,098,833 | |
Receivable for capital stock sold | | | 4,746,434 | | | | 11,678,646 | |
Receivable for investment securities sold | | | 680,000 | | | | 7,990,928 | |
Unrealized appreciation on interest rate swaps | | | 370,060 | | | | 1,880,977 | |
| | | | | | | | |
Total assets | | | 1,080,387,865 | | | | 2,245,642,821 | |
| | | | | | | | |
| Liabilities | | | | | | | | |
Payable for investment securities purchased | | | 10,838,552 | | | | 8,968,925 | |
Payable for floating rate notes issued(a) | | | 5,700,000 | | | | 159,630,000 | |
Payable for capital stock redeemed | | | 1,521,148 | | | | 7,732,337 | |
Dividends payable | | | 576,937 | | | | 2,271,850 | |
Advisory fee payable | | | 353,156 | | | | 804,226 | |
Distribution fee payable | | | 241,269 | | | | 388,005 | |
Transfer Agent fee payable | | | 12,685 | | | | 12,252 | |
Administrative fee payable | | | 7,324 | | | | 8,268 | |
Payable for variation margin on exchange-traded derivatives | | | – 0 | – | | | 226,195 | |
Unrealized depreciation on interest rate swaps | | | – 0 | – | | | 1,972,286 | |
Cash collateral due to broker | | | – 0 | – | | | 665,943 | |
Other liabilities | | | 22,022 | | | | 430,484 | |
Accrued expenses | | | 128,576 | | | | 136,204 | |
| | | | | | | | |
Total liabilities | | | 19,401,669 | | | | 183,246,975 | |
| | | | | | | | |
Net Assets | | $ | 1,060,986,196 | | | $ | 2,062,395,846 | |
| | | | | | | | |
| Composition of Net Assets | | | | | | | | |
Capital stock, at par | | $ | 103,984 | | | $ | 184,140 | |
Additional paid-in capital | | | 1,040,363,883 | | | | 2,001,381,130 | |
Undistributed (distributions in excess of) net investment income | | | (375,039 | ) | | | 469,257 | |
Accumulated net realized loss on investment transactions | | | (25,418,356 | ) | | | (43,181,755 | ) |
Net unrealized appreciation on investments | | | 46,311,724 | | | | 103,543,074 | |
| | | | | | | | |
| | $ | 1,060,986,196 | | | $ | 2,062,395,846 | |
| | | | | | | | |
| (a) | | Represents short-term floating rate certificates issued by tender option bond trusts (see Note I). |
See notes to financial statements.
| | |
| 98 | | • AB MUNICIPAL INCOME FUND |
Statement of Assets & Liabilities
Net Asset Value Per Share—54,300,000,000 shares of capital stock authorized, $.001 par value
| | | | | | | | | | | | |
| AB National Portfolio | | Net Assets | | | Shares
Outstanding | | | Net Asset
Value | |
| |
| Class A | | $ | 612,321,143 | | | | 60,005,452 | | | $ | 10.20 | * |
| |
| Class B | | $ | 920,145 | | | | 90,285 | | | $ | 10.19 | |
| |
| Class C | | $ | 131,936,247 | | | | 12,942,724 | | | $ | 10.19 | |
| |
| Advisor Class | | $ | 315,808,661 | | | | 30,945,144 | | | $ | 10.21 | |
| |
| | |
| AB High Income Municipal Portfolio | | | | | | | |
| |
| Class A | | $ | 693,522,856 | | | | 61,897,826 | | | $ | 11.20 | * |
| |
| Class C | | $ | 284,260,925 | | | | 25,383,024 | | | $ | 11.20 | |
| |
| Advisor Class | | $ | 1,084,612,065 | | | | 96,858,758 | | | $ | 11.20 | |
| |
| * | | The maximum offering price per share for Class A of AB National Portfolio and AB High Income Municipal Portfolio were $10.52 and $11.55, respectively, which reflects a sales charge of 3.00%. |
See notes to financial statements.
| | | | |
| AB MUNICIPAL INCOME FUND • | | | 99 | |
Statement of Assets & Liabilities
| | | | | | | | |
| | | AB California | | | AB New York | |
| Assets | | | | | | | | |
Investments in securities, at value | | | | | | | | |
Unaffiliated issuers (cost $550,213,812 and $483,850,132, respectively) | | $ | 606,471,048 | | | $ | 512,103,184 | |
Affiliated issuers (cost $16,125,713 and $18,572,175, respectively) | | | 16,125,713 | | | | 18,572,175 | |
Cash | | | 126 | | | | 126 | |
Interest receivable | | | 5,420,859 | | | | 6,979,090 | |
Unrealized appreciation on interest rate swaps | | | 1,733,862 | | | | 525,214 | |
Receivable for capital stock sold | | | 518,435 | | | | 130,453 | |
Receivable for investment securities sold | | | 140,000 | | | | 45,000 | |
| | | | | | | | |
Total assets | | | 630,410,043 | | | | 538,355,242 | |
| | | | | | | | |
| Liabilities | | | | | | | | |
Payable for investment securities purchased | | | 24,113,342 | | | | – 0 | – |
Unrealized depreciation on interest rate swaps | | | 7,620,163 | | | | – 0 | – |
Payable for floating rate notes issued(a) | | | 4,445,000 | | | | 5,940,000 | |
Payable for capital stock redeemed | | | 2,290,218 | | | | 843,697 | |
Dividends payable | | | 367,991 | | | | 156,327 | |
Advisory fee payable | | | 208,831 | | | | 176,327 | |
Distribution fee payable | | | 164,987 | | | | 153,300 | |
Administrative fee payable | | | 8,268 | | | | 7,324 | |
Other liabilities | | | 15,658 | | | | 14,332 | |
Transfer Agent fee payable | | | 5,664 | | | | 7,031 | |
Accrued expenses | | | 88,489 | | | | 96,338 | |
| | | | | | | | |
Total liabilities | | | 39,328,611 | | | | 7,394,676 | |
| | | | | | | | |
Net Assets | | $ | 591,081,432 | | | $ | 530,960,566 | |
| | | | | | | | |
| Composition of Net Assets | | | | | | | | |
Capital stock, at par | | $ | 52,431 | | | $ | 53,515 | |
Additional paid-in capital | | | 544,322,058 | | | | 520,086,852 | |
Distributions in excess of net investment income | | | (326,793 | ) | | | (164,796 | ) |
Accumulated net realized loss on investment transactions | | | (3,337,199 | ) | | | (17,793,271 | ) |
Net unrealized appreciation on investments | | | 50,370,935 | | | | 28,778,266 | |
| | | | | | | | |
| | $ | 591,081,432 | | | $ | 530,960,566 | |
| | | | | | | | |
| (a) | | Represents short-term floating rate certificates issued by tender option bond trusts (see Note I). |
See notes to financial statements.
| | |
| 100 | | • AB MUNICIPAL INCOME FUND |
Statement of Assets & Liabilities
Net Asset Value Per Share—54,300,000,000 shares of capital stock authorized, $.001 par value
| | | | | | | | | | | | |
| AB California Portfolio | | Net Assets | | | Shares
Outstanding | | | Net Asset
Value | |
| |
| Class A | | $ | 440,324,045 | | | | 39,057,003 | | | $ | 11.27 | * |
| |
| Class B | | $ | 187,983 | | | | 16,672 | | | $ | 11.28 | |
| |
| Class C | | $ | 83,677,278 | | | | 7,424,102 | | | $ | 11.27 | |
| |
| Advisor Class | | $ | 66,892,126 | | | | 5,933,101 | | | $ | 11.27 | |
| |
| | | |
| AB New York Portfolio | | | | | | | | | |
| |
| Class A | | $ | 428,144,547 | | | | 43,148,981 | | | $ | 9.92 | * |
| |
| Class B | | $ | 1,645,863 | | | | 166,096 | | | $ | 9.91 | |
| |
| Class C | | $ | 72,332,344 | | | | 7,294,348 | | | $ | 9.92 | |
| |
| Advisor Class | | $ | 28,837,812 | | | | 2,905,551 | | | $ | 9.93 | |
| |
| * | | The maximum offering price per share for Class A of AB California Portfolio and AB New York Portfolio were $11.62 and $10.23, respectively, which reflects a sales charge of 3.00%. |
See notes to financial statements.
| | | | |
| AB MUNICIPAL INCOME FUND • | | | 101 | |
Statement of Assets & Liabilities
STATEMENT OF OPERATIONS
| | | | | | | | |
| | | AB National | |
| | | November 1, 2014
to May 31, 2015(a) | | | Year Ended
October 31,
2014 | |
| Investment Income | | | | | | | | |
Interest | | $ | 24,666,935 | | | $ | 41,681,536 | |
Dividends – Affiliated issuers | | | 2,997 | | | | 6,311 | |
| | | | | | | | |
Total income | | | 24,669,932 | | | | 41,687,847 | |
| | | | | | | | |
| Expenses | | | | | | | | |
Advisory fee (see Note B) | | | 2,661,415 | | | | 4,216,476 | |
Distribution fee – Class A | | | 940,179 | | | | 1,857,569 | |
Distribution fee – Class B | | | 5,912 | | | | 21,779 | |
Distribution fee – Class C | | | 769,127 | | | | 1,331,165 | |
Transfer agency – Class A | | | 143,590 | | | | 273,170 | |
Transfer agency – Class B | | | 335 | | | | 1,154 | |
Transfer agency – Class C | | | 32,671 | | | | 60,246 | |
Transfer agency – Advisor Class | | | 68,859 | | | | 77,932 | |
Custodian | | | 117,150 | | | | 190,027 | |
Registration fees | | | 67,525 | | | | 93,779 | |
Audit and tax | | | 47,406 | | | | 57,895 | |
Printing | | | 37,608 | | | | 59,683 | |
Administrative | | | 29,090 | | | | 55,614 | |
Legal | | | 19,383 | | | | 29,548 | |
Directors’ fees | | | 13,325 | | | | 14,687 | |
Miscellaneous | | | 6,721 | | | | 36,682 | |
| | | | | | | | |
Total expenses before interest expense | | | 4,960,296 | | | | 8,377,406 | |
Interest expense | | | 33,181 | | | | 52,041 | |
| | | | | | | | |
Total expenses | | | 4,993,477 | | | | 8,429,447 | |
Less: expenses waived and reimbursed by the Adviser (see Note B) | | | (287,952 | ) | | | (481,922 | ) |
| | | | | | | | |
Net expenses | | | 4,705,525 | | | | 7,947,525 | |
| | | | | | | | |
Net investment income | | | 19,964,407 | | | | 33,740,322 | |
| | | | | | | | |
| Realized and Unrealized Gain (Loss) on Investment Transactions | | | | | | | | |
Net realized gain (loss) on: | | | | | | | | |
Investment transactions | | | 4,126,885 | | | | (14,948,420 | ) |
Swaps | | | 193,402 | | | | 256,335 | |
Net change in unrealized appreciation/depreciation of: | | | | | | | | |
Investments | | | (18,107,860 | ) | | | 53,725,544 | |
Swaps | | | (166,841 | ) | | | (225,064 | ) |
| | | | | | | | |
Net gain (loss) on investment transactions | | | (13,954,414 | ) | | | 38,808,395 | |
| | | | | | | | |
Net Increase in Net Assets from Operations | | $ | 6,009,993 | | | $ | 72,548,717 | |
| | | | | | | | |
| (a) | | The Portfolio changed its fiscal year end from October 31 to May 31. |
See notes to financial statements.
| | |
| 102 | | • AB MUNICIPAL INCOME FUND |
Statement of Operations
| | | | | | | | |
| | | AB High Income Municipal | |
| | | November 1, 2014
to May 31, 2015(a) | | | Year Ended
October 31,
2014 | |
| Investment Income | | | | | | | | |
Interest | | $ | 61,039,935 | | | $ | 87,036,413 | |
Dividends – Affiliated issuers | | | 26,903 | | | | 34,226 | |
| | | | | | | | |
Total income | | | 61,066,838 | | | | 87,070,639 | |
| | | | | | | | |
| Expenses | | | | | | | | |
Advisory fee (see Note B) | | | 5,886,188 | | | | 7,461,802 | |
Distribution fee – Class A | | | 1,077,158 | | | | 1,811,042 | |
Distribution fee – Class C | | | 1,596,446 | | | | 2,237,983 | |
Transfer agency – Class A | | | 111,206 | | | | 189,314 | |
Transfer agency – Class C | | | 44,945 | | | | 70,515 | |
Transfer agency – Advisor Class | | | 172,899 | | | | 200,820 | |
Custodian | | | 145,915 | | | | 223,200 | |
Registration fees | | | 104,906 | | | | 198,878 | |
Audit and tax | | | 53,304 | | | | 66,518 | |
Printing | | | 47,406 | | | | 52,288 | |
Administrative | | | 28,559 | | | | 54,934 | |
Legal | | | 18,334 | | | | 29,548 | |
Directors’ fees | | | 13,326 | | | | 14,683 | |
Miscellaneous | | | 9,990 | | | | 49,194 | |
| | | | | | | | |
Total expenses before interest expense | | | 9,310,582 | | | | 12,660,719 | |
Interest expense | | | 688,151 | | | | 1,279,346 | |
| | | | | | | | |
Total expenses | | | 9,998,733 | | | | 13,940,065 | |
Less: expenses waived and reimbursed by the Adviser (see Note B) | | | (400,402 | ) | | | (1,149,892 | ) |
| | | | | | | | |
Net expenses | | | 9,598,331 | | | | 12,790,173 | |
| | | | | | | | |
Net investment income | | | 51,468,507 | | | | 74,280,466 | |
| | | | | | | | |
| Realized and Unrealized Gain (Loss) on Investment Transactions | | | | | | | | |
Net realized gain (loss) on: | | | | | | | | |
Investment transactions | | | 4,786,224 | | | | (30,926,526 | ) |
Swaptions written | | | 279,750 | | | | – 0 | – |
Swaps | | | (3,502,541 | ) | | | (48,767 | ) |
Net change in unrealized appreciation/depreciation of: | | | | | | | | |
Investments | | | (9,123,354 | ) | | | 160,258,025 | |
Swaps | | | 2,900,900 | | | | (2,232,960 | ) |
| | | | | | | | |
Net gain (loss) on investment transactions | | | (4,659,021 | ) | | | 127,049,772 | |
| | | | | | | | |
Contributions from Affiliates (see Note B) | | | – 0 | – | | | 17,472 | |
| | | | | | | | |
Net Increase in Net Assets from Operations | | $ | 46,809,486 | | | $ | 201,347,710 | |
| | | | | | | | |
| (a) | | The Portfolio changed its fiscal year end from October 31 to May 31. |
See notes to financial statements.
| | | | |
| AB MUNICIPAL INCOME FUND • | | | 103 | |
Statement of Operations
| | | | | | | | |
| | | AB California | |
| | | November 1, 2014
to May 31, 2015(a) | | | Year Ended
October 31,
2014 | |
| Investment Income | | | | | | | | |
Interest | | $ | 14,578,884 | | | $ | 25,690,932 | |
Dividends – Affiliated issuers | | | 2,504 | | | | 1,665 | |
| | | | | | | | |
Total income | | | 14,581,388 | | | | 25,692,597 | |
| | | | | | | | |
| Expenses | | | | | | | | |
Advisory fee (see Note B) | | | 1,526,116 | | | | 2,556,120 | |
Distribution fee – Class A | | | 697,209 | | | | 1,335,686 | |
Distribution fee – Class B | | | 1,326 | | | | 7,102 | |
Distribution fee – Class C | | | 488,665 | | | | 834,185 | |
Transfer agency – Class A | | | 76,034 | | | | 144,086 | |
Transfer agency – Class B | | | 63 | | | | 274 | |
Transfer agency – Class C | | | 14,881 | | | | 27,774 | |
Transfer agency – Advisor Class | | | 9,716 | | | | 12,287 | |
Custodian | | | 87,983 | | | | 147,706 | |
Audit and tax | | | 44,937 | | | | 56,368 | |
Administrative | | | 28,887 | | | | 54,807 | |
Legal | | | 18,334 | | | | 29,548 | |
Printing | | | 15,339 | | | | 29,264 | |
Registration fees | | | 14,147 | | | | 25,558 | |
Directors’ fees | | | 13,326 | | | | 14,683 | |
Miscellaneous | | | 5,033 | | | | 25,379 | |
| | | | | | | | |
Total expenses before interest expense | | | 3,041,996 | | | | 5,300,827 | |
Interest expense | | | 23,545 | | | | 44,444 | |
| | | | | | | | |
Total expenses | | | 3,065,541 | | | | 5,345,271 | |
Less: expenses waived and reimbursed by the Adviser (see Note B) | | | (159,110 | ) | | | (283,721 | ) |
| | | | | | | | |
Net expenses | | | 2,906,431 | | | | 5,061,550 | |
| | | | | | | | |
Net investment income | | | 11,674,957 | | | | 20,631,047 | |
| | | | | | | | |
| Realized and Unrealized Gain (Loss) on Investment Transactions | | | | | | | | |
Net realized gain (loss) on: | | | | | | | | |
Investment transactions | | | 2,902,425 | | | | (1,829,223 | ) |
Swaps | | | (518,951 | ) | | | (2,977,074 | ) |
Net change in unrealized appreciation/depreciation of: | | | | | | | | |
Investments | | | (10,591,179 | ) | | | 33,369,261 | |
Swaps | | | (878,689 | ) | | | 1,005,257 | |
| | | | | | | | |
Net gain (loss) on investment transactions | | | (9,086,394 | ) | | | 29,568,221 | |
| | | | | | | | |
Net Increase in Net Assets from Operations | | $ | 2,588,563 | | | $ | 50,199,268 | |
| | | | | | | | |
| (a) | | The Portfolio changed its fiscal year end from October 31 to May 31. |
See notes to financial statements.
| | |
| 104 | | • AB MUNICIPAL INCOME FUND |
Statement of Operations
| | | | | | | | |
| | | AB New York | |
| | | November 1, 2014
to May 31, 2015(a) | | | Year Ended
October 31,
2014 | |
| Investment Income | | | | | | | | |
Interest | | $ | 12,263,503 | | | $ | 22,541,126 | |
Dividends – Affiliated issuers | | | 1,390 | | | | 2,850 | |
| | | | | | | | |
Total income | | | 12,264,893 | | | | 22,543,976 | |
| | | | | | | | |
| Expenses | | | | | | | | |
Advisory fee (see Note B) | | | 1,383,016 | | | | 2,401,210 | |
Distribution fee – Class A | | | 677,739 | | | | 1,314,673 | |
Distribution fee – Class B | | | 10,338 | | | | 37,491 | |
Distribution fee – Class C | | | 420,064 | | | | 745,597 | |
Transfer agency – Class A | | | 102,589 | | | | 192,512 | |
Transfer agency – Class B | | | 519 | | | | 1,932 | |
Transfer agency – Class C | | | 17,536 | | | | 33,355 | |
Transfer agency – Advisor Class | | | 5,924 | | | | 7,358 | |
Custodian | | | 85,732 | | | | 145,074 | |
Audit and tax | | | 47,406 | | | | 57,895 | |
Administrative | | | 29,090 | | | | 55,614 | |
Legal | | | 19,383 | | | | 29,548 | |
Printing | | | 19,140 | | | | 36,562 | |
Directors’ fees | | | 13,325 | | | | 14,686 | |
Registration fees | | | 10,478 | | | | 23,581 | |
Miscellaneous | | | 5,031 | | | | 25,058 | |
| | | | | | | | |
Total expenses before interest expense | | | 2,847,310 | | | | 5,122,146 | |
Interest expense | | | 32,612 | | | | 36,784 | |
| | | | | | | | |
Total expenses | | | 2,879,922 | | | | 5,158,930 | |
Less: expenses waived and reimbursed by the Adviser (see Note B) | | | (202,485 | ) | | | (356,372 | ) |
| | | | | | | | |
Net expenses | | | 2,677,437 | | | | 4,802,558 | |
| | | | | | | | |
Net investment income | | | 9,587,456 | | | | 17,741,418 | |
| | | | | | | | |
| Realized and Unrealized Gain (Loss) on Investment Transactions | | | | | | | | |
Net realized gain (loss) on: | | | | | | | | |
Investment transactions | | | 1,566,317 | | | | (9,251,797 | ) |
Swaps | | | 67,689 | | | | 66,805 | |
Net change in unrealized appreciation/depreciation of: | | | | | | | | |
Investments | | | (6,426,672 | ) | | | 25,683,746 | |
Swaps | | | 56,435 | | | | 92,451 | |
| | | | | | | | |
Net gain (loss) on investment transactions | | | (4,736,231 | ) | | | 16,591,205 | |
| | | | | | | | |
Net Increase in Net Assets from Operations | | $ | 4,851,225 | | | $ | 34,332,623 | |
| | | | | | | | |
| (a) | | The Portfolio changed its fiscal year end from October 31 to May 31. |
See notes to financial statements.
| | | | |
| AB MUNICIPAL INCOME FUND • | | | 105 | |
Statement of Operations
STATEMENT OF CHANGES IN NET ASSETS
| | | | | | | | | | | | |
| | | AB National | |
| | | November 1,
2014 to May 31,
2015(a) | | | Year Ended
October 31,
2014 | | | Year Ended
October 31,
2013 | |
| Increase (Decrease) in Net Assets from Operations | | | | | | | | | | | | |
Net investment income | | $ | 19,964,407 | | | $ | 33,740,322 | | | $ | 37,477,106 | |
Net realized gain (loss) on investment transactions | | | 4,320,287 | | | | (14,692,085 | ) | | | (14,091,357 | ) |
Net change in unrealized appreciation/depreciation of investments | | | (18,274,701 | ) | | | 53,500,480 | | | | (63,203,217 | ) |
| | | | | | | | | | | | |
Net increase (decrease) in net assets from operations | | | 6,009,993 | | | | 72,548,717 | | | | (39,817,468 | ) |
| Dividends to Shareholders from | | | | | | | | | | | | |
Net investment income | | | | | | | | | | | | |
Class A | | | (11,873,071 | ) | | | (22,764,029 | ) | | | (25,736,465 | ) |
Class B | | | (16,034 | ) | | | (65,472 | ) | | | (121,066 | ) |
Class C | | | (2,076,231 | ) | | | (3,970,573 | ) | | | (4,651,132 | ) |
Advisor Class | | | (6,149,085 | ) | | | (7,196,898 | ) | | | (7,222,197 | ) |
| Capital Stock Transactions | | | | | | | | | | | | |
Net increase (decrease) | | | 107,389,814 | | | | (33,734,278 | ) | | | (77,781,548 | ) |
| Capital Contributions | | | | | | | | | | | | |
Proceeds from third party regulatory settlement (see Note E) | | | – 0 | – | | | – 0 | – | | | 16,997 | |
| | | | | | | | | | | | |
Total increase (decrease) | | | 93,285,386 | | | | 4,817,467 | | | | (155,312,879 | ) |
| Net Assets | | | | | | | | | | | | |
Beginning of period | | | 967,700,810 | | | | 962,883,343 | | | | 1,118,196,222 | |
| | | | | | | | | | | | |
End of period (including distributions in excess of net investment income of ($375,039), ($418,427) and ($418,112), respectively) | | $ | 1,060,986,196 | | | $ | 967,700,810 | | | $ | 962,883,343 | |
| | | | | | | | | | | | |
| (a) | | The Portfolio changed its fiscal year end from October 31 to May 31. |
See notes to financial statements.
| | |
| 106 | | • AB MUNICIPAL INCOME FUND |
Statement of Changes in Net Assets
| | | | | | | | | | | | |
| | | AB High Income Municipal | |
| | | November 1,
2014 to May 31,
2015(a) | | | Year Ended
October 31,
2014 | | | Year Ended
October 31,
2013 | |
| Increase (Decrease) in Net Assets from Operations | | | | | | | | | | | | |
Net investment income | | $ | 51,468,507 | | | $ | 74,280,466 | | | $ | 64,726,653 | |
Net realized gain (loss) on investment transactions | | | 1,563,433 | | | | (30,975,293 | ) | | | (5,798,591 | ) |
Net change in unrealized appreciation/depreciation of investments | | | (6,222,454 | ) | | | 158,025,065 | | | | (151,811,304 | ) |
Contributions from Affiliates (see Note B) | | | – 0 | – | | | 17,472 | | | | – 0 | – |
| | | | | | | | | | | | |
Net increase (decrease) in net assets from operations | | | 46,809,486 | | | | 201,347,710 | | | | (92,883,242 | ) |
| Dividends to Shareholders from | | | | | | | | | | | | |
Net investment income | | | | | | | | | | | | |
Class A | | | (17,807,633 | ) | | | (30,136,052 | ) | | | (31,708,917 | ) |
Class C | | | (5,985,850 | ) | | | (9,582,967 | ) | | | (9,723,268 | ) |
Advisor Class | | | (29,355,600 | ) | | | (34,577,183 | ) | | | (23,981,422 | ) |
| Capital Stock Transactions | | | | | | | | | | | | |
Net increase | | | 220,107,935 | | | | 499,881,492 | | | | 118,176,111 | |
| | | | | | | | | | | | |
Total increase (decrease) | | | 213,768,338 | | | | 626,933,000 | | | | (40,120,738 | ) |
| Net Assets | | | | | | | | | | | | |
Beginning of period | | | 1,848,627,508 | | | | 1,221,694,508 | | | | 1,261,815,246 | |
| | | | | | | | | | | | |
End of period (including undistributed net investment income of $469,257, $662,956 and $778,550, respectively) | | $ | 2,062,395,846 | | | $ | 1,848,627,508 | | | $ | 1,221,694,508 | |
| | | | | | | | | | | | |
| (a) | | The Portfolio changed its fiscal year end from October 31 to May 31. |
See notes to financial statements.
| | | | |
| AB MUNICIPAL INCOME FUND • | | | 107 | |
Statement of Changes in Net Assets
| | | | | | | | | | | | |
| | | AB California | |
| | | November 1,
2014 to May 31,
2015(a) | | | Year Ended
October 31,
2014 | | | Year Ended
October 31,
2013 | |
| Increase (Decrease) in Net Assets from Operations | | | | | | | | | | | | |
Net investment income | | $ | 11,674,957 | | | $ | 20,631,047 | | | $ | 23,328,798 | |
Net realized gain (loss) on investment transactions | | | 2,383,474 | | | | (4,806,297 | ) | | | (3,700,593 | ) |
Net change in unrealized appreciation/depreciation of investments | | | (11,469,868 | ) | | | 34,374,518 | | | | (35,755,246 | ) |
| | | | | | | | | | | | |
Net increase (decrease) in net assets from operations | | | 2,588,563 | | | | 50,199,268 | | | | (16,127,041 | ) |
| Dividends and Distributions to Shareholders from | | | | | | | | | | | | |
Net investment income | | | | | | | | | | | | |
Class A | | | (8,684,517 | ) | | | (15,747,037 | ) | | | (17,718,045 | ) |
Class B | | | (3,520 | ) | | | (20,337 | ) | | | (39,229 | ) |
Class C | | | (1,294,173 | ) | | | (2,367,254 | ) | | | (2,821,519 | ) |
Advisor Class | | | (1,200,723 | ) | | | (1,474,866 | ) | | | (1,440,486 | ) |
Net realized gain on investment transactions | | | | | | | | | | | | |
Class A | | | – 0 | – | | | – 0 | – | | | (1,280,780 | ) |
Class B | | | – 0 | – | | | – 0 | – | | | (4,103 | ) |
Class C | | | – 0 | – | | | – 0 | – | | | (261,726 | ) |
Advisor Class | | | – 0 | – | | | – 0 | – | | | (85,857 | ) |
Tax return of capital | | | | | | | | | | | | |
Class A | | | – 0 | – | | | – 0 | – | | | (141,626 | ) |
Class B | | | – 0 | – | | | – 0 | – | | | (314 | ) |
Class C | | | – 0 | – | | | – 0 | – | | | (22,557 | ) |
Advisor Class | | | – 0 | – | | | – 0 | – | | | (11,513 | ) |
| Capital Stock Transactions | | | | | | | | | | | | |
Net increase (decrease) | | | 24,353,556 | | | | (42,610,980 | ) | | | (52,900,856 | ) |
| | | | | | | | | | | | |
Total increase (decrease) | | | 15,759,186 | | | | (12,021,206 | ) | | | (92,855,652 | ) |
| Net Assets | | | | | | | | | | | | |
Beginning of period | | | 575,322,246 | | | | 587,343,452 | | | | 680,199,104 | |
| | | | | | | | | | | | |
End of period (including distributions in excess of net investment income of ($326,793), ($393,455) and ($100,253), respectively) | | $ | 591,081,432 | | | $ | 575,322,246 | | | $ | 587,343,452 | |
| | | | | | | | | | | | |
| (a) | | The Portfolio changed its fiscal year end from October 31 to May 31. |
See notes to financial statements.
| | |
| 108 | | • AB MUNICIPAL INCOME FUND |
Statement of Changes in Net Assets
| | | | | | | | | | | | |
| | | AB New York | |
| | | November 1,
2014 to May 31,
2015(a) | | | Year Ended
October 31,
2014 | | | Year Ended
October 31,
2013 | |
| Increase (Decrease) in Net Assets from Operations | | | | | | | | | | | | |
Net investment income | | $ | 9,587,456 | | | $ | 17,741,418 | | | $ | 21,719,015 | |
Net realized gain (loss) on investment transactions | | | 1,634,006 | | | | (9,184,992 | ) | | | (9,900,520 | ) |
Net change in unrealized appreciation/depreciation of investments | | | (6,370,237 | ) | | | 25,776,197 | | | | (41,910,341 | ) |
| | | | | | | | | | | | |
Net increase (decrease) in net assets from operations | | | 4,851,225 | | | | 34,332,623 | | | | (30,091,846 | ) |
| Dividends and Distributions to Shareholders from | | | | | | | | | | | | |
Net investment income | | | | | | | | | | | | |
Class A | | | (8,058,903 | ) | | | (15,051,037 | ) | | | (18,119,416 | ) |
Class B | | | (25,922 | ) | | | (104,499 | ) | | | (202,855 | ) |
Class C | | | (1,050,345 | ) | | | (2,042,325 | ) | | | (2,596,232 | ) |
Advisor Class | | | (504,883 | ) | | | (632,246 | ) | | | (795,358 | ) |
Net realized gain on investment transactions | | | | | | | | | | | | |
Class A | | | – 0 | – | | | – 0 | – | | | (952,920 | ) |
Class B | | | – 0 | – | | | – 0 | – | | | (15,683 | ) |
Class C | | | – 0 | – | | | – 0 | – | | | (175,207 | ) |
Advisor Class | | | – 0 | – | | | – 0 | – | | | (40,970 | ) |
Tax return of capital | | | | | | | | | | | | |
Class A | | | – 0 | – | | | – 0 | – | | | (171,139 | ) |
Class B | | | – 0 | – | | | – 0 | – | | | (1,916 | ) |
Class C | | | – 0 | – | | | – 0 | – | | | (24,524 | ) |
Advisor Class | | | – 0 | – | | | – 0 | – | | | (7,512 | ) |
| Capital Stock Transactions | | | | | | | | | | | | |
Net increase (decrease) | | | 6,635,473 | | | | (53,768,122 | ) | | | (100,005,084 | ) |
| | | | | | | | | | | | |
Total increase (decrease) | | | 1,846,645 | | | | (37,265,606 | ) | | | (153,200,662 | ) |
| Net Assets | | | | | | | | | | | | |
Beginning of period | | | 529,113,921 | | | | 566,379,527 | | | | 719,580,189 | |
| | | | | | | | | | | | |
End of period (including distributions in excess of net investment income of ($164,796), ($226,342) and ($204,458), respectively) | | $ | 530,960,566 | | | $ | 529,113,921 | | | $ | 566,379,527 | |
| | | | | | | | | | | | |
| (a) | | The Portfolio changed its fiscal year end from October 31 to May 31. |
See notes to financial statements.
| | | | |
| AB MUNICIPAL INCOME FUND • | | | 109 | |
Statement of Changes in Net Assets
STATEMENT OF CASH FLOWS
For the Period November 1, 2014 to May 31, 2015(a)
| | | | | | | | |
| | | AB High Income Municipal* | |
Cash flows from operating activities | | | | | | | | |
Net increase in net assets from operations | | | | | | $ | 46,809,486 | |
| Reconciliation of Net Increase in Net Assets from Operations to Net Decrease in Cash from Operating Activities: | | | | | | | | |
Increase in interest and dividends receivable | | $ | (1,312,230 | ) | | | | |
Increase in receivable for investments sold | | | (7,871,928 | ) | | | | |
Net accretion of bond discount and amortization of bond premium | | | 2,896,544 | | | | | |
Decrease in payable for investments purchased | | | (12,105,091 | ) | | | | |
Increase in accrued expenses and other liabilities | | | 15,523 | | | | | |
Increase in cash collateral due from broker | | | (5,107,263 | ) | | | | |
Purchases of long-term investments | | | (318,980,876 | ) | | | | |
Purchases of short-term investments | | | (448,694,704 | ) | | | | |
Proceeds from disposition of long-term investments | | | 181,803,727 | | | | | |
Proceeds from disposition of short-term investments | | | 398,756,000 | | | | | |
Proceeds from swaptions written, net | | | 279,750 | | | | | |
Proceeds on swaps, net | | | 10,162 | | | | | |
Payments for exchange-traded derivatives settlements | | | (121,158 | ) | | | | |
Net realized gain on investment transactions | | | (1,563,433 | ) | | | | |
Net change in unrealized appreciation/depreciation on investment transactions | | | 6,222,454 | | | | | |
| | | | | | | | |
Total adjustments | | | | | | | (205,772,523 | ) |
| | | | | | | | |
Net decrease in cash from operating activities | | | | | | $ | (158,963,037 | ) |
| | | | | | | | |
| Financing Activities: | | | | | | | | |
Subscriptions of capital stock, net | | | 189,852,000 | | | | | |
Decrease in due to custodian | | | (24,303 | ) | | | | |
Cash dividends paid (net of dividend reinvestments)** | | | (24,198,827 | ) | | | | |
Decrease in payable for floating rate notes issued | | | (6,665,000 | ) | | | | |
| | | | | | | | |
Net increase in cash from financing activities | | | | | | | 158,963,870 | |
| | | | | | | | |
Net increase in cash | | | | | | | 833 | |
Net change in cash | | | | | | | | |
Cash at beginning of period | | | | | | | — | |
| | | | | | | | |
Cash at end of period | | | | | | $ | 833 | |
| | | | | | | | |
** Reinvestment of dividends | | $ | 29,515,669 | | | | | |
Supplemental disclosure of cash flow information: | | | | | | | | |
Interest expense paid during the period | | $ | 688,151 | | | | | |
| (a) | | The Portfolio changed its fiscal year end from October 31 to May 31. |
| * | | In accordance with U.S. GAAP, the Portfolio has included a Statement of Cash Flows as a result of its substantial investments in floating rate notes and Level 3 securities throughout the period. |
See notes to financial statements.
| | |
| 110 | | • AB MUNICIPAL INCOME FUND |
Statement of Cash Flows
STATEMENT OF CASH FLOWS
For the Year Ended October 31, 2014
| | | | | | | | |
| | | AB High Income Municipal* | |
Cash flows from operating activities | | | | | | | | |
Net increase in net assets from operations | | | | | | $ | 201,330,238 | |
| Reconciliation of Net Increase in Net Assets from Operations to Net Decrease in Cash from Operating Activities: | | | | | | | | |
Increase in interest and dividends receivable | | $ | (7,075,176 | ) | | | | |
Decrease in receivable for investments sold | | | 20,236,087 | | | | | |
Net accretion of bond discount and amortization of bond premium | | | 3,151,201 | | | | | |
Increase in payable for investments purchased | | | 10,125,658 | | | | | |
Increase in accrued expenses | | | 666,650 | | | | | |
Increase in due from broker | | | (4,102,573 | ) | | | | |
Purchases of long-term investments | | | (746,695,018 | ) | | | | |
Purchases of short-term investments | | | (536,344,310 | ) | | | | |
Proceeds from disposition of long-term investments | | | 243,414,136 | | | | | |
Proceeds from disposition of short-term investments | | | 529,719,182 | | | | | |
Proceeds on swaps, net | | | (145,262 | ) | | | | |
Payments for exchange-traded derivatives settlements | | | (2,126,577 | ) | | | | |
Variation margin received on exchange-traded derivatives | | | (186,734 | ) | | | | |
Decrease in cash collateral received from broker | | | (3,600,000 | ) | | | | |
Net realized loss on investment | | | 30,975,293 | | | | | |
Net change in unrealized appreciaton/ depreciation of investments | | | (158,025,065 | ) | | | | |
| | | | | | | | |
Total adjustments | | | | | | | (620,012,508 | ) |
| | | | | | | | |
Net decrease in cash from operating activities | | | | | | $ | (418,682,270 | ) |
| | | | | | | | |
| Financing Activities: | | | | | | | | |
Subscriptions of capital stock, net | | | 453,750,550 | | | | | |
Increase in due to custodian | | | 24,303 | | | | | |
Cash dividends paid (net of dividend reinvestments)** | | | (30,092,583 | ) | | | | |
Decrease in payable for floating rate | | | (5,000,000 | ) | | | | |
| | | | | | | | |
Net increase in cash from financing activities | | | | | | | 418,682,270 | |
| | | | | | | | |
Net change in cash | | | | | | | | |
Cash at beginning of year | | | | | | | — | |
| | | | | | | | |
Cash at end of year | | | | | | $ | — | |
| | | | | | | | |
** Reinvestment of dividends | | | 42,648,134 | | | | | |
Supplemental disclosure of cash flow information: | | | | | | | | |
Interest expense paid during the year | | | 1,279,346 | | | | | |
| * | | In accordance with U.S. GAAP, the Portfolio has included a Statement of Cash Flows as a result of its substantial investments in floating rate notes and Level 3 securities throughout the year. |
See notes to financial statements.
| | | | |
| AB MUNICIPAL INCOME FUND • | | | 111 | |
Statement of Cash Flows
NOTES TO FINANCIAL STATEMENTS
May 31, 2015
NOTE A
Significant Accounting Policies
AB Municipal Income Fund, Inc. (the “Fund”) is registered under the Investment Company Act of 1940 as an open-end management investment company. Prior to January 20, 2015, the Fund was known as AllianceBernstein Municipal Income Fund, Inc. The Fund, which is a Maryland corporation, operates as a series company currently comprised of the diversified AB National Portfolio, AB High Income Municipal Portfolio, AB California Portfolio and AB New York Portfolio (the “Portfolios”). Each series is considered to be a separate entity for financial reporting and tax purposes. The AB National Portfolio, AB California Portfolio and AB New York Portfolio offer Class A, Class B, Class C and Advisor Class shares. The AB High Income Municipal Portfolio offers Class A, Class C and Advisor Class shares. Class A shares are sold with a front-end sales charge of up to 3% for purchases up to $500,000; purchases of $500,000 or more are not subject to a sales charge. With respect to purchases of $500,000 or more, Class A shares redeemed within one year of purchase may be subject to a contingent deferred sales charge of 1%. Class B shares are currently sold with a contingent deferred sales charge which declines from 3% to zero depending on the period of time the shares are held. Effective January 31, 2009, sales of Class B shares of the Portfolios to new investors were suspended. Class B shares will only be issued (i) upon the exchange of Class B shares from another AB Mutual Fund, (ii) for purposes of dividend reinvestment, (iii) through the Portfolios’ Automatic Investment Program (the “Program”) for accounts that established the Program prior to January 31, 2009, and (iv) for purchases of additional shares by Class B shareholders as of January 31, 2009. The ability to establish a new Program for accounts containing Class B shares was suspended as of January 31, 2009. Class B shares will automatically convert to Class A shares six years after the end of the calendar month of purchase. Class C shares are subject to a contingent deferred sales charge of 1% on redemptions made within the first year after purchase. Advisor Class shares are sold without any initial or contingent deferred sales charge and are not subject to ongoing distribution expenses. All four classes of shares have identical voting, dividend, liquidation and other rights, except that the classes bear different distribution and transfer agency expenses. Each class has exclusive voting rights with respect to its distribution plan. The financial statements have been prepared in conformity with U.S. generally accepted accounting principles (“U.S. GAAP”) which require management to make certain estimates and assumptions that affect the reported amounts of assets and liabilities in the financial statements and amounts of income and expenses during the reporting period. Actual results could differ from those estimates. The Fund is an investment company under U.S. GAAP and follows the accounting and reporting guidance applicable to investment companies. The following is a summary of significant accounting policies followed by the Portfolios.
| | |
| 112 | | • AB MUNICIPAL INCOME FUND |
Notes to Financial Statements
1. Security Valuation
Portfolio securities are valued at their current market value determined on the basis of market quotations or, if market quotations are not readily available or are deemed unreliable, at “fair value” as determined in accordance with procedures established by and under the general supervision of the Fund’s Board of Directors (the “Board”).
In general, the market values of securities which are readily available and deemed reliable are determined as follows: securities listed on a national securities exchange (other than securities listed on the NASDAQ Stock Market, Inc. (“NASDAQ”)) or on a foreign securities exchange are valued at the last sale price at the close of the exchange or foreign securities exchange. If there has been no sale on such day, the securities are valued at the last traded price from the previous day. Securities listed on more than one exchange are valued by reference to the principal exchange on which the securities are traded; securities listed only on NASDAQ are valued in accordance with the NASDAQ Official Closing Price; listed or over the counter (“OTC”) market put or call options are valued at the mid level between the current bid and ask prices. If either a current bid or current ask price is unavailable, AllianceBernstein L.P. (the “Adviser”) will have discretion to determine the best valuation (e.g. last trade price in the case of listed options); open futures are valued using the closing settlement price or, in the absence of such a price, the most recent quoted bid price. If there are no quotations available for the day of valuation, the last available closing settlement price is used; U.S. Government securities and any other debt instruments having 60 days or less remaining until maturity are generally valued at market by an independent pricing vendor, if a market price is available. If a market price is not available, the securities are valued at amortized cost. This methodology is commonly used for short term securities that have an original maturity of 60 days or less, as well as short term securities that had an original term to maturity that exceeded 60 days. In instances when amortized cost is utilized, the Valuation Committee (the “Committee”) must reasonably conclude that the utilization of amortized cost is approximately the same as the fair value of the security. Such factors the Committee will consider include, but are not limited to, an impairment of the creditworthiness of the issuer or material changes in interest rates. Fixed-income securities, including mortgage-backed and asset-backed securities, may be valued on the basis of prices provided by a pricing service or at a price obtained from one or more of the major broker-dealers. In cases where broker-dealer quotes are obtained, the Adviser may establish procedures whereby changes in market yields or spreads are used to adjust, on a daily basis, a recently obtained quoted price on a security. Swaps and other derivatives are valued daily, primarily using independent pricing services, independent pricing models using market inputs, as well as third party broker-dealers or counterparties. Investment companies are valued at their net asset value each day.
| | | | |
| AB MUNICIPAL INCOME FUND • | | | 113 | |
Notes to Financial Statements
Securities for which market quotations are not readily available (including restricted securities) or are deemed unreliable are valued at fair value. Factors considered in making this determination may include, but are not limited to, information obtained by contacting the issuer, analysts, analysis of the issuer’s financial statements or other available documents. In addition, the Portfolios may use fair value pricing for securities primarily traded in non-U.S. markets because most foreign markets close well before the Portfolios value their securities at 4:00 p.m., Eastern Time. The earlier close of these foreign markets gives rise to the possibility that significant events, including broad market moves, may have occurred in the interim and may materially affect the value of those securities.
2. Fair Value Measurements
In accordance with U.S. GAAP regarding fair value measurements, fair value is defined as the price that the Portfolios would receive to sell an asset or pay to transfer a liability in an orderly transaction between market participants at the measurement date. U.S. GAAP establishes a framework for measuring fair value, and a three-level hierarchy for fair value measurements based upon the transparency of inputs to the valuation of an asset or liability (including those valued based on their market values as described in Note A.1 above). Inputs may be observable or unobservable and refer broadly to the assumptions that market participants would use in pricing the asset or liability. Observable inputs reflect the assumptions market participants would use in pricing the asset or liability based on market data obtained from sources independent of the Portfolios. Unobservable inputs reflect the Portfolios’ own assumptions about the assumptions that market participants would use in pricing the asset or liability based on the best information available in the circumstances. Each investment is assigned a level based upon the observability of the inputs which are significant to the overall valuation. The three-tier hierarchy of inputs is summarized below.
| | • | | Level 1—quoted prices in active markets for identical investments |
| | • | | Level 2—other significant observable inputs (including quoted prices for similar investments, interest rates, prepayment speeds, credit risk, etc.) |
| | • | | Level 3—significant unobservable inputs (including the Portfolios’ own assumptions in determining the fair value of investments) |
The fair value of debt instruments, such as bonds, and over-the-counter derivatives is generally based on market price quotations, recently executed market transactions (where observable) or industry recognized modeling techniques and are generally classified as Level 2. Pricing vendor inputs to Level 2 valuations may include quoted prices for similar investments in active markets, interest rate curves, coupon rates, currency rates, yield curves, option adjusted spreads, default rates, credit spreads and other unique security features in order to estimate the relevant cash flows which are then discounted to calculate fair values. If these inputs are unobservable and significant to the fair value, these investments will be classified as Level 3. In addition, non-agency rated investments are classified as Level 3.
| | |
| 114 | | • AB MUNICIPAL INCOME FUND |
Notes to Financial Statements
Other fixed income investments, including non-U.S. government and corporate debt, are generally valued using quoted market prices, if available, which are typically impacted by current interest rates, maturity dates and any perceived credit risk of the issuer. Additionally, in the absence of quoted market prices, these inputs are used by pricing vendors to derive a valuation based upon industry or proprietary models which incorporate issuer specific data with relevant yield/spread comparisons with more widely quoted bonds with similar key characteristics. Those investments for which there are observable inputs are classified as Level 2. Where the inputs are not observable, the investments are classified as Level 3.
The following tables summarize the valuation of the Portfolios’ investments by the above fair value hierarchy levels as of May 31, 2015:
| | | | | | | | | | | | | | | | |
| AB National Portfolio | | | | | | | | | | |
Investments in
Securities: | | Level 1 | | | Level 2 | | | Level 3 | | | Total | |
Assets: | | | | | | | | | | | | | | | | |
Long-Term Municipal Bonds | | $ | – 0 | – | | $ | 995,605,914 | | | $ | 50,875,335 | | | $ | 1,046,481,249 | |
Short-Term Investments | | | 12,811,579 | | | | – 0 | – | | | – 0 | – | | | 12,811,579 | |
| | | | | | | | | | | | | | | | |
Total Investments in Securities | | | 12,811,579 | | | | 995,605,914 | | | | 50,875,335 | | | | 1,059,292,828 | |
Other Financial Instruments*: | | | | | | | | | | | | | | | | |
Assets: | | | | | | | | | | | | | | | | |
Interest Rate Swaps | | | – 0 | – | | | 370,060 | | | | – 0 | – | | | 370,060 | |
Liabilities | | | – 0 | – | | | – 0 | – | | | – 0 | – | | | – 0 | – |
| | | | | | | | | | | | | | | | |
Total^ | | $ | 12,811,579 | | | $ | 995,975,974 | | | $ | 50,875,335 | | | $ | 1,059,662,888 | |
| | | | | | | | | | | | | | | | |
| | | | | | | | | | | | | | | | |
| AB High Income Municipal Portfolio | | | | |
Investments in
Securities: | | Level 1 | | | Level 2 | | | Level 3 | | | Total | |
Assets: | | | | | | | | | | | | | | | | |
Long-Term Municipal Bonds: | | | | | | | | | | | | | | | | |
Alaska | | $ | – 0 | – | | $ | – 0 | – | | $ | 5,272,040 | | | $ | 5,272,040 | |
Arizona | | | – 0 | – | | | 27,305,596 | | | | 13,193,263 | | | | 40,498,859 | |
California | | | – 0 | – | | | 165,700,451 | | | | 64,722,517 | | | | 230,422,968 | |
Colorado | | | – 0 | – | | | 23,239,481 | | | | 9,490,392 | | | | 32,729,873 | |
Florida | | | – 0 | – | | | 89,590,717 | | | | 26,488,757 | | | | 116,079,474 | |
Idaho | | | – 0 | – | | | 4,769,680 | | | | 8,268,405 | | | | 13,038,085 | |
Illinois | | | – 0 | – | | | 90,967,109 | | | | 55,542,778 | | | | 146,509,887 | |
Kentucky | | | – 0 | – | | | 41,728,904 | | | | 10,278,696 | | | | 52,007,600 | |
Louisiana | | | – 0 | – | | | 28,609,137 | | | | 37,479,848 | | | | 66,088,985 | |
Maryland | | | – 0 | – | | | – 0 | – | | | 5,598,018 | | | | 5,598,018 | |
Massachusetts | | | – 0 | – | | | 27,319,172 | | | | 6,241,950 | | | | 33,561,122 | |
Michigan | | | – 0 | – | | | 79,365,473 | | | | 17,234,786 | | | | 96,600,259 | |
Minnesota | | | – 0 | – | | | 3,400,740 | | | | 4,094,890 | | | | 7,495,630 | |
New Jersey | | | – 0 | – | | | 111,206,265 | | | | 3,904,268 | | | | 115,110,533 | |
| | | | |
| AB MUNICIPAL INCOME FUND • | | | 115 | |
Notes to Financial Statements
| | | | | | | | | | | | | | | | |
| AB High Income Municipal Portfolio | | | | |
Investments in
Securities: | | Level 1 | | | Level 2 | | | Level 3 | | | Total | |
New York | | $ | – 0 | – | | $ | 172,580,553 | | | $ | 43,622,353 | | | $ | 216,202,906 | |
North Carolina | | | – 0 | – | | | – 0 | – | | | 8,149,064 | | | | 8,149,064 | |
Ohio | | | – 0 | – | | | 68,176,623 | | | | 21,353,002 | | | | 89,529,625 | |
Oklahoma | | | – 0 | – | | | – 0 | – | | | 7,218,301 | | | | 7,218,301 | |
Oregon | | | – 0 | – | | | 20,296,672 | | | | 11,787,810 | | | | 32,084,482 | |
Pennsylvania | | | – 0 | – | | | 51,456,615 | | | | 19,075,679 | | | | 70,532,294 | |
Rhode Island | | | – 0 | – | | | – 0 | – | | | 9,663,990 | | | | 9,663,990 | |
Tennessee | | | – 0 | – | | | 7,877,401 | | | | 14,245,201 | | | | 22,122,602 | |
Texas | | | – 0 | – | | | 119,437,849 | | | | 47,187,534 | | | | 166,625,383 | |
Utah | | | – 0 | – | | | 4,950,130 | | | | 8,905,297 | | | | 13,855,427 | |
Vermont | | | – 0 | – | | | – 0 | – | | | 3,175,206 | | | | 3,175,206 | |
Virginia | | | – 0 | – | | | 83,507,461 | | | | 21,632,392 | | | | 105,139,853 | |
Washington | | | – 0 | – | | | 67,006,165 | | | | 37,674,466 | | | | 104,680,631 | |
Wisconsin | | | – 0 | – | | | 11,009,896 | | | | 2,749,465 | | | | 13,759,361 | |
Other | | | – 0 | – | | | 267,157,736 | | | | – 0 | – | | | 267,157,736 | |
Short-Term Municipal Notes | | | – 0 | – | | | 79,610,000 | | | | – 0 | – | | | 79,610,000 | |
Options Purchased – Puts | | | – 0 | – | | | 331,938 | | | | – 0 | – | | | 331,938 | |
Short-Term Investments | | | 9,808,372 | | | | – 0 | – | | | – 0 | – | | | 9,808,372 | |
| | | | | | | | | | | | | | | | |
Total Investments in Securities | | | 9,808,372 | | | | 1,646,601,764 | | | | 524,250,368 | | | | 2,180,660,504 | |
Other Financial Instruments*: | | | | | | | | | | | | | | | | |
Assets: | | | | | | | | | | | | | | | | |
Centrally Cleared Credit Default Swaps | | | – 0 | – | | | 1,004,286 | | | | – 0 | – | | | 1,004,286 | # |
Interest Rate Swaps | | | – 0 | – | | | 1,880,977 | | | | – 0 | – | | | 1,880,977 | |
Liabilities: | | | | | | | | | | | | | | | | |
Centrally Cleared Interest Rate Swaps | | | – 0 | – | | | (147,187 | ) | | | – 0 | – | | | (147,187 | )# |
Interest Rate Swaps | | | – 0 | – | | | (1,972,286 | ) | | | – 0 | – | | | (1,972,286 | ) |
| | | | | | | | | | | | | | | | |
Total^ | | $ | 9,808,372 | | | $ | 1,647,367,554 | | | $ | 524,250,368 | | | $ | 2,181,426,294 | |
| | | | | | | | | | | | | | | | |
| | | | | | | | | | | | | | | | |
| AB California Portfolio | |
Investments in
Securities: | | Level 1 | | | Level 2 | | | Level 3 | | | Total | |
Assets: | | | | | | | | | | | | | | | | |
Long-Term Municipal Bonds | | $ | – 0 | – | | $ | 573,733,211 | | | $ | 32,737,837 | | | $ | 606,471,048 | |
Short-Term Investments | | | 16,125,713 | | | | – 0 | – | | | – 0 | – | | | 16,125,713 | |
| | | | | | | | | | | | | | | | |
Total Investments in Securities | | | 16,125,713 | | | | 573,733,211 | | | | 32,737,837 | | | | 622,596,761 | |
| | |
| 116 | | • AB MUNICIPAL INCOME FUND |
Notes to Financial Statements
| | | | | | | | | | | | | | | | |
| AB California Portfolio | |
Investments in
Securities: | | Level 1 | | | Level 2 | | | Level 3 | | | Total | |
Other Financial Instruments*: | | | | | | | | | | | | | | | | |
Assets: | | | | | | | | | | | | | | | | |
Interest Rate Swaps | | $ | – 0 | – | | $ | 1,733,862 | | | $ | – 0 | – | | $ | 1,733,862 | |
Liabilities: | | | | | | | | | | | | | | | | |
Interest Rate Swaps | | | – 0 | – | | | (7,620,163 | ) | | | – 0 | – | | | (7,620,163 | ) |
| | | | | | | | | | | | | | | | |
Total^ | | $ | 16,125,713 | | | $ | 567,846,910 | | | $ | 32,737,837 | | | $ | 616,710,460 | |
| | | | | | | | | | | | | | | | |
|
| AB New York Portfolio | |
Investments in
Securities: | | Level 1 | | | Level 2 | | | Level 3 | | | Total | |
Assets: | | | | | | | | | | | | | | | | |
Long-Term Municipal Bonds | | $ | – 0 | – | | $ | 499,169,217 | | | $ | 12,933,967 | | | $ | 512,103,184 | |
Short-Term Investments | | | 18,572,175 | | | | – 0 | – | | | – 0 | – | | | 18,572,175 | |
| | | | | | | | | | | | | | | | |
Total Investments in Securities | | | 18,572,175 | | | | 499,169,217 | | | | 12,933,967 | | | | 530,675,359 | |
Other Financial Instruments*: | | | | | | | | | | | | | | | | |
Assets: | | | | | | | | | | | | | | | | |
Interest Rate Swaps | | | – 0 | – | | | 525,214 | | | | – 0 | – | | | 525,214 | |
Liabilities | | | – 0 | – | | | – 0 | – | | | – 0 | – | | | – 0 | – |
| | | | | | | | | | | | | | | | |
Total^ | | $ | 18,572,175 | | | $ | 499,694,431 | | | $ | 12,933,967 | | | $ | 531,200,573 | |
| | | | | | | | | | | | | | | | |
| * | | Other financial instruments are derivative instruments, such as futures, forwards and swaps, which are valued at the unrealized appreciation/depreciation on the instrument. |
| # | | Only variation margin receivable/payable at period end is reported within the statement of assets and liabilities. This amount reflects cumulative appreciation/(depreciation) of exchange-traded derivatives as reported in the portfolio of investments. |
| ^ | | There were no transfers between Level 1 and Level 2 during the reporting period. |
The Portfolios recognize all transfers between levels of the fair value hierarchy assuming the financial instruments were transferred at the beginning of the reporting period.
| | | | |
| AB MUNICIPAL INCOME FUND • | | | 117 | |
Notes to Financial Statements
The following is a reconciliation of investments in which significant unobservable inputs (Level 3) were used in determining fair value.
| | | | | | | | |
AB National Portfolio | | Long-Term
Municipal Bonds | | | Total | |
Balance as of 10/31/14 | | $ | 55,371,267 | | | $ | 55,371,267 | |
Accrued discounts/(premiums) | | | 194,253 | | | | 194,253 | |
Realized gain (loss) | | | 367,018 | | | | 367,018 | |
Change in unrealized appreciation/depreciation | | | (912,222 | ) | | | (912,222 | ) |
Purchases | | | 4,228,040 | | | | 4,228,040 | |
Sales | | | (7,709,414 | ) | | | (7,709,414 | ) |
Transfers in to Level 3 | | | 3,002,639 | | | | 3,002,639 | |
Transfers out of Level 3 | | | (3,666,246 | ) | | | (3,666,246 | ) |
| | | | | | | | |
Balance as of 5/31/15 | | $ | 50,875,335 | | | $ | 50,875,335 | + |
| | | | | | | | |
Net change in unrealized appreciation/depreciation from Investments held as of 5/31/15* | | $ | (539,846 | ) | | $ | (539,846 | ) |
| | | | | | | | |
| | |
AB High Income Municipal Portfolio | | Long-Term
Municipal Bonds | | | Total | |
Balance as of 10/31/14 | | $ | 469,124,243 | | | $ | 469,124,243 | |
Accrued discounts/(premiums) | | | 209,361 | | | | 209,361 | |
Realized gain (loss) | | | 669,810 | | | | 669,810 | |
Change in unrealized appreciation/depreciation | | | 1,052,796 | | | | 1,052,796 | |
Purchases | | | 63,470,314 | | | | 63,470,314 | |
Sales | | | (21,430,016 | ) | | | (21,430,016 | ) |
Transfers in to Level 3 | | | 11,153,860 | | | | 11,153,860 | |
Transfers out of Level 3 | | | – 0 | – | | | – 0 | – |
| | | | | | | | |
Balance as of 5/31/15 | | $ | 524,250,368 | | | $ | 524,250,368 | + |
| | | | | | | | |
Net change in unrealized appreciation/depreciation from Investments held as of 5/31/15* | | $ | 743,062 | | | $ | 743,062 | |
| | | | | | | | |
| | |
AB California Portfolio | | Long-Term
Municipal Bonds | | | Total | |
Balance as of 10/31/14 | | $ | 20,095,855 | | | $ | 20,095,855 | |
Accrued discounts/(premiums) | | | (8,364 | ) | | | (8,364 | ) |
Realized gain (loss) | | | 52,433 | | | | 52,433 | |
Change in unrealized appreciation/depreciation | | | (933,219 | ) | | | (933,219 | ) |
Purchases | | | 13,820,095 | | | | 13,820,095 | |
Sales | | | (5,025,000 | ) | | | (5,025,000 | ) |
Transfers in to Level 3 | | | 4,736,037 | | | | 4,736,037 | |
Transfers out of Level 3 | | | – 0 | – | | | – 0 | – |
| | | | | | | | |
Balance as of 5/31/15 | | $ | 32,737,837 | | | $ | 32,737,837 | + |
| | | | | | | | |
Net change in unrealized appreciation/depreciation from Investments held as of 5/31/15* | | $ | (902,766 | ) | | $ | (902,766 | ) |
| | | | | | | | |
| | |
| 118 | | • AB MUNICIPAL INCOME FUND |
Notes to Financial Statements
| | | | | | | | |
AB New York Portfolio | | Long-Term
Municipal Bonds | | | Total | |
Balance as of 10/31/14 | | $ | 19,580,785 | | | $ | 19,580,785 | |
Accrued discounts/(premiums) | | | 15,390 | | | | 15,390 | |
Realized gain (loss) | | | (125,493 | ) | | | (125,493 | ) |
Change in unrealized appreciation/depreciation | | | 234,700 | | | | 234,700 | |
Purchases | | | 2,638,899 | | | | 2,638,899 | |
Sales | | | (7,934,624 | ) | | | (7,934,624 | ) |
Transfers in to Level 3 | | | 1,038,283 | | | | 1,038,283 | |
Transfers out of Level 3 | | | (2,513,973 | ) | | | (2,513,973 | ) |
| | | | | | | | |
Balance as of 5/31/15 | | $ | 12,933,967 | | | $ | 12,933,967 | + |
| | | | | | | | |
Net change in unrealized appreciation/depreciation from Investments held as of 5/31/15* | | $ | 65,355 | | | $ | 65,355 | |
| | | | | | | | |
| + | | There were de minimis transfers under 1% of net assets during the reporting period. |
| * | | The unrealized appreciation/depreciation is included in net change in unrealized appreciation/depreciation of investments in the accompanying statement of operations. |
As of May 31, 2015, all Level 3 securities were priced by third party vendors or using prior transaction, which approximates fair value.
The Adviser established the Committee to oversee the pricing and valuation of all securities held in the Portfolios. The Committee operates under pricing and valuation policies and procedures established by the Adviser and approved by the Board, including pricing policies which set forth the mechanisms and processes to be employed on a daily basis to implement these policies and procedures. In particular, the pricing policies describe how to determine market quotations for securities and other instruments. The Committee’s responsibilities include: 1) fair value and liquidity determinations (and oversight of any third parties to whom any responsibility for fair value and liquidity determinations is delegated), and 2) regular monitoring of the Adviser’s pricing and valuation policies and procedures and modification or enhancement of these policies and procedures (or recommendation of the modification of these policies and procedures) as the Committee believes appropriate.
The Committee is also responsible for monitoring the implementation of the pricing policies by the Adviser’s Pricing Group (the “Pricing Group”) and a third party which performs certain pricing functions in accordance with the pricing policies. The Pricing Group is responsible for the oversight of the third party on a day-to-day basis. The Committee and the Pricing Group perform a series of activities to provide reasonable assurance of the accuracy of prices including: 1) periodic vendor due diligence meetings, review of methodologies, new developments and processes at vendors, 2) daily comparison of security valuation versus prior day for all securities that exceeded established thresholds, and 3) daily review of unpriced, stale, and variance reports with exceptions reviewed by senior management and the Committee.
| | | | |
| AB MUNICIPAL INCOME FUND • | | | 119 | |
Notes to Financial Statements
In addition, several processes outside of the pricing process are used to monitor valuation issues including: 1) performance and performance attribution reports are monitored for anomalous impacts based upon benchmark performance, and 2) portfolio managers review all portfolios for performance and analytics (which are generated using the Adviser’s prices).
3. Taxes
It is each Portfolio’s policy to meet the requirements of the Internal Revenue Code applicable to regulated investment companies and to distribute all of its investment company taxable income and net realized gains, if any, to shareholders. Therefore, no provisions for federal income or excise taxes are required.
In accordance with U.S. GAAP requirements regarding accounting for uncertainties in income taxes, management has analyzed the Portfolios’ tax positions taken or expected to be taken on federal and state income tax returns for all open tax years (the current and the prior three tax years) and has concluded that no provision for income tax is required in the Portfolios’ financial statements.
4. Investment Income and Investment Transactions
Dividend income is recorded on the ex-dividend date or as soon as the Portfolio is informed of the dividend. Interest income is accrued daily. Investment transactions are accounted for on the date the securities are purchased or sold. Each Portfolio may buy and sell securities from other affiliated funds in accordance with the requirements of Rule 17a-7 of the Investment Company Act of 1940. Each Portfolio has adopted procedures to ensure that all such transactions are done in accordance with the requirements of
Rule 17a-7. Investment gains and losses are determined on the identified cost basis. The Portfolios amortize premiums and accrete original issue discount and market discount as adjustments to interest income.
5. Class Allocations
All income earned and expenses incurred by the Portfolios are borne on a pro-rata basis by each settled class of shares, based on the proportionate interest in each Portfolio represented by the net assets of such class, except for class specific expenses which are allocated to the respective class. Expenses of the Fund are charged proportionately to each Portfolio or based on other appropriate methods. Realized and unrealized gains and losses are allocated among the various share classes based on respective net assets.
6. Dividends and Distributions
Dividends and distributions to shareholders, if any, are recorded on the ex-dividend date. Income dividends and capital gains distributions are determined in accordance with federal tax regulations and may differ from those determined in accordance with U.S. GAAP. To the extent these differences are permanent, such amounts are reclassified within the capital accounts based on their federal tax basis treatment; temporary differences do not require such reclassification.
| | |
| 120 | | • AB MUNICIPAL INCOME FUND |
Notes to Financial Statements
7. Change of Fiscal Year End
The Fund changed its fiscal year end from October 31 to May 31. Accordingly, the statements of operations, the statements of changes in net assets, the statement of cash flows and financial highlights reflect the period from November 1, 2014 to May 31, 2015.
NOTE B
Advisory, Administrative Fees and Other Transactions with Affiliates
Under the terms of the investment advisory agreement, the Portfolios pay the Adviser at the annual rates as follows:
| | | | | | | | | | | | |
| | | Average Daily Net Assets | |
| Portfolio | | First $2.5 Billion | | | Next $2.5 Billion | | | In Excess of $5 Billion | |
AB National | | | .45 | % | | | .40 | % | | | .35 | % |
AB High Income Municipal | | | .50 | % | | | .45 | % | | | .40 | % |
AB California | | | .45 | % | | | .40 | % | | | .35 | % |
AB New York | | | .45 | % | | | .40 | % | | | .35 | % |
Such fees are accrued daily and paid monthly.
The Adviser has agreed to waive its fees and bear certain expenses to the extent necessary to limit the total operating expenses (excluding interest expense, brokerage commissions and other transaction costs, taxes and extraordinary expenses) on an annual basis (the “Expense Caps”) as follows:
| | | | | | | | | | | | | | | | |
| | | Effective January 30, 2015(a) | |
| Portfolio | | Class A | | | Class B | | | Class C | | | Advisor
Class | |
AB National | | | .75 | % | | | 1.50 | % | | | 1.50 | % | | | .50 | % |
AB California | | | .75 | % | | | 1.50 | % | | | 1.50 | % | | | .50 | % |
AB New York | | | .75 | % | | | 1.50 | % | | | 1.50 | % | | | .50 | % |
| | | | | | | | | | | | |
| | | Effective January 30, 2015(b) | |
| Portfolio | | Class A | | | Class C | | | Advisor
Class | |
AB High Income Municipal | | | .80 | % | | | 1.55 | % | | | .55 | % |
This contractual agreement extends through January 30, 2016 for all Portfolios and may be extended by the Adviser for additional one year terms.
| (a) | | Prior to January 30, 2015, the Expense Caps were .80%, 1.50%, 1.50% and .50% for Class A, Class B, Class C and Advisor Class shares, respectively. Prior to February 1, 2013, the Expense Caps were .75%, 1.45%, 1.45% and .45% for Class A, Class B, Class C and Advisor Class shares, respectively. |
| (b) | | Prior to January 30, 2015, the Expense Caps were .80%, 1.50% and ..50% for Class A, Class C and Advisor Class shares, respectively |
| | | | |
| AB MUNICIPAL INCOME FUND • | | | 121 | |
Notes to Financial Statements
For the period ended May 31, 2015, such reimbursements amounted to $287,952, $400,402, $159,110 and $202,485 for AB National, AB High Income Municipal, AB California and AB New York Portfolios, respectively. For the year ended October 31, 2014, such reimbursements amounted to $481,922, $1,149,892, $283,721 and $356,372 for AB National, AB High Income Municipal, AB California and AB New York Portfolios, respectively.
Pursuant to the investment advisory agreement, each Portfolio may reimburse the Adviser for certain legal and accounting services provided to each Portfolio by the Adviser. For the period ended May 31, 2015, the reimbursement for such services amounted to $29,090, $28,559 $28,887 and $29,090 for AB National, AB High Income Municipal, AB California and AB New York Portfolios, respectively. For the year ended October 31, 2014, the reimbursement for such services amounted to $55,614, $54,934 $54,807 and $55,614 for AB National, AB High Income Municipal, AB California and AB New York Portfolios, respectively.
During the year ended October 31, 2014, the Adviser reimbursed the AB High Income Municipal Portfolio $17,472 for trading losses incurred due to a trade entry error.
The Portfolios compensate AllianceBernstein Investor Services, Inc. (“ABIS”), a wholly-owned subsidiary of the Adviser, under a Transfer Agency Agreement for providing personnel and facilities to perform transfer agency services for the Portfolios. ABIS may make payments to intermediaries that provide omnibus account services, sub-accounting services and/or networking services. Such compensation retained by ABIS amounted to: AB National Portfolio, $91,743; AB High Income Municipal Portfolio, $86,987; AB California Portfolio, $40,198 and AB New York Portfolio, $46,768 for the period ended May 31, 2015. AB National Portfolio, $161,095; AB High Income Municipal Portfolio, $122,270; AB California Portfolio, $73,704 and AB New York Portfolio, $88,835 for the year ended October 31, 2014.
| | |
| 122 | | • AB MUNICIPAL INCOME FUND |
Notes to Financial Statements
AllianceBernstein Investments, Inc. (the “Distributor”), a wholly-owned subsidiary of the Adviser, serves as the distributor of the Portfolios’ shares. The Distributor has advised the Portfolios that it has retained front-end sales charges from the sale of Class A shares and received contingent deferred sales charges imposed upon redemptions by shareholders of Class A, Class B and Class C shares for each Portfolio for the period ended May 31, 2015 and the year ended October 31, 2014 as follows:
| | | | | | | | | | | | | | | | | | | | | | | | | | | | | | | | |
| | | Front-End
Sales Charges | | | Contingent Deferred Sales Charges | |
| Portfolio | | Class A | | | Class A | | | Class B | | | Class C | |
| | | 2015 | | | 2014 | | | 2015 | | | 2014 | | | 2015 | | | 2014 | | | 2015 | | | 2014 | |
AB National | | $ | – 0 | – | | $ | – 0 | – | | $ | 4,897 | | | $ | 12,238 | | | $ | 30 | | | $ | 200 | | | $ | 6,797 | | | $ | 14,886 | |
AB High Income Municipal | | | – 0 | – | | | – 0 | – | | | 36,097 | | | | 79,584 | | | | – 0 | – | | | – 0 | – | | | 36,026 | | | | 62,053 | |
AB California | | | 291 | | | | – 0 | – | | | 161 | | | | 6,786 | | | | 19 | | | | – 0 | – | | | 645 | | | | 1,701 | |
AB New York | | | – 0 | – | | | – 0 | – | | | 2,699 | | | | 60,639 | | | | 728 | | | | 490 | | | | 1,899 | | | | 4,998 | |
The Portfolios may invest in the AB Fixed-Income Shares, Inc. – Government STIF Portfolio (“Government STIF Portfolio”), an open-end management investment company managed by the Adviser. The Government STIF Portfolio is offered as a cash management option to mutual funds and other institutional accounts of the Adviser, and is not available for direct purchase by members of the public. The Government STIF Portfolio pays no investment management fees but does bear its own expenses. A summary of the Portfolios’ transactions in shares of the Government STIF Portfolio for the period ended May 31, 2015 is as follows:
| | | | | | | | | | | | | | | | | | | | |
| Portfolio | | Market Value October 31,
2014 (000) | | | Purchases at Cost (000) | | | Sales Proceeds (000) | | | Market Value May 31,
2015 (000) | | | Dividend Income(a) (000) | |
AB National | | $ | – 0 | – | | $ | 109,235 | | | $ | 96,423 | | | $ | 12,812 | | | $ | 3 | |
AB High Income Municipal | | | 16,080 | | | | 381,504 | | | | 387,776 | | | | 9,808 | | | | 27 | |
AB California | | | – 0 | – | | | 71,853 | | | | 55,727 | | | | 16,126 | | | | 3 | |
AB New York | | | 1,337 | | | | 47,328 | | | | 30,093 | | | | 18,572 | | | | 1 | |
| (a) | | For the year ended October 31, 2014, the AB National, AB High Income Municipal, AB California and AB New York Portfolios received dividend income of $6,311, $34,226, $1,665 and $2,850, respectively. |
| | | | |
| AB MUNICIPAL INCOME FUND • | | | 123 | |
Notes to Financial Statements
NOTE C
Distribution Services Agreement
The Portfolios have adopted a Distribution Services Agreement (the “Agreement”) pursuant to Rule 12b-1 under the Investment Company Act of 1940. Under the Agreement, the Portfolios pay distribution and servicing fees to the Distributor at an annual rate of .25 of 1% of the Portfolios’ average daily net assets attributable to Class A shares and 1% of the Portfolios’ average daily net assets attributable to both Class B and Class C shares. There are no distribution and servicing fees on the Advisor Class shares. Prior to January 30, 2015, the Portfolios paid distribution and servicing fees to the Distributor at an annual rate of up to .30% of 1% of the Class A shares’ average daily net assets. The fees are accrued daily and paid monthly. The Agreement provides that the Distributor will use such payments in their entirety for distribution assistance and promotional activities. Since the commencement of the Portfolios’ operations, the distributor has incurred expenses in excess of the distribution costs reimbursed by each Portfolio for the period ended May 31, 2015 and the year ended October 31, 2014 as follows:
| | | | | | | | | | | | | | | | |
Portfolio | | Class B | | | Class C | |
| | | 2015 | | | 2014 | | | 2015 | | | 2014 | |
AB National | | $ | 3,388,020 | | | $ | 3,391,514 | | | $ | 6,315,740 | | | $ | 6,169,708 | |
AB High Income Municipal | | | – 0 | – | | | – 0 | – | | | 1,811,545 | | | | 1,628,623 | |
AB California | | | 6,822,843 | | | | 6,823,512 | | | | 7,078,047 | | | | 6,979,560 | |
AB New York | | | 5,977,494 | | | | 5,982,464 | | | | 4,034,363 | | | | 3,952,871 | |
While such costs may be recovered from the Portfolios in future periods so long as the Agreement is in effect, the rate of the distribution and servicing fees payable under the Agreement may not be increased without a shareholder vote. In accordance with the Agreement, there is no provision for recovery of unreimbursed distribution costs incurred by the Distributor beyond the current fiscal year for Class A shares. The Agreement also provides that the Adviser may use its own resources to finance the distribution of the Portfolios’ shares.
NOTE D
Investment Transactions
Purchases and sales of investment and U.S. government securities (excluding short-term investments) for the period ended May 31, 2015, were as follows:
| | | | | | | | | | | | | | | | |
| | | Purchases | | | Sales | |
Portfolio | | Investments | | | Government
Securities | | | Investments | | | Government
Securities | |
AB National | | $ | 155,622,358 | | | $ | – 0 | – | | $ | 65,121,608 | | | $ | – 0 | – |
AB High Income Municipal | | | 318,980,876 | | | | – 0 | – | | | 182,405,376 | | | | – 0 | – |
AB California | | | 105,455,122 | | | | – 0 | – | | | 72,677,450 | | | | – 0 | – |
AB New York | | | 61,462,834 | | | | – 0 | – | | | 72,520,529 | | | | – 0 | – |
| | |
| 124 | | • AB MUNICIPAL INCOME FUND |
Notes to Financial Statements
The cost of investments for federal income tax purposes, gross unrealized appreciation and unrealized depreciation (excluding swap transactions) are as follows:
| | | | | | | | | | | | | | | | |
| | | | | | Gross Unrealized | | | Net
Unrealized
Appreciation | |
| Portfolio | | Cost | | | Appreciation | | | (Depreciation) | | |
AB National | | $ | 1,007,680,592 | | | $ | 54,589,724 | | | $ | (8,699,509 | ) | | $ | 45,890,215 | |
AB High Income Municipal | | | 1,918,776,693 | | | | 118,909,812 | | | | (17,086,485 | ) | | | 101,823,327 | |
AB California | | | 561,919,484 | | | | 57,287,941 | | | | (1,071,322 | ) | | | 56,216,619 | |
AB New York | | | 496,493,889 | | | | 30,101,693 | | | | (1,874,555 | ) | | | 28,227,138 | |
1. Derivative Financial Instruments
Each Portfolio may use derivatives in an effort to earn income and enhance returns, to replace more traditional direct investments, to obtain exposure to otherwise inaccessible markets (collectively, “investment purposes”), or to hedge or adjust the risk profile of its portfolio.
The principal types of derivatives utilized by the Portfolios, as well as the methods in which they may be used are:
For hedging and investment purposes, the Portfolios may purchase and write (sell) put and call options on U.S. and foreign government securities and foreign currencies that are traded on U.S. and foreign securities exchanges and over-the-counter markets.
The risk associated with purchasing an option is that the Portfolios pay a premium whether or not the option is exercised. Additionally, the Portfolios bear the risk of loss of the premium and change in market value should the counterparty not perform under the contract. Put and call options purchased are accounted for in the same manner as portfolio securities. The cost of securities acquired through the exercise of call options is increased by premiums paid. The proceeds from securities sold through the exercise of put options are decreased by the premiums paid.
The Portfolios may also invest in options on swaps, also called “swaptions”. A swaption is an option that gives the buyer the right, but not the obligation, to enter into a swap on a future date in exchange for paying a market-based “premium”. A receiver swaption gives the owner the right to receive the total return of a specified asset, reference rate, or index. A payer swaption gives the owner the right to pay the total return on a specified asset, reference rate, or index. Swaptions also include options that allow an existing swap to be terminated or extended by one of the counterparties.
When the Portfolios write an option, the premium received by the Portfolios is recorded as a liability and is subsequently adjusted to the current market value of the option written. Premiums received from
| | | | |
| AB MUNICIPAL INCOME FUND • | | | 125 | |
Notes to Financial Statements
written options which expire unexercised are recorded by the Portfolios on the expiration date as realized gains from options written. The difference between the premium received and the amount paid on effecting a closing purchase transaction, including brokerage commissions, is also treated as a realized gain, or if the premium received is less than the amount paid for the closing purchase transaction, as a realized loss. If a call option is exercised, the premium received is added to the proceeds from the sale of the underlying security or currency in determining whether the Portfolios have realized a gain or loss. If a put option is exercised, the premium received reduces the cost basis of the security or currency purchased by the Portfolios. In writing an option, the Portfolios bear the market risk of an unfavorable change in the price of the security or currency underlying the written option. Exercise of an option written by the Portfolios could result in the Portfolios selling or buying a security or currency at a price different from the current market value.
During the period ended May 31, 2015, the AB High Income Municipal Portfolio held written options for non-hedging purposes.
During the period ended May 31, 2015, the AB High Income Municipal Portfolio held purchased options for hedging purposes.
For the period ended May 31, 2015, the AB High Income Municipal Portfolio had the following transactions in written options:
| | | | | | | | |
| AB High Income Municipal Portfolio | | Notional
Amount | | | Premiums
Received | |
Swaptions written outstanding as of 10/31/14 | | | – 0 | – | | $ | – 0 | – |
Swaptions written | | | 100,000,000 | | | | 651,000 | |
Swaptions expired | | | – 0 | – | | | – 0 | – |
Swaptions bought back | | | (100,000,000 | ) | | | (651,000 | ) |
Swaptions exercised | | | – 0 | – | | | – 0 | – |
| | | | | | | | |
Swaptions written outstanding as of 5/31/15 | | | – 0 | – | | $ | – 0 | – |
| | | | | | | | |
Each Portfolio may enter into swaps to hedge their exposure to interest rates or credit risk. A swap is an agreement that obligates two parties to exchange a series of cash flows at specified intervals based upon or calculated by reference to changes in specified prices or rates for a specified amount of an underlying asset. The payment flows are usually netted against each other, with the difference being paid by one party to the other. In addition, collateral may be pledged or received by the Portfolio in accordance with the terms of the respective swaps to provide value and recourse to the Portfolio or its counterparties in the event of default, bankruptcy or insolvency by one of the parties to the swap.
| | |
| 126 | | • AB MUNICIPAL INCOME FUND |
Notes to Financial Statements
Risks may arise as a result of the failure of the counterparty to the swap to comply with the terms of the swap. The loss incurred by the failure of a counterparty is generally limited to the net interim payment to be received by the Portfolio, and/or the termination value at the end of the contract. Therefore, the Portfolio considers the creditworthiness of each counterparty to a swap in evaluating potential counterparty risk. This risk is mitigated by having a netting arrangement between the Portfolio and the counterparty and by the posting of collateral by the counterparty to the Portfolio to cover the Portfolio’s exposure to the counterparty. Additionally, risks may arise from unanticipated movements in interest rates or in the value of the underlying securities. The Portfolio accrues for the interim payments on swaps on a daily basis, with the net amount recorded within unrealized appreciation/depreciation of swaps on the statement of assets and liabilities, where applicable. Once the interim payments are settled in cash, the net amount is recorded as realized gain/(loss) on swaps on the statement of operations, in addition to any realized gain/(loss) recorded upon the termination of swaps. Upfront premiums paid or received in connection with credit default swap contracts are recognized as cost or proceeds on the statement of assets and liabilities and are amortized on a straight line basis over the life of the contract. Amortized upfront premiums are included in net realized gain/(loss) from swaps on the statement of operations. Fluctuations in the value of swaps are recorded as a component of net change in unrealized appreciation/depreciation of swaps on the statement of operations.
Certain standardized swaps, including certain interest rate swaps and credit default swaps, are (or soon will be) subject to mandatory central clearing. Cleared swaps are transacted through futures commission merchants (“FCMs”) that are members of central clearinghouses, with the clearinghouse serving as central counterparty, similar to transactions in futures contracts. Centralized clearing will be required for additional categories of swaps on a phased-in basis based on requirements published by the Securities and Exchange Commission and Commodity Futures Trading Commission.
At the time the Portfolio enters into a centrally cleared swap, the Portfolio deposits and maintains as collateral an initial margin with the broker, as required by the clearinghouse on which the transaction is effected. Such amount is shown as due from broker on the statement of assets and liabilities. Pursuant to the contract, the Portfolio agrees to receive from or pay to the broker an amount of cash equal to the daily fluctuation in the value of the contract. Such receipts or payments are known as variation margin and are recorded by the Portfolio as unrealized gains or losses. Risks may arise from the potential of a counterparty to meet the terms of the contract. The credit/counterparty risk for centrally cleared swaps is generally less than non-centrally cleared swaps, since the clearinghouse,
| | | | |
| AB MUNICIPAL INCOME FUND • | | | 127 | |
Notes to Financial Statements
which is the issuer or counterparty to each centrally cleared swap, has robust risk mitigation standards, including the requirement to provide initial and variation margin. When the contract is closed, the Portfolio records a realized gain or loss equal to the difference between the value of the contract at the time it was opened and the time it was closed.
Interest Rate Swaps:
Each Portfolio is subject to interest rate risk exposure in the normal course of pursuing its investment objectives. Because the Portfolio holds fixed rate bonds, the value of these bonds may decrease if interest rates rise. To help hedge against this risk and to maintain its ability to generate income at prevailing market rates, the Portfolio may enter into interest rate swaps. Interest rate swaps are agreements between two parties to exchange cash flows based on a notional amount. The Portfolio may elect to pay a fixed rate and receive a floating rate, or, receive a fixed rate and pay a floating rate on a notional amount.
In addition, each Portfolio may also enter into interest rate swap transactions to preserve a return or spread on a particular investment or portion of its portfolio, or protecting against an increase in the price of securities the Portfolio anticipates purchasing at a later date. Interest rate swaps involve the exchange by a Portfolio with another party of their respective commitments to pay or receive interest (e.g., an exchange of floating rate payments for fixed rate payments) computed based on a contractually-based principal (or “notional”) amount. Interest rate swaps are entered into on a net basis (i.e., the two payment streams are netted out, with the Portfolio receiving or paying, as the case may be, only the net amount of the two payments).
During the period ended May 31, 2015, the AB National Portfolio, AB High Income Municipal Portfolio, AB California Portfolio and AB New York Portfolio held interest rate swaps for hedging purposes.
Credit Default Swaps:
Each Portfolio may enter into credit default swaps, including to manage its exposure to the market or certain sectors of the market, to reduce its risk exposure to defaults by corporate and sovereign issuers held by the Portfolio, or to create exposure to corporate or sovereign issuers to which it is not otherwise exposed. The Portfolio may purchase credit protection (“Buy Contract”) or provide credit protection (“Sale Contract”) on the referenced obligation of the credit default swap. During the term of the swap, the Portfolio receives/(pays) fixed payments from/(to) the respective counterparty, calculated at the agreed upon rate applied to the notional amount. If the Portfolio is a buyer/(seller) of protection and a credit event occurs, as defined under the terms of the swap, the Portfolio will either (i) receive from the seller/(pay to the buyer) of protection an amount equal to the notional amount of the swap (the “Maximum Payout
| | |
| 128 | | • AB MUNICIPAL INCOME FUND |
Notes to Financial Statements
Amount”) and deliver/(take delivery of) the referenced obligation or (ii) receive/(pay) a net settlement amount in the form of cash or securities equal to the notional amount of the swap less the recovery value of the referenced obligation.
In certain circumstances Maximum Payout Amounts may be partially offset by recovery values of the respective referenced obligations, upfront premium received upon entering into the agreement, or net amounts received from settlement of buy protection credit default swaps entered into by the Portfolio for the same reference obligation with the same counterparty.
Credit default swaps may involve greater risks than if a Portfolio had invested in the referenced obligation directly. Credit default swaps are subject to general market risk, liquidity risk, counterparty risk and credit risk. If the Portfolio is a buyer of protection and no credit event occurs, it will lose the payments it made to its counterparty. If the Portfolio is a seller of protection and a credit event occurs, the value of the referenced obligation received by the Portfolio coupled with the periodic payments previously received, may be less than the Maximum Payout Amount it pays to the buyer, resulting in a net loss to the Portfolio.
During the period ended May 31, 2015, the AB High Income Municipal Portfolio held credit default swaps for non-hedging purposes.
Implied credit spreads over U.S. Treasuries of comparable maturity utilized in determining the market value of credit default swaps on issuers as of period end are disclosed in the portfolio of investments. The implied spreads serve as an indicator of the current status of the payment/performance risk and typically reflect the likelihood of default by the issuer of the referenced obligation. The implied credit spread of a particular reference obligation also reflects the cost of buying/selling protection and may reflect upfront payments required to be made to enter into the agreement. Widening credit spreads typically represent a deterioration of the referenced obligation’s credit soundness and greater likelihood of default or other credit event occurring as defined under the terms of the agreement. A credit spread identified as “Defaulted” indicates a credit event has occurred for the referenced obligation.
The Portfolios typically enters into International Swaps and Derivatives Association, Inc. Master Agreements (“ISDA Master Agreement”) or similar master agreements (collectively, “Master Agreements”) with its derivative contract counterparties in order to, among other things, reduce its credit risk to counterparties. ISDA Master Agreements include provisions for general obligations, representations, collateral and events of default or termination. Under an ISDA Master Agreement, the Portfolios typically may offset with the counterparty certain derivative financial instrument’s payables and/or receivables with collateral held and/or posted and create one single net payment (close-out netting) in the event of default or termination.
| | | | |
| AB MUNICIPAL INCOME FUND • | | | 129 | |
Notes to Financial Statements
Various Master Agreements govern the terms of certain transactions with counterparties, including transactions such as derivative transactions, repurchase and reverse repurchase agreements. These Master Agreements typically attempt to reduce the counterparty risk associated with such transactions by specifying credit protection mechanisms and providing standardization that improves legal certainty. Cross-termination provisions under Master Agreements typically provide that a default in connection with one transaction between the Portfolio and a counterparty gives the non-defaulting party the right to terminate any other transactions in place with the defaulting party to create one single net payment due to/due from the defaulting party. In the event of a default by a Master Agreements counterparty, the return of collateral with market value in excess of the Portfolio’s net liability, held by the defaulting party, may be delayed or denied.
The Portfolio’s Master Agreements may contain provisions for early termination of OTC derivative transactions in the event the net assets of the Portfolio decline below specific levels (“net asset contingent features”). If these levels are triggered, the Portfolio’s counterparty has the right to terminate such transaction and require the Portfolio to pay or receive a settlement amount in connection with the terminated transaction. For additional details, please refer to netting arrangements by counterparty tables below.
At May 31, 2015, the Portfolios had entered into the following derivatives:
| | | | | | | | | | |
| AB National Portfolio | | | | | | | |
| | | Asset Derivatives | | | Liability Derivatives |
| Derivative Type | | Statement of
Assets and
Liabilities
Location | | Fair Value | | | Statement of
Assets and
Liabilities
Location | | Fair Value |
Interest rate contracts | | Unrealized
appreciation
on interest
rate swaps | | $ | 370,060 | | | | | |
| | | | | | | | | | |
Total | | | | $ | 370,060 | | | | | |
| | | | | | | | | | |
The effect of derivative instruments on the statement of operations for the period ended May 31, 2015:
| | | | | | | | | | |
Derivative Type | | Location of
Gain or (Loss)
on Derivatives | | Realized Gain
or (Loss) on
Derivatives | | | Change in
Unrealized
Appreciation or
(Depreciation) | |
Interest rate contracts | | Net realized gain (loss) on swaps; Net change in unrealized appreciation/depreciation of swaps | | $ | 193,402 | | | $ | (166,841 | ) |
| | | | | | | | | | |
Total | | | | $ | 193,402 | | | $ | (166,841 | ) |
| | | | | | | | | | |
| | |
| 130 | | • AB MUNICIPAL INCOME FUND |
Notes to Financial Statements
| | | | | | | | | | | | |
| AB High Income Municipal Portfolio | | | | | | |
| | | Asset Derivatives | | | Liability Derivatives | |
| Derivative Type | | Statement of
Assets and
Liabilities
Location | | Fair Value | | | Statement of
Assets and
Liabilities
Location | | Fair Value | |
Interest rate contracts | | | | | | | | Receivable/
Payable for
variation
margin on
exchange-
traded
derivatives | | $ | 147,187 | * |
| | | | |
Credit contracts | | Receivable/
Payable for
variation
margin on
exchange-
traded
derivatives | | $ | 1,004,286 | * | | | | | | |
| | | | |
Interest rate contracts | | Investments
in
securities,
at value | | | 331,938 | | | | | | | |
| | | | |
Interest rate contracts | | Unrealized
appreciation
on interest
rate swaps | | | 1,880,977 | | | Unrealized
depreciation
on interest
rate swaps | | | 1,972,286 | |
| | | | | | | | | | | | |
Total | | | | $ | 3,217,201 | | | | | $ | 2,119,473 | |
| | | | | | | | | | | | |
| * | | Only variation margin receivable/payable at period end is reported within the statement of assets and liabilities. This amount reflects cumulative appreciation/(depreciation) of exchange-traded derivatives as reported in the portfolio of investments. |
The effect of derivative instruments on the statement of operations for the period ended May 31, 2015:
| | | | | | | | | | |
Derivative Type | | Location of
Gain or (Loss)
on Derivatives | | Realized Gain
or (Loss) on
Derivatives | | | Change in
Unrealized
Appreciation or
(Depreciation) | |
Interest rate contracts | | Net realized gain (loss) on investment transactions; Net change in unrealized appreciation/depreciation of investments | | $ | – 0 | – | | $ | (2,122,241 | ) |
| | | | |
| AB MUNICIPAL INCOME FUND • | | | 131 | |
Notes to Financial Statements
| | | | | | | | | | |
Derivative Type | | Location of
Gain or (Loss)
on Derivatives | | Realized Gain
or (Loss) on
Derivatives | | | Change in
Unrealized
Appreciation or
(Depreciation) | |
Interest rate contracts | | Net realized gain (loss) on swaptions written; Net change in unrealized appreciation/depreciation of swaptions written | | $ | 279,750 | | | $ | – 0 | – |
| | | |
Interest rate contracts | | Net realized gain (loss) on swaps; Net change in unrealized appreciation/depreciation of swaps | | | (6,125,930 | ) | | | 2,616,136 | |
| | | |
Credit contracts | | Net realized gain (loss) on swaps; Net change in unrealized appreciation/depreciation of swaps | | | 2,623,389 | | | | 284,764 | |
| | | | | | | | | | |
Total | | | | $ | (3,222,791 | ) | | $ | 778,659 | |
| | | | | | | | | | |
| | | | | | | | | | | | |
| AB California Portfolio | | | | | | | | |
| | | Asset Derivatives | | | Liability Derivatives | |
| Derivative Type | | Statement of
Assets and
Liabilities
Location | | Fair Value | | | Statement of
Assets and
Liabilities
Location | | Fair Value | |
Interest rate contracts | | Unrealized appreciation on interest rate swaps | |
$ |
1,733,862 |
| | Unrealized depreciation on interest rate swaps | |
$ |
7,620,163 |
|
| | | | | | | | | | | | |
Total | | | | $ | 1,733,862 | | | | | $ | 7,620,163 | |
| | | | | | | | | | | | |
The effect of derivative instruments on the statement of operations for the period ended May 31, 2015:
| | | | | | | | | | |
Derivative Type | | Location of
Gain or (Loss)
on Derivatives | | Realized Gain
or (Loss) on
Derivatives | | | Change in
Unrealized
Appreciation or
(Depreciation) | |
Interest rate contracts | | Net realized gain (loss) on swaps; Net change in unrealized appreciation/depreciation of swaps | | $ | (518,951 | ) | | $ | (878,689 | ) |
| | | | | | | | | | |
Total | | | | $ | (518,951 | ) | | $ | (878,689 | ) |
| | | | | | | | | | |
| | |
| 132 | | • AB MUNICIPAL INCOME FUND |
Notes to Financial Statements
| | | | | | | | | | |
| AB New York Portfolio | | | | | | | |
| | | Asset Derivatives | | | Liability Derivatives |
| Derivative Type | | Statement of
Assets and
Liabilities
Location | | Fair Value | | | Statement of
Assets and
Liabilities
Location | | Fair Value |
Interest rate contracts | | Unrealized
appreciation
on interest
rate swaps | | $ | 525,214 | | | | | |
| | | | | | | | | | |
Total | | | | $ | 525,214 | | | | | |
| | | | | | | | | | |
The effect of derivative instruments on the statement of operations for the period ended May 31, 2015:
| | | | | | | | | | |
Derivative Type | | Location of
Gain or (Loss)
on Derivatives | | Realized Gain
or (Loss) on
Derivatives | | | Change in
Unrealized
Appreciation or
(Depreciation) | |
Interest rate contracts | | Net realized gain (loss) on swaps; Net change in unrealized appreciation/depreciation of swaps | | $ | 67,689 | | | $ | 56,435 | |
| | | | | | | | | | |
Total | | | | $ | 67,689 | | | $ | 56,435 | |
| | | | | | | | | | |
The following tables represent the average monthly volume of the Portfolios’ derivative transactions during the period ended May 31, 2015:
| | | | |
AB National Portfolio | | | | |
Interest Rate Swaps: | | | | |
Average notional amount | | $ | 6,300,000 | |
| |
AB High Income Municipal Portfolio | | | | |
Purchased Options: | | | | |
Average monthly cost | | $ | 3,799,750 | |
| |
Interest Rate Swaps: | | | | |
Average notional amount | | $ | 29,000,000 | |
| |
Centrally Cleared Interest Rate Swaps: | | | | |
Average notional amount | | $ | 57,187,500 | |
| |
Centrally Cleared Credit Default Swaps: | | | | |
Average notional amount of buy contracts | | $ | 20,013,560 | (a) |
Average notional amount of sale contracts | | $ | 71,671,375 | |
| (a) | | Positions were open for one month during the period. |
| | | | |
AB California Portfolio | | | | |
Interest Rate Swaps: | | | | |
Average notional amount | | $ | 39,100,000 | |
| |
AB New York Portfolio | | | | |
Interest Rate Swaps: | | | | |
Average notional amount | | $ | 2,200,000 | |
| | | | |
| AB MUNICIPAL INCOME FUND • | | | 133 | |
Notes to Financial Statements
For financial reporting purposes, the Portfolios do not offset derivative assets and derivative liabilities that are subject to netting arrangements in the statement of assets and liabilities.
All derivatives held at period end were subject to netting arrangements. The following tables present the Portfolios’ derivative assets and liabilities by counterparty net of amounts available for offset under Master Agreements (“MA”) and net of the related collateral received/ pledged by the Portfolios as of May 31, 2015:
| | | | | | | | | | | | | | | | | | | | |
| AB National Portfolio | | | | | | | | | | | | | |
Counterparty | | Derivative
Assets
Subject
to a MA | | | Derivative
Available
for Offset | | | Cash
Collateral
Received | | | Security
Collateral
Received | | | Net Amount of
Derivatives
Assets | |
OTC Derivatives: | | | | | | | | | | | | | | | | | |
Merrill Lynch Capital Services, Inc. | | $ | 370,060 | | | $ | – 0 | – | | $ | – 0 | – | | $ | – 0 | – | | $ | 370,060 | |
| | | | | | | | | | | | | | | | | | | | |
Total | | $ | 370,060 | | | $ | – 0 | – | | $ | – 0 | – | | $ | – 0 | – | | $ | 370,060 | ^ |
| | | | | | | | | | | | | | | | | | | | |
| ^ | | Net amount represents the net receivable/payable that would be due from/to the counterparty in the event of default or termination. The net amount from OTC financial derivative instruments can only be netted across transactions governed under the same master agreement with the same counterparty. |
| | | | | | | | | | | | | | | | | | | | |
| AB High Income Municipal Portfolio | | | | | | | | | | |
Counterparty | | Derivative
Assets
Subject
to a MA | | | Derivative
Available
for Offset | | | Cash
Collateral
Received | | | Security
Collateral
Received* | | | Net Amount of
Derivatives
Assets | |
OTC Derivatives: | | | | | | | | | | | | | | | | | |
Citibank | | $ | 331,938 | | | $ | – 0 | – | | $ | – 0 | – | | $ | (331,938 | ) | | $ | – 0 | – |
JPMorgan Chase Bank | | | 1,234,804 | | | | (1,234,804 | ) | | | – 0 | – | | | – 0 | – | | | – 0 | – |
Morgan Stanley Capital Services LLC | | | 646,173 | | | | – 0 | – | | | – 0 | – | | | (646,173 | ) | | | – 0 | – |
| | | | | | | | | | | | | | | | | | | | |
Total | | $ | 2,212,915 | | | $ | (1,234,804 | ) | | $ | – 0 | – | | $ | (978,111 | ) | | $ | – 0 | –^ |
| | | | | | | | | | | | | | | | | | | | |
| | | | | |
Counterparty | | Derivative
Liabilities
Subject
to a MA | | | Derivative
Available
for Offset | | | Cash
Collateral
Pledged* | | | Security
Collateral
Pledged | | | Net Amount of
Derivatives
Liabilities | |
Exchange-Traded Derivatives: | | | | | | | | | | | | | |
Morgan Stanley & Co., LLC** | | $ | 226,195 | | | $ | – 0 | – | | $ | (226,195 | ) | | $ | – 0 | – | | $ | – 0 | – |
| | | | | | | | | | | | | | | | | | | | |
Total | | $ | 226,195 | | | $ | – 0 | – | | $ | (226,195 | ) | | $ | – 0 | – | | $ | – 0 | – |
| | | | | | | | | | | | | | | | | | | | |
| | | | |
OTC Derivatives: | | | | | | | | | | | | | | | | | |
JPMorgan Chase Bank | | $ | 1,972,286 | | | $ | (1,234,804 | ) | | $ | – 0 | – | | $ | (587,201 | ) | | $ | 150,281 | |
| | | | | | | | | | | | | | | | | | | | |
Total | | $ | 1,972,286 | | | $ | (1,234,804 | ) | | $ | – 0 | – | | $ | (587,201 | ) | | $ | 150,281 | ^ |
| | | | | | | | | | | | | | | | | | | | |
| * | | The actual collateral received/pledged may be more than the amount reported due to overcollateralization. |
| | |
| 134 | | • AB MUNICIPAL INCOME FUND |
Notes to Financial Statements
| ** | | Cash has been posted for initial margin requirements for exchange traded derivatives outstanding at May 31, 2015. |
| ^ | | Net amount represents the net receivable/payable that would be due from/to the counterparty in the event of default or termination. The net amount from OTC financial derivative instruments can only be netted across transactions governed under the same master agreement with the same counterparty. |
| | | | | | | | | | | | | | | | | | | | |
| AB California Portfolio | | | | | | | | | | | | | |
Counterparty | | Derivative
Assets
Subject
to a MA | | | Derivative
Available
for Offset | | | Cash
Collateral
Received | | | Security
Collateral
Received | | | Net Amount of
Derivatives
Assets | |
OTC Derivatives: | | | | | | | | | | | | | | | | | |
Citibank, NA | | $ | 1,551,769 | | | $ | – 0 | – | | $ | – 0 | – | | $ | (1,282,021 | ) | | $ | 269,748 | |
Merrill Lynch Capital Services, Inc. | | | 182,093 | | | | (182,093 | ) | | | – 0 | – | | | – 0 | – | | | – 0 | – |
| | | | | | | | | | | | | | | | | | | | |
Total | | $ | 1,733,862 | | | $ | (182,093 | ) | | $ | – 0 | – | | $ | (1,282,021 | ) | | $ | 269,748 | ^ |
| | | | | | | | | | | | | | | | | | | | |
| | | | | |
Counterparty | | Derivative
Liabilities
Subject
to a MA | | | Derivative
Available
for Offset | | | Cash
Collateral
Pledged | | | Security
Collateral
Pledged* | | | Net Amount of
Derivatives
Liabilities | |
OTC Derivatives: | | | | | | | | | | | | | | | | | |
Merrill Lynch Capital Services, Inc. | | $ | 7,620,163 | | | $ | (182,093 | ) | | $ | – 0 | – | | $ | (7,438,070 | ) | | $ | – 0 | – |
| | | | | | | | | | | | | | | | | | | | |
Total | | $ | 7,620,163 | | | $ | (182,093 | ) | | $ | – 0 | – | | $ | (7,438,070 | ) | | $ | – 0 | –^ |
| | | | | | | | | | | | | | | | | | | | |
| * | | The actual collateral received/pledged may be more than the amount reported due to overcollateralization. |
| ^ | | Net amount represents the net receivable/payable that would be due from/to the counterparty in the event of default or termination. The net amount from OTC financial derivative instruments can only be netted across transactions governed under the same master agreement with the same counterparty. |
| | | | | | | | | | | | | | | | | | | | |
| AB New York Portfolio | | | | | | | | | | | | | |
Counterparty | | Derivative
Assets
Subject
to a MA | | | Derivative
Available
for Offset | | | Cash
Collateral
Received | | | Security
Collateral
Received | | | Net Amount of
Derivatives
Assets | |
OTC Derivatives: | | | | | | | | | | | | | | | | | |
Citibank, NA | | $ | 525,214 | | | $ | – 0 | – | | $ | – 0 | – | | $ | (502,928 | ) | | $ | 22,286 | |
| | | | | | | | | | | | | | | | | | | | |
Total | | $ | 525,214 | | | $ | – 0 | – | | $ | – 0 | – | | $ | (502,928 | ) | | $ | 22,286 | ^ |
| | | | | | | | | | | | | | | | | | | | |
| ^ | | Net amount represents the net receivable/payable that would be due from/to the counterparty in the event of default or termination. The net amount from OTC financial derivative instruments can only be netted across transactions governed under the same master agreement with the same counterparty. |
| | | | |
| AB MUNICIPAL INCOME FUND • | | | 135 | |
Notes to Financial Statements
NOTE E
Capital Stock
The Fund has allocated 18,100,000,000 of authorized shares to the AB National Portfolio of which 6,000,000,000 is allocated to each of Class A, Class B and Class C shares and 100,000,000 is allocated to Advisor Class shares; 9,100,000,000 of authorized shares to the AB High Income Municipal Portfolio of which 3,000,000,000 is allocated to each of Class A, Class B (not currently offered) and Class C shares and 100,000,000 is allocated to Advisor Class shares; 18,050,000,000 of authorized shares to the AB California Portfolio, of which 6,000,000,000 is allocated to each of Class A, Class B and Class C shares and 50,000,000 is allocated to Advisor Class shares and 9,050,000,000 of authorized shares to the AB New York Portfolio of which 3,000,000,000 is allocated to each of Class A, Class B and Class C shares and 50,000,000 is allocated to Advisor Class shares. Transactions in capital shares for each class were as follows:
| | | | | | | | | | | | | | | | | | | | | | | | | | | | |
| | | | | | | | | | | | | | | | | | | | | | | | | | | | |
| | | AB National Portfolio | | | |
| | | Shares | | | | | Amount | | | |
| | | November 1,
2014 to
May 31,
2015(a) | | | Year Ended
October 31,
2014 | | | Year Ended
October 31,
2013 | | | | | November 1,
2014 to
May 31,
2015(a) | | | Year Ended
October 31,
2014 | | | Year Ended
October 31,
2013 | | | |
| | | | | | |
| Class A | | | | | | | | | | | | | | | | | | | | | | | | | | | | |
Shares sold | | | 7,992,806 | | | | 9,955,835 | | | | 14,738,550 | | | | | $ | 82,630,150 | | | $ | 100,125,410 | | | $ | 154,664,850 | | | |
| | | |
Shares issued in reinvestment of dividends | | | 609,553 | | | | 1,263,622 | | | | 1,427,938 | | | | | | 6,306,136 | | | | 12,763,531 | | | | 14,714,891 | | | |
| | | |
Shares converted from Class B | | | 48,138 | | | | 117,806 | | | | 117,064 | | | | | | 498,138 | | | | 1,187,205 | | | | 1,217,640 | | | |
| | | |
Shares redeemed | | | (4,859,413 | ) | | | (20,650,582 | ) | | | (21,828,337 | ) | | | | | (50,204,349 | ) | | | (208,028,787 | ) | | | (223,654,762 | ) | | |
| | | |
Net increase (decrease) | | | 3,791,084 | | | | (9,313,319 | ) | | | (5,544,785 | ) | | | | $ | 39,230,075 | | | $ | (93,952,641 | ) | | $ | (53,057,381 | ) | | |
| | | |
| | | | | | | | | | | | | | | | | | | | | | | | | | | | |
| Class B | | | | | | | | | | | | | | | | | | | | | | | | | | | | |
Shares sold | | | 1,293 | | | | 9,800 | | | | 31,291 | | | | | $ | 13,375 | | | $ | 98,147 | | | $ | 329,739 | | | |
| | | |
Shares issued in reinvestment of dividends | | | 921 | | | | 3,697 | | | | 6,558 | | | | | | 9,522 | | | | 37,180 | | | | 67,737 | | | |
| | | |
Shares converted to Class A | | | (48,227 | ) | | | (117,968 | ) | | | (117,221 | ) | | | | | (498,138 | ) | | | (1,187,205 | ) | | | (1,217,640 | ) | | |
| | | |
Shares redeemed | | | (4,253 | ) | | | (70,733 | ) | | | (111,384 | ) | | | | | (43,872 | ) | | | (709,665 | ) | | | (1,137,245 | ) | | |
| | | |
Net decrease | | | (50,266 | ) | | | (175,204 | ) | | | (190,756 | ) | | | | $ | (519,113 | ) | | $ | (1,761,543 | ) | | $ | (1,957,409 | ) | | |
| | | |
| | | | | | | | | | | | | | | | | | | | | | | | | | | | |
| Class C | | | | | | | | | | | | | | | | | | | | | | | | | | | | |
Shares sold | | | 1,290,217 | | | | 989,003 | | | | 2,328,761 | | | | | $ | 13,352,027 | | | $ | 9,938,481 | | | $ | 24,323,797 | | | |
| | | |
Shares issued in reinvestment of dividends | | | 125,919 | | | | 243,547 | | | | 278,724 | | | | | | 1,301,368 | | | | 2,457,141 | | | | 2,868,191 | | | |
| | | |
Shares redeemed | | | (1,118,027 | ) | | | (3,164,858 | ) | | | (4,275,375 | ) | | | | | (11,552,622 | ) | | | (31,616,433 | ) | | | (43,407,164 | ) | | |
| | | |
Net increase (decrease) | | | 298,109 | | | | (1,932,308 | ) | | | (1,667,890 | ) | | | | $ | 3,100,773 | | | $ | (19,220,811 | ) | | $ | (16,215,176 | ) | | |
| | | |
| | | | | | | | | | | | | | | | | | | | | | | | | | | | |
| | |
| 136 | | • AB MUNICIPAL INCOME FUND |
Notes to Financial Statements
| | | | | | | | | | | | | | | | | | | | | | | | | | | | |
| | | | | | | | | | | | | | | | | | | | | | | | | | | | |
| | | AB National Portfolio | | | |
| | | Shares | | | | | Amount | | | |
| | | November 1,
2014 to
May 31,
2015(a) | | | Year Ended
October 31,
2014 | | | Year Ended
October 31,
2013 | | | | | November 1,
2014 to
May 31,
2015(a) | | | Year Ended
October 31,
2014 | | | Year Ended
October 31,
2013 | | | |
| | | | | | |
| Advisor Class | | | | | | | | | | | | | | | | | | | | | | | | | | | | |
Shares sold | | | 9,211,272 | | | | 16,540,110 | | | | 9,021,101 | | | | | $ | 95,361,455 | | | $ | 167,363,830 | | | $ | 94,096,522 | | | |
| | | |
Shares issued in reinvestment of dividends | | | 435,504 | | | | 509,126 | | | | 493,760 | | | | | | 4,505,554 | | | | 5,158,346 | | | | 5,089,961 | | | |
| | | |
Shares redeemed | | | (3,307,697 | ) | | | (9,165,616 | ) | | | (10,345,853 | ) | | | | | (34,288,930 | ) | | | (91,321,459 | ) | | | (105,738,065 | ) | | |
| | | |
Net increase (decrease) | | | 6,339,079 | | | | 7,883,620 | | | | (830,992 | ) | | | | $ | 65,578,079 | | | $ | 81,200,717 | | | $ | (6,551,582 | ) | | |
| | | |
| | | | | | | | | | | | | | | | | | | | | | | | | | | | |
| | | | | | | | | | | | | | | | | | | | | | | | | | | | |
| | | AB High Income Municipal Portfolio | | | |
| | | Shares | | | | | Amount | | | |
| | | November 1,
2014 to May 31,
2015(a) | | | Year Ended
October 31,
2014 | | | Year Ended
October 31,
2013 | | | | | November 1,
2014 to
May 31,
2015(a) | | | Year Ended
October 31,
2014 | | | Year Ended
October 31,
2013 | | | |
| | | | | | |
| Class A | | | | | | | | | | | | | | | | | | | | | | | | | | | | |
Shares sold | | | 15,621,324 | | | | 30,118,263 | | | | 35,957,029 | | | | | $ | 176,816,165 | | | $ | 323,956,865 | | | $ | 403,768,599 | | | |
| | | |
Shares issued in reinvestment of dividends | | | 822,327 | | | | 1,562,804 | | | | 1,602,631 | | | | | | 9,310,577 | | | | 16,790,691 | | | | 17,657,754 | | | |
| | | |
Shares redeemed | | | (10,491,580 | ) | | | (33,414,643 | ) | | | (33,332,782 | ) | | | | | (118,780,653 | ) | | | (356,541,980 | ) | | | (366,084,101 | ) | | |
| | | |
Net increase (decrease) | | | 5,952,071 | | | | (1,733,576 | ) | | | 4,226,878 | | | | | $ | 67,346,089 | | | $ | (15,794,424 | ) | | $ | 55,342,252 | | | |
| | | |
| | | | | | | | | | | | | | | | | | | | | | | | | | | | |
| Class C | | | | | | | | | | | | | | | | | | | | | | | | | | | | |
Shares sold | | | 4,786,956 | | | | 7,598,866 | | | | 8,554,585 | | | | | $ | 54,230,812 | | | $ | 81,597,159 | | | $ | 96,689,349 | | | |
| | | |
Shares issued in reinvestment of dividends | | | 313,839 | | | | 515,635 | | | | 516,650 | | | | | | 3,550,666 | | | | 5,551,407 | | | | 5,677,744 | | | |
| | | |
Shares redeemed | | | (2,596,189 | ) | | | (5,596,215 | ) | | | (7,224,545 | ) | | | | | (29,372,669 | ) | | | (58,885,914 | ) | | | (77,935,432 | ) | | |
| | | |
Net increase | | | 2,504,606 | | | | 2,518,286 | | | | 1,846,690 | | | | | $ | 28,408,809 | | | $ | 28,262,652 | | | $ | 24,431,661 | | | |
| | | |
| | | | | | | | | | | | | | | | | | | | | | | | | | | | |
| Advisor Class | | | | | | | | | | | | | | | | | | | | | | | | | | | | |
Shares sold | | | 31,402,697 | | | | 66,594,755 | | | | 34,684,900 | | | | | $ | 356,113,935 | | | $ | 714,868,348 | | | $ | 389,689,339 | | | |
| | | |
Shares issued in reinvestment of dividends | | | 1,472,256 | | | | 1,873,565 | | | | 1,268,326 | | | | | | 16,654,426 | | | | 20,306,036 | | | | 13,969,476 | | | |
| | | |
Shares redeemed | | | (21,954,717 | ) | | | (23,207,415 | ) | | | (33,229,784 | ) | | | | | (248,415,324 | ) | | | (247,761,120 | ) | | | (365,256,617 | ) | | |
| | | |
Net increase | | | 10,920,236 | | | | 45,260,905 | | | | 2,723,442 | | | | | $ | 124,353,037 | | | $ | 487,413,264 | | | $ | 38,402,198 | | | |
| | | |
| | | | |
| AB MUNICIPAL INCOME FUND • | | | 137 | |
Notes to Financial Statements
| | | | | | | | | | | | | | | | | | | | | | | | | | | | |
| | | | | | | | | | | | | | | | | | | | | | | | | | | | |
| | | AB California Portfolio | | | |
| | | Shares | | | | | Amount | | | |
| | | November 1,
2014 to
May 31,
2015(a) | | | Year Ended
October 31,
2014 | | | Year Ended
October 31,
2013 | | | | | November 1,
2014 to
May 31,
2015(a) | | | Year Ended
October 31,
2014 | | | Year Ended
October 31,
2013 | | | |
| | | | | | |
| Class A | | | | | | | | | | | | | | | | | | | | | | | | | | | | |
Shares sold | | | 1,951,464 | | | | 1,596,507 | | | | 4,572,068 | | | | | $ | 22,305,191 | | | $ | 17,706,326 | | | $ | 51,990,557 | | | |
| | | |
Shares issued in reinvestment of dividends and distributions | | | 345,889 | | | | 654,230 | | | | 835,570 | | | | | | 3,950,473 | | | | 7,260,407 | | | | 9,393,683 | | | |
| | | |
Shares converted from Class B | | | 16,091 | | | | 51,866 | | | | 41,724 | | | | | | 183,837 | | | | 575,781 | | | | 471,131 | | | |
| | | |
Shares redeemed | | | (1,981,338 | ) | | | (6,253,535 | ) | | | (9,103,936 | ) | | | | | (22,638,964 | ) | | | (68,880,222 | ) | | | (101,530,861 | ) | | |
| | | |
Net increase (decrease) | | | 332,106 | | | | (3,950,932 | ) | | | (3,654,574 | ) | | | | $ | 3,800,537 | | | $ | (43,337,708 | ) | | $ | (39,675,490 | ) | | |
| | | |
| | | | | | | | | | | | | | | | | | | | | | | | | | | | |
| Class B | | | | | | | | | | | | | | | | | | | | | | | | | | | | |
Shares sold | | | 499 | | | | 844 | | | | 972 | | | | | $ | 5,700 | | | $ | 9,380 | | | $ | 10,920 | | | |
| | | |
Shares issued in reinvestment of dividends and distributions | | | 273 | | | | 1,510 | | | | 2,973 | | | | | | 3,131 | | | | 16,704 | | | | 33,550 | | | |
| | | |
Shares converted to Class A | | | (16,091 | ) | | | (51,873 | ) | | | (41,735 | ) | | | | | (183,837 | ) | | | (575,781 | ) | | | (471,131 | ) | | |
| | | |
Shares redeemed | | | (3,416 | ) | | | (8,953 | ) | | | (25,115 | ) | | | | | (39,267 | ) | | | (97,809 | ) | | | (277,243 | ) | | |
| | | |
Net decrease | | | (18,735 | ) | | | (58,472 | ) | | | (62,905 | ) | | | | $ | (214,273 | ) | | $ | (647,506 | ) | | $ | (703,904 | ) | | |
| | | |
| | | | | | | | | | | | | | | | | | | | | | | | | | | | |
| Class C | | | | | | | | | | | | | | | | | | | | | | | | | | | | |
Shares sold | | | 540,461 | | | | 321,413 | | | | 534,408 | | | | | $ | 6,169,761 | | | $ | 3,550,235 | | | $ | 6,097,466 | | | |
| | | |
Shares issued in reinvestment of dividends and distributions | | | 59,714 | | | | 114,343 | | | | 153,890 | | | | | | 681,656 | | | | 1,268,050 | | | | 1,730,989 | | | |
| | | |
Shares redeemed | | | (501,479 | ) | | | (1,159,454 | ) | | | (2,013,722 | ) | | | | | (5,716,563 | ) | | | (12,723,564 | ) | | | (22,249,424 | ) | | |
| | | |
Net increase (decrease) | | | 98,696 | | | | (723,698 | ) | | | (1,325,424 | ) | | | | $ | 1,134,854 | | | $ | (7,905,279 | ) | | $ | (14,420,969 | ) | | |
| | | |
| | | | | | | | | | | | | | | | | | | | | | | | | | | | |
| Advisor Class | | | | | | | | | | | | | | | | | | | | | | | | | | | | |
Shares sold | | | 2,318,827 | | | | 2,189,608 | | | | 1,982,212 | | | | | $ | 26,505,115 | | | $ | 24,220,587 | | | $ | 22,284,216 | | | |
| | | |
Shares issued in reinvestment of dividends and distributions | | | 67,550 | | | | 79,406 | | | | 82,997 | | | | | | 771,085 | | | | 884,296 | | | | 929,512 | | | |
| | | |
Shares redeemed | | | (671,986 | ) | | | (1,452,612 | ) | | | (1,922,951 | ) | | | | | (7,643,761 | ) | | | (15,825,370 | ) | | | (21,314,221 | ) | | |
| | | |
Net increase | | | 1,714,391 | | | | 816,402 | | | | 142,258 | | | | | $ | 19,632,439 | | | $ | 9,279,513 | | | $ | 1,899,507 | | | |
| | | |
| | |
| 138 | | • AB MUNICIPAL INCOME FUND |
Notes to Financial Statements
| | | | | | | | | | | | | | | | | | | | | | | | | | | | |
| | | | | | | | | | | | | | | | | | | | | | | | | | | | |
| | | AB New York Portfolio | | | |
| | | Shares | | | | | Amount | | | |
| | | November 1,
2014 to May 31,
2015(a) | | | Year Ended
October 31,
2014 | | | Year Ended
October 31,
2013 | | | | | November 1,
2014 to
May 31,
2015(a) | | | Year Ended
October 31,
2014 | | | Year Ended
October 31,
2013 | | | |
| | | | | | |
| Class A | | | | | | | | | | | | | | | | | | | | | | | | | | | | |
Shares sold | | | 4,201,602 | | | | 4,490,562 | | | | 13,224,668 | | | | | $ | 42,101,297 | | | $ | 44,085,154 | | | $ | 134,404,340 | | | |
| | | |
Shares issued in reinvestment of dividends and distributions | | | 421,106 | | | | 824,910 | | | | 1,089,280 | | | | | | 4,222,672 | | | | 8,109,982 | | | | 11,052,638 | | | |
| | | |
Shares converted from Class B | | | 56,219 | | | | 307,083 | | | | 294,122 | | | | | | 564,360 | | | | 3,014,486 | | | | 2,980,121 | | | |
| | | |
Shares redeemed | | | (4,902,284 | ) | | | (10,098,924 | ) | | | (22,164,579 | ) | | | | | (49,135,520 | ) | | | (98,706,099 | ) | | | (221,368,058 | ) | | |
| | | |
Net decrease | | | (223,357 | ) | | | (4,476,369 | ) | | | (7,556,509 | ) | | | | $ | (2,247,191 | ) | | $ | (43,496,477 | ) | | $ | (72,930,959 | ) | | |
| | | |
| | | | | | | | | | | | | | | | | | | | | | | | | | | | |
| Class B | | | | | | | | | | | | | | | | | | | | | | | | | | | | |
Shares sold | | | 7,144 | | | | 3,916 | | | | 33,953 | | | | | $ | 71,259 | | | $ | 38,513 | | | $ | 359,225 | | | |
| | | |
Shares issued in reinvestment of dividends and distributions | | | 1,365 | | | | 6,936 | | | | 15,242 | | | | | | 13,667 | | | | 67,800 | | | | 154,862 | | | |
| | | |
Shares converted to Class A | | | (56,306 | ) | | | (307,416 | ) | | | (294,499 | ) | | | | | (564,360 | ) | | | (3,014,486 | ) | | | (2,980,121 | ) | | |
| | | |
Shares redeemed | | | (7,872 | ) | | | (50,425 | ) | | | (110,432 | ) | | | | | (78,813 | ) | | | (489,426 | ) | | | (1,105,949 | ) | | |
| | | |
Net decrease | | | (55,669 | ) | | | (346,989 | ) | | | (355,736 | ) | | | | $ | (558,247 | ) | | $ | (3,397,599 | ) | | $ | (3,571,983 | ) | | |
| | | |
| | | | | | | | | | | | | | | | | | | | | | | | | | | | |
| Class C | | | | | | | | | | | | | | | | | | | | | | | | | | | | |
Shares sold | | | 646,978 | | | | 498,851 | | | | 1,554,924 | | | | | $ | 6,492,220 | | | $ | 4,896,340 | | | $ | 16,044,056 | | | |
| | | |
Shares issued in reinvestment of dividends and distributions | | | 68,969 | | | | 138,565 | | | | 196,285 | | | | | | 691,278 | | | | 1,361,189 | | | | 1,990,505 | | | |
| | | |
Shares redeemed | | | (611,494 | ) | | | (1,752,588 | ) | | | (3,592,816 | ) | | | | | (6,133,217 | ) | | | (17,132,355 | ) | | | (35,700,102 | ) | | |
| | | |
Net increase (decrease) | | | 104,453 | | | | (1,115,172 | ) | | | (1,841,607 | ) | | | | $ | 1,050,281 | | | $ | (10,874,826 | ) | | $ | (17,665,541 | ) | | |
| | | |
| | | | | | | | | | | | | | | | | | | | | | | | | | | | |
| Advisor Class | | | | | | | | | | | | | | | | | | | | | | | | | | | | |
Shares sold | | | 1,113,069 | | | | 994,009 | | | | 1,097,023 | | | | | $ | 11,202,176 | | | $ | 9,792,314 | | | $ | 11,330,909 | | | |
| | | |
Shares issued in reinvestment of dividends and distributions | | | 26,366 | | | | 32,426 | | | | 54,607 | | | | | | 264,448 | | | | 319,135 | | | | 554,945 | | | |
| | | |
Shares redeemed | | | (306,480 | ) | | | (626,470 | ) | | | (1,760,196 | ) | | | | | (3,075,994 | ) | | | (6,110,669 | ) | | | (17,722,455 | ) | | |
| | | |
Net increase (decrease) | | | 832,955 | | | | 399,965 | | | | (608,566 | ) | | | | $ | 8,390,630 | | | $ | 4,000,780 | | | $ | (5,836,601 | ) | | |
| | | |
| (a) | | The Portfolio changed its fiscal year end from October 31 to May 31. |
For the year ended October 31, 2013, the AB National Portfolio received $16,997 related to a third-party’s settlement of regulatory proceedings involving allegations of improper trading. This amount is presented in the Portfolio’s statement of changes in net assets. Neither the Portfolio nor its affiliates were involved in the proceedings or the calculation of the payment.
| | | | |
| AB MUNICIPAL INCOME FUND • | | | 139 | |
Notes to Financial Statements
NOTE F
Risks Involved in Investing in the Portfolios
Municipal Market Risk and Concentration of Credit Risk—This is the risk that special factors may adversely affect the value of municipal securities and have a significant effect on the yield or value of the Portfolios’ investments in municipal securities. These factors include economic conditions, political or legislative changes, uncertainties related to the tax status of municipal securities, or the rights of investors in these securities. The AB New York and AB California Portfolios of the AB Municipal Income Fund are State Portfolios that may invest a large portion of their assets in a particular state’s municipal securities and their various political subdivisions. To the extent that these Portfolios invest more of their assets in a particular state’s municipal securities, these Portfolios may be vulnerable to events adversely affecting that state, including economic, political and regulatory occurrences, court decisions, terrorism and catastrophic natural disasters, such as hurricanes or earthquakes. These Portfolios’ investments in certain municipal securities with principal and interest payments that are made from the revenues of a specific project or facility, and not general tax revenues, may have increased risks. Factors affecting the project or facility, such as local business or economic conditions, could have a significant effect on the project’s ability to make payments of principal and interest on these securities.
Credit Risk—An issuer or guarantor of a fixed-income security, or the counterparty to a derivatives or other contract, may be unable or unwilling to make timely payments of interest or principal, or to otherwise honor its obligations. The issuer or guarantor may default, causing a loss of the full principal amount of a security. The degree of risk for a particular security may be reflected in its credit rating. There is the possibility that the credit rating of a fixed-income security may be downgraded after purchase, which may adversely affect the value of the security. Investments in fixed-income securities with lower ratings tend to have a higher probability that an issuer will default or fail to meet its payment obligations.
Interest Rate Risk—Changes in interest rates will affect the value of investments in fixed-income securities. When interest rates rise, the value of investments in fixed-income securities tends to fall and this decrease in value may not be offset by higher income from new investments. Interest rate risk is generally greater for fixed-income securities with longer maturities or durations.
Inflation Risk— This is the risk that the value of assets or income from investments will be less in the future as inflation decreases the value of money. As inflation increases, the real value of the Portfolio’s assets can decline as can the real value of the Portfolio’s distributions. This risk is significantly greater for fixed-income securities with longer maturities.
Liquidity Risk—Liquidity risk occurs when certain investments become difficult to purchase or sell. Difficulty in selling less liquid securities may result in sales at
| | |
| 140 | | • AB MUNICIPAL INCOME FUND |
Notes to Financial Statements
disadvantageous prices affecting the value of your investment in the Portfolio. Causes of liquidity risk may include low trading volumes and large positions. Municipal securities may have more liquidity risk than other fixed-income securities because they trade less frequently and the market for municipal securities is generally smaller than many other markets.
Derivatives Risk—The Portfolios may enter into derivative transactions such as forwards, options, futures and swaps. Derivatives may be illiquid, difficult to price, and leveraged so that small changes may produce disproportionate losses for the Portfolios, and subject to counterparty risk to a greater degree than more traditional investments. Derivatives may result in significant losses, including losses that are far greater than the value of the derivatives reflected in the statement of assets and liabilities.
Financing and Related Transactions; Leverage and Other Risks—A Portfolio may utilize financial leverage, including tender option bond transactions, to seek to enhance the yield and net asset value. These objectives may not be achieved in all interest rate environments. Leverage creates certain risks for shareholders, including the likelihood of greater volatility of the net asset value. If income from the securities purchased from the funds made available by leverage is not sufficient to cover the cost of leverage, the Portfolio’s return will be less than if leverage had not been used. As a result, the amounts available for distribution as dividends and other distributions will be reduced. During periods of rising short-term interest rates, the interest paid on the floaters in tender option bond transactions would increase, which may adversely affect the Portfolios’ income and distribution to shareholders. A decline in distributions would adversely affect the Portfolios’ yield and possibly the market value of its shares. If rising short-term rates coincide with a period of rising long-term rates, the value of the long-term municipal bonds purchased with the proceeds of leverage would decline, adversely affecting the net asset value and possibly the market value of the shares.
In a tender option bond transaction, the Portfolios may transfer a highly rated fixed-rate municipal security to a broker, which, in turn, deposits the bond into a special purpose vehicle (typically, a trust) usually sponsored by the broker. The Portfolios receive cash and a residual interest security (sometimes referred to as an “inverse floater”) issued by the trust in return. The trust simultaneously issues securities, which pay an interest rate that is reset each week based on an index of high-grade short-term seven-day demand notes. These securities, sometimes referred to as “floaters”, are bought by third parties, including tax-exempt money market funds, and can be tendered by these holders to a liquidity provider at par, unless certain events occur. The Portfolios continue to earn all the interest from the transferred bond less the amount of interest paid on the floaters and the expenses of the trust, which include payments to the trustee and the liquidity provider and organizational costs. The Portfolios also use the cash received from the transaction for investment purposes or to retire
| | | | |
| AB MUNICIPAL INCOME FUND • | | | 141 | |
Notes to Financial Statements
other forms of leverage. Under certain circumstances, the trust may be terminated and collapsed, either by the Portfolios or upon the occurrence of certain events, such as a downgrade in the credit quality of the underlying bond, or in the event holders of the floaters tender their securities to the liquidity provider. See Note I to the financial statements for more information about tender option bond transactions.
A Portfolio may also purchase inverse floaters from a tender option bond trust in a secondary market transaction without first owning the underlying bond. The income received from an inverse floater varies inversely with the short-term interest rate paid on the floaters issued by the trust. The prices of inverse floaters are subject to greater volatility than the prices of fixed-income securities that are not inverse floaters. Investments in inverse floaters may amplify the risks of leverage. If short-term interest rates rise, the interest payable on the floaters would increase and income from the inverse floaters decrease.
Indemnification Risk—In the ordinary course of business, the Portfolios enter into contracts that contain a variety of indemnifications. The Portfolios’ maximum exposure under these arrangements is unknown. However, the Portfolios have not had prior claims or losses pursuant to these indemnification provisions and expect the risk of loss thereunder to be remote. Therefore, the Portfolios have not accrued any liability in connection with these indemnification provisions.
Tax Risk—There is no guarantee that all of a Portfolio’s income will remain exempt from federal or state income taxes. From time to time, the U.S. Government and the U.S. Congress consider changes in federal tax law that could limit or eliminate the federal tax exemption for municipal bond income, which would in effect reduce the net income received by shareholders from the Portfolio by increasing taxes on that income. In such event, the Portfolio’s NAV could also decline as yields on municipal bonds, which are typically lower than those on taxable bonds, would be expected to increase to approximately the yield of comparable taxable bonds. Actions or anticipated actions affecting the tax exempt status of municipal bonds could also result in significant shareholder redemptions of Portfolio shares as investors anticipate adverse effects on the Portfolio or seek higher yields to offset the potential loss of the tax deduction. As a result, the Portfolio would be required to maintain higher levels of cash to meet the redemptions, which would negatively affect the Portfolio’s yield.
Duration Risk—Duration is the measure that relates the expected price volatility of a fixed-income security to changes in interest rates. The duration of a fixed-income security may be shorter than or equal to full maturity of a fixed-income security. Fixed-income securities with longer durations have more risk and will decrease in price as interest rates rise. For example, a fixed-income security with a duration of three years will decrease in value by approximately 3% if interest rates increase by 1%.
| | |
| 142 | | • AB MUNICIPAL INCOME FUND |
Notes to Financial Statements
Below Investment Grade Securities Risk—Investments in fixed-income securities with lower ratings (commonly known as “junk bonds”) tend to have a higher probability that an issuer will default or fail to meet its payment obligations. These securities may be subject to greater price volatility due to such factors as specific corporate developments, interest rate sensitivity, negative performance of the junk bond market generally and less secondary market liquidity.
NOTE G
Joint Credit Facility
A number of open-end mutual funds managed by the Adviser, including the Portfolios, participate in a $280 million revolving credit facility (the “Facility”) intended to provide short-term financing, if necessary, subject to certain restrictions in connection with abnormal redemption activity. Commitment fees related to the Facility are paid by the participating funds and are included in miscellaneous expenses in the statement of operations. The Portfolios did not utilize the Facility during the period ended May 31, 2015.
NOTE H
Distributions to Shareholders
The tax character of distributions paid during the fiscal period ended May 31, 2015 and years ended October 31, 2014 and October 31, 2013 were as follows:
| | | | | | | | | | | | |
| AB National Portfolio | | 2015 | | | 2014 | | | 2013 | |
Distributions paid from: | | | | | | | | | | | | |
Ordinary income | | $ | 184,929 | | | $ | 458,398 | | | $ | 317,288 | |
| | | | | | | | | | | | |
Total taxable distributions | | | 184,929 | | | | 458,398 | | | | 317,288 | |
Tax exempt distributions | | | 19,929,492 | | | | 33,538,574 | | | | 37,413,572 | |
| | | | | | | | | | | | |
Total distributions paid | | $ | 20,114,421 | | | $ | 33,996,972 | | | $ | 37,730,860 | |
| | | | | | | | | | | | |
| | | |
AB High Income Municipal
Portfolio | | 2015 | | | 2014 | | | 2013 | |
Distributions paid from: | | | | | | | | | | | | |
Ordinary income | | $ | 2,657,048 | | | $ | 1,640,685 | | | $ | 1,616,325 | |
| | | | | | | | | | | | |
Total taxable distributions | | | 2,657,048 | | | | 1,640,685 | | | | 1,616,325 | |
Tax exempt distributions | | | 50,492,035 | | | | 72,655,517 | | | | 63,797,282 | |
| | | | | | | | | | | | |
Total distributions paid | | $ | 53,149,083 | | | $ | 74,296,202 | | | $ | 65,413,607 | |
| | | | | | | | | | | | |
| | | |
| AB California Portfolio | | 2015 | | | 2014 | | | 2013 | |
Distributions paid from: | | | | | | | | | | | | |
Ordinary income | | $ | 207,341 | | | $ | 368,107 | | | $ | 448,143 | |
Long-term capital gains | | | – 0 | – | | | – 0 | – | | | 1,632,466 | |
| | | | | | | | | | | | |
Total taxable distributions | | | 207,341 | | | | 368,107 | | | | 2,080,609 | |
Tax return of capital | | | – 0 | – | | | – 0 | – | | | 176,010 | |
Tax exempt distributions | | | 10,975,592 | | | | 19,241,387 | | | | 21,571,136 | |
| | | | | | | | | | | | |
Total distributions paid | | $ | 11,182,933 | | | $ | 19,609,494 | | | $ | 23,827,755 | |
| | | | | | | | | | | | |
| | | | |
| AB MUNICIPAL INCOME FUND • | | | 143 | |
Notes to Financial Statements
| | | | | | | | | | | | |
| AB New York Portfolio | | 2015 | | | 2014 | | | 2013 | |
Distributions paid from: | | | | | | | | | | | | |
Ordinary income | | $ | 66,957 | | | $ | 113,695 | | | $ | 196,136 | |
Long-term capital gains | | | – 0 | – | | | – 0 | – | | | 1,184,780 | |
| | | | | | | | | | | | |
Total taxable distributions | | | 66,957 | | | | 113,695 | | | | 1,380,916 | |
Tax return of capital | | | – 0 | – | | | – 0 | – | | | 205,091 | |
Tax exempt distributions | | | 9,573,096 | | | | 17,716,412 | | | | 21,517,725 | |
| | | | | | | | | | | | |
Total distributions paid | | $ | 9,640,053 | | | $ | 17,830,107 | | | $ | 23,103,732 | |
| | | | | | | | | | | | |
As of May 31, 2015, the components of accumulated earnings/(deficit) on a tax basis were as follows:
| | | | | | | | | | | | | | | | |
| Portfolio | | Undistributed
Tax-Exempt
Income | | | Accumulated
Capital and
Other Losses(a) | | | Unrealized
Appreciation/
(Depreciation)(b) | | | Total
Accumulated
Earnings/
(Deficit)(c) | |
AB National | | $ | 255,105 | | | $ | (25,366,907 | ) | | $ | 46,231,679 | | | $ | 21,119,877 | |
AB High Income Municipal | | | 3,749,843 | | | | (42,227,797 | ) | | | 101,621,354 | | | | 63,143,400 | |
AB California | | | – 0 | – | | | (3,296,579 | ) | | | 50,371,516 | | | | 47,074,937 | |
AB New York | | | – 0 | – | | | (17,767,357 | ) | | | 28,743,883 | | | | 10,976,526 | |
| (a) | | At May 31, 2015 AB National Portfolio, AB High Income Municipal Portfolio, AB California Portfolio and AB New York Portfolio had capital loss carryforwards for federal income tax purposes. During the fiscal period, AB National Portfolio, AB High Income Municipal Portfolio, AB California Portfolio and AB New York Portfolio utilized capital loss carryforwards of $4,147,022, $286,988, $2,912,333 and $1,565,170, respectively, to offset current year net realized gains. |
| (b) | | The differences between book-basis and tax-basis unrealized appreciation/(depreciation) are attributable primarily to the tax deferral of losses on wash sales and the tax treatment of swaps and tender option bonds. |
| (c) | | The differences between book-basis and tax-basis components of accumulated earnings/(deficit) are attributable primarily to the tax treatment of defaulted securities, the amortization of offering costs and dividends payable to shareholders. |
For tax purposes, net capital losses may be carried over to offset future capital gains, if any. Funds are permitted to carry forward capital losses incurred in taxable years beginning after December 22, 2010 for an indefinite period. These post-December 22, 2010 capital losses must be utilized prior to the earlier capital losses, which are subject to expiration. Post-December 22, 2010 capital loss carryforwards will retain their character as either short-term or long-term capital losses rather than being considered short-term as under previous regulation.
As of May 31, 2015, certain Portfolios had net capital loss carryforwards which will expire as follows:
| | | | | | | | | | | | |
| Portfolio | | Short-Term
Amount | | | Long-Term
Amount | | | Expiration | |
AB National | | $ | 13,398,175 | | | $ | 11,968,732 | | | | No expiration | |
AB High Income Municipal | | | 4,182,905 | | | | n/a | | | | 2019 | |
| | |
| 144 | | • AB MUNICIPAL INCOME FUND |
Notes to Financial Statements
| | | | | | | | | | | | |
| Portfolio | | Short-Term
Amount | | | Long-Term
Amount | | | Expiration | |
AB High Income Municipal | | $ | 23,317,988 | | | $ | 14,726,904 | | | | No expiration | |
AB California | | | 2,554,933 | | | | 741,646 | | | | No expiration | |
AB New York | | | 7,864,127 | | | | 9,903,230 | | | | No expiration | |
During the current fiscal period, the Portfolios had adjustments due to permanent differences. Permanent differences have no effect on net assets. The effect of such permanent differences on each Portfolio—primarily due to the tax treatment of swaps and swap clearing fees, dividend overdistributions, and the tax treatment of proceeds from the sale of defaulted securities—is reflected as an adjustment to the components of capital as of May 31, 2015 as shown below:
| | | | | | | | | | | | |
| Portfolio | | Increase (Decrease)
to Additional Paid-In Capital | | | Increase (Decrease)
to Undistributed/
(Distributions in Excess of) Net Investment
Income | | | Increase (Decrease)
to Accumulated Net
Realized
Gain (Loss) on
Investment
Transactions | |
AB National | | $ | – 0 | – | | $ | 193,402 | | | $ | (193,402 | ) |
AB High Income Municipal | | | – 0 | – | | | 1,486,877 | | | | (1,486,877 | ) |
AB California | | | (93,589 | ) | | | (425,362 | ) | | | 518,951 | |
AB New York | | | (46,454 | ) | | | 114,143 | | | | (67,689 | ) |
NOTE I
Floating Rate Notes Issued in Connection with Securities Held
Each Portfolio may engage in tender option bond transactions in which the Portfolio may transfer a fixed rate bond (“Fixed Rate Bond”) to a broker for cash. The broker deposits the Fixed Rate Bond into a Special Purpose Vehicle (the “SPV”, which is generally organized as a trust), organized by the broker. The Portfolio buys a residual interest in the assets and cash flows of the SPV, often referred to as an inverse floating rate obligation (“Inverse Floater”). The SPV also issues floating rate notes (“Floating Rate Notes”) which are sold to third parties. The Floating Rate Notes pay interest at rates that generally reset weekly and their holders have the option to tender their notes to a liquidity provider for redemption at par. The Inverse Floater held by the Portfolio gives the Portfolio the right (1) to cause the holders of the Floating Rate Notes to tender their notes at par, and (2) to have the trustee transfer the Fixed Rate Bond held by the SPV to the Portfolio, thereby collapsing the SPV. The SPV may also be collapsed in certain other circumstances. In accordance with U.S. GAAP requirements regarding accounting for transfers and servicing of financial assets and extinguishments of liabilities, the Portfolio accounts for the transaction described above as a secured borrowing by including the Fixed Rate Bond in its portfolio of investments and the Floating Rate Notes as a liability under the caption “Payable for floating rate notes issued” in its statement of assets and liabilities. Interest expense related to the Portfolios’ liability with respect to Floating Rate Notes is recorded as incurred. The interest expense is also
| | | | |
| AB MUNICIPAL INCOME FUND • | | | 145 | |
Notes to Financial Statements
included in the Portfolios’ expense ratio. At May 31, 2015, the amount of Floating Rate Notes outstanding was $5,700,000, $159,630,000, $4,445,000 and $5,940,000 and the related interest rate was 0.11%, 0.11% to 0.12%, 0.11% and 0.14% for AB National, AB High Income Municipal, AB California and AB New York Portfolios, respectively.
Each Portfolio may also purchase Inverse Floaters in the secondary market without first owning the underlying bond. Such an Inverse Floater is included in the portfolio of investments but is not required to be treated as a secured borrowing and reflected in the Portfolio’s financial statements as a secured borrowing. For the period ended May 31, 2015, the Portfolios did not engage in such transactions.
NOTE J
Subsequent Events
Management has evaluated subsequent events for possible recognition or disclosure in the financial statements through the date the financial statements are issued. Management has determined that there are no material events that would require disclosure in the Portfolios’ financial statements through this date.
| | |
| 146 | | • AB MUNICIPAL INCOME FUND |
Notes to Financial Statements
FINANCIAL HIGHLIGHTS
Selected Data For A Share Of Capital Stock Outstanding Throughout Each Period
| | | | | | | | | | | | | | | | | | | | | | | | |
| | | AB National Portfolio | |
| | | Class A | |
| | | November 1,
2014 to May 31, 2015(a) | | | Year Ended October 31, | |
| | | | 2014 | | | 2013 | | | 2012 | | | 2011 | | | 2010 | |
| | | | |
| | | | | | | | | | | | | | | | | | | | | | | | |
Net asset value, beginning of period | | | $ 10.34 | | | | $ 9.91 | | | | $ 10.61 | | | | $ 9.97 | | | | $ 10.04 | | | | $ 9.62 | |
| | | | |
Income From Investment Operations | | | | | | | | | | | | | | | | | | | | | | | | |
Net investment
income(b)(c) | | | .20 | | | | .37 | | | | .36 | | | | .39 | | | | .43 | | | | .41 | |
Net realized and unrealized gain (loss) on investment transactions | | | (.13 | ) | | | .43 | | | | (.70 | ) | | | .65 | | | | (.07 | ) | | | .42 | |
| | | | |
Net increase (decrease)
in net asset value from operations | | | .07 | | | | .80 | | | | (.34 | ) | | | 1.04 | | | | .36 | | | | .83 | |
| | | | |
Less: Dividends | | | | | | | | | | | | | | | | | | | | | | | | |
Dividends from net investment income | | | (.21 | ) | | | (.37 | ) | | | (.36 | ) | | | (.40 | ) | | | (.43 | ) | | | (.41 | ) |
| | | | |
Net asset value, end of
period | | | $ 10.20 | | | | $ 10.34 | | | | $ 9.91 | | | | $ 10.61 | | | | $ 9.97 | | | | $ 10.04 | |
| | | | |
Total Return | | | | | | | | | | | | | | | | | | | | | | | | |
Total investment return based on net asset value(d) | | | .62 | % | | | 8.23 | % | | | (3.27 | )% | | | 10.57 | % | | | 3.80 | % | | | 8.81 | % |
Ratios/Supplemental Data | | | | | | | | | | | | | | | | | | | | | | | | |
Net assets, end of period
(000’s omitted) | | | $612,321 | | | | $581,215 | | | | $649,618 | | | | $754,297 | | | | $641,972 | | | | $712,033 | |
Ratio to average net assets of: | | | | | | | | | | | | | | | | | | | | | | | | |
Expenses, net of waivers/reimbursements(e) | | | .78 | %^ | | | .81 | % | | | .80 | % | | | .76 | % | | | .76 | % | | | .76 | %+ |
Expenses, before waivers/reimbursements(e) | | | .82 | %^ | | | .86 | % | | | .86 | % | | | .86 | % | | | .88 | % | | | .87 | %+ |
Net investment income(b) | | | 3.39 | %^ | | | 3.65 | % | | | 3.45 | % | | | 3.81 | % | | | 4.42 | % | | | 4.16 | %+ |
Portfolio turnover rate | | | 6 | % | | | 19 | % | | | 26 | % | | | 11 | % | | | 8 | % | | | 13 | % |
See footnote summary on pages 162-163.
| | | | |
| AB MUNICIPAL INCOME FUND • | | | 147 | |
Financial Highlights
Selected Data For A Share Of Capital Stock Outstanding Throughout Each Period
| | | | | | | | | | | | | | | | | | | | | | | | |
| | | AB National Portfolio | |
| | | Class B | |
| | | November 1,
2014 to May 31, 2015(a) | | | Year Ended October 31, | |
| | | | 2014 | | | 2013 | | | 2012 | | | 2011 | | | 2010 | |
| | | | |
| | | | | | | | | | | | | | | | | | | | | | | | |
Net asset value, beginning of period | | | $ 10.32 | | | | $ 9.90 | | | | $ 10.60 | | | | $ 9.96 | | | | $ 10.02 | | | | $ 9.61 | |
| | | | |
Income From Investment Operations | | | | | | | | | | | | | | | | | | | | | | | | |
Net investment
income(b)(c) | | | .16 | | | | .30 | | | | .28 | | | | .33 | | | | .36 | | | | .34 | |
Net realized and unrealized gain (loss) on investment transactions | | | (.13 | ) | | | .42 | | | | (.69 | ) | | | .64 | | | | (.06 | ) | | | .41 | |
| | | | |
Net increase (decrease)
in net asset value from operations | | | .03 | | | | .72 | | | | (.41 | ) | | | .97 | | | | .30 | | | | .75 | |
| | | | |
Less: Dividends | | | | | | | | | | | | | | | | | | | | | | | | |
Dividends from net investment income | | | (.16 | ) | | | (.30 | ) | | | (.29 | ) | | | (.33 | ) | | | (.36 | ) | | | (.34 | ) |
| | | | |
Net asset value, end of period | | | $ 10.19 | | | | $ 10.32 | | | | $ 9.90 | | | | $ 10.60 | | | | $ 9.96 | | | | $ 10.02 | |
| | | | |
Total Return | | | | | | | | | | | | | | | | | | | | | | | | |
Total investment return based on net asset value(d) | | | .30 | % | | | 7.39 | % | | | (3.95 | )% | | | 9.83 | % | | | 3.19 | % | | | 7.97 | % |
Ratios/Supplemental Data | | | | | | | | | | | | | | | | | | | | | | | | |
Net assets, end of period
(000’s omitted) | | | $920 | | | | $1,451 | | | | $3,126 | | | | $5,368 | | | | $7,334 | | | | $12,640 | |
Ratio to average net assets of: | | | | | | | | | | | | | | | | | | | | | | | | |
Expenses, net of waivers/reimbursements(e) | | | 1.51 | %^ | | | 1.51 | % | | | 1.49 | % | | | 1.46 | % | | | 1.46 | % | | | 1.46 | %+ |
Expenses, before waivers/reimbursements(e) | | | 1.57 | %^ | | | 1.57 | % | | | 1.57 | % | | | 1.58 | % | | | 1.60 | % | | | 1.60 | %+ |
Net investment income(b) | | | 2.69 | %^ | | | 2.98 | % | | | 2.75 | % | | | 3.16 | % | | | 3.74 | % | | | 3.48 | %+ |
Portfolio turnover rate | | | 6 | % | | | 19 | % | | | 26 | % | | | 11 | % | | | 8 | % | | | 13 | % |
See footnote summary on pages 162-163.
| | |
| 148 | | • AB MUNICIPAL INCOME FUND |
Financial Highlights
Selected Data For A Share Of Capital Stock Outstanding Throughout Each Period
| | | | | | | | | | | | | | | | | | | | | | | | |
| | | AB National Portfolio | |
| | | Class C | |
| | | November 1,
2014 to May 31, 2015(a) | | | Year Ended October 31, | |
| | | | 2014 | | | 2013 | | | 2012 | | | 2011 | | | 2010 | |
| | | | |
| | | | | | | | | | | | | | | | | | | | | | | | |
Net asset value, beginning of period | | | $ 10.33 | | | | $ 9.90 | | | | $ 10.60 | | | | $ 9.96 | | | | $ 10.03 | | | | $ 9.61 | |
| | | | |
Income From Investment Operations | | | | | | | | | | | | | | | | | | | | | | | | |
Net investment
income(b)(c) | | | .16 | | | | .30 | | | | .29 | | | | .32 | | | | .36 | | | | .34 | |
Net realized and unrealized gain (loss) on investment transactions | | | (.14 | ) | | | .43 | | | | (.70 | ) | | | .64 | | | | (.07 | ) | | | .42 | |
| | | | |
Net increase (decrease)
in net asset value from operations | | | .02 | | | | .73 | | | | (.41 | ) | | | .96 | | | | .29 | | | | .76 | |
| | | | |
Less: Dividends | | | | | | | | | | | | | | | | | | | | | | | | |
Dividends from net investment income | | | (.16 | ) | | | (.30 | ) | | | (.29 | ) | | | (.32 | ) | | | (.36 | ) | | | (.34 | ) |
| | | | |
Net asset value, end of period | | | $ 10.19 | | | | $ 10.33 | | | | $ 9.90 | | | | $ 10.60 | | | | $ 9.96 | | | | $ 10.03 | |
| | | | |
Total Return | | | | | | | | | | | | | | | | | | | | | | | | |
Total investment return based on net asset value(d) | | | .20 | % | | | 7.49 | % | | | (3.95 | )% | | | 9.81 | % | | | 3.09 | % | | | 8.07 | % |
Ratios/Supplemental Data | | | | | | | | | | | | | | | | | | | | | | | | |
Net assets, end of period
(000’s omitted) | | | $131,936 | | | | $130,601 | | | | $144,358 | | | | $172,228 | | | | $140,265 | | | | $153,200 | |
Ratio to average net assets of: | | | | | | | | | | | | | | | | | | | | | | | | |
Expenses, net of waivers/reimbursements(e) | | | 1.51 | %^ | | | 1.51 | % | | | 1.50 | % | | | 1.46 | % | | | 1.46 | % | | | 1.46 | %+ |
Expenses, before waivers/reimbursements(e) | | | 1.56 | %^ | | | 1.56 | % | | | 1.56 | % | | | 1.57 | % | | | 1.58 | % | | | 1.58 | %+ |
Net investment income(b) | | | 2.67 | %^ | | | 2.96 | % | | | 2.76 | % | | | 3.11 | % | | | 3.72 | % | | | 3.47 | %+ |
Portfolio turnover rate | | | 6 | % | | | 19 | % | | | 26 | % | | | 11 | % | | | 8 | % | | | 13 | % |
See footnote summary on pages 162-163.
| | | | |
| AB MUNICIPAL INCOME FUND • | | | 149 | |
Financial Highlights
Selected Data For A Share Of Capital Stock Outstanding Throughout Each Period
| | | | | | | | | | | | | | | | | | | | | | | | |
| | | AB National Portfolio | |
| | | Advisor Class | |
| | | November 1,
2014 to
May 31,
2015(a) | | | Year Ended October 31, | |
| | | | 2014 | | | 2013 | | | 2012 | | | 2011 | | | 2010 | |
| | | | |
| | | | | | | | | | | | | | | | | | | | | | | | |
Net asset value, beginning of period | | | $ 10.34 | | | | $ 9.91 | | | | $ 10.61 | | | | $ 9.97 | | | | $ 10.04 | | | | $ 9.62 | |
| | | | |
Income From Investment Operations | | | | | | | | | | | | | | | | | | | | | | | | |
Net investment
income(b)(c) | | | .22 | | | | .40 | | | | .39 | | | | .42 | | | | .46 | | | | .44 | |
Net realized and unrealized gain (loss) on investment transactions | | | (.13 | ) | | | .43 | | | | (.70 | ) | | | .65 | | | | (.07 | ) | | | .42 | |
| | | | |
Net increase (decrease)
in net asset value from operations | | | .09 | | | | .83 | | | | (.31 | ) | | | 1.07 | | | | .39 | | | | .86 | |
| | | | |
Less: Dividends | | | | | | | | | | | | | | | | | | | | | | | | |
Dividends from net investment income | | | (.22 | ) | | | (.40 | ) | | | (.39 | ) | | | (.43 | ) | | | (.46 | ) | | | (.44 | ) |
| | | | |
Net asset value, end of period | | | $ 10.21 | | | | $ 10.34 | | | | $ 9.91 | | | | $ 10.61 | | | | $ 9.97 | | | | $ 10.04 | |
| | | | |
Total Return | | | | | | | | | | | | | | | | | | | | | | | | |
Total investment return based on net asset value(d) | | | .88 | % | | | 8.55 | % | | | (2.98 | )% | | | 10.91 | % | | | 4.11 | % | | | 9.14 | % |
Ratios/Supplemental Data | | | | | | | | | | | | | | | | | | | | | | | | |
Net assets, end of period
(000’s omitted) | | | $315,809 | | | | $254,434 | | | | $165,782 | | | | $186,303 | | | | $94,240 | | | | $72,609 | |
Ratio to average net assets of: | | | | | | | | | | | | | | | | | | | | | | | | |
Expenses, net of waivers/reimbursements(e) | | | .51 | %^ | | | .51 | % | | | .50 | % | | | .46 | % | | | .46 | % | | | .46 | %+ |
Expenses, before waivers/reimbursements(e) | | | .55 | %^ | | | .55 | % | | | .56 | % | | | .56 | % | | | .58 | % | | | .57 | %+ |
Net investment income(b) | | | 3.66 | %^ | | | 3.92 | % | | | 3.74 | % | | | 4.08 | % | | | 4.70 | % | | | 4.45 | %+ |
Portfolio turnover rate | | | 6 | % | | | 19 | % | | | 26 | % | | | 11 | % | | | 8 | % | | | 13 | % |
See footnote summary on pages 162-163.
| | |
| 150 | | • AB MUNICIPAL INCOME FUND |
Financial Highlights
Selected Data For A Share Of Capital Stock Outstanding Throughout Each Period
| | | | | | | | | | | | | | | | | | | | | | | | |
| | | AB High Income Municipal Portfolio | |
| | | Class A | |
| | | November 1,
2014 to
May 31,
2015(a) | | | Year Ended October 31, | | | January 26,
2010(f) to
October 31,
2010 | |
| | | | 2014 | | | 2013 | | | 2012 | | | 2011 | | |
| | | | |
| | | | | | | | | | | | | | | | | | | | | | | | |
Net asset value,
beginning of period | | | $ 11.22 | | | | $ 10.29 | | | | $ 11.48 | | | | $ 10.22 | | | | $ 10.69 | | | | $ 10.00 | |
| | | | |
Income From Investment Operations | | | | | | | | | | | | | | | | | | | | | | | | |
Net investment
income(b)(c) | | | .28 | | | | .54 | | | | .53 | | | | .53 | | | | .54 | | | | .40 | |
Net realized and
unrealized gain (loss)
on investment
transactions | | | (.01 | ) | | | .93 | | | | (1.18 | ) | | | 1.28 | | | | (.42 | ) | | | .71 | |
Contributions from
Affiliates | | | – 0 | – | | | .00 | (g) | | | – 0 | – | | | – 0 | – | | | – 0 | – | | | – 0 | – |
| | | | |
Net increase (decrease)
in net asset value from
operations | | | .27 | | | | 1.47 | | | | (.65 | ) | | | 1.81 | | | | .12 | | | | 1.11 | |
| | | | |
Less: Dividends and Distributions | | | | | | | | | | | | | | | | | | | | | | | | |
Dividends from net investment income | | | (.29 | ) | | | (.54 | ) | | | (.54 | ) | | | (.55 | ) | | | (.56 | ) | | | (.42 | ) |
Distributions from net realized gain on investment transactions | | | – 0 | – | | | – 0 | – | | | – 0 | – | | | – 0 | – | | | (.03 | ) | | | – 0 | – |
| | | | |
Total dividends and distributions | | | (.29 | ) | | | (.54 | ) | | | (.54 | ) | | | (.55 | ) | | | (.59 | ) | | | (.42 | ) |
| | | | |
Net asset value, end of period | | | $ 11.20 | | | | $ 11.22 | | | | $ 10.29 | | | | $ 11.48 | | | | $ 10.22 | | | | $ 10.69 | |
| | | | |
Total Return | | | | | | | | | | | | | | | | | | | | | | | | |
Total investment return based on net asset value(d) | | | 2.45 | % | | | 14.62 | % | | | (5.88 | )% | | | 18.08 | % | | | 1.47 | % | | | 11.31 | % |
Ratios/Supplemental
Data | | | | | | | | | | | | | | | | | | | | | | | | |
Net assets, end of period
(000’s omitted) | | | $693,523 | | | | $627,941 | | | | $593,742 | | | | $613,787 | | | | $279,661 | | | | $240,484 | |
Ratio to average net
assets of: | | | | | | | | | | | | | | | | | | | | | | | | |
Expenses, net of
waivers/reimbursements(e) | | | .86 | %^ | | | .89 | % | | | .89 | % | | | .91 | % | | | .92 | % | | | .90 | %+^(h) |
Expenses, before
waivers/reimbursements(e) | | | .89 | %^ | | | .96 | % | | | .98 | % | | | 1.00 | % | | | 1.06 | % | | | 1.27 | %+^ |
Net investment
income(b) | | | 4.33 | %^ | | | 4.99 | % | | | 4.78 | % | | | 4.81 | % | | | 5.51 | % | | | 5.29 | %+^ |
Portfolio turnover rate | | | 9 | % | | | 17 | % | | | 41 | % | | | 14 | % | | | 43 | % | | | 27 | % |
See footnote summary on pages 162-163.
| | | | |
| AB MUNICIPAL INCOME FUND • | | | 151 | |
Financial Highlights
Selected Data For A Share Of Capital Stock Outstanding Throughout Each Period
| | | | | | | | | | | | | | | | | | | | | | | | |
| | | AB High Income Municipal Portfolio | |
| | | Class C | |
| | | November 1,
2014 to
May 31,
2015(a) | | | Year Ended October 31, | | | January 26,
2010(f) to
October 31,
2010 | |
| | | | 2014 | | | 2013 | | | 2012 | | | 2011 | | |
| | | | |
| | | | | | | | | | | | | | | | | | | | | | | | |
Net asset value,
beginning of period | | | $ 11.22 | | | | $ 10.29 | | | | $ 11.48 | | | | $ 10.22 | | | | $ 10.69 | | | | $ 10.00 | |
| | | | |
Income From Investment Operations | | | | | | | | | | | | | | | | | | | | | | | | |
Net investment
income(b)(c) | | | .24 | | | | .46 | | | | .46 | | | | .45 | | | | .47 | | | | .36 | |
Net realized and
unrealized gain (loss)
on investment transactions | | | (.01 | ) | | | .93 | | | | (1.19 | ) | | | 1.28 | | | | (.42 | ) | | | .69 | |
Contributions from
Affiliates | | | – 0 | – | | | .00 | (g) | | | – 0 | – | | | – 0 | – | | | – 0 | – | | | – 0 | – |
| | | | |
Net increase (decrease)
in net asset value from operations | | | .23 | | | | 1.39 | | | | (.73 | ) | | | 1.73 | | | | .05 | | | | 1.05 | |
| | | | |
Less: Dividends and Distributions | | | | | | | | | | | | | | | | | | | | | | | | |
Dividends from net investment income | | | (.25 | ) | | | (.46 | ) | | | (.46 | ) | | | (.47 | ) | | | (.49 | ) | | | (.36 | ) |
Distributions from net realized gain on investment transactions | | | – 0 | – | | | – 0 | – | | | – 0 | – | | | – 0 | – | | | (.03 | ) | | | – 0 | – |
| | | | |
Total dividends and distributions | | | (.25 | ) | | | (.46 | ) | | | (.46 | ) | | | (.47 | ) | | | (.52 | ) | | | (.36 | ) |
| | | | |
Net asset value, end of period | | | $ 11.20 | | | | $ 11.22 | | | | $ 10.29 | | | | $ 11.48 | | | | $ 10.22 | | | | $ 10.69 | |
| | | | |
Total Return | | | | | | | | | | | | | | | | | | | | | | | | |
Total investment return based on net asset value(d) | | | 2.02 | % | | | 13.83 | % | | | (6.53 | )% | | | 17.27 | % | | | .76 | % | | | 10.73 | % |
Ratios/Supplemental Data | | | | | | | | | | | | | | | | | | | | | | | | |
Net assets, end of period
(000’s omitted) | | | $284,261 | | | | $256,667 | | | | $209,480 | | | | $212,480 | | | | $87,012 | | | | $68,911 | �� |
Ratio to average net
assets of: | | | | | | | | | | | | | | | | | | | | | | | | |
Expenses, net of
waivers/reimbursements(e) | | | 1.59 | %^ | | | 1.59 | % | | | 1.59 | % | | | 1.61 | % | | | 1.62 | % | | | 1.59 | %+^(h) |
Expenses, before
waivers/reimbursements(e) | | | 1.62 | %^ | | | 1.66 | % | | | 1.68 | % | | | 1.71 | % | | | 1.76 | % | | | 2.00 | %+^ |
Net investment income(b) | | | 3.61 | %^ | | | 4.28 | % | | | 4.09 | % | | | 4.10 | % | | | 4.81 | % | | | 4.63 | %+^ |
Portfolio turnover rate | | | 9 | % | | | 17 | % | | | 41 | % | | | 14 | % | | | 43 | % | | | 27 | % |
See footnote summary on pages 162-163.
| | |
| 152 | | • AB MUNICIPAL INCOME FUND |
Financial Highlights
Selected Data For A Share Of Capital Stock Outstanding Throughout Each Period
| | | | | | | | | | | | | | | | | | | | | | | | |
| | | AB High Income Municipal Portfolio | |
| | | Advisor Class | |
| | | November 1,
2014 to
May 31, 2015(a) | | | Year Ended October 31, | | | January 26,
2010(f) to
October 31,
2010 | |
| | | | 2014 | | | 2013 | | | 2012 | | | 2011 | | |
| | | | |
| | | | | | | | | | | | | | | | | | | | | | | | |
Net asset value,
beginning of period | | | $ 11.22 | | | | $ 10.29 | | | | $ 11.48 | | | | $ 10.22 | | | | $ 10.69 | | | | $ 10.00 | |
| | | | |
Income From Investment Operations | | | | | | | | | | | | | | | | | | | | | | | | |
Net investment
income(b)(c) | | | .30 | | | | .56 | | | | .57 | | | | .56 | | | | .57 | | | | .43 | |
Net realized and
unrealized gain (loss)
on investment transactions | | | (.01 | ) | | | .94 | | | | (1.19 | ) | | | 1.28 | | | | (.42 | ) | | | .70 | |
Contributions from
Affiliates | | | – 0 | – | | | .00 | (e) | | | – 0 | – | | | – 0 | – | | | – 0 | – | | | – 0 | – |
| | | | |
Net increase (decrease)
in net asset value from operations | | | .29 | | | | 1.50 | | | | (.62 | ) | | | 1.84 | | | | .15 | | | | 1.13 | |
| | | | |
Less: Dividends and Distributions | | | | | | | | | | | | | | | | | | | | | | | | |
Dividends from net investment income | | | (.31 | ) | | | (.57 | ) | | | (.57 | ) | | | (.58 | ) | | | (.59 | ) | | | (.44 | ) |
Distributions from net realized gain on investment transactions | | | – 0 | – | | | – 0 | – | | | – 0 | – | | | – 0 | – | | | (.03 | ) | | | – 0 | – |
| | | | |
Total dividends and distributions | | | (.31 | ) | | | (.57 | ) | | | (.57 | ) | | | (.58 | ) | | | (.62 | ) | | | (.44 | ) |
| | | | |
Net asset value, end of period | | | $ 11.20 | | | | $ 11.22 | | | | $ 10.29 | | | | $ 11.48 | | | | $ 10.22 | | | | $ 10.69 | |
| | | | |
Total Return | | | | | | | | | | | | | | | | | | | | | | | | |
Total investment return based on net asset value(d) | | | 2.61 | % | | | 14.97 | % | | | (5.60 | )% | | | 18.44 | % | | | 1.77 | % | | | 11.56 | % |
Ratios/Supplemental Data | | | | | | | | | | | | | | | | | | | | | | | | |
Net assets, end of period
(000’s omitted) | | | $1,084,612 | | | | $964,020 | | | | $418,473 | | | | $435,548 | | | | $188,932 | | | | $100,804 | |
Ratio to average net
assets of: | | | | | | | | | | | | | | | | | | | | | | | | |
Expenses, net of
waivers/reimbursements(e) | | | .59 | %^ | | | .59 | % | | | .59 | % | | | .61 | % | | | .62 | % | | | .57 | %+^(h) |
Expenses, before waivers/reimbursements(e) | | | .62 | %^ | | | .66 | % | | | .68 | % | | | .71 | % | | | .76 | % | | | 1.12 | %+^ |
Net investment income(b) | | | 4.60 | %^ | | | 5.20 | % | | | 5.08 | % | | | 5.13 | % | | | 5.81 | % | | | 5.56 | %+^ |
Portfolio turnover rate | | | 9 | % | | | 17 | % | | | 41 | % | | | 14 | % | | | 43 | % | | | 27 | % |
See footnote summary on pages 162-163.
| | | | |
| AB MUNICIPAL INCOME FUND • | | | 153 | |
Financial Highlights
Selected Data For A Share Of Capital Stock Outstanding Throughout Each Period
| | | | | | | | | | | | | | | | | | | | | | | | |
| | | AB California Portfolio | |
| | | Class A | |
| | | November 1,
2014 to
May 31, 2015(a) | | | Year Ended October 31, | |
| | | | 2014 | | | 2013 | | | 2012 | | | 2011 | | | 2010 | |
| | | | |
| | | | | | | | | | | | | | | | | | | | | | | | |
Net asset value,
beginning of period | | | $ 11.44 | | | | $ 10.83 | | | | $ 11.51 | | | | $ 10.84 | | | | $ 10.94 | | | | $ 10.51 | |
| | | | |
Income From Investment Operations | | | | | | | | | | | | | | | | | | | | | | | | |
Net investment
income(b)(c) | | | .23 | | | | .41 | | | | .41 | | | | .44 | | | | .46 | | | | .46 | |
Net realized and
unrealized gain (loss)
on investment transactions | | | (.18 | ) | | | .59 | | | | (.67 | ) | | | .65 | | | | (.10 | ) | | | .42 | |
| | | | |
Net increase (decrease)
in net asset value from operations | | | .05 | | | | 1.00 | | | | (.26 | ) | | | 1.09 | | | | .36 | | | | .88 | |
| | | | |
Less: Dividends and Distributions | | | | | | | | | | | | | | | | | | | | | | | | |
Dividends from net investment income | | | (.22 | ) | | | (.39 | ) | | | (.39 | ) | | | (.42 | ) | | | (.45 | ) | | | (.45 | ) |
Distributions from net realized gain on investment transactions | | | – 0 | – | | | – 0 | – | | | (.03 | ) | | | – 0 | – | | | (.01 | ) | | | – 0 | – |
Tax return of capital | | | – 0 | – | | | – 0 | – | | | (.00 | )(g) | | | – 0 | – | | | – 0 | – | | | – 0 | – |
| | | | |
Total dividends and distributions | | | (.22 | ) | | | (.39 | ) | | | (.42 | ) | | | (.42 | ) | | | (.46 | ) | | | (.45 | ) |
| | | | |
Net asset value, end of period | | | $ 11.27 | | | | $ 11.44 | | | | $ 10.83 | | | | $ 11.51 | | | | $ 10.84 | | | | $ 10.94 | |
| | | | |
Total Return | | | | | | | | | | | | | | | | | | | | | | | | |
Total investment return based on net asset value(d) | | | .46 | % | | | 9.42 | % | | | (2.31 | )% | | | 10.19 | % | | | 3.47 | % | | | 8.49 | % |
Ratios/Supplemental
Data | | | | | | | | | | | | | | | | | | | | | | | | |
Net assets, end of period
(000’s omitted) | | | $440,324 | | | | $442,905 | | | | $462,298 | | | | $533,057 | | | | $511,656 | | | | $599,027 | |
Ratio to average net
assets of: | | | | | | | | | | | | | | | | | | | | | | | | |
Expenses, net of
waivers/reimbursements(e) | | | .78 | %^ | | | .81 | % | | | .80 | % | | | .76 | % | | | .76 | % | | | .75 | %+ |
Expenses, before
waivers/reimbursements(e) | | | .83 | %^ | | | .86 | % | | | .85 | % | | | .85 | % | | | .86 | % | | | .85 | %+ |
Net investment income(b) | | | 3.52 | %^ | | | 3.72 | % | | | 3.68 | % | | | 3.89 | % | | | 4.39 | % | | | 4.30 | %+ |
Portfolio turnover rate | | | 12 | % | | | 14 | % | | | 22 | % | | | 23 | % | | | 12 | % | | | 8 | % |
See footnote summary on pages 162-163.
| | |
| 154 | | • AB MUNICIPAL INCOME FUND |
Financial Highlights
Selected Data For A Share Of Capital Stock Outstanding Throughout Each Period
| | | | | | | | | | | | | | | | | | | | | | | | |
| | | AB California Portfolio | |
| | | Class B | |
| | | November 1,
2014 to
May 31, 2015(a) | | | Year Ended October 31, | |
| | | | 2014 | | | 2013 | | | 2012 | | | 2011 | | | 2010 | |
| | | | |
| | | | | | | | | | | | | | | | | | | | | | | | |
Net asset value,
beginning of period | | | $ 11.44 | | | | $ 10.83 | | | | $ 11.50 | | | | $ 10.84 | | | | $ 10.94 | | | | $ 10.50 | |
| | | | |
Income From Investment Operations | | | | | | | | | | | | | | | | | | | | | | | | |
Net investment
income(b)(c) | | | .19 | | | | .34 | | | | .33 | | | | .36 | | | | .39 | | | | .38 | |
Net realized and
unrealized gain (loss)
on investment transactions | | | (.17 | ) | | | .58 | | | | (.66 | ) | | | .64 | | | | (.11 | ) | | | .43 | |
| | | | |
Net increase (decrease)
in net asset value from operations | | | .02 | | | | .92 | | | | (.33 | ) | | | 1.00 | | | | .28 | | | | .81 | |
| | | | |
Less: Dividends and Distributions | | | | | | | | | | | | | | | | | | | | | | | | |
Dividends from net investment income | | | (.18 | ) | | | (.31 | ) | | | (.31 | ) | | | (.34 | ) | | | (.37 | ) | | | (.37 | ) |
Distributions from net realized gain on investment transactions | | | – 0 | – | | | – 0 | – | | | (.03 | ) | | | – 0 | – | | | (.01 | ) | | | – 0 | – |
Tax return of capital | | | – 0 | – | | | – 0 | – | | | (.00 | )(g) | | | – 0 | – | | | – 0 | – | | | – 0 | – |
| | | | |
Total dividends and distributions | | | (.18 | ) | | | (.31 | ) | | | (.34 | ) | | | (.34 | ) | | | (.38 | ) | | | (.37 | ) |
| | | | |
Net asset value, end of period | | | $ 11.28 | | | | $ 11.44 | | | | $ 10.83 | | | | $ 11.50 | | | | $ 10.84 | | | | $ 10.94 | |
| | | | |
Total Return | | | | | | | | | | | | | | | | | | | | | | | | |
Total investment return based on net asset value(d) | | | .13 | % | | | 8.66 | % | | | (2.90 | )% | | | 9.34 | % | | | 2.75 | % | | | 7.85 | % |
Ratios/Supplemental
Data | | | | | | | | | | | | | | | | | | | | | | | | |
Net assets, end of period
(000’s omitted) | | | $188 | | | | $405 | | | | $1,017 | | | | $1,804 | | | | $2,872 | | | | $5,267 | |
Ratio to average net
assets of: | | | | | | | | | | | | | | | | | | | | | | | | |
Expenses, net of
waivers/reimbursements(e) | | | 1.51 | %^ | | | 1.51 | % | | | 1.50 | % | | | 1.46 | % | | | 1.46 | % | | | 1.45 | %+ |
Expenses, before
waivers/reimbursements(e) | | | 1.57 | %^ | | | 1.56 | % | | | 1.56 | % | | | 1.58 | % | | | 1.58 | % | | | 1.57 | %+ |
Net investment income(b) | | | 2.80 | %^ | | | 3.05 | % | | | 2.97 | % | | | 3.21 | % | | | 3.70 | % | | | 3.61 | %+ |
Portfolio turnover rate | | | 12 | % | | | 14 | % | | | 22 | % | | | 23 | % | | | 12 | % | | | 8 | % |
See footnote summary on pages 162-163.
| | | | |
| AB MUNICIPAL INCOME FUND • | | | 155 | |
Financial Highlights
Selected Data For A Share Of Capital Stock Outstanding Throughout Each Period
| | | | | | | | | | | | | | | | | | | | | | | | |
| | | AB California Portfolio | |
| | | Class C | |
| | | November 1,
2014 to
May 31, 2015(a) | | | Year Ended October 31, | |
| | | | 2014 | | | 2013 | | | 2012 | | | 2011 | | | 2010 | |
| | | | |
| | | | | | | | | | | | | | | | | | | | | | | | |
Net asset value,
beginning of period | | | $ 11.43 | | | | $ 10.83 | | | | $ 11.50 | | | | $ 10.83 | | | | $ 10.93 | | | | $ 10.50 | |
| | | | |
Income From Investment Operations | | | | | | | | | | | | | | | | | | | | | | | | |
Net investment
income(b)(c) | | | .19 | | | | .33 | | | | .34 | | | | .36 | | | | .39 | | | | .39 | |
Net realized and
unrealized gain (loss)
on investment transactions | | | (.17 | ) | | | .58 | | | | (.67 | ) | | | .65 | | | | (.11 | ) | | | .41 | |
| | | | |
Net increase (decrease)
in net asset value from operations | | | .02 | | | | .91 | | | | (.33 | ) | | | 1.01 | | | | .28 | | | | .80 | |
| | | | |
Less: Dividends and Distributions | | | | | | | | | | | | | | | | | | | | | | | | |
Dividends from net investment income | | | (.18 | ) | | | (.31 | ) | | | (.31 | ) | | | (.34 | ) | | | (.37 | ) | | | (.37 | ) |
Distributions from net realized gain on investment transactions | | | – 0 | – | | | – 0 | – | | | (.03 | ) | | | – 0 | – | | | (.01 | ) | | | – 0 | – |
Tax return of capital | | | – 0 | – | | | – 0 | – | | | (.00 | )(g) | | | – 0 | – | | | – 0 | – | | | – 0 | – |
| | | | |
Total dividends and distributions | | | (.18 | ) | | | (.31 | ) | | | (.34 | ) | | | (.34 | ) | | | (.38 | ) | | | (.37 | ) |
| | | | |
Net asset value, end of period | | | $ 11.27 | | | | $ 11.43 | | | | $ 10.83 | | | | $ 11.50 | | | | $ 10.83 | | | | $ 10.93 | |
| | | | |
Total Return | | | | | | | | | | | | | | | | | | | | | | | | |
Total investment return based on net asset value(d) | | | .13 | % | | | 8.57 | % | | | (2.90 | )% | | | 9.44 | % | | | 2.75 | % | | | 7.75 | % |
Ratios/Supplemental
Data | | | | | | | | | | | | | | | | | | | | | | | | |
Net assets, end of period (000’s omitted) | | | $83,677 | | | | $83,761 | | | | $87,172 | | | | $107,831 | | | | $106,547 | | | | $117,354 | |
Ratio to average net
assets of: | | | | | | | | | | | | | | | | | | | | | | | | |
Expenses, net of
waivers/reimbursements(e) | | | 1.51 | %^ | | | 1.51 | % | | | 1.50 | % | | | 1.46 | % | | | 1.46 | % | | | 1.45 | %+ |
Expenses, before
waivers/reimbursements(e) | | | 1.55 | %^ | | | 1.56 | % | | | 1.55 | % | | | 1.55 | % | | | 1.56 | % | | | 1.55 | %+ |
Net investment income(b) | | | 2.79 | %^ | | | 3.02 | % | | | 2.98 | % | | | 3.19 | % | | | 3.69 | % | | | 3.60 | %+ |
Portfolio turnover rate | | | 12 | % | | | 14 | % | | | 22 | % | | | 23 | % | | | 12 | % | | | 8 | % |
See footnote summary on pages 162-163.
| | |
| 156 | | • AB MUNICIPAL INCOME FUND |
Financial Highlights
Selected Data For A Share Of Capital Stock Outstanding Throughout Each Period
| | | | | | | | | | | | | | | | | | | | | | | | |
| | | AB California Portfolio | |
| | | Advisor Class | |
| | | November 1,
2014 to
May 31, 2015(a) | | | Year Ended October 31, | |
| | | | 2014 | | | 2013 | | | 2012 | | | 2011 | | | 2010 | |
| | | | |
| | | | | | | | | | | | | | | | | | | | | | | | |
Net asset value,
beginning of period | | | $ 11.44 | | | | $ 10.83 | | | | $ 11.51 | | | | $ 10.84 | | | | $ 10.94 | | | | $ 10.51 | |
| | | | |
Income From Investment Operations | | | | | | | | | | | | | | | | | | | | | | | | |
Net investment
income(b)(c) | | | .25 | | | | .44 | | | | .45 | | | | .47 | | | | .49 | | | | .49 | |
Net realized and
unrealized gain (loss)
on investment transactions | | | (.18 | ) | | | .59 | | | | (.68 | ) | | | .65 | | | | (.10 | ) | | | .42 | |
| | | | |
Net increase (decrease)
in net asset value from operations | | | .07 | | | | 1.03 | | | | (.23 | ) | | | 1.12 | | | | .39 | | | | .91 | |
| | | | |
Less: Dividends and Distributions | | | | | | | | | | | | | | | | | | | | | | | | |
Dividends from net investment income | | | (.24 | ) | | | (.42 | ) | | | (.42 | ) | | | (.45 | ) | | | (.48 | ) | | | (.48 | ) |
Distributions from net realized gain on investment transactions | | | – 0 | – | | | – 0 | – | | | (.03 | ) | | | – 0 | – | | | (.01 | ) | | | – 0 | – |
Tax return of capital | | | – 0 | – | | | – 0 | – | | | (.00 | )(g) | | | – 0 | – | | | – 0 | – | | | – 0 | – |
| | | | |
Total dividends and distributions | | | (.24 | ) | | | (.42 | ) | | | (.45 | ) | | | (.45 | ) | | | (.49 | ) | | | (.48 | ) |
| | | | |
Net asset value, end of period | | | $ 11.27 | | | | $ 11.44 | | | | $ 10.83 | | | | $ 11.51 | | | | $ 10.84 | | | | $ 10.94 | |
| | | | |
Total Return | | | | | | | | | | | | | | | | | | | | | | | | |
Total investment return based on net asset value(d) | | | .62 | % | | | 9.75 | % | | | (2.02 | )% | | | 10.53 | % | | | 3.78 | % | | | 8.82 | % |
Ratios/Supplemental
Data | | | | | | | | | | | | | | | | | | | | | | | | |
Net assets, end of period
(000’s omitted) | | | $66,892 | | | | $48,251 | | | | $36,856 | | | | $37,507 | | | | $23,338 | | | | $13,614 | |
Ratio to average net
assets of: | | | | | | | | | | | | | | | | | | | | | | | | |
Expenses, net of
waivers/reimbursements(e) | | | .51 | %^ | | | .51 | % | | | .50 | % | | | .46 | % | | | .46 | % | | | .45 | %+ |
Expenses, before
waivers/reimbursements(e) | | | .55 | %^ | | | .56 | % | | | .55 | % | | | .55 | % | | | .55 | % | | | .55 | %+ |
Net investment income(b) | | | 3.78 | %^ | | | 3.99 | % | | | 3.97 | % | | | 4.16 | % | | | 4.65 | % | | | 4.59 | %+ |
Portfolio turnover rate | | | 12 | % | | | 14 | % | | | 22 | % | | | 23 | % | | | 12 | % | | | 8 | % |
See footnote summary on pages 162-163.
| | | | |
| AB MUNICIPAL INCOME FUND • | | | 157 | |
Financial Highlights
Selected Data For A Share Of Capital Stock Outstanding Throughout Each Period
| | | | | | | | | | | | | | | | | | | | | | | | |
| | | AB New York Portfolio | |
| | | Class A | |
| | | November 1,
2014 to
May 31, 2015(a) | | | Year Ended October 31, | |
| | | | 2014 | | | 2013 | | | 2012 | | | 2011 | | | 2010 | |
| | | | |
| | | | | | | | | | | | | | | | | | | | | | | | |
Net asset value,
beginning of period | | | $ 10.01 | | | | $ 9.70 | | | | $ 10.47 | | | | $ 9.97 | | | | $ 10.01 | | | | $ 9.69 | |
| | | | |
Income From Investment Operations | | | | | | | | | | | | | | | | | | | | | | | | |
Net investment
income(b)(c) | | | .19 | | | | .34 | | | | .33 | | | | .36 | | | | .38 | | | | .37 | |
Net realized and
unrealized gain (loss)
on investment transactions | | | (.09 | ) | | | .31 | | | | (.76 | ) | | | .50 | | | | (.04 | ) | | | .32 | |
| | | | |
Net increase (decrease)
in net asset value from operations | | | .10 | | | | .65 | | | | (.43 | ) | | | .86 | | | | .34 | | | | .69 | |
| | | | |
Less: Dividends and Distributions | | | | | | | | | | | | | | | | | | | | | | | | |
Dividends from net investment income | | | (.19 | ) | | | (.34 | ) | | | (.32 | ) | | | (.36 | ) | | | (.38 | ) | | | (.37 | ) |
Distributions from net realized gain on investment transactions | | | – 0 | – | | | – 0 | – | | | (.02 | ) | | | – 0 | – | | | – 0 | – | | | – 0 | – |
Tax return of capital | | | – 0 | – | | | – 0 | – | | | (.00 | )(g) | | | – 0 | – | | | – 0 | – | | | – 0 | – |
| | | | |
Total dividends and distributions | | | (.19 | ) | | | (.34 | ) | | | (.34 | ) | | | (.36 | ) | | | (.38 | ) | | | (.37 | ) |
| | | | |
Net asset value, end of period | | | $ 9.92 | | | | $ 10.01 | | | | $ 9.70 | | | | $ 10.47 | | | | $ 9.97 | | | | $ 10.01 | |
| | | | |
Total Return | | | | | | | | | | | | | | | | | | | | | | | | |
Total investment return based on net asset value(d) | | | .97 | % | | | 6.79 | % | | | (4.07 | )% | | | 8.76 | % | | | 3.56 | % | | | 7.26 | % |
Ratios/Supplemental
Data | | | | | | | | | | | | | | | | | | | | | | | | |
Net assets, end of period
(000’s omitted) | | | $428,145 | | | | $434,208 | | | | $464,134 | | | | $579,899 | | | | $493,133 | | | | $516,566 | |
Ratio to average net
assets of: | | | | | | | | | | | | | | | | | | | | | | | | |
Expenses, net of
waivers/reimbursements(e) | | | .78 | %^ | | | .81 | % | | | .79 | % | | | .75 | % | | | .75 | % | | | .75 | %+ |
Expenses, before
waivers/reimbursements(e) | | | .85 | %^ | | | .87 | % | | | .85 | % | | | .85 | % | | | .87 | % | | | .86 | %+ |
Net investment income(b) | | | 3.21 | %^ | | | 3.42 | % | | | 3.28 | % | | | 3.49 | % | | | 3.90 | % | | | 3.76 | %+ |
Portfolio turnover rate | | | 12 | % | | | 28 | % | | | 19 | % | | | 14 | % | | | 7 | % | | | 5 | % |
See footnote summary on pages 162-163.
| | |
| 158 | | • AB MUNICIPAL INCOME FUND |
Financial Highlights
Selected Data For A Share Of Capital Stock Outstanding Throughout Each Period
| | | | | | | | | | | | | | | | | | | | | | | | |
| | | AB New York Portfolio | |
| | | Class B | |
| | | November 1,
2014 to
May 31, 2015(a) | | | Year Ended October 31, | |
| | | | 2014 | | | 2013 | | | 2012 | | | 2011 | | | 2010 | |
| | | | |
| | | | | | | | | | | | | | | | | | | | | | | | |
Net asset value,
beginning of period | | | $ 10.00 | | | | $ 9.69 | | | | $ 10.45 | | | | $ 9.96 | | | | $ 10.00 | | | | $ 9.68 | |
| | | | |
Income From Investment Operations | | | | | | | | | | | | | | | | | | | | | | | | |
Net investment
income(b)(c) | | | .14 | | | | .27 | | | | .26 | | | | .29 | | | | .31 | | | | .30 | |
Net realized and
unrealized gain (loss)
on investment transactions | | | (.08 | ) | | | .31 | | | | (.74 | ) | | | .49 | | | | (.04 | ) | | | .32 | |
| | | | |
Net increase (decrease)
in net asset value from operations | | | .06 | | | | .58 | | | | (.48 | ) | | | .78 | | | | .27 | | | | .62 | |
| | | | |
Less: Dividends and Distributions | | | | | | | | | | | | | | | | | | | | | | | | |
Dividends from net investment income | | | (.15 | ) | | | (.27 | ) | | | (.26 | ) | | | (.29 | ) | | | (.31 | ) | | | (.30 | ) |
Distributions from net realized gain on investment transactions | | | – 0 | – | | | – 0 | – | | | (.02 | ) | | | – 0 | – | | | – 0 | – | | | – 0 | – |
Tax return of capital | | | – 0 | – | | | – 0 | – | | | (.00 | )(g) | | | – 0 | – | | | – 0 | – | | | – 0 | – |
| | | | |
Total dividends and distributions | | | (.15 | ) | | | (.27 | ) | | | (.28 | ) | | | (.29 | ) | | | (.31 | ) | | | (.30 | ) |
| | | | |
Net asset value, end of period | | | $ 9.91 | | | | $ 10.00 | | | | $ 9.69 | | | | $ 10.45 | | | | $ 9.96 | | | | $ 10.00 | |
| | | | |
Total Return | | | | | | | | | | | | | | | | | | | | | | | | |
Total investment return based on net asset value(d) | | | .55 | % | | | 6.06 | % | | | (4.64 | )% | | | 7.92 | % | | | 2.85 | % | | | 6.53 | % |
Ratios/Supplemental
Data | | | | | | | | | | | | | | | | | | | | | | | | |
Net assets, end of period
(000’s omitted) | | | $1,646 | | | | $2,217 | | | | $5,510 | | | | $9,664 | | | | $14,134 | | | | $24,682 | |
Ratio to average net
assets of: | | | | | | | | | | | | | | | | | | | | | | | | |
Expenses, net of
waivers/reimbursements(e) | | | 1.51 | %^ | | | 1.51 | % | | | 1.49 | % | | | 1.45 | % | | | 1.45 | % | | | 1.45 | %+ |
Expenses, before
waivers/reimbursements(e) | | | 1.59 | %^ | | | 1.58 | % | | | 1.55 | % | | | 1.57 | % | | | 1.59 | % | | | 1.58 | %+ |
Net investment income(b) | | | 2.49 | %^ | | | 2.77 | % | | | 2.57 | % | | | 2.82 | % | | | 3.22 | % | | | 3.08 | %+ |
Portfolio turnover rate | | | 12 | % | | | 28 | % | | | 19 | % | | | 14 | % | | | 7 | % | | | 5 | % |
See footnote summary on pages 162-163.
| | | | |
| AB MUNICIPAL INCOME FUND • | | | 159 | |
Financial Highlights
Selected Data For A Share Of Capital Stock Outstanding Throughout Each Period
| | | | | | | | | | | | | | | | | | | | | | | | |
| | | AB New York Portfolio | |
| | | Class C | |
| | | November 1,
2014 to
May 31, 2015(a) | | | Year Ended October 31, | |
| | | | 2014 | | | 2013 | | | 2012 | | | 2011 | | | 2010 | |
| | | | |
| | | | | | | | | | | | | | | | | | | | | | | | |
Net asset value,
beginning of period | | | $ 10.00 | | | | $ 9.69 | | | | $ 10.46 | | | | $ 9.96 | | | | $ 10.01 | | | | $ 9.68 | |
| | | | |
Income From Investment Operations | | | | | | | | | | | | | | | | | | | | | | | | |
Net investment
income(b)(c) | | | .14 | | | | .27 | | | | .26 | | | | .29 | | | | .31 | | | | .30 | |
Net realized and
unrealized gain (loss)
on investment transactions | | | (.07 | ) | | | .31 | | | | (.75 | ) | | | .50 | | | | (.05 | ) | | | .33 | |
| | | | |
Net increase (decrease)
in net asset value from operations | | | .07 | | | | .58 | | | | (.49 | ) | | | .79 | | | | .26 | | | | .63 | |
| | | | |
Less: Dividends and Distributions | | | | | | | | | | | | | | | | | | | | | | | | |
Dividends from net investment income | | | (.15 | ) | | | (.27 | ) | | | (.26 | ) | | | (.29 | ) | | | (.31 | ) | | | (.30 | ) |
Distributions from net realized gain on investment transactions | | | – 0 | – | | | – 0 | – | | | (.02 | ) | | | – 0 | – | | | – 0 | – | | | – 0 | – |
Tax return of capital | | | – 0 | – | | | – 0 | – | | | (.00 | )(g) | | | – 0 | – | | | – 0 | – | | | – 0 | – |
| | | | |
Total dividends and distributions | | | (.15 | ) | | | (.27 | ) | | | (.28 | ) | | | (.29 | ) | | | (.31 | ) | | | (.30 | ) |
| | | | |
Net asset value, end of period | | | $ 9.92 | | | | $ 10.00 | | | | $ 9.69 | | | | $ 10.46 | | | | $ 9.96 | | | | $ 10.01 | |
| | | | |
Total Return | | | | | | | | | | | | | | | | | | | | | | | | |
Total investment return based on net asset value(d) | | | .65 | % | | | 6.05 | % | | | (4.74 | )% | | | 8.01 | % | | | 2.74 | % | | | 6.62 | % |
Ratios/Supplemental
Data | | | | | | | | | | | | | | | | | | | | | | | | |
Net assets, end of period (000’s omitted) | | | $72,332 | | | | $71,934 | | | | $80,507 | | | | $106,135 | | | | $79,223 | | | | $90,789 | |
Ratio to average net
assets of: | | | | | | | | | | | | | | | | | | | | | | | | |
Expenses, net of
waivers/reimbursements(e) | | | 1.51 | %^ | | | 1.51 | % | | | 1.49 | % | | | 1.45 | % | | | 1.45 | % | | | 1.45 | %+ |
Expenses, before
waivers/reimbursements(e) | | | 1.58 | %^ | | | 1.57 | % | | | 1.55 | % | | | 1.55 | % | | | 1.57 | % | | | 1.56 | %+ |
Net investment income(b) | | | 2.48 | %^ | | | 2.72 | % | | | 2.58 | % | | | 2.79 | % | | | 3.20 | % | | | 3.05 | %+ |
Portfolio turnover rate | | | 12 | % | | | 28 | % | | | 19 | % | | | 14 | % | | | 7 | % | | | 5 | % |
See footnote summary on pages 162-163.
| | |
| 160 | | • AB MUNICIPAL INCOME FUND |
Financial Highlights
Selected Data For A Share Of Capital Stock Outstanding Throughout Each Period
| | | | | | | | | | | | | | | | | | | | | | | | |
| | | AB New York Portfolio | |
| | | Advisor Class | |
| | | November 1,
2014 to
May 31, 2015(a) | | | Year Ended May 31, | |
| | | | 2014 | | | 2013 | | | 2012 | | | 2011 | | | 2010 | |
| | | | |
| | | | | | | | | | | | | | | | | | | | | | | | |
Net asset value,
beginning of period | | | $ 10.01 | | | | $ 9.70 | | | | $ 10.47 | | | | $ 9.97 | | | | $ 10.01 | | | | $ 9.69 | |
| | | | |
Income From Investment Operations | | | | | | | | | | | | | | | | | | | | | | | | |
Net investment
income(b)(c) | | | .20 | | | | .36 | | | | .37 | | | | .39 | | | | .41 | | | | .40 | |
Net realized and
unrealized gain (loss)
on investment transactions | | | (.08 | ) | | | .32 | | | | (.76 | ) | | | .50 | | | | (.04 | ) | | | .32 | |
| | | | |
Net increase (decrease)
in net asset value from operations | | | .12 | | | | .68 | | | | (.39 | ) | | | .89 | | | | .37 | | | | .72 | |
| | | | |
Less: Dividends and Distributions | | | | | | | | | | | | | | | | | | | | | | | | |
Dividends from net investment income | | | (.20 | ) | | | (.37 | ) | | | (.36 | ) | | | (.39 | ) | | | (.41 | ) | | | (.40 | ) |
Distributions from net realized gain on investment transactions | | | – 0 | – | | | – 0 | – | | | (.02 | ) | | | – 0 | – | | | – 0 | – | | | – 0 | – |
Tax return of capital | | | – 0 | – | | | – 0 | – | | | (.00 | )(g) | | | – 0 | – | | | – 0 | – | | | – 0 | – |
| | | | |
Total dividends and distributions | | | (.20 | ) | | | (.37 | ) | | | (.38 | ) | | | (.39 | ) | | | (.41 | ) | | | (.40 | ) |
| | | | |
Net asset value, end of period | | | $ 9.93 | | | | $ 10.01 | | | | $ 9.70 | | | | $ 10.47 | | | | $ 9.97 | | | | $ 10.01 | |
| | | | |
Total Return | | | | | | | | | | | | | | | | | | | | | | | | |
Total investment return based on net asset value(d) | | | 1.23 | % | | | 7.11 | % | | | (3.78 | )% | | | 9.09 | % | | | 3.87 | % | | | 7.58 | % |
Ratios/Supplemental
Data | | | | | | | | | | | | | | | | | | | | | | | | |
Net assets, end of period (000’s omitted) | | | $28,838 | | | | $20,755 | | | | $16,229 | | | | $23,882 | | | | $11,169 | | | | $13,028 | |
Ratio to average net
assets of: | | | | | | | | | | | | | | | | | | | | | | | | |
Expenses, net of
waivers/reimbursements(e) | | | .51 | %^ | | | .51 | % | | | .49 | % | | | .45 | % | | | .45 | % | | | .45 | %+ |
Expenses, before
waivers/reimbursements(e) | | | .57 | %^ | | | .57 | % | | | .55 | % | | | .54 | % | | | .57 | % | | | .55 | %+ |
Net investment income(b) | | | 3.46 | %^ | | | 3.69 | % | | | 3.56 | % | | | 3.77 | % | | | 4.21 | % | | | 4.03 | %+ |
Portfolio turnover rate | | | 12 | % | | | 28 | % | | | 19 | % | | | 14 | % | | | 7 | % | | | 5 | % |
See footnote summary on pages 162-163.
| | | | |
| AB MUNICIPAL INCOME FUND • | | | 161 | |
Financial Highlights
| (a) | | The Portfolio changed its fiscal year end from October 31 to May 31. |
| (b) | | Net of fees and expenses waived/reimbursed by the Adviser. |
| (c) | | Based on average shares outstanding. |
| (d) | | Total investment return is calculated assuming an initial investment made at the net asset value at the beginning of the period, reinvestment of all dividends and distributions at net asset value during the period, and redemption on the last day of the period. Initial sales charges or contingent deferred sales charges are not reflected in the calculation of total investment return. Total return does not reflect the deduction of taxes that a shareholder would pay on fund distributions or the redemption of fund shares. Total investment return calculated for a period of less than one year is not annualized. |
| (e) | | The expense ratios presented below exclude interest expense: |
| | | | | | | | | | | | | | | | | | | | | | | | |
| | | November 1,
2014 to
May 31, 2015(a) | | | Year Ended October 31, | |
| | | | 2014 | | | 2013 | | | 2012 | | | 2011 | | | 2010 | |
| | | | |
AB National Portfolio | | | | | | | | | | | | | | | | | | | | | | | | |
Class A | | | | | | | | | | | | | | | | | | | | | | | | |
Net of waivers/reimbursements | | | .77 | %^ | | | .80 | % | | | .79 | % | | | .75 | % | | | .75 | % | | | .75 | %+ |
Before waivers/reimbursements | | | .82 | %^ | | | .85 | % | | | .85 | % | | | .85 | % | | | .87 | % | | | .87 | %+ |
Class B | | | | | | | | | | | | | | | | | | | | | | | | |
Net of waivers/reimbursements | | | 1.50 | %^ | | | 1.50 | % | | | 1.48 | % | | | 1.45 | % | | | 1.45 | % | | | 1.45 | %+ |
Before waivers/reimbursements | | | 1.57 | %^ | | | 1.56 | % | | | 1.56 | % | | | 1.58 | % | | | 1.59 | % | | | 1.59 | %+ |
Class C | | | | | | | | | | | | | | | | | | | | | | | | |
Net of waivers/reimbursements | | | 1.50 | %^ | | | 1.50 | % | | | 1.49 | % | | | 1.45 | % | | | 1.45 | % | | | 1.45 | %+ |
Before waivers/reimbursements | | | 1.55 | %^ | | | 1.55 | % | | | 1.55 | % | | | 1.56 | % | | | 1.57 | % | | | 1.57 | %+ |
Advisor Class | | | | | | | | | | | | | | | | | | | | | | | | |
Net of waivers/reimbursements | | | .50 | %^ | | | .50 | % | | | .49 | % | | | .45 | % | | | .45 | % | | | .45 | %+ |
Before waivers/reimbursements | | | .55 | %^ | | | .55 | % | | | .55 | % | | | .55 | % | | | .57 | % | | | .57 | %+ |
| | | | | | |
AB High Income Municipal Portfolio | | | | | | | | | | | | | | | | | | | | | | | | |
Class A | | | | | | | | | | | | | | | | | | | | | | | | |
Net of waivers/reimbursements | | | .80 | %^ | | | .80 | % | | | .80 | % | | | .80 | % | | | .80 | % | | | .78 | %+^(h)(i) |
Before waivers/reimbursements | | | .83 | %^ | | | .88 | % | | | .89 | % | | | .89 | % | | | .94 | % | | | 1.15 | %+^(i) |
Class C | | | | | | | | | | | | | | | | | | | | | | | | |
Net of waivers/reimbursements | | | 1.53 | %^ | | | 1.50 | % | | | 1.50 | % | | | 1.50 | % | | | 1.50 | % | | | 1.47 | %+^(h)(i) |
Before waivers/reimbursements | | | 1.56 | %^ | | | 1.58 | % | | | 1.59 | % | | | 1.59 | % | | | 1.64 | % | | | 1.87 | %+^(i) |
Advisor Class | | | | | | | | | | | | | | | | | | | | | | | | |
Net of waivers/reimbursements | | | .53 | %^ | | | .50 | % | | | .50 | % | | | .50 | % | | | .50 | % | | | .45 | %+^(h)(i) |
Before waivers/reimbursements | | | .56 | %^ | | | .58 | % | | | .59 | % | | | .59 | % | | | .64 | % | | | 1.00 | %+^(i) |
| | | | | | |
AB California Portfolio | | | | | | | | | | | | | | | | | | | | | | | | |
Class A | | | | | | | | | | | | | | | | | | | | | | | | |
Net of waivers/reimbursements | | | .77 | %^ | | | .80 | % | | | .79 | % | | | .75 | % | | | .75 | % | | | .75 | %+ |
Before waivers/reimbursements | | | .82 | %^ | | | .85 | % | | | .84 | % | | | .84 | % | | | .85 | % | | | .84 | %+ |
Class B | | | | | | | | | | | | | | | | | | | | | | | | |
Net of waivers/reimbursements | | | 1.50 | %^ | | | 1.50 | % | | | 1.48 | % | | | 1.45 | % | | | 1.46 | % | | | 1.45 | %+ |
Before waivers/reimbursements | | | 1.57 | %^ | | | 1.56 | % | | | 1.54 | % | | | 1.57 | % | | | 1.57 | % | | | 1.56 | %+ |
Class C | | | | | | | | | | | | | | | | | | | | | | | | |
Net of waivers/reimbursements | | | 1.50 | %^ | | | 1.50 | % | | | 1.49 | % | | | 1.45 | % | | | 1.45 | % | | | 1.45 | %+ |
Before waivers/reimbursements | | | 1.55 | %^ | | | 1.55 | % | | | 1.54 | % | | | 1.54 | % | | | 1.55 | % | | | 1.55 | %+ |
| | |
| 162 | | • AB MUNICIPAL INCOME FUND |
Financial Highlights
| | | | | | | | | | | | | | | | | | | | | | | | |
| | | November 1,
2014 to
May 31, 2015(a) | | | Year Ended October 31, | |
| | | | 2014 | | | 2013 | | | 2012 | | | 2011 | | | 2010 | |
| | | | |
Advisor Class | | | | | | | | | | | | | | | | | | | | | | | | |
Net of waivers/reimbursements | | | .50 | %^ | | | .50 | % | | | .49 | % | | | .45 | % | | | .45 | % | | | .45 | %+ |
Before waivers/reimbursements | | | .54 | %^ | | | .55 | % | | | .54 | % | | | .53 | % | | | .55 | % | | | .54 | %+ |
| | | | | | |
AB New York Portfolio | | | | | | | | | | | | | | | | | | | | | | | | |
Class A | | | | | | | | | | | | | | | | | | | | | | | | |
Net of waivers/reimbursements | | | .77 | %^ | | | .80 | % | | | .79 | % | | | .75 | % | | | .75 | % | | | .75 | %+ |
Before waivers/reimbursements | | | .84 | %^ | | | .87 | % | | | .84 | % | | | .85 | % | | | .85 | % | | | .85 | %+ |
Class B | | | | | | | | | | | | | | | | | | | | | | | | |
Net of waivers/reimbursements | | | 1.50 | %^ | | | 1.50 | % | | | 1.48 | % | | | 1.45 | % | | | 1.45 | % | | | 1.45 | %+ |
Before waivers/reimbursements | | | 1.58 | %^ | | | 1.57 | % | | | 1.55 | % | | | 1.57 | % | | | 1.59 | % | | | 1.58 | %+ |
Class C | | | | | | | | | | | | | | | | | | | | | | | | |
Net of waivers/reimbursements | | | 1.50 | %^ | | | 1.50 | % | | | 1.49 | % | | | 1.45 | % | | | 1.45 | % | | | 1.45 | %+ |
Before waivers/reimbursements | | | 1.57 | %^ | | | 1.57 | % | | | 1.54 | % | | | 1.55 | % | | | 1.57 | % | | | 1.56 | %+ |
Advisor Class | | | | | | | | | | | | | | | | | | | | | | | | |
Net of waivers/reimbursements | | | .50 | %^ | | | .50 | % | | | .49 | % | | | .45 | % | | | .45 | % | | | .45 | %+ |
Before waivers/reimbursements | | | .56 | % | | | .56 | % | | | .54 | % | | | .54 | % | | | .57 | % | | | .55 | %+ |
| (f) | | Commencement of operations |
| (g) | | Amount is less than $.005. |
| (h) | | The Adviser agreed to voluntarily reimburse an additional .02%, .03% and .05% of the Portfolio’s Class A, Class C and Advisor Class expenses, respectively. |
| (i) | | For the period January 26, 2010, commencement of operations, to October 31, 2010. |
| + | | The ratio includes expenses attributable to costs of proxy solicitation. |
See notes to financial statements.
| | | | |
| AB MUNICIPAL INCOME FUND • | | | 163 | |
Financial Highlights
REPORT OF INDEPENDENT REGISTERED
PUBLIC ACCOUNTING FIRM
To the Board of Directors and Shareholders of
AB Municipal Income Fund, Inc.
We have audited the accompanying statements of assets and liabilities, including the portfolios of investments, of AB Municipal Income Fund, Inc. (the “Fund”), formerly AllianceBernstein Municipal Income Fund, Inc., comprising, respectively, the AB National Portfolio, AB High Income Municipal Portfolio, AB California Portfolio and AB New York Portfolio, as of May 31, 2015, and the related statements of operations for the period November 1, 2014 to May 31, 2015 and the year ended October 31, 2014, the statements of changes in net assets for the period November 1, 2014 to May 31, 2015 and each of the two years in the period ended October 31, 2014, the financial highlights for the period November 1, 2014 to May 31, 2015 and each of the five years in the period ended October 31, 2014 (the four years in the period ended October 31, 2014 and the period of January 26, 2010 (commencement of operations) through October 31, 2010 for AB High Income Municipal Portfolio) and the statements of cash flows of the AB High Income Municipal Portfolio for the period November 1, 2014 to May 31, 2015 and the year ended October 31, 2014. These financial statements and financial highlights are the responsibility of the Fund’s management. Our responsibility is to express an opinion on these financial statements and financial highlights based on our audits.
We conducted our audits in accordance with the standards of the Public Company Accounting Oversight Board (United States). Those standards require that we plan and perform the audit to obtain reasonable assurance about whether the financial statements and financial highlights are free of material misstatement. We were not engaged to perform an audit of the Fund’s internal control over financial reporting. Our audits included consideration of internal control over financial reporting as a basis for designing audit procedures that are appropriate in the circumstances, but not for the purpose of expressing an opinion on the effectiveness of the Fund’s internal control over financial reporting. Accordingly, we express no such opinion. An audit also includes examining, on a test basis, evidence supporting the amounts and disclosures in the financial statements and financial highlights, assessing the accounting principles used and significant estimates made by management, and evaluating the overall financial statement presentation. Our procedures included confirmation of securities owned as of May 31, 2015 by correspondence with the custodian and others or by other appropriate auditing procedures where replies from others were not received. We believe that our audits provide a reasonable basis for our opinion.
In our opinion, the financial statements and financial highlights referred to above present fairly, in all material respects, the financial position of each of the respective portfolios constituting the AB Municipal Income Fund, Inc. at May 31, 2015, the results of their operations for the period November 1, 2014 to May 31, 2015 and the year ended October 31, 2014, the changes in their net assets for the period November 1, 2014 to May 31, 2015 and each of the two
| | |
| 164 | | • AB MUNICIPAL INCOME FUND |
Report of Independent Registered Public Accounting Firm
years in the period ended October 31, 2014, the financial highlights for the period November 1, 2014 to May 31, 2015 and each of the five years in the period ended October 31, 2014 (the four years in the period ended October 31, 2014 and the period January 26, 2010 (commencement of operations) through October 31, 2010 for AB High Income Municipal Portfolio), and the cash flows of the AB High Income Municipal Portfolio for the period November 1, 2014 to May 31, 2015 and the year ended October 31, 2014, in conformity with U.S. generally accepted accounting principles.

New York, New York
July 15, 2015
| | | | |
| AB MUNICIPAL INCOME FUND • | | | 165 | |
Report of Independent Registered Public Accounting Firm
BOARD OF DIRECTORS
| | |
Marshall C. Turner, Jr.(1) , Chairman John H. Dobkin(1) Michael J. Downey(1) William H. Foulk, Jr.(1) D. James Guzy(1) | | Nancy P. Jacklin(1) Robert M. Keith, President and Chief Executive Officer Garry L. Moody(1) Earl D. Weiner(1) |
OFFICERS
| | |
Philip L. Kirstein,
Senior Vice President and Independent Compliance Officer Robert “Guy” B. Davidson III,(2) Senior Vice President Douglas J. Peebles, Senior Vice President Michael G. Brooks,(2) Vice President Fred S. Cohen,(2) Vice President | | Wayne D. Godlin,(2) Vice President Terrance T. Hults,(2) Vice President Emilie D. Wrapp, Secretary Joseph J. Mantineo, Treasurer and Chief Financial Officer Phyllis J. Clarke, Controller Vincent S. Noto, Chief Compliance Officer |
| | |
Custodian and Accounting Agent State Street Bank and Trust Company State Street Corporation CCB/5 1 Iron Street Boston, MA 02210 Principal Underwriter AllianceBernstein Investments, Inc.
1345 Avenue of the Americas
New York, NY 10105 Legal Counsel Seward & Kissel LLP
One Battery Park Plaza
New York, NY 10004 | | Independent Registered Public Accounting Firm Ernst & Young LLP
5 Times Square
New York, NY 10036 Transfer Agent AllianceBernstein Investor
Services, Inc. P.O. Box 786003
San Antonio, TX 78278-6003
Toll-Free (800) 221-5672 |
| (1) | | Member of the Audit Committee, the Governance and Nominating Committee and the Independent Directors Committee. |
| (2) | | The day-to-day management of, and investment decisions for, the Fund’s portfolios are made by the Municipal Bond Investment Team. Messrs. Brooks, Davidson, Godlin and Hults are the investment professionals with the most significant responsibility for the day-to-day management of the High Income Municipal Portfolio. Messrs. Brooks, Cohen, Davidson, Godlin and Hults are the investment professionals with the most significant responsibility for the day-to-day management of the California, National and New York Portfolios. |
| | |
| 166 | | • AB MUNICIPAL INCOME FUND |
Board of Directors
MANAGEMENT OF THE FUND
Board of Directors Information
The business and affairs of the Fund are managed under the direction of the Board of Directors. Certain information concerning the Fund’s Directors is set forth below.
| | | | | | | | |
NAME,
ADDRESS*, AGE,
(YEAR FIRST ELECTED**) | | PRINCIPAL
OCCUPATION(S)
DURING PAST FIVE YEARS
AND OTHER RELEVANT
QUALIFICATIONS*** | | PORTFOLIOS
IN FUND
COMPLEX
OVERSEEN BY
DIRECTOR | | | OTHER
PUBLIC COMPANY
DIRECTORSHIPS
CURRENTLY
HELD BY
DIRECTOR |
| INTERESTED DIRECTOR | | | | | | |
Robert M. Keith, #
1345 Avenue of the Americas
New York, NY 10105
55
(2010) | | Senior Vice President of AllianceBernstein L.P. (the “Adviser”) and the head of AllianceBernstein Investments, Inc. (“ABI”) since July 2008; Director of ABI and President of the AB Mutual Funds. Previously, he served as Executive Managing Director of ABI from December 2006 to June 2008. Prior to joining ABI in 2006, Executive Managing Director of Bernstein Global Wealth Management, and prior thereto, Senior Managing Director and Global Head of Client Service and Sales of the Adviser’s institutional investment management business since 2004. Prior thereto, he was Managing Director and Head of North American Client Service and Sales in the Adviser’s institutional investment management business, with which he had been associated since prior to 2004. | | | 120 | | | None |
| | | | | | | | |
| | | | |
| AB MUNICIPAL INCOME FUND • | | | 167 | |
Management of the Fund
| | | | | | | | |
NAME,
ADDRESS*, AGE,
(YEAR FIRST ELECTED**) | | PRINCIPAL
OCCUPATION(S)
DURING PAST FIVE YEARS
AND OTHER RELEVANT
QUALIFICATIONS*** | | PORTFOLIOS
IN FUND
COMPLEX
OVERSEEN BY
DIRECTOR | | | OTHER
PUBLIC COMPANY
DIRECTORSHIPS
CURRENTLY
HELD BY
DIRECTOR |
| DISINTERESTED DIRECTORS | | | | | | |
Marshall C. Turner, Jr., ##
Chairman of the Board
73
(2005) | | Private Investor since prior to 2010. Former CEO of Dupont Photomasks, Inc. (components of semi-conductor manufacturing), 2003-2006, and interim CEO 1999-2000. He has extensive operating and early-stage investment experience, including prior service as general partner of institutional venture capital partnerships, and serves on the boards of three education and science-related non-profit organizations. He has served as a director of one AB fund since 1992, and director or trustee of multiple AB funds since 2005. He has been Chairman of the AB Funds since January 2014, and the Chairman of the Independent Directors Committees of such Funds since February 2014. | | | 120 | | | Xilinx, Inc. (programmable logic semi-conductors) since 2007 |
| | | | | | | | |
John H. Dobkin, ##
73
(2004) | | Independent Consultant since prior to 2010. Formerly, President of Save Venice, Inc. (preservation organization) from 2001-2002; Senior Advisor from June 1999-June 2000 and President of Historic Hudson Valley (historic preservation) from December 1989-May 1999. Previously, Director of the National Academy of Design. He has served as a director or trustee of various AB Funds since 1992, and as Chairman of the Audit Committees of a number of such Funds from 2001-2008. | | | 120 | | | None |
| | | | | | | | |
| | |
| 168 | | • AB MUNICIPAL INCOME FUND |
Management of the Fund
| | | | | | | | |
NAME,
ADDRESS*, AGE,
(YEAR FIRST ELECTED**) | | PRINCIPAL
OCCUPATION(S)
DURING PAST FIVE YEARS
AND OTHER RELEVANT
QUALIFICATIONS*** | | PORTFOLIOS
IN FUND
COMPLEX
OVERSEEN BY
DIRECTOR | | | OTHER
PUBLIC COMPANY
DIRECTORSHIPS
CURRENTLY
HELD BY
DIRECTOR |
DISINTERESTED DIRECTORS (continued) | | | | | | |
Michael J. Downey, ##
71
(2005) | | Private Investor since prior to 2010. Formerly, managing partner of Lexington Capital, LLC (investment advisory firm) from December 1997 until December 2003. He served as a Director of Prospect Acquisition Corp. (financial services) from 2007 until 2009. From 1987 until 1993, Chairman and CEO of Prudential Mutual Fund Management, director of the Prudential mutual funds, and member of the Executive Committee of Prudential Securities Inc. He has served as a director or trustee of the AB Funds since 2005 and is a director and Chairman of one other registered investment company. | | | 120 | | | Asia Pacific Fund, Inc. (registered investment company) since prior to 2010 |
| | | | | | | | |
William H. Foulk, Jr., ##
82
(2004) | | Investment Adviser and an Independent Consultant since prior to 2010. Previously, he was Senior Manager of Barrett Associates, Inc., a registered investment adviser. He was formerly Deputy Comptroller and Chief Investment Officer of the State of New York and, prior thereto, Chief Investment Officer of the New York Bank for Savings. He has served as a director or trustee of various AB Funds since 1983, and was Chairman of the Independent Directors Committees of the AB Funds from 2003 until early February 2014. He served as Chairman of such Funds from 2003 through December 2013. He is also active in a number of mutual fund related organizations and committees. | | | 120 | | | None |
| | | | | | | | |
| | | | |
| AB MUNICIPAL INCOME FUND • | | | 169 | |
Management of the Fund
| | | | | | | | |
NAME,
ADDRESS*, AGE,
(YEAR FIRST ELECTED**) | | PRINCIPAL
OCCUPATION(S)
DURING PAST FIVE YEARS
AND OTHER RELEVANT
QUALIFICATIONS*** | | PORTFOLIOS
IN FUND
COMPLEX
OVERSEEN BY
DIRECTOR | | | OTHER
PUBLIC COMPANY
DIRECTORSHIPS
CURRENTLY
HELD BY
DIRECTOR |
DISINTERESTED DIRECTORS (continued) | | | | | | |
D. James Guzy, ##
79
(2005) | | Chairman of the Board of SRC Computers, Inc. (semi-conductors), with which he has been associated since prior to 2010. He served as Chairman of the Board of PLX Technology (semi-conductors) since prior to 2010 until November 2013. He was a director of Intel Corporation (semi-conductors) from 1969 until 2008, and served as Chairman of the Finance Committee of such company for several years until May 2008. He has served as a director or trustee of one or more of the AB Funds since 1982. | | | 120 | | | None |
| | | | | | | | |
Nancy P. Jacklin, ##
67
(2006) | | Professorial Lecturer at the Johns Hopkins University, School of Advanced International Studies (2008-2015). U.S. Executive Director of the International Monetary Fund (which is responsible for ensuring the stability of the international monetary system), (December 2002-May 2006); Partner, Clifford Chance (1992-2002); Sector Counsel, International Banking and Finance, and Associate General Counsel, Citicorp (1985-1992); Assistant General Counsel (International), Federal Reserve Board of Governors (1982-1985); and Attorney Advisor, U.S. Department of the Treasury (1973-1982). Member of the Bar of the District of Columbia and of New York; and member of the Council on Foreign Relations. She has served as a director or trustee of the AB Funds since 2006 and has been Chairman of the Governance and Nominating Committees of the Funds since August 2014. | | | 120 | | | None |
| | |
| 170 | | • AB MUNICIPAL INCOME FUND |
Management of the Fund
| | | | | | | | |
NAME,
ADDRESS*, AGE,
(YEAR FIRST ELECTED**) | | PRINCIPAL
OCCUPATION(S)
DURING PAST FIVE YEARS
AND OTHER RELEVANT
QUALIFICATIONS*** | | PORTFOLIOS
IN FUND
COMPLEX
OVERSEEN BY
DIRECTOR | | | OTHER
PUBLIC COMPANY
DIRECTORSHIPS
CURRENTLY
HELD BY
DIRECTOR |
DISINTERESTED DIRECTORS (continued) | | | | | | |
Garry L. Moody, ##
63
(2008) | | Independent Consultant. Formerly, Partner, Deloitte & Touche LLP (1995-2008) where he held a number of senior positions, including Vice Chairman, and U.S. and Global Investment Management Practice Managing Partner; President, Fidelity Accounting and Custody Services Company (1993-1995); and Partner, Ernst & Young LLP (1975-1993), where he served as the National Director of Mutual Fund Tax Services and Managing Partner of its Chicago Office Tax department. He is a member of both the Governing Council of the Independent Directors Council (IDC), an organization of independent directors of mutual funds, and the Trustee Advisory Board of BoardIQ, a biweekly publication focused on issues and news affecting directors of mutual funds. He has served as a director or trustee, and as Chairman of the Audit Committees, of the AB Funds since 2008. | | | 120 | | | None |
| | | | | | | | |
Earl D. Weiner, ##
75
(2007) | | Of Counsel, and Partner prior to January 2007, of the law firm Sullivan & Cromwell LLP and is a former member of the ABA Federal Regulation of Securities Committee Task Force to draft editions of the Fund Director’s Guidebook. He also serves as a director or trustee of various non-profit organizations and has served as Chairman or Vice Chairman of a number of them. He has served as a director or trustee of the AB Funds since 2007 and served as Chairman of the Governance and Nominating Committees of the AB Funds from 2007 until August 2014. | | | 120 | | | None |
| | | | |
| AB MUNICIPAL INCOME FUND • | | | 171 | |
Management of the Fund
| * | | The address for each of the Fund’s disinterested Directors is c/o AllianceBernstein L.P., Attention: Philip L. Kirstein, 1345 Avenue of the Americas, New York, NY 10105. |
| ** | | There is no stated term of office for the Fund’s Directors. |
| *** | | The information above includes each Director’s principal occupation during the last five years and other information relating to the experience, attributes and skills relevant to each Director’s qualifications to serve as a Director, which led to the conclusion that each Director should serve as a Director for the Fund. |
| # | | Mr. Keith is an “interested person” of the Fund, as defined in the 1940 Act, due to his position as a Senior Vice President of the Adviser. |
| ## | | Member of the Audit Committee, the Governance and Nominating Committee and the Independent Directors Committee. |
| | |
| 172 | | • AB MUNICIPAL INCOME FUND |
Management of the Fund
Officer Information
Certain information concerning the Fund’s Officers is listed below.
| | | | |
NAME, ADDRESS*
AND AGE | | PRINCIPAL POSITION(S)
HELD WITH FUND | | PRINCIPAL OCCUPATION(S)
DURING PAST FIVE YEARS |
Robert M. Keith
55 | | President and Chief Executive Officer | | See biography above. |
| | | | |
Philip L. Kirstein
70 | | Senior Vice President and Independent Compliance Officer | | Senior Vice President and Independent Compliance Officer of the AB Funds, with which he has been associated since October 2004. Prior thereto, he was Of Counsel to Kirkpatrick & Lockhart, LLP from October 2003 to October 2004, and General Counsel of Merrill Lynch Investment Managers, L.P. since prior to March 2003. |
| | | | |
Robert B. “Guy” Davidson III
54 | | Senior Vice President | | Senior Vice President of the Adviser**, with which he has been associated since prior to 2010. |
| | | | |
Douglas J. Peebles
49 | | Senior Vice President | | Senior Vice President of the Adviser**, with which he has been associated since prior to 2010. |
| | | | |
Michael G. Brooks
67 | | Vice President | | Senior Vice President of the Adviser**, with which he has been associated since prior to 2010. |
| | | | |
Fred S. Cohen
57 | | Vice President | | Senior Vice President of the Adviser**, with which he has been associated since prior to 2010. |
| | | | |
Wayne D. Godlin 54 | | Vice President | | Senior Vice President of the Adviser**, with which he has been associated since prior to 2010. |
| | | | |
Terrance T. Hults
49 | | Vice President | | Senior Vice President of the Adviser**, with which he has been associated since prior to 2010. |
| | | | |
Emilie D. Wrapp
59 | | Secretary | | Senior Vice President, Assistant General Counsel and Assistant Secretary of ABI**, with which she has been associated since prior to 2010. |
| | | | |
Joseph J. Mantineo
56 | | Treasurer and Chief Financial Officer | | Senior Vice President of AllianceBernstein Investor Services, Inc. (“ABIS”)**, with which he has been associated since prior to 2010. |
| | | | |
| AB MUNICIPAL INCOME FUND • | | | 173 | |
Management of the Fund
| | | | |
NAME, ADDRESS*
AND AGE | | PRINCIPAL POSITION(S)
HELD WITH FUND | | PRINCIPAL OCCUPATION(S)
DURING PAST FIVE YEARS |
Phyllis J. Clarke
54 | | Controller | | Vice President of ABIS**, with which she has been associated since prior to 2010. |
| | | | |
Vincent S. Noto
50 | | Chief Compliance Officer | | Senior Vice President since 2015 and Mutual Fund Chief Compliance Officer of the Adviser** since 2014. Prior thereto, he was Vice President and Director of Mutual Fund Compliance of the Adviser** since prior to 2010. |
| * | | The address for each of the Fund’s Officers is 1345 Avenue of the Americas, New York, NY 10105. |
| ** | | The Adviser, ABI and ABIS are affiliates of the Fund. |
The Fund’s Statement of Additional Information (“SAI”) has additional information about the Fund’s Directors and Officers and is available without a charge upon request. Contact your financial representative or AB at (800) 227-4618, or visit www.ABglobal.com, for a free prospectus or SAI.
| | |
| 174 | | • AB MUNICIPAL INCOME FUND |
Management of the Fund
Information Regarding the Review and Approval of the Fund’s Advisory Agreement
The disinterested directors (the “directors”) of AB Municipal Income Fund, Inc. (the “Fund”) unanimously approved the continuance of the Fund’s Advisory Agreement with the Adviser in respect of each of the following portfolios (each, a “Portfolio” and collectively, the “Portfolios”) at a meeting held on November 3-6, 2014:
| | • | | AB California Portfolio |
| | • | | AB High Income Municipal Portfolio |
Prior to approval of the continuance of the Advisory Agreement, the directors had requested from the Adviser, and received and evaluated, extensive materials. They reviewed the proposed continuance of the Advisory Agreement with the Adviser and with experienced counsel who are independent of the Adviser, who advised on the relevant legal standards. The directors also reviewed an independent evaluation prepared by the Fund’s Senior Officer (who is also the Fund’s Independent Compliance Officer) of the reasonableness of the advisory fee in respect of each Portfolio, in which the Senior Officer concluded that the contractual fee for each Portfolio was reasonable. The directors also discussed the proposed continuance in private sessions with counsel and the Fund’s Senior Officer.
The directors considered their knowledge of the nature and quality of the services provided by the Adviser to the Portfolios gained from their experience as directors or trustees of most of the registered investment companies advised by the Adviser, their overall confidence in the Adviser’s integrity and competence they have gained from that experience, the Adviser’s initiative in identifying and raising potential issues with the directors and its responsiveness, frankness and attention to concerns raised by the directors in the past, including the Adviser’s willingness to consider and implement organizational and operational changes designed to improve investment results and the services provided to the AB Funds. The directors noted that they have four regular meetings each year, at each of which they receive presentations from the Adviser on the investment results of the Portfolios and review extensive materials and information presented by the Adviser.
The directors also considered all other factors they believed relevant, including the specific matters discussed below. In their deliberations, the directors did not identify any particular information that was all-important or controlling, and different directors may have attributed different weights to the various factors. The directors determined that the selection of the Adviser to manage each Portfolio and the overall arrangements between each Portfolio and the Adviser, as
| | | | |
| AB MUNICIPAL INCOME FUND • | | | 175 | |
provided in the Advisory Agreement, including the advisory fee, were fair and reasonable in light of the services performed, expenses incurred and such other matters as the directors considered relevant in the exercise of their business judgment. The material factors and conclusions that formed the basis for the directors’ determinations included the following:
Nature, Extent and Quality of Services Provided
The directors considered the scope and quality of services provided by the Adviser under the Advisory Agreement, including the quality of the investment research capabilities of the Adviser and the other resources it has dedicated to performing services for each Portfolio. They also noted the professional experience and qualifications of each Portfolio’s portfolio management team and other senior personnel of the Adviser. The directors also considered that the Advisory Agreement provides that each Portfolio will reimburse the Adviser for the cost to it of providing certain clerical, accounting, administrative and other services to such Portfolio by employees of the Adviser or its affiliates. Requests for these reimbursements are made on a quarterly basis and subject to approval by the directors. Reimbursements, to the extent requested and paid, result in a higher rate of total compensation from such Portfolio to the Adviser than the fee rate stated in the Advisory Agreement. The directors noted that the methodology used to determine the reimbursement amounts had been reviewed by an independent consultant retained by the Fund’s Senior Officer. The quality of administrative and other services, including the Adviser’s role in coordinating the activities of the Portfolios’ other service providers, also were considered. The directors concluded that, overall, they were satisfied with the nature, extent and quality of services provided to each of the Portfolios under the Advisory Agreement.
Costs of Services Provided and Profitability
The directors reviewed a schedule of the revenues, expenses and related notes indicating the profitability of each Portfolio to the Adviser for calendar years 2012 and 2013 that had been prepared with an expense allocation methodology arrived at in consultation with an independent consultant retained by the Fund’s Senior Officer. The directors noted the assumptions and methods of allocation used by the Adviser in preparing fund-specific profitability data and understood that there are a number of potentially acceptable allocation methodologies for information of this type. The directors noted that the profitability information reflected all revenues and expenses of the Adviser’s relationship with the Portfolios, including those relating to its subsidiaries that provide transfer agency and distribution services to the Portfolios. The directors recognized that it is difficult to make comparisons of the profitability of the Advisory Agreement with the profitability of advisory contracts for unaffiliated funds because comparative information is not generally publicly available and is affected by numerous factors. The directors focused on the profitability of the Adviser’s relationships with the Portfolios before taxes and distribution expenses. The directors were satisfied that the Adviser’s level of profitability from its relationship with each Portfolio was not unreasonable.
| | |
| 176 | | • AB MUNICIPAL INCOME FUND |
Fall-Out Benefits
The directors considered the other benefits to the Adviser and its affiliates from their relationships with the Portfolios, including, but not limited to, benefits relating to 12b-1 fees and sales charges received by the Fund’s principal underwriter (which is a wholly owned subsidiary of the Adviser) in respect of certain classes of the Portfolios’ shares and transfer agency fees paid by the Portfolios to a wholly owned subsidiary of the Adviser. The directors recognized that the Adviser’s profitability would be lower without these benefits. The directors understood that the Adviser also might derive reputational and other benefits from its association with the Portfolios.
Investment Results
In addition to the information reviewed by the directors in connection with the meeting, the directors receive detailed performance information for each Portfolio at each regular Board meeting during the year. At the November 2014 meeting, the directors reviewed information prepared by Lipper showing the performance for Class A shares of each Portfolio as compared with that of a group of funds selected by Lipper (the “Performance Group”) and as compared with that of a broader array of funds selected by Lipper (the “Performance Universe”), and information prepared by the Adviser showing performance of the Class A Shares of each Portfolio as compared with the Barclays Municipal Bond Index (the “Index”), in each case for the 1-, 3-, 5- and 10-year periods, as applicable, ended July 31, 2014 and (in the case of comparisons with the Index) the period since inception.
AB California Portfolio
The directors noted that the Portfolio (December 1986 inception) was in the 5th quintile of the Performance Group and the Performance Universe for the 1-, 3- and 5-year periods, and in the 4th quintile of the Performance Group and 3rd quintile of the Performance Universe for the 10-year period. The Portfolio outperformed the Index in the 1-, 3- and 5-year periods and lagged it in the 10-year period and the period since inception. Based on their review and their discussion with the Adviser of the reasons for the Portfolio’s performance, the directors retained confidence in the Adviser’s ability to manage the Portfolio’s assets.
AB National Portfolio
The directors noted that the Portfolio (December 1986 inception) was in the 5th quintile of the Performance Group and 4th quintile of the Performance Universe for the 1-year period, in the 4th quintile of the Performance Group and the Performance Universe for the 3-year period, in the 3rd quintile of the Performance Group and the Performance Universe for the 5-year period, and in the 2nd quintile of the Performance Group and the Performance Universe for the 10-year period. The Portfolio was essentially even with the Index in the 3-year period, outperformed it in the 5-year period and lagged it in the 1- and 10-year periods
| | | | |
| AB MUNICIPAL INCOME FUND • | | | 177 | |
and the period since inception. Based on their review and their discussion with the Adviser of the reasons for the Portfolio’s recent performance, the directors concluded that the Portfolio’s performance was acceptable.
AB New York Portfolio
The directors noted that the Portfolio (December 1986 inception) was in the 5th quintile of the Performance Group and the Performance Universe for the 1-, 3- and 5-year periods, and in the 2nd quintile of the Performance Group and 3rd quintile of the Performance Universe for the 10-year period. The Portfolio lagged the Index in all periods. Based on their review and their discussion with the Adviser of the reasons for the Portfolio’s performance, the directors retained confidence in the Adviser’s ability to manage the Portfolio’s assets.
AB High Income Municipal Portfolio
The directors noted that the Portfolio (January 2010 inception) was in the 1st quintile of the Performance Group and the Performance Universe for the 1-year period and in the 2nd quintile of the Performance Group and 1st quintile of the Performance Universe for the 3-year period. The Portfolio outperformed the Index in all periods. Based on their review, the directors concluded that the Portfolio’s performance was satisfactory.
Advisory Fees and Other Expenses
The directors considered the advisory fee rate paid or payable by each Portfolio to the Adviser and information prepared by Lipper concerning advisory fee rates paid by other funds in the same Lipper category as the Portfolio at a common asset level. The directors recognized that it is difficult to make comparisons of advisory fees because there are variations in the services that are included in the fees paid by other funds.
The Adviser informed the directors that there were no institutional products managed by it that have an investment style substantially similar to that of a Portfolio. The directors reviewed the relevant advisory fee information from the Adviser’s Form ADV and the evaluation from the Fund’s Senior Officer, and noted that the Adviser charged institutional clients lower fees for advising comparably sized institutional accounts using strategies that differ from those of the Portfolios but which invest in fixed income municipal securities.
The Adviser reviewed with the directors the significantly greater scope of the services it provides to the Portfolios relative to institutional clients. The Adviser also noted that because mutual funds are constantly issuing and redeeming their shares, they are more difficult to manage than an institutional account, where the assets tend to be relatively stable. In light of the substantial differences in services rendered by the Adviser to institutional clients as compared to funds such as the Portfolios, the directors considered these fee comparisons inapt and did not place significant weight on them in their deliberations.
| | |
| 178 | | • AB MUNICIPAL INCOME FUND |
The directors also considered the total expense ratio of the Class A shares of each Portfolio in comparison to the fees and expenses of funds within two comparison groups created by Lipper: an Expense Group and an Expense Universe. Lipper described an Expense Group as a representative sample of funds similar to a Portfolio and an Expense Universe as a broader group, consisting of all funds in the Portfolio’s investment classification/objective with a similar load type as the Portfolio. The Class A expense ratio of each Portfolio was based on the Portfolio’s latest fiscal year. The expense ratios of the AB High Income Portfolio reflected fee waivers and/or expense reimbursements as a result of an undertaking by the Adviser. The directors noted that it was likely that the expense ratios of some of the other funds in each Portfolio’s Lipper category also were lowered by waivers or reimbursements by those funds’ investment advisers, which in some cases might be voluntary or temporary. The directors view the expense ratio information as relevant to their evaluation of the Adviser’s services because the Adviser is responsible for coordinating services provided to the Portfolios by others.
AB California Portfolio
The directors noted that, at the Portfolio’s current size, its contractual effective advisory fee rate of 45 basis points, plus the 1 basis point impact of the administrative expense reimbursement in the latest fiscal year, was lower than the Expense Group median. The directors noted that the Portfolio’s total expense ratio, which had been capped by the Adviser (although the expense ratio was currently lower than the cap) was lower than the Expense Group median and the same as the Expense Universe median. The directors concluded that the Portfolio’s expense ratio was satisfactory.
AB National Portfolio
The directors noted that, at the Portfolio’s current size, its contractual effective advisory fee rate of 45 basis points, plus the 1 basis point impact of the administrative expense reimbursement in the latest fiscal year, was lower than the Expense Group median. The directors noted that the Portfolio’s total expense ratio, which had been capped by the Adviser (although the expense ratio was currently lower than the cap) was lower than the Expense Group and the Expense Universe medians. The directors concluded that the Portfolio’s expense ratio was satisfactory.
AB New York Portfolio
The directors noted that, at the Portfolio’s current size, its contractual effective advisory fee rate of 45 basis points, plus the 1 basis point impact of the administrative expense reimbursement in the latest fiscal year, was lower than the Expense Group median. The directors noted that the Portfolio’s total expense ratio, which had been capped by the Adviser (although the expense ratio was currently lower than the cap) was the same as the Expense Group median and higher than the Expense Universe median. The directors concluded that the Portfolio’s expense ratio was acceptable.
| | | | |
| AB MUNICIPAL INCOME FUND • | | | 179 | |
AB High Income Municipal Portfolio
The directors noted that, at the Portfolio’s current size, its contractual effective advisory fee of 50 basis points was the same as the Expense Group median. The directors noted that the administrative expense reimbursement was less than 1 basis point in the Portfolio’s latest fiscal year, and that as a result the rate of total compensation received by the Adviser from the Portfolio pursuant to the Advisory Agreement was about the same as the Expense Group median. The directors noted that the Portfolio’s total expense ratio, giving effect to a cap by the Adviser, was lower than the Expense Group and the Expense Universe medians. The directors concluded that the Portfolio’s expense ratio was satisfactory.
Economies of Scale
The directors noted that the advisory fee schedule for each Portfolio contains breakpoints that reduce the fee rates on assets above specified levels. The directors took into consideration prior presentations by an independent consultant on economies of scale in the mutual fund industry and for the AB Funds, and by the Adviser concerning certain of its views on economies of scale. The directors also had requested and received from the Adviser certain updates on economies of scale at the May 2014 meetings. The directors believe that economies of scale may be realized (if at all) by the Adviser across a variety of products and services, and not only in respect of a single fund. The directors noted that there is no established methodology for setting breakpoints that give effect to the fund-specific services provided by a fund’s adviser and to the economies of scale that an adviser may realize in its overall mutual fund business or those components of it which directly or indirectly affect a fund’s operations. The directors observed that in the mutual fund industry as a whole, as well as among funds similar to the Portfolios, there is no uniformity or pattern in the fees and asset levels at which breakpoints (if any) apply. The directors also noted that the advisory agreements for many funds do not have breakpoints at all. Having taken these factors into account, the directors concluded that the Portfolios’ shareholders would benefit from a sharing of economies of scale in the event a Portfolio’s net assets exceed a breakpoint in the future.
| | |
| 180 | | • AB MUNICIPAL INCOME FUND |
THE FOLLOWING IS NOT PART OF THE SHAREHOLDER REPORT OR THE FINANCIAL STATEMENTS
SUMMARY OF SENIOR OFFICER’S EVALUATION OF INVESTMENT ADVISORY AGREEMENT1
The following is a summary of the evaluation of the Investment Advisory Agreement between AllianceBernstein L.P. (the “Adviser”) and The AllianceBernstein Municipal Income Fund (the “Fund”) in respect of the following Portfolios (the “Portfolios”):2
California Portfolio
National Portfolio
New York Portfolio
High Income Municipal Portfolio
The evaluation of the Investment Advisory Agreement was prepared by Philip L. Kirstein, the Senior Officer of the Fund, for the Directors of the Fund, as required by the August 2004 agreement between the Adviser and the New York State Attorney General (the “NYAG”). The Senior Officer’s evaluation of the Investment Advisory Agreement is not meant to diminish the responsibility or authority of the Board of Directors to perform its duties pursuant to Section 15 of the Investment Company Act of 1940 (the “40 Act”) and applicable state law. The purpose of this summary is to provide shareholders with a synopsis of the independent evaluation of the reasonableness of the advisory fees proposed to be paid by the Portfolios which was provided to the Directors in connection with their review of the proposed approval of the continuance of the Investment Advisory Agreement.
The Senior Officer’s evaluation considered the following factors:
| | 1. | Advisory fees charged to institutional and other clients of the Adviser for like services; |
| | 2. | Advisory fees charged by other mutual fund companies for like services; |
| | 3. | Costs to the Adviser and its affiliates of supplying services pursuant to the advisory agreement, excluding any intra-corporate profit; |
| | 4. | Profit margins of the Adviser and its affiliates from supplying such services; |
| | 5. | Possible economies of scale as the Portfolios grow larger; and |
| 1 | | The information in the fee evaluation was completed on October 23, 2014 and discussed with the Board of Directors on November 4-6, 2014. |
| 2 | | Future references to the Portfolios do not include “AllianceBernstein.” References in the fee summary pertaining to performance and expense ratios refer to Class A shares of the Portfolios. |
| | | | |
| AB MUNICIPAL INCOME FUND • | | | 181 | |
| | 6. | Nature and quality of the Adviser’s services including the performance of the Portfolios. |
These factors, with the exception of the first factor, are generally referred to as the “Gartenberg factors,” which were articulated by the United States Court of Appeals for the Second Circuit in 1982. Gartenberg v. Merrill Lynch Asset Management, Inc., 694 F. 2d 923 (2d Cir. 1982). On March 30, 2010, the Supreme Court held the Gartenberg decision was correct in its basic formulation of what Section 36(b) requires: to face liability under Section 36(b), “an investment adviser must charge a fee that is so disproportionately large that it bears no reasonable relationship to the services rendered and could not have been the product of arm’s length bargaining.” Jones v. Harris Associates L.P., 130 S.Ct. 1418 (2010). In Jones, the Court stated the Gartenberg approach fully incorporates the correct understanding of fiduciary duty within the context of Section 36(b) and noted with approval that “Gartenberg insists that all relevant circumstances be taken into account” and “uses the range of fees that might result from arm’s length bargaining as the benchmark for reviewing challenged fees.”3
INVESTMENT ADVISORY FEES, NET ASSETS, EXPENSE CAPS & RATIOS
The Adviser proposed that each Portfolio pays the advisory fee set forth in the table below for receiving the services to be provided pursuant to the Investment Advisory Agreement. The fee schedule below, implemented in January 2004 in consideration of the Adviser’s settlement with the NYAG in December 2003, is based on a master schedule that contemplates eight categories of funds with almost all funds in each category having the same advisory fee schedule.4
| | | | |
| Category | | Advisory Fee Schedule5 | | Portfolio |
| Low Risk Income | | 0.45% on 1st $2.5 billion 0.40% on next $2.5 billion 0.35% on the balance | | California Portfolio National Portfolio New York Portfolio |
| | | | |
| High Income | | 0.50% on 1st $2.5 billion 0.45% on next $2.5 billion 0.40% on the balance | | High Income Municipal Portfolio |
| 3 | | Jones v. Harris at 1427. |
| 4 | | Most of the AllianceBernstein Mutual Funds, which the Adviser manages, were affected by the Adviser’s settlement with the NYAG. |
| 5 | | The advisory fees for each Portfolio are based on the percentage of each Portfolio’s average daily net assets, not a combination of any of the Portfolios. |
| | |
| 182 | | • AB MUNICIPAL INCOME FUND |
The Portfolios’ net assets on September 30, 2014 are set forth below:
| | | | |
| Portfolio | | September 30, 2014 Net Assets ($MM) | |
| California Portfolio | | $ | 569.0 | |
| National Portfolio | | $ | 953.2 | |
| New York Portfolio | | $ | 528.6 | |
| High Income Municipal Portfolio | | $ | 1,788.8 | |
The Portfolios’ Investment Advisory Agreements provide for the Adviser to be reimbursed for certain clerical, legal, accounting, administrative and other services provided to each Portfolio. Indicated below are the reimbursement amounts, which the Adviser received from the Portfolios during their most recently completed fiscal year, expressed in dollars and as a percentage of average daily net assets:
| | | | | | | | |
| Portfolio | | Amount | | | As a % of Average Daily Net Assets | |
| California Portfolio | | $ | 44,079 | | | | 0.007 | % |
| National Portfolio | | $ | 45,388 | | | | 0.004 | % |
| New York Portfolio | | $ | 45,366 | | | | 0.007 | % |
| High Income Municipal Portfolio | | $ | 43,443 | | | | 0.003 | % |
The Adviser has agreed to waive that portion of its advisory fees and/or reimburse the Portfolios for that portion of the Portfolios’ total operating expenses to the degree necessary to limit each Portfolio’s expense ratio to the amounts set forth below for each Portfolio’s current fiscal year. The waiver is terminable by the Adviser upon at least 60 days’ notice prior to each Portfolio’s prospectus update. In addition, set forth below are the gross expense ratios of the Portfolios for the most recent semi-annual period:6
| | | | | | | | | | | | |
| Fund | | Expense Cap Pursuant to
Expense Limitation
Undertaking | | | Gross Expense Ratio7 | | | Fiscal
Year End |
| California Portfolio8 | | Advisor Class A Class B Class C | |
| 0.50
0.80 1.50 1.50 | %
% % % | |
| 0.55
0.85 1.56 1.55 | %
% % % | | Oct. 31 (ratios as of Apr. 30, 2014) |
| | | | | | | | | | | | |
| National Portfolio9 | | Advisor Class A Class B Class C | |
| 0.50
0.80 1.50 1.50 | %
% % % | |
| 0.56
0.86 1.57 1.56 | %
% % % | | Oct. 31 (ratios as of Apr. 30, 2014) |
| | | | | | | | | | | | |
| 6 | | Semi-annual total expense ratios are unaudited. |
| 8 | | The Fund’s expense ratios exclude interest expense of 0.01% for all share classes. |
| 9 | | The Fund’s expense ratios exclude interest expense of less than 0.01% for Advisor Class, Class A and Class B shares, and 0.01% for Class C shares. |
| | | | |
| AB MUNICIPAL INCOME FUND • | | | 183 | |
| | | | | | | | | | | | |
| Fund | | Expense Cap Pursuant to
Expense Limitation
Undertaking | | | Gross Expense Ratio | | | Fiscal
Year End |
| New York Portfolio10 | | Advisor Class A Class B Class C | |
| 0.50
0.80 1.50 1.50 | %
% % % | |
| 0.57
0.87 1.58 1.57 | %
% % % | | Oct. 31 (ratios as of Apr. 30, 2014) |
| | | | | | | | | | | | |
| High Income Municipal Portfolio11 | | Advisor Class A Class C | |
| 0.50
0.80 1.50 | %
% % | |
| 0.58
0.89 1.59 | %
% % | | October 31 (ratios as of Apr. 30, 2014) |
| I. | ADVISORY FEES CHARGED TO INSTITUTIONAL AND OTHER CLIENTS |
The advisory fees charged to investment companies which the Adviser manages and sponsors are normally higher than those charged to similar sized institutional accounts, including pension plans and sub-advised investment companies. The fee differential reflects, among other things, different services provided to such clients, and different liabilities assumed. Services provided by the Adviser to the Portfolios that are not provided to non-investment company clients and sub-advised investment companies include providing office space and personnel to serve as Fund Officers, who among other responsibilities make the certifications required under the Sarbanes-Oxley Act of 2002, and coordinating with and monitoring the Portfolios’ third party service providers such as Fund counsel, auditors, custodians, transfer agents and pricing services. The accounting, administrative, legal and compliance requirements for the Portfolios are more costly than those for institutional assets due to the greater complexities and time required for investment companies, although as previously noted, the Adviser is reimbursed for providing such services. Also, retail mutual funds managed by the Adviser are widely held. Servicing the Portfolios’ investors is more time consuming and labor intensive compared to institutional clients since the Adviser needs to communicate with a more extensive network of financial intermediaries and shareholders. The Adviser also believes that it incurs substantial entrepreneurial risk when offering a new mutual fund since establishing a new mutual fund requires a large upfront investment and it may take a long time for the fund to achieve profitability since the fund must be priced to scale from inception in order to be competitive and assets are acquired one account at a time. In addition, managing the cash flow of an investment company may be more difficult than managing that of a stable pool of assets, such as an institutional account with little cash movement in either direction, particularly, if a fund is in net redemption and the Adviser is frequently forced to sell securities to raise cash for redemptions. However, managing a fund with positive cash flow may be easier at times than managing a stable pool of assets. Finally, in recent years, investment advisers have been sued by institutional clients and have suffered reputational damage both by the attendant publicity and outcomes other than complete
| 10 | | The Fund’s expense ratios exclude interest expense of less than 0.01% for all share classes. |
| 11 | | The Fund’s expense ratios exclude interest expense of 0.10% for Advisor Class and 0.09% for Class A and Class C shares. |
| | |
| 184 | | • AB MUNICIPAL INCOME FUND |
victories. Accordingly, the legal and reputational risks associated with institutional accounts are greater than previously thought, although still not equal to those related to the mutual fund industry.
Notwithstanding the Adviser’s view that managing an investment company is not comparable to managing other institutional accounts because the services provided are different, the Supreme Court has indicated consideration should be given to the advisory fees charged to institutional accounts with a similar investment style as the Portfolios.12 With respect to the Portfolios, the Adviser represented that there are no categories in the Form ADV for institutional products that have a substantially similar investment styles as the Portfolios. The Adviser does manage separately managed accounts that invest principally in municipal securities, but those mandates have a substantially lower risk profile (credit and interest rate risk) than that of the Portfolios.
The Adviser manages Sanford C. Bernstein Fund, Inc. (“SCB Fund”), an open-end management investment company. Several of the SCB Fund portfolios have a somewhat similar investment style as certain of the Portfolios and their advisory fee schedules are set forth below. Also presented are what would have been the effective advisory fees of the Portfolios had the SCB Fund fee schedules been applicable to the Portfolios based on September 30, 2014 net assets.
| | | | | | | | | | | | |
| Portfolio | | SCB Fund Portfolio | | Fee Schedule | | SCB Fund Effective Fee (%) | | | Portfolio Advisory Fee (%) | |
| California Portfolio | | Short Duration California Municipal Portfolio | | 0.45% on 1st $750 million 0.40% thereafter | | | 0.450% | | | | 0.450% | |
| | | | | | | | | | | | |
| California Portfolio | | California Municipal Portfolio | | 0.50% on 1st $1 billion 0.45% on next $2 billion 0.40% on next $2 billion 0.35% thereafter | | | 0.500% | | | | 0.450% | |
| | | | | | | | | | | | |
| National Portfolio | | Short Duration Diversified Municipal Portfolio | | 0.45% on 1st $750 million 0.40% thereafter | | | 0.439% | | | | 0.450% | |
| | | | | | | | | | | | |
| 12 | | The Supreme Court stated that “courts may give such comparisons the weight that they merit in light of the similarities and differences between the services that the clients in question require, but the courts must be wary of inapt comparisons.” Among the significant differences the Supreme Court noted that may exist between services provided to mutual funds and institutional accounts are “higher marketing costs.” Jones v. Harris at 1428. |
| | | | |
| AB MUNICIPAL INCOME FUND • | | | 185 | |
| | | | | | | | | | | | |
| Portfolio | | SCB Fund Portfolio | | Fee Schedule | | SCB Fund Effective Fee (%) | | | Portfolio Advisory Fee (%) | |
| National Portfolio | | Diversified Municipal Portfolio | | 0.50% on 1st $1 billion 0.45% on next $2 billion 0.40% on next $2 billion 0.35% on next $2 billion 0.30% thereafter | | | 0.500% | | | | 0.450% | |
| | | | | | | | | | | | |
| New York Portfolio | | Short Duration New York Municipal Portfolio | | 0.45% on 1st $750 million 0.40% thereafter | | | 0.450% | | | | 0.450% | |
| | | | | | | | | | | | |
| New York Portfolio | | New York Municipal Portfolio | | 0.50% on 1st $1 billion 0.45% on next $2 billion 0.40% on next $2 billion 0.35% thereafter | | | 0.500% | | | | 0.450% | |
The Adviser represented that it does not sub-advise any registered investment companies of other fund families with a substantially similar investment style as any of the Portfolios.
| II. | MANAGEMENT FEES CHARGED BY OTHER MUTUAL FUND COMPANIES FOR LIKE SERVICES. |
Lipper, Inc. (“Lipper”), an analytical service that is not affiliated with the Adviser, compared the fees charged to the Portfolios with fees charged to other investment companies for similar services offered by other investment advisers.13 Lipper’s analysis included the comparison of each Portfolio’s contractual management fee, estimated at the approximate current asset level of the subject Portfolio, to the median of each Portfolio’s Lipper Expense Group (“EG”)14 and contractual management fee ranking.15
| 13 | | The Supreme Court cautioned against accepting mutual fund fee comparisons without careful scrutiny since “these comparisons are problematic because these fees, like those challenged, may not be the product of negotiations conducted at arm’s length.” Jones v. Harris at 1429. |
| 14 | | Lipper does not consider average account size when constructing EGs. Funds with relatively small average account sizes tend to have higher transfer agent expense ratios than comparable sized funds that have relatively large average account sizes. Note that there are limitations on Lipper expense category data because different funds categorize expenses differently. |
| 15 | | The contractual management fee is calculated by Lipper using each Portfolio’s contractual management fee rate at a hypothetical asset level. The hypothetical asset level is based on the combined net assets of all classes of each Portfolio, rounded up to the next $25 million. Lipper’s total expense ratio information is based on the most recent annual report except as otherwise noted. A ranking of “1” would mean that a Portfolio had the lowest effective fee rate in the Lipper peer group. |
| | |
| 186 | | • AB MUNICIPAL INCOME FUND |
Lipper describes an EG as a representative sample of comparable funds. Lipper’s standard methodology for screening funds to be included in an EG entails the consideration of several fund criteria, including fund type, investment classification/objective, load type and similar 12b-1/non-12b-1 service fees, asset (size) comparability, expense components and attributes. An EG will typically consist of seven to twenty funds.
| | | | | | | | | | | | |
| Portfolio | | Contractual
Management
Fee (%)16 | | | Lipper Exp.
Group
Median(%) | | | Rank | |
| California Portfolio | | | 0.450 | | | | 0.497 | | | | 2/13 | |
| National Portfolio | | | 0.450 | | | | 0.488 | | | | 5/19 | |
| New York Portfolio17 | | | 0.450 | | | | 0.500 | | | | 2/10 | |
| High Income Municipal Portfolio | | | 0.500 | | | | 0.500 | | | | 6/11 | |
Lipper also compared the Portfolios’ total expense ratios to the medians of the Portfolios’ EGs and the Lipper Expense Universes (“EU”). The EU is a broader group compared to the EG, consisting of all funds that have the same investment classifications/objective and load type as the subject Portfolio.18 Set forth below is a comparison of the Portfolios’ total expense ratios and the medians of the Portfolios’ EGs and EUs. The Portfolios’ total expense ratio rankings are also shown.
| | | | | | | | | | | | | | | | |
| Portfolio | | Expense
Ratio (%)19 | | | Lipper Exp.
Group
Median (%) | | | Lipper
Group
Rank | | Lipper Exp.
Universe
Median (%) | | | Lipper
Universe
Rank |
| California Portfolio | | | 0.787 | | | | 0.795 | | | 6/13 | | | 0.787 | | | 16/31 |
| National Portfolio | | | 0.787 | | | | 0.804 | | | 9/20 | | | 0.794 | | | 29/58 |
| New York Portfolio | | | 0.786 | | | | 0.786 | | | 6/11 | | | 0.785 | | | 14/26 |
| High Income Municipal Portfolio | | | 0.800 | | | | 0.864 | | | 2/12 | | | 0.866 | | | 8/31 |
Based on this analysis, except for High Income Municipal Portfolio which has a more favorable ranking on a total expense ratio basis than a contractual management fee basis, the Portfolios have a more favorable ranking on a contractual management fee basis than on a total expense ratio basis. Except for
| 16 | | The contractual management fees for the Portfolios do not reflect any expense reimbursements made by the Portfolios to the Adviser for certain clerical, legal, accounting, administrative, and other services. In addition, the contractual management fees do not reflect any advisory fee waivers or expense reimbursements made by the Adviser that effectively reduce the contractual management fee. |
| 17 | | One of the Portfolio’s EG peer is excluded from the contractual management fee comparison because Lipper is unable to calculate the peer’s contractual management fee because of the gross income component in the peer’s advisory fee schedule. |
| 18 | | Except for asset (size) comparability, Lipper uses the same criteria for selecting an EG peer when selecting an EU peer. Unlike the EG, the EU allows for the same adviser to be represented by more than just one fund. |
| 19 | | Most recently completed fiscal year Class A share total expense ratio. |
| | | | |
| AB MUNICIPAL INCOME FUND • | | | 187 | |
New York Portfolio, which has an expense ratio equal to its EG median, the Portfolios have lower total expense ratios than their respective EG medians.
| III. | COSTS TO THE ADVISER AND ITS AFFILIATES OF SUPPLYING SERVICES PURSUANT TO THE MANAGEMENT FEE ARRANGEMENT, EXCLUDING ANY INTRA-CORPORATE PROFIT. |
The Adviser utilizes two profitability reporting systems, which operate independently but are aligned with each other, to estimate the Adviser’s profitability in connection with investment advisory services provided to the Portfolios. The Senior Officer has retained a consultant to provide independent advice regarding the alignment of the two profitability systems as well as the methodologies and allocations utilized by both profitability systems. See Section IV for additional discussion.
| IV. | PROFIT MARGINS OF THE ADVISER AND ITS AFFILIATES FOR SUPPLYING SUCH SERVICES. |
The Portfolios’ profitability information, prepared by the Adviser for the Board of Directors, was reviewed by the Senior Officer and the consultant. The Adviser’s profitability from providing investment advisory services to the Portfolios increased during calendar year 2013, relative to 2012.
In addition to the Adviser’s direct profits from managing the Portfolios, certain of the Adviser’s affiliates have business relationships with the Portfolios and may earn a profit from providing other services to the Portfolios. The courts have referred to this type of business opportunity as “fall-out benefits” to the Adviser and indicated that such benefits should be factored into the evaluation of the total relationship between the Portfolios and the Adviser. Neither case law nor common business practice precludes the Adviser’s affiliates from earning a reasonable profit on this type of relationship, provided the affiliates’ charges and services are competitive and the relationship otherwise complies with the 40 Act restrictions. These affiliates provide transfer agent and distribution services to the Portfolios and receive transfer agent fees, Rule 12b-1 payments, front-end sales loads and contingent deferred sales charges (“CDSC”).
AllianceBernstein Investments, Inc. (“ABI”), an affiliate of the Adviser, is the Portfolios’ principal underwriter. ABI and the Adviser have disclosed in the Portfolios’ prospectus that they may make revenue sharing payments from their own resources, in addition to resources derived from sales loads and Rule 12b-1 fees, to firms that sell shares of the Portfolios. In 2013, ABI paid approximately 0.05% of the average monthly assets of the AllianceBernstein Mutual Funds or approximately $19.4 million for distribution services and educational support (revenue sharing payments).
| | |
| 188 | | • AB MUNICIPAL INCOME FUND |
ABI retained the following amounts for Class A front-end load sales charges from sales of the Portfolios’ Class A shares during the Portfolios’ most recently completed fiscal year:
| | | | |
| Portfolio | | Amount Received | |
| California Portfolio | | $ | 310 | |
| National Portfolio | | $ | 3,215 | |
| New York Portfolio | | $ | 16 | |
| High Income Municipal Portfolio | | $ | 7,263 | |
ABI received the amounts set forth below in Rule 12b-1 fees and CDSC from the Portfolios during the Portfolios’ most recently completed fiscal year:
| | | | | | | | |
| Portfolio | | 12b-1 Fee Received | | | CDSC Received | |
| California Portfolio | | $ | 2,556,261 | | | $ | 10,518 | |
| National Portfolio | | $ | 3,938,924 | | | $ | 139,807 | |
| New York Portfolio | | $ | 2,745,365 | | | $ | 94,319 | |
| High Income Municipal Portfolio | | $ | 4,317,071 | | | $ | 241,128 | |
Fees and reimbursements for out of pocket expenses charged by AllianceBernstein Investor Services, Inc. (“ABIS”), the affiliated transfer agent for the Portfolios, are based on the level of the network account and the class of shares held by the account. ABIS also receives a fee per shareholder sub-account for each account maintained by an intermediary on an omnibus basis. ABIS received the following net fees from the Portfolios during the Portfolios’ most recently completed fiscal year:
| | | | |
| Portfolio | | ABIS Fee | |
| California Portfolio | | $ | 84,961 | |
| National Portfolio | | $ | 200,221 | |
| New York Portfolio | | $ | 102,330 | |
| High Income Municipal Portfolio | | $ | 121,081 | |
| V. | POSSIBLE ECONOMIES OF SCALE |
The Adviser has indicated that economies of scale are being shared with shareholders through pricing to scale, breakpoints, fee reductions/waivers and enhancement to services.
In May 2012, an independent consultant, retained by the Senior Officer, provided the Board of Directors information on the Adviser’s firm-wide average costs from 2005 through 2011 and the potential economies of scale. The independent consultant noted that from 2005 through 2007 the Adviser experienced significant growth in assets under management (“AUM”). During this period, operating expenses increased, in part to keep up with growth, and in part reflecting market returns. However, from 2008 through the first quarter of 2009, AUM rapidly and significantly decreased due to declines in market value
| | | | |
| AB MUNICIPAL INCOME FUND • | | | 189 | |
and client withdrawals. When AUM rapidly decreased, some operating expenses categories, including base compensation and office space, adjusted more slowly during this period, resulting in an increase in average costs. Since 2009, AUM has experienced less significant changes. The independent consultant noted that changes in operating expenses reflect changes in business composition and business practices in response to changes in financial markets. Finally, the independent consultant concluded that the increase in average cost and the decline in net operating margin across the Adviser since late 2008 are inconsistent with the view that there are currently reductions in average costs due to economies of scale that can be shared with the AllianceBernstein Mutual Funds managed by the Adviser through lower fees.
Previously, in February 2008, the independent consultant provided the Board of Directors an update of the Deli20 study on advisory fees and various fund characteristics.21 The independent consultant first reiterated the results of his previous two dimensional comparison analysis (fund size and family size) with the Board of Directors.22 The independent consultant then discussed the results of the regression model that was utilized to study the effects of various factors on advisory fees. The regression model output indicated that the bulk of the variation in fees predicted were explained by various factors, but substantially by fund AUM, family AUM, index fund indicator and investment style. The independent consultant also compared the advisory fees of the AllianceBernstein Mutual Funds to similar funds managed by 19 other large asset managers, regardless of the fund size and each Adviser’s proportion of mutual fund assets to non-mutual fund assets.
| VI. | NATURE AND QUALITY OF THE ADVISER’S SERVICES, INCLUDING THE PERFORMANCE OF THE FUND |
With assets under management of approximately $473 billion as of September 30, 2014, the Adviser has the investment experience to manage and provide non-investment services (described in Section I) to the Portfolios.
| 20 | | The Deli study, originally published in 2002 based on 1997 data and updated for the February 2008 Presentation, may be of diminished value due to the age of the data used in the presentation and the changes experienced in the industry since 2008. |
| 21 | | The Supreme Court cautioned against accepting mutual fund fee comparisons without careful scrutiny since the fees may not be the product of negotiations conducted at arm’s length. See Jones V. Harris at 1429. |
| 22 | | The two dimensional analysis showed patterns of lower advisory fees for funds with larger asset sizes and funds from larger family sizes compared to funds with smaller asset sizes and funds from smaller family sizes, which according to the independent consultant is indicative of a sharing of economies of scale and scope. However, in less liquid and active markets, such is not the case, as the empirical analysis showed potential for diseconomies of scale in those markets. The empirical analysis also showed diminishing economies of scale and scope as funds surpassed a certain high level of assets. |
| | |
| 190 | | • AB MUNICIPAL INCOME FUND |
The information prepared by Lipper shows the 1, 3, 5 and 10 year performance rankings23 of the Portfolios relative to their Lipper Performance Group (“PG”) and Lipper Performance Universe (“PU”)24 for the periods ended July 31, 2014.25
| | | | | | | | | | | | | | | | |
| | | Portfolio
Return (%) | | | PG
Median (%) | | | PU
Median (%) | | | PG
Rank | | PU
Rank |
| California Portfolio | | | | | | | | | | | | | | | | |
1 year | | | 7.50 | | | | 9.37 | | | | 9.41 | | | 13/13 | | 33/34 |
3 year | | | 5.44 | | | | 6.70 | | | | 6.65 | | | 13/13 | | 31/31 |
5 year | | | 6.02 | | | | 6.85 | | | | 6.79 | | | 12/13 | | 28/31 |
10 year | | | 4.74 | | | | 4.78 | | | | 4.74 | | | 7/11 | | 14/27 |
| | | | | | | | | | | | | | | | |
| National Portfolio | | | | | | | | | | | | | | | | |
1 year | | | 6.85 | | | | 7.59 | | | | 7.72 | | | 17/20 | | 47/62 |
3 year | | | 5.08 | | | | 5.42 | | | | 5.49 | | | 15/20 | | 40/61 |
5 year | | | 5.95 | | | | 5.97 | | | | 5.79 | | | 11/20 | | 27/57 |
10 year | | | 4.60 | | | | 4.46 | | | | 4.42 | | | 6/20 | | 16/49 |
| | | | | | | | | | | | | | | | |
| New York Portfolio | | | | | | | | | | | | | | | | |
1 year | | | 5.29 | | | | 6.58 | | | | 7.01 | | | 10/11 | | 25/27 |
3 year | | | 3.69 | | | | 4.55 | | | | 4.56 | | | 11/11 | | 25/25 |
5 year | | | 4.60 | | | | 5.18 | | | | 5.15 | | | 11/11 | | 23/24 |
10 year | | | 4.23 | | | | 4.21 | | | | 4.21 | | | 4/10 | | 11/23 |
| | | | | | | | | | | | | | | | |
| High Income Municipal Portfolio | | | | | | | | | | | | | | | | |
1 year | | | 11.16 | | | | 8.40 | | | | 9.56 | | | 2/12 | | 6/36 |
3 year | | | 8.10 | | | | 6.56 | | | | 6.85 | | | 3/12 | | 5/31 |
| 23 | | The performance returns and rankings of the Portfolios are for the Portfolios’ Class A shares. The performance returns of the Portfolios were provided by Lipper. |
| 24 | | A Portfolio’s PG/PU may not necessarily be identical to its respective EG/EU, as the criteria for including/excluding a fund from a PG/PU is somewhat different from that of an EG/EU. |
| 25 | | The current Lipper investment classification/objective dictates the PG and PU throughout the life of each Portfolio even if a Portfolio had a different investment classification/objective at a different point in time. |
| | | | |
| AB MUNICIPAL INCOME FUND • | | | 191 | |
Set forth below are the 1, 3, 5, 10 year and since inception performance returns of the Portfolios (in bold)26 versus their benchmarks.27 Portfolio and benchmark volatility and reward-to-variability ratio (“Sharpe Ratio”) information is also shown.28
| | | | | | | | | | | | | | | | | | | | | | | | | | | | | | | | |
| | | Periods Ending July 31, 2014 Annualized Net Performance | |
| | | 1 Year
(%) | | | 3 Year
(%) | | | 5 Year
(%) | | | 10 Year
(%) | | | Since
Inception
(%) | | | Annualized | | | Risk
Period
(Year) | |
| | | | | | | Volatility
(%) | | | Sharpe
(%) | | |
| California Portfolio | | | 7.50 | | | | 5.44 | | | | 6.02 | | | | 4.74 | | | | 6.08 | | | | 4.91 | | | | 0.63 | | | | 10 | |
| Barclays Capital Municipal Bond Index | | | 7.27 | | | | 5.06 | | | | 5.50 | | | | 4.85 | | | | 6.22 | | | | 4.37 | | | | 0.72 | | | | 10 | |
| Inception Date: December 29, 1986 | | | | | | | | | | | | | |
| | | | | | | | | | | | | | | | | | | | | | | | | | | | | | | | |
| National Portfolio | | | 6.85 | | | | 5.08 | | | | 5.95 | | | | 4.6 | | | | 5.92 | | | | 4.69 | | | | 0.63 | | | | 10 | |
| Barclays Capital Municipal Bond Index | | | 7.27 | | | | 5.06 | | �� | | 5.50 | | | | 4.85 | | | | 6.22 | | | | 4.37 | | | | 0.72 | | | | 10 | |
| Inception Date: December 29, 1986 | | | | | | | | | | | | | |
| | | | | | | | | | | | | | | | | | | | | | | | | | | | | | | | |
| New York Portfolio | | | 5.29 | | | | 3.69 | | | | 4.60 | | | | 4.23 | | | | 5.61 | | | | 4.19 | | | | 0.61 | | | | 10 | |
| Barclays Capital Municipal Bond Index | | | 7.27 | | | | 5.06 | | | | 5.50 | | | | 4.85 | | | | 6.22 | | | | 4.37 | | | | 0.72 | | | | 10 | |
| Inception Date: December 29, 1986 | | | | | | | | | | | | | |
| | | | | | | | | | | | | | | | | | | | | | | | | | | | | | | | |
| High Income Municipal Portfolio | | | 11.16 | | | | 8.10 | | | | N/A | | | | N/A | | | | 7.59 | | | | 6.88 | | | | 1.14 | | | | 3 | |
| Barclays Capital Municipal Bond Index | | | 7.27 | | | | 5.06 | | | | N/A | | | | N/A | | | | 4.99 | | | | 3.85 | | | | 1.26 | | | | 3 | |
| Inception Date: January 26, 2010 | | | | | | | | | | | | | |
| 26 | | The performance returns and risk measures shown in the table are for the Class A shares of the Portfolios. |
| 27 | | The Adviser provided Portfolio and benchmark performance return information for periods through July 31, 2014. |
| 28 | | Portfolio and benchmark volatility and Sharpe Ratio information was obtained through Lipper LANA, a database maintained by Lipper. Volatility is a statistical measure of the tendency of a market price or yield to vary over time. A Sharpe Ratio is a risk adjusted measure of return that divides a fund’s return in excess of the riskless return by the fund’s standard deviation. A fund with a greater volatility would be seen as more risky than a fund with equivalent performance but lower volatility; for that reason, a greater return would be demanded for the more risky fund. A fund with a higher Sharpe Ratio would be viewed as better performing than a fund with a lower Sharpe Ratio. |
| | |
| 192 | | • AB MUNICIPAL INCOME FUND |
CONCLUSION:
Based on the factors discussed above the Senior Officer’s conclusion is that the proposed advisory fee for each Portfolio is reasonable and within the range of what would have been negotiated at arm’s length in light of all the surrounding circumstances. This conclusion in respect of the Portfolios is based on an evaluation of all of these factors and no single factor was dispositive.
Dated: November 18, 2014
| | | | |
| AB MUNICIPAL INCOME FUND • | | | 193 | |
THIS PAGE IS NOT PART OF THE SHAREHOLDER REPORT OR THE FINANCIAL STATEMENTS
AB FAMILY OF FUNDS
US EQUITY
US Core
Core Opportunities Fund
Select US Equity Portfolio
US Growth
Concentrated Growth Fund
Discovery Growth Fund
Growth Fund
Large Cap Growth Fund
Small Cap Growth Portfolio
US Value
Discovery Value Fund
Equity Income Fund
Growth & Income Fund
Small Cap Value Portfolio
Value Fund
INTERNATIONAL/ GLOBAL EQUITY
International/Global Core
Global Core Equity Portfolio
Global Equity & Covered Call Strategy Fund
Global Thematic Growth Fund
International Portfolio
Tax-Managed International Portfolio
International/Global Growth
International Growth Fund
International/Global Value
International Value Fund
FIXED INCOME
Municipal
High Income Municipal Portfolio
Intermediate California Municipal Portfolio
Intermediate Diversified Municipal Portfolio
Intermediate New York Municipal Portfolio
Municipal Bond Inflation Strategy
Tax-Aware Fixed Income Portfolio
National Portfolio
Arizona Portfolio
California Portfolio
FIXED INCOME (continued)
Massachusetts Portfolio
Michigan Portfolio
Minnesota Portfolio
New Jersey Portfolio
New York Portfolio
Ohio Portfolio
Pennsylvania Portfolio
Virginia Portfolio
Taxable
Bond Inflation Strategy
Global Bond Fund
High Income Fund
High Yield Portfolio
Intermediate Bond Portfolio
Limited Duration High Income Portfolio
Short Duration Portfolio
ALTERNATIVES
All Market Real Return Portfolio*
Credit Long/Short Portfolio
Global Real Estate Investment Fund
Long/Short Multi-Manager Fund
Market Neutral Strategy-U.S.
Multi-Manager Alternative Strategies Fund
Select US Long/Short Portfolio
Unconstrained Bond Fund
MULTI-ASSET
All Market Growth Portfolio*
All Market Income Portfolio
Emerging Markets Multi-Asset Portfolio
Global Risk Allocation Fund
Target-Date
Multi-Manager Select Retirement Allocation Fund
Multi-Manager Select 2010 Fund
Multi-Manager Select 2015 Fund
Multi-Manager Select 2020 Fund
Multi-Manager Select 2025 Fund
MULTI-ASSET (continued)
Multi-Manager Select 2030 Fund
Multi-Manager Select 2035 Fund
Multi-Manager Select 2040 Fund
Multi-Manager Select 2045 Fund
Multi-Manager Select 2050 Fund
Multi-Manager Select 2055 Fund
2000 Retirement Strategy
2005 Retirement Strategy
2010 Retirement Strategy
2015 Retirement Strategy
2020 Retirement Strategy
2025 Retirement Strategy
2030 Retirement Strategy
2035 Retirement Strategy
2040 Retirement Strategy
2045 Retirement Strategy
2050 Retirement Strategy
2055 Retirement Strategy
Wealth Strategies
Balanced Wealth Strategy
Conservative Wealth Strategy
Wealth Appreciation Strategy
Tax-Managed Balanced Wealth Strategy
Tax-Managed Conservative Wealth Strategy
Tax-Managed Wealth Appreciation Strategy
CLOSED-END FUNDS
AB Multi-Manager Alternative Fund
Alliance California Municipal Income Fund
Alliance New York Municipal Income Fund
AllianceBernstein Global High Income Fund
AllianceBernstein Income Fund
AllianceBernstein National Municipal Income Fund
We also offer Exchange Reserves, which serves as the money market fund exchange vehicle for the AB mutual funds. An investment in Exchange Reserves is not a deposit in a bank and is not insured or guaranteed by the Federal Deposit Insurance Corporation or any other government agency. Although the Fund seeks to preserve the value of your investment at $1.00 per share, it is possible to lose money by investing in the Fund.
Investors should consider the investment objectives, risks, charges and expenses of the Fund carefully before investing. For copies of our prospectus or summary prospectus, which contain this and other information, visit us online at www.abglobal.com or contact your AB representative. Please read the prospectus and/or summary prospectus carefully before investing.
* Prior to December 15, 2014, All Market Growth Portfolio was named Dynamic All Market Fund; All Market Real Return Portfolio was named Real Asset Strategy.
| | |
| 194 | | • AB MUNICIPAL INCOME FUND |
AB Family of Funds
NOTES
| | | | |
| AB MUNICIPAL INCOME FUND • | | | 195 | |
NOTES
| | |
| 196 | | • AB MUNICIPAL INCOME FUND |
NOTES
| | | | |
| AB MUNICIPAL INCOME FUND • | | | 197 | |
NOTES
| | |
| 198 | | • AB MUNICIPAL INCOME FUND |
NOTES
| | | | |
| AB MUNICIPAL INCOME FUND • | | | 199 | |
NOTES
| | |
| 200 | | • AB MUNICIPAL INCOME FUND |
AB MUNICIPAL INCOME FUND
1345 Avenue of the Americas
New York, NY 10105 800.221.5672
MI-0151-0515 
(a) The registrant has adopted a code of ethics that applies to its principal executive officer, principal financial officer and principal accounting officer. A copy of the registrant’s code of ethics is filed herewith as Exhibit 12(a)(1).
(b) During the period covered by this report, no material amendments were made to the provisions of the code of ethics adopted in 2(a) above.
(c) During the period covered by this report, no implicit or explicit waivers to the provisions of the code of ethics adopted in 2(a) above were granted.
| ITEM 3. | AUDIT COMMITTEE FINANCIAL EXPERT. |
The registrant’s Board of Directors has determined that independent directors Garry L. Moody, William H. Foulk, Jr. and Marshall C. Turner, Jr. qualify as audit committee financial experts.
| ITEM 4. | PRINCIPAL ACCOUNTANT FEES AND SERVICES. |
(a) - (c) The following table sets forth the aggregate fees billed by the independent registered public accounting firm Ernst & Young LLP, for the Fund’s last two fiscal years for professional services rendered for: (i) the audit of the Fund’s annual financial statements included in the Fund’s annual report to stockholders; (ii) assurance and related services that are reasonably related to the performance of the audit of the Fund’s financial statements and are not reported under (i), which include advice and education related to accounting and auditing issues and quarterly press release review (for those Funds which issue press releases), and preferred stock maintenance testing (for those Funds that issue preferred stock); and (iii) tax compliance, tax advice and tax return preparation.
| | | | | | | | | | | | | | | | |
| | | | | | Audit-Related | |
| | | Audit Fees | | | Fees | | | Tax Fees | |
-AB California Portfolio | | | 2014 | | | $ | 41,361 | | | $ | — | | | $ | 13,092 | |
| | | | |
| | | 2015 | | | $ | 34,091 | | | $ | — | | | $ | 17,655 | |
| | | | |
-AB National Portfolio | | | 2014 | | | $ | 42,888 | | | $ | — | | | $ | 13,092 | |
| | | | |
| | | 2015 | | | $ | 35,350 | | | $ | — | | | $ | 17,655 | |
| | | | |
-AB New York Portfolio | | | 2014 | | | $ | 42,888 | | | $ | — | | | $ | 13,092 | |
| | | | |
| | | 2015 | | | $ | 35,350 | | | $ | — | | | $ | 17,655 | |
| | | | |
-AB High Income Municipal Portfolio | | | 2014 | | | $ | 51,511 | | | $ | — | | | $ | 13,092 | |
| | | | |
| | | 2015 | | | $ | 42,458 | | | $ | — | | | $ | 17,655 | |
(d) Not applicable.
(e) (1) Beginning with audit and non-audit service contracts entered into on or after May 6, 2003, the Fund’s Audit Committee policies and procedures require the pre-approval of all audit and non-audit services provided to the Fund by the Fund’s independent registered public accounting firm. The Fund’s Audit Committee policies and procedures also require pre-approval of all audit and non-audit services provided to the Adviser and Service Affiliates to the extent that these services are directly related to the operations or financial reporting of the Fund.
(e) (2) All of the amounts for Audit Fees, Audit-Related Fees and Tax Fees in the table under Item 4 (a) – (c) are for services pre-approved by the Fund’s Audit Committee.
(f) Not applicable.
(g) The following table sets forth the aggregate non-audit services provided to the Fund, the Fund’s Adviser and entities that control, are controlled by or under common control with the Adviser that provide ongoing services to the Fund:
| | | | | | | | | | | | |
| | | All Fees for
Non-Audit Services
Provided to the
Portfolio, the Adviser
and Service Affiliates | | | Total Amount of
Foregoing Column Pre-
approved by the Audit
Committee
(Portion Comprised of
Audit Related Fees)
(Portion Comprised of
Tax Fees) | |
-AB California Portfolio | | | 2014 | | | $ | 423,747 | | | $ | 13,092 | |
| | | | | | | | | | $ | — | |
| | | | | | | | | | $ | (13,092 | ) |
| | | 2015 | | | $ | 183,255 | | | $ | 17,655 | |
| | | | | | | | | | $ | — | |
| | | | | | | | | | $ | (17,655 | ) |
-AB National Portfolio | | | 2014 | | | $ | 423,747 | | | $ | 13,092 | |
| | | | | | | | | | $ | — | |
| | | | | | | | | | $ | (13,092 | ) |
| | | 2015 | | | $ | 183,255 | | | $ | 17,655 | |
| | | | | | | | | | $ | — | |
| | | | | | | | | | $ | (17,655 | ) |
-AB New York Portfolio | | | 2014 | | | $ | 423,747 | | | $ | 13,092 | |
| | | | | | | | | | $ | — | |
| | | | | | | | | | $ | (13,092 | ) |
| | | 2015 | | | $ | 183,255 | | | $ | 17,655 | |
| | | | | | | | | | $ | — | |
| | | | | | | | | | $ | (17,655 | ) |
-AB High Income Municipal Portfolio | | | 2014 | | | $ | 423,747 | | | $ | 13,092 | |
| | | | | | | | | | $ | — | |
| | | | | | | | | | $ | (13,092 | ) |
| | | 2015 | | | $ | 183,255 | | | $ | 17,655 | |
| | | | | | | | | | $ | — | |
| | | | | | | | | | $ | (17,655 | ) |
(h) The Audit Committee of the Fund has considered whether the provision of any non-audit services not pre-approved by the Audit Committee provided by the Fund’s independent registered public accounting firm to the Adviser and Service Affiliates is compatible with maintaining the auditor’s independence.
| ITEM 5. | AUDIT COMMITTEE OF LISTED REGISTRANTS. |
Not applicable to the registrant.
| ITEM 6. | SCHEDULE OF INVESTMENTS. |
Please see Schedule of Investments contained in the Report to Shareholders included under Item 1 of this Form N-CSR.
ITEM 7. DISCLOSURE OF PROXY VOTING POLICIES AND PROCEDURES FOR CLOSED-END MANAGEMENT INVESTMENT COMPANIES.
Not applicable to the registrant.
ITEM 8. PORTFOLIO MANAGERS OF CLOSED-END MANAGEMENT INVESTMENT COMPANIES.
Not applicable to the registrant.
ITEM 9. PURCHASES OF EQUITY SECURITIES BY CLOSED-END MANAGEMENT INVESTMENT COMPANY AND AFFILIATED PURCHASERS.
Not applicable to the registrant.
| ITEM 10. | SUBMISSION OF MATTERS TO A VOTE OF SECURITY HOLDERS. |
There have been no material changes to the procedures by which shareholders may recommend nominees to the Fund’s Board of Directors since the Fund last provided disclosure in response to this item.
| ITEM 11. | CONTROLS AND PROCEDURES. |
(a) The registrant’s principal executive officer and principal financial officer have concluded that the registrant’s disclosure controls and procedures (as defined in Rule 30a-3 (c) under the Investment Company Act of 1940, as amended) are effective at the reasonable assurance level based on their evaluation of these controls and procedures as of a date within 90 days of the filing date of this document.
(b) There were no changes in the registrant’s internal controls over financial reporting that occurred during the second fiscal quarter of the period that has materially affected, or is reasonably likely to materially affect, the registrant’s internal control over financial reporting.
The following exhibits are attached to this Form N-CSR:
| | |
EXHIBIT
NO. | | DESCRIPTION OF EXHIBIT |
| |
| 12 (a) (1) | | Code of Ethics that is subject to the disclosure of Item 2 hereof |
| |
| 12 (b) (1) | | Certification of Principal Executive Officer Pursuant to Section 302 of the Sarbanes-Oxley Act of 2002 |
| |
| 12 (b) (2) | | Certification of Principal Financial Officer Pursuant to Section 302 of the Sarbanes-Oxley Act of 2002 |
| |
| 12 (c) | | Certification of Principal Executive Officer and Principal Financial Officer Pursuant to Section 906 of the Sarbanes-Oxley Act of 2002 |
SIGNATURES
Pursuant to the requirements of the Securities Exchange Act of 1934 and the Investment Company Act of 1940, the registrant has duly caused this report to be signed on its behalf by the undersigned, thereunto duly authorized.
(Registrant): AB Municipal Income Fund, Inc.
| | |
| By: | | /s/ Robert M. Keith |
| | Robert M. Keith |
| | President |
| |
| Date: | | July 20, 2015 |
Pursuant to the requirements of the Securities Exchange Act of 1934 and the Investment Company Act of 1940, this report has been signed below by the following persons on behalf of the registrant and in the capacities and on the dates indicated.
| | |
| By: | | /s/ Robert M. Keith |
| | Robert M. Keith |
| | President |
| |
| Date: | | July 20, 2015 |
| |
| By: | | /s/ Joseph J. Mantineo |
| | Joseph J. Mantineo |
| | Treasurer and Chief Financial Officer |
| |
| Date: | | July 20, 2015 |
