UNITED STATES
SECURITIES AND EXCHANGE COMMISSION
WASHINGTON, D.C. 20549
FORM N-CSR
CERTIFIED SHAREHOLDER REPORT OF REGISTERED
MANAGEMENT INVESTMENT COMPANIES
Investment Company Act file number: 811-04791
AB MUNICIPAL INCOME FUND, INC.
(Exact name of registrant as specified in charter)
1345 Avenue of the Americas, New York, New York 10105
(Address of principal executive offices) (Zip code)
Stephen M. Woetzel
AllianceBernstein L.P.
1345 Avenue of the Americas
New York, New York 10105
(Name and address of agent for service)
Registrant’s telephone number, including area code: (800) 221-5672
Date of fiscal year end: May 31, 2024
Date of reporting period: May 31, 2024
ITEM 1. REPORTS TO STOCKHOLDERS.
Please scan QR code for
Fund Information
Annual Shareholder Report
This annual shareholder report contains important information about the AB California Portfolio (the “Fund”) for the period of June 1, 2023 to May 31, 2024. You can find additional information about the Fund at https://www.abfunds.com/link/AB/ALCVX-A. You can also request this information by contacting us at (800) 227 4618.
What were the Fund costs for the last year?
(Based on a hypothetical $10,000 investment)
| Class Name | Cost of a $10,000 investment | Costs paid as a percentage of a $10,000 investment |
|---|
| Advisor Class | $51 | 0.50% |
How did the Fund perform last year? What affected the Fund’s performance?
For the 12-month period, all share classes of the Fund outperformed the Bloomberg Municipal Bond Index, before sales charges. Sector and security selection, as well as an overweight to credit, contributed to performance, relative to the benchmark. Security selection within multi-family housing and private higher education contributed, while selection in the miscellaneous revenue and industry Industrial Development Revenue (“IDR”) detracted.
The Fund used derivatives for hedging purposes in the form of inflation swaps, which had no material impact on performance, and interest rate swaps, which added to performance. Credit default swaps, used for hedging and investment purposes, had no material impact on performance. Municipal market data rate locks were used for investment purposes and added to overall performance.
Top contributors to performance:
Top detractors from performance:
Security Selection
Top contributors
Sector
Top contributors
Public Primary/Secondary Education
MSA Tobacco Securitization
Top detractors
Not-for-Profit Health Care
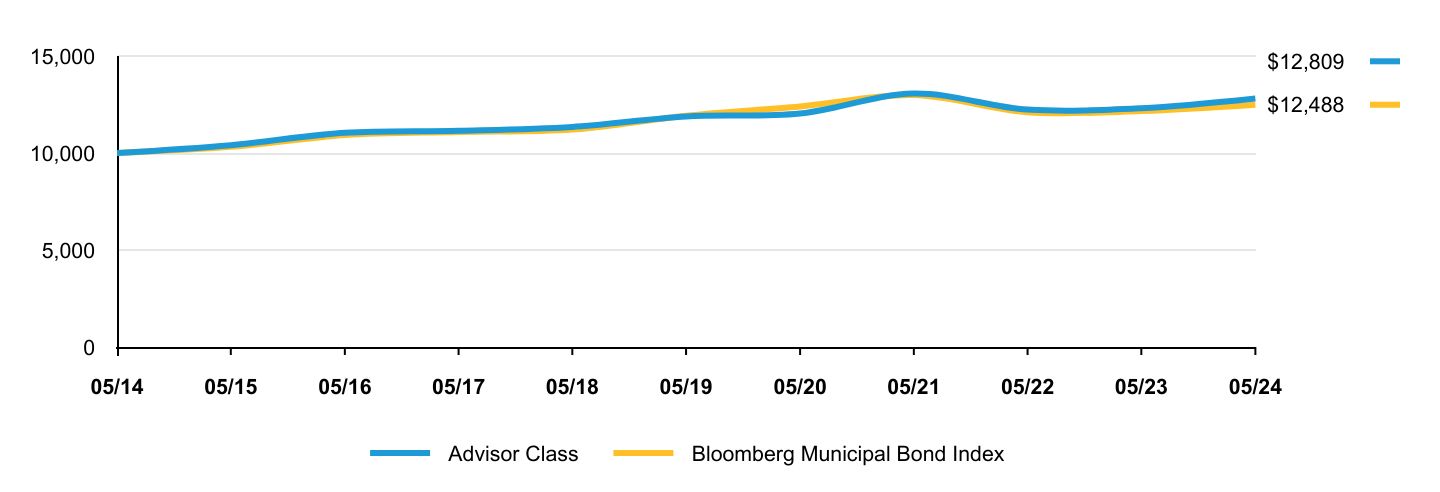
The following graph shows the performance of hypothetical $10,000 investments in the Fund and a broad-based securities market index over the most recently completed 10 fiscal years of the Fund. The Fund's performance reflects sales charges and assumes the reinvestment of dividends.
| Advisor Class | Bloomberg Municipal Bond Index |
|---|
| 05/14 | $10,000 | $10,000 |
| 05/15 | $10,401 | $10,318 |
| 05/16 | $11,040 | $10,924 |
| 05/17 | $11,144 | $11,083 |
| 05/18 | $11,345 | $11,207 |
| 05/19 | $11,887 | $11,925 |
| 05/20 | $12,034 | $12,399 |
| 05/21 | $13,065 | $12,986 |
| 05/22 | $12,238 | $12,104 |
| 05/23 | $12,306 | $12,163 |
| 05/24 | $12,809 | $12,488 |
Average Annual Total Returns
| 1 Year | 5 Years | 10 Years |
|---|
| Advisor Class (without sales charge) | 4.09% | 1.44% | 2.51% |
| Advisor Class (with sales charge) | 4.09% | 1.44% | 2.51% |
| Bloomberg Municipal Bond Index | 2.67% | 0.93% | 2.25% |
The Fund’s past performance is not a good predictor of the Fund’s future performance.
The graph and table do not reflect the deduction of taxes that a shareholder would pay on Fund distributions or redemption of Fund shares.
Visit https://www.abfunds.com/link/AB/ALCVX-A for the most recent performance information.
| Net Assets | $1,158,512,886 |
| # of Portfolio Holdings | 402 |
| Portfolio Turnover Rate | 23% |
| Total Advisory Fees Paid | $4,587,920 |
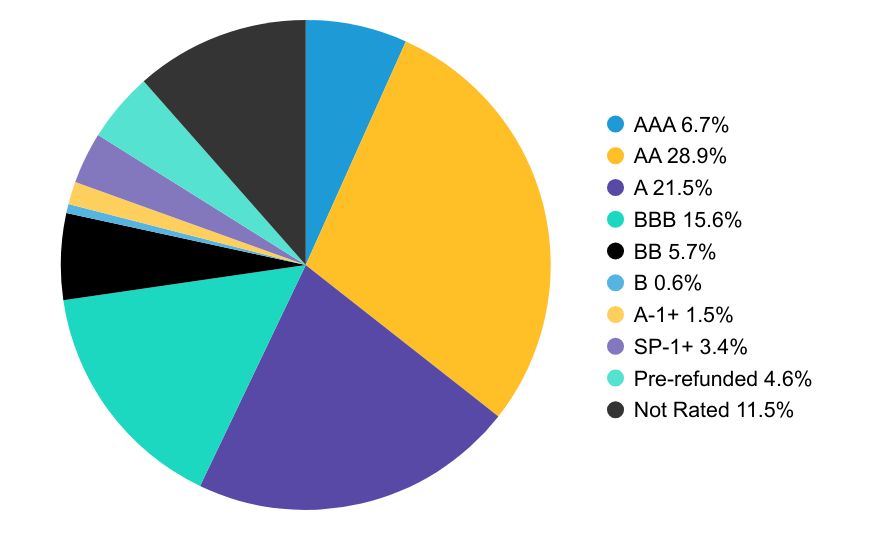
Graphical Representation of Holdings
Credit Rating BreakdownFootnote Reference*
| Value | Value |
|---|
| AAA | 6.7% |
| AA | 28.9% |
| A | 21.5% |
| BBB | 15.6% |
| BB | 5.7% |
| B | 0.6% |
| A-1+ | 1.5% |
| SP-1+ | 3.4% |
| Pre-refunded | 4.6% |
| Not Rated | 11.5% |
*The Fund’s quality rating breakdown is expressed as a percentage of the Fund’s total investments in municipal securities and may vary over time. The quality ratings are determined by using the S&P Global Ratings (“S&P”), Moody’s Investors Services, Inc. (“Moody’s”) and Fitch Ratings, Ltd. (“Fitch”). The Fund considers the credit ratings issued by S&P, Moody’s and Fitch and uses the highest rating used by the agencies. These ratings are a measure of the quality and safety of a bond or portfolio, based on the issuer’s financial condition. AAA is the highest (best) and D is the lowest (worst). If applicable, the pre-refunded category includes bonds which are secured by U.S. Government securities and therefore are deemed high-quality investment grade by Alliance Bernstein L.P. (the “Adviser”). If applicable, Not Applicable (N/A) includes non-credit worthy investments; such as, currency contracts, futures and options. If applicable, the Not Rated category includes bonds that are not rated by a nationally recognized statistical rating organization. The Adviser evaluates the creditworthiness of non-rated securities based on a number of factors including, but not limited to, cash flows, enterprise value and economic environment.
Availability of Additional Information
You can find additional information on the Fund’s website at https://www.abfunds.com/link/AB/ALCVX-A, including the Fund's:
• Prospectus
• Financial information
• Fund holdings
• Proxy voting information
You can also request this information by contacting us at (800) 227 4618.
Shareholders who have consented to receive a single annual or semi-annual shareholder report at a shared address may revoke this consent by contacting us at (800) 227 4618.
Information Regarding the Review and Approval of the Fund’s Advisory Agreement
Information regarding the Fund’s Board of Directors’/Trustees’ review of the advisory agreement is available on the Fund’s website https://www.abfunds.com/link/AB/ALCVX-A. You can request this information, free of charge, by contacting us at (800) 227 4618 or by scanning the QR code below.
The [A/B] logo is a registered service mark of AllianceBernstein and AllianceBernstein® is a registered service mark used by permission of the owner, AllianceBernstein L.P.
Please scan QR code for
Fund Information
Please scan QR code for
Fund Information
Annual Shareholder Report
This annual shareholder report contains important information about the AB California Portfolio (the “Fund”) for the period of June 1, 2023 to May 31, 2024. You can find additional information about the Fund at https://www.abfunds.com/link/AB/ALCAX-A. You can also request this information by contacting us at (800) 227 4618.
What were the Fund costs for the last year?
(Based on a hypothetical $10,000 investment)
| Class Name | Cost of a $10,000 investment | Costs paid as a percentage of a $10,000 investment |
|---|
| Class A | $76 | 0.75% |
How did the Fund perform last year? What affected the Fund’s performance?
For the 12-month period, all share classes of the Fund outperformed the Bloomberg Municipal Bond Index, before sales charges. Sector and security selection, as well as an overweight to credit, contributed to performance, relative to the benchmark. Security selection within multi-family housing and private higher education contributed, while selection in the miscellaneous revenue and industry Industrial Development Revenue (“IDR”) detracted.
The Fund used derivatives for hedging purposes in the form of inflation swaps, which had no material impact on performance, and interest rate swaps, which added to performance. Credit default swaps, used for hedging and investment purposes, had no material impact on performance. Municipal market data rate locks were used for investment purposes and added to overall performance.
Top contributors to performance:
Top detractors from performance:
Security Selection
Top contributors
Sector
Top contributors
Public Primary/Secondary Education
MSA Tobacco Securitization
Top detractors
Not-for-Profit Health Care
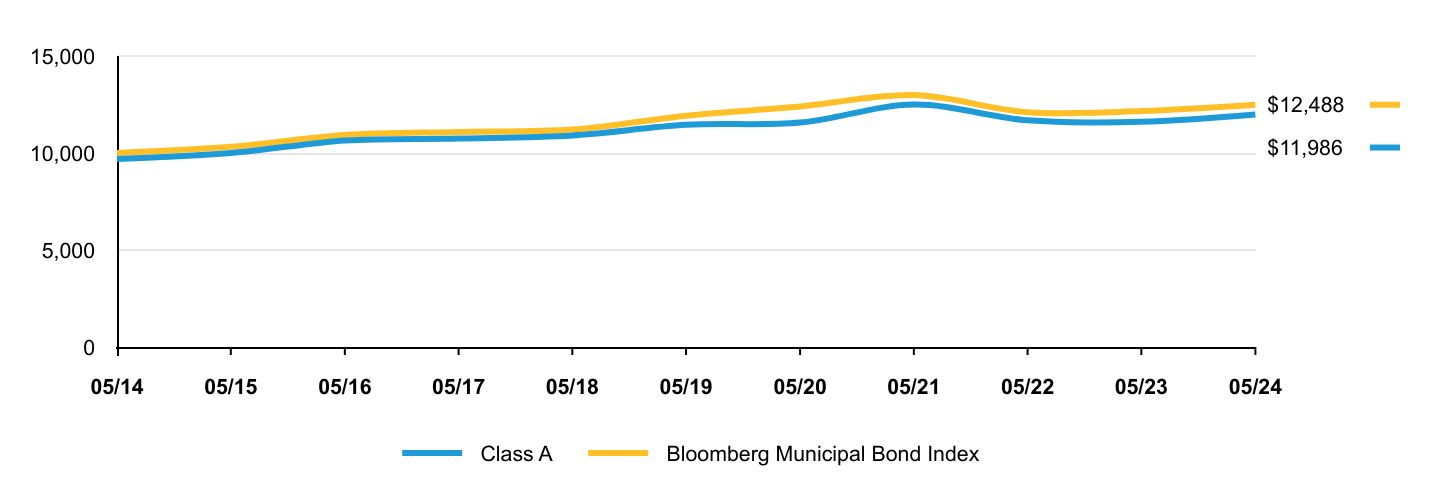
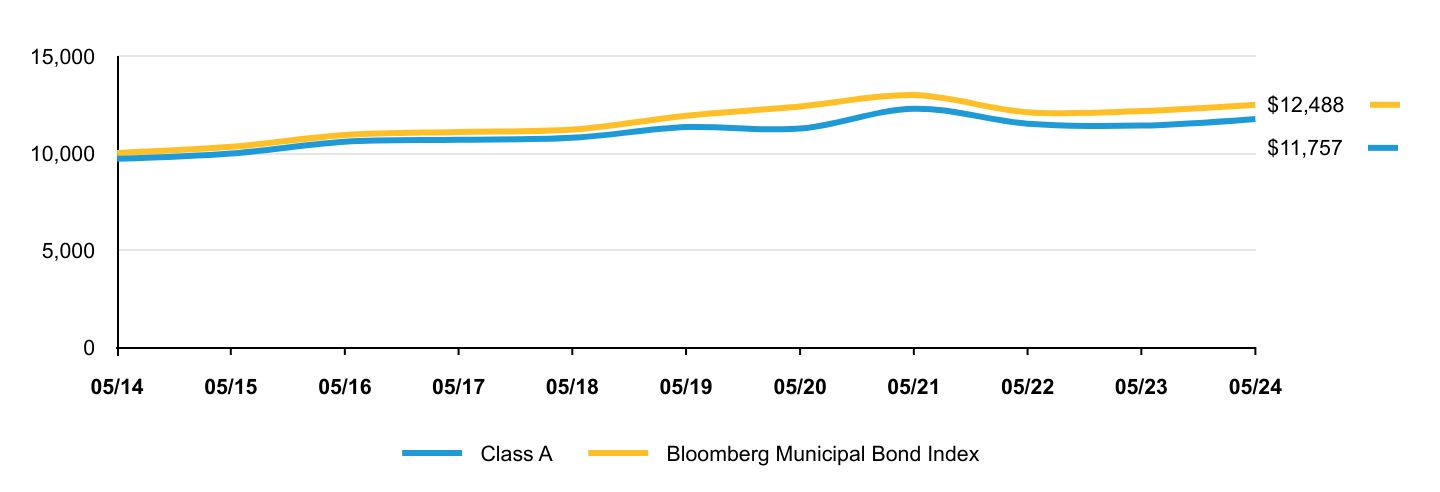
The following graph shows the performance of hypothetical $10,000 investments in the Fund and a broad-based securities market index over the most recently completed 10 fiscal years of the Fund. The Fund's performance reflects sales charges and assumes the reinvestment of dividends.
| Class A | Bloomberg Municipal Bond Index |
|---|
| 05/14 | $9,698 | $10,000 |
| 05/15 | $10,059 | $10,318 |
| 05/16 | $10,650 | $10,924 |
| 05/17 | $10,723 | $11,083 |
| 05/18 | $10,889 | $11,207 |
| 05/19 | $11,384 | $11,925 |
| 05/20 | $11,493 | $12,399 |
| 05/21 | $12,448 | $12,986 |
| 05/22 | $11,630 | $12,104 |
| 05/23 | $11,666 | $12,163 |
| 05/24 | $12,112 | $12,488 |
Average Annual Total Returns
| 1 Year | 5 Years | 10 Years |
|---|
| Class A (without sales charge) | 3.82% | 1.19% | 2.25% |
| Class A (with sales charge) | 0.70% | 0.57% | 1.93% |
| Bloomberg Municipal Bond Index | 2.67% | 0.93% | 2.25% |
The Fund’s past performance is not a good predictor of the Fund’s future performance.
The graph and table do not reflect the deduction of taxes that a shareholder would pay on Fund distributions or redemption of Fund shares.
Visit https://www.abfunds.com/link/AB/ALCAX-A for the most recent performance information.
| Net Assets | $1,158,512,886 |
| # of Portfolio Holdings | 402 |
| Portfolio Turnover Rate | 23% |
| Total Advisory Fees Paid | $4,587,920 |
Graphical Representation of Holdings
Credit Rating BreakdownFootnote Reference*
| Value | Value |
|---|
| AAA | 6.7% |
| AA | 28.9% |
| A | 21.5% |
| BBB | 15.6% |
| BB | 5.7% |
| B | 0.6% |
| A-1+ | 1.5% |
| SP-1+ | 3.4% |
| Pre-refunded | 4.6% |
| Not Rated | 11.5% |
*The Fund’s quality rating breakdown is expressed as a percentage of the Fund’s total investments in municipal securities and may vary over time. The quality ratings are determined by using the S&P Global Ratings (“S&P”), Moody’s Investors Services, Inc. (“Moody’s”) and Fitch Ratings, Ltd. (“Fitch”). The Fund considers the credit ratings issued by S&P, Moody’s and Fitch and uses the highest rating used by the agencies. These ratings are a measure of the quality and safety of a bond or portfolio, based on the issuer’s financial condition. AAA is the highest (best) and D is the lowest (worst). If applicable, the pre-refunded category includes bonds which are secured by U.S. Government securities and therefore are deemed high-quality investment grade by Alliance Bernstein L.P. (the “Adviser”). If applicable, Not Applicable (N/A) includes non-credit worthy investments; such as, currency contracts, futures and options. If applicable, the Not Rated category includes bonds that are not rated by a nationally recognized statistical rating organization. The Adviser evaluates the creditworthiness of non-rated securities based on a number of factors including, but not limited to, cash flows, enterprise value and economic environment.
Availability of Additional Information
You can find additional information on the Fund’s website at https://www.abfunds.com/link/AB/ALCAX-A, including the Fund's:
• Prospectus
• Financial information
• Fund holdings
• Proxy voting information
You can also request this information by contacting us at (800) 227 4618.
Shareholders who have consented to receive a single annual or semi-annual shareholder report at a shared address may revoke this consent by contacting us at (800) 227 4618.
Information Regarding the Review and Approval of the Fund’s Advisory Agreement
Information regarding the Fund’s Board of Directors’/Trustees’ review of the advisory agreement is available on the Fund’s website https://www.abfunds.com/link/AB/ALCAX-A. You can request this information, free of charge, by contacting us at (800) 227 4618 or by scanning the QR code below.
The [A/B] logo is a registered service mark of AllianceBernstein and AllianceBernstein® is a registered service mark used by permission of the owner, AllianceBernstein L.P.
Please scan QR code for
Fund Information
Please scan QR code for
Fund Information
Annual Shareholder Report
This annual shareholder report contains important information about the AB California Portfolio (the “Fund”) for the period of June 1, 2023 to May 31, 2024. You can find additional information about the Fund at https://www.abfunds.com/link/AB/ACACX-A. You can also request this information by contacting us at (800) 227 4618.
What were the Fund costs for the last year?
(Based on a hypothetical $10,000 investment)
| Class Name | Cost of a $10,000 investment | Costs paid as a percentage of a $10,000 investment |
|---|
| Class C | $152 | 1.50% |
How did the Fund perform last year? What affected the Fund’s performance?
For the 12-month period, all share classes of the Fund outperformed the Bloomberg Municipal Bond Index, before sales charges. Sector and security selection, as well as an overweight to credit, contributed to performance, relative to the benchmark. Security selection within multi-family housing and private higher education contributed, while selection in the miscellaneous revenue and industry Industrial Development Revenue (“IDR”) detracted.
The Fund used derivatives for hedging purposes in the form of inflation swaps, which had no material impact on performance, and interest rate swaps, which added to performance. Credit default swaps, used for hedging and investment purposes, had no material impact on performance. Municipal market data rate locks were used for investment purposes and added to overall performance.
Top contributors to performance:
Top detractors from performance:
Security Selection
Top contributors
Sector
Top contributors
Public Primary/Secondary Education
MSA Tobacco Securitization
Top detractors
Not-for-Profit Health Care
The following graph shows the performance of hypothetical $10,000 investments in the Fund and a broad-based securities market index over the most recently completed 10 fiscal years of the Fund. The Fund's performance reflects sales charges and assumes the reinvestment of dividends.
| Class C | Bloomberg Municipal Bond Index |
|---|
| 05/14 | $10,000 | $10,000 |
| 05/15 | $10,298 | $10,318 |
| 05/16 | $10,823 | $10,924 |
| 05/17 | $10,806 | $11,083 |
| 05/18 | $10,891 | $11,207 |
| 05/19 | $11,318 | $11,925 |
| 05/20 | $11,334 | $12,399 |
| 05/21 | $12,173 | $12,986 |
| 05/22 | $11,298 | $12,104 |
| 05/23 | $11,237 | $12,163 |
| 05/24 | $11,580 | $12,488 |
Average Annual Total Returns
| 1 Year | 5 Years | 10 Years |
|---|
| Class C (without sales charge) | 3.05% | 0.41% | 1.48% |
| Class C (with sales charge) | 2.05% | 0.41% | 1.48% |
| Bloomberg Municipal Bond Index | 2.67% | 0.93% | 2.25% |
The Fund’s past performance is not a good predictor of the Fund’s future performance.
The graph and table do not reflect the deduction of taxes that a shareholder would pay on Fund distributions or redemption of Fund shares.
Visit https://www.abfunds.com/link/AB/ACACX-A for the most recent performance information.
| Net Assets | $1,158,512,886 |
| # of Portfolio Holdings | 402 |
| Portfolio Turnover Rate | 23% |
| Total Advisory Fees Paid | $4,587,920 |
Graphical Representation of Holdings
Credit Rating BreakdownFootnote Reference*
| Value | Value |
|---|
| AAA | 6.7% |
| AA | 28.9% |
| A | 21.5% |
| BBB | 15.6% |
| BB | 5.7% |
| B | 0.6% |
| A-1+ | 1.5% |
| SP-1+ | 3.4% |
| Pre-refunded | 4.6% |
| Not Rated | 11.5% |
*The Fund’s quality rating breakdown is expressed as a percentage of the Fund’s total investments in municipal securities and may vary over time. The quality ratings are determined by using the S&P Global Ratings (“S&P”), Moody’s Investors Services, Inc. (“Moody’s”) and Fitch Ratings, Ltd. (“Fitch”). The Fund considers the credit ratings issued by S&P, Moody’s and Fitch and uses the highest rating used by the agencies. These ratings are a measure of the quality and safety of a bond or portfolio, based on the issuer’s financial condition. AAA is the highest (best) and D is the lowest (worst). If applicable, the pre-refunded category includes bonds which are secured by U.S. Government securities and therefore are deemed high-quality investment grade by Alliance Bernstein L.P. (the “Adviser”). If applicable, Not Applicable (N/A) includes non-credit worthy investments; such as, currency contracts, futures and options. If applicable, the Not Rated category includes bonds that are not rated by a nationally recognized statistical rating organization. The Adviser evaluates the creditworthiness of non-rated securities based on a number of factors including, but not limited to, cash flows, enterprise value and economic environment.
Availability of Additional Information
You can find additional information on the Fund’s website at https://www.abfunds.com/link/AB/ACACX-A, including the Fund's:
• Prospectus
• Financial information
• Fund holdings
• Proxy voting information
You can also request this information by contacting us at (800) 227 4618.
Shareholders who have consented to receive a single annual or semi-annual shareholder report at a shared address may revoke this consent by contacting us at (800) 227 4618.
Information Regarding the Review and Approval of the Fund’s Advisory Agreement
Information regarding the Fund’s Board of Directors’/Trustees’ review of the advisory agreement is available on the Fund’s website https://www.abfunds.com/link/AB/ACACX-A. You can request this information, free of charge, by contacting us at (800) 227 4618 or by scanning the QR code below.
The [A/B] logo is a registered service mark of AllianceBernstein and AllianceBernstein® is a registered service mark used by permission of the owner, AllianceBernstein L.P.
Please scan QR code for
Fund Information
AB High Income Municipal Portfolio
Please scan QR code for
Fund Information
Annual Shareholder Report
This annual shareholder report contains important information about the AB High Income Municipal Portfolio (the “Fund”) for the period of June 1, 2023 to May 31, 2024. You can find additional information about the Fund at https://www.abfunds.com/link/AB/ABTYX-A. You can also request this information by contacting us at (800) 227 4618.
What were the Fund costs for the last year?
(Based on a hypothetical $10,000 investment)
| Class Name | Cost of a $10,000 investment | Costs paid as a percentage of a $10,000 investment |
|---|
| Advisor Class | $97 | 0.95% |
How did the Fund perform last year? What affected the Fund’s performance?
For the 12-month period, all share classes outperformed the Bloomberg Municipal Bond Index, before sales charges. Sector and security selection, as well as an overweight to credit, contributed to performance, relative to the benchmark. Security selection within housing and special tax contributed, while selection in the electric utility and utility Industrial Development Revenue (“IDR”) detracted.
While the benchmark is fully invested in investment-grade securities, the Fund invests in below-investment-grade securities, which added over both periods.
The Fund used derivatives for hedging purposes in the form of inflation swaps, which had no material impact on performance, and interest rate swaps, which added to performance. Credit default swaps, used for hedging and investment purposes, had no material impact on performance. Municipal market data rate locks were used for investment purposes and added to overall performance.
Top contributors to performance:
Top detractors from performance:
Security Selection
Top contributors
Sector
Top contributors
Public Primary/Secondary Education
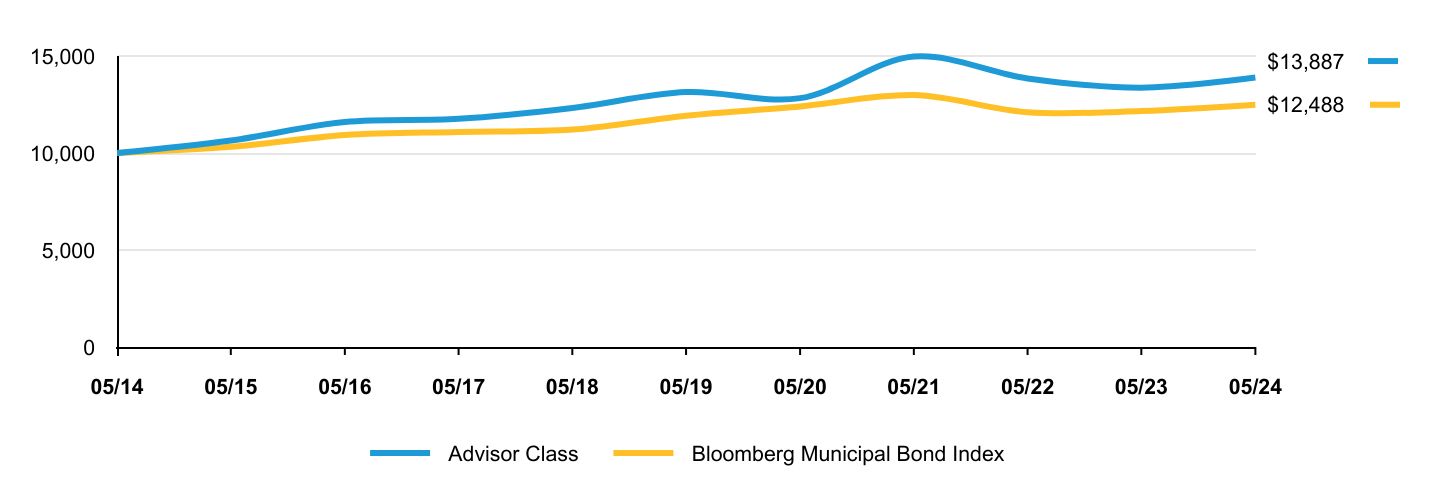
The following graph shows the performance of hypothetical $10,000 investments in the Fund and a broad-based securities market index over the most recently completed 10 fiscal years of the Fund. The Fund's performance reflects sales charges and assumes the reinvestment of dividends.
| Advisor Class | Bloomberg Municipal Bond Index |
|---|
| 05/14 | $10,000 | $10,000 |
| 05/15 | $10,644 | $10,318 |
| 05/16 | $11,602 | $10,924 |
| 05/17 | $11,763 | $11,083 |
| 05/18 | $12,323 | $11,207 |
| 05/19 | $13,143 | $11,925 |
| 05/20 | $12,827 | $12,399 |
| 05/21 | $14,969 | $12,986 |
| 05/22 | $13,841 | $12,104 |
| 05/23 | $13,368 | $12,163 |
| 05/24 | $13,887 | $12,488 |
Average Annual Total Returns
| 1 Year | 5 Years | 10 Years |
|---|
| Advisor Class (without sales charge) | 3.88% | 1.04% | 3.34% |
| Advisor Class (with sales charge) | 3.88% | 1.04% | 3.34% |
| Bloomberg Municipal Bond Index | 2.67% | 0.93% | 2.25% |
The Fund’s past performance is not a good predictor of the Fund’s future performance.
The graph and table do not reflect the deduction of taxes that a shareholder would pay on Fund distributions or redemption of Fund shares.
Visit https://www.abfunds.com/link/AB/ABTYX-A for the most recent performance information.
| Net Assets | $2,790,140,470 |
| # of Portfolio Holdings | 812 |
| Portfolio Turnover Rate | 23% |
| Total Advisory Fees Paid | $13,917,267 |
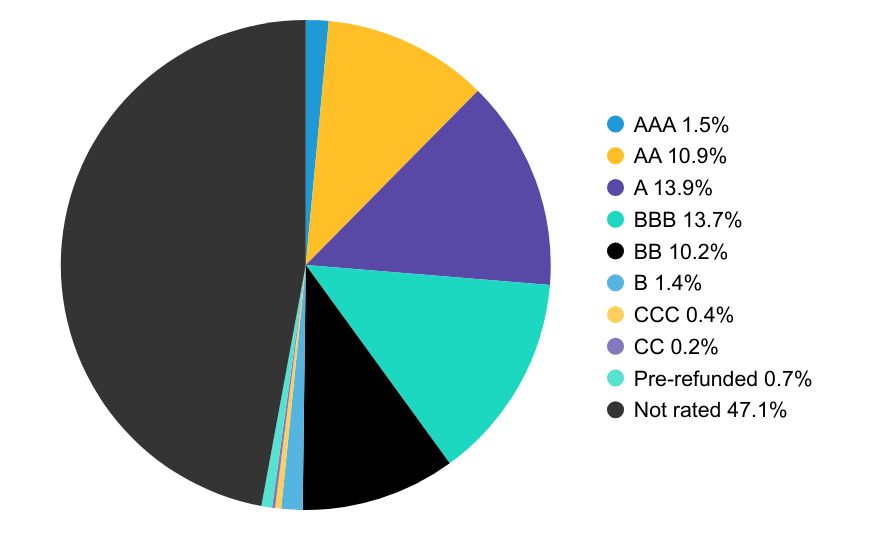
Graphical Representation of Holdings
Credit Rating BreakdownFootnote Reference*
| Value | Value |
|---|
| AAA | 1.5% |
| AA | 10.9% |
| A | 13.9% |
| BBB | 13.7% |
| BB | 10.2% |
| B | 1.4% |
| CCC | 0.4% |
| CC | 0.2% |
| Pre-refunded | 0.7% |
| Not rated | 47.1% |
*The Fund’s quality rating breakdown is expressed as a percentage of the Fund’s total investments in municipal securities and may vary over time. The quality ratings are determined by using the S&P Global Ratings (“S&P”), Moody’s Investors Services, Inc. (“Moody’s”) and Fitch Ratings, Ltd. (“Fitch”). The Fund considers the credit ratings issued by S&P, Moody’s and Fitch and uses the highest rating used by the agencies. These ratings are a measure of the quality and safety of a bond or portfolio, based on the issuer’s financial condition. AAA is the highest (best) and D is the lowest (worst). If applicable, the pre-refunded category includes bonds which are secured by U.S. Government securities and therefore are deemed high-quality investment grade by Alliance Bernstein L.P. (the “Adviser”). If applicable, Not Applicable (N/A) includes non-credit worthy investments; such as, currency contracts, futures and options. If applicable, the Not Rated category includes bonds that are not rated by a nationally recognized statistical rating organization. The Adviser evaluates the creditworthiness of non-rated securities based on a number of factors including, but not limited to, cash flows, enterprise value and economic environment.
Availability of Additional Information
You can find additional information on the Fund’s website at https://www.abfunds.com/link/AB/ABTYX-A, including the Fund's:
• Prospectus
• Financial information
• Fund holdings
• Proxy voting information
You can also request this information by contacting us at (800) 227 4618.
Shareholders who have consented to receive a single annual or semi-annual shareholder report at a shared address may revoke this consent by contacting us at (800) 227 4618.
Information Regarding the Review and Approval of the Fund’s Advisory Agreement
Information regarding the Fund’s Board of Directors’/Trustees’ review of the advisory agreement is available on the Fund’s website https://www.abfunds.com/link/AB/ABTYX-A. You can request this information, free of charge, by contacting us at (800) 227 4618 or by scanning the QR code below.
The [A/B] logo is a registered service mark of AllianceBernstein and AllianceBernstein® is a registered service mark used by permission of the owner, AllianceBernstein L.P.
Please scan QR code for
Fund Information
AB High Income Municipal Portfolio
Please scan QR code for
Fund Information
Annual Shareholder Report
This annual shareholder report contains important information about the AB High Income Municipal Portfolio (the “Fund”) for the period of June 1, 2023 to May 31, 2024. You can find additional information about the Fund at https://www.abfunds.com/link/AB/ABTHX-A. You can also request this information by contacting us at (800) 227 4618.
What were the Fund costs for the last year?
(Based on a hypothetical $10,000 investment)
| Class Name | Cost of a $10,000 investment | Costs paid as a percentage of a $10,000 investment |
|---|
| Class A | $122 | 1.20% |
How did the Fund perform last year? What affected the Fund’s performance?
For the 12-month period, all share classes outperformed the Bloomberg Municipal Bond Index, before sales charges. Sector and security selection, as well as an overweight to credit, contributed to performance, relative to the benchmark. Security selection within housing and special tax contributed, while selection in the electric utility and utility Industrial Development Revenue (“IDR”) detracted.
While the benchmark is fully invested in investment-grade securities, the Fund invests in below-investment-grade securities, which added over both periods.
The Fund used derivatives for hedging purposes in the form of inflation swaps, which had no material impact on performance, and interest rate swaps, which added to performance. Credit default swaps, used for hedging and investment purposes, had no material impact on performance. Municipal market data rate locks were used for investment purposes and added to overall performance.
Top contributors to performance:
Top detractors from performance:
Security Selection
Top contributors
Sector
Top contributors
Public Primary/Secondary Education
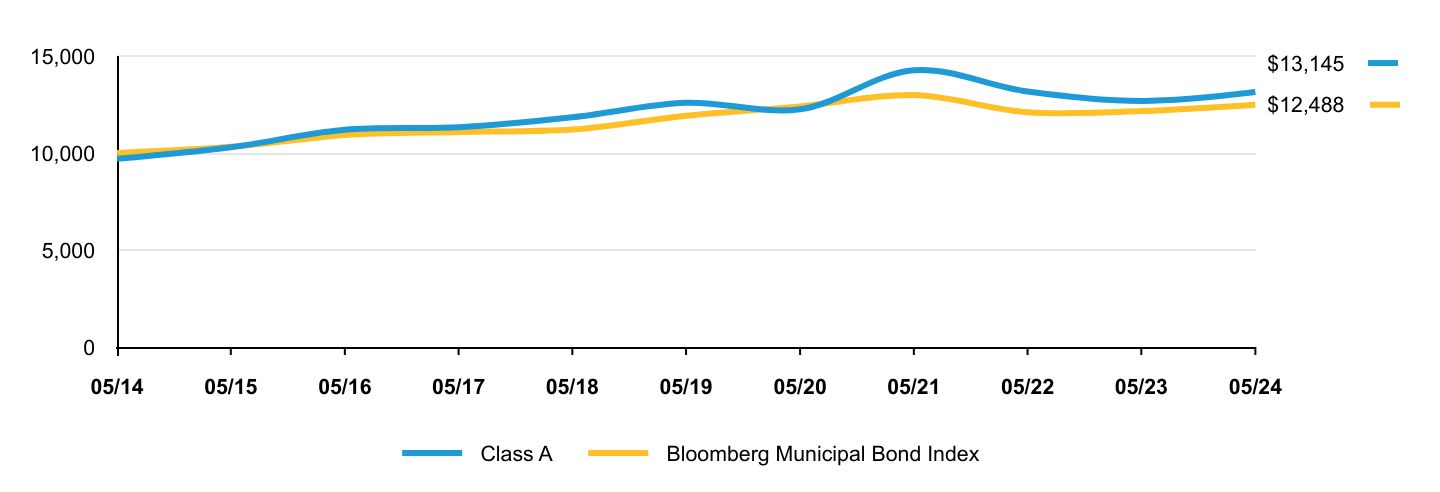
The following graph shows the performance of hypothetical $10,000 investments in the Fund and a broad-based securities market index over the most recently completed 10 fiscal years of the Fund. The Fund's performance reflects sales charges and assumes the reinvestment of dividends.
| Class A | Bloomberg Municipal Bond Index |
|---|
| 05/14 | $9,701 | $10,000 |
| 05/15 | $10,296 | $10,318 |
| 05/16 | $11,204 | $10,924 |
| 05/17 | $11,331 | $11,083 |
| 05/18 | $11,841 | $11,207 |
| 05/19 | $12,589 | $11,925 |
| 05/20 | $12,253 | $12,399 |
| 05/21 | $14,263 | $12,986 |
| 05/22 | $13,167 | $12,104 |
| 05/23 | $12,686 | $12,163 |
| 05/24 | $13,145 | $12,488 |
Average Annual Total Returns
| 1 Year | 5 Years | 10 Years |
|---|
| Class A (without sales charge) | 3.62% | 0.81% | 3.08% |
| Class A (with sales charge) | 0.55% | 0.19% | 2.77% |
| Bloomberg Municipal Bond Index | 2.67% | 0.93% | 2.25% |
The Fund’s past performance is not a good predictor of the Fund’s future performance.
The graph and table do not reflect the deduction of taxes that a shareholder would pay on Fund distributions or redemption of Fund shares.
Visit https://www.abfunds.com/link/AB/ABTHX-A for the most recent performance information.
| Net Assets | $2,790,140,470 |
| # of Portfolio Holdings | 812 |
| Portfolio Turnover Rate | 23% |
| Total Advisory Fees Paid | $13,917,267 |
Graphical Representation of Holdings
Credit Rating BreakdownFootnote Reference*
| Value | Value |
|---|
| AAA | 1.5% |
| AA | 10.9% |
| A | 13.9% |
| BBB | 13.7% |
| BB | 10.2% |
| B | 1.4% |
| CCC | 0.4% |
| CC | 0.2% |
| Pre-refunded | 0.7% |
| Not rated | 47.1% |
*The Fund’s quality rating breakdown is expressed as a percentage of the Fund’s total investments in municipal securities and may vary over time. The quality ratings are determined by using the S&P Global Ratings (“S&P”), Moody’s Investors Services, Inc. (“Moody’s”) and Fitch Ratings, Ltd. (“Fitch”). The Fund considers the credit ratings issued by S&P, Moody’s and Fitch and uses the highest rating used by the agencies. These ratings are a measure of the quality and safety of a bond or portfolio, based on the issuer’s financial condition. AAA is the highest (best) and D is the lowest (worst). If applicable, the pre-refunded category includes bonds which are secured by U.S. Government securities and therefore are deemed high-quality investment grade by Alliance Bernstein L.P. (the “Adviser”). If applicable, Not Applicable (N/A) includes non-credit worthy investments; such as, currency contracts, futures and options. If applicable, the Not Rated category includes bonds that are not rated by a nationally recognized statistical rating organization. The Adviser evaluates the creditworthiness of non-rated securities based on a number of factors including, but not limited to, cash flows, enterprise value and economic environment.
Availability of Additional Information
You can find additional information on the Fund’s website at https://www.abfunds.com/link/AB/ABTHX-A, including the Fund's:
• Prospectus
• Financial information
• Fund holdings
• Proxy voting information
You can also request this information by contacting us at (800) 227 4618.
Shareholders who have consented to receive a single annual or semi-annual shareholder report at a shared address may revoke this consent by contacting us at (800) 227 4618.
Information Regarding the Review and Approval of the Fund’s Advisory Agreement
Information regarding the Fund’s Board of Directors’/Trustees’ review of the advisory agreement is available on the Fund’s website https://www.abfunds.com/link/AB/ABTHX-A. You can request this information, free of charge, by contacting us at (800) 227 4618 or by scanning the QR code below.
The [A/B] logo is a registered service mark of AllianceBernstein and AllianceBernstein® is a registered service mark used by permission of the owner, AllianceBernstein L.P.
Please scan QR code for
Fund Information
AB High Income Municipal Portfolio
Please scan QR code for
Fund Information
Annual Shareholder Report
This annual shareholder report contains important information about the AB High Income Municipal Portfolio (the “Fund”) for the period of June 1, 2023 to May 31, 2024. You can find additional information about the Fund at https://www.abfunds.com/link/AB/ABTFX-A. You can also request this information by contacting us at (800) 227 4618.
What were the Fund costs for the last year?
(Based on a hypothetical $10,000 investment)
| Class Name | Cost of a $10,000 investment | Costs paid as a percentage of a $10,000 investment |
|---|
| Class C | $198 | 1.95% |
How did the Fund perform last year? What affected the Fund’s performance?
For the 12-month period, all share classes outperformed the Bloomberg Municipal Bond Index, before sales charges. Sector and security selection, as well as an overweight to credit, contributed to performance, relative to the benchmark. Security selection within housing and special tax contributed, while selection in the electric utility and utility Industrial Development Revenue (“IDR”) detracted.
While the benchmark is fully invested in investment-grade securities, the Fund invests in below-investment-grade securities, which added over both periods.
The Fund used derivatives for hedging purposes in the form of inflation swaps, which had no material impact on performance, and interest rate swaps, which added to performance. Credit default swaps, used for hedging and investment purposes, had no material impact on performance. Municipal market data rate locks were used for investment purposes and added to overall performance.
Top contributors to performance:
Top detractors from performance:
Security Selection
Top contributors
Sector
Top contributors
Public Primary/Secondary Education
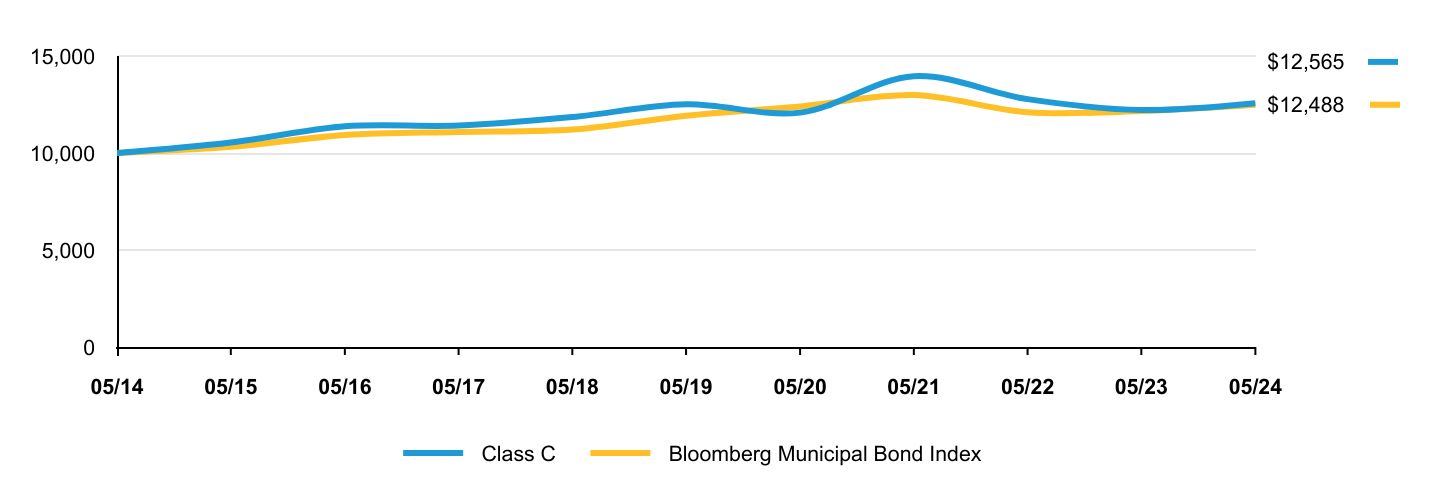
The following graph shows the performance of hypothetical $10,000 investments in the Fund and a broad-based securities market index over the most recently completed 10 fiscal years of the Fund. The Fund's performance reflects sales charges and assumes the reinvestment of dividends.
| Class C | Bloomberg Municipal Bond Index |
|---|
| 05/14 | $10,000 | $10,000 |
| 05/15 | $10,538 | $10,318 |
| 05/16 | $11,373 | $10,924 |
| 05/17 | $11,416 | $11,083 |
| 05/18 | $11,851 | $11,207 |
| 05/19 | $12,514 | $11,925 |
| 05/20 | $12,082 | $12,399 |
| 05/21 | $13,959 | $12,986 |
| 05/22 | $12,778 | $12,104 |
| 05/23 | $12,218 | $12,163 |
| 05/24 | $12,565 | $12,488 |
Average Annual Total Returns
| 1 Year | 5 Years | 10 Years |
|---|
| Class C (without sales charge) | 2.84% | 0.03% | 2.31% |
| Class C (with sales charge) | 1.84% | 0.03% | 2.31% |
| Bloomberg Municipal Bond Index | 2.67% | 0.93% | 2.25% |
The Fund’s past performance is not a good predictor of the Fund’s future performance.
The graph and table do not reflect the deduction of taxes that a shareholder would pay on Fund distributions or redemption of Fund shares.
Visit https://www.abfunds.com/link/AB/ABTFX-A for the most recent performance information.
| Net Assets | $2,790,140,470 |
| # of Portfolio Holdings | 812 |
| Portfolio Turnover Rate | 23% |
| Total Advisory Fees Paid | $13,917,267 |
Graphical Representation of Holdings
Credit Rating BreakdownFootnote Reference*
| Value | Value |
|---|
| AAA | 1.5% |
| AA | 10.9% |
| A | 13.9% |
| BBB | 13.7% |
| BB | 10.2% |
| B | 1.4% |
| CCC | 0.4% |
| CC | 0.2% |
| Pre-refunded | 0.7% |
| Not rated | 47.1% |
*The Fund’s quality rating breakdown is expressed as a percentage of the Fund’s total investments in municipal securities and may vary over time. The quality ratings are determined by using the S&P Global Ratings (“S&P”), Moody’s Investors Services, Inc. (“Moody’s”) and Fitch Ratings, Ltd. (“Fitch”). The Fund considers the credit ratings issued by S&P, Moody’s and Fitch and uses the highest rating used by the agencies. These ratings are a measure of the quality and safety of a bond or portfolio, based on the issuer’s financial condition. AAA is the highest (best) and D is the lowest (worst). If applicable, the pre-refunded category includes bonds which are secured by U.S. Government securities and therefore are deemed high-quality investment grade by Alliance Bernstein L.P. (the “Adviser”). If applicable, Not Applicable (N/A) includes non-credit worthy investments; such as, currency contracts, futures and options. If applicable, the Not Rated category includes bonds that are not rated by a nationally recognized statistical rating organization. The Adviser evaluates the creditworthiness of non-rated securities based on a number of factors including, but not limited to, cash flows, enterprise value and economic environment.
Availability of Additional Information
You can find additional information on the Fund’s website at https://www.abfunds.com/link/AB/ABTFX-A, including the Fund's:
• Prospectus
• Financial information
• Fund holdings
• Proxy voting information
You can also request this information by contacting us at (800) 227 4618.
Shareholders who have consented to receive a single annual or semi-annual shareholder report at a shared address may revoke this consent by contacting us at (800) 227 4618.
Information Regarding the Review and Approval of the Fund’s Advisory Agreement
Information regarding the Fund’s Board of Directors’/Trustees’ review of the advisory agreement is available on the Fund’s website https://www.abfunds.com/link/AB/ABTFX-A. You can request this information, free of charge, by contacting us at (800) 227 4618 or by scanning the QR code below.
The [A/B] logo is a registered service mark of AllianceBernstein and AllianceBernstein® is a registered service mark used by permission of the owner, AllianceBernstein L.P.
Please scan QR code for
Fund Information
AB High Income Municipal Portfolio
Please scan QR code for
Fund Information
Annual Shareholder Report
This annual shareholder report contains important information about the AB High Income Municipal Portfolio (the “Fund”) for the period of June 1, 2023 to May 31, 2024. You can find additional information about the Fund at https://www.abfunds.com/link/AB/ABTZX-A. You can also request this information by contacting us at (800) 227 4618.
What were the Fund costs for the last year?
(Based on a hypothetical $10,000 investment)
| Class Name | Cost of a $10,000 investment | Costs paid as a percentage of a $10,000 investment |
|---|
| Class Z | $97 | 0.95% |
How did the Fund perform last year? What affected the Fund’s performance?
For the 12-month period, all share classes outperformed the Bloomberg Municipal Bond Index, before sales charges. Sector and security selection, as well as an overweight to credit, contributed to performance, relative to the benchmark. Security selection within housing and special tax contributed, while selection in the electric utility and utility Industrial Development Revenue (“IDR”) detracted.
While the benchmark is fully invested in investment-grade securities, the Fund invests in below-investment-grade securities, which added over both periods.
The Fund used derivatives for hedging purposes in the form of inflation swaps, which had no material impact on performance, and interest rate swaps, which added to performance. Credit default swaps, used for hedging and investment purposes, had no material impact on performance. Municipal market data rate locks were used for investment purposes and added to overall performance.
Top contributors to performance:
Top detractors from performance:
Security Selection
Top contributors
Sector
Top contributors
Public Primary/Secondary Education
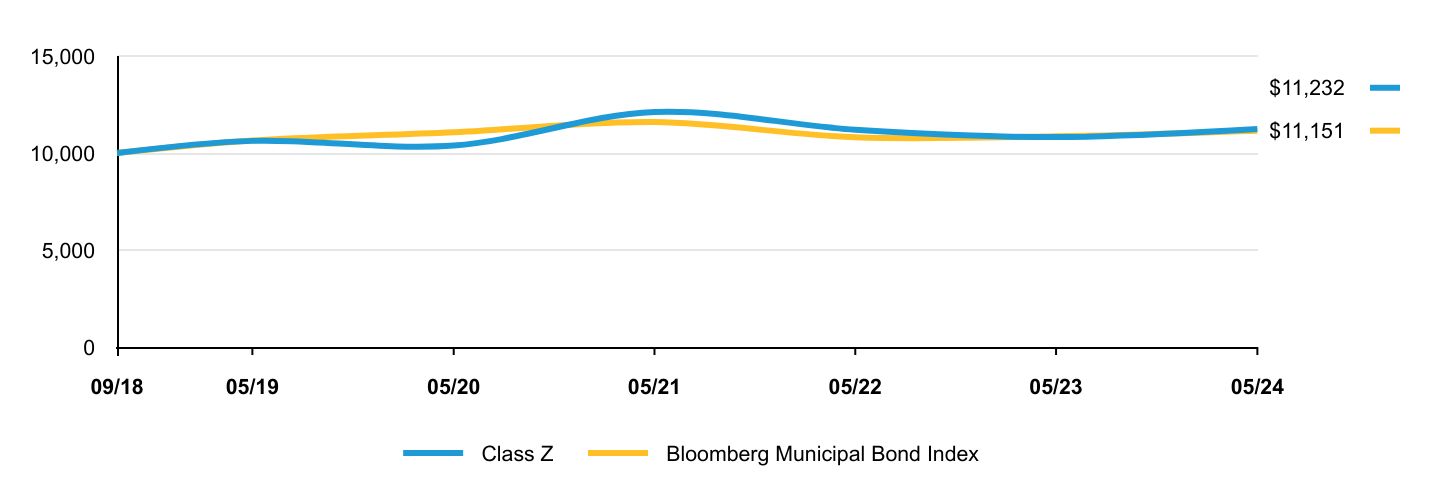
The following graph shows the performance of hypothetical $10,000 investments in the Fund and a broad-based securities market index over the most recently completed 10 fiscal years of the Fund. The Fund's performance reflects sales charges and assumes the reinvestment of dividends.
| Class Z | Bloomberg Municipal Bond Index |
|---|
| 09/18 | $10,000 | $10,000 |
| 05/19 | $10,625 | $10,647 |
| 05/20 | $10,382 | $11,071 |
| 05/21 | $12,115 | $11,595 |
| 05/22 | $11,204 | $10,807 |
| 05/23 | $10,823 | $10,860 |
| 05/24 | $11,232 | $11,151 |
Average Annual Total Returns
| 1 Year | 5 Years | Since Inception 9/28/18 |
|---|
| Class Z (without sales charge) | 3.78% | 1.05% | 2.07% |
| Class Z (with sales charge) | 3.78% | 1.05% | 2.07% |
| Bloomberg Municipal Bond Index | 2.67% | 0.93% | 1.94% |
The Fund’s past performance is not a good predictor of the Fund’s future performance.
The graph and table do not reflect the deduction of taxes that a shareholder would pay on Fund distributions or redemption of Fund shares.
Visit https://www.abfunds.com/link/AB/ABTZX-A for the most recent performance information.
| Net Assets | $2,790,140,470 |
| # of Portfolio Holdings | 812 |
| Portfolio Turnover Rate | 23% |
| Total Advisory Fees Paid | $13,917,267 |
Graphical Representation of Holdings
Credit Rating BreakdownFootnote Reference*
| Value | Value |
|---|
| AAA | 1.5% |
| AA | 10.9% |
| A | 13.9% |
| BBB | 13.7% |
| BB | 10.2% |
| B | 1.4% |
| CCC | 0.4% |
| CC | 0.2% |
| Pre-refunded | 0.7% |
| Not rated | 47.1% |
*The Fund’s quality rating breakdown is expressed as a percentage of the Fund’s total investments in municipal securities and may vary over time. The quality ratings are determined by using the S&P Global Ratings (“S&P”), Moody’s Investors Services, Inc. (“Moody’s”) and Fitch Ratings, Ltd. (“Fitch”). The Fund considers the credit ratings issued by S&P, Moody’s and Fitch and uses the highest rating used by the agencies. These ratings are a measure of the quality and safety of a bond or portfolio, based on the issuer’s financial condition. AAA is the highest (best) and D is the lowest (worst). If applicable, the pre-refunded category includes bonds which are secured by U.S. Government securities and therefore are deemed high-quality investment grade by Alliance Bernstein L.P. (the “Adviser”). If applicable, Not Applicable (N/A) includes non-credit worthy investments; such as, currency contracts, futures and options. If applicable, the Not Rated category includes bonds that are not rated by a nationally recognized statistical rating organization. The Adviser evaluates the creditworthiness of non-rated securities based on a number of factors including, but not limited to, cash flows, enterprise value and economic environment.
Availability of Additional Information
You can find additional information on the Fund’s website at https://www.abfunds.com/link/AB/ABTZX-A, including the Fund's:
• Prospectus
• Financial information
• Fund holdings
• Proxy voting information
You can also request this information by contacting us at (800) 227 4618.
Shareholders who have consented to receive a single annual or semi-annual shareholder report at a shared address may revoke this consent by contacting us at (800) 227 4618.
Information Regarding the Review and Approval of the Fund’s Advisory Agreement
Information regarding the Fund’s Board of Directors’/Trustees’ review of the advisory agreement is available on the Fund’s website https://www.abfunds.com/link/AB/ABTZX-A. You can request this information, free of charge, by contacting us at (800) 227 4618 or by scanning the QR code below.
The [A/B] logo is a registered service mark of AllianceBernstein and AllianceBernstein® is a registered service mark used by permission of the owner, AllianceBernstein L.P.
Please scan QR code for
Fund Information
Please scan QR code for
Fund Information
Annual Shareholder Report
This annual shareholder report contains important information about the AB National Portfolio (the “Fund”) for the period of June 1, 2023 to May 31, 2024. You can find additional information about the Fund at https://www.abfunds.com/link/AB/ALTVX-A. You can also request this information by contacting us at (800) 227 4618.
What were the Fund costs for the last year?
(Based on a hypothetical $10,000 investment)
| Class Name | Cost of a $10,000 investment | Costs paid as a percentage of a $10,000 investment |
|---|
| Advisor Class | $51 | 0.50% |
How did the Fund perform last year? What affected the Fund’s performance?
For the 12-month period, all share classes, except Class C, outperformed the Bloomberg Municipal Bond Index, before sales charges. Sector and security selection, as well as an overweight to credit, contributed to performance, relative to the benchmark. Security selection within special tax and multi-family housing contributed, while selection within senior living and industry Industrial Development Revenue (“IDR") detracted.
The Fund used derivatives for hedging purposes in the form of inflation swaps, credit default swaps and municipal market data rate locks which had no material impact on performance. Interest rate swaps added to overall performance.
Top contributors to performance:
Top detractors from performance:
Security Selection
Top contributors
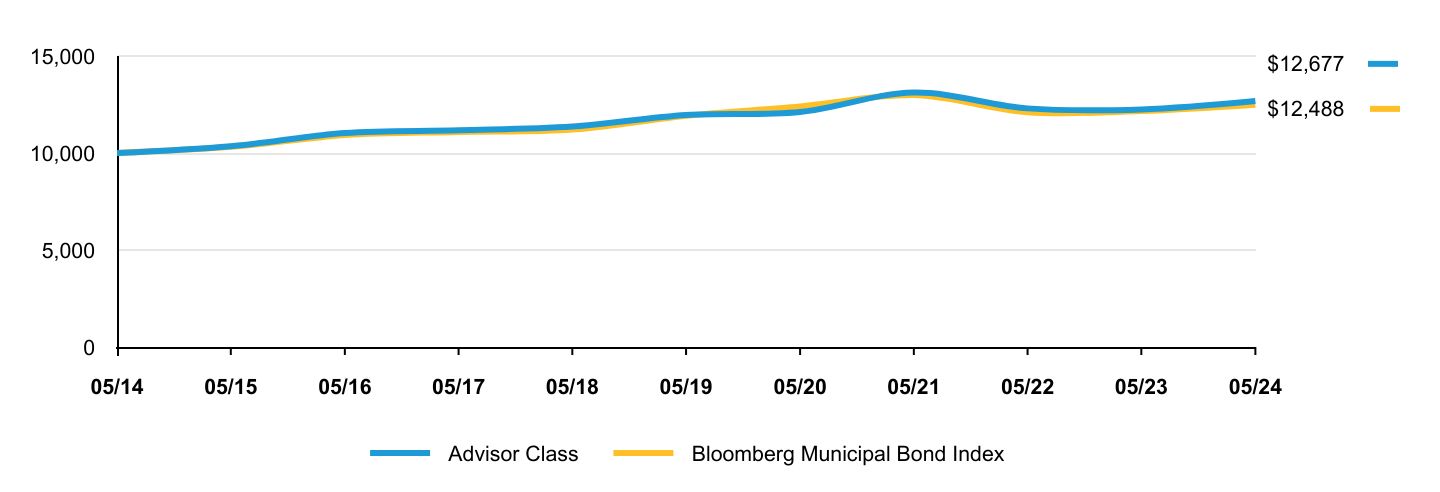
The following graph shows the performance of hypothetical $10,000 investments in the Fund and a broad-based securities market index over the most recently completed 10 fiscal years of the Fund. The Fund's performance reflects sales charges and assumes the reinvestment of dividends.
| Advisor Class | Bloomberg Municipal Bond Index |
|---|
| 05/14 | $10,000 | $10,000 |
| 05/15 | $10,350 | $10,318 |
| 05/16 | $11,033 | $10,924 |
| 05/17 | $11,171 | $11,083 |
| 05/18 | $11,364 | $11,207 |
| 05/19 | $11,958 | $11,925 |
| 05/20 | $12,114 | $12,399 |
| 05/21 | $13,116 | $12,986 |
| 05/22 | $12,300 | $12,104 |
| 05/23 | $12,245 | $12,163 |
| 05/24 | $12,677 | $12,488 |
Average Annual Total Returns
| 1 Year | 5 Years | 10 Years |
|---|
| Advisor Class (without sales charge) | 3.53% | 1.12% | 2.40% |
| Advisor Class (with sales charge) | 3.53% | 1.12% | 2.40% |
| Bloomberg Municipal Bond Index | 2.67% | 0.93% | 2.25% |
The Fund’s past performance is not a good predictor of the Fund’s future performance.
The graph and table do not reflect the deduction of taxes that a shareholder would pay on Fund distributions or redemption of Fund shares.
Visit https://www.abfunds.com/link/AB/ALTVX-A for the most recent performance information.
| Net Assets | $1,848,707,128 |
| # of Portfolio Holdings | 694 |
| Portfolio Turnover Rate | 30% |
| Total Advisory Fees Paid | $7,415,878 |
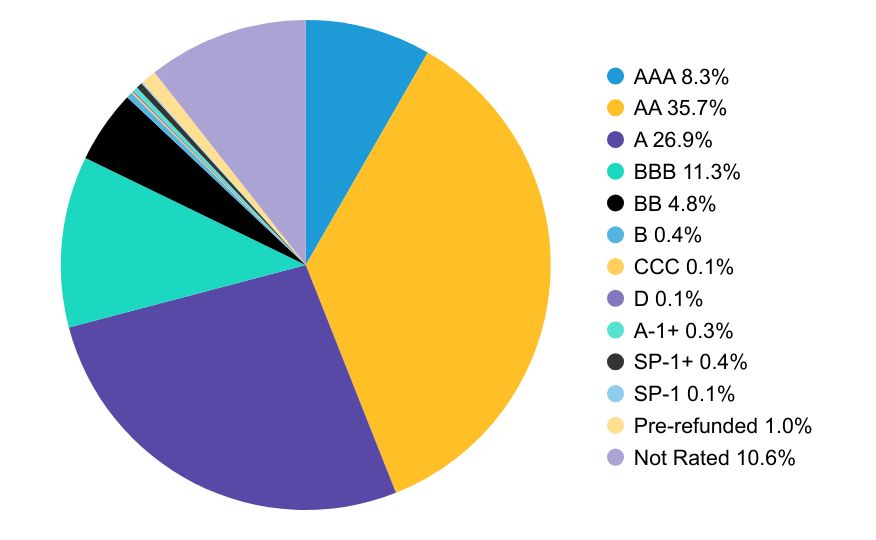
Graphical Representation of Holdings
Credit Rating BreakdownFootnote Reference*
| Value | Value |
|---|
| AAA | 8.3% |
| AA | 35.7% |
| A | 26.9% |
| BBB | 11.3% |
| BB | 4.8% |
| B | 0.4% |
| CCC | 0.1% |
| D | 0.1% |
| A-1+ | 0.3% |
| SP-1+ | 0.4% |
| SP-1 | 0.1% |
| Pre-refunded | 1.0% |
| Not Rated | 10.6% |
*The Fund’s quality rating breakdown is expressed as a percentage of the Fund’s total investments in municipal securities and may vary over time. The quality ratings are determined by using the S&P Global Ratings (“S&P”), Moody’s Investors Services, Inc. (“Moody’s”) and Fitch Ratings, Ltd. (“Fitch”). The Fund considers the credit ratings issued by S&P, Moody’s and Fitch and uses the highest rating used by the agencies. These ratings are a measure of the quality and safety of a bond or portfolio, based on the issuer’s financial condition. AAA is the highest (best) and D is the lowest (worst). If applicable, the pre-refunded category includes bonds which are secured by U.S. Government securities and therefore are deemed high-quality investment grade by Alliance Bernstein L.P. (the “Adviser”). If applicable, Not Applicable (N/A) includes non-credit worthy investments; such as, currency contracts, futures and options. If applicable, the Not Rated category includes bonds that are not rated by a nationally recognized statistical rating organization. The Adviser evaluates the creditworthiness of non-rated securities based on a number of factors including, but not limited to, cash flows, enterprise value and economic environment.
Availability of Additional Information
You can find additional information on the Fund’s website at https://www.abfunds.com/link/AB/ALTVX-A, including the Fund's:
• Prospectus
• Financial information
• Fund holdings
• Proxy voting information
You can also request this information by contacting us at (800) 227 4618.
Shareholders who have consented to receive a single annual or semi-annual shareholder report at a shared address may revoke this consent by contacting us at (800) 227 4618.
Information Regarding the Review and Approval of the Fund’s Advisory Agreement
Information regarding the Fund’s Board of Directors’/Trustees’ review of the advisory agreement is available on the Fund’s website https://www.abfunds.com/link/AB/ALTVX-A. You can request this information, free of charge, by contacting us at (800) 227 4618 or by scanning the QR code below.
The [A/B] logo is a registered service mark of AllianceBernstein and AllianceBernstein® is a registered service mark used by permission of the owner, AllianceBernstein L.P.
Please scan QR code for
Fund Information
Please scan QR code for
Fund Information
Annual Shareholder Report
This annual shareholder report contains important information about the AB National Portfolio (the “Fund”) for the period of June 1, 2023 to May 31, 2024. You can find additional information about the Fund at https://www.abfunds.com/link/AB/ALTHX-A. You can also request this information by contacting us at (800) 227 4618.
What were the Fund costs for the last year?
(Based on a hypothetical $10,000 investment)
| Class Name | Cost of a $10,000 investment | Costs paid as a percentage of a $10,000 investment |
|---|
| Class A | $76 | 0.75% |
How did the Fund perform last year? What affected the Fund’s performance?
For the 12-month period, all share classes, except Class C, outperformed the Bloomberg Municipal Bond Index, before sales charges. Sector and security selection, as well as an overweight to credit, contributed to performance, relative to the benchmark. Security selection within special tax and multi-family housing contributed, while selection within senior living and industry Industrial Development Revenue (“IDR") detracted.
The Fund used derivatives for hedging purposes in the form of inflation swaps, credit default swaps and municipal market data rate locks which had no material impact on performance. Interest rate swaps added to overall performance.
Top contributors to performance:
Top detractors from performance:
Security Selection
Top contributors
The following graph shows the performance of hypothetical $10,000 investments in the Fund and a broad-based securities market index over the most recently completed 10 fiscal years of the Fund. The Fund's performance reflects sales charges and assumes the reinvestment of dividends.
| Class A | Bloomberg Municipal Bond Index |
|---|
| 05/14 | $9,697 | $10,000 |
| 05/15 | $9,998 | $10,318 |
| 05/16 | $10,642 | $10,924 |
| 05/17 | $10,748 | $11,083 |
| 05/18 | $10,907 | $11,207 |
| 05/19 | $11,451 | $11,925 |
| 05/20 | $11,569 | $12,399 |
| 05/21 | $12,495 | $12,986 |
| 05/22 | $11,688 | $12,104 |
| 05/23 | $11,607 | $12,163 |
| 05/24 | $11,986 | $12,488 |
Average Annual Total Returns
| 1 Year | 5 Years | 10 Years |
|---|
| Class A (without sales charge) | 3.27% | 0.87% | 2.14% |
| Class A (with sales charge) | 0.21% | 0.26% | 1.83% |
| Bloomberg Municipal Bond Index | 2.67% | 0.93% | 2.25% |
The Fund’s past performance is not a good predictor of the Fund’s future performance.
The graph and table do not reflect the deduction of taxes that a shareholder would pay on Fund distributions or redemption of Fund shares.
Visit https://www.abfunds.com/link/AB/ALTHX-A for the most recent performance information.
| Net Assets | $1,848,707,128 |
| # of Portfolio Holdings | 694 |
| Portfolio Turnover Rate | 30% |
| Total Advisory Fees Paid | $7,415,878 |
Graphical Representation of Holdings
Credit Rating BreakdownFootnote Reference*
| Value | Value |
|---|
| AAA | 8.3% |
| AA | 35.7% |
| A | 26.9% |
| BBB | 11.3% |
| BB | 4.8% |
| B | 0.4% |
| CCC | 0.1% |
| D | 0.1% |
| A-1+ | 0.3% |
| SP-1+ | 0.4% |
| SP-1 | 0.1% |
| Pre-refunded | 1.0% |
| Not Rated | 10.6% |
*The Fund’s quality rating breakdown is expressed as a percentage of the Fund’s total investments in municipal securities and may vary over time. The quality ratings are determined by using the S&P Global Ratings (“S&P”), Moody’s Investors Services, Inc. (“Moody’s”) and Fitch Ratings, Ltd. (“Fitch”). The Fund considers the credit ratings issued by S&P, Moody’s and Fitch and uses the highest rating used by the agencies. These ratings are a measure of the quality and safety of a bond or portfolio, based on the issuer’s financial condition. AAA is the highest (best) and D is the lowest (worst). If applicable, the pre-refunded category includes bonds which are secured by U.S. Government securities and therefore are deemed high-quality investment grade by Alliance Bernstein L.P. (the “Adviser”). If applicable, Not Applicable (N/A) includes non-credit worthy investments; such as, currency contracts, futures and options. If applicable, the Not Rated category includes bonds that are not rated by a nationally recognized statistical rating organization. The Adviser evaluates the creditworthiness of non-rated securities based on a number of factors including, but not limited to, cash flows, enterprise value and economic environment.
Availability of Additional Information
You can find additional information on the Fund’s website at https://www.abfunds.com/link/AB/ALTHX-A, including the Fund's:
• Prospectus
• Financial information
• Fund holdings
• Proxy voting information
You can also request this information by contacting us at (800) 227 4618.
Shareholders who have consented to receive a single annual or semi-annual shareholder report at a shared address may revoke this consent by contacting us at (800) 227 4618.
Information Regarding the Review and Approval of the Fund’s Advisory Agreement
Information regarding the Fund’s Board of Directors’/Trustees’ review of the advisory agreement is available on the Fund’s website https://www.abfunds.com/link/AB/ALTHX-A. You can request this information, free of charge, by contacting us at (800) 227 4618 or by scanning the QR code below.
The [A/B] logo is a registered service mark of AllianceBernstein and AllianceBernstein® is a registered service mark used by permission of the owner, AllianceBernstein L.P.
Please scan QR code for
Fund Information
Please scan QR code for
Fund Information
Annual Shareholder Report
This annual shareholder report contains important information about the AB National Portfolio (the “Fund”) for the period of June 1, 2023 to May 31, 2024. You can find additional information about the Fund at https://www.abfunds.com/link/AB/ALNCX-A. You can also request this information by contacting us at (800) 227 4618.
What were the Fund costs for the last year?
(Based on a hypothetical $10,000 investment)
| Class Name | Cost of a $10,000 investment | Costs paid as a percentage of a $10,000 investment |
|---|
| Class C | $152 | 1.50% |
How did the Fund perform last year? What affected the Fund’s performance?
For the 12-month period, all share classes, except Class C, outperformed the Bloomberg Municipal Bond Index, before sales charges. Sector and security selection, as well as an overweight to credit, contributed to performance, relative to the benchmark. Security selection within special tax and multi-family housing contributed, while selection within senior living and industry Industrial Development Revenue (“IDR") detracted.
The Fund used derivatives for hedging purposes in the form of inflation swaps, credit default swaps and municipal market data rate locks which had no material impact on performance. Interest rate swaps added to overall performance.
Top contributors to performance:
Top detractors from performance:
Security Selection
Top contributors
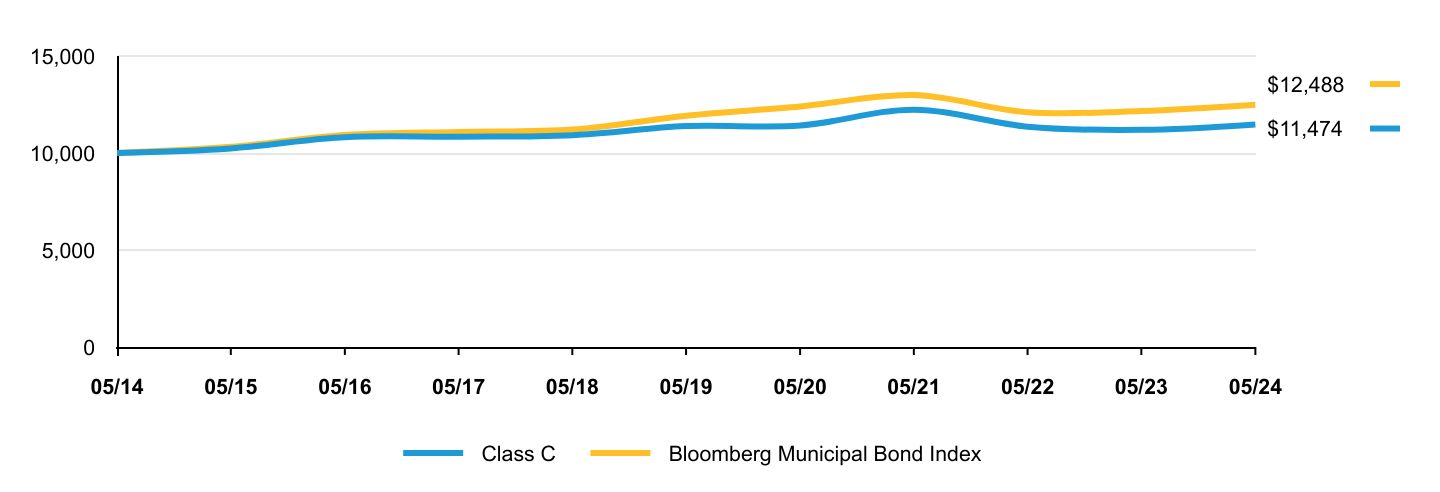
The following graph shows the performance of hypothetical $10,000 investments in the Fund and a broad-based securities market index over the most recently completed 10 fiscal years of the Fund. The Fund's performance reflects sales charges and assumes the reinvestment of dividends.
| Class C | Bloomberg Municipal Bond Index |
|---|
| 05/14 | $10,000 | $10,000 |
| 05/15 | $10,238 | $10,318 |
| 05/16 | $10,817 | $10,924 |
| 05/17 | $10,843 | $11,083 |
| 05/18 | $10,921 | $11,207 |
| 05/19 | $11,388 | $11,925 |
| 05/20 | $11,413 | $12,399 |
| 05/21 | $12,235 | $12,986 |
| 05/22 | $11,358 | $12,104 |
| 05/23 | $11,194 | $12,163 |
| 05/24 | $11,474 | $12,488 |
Average Annual Total Returns
| 1 Year | 5 Years | 10 Years |
|---|
| Class C (without sales charge) | 2.50% | 0.12% | 1.38% |
| Class C (with sales charge) | 1.50% | 0.12% | 1.38% |
| Bloomberg Municipal Bond Index | 2.67% | 0.93% | 2.25% |
The Fund’s past performance is not a good predictor of the Fund’s future performance.
The graph and table do not reflect the deduction of taxes that a shareholder would pay on Fund distributions or redemption of Fund shares.
Visit https://www.abfunds.com/link/AB/ALNCX-A for the most recent performance information.
| Net Assets | $1,848,707,128 |
| # of Portfolio Holdings | 694 |
| Portfolio Turnover Rate | 30% |
| Total Advisory Fees Paid | $7,415,878 |
Graphical Representation of Holdings
Credit Rating BreakdownFootnote Reference*
| Value | Value |
|---|
| AAA | 8.3% |
| AA | 35.7% |
| A | 26.9% |
| BBB | 11.3% |
| BB | 4.8% |
| B | 0.4% |
| CCC | 0.1% |
| D | 0.1% |
| A-1+ | 0.3% |
| SP-1+ | 0.4% |
| SP-1 | 0.1% |
| Pre-refunded | 1.0% |
| Not Rated | 10.6% |
*The Fund’s quality rating breakdown is expressed as a percentage of the Fund’s total investments in municipal securities and may vary over time. The quality ratings are determined by using the S&P Global Ratings (“S&P”), Moody’s Investors Services, Inc. (“Moody’s”) and Fitch Ratings, Ltd. (“Fitch”). The Fund considers the credit ratings issued by S&P, Moody’s and Fitch and uses the highest rating used by the agencies. These ratings are a measure of the quality and safety of a bond or portfolio, based on the issuer’s financial condition. AAA is the highest (best) and D is the lowest (worst). If applicable, the pre-refunded category includes bonds which are secured by U.S. Government securities and therefore are deemed high-quality investment grade by Alliance Bernstein L.P. (the “Adviser”). If applicable, Not Applicable (N/A) includes non-credit worthy investments; such as, currency contracts, futures and options. If applicable, the Not Rated category includes bonds that are not rated by a nationally recognized statistical rating organization. The Adviser evaluates the creditworthiness of non-rated securities based on a number of factors including, but not limited to, cash flows, enterprise value and economic environment.
Availability of Additional Information
You can find additional information on the Fund’s website at https://www.abfunds.com/link/AB/ALNCX-A, including the Fund's:
• Prospectus
• Financial information
• Fund holdings
• Proxy voting information
You can also request this information by contacting us at (800) 227 4618.
Shareholders who have consented to receive a single annual or semi-annual shareholder report at a shared address may revoke this consent by contacting us at (800) 227 4618.
Information Regarding the Review and Approval of the Fund’s Advisory Agreement
Information regarding the Fund’s Board of Directors’/Trustees’ review of the advisory agreement is available on the Fund’s website https://www.abfunds.com/link/AB/ALNCX-A. You can request this information, free of charge, by contacting us at (800) 227 4618 or by scanning the QR code below.
The [A/B] logo is a registered service mark of AllianceBernstein and AllianceBernstein® is a registered service mark used by permission of the owner, AllianceBernstein L.P.
Please scan QR code for
Fund Information
Please scan QR code for
Fund Information
Annual Shareholder Report
This annual shareholder report contains important information about the AB New York Portfolio (the “Fund”) for the period of June 1, 2023 to May 31, 2024. You can find additional information about the Fund at https://www.abfunds.com/link/AB/ALNVX-A. You can also request this information by contacting us at (800) 227 4618.
What were the Fund costs for the last year?
(Based on a hypothetical $10,000 investment)
| Class Name | Cost of a $10,000 investment | Costs paid as a percentage of a $10,000 investment |
|---|
| Advisor Class | $51 | 0.50% |
How did the Fund perform last year? What affected the Fund’s performance?
For the 12-month period, all share classes, except Class C, outperformed the Bloomberg Municipal Bond Index, before sales charges. Sector and security selection, as well as an overweight to credit, contributed to performance, relative to the benchmark. Security selection within water and sewer and senior living contributed, while selection within toll roads and private higher education detracted.
The Fund used derivatives for hedging purposes in the form of inflation swaps and credit default swaps, which had no material impact on performance. Interest rate swaps added to overall performance.
Top contributors to performance:
Top detractors from performance:
Security Selection
Top contributors
Sector
Top contributors
Public Primary/Secondary Education
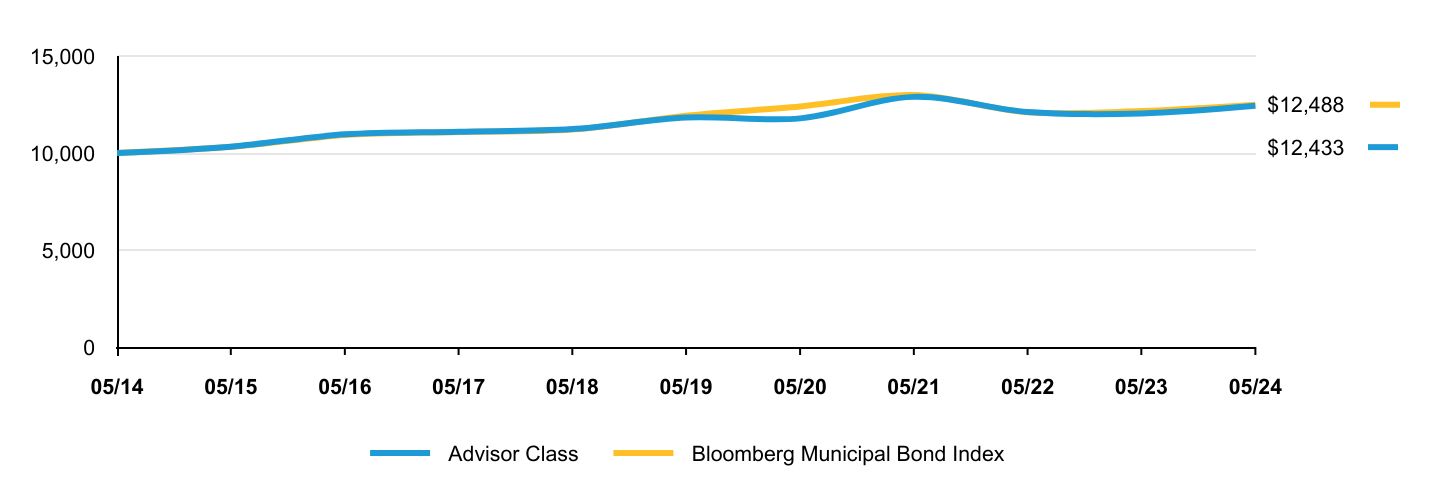
The following graph shows the performance of hypothetical $10,000 investments in the Fund and a broad-based securities market index over the most recently completed 10 fiscal years of the Fund. The Fund's performance reflects sales charges and assumes the reinvestment of dividends.
| Advisor Class | Bloomberg Municipal Bond Index |
|---|
| 05/14 | $10,000 | $10,000 |
| 05/15 | $10,327 | $10,318 |
| 05/16 | $10,962 | $10,924 |
| 05/17 | $11,099 | $11,083 |
| 05/18 | $11,233 | $11,207 |
| 05/19 | $11,835 | $11,925 |
| 05/20 | $11,785 | $12,399 |
| 05/21 | $12,893 | $12,986 |
| 05/22 | $12,112 | $12,104 |
| 05/23 | $12,038 | $12,163 |
| 05/24 | $12,433 | $12,488 |
Average Annual Total Returns
| 1 Year | 5 Years | 10 Years |
|---|
| Advisor Class (without sales charge) | 3.28% | 0.94% | 2.20% |
| Advisor Class (with sales charge) | 3.28% | 0.94% | 2.20% |
| Bloomberg Municipal Bond Index | 2.67% | 0.93% | 2.25% |
The Fund’s past performance is not a good predictor of the Fund’s future performance.
The graph and table do not reflect the deduction of taxes that a shareholder would pay on Fund distributions or redemption of Fund shares.
Visit https://www.abfunds.com/link/AB/ALNVX-A for the most recent performance information.
| Net Assets | $491,328,347 |
| # of Portfolio Holdings | 222 |
| Portfolio Turnover Rate | 35% |
| Total Advisory Fees Paid | $1,926,992 |
Graphical Representation of Holdings
Credit Rating BreakdownFootnote Reference*
| Value | Value |
|---|
| AAA | 5.7% |
| AA | 30.7% |
| A | 20.6% |
| BBB | 26.7% |
| BB | 4.6% |
| B | 1.8% |
| CCC | 0.6% |
| CC | 0.5% |
| A-1+ | 0.3% |
| Pre-refunded | 2.7% |
| Not Rated | 5.8% |
*The Fund’s quality rating breakdown is expressed as a percentage of the Fund’s total investments in municipal securities and may vary over time. The quality ratings are determined by using the S&P Global Ratings (“S&P”), Moody’s Investors Services, Inc. (“Moody’s”) and Fitch Ratings, Ltd. (“Fitch”). The Fund considers the credit ratings issued by S&P, Moody’s and Fitch and uses the highest rating used by the agencies. These ratings are a measure of the quality and safety of a bond or portfolio, based on the issuer’s financial condition. AAA is the highest (best) and D is the lowest (worst). If applicable, the pre-refunded category includes bonds which are secured by U.S. Government securities and therefore are deemed high-quality investment grade by Alliance Bernstein L.P. (the “Adviser”). If applicable, Not Applicable (N/A) includes non-credit worthy investments; such as, currency contracts, futures and options. If applicable, the Not Rated category includes bonds that are not rated by a nationally recognized statistical rating organization. The Adviser evaluates the creditworthiness of non-rated securities based on a number of factors including, but not limited to, cash flows, enterprise value and economic environment.
Availability of Additional Information
You can find additional information on the Fund’s website at https://www.abfunds.com/link/AB/ALNVX-A, including the Fund's:
• Prospectus
• Financial information
• Fund holdings
• Proxy voting information
You can also request this information by contacting us at (800) 227 4618.
Shareholders who have consented to receive a single annual or semi-annual shareholder report at a shared address may revoke this consent by contacting us at (800) 227 4618.
Information Regarding the Review and Approval of the Fund’s Advisory Agreement
Information regarding the Fund’s Board of Directors’/Trustees’ review of the advisory agreement is available on the Fund’s website https://www.abfunds.com/link/AB/ALNVX-A. You can request this information, free of charge, by contacting us at (800) 227 4618 or by scanning the QR code below.
The [A/B] logo is a registered service mark of AllianceBernstein and AllianceBernstein® is a registered service mark used by permission of the owner, AllianceBernstein L.P.
Please scan QR code for
Fund Information
Please scan QR code for
Fund Information
Annual Shareholder Report
This annual shareholder report contains important information about the AB New York Portfolio (the “Fund”) for the period of June 1, 2023 to May 31, 2024. You can find additional information about the Fund at https://www.abfunds.com/link/AB/ALNYX-A. You can also request this information by contacting us at (800) 227 4618.
What were the Fund costs for the last year?
(Based on a hypothetical $10,000 investment)
| Class Name | Cost of a $10,000 investment | Costs paid as a percentage of a $10,000 investment |
|---|
| Class A | $76 | 0.75% |
How did the Fund perform last year? What affected the Fund’s performance?
For the 12-month period, all share classes, except Class C, outperformed the Bloomberg Municipal Bond Index, before sales charges. Sector and security selection, as well as an overweight to credit, contributed to performance, relative to the benchmark. Security selection within water and sewer and senior living contributed, while selection within toll roads and private higher education detracted.
The Fund used derivatives for hedging purposes in the form of inflation swaps and credit default swaps, which had no material impact on performance. Interest rate swaps added to overall performance.
Top contributors to performance:
Top detractors from performance:
Security Selection
Top contributors
Sector
Top contributors
Public Primary/Secondary Education
The following graph shows the performance of hypothetical $10,000 investments in the Fund and a broad-based securities market index over the most recently completed 10 fiscal years of the Fund. The Fund's performance reflects sales charges and assumes the reinvestment of dividends.
| Class A | Bloomberg Municipal Bond Index |
|---|
| 05/14 | $9,698 | $10,000 |
| 05/15 | $9,977 | $10,318 |
| 05/16 | $10,575 | $10,924 |
| 05/17 | $10,681 | $11,083 |
| 05/18 | $10,782 | $11,207 |
| 05/19 | $11,335 | $11,925 |
| 05/20 | $11,257 | $12,399 |
| 05/21 | $12,285 | $12,986 |
| 05/22 | $11,511 | $12,104 |
| 05/23 | $11,413 | $12,163 |
| 05/24 | $11,757 | $12,488 |
Average Annual Total Returns
| 1 Year | 5 Years | 10 Years |
|---|
| Class A (without sales charge) | 3.02% | 0.69% | 1.94% |
| Class A (with sales charge) | -0.04% | 0.08% | 1.63% |
| Bloomberg Municipal Bond Index | 2.67% | 0.93% | 2.25% |
The Fund’s past performance is not a good predictor of the Fund’s future performance.
The graph and table do not reflect the deduction of taxes that a shareholder would pay on Fund distributions or redemption of Fund shares.
Visit https://www.abfunds.com/link/AB/ALNYX-A for the most recent performance information.
| Net Assets | $491,328,347 |
| # of Portfolio Holdings | 222 |
| Portfolio Turnover Rate | 35% |
| Total Advisory Fees Paid | $1,926,992 |
Graphical Representation of Holdings
Credit Rating BreakdownFootnote Reference*
| Value | Value |
|---|
| AAA | 5.7% |
| AA | 30.7% |
| A | 20.6% |
| BBB | 26.7% |
| BB | 4.6% |
| B | 1.8% |
| CCC | 0.6% |
| CC | 0.5% |
| A-1+ | 0.3% |
| Pre-refunded | 2.7% |
| Not Rated | 5.8% |
*The Fund’s quality rating breakdown is expressed as a percentage of the Fund’s total investments in municipal securities and may vary over time. The quality ratings are determined by using the S&P Global Ratings (“S&P”), Moody’s Investors Services, Inc. (“Moody’s”) and Fitch Ratings, Ltd. (“Fitch”). The Fund considers the credit ratings issued by S&P, Moody’s and Fitch and uses the highest rating used by the agencies. These ratings are a measure of the quality and safety of a bond or portfolio, based on the issuer’s financial condition. AAA is the highest (best) and D is the lowest (worst). If applicable, the pre-refunded category includes bonds which are secured by U.S. Government securities and therefore are deemed high-quality investment grade by Alliance Bernstein L.P. (the “Adviser”). If applicable, Not Applicable (N/A) includes non-credit worthy investments; such as, currency contracts, futures and options. If applicable, the Not Rated category includes bonds that are not rated by a nationally recognized statistical rating organization. The Adviser evaluates the creditworthiness of non-rated securities based on a number of factors including, but not limited to, cash flows, enterprise value and economic environment.
Availability of Additional Information
You can find additional information on the Fund’s website at https://www.abfunds.com/link/AB/ALNYX-A, including the Fund's:
• Prospectus
• Financial information
• Fund holdings
• Proxy voting information
You can also request this information by contacting us at (800) 227 4618.
Shareholders who have consented to receive a single annual or semi-annual shareholder report at a shared address may revoke this consent by contacting us at (800) 227 4618.
Information Regarding the Review and Approval of the Fund’s Advisory Agreement
Information regarding the Fund’s Board of Directors’/Trustees’ review of the advisory agreement is available on the Fund’s website https://www.abfunds.com/link/AB/ALNYX-A. You can request this information, free of charge, by contacting us at (800) 227 4618 or by scanning the QR code below.
The [A/B] logo is a registered service mark of AllianceBernstein and AllianceBernstein® is a registered service mark used by permission of the owner, AllianceBernstein L.P.
Please scan QR code for
Fund Information
Please scan QR code for
Fund Information
Annual Shareholder Report
This annual shareholder report contains important information about the AB New York Portfolio (the “Fund”) for the period of June 1, 2023 to May 31, 2024. You can find additional information about the Fund at https://www.abfunds.com/link/AB/ANYCX-A. You can also request this information by contacting us at (800) 227 4618.
What were the Fund costs for the last year?
(Based on a hypothetical $10,000 investment)
| Class Name | Cost of a $10,000 investment | Costs paid as a percentage of a $10,000 investment |
|---|
| Class C | $152 | 1.50% |
How did the Fund perform last year? What affected the Fund’s performance?
For the 12-month period, all share classes, except Class C, outperformed the Bloomberg Municipal Bond Index, before sales charges. Sector and security selection, as well as an overweight to credit, contributed to performance, relative to the benchmark. Security selection within water and sewer and senior living contributed, while selection within toll roads and private higher education detracted.
The Fund used derivatives for hedging purposes in the form of inflation swaps and credit default swaps, which had no material impact on performance. Interest rate swaps added to overall performance.
Top contributors to performance:
Top detractors from performance:
Security Selection
Top contributors
Sector
Top contributors
Public Primary/Secondary Education
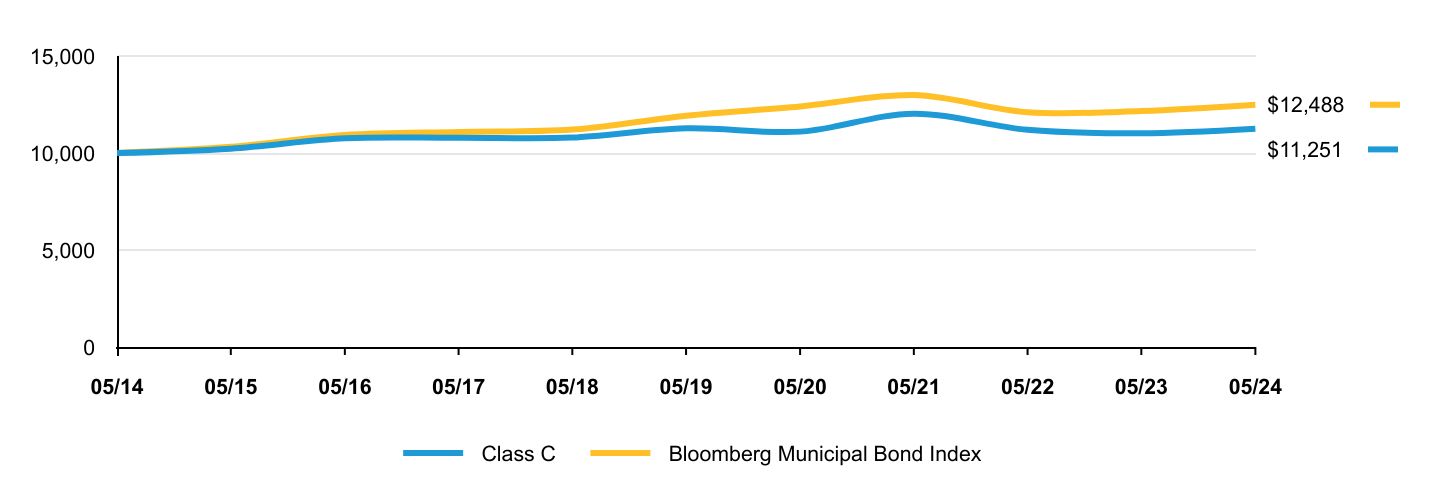
The following graph shows the performance of hypothetical $10,000 investments in the Fund and a broad-based securities market index over the most recently completed 10 fiscal years of the Fund. The Fund's performance reflects sales charges and assumes the reinvestment of dividends.
| Class C | Bloomberg Municipal Bond Index |
|---|
| 05/14 | $10,000 | $10,000 |
| 05/15 | $10,225 | $10,318 |
| 05/16 | $10,757 | $10,924 |
| 05/17 | $10,784 | $11,083 |
| 05/18 | $10,794 | $11,207 |
| 05/19 | $11,270 | $11,925 |
| 05/20 | $11,102 | $12,399 |
| 05/21 | $12,026 | $12,986 |
| 05/22 | $11,195 | $12,104 |
| 05/23 | $11,016 | $12,163 |
| 05/24 | $11,251 | $12,488 |
Average Annual Total Returns
| 1 Year | 5 Years | 10 Years |
|---|
| Class C (without sales charge) | 2.13% | | 1.19% |
| Class C (with sales charge) | 1.13% | -0.07% | 1.19% |
| Bloomberg Municipal Bond Index | 2.67% | 0.93% | 2.25% |
The Fund’s past performance is not a good predictor of the Fund’s future performance.
The graph and table do not reflect the deduction of taxes that a shareholder would pay on Fund distributions or redemption of Fund shares.
Visit https://www.abfunds.com/link/AB/ANYCX-A for the most recent performance information.
| Net Assets | $491,328,347 |
| # of Portfolio Holdings | 222 |
| Portfolio Turnover Rate | 35% |
| Total Advisory Fees Paid | $1,926,992 |
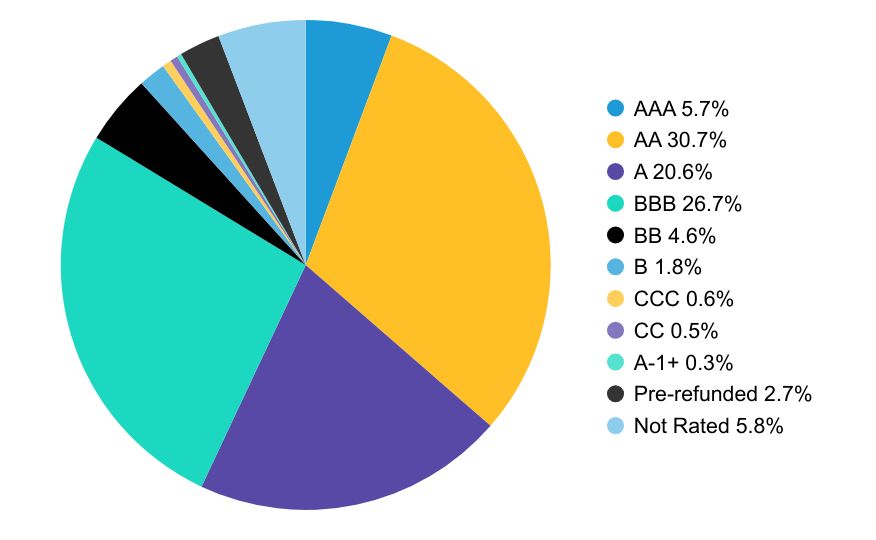
Graphical Representation of Holdings
Credit Rating BreakdownFootnote Reference*
| Value | Value |
|---|
| AAA | 5.7% |
| AA | 30.7% |
| A | 20.6% |
| BBB | 26.7% |
| BB | 4.6% |
| B | 1.8% |
| CCC | 0.6% |
| CC | 0.5% |
| A-1+ | 0.3% |
| Pre-refunded | 2.7% |
| Not Rated | 5.8% |
*The Fund’s quality rating breakdown is expressed as a percentage of the Fund’s total investments in municipal securities and may vary over time. The quality ratings are determined by using the S&P Global Ratings (“S&P”), Moody’s Investors Services, Inc. (“Moody’s”) and Fitch Ratings, Ltd. (“Fitch”). The Fund considers the credit ratings issued by S&P, Moody’s and Fitch and uses the highest rating used by the agencies. These ratings are a measure of the quality and safety of a bond or portfolio, based on the issuer’s financial condition. AAA is the highest (best) and D is the lowest (worst). If applicable, the pre-refunded category includes bonds which are secured by U.S. Government securities and therefore are deemed high-quality investment grade by Alliance Bernstein L.P. (the “Adviser”). If applicable, Not Applicable (N/A) includes non-credit worthy investments; such as, currency contracts, futures and options. If applicable, the Not Rated category includes bonds that are not rated by a nationally recognized statistical rating organization. The Adviser evaluates the creditworthiness of non-rated securities based on a number of factors including, but not limited to, cash flows, enterprise value and economic environment.
Availability of Additional Information
You can find additional information on the Fund’s website at https://www.abfunds.com/link/AB/ANYCX-A, including the Fund's:
• Prospectus
• Financial information
• Fund holdings
• Proxy voting information
You can also request this information by contacting us at (800) 227 4618.
Shareholders who have consented to receive a single annual or semi-annual shareholder report at a shared address may revoke this consent by contacting us at (800) 227 4618.
Information Regarding the Review and Approval of the Fund’s Advisory Agreement
Information regarding the Fund’s Board of Directors’/Trustees’ review of the advisory agreement is available on the Fund’s website https://www.abfunds.com/link/AB/ANYCX-A. You can request this information, free of charge, by contacting us at (800) 227 4618 or by scanning the QR code below.
The [A/B] logo is a registered service mark of AllianceBernstein and AllianceBernstein® is a registered service mark used by permission of the owner, AllianceBernstein L.P.
Please scan QR code for
Fund Information
ITEM 2. CODE OF ETHICS.
(a) The registrant has adopted a code of ethics that applies to its principal executive officer, principal financial officer and principal accounting officer. A copy of the registrant’s code of ethics is filed herewith as Exhibit 19(a)(1).
(b) During the period covered by this report, no material amendments were made to the provisions of the code of ethics adopted in 2(a) above.
(c) During the period covered by this report, no implicit or explicit waivers to the provisions of the code of ethics adopted in 2(a) above were granted.
ITEM 3. AUDIT COMMITTEE FINANCIAL EXPERT.
The registrant’s Board of Directors has determined that independent directors Garry L. Moody, Marshall C. Turner, Jr., Jorge A. Bermudez and Carol C. McMullen qualify as audit committee financial experts.
ITEM 4. PRINCIPAL ACCOUNTANT FEES AND SERVICES.
(a) - (c) The following table sets forth the aggregate fees billed* by the independent registered public accounting firm Ernst & Young LLP, for the Fund’s last two fiscal years, for professional services rendered for: (i) the audit of the Fund’s annual financial statements included in the Fund’s annual report to stockholders; (ii) assurance and related services that are reasonably related to the performance of the audit of the Fund’s financial statements and are not reported under (i), which include advice and education related to accounting and auditing issues, quarterly press release review (for those Funds that issue quarterly press releases), and preferred stock maintenance testing (for those Funds that issue preferred stock); and (iii) tax compliance, tax advice and tax return preparation.
| | | | | | | | | | | | | | | | |
| | | Audit Fees | | | Audit-Related
Fees | | | Tax Fees | |
California Portfolio | | | 2023 | | | $ | 39,152 | | | $ | — | | | $ | 18,583 | |
| | | 2024 | | | $ | 39,152 | | | $ | — | | | $ | 18,428 | |
National Portfolio | | | 2023 | | | $ | 40,597 | | | $ | — | | | $ | 18,583 | |
| | | 2024 | | | $ | 40,597 | | | $ | — | | | $ | 18,428 | |
New York Portfolio | | | 2023 | | | $ | 40,597 | | | $ | — | | | $ | 18,583 | |
| | | 2024 | | | $ | 40,597 | | | $ | — | | | $ | 18,428 | |
High Income | | | 2023 | | | $ | 48,760 | | | $ | — | | | $ | 19,083 | |
| | | 2024 | | | $ | 48,760 | | | $ | — | | | $ | 18,928 | |
(d) Not applicable.
(e) (1) Beginning with audit and non-audit service contracts entered into on or after May 6, 2003, the Fund’s Audit Committee policies and procedures require the pre-approval of all audit and non-audit services provided to the Fund by the Fund’s independent registered public accounting firm. The Fund’s Audit Committee policies and procedures also require pre-approval of all audit and non-audit services provided to the Adviser and Service Affiliates to the extent that these services are directly related to the operations or financial reporting of the Fund.
(e) (2) No percentage of services addressed by (b) and (c) of this Item 4 were approved pursuant to the waiver provision of paragraph (c)(7)(i)(C) of Rule 2-01 of Regulation S-X. No amounts are reported for Item 4 (d).
(f) Not applicable.
(g) The following table sets forth the aggregate non-audit services provided to the Fund, the Fund’s Adviser and entities that control, are controlled by or under common control with the Adviser that provide ongoing services to the Fund (“Service Affiliates”):
| | | | | | | | | | | | |
| | | | | | All Fees for
Non-Audit Services
Provided to the
Portfolio, the Adviser
and Service Affiliates | | | Total Amount of
Foregoing Column Pre-
approved by the Audit
Committee
(Portion Comprised of
Audit Related Fees)
(Portion Comprised of
Tax Fees) | |
California Portfolio | | | 2023 | | | $ | 1,965,135 | | | $ | 18,583 | |
| | | | | | | | | | $ | — | |
| | | | | | | | | | $ | (18,583 | ) |
| | | 2024 | | | $ | 2,070,514 | | | $ | 18,428 | |
| | | | | | | | | | $ | — | |
| | | | | | | | | | $ | (18,428 | ) |
National Portfolio | | | 2023 | | | $ | 1,965,135 | | | $ | 18,583 | |
| | | | | | | | | | $ | — | |
| | | | | | | | | | $ | (18,583 | ) |
| | | 2024 | | | $ | 2,070,514 | | | $ | 18,428 | |
| | | | | | | | | | $ | — | |
| | | | | | | | | | $ | (18,428 | ) |
New York Portfolio | | | 2023 | | | $ | 1,965,135 | | | $ | 18,583 | |
| | | | | | | | | | $ | — | |
| | | | | | | | | | $ | (18,583 | ) |
| | | 2024 | | | $ | 2,070,514 | | | $ | 18,428 | |
| | | | | | | | | | $ | — | |
| | | | | | | | | | $ | (18,428 | ) |
High Income | | | 2023 | | | $ | 1,965,635 | | | $ | 19,083 | |
| | | | | | | | | | $ | — | |
| | | | | | | | | | $ | (19,083 | ) |
| | | 2024 | | | $ | 2,071,014 | | | $ | 18,928 | |
| | | | | | | | | | $ | — | |
| | | | | | | | | | $ | (18,928 | ) |
(h) The Audit Committee of the Fund has considered whether the provision of any non-audit services not pre-approved by the Audit Committee provided by the Fund’s independent registered public accounting firm to the Adviser and Service Affiliates is compatible with maintaining the auditor’s independence.
(i) Not applicable.
(j) Not applicable.
ITEM 5. AUDIT COMMITTEE OF LISTED REGISTRANTS.
Not applicable to the registrant.
ITEM 6. INVESTMENTS.
Please see Schedule of Investments contained in the Financial Statements included under Item 7 of this Form N-CSR.
ITEM 7. FINANCIAL STATEMENTS AND FINANCIAL HIGHLIGHTS FOR OPEN-END MANAGEMENT INVESTMENT COMPANIES.
MAY 05.31.24

ANNUAL REPORT
AB MUNICIPAL INCOME FUND
| + | | AB CALIFORNIA PORTFOLIO |
| + | | AB HIGH INCOME MUNICIPAL PORTFOLIO |

| | |
| |
| Investment Products Offered | | • Are Not FDIC Insured • May Lose Value • Are Not Bank Guaranteed |
Investors should consider the investment objectives, risks, charges and expenses of the Fund carefully before investing. For copies of our prospectus or summary prospectus, which contain this and other information, visit us online at www.abfunds.com or contact your AB representative. Please read the prospectus and/or summary prospectus carefully before investing.
This shareholder report must be preceded or accompanied by the Fund’s prospectus for individuals who are not current shareholders of the Fund.
You may obtain a description of the Fund’s proxy voting policies and procedures, and information regarding how the Fund voted proxies relating to portfolio securities during the most recent 12-month period ended June 30, without charge. Simply visit AB’s website at www.abfunds.com, or go to the Securities and Exchange Commission’s (the “Commission”) website at www.sec.gov, or call AB at (800) 227 4618.
The Fund files its complete schedule of portfolio holdings with the Commission for the first and third quarters of each fiscal year as an exhibit to its reports on Form N-PORT. The Fund’s Form N-PORT reports are available on the Commission’s website at www.sec.gov. AB publishes full portfolio holdings for the Fund monthly at www.abfunds.com.
AllianceBernstein Investments, Inc. (ABI) is the distributor of the AB family of mutual funds. ABI is a member of FINRA and is an affiliate of AllianceBernstein L.P., the Adviser of the funds.
The [A/B] logo is a registered service mark of AllianceBernstein and AllianceBernstein® is a registered service mark used by permission of the owner, AllianceBernstein L.P.
PORTFOLIO OF INVESTMENTS
AB CALIFORNIA PORTFOLIO
May 31, 2024
| | | | | | | | |
| | | Principal
Amount
(000) | | | U.S. $ Value | |
| |
MUNICIPAL OBLIGATIONS – 98.6% | | | | | | | | |
Long-Term Municipal Bonds – 98.6% | | | | | | | | |
California – 94.7% | | | | | | | | |
Alameda Corridor Transportation Authority
Series 2022-A
0.00%, 10/01/2047(a) | | $ | 17,955 | | | $ | 9,961,254 | |
AGM Series 2024
Zero Coupon, 10/01/2053 | | | 2,000 | | | | 471,844 | |
Anaheim Housing & Public Improvements Authority
(City of Anaheim CA Electric System Revenue)
Series 2020
2.792%, 10/01/2032 | | | 5,000 | | | | 4,191,369 | |
5.00%, 10/01/2045 | | | 2,500 | | | | 2,535,958 | |
Bakersfield City School District
BAM Series 2012-C
0.00%, 05/01/2047(a) | | | 6,380 | | | | 4,725,488 | |
Bay Area Toll Authority
Series 2021
3.66% (MUNIPSA + 0.30%), 04/01/2056(b) | | | 2,000 | | | | 1,960,534 | |
3.77% (MUNIPSA + 0.41%), 04/01/2056(b) | | | 14,800 | | | | 14,461,893 | |
Series 2023-F
5.00%, 04/01/2025 | | | 2,525 | | | | 2,560,336 | |
Burbank-Glendale-Pasadena Airport Authority Brick Campaign
Series 2024-B
5.25%, 07/01/2044 | | | 3,000 | | | | 3,231,745 | |
5.25%, 07/01/2049 | | | 9,000 | | | | 9,579,252 | |
5.25%, 07/01/2054 | | | 7,350 | | | | 7,795,462 | |
AGM Series 2024-B
4.50%, 07/01/2054 | | | 2,000 | | | | 1,956,348 | |
California Community Choice Financing Authority
(American International Group, Inc.)
Series 2023-D
5.50%, 05/01/2054 | | | 5,000 | | | | 5,300,386 | |
California Community Choice Financing Authority
(Deutsche Bank AG)
Series 2023
5.25%, 01/01/2054 | | | 10,375 | | | | 10,842,597 | |
| | |
| |
| abfunds.com | | AB MUNICIPAL INCOME FUND | 1 |
PORTFOLIO OF INVESTMENTS (continued)
AB CALIFORNIA PORTFOLIO
| | | | | | | | |
| | | Principal
Amount
(000) | | | U.S. $ Value | |
| |
California Community Choice Financing Authority
(Goldman Sachs Group, Inc. (The))
Series 2021
4.00%, 10/01/2052 | | $ | 5,745 | | | $ | 5,741,889 | |
Series 2023
5.00%, 12/01/2053 | | | 8,650 | | | | 9,047,322 | |
California Community Choice Financing Authority
(Morgan Stanley)
Series 2021-B
4.00%, 02/01/2052 | | | 4,000 | | | | 3,968,676 | |
Series 2022-A
4.00%, 05/01/2053 | | | 3,675 | | | | 3,663,010 | |
Series 2023
5.00%, 02/01/2054 | | | 12,500 | | | | 13,171,632 | |
5.194% (SOFR + 1.63%), 07/01/2053(b) | | | 5,000 | | | | 4,965,741 | |
5.234% (SOFR + 1.67%), 02/01/2054(b) | | | 5,000 | | | | 4,945,535 | |
California Community College Financing Authority
(NCCD-Orange Coast Properties LLC)
Series 2018
5.25%, 05/01/2043 | | | 3,600 | | | | 3,671,121 | |
5.25%, 05/01/2048 | | | 2,750 | | | | 2,791,571 | |
California Community Housing Agency
(California Community Housing Agency Aster Apartments)
Series 2021-A
4.00%, 02/01/2056(c) | | | 1,000 | | | | 898,885 | |
California Community Housing Agency
(California Community Housing Agency Brio Apartments & Next on Lex Apartments)
Series 2021
4.00%, 02/01/2056(c) | | | 2,000 | | | | 1,653,374 | |
California Community Housing Agency
(California Community Housing Agency Fountains at Emerald Park)
Series 2021
3.00%, 08/01/2056(c) | | | 1,000 | | | | 709,149 | |
California Community Housing Agency
(California Community Housing Agency Summit at Sausalito Apartments)
Series 2021
3.00%, 02/01/2057(c) | | | 2,000 | | | | 1,374,047 | |
| | |
| |
2 | AB MUNICIPAL INCOME FUND | | abfunds.com |
PORTFOLIO OF INVESTMENTS (continued)
AB CALIFORNIA PORTFOLIO
| | | | | | | | |
| | | Principal
Amount
(000) | | | U.S. $ Value | |
| |
California County Tobacco Securitization Agency
(Los Angeles County Securitization Corp.)
Series 2020-A
4.00%, 06/01/2040 | | $ | 1,365 | | | $ | 1,364,219 | |
4.00%, 06/01/2049 | | | 12,155 | | | | 11,334,940 | |
California Earthquake Authority
Series 2022-A
5.603%, 07/01/2027 | | | 2,170 | | | | 2,167,304 | |
California Educational Facilities Authority
(Art Center College of Design)
Series 2018-A
5.00%, 12/01/2037 | | | 1,265 | | | | 1,307,365 | |
5.00%, 12/01/2044 | | | 6,885 | | | | 6,978,410 | |
California Educational Facilities Authority
(Chapman University)
Series 2015
5.00%, 04/01/2035 | | | 4,415 | | | | 4,449,313 | |
California Educational Facilities Authority
(Loma Linda University)
Series 2017-A
5.00%, 04/01/2047 | | | 4,000 | | | | 4,041,166 | |
California Educational Facilities Authority
(St Mary’s College of California)
Series 2023
5.25%, 10/01/2044 | | | 2,100 | | | | 2,155,645 | |
California Educational Facilities Authority
(University of Redlands)
Series 2022-A
5.00%, 10/01/2044 | | | 2,500 | | | | 2,524,960 | |
California Educational Facilities Authority
(University of the Pacific)
Series 2015
5.00%, 11/01/2031 | | | 2,000 | | | | 2,027,872 | |
Series 2023
4.25%, 11/01/2048 | | | 3,230 | | | | 3,121,353 | |
California Enterprise Development Authority (Heights Christian Schools)
Series 2023
6.25%, 06/01/2053(c) | | | 2,000 | | | | 2,000,612 | |
California Enterprise Development Authority
(Rocketship Education Obligated Group)
Series 2022
4.00%, 06/01/2042(c) | | | 1,000 | | | | 841,539 | |
| | |
| |
| abfunds.com | | AB MUNICIPAL INCOME FUND | 3 |
PORTFOLIO OF INVESTMENTS (continued)
AB CALIFORNIA PORTFOLIO
| | | | | | | | |
| | | Principal
Amount
(000) | | | U.S. $ Value | |
| |
California Enterprise Development Authority
(Rocklin Academy (The))
Series 2021
4.00%, 06/01/2051(c) | | $ | 1,875 | | | $ | 1,519,024 | |
4.00%, 06/01/2061(c) | | | 840 | | | | 649,788 | |
California Health Facilities Financing Authority
(Children’s Hospital Los Angeles)
Series 2017-A
5.00%, 08/15/2035 | | | 1,365 | | | | 1,403,990 | |
5.00%, 08/15/2036 | | | 3,000 | | | | 3,081,625 | |
5.00%, 08/15/2042 | | | 2,000 | | | | 2,032,675 | |
California Health Facilities Financing Authority
(CommonSpirit Health)
Series 2020-A
4.00%, 04/01/2037 | | | 5,165 | | | | 5,136,456 | |
California Health Facilities Financing Authority
(Lucile Salter Packard Children’s Hospital at Stanford Obligated Group)
Series 2022-A
4.00%, 05/15/2046 | | | 13,865 | | | | 13,443,189 | |
California Health Facilities Financing Authority
(Stanford Health Care Obligated Group)
Series 2023-A
5.00%, 08/15/2033 | | | 10,000 | | | | 11,538,944 | |
California Infrastructure & Economic Development Bank
(California Academy of Sciences)
Series 2024
3.25%, 08/01/2029 | | | 3,750 | | | | 3,655,636 | |
California Infrastructure & Economic Development Bank
(DesertXpress Enterprises LLC)
Series 2023
8.00%, 01/01/2050(c) | | | 3,025 | | | | 3,124,739 | |
Series 2024
3.95%, 01/01/2050(c) | | | 17,215 | | | | 17,214,940 | |
California Infrastructure & Economic Development Bank
(Goodwill Industries of Sacramento Valley & Northern Nevada, Inc.)
Series 2016
5.00%, 01/01/2036(c) | | | 1,500 | | | | 1,256,810 | |
California Municipal Finance Authority
(American Heritage/Escondido/Heritage K-8 Charter School Obligated Group)
Series 2016-A
5.00%, 06/01/2036 | | | 1,900 | | | | 1,914,735 | |
| | |
| |
4 | AB MUNICIPAL INCOME FUND | | abfunds.com |
PORTFOLIO OF INVESTMENTS (continued)
AB CALIFORNIA PORTFOLIO
| | | | | | | | |
| | | Principal
Amount
(000) | | | U.S. $ Value | |
| |
5.00%, 06/01/2046 | | $ | 1,000 | | | $ | 974,591 | |
California Municipal Finance Authority
(Azusa Pacific University)
Series 2015-B
5.00%, 04/01/2035 | | | 3,160 | | | | 3,085,193 | |
5.00%, 04/01/2041 | | | 3,000 | | | | 2,837,971 | |
California Municipal Finance Authority
(Biola University, Inc.)
Series 2017
5.00%, 10/01/2032 | | | 565 | | | | 580,721 | |
5.00%, 10/01/2033 | | | 625 | | | | 641,764 | |
5.00%, 10/01/2034 | | | 570 | | | | 584,886 | |
5.00%, 10/01/2035 | | | 600 | | | | 615,223 | |
5.00%, 10/01/2036 | | | 1,150 | | | | 1,177,042 | |
5.00%, 10/01/2037 | | | 2,000 | | | | 2,041,571 | |
California Municipal Finance Authority
(California Institute of the Arts)
Series 2021
4.00%, 10/01/2046 | | | 1,340 | | | | 1,184,778 | |
4.00%, 10/01/2051 | | | 1,200 | | | | 1,027,299 | |
California Municipal Finance Authority
(CHF-Riverside II LLC)
Series 2019
5.00%, 05/15/2041 | | | 3,470 | | | | 3,560,815 | |
5.00%, 05/15/2042 | | | 2,705 | | | | 2,769,622 | |
5.00%, 05/15/2049 | | | 4,500 | | | | 4,549,203 | |
5.00%, 05/15/2052 | | | 1,575 | | | | 1,586,942 | |
California Municipal Finance Authority
(Community Health Centers of The Central Coast, Inc.)
Series 2021-A
5.00%, 12/01/2054(c) | | | 1,000 | | | | 927,378 | |
California Municipal Finance Authority
(Congregational Homes, Inc. Obligated Group)
Series 2022
4.00%, 11/15/2042 | | | 560 | | | | 483,877 | |
4.00%, 11/15/2052 | | | 3,605 | | | | 2,823,103 | |
4.00%, 11/15/2056 | | | 1,685 | | | | 1,287,829 | |
California Municipal Finance Authority
(Goodwill Industries of Sacramento Valley & Northern Nevada, Inc.)
Series 2014
5.25%, 01/01/2045 | | | 1,295 | | | | 1,002,855 | |
| | |
| |
| abfunds.com | | AB MUNICIPAL INCOME FUND | 5 |
PORTFOLIO OF INVESTMENTS (continued)
AB CALIFORNIA PORTFOLIO
| | | | | | | | |
| | | Principal
Amount
(000) | | | U.S. $ Value | |
| |
California Municipal Finance Authority
(Inland Regional Center)
Series 2015
5.00%, 06/15/2032 | | $ | 5,000 | | | $ | 5,047,218 | |
California Municipal Finance Authority
(LAX Integrated Express Solutions LLC)
Series 2018
4.00%, 12/31/2047 | | | 5,000 | | | | 4,381,362 | |
5.00%, 12/31/2036 | | | 5,685 | | | | 5,733,180 | |
5.00%, 12/31/2037 | | | 4,000 | | | | 4,022,051 | |
5.00%, 12/31/2047 | | | 8,005 | | | | 7,961,189 | |
California Municipal Finance Authority
(Samuel Merritt University)
Series 2022
5.25%, 06/01/2053 | | | 10,000 | | | | 10,474,048 | |
California Municipal Finance Authority
(UTS Bioenergy LLC)
Series 2011-A1
7.50%, 12/01/2032(d)(e)(f) | | | 2,745 | | | | 54,900 | |
California Pollution Control Financing Authority
(Poseidon Resources Channelside LP)
Series 2023
5.00%, 07/01/2035(c) | | | 2,000 | | | | 2,177,942 | |
5.00%, 07/01/2038(c) | | | 1,000 | | | | 1,069,180 | |
California Pollution Control Financing Authority
(Rialto Bioenergy Facility LLC)
Series 2019
7.50%, 12/01/2040(c)(d)(e) | | | 2,200 | | | | 165,000 | |
California Pollution Control Financing Authority
(San Diego County Water Authority Desalination Project Pipeline)
Series 2019
5.00%, 07/01/2039(c) | | | 8,740 | | | | 9,050,240 | |
5.00%, 11/21/2045(c) | | | 8,000 | | | | 8,150,281 | |
California Public Finance Authority
(California University of Science & Medicine Obligated Group)
Series 2019
6.25%, 07/01/2054(c) | | | 2,000 | | | | 2,095,722 | |
California Public Finance Authority
(Henry Mayo Newhall Hospital Obligated Group)
Series 2017
5.00%, 10/15/2037 | | | 1,000 | | | | 1,010,090 | |
| | |
| |
6 | AB MUNICIPAL INCOME FUND | | abfunds.com |
PORTFOLIO OF INVESTMENTS (continued)
AB CALIFORNIA PORTFOLIO
| | | | | | | | |
| | | Principal
Amount
(000) | | | U.S. $ Value | |
| |
California School Finance Authority
Series 2017
5.00%, 06/01/2047(c) | | $ | 700 | | | $ | 658,531 | |
5.00%, 06/01/2053(c) | | | 1,775 | | | | 1,636,211 | |
California School Finance Authority
(ACE Charter Schools Obligated Group)
Series 2016
5.00%, 06/01/2042(c) | | | 2,750 | | | | 2,616,430 | |
California School Finance Authority
(Alliance for College Ready Public Schools Obligated Group)
Series 2015-A
5.00%, 07/01/2045(c) | | | 4,675 | | | | 4,676,228 | |
Series 2016
5.25%, 07/01/2052(c) | | | 2,500 | | | | 2,507,885 | |
California School Finance Authority
(Aspire Public Schools Obligated Group)
Series 2020-A
5.00%, 08/01/2059(c) | | | 2,000 | | | | 1,960,705 | |
California School Finance Authority
(Bright Star Schools Obligated Group)
Series 2017
5.00%, 06/01/2037(c) | | | 1,200 | | | | 1,207,302 | |
5.00%, 06/01/2047(c) | | | 1,565 | | | | 1,520,551 | |
California School Finance Authority
(Classical Academy Obligated Group)
Series 2020-A
5.00%, 10/01/2050(c) | | | 3,000 | | | | 2,939,542 | |
Series 2021
4.00%, 10/01/2046(c) | | | 1,250 | | | | 1,065,648 | |
Series 2022
5.00%, 10/01/2061(c) | | | 2,000 | | | | 1,911,885 | |
California School Finance Authority
(Downtown College Prep Obligated Group)
Series 2016
5.00%, 06/01/2046(c) | | | 2,325 | | | | 2,219,009 | |
5.00%, 06/01/2051(c) | | | 2,910 | | | | 2,716,191 | |
California School Finance Authority
(Ednovate Obligated Group)
Series 2018
5.00%, 06/01/2037(c) | | | 430 | | | | 421,178 | |
California School Finance Authority
(Equitas Academy Obligated Group)
Series 2018-A
5.00%, 06/01/2035(c) | | | 4,770 | | | | 4,710,431 | |
| | |
| |
| abfunds.com | | AB MUNICIPAL INCOME FUND | 7 |
PORTFOLIO OF INVESTMENTS (continued)
AB CALIFORNIA PORTFOLIO
| | | | | | | | |
| | | Principal
Amount
(000) | | | U.S. $ Value | |
| |
California School Finance Authority
(Fenton Charter Public Schools)
Series 2020-A
5.00%, 07/01/2058(c) | | $ | 625 | | | $ | 576,629 | |
California School Finance Authority
(Green DOT Public Schools Obligated Group)
Series 2015-A
5.00%, 08/01/2045(c) | | | 1,000 | | | | 1,000,482 | |
Series 2022
5.00%, 08/01/2032(c) | | | 750 | | | | 769,726 | |
5.75%, 08/01/2052(c) | | | 1,650 | | | | 1,726,806 | |
California School Finance Authority
(Hawking STEAM Charter Schools, Inc.)
Series 2022
5.00%, 07/01/2042(c) | | | 1,860 | | | | 1,880,177 | |
5.25%, 07/01/2052(c) | | | 2,755 | | | | 2,781,108 | |
5.375%, 07/01/2056(c) | | | 1,990 | | | | 2,016,325 | |
5.50%, 07/01/2062(c) | | | 1,775 | | | | 1,803,541 | |
California School Finance Authority
(KIPP SoCal Public Schools Obligated Group)
Series 2017-A
5.00%, 07/01/2037(c) | | | 935 | | | | 955,016 | |
Series 2019-A
5.00%, 07/01/2049(c) | | | 2,000 | | | | 2,009,204 | |
Series 2020-A
4.00%, 07/01/2055(c) | | | 835 | | | | 705,046 | |
California School Finance Authority
(KIPP SoCal Public Schools)
Series 2014-A
5.00%, 07/01/2034(c) | | | 1,200 | | | | 1,200,910 | |
California School Finance Authority
(Lighthouse Community Public Schools Obligated Group)
Series 2022
6.50%, 06/01/2062(c) | | | 2,300 | | | | 2,375,450 | |
California School Finance Authority
(Partnerships to Uplift Communities Series 2023 Obligated Group)
Series 2023
5.50%, 08/01/2043(c) | | | 550 | | | | 566,463 | |
5.50%, 08/01/2047(c) | | | 525 | | | | 535,357 | |
California School Finance Authority
(Pre-refunded – US Treasuries)
Series 2017
5.00%, 06/01/2047(c) | | | 800 | | | | 827,664 | |
| | |
| |
8 | AB MUNICIPAL INCOME FUND | | abfunds.com |
PORTFOLIO OF INVESTMENTS (continued)
AB CALIFORNIA PORTFOLIO
| | | | | | | | |
| | | Principal
Amount
(000) | | | U.S. $ Value | |
| |
5.00%, 06/01/2053(c) | | $ | 2,025 | | | $ | 2,095,026 | |
California School Finance Authority
(Rocketship Education Obligated Group)
Series 2016-A
5.00%, 06/01/2036(c) | | | 1,000 | | | | 1,003,074 | |
5.00%, 06/01/2046(c) | | | 2,500 | | | | 2,426,894 | |
Series 2017
5.125%, 06/01/2047(c) | | | 700 | | | | 688,834 | |
Series 2017-G
5.00%, 06/01/2037(c) | | | 360 | | | | 361,865 | |
5.00%, 06/01/2053(c) | | | 2,075 | | | | 1,970,019 | |
California School Finance Authority
(View Park Elementary & Middle Schools)
Series 2014
5.625%, 10/01/2034 | | | 575 | | | | 576,557 | |
6.00%, 10/01/2049 | | | 715 | | | | 716,264 | |
California State Public Works Board
(California State Public Works Board Lease)
Series 2021-A
5.00%, 02/01/2025 | | | 2,000 | | | | 2,019,032 | |
California State Public Works Board
(State of California Department of General Services Lease)
Series 2024
5.00%, 04/01/2044 | | | 1,500 | | | | 1,654,920 | |
5.00%, 04/01/2049 | | | 1,500 | | | | 1,639,017 | |
5.05%, 04/01/2032 | | | 2,000 | | | | 1,990,146 | |
5.06%, 04/01/2033 | | | 1,000 | | | | 990,082 | |
California State University
Series 2020-D
1.49%, 11/01/2028 | | | 1,500 | | | | 1,297,951 | |
Series 2021-B
2.144%, 11/01/2033 | | | 6,000 | | | | 4,675,450 | |
California Statewide Communities Development Authority
(California Baptist University)
Series 2017-A
5.00%, 11/01/2032(c) | | | 1,135 | | | | 1,161,009 | |
California Statewide Communities Development Authority
(CHF-Irvine LLC)
Series 2017-A
5.00%, 05/15/2034 | | | 1,000 | | | | 1,020,375 | |
5.00%, 05/15/2035 | | | 1,410 | | | | 1,438,641 | |
5.00%, 05/15/2036 | | | 1,500 | | | | 1,528,994 | |
| | |
| |
| abfunds.com | | AB MUNICIPAL INCOME FUND | 9 |
PORTFOLIO OF INVESTMENTS (continued)
AB CALIFORNIA PORTFOLIO
| | | | | | | | |
| | | Principal
Amount
(000) | | | U.S. $ Value | |
| |
California Statewide Communities Development Authority
(Emanate Health Obligated Group)
Series 2020-A
5.00%, 04/01/2035 | | $ | 1,000 | | | $ | 1,066,054 | |
California Statewide Communities Development Authority
(Enloe Medical Center Obligated Group)
AGM Series 2022-A
5.375%, 08/15/2057 | | | 2,000 | | | | 2,133,198 | |
California Statewide Communities Development Authority
(Lancer Educational Housing LLC)
Series 2016
5.00%, 06/01/2036(c) | | | 1,000 | | | | 1,011,716 | |
Series 2019
5.00%, 06/01/2051(c) | | | 3,165 | | | | 3,069,243 | |
California Statewide Communities Development Authority
(Loma Linda University Medical Center)
Series 2016-A
5.00%, 12/01/2036(c) | | | 5,000 | | | | 5,051,514 | |
5.25%, 12/01/2056(c) | | | 1,700 | | | | 1,707,023 | |
California Statewide Communities Development Authority
(NCCD-Hooper Street LLC)
Series 2019
5.25%, 07/01/2039(c) | | | 2,295 | | | | 2,327,541 | |
5.25%, 07/01/2049(c) | | | 2,675 | | | | 2,679,602 | |
5.25%, 07/01/2052(c) | | | 1,565 | | | | 1,565,620 | |
California Statewide Communities Development Authority
(Pre-refunded – US Treasuries)
AGM Series 2014
5.00%, 11/15/2044 | | | 2,000 | | | | 2,011,792 | |
California Statewide Communities Development Authority
(Southern California Edison Co.)
Series 2023
4.50%, 11/01/2033 | | | 9,000 | | | | 9,351,556 | |
Capistrano Unified School District School Facilities Improvement District No. 1
AGM Series 2001-B
Zero Coupon, 08/01/2025 | | | 3,050 | | | | 2,894,911 | |
Cerritos Community College District
Series 2014-A
4.00%, 08/01/2030 | | | 2,230 | | | | 2,224,250 | |
| | |
| |
10 | AB MUNICIPAL INCOME FUND | | abfunds.com |
PORTFOLIO OF INVESTMENTS (continued)
AB CALIFORNIA PORTFOLIO
| | | | | | | | |
| | | Principal
Amount
(000) | | | U.S. $ Value | |
| |
City & County of San Francisco CA
(City & County of San Francisco CA COP)
Series 2019
5.00%, 04/01/2025 | | $ | 3,520 | | | $ | 3,568,105 | |
City of Atwater CA Wastewater Revenue
AGM Series 2017-A
5.00%, 05/01/2040 | | | 1,000 | | | | 1,032,837 | |
5.00%, 05/01/2043 | | | 1,000 | | | | 1,029,026 | |
City of Fairfield CA
(City of Fairfield CA COP)
AGC Series 2007
Zero Coupon, 04/01/2035 | | | 3,700 | | | | 2,400,777 | |
City of Fremont CA Community Facilities District No. 1
Series 2015
5.00%, 09/01/2040 | | | 4,000 | | | | 4,021,122 | |
City of Irvine CA
(City of Irvine CA Assessment Dist No. 13-1)
Series 2013
5.00%, 09/02/2027 | | | 650 | | | | 652,471 | |
5.00%, 09/02/2029 | | | 1,110 | | | | 1,114,445 | |
City of Irvine CA
(City of Irvine CA Community Facilities District No. 2013-3 Improvement Area No. 8)
Series 2018
5.00%, 09/01/2043 | | | 2,400 | | | | 2,448,636 | |
5.00%, 09/01/2048 | | | 4,250 | | | | 4,310,400 | |
City of Long Beach CA Marina System Revenue
Series 2015
5.00%, 05/15/2032 | | | 1,100 | | | | 1,105,106 | |
5.00%, 05/15/2040 | | | 2,250 | | | | 2,252,427 | |
5.00%, 05/15/2045 | | | 2,250 | | | | 2,228,500 | |
City of Los Angeles CA
Series 2023
5.00%, 06/27/2024 | | | 36,270 | | | | 36,290,068 | |
City of Los Angeles CA Wastewater System Revenue
Series 2013-B
5.00%, 06/01/2031 | | | 5,000 | | | | 5,006,420 | |
Series 2022-C
5.00%, 06/01/2024 | | | 1,675 | | | | 1,675,000 | |
City of Los Angeles Department of Airports
Series 2017B
5.00%, 05/15/2025 | | | 1,325 | | | | 1,338,540 | |
| | |
| |
| abfunds.com | | AB MUNICIPAL INCOME FUND | 11 |
PORTFOLIO OF INVESTMENTS (continued)
AB CALIFORNIA PORTFOLIO
| | | | | | | | |
| | | Principal
Amount
(000) | | | U.S. $ Value | |
| |
Series 2022
3.25%, 05/15/2049 | | $ | 2,000 | | | $ | 1,548,907 | |
5.00%, 05/15/2045 | | | 1,500 | | | | 1,563,350 | |
City of Palo Alto CA
(City of Palo Alto CA University Avenue AD)
Series 2012
5.00%, 09/02/2025 | | | 1,685 | | | | 1,691,126 | |
5.00%, 09/02/2028 | | | 530 | | | | 532,026 | |
5.00%, 09/02/2030 | | | 745 | | | | 747,899 | |
City of Riverside CA Sewer Revenue
Series 2015-A
5.00%, 08/01/2033 | | | 10,090 | | | | 10,254,324 | |
City of Roseville CA
(City of Roseville CA Fiddyment Ranch Community Facilities District No. 1)
Series 2017
5.00%, 09/01/2033 | | | 1,315 | | | | 1,338,157 | |
5.00%, 09/01/2034 | | | 1,000 | | | | 1,017,839 | |
City of Roseville CA
(HP Campus Oaks Community Facilities District No. 1)
Series 2016
5.00%, 09/01/2036 | | | 640 | | | | 648,642 | |
City of San Francisco CA Public Utilities Commission Water Revenue
Series 2020
2.825%, 11/01/2041 | | | 4,840 | | | | 3,691,804 | |
City of San Jose CA Airport Revenue
(Norman Y Mineta San Jose International Airport SJC)
Series 2017-A
5.00%, 03/01/2033 | | | 1,100 | | | | 1,125,323 | |
5.00%, 03/01/2034 | | | 2,000 | | | | 2,045,910 | |
5.00%, 03/01/2035 | | | 3,500 | | | | 3,580,141 | |
5.00%, 03/01/2037 | | | 1,800 | | | | 1,836,847 | |
City of Upland CA
(San Antonio Regional Hospital)
Series 2017
5.00%, 01/01/2032 | | | 1,000 | | | | 1,032,262 | |
5.00%, 01/01/2047 | | | 3,895 | | | | 3,935,033 | |
CMFA Special Finance Agency
(CMFA Special Finance Agency Enclave)
Series 2022-A
4.00%, 08/01/2058(c) | | | 2,000 | | | | 1,542,411 | |
| | |
| |
12 | AB MUNICIPAL INCOME FUND | | abfunds.com |
PORTFOLIO OF INVESTMENTS (continued)
AB CALIFORNIA PORTFOLIO
| | | | | | | | |
| | | Principal
Amount
(000) | | | U.S. $ Value | |
| |
CMFA Special Finance Agency
(CMFA Special Finance Agency Latitude33)
Series 2021-A
3.00%, 12/01/2056(c) | | $ | 2,000 | | | $ | 1,390,332 | |
CMFA Special Finance Agency
(CMFA Special Finance Agency Solana at Grand)
Series 2021-A
4.00%, 08/01/2056(c) | | | 3,000 | | | | 2,577,946 | |
CMFA Special Finance Agency VII
(CMFA Special Finance Agency VII The Breakwater Apartments)
Series 2021
3.00%, 08/01/2056(c) | | | 1,000 | | | | 670,892 | |
CMFA Special Finance Agency VIII Elan Huntington Beach
Series 2021
3.00%, 08/01/2056(c) | | | 4,000 | | | | 2,770,794 | |
Coast Community College District
Series 2019-F
3.00%, 08/01/2036 | | | 850 | | | | 755,267 | |
3.00%, 08/01/2037 | | | 940 | | | | 824,887 | |
3.00%, 08/01/2038 | | | 2,175 | | | | 1,885,596 | |
Coast Community College District
(Pre-refunded – US Treasuries)
Series 2015
Zero Coupon, 08/01/2036 | | | 8,690 | | | | 5,130,011 | |
Compton Community Redevelopment Agency Successor Agency
AGM Series 2022-A
5.25%, 08/01/2032 | | | 3,500 | | | | 3,832,164 | |
Contra Costa Community College District
Series 2014-A
4.00%, 08/01/2029 | | | 2,100 | | | | 2,100,298 | |
County of Los Angeles CA
Series 2023
5.00%, 06/28/2024 | | | 17,000 | | | | 17,012,456 | |
County of Los Angeles CA Community Facilities District No. 2021-01
(County of Los Angeles CA Community Facilities District No. 2021-01 Area No. 1)
Series 2022
5.00%, 09/01/2047 | | | 2,750 | | | | 2,753,096 | |
5.00%, 09/01/2052 | | | 2,500 | | | | 2,491,292 | |
| | |
| |
| abfunds.com | | AB MUNICIPAL INCOME FUND | 13 |
PORTFOLIO OF INVESTMENTS (continued)
AB CALIFORNIA PORTFOLIO
| | | | | | | | |
| | | Principal
Amount
(000) | | | U.S. $ Value | |
| |
County of Sacramento CA
(North Vineyard District 2005-2)
Series 2016
5.00%, 09/01/2040 | | $ | 990 | | | $ | 999,485 | |
5.00%, 09/01/2045 | | | 1,250 | | | | 1,257,345 | |
County of Sacramento CA Airport System Revenue
Series 2016-B
5.00%, 07/01/2036 | | | 1,755 | | | | 1,802,270 | |
County of Santa Cruz CA
Series 2023
5.00%, 07/05/2024 | | | 2,500 | | | | 2,502,436 | |
CSCDA Community Improvement Authority
(CSCDA Community Improvement Authority 777 Place-Pomona)
Series 2021
4.00%, 05/01/2057(c) | | | 1,000 | | | | 716,471 | |
CSCDA Community Improvement Authority
(CSCDA Community Improvement Authority 1818 Platinum Triangle-Anaheim)
Series 2021
3.25%, 04/01/2057(c) | | | 4,000 | | | | 2,880,239 | |
CSCDA Community Improvement Authority
(CSCDA Community Improvement Authority Acacia on Santa Rosa Creek)
Series 2021
4.00%, 10/01/2046(c) | | | 3,000 | | | | 2,347,439 | |
CSCDA Community Improvement Authority
(CSCDA Community Improvement Authority Altana Apartments)
Series 2021
4.00%, 10/01/2056(c) | | | 5,000 | | | | 3,835,079 | |
CSCDA Community Improvement Authority
(CSCDA Community Improvement Authority Millennium South Bay-Hawthorne)
Series 2021
4.00%, 07/01/2058(c) | | | 1,000 | | | | 680,007 | |
CSCDA Community Improvement Authority
(CSCDA Community Improvement Authority Oceanaire Apartments)
Series 2021
4.00%, 09/01/2056(c) | | | 2,500 | | | | 1,867,121 | |
| | |
| |
14 | AB MUNICIPAL INCOME FUND | | abfunds.com |
PORTFOLIO OF INVESTMENTS (continued)
AB CALIFORNIA PORTFOLIO
| | | | | | | | |
| | | Principal
Amount
(000) | | | U.S. $ Value | |
| |
CSCDA Community Improvement Authority
(CSCDA Community Improvement Authority Pasadena Portfolio)
Series 2021
3.00%, 12/01/2056(c) | | $ | 1,000 | | | $ | 695,166 | |
4.00%, 12/01/2056(c) | | | 1,000 | | | | 736,912 | |
CSCDA Community Improvement Authority
(CSCDA Community Improvement Authority The Crescent)
Series 2022
4.30%, 07/01/2059(c) | | | 1,000 | | | | 835,873 | |
CSCDA Community Improvement Authority
(CSCDA Community Improvement Authority Theo Apartments)
Series 2021
4.00%, 05/01/2057(c) | | | 2,000 | | | | 1,404,529 | |
CSCDA Community Improvement Authority
(CSCDA Community Improvement Authority Towne at Glendale Apartments)
Series 2022
0.00%, 09/01/2062(a)(c) | | | 1,645 | | | | 858,567 | |
CSCDA Community Improvement Authority
(CSCDA Community Improvement Authority Union South Bay)
Series 2021-A2
4.00%, 07/01/2056(c) | | | 2,400 | | | | 1,830,804 | |
CSCDA Community Improvement Authority
(CSCDA Community Improvement Authority Vineyard Gardens Apartments)
Series 2021
3.25%, 10/01/2058(c) | | | 1,000 | | | | 679,893 | |
4.00%, 10/01/2048(c) | | | 3,000 | | | | 2,176,293 | |
CSCDA Community Improvement Authority
(CSCDA Community Improvement Authority Waterscape Apartments)
Series 2021-A
3.00%, 09/01/2056(c) | | | 1,500 | | | | 1,025,638 | |
Desert Community College District
Series 2024
5.00%, 08/01/2024 | | | 2,500 | | | | 2,504,815 | |
Foothill-De Anza Community College District
AMBAC Series 2007-A
Zero Coupon, 08/01/2034 | | | 1,995 | | | | 1,402,228 | |
Foothill-Eastern Transportation Corridor Agency
Series 2021-C
4.00%, 01/15/2043 | | | 1,500 | | | | 1,453,749 | |
| | |
| |
| abfunds.com | | AB MUNICIPAL INCOME FUND | 15 |
PORTFOLIO OF INVESTMENTS (continued)
AB CALIFORNIA PORTFOLIO
| | | | | | | | |
| | | Principal
Amount
(000) | | | U.S. $ Value | |
| |
Fremont Union High School District
Series 2024
5.00%, 08/01/2029 | | $ | 1,000 | | | $ | 1,094,888 | |
5.00%, 08/01/2032 | | | 1,000 | | | | 1,146,234 | |
5.00%, 08/01/2034 | | | 1,850 | | | | 2,176,788 | |
5.00%, 08/01/2035 | | | 1,170 | | | | 1,375,779 | |
Glendale Unified School District/CA
(Pre-refunded – US Treasuries)
Series 2015-B
4.00%, 09/01/2041 | | | 10,000 | | | | 10,095,235 | |
Golden State Tobacco Securitization Corp.
Series 2021
3.85%, 06/01/2050 | | | 4,710 | | | | 4,376,568 | |
Series 2021-B
Zero Coupon, 06/01/2066 | | | 32,000 | | | | 3,485,312 | |
Series 2022
5.00%, 06/01/2051 | | | 10,000 | | | | 10,280,483 | |
Golden State Tobacco Securitization Corp.
(Golden State Tobacco Securitization Corp. Lease)
Series 2021
2.746%, 06/01/2034 | | | 3,175 | | | | 2,654,002 | |
3.115%, 06/01/2038 | | | 5,000 | | | | 3,980,722 | |
Golden State Tobacco Securitization Corp.
(Pre-refunded – US Treasuries)
Series 2018-A
5.00%, 06/01/2030 | | | 2,500 | | | | 2,676,934 | |
Irvine Facilities Financing Authority
(City of Irvine CA Community Facilities District No. 2013-3)
BAM Series 2023
Zero Coupon, 09/01/2049 | | | 1,300 | | | | 385,298 | |
Zero Coupon, 09/01/2050 | | | 1,250 | | | | 351,803 | |
Irvine Unified School District
Series 2017-B
5.00%, 09/01/2047 | | | 995 | | | | 1,007,336 | |
Lake Elsinore Public Financing Authority
Series 2015
5.00%, 09/01/2031 | | | 2,690 | | | | 2,711,903 | |
5.00%, 09/01/2035 | | | 1,835 | | | | 1,849,556 | |
Long Beach Bond Finance Authority
(Bank of America Corp.)
Series 2007-A
5.00%, 11/15/2024 | | | 1,175 | | | | 1,177,086 | |
5.50%, 11/15/2037 | | | 2,000 | | | | 2,216,445 | |
| | |
| |
16 | AB MUNICIPAL INCOME FUND | | abfunds.com |
PORTFOLIO OF INVESTMENTS (continued)
AB CALIFORNIA PORTFOLIO
| | | | | | | | |
| | | Principal
Amount
(000) | | | U.S. $ Value | |
| |
Los Angeles County Metropolitan Transportation Authority Sales Tax Revenue
Series 2020
5.00%, 06/01/2024 | | $ | 1,170 | | | $ | 1,170,000 | |
Los Angeles Department of Water & Power
(Los Angeles Department of Water & Power Power System Revenue)
Series 2023-D
5.00%, 07/01/2041 | | | 12,610 | | | | 14,006,382 | |
Los Angeles Department of Water & Power Water System Revenue
Series 2021-C
5.00%, 07/01/2041 | | | 1,250 | | | | 1,348,891 | |
Series 2022-C
5.00%, 07/01/2042 | | | 8,750 | | | | 9,635,173 | |
Los Angeles Unified School District/CA
Series 2024-A
5.00%, 07/01/2032 | | | 27,000 | | | | 30,540,513 | |
Los Angeles Unified School District/CA
(Pre-refunded – US Treasuries)
Series 2014-C
5.00%, 07/01/2030 | | | 10,000 | | | | 10,016,434 | |
M-S-R Energy Authority
(Citigroup, Inc.)
Series 2009-A
6.50%, 11/01/2039 | | | 2,000 | | | | 2,472,500 | |
Series 2009-B
6.50%, 11/01/2039 | | | 10,000 | | | | 12,362,498 | |
Menifee Union School District
Series 2018
5.00%, 09/01/2043 | | | 1,000 | | | | 1,017,943 | |
5.00%, 09/01/2048 | | | 1,215 | | | | 1,232,267 | |
Metropolitan Water District of Southern California
Series 2019-A
5.00%, 07/01/2024 | | | 3,820 | | | | 3,823,137 | |
Northern California Energy Authority
(Pacific Mutual Holding Co.)
Series 2024
5.00%, 12/01/2054 | | | 10,000 | | | | 10,573,525 | |
Oakland Unified School District/Alameda County
(Pre-refunded – US Treasuries)
Series 2015-A
5.00%, 08/01/2031 | | | 1,640 | | | | 1,671,132 | |
| | |
| |
| abfunds.com | | AB MUNICIPAL INCOME FUND | 17 |
PORTFOLIO OF INVESTMENTS (continued)
AB CALIFORNIA PORTFOLIO
| | | | | | | | |
| | | Principal
Amount
(000) | | | U.S. $ Value | |
| |
5.00%, 08/01/2032 | | $ | 1,500 | | | $ | 1,528,474 | |
5.00%, 08/01/2033 | | | 2,200 | | | | 2,241,762 | |
Orange County Water District
Series 2019-C
4.00%, 08/15/2034 | | | 1,250 | | | | 1,296,356 | |
Oxnard Financing Authority
(City of Oxnard CA Wastewater Revenue)
AGM Series 2014
5.00%, 06/01/2031 | | | 5,250 | | | | 5,252,833 | |
Palomar Health
(Palomar Health Obligated Group)
Series 2016-A
5.00%, 08/01/2031 | | | 1,285 | | | | 1,290,008 | |
Peralta Community College District
Series 2022
5.00%, 08/01/2024 | | | 1,330 | | | | 1,332,605 | |
Port of Oakland
Series 2021
5.00%, 05/01/2025 | | | 4,640 | | | | 4,679,568 | |
Poway Unified School District Public Financing Authority
Series 2015-A
5.00%, 09/01/2033 | | | 1,500 | | | | 1,516,863 | |
5.00%, 09/01/2034 | | | 995 | | | | 1,006,519 | |
Redding Joint Powers Financing Authority
Series 2015-A
5.00%, 06/01/2030 | | | 1,350 | | | | 1,379,917 | |
Rialto Redevelopment Agency
Series 2018
5.00%, 09/01/2032 | | | 500 | | | | 528,983 | |
5.00%, 09/01/2033 | | | 500 | | | | 527,949 | |
5.00%, 09/01/2037 | | | 2,235 | | | | 2,342,935 | |
River Islands Public Financing Authority
(River Islands Public Financing Authority Cmnty Facs District No. 2003-1 Area 1)
Series 2022
5.00%, 09/01/2052 | | | 5,200 | | | | 4,862,318 | |
Riverside County Transportation Commission
Series 2021
4.00%, 06/01/2040 | | | 3,330 | | | | 3,273,936 | |
4.00%, 06/01/2041 | | | 1,765 | | | | 1,722,652 | |
| | |
| |
18 | AB MUNICIPAL INCOME FUND | | abfunds.com |
PORTFOLIO OF INVESTMENTS (continued)
AB CALIFORNIA PORTFOLIO
| | | | | | | | |
| | | Principal
Amount
(000) | | | U.S. $ Value | |
| |
Sacramento County Water Financing Authority
(Sacramento County Water Agency)
NATL Series 2007-B
4.304% (CME Term SOFR 3 Month + 0.55%), 06/01/2034(b) | | $ | 1,410 | | | $ | 1,336,131 | |
4.324% (CME Term SOFR 3 Month + 0.57%), 06/01/2039(b) | | | 5,375 | | | | 4,813,554 | |
San Diego County Regional Airport Authority
Series 2020
5.00%, 07/01/2035 | | | 650 | | | | 686,880 | |
5.00%, 07/01/2036 | | | 500 | | | | 527,255 | |
5.00%, 07/01/2037 | | | 250 | | | | 262,598 | |
5.00%, 07/01/2038 | | | 250 | | | | 261,450 | |
5.00%, 07/01/2039 | | | 255 | | | | 265,836 | |
5.00%, 07/01/2040 | | | 250 | | | | 259,532 | |
Series 2021-A
4.00%, 07/01/2056 | | | 4,000 | | | | 3,755,663 | |
Series 2021-B
4.00%, 07/01/2041 | | | 3,010 | | | | 2,871,947 | |
Series 2023
5.00%, 07/01/2043 | | | 1,185 | | | | 1,244,388 | |
5.00%, 07/01/2053 | | | 11,000 | | | | 11,324,360 | |
San Diego Unified School District/CA
Series 2023
4.00%, 07/01/2053 | | | 2,000 | | | | 1,931,098 | |
5.00%, 07/01/2048 | | | 10,000 | | | | 10,849,453 | |
Series 2025-S
5.00%, 07/01/2034(g) | | | 1,000 | | | | 1,128,591 | |
Series 2025-Z
5.00%, 07/01/2030(g) | | | 1,000 | | | | 1,076,616 | |
5.00%, 07/01/2034(g) | | | 2,000 | | | | 2,257,183 | |
San Francisco City & County Redevelopment Agency Successor Agency
(Successor Agency to the Redev of San Francisco – Mission Bay South)
Series 2016-B
5.00%, 08/01/2033 | | | 1,000 | | | | 1,033,164 | |
5.00%, 08/01/2035 | | | 1,000 | | | | 1,032,307 | |
Series 2016-C
5.00%, 08/01/2032 | | | 1,000 | | | | 1,033,467 | |
5.00%, 08/01/2035 | | | 1,000 | | | | 1,032,307 | |
San Francisco Intl Airport
Series 2017-A
5.00%, 05/01/2042 | | | 2,000 | | | | 2,027,408 | |
| | |
| |
| abfunds.com | | AB MUNICIPAL INCOME FUND | 19 |
PORTFOLIO OF INVESTMENTS (continued)
AB CALIFORNIA PORTFOLIO
| | | | | | | | |
| | | Principal
Amount
(000) | | | U.S. $ Value | |
| |
Series 2019-E
5.00%, 05/01/2050 | | $ | 2,000 | | | $ | 2,033,461 | |
Series 2022-C
3.283%, 05/01/2036 | | | 3,000 | | | | 2,493,505 | |
Series 2023-E
5.50%, 05/01/2041 | | | 5,350 | | | | 5,885,700 | |
Series 2024
5.00%, 05/01/2037(g) | | | 5,265 | | | | 5,708,959 | |
5.25%, 05/01/2042(g) | | | 10,185 | | | | 11,043,227 | |
5.25%, 05/01/2044(g) | | | 5,050 | | | | 5,439,029 | |
5.25%, 05/01/2049(g) | | | 7,500 | | | | 8,000,974 | |
San Ramon Valley Unified School District/CA
(Pre-refunded – US Treasuries)
Series 2015
4.00%, 08/01/2034 | | | 4,000 | | | | 4,030,772 | |
Santa Barbara Secondary High School District
Series 2011-A
Zero Coupon, 08/01/2036 | | | 15,395 | | | | 9,299,422 | |
Santa Clara Valley Water District Safe Clean Water Revenue
(Santa Clara Valley Water District Safe Clean Water Revenue Lease)
Series 2022-A
5.00%, 08/01/2049 | | | 1,210 | | | | 1,303,263 | |
Sequoia Union High School District
Series 2024
5.00%, 07/01/2024 | | | 6,035 | | | | 6,040,099 | |
Sierra Joint Community College District School Facilities District No. 2
NATL Series 2007-B
Zero Coupon, 06/01/2032 | | | 5,485 | | | | 4,105,651 | |
Southern California Public Power Authority
(American International Group, Inc.) 5.00%, 04/01/2055 | | | 3,600 | | | | 3,787,853 | |
Southern California Public Power Authority (Pre-refunded – Others)
Series 2014-A
5.00%, 07/01/2033 | | | 5,000 | | | | 5,013,476 | |
5.00%, 07/01/2034 | | | 3,200 | | | | 3,208,625 | |
State of California
Series 2004
5.30%, 04/01/2029 | | | 5 | | | | 5,005 | |
Series 2009
7.55%, 04/01/2039 | | | 1,000 | | | | 1,194,665 | |
Series 2017
5.00%, 11/01/2024 | | | 5,790 | | | | 5,820,564 | |
| | |
| |
20 | AB MUNICIPAL INCOME FUND | | abfunds.com |
PORTFOLIO OF INVESTMENTS (continued)
AB CALIFORNIA PORTFOLIO
| | | | | | | | |
| | | Principal
Amount
(000) | | | U.S. $ Value | |
| |
Series 2018
4.60%, 04/01/2038 | | $ | 2,000 | | | $ | 1,868,758 | |
Series 2019
5.00%, 10/01/2025 | | | 3,950 | | | | 4,031,963 | |
Series 2021
5.00%, 10/01/2024 | | | 3,000 | | | | 3,010,114 | |
Series 2022
5.00%, 09/01/2025 | | | 7,000 | | | | 7,135,749 | |
5.00%, 09/01/2042 | | | 7,000 | | | | 7,668,142 | |
Series 2023
5.00%, 10/01/2042 | | | 1,000 | | | | 1,101,194 | |
5.25%, 10/01/2050 | | | 5,000 | | | | 5,530,564 | |
5.25%, 09/01/2053 | | | 20,000 | | | | 22,117,134 | |
6.00%, 03/01/2033 | | | 4,000 | | | | 4,261,600 | |
Series 2024
5.00%, 09/01/2025 | | | 1,000 | | | | 1,019,393 | |
5.15%, 09/01/2034 | | | 2,000 | | | | 2,016,355 | |
State of California
(Pre-refunded – Others)
Series 2019
5.00%, 04/01/2037 | | | 2,500 | | | | 2,502,031 | |
Stockton Redevelopment Agency Successor Agency
AGM Series 2016-A
5.00%, 09/01/2033 | | | 2,800 | | | | 2,880,125 | |
5.00%, 09/01/2034 | | | 1,000 | | | | 1,027,309 | |
Successor Agency to the Redev of San Francisco – Mission Bay North
Series 2016-A
5.00%, 08/01/2032 | | | 1,025 | | | | 1,059,304 | |
5.00%, 08/01/2034 | | | 1,105 | | | | 1,141,584 | |
5.00%, 08/01/2035 | | | 595 | | | | 614,222 | |
5.00%, 08/01/2036 | | | 775 | | | | 793,612 | |
Tobacco Securitization Authority of Northern California
(Sacramento County Tobacco Securitization Corp.)
Series 2021
Zero Coupon, 06/01/2060 | | | 10,000 | | | | 1,553,873 | |
5.00%, 06/01/2024 | | | 1,250 | | | | 1,250,000 | |
Tobacco Securitization Authority of Southern California
Series 2019
5.00%, 06/01/2037 | | | 1,000 | | | | 1,053,930 | |
5.00%, 06/01/2048 | | | 8,970 | | | | 9,082,260 | |
| | |
| |
| abfunds.com | | AB MUNICIPAL INCOME FUND | 21 |
PORTFOLIO OF INVESTMENTS (continued)
AB CALIFORNIA PORTFOLIO
| | | | | | | | |
| | | Principal
Amount
(000) | | | U.S. $ Value | |
| |
Transbay Joint Powers Authority
(Transbay Joint Powers Authority Transbay Redevelopment Project Tax Increment Rev)
Series 2020
5.00%, 10/01/2040 | | $ | 1,000 | | | $ | 1,016,587 | |
5.00%, 10/01/2045 | | | 2,000 | | | | 2,017,445 | |
5.00%, 10/01/2049 | | | 2,200 | | | | 2,205,353 | |
Twin Rivers Unified School District
BAM Series 2023-A
5.00%, 08/01/2024 | | | 2,000 | | | | 2,003,004 | |
University of California
Series 2023-B
4.693%, 05/15/2033 | | | 5,600 | | | | 5,472,881 | |
5.00%, 05/15/2025 | | | 2,610 | | | | 2,651,568 | |
5.00%, 05/15/2035 | | | 5,000 | | | | 5,714,685 | |
5.00%, 05/15/2036 | | | 5,000 | | | | 5,708,088 | |
Upland Unified School District
Series 2011-C
Zero Coupon, 08/01/2035 | | | 1,020 | | | | 668,451 | |
Walnut Energy Center Authority
Series 2014
5.00%, 01/01/2031 | | | 4,000 | | | | 4,003,553 | |
5.00%, 01/01/2032 | | | 3,700 | | | | 3,702,671 | |
Washington Township Health Care District
Series 2017-B
5.00%, 07/01/2032 | | | 2,000 | | | | 2,027,031 | |
5.00%, 07/01/2033 | | | 1,500 | | | | 1,520,199 | |
Series 2023-B
5.25%, 08/01/2048 | | | 1,750 | | | | 1,910,491 | |
AGM Series 2023-B
4.25%, 08/01/2045 | | | 1,225 | | | | 1,231,891 | |
| | | | | | | | |
| | | | | | | 1,097,432,802 | |
| | | | | | | | |
American Samoa – 0.2% | |
American Samoa Economic Development Authority
(Territory of American Samoa)
Series 2015-A
6.625%, 09/01/2035 | | | 430 | | | | 440,519 | |
Series 2018
7.125%, 09/01/2038(c) | | | 1,385 | | | | 1,486,084 | |
| | | | | | | | |
| | | | | | | 1,926,603 | |
| | | | | | | | |
Georgia – 0.0% | |
Municipal Electric Authority of Georgia
Series 2019
5.00%, 01/01/2037 | | | 100 | | | | 102,853 | |
| | |
| |
22 | AB MUNICIPAL INCOME FUND | | abfunds.com |
PORTFOLIO OF INVESTMENTS (continued)
AB CALIFORNIA PORTFOLIO
| | | | | | | | |
| | | Principal
Amount
(000) | | | U.S. $ Value | |
| |
5.00%, 01/01/2038 | | $ | 100 | | | $ | 102,551 | |
5.00%, 01/01/2039 | | | 100 | | | | 103,338 | |
| | | | | | | | |
| | | | | | | 308,742 | |
| | | | | | | | |
Guam – 1.6% | |
Antonio B Won Pat International Airport Authority
Series 2021-A
3.839%, 10/01/2036 | | | 1,190 | | | | 992,069 | |
Series 2023
5.375%, 10/01/2040 | | | 250 | | | | 245,452 | |
5.375%, 10/01/2043 | | | 1,050 | | | | 1,016,108 | |
Guam Power Authority
Series 2017-A
5.00%, 10/01/2036 | | | 2,940 | | | | 3,008,217 | |
5.00%, 10/01/2037 | | | 1,300 | | | | 1,327,021 | |
Series 2022-A
5.00%, 10/01/2044 | | | 3,700 | | | | 3,759,756 | |
Territory of Guam
Series 2019
5.00%, 11/15/2031 | | | 240 | | | | 241,212 | |
Territory of Guam
(Guam Section 30 Income Tax)
Series 2016-A
5.00%, 12/01/2029 | | | 3,805 | | | | 3,883,803 | |
5.00%, 12/01/2030 | | | 415 | | | | 423,693 | |
5.00%, 12/01/2032 | | | 455 | | | | 464,448 | |
Territory of Guam
(Territory of Guam Business Privilege Tax)
Series 2021-F
4.00%, 01/01/2042 | | | 3,000 | | | | 2,782,533 | |
| | | | | | | | |
| | | | | | | 18,144,312 | |
| | | | | | | | |
Michigan – 0.0% | |
City of Detroit MI
Series 2018
5.00%, 04/01/2036 | | | 305 | | | | 310,587 | |
| | | | | | | | |
|
Puerto Rico – 1.5% | |
Commonwealth of Puerto Rico
Series 2021-A
Zero Coupon, 07/01/2024 | | | 217 | | | | 216,346 | |
Zero Coupon, 07/01/2033 | | | 1,238 | | | | 820,157 | |
4.00%, 07/01/2046 | | | 11 | | | | 9,547 | |
Series 2022-C
Zero Coupon, 11/01/2043 | | | 60 | | | | 37,164 | |
| | |
| |
| abfunds.com | | AB MUNICIPAL INCOME FUND | 23 |
PORTFOLIO OF INVESTMENTS (continued)
AB CALIFORNIA PORTFOLIO
| | | | | | | | |
| | | Principal
Amount
(000) | | | U.S. $ Value | |
| |
Puerto Rico Commonwealth Aqueduct & Sewer Authority
Series 2020-A
5.00%, 07/01/2030(c) | | $ | 2,490 | | | $ | 2,613,499 | |
5.00%, 07/01/2035(c) | | | 1,945 | | | | 2,025,520 | |
Puerto Rico Electric Power Authority
AGM Series 2007-V
5.25%, 07/01/2031 | | | 1,000 | | | | 995,289 | |
NATL Series 2007-V
5.25%, 07/01/2032 | | | 1,000 | | | | 984,207 | |
5.25%, 07/01/2034 | | | 1,000 | | | | 985,362 | |
Puerto Rico Industrial Tourist Educational Medical & Environmental Control Facilities Financing Auth
Series 2023-A
6.625%, 01/01/2027 | | | 172 | | | | 169,371 | |
6.625%, 01/01/2028 | | | 1,313 | | | | 1,288,788 | |
Puerto Rico Industrial Tourist Educational Medical & Environmental Control Facilities Financing Auth
(AES Puerto Rico LP)
12.50%, 12/15/2025(h)(i) | | | 305 | | | | 295,929 | |
Puerto Rico Industrial Tourist Educational Medical & Environmental Control Facilities Financing Auth
(San Juan Cruise Port LLC)
Series 2024
6.75%, 01/01/2045 | | | 1,700 | | | | 2,014,687 | |
Puerto Rico Sales Tax Financing Corp. Sales Tax Revenue
Series 2018-A
Zero Coupon, 07/01/2029 | | | 847 | | | | 699,284 | |
Series 2019-A
4.329%, 07/01/2040 | | | 1,065 | | | | 1,058,017 | |
4.55%, 07/01/2040 | | | 90 | | | | 90,543 | |
5.00%, 07/01/2058 | | | 2,900 | | | | 2,890,461 | |
| | | | | | | | |
| | | | | | | 17,194,171 | |
| | | | | | | | |
Tennessee – 0.1% | |
Bristol Industrial Development Board
(Bristol Industrial Development Board Sales Tax)
Series 2016-A
5.00%, 12/01/2035(c) | | | 1,010 | | | | 925,411 | |
| | | | | | | | |
| | |
| |
24 | AB MUNICIPAL INCOME FUND | | abfunds.com |
PORTFOLIO OF INVESTMENTS (continued)
AB CALIFORNIA PORTFOLIO
| | | | | | | | |
| | | Principal
Amount
(000) | | | U.S. $ Value | |
| |
Texas – 0.2% | |
Mission Economic Development Corp.
(Natgasoline LLC)
Series 2018
4.625%, 10/01/2031(c) | | $ | 1,805 | | | $ | 1,792,346 | |
| | | | | | | | |
|
Washington – 0.0% | |
Washington State Housing Finance Commission
(Presbyterian Retirement Communities Northwest Obligated Group)
Series 2019-A
5.00%, 01/01/2044(c) | | | 130 | | | | 107,317 | |
5.00%, 01/01/2049(c) | | | 100 | | | | 78,641 | |
5.00%, 01/01/2055(c) | | | 410 | | | | 310,846 | |
| | | | | | | | |
| | | | | | | 496,804 | |
| | | | | | | | |
Wisconsin – 0.2% | |
Wisconsin Health & Educational Facilities Authority
(St. Camillus Health System Obligated Group)
Series 2019
5.00%, 11/01/2054 | | | 115 | | | | 92,121 | |
Wisconsin Public Finance Authority
(Catholic Bishop of Chicago (The))
Series 2021
5.75%, 07/25/2041(j) | | | 2,000 | | | | 1,771,870 | |
| | | | | | | | |
| | | | | | | 1,863,991 | |
| | | | | | | | |
Other – 0.1% | |
Federal Home Loan Mortgage Corp. Multifamily VRD Certificates
Series 2022-ML13, Class ACA
2.875%, 07/25/2036 | | | 1,926 | | | | 1,709,694 | |
| | | | | | | | |
| | |
Total Municipal Obligations
(cost $1,178,655,076) | | | | | | | 1,142,105,463 | |
| | | | | | | | |
| | | | | | | | |
COMMERCIAL MORTGAGE-BACKED SECURITIES – 2.3% | | | | | | | | |
Agency CMBS – 0.9% | |
California Housing Finance Agency
Series 2021-2, Class A
3.75%, 03/25/2035 | | | 6,274 | | | | 6,024,686 | |
Series 2021-2, Class X
0.82%, 03/25/2035(k) | | | 2,896 | | | | 132,406 | |
| | |
| |
| abfunds.com | | AB MUNICIPAL INCOME FUND | 25 |
PORTFOLIO OF INVESTMENTS (continued)
AB CALIFORNIA PORTFOLIO
| | | | | | | | |
| | | Principal
Amount
(000) | | | U.S. $ Value | |
| |
Series 2021-3, Class A
3.25%, 08/20/2036 | | $ | 1,922 | | | $ | 1,730,459 | |
Series 2021-3, Class X
0.77%, 08/20/2036(k) | | | 2,547 | | | | 127,621 | |
Federal Home Loan Mortgage Corp.
Series 2021-ML10, Class AUS
2.032%, 01/25/2038 | | | 3,599 | | | | 2,748,192 | |
Federal Home Loan Mortgage Corp.
Multifamily VRD Certificates
Series 2022-ML13, Class XCA
0.96%, 07/25/2036(k) | | | 5,392 | | | | 284,937 | |
| | | | | | | | |
| | | | | | | 11,048,301 | |
| | | | | | | | |
Non-Agency Fixed Rate CMBS – 1.4% | |
California Housing Finance Agency
Series 2019-2, Class A
4.00%, 03/20/2033 | | | 7,642 | | | | 7,507,895 | |
Series 2021-1, Class A
3.50%, 11/20/2035 | | | 6,999 | | | | 6,528,580 | |
Series 2023-1, Class A
4.375%, 09/20/2036 | | | 1,987 | | | | 1,962,031 | |
City of Fort Wayne IN
10.75%, 12/01/2029(d)(e) | | | 47 | | | | 4 | |
| | | | | | | | |
| | | | | | | 15,998,510 | |
| | | | | | | | |
Total Commercial Mortgage-Backed Securities
(cost $32,025,051) | | | | | | | 27,046,811 | |
| | | | | | | | |
| | | | | | | | |
ASSET-BACKED SECURITIES – 0.2% | | | | | | | | |
Other ABS - Fixed Rate – 0.2% | | | | | | | | |
HTA TRRB Custodial Trust
Series 2022
5.25%, 07/01/2034 | | | 838 | | | | 816,157 | |
5.25%, 07/01/2036 | | | 879 | | | | 882,596 | |
5.25%, 07/01/2041 | | | 596 | | | | 579,823 | |
| | | | | | | | |
| | |
Total Asset-Backed Securities
(cost $2,302,862) | | | | | | | 2,278,576 | |
| | | | | | | | |
| | |
| | | Shares | | | | |
PREFERRED STOCKS – 0.0% | | | | | | | | |
Utility – 0.0% | | | | | | | | |
Electric – 0.0% | | | | | | | | |
AES Puerto Rico LP
0.00%(e)(h)(i)
(cost $518,457) | | | 28,882 | | | | 84,047 | |
| | | | | | | | |
| | |
| |
26 | AB MUNICIPAL INCOME FUND | | abfunds.com |
PORTFOLIO OF INVESTMENTS (continued)
AB CALIFORNIA PORTFOLIO
| | | | | | | | |
| | |
Shares | | | U.S. $ Value | |
| |
SHORT-TERM INVESTMENTS – 0.2% | | | | | | | | |
Investment Companies – 0.2% | | | | | | | | |
AB Fixed Income Shares, Inc. – Government Money Market Portfolio – Class AB, 5.22%(l)(m)(n)
(cost $2,448,099) | | | 2,448,099 | | | $ | 2,448,099 | |
| | | | | | | | |
| | |
Total Investments – 101.3%
(cost $1,215,949,545) | | | | | | | 1,173,962,996 | |
Other assets less liabilities – (1.3)% | | | | | | | (15,450,110 | ) |
| | | | | | | | |
| | |
Net Assets – 100.0% | | | | | | $ | 1,158,512,886 | |
| | | | | | | | |
CENTRALLY CLEARED INFLATION (CPI) SWAPS (see Note D)
| | | | | | | | | | | | | | | | | | | | | | | | | | |
| | | | Rate Type | | | | | | | | | | | |
Notional Amount (000) | | | Termination Date | | | Payments made by the Fund | | Payments received by the Fund | | Payment
Frequency Paid/ Received | | Market Value | | | Upfront Premiums Paid (Received) | | | Unrealized Appreciation (Depreciation) | |
USD | | | 6,350 | | | | 01/15/2025 | | | 2.565% | | CPI# | | Maturity | | $ | 719,559 | | | $ | – 0 | – | | $ | 719,559 | |
USD | | | 3,340 | | | | 01/15/2025 | | | 4.028% | | CPI# | | Maturity | | | 170,102 | | | | – 0 | – | | | 170,102 | |
USD | | | 3,175 | | | | 01/15/2025 | | | 2.585% | | CPI# | | Maturity | | | 357,127 | | | | – 0 | – | | | 357,127 | |
USD | | | 3,175 | | | | 01/15/2025 | | | 2.613% | | CPI# | | Maturity | | | 353,478 | | | | – 0 | – | | | 353,478 | |
USD | | | 37,160 | | | | 01/15/2027 | | | CPI# | | 3.336% | | Maturity | | | (2,015,079 | ) | | | – 0 | – | | | (2,015,079 | ) |
USD | | | 10,000 | | | | 01/15/2027 | | | CPI# | | 3.466% | | Maturity | | | (460,477 | ) | | | (7,144 | ) | | | (453,333 | ) |
USD | | | 20,520 | | | | 01/15/2028 | | | 1.230% | | CPI# | | Maturity | | | 3,924,658 | | | | – 0 | – | | | 3,924,658 | |
USD | | | 16,260 | | | | 01/15/2028 | | | 0.735% | | CPI# | | Maturity | | | 3,698,094 | | | | – 0 | – | | | 3,698,094 | |
USD | | | 16,830 | | | | 01/15/2029 | | | CPI# | | 3.735% | | Maturity | | | (72,222 | ) | | | – 0 | – | | | (72,222 | ) |
USD | | | 3,150 | | | | 01/15/2029 | | | CPI# | | 3.408% | | Maturity | | | (100,010 | ) | | | – 0 | – | | | (100,010 | ) |
USD | | | 6,300 | | | | 01/15/2030 | | | 1.572% | | CPI# | | Maturity | | | 1,140,410 | | | | – 0 | – | | | 1,140,410 | |
USD | | | 6,300 | | | | 01/15/2030 | | | 1.587% | | CPI# | | Maturity | | | 1,131,815 | | | | – 0 | – | | | 1,131,815 | |
USD | | | 655 | | | | 01/15/2030 | | | 1.714% | | CPI# | | Maturity | | | 110,059 | | | | – 0 | – | | | 110,059 | |
USD | | | 655 | | | | 01/15/2030 | | | 1.731% | | CPI# | | Maturity | | | 109,034 | | | | – 0 | – | | | 109,034 | |
USD | | | 6,200 | | | | 01/15/2031 | | | 2.782% | | CPI# | | Maturity | | | 480,831 | | | | – 0 | – | | | 480,831 | |
USD | | | 5,700 | | | | 01/15/2031 | | | 2.680% | | CPI# | | Maturity | | | 498,339 | | | | – 0 | – | | | 498,339 | |
USD | | | 5,120 | | | | 01/15/2032 | | | CPI# | | 3.064% | | Maturity | | | (228,866 | ) | | | – 0 | – | | | (228,866 | ) |
USD | | | 5,250 | | | | 04/15/2032 | | | CPI# | | 2.909% | | Maturity | | | (302,285 | ) | | | – 0 | – | | | (302,285 | ) |
USD | | | 1,120 | | | | 04/15/2032 | | | CPI# | | 2.748% | | Maturity | | | (83,442 | ) | | | – 0 | – | | | (83,442 | ) |
| | | | | | | | | | | | | | | | | | | | | | | | | | |
| | $ | 9,431,125 | | | $ | (7,144 | ) | | $ | 9,438,269 | |
| | | | | | | | | | | | |
| # | Variable interest rate based on the rate of inflation as determined by the Consumer Price Index (CPI). |
| | |
| |
| abfunds.com | | AB MUNICIPAL INCOME FUND | 27 |
PORTFOLIO OF INVESTMENTS (continued)
AB CALIFORNIA PORTFOLIO
CENTRALLY CLEARED INTEREST RATE SWAPS (see Note D)
| | | | | | | | | | | | | | | | | | | | | | | | | | |
| | | | Rate Type | | | | | | | | | | | |
Notional Amount (000) | | | Termination Date | | | Payments made by the Fund | | Payments received by the Fund | | Payment
Frequency Paid/ Received | | Market Value | | | Upfront Premiums Paid (Received) | | | Unrealized Appreciation (Depreciation) | |
USD | | | 14,000 | | | | 01/15/2027 | | | 1 Day
SOFR | | 2.719% | | Annual | | $ | (788,368 | ) | | $ | – 0 | – | | $ | (788,368 | ) |
USD | | | 18,900 | | | | 07/31/2029 | | | 1 Day
SOFR | | 4.042% | | Annual | | | (264,559 | ) | | | – 0 | – | | | (264,559 | ) |
USD | | | 17,700 | | | | 07/31/2030 | | | 1 Day
SOFR | | 4.030% | | Annual | | | (355,341 | ) | | | – 0 | – | | | (355,341 | ) |
USD | | | 11,800 | | | | 07/31/2030 | | | 1 Day
SOFR | | 3.897% | | Annual | | | (333,662 | ) | | | – 0 | – | | | (333,662 | ) |
USD | | | 21,800 | | | | 07/31/2031 | | | 1 Day
SOFR | | 4.087% | | Annual | | | (137,862 | ) | | | (864 | ) | | | (136,998 | ) |
| | | | | | | | | | | | | | | | | | | | | | | | | | |
| | $ | (1,879,792 | ) | | $ | (864 | ) | | $ | (1,878,928 | ) |
| | | | | | | | | | | | |
INTEREST RATE SWAPS (see Note D)
| | | | | | | | | | | | | | | | | | | | | | | | | | | | | | | | | | | | |
| | | | Rate Type | | | | |
Swap
Counterparty | | Notional Amount (000) | | | Termination Date | | | Payments made by the Fund | | | Payments received by the Fund | | | Payment
Frequency
Paid/ Received | | | Market Value | | | Upfront Premiums Paid (Received) | | | Unrealized Appreciation (Depreciation) | |
Citibank, NA | | | USD | | | | 12,620 | | | | 10/09/2029 | | | | 1.125 | % | | | SIFMA | * | | | Quarterly | | | $ | 1,304,043 | | | $ | – 0 | – | | $ | 1,304,043 | |
| * | Variable interest rate based on the Securities Industry & Financial Markets Association (SIFMA) Municipal Swap Index. |
| (a) | Coupon rate adjusts periodically based upon a predetermined schedule. Stated interest rate in effect at May 31, 2024. |
| (b) | Floating Rate Security. Stated interest/floor/ceiling rate was in effect at May 31, 2024. |
| (c) | Security is exempt from registration under Rule 144A or Regulation S of the Securities Act of 1933. These securities are considered restricted, but liquid and may be resold in transactions exempt from registration. At May 31, 2024, the aggregate market value of these securities amounted to $177,357,331 or 15.3% of net assets. |
| (e) | Non-income producing security. |
| (f) | Restricted and illiquid security. |
| | | | | | | | | | | | | | | | |
Restricted & Illiquid Securities | | Acquisition Date | | | Cost | | | Market Value | | | Percentage of Net Assets | |
California Municipal Finance Authority
(UTS Bioenergy LLC)
Series 2011-A1
7.50%, 12/01/2032 | | | 12/22/2011 | | | $ | 2,745,000 | | | $ | 54,900 | | | | 0.00 | % |
| (g) | When-Issued or delayed delivery security. |
| (h) | Fair valued by the Adviser. |
| | |
| |
28 | AB MUNICIPAL INCOME FUND | | abfunds.com |
PORTFOLIO OF INVESTMENTS (continued)
AB CALIFORNIA PORTFOLIO
| (i) | Security in which significant unobservable inputs (Level 3) were used in determining fair value. |
| (j) | Security is exempt from registration under Rule 144A or Regulation S of the Securities Act of 1933. These securities, which represent 0.15% of net assets as of May 31, 2024, are considered illiquid and restricted. Additional information regarding such securities follows: |
| | | | | | | | | | | | | | | | |
144A/Restricted & Illiquid Securities | | Acquisition Date | | | Cost | | | Market Value | | | Percentage of Net Assets | |
Wisconsin Public Finance Authority
(Catholic Bishop of Chicago (The))
Series 2021
5.75%, 07/25/2041 | | | 08/03/2021 | | | $ | 2,000,000 | | | $ | 1,771,870 | | | | 0.15 | % |
| (l) | Affiliated investments. |
| (m) | The rate shown represents the 7-day yield as of period end. |
| (n) | To obtain a copy of the fund’s shareholder report, please go to the Securities and Exchange Commission’s website at www.sec.gov, or call AB at (800) 227-4618. |
As of May 31, 2024, the Portfolio’s percentages of investments in municipal bonds that are insured and in insured municipal bonds that have been pre-refunded or escrowed to maturity are 4.4% and 0.0%, respectively.
Glossary:
ABS – Asset-Backed Securities
AGC – Assured Guaranty Corporation
AGM – Assured Guaranty Municipal
AMBAC – Ambac Assurance Corporation
BAM – Build American Mutual
CHF – Collegiate Housing Foundation
CMBS – Commercial Mortgage-Backed Securities
COP – Certificate of Participation
DOT – Department of Transportation
MUNIPSA – SIFMA Municipal Swap Index
NATL – National Interstate Corporation
SOFR – Secured Overnight Financing Rate
See notes to financial statements.
| | |
| |
| abfunds.com | | AB MUNICIPAL INCOME FUND | 29 |
PORTFOLIO OF INVESTMENTS
AB HIGH INCOME MUNICIPAL PORTFOLIO
May 31, 2024
| | | | | | | | |
| | | Principal
Amount
(000) | | | U.S. $ Value | |
| |
MUNICIPAL OBLIGATIONS – 103.7% | | | | | | | | |
Long-Term Municipal Bonds – 103.7% | | | | | | | | |
Alabama – 4.2% | | | | | | | | |
Black Belt Energy Gas District
(Goldman Sachs Group, Inc. (The))
Series 2023-C
5.50%, 10/01/2054 | | $ | 10,000 | | | $ | 10,817,656 | |
Series 2023-D
5.414% (SOFR + 1.85%), 06/01/2049(a)(b) | | | 10,000 | | | | 10,076,109 | |
Black Belt Energy Gas District
(Morgan Stanley)
5.714% (SOFR + 2.15%), 02/01/2053(a)(b) | | | 10,000 | | | | 10,212,991 | |
Black Belt Energy Gas District
(Nomura Holdings, Inc.)
Series 2022-A
4.00%, 12/01/2052 | | | 10,000 | | | | 9,798,644 | |
Black Belt Energy Gas District
(Royal Bank of Canada)
Series 2023-B
5.25%, 12/01/2053(a) | | | 10,000 | | | | 10,699,926 | |
County of Jefferson AL Sewer Revenue
Series 2024
5.50%, 10/01/2053 | | | 10,000 | | | | 10,766,813 | |
Energy Southeast A Cooperative District
(Morgan Stanley)
Series 2024-B
5.25%, 07/01/2054 | | | 10,000 | | | | 10,618,535 | |
Homewood Educational Building Authority
(CHF – Horizons II LLC)
Series 2024
5.50%, 10/01/2054(c) | | | 1,300 | | | | 1,349,626 | |
Southeast Energy Authority A Cooperative District
(Goldman Sachs Group, Inc. (The))
Series 2022-B
5.00%, 05/01/2053 | | | 1,000 | | | | 1,031,549 | |
Southeast Energy Authority A Cooperative District
(Morgan Stanley)
Series 2022-A
5.984% (SOFR + 2.42%), 01/01/2053(a)(b) | | | 10,000 | | | | 10,346,781 | |
| | |
| |
30 | AB MUNICIPAL INCOME FUND | | abfunds.com |
PORTFOLIO OF INVESTMENTS (continued)
AB HIGH INCOME MUNICIPAL PORTFOLIO
| | | | | | | | |
| | | Principal
Amount
(000) | | | U.S. $ Value | |
| |
Southeast Energy Authority A Cooperative District
(Royal Bank of Canada)
Series 2023-B
5.00%, 01/01/2054(a) | | $ | 10,000 | | | $ | 10,518,649 | |
Southeast Energy Authority A Cooperative District
(Sumitomo Mitsui Financial Group, Inc.)
Series 2023-A
5.25%, 01/01/2054(a) | | | 20,000 | | | | 20,980,920 | |
| | | | | | | | |
| | | | | | | 117,218,199 | |
| | | | | | | | |
American Samoa – 0.3% | |
American Samoa Economic Development Authority
(Territory of American Samoa)
Series 2015-A
6.625%, 09/01/2035 | | | 7,095 | | | | 7,268,566 | |
| | | | | | | | |
|
Arizona – 2.7% | |
Arizona Industrial Development Authority
(BASIS Schools, Inc. Obligated Group)
Series 2017-D
5.00%, 07/01/2051(d) | | | 1,885 | | | | 1,782,040 | |
Arizona Industrial Development Authority
(Benjamin Franklin Charter School Obligated Group)
Series 2023
5.00%, 07/01/2043(d) | | | 1,000 | | | | 977,579 | |
Arizona Industrial Development Authority
(Equitable School Revolving Fund LLC Obligated Group)
Series 2021
4.00%, 11/01/2051(d) | | | 10,000 | | | | 8,479,408 | |
Arizona Industrial Development Authority
(Heritage Academy Laveen & Gateway Obligated Group)
Series 2021
5.00%, 07/01/2051(d) | | | 2,230 | | | | 1,942,529 | |
Arizona Industrial Development Authority
(KIPP NYC Public Charter Schools)
Series 2021-B
4.00%, 07/01/2061 | | | 2,000 | | | | 1,658,021 | |
Arizona Industrial Development Authority
(Legacy Cares, Inc.)
Series 2020
7.75%, 07/01/2050(e)(f)(g) | | | 10,420 | | | | 625,200 | |
| | |
| |
| abfunds.com | | AB MUNICIPAL INCOME FUND | 31 |
PORTFOLIO OF INVESTMENTS (continued)
AB HIGH INCOME MUNICIPAL PORTFOLIO
| | | | | | | | |
| | | Principal
Amount
(000) | | | U.S. $ Value | |
| |
Series 2021-A
5.50%, 07/01/2031(e)(f)(g) | | $ | 480 | | | $ | 28,800 | |
6.00%, 07/01/2051(e)(f)(g) | | | 3,000 | | | | 180,000 | |
Arizona Industrial Development Authority
(Pinecrest Academy of Nevada)
Series 2020-A
4.00%, 07/15/2050(d) | | | 1,000 | | | | 807,535 | |
Glendale Industrial Development Authority
(Beatitudes Campus Obligated Group (The))
Series 2017
5.00%, 11/15/2040 | | | 2,865 | | | | 2,463,130 | |
Industrial Development Authority of the City of Phoenix Arizona (The)
(BASIS Schools, Inc. Obligated Group)
Series 2015
5.00%, 07/01/2035(d) | | | 1,000 | | | | 1,004,225 | |
Industrial Development Authority of the City of Phoenix Arizona (The)
(GreatHearts Arizona Obligated Group)
Series 2014
5.00%, 07/01/2044 | | | 10,690 | | | | 10,689,364 | |
Industrial Development Authority of the County of Pima (The)
(Edkey, Inc. Obligated Group)
Series 2020
5.00%, 07/01/2040(d) | | | 5,000 | | | | 4,782,169 | |
5.00%, 07/01/2055(d) | | | 1,000 | | | | 892,138 | |
Industrial Development Authority of the County of Pima (The)
(La Posada at Park Centre, Inc. Obligated Group)
Series 2022
6.75%, 11/15/2042(d) | | | 3,250 | | | | 3,492,311 | |
6.875%, 11/15/2052(d) | | | 2,000 | | | | 2,120,026 | |
7.00%, 11/15/2057(d) | | | 1,000 | | | | 1,063,443 | |
Maricopa County Industrial Development Authority
(Benjamin Franklin Charter School Ltd.)
Series 2018
6.00%, 07/01/2038(d) | | | 2,000 | | | | 2,086,396 | |
Series 2018-A
6.00%, 07/01/2052(d) | | | 5,170 | | | | 5,277,143 | |
Maricopa County Industrial Development Authority
(Commercial Metals Co.)
Series 2022
4.00%, 10/15/2047(d) | | | 6,725 | | | | 5,888,025 | |
| | |
| |
32 | AB MUNICIPAL INCOME FUND | | abfunds.com |
PORTFOLIO OF INVESTMENTS (continued)
AB HIGH INCOME MUNICIPAL PORTFOLIO
| | | | | | | | |
| | | Principal
Amount
(000) | | | U.S. $ Value | |
| |
Maricopa County Industrial Development Authority
(HonorHealth Obligated Group)
Series 2024-D
5.00%, 12/01/2041(c) | | $ | 2,875 | | | $ | 3,031,875 | |
5.00%, 12/01/2042(c) | | | 1,025 | | | | 1,074,191 | |
5.00%, 12/01/2043(c) | | | 2,150 | | | | 2,244,868 | |
5.00%, 12/01/2044(c) | | | 2,750 | | | | 2,860,318 | |
5.00%, 12/01/2045(c) | | | 1,200 | | | | 1,246,064 | |
Maricopa County Industrial Development Authority
(Legacy Traditional School Obligated Group)
Series 2019
5.00%, 07/01/2049(d) | | | 1,000 | | | | 956,568 | |
Maricopa County Industrial Development Authority
(Morrison Education Group Obligated Group)
Series 2024-A
6.625%, 07/01/2059(d) | | | 2,000 | | | | 2,060,054 | |
6.75%, 07/01/2063(d) | | | 2,000 | | | | 2,068,452 | |
Maricopa County Industrial Development Authority
(Reid Traditional Schools Obligated Group)
Series 2016
5.00%, 07/01/2047 | | | 1,375 | | | | 1,348,170 | |
Sierra Vista Industrial Development Authority
(American Leadership Academy, Inc.)
Series 2023
5.75%, 06/15/2058(d) | | | 1,810 | | | | 1,819,525 | |
Tempe Industrial Development Authority
(Mirabella at ASU, Inc.)
Series 2017-A
6.125%, 10/01/2047(d) | | | 1,225 | | | | 751,850 | |
| | | | | | | | |
| | | | | | | 75,701,417 | |
| | | | | | | | |
Arkansas – 0.7% | |
Arkansas Development Finance Authority
(Hybar LLC)
Series 2023
6.875%, 07/01/2048(d) | | | 2,700 | | | | 2,922,212 | |
Series 2024
7.375%, 07/01/2048(d) | | | 13,000 | | | | 14,152,984 | |
| | |
| |
| abfunds.com | | AB MUNICIPAL INCOME FUND | 33 |
PORTFOLIO OF INVESTMENTS (continued)
AB HIGH INCOME MUNICIPAL PORTFOLIO
| | | | | | | | |
| | | Principal
Amount
(000) | | | U.S. $ Value | |
| |
Arkansas Development Finance Authority
(United States Steel Corp.)
Series 2022
5.45%, 09/01/2052 | | $ | 2,300 | | | $ | 2,336,238 | |
| | | | | | | | |
| | | | | | | 19,411,434 | |
| | | | | | | | |
California – 10.1% | |
ARC70 II TRUST
Series 2021
4.00%, 12/01/2059 | | | 3,000 | | | | 2,559,031 | |
Series 2023
4.84%, 04/01/2065(g)(h) | | | 19,084 | | | | 18,296,161 | |
California Community Choice Financing Authority
(American International Group, Inc.)
Series 2023-D
5.50%, 05/01/2054(a) | | | 10,000 | | | | 10,600,772 | |
California Community Choice Financing Authority
(Deutsche Bank AG)
Series 2023
5.25%, 01/01/2054 | | | 16,020 | | | | 16,742,015 | |
California Community Choice Financing Authority
(Morgan Stanley)
Series 2023
4.679% (SOFR + 1.63%), 07/01/2053(a)(b) | | | 10,000 | | | | 9,931,483 | |
California Community Housing Agency
(California Community Housing Agency Aster Apartments)
Series 2021-A
4.00%, 02/01/2056(d) | | | 5,200 | | | | 4,674,204 | |
California Community Housing Agency
(California Community Housing Agency Brio Apartments & Next on Lex Apartments)
Series 2021
4.00%, 02/01/2056(d) | | | 13,500 | | | | 11,160,274 | |
California Community Housing Agency
(California Community Housing Agency Fountains at Emerald Park)
Series 2021
3.00%, 08/01/2056(d) | | | 11,070 | | | | 7,850,281 | |
4.00%, 08/01/2046(d) | | | 3,305 | | | | 2,752,256 | |
| | |
| |
34 | AB MUNICIPAL INCOME FUND | | abfunds.com |
PORTFOLIO OF INVESTMENTS (continued)
AB HIGH INCOME MUNICIPAL PORTFOLIO
| | | | | | | | |
| | | Principal
Amount
(000) | | | U.S. $ Value | |
| |
California Community Housing Agency
(California Community Housing Agency Summit at Sausalito Apartments)
Series 2021
3.00%, 02/01/2057(d) | | $ | 5,000 | | | $ | 3,435,118 | |
California Community Housing Agency
(California Community Housing Agency Twin Creek Apartments)
Series 2022
Zero Coupon, 08/01/2065(d) | | | 32,000 | | | | 1,937,747 | |
5.50%, 02/01/2040(d) | | | 2,000 | | | | 1,876,028 | |
Series 2022-A
4.50%, 08/01/2052(d) | | | 6,000 | | | | 5,025,280 | |
California County Tobacco Securitization Agency
(Los Angeles County Securitization Corp.)
Series 2020-B
Zero Coupon, 06/01/2055 | | | 22,000 | | | | 3,819,143 | |
California Enterprise Development Authority
(Heights Christian Schools)
Series 2023
6.25%, 06/01/2053(d) | | | 1,000 | | | | 1,000,306 | |
California Infrastructure & Economic Development Bank
(WFCS Holdings II LLC)
Series 2021
Zero Coupon, 01/01/2061(d) | | | 995 | | | | 69,378 | |
Series 2021-A1
5.00%, 01/01/2056(d) | | | 1,990 | | | | 1,777,588 | |
California Municipal Finance Authority
(Azusa Pacific University)
Series 2015-B
5.00%, 04/01/2035 | | | 2,000 | | | | 1,952,654 | |
California Municipal Finance Authority
(Goodwill Industries of Sacramento Valley & Northern Nevada, Inc.)
Series 2012-A
6.625%, 01/01/2032(d) | | | 765 | | | | 745,892 | |
6.875%, 01/01/2042(d) | | | 3,415 | | | | 3,212,055 | |
Series 2014
5.00%, 01/01/2035 | | | 1,050 | | | | 890,711 | |
5.25%, 01/01/2045 | | | 2,025 | | | | 1,568,171 | |
California Municipal Finance Authority
(LAX Integrated Express Solutions LLC)
Series 2018
5.00%, 12/31/2043 | | | 3,000 | | | | 3,005,786 | |
| | |
| |
| abfunds.com | | AB MUNICIPAL INCOME FUND | 35 |
PORTFOLIO OF INVESTMENTS (continued)
AB HIGH INCOME MUNICIPAL PORTFOLIO
| | | | | | | | |
| | | Principal
Amount
(000) | | | U.S. $ Value | |
| |
California Municipal Finance Authority
(UTS Bioenergy LLC)
Series 2011-A1
7.50%, 12/01/2032(e)(f)(i) | | $ | 3,795 | | | $ | 75,900 | |
California Pollution Control Financing Authority
(Poseidon Resources Channelside LP)
Series 2012
5.00%, 11/21/2045(d) | | | 8,595 | | | | 8,604,831 | |
California Pollution Control Financing Authority
(Rialto Bioenergy Facility LLC)
Series 2019
7.50%, 12/01/2040(d)(e)(f) | | | 515 | | | | 38,625 | |
California Public Finance Authority
(Kendal at Ventura)
Series 2023
10.00%, 05/15/2028(d) | | | 200 | | | | 223,831 | |
California School Finance Authority
(ACE Charter Schools Obligated Group)
Series 2016
5.00%, 06/01/2052(d) | | | 3,790 | | | | 3,418,514 | |
California School Finance Authority
(Alliance for College Ready Public Schools Obligated Group)
Series 2016-A
5.00%, 07/01/2046(d) | | | 3,500 | | | | 3,497,468 | |
5.00%, 07/01/2051(d) | | | 1,750 | | | | 1,732,539 | |
California School Finance Authority
(Bright Star Schools Obligated Group)
Series 2017
5.00%, 06/01/2054(d) | | | 1,165 | | | | 1,110,635 | |
California School Finance Authority
(Downtown College Prep Obligated Group)
Series 2016
5.00%, 06/01/2046(d) | | | 1,000 | | | | 954,412 | |
California School Finance Authority
(KIPP SoCal Public Schools)
Series 2014-A
5.125%, 07/01/2044(d) | | | 2,850 | | | | 2,851,003 | |
California Statewide Communities Development Authority
(NCCD-Hooper Street LLC)
Series 2019
5.25%, 07/01/2052(d) | | | 1,000 | | | | 1,000,396 | |
| | |
| |
36 | AB MUNICIPAL INCOME FUND | | abfunds.com |
PORTFOLIO OF INVESTMENTS (continued)
AB HIGH INCOME MUNICIPAL PORTFOLIO
| | | | | | | | |
| | | Principal
Amount
(000) | | | U.S. $ Value | |
| |
CMFA Special Finance Agency
(CMFA Special Finance Agency Enclave)
Series 2022-A
4.00%, 08/01/2058(d) | | $ | 10,000 | | | $ | 7,712,057 | |
CMFA Special Finance Agency
(CMFA Special Finance Agency Latitude33)
Series 2021-A
3.00%, 12/01/2056(d) | | | 6,550 | | | | 4,553,339 | |
CMFA Special Finance Agency
(CMFA Special Finance Agency Solana at Grand)
Series 2021-A
4.00%, 08/01/2056(d) | | | 5,000 | | | | 4,296,576 | |
CMFA Special Finance Agency VIII Elan
Huntington Beach
Series 2021
3.00%, 08/01/2056(d) | | | 6,800 | | | | 4,710,349 | |
4.00%, 08/01/2047(d) | | | 2,905 | | | | 2,505,368 | |
CSCDA Community Improvement Authority
(CSCDA Community Improvement Authority 777 Place-Pomona)
Series 2021
3.25%, 05/01/2057(d) | | | 7,500 | | | | 5,224,586 | |
4.00%, 05/01/2057(d) | | | 10,000 | | | | 7,164,707 | |
CSCDA Community Improvement Authority
(CSCDA Community Improvement Authority 1818 Platinum Triangle-Anaheim)
Series 2021
3.25%, 04/01/2057(d) | | | 3,275 | | | | 2,358,196 | |
CSCDA Community Improvement Authority
(CSCDA Community Improvement Authority Acacia on Santa Rosa Creek)
Series 2021
4.00%, 10/01/2056(d) | | | 5,000 | | | | 4,259,032 | |
CSCDA Community Improvement Authority
(CSCDA Community Improvement Authority Altana Apartments)
Series 2021
4.00%, 10/01/2056(d) | | | 7,500 | | | | 5,752,619 | |
CSCDA Community Improvement Authority
(CSCDA Community Improvement Authority Millennium South Bay-Hawthorne)
Series 2021
3.25%, 07/01/2056(d) | | | 5,800 | | | | 3,980,949 | |
4.00%, 07/01/2058(d) | | | 7,360 | | | | 5,004,854 | |
| | |
| |
| abfunds.com | | AB MUNICIPAL INCOME FUND | 37 |
PORTFOLIO OF INVESTMENTS (continued)
AB HIGH INCOME MUNICIPAL PORTFOLIO
| | | | | | | | |
| | | Principal
Amount
(000) | | | U.S. $ Value | |
| |
CSCDA Community Improvement Authority
(CSCDA Community Improvement Authority Oceanaire Apartments)
Series 2021
4.00%, 09/01/2056(d) | | $ | 4,500 | | | $ | 3,360,819 | |
CSCDA Community Improvement Authority
(CSCDA Community Improvement Authority Park Crossing Apartments)
Series 2021
3.25%, 12/01/2058(d) | | | 5,500 | | | | 3,690,482 | |
CSCDA Community Improvement Authority
(CSCDA Community Improvement Authority Pasadena Portfolio)
Series 2021
3.00%, 12/01/2056(d) | | | 2,000 | | | | 1,390,332 | |
4.00%, 12/01/2056(d) | | | 9,600 | | | | 7,074,358 | |
CSCDA Community Improvement Authority
(CSCDA Community Improvement Authority The Crescent)
Series 2022
4.30%, 07/01/2059(d) | | | 10,000 | | | | 8,358,725 | |
CSCDA Community Improvement Authority
(CSCDA Community Improvement Authority Theo Apartments)
Series 2021
4.00%, 05/01/2057(d) | | | 1,000 | | | | 702,264 | |
CSCDA Community Improvement Authority
(CSCDA Community Improvement Authority Union South Bay)
Series 2021-A
3.10%, 07/01/2045(d) | | | 5,000 | | | | 4,155,339 | |
Series 2021-A2 4.00%, 07/01/2056(d) | | | 10,000 | | | | 7,628,349 | |
CSCDA Community Improvement Authority
(CSCDA Community Improvement Authority Waterscape Apartments)
Series 2021-A
3.00%, 09/01/2056(d) | | | 2,500 | | | | 1,709,397 | |
Golden State Tobacco Securitization Corp.
Series 2021-B
Zero Coupon, 06/01/2066 | | | 111,125 | | | | 12,103,290 | |
Hastings Campus Housing Finance Authority
Series 2020-A
5.00%, 07/01/2061(d) | | | 5,825 | | | | 5,297,951 | |
| | |
| |
38 | AB MUNICIPAL INCOME FUND | | abfunds.com |
PORTFOLIO OF INVESTMENTS (continued)
AB HIGH INCOME MUNICIPAL PORTFOLIO
| | | | | | | | |
| | | Principal
Amount
(000) | | | U.S. $ Value | |
| |
Los Angeles Unified School District/CA
Series 2024-A
5.00%, 07/01/2031 | | $ | 10,000 | | | $ | 11,167,995 | |
San Francisco Intl Airport
Series 2024
5.25%, 05/01/2041(c) | | | 10,000 | | | | 10,890,831 | |
Southern California Logistics Airport Authority
AGC Series 2006
5.00%, 12/01/2036 | | | 3,600 | | | | 3,628,127 | |
Tobacco Securitization Authority of Northern California
(Sacramento County Tobacco Securitization Corp.)
Series 2021
Zero Coupon, 06/01/2060 | | | 12,550 | | | | 1,950,111 | |
Tobacco Securitization Authority of Southern California
Series 2019
Zero Coupon, 06/01/2054 | | | 6,520 | | | | 1,259,905 | |
5.00%, 06/01/2039 | | | 680 | | | | 710,174 | |
Tobacco Securitization Authority of Southern California
(San Diego County Tobacco Asset Securitization Corp.)
Series 2006
Zero Coupon, 06/01/2046 | | | 5,465 | | | | 1,112,407 | |
| | | | | | | | |
| | | | | | | 282,103,976 | |
| | | | | | | | |
Colorado – 2.9% | | | | | | | | |
Aurora Highlands Community Authority Board
Series 2021-A
5.75%, 12/01/2051 | | | 10,000 | | | | 8,986,078 | |
Broadway Station Metropolitan District No. 3
Series 2019
5.00%, 12/01/2039 | | | 749 | | | | 643,401 | |
5.00%, 12/01/2049 | | | 1,750 | | | | 1,358,387 | |
Centerra Metropolitan District No. 1
Series 2017
5.00%, 12/01/2037(d) | | | 5,730 | | | | 5,455,075 | |
Series 2022
6.50%, 12/01/2053 | | | 1,000 | | | | 1,011,753 | |
Colorado Educational & Cultural Facilities Authority
(Aspen View Academy, Inc.)
Series 2021
4.00%, 05/01/2051 | | | 1,100 | | | | 928,077 | |
4.00%, 05/01/2061 | | | 1,250 | | | | 1,009,768 | |
| | |
| |
| abfunds.com | | AB MUNICIPAL INCOME FUND | 39 |
PORTFOLIO OF INVESTMENTS (continued)
AB HIGH INCOME MUNICIPAL PORTFOLIO
| | | | | | | | |
| | | Principal
Amount
(000) | | | U.S. $ Value | |
| |
Colorado Educational & Cultural Facilities Authority
(Lighthouse Building Corp.)
Series 2021
4.00%, 10/01/2061 | | $ | 1,500 | | | $ | 1,143,189 | |
Colorado Educational & Cultural Facilities Authority
(STEAD School (The))
Series 2023-A
7.00%, 07/01/2034(d) | | | 4,000 | | | | 4,037,081 | |
Colorado Educational & Cultural Facilities Authority
(STEM School Academy)
Series 2014
5.00%, 11/01/2044 | | | 890 | | | | 872,888 | |
5.125%, 11/01/2049 | | | 765 | | | | 746,824 | |
Colorado Health Facilities Authority
5.25%, 11/01/2038(a) | | | 2,200 | | | | 2,393,119 | |
5.25%, 11/01/2039(a) | | | 2,600 | | | | 2,825,798 | |
5.25%, 11/01/2052(a) | | | 5,000 | | | | 5,281,762 | |
Colorado Health Facilities Authority
(Aberdeen Ridge, Inc. Obligated Group)
Series 2021-A
5.00%, 05/15/2044 | | | 2,000 | | | | 1,385,465 | |
Colorado Health Facilities Authority
(Christian Living Neighborhoods Obligated Group)
Series 2021
4.00%, 01/01/2042 | | | 1,750 | | | | 1,497,231 | |
Colorado Health Facilities Authority
(CommonSpirit Health)
Series 2019-A
4.00%, 08/01/2038 | | | 735 | | | | 699,092 | |
Colorado Health Facilities Authority
(Frasier Meadows Manor, Inc. Obligated Group)
Series 2023-2
4.00%, 05/15/2041 | | | 1,175 | | | | 1,025,833 | |
Colorado Health Facilities Authority
(Sunny Vista Living Center)
Series 2015-A
6.125%, 12/01/2045(d) | | | 1,750 | | | | 1,181,216 | |
Douglas County Housing Partnership
(Bridgewater Castle Rock ALF LLC)
Series 2021
5.375%, 01/01/2041(e)(f)(g) | | | 10,000 | | | | 7,412,188 | |
| | |
| |
40 | AB MUNICIPAL INCOME FUND | | abfunds.com |
PORTFOLIO OF INVESTMENTS (continued)
AB HIGH INCOME MUNICIPAL PORTFOLIO
| | | | | | | | |
| | | Principal
Amount
(000) | | | U.S. $ Value | |
| |
Four Corners Business Improvement District
Series 2022
6.00%, 12/01/2052 | | $ | 1,000 | | | $ | 919,862 | |
Johnstown Plaza Metropolitan District
Series 2022
4.25%, 12/01/2046 | | | 9,363 | | | | 7,927,606 | |
Longs Peak Metropolitan District
Series 2021
5.25%, 12/01/2051(d) | | | 2,000 | | | | 1,918,038 | |
Meridian Ranch Metropolitan District 2018 Subdistrict
Series 2022
6.75%, 12/01/2052 | | | 1,500 | | | | 1,501,598 | |
Platte River Metropolitan District
Series 2023-A
6.50%, 08/01/2053(d) | | | 1,200 | | | | 1,221,027 | |
Plaza Metropolitan District No. 1
Series 2013
5.00%, 12/01/2040(d) | | | 1,000 | | | | 962,757 | |
Pueblo Urban Renewal Authority
Series 2021
4.75%, 12/01/2045(g) | | | 3,810 | | | | 2,542,801 | |
Riverwalk Metropolitan District No. 2
Series 2022-A
5.00%, 12/01/2042 | | | 3,000 | | | | 2,705,107 | |
5.00%, 12/01/2052 | | | 1,000 | | | | 865,547 | |
Sagebrush Farm Metropolitan District No. 1
Series 2022-A
6.75%, 12/01/2052 | | | 1,500 | | | | 1,483,276 | |
Spring Hill Metropolitan District No. 3
Series 2022-A
6.75%, 12/01/2052(d) | | | 333 | | | | 337,012 | |
STC Metropolitan District No. 2
Series 2019-A
5.00%, 12/01/2038 | | | 1,060 | | | | 1,001,029 | |
Sterling Ranch Community Authority Board
(Sterling Ranch Metropolitan District No. 3)
Series 2022
6.50%, 12/01/2042 | | | 2,000 | | | | 2,089,266 | |
6.75%, 12/01/2053 | | | 3,000 | | | | 3,120,074 | |
Series 2023
8.375%, 12/15/2054 | | | 1,000 | | | | 1,000,142 | |
Vauxmont Metropolitan District
AGM Series 2019
3.25%, 12/15/2050 | | | 185 | | | | 144,481 | |
| | |
| |
| abfunds.com | | AB MUNICIPAL INCOME FUND | 41 |
PORTFOLIO OF INVESTMENTS (continued)
AB HIGH INCOME MUNICIPAL PORTFOLIO
| | | | | | | | |
| | | Principal
Amount
(000) | | | U.S. $ Value | |
| |
AGM Series 2020
5.00%, 12/01/2027 | | $ | 195 | | | $ | 202,949 | |
5.00%, 12/01/2030 | | | 270 | | | | 288,031 | |
5.00%, 12/01/2050 | | | 205 | | | | 210,491 | |
Verve Metropolitan District No. 1
Series 2023
6.50%, 12/01/2043 | | | 1,000 | | | | 934,507 | |
6.75%, 12/01/2052 | | | 1,000 | | | | 942,450 | |
| | | | | | | | |
| | | | | | | 82,212,276 | |
| | | | | | | | |
Connecticut – 0.1% | | | | | | | | |
Connecticut State Health & Educational Facilities Authority
(Hartford HealthCare Obligated Group)
Series 2020-A
4.00%, 07/01/2036 | | | 500 | | | | 496,804 | |
Town of Hamden CT
(Whitney Center, Inc. Obligated Group)
Series 2022-A
7.00%, 01/01/2053 | | | 1,000 | | | | 1,066,225 | |
| | | | | | | | |
| | | | | | | 1,563,029 | |
| | | | | | | | |
District of Columbia – 0.8% | | | | | | | | |
District of Columbia
(District of Columbia Union Market TIF Area)
Series 2024
0.00%, 06/01/2041(d)(j) | | | 1,000 | | | | 558,478 | |
0.00%, 06/01/2049(d)(j) | | | 1,600 | | | | 878,468 | |
Series 2024-A
5.125%, 06/01/2034(d) | | | 2,720 | | | | 2,669,365 | |
District of Columbia
(KIPP DC Obligated Group)
Series 2017-A
5.00%, 07/01/2042 | | | 1,000 | | | | 1,017,447 | |
District of Columbia
(Rocketship DC Obligated Group)
Series 2019
5.00%, 06/01/2039(d) | | | 1,425 | | | | 1,422,166 | |
Series 2021
5.00%, 06/01/2061(d) | | | 1,000 | | | | 898,859 | |
District of Columbia Tobacco Settlement Financing Corp.
Series 2006
Zero Coupon, 06/15/2055 | | | 140,500 | | | | 14,276,588 | |
| | | | | | | | |
| | | | | | | 21,721,371 | |
| | | | | | | | |
| | |
| |
42 | AB MUNICIPAL INCOME FUND | | abfunds.com |
PORTFOLIO OF INVESTMENTS (continued)
AB HIGH INCOME MUNICIPAL PORTFOLIO
| | | | | | | | |
| | | Principal
Amount
(000) | | | U.S. $ Value | |
| |
Florida – 5.0% | |
Alachua County Health Facilities Authority
(Oak Hammock at the University of Florida Obligated Group)
Series 2022
4.00%, 10/01/2040 | | $ | 2,400 | | | $ | 2,095,161 | |
4.00%, 10/01/2046 | | | 1,750 | | | | 1,418,611 | |
Align Affordable Housing Bond Fund LP
(SHI – Lake Worth LLC)
Series 2021
3.25%, 12/01/2051(d) | | | 15,000 | | | | 13,231,095 | |
Bexley Community Development District
Series 2016
4.875%, 05/01/2047 | | | 2,050 | | | | 1,929,459 | |
Cape Coral Health Facilities Authority
(Gulf Care, Inc. Obligated Group)
Series 2015
6.00%, 07/01/2050(d) | | | 1,550 | | | | 1,094,587 | |
Capital Projects Finance Authority/FL
(CAPFA Capital Corp. 2000F)
Series 2020-A
5.00%, 10/01/2028 | | | 1,300 | | | | 1,321,051 | |
5.00%, 10/01/2032 | | | 1,000 | | | | 1,017,649 | |
Capital Projects Finance Authority/FL
(IDEA Lakeland)
Series 2023
7.00%, 06/15/2030(d) | | | 3,000 | | | | 3,116,874 | |
Capital Trust Agency, Inc.
(Aviva Senior Life)
Series 2017
5.00%, 07/01/2046(d) | | | 1,500 | | | | 1,081,850 | |
Capital Trust Agency, Inc.
(Educational Growth Fund LLC)
Series 2021
Zero Coupon, 07/01/2061(d) | | | 27,000 | | | | 1,735,403 | |
3.375%, 07/01/2031(d) | | | 1,000 | | | | 946,943 | |
5.00%, 07/01/2056(d) | | | 11,500 | | | | 10,612,796 | |
Capital Trust Agency, Inc.
(Southeastern University Obligated Group)
Series 2023
6.25%, 05/01/2048(d) | | | 1,000 | | | | 1,008,459 | |
6.375%, 05/01/2053(d) | | | 1,000 | | | | 1,011,474 | |
| | |
| |
| abfunds.com | | AB MUNICIPAL INCOME FUND | 43 |
PORTFOLIO OF INVESTMENTS (continued)
AB HIGH INCOME MUNICIPAL PORTFOLIO
| | | | | | | | |
| | | Principal
Amount
(000) | | | U.S. $ Value | |
| |
Capital Trust Agency, Inc.
(Team Success A School of Excellence, Inc.)
Series 2020
5.00%, 06/01/2045(d) | | $ | 1,000 | | | $ | 915,476 | |
5.00%, 06/01/2055(d) | | | 2,000 | | | | 1,761,874 | |
Capital Trust Authority
(IDEA Florida, Inc.)
Series 2023-A
6.375%, 06/15/2058(d) | | | 2,000 | | | | 2,078,881 | |
City of Tampa FL
(State of Florida Cigarette Tax Revenue)
Series 2020-A
Zero Coupon, 09/01/2039 | | | 850 | | | | 417,163 | |
Zero Coupon, 09/01/2042 | | | 1,000 | | | | 413,027 | |
Zero Coupon, 09/01/2049 | | | 1,000 | | | | 275,286 | |
Zero Coupon, 09/01/2053 | | | 1,400 | | | | 307,211 | |
County of Lake FL
(Waterman Communities, Inc.)
Series 2020
5.50%, 08/15/2040 | | | 3,000 | | | | 2,784,059 | |
County of Osceola FL Transportation Revenue
Series 2020-A
Zero Coupon, 10/01/2035 | | | 250 | | | | 148,967 | |
Zero Coupon, 10/01/2036 | | | 410 | | | | 229,066 | |
Zero Coupon, 10/01/2037 | | | 230 | | | | 121,560 | |
Zero Coupon, 10/01/2038 | | | 315 | | | | 156,558 | |
Zero Coupon, 10/01/2039 | | | 390 | | | | 180,673 | |
County of Palm Beach FL
(Provident Group-PBAU Properties LLC)
Series 2019
5.00%, 04/01/2039(d) | | | 1,000 | | | | 1,005,039 | |
5.00%, 04/01/2051(d) | | | 1,970 | | | | 1,896,663 | |
Escambia County Housing Finance Authority (4900 S. Rio Grande Avenue LP)
Series 2023-A
6.88%, 11/01/2053(d) | | | 1,000 | | | | 1,078,043 | |
Series 2023-B
6.45%, 05/01/2027(d) | | | 2,755 | | | | 2,816,273 | |
Florida Development Finance Corp.
(Assistance Unlimited, Inc.)
Series 2022
6.00%, 08/15/2057(d) | | | 3,900 | | | | 3,792,899 | |
| | |
| |
44 | AB MUNICIPAL INCOME FUND | | abfunds.com |
PORTFOLIO OF INVESTMENTS (continued)
AB HIGH INCOME MUNICIPAL PORTFOLIO
| | | | | | | | |
| | | Principal
Amount
(000) | | | U.S. $ Value | |
| |
Florida Development Finance Corp.
(Brightline Trains Florida LLC)
Series 2024
5.00%, 07/01/2037 | | $ | 1,000 | | | $ | 1,036,984 | |
5.00%, 07/01/2038 | | | 1,000 | | | | 1,034,669 | |
5.25%, 07/01/2047 | | | 2,000 | | | | 2,057,543 | |
5.50%, 07/01/2053 | | | 3,000 | | | | 3,117,929 | |
Florida Development Finance Corp.
(Drs Kiran & Pallavi Patel 2017 Foundation for Global Understanding, Inc.)
Series 2021
3.00%, 07/01/2031(d) | | | 990 | | | | 905,870 | |
4.00%, 07/01/2051(d) | | | 1,950 | | | | 1,605,825 | |
Florida Development Finance Corp.
(IDEA Florida, Inc.)
Series 2022
5.25%, 06/15/2029(d) | | | 1,000 | | | | 1,019,287 | |
Florida Development Finance Corp.
(Mater Academy, Inc.)
Series 2020-A
5.00%, 06/15/2050 | | | 5,705 | | | | 5,639,365 | |
5.00%, 06/15/2055 | | | 3,275 | | | | 3,184,091 | |
Florida Development Finance Corp.
(Parrish Charter Academy)
Series 2023
6.25%, 04/23/2058(d) | | | 2,365 | | | | 2,353,714 | |
Florida Development Finance Corp.
(Seaside School Consortium, Inc.)
Series 2022
6.00%, 06/15/2057 | | | 2,000 | | | | 2,040,690 | |
Florida Development Finance Corp.
(SFP – Tampa I LLC)
Series 2024
6.50%, 06/01/2059(c)(d) | | | 1,200 | | | | 1,201,735 | |
Series 2024-A
5.00%, 06/01/2044(c)(d) | | | 1,000 | | | | 998,741 | |
5.25%, 06/01/2054(c)(d) | | | 1,050 | | | | 1,051,612 | |
5.25%, 06/01/2059(c)(d) | | | 1,000 | | | | 995,230 | |
Florida Higher Educational Facilities Financial Authority
(Ringling College of Art and Design, Inc.)
Series 2019
5.00%, 03/01/2044 | | | 795 | | | | 799,879 | |
5.00%, 03/01/2049 | | | 3,375 | | | | 3,378,177 | |
| | |
| |
| abfunds.com | | AB MUNICIPAL INCOME FUND | 45 |
PORTFOLIO OF INVESTMENTS (continued)
AB HIGH INCOME MUNICIPAL PORTFOLIO
| | | | | | | | |
| | | Principal
Amount
(000) | | | U.S. $ Value | |
| |
Hillsborough County Aviation Authority
Series 2018-F
5.00%, 10/01/2048 | | $ | 10,000 | | | $ | 10,331,746 | |
Lee County Industrial Development Authority/FL
(Cypress Cove at Healthpark Florida Obligated Group)
Series 2022
5.25%, 10/01/2057 | | | 3,000 | | | | 2,515,972 | |
Miami-Dade County Housing Finance Authority
(Wynwood Works LLC)
Series 2023-A
5.70%, 06/01/2052(d) | | | 1,500 | | | | 1,517,018 | |
Series 2023-B
5.78%, 06/01/2027(d) | | | 1,000 | | | | 1,003,200 | |
Miami-Dade County Industrial Development Authority
(AcadeMir Charter School Middle & Preparatory Academy Obligated Group)
Series 2022
5.25%, 07/01/2052(d) | | | 1,000 | | | | 956,809 | |
5.50%, 07/01/2061(d) | | | 1,000 | | | | 976,355 | |
North Broward Hospital District
Series 2017-B
5.00%, 01/01/2037 | | | 7,235 | | | | 7,447,040 | |
Orange County Health Facilities Authority
(Presbyterian Retirement Communities, Inc. Obligated Group)
Series 2023
4.00%, 08/01/2042 | | | 5,000 | | | | 4,409,836 | |
Palm Beach County Educational Facilities Authority
(Palm Beach Atlantic University Obligated Group)
Series 2021
4.00%, 10/01/2041 | | | 1,000 | | | | 922,194 | |
4.00%, 10/01/2051 | | | 1,815 | | | | 1,565,952 | |
Palm Beach County Health Facilities Authority
(Federation CCRC Operations Corp. Obligated Group)
Series 2022
4.25%, 06/01/2056 | | | 2,100 | | | | 1,664,566 | |
| | |
| |
46 | AB MUNICIPAL INCOME FUND | | abfunds.com |
PORTFOLIO OF INVESTMENTS (continued)
AB HIGH INCOME MUNICIPAL PORTFOLIO
| | | | | | | | |
| | | Principal
Amount
(000) | | | U.S. $ Value | |
| |
Palm Beach County Health Facilities Authority
(Green Cay Life Plan Village, Inc.)
Series 2022
11.50%, 07/01/2027(d) | | $ | 1,000 | | | $ | 1,196,009 | |
Polk County Industrial Development Authority
(Mineral Development LLC)
Series 2020
5.875%, 01/01/2033(d) | | | 1,905 | | | | 1,821,072 | |
Sarasota County Health Facilities Authority
(Village On the Isle)
Series 2017-A
5.00%, 01/01/2047 | | | 2,450 | | | | 2,245,223 | |
5.00%, 01/01/2052 | | | 4,500 | | | | 4,013,017 | |
Village Community Development District No. 13
(Village Community Development Dist No. 13 Phase II Series 2020 Special Assmnts)
Series 2020
3.50%, 05/01/2051(d) | | | 1,935 | | | | 1,534,221 | |
Village Community Development District No. 13
(Village Community Development District No. 13 Phase III Series 2020 Special Assmnts)
Series 2021
1.80%, 05/01/2026 | | | 195 | | | | 187,225 | |
Village Community Development District No. 15
(Village Community Development District No. 15 Series 2023 Phase I Special Assmnts)
Series 2023
5.25%, 05/01/2054(d) | | | 1,000 | | | | 1,020,003 | |
| | | | | | | | |
| | | | | | | 139,748,929 | |
| | | | | | | | |
Georgia – 2.8% | | | | | | | | |
DeKalb County Housing Authority
(HADC Avenues LLC)
Series 2023
6.17%, 06/01/2053(d) | | | 8,625 | | | | 8,684,375 | |
7.00%, 06/01/2041(d) | | | 2,000 | | | | 2,013,339 | |
| | |
| |
| abfunds.com | | AB MUNICIPAL INCOME FUND | 47 |
PORTFOLIO OF INVESTMENTS (continued)
AB HIGH INCOME MUNICIPAL PORTFOLIO
| | | | | | | | |
| | | Principal
Amount
(000) | | | U.S. $ Value | |
| |
Glynn-Brunswick Memorial Hospital Authority
(Southeast Georgia Health System Obligated Group)
Series 2017
5.00%, 08/01/2043 | | $ | 1,000 | | | $ | 981,262 | |
5.00%, 08/01/2047 | | | 1,650 | | | | 1,584,711 | |
Main Street Natural Gas, Inc.
(Citadel LP)
Series 2022-C
4.00%, 08/01/2052(d) | | | 12,250 | | | | 12,036,389 | |
Main Street Natural Gas, Inc.
(Citigroup, Inc.)
Series 2023-A
5.00%, 06/01/2053 | | | 10,000 | | | | 10,442,870 | |
Series 2023-D
5.00%, 05/01/2054(a) | | | 10,000 | | | | 10,455,685 | |
Main Street Natural Gas, Inc.
(Royal Bank of Canada)
Series 2023
5.264% (SOFR + 1.70%), 12/01/2053(b) | | | 10,000 | | | | 10,058,246 | |
Series 2023-B
5.00%, 07/01/2053(a) | | | 10,000 | | | | 10,505,533 | |
Municipal Electric Authority of Georgia
Series 2019
5.00%, 01/01/2038 | | | 715 | | | | 735,877 | |
5.00%, 01/01/2039 | | | 780 | | | | 798,966 | |
5.00%, 01/01/2049 | | | 4,000 | | | | 4,037,993 | |
Series 2022
5.50%, 07/01/2063 | | | 6,500 | | | | 6,763,890 | |
| | | | | | | | |
| | | | | | | 79,099,136 | |
| | | | | | | | |
Guam – 0.6% | |
Guam Power Authority
Series 2022-A
5.00%, 10/01/2042 | | | 6,500 | | | | 6,643,544 | |
5.00%, 10/01/2043 | | | 1,000 | | | | 1,018,281 | |
Territory of Guam
Series 2019
5.00%, 11/15/2031 | | | 745 | | | | 748,763 | |
Territory of Guam
(Guam Section 30 Income Tax)
Series 2016-A
5.00%, 12/01/2046 | | | 4,365 | | | | 4,344,473 | |
| | |
| |
48 | AB MUNICIPAL INCOME FUND | | abfunds.com |
PORTFOLIO OF INVESTMENTS (continued)
AB HIGH INCOME MUNICIPAL PORTFOLIO
| | | | | | | | |
| | | Principal
Amount
(000) | | | U.S. $ Value | |
| |
Territory of Guam
(Territory of Guam Business Privilege Tax)
Series 2021-F
4.00%, 01/01/2036 | | $ | 5,000 | | | $ | 4,898,628 | |
| | | | | | | | |
| | | | | | | 17,653,689 | |
| | | | | | | | |
Idaho – 0.3% | | | | | | | | |
Idaho Health Facilities Authority
(North Canyon Medical Center, Inc.)
Series 2023
7.125%, 11/01/2057 | | | 3,000 | | | | 3,065,118 | |
Idaho Housing & Finance Association
(Battelle Energy Alliance LLC)
Series 2010-A
7.00%, 02/01/2036 | | | 4,000 | | | | 4,006,687 | |
| | | | | | | | |
| | | | | | | 7,071,805 | |
| | | | | | | | |
Illinois – 4.8% | | | | | | | | |
Chicago Board of Education
Series 2015-C
5.25%, 12/01/2035 | | | 5,405 | | | | 5,406,424 | |
Series 2016-A
7.00%, 12/01/2044 | | | 3,095 | | | | 3,195,216 | |
Series 2017-A
7.00%, 12/01/2046(d) | | | 4,975 | | | | 5,352,912 | |
Series 2017-B
6.75%, 12/01/2030(d) | | | 11,365 | | | | 12,416,230 | |
7.00%, 12/01/2042(d) | | | 2,400 | | | | 2,596,685 | |
Series 2018-A
5.00%, 12/01/2032 | | | 4,800 | | | | 4,959,418 | |
Series 2019-B
5.00%, 12/01/2030 | | | 425 | | | | 442,076 | |
5.00%, 12/01/2031 | | | 750 | | | | 780,024 | |
5.00%, 12/01/2032 | | | 310 | | | | 322,308 | |
5.00%, 12/01/2033 | | | 290 | | | | 301,072 | |
Series 2023-A
5.875%, 12/01/2047 | | | 5,000 | | | | 5,441,807 | |
6.00%, 12/01/2049 | | | 5,000 | | | | 5,473,182 | |
Chicago O’Hare International Airport
Series 2022
5.50%, 01/01/2055(a) | | | 10,000 | | | | 10,579,752 | |
City of Chicago IL
Series 2015-B
5.00%, 01/01/2025 | | | 400 | | | | 402,015 | |
Series 2016-C
5.00%, 01/01/2038 | | | 90 | | | | 90,361 | |
| | |
| |
| abfunds.com | | AB MUNICIPAL INCOME FUND | 49 |
PORTFOLIO OF INVESTMENTS (continued)
AB HIGH INCOME MUNICIPAL PORTFOLIO
| | | | | | | | |
| | | Principal
Amount
(000) | | | U.S. $ Value | |
| |
City of Chicago IL
(Goldblatts Supportive Living Project)
Series 2013
6.375%, 12/01/2052(e)(f) | | $ | 7,950 | | | $ | 4,658,357 | |
Eastern Illinois Economic Development Authority
(City of Mattoon IL Sales & Hotel Tax)
Series 2023
6.00%, 05/01/2046 | | | 2,000 | | | | 1,984,367 | |
Illinois Finance Authority
(Acero Charter Schools, Inc. Obligated Group)
Series 2021
4.00%, 10/01/2042(d) | | | 1,000 | | | | 827,481 | |
Illinois Finance Authority
(Bradley University)
Series 2021-A
4.00%, 08/01/2043 | | | 1,190 | | | | 1,078,349 | |
4.00%, 08/01/2046 | | | 2,000 | | | | 1,766,815 | |
Illinois Finance Authority
(CHF-Chicago LLC)
Series 2017-A
5.00%, 02/15/2047 | | | 1,790 | | | | 1,719,442 | |
5.00%, 02/15/2050 | | | 1,240 | | | | 1,173,049 | |
Illinois Finance Authority
(Illinois Institute of Technology)
Series 2019
4.00%, 09/01/2035 | | | 400 | | | | 351,408 | |
4.00%, 09/01/2037 | | | 520 | | | | 437,757 | |
4.00%, 09/01/2039 | | | 1,000 | | | | 814,288 | |
4.00%, 09/01/2041 | | | 1,000 | | | | 790,946 | |
5.00%, 09/01/2036 | | | 540 | | | | 516,185 | |
5.00%, 09/01/2038 | | | 1,000 | | | | 933,347 | |
5.00%, 09/01/2040 | | | 1,500 | | | | 1,373,918 | |
Illinois Finance Authority
(LRS Holdings LLC)
Series 2023
7.375%, 09/01/2042(d) | | | 5,500 | | | | 5,930,829 | |
Illinois Finance Authority
(Park Place of Elmhurst Obligated Group)
Series 2021
5.125%, 05/15/2060 | | | 11,530 | | | | 6,121,101 | |
Illinois Finance Authority
(Rosalind Franklin University of Medicine & Science)
Series 2017-C
5.00%, 08/01/2049 | | | 1,075 | | | | 1,069,495 | |
| | |
| |
50 | AB MUNICIPAL INCOME FUND | | abfunds.com |
PORTFOLIO OF INVESTMENTS (continued)
AB HIGH INCOME MUNICIPAL PORTFOLIO
| | | | | | | | |
| | | Principal
Amount
(000) | | | U.S. $ Value | |
| |
Illinois Housing Development Authority
(Drexel Court & Lake Park East)
Series 2022
7.17%, 11/01/2038 | | $ | 600 | | | $ | 613,859 | |
Metropolitan Pier & Exposition Authority
Series 2012
Zero Coupon, 12/15/2041 | | | 24,500 | | | | 10,504,422 | |
Zero Coupon, 12/15/2050 | | | 19,675 | | | | 4,834,992 | |
State of Illinois
Series 2010
7.35%, 07/01/2035 | | | 6,429 | | | | 6,894,119 | |
Village of Antioch IL Special Service Areas No. 1 & 2
Series 2016-A
4.50%, 03/01/2033 | | | 7,314 | | | | 6,776,271 | |
Series 2016-B
7.00%, 03/01/2033 | | | 3,344 | | | | 3,222,632 | |
Village of Pingree Grove IL Special Service Area No. 7
Series 2015
4.50%, 03/01/2025 | | | 526 | | | | 523,625 | |
5.00%, 03/01/2036 | | | 8,950 | | | | 8,584,252 | |
Series 2015-B
6.00%, 03/01/2036 | | | 2,380 | | | | 2,381,529 | |
| | | | | | | | |
| | | | | | | 133,642,317 | |
| | | | | | | | |
Indiana – 2.5% | | | | | | | | |
City of Valparaiso IN
(Green Oaks of Valparaiso LLC)
Series 2021
5.375%, 12/01/2041(d) | | | 3,350 | | | | 2,627,053 | |
City of Valparaiso IN
(Pratt Paper IN LLC)
Series 2024
4.875%, 01/01/2044(d) | | | 1,000 | | | | 1,018,745 | |
5.00%, 01/01/2054(d) | | | 2,000 | | | | 2,039,585 | |
City of Whiting IN
(BP PLC)
Series 2023
4.40%, 11/01/2045 | | | 8,000 | | | | 7,913,818 | |
Indiana Finance Authority
(Brightmark Plastics Renewal Indiana LLC)
Series 2019
7.00%, 03/01/2039(g) | | | 17,575 | | | | 12,179,635 | |
| | |
| |
| abfunds.com | | AB MUNICIPAL INCOME FUND | 51 |
PORTFOLIO OF INVESTMENTS (continued)
AB HIGH INCOME MUNICIPAL PORTFOLIO
| | | | | | | | |
| | | Principal
Amount
(000) | | | U.S. $ Value | |
| |
Indiana Finance Authority
(CWA Authority, Inc.)
Series 2024
5.00%, 10/01/2031(c) | | $ | 3,100 | | | $ | 3,417,894 | |
Indiana Finance Authority
(Good Samaritan Hospital Obligated Group)
Series 2022
4.00%, 04/01/2038 | | | 2,045 | | | | 1,855,921 | |
4.00%, 04/01/2040 | | | 2,215 | | | | 1,926,496 | |
Indiana Finance Authority
(Greencroft Goshen Obligated Group)
Series 2023-2
4.00%, 11/15/2026 | | | 1,000 | | | | 976,961 | |
4.00%, 11/15/2027 | | | 1,000 | | | | 972,654 | |
4.00%, 11/15/2030 | | | 1,000 | | | | 965,195 | |
Indiana Finance Authority
(Marquette Manor)
Series 2015-A
5.00%, 03/01/2039 | | | 2,675 | | | | 2,628,269 | |
Indiana Finance Authority
(Ohio Valley Electric Corp.)
Series 2020
3.00%, 11/01/2030 | | | 5,145 | | | | 4,754,779 | |
Series 2021-B
2.50%, 11/01/2030 | | | 4,025 | | | | 3,543,980 | |
Indiana Finance Authority
(University of Evansville)
Series 2022
5.25%, 09/01/2057 | | | 5,000 | | | | 4,861,253 | |
Indianapolis Local Public Improvement Bond Bank
(Pan Am Plaza Hotel)
Series 2023
5.75%, 03/01/2043 | | | 2,000 | | | | 2,175,779 | |
6.00%, 03/01/2053 | | | 5,000 | | | | 5,411,292 | |
Series 2023-F
7.75%, 03/01/2067 | | | 4,075 | | | | 4,320,712 | |
BAM Series 2023
5.25%, 03/01/2067 | | | 5,000 | | | | 5,251,317 | |
| | | | | | | | |
| | | | | | | 68,841,338 | |
| | | | | | | | |
Iowa – 0.7% | | | | | | | | |
Iowa Finance Authority
(Iowa Fertilizer Co., LLC)
Series 2022
5.00%, 12/01/2050 | | | 6,090 | | | | 6,331,451 | |
| | |
| |
52 | AB MUNICIPAL INCOME FUND | | abfunds.com |
PORTFOLIO OF INVESTMENTS (continued)
AB HIGH INCOME MUNICIPAL PORTFOLIO
| | | | | | | | |
| | | Principal
Amount
(000) | | | U.S. $ Value | |
| |
Iowa Finance Authority
(Wesley Retirement Services, Inc. Obligated Group)
Series 2021
4.00%, 12/01/2031 | | $ | 1,790 | | | $ | 1,654,923 | |
4.00%, 12/01/2041 | | | 3,400 | | | | 2,739,340 | |
4.00%, 12/01/2046 | | | 2,275 | | | | 1,733,443 | |
4.00%, 12/01/2051 | | | 4,060 | | | | 2,981,720 | |
Iowa Higher Education Loan Authority
(Simpson College)
Series 2020
5.50%, 11/01/2051 | | | 5,000 | | | | 4,556,698 | |
| | | | | | | | |
| | | | | | | 19,997,575 | |
| | | | | | | | |
Kansas – 0.4% | |
City of Colby KS
(Citizens Medical Center, Inc.)
Series 2024
5.50%, 07/01/2026 | | | 5,000 | | | | 4,974,025 | |
Overland Park Development Corp.
(City of Overland Park KS)
Series 2019
5.00%, 03/01/2037 | | | 1,000 | | | | 982,931 | |
5.00%, 03/01/2039 | | | 1,070 | | | | 1,038,004 | |
5.00%, 03/01/2044 | | | 655 | | | | 620,946 | |
5.00%, 03/01/2049 | | | 3,835 | | | | 3,540,276 | |
| | | | | | | | |
| | | | | | | 11,156,182 | |
| | | | | | | | |
Kentucky – 2.1% | | | | | | | | |
City of Ashland KY
(Royal Blue Health LLC Obligated Group)
Series 2019
4.00%, 02/01/2038 | | | 745 | | | | 693,596 | |
City of Henderson KY
(Pratt Paper KY LLC)
Series 2022
4.70%, 01/01/2052(d) | | | 7,000 | | | | 6,978,279 | |
Kentucky Economic Development Finance Authority
(Masonic Homes of Kentucky, Inc. Obligated Group)
Series 2012
5.375%, 11/15/2042 | | | 7,765 | | | | 6,269,201 | |
5.50%, 11/15/2045 | | | 2,350 | | | | 1,873,481 | |
Series 2016-A
5.00%, 05/15/2046 | | | 4,500 | | | | 3,415,900 | |
5.00%, 05/15/2051 | | | 3,500 | | | | 2,573,011 | |
| | |
| |
| abfunds.com | | AB MUNICIPAL INCOME FUND | 53 |
PORTFOLIO OF INVESTMENTS (continued)
AB HIGH INCOME MUNICIPAL PORTFOLIO
| | | | | | | | |
| | | Principal
Amount
(000) | | | U.S. $ Value | |
| |
Kentucky Economic Development Finance Authority
(Owensboro Health, Inc. Obligated Group)
Series 2017-A
5.00%, 06/01/2037 | | $ | 4,045 | | | $ | 4,090,802 | |
5.25%, 06/01/2041 | | | 3,650 | | | | 3,672,310 | |
Kentucky Economic Development Finance Authority
(Rosedale Green)
Series 2015
5.75%, 11/15/2050 | | | 2,650 | | | | 2,281,644 | |
Kentucky Housing Corp.
(Churchill Park LLLP)
Series 2022-A
4.65%, 05/01/2025(d) | | | 1,105 | | | | 1,103,787 | |
5.75%, 11/01/2040(d) | | | 5,130 | | | | 5,177,932 | |
Series 2022-B
6.75%, 11/01/2040(d) | | | 850 | | | | 857,581 | |
Kentucky Public Energy Authority
(Goldman Sachs Group, Inc. (The))
Series 2024-A
5.00%, 05/01/2055 | | | 10,000 | | | | 10,448,381 | |
Kentucky Public Energy Authority
(Morgan Stanley)
Series 2022-A
4.00%, 08/01/2052 | | | 10,000 | | | | 9,856,377 | |
Louisville/Jefferson County Metropolitan Government
(Norton Healthcare Obligated Group)
Series 2020-A
5.00%, 10/01/2038 | | | 370 | | | | 381,899 | |
| | | | | | | | |
| | | | | | | 59,674,181 | |
| | | | | | | | |
Louisiana – 1.0% | |
Louisiana Local Government Environmental Facilities & Community Development Auth
(St. James Place of Baton Rouge)
Series 2015-A
6.25%, 11/15/2045 | | | 7,625 | | | | 7,380,098 | |
Louisiana Local Government Environmental Facilities & Community Development Auth
(Woman’s Hospital Foundation)
Series 2017
5.00%, 10/01/2041 | | | 5,000 | | | | 5,081,610 | |
| | |
| |
54 | AB MUNICIPAL INCOME FUND | | abfunds.com |
PORTFOLIO OF INVESTMENTS (continued)
AB HIGH INCOME MUNICIPAL PORTFOLIO
| | | | | | | | |
| | | Principal
Amount
(000) | | | U.S. $ Value | |
| |
Louisiana Public Facilities Authority
(Louisiana Pellets, Inc.)
Series 2013-B
10.50%, 07/01/2039(e)(f) | | $ | 7,250 | | | $ | 72 | |
Series 2014-A
8.375%, 07/01/2039(e)(f) | | | 17,000 | | | | 170 | |
Louisiana Public Facilities Authority
(Louisiana State University & Agricultural & Mechanical College Lease)
Series 2016-A
5.00%, 07/01/2051 | | | 10,000 | | | | 10,022,602 | |
Louisiana Public Facilities Authority
(Pre-refunded – US Govt Agencies)
Series 2016
5.00%, 05/15/2047 (Pre-refunded/ETM) | | | 25 | | | | 25,624 | |
Parish of St. James LA
(NuStar Logistics LP)
Series 2020-2
6.35%, 07/01/2040(d) | | | 955 | | | | 1,037,295 | |
St. Tammany Parish Finance Authority
(Christwood)
Series 2015
5.25%, 11/15/2037 | | | 4,600 | | | | 4,357,587 | |
| | | | | | | | |
| | | | | | | 27,905,058 | |
| | | | | | | | |
Maine – 0.3% | |
Finance Authority of Maine
(Casella Waste Systems, Inc.)
Series 2017
5.25%, 01/01/2025(d) | | | 7,270 | | | | 7,286,056 | |
| | | | | | | | |
| | |
Maryland – 2.0% | | | | | | | | |
City of Westminster MD
(Lutheran Village at Miller’s Grant, Inc. (The))
Series 2014-A
6.00%, 07/01/2034 | | | 1,500 | | | | 1,500,550 | |
6.125%, 07/01/2039 | | | 750 | | | | 750,066 | |
6.25%, 07/01/2044 | | | 2,000 | | | | 1,999,888 | |
Maryland Health & Higher Educational Facilities Authority
(Adventist Healthcare Obligated Group)
Series 2021
5.00%, 01/01/2025 | | | 475 | | | | 475,702 | |
5.00%, 01/01/2026 | | | 495 | | | | 498,418 | |
5.00%, 01/01/2027 | | | 430 | | | | 434,724 | |
5.00%, 01/01/2028 | | | 300 | | | | 304,803 | |
| | |
| |
| abfunds.com | | AB MUNICIPAL INCOME FUND | 55 |
PORTFOLIO OF INVESTMENTS (continued)
AB HIGH INCOME MUNICIPAL PORTFOLIO
| | | | | | | | |
| | | Principal
Amount
(000) | | | U.S. $ Value | |
| |
5.00%, 01/01/2029 | | $ | 290 | | | $ | 296,109 | |
5.00%, 01/01/2030 | | | 285 | | | | 292,334 | |
5.00%, 01/01/2036 | | | 1,790 | | | | 1,846,864 | |
Maryland Stadium Authority
(Baltimore City Public School Construction Financing Fund)
Series 2020
5.00%, 05/01/2050(a) | | | 45,000 | | | | 48,519,238 | |
| | | | | | | | |
| | | | | | | 56,918,696 | |
| | | | | | | | |
Massachusetts – 1.2% | | | | | | | | |
Commonwealth of Massachusetts Transportation Fund Revenue
Series 2023
5.00%, 06/01/2053 | | | 10,000 | | | | 10,673,879 | |
Massachusetts Development Finance Agency
(Emmanuel College/MA)
Series 2016-A
5.00%, 10/01/2034 | | | 1,135 | | | | 1,146,594 | |
Massachusetts Development Finance Agency
(NewBridge on the Charles, Inc.)
Series 2017
5.00%, 10/01/2037(d) | | | 1,000 | | | | 1,016,158 | |
Massachusetts Development Finance Agency
(Tufts Medicine Obligated Group)
Series 2019-A
5.00%, 07/01/2036 | | | 3,000 | | | | 3,003,213 | |
Massachusetts Port Authority
Series 2019-A
5.00%, 07/01/2036 | | | 4,500 | | | | 4,736,748 | |
5.00%, 07/01/2037 | | | 4,000 | | | | 4,196,374 | |
5.00%, 07/01/2038 | | | 8,100 | | | | 8,465,885 | |
| | | | | | | | |
| | | | | | | 33,238,851 | |
| | | | | | | | |
Michigan – 1.1% | | | | | | | | |
City of Detroit MI
Series 2014-B
4.00%, 04/01/2044(j) | | | 7,000 | | | | 5,520,453 | |
Grand Rapids Economic Development Corp. (Beacon Hill at Eastgate)
Series 2017-A
5.00%, 11/01/2047 | | | 1,060 | | | | 927,544 | |
5.00%, 11/01/2052 | | | 1,185 | | | | 1,012,832 | |
| | |
| |
56 | AB MUNICIPAL INCOME FUND | | abfunds.com |
PORTFOLIO OF INVESTMENTS (continued)
AB HIGH INCOME MUNICIPAL PORTFOLIO
| | | | | | | | |
| | | Principal
Amount
(000) | | | U.S. $ Value | |
| |
Michigan Finance Authority
(Great Lakes Water Authority Water Supply System Revenue)
Series 2014-D4
5.00%, 07/01/2030 | | $ | 1,000 | | | $ | 1,000,481 | |
Michigan Finance Authority
(Lawrence Technological University Obligated Group)
Series 2022
4.00%, 02/01/2027 | | | 140 | | | | 134,972 | |
4.00%, 02/01/2032 | | | 285 | | | | 261,500 | |
4.00%, 02/01/2042 | | | 1,115 | | | | 891,170 | |
Michigan Finance Authority
(Michigan Finance Authority Tobacco Settlement Revenue)
Series 2020-B
Zero Coupon, 06/01/2065 | | | 16,250 | | | | 1,642,215 | |
Michigan Finance Authority
(Pre-refunded – US Treasuries)
Series 2016
5.00%, 12/01/2045 (Pre-refunded/ETM) | | | 45 | | | | 46,328 | |
Michigan Finance Authority
(Public Lighting Authority)
Series 2014-B
5.00%, 07/01/2039 | | | 13,580 | | | | 13,583,899 | |
5.00%, 07/01/2044 | | | 1,200 | | | | 1,200,176 | |
Michigan Tobacco Settlement Finance Authority
(Tobacco Settlement Financing Corp./MI)
Series 2008-C
Zero Coupon, 06/01/2058 | | | 164,100 | | | | 4,978,991 | |
| | | | | | | | |
| | | | | | | 31,200,561 | |
| | | | | | | | |
Minnesota – 1.1% | |
City of Apple Valley MN
(PHS Apple Valley Senior Housing, Inc.)
Series 2021
4.00%, 09/01/2051 | | | 230 | | | | 188,856 | |
4.00%, 09/01/2061 | | | 870 | | | | 670,845 | |
City of Brooklyn Park MN
(Brooklyn Park AH I LLLP)
Series 2023
6.205%, 01/01/2042(d)(j) | | | 5,000 | | | | 5,115,572 | |
City of Columbus MN
(Adalyn Avenue LLLP)
Series 2023
5.98%, 12/01/2041(d) | | | 5,000 | | | | 5,039,577 | |
| | |
| |
| abfunds.com | | AB MUNICIPAL INCOME FUND | 57 |
PORTFOLIO OF INVESTMENTS (continued)
AB HIGH INCOME MUNICIPAL PORTFOLIO
| | | | | | | | |
| | | Principal
Amount
(000) | | | U.S. $ Value | |
| |
City of Fridley MN
(Roers Fridley Apartments Owner II LLC)
Series 2023-A
5.75%, 06/01/2041(d) | | $ | 3,000 | | | $ | 2,983,912 | |
Dakota County Community Development Agency
(Rosemont AH I LLLP)
Series 2023
5.30%, 07/01/2028(d) | | | 2,760 | | | | 2,761,117 | |
5.66%, 07/01/2041(d) | | | 7,500 | | | | 7,541,898 | |
Duluth Economic Development Authority
(Benedictine Health System Obligated Group)
Series 2021
4.00%, 07/01/2036 | | | 1,000 | | | | 871,270 | |
4.00%, 07/01/2041 | | | 830 | | | | 660,935 | |
Housing & Redevelopment Authority of The City of St. Paul Minnesota
(Minnesota Math & Science Academy)
Series 2021
4.00%, 06/01/2041(d) | | | 2,100 | | | | 1,619,542 | |
4.00%, 06/01/2051(d) | | | 2,225 | | | | 1,528,873 | |
4.00%, 06/01/2056(d) | | | 1,000 | | | | 663,191 | |
| | | | | | | | |
| | | | | | | 29,645,588 | |
| | | | | | | | |
Mississippi – 0.6% | |
Mississippi Business Finance Corp.
(Alden Group Renewable Energy Mississippi LLC)
Series 2022
8.00%, 12/01/2029(g) | | | 5,750 | | | | 5,633,315 | |
Mississippi Development Bank
(Magnolia Regional Health Center)
Series 2021
4.00%, 10/01/2041(d) | | | 1,000 | | | | 802,973 | |
5.00%, 10/01/2031(d) | | | 2,850 | | | | 2,860,173 | |
Mississippi Hospital Equipment & Facilities Authority
(Baptist Memorial Health Care Obligated Group)
Series 2016-A
5.00%, 09/01/2036 | | | 6,400 | | | | 6,454,118 | |
Mississippi Hospital Equipment & Facilities Authority
(Forrest County General Hospital)
Series 2019
4.00%, 01/01/2037 | | | 250 | | | | 242,311 | |
| | |
| |
58 | AB MUNICIPAL INCOME FUND | | abfunds.com |
PORTFOLIO OF INVESTMENTS (continued)
AB HIGH INCOME MUNICIPAL PORTFOLIO
| | | | | | | | |
| | | Principal
Amount
(000) | | | U.S. $ Value | |
| |
5.00%, 01/01/2035 | | $ | 750 | | | $ | 784,392 | |
| | | | | | | | |
| | | | | | | 16,777,282 | |
| | | | | | | | |
Missouri – 0.9% | |
I-470 Western Gateway Transportation Development District
(I-470 Western Gateway Transportation Development District Sales Tax)
Series 2019-A
5.25%, 12/01/2048(d) | | | 5,000 | | | | 4,854,769 | |
Kansas City Industrial Development Authority (Kingswood Senior Living Community)
Series 2021
2.00%, 11/15/2046(e)(f) | | | 1,165 | | | | 54,350 | |
5.00%, 11/15/2046(e)(f) | | | 2,610 | | | | 1,824,324 | |
Series 2021-A
10.00%, 11/15/2046(e)(f) | | | 804 | | | | 679,208 | |
Series 2021-C
7.50%, 11/15/2037(e)(f) | | | 643 | | | | 500,176 | |
Kansas City Industrial Development Authority (Platte Purchase Project)
Series 2019
5.00%, 07/01/2040(d) | | | 1,665 | | | | 1,450,231 | |
Lee’s Summit Industrial Development Authority
(John Knox Village Obligated Group)
Series 2016-A
5.00%, 08/15/2036 | | | 2,000 | | | | 1,985,432 | |
5.00%, 08/15/2046 | | | 5,585 | | | | 4,947,965 | |
5.00%, 08/15/2051 | | | 2,415 | | | | 2,052,941 | |
Series 2021-A
5.00%, 08/15/2056 | | | 5,000 | | | | 4,347,694 | |
Taney County Industrial Development Authority
(Taney County Industrial Development Authority Lease)
Series 2023
6.00%, 10/01/2049(d) | | | 2,000 | | | | 1,942,029 | |
| | | | | | | | |
| | | | | | | 24,639,119 | |
| | | | | | | | |
Nebraska – 0.9% | |
Central Plains Energy Project
(Goldman Sachs Group, Inc. (The))
Series 2017-A
5.00%, 09/01/2032 | | | 10,730 | | | | 11,149,604 | |
5.00%, 09/01/2042 | | | 14,670 | | | | 15,190,898 | |
| | | | | | | | |
| | | | | | | 26,340,502 | |
| | | | | | | | |
| | |
| |
| abfunds.com | | AB MUNICIPAL INCOME FUND | 59 |
PORTFOLIO OF INVESTMENTS (continued)
AB HIGH INCOME MUNICIPAL PORTFOLIO
| | | | | | | | |
| | | Principal
Amount
(000) | | | U.S. $ Value | |
| |
Nevada – 0.6% | |
City of Reno NV
(County of Washoe NV Sales Tax Revenue)
Series 2018-C
Zero Coupon, 07/01/2058(d) | | $ | 9,500 | | | $ | 1,214,559 | |
City of Sparks NV
(City of Sparks NV Sales Tax)
Series 2019-A
2.75%, 06/15/2028(d) | | | 1,550 | | | | 1,463,642 | |
Las Vegas Redevelopment Agency
(Las Vegas Redevelopment Agency Redevelopment Area 1)
Series 2016
5.00%, 06/15/2045 | | | 3,000 | | | | 3,009,411 | |
State of Nevada Department of Business & Industry
Series 2018
6.95%, 02/15/2038(d)(e)(f) | | | 1,603 | | | | 160,323 | |
State of Nevada Department of Business & Industry
(DesertXpress Enterprises LLC)
Series 2023
8.125%, 01/01/2050(d) | | | 9,715 | | | | 10,037,564 | |
| | | | | | | | |
| | | | | | | 15,885,499 | |
| | | | | | | | |
New Hampshire – 1.5% | |
New Hampshire Business Finance Authority
Series 2022-1, Class A
4.375%, 09/20/2036 | | | 16,583 | | | | 15,879,171 | |
Series 2022-2, Class A
4.00%, 10/20/2036 | | | 9,787 | | | | 9,067,499 | |
Series 2024-2
0.49%, 07/01/2051 | | | 4,225 | | | | 165,796 | |
Series 2024-2, Class X
0.594%, 08/20/2039 | | | 10,000 | | | | 421,028 | |
New Hampshire Business Finance Authority
(Reworld Holding Corp.)
Series 2018
4.625%, 11/01/2042(d) | | | 2,325 | | | | 2,122,798 | |
Series 2020-A
3.625%, 07/01/2043(d) | | | 1,500 | | | | 1,205,825 | |
Series 2020-B
3.75%, 07/01/2045(d) | | | 3,215 | | | | 2,597,554 | |
| | |
| |
60 | AB MUNICIPAL INCOME FUND | | abfunds.com |
PORTFOLIO OF INVESTMENTS (continued)
AB HIGH INCOME MUNICIPAL PORTFOLIO
| | | | | | | | |
| | | Principal
Amount
(000) | | | U.S. $ Value | |
| |
New Hampshire Health and Education Facilities Authority Act
(Dartmouth-Hitchcock Obligated Group)
Series 2020-A
5.00%, 08/01/2059 | | $ | 10,920 | | | $ | 11,026,879 | |
| | | | | | | | |
| | | | | | | 42,486,550 | |
| | | | | | | | |
New Jersey – 4.4% | |
Essex County Improvement Authority
(North Star Academy Charter School of Newark, Inc.)
Series 2020
4.00%, 07/15/2050(d) | | | 1,000 | | | | 855,019 | |
New Jersey Economic Development Authority
(NYNJ Link Borrower LLC)
Series 2013
5.125%, 01/01/2034 | | | 9,780 | | | | 9,784,309 | |
New Jersey Economic Development Authority
(Port Newark Container Terminal LLC)
Series 2017
5.00%, 10/01/2037 | | | 2,000 | | | | 2,048,572 | |
New Jersey Economic Development Authority
(State of New Jersey)
Series 2024-S
5.00%, 06/15/2035 | | | 1,000 | | | | 1,116,348 | |
New Jersey Economic Development Authority
(UMM Energy Partners LLC)
Series 2012-A
5.125%, 06/15/2043 | | | 7,515 | | | | 7,419,650 | |
New Jersey Economic Development Authority
(United Airlines, Inc.)
Series 2012
5.25%, 09/15/2029 | | | 4,140 | | | | 4,144,667 | |
Series 2014-B
5.625%, 11/15/2030 | | | 4,525 | | | | 4,562,791 | |
New Jersey Educational Facilities Authority
(Stevens Institute of Technology International, Inc.)
Series 2020-A
4.00%, 07/01/2050 | | | 1,195 | | | | 1,031,262 | |
| | |
| |
| abfunds.com | | AB MUNICIPAL INCOME FUND | 61 |
PORTFOLIO OF INVESTMENTS (continued)
AB HIGH INCOME MUNICIPAL PORTFOLIO
| | | | | | | | |
| | | Principal
Amount
(000) | | | U.S. $ Value | |
| |
New Jersey Transportation Trust Fund Authority
(New Jersey Transportation Trust Fund Authority State Lease)
Series 2018-A
5.00%, 12/15/2033(a) | | $ | 12,240 | | | $ | 12,871,744 | |
5.00%, 12/15/2035(a) | | | 6,545 | | | | 6,875,825 | |
Series 2019-B
4.00%, 06/15/2037 | | | 800 | | | | 794,397 | |
New Jersey Turnpike Authority
Series 2024-A
4.00%, 01/01/2035(c) | | | 11,500 | | | | 11,970,501 | |
Series 2024-C
5.00%, 01/01/2043(c) | | | 7,500 | | | | 8,028,253 | |
5.00%, 01/01/2044(c) | | | 2,500 | | | | 2,663,994 | |
Tobacco Settlement Financing Corp./NJ
Series 2018-B
5.00%, 06/01/2046 | | | 47,615 | | | | 47,922,388 | |
| | | | | | | | |
| | | | | | | 122,089,720 | |
| | | | | | | | |
New Mexico – 0.1% | |
New Mexico Hospital Equipment Loan Council
(Haverland Carter Lifestyle Obligated Group)
Series 2019
5.00%, 07/01/2049 | | | 2,765 | | | | 2,278,662 | |
| | | | | | | | |
|
New York – 6.3% | |
Build NYC Resource Corp.
(Albert Einstein College of Medicine, Inc.)
Series 2016
5.50%, 09/01/2045(d) | | | 4,315 | | | | 4,317,965 | |
Build NYC Resource Corp.
(Integration Charter Schools)
Series 2021
5.00%, 06/01/2056(d) | | | 2,050 | | | | 1,846,798 | |
Build NYC Resource Corp.
(Metropolitan College of New York)
Series 2014
5.00%, 11/01/2039 | | | 7,050 | | | | 4,230,000 | |
5.50%, 11/01/2044 | | | 2,875 | | | | 1,725,000 | |
City of New York NY
Series 2024-C
5.00%, 03/01/2043 | | | 10,000 | | | | 10,864,420 | |
| | |
| |
62 | AB MUNICIPAL INCOME FUND | | abfunds.com |
PORTFOLIO OF INVESTMENTS (continued)
AB HIGH INCOME MUNICIPAL PORTFOLIO
| | | | | | | | |
| | | Principal
Amount
(000) | | | U.S. $ Value | |
| |
Jefferson County Industrial Development Agency
(ReEnergy Black River LLC)
Series 2015
12.00%, 07/01/2034(e)(f)(k)(l) | | $ | 5,000 | | | $ | – 0 | – |
Metropolitan Transportation Authority
Series 2016-B
5.00%, 11/15/2025 | | | 635 | | | | 647,173 | |
5.00%, 11/15/2037 | | | 13,265 | | | | 13,621,901 | |
Series 2020-C
5.25%, 11/15/2055 | | | 2,000 | | | | 2,060,129 | |
Monroe County Industrial Development Corp./NY
(St Ann’s of Greater Rochester Obligated Group)
Series 2019
5.00%, 01/01/2050 | | | 2,765 | | | | 2,143,220 | |
Nassau County Industrial Development Agency
(Amsterdam House Continuing Care Retirement Community, Inc.)
Series 2021
5.00%, 01/01/2058(e)(f) | | | 7,315 | | | | 2,190,311 | |
9.00%, 01/01/2041(e)(f)(g) | | | 3,660 | | | | 3,660,000 | |
New York City Housing Development Corp.
Series 2020
2.55%, 08/01/2040 | | | 1,355 | | | | 999,616 | |
New York City Municipal Water Finance Authority
Series 2024-C
5.25%, 06/15/2054 | | | 10,000 | | | | 10,885,973 | |
New York Counties Tobacco Trust V
Series 2005
Zero Coupon, 06/01/2050 | | | 51,990 | | | | 7,710,294 | |
New York Liberty Development Corp.
(3 World Trade Center LLC)
Series 2014
5.00%, 11/15/2044(d) | | | 9,190 | | | | 9,205,969 | |
5.375%, 11/15/2040(d) | | | 2,500 | | | | 2,509,567 | |
7.25%, 11/15/2044(d) | | | 1,705 | | | | 1,716,861 | |
New York State Dormitory Authority
(Cornell University)
Series 2024-A
5.50%, 07/01/2054 | | | 10,000 | | | | 11,224,370 | |
| | |
| |
| abfunds.com | | AB MUNICIPAL INCOME FUND | 63 |
PORTFOLIO OF INVESTMENTS (continued)
AB HIGH INCOME MUNICIPAL PORTFOLIO
| | | | | | | | |
| | | Principal
Amount
(000) | | | U.S. $ Value | |
| |
New York Transportation Development Corp.
(JFK NTO LLC)
Series 2023
5.375%, 06/30/2060 | | $ | 5,000 | | | $ | 5,182,126 | |
6.00%, 06/30/2054 | | | 2,500 | | | | 2,740,539 | |
AGM Series 2023
5.00%, 06/30/2049 | | | 2,000 | | | | 2,053,020 | |
New York Transportation Development Corp.
(Laguardia Gateway Partners LLC)
Series 2016-A
5.00%, 07/01/2041 | | | 17,110 | | | | 17,068,825 | |
Suffolk Regional Off-Track Betting Co.
Series 2024
6.00%, 12/01/2053 | | | 5,000 | | | | 5,168,605 | |
Triborough Bridge & Tunnel Authority
5.25%, 05/15/2057(a) | | | 10,000 | | | | 10,730,740 | |
Triborough Bridge & Tunnel Authority
(Metropolitan Transportation Authority Payroll Mobility Tax Revenue)
Series 2021-B
5.50%, 11/15/2057(a) | | | 10,000 | | | | 10,908,568 | |
Series 2022-C
5.25%, 05/15/2052(a) | | | 5,000 | | | | 5,367,031 | |
Triborough Bridge & Tunnel Authority Sales Tax Revenue
Series 2024-A
5.25%, 05/15/2064 | | | 10,000 | | | | 10,761,702 | |
Ulster County Capital Resource Corp.
(Woodland Pond at New Paltz)
Series 2017
5.00%, 09/15/2037 | | | 4,270 | | | | 3,516,125 | |
5.25%, 09/15/2042 | | | 1,795 | | | | 1,426,604 | |
5.25%, 09/15/2047 | | | 3,080 | | | | 2,324,770 | |
5.25%, 09/15/2053 | | | 6,635 | | | | 4,813,516 | |
Western Regional Off-Track Betting Corp.
Series 2021
4.125%, 12/01/2041(d) | | | 1,650 | | | | 1,291,209 | |
| | | | | | | | |
| | | | | | | 174,912,947 | |
| | | | | | | | |
North Carolina – 0.3% | |
Fayetteville State University
Series 2023
5.00%, 04/01/2033(d) | | | 710 | | | | 764,191 | |
5.00%, 04/01/2035(d) | | | 830 | | | | 899,042 | |
5.00%, 04/01/2039(d) | | | 1,120 | | | | 1,188,726 | |
5.00%, 04/01/2041(d) | | | 1,290 | | | | 1,355,822 | |
5.00%, 04/01/2043(d) | | | 1,480 | | | | 1,545,369 | |
| | |
| |
64 | AB MUNICIPAL INCOME FUND | | abfunds.com |
PORTFOLIO OF INVESTMENTS (continued)
AB HIGH INCOME MUNICIPAL PORTFOLIO
| | | | | | | | |
| | | Principal
Amount
(000) | | | U.S. $ Value | |
| |
North Carolina Medical Care Commission
(Pennybyrn at Maryfield)
Series 2015
5.00%, 10/01/2035 | | $ | 1,625 | | | $ | 1,583,757 | |
North Carolina Turnpike Authority
AGM Series 2024
Zero Coupon, 01/01/2051 | | | 3,000 | | | | 793,320 | |
Zero Coupon, 01/01/2052 | | | 2,000 | | | | 500,627 | |
Zero Coupon, 01/01/2053 | | | 1,000 | | | | 236,849 | |
| | | | | | | | |
| | | | | | | 8,867,703 | |
| | | | | | | | |
North Dakota – 0.2% | |
County of Grand Forks ND
(Red River Biorefinery LLC)
Series 2021
6.625%, 12/15/2031(e)(f)(g)(k)(l) | | | 1,550 | | | | 20,150 | |
7.00%, 12/15/2043(e)(f)(g)(k)(l) | | | 1,610 | | | | 20,930 | |
County of Ward ND
(Trinity Health Obligated Group)
Series 2017-C
5.00%, 06/01/2043 | | | 5,000 | | | | 4,621,925 | |
| | | | | | | | |
| | | | | | | 4,663,005 | |
| | | | | | | | |
Ohio – 2.5% | |
Buckeye Tobacco Settlement Financing Authority
Series 2020-B
Zero Coupon, 06/01/2057 | | | 36,605 | | | | 3,266,092 | |
5.00%, 06/01/2055 | | | 27,400 | | | | 24,515,128 | |
City of Middleburg Heights OH
(Southwest General Health Center Obligated Group)
Series 2021
5.00%, 08/01/2032 | | | 1,000 | | | | 1,055,415 | |
5.00%, 08/01/2033 | | | 800 | | | | 843,903 | |
5.00%, 08/01/2034 | | | 1,000 | | | | 1,053,332 | |
County of Cuyahoga OH
(MetroHealth System (The))
Series 2017
5.00%, 02/15/2042 | | | 10,920 | | | | 10,931,637 | |
County of Franklin OH
(First Community Village Obligated Group)
Series 2019
5.00%, 07/01/2049 | | | 2,770 | | | | 2,312,840 | |
| | |
| |
| abfunds.com | | AB MUNICIPAL INCOME FUND | 65 |
PORTFOLIO OF INVESTMENTS (continued)
AB HIGH INCOME MUNICIPAL PORTFOLIO
| | | | | | | | |
| | | Principal
Amount
(000) | | | U.S. $ Value | |
| |
County of Marion OH
(United Church Homes, Inc. Obligated Group)
Series 2019
5.00%, 12/01/2039 | | $ | 565 | | | $ | 475,201 | |
5.125%, 12/01/2049 | | | 690 | | | | 536,486 | |
County of Montgomery OH
(Trousdale Foundation Obligated Group)
Series 2018-A
6.25%, 04/01/2049(e)(f)(g) | | | 5,215 | | | | 1,371,545 | |
County of Washington OH
(Marietta Area Health Care, Inc. Obligated Group)
Series 2022
6.625%, 12/01/2042 | | | 1,000 | | | | 1,079,542 | |
6.75%, 12/01/2052 | | | 10,000 | | | | 10,738,889 | |
Jefferson County Port Authority/OH
(JSW Steel USA Ohio, Inc.)
Series 2021
3.50%, 12/01/2051(d) | | | 3,700 | | | | 2,776,466 | |
Series 2023
5.00%, 12/01/2053(d) | | | 2,000 | | | | 2,021,180 | |
Port of Greater Cincinnati Development Authority
Series 2021
4.375%, 06/15/2056 | | | 1,000 | | | | 975,340 | |
Toledo-Lucas County Port Authority
(ParkUToledo, Inc.)
Series 2021
4.00%, 01/01/2057 | | | 7,065 | | | | 5,920,244 | |
| | | | | | | | |
| | | | | | | 69,873,240 | |
| | | | | | | | |
Oklahoma – 1.1% | |
Norman Regional Hospital Authority
(Norman Regional Hospital Authority Obligated Group)
Series 2019
3.25%, 09/01/2038 | | | 3,295 | | | | 2,406,782 | |
Oklahoma Development Finance Authority
(OU Medicine Obligated Group)
Series 2018-B
5.00%, 08/15/2033 | | | 3,165 | | | | 3,227,759 | |
5.50%, 08/15/2052 | | | 3,000 | | | | 3,061,171 | |
5.50%, 08/15/2057 | | | 11,290 | | | | 11,505,322 | |
Series 2022-A
5.50%, 08/15/2044 | | | 10,000 | | | | 10,164,694 | |
| | | | | | | | |
| | | | | | | 30,365,728 | |
| | | | | | | | |
| | |
| |
66 | AB MUNICIPAL INCOME FUND | | abfunds.com |
PORTFOLIO OF INVESTMENTS (continued)
AB HIGH INCOME MUNICIPAL PORTFOLIO
| | | | | | | | |
| | | Principal
Amount
(000) | | | U.S. $ Value | |
| |
Oregon – 0.1% | |
Clackamas County Hospital Facility Authority (Rose Villa, Inc. Obligated Group)
Series 2020-A
5.25%, 11/15/2050 | | $ | 1,000 | | | $ | 922,240 | |
Multnomah County School District No. 40
Series 2023-A
Zero Coupon, 06/15/2051 | | | 10,000 | | | | 2,552,641 | |
Umatilla County School District No. 6R Umatilla
Series 2023-B
Zero Coupon, 06/15/2053 | | | 3,000 | | | | 690,497 | |
| | | | | | | | |
| | | | | | | 4,165,378 | |
| | | | | | | | |
Other – 0.3% | |
Affordable Housing Tax-Exempt Bond Pass-Thru Trust
Series 2023-2
6.00%, 10/05/2040(d) | | | 7,469 | | | | 7,666,972 | |
| | | | | | | | |
|
Pennsylvania – 3.5% | |
Berks County Industrial Development Authority
(Tower Health Obligated Group)
Series 2017
5.00%, 11/01/2047 | | | 1,800 | | | | 908,448 | |
Berks County Municipal Authority (The)
(Tower Health Obligated Group)
Series 2020-B
5.00%, 02/01/2040 | | | 6,000 | | | | 4,613,285 | |
Bucks County Industrial Development Authority
(Grand View Hospital/Sellersville PA Obligated Group)
Series 2021
4.00%, 07/01/2051 | | | 5,000 | | | | 3,647,840 | |
5.00%, 07/01/2040 | | | 1,100 | | | | 997,120 | |
Chester County Industrial Development Authority
(Collegium Charter School)
Series 2022
5.625%, 10/15/2042(d) | | | 2,750 | | | | 2,724,594 | |
Crawford County Hospital Authority
(Meadville Medical Center Obligated Group)
Series 2016-A
6.00%, 06/01/2046 | | | 7,950 | | | | 7,996,704 | |
| | |
| |
| abfunds.com | | AB MUNICIPAL INCOME FUND | 67 |
PORTFOLIO OF INVESTMENTS (continued)
AB HIGH INCOME MUNICIPAL PORTFOLIO
| | | | | | | | |
| | | Principal
Amount
(000) | | | U.S. $ Value | |
| |
6.00%, 06/01/2051 | | $ | 3,715 | | | $ | 3,720,722 | |
Cumberland County Municipal Authority
(Asbury Pennsylvania Obligated Group)
Series 2019
5.00%, 01/01/2045 | | | 1,185 | | | | 1,051,072 | |
Cumberland County Municipal Authority
(Penn State Health Obligated Group)
Series 2019
4.00%, 11/01/2036 | | | 715 | | | | 701,128 | |
Geisinger Authority
(Kaiser Obligated Group)
Series 2020
5.00%, 04/01/2043 | | | 2,000 | | | | 2,107,937 | |
5.00%, 04/01/2050 | | | 8,000 | | | | 8,137,902 | |
Hospitals & Higher Education Facilities Authority of Philadelphia (The)
(Temple University Health System Obligated Group)
Series 2017
5.00%, 07/01/2032 | | | 1,000 | | | | 1,006,946 | |
Lancaster County Hospital Authority/PA
(St. Anne’s Retirement Community Obligated Group)
Series 2020
5.00%, 03/01/2040 | | | 1,000 | | | | 885,888 | |
5.00%, 03/01/2045 | | | 500 | | | | 421,699 | |
Moon Industrial Development Authority
(Baptist Homes Society)
Series 2015
6.00%, 07/01/2045 | | | 18,125 | | | | 13,600,960 | |
Pennsylvania Economic Development Financing Authority
(Commonwealth of Pennsylvania Department of Transportation)
AGM Series 2022
5.75%, 12/31/2062 | | | 4,000 | | | | 4,353,220 | |
Pennsylvania Economic Development Financing Authority
(Iron Cumberland LLC)
Series 2022
7.00%, 12/01/2029 | | | 10,170 | | | | 10,016,296 | |
Pennsylvania Economic Development Financing Authority
(Reworld Holding Corp.)
Series 2019
3.25%, 08/01/2039(d) | | | 1,640 | | | | 1,267,012 | |
| | |
| |
68 | AB MUNICIPAL INCOME FUND | | abfunds.com |
PORTFOLIO OF INVESTMENTS (continued)
AB HIGH INCOME MUNICIPAL PORTFOLIO
| | | | | | | | |
| | | Principal
Amount
(000) | | | U.S. $ Value | |
| |
Philadelphia Authority for Industrial Development
(Greater Philadelphia Health Action, Inc.)
Series 2015-A
6.375%, 06/01/2040 | | $ | 1,300 | | | $ | 1,300,425 | |
6.50%, 06/01/2045 | | | 2,390 | | | | 2,390,667 | |
6.625%, 06/01/2050 | | | 3,870 | | | | 3,873,096 | |
Philadelphia Authority for Industrial Development
(MaST Community Charter School III)
Series 2021
5.00%, 08/01/2050 | | | 2,240 | | | | 2,030,781 | |
5.00%, 08/01/2054 | | | 1,585 | | | | 1,413,334 | |
Philadelphia Authority for Industrial Development
(Philadelphia Electrical & Technology Charter High School)
Series 2021
4.00%, 06/01/2051 | | | 3,450 | | | | 2,692,144 | |
Philadelphia Authority for Industrial Development
(Philadelphia Performing Arts Charter School)
Series 2020
5.00%, 06/15/2050(d) | | | 1,000 | | | | 986,338 | |
Philadelphia Authority for Industrial Development
(Tacony Academy Charter School)
Series 2023
5.50%, 06/15/2043(d) | | | 1,250 | | | | 1,264,502 | |
School District of Philadelphia (The)
Series 2023-A
5.50%, 09/01/2048 | | | 1,750 | | | | 1,906,518 | |
Scranton-Lackawanna Health and Welfare Authority
(Scranton Parking System Concession Project)
Series 2016-A
5.00%, 01/01/2051(d) | | | 6,920 | | | | 4,040,539 | |
5.00%, 01/01/2057(d) | | | 5,475 | | | | 3,073,016 | |
Series 2016-B
6.08%, 01/01/2026(d) | | | 495 | | | | 476,459 | |
Series 2016-C
Zero Coupon, 01/01/2036(d) | | | 3,010 | | | | 1,012,089 | |
Series 2016-D
Zero Coupon, 01/01/2057(g) | | | 59,415 | | | | 3,305,340 | |
| | | | | | | | |
| | | | | | | 97,924,021 | |
| | | | | | | | |
| | |
| |
| abfunds.com | | AB MUNICIPAL INCOME FUND | 69 |
PORTFOLIO OF INVESTMENTS (continued)
AB HIGH INCOME MUNICIPAL PORTFOLIO
| | | | | | | | |
| | | Principal
Amount
(000) | | | U.S. $ Value | |
| |
Puerto Rico – 9.0% | |
Children’s Trust Fund
Series 2008-A
Zero Coupon, 05/15/2057 | | $ | 68,000 | | | $ | 5,446,514 | |
Series 2008-B
Zero Coupon, 05/15/2057 | | | 445,000 | | | | 26,685,715 | |
Commonwealth of Puerto Rico
Series 2021-A
Zero Coupon, 07/01/2024 | | | 425 | | | | 423,627 | |
Zero Coupon, 07/01/2033 | | | 21,858 | | | | 14,486,142 | |
4.00%, 07/01/2033 | | | 10,000 | | | | 9,977,118 | |
4.00%, 07/01/2035 | | | 2,805 | | | | 2,748,111 | |
Series 2022-A
Zero Coupon, 11/01/2051 | | | 5,426 | | | | 2,801,141 | |
0.00%, 11/01/2051 | | | 17,500 | | | | 3,631,250 | |
5.07%, 11/01/2051 | | | 17,550 | | | | 11,056,319 | |
Series 2022-C
Zero Coupon, 11/01/2043 | | | 38,675 | | | | 23,978,639 | |
GDB Debt Recovery Authority of Puerto Rico
Series 2018
7.50%, 08/20/2040 | | | 3,528 | | | | 3,426,153 | |
Puerto Rico Commonwealth Aqueduct & Sewer Authority
Series 2008-A
6.125%, 07/01/2024 | | | 896 | | | | 897,397 | |
Series 2020-A
5.00%, 07/01/2030(d) | | | 10,000 | | | | 10,495,981 | |
5.00%, 07/01/2047(d) | | | 5,500 | | | | 5,548,468 | |
Series 2021-B
5.00%, 07/01/2025(d) | | | 3,505 | | | | 3,541,502 | |
5.00%, 07/01/2028(d) | | | 2,550 | | | | 2,642,077 | |
5.00%, 07/01/2029(d) | | | 3,850 | | | | 4,014,433 | |
5.00%, 07/01/2033(d) | | | 2,835 | | | | 2,983,879 | |
5.00%, 07/01/2037(d) | | | 2,530 | | | | 2,629,173 | |
Puerto Rico Electric Power Authority
Series 2007-T
5.00%, 07/01/2032(e)(f) | | | 7,425 | | | | 1,949,062 | |
5.00%, 07/01/2037(e)(f) | | | 10,045 | | | | 2,636,812 | |
Series 2008-W
5.00%, 07/01/2028(e)(f) | | | 7,285 | | | | 1,912,312 | |
Series 2008-WW
5.375%, 07/01/2024(e)(f) | | | 3,700 | | | | 971,250 | |
Series 2010-A
5.25%, 07/01/2029(e)(f) | | | 2,370 | | | | 622,125 | |
5.25%, 07/01/2030(e)(f) | | | 390 | | | | 102,375 | |
| | |
| |
70 | AB MUNICIPAL INCOME FUND | | abfunds.com |
PORTFOLIO OF INVESTMENTS (continued)
AB HIGH INCOME MUNICIPAL PORTFOLIO
| | | | | | | | |
| | | Principal
Amount
(000) | | | U.S. $ Value | |
| |
Series 2010-C
5.00%, 07/01/2024(e)(f) | | $ | 1,530 | | | $ | 401,625 | |
5.25%, 07/01/2027(e)(f) | | | 2,550 | | | | 669,375 | |
5.25%, 07/01/2028(e)(f) | | | 5,255 | | | | 1,379,437 | |
Series 2010-DDD
5.00%, 07/01/2020(e)(m) | | | 1,660 | | | | 435,750 | |
5.00%, 07/01/2021(e)(m) | | | 920 | | | | 241,500 | |
5.00%, 07/01/2022(e)(m) | | | 610 | | | | 160,125 | |
Series 2010-X
5.25%, 07/01/2027(e)(f) | | | 3,725 | | | | 977,813 | |
5.25%, 07/01/2040(e)(f) | | | 10,035 | | | | 2,634,187 | |
5.75%, 07/01/2036(e)(f) | | | 2,280 | | | | 598,500 | |
Series 2010-ZZ
5.25%, 07/01/2018(e)(m) | | | 2,500 | | | | 656,250 | |
5.25%, 07/01/2019(e)(m) | | | 1,715 | | | | 450,188 | |
5.25%, 07/01/2022(e)(m) | | | 1,565 | | | | 410,813 | |
5.25%, 07/01/2024(e)(f) | | | 1,570 | | | | 412,125 | |
5.25%, 07/01/2025(e)(f) | | | 440 | | | | 115,500 | |
Series 2012-A
5.00%, 07/01/2029(e)(f) | | | 3,345 | | | | 878,063 | |
5.00%, 07/01/2042(e)(f) | | | 1,000 | | | | 262,500 | |
5.05%, 07/01/2042(e)(f) | | | 2,000 | | | | 525,000 | |
Series 2013-A
7.00%, 07/01/2033(e)(f) | | | 2,200 | | | | 577,500 | |
7.00%, 07/01/2040(e)(f) | | | 575 | | | | 150,938 | |
AGM Series 2007-V
5.25%, 07/01/2031 | | | 14,090 | | | | 14,023,618 | |
NATL Series 2007-V
5.25%, 07/01/2029 | | | 245 | | | | 241,456 | |
Puerto Rico Industrial Tourist Educational Medical & Environmental Control Facilities Financing Auth
Series 2023-A
6.625%, 01/01/2027 | | | 1,321 | | | | 1,299,700 | |
6.625%, 01/01/2028 | | | 10,077 | | | | 9,889,754 | |
Puerto Rico Industrial Tourist Educational Medical & Environmental Control Facilities Financing Auth
(AES Puerto Rico LP)
12.50%, 12/15/2025(k)(l) | | | 2,341 | | | | 2,270,873 | |
Puerto Rico Industrial Tourist Educational Medical & Environmental Control Facilities Financing Auth (San Juan Cruise Port LLC)
Series 2024
6.75%, 01/01/2045 | | | 2,000 | | | | 2,370,220 | |
| | |
| |
| abfunds.com | | AB MUNICIPAL INCOME FUND | 71 |
PORTFOLIO OF INVESTMENTS (continued)
AB HIGH INCOME MUNICIPAL PORTFOLIO
| | | | | | | | |
| | | Principal
Amount
(000) | | | U.S. $ Value | |
| |
Puerto Rico Sales Tax Financing Corp. Sales Tax Revenue
Series 2018-A
Zero Coupon, 07/01/2024 | | $ | 78 | | | $ | 77,767 | |
Zero Coupon, 07/01/2027 | | | 383 | | | | 341,203 | |
Zero Coupon, 07/01/2029 | | | 1,519 | | | | 1,254,088 | |
Zero Coupon, 07/01/2046 | | | 57,388 | | | | 18,279,295 | |
Zero Coupon, 07/01/2051 | | | 40,000 | | | | 9,460,588 | |
Series 2019-A
4.329%, 07/01/2040 | | | 21,770 | | | | 21,627,246 | |
4.55%, 07/01/2040 | | | 2,637 | | | | 2,652,903 | |
5.00%, 07/01/2058 | | | 10,481 | | | | 10,446,524 | |
| | | | | | | | |
| | | | | | | 251,779,999 | |
| | | | | | | | |
Rhode Island – 0.2% | |
Rhode Island Health and Educational Building Corp.
(Lifespan Obligated Group)
Series 2016
5.00%, 05/15/2031 | | | 1,795 | | | | 1,812,486 | |
5.00%, 05/15/2032 | | | 1,890 | | | | 1,908,341 | |
5.00%, 05/15/2033 | | | 1,000 | | | | 1,009,673 | |
5.00%, 05/15/2034 | | | 1,600 | | | | 1,615,395 | |
| | | | | | | | |
| | | | | | | 6,345,895 | |
| | | | | | | | |
South Carolina – 1.7% | |
Columbia Housing Authority/SC
(Garden Lakes Apartments)
Series 2022
4.80%, 11/01/2024 | | | 2,975 | | | | 2,941,708 | |
5.26%, 11/01/2032 | | | 475 | | | | 462,398 | |
5.41%, 11/01/2039 | | | 7,515 | | | | 7,211,231 | |
6.28%, 11/01/2039 | | | 330 | | | | 317,393 | |
Greenville Housing Authority/SC
(Victor Verdae Apartments)
Series 2023
6.16%, 05/01/2063(d) | | | 5,000 | | | | 5,006,446 | |
South Carolina Jobs-Economic Development Authority
(FAH Pelham LLC)
Series 2023
10.00%, 08/01/2039(d) | | | 185 | | | | 171,155 | |
Series 2023-A
6.50%, 02/01/2056(d) | | | 5,715 | | | | 5,650,057 | |
Series 2023-B
7.50%, 08/01/2047(d) | | | 2,200 | | | | 2,150,127 | |
| | |
| |
72 | AB MUNICIPAL INCOME FUND | | abfunds.com |
PORTFOLIO OF INVESTMENTS (continued)
AB HIGH INCOME MUNICIPAL PORTFOLIO
| | | | | | | | |
| | | Principal
Amount
(000) | | | U.S. $ Value | |
| |
South Carolina Jobs-Economic Development Authority
(International Paper Co.)
Series 2023
4.00%, 04/01/2033 | | $ | 2,000 | | | $ | 2,006,212 | |
South Carolina Jobs-Economic Development Authority
(Last Step Recycling LLC)
Series 2021
6.25%, 06/01/2040(e)(f)(g) | | | 3,115 | | | | 1,995,723 | |
6.50%, 06/01/2051(e)(f)(g) | | | 3,175 | | | | 1,845,575 | |
South Carolina Jobs-Economic Development Authority
(Novant Health Obligated Group)
Series 2024
4.00%, 11/01/2042 | | | 1,000 | | | | 965,061 | |
4.50%, 11/01/2054 | | | 1,000 | | | | 980,361 | |
5.25%, 11/01/2044 | | | 10,000 | | | | 10,995,402 | |
South Carolina Jobs-Economic Development Authority
(PSG Patriot’s Place Apartments LLC)
Series 2022
0.00%, 06/01/2052(j) | | | 6,135 | | | | 4,573,955 | |
South Carolina Public Service Authority
Series 2022
3.00%, 12/01/2043 | | | 1,606 | | | | 1,179,568 | |
| | | | | | | | |
| | | | | | | 48,452,372 | |
| | | | | | | | |
South Dakota – 0.2% | |
County of Lincoln SD
(Augustana College Association/SD)
Series 2021
4.00%, 08/01/2041 | | | 1,000 | | | | 865,942 | |
4.00%, 08/01/2051 | | | 3,620 | | | | 2,881,163 | |
South Dakota Housing Development Authority (Schuett Spearfish LP)
Series 2023
6.15%, 09/01/2039 | | | 1,500 | | | | 1,535,919 | |
| | | | | | | | |
| | | | | | | 5,283,024 | |
| | | | | | | | |
Tennessee – 1.4% | |
Bristol Industrial Development Board
(Bristol Industrial Development Board Sales Tax)
Series 2016-A
5.125%, 12/01/2042(d) | | | 19,305 | | | | 17,195,603 | |
| | |
| |
| abfunds.com | | AB MUNICIPAL INCOME FUND | 73 |
PORTFOLIO OF INVESTMENTS (continued)
AB HIGH INCOME MUNICIPAL PORTFOLIO
| | | | | | | | |
| | | Principal
Amount
(000) | | | U.S. $ Value | |
| |
Chattanooga Health Educational & Housing Facility Board
(CommonSpirit Health)
Series 2019-A
4.00%, 08/01/2037 | | $ | 805 | | | $ | 777,078 | |
Knox County Industrial Development Board
(Tompaul Knoxville LLC)
Series 2022
9.25%, 11/01/2042(d) | | | 2,350 | | | | 2,374,245 | |
9.50%, 11/01/2052(d) | | | 6,600 | | | | 6,667,546 | |
Metropolitan Government Nashville & Davidson County Health & Educational Facilities Board
(Trevecca Nazarene University)
Series 2021
4.00%, 10/01/2051 | | | 1,580 | | | | 1,289,496 | |
Metropolitan Government Nashville & Davidson County Health & Educational Facilities Board
(Trousdale Foundation Obligated Group)
Series 2018
7.50%, 04/01/2049(e)(f)(g) | | | 100 | | | | 1,000 | |
Series 2018-A
6.25%, 04/01/2049(e)(f)(g) | | | 4,465 | | | | 1,174,295 | |
Metropolitan Government Nashville & Davidson County Industrial Development Board
(Nashville & Davidson County TN South Nashville Central Business Improvement District)
Series 2021
4.00%, 06/01/2051(d) | | | 1,300 | | | | 1,044,168 | |
Shelby County Health Educational & Housing Facilities Board
(Trezevant Episcopal Home (The))
Series 2013-A
5.375%, 09/01/2041 | | | 1,020 | | | | 841,032 | |
Shelby County Health Educational & Housing Facilities Board
(Village at Germantown, Inc.)
Series 2014
5.25%, 12/01/2044 | | | 1,075 | | | | 981,809 | |
5.25%, 12/01/2049 | | | 3,250 | | | | 2,860,764 | |
| | |
| |
74 | AB MUNICIPAL INCOME FUND | | abfunds.com |
PORTFOLIO OF INVESTMENTS (continued)
AB HIGH INCOME MUNICIPAL PORTFOLIO
| | | | | | | | |
| | | Principal
Amount
(000) | | | U.S. $ Value | |
| |
Wilson County Health & Educational Facilities Board
(Limestone Trail Apartments)
Series 2021
4.00%, 12/01/2039 | | $ | 5,800 | | | $ | 4,794,267 | |
| | | | | | | | |
| | | | | | | 40,001,303 | |
| | | | | | | | |
Texas – 7.4% | |
Abilene Convention Center Hotel Development Corp.
(City of Abilene TX Abilene Convention Center Revenue)
Series 2021-A
4.00%, 10/01/2050 | | | 2,895 | | | | 2,287,726 | |
Series 2021-B
5.00%, 10/01/2050(d) | | | 4,250 | | | | 3,655,643 | |
Arlington Higher Education Finance Corp.
(BASIS Texas Charter Schools, Inc.)
Series 2023
4.875%, 06/15/2056(d) | | | 1,000 | | | | 1,006,455 | |
Arlington Higher Education Finance Corp.
(Magellan School (The))
Series 2022
6.25%, 06/01/2052(d) | | | 1,100 | | | | 1,134,538 | |
6.375%, 06/01/2062(d) | | | 3,500 | | | | 3,614,997 | |
Arlington Higher Education Finance Corp.
(Uplift Education)
Series 2016-A
5.00%, 12/01/2046 | | | 2,175 | | | | 2,130,367 | |
Arlington Higher Education Finance Corp.
(Wayside Schools)
Series 2021-A
4.00%, 08/15/2041 | | | 610 | | | | 528,906 | |
Baytown Municipal Development District
(Baytown Municipal Development District Baytown Convention Center Hotel Revenue Hotel Occupancy Tax)
Series 2021
5.00%, 10/01/2050(d) | | | 6,205 | | | | 3,601,169 | |
Board of Managers Joint Guadalupe County-City of Seguin Hospital
Series 2015
5.00%, 12/01/2040 | | | 1,500 | | | | 1,364,970 | |
| | |
| |
| abfunds.com | | AB MUNICIPAL INCOME FUND | 75 |
PORTFOLIO OF INVESTMENTS (continued)
AB HIGH INCOME MUNICIPAL PORTFOLIO
| | | | | | | | |
| | | Principal
Amount
(000) | | | U.S. $ Value | |
| |
Brazoria County Industrial Development Corp. (Aleon Renewable Metals LLC)
Series 2022
10.00%, 06/01/2042(d) | | $ | 8,500 | | | $ | 8,385,461 | |
Series 2023
12.00%, 06/01/2043(d) | | | 1,000 | | | | 1,003,032 | |
City of Dallas Housing Finance Corp.
(DHFC The Briscoe Apartments LLC)
Series 2022
Zero Coupon, 12/01/2062(d) | | | 69,320 | | | | 4,923,980 | |
6.00%, 12/01/2062 | | | 8,080 | | | | 7,878,796 | |
City of Dallas Housing Finance Corp.
(DHFC The Dylan Apartments LLC)
Series 2022
6.00%, 12/01/2062(d) | | | 3,460 | | | | 3,408,875 | |
6.25%, 12/01/2054(d) | | | 1,400 | | | | 1,296,440 | |
City of Houston TX
(City of Houston TX Hotel Occupancy Tax)
Series 2015
5.00%, 09/01/2040 | | | 4,715 | | | | 4,718,242 | |
City of Houston TX Airport System Revenue
(United Airlines, Inc.)
Series 2014
5.00%, 07/01/2029 | | | 12,845 | | | | 12,846,004 | |
Clifton Higher Education Finance Corp.
(Pre-refunded – US Treasuries)
Series 2012
5.00%, 08/15/2042 (Pre-refunded/ETM) | | | 2,470 | | | | 2,474,692 | |
Series 2013
6.00%, 08/15/2043 (Pre-refunded/ETM) | | | 1,000 | | | | 1,003,747 | |
Clifton Higher Education Finance Corp.
(Valor Texas Education Foundation)
Series 2023-A
6.00%, 06/15/2048(d) | | | 1,000 | | | | 1,004,795 | |
6.25%, 06/15/2053(d) | | | 2,000 | | | | 2,024,270 | |
Conroe Local Government Corp.
(Conroe Local Government Corp.
Conroe Convention Center Hotel)
Series 2021
4.00%, 10/01/2046 | | | 1,160 | | | | 1,057,105 | |
Dallas County Flood Control District No. 1
Series 2015
5.00%, 04/01/2032(d) | | | 2,000 | | | | 1,962,538 | |
| | |
| |
76 | AB MUNICIPAL INCOME FUND | | abfunds.com |
PORTFOLIO OF INVESTMENTS (continued)
AB HIGH INCOME MUNICIPAL PORTFOLIO
| | | | | | | | |
| | | Principal
Amount
(000) | | | U.S. $ Value | |
| |
El Paso County Hospital District
Series 2017
5.00%, 08/15/2033 | | $ | 3,940 | | | $ | 3,982,993 | |
Hidalgo County Regional Mobility Authority
Series 2022-A
Zero Coupon, 12/01/2050 | | | 2,000 | | | | 483,687 | |
Zero Coupon, 12/01/2054 | | | 1,585 | | | | 296,789 | |
Series 2022-B
Zero Coupon, 12/01/2043 | | | 2,965 | | | | 1,049,224 | |
Zero Coupon, 12/01/2055 | | | 5,000 | | | | 820,882 | |
Zero Coupon, 12/01/2056 | | | 3,325 | | | | 513,826 | |
Irving Hospital Authority
(Baylor Medical Center at Irving)
Series 2017-A
5.00%, 10/15/2033 | | | 1,055 | | | | 1,069,610 | |
5.00%, 10/15/2034 | | | 1,665 | | | | 1,686,984 | |
5.00%, 10/15/2037 | | | 2,765 | | | | 2,787,401 | |
5.00%, 10/15/2038 | | | 2,615 | | | | 2,629,596 | |
5.00%, 10/15/2044 | | | 5,375 | | | | 5,377,392 | |
Kerrville Health Facilities Development Corp.
(Sid Peterson Memorial Hospital)
Series 2015
5.00%, 08/15/2035 | | | 1,800 | | | | 1,808,883 | |
Mission Economic Development Corp.
(Natgasoline LLC)
Series 2018
4.625%, 10/01/2031(d) | | | 15,000 | | | | 14,894,842 | |
New Hope Cultural Education Facilities Finance Corp.
(BSPV – Plano LLC)
Series 2023
0.00%, 12/31/2030 | | | 736 | | | | 446,128 | |
7.25%, 12/31/2030 | | | 4,145 | | | | 4,116,956 | |
New Hope Cultural Education Facilities Finance Corp.
(Buckingham Senior Living Community, Inc. Obligated Group)
Series 2021
2.00%, 11/15/2061(e)(f) | | | 9,588 | | | | 3,555,278 | |
7.50%, 11/15/2036(e)(f) | | | 2,265 | | | | 1,853,656 | |
7.50%, 11/15/2037(e)(f) | | | 365 | | | | 277,591 | |
New Hope Cultural Education Facilities Finance Corp.
(Dwyer Workforce Development)
Series 2023
8.50%, 09/01/2027(g) | | | 8,750 | | | | 8,751,515 | |
| | |
| |
| abfunds.com | | AB MUNICIPAL INCOME FUND | 77 |
PORTFOLIO OF INVESTMENTS (continued)
AB HIGH INCOME MUNICIPAL PORTFOLIO
| | | | | | | | |
| | | Principal
Amount
(000) | | | U.S. $ Value | |
| |
New Hope Cultural Education Facilities Finance Corp.
(Legacy at Midtown Park, Inc. Obligated Group)
Series 2018-A
5.50%, 07/01/2054 | | $ | 3,000 | | | $ | 2,163,883 | |
New Hope Cultural Education Facilities Finance Corp.
(Longhorn Village)
Series 2017
5.00%, 01/01/2037 | | | 2,285 | | | | 2,174,184 | |
5.00%, 01/01/2042 | | | 7,485 | | | | 6,837,845 | |
New Hope Cultural Education Facilities Finance Corp.
(Morningside Ministries Obligated Group)
Series 2020
5.00%, 01/01/2055 | | | 1,680 | | | | 1,280,583 | |
Series 2022 4.00%, 01/01/2047 | | | 1,300 | | | | 886,341 | |
4.25%, 01/01/2057 | | | 5,000 | | | | 3,271,672 | |
New Hope Cultural Education Facilities Finance Corp.
(Outlook at Windhaven Forefront Living Obligated Group)
Series 2022
6.875%, 10/01/2057 | | | 5,000 | | | | 4,717,112 | |
New Hope Cultural Education Facilities Finance Corp.
(Wesleyan Homes Obligated Group)
Series 2019
5.00%, 01/01/2055 | | | 2,200 | | | | 1,594,474 | |
New Hope Cultural Education Facilities Finance Corp.
(Westminster Manor)
Series 2016
5.00%, 11/01/2040 | | | 1,000 | | | | 1,002,880 | |
Newark Higher Education Finance Corp.
(TLC Academy)
Series 2021-A
4.00%, 08/15/2051 | | | 1,275 | | | | 1,019,611 | |
4.00%, 08/15/2056 | | | 1,380 | | | | 1,075,124 | |
Port Beaumont Navigation District
Series 2024
5.00%, 01/01/2039(c)(d) | | | 2,315 | | | | 2,315,059 | |
5.125%, 01/01/2044(c)(d) | | | 3,000 | | | | 2,999,935 | |
5.25%, 01/01/2054(c)(d) | | | 2,000 | | | | 1,999,978 | |
| | |
| |
78 | AB MUNICIPAL INCOME FUND | | abfunds.com |
PORTFOLIO OF INVESTMENTS (continued)
AB HIGH INCOME MUNICIPAL PORTFOLIO
| | | | | | | | |
| | | Principal
Amount
(000) | | | U.S. $ Value | |
| |
Port Beaumont Navigation District
(Jefferson 2020 Bond Borrower LLC)
Series 2024
10.00%, 07/01/2026(c)(d) | | $ | 2,000 | | | $ | 2,000,378 | |
Port Beaumont Navigation District
(Jefferson Railport Terminal II LLC)
Series 2020
4.00%, 01/01/2050(d) | | | 4,000 | | | | 3,283,724 | |
Series 2021 2.75%, 01/01/2036(d) | | | 1,750 | | | | 1,401,845 | |
2.875%, 01/01/2041(d) | | | 2,000 | | | | 1,486,563 | |
Tarrant County Cultural Education Facilities
Finance Corp.
Series 2015-A
5.00%, 11/15/2045(e)(f)(i)(k)(l) | | | 2,115 | | | | – 0 | – |
Series 2015-B 5.00%, 11/15/2036(e)(f)(i)(k)(l) | | | 920 | | | | – 0 | – |
Series 2017 5.25%, 11/15/2047(e)(f)(i)(k)(l) | | | 678 | | | | – 0 | – |
Tarrant County Cultural Education Facilities
Finance Corp.
(Stayton at Museum Way)
Series 2020-A
5.75%, 12/01/2054(e)(f)(i) | | | 16,668 | | | | 10,500,864 | |
Tarrant County Cultural Education Facilities
Finance Corp.
(Trinity Terrace Project)
Series 2014-A1
5.00%, 10/01/2049 | | | 2,625 | | | | 2,421,094 | |
Texas Municipal Gas Acquisition & Supply Corp. IV
(BP PLC)
Series 2023-A
5.00%, 01/01/2054(a) | | | 10,895 | | | | 11,622,696 | |
Texas Private Activity Bond Surface Transportation Corp.
(NTE Mobility Partners LLC)
Series 2023
5.50%, 12/31/2058 | | | 10,000 | | | | 10,666,004 | |
| | | | | | | | |
| | | | | | | 206,437,830 | |
| | | | | | | | |
Utah – 0.7% | | | | | | | | |
Black Desert Public Infrastructure District
(Black Desert Public Infrastructure District Black Desert Assessment Area No. 1)
Series 2024
5.625%, 12/01/2053(d) | | | 2,200 | | | | 2,240,826 | |
| | |
| |
| abfunds.com | | AB MUNICIPAL INCOME FUND | 79 |
PORTFOLIO OF INVESTMENTS (continued)
AB HIGH INCOME MUNICIPAL PORTFOLIO
| | | | | | | | |
| | | Principal
Amount
(000) | | | U.S. $ Value | |
| |
County of Utah UT
(IHC Health Services, Inc. Obligated Group)
Series 2020-I
5.00%, 05/15/2043(a) | | $ | 5,000 | | | $ | 5,238,518 | |
5.00%, 05/15/2050(a) | | | 8,000 | | | | 8,253,194 | |
Military Installation Development Authority
(Military Installation Development Authority Military Recreation Assessment Area)
Series 2021-A
4.00%, 06/01/2052 | | | 3,000 | | | | 2,233,404 | |
Wohali Public Infrastructure District No. 1
(Wohali Public Infrastructure District No. 1 Assessment Area No. 1)
Series 2023
7.00%, 12/01/2042(d) | | | 2,000 | | | | 1,967,699 | |
| | | | | | | | |
| | | | | | | 19,933,641 | |
| | | | | | | | |
Vermont – 0.1% | | | | | | | | |
Vermont Educational & Health Buildings Financing Agency
(St Michael’s College, Inc.)
Series 2023
5.50%, 10/01/2043(d) | | | 1,500 | | | | 1,494,414 | |
| | | | | | | | |
| | |
Virginia – 2.7% | | | | | | | | |
Align Affordable Housing Bond Fund LP
(Park Landing LP)
Series 2022-2
5.66%, 08/01/2052 | | | 7,300 | | | | 7,049,897 | |
Atlantic Park Community Development Authority
(Atlantic Park Community Development Authority District)
Series 2023
6.25%, 08/01/2045(d) | | | 6,410 | | | | 6,016,117 | |
Richmond Redevelopment & Housing Authority
(American Tobacco Holdings LLC)
Series 2017
5.55%, 01/01/2037(d) | | | 1,245 | | | | 1,190,658 | |
Tobacco Settlement Financing Corp./VA
Series 2007-B1
5.00%, 06/01/2047 | | | 28,805 | | | | 26,550,430 | |
| | |
| |
80 | AB MUNICIPAL INCOME FUND | | abfunds.com |
PORTFOLIO OF INVESTMENTS (continued)
AB HIGH INCOME MUNICIPAL PORTFOLIO
| | | | | | | | |
| | | Principal
Amount
(000) | | | U.S. $ Value | |
| |
US Bank Trust Co. NA
(Park Landing LP)
Series 2022-B
5.90%, 08/01/2052 | | $ | 5,336 | | | $ | 4,822,647 | |
Virginia College Building Authority
(Marymount University)
Series 2015
5.00%, 07/01/2045(d) | | | 4,000 | | | | 3,665,944 | |
Series 2015-A 5.00%, 07/01/2035(d) | | | 1,200 | | | | 1,188,980 | |
5.00%, 07/01/2045(d) | | | 3,110 | | | | 2,850,271 | |
Virginia Small Business Financing Authority
(P3 VB Holdings LLC)
Series 2023
8.50%, 12/01/2052(d) | | | 4,465 | | | | 4,314,830 | |
Virginia Small Business Financing Authority
(Total Fiber Recovery @ Chesapeake LLC)
Series 2022
8.50%, 06/01/2042(d) | | | 10,000 | | | | 9,842,427 | |
9.217% (SOFR + 5.50%),
06/01/2029(b)(d) | | | 8,500 | | | | 8,306,306 | |
| | | | | | | | |
| | | | | | | 75,798,507 | |
| | | | | | | | |
Washington – 2.3% | | | | | | | | |
Central Puget Sound Regional Transit Authority
(Central Puget Sound Regional Transit Auth Sales Motor Vehicle & Rental Car Tax)
Series 2016-S
5.00%, 11/01/2046 | | | 10,000 | | | | 11,247,012 | |
Central Puget Sound Regional Transit Authority
(Pre-refunded – US Treasuries)
Series 2015
5.00%, 11/01/2035 (Pre-refunded/ETM) | | | 15,810 | | | | 16,157,847 | |
Grays Harbor County Public Hospital District No. 1
Series 2023
6.875%, 12/01/2053 | | | 1,000 | | | | 1,014,871 | |
King County Public Hospital District No. 4
Series 2015-A
5.00%, 12/01/2038 | | | 5,700 | | | | 5,567,444 | |
Port of Seattle WA
Series 2019
5.00%, 04/01/2044(a) | | | 10,000 | | | | 10,179,203 | |
| | |
| |
| abfunds.com | | AB MUNICIPAL INCOME FUND | 81 |
PORTFOLIO OF INVESTMENTS (continued)
AB HIGH INCOME MUNICIPAL PORTFOLIO
| | | | | | | | |
| | | Principal
Amount
(000) | | | U.S. $ Value | |
| |
Washington Health Care Facilities Authority
(Fred Hutchinson Cancer Center Obligated Group)
Series 2021
3.00%, 12/01/2035(d) | | $ | 440 | | | $ | 383,026 | |
Washington Health Care Facilities Authority
(Overlake Hospital Medical Center Obligated Group)
Series 2017-B
5.00%, 07/01/2033 | | | 2,835 | | | | 2,858,445 | |
Washington State Housing Finance Commission
(Presbyterian Retirement Communities Northwest Obligated Group)
Series 2016
4.00%, 01/01/2026(d) | | | 1,625 | | | | 1,584,290 | |
5.00%, 01/01/2036(d) | | | 2,200 | | | | 2,009,571 | |
5.00%, 01/01/2046(d) | | | 4,425 | | | | 3,581,463 | |
Series 2019-A
5.00%, 01/01/2044(d) | | | 440 | | | | 363,227 | |
5.00%, 01/01/2049(d) | | | 275 | | | | 216,262 | |
Washington State Housing Finance Commission
(Riverview Retirement Community Obligated Group)
Series 2012
5.00%, 01/01/2048 | | | 5,185 | | | | 4,570,628 | |
Washington State Housing Finance Commission
(Seattle Academy of Arts & Sciences)
Series 2023
6.375%, 07/01/2063(d) | | | 3,125 | | | | 3,404,913 | |
| | | | | | | | |
| | | | | | | 63,138,202 | |
| | | | | | | | |
West Virginia – 0.6% | | | | | | | | |
City of South Charleston WV
(City of South Charleston WV South Charleston Park Place Excise Tax District)
Series 2022
4.50%, 06/01/2050(d) | | | 1,000 | | | | 757,322 | |
County of Monongalia WV
(Monongalia County Building Commission Development District No. 4)
Series 2023
5.00%, 06/01/2033(d) | | | 460 | | | | 468,669 | |
6.00%, 06/01/2053(d) | | | 1,000 | | | | 1,050,407 | |
| | |
| |
82 | AB MUNICIPAL INCOME FUND | | abfunds.com |
PORTFOLIO OF INVESTMENTS (continued)
AB HIGH INCOME MUNICIPAL PORTFOLIO
| | | | | | | | |
| | | Principal
Amount
(000) | | | U.S. $ Value | |
| |
Monongalia County Commission Excise Tax District
Series 2021-A
4.125%, 06/01/2043(d) | | $ | 2,105 | | | $ | 1,802,903 | |
Series 2023
0.00%, 06/01/2053(d)(j) | | | 5,435 | | | | 1,162,746 | |
7.00%, 06/01/2043(d) | | | 1,000 | | | | 1,049,991 | |
West Virginia Economic Development Authority
(Arch Resources, Inc.)
Series 2021
4.125%, 07/01/2045 | | | 1,990 | | | | 1,981,141 | |
West Virginia Economic Development Authority
(Wyoming County Coal LLC)
Series 2023
9.00%, 06/01/2038(d) | | | 8,000 | | | | 8,108,999 | |
| | | | | | | | |
| | | | | | | 16,382,178 | |
| | | | | | | | |
Wisconsin – 6.4% | | | | | | | | |
St. Croix Chippewa Indians of Wisconsin
Series 2021
5.00%, 09/30/2041(d) | | | 6,175 | | | | 4,551,652 | |
State of Wisconsin
Series 2025-1
5.00%, 05/01/2033(c) | | | 2,750 | | | | 3,016,931 | |
Wisconsin Center District
AGM Series 2020-D
Zero Coupon, 12/15/2050 | | | 44,075 | | | | 11,888,028 | |
Wisconsin Center District
(Wisconsin Center District Ded Tax)
Series 2022
5.25%, 12/15/2061(d) | | | 2,000 | | | | 2,001,683 | |
Wisconsin Health & Educational Facilities Authority
(Marshfield Clinic Health System Obligated Group)
AGM Series 2020
4.00%, 02/15/2035 | | | 800 | | | | 788,863 | |
Wisconsin Health & Educational Facilities Authority
(Oakwood Lutheran Senior Ministries Obligated Group)
Series 2021
4.00%, 01/01/2047 | | | 2,400 | | | | 1,644,776 | |
| | |
| |
| abfunds.com | | AB MUNICIPAL INCOME FUND | 83 |
PORTFOLIO OF INVESTMENTS (continued)
AB HIGH INCOME MUNICIPAL PORTFOLIO
| | | | | | | | |
| | | Principal
Amount
(000) | | | U.S. $ Value | |
| |
Wisconsin Health & Educational Facilities Authority
(St. Camillus Health System Obligated Group)
Series 2019
5.00%, 11/01/2046 | | $ | 980 | | | $ | 831,203 | |
5.00%, 11/01/2054 | | | 1,100 | | | | 881,155 | |
Wisconsin Housing & Economic Development Authority
(Roers Sun Prairie Apartments Owner LLC)
Series 2022
4.625%, 03/15/2040(d) | | | 1,605 | | | | 1,404,819 | |
Series 2022-A
3.875%, 12/01/2039(d) | | | 7,370 | | | | 6,400,225 | |
Wisconsin Public Finance Authority
Series 2024
Zero Coupon, 02/01/2031 | | | 5,000 | | | | 3,044,167 | |
Wisconsin Public Finance Authority
(21st Century Public Academy)
Series 2020
5.00%, 06/01/2040(d) | | | 750 | | | | 679,564 | |
Wisconsin Public Finance Authority
(Bancroft Neurohealth Obligated Group)
Series 2016
5.125%, 06/01/2048(d) | | | 8,770 | | | | 7,841,504 | |
Wisconsin Public Finance Authority
(Catholic Bishop of Chicago (The))
Series 2021
5.75%, 07/25/2041(g) | | | 27,000 | | | | 23,920,248 | |
Wisconsin Public Finance Authority
(CFC-SA LLC)
Series 2022
5.00%, 02/01/2052 | | | 7,250 | | | | 7,115,341 | |
5.75%, 02/01/2052(d) | | | 13,000 | | | | 12,988,294 | |
6.00%, 02/01/2062(d) | | | 7,850 | | | | 7,978,910 | |
Wisconsin Public Finance Authority
(Crossroads Health Project)
Series 2023
8.00%, 07/01/2053(d) | | | 5,500 | | | | 5,555,702 | |
8.125%, 07/01/2058(d) | | | 5,500 | | | | 5,557,358 | |
Wisconsin Public Finance Authority
(FAH Tree House LLC)
Series 2023
6.50%, 08/01/2053(d) | | | 6,875 | | | | 6,898,932 | |
6.625%, 02/01/2046(d) | | | 4,750 | | | | 4,447,085 | |
| | |
| |
84 | AB MUNICIPAL INCOME FUND | | abfunds.com |
PORTFOLIO OF INVESTMENTS (continued)
AB HIGH INCOME MUNICIPAL PORTFOLIO
| | | | | | | | |
| | | Principal
Amount
(000) | | | U.S. $ Value | |
| |
Wisconsin Public Finance Authority
(Gannon University)
Series 2017
5.00%, 05/01/2047 | | $ | 1,000 | | | $ | 915,176 | |
Wisconsin Public Finance Authority
(KDC Agribusiness LLC)
12.00%, 09/14/2023(e)(k)(l)(m) | | | 3,409 | | | | 340,900 | |
Series 2022
15.00%, 04/30/2023(e)(g)(k)(l)(m) | | | 7,500 | | | | – 0 | – |
Series 2023
15.00%, 04/30/2023(e)(g)(k)(l)(m) | | | 1,815 | | | | – 0 | – |
Wisconsin Public Finance Authority
(Lehigh Valley Health Network, Inc.)
Series 2023
6.625%, 12/01/2032(d) | | | 1,000 | | | | 995,925 | |
7.25%, 12/01/2042(d) | | | 2,370 | | | | 2,380,399 | |
7.50%, 12/01/2052(d) | | | 2,060 | | | | 2,088,325 | |
Wisconsin Public Finance Authority
(McLemore Resort Manager LLC)
Series 2021
4.50%, 06/01/2056(d) | | | 6,640 | | | | 5,229,892 | |
Wisconsin Public Finance Authority
(North San Gabriel Municipal Utility District No. 1)
Series 2023
Zero Coupon, 09/01/2029(d) | | | 3,000 | | | | 2,054,014 | |
Wisconsin Public Finance Authority
(Pre-refunded – US Treasuries)
Series 2020
5.00%, 04/01/2050 (Pre-refunded/ETM)(d) | | | 40 | | | | 43,382 | |
Wisconsin Public Finance Authority
(RBS Evolution LLC)
Series 2023
10.00%, 11/01/2038(d) | | | 6,000 | | | | 6,013,383 | |
Wisconsin Public Finance Authority
(Samaritan Housing Foundation Obligated Group)
Series 2021
4.00%, 06/01/2056(d) | | | 16,500 | | | | 12,125,537 | |
Series 2022
4.00%, 06/01/2049(d) | | | 3,980 | | | | 3,062,379 | |
Wisconsin Public Finance Authority
(Seabury Retirement Community)
Series 2015-A
5.00%, 09/01/2038(d) | | | 1,725 | | | | 1,604,953 | |
| | |
| |
| abfunds.com | | AB MUNICIPAL INCOME FUND | 85 |
PORTFOLIO OF INVESTMENTS (continued)
AB HIGH INCOME MUNICIPAL PORTFOLIO
| | | | | | | | |
| | | Principal
Amount
(000) | | | U.S. $ Value | |
| |
Wisconsin Public Finance Authority
(Southeast Overtown Park West Community Redevelopment Agency)
Series 2024
5.00%, 06/01/2041(d) | | $ | 4,000 | | | $ | 4,000,562 | |
Wisconsin Public Finance Authority
(Southeastern Regional Medical Center Obligated Group)
Series 2022
4.00%, 02/01/2035 | | | 1,650 | | | | 1,376,906 | |
Wisconsin Public Finance Authority
(UMA Education, Inc.)
Series 2019
5.00%, 10/01/2034(d) | | | 2,495 | | | | 2,558,243 | |
5.00%, 10/01/2039(d) | | | 5,095 | | | | 5,130,638 | |
Wisconsin Public Finance Authority
(Uwharrie Charter Academy)
Series 2022
5.00%, 06/15/2062(d) | | | 5,000 | | | | 4,454,608 | |
Wisconsin Public Finance Authority
(Washoe Barton Medical Clinic)
Series 2021
4.00%, 12/01/2041(d) | | | 2,500 | | | | 2,149,676 | |
4.00%, 12/01/2051(d) | | | 1,500 | | | | 1,159,963 | |
Wisconsin Public Finance Authority
(WFCS Holdings II LLC)
Series 2021-A1
5.00%, 01/01/2056(d) | | | 1,150 | | | | 1,009,128 | |
| | | | | | | | |
| | | | | | | 178,130,429 | |
| | | | | | | | |
Total Municipal Obligations
(cost $3,219,493,597) | | | | | | | 2,892,394,352 | |
| | | | | | | | |
| | | | | | | | |
COMMERCIAL MORTGAGE-BACKED SECURITIES – 1.7% | | | | | | | | |
Agency CMBS – 0.2% | |
California Housing Finance Agency
Series 2021-2, Class X
0.82%, 03/25/2035(n) | | | 15,444 | | | | 706,165 | |
Series 2021-3, Class A
3.25%, 08/20/2036 | | | 3,845 | | | | 3,460,919 | |
Series 2021-3, Class X
0.77%, 08/20/2036(n) | | | 13,721 | | | | 687,467 | |
Federal Home Loan Mortgage Corp. Multifamily VRD Certificates
Series 2022-ML13, Class XCA
0.96%, 07/25/2036(n) | | | 6,643 | | | | 351,083 | |
| | |
| |
86 | AB MUNICIPAL INCOME FUND | | abfunds.com |
PORTFOLIO OF INVESTMENTS (continued)
AB HIGH INCOME MUNICIPAL PORTFOLIO
| | | | | | | | |
| | | Principal
Amount
(000) | | | U.S. $ Value | |
| |
Series 2022-ML13, Class XUS
0.98%, 09/25/2036(n) | | $ | 11,697 | | | $ | 767,050 | |
| | | | | | | | |
| | | | | | | 5,972,684 | |
| | | | | | | | |
Non-Agency Fixed Rate CMBS – 1.5% | | | | | | | | |
Arizona Industrial Development Authority
Series 2019-2, Class A
3.625%, 05/20/2033 | | | 10,407 | | | | 9,411,183 | |
California Housing Finance Agency
Series 2019-2, Class A
4.00%, 03/20/2033 | | | 5,180 | | | | 5,088,786 | |
Series 2021-1, Class A
3.50%, 11/20/2035 | | | 4,137 | | | | 3,859,412 | |
City of Fort Wayne IN
10.75%, 12/01/2029(e)(f) | | | 328 | | | | 33 | |
National Finance Authority
Series 2022-2, Class X
0.652%, 10/01/2036(n) | | | 9,787 | | | | 456,301 | |
New Hampshire Business Finance Authority
Series 2020-1, Class A
4.125%, 01/20/2034 | | | 11,996 | | | | 11,400,256 | |
Series 2022-1, Class X
0.334%, 09/20/2036(n) | | | 10,730 | | | | 230,374 | |
Washington State Housing Finance Commission
Series 2021-1, Class A
3.50%, 12/20/2035 | | | 9,697 | | | | 8,588,446 | |
Series 2021-1, Class X
0.726%, 12/20/2035(n) | | | 7,643 | | | | 332,377 | |
Series 2023-1, Class X
1.448%, 04/20/2037(n) | | | 19,921 | | | | 2,123,419 | |
| | | | | | | | |
| | | | | | | 41,490,587 | |
| | | | | | | | |
Total Commercial Mortgage-Backed Securities
(cost $56,244,219) | | | | | | | 47,463,271 | |
| | | | | | | | |
| | | | | | | | |
CORPORATES - NON-INVESTMENT GRADE – 0.7% | | | | | | | | |
Industrial – 0.7% | | | | | | | | |
Communications - Media – 0.2% | | | | | | | | |
CCO Holdings LLC/CCO Holdings Capital Corp.
4.25%, 01/15/2034(d) | | | 7,730 | | | | 5,778,870 | |
| | | | | | | | |
| | |
| |
| abfunds.com | | AB MUNICIPAL INCOME FUND | 87 |
PORTFOLIO OF INVESTMENTS (continued)
AB HIGH INCOME MUNICIPAL PORTFOLIO
| | | | | | | | |
| | | Principal
Amount
(000) | | | U.S. $ Value | |
| |
Consumer Cyclical - Entertainment – 0.3% | |
Wild Rivers Water Park
8.50%, 11/01/2051(k)(l) | | $ | 13,775 | | | $ | 8,560,259 | |
| | | | | | | | |
| | |
Consumer Non-Cyclical – 0.1% | | | | | | | | |
Tower Health
Series 2020
4.451%, 02/01/2050 | | | 5,300 | | | | 2,367,245 | |
| | | | | | | | |
| | |
Energy – 0.0% | | | | | | | | |
Red River Biorefinery LLC
Series 2024
15.00%, 07/31/2024(g)(k)(l) | | | 105 | | | | 31,500 | |
Series 23A
15.00%, 07/31/2024(g)(k)(l) | | | 245 | | | | 73,500 | |
| | | | | | | | |
| | | | | | | 105,000 | |
| | | | | | | | |
Other Industrial – 0.0% | | | | | | | | |
Cincinnati Sr Care/Dayton/Florida/Nashville/Sebring/Trousdale/Waynesboro HC
Series 2023
12.00%, 12/31/2023(g)(k)(l) | | | 395 | | | | 395,000 | |
| | | | | | | | |
| | |
Services – 0.1% | | | | | | | | |
Trousdale Issuer LLC
Series A
6.50%, 04/01/2025(e)(f)(k)(l) | | | 5,265 | | | | 1,158,300 | |
| | | | | | | | |
Total Corporates – Non-Investment Grade
(cost $26,236,850) | | | | | | | 18,364,674 | |
| | | | | | | | |
| | | | | | | | |
CORPORATES - INVESTMENT GRADE – 0.2% | | | | | | | | |
Financial Institutions – 0.2% | | | | | | | | |
Banking – 0.2% | | | | | | | | |
Citigroup, Inc.
Series Z
7.375%, 05/15/2028(o)
(cost $6,136,127) | | | 6,300 | | | | 6,458,130 | |
| | | | | | | | |
| | | | | | | | |
ASSET-BACKED SECURITIES – 0.2% | | | | | | | | |
Other ABS - Fixed Rate – 0.2% | | | | | | | | |
HTA TRRB Custodial Trust
Series 2022
5.25%, 07/01/2036 | | | 2,925 | | | | 2,936,487 | |
5.25%, 07/01/2041 | | | 3,500 | | | | 3,406,961 | |
| | | | | | | | |
Total Asset-Backed Securities
(cost $6,394,067) | | | | | | | 6,343,448 | |
| | | | | | | | |
| | |
| |
88 | AB MUNICIPAL INCOME FUND | | abfunds.com |
PORTFOLIO OF INVESTMENTS (continued)
AB HIGH INCOME MUNICIPAL PORTFOLIO
| | | | | | | | |
| | |
Shares | | | U.S. $ Value | |
| |
PREFERRED STOCKS – 0.0% | | | | | | | | |
Utility – 0.0% | | | | | | | | |
Electric – 0.0% | | | | | | | | |
AES Puerto Rico LP
0.00%(e)(k)(l)
(cost $4,015,771) | | | 221,631 | | | $ | 644,946 | |
| | | | | | | | |
| | | | | | | | |
SHORT-TERM INVESTMENTS – 0.3% | | | | | | | | |
Investment Companies – 0.3% | | | | | | | | |
AB Fixed Income Shares, Inc. – Government Money Market Portfolio – Class AB, 5.22%(p)(q)(r)
(cost $8,116,755) | | | 8,116,755 | | | | 8,116,755 | |
| | | | | | | | |
| | |
Total Investments – 106.8%
(cost $3,326,637,386) | | | | | | | 2,979,785,576 | |
Other assets less liabilities – (6.8)% | | | | | | | (189,645,106 | ) |
| | | | | | | | |
| | |
Net Assets – 100.0% | | | | | | $ | 2,790,140,470 | |
| | | | | | | | |
CENTRALLY CLEARED CREDIT DEFAULT SWAPS (see Note D)
| | | | | | | | | | | | | | | | | | | | | | | | | | | | | | | | |
Description | | Fixed
Rate
(Pay)
Receive | | | Payment
Frequency | | | Implied
Credit
Spread at
May 31,
2024 | | | Notional
Amount
(000) | | | Market
Value | | | Upfront
Premiums
Paid
(Received) | | | Unrealized
Appreciation
(Depreciation) | |
Buy Contracts | | | | | | | | | | | | | | | | | | | | | | | | | | | | | | | | |
CDX-NAHY Series 42, 5 Year Index, 06/20/2029* | | | (5.00 | )% | | | Quarterly | | | | 3.34 | % | | | USD | | | | 129,430 | | | $ | (10,053,277 | ) | | $ | (8,488,918) | | | $ | (1,564,359 | ) |
CENTRALLY CLEARED INTEREST RATE SWAPS (see Note D)
| | | | | | | | | | | | | | | | | | | | | | | | | | | | | | |
| | | | | | | | | Rate Type | | | | | | | | | | | | | |
Notional
Amount
(000) | | | Termination
Date | | | Payments
made
by the
Fund | | Payments
received
by the
Fund | | | Payment
Frequency
Paid/
Received | | | Market
Value | | | Upfront
Premiums
Paid
(Received) | | | Unrealized
Appreciation
(Depreciation) | |
| USD | | | 140,000 | | | | 01/15/2027 | | | 1 Day SOFR | | | 3.848% | | | | Annual | | | $ | (3,438,500 | ) | | $ | – 0 | – | | $ | (3,438,500 | ) |
| USD | | | 100,700 | | | | 01/15/2027 | | | 1 Day SOFR | | | 3.528% | | | | Annual | | | | (3,381,967 | ) | | | – 0 | – | | | (3,381,967 | ) |
| USD | | | 55,130 | | | | 04/30/2030 | | | 1 Day SOFR | | | 3.500% | | | | Annual | | | | (2,186,027 | ) | | | – 0 | – | | | (2,186,027 | ) |
| USD | | | 9,000 | | | | 04/30/2030 | | | 1 Day SOFR | | | 3.075% | | | | Annual | | | | (557,915 | ) | | | – 0 | – | | | (557,915 | ) |
| USD | | | 34,200 | | | | 11/01/2030 | | | 1 Day SOFR | | | 4.204% | | | | Annual | | | | (243,264 | ) | | | – 0 | – | | | (243,264 | ) |
| USD | | | 82,000 | | | | 01/08/2031 | | | 1 Day SOFR | | | 3.580% | | | | Annual | | | | (3,412,429 | ) | | | – 0 | – | | | (3,412,429 | ) |
| USD | | | 88,000 | | | | 07/31/2031 | | | 1 Day SOFR | | | 4.059% | | | | Annual | | | | (717,392 | ) | | | 9,973 | | | | (727,365 | ) |
| USD | | | 15,000 | | | | 02/15/2041 | | | 1 Day SOFR | | | 2.832% | | | | Annual | | | | (2,426,171 | ) | | | – 0 | – | | | (2,426,171 | ) |
| | | | | | | | | | | | | | | | | | | | | | | | | | | | | | |
| | | | | | | | | | | | | | | | | | | | $ | (16,363,665 | ) | | $ | 9,973 | | | $ | (16,373,638 | ) |
| | | | | | | | | | | | | | | | | | | | | | | | | | | | | | |
| | |
| |
| abfunds.com | | AB MUNICIPAL INCOME FUND | 89 |
PORTFOLIO OF INVESTMENTS (continued)
AB HIGH INCOME MUNICIPAL PORTFOLIO
CREDIT DEFAULT SWAPS (see Note D)
| | | | | | | | | | | | | | | | | | | | | | | | | | | | | | | | |
Swap
Counterparty &
Referenced
Obligation | | Fixed
Rate
(Pay)
Receive | | | Payment
Frequency | | | Implied
Credit
Spread at
May 31,
2024 | | | Notional
Amount
(000) | | | Market
Value | | | Upfront
Premiums
Paid
(Received) | | | Unrealized
Appreciation
(Depreciation) | |
Sale Contracts | | | | | | | | | | | | | | | | | | | | | | | | | | | | | | | | |
Citigroup Global Markets, Inc. | | | | | | | | | | | | | | | | | | | | | | | | | | | | | |
CDX-CMBX.NA.BBB- Series 6, 05/11/2063* | | | 3.00 | % | | | Monthly | | | | 5.00 | % | | | USD | | | | 227 | | | $ | (29,390 | ) | | $ | (25,757) | | | $ | (3,633 | ) |
CDX-CMBX.NA.BBB- Series 6, 05/11/2063* | | | 3.00 | | | | Monthly | | | | 5.00 | | | | USD | | | | 325 | | | | (42,010 | ) | | | (36,674) | | | | (5,336 | ) |
CDX-CMBX.NA.BBB- Series 6, 05/11/2063* | | | 3.00 | | | | Monthly | | | | 5.00 | | | | USD | | | | 167 | | | | (21,610 | ) | | | (14,977) | | | | (6,633 | ) |
CDX-CMBX.NA.BBB- Series 6, 05/11/2063* | | | 3.00 | | | | Monthly | | | | 5.00 | | | | USD | | | | 1,107 | | | | (143,087 | ) | | | (127,940) | | | | (15,147 | ) |
Credit Suisse International | | | | | | | | | | | | | | | | | | | | | | | | | | | | | | | | |
CDX-CMBX.NA.BBB-
Series 6, 05/11/2063* | | | 3.00 | | | | Monthly | | | | 5.00 | | | | USD | | | | 74 | | | | (9,508 | ) | | | (8,245) | | | | (1,263 | ) |
CDX-CMBX.NA.BBB-
Series 6, 05/11/2063* | | | 3.00 | | | | Monthly | | | | 5.00 | | | | USD | | | | 92 | | | | (11,871 | ) | | | (8,303) | | | | (3,568 | ) |
CDX-CMBX.NA.BBB-
Series 6, 05/11/2063* | | | 3.00 | | | | Monthly | | | | 5.00 | | | | USD | | | | 892 | | | | (115,254 | ) | | | (77,432) | | | | (37,822 | ) |
CDX-CMBX.NA.BBB-
Series 6, 05/11/2063* | | | 3.00 | | | | Monthly | | | | 5.00 | | | | USD | | | | 2,254 | | | | (291,246 | ) | | | (250,876) | | | | (40,370 | ) |
CDX-CMBX.NA.BBB-
Series 6, 05/11/2063* | | | 3.00 | | | | Monthly | | | | 5.00 | | | | USD | | | | 1,141 | | | | (147,410 | ) | | | (103,233) | | | | (44,177 | ) |
CDX-CMBX.NA.BBB-
Series 6, 05/11/2063* | | | 3.00 | | | | Monthly | | | | 5.00 | | | | USD | | | | 1,717 | | | | (221,865 | ) | | | (151,384) | | | | (70,481 | ) |
Goldman Sachs International | | | | | | | | | | | | | | | | | | | | | | | | | | | | | | | | |
CDX-CMBX.NA.BBB-
Series 6, 05/11/2063* | | | 3.00 | | | | Monthly | | | | 5.00 | | | | USD | | | | 3,724 | | | | (481,243 | ) | | | (484,105) | | | | 2,862 | |
CDX-CMBX.NA.BBB-
Series 6, 05/11/2063* | | | 3.00 | | | | Monthly | | | | 5.00 | | | | USD | | | | 427 | | | | (55,207 | ) | | | (49,156) | | | | (6,051 | ) |
CDX-CMBX.NA.BBB-
Series 6, 05/11/2063* | | | 3.00 | | | | Monthly | | | | 5.00 | | | | USD | | | | 1,383 | | | | (178,644 | ) | | | (150,482 | ) | | | (28,162 | ) |
CDX-CMBX.NA.BBB-
Series 6, 05/11/2063* | | | 3.00 | | | | Monthly | | | | 5.00 | | | | USD | | | | 1,115 | | | | (144,067 | ) | | | (93,007) | | | | (51,060 | ) |
CDX-CMBX.NA.BBB-
Series 6, 05/11/2063* | | | 3.00 | | | | Monthly | | | | 5.00 | | | | USD | | | | 1,488 | | | | (192,244 | ) | | | (127,320) | | | | (64,924 | ) |
Morgan Stanley Capital Services LLC | | | | | | | | | | | | | | | | | | | | | | | | | | | | | | | | |
CDX-CMBX.NA.BBB- Series 6, 05/11/2063* | | | 3.00 | | | | Monthly | | | | 5.00 | | | | USD | | | | 1,548 | | | | (199,966 | ) | | | (129,558 | ) | | | (70,408 | ) |
| | | | | | | | | | | | | | | | | | | | | | | | | | | | | | | | |
| | | | | | | | | | | | | | | | | | | | | | $ | (2,284,622 | ) | | $ | (1,838,449 | ) | | $ | (446,173 | ) |
| | | | | | | | | | | | | | | | | | | | | | | | | | | | | | | | |
INTEREST RATE SWAPS (see Note D)
| | | | | | | | | | | | | | | | | | | | | | | | | | | | | | |
| | | | | | | | | Rate Type | | | | | | | | | | | |
Swap
Counterparty | | Notional
Amount
(000) | | | Termination
Date | | | Payments
made
by the
Fund | | Payments
received
by the
Fund | | Payment
Frequency
Paid/
Received | | Market
Value | | | Upfront
Premiums
Paid/
(Received) | | | Unrealized
Appreciation/
(Depreciation) | |
Bank of America, NA | | | USD | | | | 20,000 | | | | 06/21/2024 | | | MMD 5 Year^ | | 2.970% | | Maturity | | $ | (133,298 | ) | | $ | – 0 | – | | $ | (133,298 | ) |
| | |
| |
90 | AB MUNICIPAL INCOME FUND | | abfunds.com |
PORTFOLIO OF INVESTMENTS (continued)
AB HIGH INCOME MUNICIPAL PORTFOLIO
| | | | | | | | | | | | | | | | | | | | | | | | | | | | | | |
| | | | | | | | | Rate Type | | | | | | | | | | | |
Swap
Counterparty | | Notional
Amount
(000) | | | Termination
Date | | | Payments
made
by the
Fund | | Payments
received
by the
Fund | | Payment
Frequency
Paid/
Received | | Market
Value | | | Upfront
Premiums
Paid/
(Received) | | | Unrealized
Appreciation/
(Depreciation) | |
Bank of America, NA | | | USD | | | | 30,000 | | | | 05/21/2025 | | | MMD 5 Year^ | | 3.200% | | Maturity | | $ | (284,497 | ) | | $ | – 0 | – | | $ | (284,497 | ) |
Citibank, NA | | | USD | | | | 10,000 | | | | 09/26/2024 | | | MMD 5 Year^ | | 3.490% | | Maturity | | | 153,824 | | | | – 0 | – | | | 153,824 | |
Citibank, NA | | | USD | | | | 20,000 | | | | 10/15/2024 | | | MMD 5 Year^ | | 3.590% | | Maturity | | | 286,438 | | | | – 0 | – | | | 286,438 | |
Citibank, NA | | | USD | | | | 25,000 | | | | 11/18/2024 | | | MMD 5 Year^ | | 3.250% | | Maturity | | | 14,733 | | | | – 0 | – | | | 14,733 | |
Citibank, NA | | | USD | | | | 21,490 | | | | 10/09/2029 | | | 1.125% | | SIFMA* | | Quarterly | | | 2,220,593 | | | | – 0 | – | | | 2,220,593 | |
JPMorgan Chase Bank, NA | | | USD | | | | 15,000 | | | | 03/27/2025 | | | MMD 5 Year^ | | 2.920% | | Maturity | | | (309,644 | ) | | | – 0 | – | | | (309,644 | ) |
Morgan Stanley Capital Services LLC | | | USD | | | | 20,000 | | | | 11/04/2024 | | | MMD 5 Year^ | | 3.730% | | Maturity | | | 495,820 | | | | – 0 | – | | | 495,820 | |
Morgan Stanley Capital Services LLC | | | USD | | | | 20,000 | | | | 11/07/2024 | | | MMD 5 Year^ | | 3.420% | | Maturity | | | 192,366 | | | | – 0 | – | | | 192,366 | |
Morgan Stanley Capital Services LLC | | | USD | | | | 20,000 | | | | 03/17/2025 | | | MMD 5 Year^ | | 2.910% | | Maturity | | | (417,225 | ) | | | – 0 | – | | | (417,225 | ) |
Morgan Stanley Capital Services LLC | | | USD | | | | 30,000 | | | | 03/26/2025 | | | MMD 5 Year^ | | 2.880% | | Maturity | | | (675,756 | ) | | | – 0 | – | | | (675,756 | ) |
Morgan Stanley Capital Services LLC | | | USD | | | | 20,000 | | | | 04/16/2025 | | | MMD 5 Year^ | | 3.040% | | Maturity | | | (313,897 | ) | | | – 0 | – | | | (313,897 | ) |
Morgan Stanley Capital Services LLC | | | USD | | | | 20,000 | | | | 04/21/2025 | | | MMD 10 Year^ | | 3.220% | | Maturity | | | (304,375 | ) | | | – 0 | – | | | (304,375 | ) |
Morgan Stanley Capital Services LLC | | | USD | | | | 25,000 | | | | 05/09/2025 | | | MMD 5 Year^ | | 3.050% | | Maturity | | | (403,395 | ) | | | – 0 | – | | | (403,395 | ) |
Morgan Stanley Capital Services LLC | | | USD | | | | 35,000 | | | | 05/27/2025 | | | MMD 5 Year^ | | 3.310% | | Maturity | | | (161,916 | ) | | | – 0 | – | | | (161,916 | ) |
| | | | | | | | | | | | | | | | | | | | | | | | | | | | | | |
| | | | | | | | | | | | | | | | | | | | $ | 359,771 | | | $ | – 0 | – | | $ | 359,771 | |
| | | | | | | | | | | | | | | | | | | | | | | | | | | | | | |
| ^ | Variable interest rate based on the Municipal Market Data AAA General Obligation Scale. |
| | |
| |
| abfunds.com | | AB MUNICIPAL INCOME FUND | 91 |
PORTFOLIO OF INVESTMENTS (continued)
AB HIGH INCOME MUNICIPAL PORTFOLIO
| * | Variable interest rate based on the Securities Industry & Financial Markets Association (SIFMA) Municipal Swap Index. |
| (a) | Security represents the underlying municipal obligation of an inverse floating rate obligation held by the Fund (see Note I). |
| (b) | Floating Rate Security. Stated interest/floor/ceiling rate was in effect at May 31, 2024. |
| (c) | When-Issued or delayed delivery security. |
| (d) | Security is exempt from registration under Rule 144A or Regulation S of the Securities Act of 1933. These securities are considered restricted, but liquid and may be resold in transactions exempt from registration. At May 31, 2024, the aggregate market value of these securities amounted to $854,506,574 or 30.6% of net assets. |
| (e) | Non-income producing security. |
| (g) | Security is exempt from registration under Rule 144A or Regulation S of the Securities Act of 1933. These securities, which represent 3.35% of net assets as of May 31, 2024, are considered illiquid and restricted. Additional information regarding such securities follows: |
| | | | | | | | | | | | | | |
144A/Restricted & Illiquid
Securities | | Acquisition
Date | | Cost | | | Market
Value | | | Percentage of
Net Assets | |
ARC70 II TRUST
Series 2023
4.84%, 04/01/2065 | | 07/18/2023 | | $ | 19,083,767 | | | $ | 18,296,161 | | | | 0.66 | % |
Arizona Industrial Development Authority
(Legacy Cares, Inc.)
Series 2021-A
5.50%, 07/01/2031 | | 08/12/2020 – 06/10/2022 | | | 466,370 | | | | 28,800 | | | | 0.00 | % |
Arizona Industrial Development Authority
(Legacy Cares, Inc.)
Series 2021-A
6.00%, 07/01/2051 | | 06/04/2021 – 07/21/2022 | | | 3,000,000 | | | | 180,000 | | | | 0.01 | % |
Arizona Industrial Development Authority
(Legacy Cares, Inc.)
Series 2020
7.75%, 07/01/2050 | | 06/04/2021 | | | 10,701,376 | | | | 625,200 | | | | 0.02 | % |
Cincinnati Sr Care/Dayton/Florida/Nashville/Sebring/Trousdale/Waynesboro HC
Series 2023
12.00%, 12/31/2023 | | 08/24/2023 | | | 395,000 | | | | 395,000 | | | | 0.01 | % |
County of Grand Forks ND
(Red River Biorefinery LLC) Series 2021
6.625%, 12/15/2031 | | 05/21/2021 | | | 1,550,000 | | | | 20,150 | | | | 0.00 | % |
| | |
| |
92 | AB MUNICIPAL INCOME FUND | | abfunds.com |
PORTFOLIO OF INVESTMENTS (continued)
AB HIGH INCOME MUNICIPAL PORTFOLIO
| | | | | | | | | | | | | | |
144A/Restricted & Illiquid
Securities | | Acquisition
Date | | Cost | | | Market
Value | | | Percentage of
Net Assets | |
County of Grand Forks ND
(Red River Biorefinery LLC) Series 2021
7.00%, 12/15/2043 | | 05/21/2021 | | $ | 1,610,000 | | | $ | 20,930 | | | | 0.00 | % |
County of Montgomery OH
(Trousdale Foundation Obligated Group)
Series 2018-A
6.25%, 04/01/2049 | | 08/29/2018 – 10/05/2020 | | | 3,483,950 | | | | 1,371,545 | | | | 0.05 | % |
Douglas County Housing Partnership
(Bridgewater Castle Rock ALF LLC)
Series 2021
5.375%, 01/01/2041 | | 01/14/2021 | | | 9,860,216 | | | | 7,412,188 | | | | 0.27 | % |
Indiana Finance Authority
(Brightmark Plastics Renewal Indiana LLC) Series 2019
7.00%, 03/01/2039 | | 03/28/2019 – 02/09/2022 | | | 16,892,330 | | | | 12,179,635 | | | | 0.44 | % |
Metropolitan Government Nashville & Davidson County Health & Educational Facilities Board
(Trousdale Foundation Obligated Group)
Series 2018-A
7.50%, 04/01/2049 | | 01/27/2021 | | | 35,000 | | | | 1,000 | | | | 0.00 | % |
Metropolitan Government Nashville & Davidson County Health & Educational Facilities Board
(Trousdale Foundation Obligated Group)
Series 2018-A
6.25%, 04/01/2049 | | 08/29/2018 | | | 4,434,727 | | | | 1,174,295 | | | | 0.04 | % |
Mississippi Business Finance Corp.
(Alden Group Renewable Energy Mississippi LLC) Series 2022
8.00%, 12/01/2029 | | 12/13/2022 | | | 5,678,057 | | | | 5,633,315 | | | | 0.20 | % |
| | |
| |
| abfunds.com | | AB MUNICIPAL INCOME FUND | 93 |
PORTFOLIO OF INVESTMENTS (continued)
AB HIGH INCOME MUNICIPAL PORTFOLIO
| | | | | | | | | | | | | | |
144A/Restricted & Illiquid
Securities | | Acquisition
Date | | Cost | | | Market
Value | | | Percentage of
Net Assets | |
Nassau County Industrial Development Agency (Amsterdam House Continuing Care Retirement Community, Inc.)
Series 2021
9.00%, 01/01/2041 | | 09/03/2021 | | $ | 3,660,000 | | | $ | 3,660,000 | | | | 0.13 | % |
New Hope Cultural Education Facilities Finance Corp.
(Dwyer Workforce Development)
Series 2023
8.50%, 09/01/2027 | | 02/03/2023 | | | 8,750,000 | | | | 8,751,515 | | | | 0.31 | % |
Pueblo Urban Renewal Authority
Series 2021
4.75%, 12/01/2045 | | 03/24/2021 – 03/30/2021 | | | 3,889,990 | | | | 2,542,801 | | | | 0.09 | % |
Red River Biorefinery LLC Series 2024
15.00%, 07/31/2024 | | 01/25/2024 | | | 105,000 | | | | 31,500 | | | | 0.00 | % |
Red River Biorefinery LLC Series 23A
15.00%, 07/31/2024 | | 05/31/2023 | | | 245,000 | | | | 73,500 | | | | 0.00 | % |
Scranton-Lackawanna Health and Welfare Authority
(Scranton Parking System Concession Project)
Series 2016-D
Zero Coupon, 01/01/2057 | | 08/24/2016 | | | 7,393,101 | | | | 3,305,340 | | | | 0.12 | % |
South Carolina Jobs-Economic Development Authority
(Last Step Recycling LLC) Series 2021
6.25%, 06/01/2040 | | 06/16/2021 – 07/20/2022 | | | 3,043,149 | | | | 1,995,723 | | | | 0.07 | % |
South Carolina Jobs-Economic Development Authority
(Last Step Recycling LLC) Series 2021
6.50%, 06/01/2051 | | 06/16/2021 – 10/20/2022 | | | 2,823,606 | | | | 1,845,575 | | | | 0.07 | % |
| | |
| |
94 | AB MUNICIPAL INCOME FUND | | abfunds.com |
PORTFOLIO OF INVESTMENTS (continued)
AB HIGH INCOME MUNICIPAL PORTFOLIO
| | | | | | | | | | | | | | |
144A/Restricted & Illiquid
Securities | | Acquisition
Date | | Cost | | | Market
Value | | | Percentage of
Net Assets | |
Wisconsin Public Finance Authority
(Catholic Bishop of Chicago (The))
Series 2021
5.75%, 07/25/2041 | | 08/03/2021 | | $ | 27,000,000 | | | $ | 23,920,248 | | | | 0.86 | % |
Wisconsin Public Finance Authority
(KDC Agribusiness LLC) Series 2022
15.00%, 04/30/2023 | | 11/10/2022 | | | 7,500,000 | | | | – 0 | – | | | 0.00 | % |
Wisconsin Public Finance Authority
(KDC Agribusiness LLC) Series 2023
15.00%, 04/30/2023 | | 03/16/2023 | | | 1,815,000 | | | | – 0 | – | | | 0.00 | % |
| (h) | Inverse floater security. |
| (i) | Restricted and illiquid security. |
| | | | | | | | | | | | | | |
Restricted & Illiquid
Securities | | Acquisition
Date | | Cost | | | Market
Value | | | Percentage of
Net Assets | |
California Municipal Finance Authority
(UTS Bioenergy LLC) Series 2011-A1
7.50%, 12/01/2032 | | 12/22/2011 | | $ | 3,795,000 | | | $ | 75,900 | | | | 0.00 | % |
Tarrant County Cultural Education Facilities Finance Corp.
Series 2015-A
5.00%, 11/15/2045 | | 01/30/2020 – 01/31/2020 | | | 2,168,940 | | | | – 0 | – | | | 0.00 | % |
Tarrant County Cultural Education Facilities Finance Corp.
Series 2015-B
5.00%, 11/15/2036 | | 03/06/2020 | | | 948,067 | | | | – 0 | – | | | 0.00 | % |
Tarrant County Cultural Education Facilities Finance Corp.
Series 2017
5.25%, 11/15/2047 | | 02/06/2020 | | | 708,967 | | | | – 0 | – | | | 0.00 | % |
Tarrant County Cultural Education Facilities Finance Corp.
(Stayton at Museum Way) Series 2020-A
5.75%, 12/01/2054 | | 04/08/2010 – 01/08/2020 | | | 16,714,412 | | | | 10,500,864 | | | | 0.38 | % |
| (j) | Coupon rate adjusts periodically based upon a predetermined schedule. Stated interest rate in effect at May 31, 2024. |
| (k) | Fair valued by the Adviser. |
| | |
| |
| abfunds.com | | AB MUNICIPAL INCOME FUND | 95 |
PORTFOLIO OF INVESTMENTS (continued)
AB HIGH INCOME MUNICIPAL PORTFOLIO
| (l) | Security in which significant unobservable inputs (Level 3) were used in determining fair value. |
| (m) | Defaulted matured security. |
| (o) | Securities are perpetual and, thus, do not have a predetermined maturity date. The date shown, if applicable, reflects the next call date. |
| (p) | Affiliated investments. |
| (q) | The rate shown represents the 7-day yield as of period end. |
| (r) | To obtain a copy of the fund’s shareholder report, please go to the Securities and Exchange Commission’s website at www.sec.gov, or call AB at (800) 227-4618. |
As of May 31, 2024, the Portfolio’s percentages of investments in municipal bonds that are insured and in insured municipal bonds that have been pre-refunded or escrowed to maturity are 1.5% and 0.0%, respectively.
Glossary:
ABS – Asset-Backed Securities
AGC – Assured Guaranty Corporation
AGM – Assured Guaranty Municipal
BAM – Build American Mutual
CCRC – Congregate Care Retirement Center
CDX-CMBX.NA – North American Commercial Mortgage-Backed Index
CDX-NAHY – North American High Yield Credit Default Swap Index
CMBS – Commercial Mortgage-Backed Securities
ETM – Escrowed to Maturity
MMD – Municipal Market Data
NATL – National Interstate Corporation
SD – School District
SOFR – Secured Overnight Financing Rate
See notes to financial statements.
| | |
| |
96 | AB MUNICIPAL INCOME FUND | | abfunds.com |
PORTFOLIO OF INVESTMENTS
AB NATIONAL PORTFOLIO
May 31, 2024
| | | | | | | | |
| | | Principal
Amount
(000) | | | U.S. $ Value | |
| |
MUNICIPAL OBLIGATIONS – 98.0% | | | | | | | | |
Long-Term Municipal Bonds – 98.0% | | | | | | | | |
Alabama – 2.6% | | | | | | | | |
Black Belt Energy Gas District
(Goldman Sachs Group, Inc. (The))
Series 2023-D
5.414% (SOFR + 1.85%), 06/01/2049(a) | | $ | 5,000 | | | $ | 5,038,054 | |
Series 2023-C
5.50%, 10/01/2054 | | | 5,000 | | | | 5,408,828 | |
County of Jefferson AL
Series 2017
5.00%, 09/15/2033 | | | 1,000 | | | | 1,031,480 | |
County of Jefferson AL Sewer Revenue
Series 2024
5.50%, 10/01/2053 | | | 1,000 | | | | 1,076,681 | |
Energy Southeast A Cooperative District
(Morgan Stanley)
Series 2023-A
5.614% (SOFR + 2.05%), 11/01/2053(a) | | | 2,000 | | | | 1,978,706 | |
Series 2023-B
5.764% (SOFR + 2.20%), 04/01/2054(a) | | | 3,000 | | | | 2,993,543 | |
Series 2024-B
5.25%, 07/01/2054 | | | 2,000 | | | | 2,123,707 | |
Homewood Educational Building Authority
(CHF – Horizons II LLC)
Series 2024
5.50%, 10/01/2049(b) | | | 250 | | | | 260,427 | |
5.50%, 10/01/2054(b) | | | 250 | | | | 259,544 | |
Infirmary Health System Special Care Facilities Financing Authority of Mobile
(Infirmary Health System Obligated Group)
Series 2016
5.00%, 02/01/2036 | | | 2,500 | | | | 2,530,052 | |
Lower Alabama Gas District (The)
(Goldman Sachs Group, Inc. (The))
Series 2020
4.00%, 12/01/2050 | | | 11,135 | | | | 11,122,056 | |
Southeast Alabama Gas Supply District (The)
(Pacific Mutual Holding Co.)
Series 2024-A
5.00%, 08/01/2054 | | | 2,500 | | | | 2,647,256 | |
Southeast Energy Authority A Cooperative District
(Goldman Sachs Group, Inc. (The))
Series 2022-B
5.00%, 05/01/2053 | | | 1,000 | | | | 1,031,549 | |
| | |
| |
| abfunds.com | | AB MUNICIPAL INCOME FUND | 97 |
PORTFOLIO OF INVESTMENTS (continued)
AB NATIONAL PORTFOLIO
| | | | | | | | |
| | | Principal
Amount
(000) | | | U.S. $ Value | |
| |
Southeast Energy Authority A Cooperative District
(Morgan Stanley)
Series 2021-B
4.00%, 12/01/2051 | | $ | 2,000 | | | $ | 1,962,069 | |
Series 2022-A
5.984% (SOFR + 2.42%), 01/01/2053(a) | | | 2,000 | | | | 2,069,356 | |
Southeast Energy Authority A Cooperative District
(Royal Bank of Canada)
Series 2023-B
5.00%, 01/01/2054 | | | 2,000 | | | | 2,103,730 | |
Southeast Energy Authority A Cooperative District
(Sumitomo Mitsui Financial Group, Inc.)
Series 2023-A
5.25%, 01/01/2054 | | | 4,000 | | | | 4,196,184 | |
| | | | | | | | |
| | | | | | | 47,833,222 | |
| | | | | | | | |
American Samoa – 0.1% | | | | | | | | |
American Samoa Economic Development Authority
(Territory of American Samoa)
Series 2015-A
6.625%, 09/01/2035 | | | 325 | | | | 332,951 | |
Series 2018
7.125%, 09/01/2038(c) | | | 1,490 | | | | 1,598,747 | |
| | | | | | | | |
| | | | | | | 1,931,698 | |
| | | | | | | | |
Arizona – 4.0% | | | | | | | | |
Arizona Board of Regents
(Arizona State University)
Series 2023
5.00%, 07/01/2042 | | | 4,020 | | | | 4,378,389 | |
Arizona Health Facilities Authority
(HonorHealth Obligated Group)
Series 2014-A
5.00%, 12/01/2033 | | | 9,175 | | | | 9,225,795 | |
5.00%, 12/01/2034 | | | 3,440 | | | | 3,459,045 | |
Arizona Industrial Development Authority
(KIPP Nashville Obligated Group)
Series 2022-A
5.00%, 07/01/2062 | | | 1,575 | | | | 1,556,277 | |
Arizona Industrial Development Authority
(Legacy Cares, Inc.)
Series 2020
7.75%, 07/01/2050(d)(e) | | | 3,725 | | | | 223,500 | |
| | |
| |
98 | AB MUNICIPAL INCOME FUND | | abfunds.com |
PORTFOLIO OF INVESTMENTS (continued)
AB NATIONAL PORTFOLIO
| | | | | | | | |
| | | Principal
Amount
(000) | | | U.S. $ Value | |
| |
Chandler Industrial Development Authority
(Intel Corp.)
Series 2022
5.00%, 09/01/2052 | | $ | 2,000 | | | $ | 2,041,675 | |
Series 2024
4.00%, 06/01/2049(b) | | | 8,000 | | | | 7,927,934 | |
City of Glendale AZ
(City of Glendale AZ COP)
Series 2021
2.222%, 07/01/2030 | | | 2,000 | | | | 1,718,307 | |
2.742%, 07/01/2035 | | | 2,000 | | | | 1,592,037 | |
2.842%, 07/01/2036 | | | 2,000 | | | | 1,574,357 | |
City of Tempe AZ
(City of Tempe AZ COP)
Series 2021
2.071%, 07/01/2032 | | | 1,000 | | | | 798,625 | |
2.521%, 07/01/2036 | | | 2,500 | | | | 1,872,509 | |
Industrial Development Authority of the City of Phoenix Arizona (The)
(AZ GFF Tiyan LLC Lease)
Series 2014
5.00%, 02/01/2029 | | | 2,000 | | | | 1,909,240 | |
Industrial Development Authority of the County of Pima (The)
(Edkey, Inc. Obligated Group)
Series 2020
5.00%, 07/01/2040(c) | | | 1,355 | | | | 1,295,968 | |
Industrial Development Authority of the County of Pima (The)
(La Posada at Park Centre, Inc. Obligated Group)
Series 2022
5.125%, 11/15/2029(c) | | | 1,000 | | | | 1,006,649 | |
7.00%, 11/15/2057(c) | | | 1,000 | | | | 1,063,443 | |
Maricopa County Industrial Development Authority
(Commercial Metals Co.)
Series 2022
4.00%, 10/15/2047(c) | | | 1,670 | | | | 1,462,156 | |
Maricopa County Industrial Development Authority
(HonorHealth Obligated Group)
Series 2024-D
5.00%, 12/01/2042(b) | | | 1,225 | | | | 1,283,790 | |
| | |
| |
| abfunds.com | | AB MUNICIPAL INCOME FUND | 99 |
PORTFOLIO OF INVESTMENTS (continued)
AB NATIONAL PORTFOLIO
| | | | | | | | |
| | | Principal
Amount
(000) | | | U.S. $ Value | |
| |
Maricopa County Industrial Development Authority
(Morrison Education Group Obligated Group)
Series 2024-A
6.75%, 07/01/2063(c) | | $ | 1,000 | | | $ | 1,034,226 | |
Maricopa County Special Health Care District
Series 2018-C
5.00%, 07/01/2034 | | | 1,000 | | | | 1,048,509 | |
5.00%, 07/01/2035 | | | 6,000 | | | | 6,284,864 | |
5.00%, 07/01/2036 | | | 7,800 | | | | 8,155,979 | |
Salt River Project Agricultural Improvement & Power District
Series 2023-A
5.00%, 01/01/2050 | | | 10,000 | | | | 10,627,615 | |
Sierra Vista Industrial Development Authority
(American Leadership Academy, Inc.)
Series 2023
5.75%, 06/15/2058(c) | | | 1,000 | | | | 1,005,263 | |
Tempe Industrial Development Authority
(Mirabella at ASU, Inc.)
Series 2017-A
6.00%, 10/01/2037(c) | | | 1,200 | | | | 840,963 | |
| | | | | | | | |
| | | | | | | 73,387,115 | |
| | | | | | | | |
Arkansas – 0.1% | | | | | | | | |
Arkansas Development Finance Authority
(Hybar LLC)
Series 2024
7.375%, 07/01/2048(c) | | | 1,100 | | | | 1,197,560 | |
Arkansas Development Finance Authority
(United States Steel Corp.)
Series 2022
5.45%, 09/01/2052 | | | 500 | | | | 507,878 | |
| | | | | | | | |
| | | | | | | 1,705,438 | |
| | | | | | | | |
California – 13.0% | | | | | | | | |
Alameda Corridor Transportation Authority
Series 2022-A
0.00%, 10/01/2048(f) | | | 4,000 | | | | 2,207,619 | |
AGM Series 2024
Zero Coupon, 10/01/2053 | | | 2,000 | | | | 471,844 | |
ARC70 II TRUST
Series 2023
4.84%, 04/01/2065(e)(g) | | | 4,771 | | | | 4,574,040 | |
| | |
| |
100 | AB MUNICIPAL INCOME FUND | | abfunds.com |
PORTFOLIO OF INVESTMENTS (continued)
AB NATIONAL PORTFOLIO
| | | | | | | | |
| | | Principal
Amount
(000) | | | U.S. $ Value | |
| |
Burbank-Glendale-Pasadena Airport Authority Brick Campaign
AGM Series 2024-B
4.375%, 07/01/2049 | | $ | 5,000 | | | $ | 4,862,434 | |
4.50%, 07/01/2054 | | | 2,250 | | | | 2,200,891 | |
California Community Choice Financing Authority
(American International Group, Inc.)
Series 2023-D
5.50%, 05/01/2054 | | | 5,000 | | | | 5,300,386 | |
California Community Choice Financing Authority
(Deutsche Bank AG)
Series 2023
5.25%, 01/01/2054 | | | 8,660 | | | | 9,050,303 | |
California Community Choice Financing Authority
(Goldman Sachs Group, Inc. (The))
Series 2023
5.25%, 11/01/2054 | | | 2,745 | | | | 2,916,002 | |
California Community Choice Financing Authority
(Morgan Stanley)
Series 2023
5.194% (SOFR + 1.63%), 07/01/2053(a) | | | 2,000 | | | | 1,986,297 | |
5.234% (SOFR + 1.67%), 02/01/2054(a) | | | 2,000 | | | | 1,978,214 | |
Series 2024
5.00%, 05/01/2054 | | | 2,000 | | | | 2,117,680 | |
California Community Housing Agency
(California Community Housing Agency Aster Apartments)
Series 2021-A
4.00%, 02/01/2056(c) | | | 2,000 | | | | 1,797,771 | |
California Community Housing Agency
(California Community Housing Agency Brio Apartments & Next on Lex Apartments)
Series 2021
4.00%, 02/01/2056(c) | | | 5,000 | | | | 4,133,435 | |
California Community Housing Agency
(California Community Housing Agency Fountains at Emerald Park)
Series 2021
3.00%, 08/01/2056(c) | | | 1,000 | | | | 709,149 | |
4.00%, 08/01/2046(c) | | | 990 | | | | 824,428 | |
| | |
| |
| abfunds.com | | AB MUNICIPAL INCOME FUND | 101 |
PORTFOLIO OF INVESTMENTS (continued)
AB NATIONAL PORTFOLIO
| | | | | | | | |
| | | Principal
Amount
(000) | | | U.S. $ Value | |
| |
California Community Housing Agency
(California Community Housing Agency Summit at Sausalito Apartments)
Series 2021
3.00%, 02/01/2057(c) | | $ | 1,000 | | | $ | 687,024 | |
California Community Housing Agency
(California Community Housing Agency Twin Creek Apartments)
Series 2022-A
4.50%, 08/01/2052(c) | | | 2,000 | | | | 1,675,093 | |
California County Tobacco Securitization Agency
(Los Angeles County Securitization Corp.)
Series 2020-A
4.00%, 06/01/2035 | | | 1,300 | | | | 1,334,731 | |
California Educational Facilities Authority
(Chapman University)
Series 2015
5.00%, 04/01/2045 | | | 4,000 | | | | 4,012,370 | |
California Enterprise Development Authority
(County of Riverside CA Lease)
Series 2024
5.00%, 11/01/2036(b) | | | 2,000 | | | | 2,268,591 | |
California Infrastructure & Economic Development Bank
(DesertXpress Enterprises LLC)
Series 2024
3.95%, 01/01/2050(c) | | | 7,200 | | | | 7,199,975 | |
California Municipal Finance Authority
(CHF-Riverside II LLC)
Series 2019
5.00%, 05/15/2035 | | | 1,000 | | | | 1,047,062 | |
5.00%, 05/15/2036 | | | 1,215 | | | | 1,269,434 | |
5.00%, 05/15/2037 | | | 1,000 | | | | 1,040,740 | |
5.00%, 05/15/2038 | | | 2,250 | | | | 2,332,260 | |
5.00%, 05/15/2041 | | | 915 | | | | 938,947 | |
California Municipal Finance Authority
(LAX Integrated Express Solutions LLC) | | | | | | | | |
Series 2018
5.00%, 12/31/2035 | | | 4,300 | | | | 4,345,739 | |
5.00%, 12/31/2036 | | | 3,910 | | | | 3,943,137 | |
5.00%, 12/31/2043 | | | 12,250 | | | | 12,273,625 | |
California Pollution Control Financing Authority
(Poseidon Resources Channelside LP)
Series 2012
5.00%, 07/01/2037(c) | | | 5,795 | | | | 5,809,492 | |
| | |
| |
102 | AB MUNICIPAL INCOME FUND | | abfunds.com |
PORTFOLIO OF INVESTMENTS (continued)
AB NATIONAL PORTFOLIO
| | | | | | | | |
| | | Principal
Amount
(000) | | | U.S. $ Value | |
| |
California School Finance Authority
(Equitas Academy Obligated Group)
Series 2018-A
5.00%, 06/01/2041(c) | | $ | 3,090 | | | $ | 2,958,234 | |
California State Public Works Board
(State of California Department of General Services Lease)
Series 2024
5.00%, 04/01/2043 | | | 5,255 | | | | 5,811,838 | |
California State University
Series 2021-B
2.374%, 11/01/2035 | | | 2,000 | | | | 1,514,591 | |
California Statewide Communities Development Authority
(Loma Linda University Medical Center)
Series 2016-A
5.00%, 12/01/2041(c) | | | 1,400 | | | | 1,405,848 | |
Series 2018-A
5.50%, 12/01/2058(c) | | | 1,090 | | | | 1,109,160 | |
City of Los Angeles CA Wastewater System Revenue
Series 2013-A
5.00%, 06/01/2033 | | | 9,310 | | | | 9,328,147 | |
City of Los Angeles Department of Airports
Series 2022
3.25%, 05/15/2049 | | | 1,000 | | | | 774,453 | |
5.25%, 05/15/2047 | | | 5,000 | | | | 5,306,603 | |
CMFA Special Finance Agency
(CMFA Special Finance Agency Enclave)
Series 2022-A
4.00%, 08/01/2058(c) | | | 2,000 | | | | 1,542,411 | |
CMFA Special Finance Agency
(CMFA Special Finance Agency Solana at Grand)
Series 2021-A
4.00%, 08/01/2056(c) | | | 1,000 | | | | 859,315 | |
CMFA Special Finance Agency VIII Elan Huntington Beach
Series 2021
3.00%, 08/01/2056(c) | | | 4,000 | | | | 2,770,794 | |
4.00%, 08/01/2047(c) | | | 970 | | | | 836,560 | |
CSCDA Community Improvement Authority
(CSCDA Community Improvement Authority 777 Place-Pomona)
Series 2021
3.25%, 05/01/2057(c) | | | 1,000 | | | | 696,611 | |
4.00%, 05/01/2057(c) | | | 2,000 | | | | 1,432,941 | |
| | |
| |
| abfunds.com | | AB MUNICIPAL INCOME FUND | 103 |
PORTFOLIO OF INVESTMENTS (continued)
AB NATIONAL PORTFOLIO
| | | | | | | | |
| | | Principal
Amount
(000) | | | U.S. $ Value | |
| |
CSCDA Community Improvement Authority
(CSCDA Community Improvement Authority 1818 Platinum Triangle-Anaheim)
Series 2021
3.25%, 04/01/2057(c) | | $ | 1,000 | | | $ | 720,060 | |
CSCDA Community Improvement Authority
(CSCDA Community Improvement Authority Acacia on Santa Rosa Creek)
Series 2021
4.00%, 10/01/2056(c) | | | 2,000 | | | | 1,703,613 | |
CSCDA Community Improvement Authority
(CSCDA Community Improvement Authority Millennium South Bay-Hawthorne)
Series 2021
3.25%, 07/01/2056(c) | | | 1,000 | | | | 686,371 | |
4.00%, 07/01/2058(c) | | | 1,000 | | | | 680,007 | |
CSCDA Community Improvement Authority
(CSCDA Community Improvement Authority Oceanaire Apartments)
Series 2021
4.00%, 09/01/2056(c) | | | 1,000 | | | | 746,849 | |
CSCDA Community Improvement Authority
(CSCDA Community Improvement Authority Park Crossing Apartments)
Series 2021
3.25%, 12/01/2058(c) | | | 1,500 | | | | 1,006,495 | |
CSCDA Community Improvement Authority
(CSCDA Community Improvement Authority Pasadena Portfolio)
Series 2021
3.00%, 12/01/2056(c) | | | 1,480 | | | | 1,028,846 | |
CSCDA Community Improvement Authority
(CSCDA Community Improvement Authority The Crescent)
Series 2022
4.30%, 07/01/2059(c) | | | 2,000 | | | | 1,671,745 | |
CSCDA Community Improvement Authority
(CSCDA Community Improvement Authority Union South Bay)
Series 2021-A2
4.00%, 07/01/2056(c) | | | 3,300 | | | | 2,517,355 | |
CSCDA Community Improvement Authority
(CSCDA Community Improvement Authority Vineyard Gardens Apartments)
Series 2021
3.25%, 10/01/2058(c) | | | 1,245 | | | | 846,466 | |
| | |
| |
104 | AB MUNICIPAL INCOME FUND | | abfunds.com |
PORTFOLIO OF INVESTMENTS (continued)
AB NATIONAL PORTFOLIO
| | | | | | | | |
| | | Principal
Amount
(000) | | | U.S. $ Value | |
| |
CSCDA Community Improvement Authority
(CSCDA Community Improvement Authority Waterscape Apartments)
Series 2021-A
3.00%, 09/01/2056(c) | | $ | 2,000 | | | $ | 1,367,517 | |
Golden State Tobacco Securitization Corp.
Series 2021
3.85%, 06/01/2050 | | | 1,855 | | | | 1,723,680 | |
Series 2021-B
Zero Coupon, 06/01/2066 | | | 10,000 | | | | 1,089,160 | |
Hastings Campus Housing Finance Authority
Series 2020-A
5.00%, 07/01/2061(c) | | | 1,375 | | | | 1,250,589 | |
Los Angeles Unified School District/CA
Series 2024-A
5.00%, 07/01/2031 | | | 10,000 | | | | 11,167,995 | |
Manteca Unified School District
(Manteca Unified School District CFD No. 89-1)
NATL Series 2001
Zero Coupon, 09/01/2031 | | | 11,910 | | | | 8,732,769 | |
Morongo Band of Mission Indians (The)
Series 2018-A
5.00%, 10/01/2042(c) | | | 4,500 | | | | 4,506,623 | |
Port of Los Angeles
Series 2014-A
5.00%, 08/01/2034 | | | 5,790 | | | | 5,791,309 | |
Sacramento County Water Financing Authority
(Sacramento County Water Agency)
NATL Series 2007-B
4.324% (CME Term SOFR 3 Month + 0.57%), 06/01/2039(a) | | | 8,075 | | | | 7,231,526 | |
San Diego County Regional Airport Authority
Series 2023
5.00%, 07/01/2043 | | | 11,080 | | | | 11,635,291 | |
San Diego Unified School District/CA
Series 2023
4.00%, 07/01/2053 | | | 2,000 | | | | 1,931,098 | |
San Francisco Intl Airport
Series 2019-A
5.00%, 05/01/2044 | | | 17,000 | | | | 17,379,873 | |
Series 2023-E
5.25%, 05/01/2035 | | | 5,000 | | | | 5,568,679 | |
Series 2024
5.00%, 05/01/2039(b) | | | 3,400 | | | | 3,641,299 | |
| | |
| |
| abfunds.com | | AB MUNICIPAL INCOME FUND | 105 |
PORTFOLIO OF INVESTMENTS (continued)
AB NATIONAL PORTFOLIO
| | | | | | | | |
| | | Principal
Amount
(000) | | | U.S. $ Value | |
| |
State of California
Series 2023
5.00%, 09/01/2043 | | $ | 5,000 | | | $ | 5,503,377 | |
5.25%, 09/01/2053 | | | 5,000 | | | | 5,529,283 | |
6.00%, 03/01/2033 | | | 1,000 | | | | 1,065,400 | |
Tobacco Securitization Authority of Northern California
(Sacramento County Tobacco Securitization Corp.)
Series 2021
Zero Coupon, 06/01/2060 | | | 1,200 | | | | 186,465 | |
University of California
Series 2024-B
5.00%, 05/15/2026 | | | 1,495 | | | | 1,545,460 | |
| | | | | | | | |
| | | | | | | 240,111,419 | |
| | | | | | | | |
Colorado – 1.0% | | | | | | | | |
Centerra Metropolitan District No. 1
Series 2022
6.50%, 12/01/2053 | | | 1,000 | | | | 1,011,753 | |
City & County of Denver CO Airport System Revenue
Series 2022-A
5.00%, 11/15/2033 | | | 1,000 | | | | 1,084,232 | |
Series 2023-B
5.25%, 11/15/2034 | | | 3,275 | | | | 3,655,560 | |
Colorado Educational & Cultural Facilities Authority
(Ascent Classical Academy Charter Schools, Inc.)
Series 2024
5.50%, 04/01/2044(c) | | | 1,660 | | | | 1,690,625 | |
Colorado Health Facilities Authority
(CommonSpirit Health)
Series 2019-A
5.00%, 08/01/2044 | | | 1,675 | | | | 1,711,536 | |
Colorado Health Facilities Authority
(Sanford Obligated Group)
Series 2019-A
5.00%, 11/01/2044 | | | 1,000 | | | | 1,032,836 | |
Douglas County Housing Partnership
(Bridgewater Castle Rock ALF LLC)
Series 2021
5.375%, 01/01/2041(d)(e) | | | 2,500 | | | | 1,853,047 | |
E-470 Public Highway Authority
Series 2021-B
3.914% (SOFR + 0.35%), 09/01/2039(a) | | | 2,000 | | | | 1,997,689 | |
| | |
| |
106 | AB MUNICIPAL INCOME FUND | | abfunds.com |
PORTFOLIO OF INVESTMENTS (continued)
AB NATIONAL PORTFOLIO
| | | | | | | | |
| | | Principal
Amount
(000) | | | U.S. $ Value | |
| |
Johnstown Plaza Metropolitan District
Series 2022
4.25%, 12/01/2046 | | $ | 1,128 | | | $ | 955,072 | |
Park Creek Metropolitan District
Series 2015-A
5.00%, 12/01/2034 | | | 1,300 | | | | 1,317,431 | |
Platte River Metropolitan District
Series 2023-A
6.50%, 08/01/2053(c) | | | 750 | | | | 763,142 | |
Sterling Ranch Community Authority Board
(Sterling Ranch Metropolitan District No. 3)
Series 2022
6.50%, 12/01/2042 | | | 1,175 | | | | 1,227,444 | |
| | | | | | | | |
| | | | | | | 18,300,367 | |
| | | | | | | | |
Connecticut – 1.1% | | | | | | | | |
Connecticut State Health & Educational Facilities Authority
(Yale University)
Series 2023-A
2.80%, 07/01/2048 | | | 6,175 | | | | 6,041,688 | |
State of Connecticut
Series 2015-B
5.00%, 06/15/2032 | | | 2,350 | | | | 2,375,482 | |
Series 2015-F
5.00%, 11/15/2030 | | | 2,000 | | | | 2,031,827 | |
5.00%, 11/15/2031 | | | 2,500 | | | | 2,537,685 | |
State of Connecticut Special Tax Revenue
Series 2023-A
5.25%, 07/01/2042 | | | 7,000 | | | | 7,847,212 | |
| | | | | | | | |
| | | | | | | 20,833,894 | |
| | | | | | | | |
Delaware – 0.0% | | | | | | | | |
Delaware State Economic Development Authority
(Newark Charter School, Inc.)
Series 2016
5.00%, 09/01/2046 | | | 550 | | | | 549,580 | |
| | | | | | | | |
| | |
District of Columbia – 1.3% | | | | | | | | |
District of Columbia Income Tax Revenue
Series 2024-A
5.00%, 10/01/2036 | | | 10,500 | | | | 11,990,482 | |
Metropolitan Washington Airports Authority Aviation Revenue
Series 2018-A
5.00%, 10/01/2038 | | | 2,630 | | | | 2,721,168 | |
| | |
| |
| abfunds.com | | AB MUNICIPAL INCOME FUND | 107 |
PORTFOLIO OF INVESTMENTS (continued)
AB NATIONAL PORTFOLIO
| | | | | | | | |
| | | Principal
Amount
(000) | | | U.S. $ Value | |
| |
Series 2021-A
5.00%, 10/01/2046 | | $ | 10,000 | | | $ | 10,315,141 | |
| | | | | | | | |
| | | | | | | 25,026,791 | |
| | | | | | | | |
Florida – 3.9% | | | | | | | | |
Align Affordable Housing Bond Fund LP
(SHI – Lake Worth LLC)
Series 2021
3.25%, 12/01/2051(c) | | | 3,000 | | | | 2,646,219 | |
Bexley Community Development District
Series 2016
4.70%, 05/01/2036 | | | 1,750 | | | | 1,737,767 | |
Cape Coral Health Facilities Authority
(Gulf Care, Inc. Obligated Group)
Series 2015
5.875%, 07/01/2040(c) | | | 1,000 | | | | 714,426 | |
Capital Trust Agency, Inc.
(Educational Growth Fund LLC)
Series 2021
Zero Coupon, 07/01/2061(c) | | | 5,000 | | | | 321,371 | |
5.00%, 07/01/2056(c) | | | 3,000 | | | | 2,768,555 | |
Capital Trust Agency, Inc.
(Team Success A School of Excellence, Inc.)
Series 2020
4.25%, 06/01/2030(c) | | | 1,585 | | | | 1,516,104 | |
City of Tampa FL
(State of Florida Cigarette Tax Revenue)
Series 2020-A
Zero Coupon, 09/01/2038 | | | 1,000 | | | | 517,806 | |
County of Broward FL Airport System Revenue
Series 2019-C
2.384%, 10/01/2026 | | | 5,500 | | | | 5,187,421 | |
County of Miami-Dade FL Aviation Revenue
Series 2014-A
5.00%, 10/01/2033 | | | 1,700 | | | | 1,701,627 | |
Series 2015-A
5.00%, 10/01/2038 | | | 4,300 | | | | 4,323,512 | |
Series 2019-A
5.00%, 10/01/2049 | | | 2,500 | | | | 2,534,818 | |
County of Pasco FL
(H Lee Moffitt Cancer Center & Research Institute Obligated Group)
Series 2023
5.00%, 07/01/2030(c) | | | 10,000 | | | | 10,649,601 | |
| | |
| |
108 | AB MUNICIPAL INCOME FUND | | abfunds.com |
PORTFOLIO OF INVESTMENTS (continued)
AB NATIONAL PORTFOLIO
| | | | | | | | |
| | | Principal
Amount
(000) | | | U.S. $ Value | |
| |
Escambia County Housing Finance Authority
(4900 S. Rio Grande Avenue LP)
Series 2023-A
6.88%, 11/01/2053(c) | | $ | 220 | | | $ | 237,170 | |
Series 2023-B
6.45%, 05/01/2027(c) | | | 605 | | | | 618,456 | |
Florida Development Finance Corp.
(Assistance Unlimited, Inc.)
Series 2022
6.00%, 08/15/2057(c) | | | 1,000 | | | | 972,538 | |
Florida Development Finance Corp.
(Brightline Trains Florida LLC)
Series 2024
5.00%, 07/01/2037 | | | 1,000 | | | | 1,036,984 | |
AGM Series 2024
5.25%, 07/01/2047 | | | 5,000 | | | | 5,191,306 | |
Florida Development Finance Corp.
(Mater Academy, Inc.)
Series 2020-A
5.00%, 06/15/2050 | | | 1,000 | | | | 988,495 | |
Florida Development Finance Corp.
(Seaside School Consortium, Inc.)
Series 2022
6.00%, 06/15/2057 | | | 1,000 | | | | 1,020,345 | |
Florida Higher Educational Facilities Financial Authority
(Nova Southeastern University, Inc.)
Series 2016
5.00%, 04/01/2032 | | | 1,125 | | | | 1,144,757 | |
Greater Orlando Aviation Authority
Series 2017-A
5.00%, 10/01/2031 | | | 1,200 | | | | 1,235,479 | |
Halifax Hospital Medical Center
(Halifax Hospital Medical Center Obligated Group)
Series 2016
5.00%, 06/01/2036 | | | 2,190 | | | | 2,206,154 | |
JEA Water & Sewer System Revenue
Series 2024-A
5.00%, 10/01/2043 | | | 1,000 | | | | 1,094,599 | |
Marshall Creek Community Development District
Series 2016
6.32%, 05/01/2045 | | | 110 | | | | 110,199 | |
| | |
| |
| abfunds.com | | AB MUNICIPAL INCOME FUND | 109 |
PORTFOLIO OF INVESTMENTS (continued)
AB NATIONAL PORTFOLIO
| | | | | | | | |
| | | Principal
Amount
(000) | | | U.S. $ Value | |
| |
Marshall Creek Community Development District
(Marshall Creek Community Development District 2002A)
Series 2017
5.00%, 05/01/2032 | | $ | 1,180 | | | $ | 1,180,267 | |
Miami-Dade County Expressway Authority
Series 2014-B
5.00%, 07/01/2031 | | | 3,750 | | | | 3,752,014 | |
North Broward Hospital District
Series 2017-B
5.00%, 01/01/2035 | | | 5,230 | | | | 5,397,549 | |
Orange County Health Facilities Authority
(Presbyterian Retirement Communities, Inc. Obligated Group)
Series 2023
4.00%, 08/01/2042 | | | 1,000 | | | | 881,967 | |
Polk County Industrial Development Authority
(Mineral Development LLC)
Series 2020
5.875%, 01/01/2033(c) | | | 950 | | | | 908,146 | |
Sarasota County Health Facilities Authority
(Village On the Isle)
Series 2017-A
5.00%, 01/01/2042 | | | 1,100 | | | | 1,046,810 | |
South Florida Water Management District
(South Florida Water Management District COP)
Series 2016
5.00%, 10/01/2033 | | | 5,000 | | | | 5,096,981 | |
St. Johns County Industrial Development Authority
(Presbyterian Retirement Communities, Inc. Obligated Group)
Series 2020
4.00%, 08/01/2055 | | | 1,000 | | | | 793,673 | |
Tampa-Hillsborough County Expressway Authority
Series 2017-C
5.00%, 07/01/2048 | | | 2,640 | | | | 2,696,031 | |
Village Community Development District No. 15
(Village Community Development District No. 15 Series 2023 Phase I Special Asmnts)
Series 2023
5.25%, 05/01/2054(c) | | | 250 | | | | 255,001 | |
| | | | | | | | |
| | | | | | | 72,484,148 | |
| | | | | | | | |
| | |
| |
110 | AB MUNICIPAL INCOME FUND | | abfunds.com |
PORTFOLIO OF INVESTMENTS (continued)
AB NATIONAL PORTFOLIO
| | | | | | | | |
| | | Principal
Amount
(000) | | | U.S. $ Value | |
| |
Georgia – 3.6% | |
City of Atlanta GA Department of Aviation
Series 2022-B
5.00%, 07/01/2047 | | $ | 10,000 | | | $ | 10,362,809 | |
DeKalb County Housing Authority
(HADC Avenues LLC)
Series 2023
6.17%, 06/01/2053(c) | | | 2,155 | | | | 2,169,835 | |
7.00%, 06/01/2041(c) | | | 500 | | | | 503,335 | |
Development Authority of Appling County
(Oglethorpe Power Corp.)
Series 2020
1.50%, 01/01/2038 | | | 2,300 | | | | 2,235,760 | |
Development Authority of Burke County (The)
(Georgia Power Co.)
Series 2023
3.875%, 10/01/2032 | | | 3,245 | | | | 3,250,508 | |
Development Authority of Burke County (The)
(Oglethorpe Power Corp.)
Series 2020
1.50%, 01/01/2040 | | | 7,350 | | | | 7,144,712 | |
Development Authority of Monroe County (The)
(Georgia Power Co.)
Series 2023
3.875%, 10/01/2048 | | | 3,750 | | | | 3,756,365 | |
Main Street Natural Gas, Inc.
(Citadel LP)
Series 2022-C
4.00%, 08/01/2052(c) | | | 3,650 | | | | 3,586,353 | |
Main Street Natural Gas, Inc.
(Citigroup, Inc.)
Series 2023-D
5.00%, 05/01/2054 | | | 6,000 | | | | 6,273,411 | |
Main Street Natural Gas, Inc.
(Royal Bank of Canada)
Series 2023
5.264% (SOFR + 1.70%), 12/01/2053(a) | | | 5,000 | | | | 5,029,123 | |
Series 2023-C
5.00%, 09/01/2053 | | | 5,000 | | | | 5,249,855 | |
Municipal Electric Authority of Georgia
Series 2019
5.00%, 01/01/2037 | | | 150 | | | | 154,280 | |
5.00%, 01/01/2039 | | | 205 | | | | 210,674 | |
5.00%, 01/01/2049 | | | 2,000 | | | | 2,018,996 | |
5.00%, 01/01/2056 | | | 1,350 | | | | 1,367,565 | |
| | |
| |
| abfunds.com | | AB MUNICIPAL INCOME FUND | 111 |
PORTFOLIO OF INVESTMENTS (continued)
AB NATIONAL PORTFOLIO
| | | | | | | | |
| | | Principal
Amount
(000) | | | U.S. $ Value | |
| |
Series 2022
5.50%, 07/01/2063 | | $ | 2,000 | | | $ | 2,081,197 | |
Private Colleges & Universities Authority
(Emory University)
Series 2023
5.00%, 09/01/2033(c) | | | 10,000 | | | | 11,098,844 | |
| | | | | | | | |
| | | | | | | 66,493,622 | |
| | | | | | | | |
Guam – 0.4% | |
Territory of Guam
Series 2019
5.00%, 11/15/2031 | | | 235 | | | | 236,187 | |
Territory of Guam
(Guam Section 30 Income Tax)
Series 2016-A
5.00%, 12/01/2029 | | | 1,840 | | | | 1,878,107 | |
5.00%, 12/01/2030 | | | 565 | | | | 576,835 | |
5.00%, 12/01/2032 | | | 790 | | | | 806,404 | |
Territory of Guam
(Territory of Guam Business Privilege Tax)
Series 2015
5.00%, 11/15/2029 | | | 2,000 | | | | 2,021,984 | |
Series 2015-D
5.00%, 11/15/2033 | | | 410 | | | | 413,595 | |
5.00%, 11/15/2035 | | | 1,365 | | | | 1,376,384 | |
| | | | | | | | |
| | | | | | | 7,309,496 | |
| | | | | | | | |
Hawaii – 0.6% | |
State of Hawaii
Series 2016-F
4.00%, 10/01/2031 | | | 3,000 | | | | 2,971,500 | |
State of Hawaii Airports System Revenue
Series 2022-A
5.00%, 07/01/2051 | | | 7,855 | | | | 8,084,866 | |
| | | | | | | | |
| | | | | | | 11,056,366 | |
| | | | | | | | |
Idaho – 0.1% | |
Idaho Health Facilities Authority
(North Canyon Medical Center, Inc.)
Series 2023
7.125%, 11/01/2057 | | | 1,000 | | | | 1,021,706 | |
| | | | | | | | |
|
Illinois – 6.0% | |
Chicago Board of Education
Series 2012-B
5.00%, 12/01/2033 | | | 1,605 | | | | 1,593,033 | |
Series 2017-D
5.00%, 12/01/2031 | | | 1,800 | | | | 1,847,623 | |
Series 2017-G
5.00%, 12/01/2034 | | | 2,350 | | | | 2,402,885 | |
| | |
| |
112 | AB MUNICIPAL INCOME FUND | | abfunds.com |
PORTFOLIO OF INVESTMENTS (continued)
AB NATIONAL PORTFOLIO
| | | | | | | | |
| | | Principal
Amount
(000) | | | U.S. $ Value | |
| |
Series 2019-B
5.00%, 12/01/2030 | | $ | 235 | | | $ | 244,442 | |
5.00%, 12/01/2031 | | | 345 | | | | 358,811 | |
5.00%, 12/01/2032 | | | 155 | | | | 161,154 | |
5.00%, 12/01/2033 | | | 150 | | | | 155,727 | |
Series 2023-A
5.00%, 12/01/2034 | | | 3,250 | | | | 3,467,585 | |
Chicago O’Hare International Airport
Series 2022
4.625%, 01/01/2053 | | | 4,000 | | | | 3,868,376 | |
5.50%, 01/01/2055 | | | 10,900 | | | | 11,531,930 | |
Chicago Transit Authority Capital Grant Receipts Revenue
(City of Chicago IL Fed Hwy Grant)
Series 2021
5.00%, 06/01/2027 | | | 2,400 | | | | 2,476,053 | |
5.00%, 06/01/2028 | | | 2,500 | | | | 2,602,360 | |
5.00%, 06/01/2029 | | | 1,000 | | | | 1,053,056 | |
County of Cook IL
Series 2021-B
4.00%, 11/15/2025 | | | 1,000 | | | | 1,005,613 | |
Illinois Finance Authority
(Park Place of Elmhurst Obligated Group)
Series 2021
5.125%, 05/15/2060 | | | 2,989 | | | | 1,586,728 | |
Illinois Housing Development Authority
(Drexel Court & Lake Park East)
Series 2022
7.17%, 11/01/2038 | | | 150 | | | | 153,465 | |
Illinois State Toll Highway Authority
Series 2009
6.184%, 01/01/2034 | | | 2,000 | | | | 2,089,080 | |
Series 2017-A
5.00%, 01/01/2042 | | | 15,000 | | | | 15,593,633 | |
Series 2021-A
5.00%, 01/01/2043 | | | 15,000 | | | | 15,926,762 | |
Metropolitan Pier & Exposition Authority
Series 2017-A
5.00%, 06/15/2057 | | | 1,000 | | | | 1,009,209 | |
Series 2020
5.00%, 06/15/2050 | | | 12,310 | | | | 12,552,258 | |
State of Illinois
Series 2017-D
5.00%, 11/01/2028 | | | 8,700 | | | | 9,013,773 | |
Series 2018-A
5.00%, 10/01/2027 | | | 2,000 | | | | 2,075,245 | |
Series 2024-B
4.25%, 05/01/2046 | | | 2,000 | | | | 1,935,848 | |
5.25%, 05/01/2043 | | | 2,000 | | | | 2,169,611 | |
| | |
| |
| abfunds.com | | AB MUNICIPAL INCOME FUND | 113 |
PORTFOLIO OF INVESTMENTS (continued)
AB NATIONAL PORTFOLIO
| | | | | | | | |
| | | Principal
Amount
(000) | | | U.S. $ Value | |
| |
5.25%, 05/01/2044 | | $ | 3,330 | | | $ | 3,597,291 | |
5.25%, 05/01/2045 | | | 4,625 | | | | 4,980,336 | |
State of Illinois Sales Tax Revenue
Series 2024-A
5.00%, 06/15/2025 | | | 3,000 | | | | 3,032,151 | |
Village of Pingree Grove IL Special Service Area No. 7
Series 2015
4.50%, 03/01/2025 | | | 136 | | | | 135,386 | |
5.00%, 03/01/2036 | | | 2,317 | | | | 2,222,314 | |
Series 2015-B
6.00%, 03/01/2036 | | | 616 | | | | 616,396 | |
| | | | | | | | |
| | | | | | | 111,458,134 | |
| | | | | | | | |
Indiana – 1.6% | |
City of Whiting IN
(BP PLC)
Series 2019
5.00%, 12/01/2044 | | | 2,000 | | | | 2,032,772 | |
Series 2023
4.40%, 11/01/2045 | | | 4,000 | | | | 3,956,909 | |
Indiana Finance Authority
(Brightmark Plastics Renewal Indiana LLC)
Series 2019
7.00%, 03/01/2039(e) | | | 3,470 | | | | 2,404,742 | |
Indiana Finance Authority
(CWA Authority, Inc.)
Series 2024
5.00%, 10/01/2035(b) | | | 2,125 | | | | 2,377,742 | |
Indiana Finance Authority
(Good Samaritan Hospital Obligated Group)
Series 2022
5.00%, 04/01/2029 | | | 1,080 | | | | 1,074,904 | |
Indiana Finance Authority
(Ohio Valley Electric Corp.)
Series 2020
3.00%, 11/01/2030 | | | 1,085 | | | | 1,002,709 | |
Series 2020-A
3.00%, 11/01/2030 | | | 1,295 | | | | 1,196,781 | |
Series 2021-B
2.50%, 11/01/2030 | | | 525 | | | | 462,258 | |
Indianapolis Local Public Improvement Bond Bank
(Pan Am Plaza Hotel)
Series 2023
5.75%, 03/01/2043 | | | 1,000 | | | | 1,087,889 | |
| | |
| |
114 | AB MUNICIPAL INCOME FUND | | abfunds.com |
PORTFOLIO OF INVESTMENTS (continued)
AB NATIONAL PORTFOLIO
| | | | | | | | |
| | | Principal
Amount
(000) | | | U.S. $ Value | |
| |
6.00%, 03/01/2053 | | $ | 1,500 | | | $ | 1,623,388 | |
Series 2023-F
7.75%, 03/01/2067 | | | 1,225 | | | | 1,298,864 | |
BAM Series 2023
5.25%, 03/01/2067 | | | 10,000 | | | | 10,502,635 | |
| | | | | | | | |
| | | | | | | 29,021,593 | |
| | | | | | | | |
Iowa – 0.4% | | | | | | | | |
Iowa Finance Authority
Series 2022-E
4.524% (SOFR + 0.80%), 01/01/2052(a) | | | 5,000 | | | | 4,969,400 | |
Iowa Finance Authority
(Wesley Retirement Services, Inc. Obligated Group)
Series 2021
4.00%, 12/01/2031 | | | 440 | | | | 406,797 | |
4.00%, 12/01/2041 | | | 820 | | | | 660,664 | |
4.00%, 12/01/2046 | | | 550 | | | | 419,074 | |
4.00%, 12/01/2051 | | | 985 | | | | 723,397 | |
Iowa Tobacco Settlement Authority
Series 2021-B
4.00%, 06/01/2049 | | | 555 | | | | 539,334 | |
| | | | | | | | |
| | | | | | | 7,718,666 | |
| | | | | | | | |
Kansas – 0.2% | | | | | | | | |
City of Colby KS
(Citizens Medical Center, Inc.)
Series 2024
5.50%, 07/01/2026 | | | 1,000 | | | | 994,805 | |
City of Overland Park KS Sales Tax Revenue
Series 2022
6.00%, 11/15/2034(c) | | | 155 | | | | 157,863 | |
6.50%, 11/15/2042(c) | | | 1,185 | | | | 1,200,069 | |
Kansas Development Finance Authority
(State of Kansas Department of Administration Lease)
Series 2021-K
1.369%, 05/01/2027 | | | 2,405 | | | | 2,172,354 | |
| | | | | | | | |
| | | | | | | 4,525,091 | |
| | | | | | | | |
Kentucky – 1.3% | | | | | | | | |
City of Henderson KY
(Pratt Paper KY LLC) | | | | | | | | |
Series 2022
3.70%, 01/01/2032(c) | | | 880 | | | | 856,689 | |
County of Trimble KY
(Louisville Gas and Electric Co.) | | | | | | | | |
Series 2020
1.30%, 09/01/2044 | | | 1,500 | | | | 1,357,468 | |
| | |
| |
| abfunds.com | | AB MUNICIPAL INCOME FUND | 115 |
PORTFOLIO OF INVESTMENTS (continued)
AB NATIONAL PORTFOLIO
| | | | | | | | |
| | | Principal
Amount
(000) | | | U.S. $ Value | |
| |
Kentucky Economic Development Finance Authority
(Louisville Arena Authority, Inc.)
AGM Series 2017-A
5.00%, 12/01/2047 | | $ | 1,250 | | | $ | 1,219,385 | |
Kentucky Economic Development Finance Authority
(Owensboro Health, Inc. Obligated Group)
Series 2015
5.25%, 06/01/2050 | | | 3,015 | | | | 2,922,399 | |
Kentucky Public Energy Authority
(BP PLC)
Series 2018-B
4.00%, 01/01/2049 | | | 1,000 | | | | 999,654 | |
Series 2020-A
4.00%, 12/01/2050 | | | 3,000 | | | | 2,991,985 | |
Kentucky Public Energy Authority
(Morgan Stanley)
Series 2023-A
5.544% (SOFR + 1.98%), 04/01/2054(a) | | | 5,000 | | | | 5,000,000 | |
Kentucky State Property & Building Commission
Series 2024-A
4.00%, 11/01/2041 | | | 3,430 | | | | 3,334,638 | |
Louisville/Jefferson County Metropolitan Government
(Norton Healthcare Obligated Group)
Series 2016
5.00%, 10/01/2030 | | | 2,330 | | | | 2,366,603 | |
5.00%, 10/01/2033 | | | 2,670 | | | | 2,706,457 | |
| | | | | | | | |
| | | | | | | 23,755,278 | |
| | | | | | | | |
Louisiana – 1.5% | |
Louisiana Local Government Environmental Facilities & Community Development Auth
(Louisiana Utilities Restoration Corp. ELL System Restoration Revenue)
Series 2023
5.048%, 12/01/2034 | | | 2,180 | | | | 2,147,300 | |
Louisiana Local Government Environmental Facilities & Community Development Auth
(Woman’s Hospital Foundation)
Series 2017
5.00%, 10/01/2033 | | | 3,790 | | | | 3,886,116 | |
5.00%, 10/01/2044 | | | 3,500 | | | | 3,534,108 | |
Louisiana Public Facilities Authority
(ElementUS Minerals LLC)
Series 2023
5.00%, 10/01/2043(c) | | | 5,000 | | | | 5,024,230 | |
| | |
| |
116 | AB MUNICIPAL INCOME FUND | | abfunds.com |
PORTFOLIO OF INVESTMENTS (continued)
AB NATIONAL PORTFOLIO
| | | | | | | | |
| | | Principal
Amount
(000) | | | U.S. $ Value | |
| |
Louisiana Public Facilities Authority
(Ochsner Clinic Foundation Obligated Group)
Series 2016
5.00%, 05/15/2034 | | $ | 1,730 | | | $ | 1,758,227 | |
Louisiana Public Facilities Authority
(Pre-refunded – US Govt Agencies)
Series 2016
5.00%, 05/15/2034 | | | 20 | | | | 20,499 | |
Parish of St. James LA
(NuStar Logistics LP)
Series 2020-2
6.35%, 07/01/2040(c) | | | 355 | | | | 385,591 | |
Parish of St. John the Baptist LA
(Marathon Oil Corp.)
Series 2019
2.10%, 06/01/2037 | | | 600 | | | | 598,486 | |
2.20%, 06/01/2037 | | | 365 | | | | 346,438 | |
State of Louisiana Gasoline & Fuels Tax Revenue
Series 2017-C
5.00%, 05/01/2035 | | | 4,500 | | | | 4,687,452 | |
5.00%, 05/01/2036 | | | 4,620 | | | | 4,806,027 | |
| | | | | | | | |
| | | | | | | 27,194,474 | |
| | | | | | | | |
Maryland – 1.2% | |
Maryland Economic Development Corp.
(Ports America Chesapeake LLC)
Series 2017-A
5.00%, 06/01/2035 | | | 1,035 | | | | 1,074,048 | |
Maryland Economic Development Corp.
(Purple Line Transit Partners LLC)
Series 2022
5.25%, 06/30/2052 | | | 6,000 | | | | 6,156,170 | |
Maryland Health & Higher Educational Facilities Authority
(TidalHealth Obligated Group)
Series 2020
4.00%, 07/01/2036 | | | 305 | | | | 299,905 | |
4.00%, 07/01/2037 | | | 360 | | | | 349,607 | |
5.00%, 07/01/2046 | | | 2,960 | | | | 3,025,432 | |
Maryland Stadium Authority
(Baltimore City Public School Construction Financing Fund)
Series 2020
5.00%, 05/01/2050 | | | 3,000 | | | | 3,234,616 | |
| | |
| |
| abfunds.com | | AB MUNICIPAL INCOME FUND | 117 |
PORTFOLIO OF INVESTMENTS (continued)
AB NATIONAL PORTFOLIO
| | | | | | | | |
| | | Principal
Amount
(000) | | | U.S. $ Value | |
| |
Maryland State Transportation Authority
Series 2021-A
5.00%, 07/01/2051 | | $ | 4,990 | | | $ | 5,221,478 | |
State of Maryland Department of Transportation
Series 2017
5.00%, 09/01/2025 | | | 2,000 | | | | 2,038,403 | |
| | | | | | | | |
| | | | | | | 21,399,659 | |
| | | | | | | | |
Massachusetts – 2.7% | |
Commonwealth of Massachusetts
Series 2024-A
5.00%, 01/01/2041 | | | 3,000 | | | | 3,317,054 | |
Commonwealth of Massachusetts
(Commonwealth of Massachusetts COVID-19 Recovery Assessment Revenue)
Series 2022-B
4.11%, 07/15/2031 | | | 1,517 | | | | 1,473,915 | |
Commonwealth of Massachusetts Transportation Fund Revenue
Series 2023
5.00%, 06/01/2053 | | | 10,000 | | | | 10,673,879 | |
Series 2023-B
5.00%, 06/01/2051 | | | 5,000 | | | | 5,343,240 | |
Massachusetts Bay Transportation Authority Sales Tax Revenue
Series 2023-A
5.25%, 07/01/2053 | | | 4,840 | | | | 5,267,120 | |
Massachusetts Development Finance Agency
(Emerson College)
Series 2018
5.00%, 01/01/2048 | | | 1,180 | | | | 1,168,870 | |
Massachusetts Development Finance Agency
(Mass General Brigham, Inc.)
Series 2016Q
5.00%, 07/01/2041 | | | 10,000 | | | | 10,146,718 | |
Massachusetts Development Finance Agency
(UMass Memorial Health Care Obligated Group)
Series 2016
5.00%, 07/01/2036 | | | 2,385 | | | | 2,420,441 | |
Series 2017-L
5.00%, 07/01/2044 | | | 5,000 | | | | 5,038,000 | |
| | |
| |
118 | AB MUNICIPAL INCOME FUND | | abfunds.com |
PORTFOLIO OF INVESTMENTS (continued)
AB NATIONAL PORTFOLIO
| | | | | | | | |
| | | Principal
Amount
(000) | | | U.S. $ Value | |
| |
Massachusetts Port Authority
Series 2021-E
5.00%, 07/01/2051 | | $ | 5,000 | | | $ | 5,140,626 | |
| | | | | | | | |
| | | | | | | 49,989,863 | |
| | | | | | | | |
Michigan – 1.7% | |
City of Detroit MI
Series 2014-B
4.00%, 04/01/2044(f) | | | 2,000 | | | | 1,577,272 | |
Series 2018
5.00%, 04/01/2036 | | | 835 | | | | 850,296 | |
Series 2021-A
5.00%, 04/01/2031 | | | 1,210 | | | | 1,262,207 | |
Series 2021-B
2.511%, 04/01/2025 | | | 1,030 | | | | 1,000,799 | |
3.644%, 04/01/2034 | | | 275 | | | | 231,816 | |
Series 2023-A
6.00%, 05/01/2039 | | | 2,000 | | | | 2,240,925 | |
City of Detroit MI Sewage Disposal System Revenue
(Great Lakes Water Authority Sewage Disposal System Revenue)
AGM Series 2006-D
4.328% (CME Term SOFR 3 Month + 0.60%), 07/01/2032(a) | | | 5,000 | | | | 4,767,430 | |
Kalamazoo Economic Development Corp.
(Heritage Community of Kalamazoo Obligated Group)
Series 2020
5.00%, 05/15/2055 | | | 2,000 | | | | 1,638,465 | |
Michigan Finance Authority
(Corewell Health Obligated Group)
Series 2016
5.00%, 11/01/2044 | | | 1,500 | | | | 1,512,163 | |
Michigan Finance Authority
(Great Lakes Water Authority Water Supply System Revenue)
Series 2014-D4
5.00%, 07/01/2034 | | | 11,225 | | | | 11,231,996 | |
Michigan Finance Authority
(Michigan Finance Authority Tobacco Settlement Revenue)
Series 2020-A
3.267%, 06/01/2039 | | | 2,000 | | | | 1,837,171 | |
Series 2020-B
Zero Coupon, 06/01/2065 | | | 1,250 | | | | 126,324 | |
| | |
| |
| abfunds.com | | AB MUNICIPAL INCOME FUND | 119 |
PORTFOLIO OF INVESTMENTS (continued)
AB NATIONAL PORTFOLIO
| | | | | | | | |
| | | Principal
Amount
(000) | | | U.S. $ Value | |
| |
Michigan Finance Authority
(Public Lighting Authority)
Series 2014-B
5.00%, 07/01/2033 | | $ | 2,485 | | | $ | 2,486,377 | |
Plymouth Educational Center Charter School
Series 2005
5.375%, 11/01/2030(d) | | | 2,000 | | | | 1,220,000 | |
| | | | | | | | |
| | | | | | | 31,983,241 | |
| | | | | | | | |
Minnesota – 0.6% | |
City of Brooklyn Park MN
(Brooklyn Park AH I LLLP)
Series 2023
6.205%, 01/01/2042(c)(f) | | | 2,000 | | | | 2,046,229 | |
City of Columbus MN
(Adalyn Avenue LLLP)
Series 2023
5.98%, 12/01/2041(c) | | | 1,500 | | | | 1,511,873 | |
Dakota County Community Development Agency
(Rosemont AH I LLLP)
Series 2023
5.30%, 07/01/2028(c) | | | 520 | | | | 520,210 | |
5.66%, 07/01/2041(c) | | | 1,415 | | | | 1,422,905 | |
Minneapolis-St. Paul Metropolitan Airports Commission
Series 2022-B
5.00%, 01/01/2047 | | | 4,500 | | | | 4,631,418 | |
Minnesota Higher Education Facilities Authority
(St. Olaf College)
Series 2015-8
5.00%, 12/01/2030 | | | 1,000 | | | | 1,016,746 | |
| | | | | | | | |
| | | | | | | 11,149,381 | |
| | | | | | | | |
Mississippi – 0.1% | |
Mississippi Business Finance Corp.
(Alden Group Renewable Energy Mississippi LLC)
Series 2022
8.00%, 12/01/2029(e) | | | 1,250 | | | | 1,224,634 | |
| | | | | | | | |
|
Missouri – 1.4% | |
Health & Educational Facilities Authority of the State of Missouri
(Lutheran Senior Services Obligated Group)
Series 2019
4.00%, 02/01/2042 | | | 2,900 | | | | 2,540,591 | |
| | |
| |
120 | AB MUNICIPAL INCOME FUND | | abfunds.com |
PORTFOLIO OF INVESTMENTS (continued)
AB NATIONAL PORTFOLIO
| | | | | | | | |
| | | Principal
Amount
(000) | | | U.S. $ Value | |
| |
4.00%, 02/01/2048 | | $ | 2,965 | | | $ | 2,438,086 | |
5.00%, 02/01/2042 | | | 2,695 | | | | 2,657,514 | |
5.00%, 02/01/2048 | | | 400 | | | | 382,339 | |
Health & Educational Facilities Authority of the State of Missouri
(Mercy Health/MO)
Series 2023
5.50%, 12/01/2048 | | | 10,000 | | | | 10,921,545 | |
Howard Bend Levee District XLCA
Series 2005
5.75%, 03/01/2025 | | | 190 | | | | 190,621 | |
5.75%, 03/01/2027 | | | 175 | | | | 175,741 | |
Joplin Industrial Development Authority
(Freeman Health System Obligated Group)
Series 2015
5.00%, 02/15/2035 | | | 1,485 | | | | 1,455,910 | |
Kansas City Industrial Development Authority
(Kingswood Senior Living Community)
Series 2021
2.00%, 11/15/2046(d) | | | 522 | | | | 24,339 | |
5.00%, 11/15/2046(d) | | | 1,169 | | | | 816,971 | |
Series 2021-A
10.00%, 11/15/2037(d) | | | 360 | | | | 304,123 | |
Series 2021-C
7.50%, 11/15/2046(d) | | | 288 | | | | 224,029 | |
Kansas City Industrial Development Authority
(Platte Purchase Project)
Series 2019
5.00%, 07/01/2040(c) | | | 405 | | | | 352,759 | |
Lee’s Summit Industrial Development Authority
(John Knox Village Obligated Group)
Series 2021-A
5.00%, 08/15/2056 | | | 2,700 | | | | 2,347,755 | |
Missouri Highway & Transportation Commission
Series 2019-B
5.00%, 11/01/2025 | | | 2,000 | | | | 2,044,095 | |
| | | | | | | | |
| | | | | | | 26,876,418 | |
| | | | | | | | |
Nebraska – 0.1% | |
Central Plains Energy Project
(Goldman Sachs Group, Inc. (The))
Series 2017-A
5.00%, 09/01/2028 | | | 2,620 | | | | 2,697,474 | |
| | | | | | | | |
| | |
| |
| abfunds.com | | AB MUNICIPAL INCOME FUND | 121 |
PORTFOLIO OF INVESTMENTS (continued)
AB NATIONAL PORTFOLIO
| | | | | | | | |
| | | Principal
Amount
(000) | | | U.S. $ Value | |
| |
Nevada – 1.6% | |
Carson City NV
(Carson Tahoe Regional Healthcare)
Series 2017
5.00%, 09/01/2042 | | $ | 1,965 | | | $ | 1,988,400 | |
City of Las Vegas NV
Series 2015-C
5.00%, 09/01/2027 | | | 1,400 | | | | 1,434,919 | |
City of Reno NV
(County of Washoe NV Sales Tax Revenue)
Series 2018-C
Zero Coupon, 07/01/2058(c) | | | 2,000 | | | | 255,697 | |
Clark County School District
AGM Series 2019-B
3.00%, 06/15/2036 | | | 6,725 | | | | 5,817,439 | |
3.00%, 06/15/2037 | | | 4,305 | | | | 3,663,096 | |
Clark County Water Reclamation District
Series 2023
5.00%, 07/01/2049 | | | 10,000 | | | | 10,683,232 | |
State of Nevada
Series 2015-D
5.00%, 04/01/2027 | | | 2,000 | | | | 2,023,072 | |
State of Nevada Department of Business & Industry
(DesertXpress Enterprises LLC)
Series 2023
8.125%, 01/01/2050(c) | | | 2,135 | | | | 2,205,888 | |
Series 2024
4.00%, 01/01/2050(c) | | | 740 | | | | 740,025 | |
| | | | | | | | |
| | | | | | | 28,811,768 | |
| | | | | | | | |
New Hampshire – 0.6% | |
New Hampshire Business Finance Authority
Series 2022-1, Class A
4.375%, 09/20/2036 | | | 7,804 | | | | 7,472,551 | |
Series 2022-2, Class A
4.00%, 10/20/2036 | | | 3,915 | | | | 3,627,000 | |
Series 2024-2
0.49%, 07/01/2051 | | | 2,739 | | | | 107,483 | |
Series 2024-2, Class X
0.594%, 08/20/2039 | | | 2,000 | | | | 84,205 | |
| | | | | | | | |
| | | | | | | 11,291,239 | |
| | | | | | | | |
New Jersey – 5.9% | |
Casino Reinvestment Development Authority, Inc.
Series 2014
5.25%, 11/01/2044 | | | 1,680 | | | | 1,680,909 | |
| | |
| |
122 | AB MUNICIPAL INCOME FUND | | abfunds.com |
PORTFOLIO OF INVESTMENTS (continued)
AB NATIONAL PORTFOLIO
| | | | | | | | |
| | | Principal
Amount
(000) | | | U.S. $ Value | |
| |
City of Hoboken NJ
Series 2024-A
4.00%, 03/12/2025 | | $ | 5,000 | | | $ | 5,011,519 | |
Essex County Improvement Authority
(Friends of TEAM Academy Charter School Obligated Group)
Series 2021
4.00%, 06/15/2051 | | | 1,700 | | | | 1,465,733 | |
Morris-Union Jointure Commission
(Morris-Union Jointure Commission COP)
AGM Series 2013
5.00%, 08/01/2025 | | | 2,055 | | | | 2,057,072 | |
New Jersey Economic Development Authority
(Middlesex Water Co.)
Series 2019
4.00%, 08/01/2059 | | | 1,275 | | | | 1,123,936 | |
New Jersey Economic Development Authority
(New Jersey-American Water Co., Inc.)
Series 2023
3.75%, 11/01/2034 | | | 2,000 | | | | 1,956,344 | |
New Jersey Economic Development Authority
(Port Newark Container Terminal LLC)
Series 2017
5.00%, 10/01/2037 | | | 3,320 | | | | 3,400,630 | |
New Jersey Economic Development Authority
(Pre-refunded – US Treasuries)
Series 2017-D
5.00%, 06/15/2034 | | | 2,000 | | | | 2,101,019 | |
5.00%, 06/15/2035 | | | 1,560 | | | | 1,638,794 | |
New Jersey Economic Development Authority
(State of New Jersey)
Series 2024-S
5.00%, 06/15/2034 | | | 1,000 | | | | 1,116,797 | |
New Jersey Educational Facilities Authority
(Ramapo College of New Jersey)
AGM Series 2022-A
4.00%, 07/01/2042 | | | 725 | | | | 699,388 | |
4.00%, 07/01/2047 | | | 285 | | | | 268,209 | |
New Jersey Health Care Facilities Financing Authority
(New Jersey Health Care Facilities Financing Authority State Lease)
Series 2017
5.00%, 10/01/2034 | | | 5,000 | | | | 5,209,188 | |
| | |
| |
| abfunds.com | | AB MUNICIPAL INCOME FUND | 123 |
PORTFOLIO OF INVESTMENTS (continued)
AB NATIONAL PORTFOLIO
| | | | | | | | |
| | | Principal
Amount
(000) | | | U.S. $ Value | |
| |
New Jersey Transportation Trust Fund Authority
(New Jersey Transportation Fed Hwy Grant)
Series 2016
5.00%, 06/15/2027 | | $ | 5,000 | | | $ | 5,120,156 | |
5.00%, 06/15/2029 | | | 2,175 | | | | 2,222,326 | |
New Jersey Transportation Trust Fund Authority
(New Jersey Transportation Trust Fund Authority State Lease)
Series 2018-A
5.00%, 12/15/2035 | | | 1,000 | | | | 1,050,546 | |
Series 2022
4.00%, 06/15/2050 | | | 7,585 | | | | 7,016,692 | |
Series 2023-B
5.00%, 06/15/2040 | | | 2,985 | | | | 3,244,952 | |
5.00%, 06/15/2043 | | | 1,985 | | | | 2,132,355 | |
New Jersey Turnpike Authority | | | | | | | | |
Series 2014-A
5.00%, 01/01/2033 | | | 4,750 | | | | 4,752,157 | |
Series 2015-E
5.00%, 01/01/2033 | | | 11,000 | | | | 11,063,261 | |
Series 2017-A
5.00%, 01/01/2034 | | | 5,000 | | | | 5,150,699 | |
Series 2024-A
4.00%, 01/01/2035(b) | | | 3,000 | | | | 3,122,739 | |
5.00%, 01/01/2032(b) | | | 3,715 | | | | 4,112,437 | |
5.00%, 01/01/2034(b) | | | 2,200 | | | | 2,487,937 | |
Series 2024-C
5.00%, 01/01/2043(b) | | | 3,000 | | | | 3,211,301 | |
5.00%, 01/01/2044(b) | | | 2,000 | | | | 2,131,196 | |
State of New Jersey
Series 2020
5.00%, 06/01/2025 | | | 7,000 | | | | 7,100,036 | |
Tobacco Settlement Financing Corp./NJ
Series 2018-B
5.00%, 06/01/2046 | | | 10,605 | | | | 10,673,463 | |
Township of Woodbridge NJ
Series 2024
4.00%, 03/14/2025 | | | 2,000 | | | | 2,005,119 | |
Union County Utilities Authority
(County of Union NJ Lease)
Series 2011-A
5.25%, 12/01/2031 | | | 4,105 | | | | 4,107,791 | |
| | | | | | | | |
| | | | | | | 108,434,701 | |
| | | | | | | | |
| | |
| |
124 | AB MUNICIPAL INCOME FUND | | abfunds.com |
PORTFOLIO OF INVESTMENTS (continued)
AB NATIONAL PORTFOLIO
| | | | | | | | |
| | | Principal
Amount
(000) | | | U.S. $ Value | |
| |
New York – 9.6% | |
Build NYC Resource Corp.
(Albert Einstein College of Medicine, Inc.)
Series 2016
5.50%, 09/01/2045(c) | | $ | 6,860 | | | $ | 6,864,714 | |
City of New York NY
Series 2019-E
5.00%, 08/01/2025 | | | 1,970 | | | | 2,003,311 | |
Series 2021
1.396%, 08/01/2027 | | | 5,205 | | | | 4,654,279 | |
Series 2024-C
4.00%, 03/01/2046 | | | 2,000 | | | | 1,916,544 | |
5.00%, 03/01/2043 | | | 1,000 | | | | 1,086,442 | |
Series 2024-D
4.00%, 04/01/2045 | | | 3,180 | | | | 3,061,123 | |
5.25%, 04/01/2054 | | | 2,000 | | | | 2,172,194 | |
Dutchess County Local Development Corp.
(Bard College)
Series 2020-A
5.00%, 07/01/2051 | | | 2,475 | | | | 2,428,851 | |
Long Island Power Authority
Series 2023-E
5.00%, 09/01/2048 | | | 2,650 | | | | 2,851,785 | |
5.00%, 09/01/2053 | | | 2,350 | | | | 2,519,505 | |
Metropolitan Transportation Authority
Series 2016-D
5.00%, 11/15/2027 | | | 1,000 | | | | 1,034,095 | |
5.00%, 11/15/2031 | | | 5,000 | | | | 5,152,774 | |
Series 2017
5.00%, 11/15/2024 | | | 1,755 | | | | 1,763,692 | |
Series 2017-C
5.00%, 11/15/2033 | | | 5,500 | | | | 5,766,477 | |
Series 2020-C
5.25%, 11/15/2055 | | | 1,000 | | | | 1,030,064 | |
Series 2020-D
5.00%, 11/15/2043 | | | 1,000 | | | | 1,044,244 | |
Series 2020-E
4.00%, 11/15/2026 | | | 1,000 | | | | 1,009,239 | |
New York City Municipal Water Finance Authority
Series 2022-A
5.25%, 06/15/2052 | | | 5,000 | | | | 5,400,759 | |
Series 2023
5.00%, 06/15/2034 | | | 2,000 | | | | 2,304,937 | |
Series 2024-C
4.25%, 06/15/2054 | | | 2,000 | | | | 1,956,576 | |
| | |
| |
| abfunds.com | | AB MUNICIPAL INCOME FUND | 125 |
PORTFOLIO OF INVESTMENTS (continued)
AB NATIONAL PORTFOLIO
| | | | | | | | |
| | | Principal
Amount
(000) | | | U.S. $ Value | |
| |
New York City Municipal Water Finance Authority
(Pre-refunded – US Treasuries)
Series 2014-D
5.00%, 06/15/2035 | | $ | 4,000 | | | $ | 4,001,375 | |
New York City Transitional Finance Authority Building Aid Revenue
(New York City Transitional Finance Authority Building Aid Revenue State Lease)
Series 2018-S
5.00%, 07/15/2036 | | | 14,800 | | | | 15,420,179 | |
New York City Transitional Finance Authority Future Tax Secured Revenue
Series 2014-B1
5.00%, 08/01/2032 | | | 4,000 | | | | 4,006,472 | |
Series 2017-E1
5.00%, 02/01/2036 | | | 2,500 | | | | 2,572,754 | |
New York Liberty Development Corp.
(3 World Trade Center LLC)
Series 2014
5.375%, 11/15/2040(c) | | | 300 | | | | 301,148 | |
7.25%, 11/15/2044(c) | | | 510 | | | | 513,548 | |
New York Power Authority
(New York Power Authority SFP Transmission Project)
AGM Series 2023
5.00%, 11/15/2048 | | | 8,000 | | | | 8,644,504 | |
5.00%, 11/15/2053 | | | 2,000 | | | | 2,148,722 | |
New York State Dormitory Authority
(Cornell University)
Series 2024-A
5.50%, 07/01/2054 | | | 2,000 | | | | 2,244,874 | |
New York State Dormitory Authority
(State of New York Pers Income Tax)
Series 2015-E
5.00%, 03/15/2034 | | | 10,000 | | | | 10,119,603 | |
5.25%, 03/15/2033 | | | 2,000 | | | | 2,030,108 | |
New York State Environmental Facilities Corp.
(New York City Municipal Water Finance Authority)
Series 2020
2.75%, 09/01/2050 | | | 2,000 | | | | 1,952,887 | |
| | |
| |
126 | AB MUNICIPAL INCOME FUND | | abfunds.com |
PORTFOLIO OF INVESTMENTS (continued)
AB NATIONAL PORTFOLIO
| | | | | | | | |
| | | Principal
Amount
(000) | | | U.S. $ Value | |
| |
New York State Thruway Authority
(New York State Thruway Authority Gen Toll Road)
Series 2016-A
5.00%, 01/01/2034 | | $ | 2,070 | | | $ | 2,105,521 | |
Series 2021-O
4.00%, 01/01/2043 | | | 1,000 | | | | 975,438 | |
New York Transportation Development Corp.
(Delta Air Lines, Inc.)
Series 2018
4.00%, 01/01/2036 | | | 3,525 | | | | 3,477,055 | |
Series 2020
4.00%, 10/01/2030 | | | 5,345 | | | | 5,309,290 | |
Series 2023
5.625%, 04/01/2040 | | | 6,500 | | | | 7,084,828 | |
New York Transportation Development Corp.
(JFK International Air Terminal LLC)
Series 2022
5.00%, 12/01/2040 | | | 2,000 | | | | 2,081,850 | |
New York Transportation Development Corp.
(JFK NTO LLC)
Series 2023
5.375%, 06/30/2060 | | | 2,000 | | | | 2,072,850 | |
AGM Series 2023
5.00%, 06/30/2049 | | | 1,000 | | | | 1,026,510 | |
New York Transportation Development Corp.
(Laguardia Gateway Partners LLC)
Series 2016-A
5.00%, 07/01/2046 | | | 3,930 | | | | 3,905,757 | |
Niagara Area Development Corp.
(Reworld Holding Corp.)
Series 2018-A
4.75%, 11/01/2042(c) | | | 3,235 | | | | 2,947,627 | |
Oneida County Local Development Corp.
(Hamilton College)
Series 2021
5.00%, 07/01/2051 | | | 3,200 | | | | 3,433,670 | |
Port Authority of New York & New Jersey
Series 2014
5.00%, 09/01/2030 | | | 10,000 | | | | 10,014,965 | |
5.00%, 09/01/2031 | | | 3,750 | | | | 3,755,704 | |
| | |
| |
| abfunds.com | | AB MUNICIPAL INCOME FUND | 127 |
PORTFOLIO OF INVESTMENTS (continued)
AB NATIONAL PORTFOLIO
| | | | | | | | |
| | | Principal
Amount
(000) | | | U.S. $ Value | |
| |
Suffolk Regional Off-Track Betting Co.
Series 2024
6.00%, 12/01/2053 | | $ | 1,000 | | | $ | 1,033,721 | |
Town of Oyster Bay NY
Series 2024
4.00%, 03/07/2025 | | | 2,300 | | | | 2,306,527 | |
Triborough Bridge & Tunnel Authority
Series 2020-A
5.00%, 11/15/2049 | | | 2,000 | | | | 2,094,644 | |
Triborough Bridge & Tunnel Authority
(Metropolitan Transportation Authority Payroll Mobility Tax Revenue)
Series 2021-A
2.591%, 05/15/2036 | | | 2,000 | | | | 1,556,600 | |
2.917%, 05/15/2040 | | | 2,000 | | | | 1,491,520 | |
Series 2021-C
5.00%, 05/15/2051 | | | 5,000 | | | | 5,273,979 | |
Series 2022
4.614% (SOFR + 1.05%), 04/01/2026(a) | | | 4,000 | | | | 4,008,081 | |
Series 2023
5.00%, 11/15/2043 | | | 2,000 | | | | 2,182,153 | |
| | | | | | | | |
| | | | | | | 178,116,069 | |
| | | | | | | | |
North Carolina – 0.8% | |
City of Charlotte NC Airport Revenue
Series 2023
5.00%, 07/01/2044 | | | 1,250 | | | | 1,314,473 | |
5.25%, 07/01/2053 | | | 7,250 | | | | 7,630,041 | |
Fayetteville State University
Series 2023
4.00%, 04/01/2025(c) | | | 335 | | | | 333,061 | |
5.00%, 04/01/2026(c) | | | 375 | | | | 381,070 | |
North Carolina Turnpike Authority
AGM Series 2024
Zero Coupon, 01/01/2053 | | | 2,000 | | | | 473,697 | |
State of North Carolina
(State of North Carolina Fed Hwy Grant)
Series 2015
5.00%, 03/01/2030 | | | 5,000 | | | | 5,039,977 | |
| | | | | | | | |
| | | | | | | 15,172,319 | |
| | | | | | | | |
Ohio – 2.3% | |
Buckeye Tobacco Settlement Financing Authority
Series 2020-B
5.00%, 06/01/2055 | | | 5,680 | | | | 5,081,968 | |
| | |
| |
128 | AB MUNICIPAL INCOME FUND | | abfunds.com |
PORTFOLIO OF INVESTMENTS (continued)
AB NATIONAL PORTFOLIO
| | | | | | | | |
| | | Principal
Amount
(000) | | | U.S. $ Value | |
| |
County of Cuyahoga OH
(MetroHealth System (The))
Series 2017
5.00%, 02/15/2042 | | $ | 8,000 | | | $ | 8,008,526 | |
County of Hamilton OH
(Christ Hospital Obligated Group)
Series 2023
5.00%, 06/01/2042 | | | 2,000 | | | | 2,002,570 | |
County of Hamilton OH
(UC Health Obligated Group)
Series 2020
5.00%, 09/15/2050 | | | 3,045 | | | | 2,885,901 | |
County of Washington OH
(Marietta Area Health Care, Inc. Obligated Group)
Series 2022
6.625%, 12/01/2042 | | | 2,000 | | | | 2,159,085 | |
Ohio Air Quality Development Authority
(American Electric Power Co., Inc.)
Series 2019
2.10%, 10/01/2028 | | | 3,925 | | | | 3,874,239 | |
Ohio Air Quality Development Authority
(Duke Energy Corp.)
Series 2022
4.25%, 11/01/2039 | | | 2,000 | | | | 1,991,831 | |
Ohio Higher Educational Facility Commission
(University of Dayton)
Series 2022
5.00%, 02/01/2052 | | | 4,000 | | | | 4,147,453 | |
Ohio State University (The)
Series 2023
5.25%, 12/01/2046 | | | 1,000 | | | | 1,101,081 | |
State of Ohio
Series 2017-U
5.00%, 05/01/2025 | | | 1,500 | | | | 1,520,648 | |
University of Toledo
Series 2023-B
4.617% (SOFR + 0.90%), 06/01/2036(a)(e) | | | 9,775 | | | | 9,492,282 | |
| | | | | | | | |
| | | | | | | 42,265,584 | |
| | | | | | | | |
Oklahoma – 0.4% | |
Oklahoma Development Finance Authority
Series 2022
4.714%, 05/01/2052 | | | 5,000 | | | | 4,600,172 | |
| | |
| |
| abfunds.com | | AB MUNICIPAL INCOME FUND | 129 |
PORTFOLIO OF INVESTMENTS (continued)
AB NATIONAL PORTFOLIO
| | | | | | | | |
| | | Principal
Amount
(000) | | | U.S. $ Value | |
| |
Oklahoma Development Finance Authority
(OU Medicine Obligated Group)
Series 2022-A
5.50%, 08/15/2044 | | $ | 2,360 | | | $ | 2,398,868 | |
| | | | | | | | |
| | | | | | | 6,999,040 | |
| | | | | | | | |
Oregon – 0.0% | |
Multnomah County School District No. 40
Series 2023-A
Zero Coupon, 06/15/2043 | | | 1,000 | | | | 405,526 | |
Umatilla County School District No. 6R Umatilla
Series 2023-B
Zero Coupon, 06/15/2053 | | | 2,000 | | | | 460,331 | |
| | | | | | | | |
| | | | | | | 865,857 | |
| | | | | | | | |
Other – 0.1% | |
Federal Home Loan Mortgage Corp.
Series 2024
4.683%, 10/25/2040(b) | | | 1,000 | | | | 1,029,797 | |
| | | | | | | | |
|
Pennsylvania – 5.0% | |
Berks County Industrial Development Authority
(Tower Health Obligated Group)
Series 2017
5.00%, 11/01/2047 | | | 600 | | | | 302,816 | |
Berks County Municipal Authority (The)
(Tower Health Obligated Group)
Series 2020-B
5.00%, 02/01/2040 | | | 2,000 | | | | 1,586,278 | |
Bucks County Industrial Development Authority
(Grand View Hospital/Sellersville PA Obligated Group)
Series 2021
5.00%, 07/01/2027 | | | 1,475 | | | | 1,445,678 | |
Chambersburg Area Municipal Authority
(Wilson College)
Series 2018
5.75%, 10/01/2038 | | | 2,350 | | | | 2,338,865 | |
5.75%, 10/01/2043 | | | 5,000 | | | | 4,865,832 | |
Chester County Industrial Development Authority
(Collegium Charter School)
Series 2022
5.00%, 10/15/2032(c) | | | 930 | | | | 936,245 | |
| | |
| |
130 | AB MUNICIPAL INCOME FUND | | abfunds.com |
PORTFOLIO OF INVESTMENTS (continued)
AB NATIONAL PORTFOLIO
| | | | | | | | |
| | | Principal
Amount
(000) | | | U.S. $ Value | |
| |
City of Philadelphia PA Water & Wastewater Revenue
AGM Series 2023-B
5.00%, 09/01/2037 | | $ | 1,250 | | | $ | 1,395,052 | |
Commonwealth of Pennsylvania
Series 2019
5.00%, 07/15/2025 | | | 1,300 | | | | 1,321,613 | |
Series 2023
5.00%, 09/01/2024 | | | 4,000 | | | | 4,012,038 | |
Cumberland County Municipal Authority
(Penn State Health Obligated Group)
Series 2019
4.00%, 11/01/2036 | | | 285 | | | | 279,471 | |
Geisinger Authority
(Kaiser Obligated Group)
Series 2020
4.00%, 04/01/2039 | | | 3,820 | | | | 3,691,120 | |
5.00%, 04/01/2043 | | | 6,250 | | | | 6,587,302 | |
Montgomery County Higher Education and Health Authority
(Thomas Jefferson University Obligated Group)
Series 2022
5.00%, 05/01/2052 | | | 2,000 | | | | 2,049,008 | |
Moon Industrial Development Authority
(Baptist Homes Society Obligated Group)
Series 2015
6.125%, 07/01/2050 | | | 1,000 | | | | 740,893 | |
Moon Industrial Development Authority
(Baptist Homes Society)
Series 2015
6.00%, 07/01/2045 | | | 5,375 | | | | 4,033,388 | |
Pennsylvania Economic Development Financing Authority
(Commonwealth of Pennsylvania Department of Transportation)
Series 2022
6.00%, 06/30/2061 | | | 10,000 | | | | 10,955,001 | |
Pennsylvania Economic Development Financing Authority
(PA Bridges Finco LP)
Series 2015
5.00%, 06/30/2042 | | | 1,000 | | | | 982,931 | |
Pennsylvania Economic Development Financing Authority
(UPMC Obligated Group)
Series 2022-C
4.06% (MUNIPSA + 0.70%), 11/15/2047(a) | | | 10,000 | | | | 9,950,958 | |
| | |
| |
| abfunds.com | | AB MUNICIPAL INCOME FUND | 131 |
PORTFOLIO OF INVESTMENTS (continued)
AB NATIONAL PORTFOLIO
| | | | | | | | |
| | | Principal
Amount
(000) | | | U.S. $ Value | |
| |
Pennsylvania Economic Development Financing Authority
(Villanova University)
Series 2024
5.00%, 08/01/2044 | | $ | 1,325 | | | $ | 1,447,053 | |
Pennsylvania Turnpike Commission
Series 2022-A
5.00%, 12/01/2036 | | | 1,000 | | | | 1,114,098 | |
Pennsylvania Turnpike Commission Oil Franchise Tax Revenue
Series 2018-B
5.00%, 12/01/2039 | | | 3,000 | | | | 3,137,517 | |
Pennsylvania Turnpike Commission Registration Fee Revenue
Series 2023
3.36% (MUNIPSA + 0.85%), 07/15/2041(a) | | | 10,000 | | | | 10,003,337 | |
Philadelphia Authority for Industrial Development
(Greater Philadelphia Health Action, Inc.)
Series 2015-A
6.375%, 06/01/2040 | | | 3,100 | | | | 3,101,013 | |
Philadelphia Gas Works Co.
Series 2017
5.00%, 08/01/2042 | | | 2,000 | | | | 2,035,026 | |
Pittsburgh Water & Sewer Authority
AGM Series 2023-C
4.524% (SOFR + 0.80%), 09/01/2040(a)(c) | | | 10,000 | | | | 9,690,293 | |
School District of Philadelphia (The)
Series 2023-A
5.00%, 06/28/2024 | | | 5,000 | | | | 5,002,262 | |
| | | | | | | | |
| | | | | | | 93,005,088 | |
| | | | | | | | |
Puerto Rico – 1.2% | | | | | | | | |
Children’s Trust Fund
Series 2008-A
Zero Coupon, 05/15/2057 | | | 30,000 | | | | 2,402,874 | |
Commonwealth of Puerto Rico
Series 2021-A
Zero Coupon, 07/01/2024 | | | 3 | | | | 3,063 | |
Zero Coupon, 07/01/2033 | | | 564 | | | | 373,966 | |
4.00%, 07/01/2046 | | | 21 | | | | 18,523 | |
5.625%, 07/01/2027 | | | 861 | | | | 899,386 | |
Series 2022-A
Zero Coupon, 11/01/2051 | | | 2,168 | | | | 1,119,031 | |
5.07%, 11/01/2051 | | | 3,747 | | | | 2,360,509 | |
Series 2022-C
Zero Coupon, 11/01/2043 | | | 6,836 | | | | 4,238,064 | |
| | |
| |
132 | AB MUNICIPAL INCOME FUND | | abfunds.com |
PORTFOLIO OF INVESTMENTS (continued)
AB NATIONAL PORTFOLIO
| | | | | | | | |
| | | Principal
Amount
(000) | | | U.S. $ Value | |
| |
Puerto Rico Electric Power Authority
AGM Series 2007-V
5.25%, 07/01/2031 | | $ | 1,895 | | | $ | 1,886,072 | |
NATL Series 2007-V
5.25%, 07/01/2033 | | | 1,150 | | | | 1,135,022 | |
Puerto Rico Industrial Tourist Educational Medical & Environmental Control Facilities Financing Auth
Series 2023-A
6.625%, 01/01/2027 | | | 322 | | | | 316,456 | |
6.625%, 01/01/2028 | | | 2,454 | | | | 2,407,999 | |
Puerto Rico Industrial Tourist Educational Medical & Environmental Control Facilities Financing Auth
(AES Puerto Rico LP)
12.50%, 12/15/2025(h)(i) | | | 570 | | | | 552,921 | |
Puerto Rico Industrial Tourist Educational Medical & Environmental Control Facilities Financing Auth
(San Juan Cruise Port LLC)
Series 2024
6.75%, 01/01/2045 | | | 1,000 | | | | 1,185,110 | |
Puerto Rico Sales Tax Financing Corp. Sales Tax Revenue
Series 2018-A
Zero Coupon, 07/01/2029 | | | 1,595 | | | | 1,316,834 | |
Series 2019-A
4.329%, 07/01/2040 | | | 1,504 | | | | 1,494,138 | |
| | | | | | | | |
| | | | | | | 21,709,968 | |
| | | | | | | | |
South Carolina – 4.0% | |
Columbia Housing Authority/SC
(Garden Lakes Apartments)
Series 2022
4.80%, 11/01/2024 | | | 500 | | | | 494,405 | |
5.26%, 11/01/2032 | | | 100 | | | | 97,347 | |
5.41%, 11/01/2039 | | | 1,240 | | | | 1,189,877 | |
6.28%, 11/01/2039 | | | 100 | | | | 96,180 | |
Greenville Housing Authority/SC
(Victor Verdae Apartments)
Series 2023
6.16%, 05/01/2063(c) | | | 3,000 | | | | 3,003,867 | |
Patriots Energy Group Financing Agency
(Royal Bank of Canada)
Series 2023
5.25%, 02/01/2054 | | | 2,275 | | | | 2,433,418 | |
Series 2023-B
5.464% (SOFR + 1.90%), 02/01/2054(a) | | | 5,000 | | | | 5,094,704 | |
| | |
| |
| abfunds.com | | AB MUNICIPAL INCOME FUND | 133 |
PORTFOLIO OF INVESTMENTS (continued)
AB NATIONAL PORTFOLIO
| | | | | | | | |
| | | Principal
Amount
(000) | | | U.S. $ Value | |
| |
Patriots Energy Group Financing Agency
(Sumitomo Mitsui Financial Group, Inc.)
Series 2023-A
5.25%, 10/01/2054 | | $ | 2,000 | | | $ | 2,114,527 | |
South Carolina Jobs-Economic Development Authority
(Bon Secours Mercy Health, Inc.)
Series 2020
5.00%, 12/01/2046 | | | 2,855 | | | | 2,939,057 | |
South Carolina Jobs-Economic Development Authority
(International Paper Co.)
Series 2023
4.00%, 04/01/2033 | | | 1,000 | | | | 1,003,106 | |
South Carolina Jobs-Economic Development Authority
(Last Step Recycling LLC)
Series 2021
6.50%, 06/01/2051(d)(e) | | | 1,450 | | | | 842,861 | |
South Carolina Jobs-Economic Development Authority
(Novant Health Obligated Group)
Series 2024
4.00%, 11/01/2042 | | | 7,000 | | | | 6,755,430 | |
4.50%, 11/01/2054 | | | 2,000 | | | | 1,960,723 | |
5.00%, 11/01/2038 | | | 2,000 | | | | 2,209,599 | |
5.25%, 11/01/2043 | | | 5,000 | | | | 5,528,257 | |
South Carolina Jobs-Economic Development Authority
(Prisma Health Obligated Group)
Series 2018
5.00%, 05/01/2038 | | | 2,500 | | | | 2,563,129 | |
Series 2018-A
5.00%, 05/01/2048 | | | 1,000 | | | | 1,002,562 | |
South Carolina Jobs-Economic Development Authority
(PSG Patriot’s Place Apartments LLC)
Series 2022
0.00%, 06/01/2052(f) | | | 1,600 | | | | 1,192,882 | |
South Carolina Public Service Authority
Series 2015-A
5.00%, 12/01/2050 | | | 4,530 | | | | 4,500,749 | |
Series 2016-A
5.00%, 12/01/2036 | | | 4,750 | | | | 4,794,441 | |
Series 2016-B
5.00%, 12/01/2036 | | | 2,000 | | | | 2,023,150 | |
5.00%, 12/01/2056 | | | 6,250 | | | | 6,234,981 | |
| | |
| |
134 | AB MUNICIPAL INCOME FUND | | abfunds.com |
PORTFOLIO OF INVESTMENTS (continued)
AB NATIONAL PORTFOLIO
| | | | | | | | |
| | | Principal
Amount
(000) | | | U.S. $ Value | |
| |
Series 2021-B
4.00%, 12/01/2038 | | $ | 1,500 | | | $ | 1,474,226 | |
Series 2022-A
4.00%, 12/01/2052 | | | 12,500 | | | | 11,112,851 | |
5.00%, 12/01/2055 | | | 2,500 | | | | 2,545,319 | |
| | | | | | | | |
| | | | | | | 73,207,648 | |
| | | | | | | | |
South Dakota – 0.0% | |
South Dakota Housing Development Authority
(Schuett Spearfish LP)
Series 2023
6.15%, 09/01/2039 | | | 400 | | | | 409,578 | |
| | | | | | | | |
|
Tennessee – 1.6% | |
Bristol Industrial Development Board
(Bristol Industrial Development Board Sales Tax)
Series 2016-A
5.00%, 12/01/2035(c) | | | 2,785 | | | | 2,551,753 | |
5.125%, 12/01/2042(c) | | | 1,325 | | | | 1,180,221 | |
Chattanooga Health Educational & Housing Facility Board
(CommonSpirit Health)
Series 2019-A
4.00%, 08/01/2037 | | | 345 | | | | 333,034 | |
4.00%, 08/01/2038 | | | 495 | | | | 470,817 | |
Knox County Industrial Development Board
(Tompaul Knoxville LLC)
Series 2022
9.25%, 11/01/2042(c) | | | 1,000 | | | | 1,010,317 | |
9.50%, 11/01/2052(c) | | | 1,000 | | | | 1,010,234 | |
Metropolitan Government Nashville & Davidson County Health & Educational Facilities Board
(Vanderbilt University Medical Center Obligated Group)
Series 2016
5.00%, 07/01/2035 | | | 4,325 | | | | 4,395,299 | |
Metropolitan Government Nashville & Davidson County Sports Authority
(Metropolitan Government of Nashville & Davidson County TN)
AGM Series 2023-A
5.25%, 07/01/2053 | | | 4,000 | | | | 4,262,585 | |
Metropolitan Nashville Airport Authority (The)
Series 2022-B
5.50%, 07/01/2040 | | | 2,350 | | | | 2,575,870 | |
| | |
| |
| abfunds.com | | AB MUNICIPAL INCOME FUND | 135 |
PORTFOLIO OF INVESTMENTS (continued)
AB NATIONAL PORTFOLIO
| | | | | | | | |
| | | Principal
Amount
(000) | | | U.S. $ Value | |
| |
State of Tennessee
Series 2023
5.00%, 05/01/2042 | | $ | 2,215 | | | $ | 2,446,469 | |
Tennergy Corp./TN
(Goldman Sachs Group, Inc. (The))
Series 2022-A
5.50%, 10/01/2053 | | | 5,000 | | | | 5,287,562 | |
Tennessee Energy Acquisition Corp.
(Goldman Sachs Group, Inc. (The))
Series 2023-A
5.00%, 05/01/2053 | | | 2,000 | | | | 2,066,061 | |
Wilson County Health & Educational Facilities Board
(Limestone Trail Apartments)
Series 2021
4.00%, 12/01/2039 | | | 1,000 | | | | 826,598 | |
4.25%, 12/01/2024 | | | 1,000 | | | | 978,096 | |
| | | | | | | | |
| | | | | | | 29,394,916 | |
| | | | | | | | |
Texas – 6.6% | |
Abilene Convention Center Hotel Development Corp.
(City of Abilene TX Abilene Convention Center Revenue)
Series 2021-B
5.00%, 10/01/2050(c) | | | 500 | | | | 430,076 | |
Arlington Higher Education Finance Corp.
(Cypress Christian School, Inc.)
Series 2024-2
5.75%, 06/01/2043(c) | | | 1,020 | | | | 1,042,631 | |
Arlington Higher Education Finance Corp.
(Harmony Public Schools)
Series 2016-A
5.00%, 02/15/2033 | | | 1,410 | | | | 1,435,732 | |
Arlington Higher Education Finance Corp.
(Magellan School (The))
Series 2022
6.25%, 06/01/2052(c) | | | 1,000 | | | | 1,031,399 | |
Bexar County Hospital District
Series 2018
5.00%, 02/15/2048 | | | 9,000 | | | | 9,083,678 | |
Board of Regents of the University of Texas System
Series 2017-C
5.00%, 08/15/2025 | | | 2,000 | | | | 2,036,882 | |
Series 2017-J
5.00%, 08/15/2025 | | | 2,460 | | | | 2,505,364 | |
| | |
| |
136 | AB MUNICIPAL INCOME FUND | | abfunds.com |
PORTFOLIO OF INVESTMENTS (continued)
AB NATIONAL PORTFOLIO
| | | | | | | | |
| | | Principal
Amount
(000) | | | U.S. $ Value | |
| |
Series 2019-B
5.00%, 08/15/2049 | | $ | 2,000 | | | $ | 2,241,542 | |
Central Texas Regional Mobility Authority
Series 2016
5.00%, 01/01/2032 | | | 1,600 | | | | 1,627,032 | |
5.00%, 01/01/2033 | | | 1,300 | | | | 1,321,126 | |
Central Texas Turnpike System
Series 2015-C
5.00%, 08/15/2034 | | | 10,000 | | | | 10,021,082 | |
City of Houston TX
(City of Houston TX Hotel Occupancy Tax)
Series 2015
5.00%, 09/01/2031 | | | 2,500 | | | | 2,506,074 | |
City of Houston TX Airport System Revenue
(United Airlines, Inc.)
Series 2014
5.00%, 07/01/2029 | | | 505 | | | | 505,039 | |
Series 2015-B
5.00%, 07/15/2030 | | | 4,650 | | | | 4,664,369 | |
Series 2018
5.00%, 07/15/2028 | | | 1,300 | | | | 1,324,317 | |
County of Harris TX
Series 2020-A
3.00%, 10/01/2045 | | | 1,600 | | | | 1,225,001 | |
County of Harris TX Toll Road Revenue
Series 2024-A
4.00%, 08/15/2054(b) | | | 1,000 | | | | 929,393 | |
Crowley Independent School District
(Pre-refunded – US Govt Agencies)
Series 2016-B
4.00%, 08/01/2037 | | | 1,855 | | | | 1,862,957 | |
Dallas Fort Worth International Airport
Series 2022-A
4.507%, 11/01/2051 | | | 1,000 | | | | 881,276 | |
Grand Parkway Transportation Corp.
Series 2018-A
5.00%, 10/01/2036 | | | 10,000 | | | | 10,500,710 | |
Harris County Cultural Education Facilities Finance Corp.
(Memorial Hermann Health System Obligated Group)
Series 2022
4.21% (MUNIPSA + 0.85%), 07/01/2049(a) | | | 1,000 | | | | 996,523 | |
| | |
| |
| abfunds.com | | AB MUNICIPAL INCOME FUND | 137 |
PORTFOLIO OF INVESTMENTS (continued)
AB NATIONAL PORTFOLIO
| | | | | | | | |
| | | Principal
Amount
(000) | | | U.S. $ Value | |
| |
Hidalgo County Regional Mobility Authority
Series 2022-A
Zero Coupon, 12/01/2050 | | $ | 2,000 | | | $ | 483,687 | |
Series 2022-B
Zero Coupon, 12/01/2042 | | | 2,000 | | | | 754,226 | |
Irving Hospital Authority
(Baylor Medical Center at Irving)
Series 2017-A
5.00%, 10/15/2044 | | | 1,785 | | | | 1,785,794 | |
Lamar Consolidated Independent School District
Series 2023-A
5.00%, 02/15/2058 | | | 10,000 | | | | 10,543,157 | |
Mission Economic Development Corp.
(Natgasoline LLC)
Series 2018
4.625%, 10/01/2031(c) | | | 4,500 | | | | 4,468,453 | |
New Hope Cultural Education Facilities Finance Corp.
(Army Retirement Residence Obligated Group)
Series 2022
5.75%, 07/15/2052 | | | 1,000 | | | | 954,429 | |
New Hope Cultural Education Facilities Finance Corp.
(BSPV – Plano LLC)
Series 2023
0.00%, 12/31/2030 | | | 177 | | | | 107,630 | |
7.25%, 12/31/2030 | | | 1,000 | | | | 993,234 | |
New Hope Cultural Education Facilities Finance Corp.
(Buckingham Senior Living Community, Inc. Obligated Group)
Series 2021
2.00%, 11/15/2061(d) | | | 4,075 | | | | 1,510,895 | |
7.50%, 11/15/2036(d) | | | 970 | | | | 793,839 | |
7.50%, 11/15/2037(d) | | | 150 | | | | 114,078 | |
New Hope Cultural Education Facilities Finance Corp.
(Dwyer Workforce Development)
Series 2023
8.50%, 09/01/2027(e) | | | 1,750 | | | | 1,750,303 | |
New Hope Cultural Education Facilities Finance Corp.
(Morningside Ministries Obligated Group)
Series 2020
5.00%, 01/01/2055 | | | 425 | | | | 323,957 | |
| | |
| |
138 | AB MUNICIPAL INCOME FUND | | abfunds.com |
PORTFOLIO OF INVESTMENTS (continued)
AB NATIONAL PORTFOLIO
| | | | | | | | |
| | | Principal
Amount
(000) | | | U.S. $ Value | |
| |
Series 2022
5.00%, 01/01/2057 | | $ | 1,000 | | | $ | 755,822 | |
Newark Higher Education Finance Corp.
(Abilene Christian University)
Series 2022
4.00%, 04/01/2057 | | | 5,000 | | | | 4,250,834 | |
North East Texas Regional Mobility Authority
Series 2016
5.00%, 01/01/2046 | | | 3,330 | | | | 3,332,106 | |
North Texas Tollway Authority
(North Texas Tollway System)
Series 2015-A
5.00%, 01/01/2035 | | | 5,000 | | | | 5,022,623 | |
Series 2015-B
5.00%, 01/01/2034 | | | 1,700 | | | | 1,709,245 | |
Series 2016-A
5.00%, 01/01/2036 | | | 1,000 | | | | 1,017,386 | |
AGC Series 2008
Zero Coupon, 01/01/2036 | | | 7,200 | | | | 4,612,802 | |
Pflugerville Independent School District
Series 2023-A
4.00%, 02/15/2044 | | | 5,445 | | | | 5,199,911 | |
Port Beaumont Navigation District
(Jefferson 2020 Bond Borrower LLC)
Series 2024
10.00%, 07/01/2026(b)(c) | | | 1,000 | | | | 1,000,189 | |
Port Beaumont Navigation District
(Jefferson Railport Terminal II LLC)
Series 2021
1.875%, 01/01/2026(c) | | | 850 | | | | 815,232 | |
Tarrant County Cultural Education Facilities Finance Corp.
Series 2015-A
5.00%, 11/15/2045(d)(h)(i)(j) | | | 3,097 | | | | – 0 | – |
Series 2015-B
5.00%, 11/15/2036(d)(h)(i)(j) | | | 1,514 | | | | – 0 | – |
Tarrant County Cultural Education Facilities Finance Corp.
(Stayton at Museum Way)
Series 2020-A
5.75%, 12/01/2054(d)(j) | | | 2,118 | | | | 1,334,601 | |
Texas Municipal Gas Acquisition & Supply Corp. IV
(BP PLC)
Series 2023-B
5.50%, 01/01/2054 | | | 2,000 | | | | 2,205,376 | |
| | |
| |
| abfunds.com | | AB MUNICIPAL INCOME FUND | 139 |
PORTFOLIO OF INVESTMENTS (continued)
AB NATIONAL PORTFOLIO
| | | | | | | | |
| | | Principal
Amount
(000) | | | U.S. $ Value | |
| |
Texas Municipal Gas Acquisition and Supply Corp. II
(JPMorgan Chase & Co.)
Series 2012-C
4.38% (CME Term SOFR 3 Month + 0.86%), 09/15/2027(a) | | $ | 3,000 | | | $ | 2,996,350 | |
Texas State Public Finance Authority Charter School Finance Corp.
(KIPP Texas, Inc.)
Series 2014-A
5.00%, 08/15/2032 | | | 1,385 | | | | 1,387,194 | |
5.00%, 08/15/2034 | | | 1,945 | | | | 1,947,692 | |
Texas State University System
Series 2024
5.00%, 03/15/2043(b) | | | 1,000 | | | | 1,086,602 | |
| | | | | | | | |
| | | | | | | 121,429,850 | |
| | | | | | | | |
Utah – 0.5% | | | | | | | | |
City of Salt Lake City UT Airport Revenue
Series 2017-A
5.00%, 07/01/2047 | | | 3,265 | | | | 3,271,357 | |
Intermountain Power Agency
Series 2022-A
5.00%, 07/01/2045 | | | 5,045 | | | | 5,366,000 | |
| | | | | | | | |
| | | | | | | 8,637,357 | |
| | | | | | | | |
Vermont – 0.1% | | | | | | | | |
Vermont Educational & Health Buildings Financing Agency
(St Michael’s College, Inc.)
Series 2023
5.50%, 10/01/2043(c) | | | 1,000 | | | | 996,276 | |
| | | | | | | | |
| | |
Virginia – 1.0% | | | | | | | | |
Align Affordable Housing Bond Fund LP
(Park Landing LP)
Series 2022-2
5.66%, 08/01/2052 | | | 2,000 | | | | 1,931,479 | |
Arlington County Industrial Development Authority
(Virginia Hospital Center Arlington Health System Obligated Group)
Series 2020
4.00%, 07/01/2045 | | | 690 | | | | 647,623 | |
Cherry Hill Community Development Authority
(Potomac Shores Project)
Series 2015
5.40%, 03/01/2045(c) | | | 1,410 | | | | 1,410,938 | |
| | |
| |
140 | AB MUNICIPAL INCOME FUND | | abfunds.com |
PORTFOLIO OF INVESTMENTS (continued)
AB NATIONAL PORTFOLIO
| | | | | | | | |
| | | Principal
Amount
(000) | | | U.S. $ Value | |
| |
County of Loudoun VA
Series 2016-A
4.00%, 12/01/2025 | | $ | 1,000 | | | $ | 1,009,111 | |
US Bank Trust Co. NA
(Park Landing LP)
Series 2022-B
5.90%, 08/01/2052 | | | 1,298 | | | | 1,173,270 | |
Virginia Beach Development Authority
(Westminster-Canterbury on Chesapeake Bay Obligated Group)
Series 2023
5.375%, 09/01/2029 | | | 1,000 | | | | 1,036,135 | |
Virginia Port Authority
(Pre-refunded – US Treasuries)
Series 2015-A
5.00%, 07/01/2030 | | | 2,730 | | | | 2,762,116 | |
Virginia Small Business Financing Authority
(Capital Beltway Express LLC)
Series 2022
5.00%, 12/31/2047 | | | 1,000 | | | | 1,014,224 | |
Virginia Small Business Financing Authority
(National Senior Campuses, Inc. Obligated Group)
Series 2020
5.00%, 01/01/2028 | | | 2,100 | | | | 2,138,362 | |
Virginia Small Business Financing Authority
(Pure Salmon Virginia LLC)
Series 2023
5.00%, 11/01/2052 | | | 6,000 | | | | 5,999,908 | |
| | | | | | | | |
| | | | | | | 19,123,166 | |
| | | | | | | | |
Washington – 2.5% | |
Central Puget Sound Regional Transit Authority
(Central Puget Sound Regional Transit Auth Sales Motor Vehicle & Rental Car Tax)
Series 2016-S
5.00%, 11/01/2046 | | | 2,000 | | | | 2,249,402 | |
Grant County Public Utility District No. 2 Priest Rapids Hydroelectric Project
(Pre-refunded – US Treasuries)
Series 2014-A
4.00%, 01/01/2044 | | | 6,000 | | | | 5,999,920 | |
Grays Harbor County Public Hospital District No. 1
Series 2023
6.875%, 12/01/2053 | | | 300 | | | | 304,462 | |
| | |
| |
| abfunds.com | | AB MUNICIPAL INCOME FUND | 141 |
PORTFOLIO OF INVESTMENTS (continued)
AB NATIONAL PORTFOLIO
| | | | | | | | |
| | | Principal
Amount
(000) | | | U.S. $ Value | |
| |
Grays Harbor County Public Hospital District No. 2
Series 2018
5.00%, 12/15/2048 | | $ | 5,650 | | | $ | 5,145,546 | |
King County School District No. 411 Issaquah
Series 2015
5.00%, 12/01/2025 | | | 2,000 | | | | 2,028,656 | |
Port of Seattle WA
Series 2019
4.00%, 04/01/2044 | | | 2,175 | | | | 1,987,143 | |
Series 2021
4.00%, 08/01/2041 | | | 2,000 | | | | 1,863,562 | |
Port of Tacoma WA
Series 2016-B
5.00%, 12/01/2037 | | | 2,000 | | | | 2,019,533 | |
5.00%, 12/01/2038 | | | 2,500 | | | | 2,519,144 | |
Spokane County School District No. 81 Spokane
Series 2012
3.00%, 12/01/2031 | | | 2,000 | | | | 1,831,916 | |
State of Washington
Series 2020-R
5.00%, 07/01/2025 | | | 2,500 | | | | 2,538,760 | |
Series 2022-R
5.00%, 07/01/2025 | | | 4,000 | | | | 4,062,016 | |
Series 2024-C
5.00%, 02/01/2025 | | | 3,420 | | | | 3,449,735 | |
Washington Health Care Facilities Authority
(Fred Hutchinson Cancer Center Obligated Group)
Series 2020
4.00%, 09/01/2045 | | | 455 | | | | 417,380 | |
5.00%, 09/01/2039 | | | 450 | | | | 472,099 | |
5.00%, 09/01/2040 | | | 700 | | | | 731,367 | |
5.00%, 09/01/2045 | | | 430 | | | | 444,116 | |
5.00%, 09/01/2050 | | | 500 | | | | 512,025 | |
Series 2021
3.00%, 12/01/2034(c) | | | 425 | | | | 375,741 | |
4.00%, 12/01/2048(c) | | | 1,740 | | | | 1,557,572 | |
5.00%, 12/01/2027(c) | | | 440 | | | | 455,163 | |
5.00%, 12/01/2028(c) | | | 305 | | | | 318,937 | |
5.00%, 12/01/2029(c) | | | 170 | | | | 179,704 | |
5.00%, 12/01/2030(c) | | | 265 | | | | 282,869 | |
5.00%, 12/01/2031(c) | | | 265 | | | | 283,016 | |
5.00%, 12/01/2032(c) | | | 225 | | | | 240,469 | |
5.00%, 12/01/2033(c) | | | 245 | | | | 261,813 | |
| | |
| |
142 | AB MUNICIPAL INCOME FUND | | abfunds.com |
PORTFOLIO OF INVESTMENTS (continued)
AB NATIONAL PORTFOLIO
| | | | | | | | |
| | | Principal
Amount
(000) | | | U.S. $ Value | |
| |
Washington Higher Education Facilities Authority
(Corp. of Gonzaga University (The))
Series 2023
4.00%, 04/01/2043 | | $ | 2,600 | | | $ | 2,417,532 | |
Washington State Housing Finance Commission
(Presbyterian Retirement Communities Northwest Obligated Group)
Series 2019-A
5.00%, 01/01/2044(c) | | | 1,000 | | | | 825,516 | |
5.00%, 01/01/2055(c) | | | 365 | | | | 276,729 | |
Washington State Housing Finance Commission
(Seattle Academy of Arts & Sciences)
Series 2023
6.375%, 07/01/2063(c) | | | 1,000 | | | | 1,089,572 | |
| | | | | | | | |
| | | | | | | 47,141,415 | |
| | | | | | | | |
West Virginia – 0.2% | | | | | | | | |
Monongalia County Commission Excise Tax District
Series 2023
0.00%, 06/01/2053(c)(f) | | | 815 | | | | 174,358 | |
7.00%, 06/01/2043(c) | | | 150 | | | | 157,499 | |
Tobacco Settlement Finance Authority/WV
Series 2020
4.875%, 06/01/2049 | | | 1,690 | | | | 1,603,145 | |
West Virginia Economic Development Authority
(Wyoming County Coal LLC)
Series 2023
9.00%, 06/01/2038(c) | | | 2,250 | | | | 2,280,656 | |
| | | | | | | | |
| | | | | | | 4,215,658 | |
| | | | | | | | |
Wisconsin – 3.4% | | | | | | | | |
St. Croix Chippewa Indians of Wisconsin
Series 2021
5.00%, 09/30/2041(c) | | | 1,000 | | | | 737,110 | |
State of Wisconsin
Series 2025-1
5.00%, 05/01/2033(b) | | | 1,000 | | | | 1,097,066 | |
Wisconsin Center District
(Wisconsin Center District Ded Tax)
Series 2022
5.25%, 12/15/2061(c) | | | 1,000 | | | | 1,000,841 | |
| | |
| |
| abfunds.com | | AB MUNICIPAL INCOME FUND | 143 |
PORTFOLIO OF INVESTMENTS (continued)
AB NATIONAL PORTFOLIO
| | | | | | | | |
| | | Principal
Amount
(000) | | | U.S. $ Value | |
| |
Wisconsin Health & Educational Facilities Authority
(Advocate Aurora Health Obligated Group)
Series 2023
5.00%, 08/15/2054 | | $ | 1,250 | | | $ | 1,273,471 | |
Wisconsin Health & Educational Facilities Authority
(Gundersen Lutheran Obligated Group)
Series 2021
4.00%, 10/15/2035 | | | 1,375 | | | | 1,372,129 | |
4.00%, 10/15/2036 | | | 2,600 | | | | 2,583,933 | |
Wisconsin Health & Educational Facilities Authority
(St. Camillus Health System Obligated Group)
Series 2019
5.00%, 11/01/2046 | | | 250 | | | | 212,042 | |
5.00%, 11/01/2054 | | | 215 | | | | 172,226 | |
Wisconsin Health & Educational Facilities Authority
(Thedacare, Inc. Obligated Group)
Series 2019
4.00%, 12/15/2035 | | | 305 | | | | 300,903 | |
4.00%, 12/15/2036 | | | 335 | | | | 328,686 | |
4.00%, 12/15/2037 | | | 320 | | | | 309,775 | |
4.00%, 12/15/2038 | | | 335 | | | | 318,225 | |
Wisconsin Housing & Economic Development Authority
(Roers Sun Prairie Apartments Owner LLC)
Series 2022
4.625%, 03/15/2040(c) | | | 255 | | | | 223,196 | |
Series 2022-A
3.875%, 12/01/2039(c) | | | 1,170 | | | | 1,016,047 | |
Wisconsin Public Finance Authority
Series 2024
Zero Coupon, 02/01/2031 | | | 1,000 | | | | 608,833 | |
Wisconsin Public Finance Authority
(Beyond Boone LLC)
AGM Series 2019
5.00%, 07/01/2054 | | | 775 | | | | 779,080 | |
5.00%, 07/01/2058 | | | 750 | | | | 753,949 | |
| | |
| |
144 | AB MUNICIPAL INCOME FUND | | abfunds.com |
PORTFOLIO OF INVESTMENTS (continued)
AB NATIONAL PORTFOLIO
| | | | | | | | |
| | | Principal
Amount
(000) | | | U.S. $ Value | |
| |
Wisconsin Public Finance Authority
(Blue Ridge Healthcare Obligated Group)
Series 2020
5.00%, 01/01/2035 | | $ | 500 | | | $ | 518,130 | |
5.00%, 01/01/2036 | | | 500 | | | | 517,312 | |
5.00%, 01/01/2037 | | | 500 | | | | 515,488 | |
Wisconsin Public Finance Authority
(Catholic Bishop of Chicago (The))
Series 2021
5.75%, 07/25/2041(e) | | | 6,750 | | | | 5,980,062 | |
Wisconsin Public Finance Authority
(Celanese US Holdings LLC)
Series 2016-B
5.00%, 12/01/2025 | | | 1,795 | | | | 1,812,861 | |
Wisconsin Public Finance Authority
(CFC-SA LLC)
Series 2022
5.00%, 02/01/2052 | | | 1,150 | | | | 1,128,640 | |
5.75%, 02/01/2052(c) | | | 1,500 | | | | 1,498,649 | |
6.00%, 02/01/2062(c) | | | 1,700 | | | | 1,727,917 | |
Wisconsin Public Finance Authority
(CHF – Wilmington LLC)
AGM Series 2018
5.00%, 07/01/2053 | | | 3,315 | | | | 3,349,498 | |
Wisconsin Public Finance Authority
(FAH Tree House LLC)
Series 2023
6.50%, 08/01/2053(c) | | | 2,825 | | | | 2,834,834 | |
Wisconsin Public Finance Authority
(Moses H Cone Memorial Hospital Obligated Group)
Series 2022-A
5.00%, 10/01/2052 | | | 15,000 | | | | 15,643,743 | |
Wisconsin Public Finance Authority
(North San Gabriel Municipal Utility District No. 1)
Series 2023
Zero Coupon, 09/01/2029(c) | | | 1,000 | | | | 684,671 | |
Wisconsin Public Finance Authority
(Pine Lake Preparatory, Inc.)
Series 2015
5.50%, 03/01/2045(c) | | | 3,465 | | | | 3,471,669 | |
| | |
| |
| abfunds.com | | AB MUNICIPAL INCOME FUND | 145 |
PORTFOLIO OF INVESTMENTS (continued)
AB NATIONAL PORTFOLIO
| | | | | | | | |
| | | Principal
Amount
(000) | | | U.S. $ Value | |
| |
Wisconsin Public Finance Authority
(Queens University of Charlotte)
Series 2022
5.25%, 03/01/2042 | | $ | 2,000 | | | $ | 2,033,438 | |
Wisconsin Public Finance Authority
(Samaritan Housing Foundation Obligated Group)
Series 2021
4.00%, 06/01/2056(c) | | | 5,000 | | | | 3,674,405 | |
Series 2022
4.00%, 06/01/2049(c) | | | 990 | | | | 761,748 | |
Wisconsin Public Finance Authority
(Southeast Overtown Park West Community Redevelopment Agency)
Series 2024
5.00%, 06/01/2041(c) | | | 1,000 | | | | 1,000,141 | |
Wisconsin Public Finance Authority
(Southeastern Regional Medical Center Obligated Group)
Series 2022
5.00%, 02/01/2033 | | | 2,000 | | | | 1,850,622 | |
| | | | | | | | |
| | | | | | | 62,091,340 | |
| | | | | | | | |
Total Municipal Obligations
(cost $1,867,104,679) | | | | | | | 1,811,387,402 | |
| | | | | | | | |
| | | | | | | | |
COMMERCIAL MORTGAGE-BACKED SECURITIES – 1.6% | | | | | | | | |
Agency CMBS – 0.9% | | | | | | | | |
California Housing Finance Agency
Series 2021-2, Class A
3.75%, 03/25/2035 | | | 4,826 | | | | 4,634,374 | |
Series 2021-2, Class X
0.82%, 03/25/2035(k) | | | 2,413 | | | | 110,338 | |
Series 2021-3, Class A
3.25%, 08/20/2036 | | | 961 | | | | 865,230 | |
Series 2021-3, Class X
0.77%, 08/20/2036(k) | | | 2,211 | | | | 110,765 | |
Federal Home Loan Mortgage Corp.
Series 2024-ML21, Class AUS
4.62%, 08/25/2041 | | | 3,224 | | | | 3,291,438 | |
Series 2021-ML10, Class ACA
2.046%, 06/25/2038 | | | 964 | | | | 743,491 | |
Series 2021-ML10, Class AUS
2.032%, 01/25/2038 | | | 1,256 | | | | 959,100 | |
| | |
| |
146 | AB MUNICIPAL INCOME FUND | | abfunds.com |
PORTFOLIO OF INVESTMENTS (continued)
AB NATIONAL PORTFOLIO
| | | | | | | | |
| | | Principal
Amount
(000) | | | U.S. $ Value | |
| |
Federal Home Loan Mortgage Corp. Multifamily VRD Certificates
Series 2021-ML12, Class AUS
2.34%, 07/25/2041 | | $ | 1,951 | | | $ | 1,550,410 | |
Series 2022-ML13, Class XCA
0.96%, 07/25/2036(k) | | | 1,540 | | | | 81,411 | |
Series 2022-ML13, Class XUS
0.98%, 09/25/2036(k) | | | 2,632 | | | | 172,586 | |
Series M052, Class A
2.65%, 06/15/2036 | | | 5,285 | | | | 4,262,016 | |
| | | | | | | | |
| | | | | | | 16,781,159 | |
| | | | | | | | |
Non-Agency Fixed Rate CMBS – 0.7% | | | | | | | | |
Arizona Industrial Development Authority
Series 2019-2, Class A
3.625%, 05/20/2033 | | | 4,940 | | | | 4,467,308 | |
California Housing Finance Agency
Series 2019-2, Class A
4.00%, 03/20/2033 | | | 547 | | | | 537,580 | |
Series 2021-1, Class A
3.50%, 11/20/2035 | | | 952 | | | | 888,242 | |
City of Fort Wayne IN
10.75%, 12/01/2029(d) | | | 105 | | | | 11 | |
National Finance Authority
Series 2022-2, Class X
0.652%, 10/01/2036(k) | | | 3,915 | | | | 182,520 | |
New Hampshire Business Finance Authority
Series 2020-1, Class A
4.125%, 01/20/2034 | | | 4,966 | | | | 4,719,032 | |
Series 2022-1, Class X
0.334%, 09/20/2036(k) | | | 6,048 | | | | 129,847 | |
Washington State Housing Finance Commission
Series 2021-1, Class A
3.50%, 12/20/2035 | | | 2,259 | | | | 2,001,150 | |
Series 2021-1, Class X
0.726%, 12/20/2035(k) | | | 1,911 | | | | 83,094 | |
Series 2023-1, Class X
1.448%, 04/20/2037(k) | | | 4,980 | | | | 530,855 | |
| | | | | | | | |
| | | | | | | 13,539,639 | |
| | | | | | | | |
Total Commercial Mortgage-Backed Securities
(cost $36,080,937) | | | | | | | 30,320,798 | |
| | | | | | | | |
| | | | | | | | |
| | |
| |
| abfunds.com | | AB MUNICIPAL INCOME FUND | 147 |
PORTFOLIO OF INVESTMENTS (continued)
AB NATIONAL PORTFOLIO
| | | | | | | | |
| | | Principal
Amount
(000) | | | U.S. $ Value | |
| |
ASSET-BACKED SECURITIES – 0.2% | | | | | | | | |
Other ABS - Fixed Rate – 0.2% | | | | | | | | |
HTA TRRB Custodial Trust
Series 2022
5.25%, 07/01/2034 | | $ | 1,573 | | | $ | 1,532,294 | |
5.25%, 07/01/2036 | | | 1,655 | | | | 1,662,085 | |
5.25%, 07/01/2041 | | | 1,125 | | | | 1,095,666 | |
| | | | | | | | |
| | |
Total Asset-Backed Securities
(cost $4,335,754) | | | | | | | 4,290,045 | |
| | | | | | | | |
| | |
| | | Shares | | | | |
PREFERRED STOCKS – 0.0% | | | | | | | | |
Utility – 0.0% | | | | | | | | |
Electric – 0.0% | | | | | | | | |
AES Puerto Rico LP
0.00%(h)(j)(l)
(cost $969,221) | | | 53,964 | | | | 157,035 | |
| | | | | | | | |
| | | | | | | | |
SHORT-TERM INVESTMENTS – 0.6% | | | | | | | | |
Investment Companies – 0.6% | | | | | | | | |
AB Fixed Income Shares, Inc. – Government Money Market Portfolio – Class AB, 5.22%(m)(n)(o)
(cost $10,267,244) | | | 10,267,244 | | | | 10,267,244 | |
| | | | | | | | |
| | |
Total Investments – 100.4%
(cost $1,918,757,835) | | | | | | | 1,856,422,524 | |
Other assets less liabilities – (0.4)% | | | | | | | (7,715,396 | ) |
| | | | | | | | |
| | |
Net Assets – 100.0% | | | | | | $ | 1,848,707,128 | |
| | | | | | | | |
CENTRALLY CLEARED CREDIT DEFAULT SWAPS (see Note D)
| | | | | | | | | | | | | | | | | | | | | | | | | | |
| Description | | Fixed
Rate
(Pay)
Receive | | Payment
Frequency | | | Implied
Credit
Spread at
May 31,
2024 | | | Notional
Amount
(000) | | | Market
Value | | | Upfront
Premiums
Paid
(Received) | | | Unrealized
Appreciation
(Depreciation) | |
Buy Contracts | | | | | | | | | | | | | | | | | | | | | | | | |
CDX-NAHY Series 42, 5 Year Index, 06/20/2029* | | (5.00)% | | | Quarterly | | | | 3.34% | | | | USD 27,690 | | | | $ (2,150,222) | | | | $ (1,812,893) | | | | $ (337,329) | |
| | |
| |
148 | AB MUNICIPAL INCOME FUND | | abfunds.com |
PORTFOLIO OF INVESTMENTS (continued)
AB NATIONAL PORTFOLIO
CENTRALLY CLEARED INTEREST RATE SWAPS (see Note D)
| | | | | | | | | | | | | | | | | | | | | | | | | | | | | | |
| | | | | | | | | Rate Type | | | | | | | | | | | | |
Notional
Amount
(000) | | | Termination
Date | | | Payments
made
by the
Fund | | | Payments
received
by the
Fund | | | Payment
Frequency Paid/
Received | | Market
Value | | | Upfront
Premiums
Paid
(Received) | | | Unrealized
Appreciation
(Depreciation) | |
| USD | | | 30,000 | | | | 01/15/2027 | | | | 1 Day SOFR | | | | 2.540% | | | Annual | | $ | (1,840,642 | ) | | $ | – 0 | – | | $ | (1,840,642 | ) |
| USD | | | 20,000 | | | | 01/15/2027 | | | | 1 Day SOFR | | | | 2.143% | | | Annual | | | (1,451,061 | ) | | | – 0 | – | | | (1,451,061 | ) |
| USD | | | 42,100 | | | | 07/31/2029 | | | | 1 Day SOFR | | | | 4.109% | | | Annual | | | (386,111 | ) | | | – 0 | – | | | (386,111 | ) |
| USD | | | 34,900 | | | | 07/31/2029 | | | | 1 Day SOFR | | | | 3.975% | | | Annual | | | (592,558 | ) | | | – 0 | – | | | (592,558 | ) |
| USD | | | 40,800 | | | | 07/31/2030 | | | | 1 Day SOFR | | | | 4.032% | | | Annual | | | (824,752 | ) | | | – 0 | – | | | (824,752 | ) |
| USD | | | 15,600 | | | | 11/01/2030 | | | | 1 Day SOFR | | | | 4.105% | | | Annual | | | (201,549 | ) | | | – 0 | – | | | (201,549 | ) |
| USD | | | 6,100 | | | | 01/08/2031 | | | | 1 Day SOFR | | | | 3.580% | | | Annual | | | (253,851 | ) | | | – 0 | – | | | (253,851 | ) |
| | | | | | | | | | | | | | | | | | | | | | | | | | | | | | |
| | | | | | | | | | | | | | | | | | | | $ | (5,550,524 | ) | | $ | – 0 | – | | $ | (5,550,524 | ) |
| | | | | | | | | | | | | | | | | | | | | | | | | | | | | | |
INTEREST RATE SWAPS (see Note D)
| | | | | | | | | | | | | | | | | | | | | | | | | | | | | | | | | | | | |
| | | | | | | | | | | | Rate Type | | | | | | | | | | | | | |
Swap
Counterparty | | Notional
Amount
(000) | | | Termination
Date | | | Payments
made
by the
Fund | | | Payments
received
by the
Fund | | | Payment
Frequency
Paid/
Received | | | Market
Value | | | Upfront
Premiums
Paid
(Received) | | | Unrealized
Appreciation
(Depreciation) | |
Citibank, NA | | | USD | | | | 22,105 | | | | 10/09/2029 | | | | 1.125% | | | | SIFMA* | | | | Quarterly | | | $ | 2,284,141 | | | $ | – 0 | – | | $ | 2,284,141 | |
Morgan Stanley Capital Services LLC | | | USD | | | | 7,000 | | | | 04/21/2025 | | | | MMD 10 Year^ | | | | 3.220% | | | | Maturity | | | | (106,531 | ) | | | – 0 | – | | | (106,531 | ) |
Bank of America, NA | | | USD | | | | 10,000 | | | | 05/21/2025 | | | | MMD 5 Year^ | | | | 3.200% | | | | Maturity | | | | (94,833 | ) | | | – 0 | – | | | (94,833 | ) |
Citibank, NA | | | USD | | | | 15,000 | | | | 08/30/2024 | | | | MMD 5 Year^ | | | | 3.200% | | | | Maturity | | | | 38,994 | | | | – 0 | – | | | 38,994 | |
Citibank, NA | | | USD | | | | 15,000 | | | | 08/26/2024 | | | | MMD 5 Year^ | | | | 3.250% | | | | Maturity | | | | (7,847 | ) | | | – 0 | – | | | (7,847 | ) |
Citibank, NA | | | USD | | | | 8,000 | | | | 09/26/2024 | | | | MMD 5 Year^ | | | | 3.490% | | | | Maturity | | | | 123,059 | | | | – 0 | – | | | 123,059 | |
JPMorgan Chase Bank, NA | | | USD | | | | 7,000 | | | | 03/27/2025 | | | | MMD 5 Year^ | | | | 2.920% | | | | Maturity | | | | (144,500 | ) | | | – 0 | – | | | (144,500 | ) |
Morgan Stanley Capital Services LLC | | | USD | | | | 15,000 | | | | 04/16/2025 | | | | MMD 5 Year^ | | | | 3.040% | | | | Maturity | | | | (235,423 | ) | | | – 0 | – | | | (235,423 | ) |
Morgan Stanley Capital Services LLC | | | USD | | | | 10,000 | | | | 05/09/2025 | | | | MMD 5 Year^ | | | | 3.050% | | | | Maturity | | | | (161,358 | ) | | | – 0 | – | | | (161,358 | ) |
Morgan Stanley Capital Services LLC | | | USD | | | | 10,000 | | | | 05/27/2025 | | | | MMD 5 Year^ | | | | 3.310% | | | | Maturity | | | | (46,262 | ) | | | – 0 | – | | | (46,262 | ) |
| | | | | | | | | | | | | | | | | | | | | | | | | | | | | | | | | | | | |
| | | | | | | | | | | | | | | | | | | | | | | | | | $ | 1,649,440 | | | $ | – 0 | – | | $ | 1,649,440 | |
| | | | | | | | | | | | | | | | | | | | | | | | | | | | | | | | | | | | |
| ^ | Variable interest rate based on the Municipal Market Data AAA General Obligation Scale. |
| * | Variable interest rate based on the Securities Industry & Financial Markets Association (SIFMA) Municipal Swap Index. |
| (a) | Floating Rate Security. Stated interest/floor/ceiling rate was in effect at May 31, 2024. |
| (b) | When-Issued or delayed delivery security. |
| (c) | Security is exempt from registration under Rule 144A or Regulation S of the Securities Act of 1933. These securities are considered restricted, but liquid and may be resold in transactions exempt from registration. At May 31, 2024, the aggregate market value of these securities amounted to $193,095,635 or 10.4% of net assets. |
| | |
| |
| abfunds.com | | AB MUNICIPAL INCOME FUND | 149 |
PORTFOLIO OF INVESTMENTS (continued)
AB NATIONAL PORTFOLIO
| (e) | Security is exempt from registration under Rule 144A or Regulation S of the Securities Act of 1933. These securities, which represent 1.53% of net assets as of May 31, 2024, are considered illiquid and restricted. Additional information regarding such securities follows: |
| | | | | | | | | | | | | | |
144A/Restricted & Illiquid
Securities | | Acquisition
Date | | Cost | | | Market
Value | | | Percentage of
Net Assets | |
ARC70 II TRUST
Series 2023
4.84%, 04/01/2065 | | 07/18/2023 | | $ | 4,770,942 | | | $ | 4,574,040 | | | | 0.25 | % |
Arizona Industrial Development Authority
(Legacy Cares, Inc.)
Series 2020
7.75%, 07/01/2050 | | 06/09/2022 – 07/20/2022 | | | 4,116,975 | | | | 223,500 | | | | 0.01 | % |
Douglas County Housing Partnership
(Bridgewater Castle Rock ALF LLC)
Series 2021
5.375%, 01/01/2041 | | 01/14/2021 | | | 2,465,054 | | | | 1,853,047 | | | | 0.10 | % |
Indiana Finance Authority
(Brightmark Plastics Renewal Indiana LLC)
Series 2019
7.00%, 03/01/2039 | | 03/29/2019 | | | 3,581,381 | | | | 2,404,742 | | | | 0.13 | % |
Mississippi Business Finance Corp.
(Alden Group Renewable Energy Mississippi LLC)
Series 2022
8.00%, 12/01/2029 | | 12/13/2022 | | | 1,234,360 | | | | 1,224,634 | | | | 0.07 | % |
New Hope Cultural Education Facilities Finance Corp.
(Dwyer Workforce Development)
Series 2023
8.50%, 09/01/2027 | | 02/03/2023 | | | 1,750,000 | | | | 1,750,303 | | | | 0.09 | % |
South Carolina Jobs-Economic Development Authority
(Last Step Recycling LLC)
Series 2021
6.50%, 06/01/2051 | | 02/25/2022 – 10/20/2022 | | | 1,293,300 | | | | 842,861 | | | | 0.05 | % |
University of Toledo
Series 2023-B
4.617%, 06/01/2036 | | 06/30/2023 | | | 9,775,000 | | | | 9,492,282 | | | | 0.51 | % |
| | |
| |
150 | AB MUNICIPAL INCOME FUND | | abfunds.com |
PORTFOLIO OF INVESTMENTS (continued)
AB NATIONAL PORTFOLIO
| | | | | | | | | | | | | | |
144A/Restricted & Illiquid
Securities | | Acquisition
Date | | Cost | | | Market
Value | | | Percentage of
Net Assets | |
Wisconsin Public Finance Authority
(Catholic Bishop of Chicago (The))
Series 2021
5.75%, 07/25/2041 | | 08/03/2021 | | $ | 6,750,000 | | | $ | 5,980,062 | | | | 0.32 | % |
| (f) | Coupon rate adjusts periodically based upon a predetermined schedule. Stated interest rate in effect at May 31, 2024. |
| (g) | Inverse floater security. |
| (h) | Fair valued by the Adviser. |
| (i) | Security in which significant unobservable inputs (Level 3) were used in determining fair value. |
| (j) | Restricted and illiquid security. |
| | | | | | | | | | | | | | |
Restricted & Illiquid
Securities | | Acquisition
Date | | Cost | | | Market
Value | | | Percentage of
Net Assets | |
Tarrant County Cultural Education Facilities Finance Corp.
Series 2015-B
5.00%, 11/15/2036 | | 05/22/2015 | | $ | 1,528,934 | | | $ | – 0 | – | | | 0.00 | % |
Tarrant County Cultural Education Facilities Finance Corp.
Series 2015-A
5.00%, 11/15/2045 | | 05/07/2015 – 11/10/2015 | | | 3,128,630 | | | | – 0 | – | | | 0.00 | % |
Tarrant County Cultural Education Facilities Finance Corp.
(Stayton at Museum Way)
Series 2020-A
5.75%, 12/01/2054 | | 04/08/2010 | | | 2,094,247 | | | | 1,334,601 | | | | 0.07 | % |
| (l) | Non-income producing security. |
| (m) | Affiliated investments. |
| (n) | The rate shown represents the 7-day yield as of period end. |
| (o) | To obtain a copy of the fund’s shareholder report, please go to the Securities and Exchange Commission’s website at www.sec.gov, or call AB at (800) 227-4618. |
As of May 31, 2024, the Portfolio’s percentages of investments in municipal bonds that are insured and in insured municipal bonds that have been pre-refunded or escrowed to maturity are 5.4% and 0.0%, respectively.
| | |
| |
| abfunds.com | | AB MUNICIPAL INCOME FUND | 151 |
PORTFOLIO OF INVESTMENTS (continued)
AB NATIONAL PORTFOLIO
Glossary:
ABS – Asset-Backed Securities
AGC – Assured Guaranty Corporation
AGM – Assured Guaranty Municipal
BAM – Build American Mutual
CFD – Community Facilities District
CHF – Collegiate Housing Foundation
CMBS – Commercial Mortgage-Backed Securities
CME – Chicago Mercantile Exchange
COP – Certificate of Participation
MMD – Municipal Market Data
NATL – National Interstate Corporation
SOFR – Secured Overnight Financing Rate
MUNIPSA – SIFMA Municipal Swap Index
UPMC – University of Pittsburgh Medical Center
XLCA – XL Capital Assurance Inc.
See notes to financial statements.
| | |
| |
152 | AB MUNICIPAL INCOME FUND | | abfunds.com |
PORTFOLIO OF INVESTMENTS
AB NEW YORK PORTFOLIO
May 31, 2024
| | | | | | | | |
| | | Principal
Amount
(000) | | | U.S. $ Value | |
| |
MUNICIPAL OBLIGATIONS – 97.5% | | | | | | | | |
Long-Term Municipal Bonds – 97.5% | | | | | | | | |
New York – 91.0% | | | | | | | | |
Brookhaven Local Development Corp.
(Jefferson’s Ferry)
Series 2016
5.25%, 11/01/2036 | | $ | 1,500 | | | $ | 1,530,181 | |
Series 2020
4.00%, 11/01/2045 | | | 1,000 | | | | 869,436 | |
Broome County Local Development Corp.
(Good Shepherd Village at Endwell Obligated Group)
Series 2021
4.00%, 07/01/2047 | | | 1,000 | | | | 760,021 | |
Buffalo & Fort Erie Public Bridge Authority
Series 2017
5.00%, 01/01/2042 | | | 2,250 | | | | 2,291,863 | |
Build NYC Resource Corp.
(Albert Einstein College of Medicine, Inc.)
Series 2016
5.50%, 09/01/2045(a) | | | 940 | | | | 940,646 | |
Build NYC Resource Corp.
(City University of New York (The))
Series 2014-A
5.00%, 06/01/2030 | | | 1,110 | | | | 1,110,341 | |
5.00%, 06/01/2033 | | | 1,320 | | | | 1,320,374 | |
5.00%, 06/01/2034 | | | 550 | | | | 550,139 | |
Build NYC Resource Corp.
(Classical Charter School, Inc.)
Series 2023
4.75%, 06/15/2058 | | | 760 | | | | 706,747 | |
Build NYC Resource Corp.
(East Harlem Scholars Academy Charter School Obligated Group)
Series 2022
5.75%, 06/01/2052(a) | | | 2,125 | | | | 2,168,618 | |
5.75%, 06/01/2062(a) | | | 1,905 | | | | 1,934,352 | |
Build NYC Resource Corp.
(Global Community Charter School)
Series 2022
5.00%, 06/15/2052 | | | 1,275 | | | | 1,236,614 | |
Build NYC Resource Corp.
(Grand Concourse Acadmey Charter School) Series 2022
5.00%, 07/01/2052 | | | 975 | | | | 963,950 | |
5.00%, 07/01/2056 | | | 1,410 | | | | 1,378,937 | |
5.00%, 07/01/2062 | | | 6,000 | | | | 5,801,034 | |
| | |
| |
| abfunds.com | | AB MUNICIPAL INCOME FUND | 153 |
PORTFOLIO OF INVESTMENTS (continued)
AB NEW YORK PORTFOLIO
| | | | | | | | |
| | | Principal
Amount
(000) | | | U.S. $ Value | |
| |
Build NYC Resource Corp.
(Integration Charter Schools)
Series 2021
5.00%, 06/01/2051(a) | | $ | 1,500 | | | $ | 1,372,511 | |
Build NYC Resource Corp.
(KIPP NYC Public Charter Schools)
Series 2023
5.25%, 07/01/2052 | | | 2,000 | | | | 2,041,350 | |
5.25%, 07/01/2062 | | | 3,000 | | | | 3,045,104 | |
Build NYC Resource Corp.
(Metropolitan College of New York)
Series 2014
5.25%, 11/01/2029 | | | 2,555 | | | | 1,533,000 | |
5.50%, 11/01/2044 | | | 1,625 | | | | 975,000 | |
Build NYC Resource Corp.
(Metropolitan Lighthouse Charter School)
Series 2017
5.00%, 06/01/2052(a) | | | 1,000 | | | | 950,451 | |
Build NYC Resource Corp.
(South Bronx Charter School For International Cultures & The Arts)
Series 2023
7.00%, 04/15/2053(a) | | | 1,200 | | | | 1,280,179 | |
City of New York NY
Series 2016-B
5.00%, 12/01/2034 | | | 2,000 | | | | 2,044,170 | |
Series 2021
1.396%, 08/01/2027 | | | 5,905 | | | | 5,280,215 | |
1.723%, 08/01/2029 | | | 2,475 | | | | 2,111,848 | |
1.823%, 08/01/2030 | | | 2,210 | | | | 1,840,415 | |
Series 2024-D
5.25%, 04/01/2054 | | | 5,000 | | | | 5,430,485 | |
Series 2024-I
5.00%, 04/01/2034 | | | 1,620 | | | | 1,833,681 | |
City of New York NY
(Pre-refunded - US Treasuries)
Series 2021
1.723%, 08/01/2029 | | | 525 | | | | 453,721 | |
1.823%, 08/01/2030 | | | 790 | | | | 666,662 | |
Dutchess County Local Development Corp.
(Bard College)
Series 2020-A
5.00%, 07/01/2051 | | | 6,400 | | | | 6,280,666 | |
Series 2020-B
5.918%, 07/01/2039 | | | 1,405 | | | | 1,364,531 | |
| | |
| |
154 | AB MUNICIPAL INCOME FUND | | abfunds.com |
PORTFOLIO OF INVESTMENTS (continued)
AB NEW YORK PORTFOLIO
| | | | | | | | |
| | | Principal
Amount
(000) | | | U.S. $ Value | |
| |
Hempstead Town Local Development Corp.
(Evergreen Charter School, Inc.)
Series 2022-A
5.50%, 06/15/2057 | | $ | 5,000 | | | $ | 5,062,928 | |
Hempstead Town Local Development Corp.
(Molloy College)
Series 2014
5.00%, 07/01/2034 | | | 1,845 | | | | 1,845,639 | |
5.00%, 07/01/2039 | | | 1,100 | | | | 1,100,037 | |
Series 2018
5.00%, 07/01/2048 | | | 1,495 | | | | 1,466,477 | |
Hudson Yards Infrastructure Corp.
Series 2017-A
5.00%, 02/15/2042 | | | 5,000 | | | | 5,116,657 | |
Long Island Power Authority
Series 2014-A
5.00%, 09/01/2035 | | | 1,000 | | | | 1,002,012 | |
Series 2016-B
5.00%, 09/01/2030 | | | 5,000 | | | | 5,156,801 | |
5.00%, 09/01/2033 | | | 3,515 | | | | 3,622,930 | |
Series 2023-E
5.00%, 09/01/2048 | | | 5,000 | | | | 5,380,725 | |
Metropolitan Transportation Authority
Series 2010
6.814%, 11/15/2040 | | | 2,000 | | | | 2,175,539 | |
Series 2021
3.994% (SOFR + 0.43%), 11/01/2026(b) | | | 480 | | | | 478,126 | |
AGM Series 2021
4.364% (SOFR + 0.80%), 11/01/2032(b) | | | 1,285 | | | | 1,283,766 | |
BAM Series 2024-A
4.00%, 11/15/2048 | | | 6,000 | | | | 5,648,198 | |
Metropolitan Transportation Authority
(Metropolitan Transportation Authority Dedicated Tax Fund)
Series 2016-A
5.25%, 11/15/2034 | | | 10,740 | | | | 11,143,314 | |
5.25%, 11/15/2035 | | | 5,000 | | | | 5,180,405 | |
Metropolitan Transportation Authority
(Pre-refunded - US Govt Agencies)
Series 2014-B
5.00%, 11/15/2044 | | | 12,000 | | | | 12,006,566 | |
Metropolitan Transportation Authority Payroll Mobility Tax Revenue
Series 2024-A
5.37%, 12/19/2024 | | | 1,500 | | | | 1,499,773 | |
| | |
| |
| abfunds.com | | AB MUNICIPAL INCOME FUND | 155 |
PORTFOLIO OF INVESTMENTS (continued)
AB NEW YORK PORTFOLIO
| | | | | | | | |
| | | Principal
Amount
(000) | | | U.S. $ Value | |
| |
Monroe County Industrial Development Corp./NY
(Academy of Health Sciences Charter School)
Series 2022
5.875%, 07/01/2052(a) | | $ | 2,000 | | | $ | 2,017,766 | |
Monroe County Industrial Development Corp./NY
(Rochester Regional Health Obligated Group)
Series 2017
5.00%, 12/01/2034 | | | 1,150 | | | | 1,166,700 | |
Series 2020
4.00%, 12/01/2038 | | | 1,200 | | | | 1,127,226 | |
4.00%, 12/01/2039 | | | 1,000 | | | | 932,991 | |
Monroe County Industrial Development Corp./NY
(St. Ann’s of Greater Rochester Obligated Group) Series 2019
5.00%, 01/01/2040 | | | 2,150 | | | | 1,848,242 | |
Nassau County Industrial Development Agency
(Amsterdam House Continuing Care Retirement Community, Inc.)
Series 2021
5.00%, 01/01/2058(c)(d) | | | 1,447 | | | | 433,276 | |
9.00%, 01/01/2041(c)(d)(e) | | | 720 | | | | 720,000 | |
Nassau County Local Economic Assistance Corp.
(Roosevelt Children’s Academy Charter School)
Series 2023
5.00%, 07/01/2043 | | | 1,195 | | | | 1,211,417 | |
5.00%, 07/01/2055 | | | 3,250 | | | | 3,164,555 | |
New York City Municipal Water Finance Authority
Series 2015-G
5.00%, 06/15/2039 | | | 1,445 | | | | 1,460,559 | |
Series 2022-A
5.25%, 06/15/2052 | | | 10,000 | | | | 10,801,518 | |
Series 2023
5.25%, 06/15/2053 | | | 4,500 | | | | 4,888,582 | |
Series 2024-C
4.25%, 06/15/2054 | | | 3,000 | | | | 2,934,865 | |
New York City Transitional Finance Authority
(New York City Transitional Finance Authority Future Tax Secured Revenue)
Series 2023
5.50%, 05/01/2042 | | | 7,000 | | | | 7,965,823 | |
| | |
| |
156 | AB MUNICIPAL INCOME FUND | | abfunds.com |
PORTFOLIO OF INVESTMENTS (continued)
AB NEW YORK PORTFOLIO
| | | | | | | | |
| | | Principal
Amount
(000) | | | U.S. $ Value | |
| |
New York City Transitional Finance Authority Building Aid Revenue
(New York City Transitional Finance Authority Building Aid Revenue State Lease)
Series 2015-S
5.00%, 07/15/2035 | | $ | 5,160 | | | $ | 5,217,652 | |
Series 2016-S
5.00%, 07/15/2034 | | | 1,000 | | | | 1,017,628 | |
New York City Transitional Finance Authority Future Tax Secured Revenue
Series 2014-A
5.00%, 08/01/2034 | | | 2,000 | | | | 2,003,171 | |
Series 2016-F
5.00%, 02/01/2032 | | | 10,000 | | | | 10,206,371 | |
Series 2020
5.00%, 11/01/2024 | | | 6,925 | | | | 6,964,229 | |
New York Convention Center Development Corp.
(New York City Hotel Unit Fee Revenue Hotel Occupancy Tax)
Series 2015
5.00%, 11/15/2034 | | | 9,220 | | | | 9,358,894 | |
5.00%, 11/15/2035 | | | 6,000 | | | | 6,089,691 | |
New York Liberty Development Corp.
(3 World Trade Center LLC)
Series 2014
5.00%, 11/15/2044(a) | | | 2,200 | | | | 2,203,823 | |
5.375%, 11/15/2040(a) | | | 700 | | | | 702,679 | |
7.25%, 11/15/2044(a) | | | 1,280 | | | | 1,288,904 | |
New York Liberty Development Corp.
(One Bryant Park LLC)
Series 2019
2.625%, 09/15/2069 | | | 7,780 | | | | 7,017,467 | |
2.80%, 09/15/2069 | | | 5,780 | | | | 5,137,824 | |
New York Liberty Development Corp.
(Port Authority of New York & New Jersey)
Series 2021-1
3.00%, 02/15/2042 | | | 3,000 | | | | 2,430,428 | |
New York Power Authority
(New York Power Authority SFP Transmission Project)
AGM Series 2023
5.00%, 11/15/2053 | | | 3,000 | | | | 3,223,082 | |
New York State Dormitory Authority
(Catholic Health System Obligated Group)
Series 2019
5.00%, 07/01/2035 | | | 1,310 | | | | 1,163,110 | |
| | |
| |
| abfunds.com | | AB MUNICIPAL INCOME FUND | 157 |
PORTFOLIO OF INVESTMENTS (continued)
AB NEW YORK PORTFOLIO
| | | | | | | | |
| | | Principal
Amount
(000) | | | U.S. $ Value | |
| |
New York State Dormitory Authority
(Cornell University)
Series 2024-A
5.50%, 07/01/2054 | | $ | 5,000 | | | $ | 5,612,185 | |
New York State Dormitory Authority
(Garnet Health Medical Center Obligated Group)
Series 2017
5.00%, 12/01/2032(a) | | | 1,000 | | | | 929,000 | |
5.00%, 12/01/2033(a) | | | 1,000 | | | | 919,249 | |
New York State Dormitory Authority
(Icahn School of Medicine at Mount Sinai)
Series 2015-A
5.00%, 07/01/2031 | | | 3,000 | | | | 3,012,241 | |
5.00%, 07/01/2033 | | | 3,000 | | | | 3,008,747 | |
New York State Dormitory Authority
(Iona College)
Series 2021-A
5.00%, 07/01/2046 | | | 375 | | | | 371,268 | |
5.00%, 07/01/2051 | | | 1,200 | | | | 1,162,267 | |
Series 2022-2
5.00%, 07/01/2037 | | | 200 | | | | 205,619 | |
5.00%, 07/01/2042 | | | 275 | | | | 276,517 | |
New York State Dormitory Authority
(Montefiore Obligated Group)
Series 2018
5.00%, 08/01/2032 | | | 1,950 | | | | 1,975,933 | |
5.00%, 08/01/2033 | | | 2,000 | | | | 2,026,459 | |
5.00%, 08/01/2035 | | | 1,515 | | | | 1,533,291 | |
Series 2020
4.00%, 09/01/2037 | | | 800 | | | | 751,229 | |
4.00%, 09/01/2039 | | | 1,345 | | | | 1,236,389 | |
AGM Series 2020
3.00%, 09/01/2050 | | | 3,000 | | | | 2,093,045 | |
New York State Dormitory Authority
(New School (The))
Series 2016-A
5.00%, 07/01/2035 | | | 2,815 | | | | 2,880,199 | |
5.00%, 07/01/2036 | | | 3,000 | | | | 3,065,708 | |
New York State Dormitory Authority
(Northwell Health Obligated Group)
Series 2015-A
5.00%, 05/01/2033 | | | 5,000 | | | | 5,032,811 | |
New York State Dormitory Authority
(NYU Langone Hospitals)
Series 2014
5.00%, 07/01/2031 | | | 1,000 | | | | 1,002,565 | |
| | |
| |
158 | AB MUNICIPAL INCOME FUND | | abfunds.com |
PORTFOLIO OF INVESTMENTS (continued)
AB NEW YORK PORTFOLIO
| | | | | | | | |
| | | Principal
Amount
(000) | | | U.S. $ Value | |
| |
New York State Dormitory Authority
(Pratt Institute)
Series 2016
5.00%, 07/01/2030 | | $ | 1,000 | | | $ | 1,022,937 | |
New York State Dormitory Authority
(Rochester Institute of Technology)
Series 2020-A
5.00%, 07/01/2036 | | | 1,115 | | | | 1,188,416 | |
New York State Dormitory Authority
(St. John’s University/NY)
Series 2015-A
5.00%, 07/01/2033 | | | 1,000 | | | | 1,012,042 | |
5.00%, 07/01/2034 | | | 1,000 | | | | 1,011,591 | |
New York State Dormitory Authority
(State of New York Pers Income Tax)
Series 2017-B
5.00%, 02/15/2033 | | | 12,095 | | | | 12,551,083 | |
Series 2024-B | | | | | | | | |
5.113%, 03/15/2025 | | | 1,000 | | | | 997,793 | |
New York State Dormitory Authority
(Wagner College)
Series 2022
5.00%, 07/01/2047 | | | 5,625 | | | | 5,441,389 | |
New York State Environmental Facilities Corp.
(Casella Waste Systems, Inc.)
Series 2019
2.875%, 12/01/2044(a) | | | 3,125 | | | | 2,852,308 | |
New York State Thruway Authority
(New York State Thruway Authority Gen Toll Road)
Series 2014-K
5.00%, 01/01/2031 | | | 7,500 | | | | 7,542,771 | |
5.00%, 01/01/2032 | | | 5,000 | | | | 5,028,514 | |
Series 2016-A
5.25%, 01/01/2056 | | | 2,940 | | | | 2,973,722 | |
Series 2024-P
5.00%, 01/01/2025 | | | 1,500 | | | | 1,511,736 | |
New York Transportation Development Corp.
(Delta Air Lines, Inc.)
Series 2018
5.00%, 01/01/2030 | | | 2,395 | | | | 2,471,782 | |
5.00%, 01/01/2036 | | | 13,850 | | | | 14,239,948 | |
New York Transportation Development Corp.
(Empire State Thruway Partners LLC)
Series 2021
4.00%, 10/31/2046 | | | 11,000 | | | | 9,206,615 | |
| | |
| |
| abfunds.com | | AB MUNICIPAL INCOME FUND | 159 |
PORTFOLIO OF INVESTMENTS (continued)
AB NEW YORK PORTFOLIO
| | | | | | | | |
| | | Principal
Amount
(000) | | | U.S. $ Value | |
| |
New York Transportation Development Corp.
(JFK International Air Terminal LLC)
Series 2020
4.00%, 12/01/2038 | | $ | 1,050 | | | $ | 1,013,534 | |
4.00%, 12/01/2042 | | | 1,940 | | | | 1,810,359 | |
5.00%, 12/01/2031 | | | 1,150 | | | | 1,211,269 | |
Series 2022
4.00%, 12/01/2042 | | | 2,000 | | | | 1,861,601 | |
New York Transportation Development Corp.
(JFK NTO LLC)
AGM Series 2023
5.00%, 06/30/2049 | | | 1,000 | | | | 1,026,510 | |
5.125%, 06/30/2060 | | | 5,000 | | | | 5,156,257 | |
New York Transportation Development Corp.
(Laguardia Gateway Partners LLC)
Series 2016-A
4.00%, 07/01/2032 | | | 2,000 | | | | 1,943,428 | |
4.00%, 07/01/2033 | | | 2,250 | | | | 2,179,674 | |
5.00%, 07/01/2034 | | | 2,490 | | | | 2,489,848 | |
5.00%, 07/01/2046 | | | 2,000 | | | | 1,987,662 | |
5.25%, 01/01/2050 | | | 3,030 | | | | 3,012,464 | |
Niagara Area Development Corp.
(Reworld Holding Corp.)
Series 2018-A
4.75%, 11/01/2042(a) | | | 5,000 | | | | 4,555,838 | |
Oneida County Local Development Corp.
(Hamilton College)
Series 2021
5.00%, 07/01/2051 | | | 2,405 | | | | 2,580,617 | |
Onondaga Civic Development Corp.
(Le Moyne College)
Series 2021
5.00%, 07/01/2051 | | | 1,400 | | | | 1,330,688 | |
Series 2022
4.00%, 07/01/2042 | | | 525 | | | | 450,848 | |
Port Authority of New York & New Jersey
Series 2014
5.00%, 09/01/2031 | | | 5,000 | | | | 5,007,606 | |
Series 2020-2
4.00%, 07/15/2045 | | | 5,000 | | | | 4,672,857 | |
Schenectady County Capital Resource Corp.
(Trustees of Union College)
Series 2017
5.00%, 01/01/2040 | | | 2,600 | | | | 2,664,548 | |
| | |
| |
160 | AB MUNICIPAL INCOME FUND | | abfunds.com |
PORTFOLIO OF INVESTMENTS (continued)
AB NEW YORK PORTFOLIO
| | | | | | | | |
| | | Principal
Amount
(000) | | | U.S. $ Value | |
| |
Suffolk County Economic Development Corp.
(Catholic Health Services of Long Island Obligated Group)
Series 2014-C
5.00%, 07/01/2031 | | $ | 2,500 | | | $ | 2,501,224 | |
Suffolk County Economic Development Corp.
(Peconic Landing at Southold, Inc.)
Series 2020
5.00%, 12/01/2040 | | | 1,500 | | | | 1,495,008 | |
Suffolk Regional Off-Track Betting Co.
Series 2024
5.75%, 12/01/2044 | | | 1,600 | | | | 1,652,324 | |
Suffolk Tobacco Asset Securitization Corp.
Series 2021
4.00%, 06/01/2050 | | | 4,855 | | | | 4,335,701 | |
Triborough Bridge & Tunnel Authority
Series 2017-B
5.00%, 11/15/2036 | | | 3,000 | | | | 3,106,001 | |
Series 2020-A
5.00%, 11/15/2049 | | | 3,000 | | | | 3,141,967 | |
Triborough Bridge & Tunnel Authority
(Metropolitan Transportation Authority Payroll Mobility Tax Revenue)
Series 2021-A
2.511%, 05/15/2035 | | | 3,500 | | | | 2,763,453 | |
Series 2021-C
5.00%, 05/15/2051 | | | 10,000 | | | | 10,547,959 | |
Series 2022
4.614% (SOFR + 1.05%), 04/01/2026(b) | | | 2,500 | | | | 2,505,051 | |
Trust for Cultural Resources of The City of New York (The)
(Lincoln Center for the Performing Arts, Inc.)
Series 2020
4.00%, 12/01/2033 | | | 1,000 | | | | 1,024,906 | |
TSASC, Inc./NY
Series 2016
5.00%, 06/01/2045 | | | 3,350 | | | | 2,878,023 | |
Series 2017-A
5.00%, 06/01/2041 | | | 10,850 | | | | 11,000,371 | |
Ulster County Capital Resource Corp.
(Woodland Pond at New Paltz)
Series 2017
5.00%, 09/15/2037 | | | 1,515 | | | | 1,247,524 | |
5.25%, 09/15/2042 | | | 135 | | | | 107,293 | |
5.25%, 09/15/2047 | | | 235 | | | | 177,377 | |
5.25%, 09/15/2053 | | | 505 | | | | 366,364 | |
| | |
| |
| abfunds.com | | AB MUNICIPAL INCOME FUND | 161 |
PORTFOLIO OF INVESTMENTS (continued)
AB NEW YORK PORTFOLIO
| | | | | | | | |
| | | Principal
Amount
(000) | | | U.S. $ Value | |
| |
Westchester County Healthcare Corp./NY
(Westchester County Health Care Corp. Obligated Group)
Series 2010-B
6.00%, 11/01/2030 | | $ | 115 | | | $ | 115,142 | |
Westchester County Local Development Corp.
(Kendal on Hudson Obligated Group)
Series 2022
4.25%, 01/01/2045 | | | 2,925 | | | | 2,698,027 | |
5.00%, 01/01/2051 | | | 2,505 | | | | 2,510,465 | |
Westchester County Local Development Corp.
(Purchase Housing Corp. II)
Series 2017
5.00%, 06/01/2042 | | | 1,000 | | | | 992,930 | |
5.00%, 06/01/2047 | | | 1,000 | | | | 977,436 | |
Westchester County Local Development Corp.
(Westchester County Health Care Corp. Obligated Group)
Series 2016
5.00%, 11/01/2046 | | | 2,000 | | | | 1,882,294 | |
Westchester Tobacco Asset Securitization Corp.
Series 2016-B
5.00%, 06/01/2041 | | | 1,830 | | | | 1,858,794 | |
| | | | | | | | |
| | | | | | | 446,924,219 | |
| | | | | | | | |
American Samoa – 0.3% | |
American Samoa Economic Development Authority
(Territory of American Samoa)
Series 2015-A
6.625%, 09/01/2035 | | | 280 | | | | 286,849 | |
Series 2018
7.125%, 09/01/2038(a) | | | 935 | | | | 1,003,241 | |
| | | | | | | | |
| | | | | | | 1,290,090 | |
| | | | | | | | |
Florida – 0.1% | | | | | | | | |
Marshall Creek Community Development District
Series 2016
6.32%, 05/01/2045 | | | 45 | | | | 45,081 | |
Marshall Creek Community Development District
(Marshall Creek Community Development District 2002A)
Series 2017
5.00%, 05/01/2032 | | | 440 | | | | 440,100 | |
| | | | | | | | |
| | | | | | | 485,181 | |
| | | | | | | | |
| | |
| |
162 | AB MUNICIPAL INCOME FUND | | abfunds.com |
PORTFOLIO OF INVESTMENTS (continued)
AB NEW YORK PORTFOLIO
| | | | | | | | |
| | | Principal
Amount
(000) | | | U.S. $ Value | |
| |
Georgia – 0.0% | |
Municipal Electric Authority of Georgia
Series 2019
5.00%, 01/01/2037 | | $ | 100 | | | $ | 102,854 | |
5.00%, 01/01/2039 | | | 100 | | | | 102,169 | |
| | | | | | | | |
| | | | | | | 205,023 | |
| | | | | | | | |
Guam – 2.1% | |
Antonio B Won Pat International Airport Authority
Series 2021-A
3.839%, 10/01/2036 | | | 500 | | | | 416,836 | |
Series 2023
5.25%, 10/01/2031 | | | 175 | | | | 174,745 | |
5.25%, 10/01/2036 | | | 585 | | | | 578,006 | |
Guam Power Authority
Series 2017-A
5.00%, 10/01/2036 | | | 1,000 | | | | 1,023,203 | |
5.00%, 10/01/2037 | | | 1,500 | | | | 1,531,178 | |
5.00%, 10/01/2038 | | | 1,930 | | | | 1,964,784 | |
Series 2022-A
5.00%, 10/01/2044 | | | 1,100 | | | | 1,117,765 | |
Territory of Guam
Series 2019
5.00%, 11/15/2031 | | | 95 | | | | 95,480 | |
Territory of Guam
(Territory of Guam Business Privilege Tax)
Series 2021-F
4.00%, 01/01/2042 | | | 3,760 | | | | 3,487,441 | |
| | | | | | | | |
| | | | | | | 10,389,438 | |
| | | | | | | | |
Illinois – 0.4% | |
Chicago Board of Education
Series 2018-A
5.00%, 12/01/2031 | | | 1,710 | | | | 1,767,267 | |
Illinois Finance Authority
(Illinois Institute of Technology)
Series 2019
4.00%, 09/01/2037 | | | 100 | | | | 84,184 | |
4.00%, 09/01/2041 | | | 115 | | | | 90,959 | |
5.00%, 09/01/2036 | | | 115 | | | | 109,928 | |
5.00%, 09/01/2038 | | | 100 | | | | 93,335 | |
| | | | | | | | |
| | | | | | | 2,145,673 | |
| | | | | | | | |
Indiana – 0.1% | |
Indiana Finance Authority
(Brightmark Plastics Renewal Indiana LLC)
Series 2019
7.00%, 03/01/2039(e) | | | 745 | | | | 516,292 | |
| | | | | | | | |
| | |
| |
| abfunds.com | | AB MUNICIPAL INCOME FUND | 163 |
PORTFOLIO OF INVESTMENTS (continued)
AB NEW YORK PORTFOLIO
| | | | | | | | |
| | | Principal
Amount
(000) | | | U.S. $ Value | |
| |
Maryland – 0.1% | | | | | | | | |
City of Baltimore MD
(City of Baltimore MD Harbor Point Special Taxing District)
Series 2019
3.50%, 06/01/2039(a) | | $ | 650 | | | $ | 535,377 | |
Series 2019-B
3.70%, 06/01/2039(a) | | | 200 | | | | 165,617 | |
| | | | | | | | |
| | | | | | | 700,994 | |
| | | | | | | | |
Michigan – 0.1% | | | | | | | | |
City of Detroit MI
Series 2018
5.00%, 04/01/2036 | | | 245 | | | | 249,488 | |
| | | | | | | | |
| | |
North Dakota – 0.0% | | | | | | | | |
County of Grand Forks ND
(Red River Biorefinery LLC)
Series 2021
6.625%, 12/15/2031(c)(d)(e)(f)(g) | | | 105 | | | | 1,365 | |
7.00%, 12/15/2043(c)(d)(e)(f)(g) | | | 115 | | | | 1,495 | |
| | | | | | | | |
| | | | | | | 2,860 | |
| | | | | | | | |
Puerto Rico – 2.1% | | | | | | | | |
Commonwealth of Puerto Rico
Series 2021-A
Zero Coupon, 07/01/2024 | | | 101 | | | | 101,090 | |
Zero Coupon, 07/01/2033 | | | 908 | | | | 601,574 | |
4.00%, 07/01/2046 | | | 211 | | | | 189,812 | |
5.625%, 07/01/2027 | | | 1,046 | | | | 1,092,758 | |
Series 2022-C
Zero Coupon, 11/01/2043 | | | 61 | | | | 37,719 | |
Puerto Rico Commonwealth Aqueduct & Sewer Authority
Series 2020-A
5.00%, 07/01/2030(a) | | | 1,290 | | | | 1,353,982 | |
5.00%, 07/01/2035(a) | | | 1,295 | | | | 1,348,611 | |
Puerto Rico Electric Power Authority
AGM Series 2007-V
5.25%, 07/01/2031 | | | 710 | | | | 706,655 | |
NATL Series 2007-V
5.25%, 07/01/2034 | | | 1,000 | | | | 985,362 | |
Puerto Rico Industrial Tourist Educational Medical & Environmental Control Facilities Financing Auth
Series 2023-A
6.625%, 01/01/2027 | | | 140 | | | | 137,726 | |
6.625%, 01/01/2028 | | | 1,068 | | | | 1,047,988 | |
| | |
| |
164 | AB MUNICIPAL INCOME FUND | | abfunds.com |
PORTFOLIO OF INVESTMENTS (continued)
AB NEW YORK PORTFOLIO
| | | | | | | | |
| | | Principal
Amount
(000) | | | U.S. $ Value | |
| |
Puerto Rico Industrial Tourist Educational Medical & Environmental Control Facilities Financing Auth
(AES Puerto Rico LP)
12.50%, 12/15/2025(f)(g) | | $ | 248 | | | $ | 240,638 | |
Puerto Rico Sales Tax Financing Corp. Sales Tax Revenue
Series 2018-A
Zero Coupon, 07/01/2029 | | | 654 | | | | 539,943 | |
Series 2019-A
4.329%, 07/01/2040 | | | 675 | | | | 670,573 | |
4.55%, 07/01/2040 | | | 73 | | | | 73,440 | |
5.00%, 07/01/2058 | | | 1,160 | | | | 1,156,184 | |
| | | | | | | | |
| | | | | | | 10,284,055 | |
| | | | | | | | |
Tennessee – 0.2% | |
Bristol Industrial Development Board
(Bristol Industrial Development Board Sales Tax)
Series 2016-A
5.00%, 12/01/2035(a) | | | 820 | | | | 751,324 | |
Chattanooga Health Educational & Housing Facility Board
(CommonSpirit Health)
Series 2019-A
4.00%, 08/01/2037 | | | 65 | | | | 62,745 | |
4.00%, 08/01/2038 | | | 130 | | | | 123,649 | |
| | | | | | | | |
| | | | | | | 937,718 | |
| | | | | | | | |
Texas – 0.4% | |
Mission Economic Development Corp.
(Natgasoline LLC)
Series 2018
4.625%, 10/01/2031(a) | | | 1,455 | | | | 1,444,800 | |
New Hope Cultural Education Facilities Finance Corp.
(Morningside Ministries Obligated Group)
Series 2020
5.00%, 01/01/2055 | | | 100 | | | | 76,225 | |
Tarrant County Cultural Education Facilities Finance Corp.
(Stayton at Museum Way)
Series 2020-A
5.75%, 12/01/2054(c)(d)(h) | | | 1,000 | | | | 630,000 | |
| | | | | | | | |
| | | | | | | 2,151,025 | |
| | | | | | | | |
| | |
| |
| abfunds.com | | AB MUNICIPAL INCOME FUND | 165 |
PORTFOLIO OF INVESTMENTS (continued)
AB NEW YORK PORTFOLIO
| | | | | | | | |
| | | Principal
Amount
(000) | | | U.S. $ Value | |
| |
Washington – 0.1% | |
Washington State Housing Finance Commission
(Presbyterian Retirement Communities Northwest Obligated Group)
Series 2019-A
5.00%, 01/01/2044(a) | | $ | 100 | | | $ | 82,551 | |
5.00%, 01/01/2049(a) | | | 105 | | | | 82,573 | |
5.00%, 01/01/2055(a) | | | 305 | | | | 231,239 | |
| | | | | | | | |
| | | | | | | 396,363 | |
| | | | | | | | |
Wisconsin – 0.5% | |
Wisconsin Health & Educational Facilities Authority
(St. Camillus Health System Obligated Group)
Series 2019
5.00%, 11/01/2054 | | | 100 | | | | 80,105 | |
Wisconsin Public Finance Authority
(Catholic Bishop of Chicago (The))
Series 2021
5.75%, 07/25/2041(e) | | | 1,250 | | | | 1,107,419 | |
Wisconsin Public Finance Authority
(UMA Education, Inc.)
Series 2019
5.00%, 10/01/2025(a) | | | 365 | | | | 366,222 | |
5.00%, 10/01/2026(a) | | | 390 | | | | 393,543 | |
5.00%, 10/01/2028(a) | | | 225 | | | | 230,338 | |
5.00%, 10/01/2029(a) | | | 100 | | | | 102,959 | |
| | | | | | | | |
| | | | | | | 2,280,586 | |
| | | | | | | | |
Total Municipal Obligations
(cost $499,001,781) | | | | | | | 478,959,005 | |
| | | | | |
| | | | | | | | |
ASSET-BACKED SECURITIES – 0.3% | | | | | | | | |
Other ABS - Fixed Rate – 0.3% | | | | | | | | |
HTA HRRB Custodial Trust
Series 2007-CC
5.25%, 07/01/2036 | | | 19 | | | | 19,403 | |
HTA TRRB Custodial Trust
Series 2022
5.25%, 07/01/2034 | | | 653 | | | | 636,122 | |
5.25%, 07/01/2036 | | | 563 | | | | 565,026 | |
5.25%, 07/01/2041 | | | 234 | | | | 227,931 | |
| | | | | | | | |
| | |
Total Asset-Backed Securities
(cost $1,463,272) | | | | | | | 1,448,482 | |
| | | | | | | | |
| | |
| |
166 | AB MUNICIPAL INCOME FUND | | abfunds.com |
PORTFOLIO OF INVESTMENTS (continued)
AB NEW YORK PORTFOLIO
| | | | | | | | |
| | | Shares | | | U.S. $ Value | |
| |
PREFERRED STOCKS – 0.0% | | | | | | | | |
Utility – 0.0% | | | | | | | | |
Electric – 0.0% | | | | | | | | |
AES Puerto Rico LP
0.00%(d)(f)(g)
(cost $421,410) | | | 23,486 | | | $ | 68,344 | |
| | | | | | | | |
| | |
| | | Principal
Amount
(000) | | | | |
CORPORATES - NON-INVESTMENT GRADE – 0.0% | | | | | | | | |
Industrial – 0.0% | | | | | | | | |
Energy – 0.0% | | | | | | | | |
Red River Biorefinery LLC
Series 2024
15.00%, 07/31/2024(e)(f)(g) | | $ | 5 | | | | 1,500 | |
Series 23A
15.00%, 07/31/2024(e)(f)(g) | | | 20 | | | | 6,000 | |
| | | | | | | | |
| | |
Total Corporates - Non-Investment Grade
(cost $25,000) | | | | | | | 7,500 | |
| | | | | | | | |
| | | | | | | | |
COMMERCIAL MORTGAGE-BACKED SECURITIES – 0.0% | | | | | | | | |
Non-Agency Fixed Rate CMBS – 0.0% | | | | | | | | |
City of Fort Wayne IN
10.75%, 12/01/2029(c)(d) | | | 26 | | | | 3 | |
Jefferson County Industrial Development Agency
Series 2019
5.25%, 01/01/2024(d)(e)(f)(g)(i) | | | 670 | | | | 145 | |
| | | | | | | | |
| | |
Total Commercial Mortgage-Backed Securities
(cost $695,929) | | | | | | | 148 | |
| | | | | | | | |
| | |
| | | Shares | | | | |
SHORT-TERM INVESTMENTS – 0.5% | | | | | | | | |
Investment Companies – 0.5% | |
AB Fixed Income Shares, Inc. – Government Money Market Portfolio – Class AB, 5.22%(j)(k)(l)
(cost $2,546,435) | | | 2,546,435 | | | | 2,546,435 | |
| | | | | | | | |
| | |
Total Investments – 98.3%
(cost $504,153,827) | | | | | | | 483,029,914 | |
Other assets less liabilities – 1.7% | | | | | | | 8,298,433 | |
| | | | | | | | |
| | |
Net Assets – 100.0% | | | | | | $ | 491,328,347 | |
| | | | | | | | |
| | |
| |
| abfunds.com | | AB MUNICIPAL INCOME FUND | 167 |
PORTFOLIO OF INVESTMENTS (continued)
AB NEW YORK PORTFOLIO
CENTRALLY CLEARED CREDIT DEFAULT SWAPS (see Note D)
| | | | | | | | | | | | | | | | | | | | | | | | | | |
| Description | | Fixed
Rate
(Pay)
Receive | | Payment
Frequency | | | Implied
Credit
Spread at
May 31,
2024 | | | Notional
Amount
(000) | | | Market
Value | | | Upfront
Premiums
Paid
(Received) | | | Unrealized
Appreciation
(Depreciation) | |
Buy Contracts | | | | | | | | | | | | | | | | | | | | | | | | |
CDX-NAHY Series 42, 5 Year Index, 06/20/2029* | | (5.00)% | | | Quarterly | | | | 3.34% | | | | USD 5,000 | | | | $ (389,257) | | | | $ (311,285) | | | | $ (77,972) | |
CENTRALLY CLEARED INTEREST RATE SWAPS (see Note D)
| | | | | | | | | | | | | | | | | | | | | | | | | | | | | | |
| | | | | | | | | Rate Type | | | | | | | | | | | | |
Notional
Amount
(000) | | | Termination
Date | | | Payments
made
by the
Fund | | | Payments
received
by the
Fund | | | Payment
Frequency
Paid/
Received | | Market
Value | | | Upfront
Premiums
Paid
(Received) | | | Unrealized
Appreciation
(Depreciation) | |
| USD | | | 27,500 | | | | 01/15/2027 | | | | 1 Day SOFR | | | | 2.583% | | | Annual | | $ | (1,654,329 | ) | | $ | – 0 | – | | $ | (1,654,329 | ) |
| USD | | | 5,200 | | | | 01/15/2027 | | | | 1 Day SOFR | | | | 2.540% | | | Annual | | | (319,118 | ) | | | – 0 | – | | | (319,118 | ) |
| USD | | | 2,700 | | | | 01/15/2029 | | | | 1 Day SOFR | | | | 3.315% | | | Annual | | | (133,018 | ) | | | – 0 | – | | | (133,018 | ) |
| USD | | | 9,600 | | | | 07/31/2029 | | | | 1 Day SOFR | | | | 4.461% | | | Annual | | | 76,365 | | | | – 0 | – | | | 76,365 | |
| USD | | | 5,200 | | | | 07/31/2029 | | | | 1 Day SOFR | | | | 4.042% | | | Annual | | | (72,789 | ) | | | – 0 | – | | | (72,789 | ) |
| USD | | | 11,100 | | | | 11/01/2030 | | | | 1 Day SOFR | | | | 4.190% | | | Annual | | | (88,882 | ) | | | – 0 | – | | | (88,882 | ) |
| USD | | | 17,800 | | | | 07/31/2031 | | | | 1 Day SOFR | | | | 4.059% | | | Annual | | | (145,109 | ) | | | 2,017 | | | | (147,126 | ) |
| | | | | | | | | | | | | | | | | | | | | | | | | | | | | | |
| | | | | | | | | | | | | | | | | | | | $ | (2,336,880 | ) | | $ | 2,017 | | | $ | (2,338,897 | ) |
| | | | | | | | | | | | | | | | | | | | | | | | | | | | | | |
INTEREST RATE SWAPS
| | | | | | | | | | | | | | | | | | | | | | | | | | | | | | |
| | | | | | | | | Rate Type | | | | | | | | | | | |
Swap Counterparty | | Notional
Amount
(000) | | | Termination
Date | | | Payments
made
by the
Fund | | Payments
received
by the
Fund | | Payment
Frequency
Paid/
Received | | Market
Value | | | Upfront
Premiums
Paid
(Received) | | | Unrealized
Appreciation
(Depreciation) | |
Citibank, NA | | | USD | | | | 9,395 | | | | 10/09/2029 | | | 1.125% | | SIFMA* | | Quarterly | | $ | 970,799 | | | $ | – 0 | – | | $ | 970,799 | |
| * | Variable interest rate based on the Securities Industry & Financial Markets Association (SIFMA) Municipal Swap Index. |
| (a) | Security is exempt from registration under Rule 144A or Regulation S of the Securities Act of 1933. These securities are considered restricted, but liquid and may be resold in transactions exempt from registration. At May 31, 2024, the aggregate market value of these securities amounted to $32,208,701 or 6.6% of net assets. |
| (b) | Floating Rate Security. Stated interest/floor/ceiling rate was in effect at May 31, 2024. |
| (d) | Non-income producing security. |
| | |
| |
168 | AB MUNICIPAL INCOME FUND | | abfunds.com |
PORTFOLIO OF INVESTMENTS (continued)
AB NEW YORK PORTFOLIO
| (e) | Security is exempt from registration under Rule 144A or Regulation S of the Securities Act of 1933. These securities, which represent 0.49% of net assets as of May 31, 2024, are considered illiquid and restricted. Additional information regarding such securities follows: |
| | | | | | | | | | | | | | |
144A/Restricted & Illiquid
Securities | | Acquisition
Date | | Cost | | | Market
Value | | | Percentage of
Net Assets | |
County of Grand Forks ND
(Red River Biorefinery LLC)
Series 2021
6.625%, 12/15/2031 | | 05/21/2021 | | $ | 105,000 | | | $ | 1,365 | | | | 0.00 | % |
County of Grand Forks ND
(Red River Biorefinery LLC)
Series 2021
7.00%, 12/15/2043 | | 05/21/2021 | | | 115,000 | | | | 1,495 | | | | 0.00 | % |
Indiana Finance Authority
(Brightmark Plastics Renewal Indiana LLC)
Series 2019
7.00%, 03/01/2039 | | 03/29/2019 – 07/23/2019 | | | 768,625 | | | | 516,292 | | | | 0.11 | % |
Jefferson County Industrial Development Agency
Series 2019
5.25%, 01/01/2024 | | 12/09/2019 | | | 670,153 | | | | 145 | | | | 0.00 | % |
Nassau County Industrial Development Agency
(Amsterdam House Continuing Care Retirement Community, Inc.)
Series 2021
9.00%, 01/01/2041 | | 09/03/2021 | | | 720,000 | | | | 720,000 | | | | 0.15 | % |
Red River Biorefinery LLC
Series 2024
15.00%, 07/31/2024 | | 01/25/2024 | | | 5,000 | | | | 1,500 | | | | 0.00 | % |
Red River Biorefinery LLC
Series 23A
15.00%, 07/31/2024 | | 05/31/2023 | | | 20,000 | | | | 6,000 | | | | 0.00 | % |
Wisconsin Public Finance Authority
(Catholic Bishop of Chicago (The))
Series 2021
5.75%, 07/25/2041 | | 08/03/2021 | | | 1,250,000 | | | | 1,107,419 | | | | 0.23 | % |
| (f) | Fair valued by the Adviser. |
| (g) | Security in which significant unobservable inputs (Level 3) were used in determining fair value. |
| | |
| |
| abfunds.com | | AB MUNICIPAL INCOME FUND | 169 |
PORTFOLIO OF INVESTMENTS (continued)
AB NEW YORK PORTFOLIO
| (h) | Restricted and illiquid security. |
| | | | | | | | | | | | | | | | |
Restricted & Illiquid
Securities | | Acquisition
Date | | | Cost | | | Market
Value | | | Percentage of
Net Assets | |
Tarrant County Cultural Education Facilities Finance Corp.
(Stayton at Museum Way)
Series 2020-A
5.75%, 12/01/2054 | | | 01/07/2020 | | | $ | 1,039,070 | | | $ | 630,000 | | | | 0.13 | % |
| (i) | Defaulted matured security. |
| (j) | Affiliated investments. |
| (k) | The rate shown represents the 7-day yield as of period end. |
| (l) | To obtain a copy of the fund’s shareholder report, please go to the Securities and Exchange Commission’s website at www.sec.gov, or call AB at (800) 227-4618. |
As of May 31, 2024, the Portfolio’s percentages of investments in municipal bonds that are insured and in insured municipal bonds that have been pre-refunded or escrowed to maturity are 4.2% and 0.0%, respectively.
Glossary:
ABS – Asset-Backed Securities
AGM – Assured Guaranty Municipal
BAM – Build American Mutual
CMBS – Commercial Mortgage-Backed Securities
NATL – National Interstate Corporation
SOFR – Secured Overnight Financing Rate
See notes to financial statements.
| | |
| |
170 | AB MUNICIPAL INCOME FUND | | abfunds.com |
STATEMENT OF ASSETS & LIABILITIES
May 31, 2024
| | | | | | | | |
| | | AB California | | | AB High Income
Municipal | |
| Assets | |
Investments in securities, at value | | | | | | | | |
Unaffiliated issuers (cost $1,213,501,446 and $3,318,520,631 respectively) | | $ | 1,171,514,897 | | | $ | 2,971,668,821 | |
Affiliated issuers (cost $2,448,099 and $8,116,755, respectively) | | | 2,448,099 | | | | 8,116,755 | |
Cash | | | 9,902 | | | | – 0 | – |
Cash collateral due from broker | | | 2,864,727 | | | | 27,218,540 | |
Interest receivable | | | 16,039,050 | | | | 44,588,389 | |
Receivable for capital stock sold | | | 1,986,764 | | | | 1,987,768 | |
Unrealized appreciation on interest rate swaps | | | 1,304,043 | | | | 3,363,774 | |
Receivable for investment securities sold | | | 1,149,285 | | | | 10,294,213 | |
Receivable for variation margin on centrally cleared swaps | | | 367,872 | | | | 2,390,149 | |
Affiliated dividends receivable | | | 31,164 | | | | 56,038 | |
Receivable due from Adviser | | | 914 | | | | 61,885 | |
| | | | | | | | |
Total assets | | | 1,197,716,717 | | | | 3,069,746,332 | |
| | | | | | | | |
| Liabilities | |
Due to custodian | | | – 0 | – | | | 5,818,597 | |
Payable for investment securities purchased | | | 35,140,704 | | | | 66,856,437 | |
Payable for capital stock redeemed | | | 1,450,340 | | | | 6,735,431 | |
Cash collateral due to broker | | | 1,300,000 | | | | 2,643,000 | |
Advisory fee payable | | | 439,889 | | | | 1,181,909 | |
Dividends payable | | | 349,297 | | | | 1,388,147 | |
Distribution fee payable | | | 118,980 | | | | 160,534 | |
Administrative fee payable | | | 30,849 | | | | 41,629 | |
Directors’ fees payable | | | 9,100 | | | | 15,190 | |
Transfer Agent fee payable | | | 5,436 | | | | 17,572 | |
Unrealized depreciation on interest rate swaps | | | – 0 | – | | | 3,004,003 | |
Market value on credit default swaps (net premiums received $0 and $1,838,449, respectively) | | | – 0 | – | | | 2,284,622 | |
Payable for floating rate notes issued(a) | | | – 0 | – | | | 186,705,000 | |
Payable for terminated centrally cleared interest rate swaps | | | – 0 | – | | | 1,465,930 | |
Accrued expenses and other liabilities | | | 359,236 | | | | 1,287,861 | |
| | | | | | | | |
Total liabilities | | | 39,203,831 | | | | 279,605,862 | |
| | | | | | | | |
Net Assets | | $ | 1,158,512,886 | | | $ | 2,790,140,470 | |
| | | | | | | | |
| Composition of Net Assets | |
Capital stock, at par | | $ | 111,644 | | | $ | 276,418 | |
Additional paid-in capital | | | 1,206,416,303 | | | | 3,209,261,739 | |
Accumulated loss | | | (48,015,061 | ) | | | (419,397,687 | ) |
| | | | | | | | |
| | $ | 1,158,512,886 | | | $ | 2,790,140,470 | |
| | | | | | | | |
| (a) | Represents short-term floating rate certificates issued by tender option bond trusts (see Note I). |
See notes to financial statements.
| | |
| |
| abfunds.com | | AB MUNICIPAL INCOME FUND | 171 |
STATEMENT OF ASSETS & LIABILITIES (continued)
Net Asset Value Per Share—81,200,000,000 shares of capital stock authorized, $.001 par value (see Note E)
| | | | | | | | | | | | |
| AB California Portfolio | | Net Assets | | | Shares
Outstanding | | | Net Asset
Value | |
| |
| Class A | | $ | 482,717,237 | | | | 46,519,678 | | | $ | 10.38 | * |
| |
| Class C | | $ | 20,782,146 | | | | 2,003,378 | | | $ | 10.37 | |
| |
| Advisor Class | | $ | 655,013,503 | | | | 63,121,092 | | | $ | 10.38 | |
| |
|
| AB High Income Municipal Portfolio | |
| |
| Class A | | $ | 559,773,322 | | | | 55,433,098 | | | $ | 10.10 | * |
| |
| Class C | | $ | 48,159,440 | | | | 4,771,883 | | | $ | 10.09 | |
| |
| Advisor Class | | $ | 1,903,554,868 | | | | 188,608,966 | | | $ | 10.09 | |
| |
| Class Z | | $ | 278,652,840 | | | | 27,604,493 | | | $ | 10.09 | |
| |
| * | The maximum offering price per share for Class A of AB California Portfolio and AB High Income Municipal Portfolio were $10.70 and $10.41, respectively, which reflects a sales charge of 3.00%. |
See notes to financial statements.
| | |
| |
172 | AB MUNICIPAL INCOME FUND | | abfunds.com |
STATEMENT OF ASSETS & LIABILITIES (continued)
| | | | | | | | |
| | | AB National | | | AB New York | |
| Assets | |
Investments in securities, at value | |
Unaffiliated issuers (cost $1,908,490,591 and $501,607,392, respectively) | | $ | 1,846,155,280 | | | $ | 480,483,479 | |
Affiliated issuers (cost $10,267,244 and $2,546,435, respectively) | | | 10,267,244 | | | | 2,546,435 | |
Cash | | | – 0 | – | | | 11 | |
Cash collateral due from broker | | | 7,352,902 | | | | 2,483,556 | |
Interest receivable | | | 25,655,001 | | | | 6,804,070 | |
Receivable for investment securities sold | | | 6,729,806 | | | | 80,000 | |
Unrealized appreciation on interest rate swaps | | | 2,446,194 | | | | 970,799 | |
Receivable for capital stock sold | | | 1,575,684 | | | | 46,446 | |
Receivable for variation margin on centrally cleared swaps | | | 949,855 | | | | 159,041 | |
Affiliated dividends receivable | | | 32,465 | | | | 7,630 | |
Receivable due from Adviser | | | 14,154 | | | | 28,910 | |
| | | | | | | | |
Total assets | | | 1,901,178,585 | | | | 493,610,377 | |
| | | | | | | | |
| Liabilities | |
Due to custodian | | | 1,429,021 | | | | – 0 | – |
Payable for investment securities purchased and swap transactions | | | 42,043,494 | | | | – 0 | – |
Cash collateral due to broker | | | 2,670,000 | | | | 950,000 | |
Payable for capital stock redeemed | | | 3,284,803 | | | | 685,243 | |
Unrealized depreciation on interest rate swaps | | | 796,754 | | | | – 0 | – |
Advisory fee payable | | | 710,293 | | | | 188,911 | |
Payable for terminated centrally cleared interest rate swaps | | | 556,377 | | | | – 0 | – |
Custody and accounting fees payable | | | 379,563 | | | | 207,516 | |
Dividends payable | | | 280,539 | | | | 27,248 | |
Distribution fee payable | | | 102,773 | | | | 75,373 | |
Administrative fee payable | | | 38,112 | | | | 44,068 | |
Transfer Agent fee payable | | | 15,760 | | | | 4,562 | |
Directors’ fees payable | | | 11,607 | | | | 6,871 | |
Accrued expenses | | | 152,361 | | | | 92,238 | |
| | | | | | | | |
Total liabilities | | | 52,471,457 | | | | 2,282,030 | |
| | | | | | | | |
Net Assets | | $ | 1,848,707,128 | | | $ | 491,328,347 | |
| | | | | | | | |
| Composition of Net Assets | |
Capital stock, at par | | $ | 193,737 | | | $ | 53,659 | |
Additional paid-in capital | | | 1,974,594,495 | | | | 540,061,767 | |
Accumulated loss | | | (126,081,104 | ) | | | (48,787,079 | ) |
| | | | | | | | |
| | $ | 1,848,707,128 | | | $ | 491,328,347 | |
| | | | | | | | |
See notes to financial statements.
| | |
| |
| abfunds.com | | AB MUNICIPAL INCOME FUND | 173 |
STATEMENT OF ASSETS & LIABILITIES (continued)
Net Asset Value Per Share—81,200,000,000 shares of capital stock authorized, $.001 par value (see Note E)
| | | | | | | | | | | | |
| AB National Portfolio | | Net Assets | | | Shares
Outstanding | | | Net Asset
Value | |
| |
| Class A | | $ | 406,540,091 | | | | 42,605,413 | | | $ | 9.54 | * |
| | | | | | | | | | | | |
| Class C | | $ | 17,782,065 | | | | 1,865,783 | | | $ | 9.53 | |
| | | | | | | | | | | | |
| Advisor Class | | $ | 1,424,384,972 | | | | 149,266,250 | | | $ | 9.54 | |
| | | | | | | | | | | | |
|
| AB New York Portfolio | |
| |
| Class A | | $ | 305,467,469 | | | | 33,363,478 | | | $ | 9.16 | * |
| | | | | | | | | | | | |
| Class C | | $ | 11,270,387 | | | | 1,231,463 | | | $ | 9.15 | |
| | | | | | | | | | | | |
| Advisor Class | | $ | 174,590,491 | | | | 19,063,848 | | | $ | 9.16 | |
| | | | | | | | | | | | |
| * | The maximum offering price per share for Class A of AB National Portfolio and AB New York Portfolio were $9.84 and $9.44, respectively, which reflects a sales charge of 3.00%. |
See notes to financial statements.
| | |
| |
174 | AB MUNICIPAL INCOME FUND | | abfunds.com |
STATEMENT OF OPERATIONS
Year Ended May 31, 2024
| | | | | | | | |
| | | AB California | | | AB High Income
Municipal | |
| Investment Income | | | | | | | | |
Interest | | $ | 40,500,770 | | | $ | 150,262,470 | |
Dividends – Affiliated issuers | | | 1,233,516 | | | | 1,811,096 | |
Other income | | | 17,189 | | | | 56,118 | |
| | | | | | | | |
Total income | | | 41,751,475 | | | | 152,129,684 | |
| | | | | | | | |
| Expenses | | | | | | | | |
Advisory fee (see Note B) | | | 4,835,589 | | | | 14,212,246 | |
Distribution fee – Class A | | | 1,162,205 | | | | 1,441,348 | |
Distribution fee – Class C | | | 232,630 | | | | 590,316 | |
Transfer agency – Class A | | | 117,087 | | | | 170,128 | |
Transfer agency – Class C | | | 5,983 | | | | 18,093 | |
Transfer agency – Advisor Class | | | 147,885 | | | | 585,475 | |
Transfer agency – Class Z | | | – 0 | – | | | 54,512 | |
Custody and accounting | | | 115,143 | | | | 247,720 | |
Administrative | | | 87,513 | | | | 101,713 | |
Printing | | | 54,726 | | | | 235,136 | |
Audit and tax | | | 54,272 | | | | 64,380 | |
Registration fees | | | 53,060 | | | | 178,655 | |
Legal | | | 43,875 | | | | 180,796 | |
Directors’ fees | | | 32,661 | | | | 56,000 | |
Miscellaneous | | | 40,397 | | | | 92,802 | |
| | | | | | | | |
Total expenses before interest expense | | | 6,983,026 | | | | 18,229,320 | |
Interest expense | | | 7,194 | | | | 11,451,880 | |
| | | | | | | | |
Total expenses | | | 6,990,220 | | | | 29,681,200 | |
Less: expenses waived and reimbursed by the Adviser (see Note B) | | | (247,669 | ) | | | (294,979 | ) |
| | | | | | | | |
Net expenses | | | 6,742,551 | | | | 29,386,221 | |
| | | | | | | | |
Net investment income | | | 35,008,924 | | | | 122,743,463 | |
| | | | | | | | |
| Realized and Unrealized Gain (Loss) on Investment Transactions | | | | | | | | |
Net realized gain (loss) on: | |
Investment transactions | | | (6,418,498 | ) | | | (63,739,641 | ) |
Affiliated Underlying Portfolios | | | – 0 | – | | | 77,980 | |
Swaps | | | 982,920 | | | | 54,975,678 | |
Net change in unrealized appreciation/depreciation of: | | | | | | | | |
Investments | | | 15,439,809 | | | | 60,910,284 | |
Swaps | | | (4,129,644 | ) | | | (75,371,174 | ) |
| | | | | | | | |
Net gain (loss) on investment transactions | | | 5,874,587 | | | | (23,146,873 | ) |
| | | | | | | | |
Net Increase in Net Assets from Operations | | $ | 40,883,511 | | | $ | 99,596,590 | |
| | | | | | | | |
See notes to financial statements.
| | |
| |
| abfunds.com | | AB MUNICIPAL INCOME FUND | 175 |
STATEMENT OF OPERATIONS (continued)
| | | | | | | | |
| | | AB National | | | AB New York | |
| Investment Income | | | | | | | | |
Interest | | $ | 71,166,832 | | | $ | 18,987,251 | |
Dividends – Affiliated issuers | | | 1,346,612 | | | | 283,074 | |
Other income | | | 30,840 | | | | 4,263 | |
| | | | | | | | |
Total income | | | 72,544,284 | | | | 19,274,588 | |
| | | | | | | | |
| Expenses | | | | | | | | |
Advisory fee (see Note B) | | | 8,017,019 | | | | 2,296,784 | |
Distribution fee – Class A | | | 1,039,163 | | | | 809,374 | |
Distribution fee – Class C | | | 206,744 | | | | 142,756 | |
Transfer agency – Class A | | | 181,153 | | | | 112,899 | |
Transfer agency – Class C | | | 9,673 | | | | 5,048 | |
Transfer agency – Advisor Class | | | 586,123 | | | | 59,910 | |
Custody and accounting | | | 173,160 | | | | 92,076 | |
Registration fees | | | 114,353 | | | | 49,946 | |
Administrative | | | 94,360 | | | | 102,424 | |
Printing | | | 91,696 | | | | 43,516 | |
Audit and tax | | | 55,717 | | | | 55,717 | |
Legal | | | 50,247 | | | | 39,805 | |
Directors’ fees | | | 41,786 | | | | 25,232 | |
Miscellaneous | | | 57,886 | | | | 31,393 | |
| | | | | | | | |
Total expenses before interest expense | | | 10,719,080 | | | | 3,866,880 | |
Interest expense | | | 4,781 | | | | 4,539 | |
| | | | | | | | |
Total expenses | | | 10,723,861 | | | | 3,871,419 | |
Less: expenses waived and reimbursed by the Adviser (see Note B) | | | (601,141 | ) | | | (369,792 | ) |
| | | | | | | | |
Net expenses | | | 10,122,720 | | | | 3,501,627 | |
| | | | | | | | |
Net investment income | | | 62,421,564 | | | | 15,772,961 | |
| | | | | | | | |
| Realized and Unrealized Gain (Loss) on Investment Transactions | | | | | | | | |
Net realized gain (loss) on: | |
Investment transactions | | | (21,579,506 | ) | | | (9,674,617 | ) |
Swaps | | | 7,868,891 | | | | 6,109,850 | |
Net change in unrealized appreciation/depreciation of: | | | | | | | | |
Investments | | | 31,728,439 | | | | 11,011,632 | |
Swaps | | | (20,111,167 | ) | | | (9,460,860 | ) |
| | | | | | | | |
Net loss on investment transactions | | | (2,093,343 | ) | | | (2,013,995 | ) |
| | | | | | | | |
Contributions from Affiliates (see Note B) | | | 1,750 | | | | – 0 | – |
| | | | | | | | |
Net Increase in Net Assets from Operations | | $ | 60,329,971 | | | $ | 13,758,966 | |
| | | | | | | | |
See notes to financial statements.
| | |
| |
176 | AB MUNICIPAL INCOME FUND | | abfunds.com |
STATEMENT OF CHANGES IN NET ASSETS
| | | | | | | | |
| | | AB California | |
| | | Year Ended
May 31,
2024 | | | Year Ended
May 31,
2023 | |
| Increase (Decrease) in Net Assets from Operations | | | | | | | | |
Net investment income | | $ | 35,008,924 | | | $ | 29,290,330 | |
Net realized loss on investment transactions | | | (5,435,578 | ) | | | (4,952,153 | ) |
Net change in unrealized appreciation (depreciation) of investments | | | 11,310,165 | | | | (22,946,120 | ) |
| | | | | | | | |
Net increase in net assets from operations | | | 40,883,511 | | | | 1,392,057 | |
Distributions to Shareholders | | | | | | | | |
Class A | | | (14,304,887 | ) | | | (14,157,982 | ) |
Class C | | | (541,053 | ) | | | (611,383 | ) |
Advisor Class | | | (19,522,643 | ) | | | (15,739,733 | ) |
| Capital Stock Transactions | |
Net increase | | | 158,125,513 | | | | 48,590,085 | |
| | | | | | | | |
Total increase | | | 164,640,441 | | | | 19,473,044 | |
| Net Assets | |
Beginning of period | | | 993,872,445 | | | | 974,399,401 | |
| | | | | | | | |
End of period | | $ | 1,158,512,886 | | | $ | 993,872,445 | |
| | | | | | | | |
See notes to financial statements.
| | |
| |
| abfunds.com | | AB MUNICIPAL INCOME FUND | 177 |
STATEMENT OF CHANGES IN NET ASSETS (continued)
| | | | | | | | |
| | | AB High Income Municipal | |
| | | Year Ended
May 31,
2024 | | | Year Ended
May 31,
2023 | |
| Increase (Decrease) in Net Assets from Operations | | | | | | | | |
Net investment income | | $ | 122,743,463 | | | $ | 125,194,606 | |
Net realized loss on investment transactions | | | (8,685,983 | ) | | | (32,181,715 | ) |
Net change in unrealized appreciation (depreciation) of investments | | | (14,460,890 | ) | | | (239,713,482 | ) |
Contributions from Affiliates (see Note B) | | | – 0 | – | | | 175,936 | |
| | | | | | | | |
Net increase (decrease) in net assets from operations | | | 99,596,590 | | | | (146,524,655 | ) |
Distributions to Shareholders | |
Class A | | | (22,746,310 | ) | | | (26,625,590 | ) |
Class C | | | (1,884,722 | ) | | | (2,916,733 | ) |
Advisor Class | | | (83,153,491 | ) | | | (98,881,284 | ) |
Class Z | | | (11,075,099 | ) | | | (1,543,155 | ) |
| Capital Stock Transactions | |
Net decrease | | | (203,153,853 | ) | | | (204,078,550 | ) |
| | | | | | | | |
Total decrease | | | (222,416,885 | ) | | | (480,569,967 | ) |
| Net Assets | |
Beginning of period | | | 3,012,557,355 | | | | 3,493,127,322 | |
| | | | | | | | |
End of period | | $ | 2,790,140,470 | | | $ | 3,012,557,355 | |
| | | | | | | | |
See notes to financial statements.
| | |
| |
178 | AB MUNICIPAL INCOME FUND | | abfunds.com |
STATEMENT OF CHANGES IN NET ASSETS (continued)
| | | | | | | | |
| | | AB National | |
| | | Year Ended
May 31,
2024 | | | Year Ended
May 31,
2023 | |
| Increase (Decrease) in Net Assets from Operations | | | | | | | | |
Net investment income | | $ | 62,421,564 | | | $ | 51,704,891 | |
Net realized loss on investment transactions | | | (13,710,615 | ) | | | (31,181,172 | ) |
Net change in unrealized appreciation (depreciation) of investments | | | 11,617,272 | | | | (36,340,228 | ) |
Contributions from Affiliates (see Note B) | | | 1,750 | | | | – 0 | – |
| | | | | | | | |
Net increase (decrease) in net assets from operations | | | 60,329,971 | | | | (15,816,509 | ) |
Distributions to Shareholders | |
Class A | | | (12,927,842 | ) | | | (12,935,134 | ) |
Class C | | | (485,855 | ) | | | (595,071 | ) |
Advisor Class | | | (45,283,422 | ) | | | (38,718,833 | ) |
| Capital Stock Transactions | |
Net increase (decrease) | | | 166,437,839 | | | | (63,268,055 | ) |
| | | | | | | | |
Total increase (decrease) | | | 168,070,691 | | | | (131,333,602 | ) |
| Net Assets | |
Beginning of period | | | 1,680,636,437 | | | | 1,811,970,039 | |
| | | | | | | | |
End of period | | $ | 1,848,707,128 | | | $ | 1,680,636,437 | |
| | | | | | | | |
See notes to financial statements.
| | |
| |
| abfunds.com | | AB MUNICIPAL INCOME FUND | 179 |
STATEMENT OF CHANGES IN NET ASSETS (continued)
| | | | | | | | |
| | | AB New York | |
| | | Year Ended
May 31,
2024 | | | Year Ended
May 31,
2023 | |
| Increase (Decrease) in Net Assets from Operations | | | | | | | | |
Net investment income | | $ | 15,772,961 | | | $ | 15,053,747 | |
Net realized loss on investment transactions | | | (3,564,767 | ) | | | (10,211,148 | ) |
Net change in unrealized appreciation (depreciation) of investments | | | 1,550,772 | | | | (11,206,726 | ) |
Contributions from Affiliates (see Note B) | | | – 0 | – | | | 1,866 | |
| | | | | | | | |
Net increase (decrease) in net assets from operations | | | 13,758,966 | | | | (6,362,261 | ) |
Distributions to Shareholders | |
Class A | | | (9,260,984 | ) | | | (9,592,719 | ) |
Class C | | | (299,492 | ) | | | (417,976 | ) |
Advisor Class | | | (5,359,638 | ) | | | (5,255,441 | ) |
| Capital Stock Transactions | |
Net decrease | | | (45,498,389 | ) | | | (37,823,599 | ) |
| | | | | | | | |
Total decrease | | | (46,659,537 | ) | | | (59,451,996 | ) |
| Net Assets | |
Beginning of period | | | 537,987,884 | | | | 597,439,880 | |
| | | | | | | | |
End of period | | $ | 491,328,347 | | | $ | 537,987,884 | |
| | | | | | | | |
See notes to financial statements.
| | |
| |
180 | AB MUNICIPAL INCOME FUND | | abfunds.com |
NOTES TO FINANCIAL STATEMENTS
May 31, 2024
NOTE A
Significant Accounting Policies
AB Municipal Income Fund, Inc. (the “Fund”) is registered under the Investment Company Act of 1940 (the “1940 Act”) as an open-end management investment company. The Fund, which is a Maryland corporation, operates as a series company currently comprised of the diversified AB California Portfolio, AB High Income Municipal Portfolio, AB National Portfolio and AB New York Portfolio (the “Portfolios”). Each series is considered to be a separate entity for financial reporting and tax purposes. The AB California Portfolio, AB National Portfolio and AB New York Portfolio offer Class A, Class C and Advisor Class shares. The AB High Income Municipal Portfolio offers Class A, Class C, Advisor Class and Class Z shares. Class B and Class T shares have been authorized but currently are not offered. Class Z shares have been authorized but currently are not being offered for AB California Portfolio, AB National Portfolio and AB New York Portfolio. Class A shares are sold with a front-end sales charge of up to 3% for purchases up to $500,000; purchases of $500,000 or more are not subject to a sales charge. With respect to purchases of $500,000 or more, Class A shares redeemed within one year of purchase may be subject to a contingent deferred sales charge of 1%. Class C shares are subject to a contingent deferred sales charge of 1% on redemptions made within the first year after purchase, and 0% after the first year of purchase. Class C shares automatically convert to Class A shares eight years after the end of the calendar month of purchase. Advisor Class shares are sold without any initial or contingent deferred sales charge and are not subject to ongoing distribution expenses. All six classes of shares have identical voting, dividend, liquidation and other rights, except that the classes bear different distribution and transfer agency expenses. Each class has exclusive voting rights with respect to its distribution plan. The financial statements have been prepared in conformity with U.S. generally accepted accounting principles (“U.S. GAAP”), which require management to make certain estimates and assumptions that affect the reported amounts of assets and liabilities in the financial statements and amounts of income and expenses during the reporting period. Actual results could differ from those estimates. Each Portfolio is an investment company under U.S. GAAP and follows the accounting and reporting guidance applicable to investment companies. The following is a summary of significant accounting policies followed by the Portfolios.
1. Security Valuation
Portfolio securities are valued at market value determined on the basis of market quotations or, if market quotations are not readily available or are unreliable, at “fair value” as determined in accordance with procedures approved by and under the oversight of the Fund’s Board of Directors (the
| | |
| |
| abfunds.com | | AB MUNICIPAL INCOME FUND | 181 |
NOTES TO FINANCIAL STATEMENTS (continued)
“Board”). Pursuant to these procedures, AllianceBernstein L.P. (the “Adviser”) serves as the Portfolios’ valuation designee pursuant to Rule 2a-5 of the 1940 Act. In this capacity, the Adviser is responsible, among other things, for making all fair value determinations relating to the Portfolios’ portfolio investments, subject to the Board’s oversight.
In general, the market values of securities which are readily available and deemed reliable are determined as follows: securities listed on a national securities exchange (other than securities listed on the NASDAQ Stock Market, Inc. (“NASDAQ”)) or on a foreign securities exchange are valued at the last sale price at the close of the exchange or foreign securities exchange. If there has been no sale on such day, the securities are valued at the last traded price from the previous day. Securities listed on more than one exchange are valued by reference to the principal exchange on which the securities are traded; securities listed only on NASDAQ are valued in accordance with the NASDAQ Official Closing Price; listed or over the counter (“OTC”) market put or call options are valued at the mid level between the current bid and ask prices. If either a current bid or current ask price is unavailable, the Adviser will have discretion to determine the best valuation (e.g., last trade price in the case of listed options); open futures are valued using the closing settlement price or, in the absence of such a price, the most recent quoted bid price. If there are no quotations available for the day of valuation, the last available closing settlement price is used; U.S. Government securities and any other debt instruments having 60 days or less remaining until maturity are generally valued at market by an independent pricing vendor, if a market price is available. If a market price is not available, the securities are valued at amortized cost. This methodology is commonly used for short term securities that have an original maturity of 60 days or less, as well as short term securities that had an original term to maturity that exceeded 60 days. In instances when amortized cost is utilized, the Valuation Committee (the “Committee”) must reasonably conclude that the utilization of amortized cost is approximately the same as the fair value of the security. Factors the Committee will consider include, but are not limited to, an impairment of the creditworthiness of the issuer or material changes in interest rates. Fixed-income securities, including mortgage-backed and asset-backed securities, may be valued on the basis of prices provided by a pricing service or at a price obtained from one or more of the major broker-dealers. In cases where broker-dealer quotes are obtained, the Adviser may establish procedures whereby changes in market yields or spreads are used to adjust, on a daily basis, a recently obtained quoted price on a security. Swaps and other derivatives are valued daily, primarily using independent pricing services, independent pricing models using market inputs, as well as third party broker-dealers or counterparties. Open-end mutual funds are valued at the closing net asset value per share, while exchange-traded funds are valued at the closing market price per share.
| | |
| |
182 | AB MUNICIPAL INCOME FUND | | abfunds.com |
NOTES TO FINANCIAL STATEMENTS (continued)
Securities for which market quotations are not readily available (including restricted securities) or are deemed unreliable are valued at fair value as deemed appropriate by the Adviser. Factors considered in making this determination may include, but are not limited to, information obtained by contacting the issuer, analysts, analysis of the issuer’s financial statements or other available documents. In addition, the Portfolios may use fair value pricing for securities primarily traded in non-U.S. markets because most foreign markets close well before the Portfolios value their securities at 4:00 p.m., Eastern Time. The earlier close of these foreign markets gives rise to the possibility that significant events, including broad market moves, may have occurred in the interim and may materially affect the value of those securities. To account for this, the Portfolios generally value many of their foreign equity securities using fair value prices based on third party vendor modeling tools to the extent available.
2. Fair Value Measurements
In accordance with U.S. GAAP regarding fair value measurements, fair value is defined as the price that the Portfolios would receive to sell an asset or pay to transfer a liability in an orderly transaction between market participants at the measurement date. U.S. GAAP establishes a framework for measuring fair value, and a three-level hierarchy for fair value measurements based upon the transparency of inputs to the valuation of an asset or liability (including those valued based on their market values as described in Note A.1 above). Inputs may be observable or unobservable and refer broadly to the assumptions that market participants would use in pricing the asset or liability. Observable inputs reflect the assumptions market participants would use in pricing the asset or liability based on market data obtained from sources independent of the Portfolios. Unobservable inputs reflect the Portfolios’ own assumptions about the assumptions that market participants would use in pricing the asset or liability based on the best information available in the circumstances. Each investment is assigned a level based upon the observability of the inputs which are significant to the overall valuation. The three-tier hierarchy of inputs is summarized below.
| | • | | Level 1—quoted prices in active markets for identical investments |
| | • | | Level 2—other significant observable inputs (including quoted prices for similar investments, interest rates, prepayment speeds, credit risk, etc.) |
| | • | | Level 3—significant unobservable inputs (including the Portfolios’ own assumptions in determining the fair value of investments) |
The fair value of debt instruments, such as bonds, and over-the-counter derivatives is generally based on market price quotations, recently executed market transactions (where observable) or industry recognized modeling techniques and are generally classified as Level 2. Pricing vendor inputs to
| | |
| |
| abfunds.com | | AB MUNICIPAL INCOME FUND | 183 |
NOTES TO FINANCIAL STATEMENTS (continued)
Level 2 valuations may include quoted prices for similar investments in active markets, interest rate curves, coupon rates, currency rates, yield curves, option adjusted spreads, default rates, credit spreads and other unique security features in order to estimate the relevant cash flows which are then discounted to calculate fair values. If these inputs are unobservable and significant to the fair value, these investments will be classified as Level 3.
Other fixed income investments, including non-U.S. government and corporate debt, are generally valued using quoted market prices, if available, which are typically impacted by current interest rates, maturity dates and any perceived credit risk of the issuer. Additionally, in the absence of quoted market prices, these inputs are used by pricing vendors to derive a valuation based upon industry or proprietary models which incorporate issuer specific data with relevant yield/spread comparisons with more widely quoted bonds with similar key characteristics. Those investments for which there are observable inputs are classified as Level 2. Where the inputs are not observable, the investments are classified as Level 3.
The following tables summarize the valuation of the Portfolios’ investments by the above fair value hierarchy levels as of May 31, 2024:
| | | | | | | | | | | | | | | | |
| AB California Portfolio | |
Investments in
Securities: | | Level 1 | | | Level 2 | | | Level 3 | | | Total | |
Assets: | | | | | | | | | | | | | | | | |
Long-Term Municipal Bonds | | $ | – 0 | – | | $ | 1,141,809,534 | | | $ | 295,929 | | | $ | 1,142,105,463 | |
Commercial Mortgage-Backed Securities | | | – 0 | – | | | 27,046,811 | | | | – 0 | – | | | 27,046,811 | |
Asset-Backed Securities | | | – 0 | – | | | 2,278,576 | | | | – 0 | – | | | 2,278,576 | |
Preferred Stocks | | | – 0 | – | | | – 0 | – | | | 84,047 | | | | 84,047 | |
Short-Term Investments | | | 2,448,099 | | | | – 0 | – | | | – 0 | – | | | 2,448,099 | |
| | | | | | | | | | | | | | | | |
Total Investments in Securities | | | 2,448,099 | | | | 1,171,134,921 | | | | 379,976 | | | | 1,173,962,996 | |
Other Financial Instruments(a): | | | | | | | | | | | | | | | | |
Assets: | | | | | | | | | | | | | | | | |
Centrally Cleared Inflation (CPI) Swaps | | | – 0 | – | | | 12,693,506 | | | | – 0 | – | | | 12,693,506 | (b) |
Interest Rate Swaps | | | – 0 | – | | | 1,304,043 | | | | – 0 | – | | | 1,304,043 | |
Liabilities: | | | | | | | | | | | | | | | | |
Centrally Cleared Inflation (CPI) Swaps | | | – 0 | – | | | (3,262,381 | ) | | | – 0 | – | | | (3,262,381 | )(b) |
Centrally Cleared Interest Rate Swaps | | | – 0 | – | | | (1,879,792 | ) | | | – 0 | – | | | (1,879,792 | )(b) |
| | | | | | | | | | | | | | | | |
Total | | $ | 2,448,099 | | | $ | 1,179,990,297 | | | $ | 379,976 | | | $ | 1,182,818,372 | |
| | | | | | | | | | | | | | | | |
| | |
| |
184 | AB MUNICIPAL INCOME FUND | | abfunds.com |
NOTES TO FINANCIAL STATEMENTS (continued)
| | | | | | | | | | | | | | | | |
| AB High Income Municipal Portfolio | |
Investments in
Securities: | | Level 1 | | | Level 2 | | | Level 3 | | | Total | |
Assets: | | | | | | | | | | | | | | | | |
Long-Term Municipal Bonds | | $ | – 0 | – | | $ | 2,889,741,499 | | | $ | 2,652,853 | (c) | | $ | 2,892,394,352 | |
Commercial Mortgage-Backed Securities | | | – 0 | – | | | 47,463,271 | | | | – 0 | – | | | 47,463,271 | |
Corporates – Non-Investment Grade | | | – 0 | – | | | 8,146,115 | | | | 10,218,559 | | | | 18,364,674 | |
Corporates – Investment Grade | | | – 0 | – | | | 6,458,130 | | | | – 0 | – | | | 6,458,130 | |
Asset-Backed Securities | | | – 0 | – | | | 6,343,448 | | | | – 0 | – | | | 6,343,448 | |
Preferred Stocks | | | – 0 | – | | | – 0 | – | | | 644,946 | | | | 644,946 | |
Short-Term Investments | | | 8,116,755 | | | | – 0 | – | | | – 0 | – | | | 8,116,755 | |
| | | | | | | | | | | | | | | | |
Total Investments in Securities | | | 8,116,755 | | | | 2,958,152,463 | | | | 13,516,358 | (c) | | | 2,979,785,576 | |
Other Financial Instruments(a): | | | | | | | | | | | | | | | | |
Assets: | | | | | | | | | | | | | | | | |
Interest Rate Swaps | | | – 0 | – | | | 3,363,774 | | | | – 0 | – | | | 3,363,774 | |
Liabilities: | | | | | | | | | | | | | | | | |
Centrally Cleared Credit Default Swaps | | | – 0 | – | | | (10,053,277 | ) | | | – 0 | – | | | (10,053,277 | )(b) |
Centrally Cleared Interest Rate Swaps | | | – 0 | – | | | (16,363,665 | ) | | | – 0 | – | | | (16,363,665 | )(b) |
Credit Default Swaps | | | – 0 | – | | | (2,284,622 | ) | | | – 0 | – | | | (2,284,622 | ) |
Interest Rate Swaps | | | – 0 | – | | | (3,004,003 | ) | | | – 0 | – | | | (3,004,003 | ) |
| | | | | | | | | | | | | | | | |
Total | | $ | 8,116,755 | | | $ | 2,929,810,670 | | | $ | 13,516,358 | (c) | | $ | 2,951,443,783 | |
| | | | | | | | | | | | | | | | |
| | |
| |
| abfunds.com | | AB MUNICIPAL INCOME FUND | 185 |
NOTES TO FINANCIAL STATEMENTS (continued)
| | | | | | | | | | | | | | | | |
| AB National Portfolio | |
Investments in
Securities: | | Level 1 | | | Level 2 | | | Level 3 | | | Total | |
Assets: | | | | | | | | | | | | | | | | |
Long-Term Municipal Bonds | | $ | – 0 | – | | $ | 1,810,834,481 | | | $ | 552,921 | (c) | | $ | 1,811,387,402 | |
Commercial Mortgage-Backed Securities | | | – 0 | – | | | 30,320,798 | | | | – 0 | – | | | 30,320,798 | |
Asset-Backed Securities | | | – 0 | – | | | 4,290,045 | | | | – 0 | – | | | 4,290,045 | |
Preferred Stocks | | | – 0 | – | | | – 0 | – | | | 157,035 | | | | 157,035 | |
Short-Term Investments | | | 10,267,244 | | | | – 0 | – | | | – 0 | – | | | 10,267,244 | |
| | | | | | | | | | | | | | | | |
Total Investments in Securities | | | 10,267,244 | | | | 1,845,445,324 | | | | 709,956 | (c) | | | 1,856,422,524 | |
Other Financial Instruments(a): | | | | | | | | | | | | | | | | |
Assets: | | | | | | | | | | | | | | | | |
Interest Rate Swaps | | | – 0 | – | | | 2,446,194 | | | | – 0 | – | | | 2,446,194 | |
Liabilities: | | | | | | | | | | | | | | | | |
Centrally Cleared Credit Default Swaps | | | – 0 | – | | | (2,150,222 | ) | | | – 0 | – | | | (2,150,222 | )(b) |
Centrally Cleared Interest Rate Swaps | | | – 0 | – | | | (5,550,524 | ) | | | – 0 | – | | | (5,550,524 | )(b) |
Interest Rate Swaps | | | – 0 | – | | | (796,754 | ) | | | – 0 | – | | | (796,754 | ) |
| | | | | | | | | | | | | | | | |
Total | | $ | 10,267,244 | | | $ | 1,839,394,018 | | | $ | 709,956 | (c) | | $ | 1,850,371,218 | |
| | | | | | | | | | | | | | | | |
| | |
| |
186 | AB MUNICIPAL INCOME FUND | | abfunds.com |
NOTES TO FINANCIAL STATEMENTS (continued)
| | | | | | | | | | | | | | | | |
| AB New York Portfolio | |
Investments in
Securities: | | Level 1 | | | Level 2 | | | Level 3 | | | Total | |
Assets: | | | | | | | | | | | | | | | | |
Long-Term Municipal Bonds | | $ | – 0 | – | | $ | 478,715,507 | | | $ | 243,498 | | | $ | 478,959,005 | |
Asset-Backed Securities | | | – 0 | – | | | 1,448,482 | | | | – 0 | – | | | 1,448,482 | |
Preferred Stocks | | | – 0 | – | | | – 0 | – | | | 68,344 | | | | 68,344 | |
Corporates – Non-Investment Grade | | | – 0 | – | | | – 0 | – | | | 7,500 | | | | 7,500 | |
Commercial Mortgage-Backed Securities | | | – 0 | – | | | 3 | | | | 145 | | | | 148 | |
Short-Term Investments | | | 2,546,435 | | | | – 0 | – | | | – 0 | – | | | 2,546,435 | |
| | | | | | | | | | | | | | | | |
Total Investments in Securities | | | 2,546,435 | | | | 480,163,992 | | | | 319,487 | | | | 483,029,914 | |
Other Financial Instruments(a): | | | | | | | | | | | | | | | | |
Assets: | | | | | | | | | | | | | | | | |
Centrally Cleared Interest Rate Swaps | | | – 0 | – | | | 76,365 | | | | – 0 | – | | | 76,365 | (b) |
Interest Rate Swaps | | | – 0 | – | | | 970,799 | | | | – 0 | – | | | 970,799 | |
Liabilities: | | | | | | | | | | | | | | | | |
Centrally Cleared Credit Default Swaps | | | – 0 | – | | | (389,257 | ) | | | – 0 | – | | | (389,257 | )(b) |
Centrally Cleared Interest Rate Swaps | | | – 0 | – | | | (2,413,245 | ) | | | – 0 | – | | | (2,413,245 | )(b) |
| | | | | | | | | | | | | | | | |
Total | | $ | 2,546,435 | | | $ | 478,408,654 | | | $ | 319,487 | | | $ | 481,274,576 | |
| | | | | | | | | | | | | | | | |
AB High Income Municipal Portfolio holds liabilities for floating rate note obligations which are not reflected in the table above. The fair value of the Fund’s liabilities for floating rate note obligations approximates their liquidation values. Floating rate note obligations are generally classified as level 2.
| (a) | Other financial instruments include reverse repurchase agreements and derivative instruments, such as futures, forwards and swaps. Derivative instruments are valued at the unrealized appreciation (depreciation) on the instrument. Other financial instruments may also include swaps with upfront premiums, written options and written swaptions which are valued at market value. |
| (b) | Only variation margin receivable (payable) at period end is reported within the statement of assets and liabilities. This amount reflects cumulative unrealized appreciation (depreciation) on futures and centrally cleared swaps as reported in the portfolio of investments. Where applicable, centrally cleared swaps with upfront premiums are presented here at market value. |
| (c) | The Portfolio held securities with zero market value at period end. |
3. Taxes
It is each Portfolio’s policy to meet the requirements of the Internal Revenue Code applicable to regulated investment companies and to distribute all of its investment company taxable income and net realized gains, if any, to shareholders. Therefore, no provisions for federal income or excise taxes are required. The Portfolios have a tax year-end of November 30 concurrent with the filing of the Portfolios’ tax returns.
| | |
| |
| abfunds.com | | AB MUNICIPAL INCOME FUND | 187 |
NOTES TO FINANCIAL STATEMENTS (continued)
In accordance with U.S. GAAP requirements regarding accounting for uncertainties in income taxes, management has analyzed the Portfolios’ tax positions taken or expected to be taken on federal and state income tax returns for all open tax years (the current and the prior three tax years) and has concluded that no provision for income tax is required in the Portfolios’ financial statements.
4. Investment Income and Investment Transactions
Dividend income is recorded on the ex-dividend date or as soon as the Portfolios are informed of the dividend. Interest income is accrued daily. Investment transactions are accounted for on the date the securities are purchased or sold. Investment gains or losses are determined on the identified cost basis. Non-cash dividends, if any, are recorded on the ex-dividend date at the fair value of the securities received. The Portfolios amortize premiums and accrete original issue and market discounts as adjustments to interest income. The Portfolio accounts for distributions received from real estate investment trust (“REIT”) investments or from regulated investment companies as dividend income, realized gain, or return of capital based on information provided by the REIT or the investment company.
5. Class Allocations
All income earned and expenses incurred by the Portfolios are borne on a pro-rata basis by each settled class of shares, based on the proportionate interest in each Portfolio represented by the net assets of such class, except for class specific expenses which are allocated to the respective class. Expenses of the Fund are charged proportionately to the Portfolios or based on other appropriate methods. Realized and unrealized gains and losses are allocated among the various share classes based on respective net assets.
6. Dividends and Distributions
Dividends and distributions to shareholders, if any, are recorded on the ex-dividend date. Income dividends and capital gains distributions are determined in accordance with federal tax regulations and may differ from those determined in accordance with U.S. GAAP. To the extent these differences are permanent, such amounts are reclassified within the capital accounts based on their federal tax basis treatment; temporary differences do not require such reclassification.
7. Cash and Short-Term Investments
Cash and short-term investments include cash on hand and short-term investments with maturities of less than one year when purchased.
| | |
| |
188 | AB MUNICIPAL INCOME FUND | | abfunds.com |
NOTES TO FINANCIAL STATEMENTS (continued)
NOTE B
Advisory Fee and Other Transactions with Affiliates
Under the terms of the investment advisory agreement, the Portfolios pay the Adviser at the annual rates as follows:
| | | | | | | | | | | | |
| | | Average Daily Net Assets | |
| Portfolio | | First $2.5 Billion | | | Next $2.5 Billion | | | In Excess of $5 Billion | |
AB California | | | .45 | % | | | .40 | % | | | .35 | % |
AB High Income Municipal | | | .50 | % | | | .45 | % | | | .40 | % |
AB National | | | .45 | % | | | .40 | % | | | .35 | % |
AB New York | | | .45 | % | | | .40 | % | | | .35 | % |
Such fees are accrued daily and paid monthly.
The Adviser has agreed to waive its fees and bear certain expenses to the extent necessary to limit the total operating expenses (excluding interest expense, brokerage commissions and other transaction costs, taxes and extraordinary expenses) on an annual basis (the “Expense Caps”) as follows:
| | | | | | | | | | | | | | |
| Portfolio | | Class A | | | Class C | | | Advisor
Class | | | Class Z |
AB California | | | .75 | % | | | 1.50 | % | | | .50 | % | | N/A |
AB High Income Municipal | | | .80 | % | | | 1.55 | % | | | .55 | % | | .55% |
AB National | | | .75 | % | | | 1.50 | % | | | .50 | % | | N/A |
AB New York | | | .75 | % | | | 1.50 | % | | | .50 | % | | N/A |
This contractual agreement extends through September 30, 2024, for all Portfolios and may be extended by the Adviser for additional one year terms.
For the year ended May 31, 2024, such reimbursements amounted to $215,312, $241,276, $565,373 and $362,767 for AB California, AB High Income Municipal, AB National and AB New York Portfolios, respectively.
Pursuant to the investment advisory agreement, each Portfolio may reimburse the Adviser for certain legal and accounting services provided to each Portfolio by the Adviser. For the year ended May 31, 2024, the reimbursement for such services amounted to $87,513, $101,713, $94,360 and $102,424 for AB California, AB High Income Municipal, AB National and AB New York Portfolios, respectively.
The Portfolios compensate AllianceBernstein Investor Services, Inc. (“ABIS”), a wholly-owned subsidiary of the Adviser, under a Transfer Agency Agreement for providing personnel and facilities to perform transfer agency services for the Portfolios. ABIS may make payments to intermediaries that provide omnibus account services, sub-accounting services
| | |
| |
| abfunds.com | | AB MUNICIPAL INCOME FUND | 189 |
NOTES TO FINANCIAL STATEMENTS (continued)
and/or networking services. Such compensation retained by ABIS amounted to: AB California Portfolio, $69,001; AB High Income Municipal Portfolio, $238,554; AB National Portfolio, $200,028 and AB New York Portfolio, $56,734 for the year ended May 31, 2024.
AllianceBernstein Investments, Inc. (the “Distributor”), a wholly-owned subsidiary of the Adviser, serves as the distributor of the Portfolios’ shares. The Distributor has advised the Portfolios that it has retained front-end sales charges from the sale of Class A shares and received contingent deferred sales charges imposed upon redemptions by shareholders of Class A and Class C shares for each Portfolio for the year ended May 31, 2024, as follows:
| | | | | | | | | | | | |
| | | Front-End Sales
Charges | | | Contingent Deferred Sales
Charges | |
| Portfolio | | Class A | | | Class A | | | Class C | |
AB California | | $ | 428 | | | $ | 71,602 | | | $ | 4,411 | |
AB High Income Municipal | | | – 0 | – | | | 44,155 | | | | 4,798 | |
AB National | | | 251 | | | | 5,126 | | | | 2,539 | |
AB New York | | | 113 | | | | 629 | | | | 1,864 | |
The Portfolios may invest in AB Government Money Market Portfolio (the “Government Money Market Portfolio”) which has a contractual annual advisory fee rate of .20% of the portfolio’s average daily net assets and bears its own expenses. The Adviser had contractually agreed to waive .10% of the advisory fee of Government Money Market Portfolio (resulting in a net advisory fee of .10%) until August 31, 2023. Effective September 1, 2023, the Adviser has contractually agreed to waive .05% of the advisory fee of Government Money Market Portfolio (resulting in a net advisory fee of .15%) until August 31, 2024. In connection with the investment by the Portfolios in Government Money Market Portfolio, the Adviser has contractually agreed to waive its advisory fee from the Portfolios in an amount equal to each Portfolio’s pro rata share of the effective advisory fee of Government Money Market Portfolio, as borne indirectly by the Portfolios as an acquired fund fee and expense. For the year ended May 31, 2024, such waivers amounted to:
| | | | |
Portfolio | | Amount | |
AB California | | $ | 32,357 | |
AB High Income Municipal | | | 50,125 | |
AB National | | | 35,768 | |
AB New York | | | 7,025 | |
In connection with the Portfolios’ investments in other AB mutual funds, the Adviser has contractually agreed to waive fees and/or reimburse the expenses payable to the Adviser by the Portfolios in an amount equal to the Portfolios’ pro rata share of the effective advisory fees of AB mutual
| | |
| |
190 | AB MUNICIPAL INCOME FUND | | abfunds.com |
NOTES TO FINANCIAL STATEMENTS (continued)
funds, as paid by the Portfolios as an acquired fund fee and expense. These fee waivers and/or expense reimbursements will remain in effect until September 30, 2025. For the year ended May 31, 2024, such waivers and/or reimbursements amounted to $3,578 for AB High Income Municipal Portfolio.
A summary of the Portfolios’ transactions in AB mutual funds for the year ended May 31, 2024 is as follows:
| | | | | | | | | | | | | | | | | | | | |
| AB Municipal Income Fund, Inc. – AB California Portfolio | |
| Portfolio | | Market
Value 5/31/23 (000) | | | Purchases at Cost (000) | | | Sales Proceeds (000) | | | Market
Value 5/31/24 (000) | | | Dividend Income (000) | |
Government Money Market Portfolio | | $ | 17,007 | | | $ | 360,644 | | | $ | 375,203 | | | $ | 2,448 | | | $ | 1,234 | |
| | | | | | | | | | | | | | | | | | | | | | | | | | | | | | | | |
| AB Municipal Income Fund, Inc. – AB High Income Municipal | |
| | | | Distributions | |
| Fund | | Market
Value
5/31/23
(000) | | | Purchases
at Cost
(000) | | | Sales
Proceeds
(000) | | | Realized
Gain
(Loss)
(000) | | | Change in
Unrealized
Appr./
(Depr.)
(000) | | | Market
Value
5/31/24
(000) | | | Dividend
Income
(000) | | | Realized
Gains
(000) | |
Government Money Market Portfolio | | $ | 5,642 | | | $ | 749,608 | | | $ | 747,133 | | | $ | – 0 | – | | $ | – 0 | – | | $ | 8,117 | | | $ | 1,772 | | | $ | – 0 | – |
AB Tax-
Aware Short Duration Municipal ETF | | | – 0 | – | | | 4,954 | | | | 5,032 | | | | 78 | | | | – 0 | – | | | – 0 | – | | | 39 | | | | – 0 | – |
| | | | | | | | | | | | | | | | | | | | | | | | | | | | | | | | |
Total | | | | | | | | | | | | | | $ | 78 | | | $ | – 0 | – | | $ | 8,117 | | | $ | 1,811 | | | $ | – 0 | – |
| | | | | | | | | | | | | | | | | | | | | | | | | | | | | | | | |
| | | | | | | | | | | | | | | | | | | | |
| AB Municipal Income Fund, Inc. – AB National Portfolio | |
| Portfolio | | Market
Value 5/31/23 (000) | | | Purchases at Cost (000) | | | Sales Proceeds (000) | | | Market
Value 5/31/24 (000) | | | Dividend Income (000) | |
Government Money Market Portfolio | | $ | 28,136 | | | $ | 537,848 | | | $ | 555,717 | | | $ | 10,267 | | | $ | 1,347 | |
| | | | | | | | | | | | | | | | | | | | |
| AB Municipal Income Fund, Inc. – AB New York Portfolio | |
| Portfolio | | Market
Value 5/31/23 (000) | | | Purchases at Cost (000) | | | Sales Proceeds (000) | | | Market
Value 5/31/24 (000) | | | Dividend Income (000) | |
Government Money Market Portfolio | | $ | 15,718 | | | $ | 129,192 | | | $ | 142,364 | | | $ | 2,546 | | | $ | 283 | |
| | |
| |
| abfunds.com | | AB MUNICIPAL INCOME FUND | 191 |
NOTES TO FINANCIAL STATEMENTS (continued)
During the year ended May 31, 2024 and the year ended May 31, 2023, the Adviser reimbursed AB High Income Municipal Portfolio $0 and $175,936, AB National Portfolio $1,750 and $0, and AB New York Portfolio $0 and $1,866, respectively, for trading losses incurred due to a trade entry error.
NOTE C
Distribution Services Agreement
The Portfolios have adopted a Distribution Services Agreement (the “Agreement”) pursuant to Rule 12b-1 under the 1940 Act. Under the Agreement, the Portfolios pay distribution and servicing fees to the Distributor at an annual rate of up to .30% of the Portfolios’ average daily net assets attributable to Class A shares and 1% of the Portfolios’ average daily net assets attributable to Class C shares. Payments under the Agreement in respect of Class A shares are currently limited to an annual rate of .25% of Class A shares’ average daily net assets. There are no distribution and servicing fees on the Advisor Class and Class Z shares. The fees are accrued daily and paid monthly. The Agreement provides that the Distributor will use such payments in their entirety for distribution assistance and promotional activities. Since the commencement of the Portfolios’ operations, the distributor has incurred expenses in excess of the distribution costs reimbursed by each Portfolio as follows:
| | | | |
Portfolio | | Class C | |
AB California | | $ | 7,521,531 | |
AB High Income Municipal | | | 3,710,247 | |
AB National | | | 7,084,459 | |
AB New York | | | 4,541,655 | |
While such costs may be recovered from the Portfolios in future periods so long as the Agreement is in effect, the rate of the distribution and servicing fees payable under the Agreement may not be increased without a shareholder vote. In accordance with the Agreement, there is no provision for recovery of unreimbursed distribution costs incurred by the Distributor beyond the current fiscal year for Class A shares. The Agreement also provides that the Adviser may use its own resources to finance the distribution of the Portfolios’ shares.
| | |
| |
192 | AB MUNICIPAL INCOME FUND | | abfunds.com |
NOTES TO FINANCIAL STATEMENTS (continued)
NOTE D
Investment Transactions
Purchases and sales of investment securities (excluding short-term investments) for the year ended May 31, 2024, were as follows:
| | | | | | | | | | | | | | | | |
| | | Purchases | | | Sales | |
Portfolio | | Investments | | | Government
Securities | | | Investments | | | Government
Securities | |
AB California | | $ | 411,277,230 | | | $ | – 0 | – | | $ | 231,453,091 | | | $ | – 0 | – |
AB High Income Municipal | | | 717,057,583 | | | | – 0 | – | | | 954,584,753 | | | | – 0 | – |
AB National | | | 742,207,598 | | | | 4,279,655 | | | | 530,211,262 | | | | 105,000 | |
AB New York | | | 172,920,094 | | | | – 0 | – | | | 197,704,339 | | | | – 0 | – |
As of May 31, 2024, the cost of investments for federal income tax purposes, gross unrealized appreciation and unrealized depreciation are as follows:
| | | | | | | | | | | | | | | | |
| | | | | | Gross Unrealized | | | Net Unrealized
Depreciation | |
Portfolio | | Cost | | | Appreciation | | | (Depreciation) | |
AB California | | $ | 1,215,946,149 | | | $ | 22,503,620 | | | $ | (55,573,641 | ) | | $ | (33,070,021 | ) |
AB High Income Municipal | | | 3,136,429,486 | | | | 49,984,317 | | | | (402,966,302 | ) | | | (352,981,985 | ) |
AB National | | | 1,918,417,178 | | | | 22,029,729 | | | | (87,301,136 | ) | | | (65,271,407 | ) |
AB New York | | | 504,150,377 | | | | 5,136,010 | | | | (27,075,527 | ) | | | (21,939,517 | ) |
1. Derivative Financial Instruments
Each Portfolio may use derivatives in an effort to earn income and enhance returns, to replace more traditional direct investments, to obtain exposure to otherwise inaccessible markets (collectively, “investment purposes”), or to hedge or adjust the risk profile of its portfolio.
The principal type of derivative utilized by the Portfolios, as well as the methods in which they may be used are:
Each Portfolio may enter into swaps for investment purposes or to hedge its exposure to interest rates, credit risk or inflation. A swap is an agreement that obligates two parties to exchange a series of cash flows at specified intervals based upon or calculated by reference to changes in specified prices, rates or indexes for a specified amount of an underlying asset or inflation. The payment flows are usually netted against each other, with the difference being paid by one party to the other. In addition, collateral may be pledged or received by the Portfolios in accordance with the terms of the respective swaps to provide value and recourse to the Portfolios or their counterparties in the event of default, bankruptcy or insolvency by one of the parties to the swap.
| | |
| |
| abfunds.com | | AB MUNICIPAL INCOME FUND | 193 |
NOTES TO FINANCIAL STATEMENTS (continued)
Risks may arise as a result of the failure of the counterparty to the swap to comply with the terms of the swap. The loss incurred by the failure of a counterparty is generally limited to the net interim payment to be received by the Portfolio, and/or the termination value at the end of the contract. Therefore, the Portfolio considers the creditworthiness of each counterparty to a swap in evaluating potential counterparty risk. This risk is mitigated by having a netting arrangement between the Portfolio and the counterparty and by the posting of collateral by the counterparty to the Portfolio to cover the Portfolios’ exposure to the counterparty. Additionally, risks may arise from unanticipated movements in interest rates, inflation or in the value of the underlying securities. The Portfolio accrues for the interim payments on swaps on a daily basis, with the net amount recorded within unrealized appreciation/(depreciation) of swaps on the statement of assets and liabilities, where applicable. Once the interim payments are settled in cash, the net amount is recorded as realized gain/(loss) on swaps on the statement of operations, in addition to any realized gain/(loss) recorded upon the termination of swaps. Upfront premiums paid or received for swaps are recognized as cost or proceeds on the statement of assets and liabilities and are amortized on a straight line basis over the life of the contract. Amortized upfront premiums are included in net realized gain/(loss) from swaps on the statement of operations. Fluctuations in the value of swaps are recorded as a component of net change in unrealized appreciation/depreciation of swaps on the statement of operations.
Certain standardized swaps, including certain interest rate swaps and credit default swaps, are subject to mandatory central clearing. Cleared swaps are transacted through futures commission merchants (“FCMs”) that are members of central clearinghouses, with the clearinghouse serving as central counterparty, similar to transactions in futures contracts. Centralized clearing will be required for additional categories of swaps on a phased-in basis based on requirements published by the Securities and Exchange Commission and Commodity Futures Trading Commission.
At the time the Portfolios enter into a centrally cleared swap, each Portfolio deposits with the broker or segregates at its custodian cash or securities as collateral to satisfy initial margin requirements set by the clearinghouse on which the transaction is effected. Pursuant to the contract, with respect to cash collateral, the Portfolios agree to receive from or pay to the broker an amount of cash equal to the daily fluctuation in the value of the contract; in the case of securities collateral, the Portfolios agree to adjust the securities position held in the segregated account accordingly. Such receipts, payments or adjustments are known as variation margin and are recorded by the
| | |
| |
194 | AB MUNICIPAL INCOME FUND | | abfunds.com |
NOTES TO FINANCIAL STATEMENTS (continued)
Portfolios as unrealized gains or losses. Risks may arise from the potential inability of a counterparty to meet the terms of the contract. The credit/counterparty risk for centrally cleared swaps is generally less than non-centrally cleared swaps, since the clearinghouse, which is the issuer or counterparty to each centrally cleared swap, has robust risk mitigation standards, including the requirement to provide initial and variation margin. When the contract is closed, the Portfolios record a realized gain or loss equal to the difference between the value of the contract at the time it was opened and the time it was closed.
Interest Rate Swaps:
Each Portfolio is subject to interest rate risk exposure in the normal course of pursuing its investment objectives. Because the Portfolios hold fixed rate bonds, the value of these bonds may decrease if interest rates rise. To help hedge against this risk and to maintain its ability to generate income at prevailing market rates, the Portfolios may enter into interest rate swaps. Interest rate swaps are agreements between two parties to exchange cash flows based on a notional amount. The Portfolios may elect to pay a fixed rate and receive a floating rate, or, receive a fixed rate and pay a floating rate on a notional amount.
In addition, the Portfolios may also enter into interest rate swap transactions to preserve a return or spread on a particular investment or portion of its portfolio, or protecting against an increase in the price of securities the Portfolios anticipate purchasing at a later date. Interest rate swaps involve the exchange by the Portfolio with another party of their respective commitments to pay or receive interest (e.g., an exchange of floating rate payments for fixed rate payments) computed based on a contractually-based principal (or “notional”) amount. Interest rate swaps are entered into on a net basis (i.e., the two payment streams are netted out, with the Portfolios receiving or paying, as the case may be, only the net amount of the two payments).
During the year ended May 31, 2024, the AB California Portfolio and New York Portfolio held interest rate swaps for hedging purposes, AB High Income Municipal Portfolio and AB National Portfolio held interest rate swaps for hedging and non-hedging purposes.
Inflation (CPI) Swaps:
Inflation swap agreements are contracts in which one party agrees to pay the cumulative percentage increase in a price index (the Consumer Price Index with respect to CPI swaps) over the term of the swap (with some lag on the inflation index), and the other pays a compounded fixed rate. Inflation swaps may be used to protect the net asset value, or NAV, of a Portfolio against an unexpected change
| | |
| |
| abfunds.com | | AB MUNICIPAL INCOME FUND | 195 |
NOTES TO FINANCIAL STATEMENTS (continued)
in the rate of inflation measured by an inflation index since the value of these agreements is expected to increase if there are unexpected inflation increases.
During the year ended May 31, 2024, the Portfolios held inflation (CPI) swaps for hedging purposes.
Credit Default Swaps:
Each Portfolio may enter into credit default swaps, including to manage its exposure to the market or certain sectors of the market, to reduce its risk exposure to defaults by corporate and sovereign issuers held by the Portfolio, or to create exposure to corporate or sovereign issuers to which it is not otherwise exposed. The Portfolio may purchase credit protection (“Buy Contract”) or provide credit protection (“Sale Contract”) on the referenced obligation of the credit default swap. During the term of the swap, the Portfolio receives/(pays) fixed payments from/(to) the respective counterparty, calculated at the agreed upon rate applied to the notional amount. If the Portfolio is a buyer/(seller) of protection and a credit event occurs, as defined under the terms of the swap, the Portfolio will either (i) receive from the seller/(pay to the buyer) of protection an amount equal to the notional amount of the swap (the “Maximum Payout Amount”) and deliver/(take delivery of) the referenced obligation or (ii) receive/(pay) a net settlement amount in the form of cash or securities equal to the notional amount of the swap less the recovery value of the referenced obligation. In certain circumstances Maximum Payout Amounts may be partially offset by recovery values of the respective referenced obligations, upfront premium received upon entering into the agreement, or net amounts received from settlement of buy protection credit default swaps entered into by the Portfolio for the same referenced obligations with the same counterparty.
Credit default swaps may involve greater risks than if the Portfolio had invested in the referenced obligation directly. Credit default swaps are subject to general market risk, liquidity risk, counterparty risk and credit risk. If the Portfolio is a buyer of protection and no credit event occurs, it will lose the payments it made to its counterparty. If the Portfolio is a seller of protection and a credit event occurs, the value of the referenced obligation received by the Portfolio coupled with the periodic payments previously received, may be less than the Maximum Payout Amount it pays to the buyer, resulting in a net loss to the Portfolio.
Implied credit spreads over U.S. Treasuries of comparable maturity utilized in determining the market value of credit default swaps on issuers as of period end are disclosed in the portfolio of investments. The implied spreads serve as an indicator of the current status of the
| | |
| |
196 | AB MUNICIPAL INCOME FUND | | abfunds.com |
NOTES TO FINANCIAL STATEMENTS (continued)
payment/performance risk and typically reflect the likelihood of default by the issuer of the referenced obligation. The implied credit spread of a particular reference obligation also reflects the cost of buying/selling protection and may reflect upfront payments required to be made to enter into the agreement. Widening credit spreads typically represent a deterioration of the referenced obligation’s credit soundness and greater likelihood of default or other credit event occurring as defined under the terms of the agreement. A credit spread identified as “Defaulted” indicates a credit event has occurred for the referenced obligation.
During the year ended May 31, 2024, the AB High Income Municipal Portfolio held credit default swaps for hedging and non-hedging purposes, AB National Portfolio and New York Portfolio held credit default swaps for hedging purposes.
The Portfolios typically enter into International Swaps and Derivatives Association, Inc. Master Agreements (“ISDA Master Agreement”) with its OTC derivative contract counterparties in order to, among other things, reduce its credit risk to OTC counterparties. ISDA Master Agreements include provisions for general obligations, representations, collateral and events of default or termination. Under an ISDA Master Agreement, the Portfolios typically may offset with the OTC counterparty certain derivative financial instruments’ payables and/or receivables with collateral held and/or posted and create one single net payment (close-out netting) in the event of default or termination. In the event of a default by an OTC counterparty, the return of collateral with market value in excess of the Portfolios’ net liability, held by the defaulting party, may be delayed or denied.
The Portfolios’ ISDA Master Agreements may contain provisions for early termination of OTC derivative transactions in the event the net assets of the Portfolios decline below specific levels (“net asset contingent features”). If these levels are triggered, the Portfolios’ OTC counterparty has the right to terminate such transaction and require the Portfolios to pay or receive a settlement amount in connection with the terminated transaction. If OTC derivatives were held at period end, please refer to netting arrangements by the OTC counterparty tables below for additional details.
| | |
| |
| abfunds.com | | AB MUNICIPAL INCOME FUND | 197 |
NOTES TO FINANCIAL STATEMENTS (continued)
During the year ended May 31, 2024, the Portfolios had entered into the following derivatives:
| | | | | | | | | | | | |
| AB California Portfolio | |
| | | Asset Derivatives | | | Liability Derivatives | |
Derivative Type | | Statement of
Assets and
Liabilities
Location | | Fair Value | | | Statement of
Assets and
Liabilities
Location | | Fair Value | |
Interest rate contracts | | Receivable for variation margin on centrally cleared swaps | | $ | 12,693,506 | * | | Payable for variation margin on centrally cleared swaps | | $ | 5,134,165 | * |
| | | | |
Interest rate contracts | | Unrealized appreciation on interest rate swaps | | | 1,304,043 | | | | | | | |
| | | | | | | | | | | | |
Total | | | | $ | 13,997,549 | | | | | $ | 5,134,165 | |
| | | | | | | | | | | | |
| * | Only variation margin receivable/payable at period end is reported within the statement of assets and liabilities. This amount reflects cumulative unrealized appreciation (depreciation) on futures and centrally cleared swaps as reported in the portfolio of investments. |
| | | | | | | | | | |
Derivative Type | | Location of Gain or (Loss) on Derivatives Within Statement of Operations | | Realized Gain
or (Loss) on
Derivatives | | | Change in
Unrealized
Appreciation or
(Depreciation) | |
Interest rate contracts | | Net realized gain (loss) on swaps; Net change in unrealized appreciation (depreciation) of swaps | | $ | 982,920 | | | $ | (4,129,644 | ) |
| | | | | | | | | | |
Total | | | | $ | 982,920 | | | $ | (4,129,644 | ) |
| | | | | | | | | | |
| | | | | | | | | | | | |
| AB High Income Municipal Portfolio | |
| | | Asset Derivatives | | | Liability Derivatives | |
Derivative Type | | Statement of
Assets and
Liabilities
Location | | Fair Value | | | Statement of
Assets and
Liabilities
Location | | Fair Value | |
Credit contracts | | | | | | | | Payable for variation margin on centrally cleared swaps | | $ | 1,564,359 | * |
| | | | |
Interest rate contracts | | | | | | | | Payable for variation margin on centrally cleared swaps | | | 16,373,638 | * |
| | |
| |
198 | AB MUNICIPAL INCOME FUND | | abfunds.com |
NOTES TO FINANCIAL STATEMENTS (continued)
| | | | | | | | | | | | |
| | | Asset Derivatives | | | Liability Derivatives | |
Derivative Type | | Statement of
Assets and
Liabilities
Location | | Fair Value | | | Statement of
Assets and
Liabilities
Location | | Fair Value | |
| | | | |
Interest rate contracts | | Unrealized appreciation on interest rate swaps | | $ | 3,363,774 | | | Unrealized depreciation on interest rate swaps | | $ | 3,004,003 | |
| | | | |
Credit contracts | | | | | | | | Market value on credit default swaps | | | 2,284,622 | |
| | | | | | | | | | | | |
Total | | | | $ | 3,363,774 | | | | | $ | 23,226,622 | |
| | | | | | | | | | | | |
| * | Only variation margin receivable/payable at period end is reported within the statement of assets and liabilities. This amount reflects cumulative unrealized appreciation (depreciation) on futures and centrally cleared swaps as reported in the portfolio of investments. |
| | | | | | | | | | |
Derivative Type | | Location of Gain or (Loss) on Derivatives Within Statement of Operations | | Realized Gain
or (Loss) on
Derivatives | | | Change in
Unrealized
Appreciation or
(Depreciation) | |
Interest rate contracts | | Net realized gain (loss) on swaps; Net change in unrealized appreciation (depreciation) of swaps | | $ | 57,608,112 | | | $ | (76,983,993 | ) |
| | | |
Credit contracts | | Net realized gain (loss) on swaps; Net change in unrealized appreciation (depreciation) of swaps | | | (2,632,434 | ) | | | 1,612,819 | |
| | | | | | | | | | |
Total | | | | $ | 54,975,678 | | | $ | (75,371,174) | |
| | | | | | | | | | |
| | | | | | | | | | | | |
| AB National Portfolio | |
| | | Asset Derivatives | | | Liability Derivatives | |
Derivative Type | | Statement of
Assets and
Liabilities
Location | | Fair Value | | | Statement of
Assets and
Liabilities
Location | | Fair Value | |
Credit contracts | | | | | | | | Payable for variation margin on centrally cleared swaps | | $ | 337,329 | * |
| | | | |
Interest rate contracts | | | | | | | | Payable for variation margin on centrally cleared swaps | | | 5,550,524 | * |
| | | | |
Interest rate contracts | | Unrealized appreciation on interest rate swaps | | $ | 2,446,194 | | | Unrealized depreciation on interest rate swaps | | | 796,754 | |
| | | | | | | | | | | | |
Total | | | | $ | 2,446,194 | | | | | $ | 6,684,607 | |
| | | | | | | | | | | | |
| * | Only variation margin receivable/payable at period end is reported within the statement of assets and liabilities. This amount reflects cumulative unrealized appreciation (depreciation) on futures and centrally cleared swaps as reported in the portfolio of investments. |
| | |
| |
| abfunds.com | | AB MUNICIPAL INCOME FUND | 199 |
NOTES TO FINANCIAL STATEMENTS (continued)
| | | | | | | | | | |
Derivative Type | | Location of Gain or (Loss) on Derivatives Within Statement of Operations | | Realized Gain
or (Loss) on
Derivatives | | | Change in
Unrealized
Appreciation or
(Depreciation) | |
Interest rate contracts | | Net realized gain (loss) on swaps; Net change in unrealized appreciation (depreciation) of swaps | | $ | 8,637,445 | | | $ | (19,923,219 | ) |
| | | |
Credit contracts | | Net realized gain (loss) on swaps; Net change in unrealized appreciation (depreciation) of swaps | | | (768,554 | ) | | | (187,948 | ) |
| | | | | | | | | | |
Total | | | | $ | 7,868,891 | | | $ | (20,111,167) | |
| | | | | | | | | | |
| | | | | | | | | | | | |
| AB New York Portfolio | |
| | | Asset Derivatives | | | Liability Derivatives | |
Derivative Type | | Statement of
Assets and
Liabilities
Location | | Fair Value | | | Statement of
Assets and
Liabilities
Location | | Fair Value | |
Credit contracts | | | | | | | | Payable for variation margin on centrally cleared swaps | | $ | 77,972 | * |
Interest rate contracts | | Receivable for variation margin on centrally cleared swaps | | $ | 76,365 | * | | Payable for variation margin on centrally cleared swaps | | | 2,415,262 | * |
| | | | |
Interest rate contracts | | Unrealized appreciation on interest rate swaps | | | 970,799 | | | | | | | |
| | | | | | | | | | | | |
Total | | | | $ | 1,047,164 | | | | | $ | 2,493,234 | |
| | | | | | | | | | | | |
| * | Only variation margin receivable/payable at period end is reported within the statement of assets and liabilities. This amount reflects cumulative unrealized appreciation (depreciation) on futures and centrally cleared swaps as reported in the portfolio of investments. |
| | | | | | | | | | |
Derivative Type | | Location of Gain or (Loss) on Derivatives
Within Statement of Operations | | Realized Gain
or (Loss) on
Derivatives | | | Change in
Unrealized
Appreciation or
(Depreciation) | |
Interest rate contracts | | Net realized gain (loss) on swaps; Net change in unrealized appreciation (depreciation) of swaps | | $ | 6,075,454 | | | $ | (9,382,888 | ) |
| | | |
Credit contracts | | Net realized gain (loss) on swaps; Net change in unrealized appreciation (depreciation) of swaps | | | 34,396 | | | | (77,972 | ) |
| | | | | | | | | | |
Total | | | | $ | 6,109,850 | | | $ | (9,460,860 | ) |
| | | | | | | | | | |
| | |
| |
200 | AB MUNICIPAL INCOME FUND | | abfunds.com |
NOTES TO FINANCIAL STATEMENTS (continued)
The following tables represent the average monthly volume of the Portfolios’ derivative transactions during the year ended May 31, 2024:
| | | | |
AB California Portfolio | | | | |
Interest Rate Swaps: | | | | |
Average notional amount | | $ | 12,620,000 | |
Centrally Cleared Interest Rate Swaps: | | | | |
Average notional amount | | $ | 121,486,154 | |
Centrally Cleared Inflation Swaps: | | | | |
Average notional amount | | $ | 157,260,000 | |
| |
AB High Income Municipal Portfolio | | | | |
Interest Rate Swaps: | | | | |
Average notional amount | | $ | 258,413,077 | |
Centrally Cleared Interest Rate Swaps: | | | | |
Average notional amount | | $ | 662,027,692 | |
Centrally Cleared Inflation Swaps: | | | | |
Average notional amount | | $ | 794,620,000 | (a) |
Credit Default Swaps: | | | | |
Average notional amount of sale contracts | | $ | 21,931,252 | |
Centrally Cleared Credit Default Swaps: | | | | |
Average notional amount of buy contracts | | $ | 58,151,000 | (b) |
Average notional amount of sale contracts | | $ | 13,083,840 | (c) |
| (a) | Positions were open for ten months during the year. |
| (b) | Positions were open for nine months during the year. |
| (c) | Positions were open for one month during the year. |
| | | | |
AB National Portfolio | | | | |
Interest Rate Swaps: | | | | |
Average notional amount | | $ | 58,028,077 | |
Centrally Cleared Interest Rate Swaps: | | | | |
Average notional amount | | $ | 291,166,154 | |
Centrally Cleared Inflation Swaps: | | | | |
Average notional amount | | $ | 289,720,000 | (a) |
Centrally Cleared Credit Default Swaps: | | | | |
Average notional amount of buy contracts | | $ | 12,254,923 | |
Average notional amount of sale contracts | | $ | 3,717,450 | (b) |
| (a) | Positions were open for four months during the year. |
| (b) | Positions were open for one month during the year. |
| | | | |
AB New York Portfolio | | | | |
Interest Rate Swaps: | | | | |
Average notional amount | | $ | 9,395,000 | |
Centrally Cleared Interest Rate Swaps: | | | | |
Average notional amount | | $ | 85,770,769 | |
Centrally Cleared Inflation Swaps: | | | | |
Average notional amount | | $ | 104,080,000 | (a) |
Centrally Cleared Credit Default Swaps: | | | | |
Average notional amount of buy contracts | | $ | 5,000,000 | (b) |
| (a) | Positions were open for four months during the year. |
| (b) | Positions were open for two months during the year. |
| | |
| |
| abfunds.com | | AB MUNICIPAL INCOME FUND | 201 |
NOTES TO FINANCIAL STATEMENTS (continued)
For financial reporting purposes, the Portfolios do not offset derivative assets and derivative liabilities that are subject to netting arrangements in the statement of assets and liabilities.
All OTC derivatives held at period end were subject to netting arrangements. The following tables present the Portfolios’ derivative assets and liabilities by OTC counterparty net of amounts available for offset under ISDA Master Agreements (“MA”) and net of the related collateral received/pledged by the Portfolios as of May 31, 2024. Exchange-traded derivatives and centrally cleared swaps are not subject to netting arrangements and as such are excluded from the tables.
| | | | | | | | | | | | | | | | | | | | |
| AB California Portfolio | |
Counterparty | | Derivative
Assets
Subject
to a MA | | | Derivatives
Available
for Offset | | | Cash
Collateral
Received* | | | Security
Collateral
Received* | | | Net Amount of
Derivative
Assets | |
Citibank, NA | | $ | 1,304,043 | | | $ | – 0 | – | | $ | (1,300,000 | ) | | $ | – 0 | – | | $ | 4,043 | |
| | | | | | | | | | | | | | | | | | | | |
Total | | $ | 1,304,043 | | | $ | – 0 | – | | $ | (1,300,000 | ) | | $ | – 0 | – | | $ | 4,043 | ^ |
| | | | | | | | | | | | | | | | | | | | |
| * | The actual collateral received/pledged may be more than the amount reported due to over-collateralization. |
| ^ | Net amount represents the net receivable/payable that would be due from/to the counterparty in the event of default or termination. The net amount from OTC financial derivative instruments can only be netted across transactions governed under the same master agreement with the same counterparty. |
| | | | | | | | | | | | | | | | | | | | |
| AB High Income Municipal Portfolio | |
Counterparty | | Derivative
Assets
Subject
to a MA | | | Derivatives
Available
for Offset | | | Cash
Collateral
Received* | | | Security
Collateral
Received* | | | Net Amount of
Derivative
Assets | |
Citibank, NA/Citigroup Global Markets, Inc. | | $ | 2,675,588 | | | $ | (236,097 | ) | | $ | (2,439,491 | ) | | $ | – 0 | – | | $ | – 0 | – |
Morgan Stanley Capital Services LLC | | | 688,186 | | | | (688,186 | ) | | | – 0 | – | | | – 0 | – | | | – 0 | – |
| | | | | | | | | | | | | | | | | | | | |
Total | | $ | 3,363,774 | | | $ | (924,283 | ) | | $ | (2,439,491 | ) | | $ | – 0 | – | | $ | 0 | ^ |
| | | | | | | | | | | | | | | | | | | | |
| | | | | | | | | | | | | | | | | | | | |
Counterparty | | Derivative
Liabilities
Subject
to a MA | | | Derivatives
Available
for Offset | | | Cash
Collateral
Pledged* | | | Security
Collateral
Pledged* | | | Net Amount of
Derivative
Liabilities | |
Bank of America, NA | | $ | 417,795 | | | $ | – 0 | – | | $ | (417,795 | ) | | $ | – 0 | – | | $ | – 0 | – |
Citibank, NA/Citigroup Global Markets, Inc. | | | 236,097 | | | | (236,097 | ) | | | – 0 | – | | | – 0 | – | | | – 0 | – |
Credit Suisse International | | | 797,154 | | | | – 0 | – | | | (766,000 | ) | | | – 0 | – | | | 31,154 | |
Goldman Sachs International | | | 1,051,405 | | | | – 0 | – | | | (1,051,405 | ) | | | – 0 | – | | | – 0 | – |
| | |
| |
202 | AB MUNICIPAL INCOME FUND | | abfunds.com |
NOTES TO FINANCIAL STATEMENTS (continued)
| | | | | | | | | | | | | | | | | | | | |
Counterparty | | Derivative
Liabilities
Subject
to a MA | | | Derivatives
Available
for Offset | | | Cash
Collateral
Pledged* | | | Security
Collateral
Pledged* | | | Net Amount of
Derivative
Liabilities | |
JPMorgan Chase Bank, NA | | $ | 309,644 | | | $ | – 0 | – | | $ | – 0 | – | | $ | – 0 | – | | $ | 309,644 | |
Morgan Stanley Capital Services LLC | | | 2,476,530 | | | | (688,186 | ) | | | (1,788,344 | ) | | | – 0 | – | | | – 0 | – |
| | | | | | | | | | | | | | | | | | | | |
Total | | $ | 5,288,625 | | | $ | (924,283 | ) | | $ | (4,023,544 | ) | | $ | – 0 | – | | $ | 340,798 | ^ |
| | | | | | | | | | | | | | | | | | | | |
| * | The actual collateral received/pledged may be more than the amount reported due to over-collateralization. |
| ^ | Net amount represents the net receivable/payable that would be due from/to the counterparty in the event of default or termination. The net amount from OTC financial derivative instruments can only be netted across transactions governed under the same master agreement with the same counterparty. |
| | | | | | | | | | | | | | | | | | | | |
| AB National Portfolio | |
Counterparty | | Derivative
Assets
Subject
to a MA | | | Derivatives
Available
for Offset | | | Cash
Collateral
Received* | | | Security
Collateral
Received* | | | Net Amount of
Derivative
Assets | |
Citibank, NA | | $ | 2,446,194 | | | $ | (7,847 | ) | | $ | (2,438,347 | ) | | $ | – 0 | – | | $ | – 0 | – |
| | | | | | | | | | | | | | | | | | | | |
Total | | $ | 2,446,194 | | | $ | (7,847 | ) | | $ | (2,438,347 | ) | | $ | – 0 | – | | $ | 0 | ^ |
| | | | | | | | | | | | | | | | | | | | |
| | | | | | | | | | | | | | | | | | | | |
Counterparty | | Derivative
Liabilities
Subject
to a MA | | | Derivatives
Available
for Offset | | | Cash
Collateral
Pledged* | | | Security
Collateral
Pledged* | | | Net Amount of
Derivative
Liabilities | |
Bank of America, NA | | $ | 94,833 | | | $ | – 0 | – | | $ | (94,833 | ) | | $ | – 0 | – | | $ | – 0 | – |
Citibank, NA | | | 7,847 | | | | (7,847 | ) | | | – 0 | – | | | – 0 | – | | | – 0 | – |
JPMorgan Chase Bank, NA | | | 144,500 | | | | – 0 | – | | | – 0 | – | | | – 0 | – | | | 144,500 | |
Morgan Stanley Capital Services LLC | | | 549,574 | | | | – 0 | – | | | (260,000 | ) | | | – 0 | – | | | 289,574 | |
| | | | | | | | | | | | | | | | | | | | |
Total | | $ | 796,754 | | | $ | (7,847 | ) | | $ | (354,833 | ) | | $ | – 0 | – | | $ | 434,074 | ^ |
| | | | | | | | | | | | | | | | | | | | |
| * | The actual collateral received/pledged may be more than the amount reported due to over-collateralization. |
| ^ | Net amount represents the net receivable/payable that would be due from/to the counterparty in the event of default or termination. The net amount from OTC financial derivative instruments can only be netted across transactions governed under the same master agreement with the same counterparty. |
| | | | | | | | | | | | | | | | | | | | |
| AB New York Portfolio | |
Counterparty | | Derivative
Assets
Subject
to a MA | | | Derivatives
Available
for Offset | | | Cash
Collateral
Received* | | | Security
Collateral
Received* | | | Net Amount of
Derivative
Assets | |
Citibank, NA | | $ | 970,799 | | | $ | – 0 | – | | $ | (950,000 | ) | | $ | – 0 | – | | $ | 20,799 | |
| | | | | | | | | | | | | | | | | | | | |
Total | | $ | 970,799 | | | $ | – 0 | – | | $ | (950,000 | ) | | $ | – 0 | – | | $ | 20,799 | ^ |
| | | | | | | | | | | | | | | | | | | | |
| * | The actual collateral received/pledged may be more than the amount reported due to over-collateralization. |
| ^ | Net amount represents the net receivable/payable that would be due from/to the counterparty in the event of default or termination. The net amount from OTC financial derivative instruments can only be netted across transactions governed under the same master agreement with the same counterparty. |
| | |
| |
| abfunds.com | | AB MUNICIPAL INCOME FUND | 203 |
NOTES TO FINANCIAL STATEMENTS (continued)
NOTE E
Capital Stock
The Fund has authorized 81.2 billion shares of capital stock. The allocation is as follow:
| | | | | | | | | | | | | | | | | | | | | | | | | | | | |
| | | Allocation of Shares (In Million) | |
Portfolio | | Class A | | | Class B | | | Class C | | | Advisor | | | Class T | | | Class Z | | | Total | |
AB California | | | 6,000 | | | | – 0 | – | | | 6,000 | | | | 6,050 | | | | 3,000 | | | | 3,000 | | | | 24,050 | |
AB High Income Municipal | | | 3,000 | | | | 3,000 | | | | 3,000 | | | | 3,000 | | | | 3,000 | | | | 3,000 | | | | 18,000 | |
AB National | | | 6,000 | | | | – 0 | – | | | 6,000 | | | | 6,100 | | | | 3,000 | | | | 3,000 | | | | 24,100 | |
AB New York | | | 3,000 | | | | – 0 | – | | | 3,000 | | | | 3,050 | | | | 3,000 | | | | 3,000 | | | | 15,050 | |
Transactions in capital shares for each class were as follows:
| | | | | | | | | | | | | | | | | | | | | | | | |
| | | | | | | | | | | | | | | | | | | | | | | | |
| | | AB California Portfolio | |
| | | Shares | | | | | | Amount | | | | |
| | | Year Ended
May 31,
2024 | | | Year Ended
May 31,
2023 | | | | | | Year Ended
May 31,
2024 | | | Year Ended
May 31,
2023 | | | | |
| | | | | | | | |
| Class A | | | | | | | | | | | | | | | | | | | | | | | | |
Shares sold | | | 12,103,791 | | | | 7,704,647 | | | | | | | $ | 125,073,042 | | | $ | 79,007,479 | | | | | |
| | | | | |
Shares issued in reinvestment of dividends | | | 769,829 | | | | 694,841 | | | | | | | | 7,952,106 | | | | 7,144,424 | | | | | |
| | | | | |
Shares converted from Class C | | | 366,415 | | | | 175,932 | | | | | | | | 3,761,457 | | | | 1,813,791 | | | | | |
| | | | | |
Shares redeemed | | | (11,335,814 | ) | | | (9,378,795 | ) | | | | | | | (116,571,934 | ) | | | (96,438,400 | ) | | | | |
| | | | | |
Net increase (decrease) | | | 1,904,221 | | | | (803,375 | ) | | | | | | $ | 20,214,671 | | | $ | (8,472,706 | ) | | | | |
| | | | | |
| | | | | | | | | | | | | | | | | | | | | | | | |
| Class C | | | | | | | | | | | | | | | | | | | | | | | | |
Shares sold | | | 400,821 | | | | 636,890 | | | | | | | $ | 4,122,668 | | | $ | 6,584,371 | | | | | |
| | | | | |
Shares issued in reinvestment of dividends | | | 38,143 | | | | 41,605 | | | | | | | | 393,737 | | | | 427,499 | | | | | |
| | | | | |
Shares converted to Class A | | | (366,538 | ) | | | (176,006 | ) | | | | | | | (3,761,457 | ) | | | (1,813,791 | ) | | | | |
| | | | | |
Shares redeemed | | | (627,550 | ) | | | (624,303 | ) | | | | | | | (6,472,754 | ) | | | (6,410,749 | ) | | | | |
| | | | | |
Net decrease | | | (555,124 | ) | | | (121,814 | ) | | | | | | $ | (5,717,806 | ) | | $ | (1,212,670 | ) | | | | |
| | | | | |
| | | | | | | | | | | | | | | | | | | | | | | | |
| Advisor Class | | | | | |
Shares sold | | | 33,655,399 | | | | 33,681,204 | | | | | | | $ | 346,123,881 | | | $ | 347,657,032 | | | | | |
| | | | | |
Shares issued in reinvestment of dividends | | | 948,240 | | | | 771,267 | | | | | | | | 9,800,956 | | | | 7,928,561 | | | | | |
| | | | | |
Shares redeemed | | | (20,747,034 | ) | | | (29,013,615 | ) | | | | | | | (212,296,189 | ) | | | (297,310,132 | ) | | | | |
| | | | | |
Net increase | | | 13,856,605 | | | | 5,438,856 | | | | | | | $ | 143,628,648 | | | $ | 58,275,461 | | | | | |
| | | | | |
| | |
| |
204 | AB MUNICIPAL INCOME FUND | | abfunds.com |
NOTES TO FINANCIAL STATEMENTS (continued)
| | | | | | | | | | | | | | | | | | | | | | | | |
| | | | | | | | | | | | | | | | | | | | | | | | |
| | | AB High Income Municipal Portfolio | |
| | | Shares | | | | | | Amount | | | | |
| | | Year Ended
May 31,
2024 | | | Year Ended
May 31,
2023 | | | | | | Year Ended May 31,
2024 | | | Year Ended May 31,
2023 | | | | |
| | | | | | | | |
| Class A | | | | | |
Shares sold | | | 14,889,782 | | | | 19,319,656 | | | | | | | $ | 148,557,006 | | | $ | 198,769,746 | | | | | |
| | | | | |
Shares issued in reinvestment of dividends | | | 1,188,748 | | | | 1,306,039 | | | | | | | | 11,863,832 | | | | 13,337,776 | | | | | |
| | | | | |
Shares converted from Class C | | | 1,460,995 | | | | 1,561,796 | | | | | | | | 14,319,087 | | | | 16,050,640 | | | | | |
| | | | | |
Shares redeemed | | | (23,254,765 | ) | | | (31,301,164 | ) | | | | | | | (231,239,403 | ) | | | (320,723,483 | ) | | | | |
| | | | | |
Net decrease | | | (5,715,240 | ) | | | (9,113,673 | ) | | | | | | $ | (56,499,478 | ) | | $ | (92,565,321 | ) | | | | |
| | | | | |
| | | | | | | | | | | | | | | | | | | | | | | | |
| Class C | | | | | |
Shares sold | | | 688,956 | | | | 1,322,262 | | | | | | | $ | 6,945,569 | | | $ | 13,633,980 | | | | | |
| | | | | |
Shares issued in reinvestment of dividends | | | 123,948 | | | | 183,225 | | | | | | | | 1,234,793 | | | | 1,869,640 | | | | | |
| | | | | |
Shares converted to Class A | | | (1,462,127 | ) | | | (1,562,652 | ) | | | | | | | (14,319,087 | ) | | | (16,050,640 | ) | | | | |
| | | | | |
Shares redeemed | | | (1,780,462 | ) | | | (3,064,799 | ) | | | | | | | (17,758,692 | ) | | | (31,179,111 | ) | | | | |
| | | | | |
Net decrease | | | (2,429,685 | ) | | | (3,121,964 | ) | | | | | | $ | (23,897,417 | ) | | $ | (31,726,131 | ) | | | | |
| | | | | |
| | | | | | | | | | | | | | | | | | | | | | | | |
| Advisor Class | | | | | |
Shares sold | | | 64,981,724 | | | | 123,855,777 | | | | | | | $ | 648,392,148 | | | $ | 1,274,580,071 | | | | | |
| | | | | |
Shares issued in reinvestment of dividends | | | 4,504,556 | | | | 5,654,607 | | | | | | | | 44,943,172 | | | | 57,704,686 | | | | | |
| | | | | |
Shares redeemed | | | (104,907,798 | ) | | | (143,731,592 | ) | | | | | | | (1,047,127,920 | ) | | | (1,459,403,797 | ) | | | | |
| | | | | |
Net decrease | | | (35,421,518 | ) | | | (14,221,208 | ) | | | | | | $ | (353,792,600 | ) | | $ | (127,119,040 | ) | | | | |
| | | | | |
| | | | | | | | | | | | | | | | | | | | | | | | |
| Class Z | | | | | |
Shares sold | | | 38,124,499 | | | | 10,346,980 | | | | | | | $ | 384,616,078 | | | $ | 102,368,784 | | | | | |
| | | | | |
Shares issued in reinvestment of dividends | | | 866,012 | | | | 1,190 | | | | | | | | 8,621,155 | | | | 12,157 | | | | | |
| | | | | |
Shares redeemed | | | (16,357,554 | ) | | | (5,488,975 | ) | | | | | | | (162,201,591 | ) | | | (55,048,999 | ) | | | | |
| | | | | |
Net increase | | | 22,632,957 | | | | 4,859,195 | | | | | | | $ | 231,035,642 | | | $ | 47,331,942 | | | | | |
| | | | | |
| | |
| |
| abfunds.com | | AB MUNICIPAL INCOME FUND | 205 |
NOTES TO FINANCIAL STATEMENTS (continued)
| | | | | | | | | | | | | | | | | | | | | | | | |
| | | | | | | | | | | | | | | | | | | | | | | | |
| | | AB National Portfolio | |
| | | Shares | | | | | | Amount | | | | |
| | | Year Ended
May 31,
2024 | | | Year Ended
May 31,
2023 | | | | | | Year Ended
May 31,
2024 | | | Year Ended
May 31,
2023 | | | | |
| | | | | | | | |
| Class A | | | | | |
Shares sold | | | 7,076,762 | | | | 9,334,429 | | | | | | | $ | 67,291,820 | | | $ | 89,177,348 | | | | | |
| | | | | |
Shares issued in reinvestment of dividends | | | 797,174 | | | | 776,246 | | | | | | | | 7,585,648 | | | | 7,401,302 | | | | | |
| | | | | |
Shares converted from Class C | | | 466,615 | | | | 494,018 | | | | | | | | 4,406,644 | | | | 4,720,857 | | | | | |
| | | | | |
Shares redeemed | | | (10,198,931 | ) | | | (17,637,628 | ) | | | | | | | (96,886,982 | ) | | | (168,516,029 | ) | | | | |
| | | | | |
Net decrease | | | (1,858,380 | ) | | | (7,032,935 | ) | | | | | | $ | (17,602,870 | ) | | $ | (67,216,522 | ) | | | | |
| | | | | |
| | | | | | | | | | | | | | | | | | | | | | | | |
| Class C | | | | | |
Shares sold | | | 349,616 | | | | 687,356 | | | | | | | $ | 3,328,322 | | | $ | 6,531,079 | | | | | |
| | | | | |
Shares issued in reinvestment of dividends | | | 40,309 | | | | 47,371 | | | | | | | | 382,737 | | | | 451,073 | | | | | |
| | | | | |
Shares converted to Class A | | | (467,261 | ) | | | (494,595 | ) | | | | | | | (4,406,644 | ) | | | (4,720,857 | ) | | | | |
| | | | | |
Shares redeemed | | | (642,223 | ) | | | (956,464 | ) | | | | | | | (6,097,819 | ) | | | (9,092,887 | ) | | | | |
| | | | | |
Net decrease | | | (719,559 | ) | | | (716,332 | ) | | | | | | $ | (6,793,404 | ) | | $ | (6,831,592 | ) | | | | |
| | | | | |
| | | | | | | | | | | | | | | | | | | | | | | | |
| Advisor Class | | | | | |
Shares sold | | | 71,640,300 | | | | 95,485,368 | | | | | | | $ | 679,042,868 | | | $ | 913,030,211 | | | | | |
| | | | | |
Shares issued in reinvestment of dividends | | | 3,358,852 | | | | 2,815,718 | | | | | | | | 31,956,034 | | | | 26,867,436 | | | | | |
| | | | | |
Shares redeemed | | | (55,000,613 | ) | | | (97,613,105 | ) | | | | | | | (520,164,789 | ) | | | (929,117,588 | ) | | | | |
| | | | | |
Net increase | | | 19,998,539 | | | | 687,981 | | | | | | | $ | 190,834,113 | | | $ | 10,780,059 | | | | | |
| | | | | |
| | |
| |
206 | AB MUNICIPAL INCOME FUND | | abfunds.com |
NOTES TO FINANCIAL STATEMENTS (continued)
| | | | | | | | | | | | | | | | | | | | | | | | |
| | | | | | | | | | | | | | | | | | | | | | | | |
| | | AB New York Portfolio | | | | |
| | | Shares | | | | | | Amount | | | | |
| | | Year Ended May 31,
2024 | | | Year Ended
May 31,
2023 | | | | | | Year Ended
May 31,
2024 | | | Year Ended May 31,
2023 | | | | |
| | | | | | | | |
| Class A | | | | | | | | | | | | | | | | | | | | | | | | |
Shares sold | | | 3,944,674 | | | | 9,091,308 | | | | | | | $ | 35,577,569 | | | $ | 82,288,278 | | | | | |
| | | | | |
Shares issued in reinvestment of dividends | | | 572,502 | | | | 568,418 | | | | | | | | 5,211,392 | | | | 5,191,614 | | | | | |
| | | | | |
Shares converted from Class C | | | 515,651 | | | | 253,419 | | | | | | | | 4,587,724 | | | | 2,325,313 | | | | | |
| | | | | |
Shares redeemed | | | (9,012,605 | ) | | | (12,649,008 | ) | | | | | | | (81,174,687 | ) | | | (115,098,325 | ) | | | | |
| | | | | |
Net decrease | | | (3,979,778 | ) | | | (2,735,863 | ) | | | | | | $ | (35,798,002 | ) | | $ | (25,293,120 | ) | | | | |
| | | | | |
| | | | | | | | | | | | | | | | | | | | | | | | |
| Class C | | | | | |
Shares sold | | | 88,500 | | | | 159,265 | | | | | | | $ | 808,820 | | | $ | 1,445,248 | | | | | |
| | | | | |
Shares issued in reinvestment of dividends | | | 23,286 | | | | 32,756 | | | | | | | | 211,669 | | | | 298,992 | | | | | |
| | | | | |
Shares converted to Class A | | | (516,043 | ) | | | (253,550 | ) | | | | | | | (4,587,724 | ) | | | (2,325,313 | ) | | | | |
| | | | | |
Shares redeemed | | | (354,858 | ) | | | (487,429 | ) | | | | | | | (3,219,375 | ) | | | (4,460,159 | ) | | | | |
| | | | | |
Net decrease | | | (759,115 | ) | | | (548,958 | ) | | | | | | $ | (6,786,610 | ) | | $ | (5,041,232 | ) | | | | |
| | | | | |
| | | | | | | | | | | | | | | | | | | | | | | | |
| Advisor Class | | | | | |
Shares sold | | | 7,654,137 | | | | 11,804,628 | | | | | | | $ | 69,674,890 | | | $ | 108,076,760 | | | | | |
| | | | | |
Shares issued in reinvestment of dividends | | | 300,751 | | | | 281,205 | | | | | | | | 2,740,666 | | | | 2,569,640 | | | | | |
| | | | | |
Shares redeemed | | | (8,349,937 | ) | | | (12,956,985 | ) | | | | | | | (75,329,333 | ) | | | (118,135,647 | ) | | | | |
| | | | | |
Net decrease | | | (395,049 | ) | | | (871,152 | ) | | | | | | $ | (2,913,777 | ) | | $ | (7,489,247 | ) | | | | |
| | | | | |
NOTE F
Risks Involved in Investing in the Portfolios
Market Risk—The value of the Portfolios’ assets will fluctuate as the bond market fluctuates. The value of the Portfolios’ investments may decline, sometimes rapidly and unpredictably, simply because of economic changes or other events, including public health crises (including the occurrence of a contagious disease or illness) and regional and global conflicts, that affect large portions of the market.
Credit Risk—An issuer or guarantor of a fixed-income security, or the counterparty to a derivatives or other contract, may be unable or unwilling to make timely payments of interest or principal, or to otherwise honor its obligations. The issuer or guarantor may default, causing a loss of the full principal amount of a security and accrued interest. The degree of risk for a particular security may be reflected in its credit rating. There is the
| | |
| |
| abfunds.com | | AB MUNICIPAL INCOME FUND | 207 |
NOTES TO FINANCIAL STATEMENTS (continued)
possibility that the credit rating of a fixed-income security may be downgraded after purchase, which may adversely affect the value of the security. Investments in fixed-income securities with lower ratings tend to have a higher probability that an issuer will default or fail to meet its payment obligations.
Below Investment-Grade Securities Risk—Investments in fixed-income securities with lower ratings (commonly known as “junk bonds”) have a higher probability that an issuer will default or fail to meet its payment obligations. These securities may be subject to greater price volatility due to such factors as specific corporate developments, interest rate sensitivity and negative performance of the junk bond market generally and may be more difficult to trade than other types of securities.
Municipal Market Risk—This is the risk that special factors may adversely affect the value of municipal securities and have a significant effect on the yield or value of the Portfolios’ investments in municipal securities. These factors include economic conditions, political or legislative changes, public health crises, uncertainties related to the tax status of municipal securities, and the rights of investors in these securities. To the extent that the Portfolios invest more of their assets in a particular state’s municipal securities, the Portfolios may be vulnerable to events adversely affecting that state, including economic, political and regulatory occurrences, court decisions, terrorism, public health crises (including the occurrence of a contagious disease or illness) and catastrophic natural disasters, such as hurricanes, fires or earthquakes. The Portfolios’ investment in certain municipal securities with principal and interest payments that are made from the revenues of a specific project or facility, and not general tax revenues, may have increased risks. Factors affecting the project or facility, such as local business or economic conditions, could have a significant effect on the project’s ability to make payments of principal and interest on these securities.
In addition, changes in tax rates or the treatment of income from certain types of municipal securities, among other things, could negatively affect the municipal securities markets.
The Portfolios invest from time to time in the municipal securities of Puerto Rico and other U.S. territories and their governmental agencies and municipalities, which are exempt from federal, state, and, where applicable, local income taxes. These municipal securities may have more risks than those of other U.S. issuers of municipal securities. Puerto Rico continues to face a challenging economic and fiscal environment. If the general economic situation in Puerto Rico continues to persist or worsens, the volatility and credit quality of Puerto Rican municipal securities could continue to be adversely affected, and the market for such securities may deteriorate further.
| | |
| |
208 | AB MUNICIPAL INCOME FUND | | abfunds.com |
NOTES TO FINANCIAL STATEMENTS (continued)
Tax Risk—There is no guarantee that the income on the Portfolios’ municipal securities will be exempt from regular federal, and if applicable, state income taxes. From time to time, the U.S. Government and the U.S. Congress consider changes in federal tax law that could limit or eliminate the federal tax exemption for municipal bond income, which would in effect reduce the income received by shareholders from the Portfolios by increasing taxes on that income. In such event, the Portfolios’ NAV, could also decline as yields on municipal bonds, which are typically lower than those on taxable bonds, would be expected to increase to approximately the yield of comparable taxable bonds. Actions or anticipated actions affecting the tax exempt status of municipal bonds could also result in significant shareholder redemptions of portfolio shares as investors anticipate adverse effects on the Portfolios or seek higher yields to offset the potential loss of the tax deduction. As a result, the Portfolios would be required to maintain higher levels of cash to meet the redemptions, which would negatively affect the Portfolios’ yield.
Interest-Rate Risk—Changes in interest rates will affect the value of investments in fixed-income securities. When interest rates rise, the value of existing investments in fixed-income securities tends to fall and this decrease in value may not be offset by higher income from new investments. Interest-rate risk is generally greater for fixed-income securities with longer maturities or durations. The Portfolios may be subject to a greater risk of rising interest rates than would normally be the case due to the recent end of a period of historically low rates and the effects of potential central bank monetary policy, and government fiscal policy, initiatives and market reactions to those initiatives.
Duration Risk—Duration is a measure that relates the expected price volatility of a fixed-income security to changes in interest rates. The duration of a fixed-income security may be shorter than or equal to the full maturity of a fixed-income security. Fixed-income securities with longer durations have more risk and will decrease in price as interest rates rise.
Inflation Risk—This is the risk that the value of assets or income from investments will be less in the future as inflation decreases the value of money. As inflation increases, the value of the Portfolios’ assets can decline as can the value of the Portfolios’ distributions. This risk is significantly greater for fixed-income securities with longer maturities.
Financing and Related Transactions; Leverage and Other Risks—The Portfolios may utilize financial leverage, including tender option bond transactions, to seek to enhance the yield and net asset value. These objectives may not be achieved in all interest rate environments. Leverage creates certain risks for shareholders, including the likelihood of greater
| | |
| |
| abfunds.com | | AB MUNICIPAL INCOME FUND | 209 |
NOTES TO FINANCIAL STATEMENTS (continued)
volatility of the net asset value. If income from the securities purchased from the funds made available by leverage is not sufficient to cover the cost of leverage, the Portfolios’ return will be less than if leverage had not been used. As a result, the amounts available for distribution as dividends and other distributions will be reduced. During periods of rising short-term interest rates, the interest paid on the floaters in tender option bond transactions would increase, which may adversely affect the Portfolios’ income and distribution to shareholders. A decline in distributions would adversely affect the Portfolios’ yield. If rising short-term rates coincide with a period of rising long-term rates, the value of the long-term municipal bonds purchased with the proceeds of leverage would decline, adversely affecting the net asset value.
In a tender option bond transaction, the Portfolios may transfer a highly rated fixed-rate municipal security to a broker, which, in turn, deposits the bond into a special purpose vehicle (typically, a trust) usually sponsored by the broker. The Portfolios receive cash and a residual interest security (sometimes referred to as an “inverse floater”) issued by the trust in return. The trust simultaneously issues securities, which pay an interest rate that is reset each week based on an index of high-grade short-term seven-day demand notes. These securities, sometimes referred to as “floaters”, are bought by third parties, including tax-exempt money market funds, and can be tendered by these holders to a liquidity provider at par, unless certain events occur. The Portfolios continue to earn all the interest from the transferred bond less the amount of interest paid on the floaters and the expenses of the trust, which include payments to the trustee and the liquidity provider and organizational costs. The Portfolios also use the cash received from the transaction for investment purposes or to retire other forms of leverage. Under certain circumstances, the trust may be terminated and collapsed, either by the Portfolios or upon the occurrence of certain events, such as a downgrade in the credit quality of the underlying bond, or in the event holders of the floaters tender their securities to the liquidity provider. See Note I to the Financial Statements “Floating Rate Notes Issued in Connection with Securities Held” for more information about tender option bond transactions.
The Portfolios may also purchase inverse floaters from a tender option bond trust in a secondary market transaction without first owning the underlying bond. The income received from an inverse floater varies inversely with the short-term interest rate paid on the floaters issued by the trust. The prices of inverse floaters are subject to greater volatility than the prices of fixed-income securities that are not inverse floaters. Investments in inverse floaters may amplify the risks of leverage. If short-term interest rates rise, the interest payable on the floaters would increase and income from the inverse floaters decrease.
| | |
| |
210 | AB MUNICIPAL INCOME FUND | | abfunds.com |
NOTES TO FINANCIAL STATEMENTS (continued)
Illiquid Investments Risk—Illiquid investments risk exists when certain investments are or become difficult to purchase or sell. Difficulty in selling such investments may result in sales at disadvantageous prices affecting the value of your investment in the Portfolios. Causes of illiquid investments risk may include low trading volumes, large positions and heavy redemptions of Portfolio shares. Illiquid investments risk may be higher in a rising interest rate environment, when the value and liquidity of fixed-income securities generally decline. Municipal securities may have more illiquid investments risk than other fixed-income securities because they trade less frequently and the market for municipal securities is generally smaller than many other markets.
Derivatives Risk—Derivatives may be difficult to price or unwind and leveraged so that small changes may produce disproportionate losses for the Portfolios. A short position in a derivative instrument involves the risk of a theoretically unlimited increase in the value of the underlying asset, reference rate or index, which could cause the Portfolios to suffer a potentially unlimited loss. Derivatives, especially over-the-counter derivatives, are also subject to counterparty risk, which is the risk that the counterparty (the party on the other side of the transaction) on a derivative transaction will be unable or unwilling to honor its contractual obligations to the Portfolios.
LIBOR Replacement Risk—The Fund may be exposed to debt securities, derivatives or other financial instruments that recently transitioned from the London Interbank Offered Rate (LIBOR) as a benchmark or reference rate for various interest rate calculations. The use of LIBOR was phased out in June 2023 and transitioned to the Secured Overnight Financing Rate (SOFR). SOFR is a broad measure of the cost of borrowing cash overnight collateralized by U.S. Treasury securities in the repurchase agreement (repo) market. There can be no assurance that instruments linked to SOFR will have the same volume or liquidity as did the market for LIBOR-linked financial instruments prior to LIBOR’s discontinuance or unavailability.
Indemnification Risk—In the ordinary course of business, the Portfolios enter into contracts that contain a variety of indemnifications. The Portfolios’ maximum exposure under these arrangements is unknown. However, the Portfolios have not had prior claims or losses pursuant to these indemnification provisions and expect the risk of loss thereunder to be remote. Therefore, the Portfolios have not accrued any liability in connection with these indemnification provisions.
Management Risk—The Portfolios are subject to management risk because they are an actively-managed investment funds. The Adviser will apply its investment techniques and risk analyses in making investment
| | |
| |
| abfunds.com | | AB MUNICIPAL INCOME FUND | 211 |
NOTES TO FINANCIAL STATEMENTS (continued)
decisions, but there is no guarantee that its techniques will produce the intended results. Some of these techniques may incorporate, or rely upon, quantitative models, but there is no guarantee that these models will generate accurate forecasts, reduce risk or otherwise perform as expected.
NOTE G
Joint Credit Facility
A number of open-end mutual funds managed by the Adviser, including the Portfolios, participate in a $325 million revolving credit facility (the “Facility”) intended to provide short-term financing related to redemptions and other short term liquidity requirements, subject to certain restrictions. Commitment fees related to the Facility are paid by the participating funds and are included in miscellaneous expenses in the statement of operations. The Portfolios did not utilize the Facility during the year ended May 31, 2024.
NOTE H
Distributions to Shareholders
The tax character of distributions paid during the tax years ended November 30, 2023 and November, 30, 2022 were as follows:
| | | | | | | | |
| AB California Portfolio | | December 1,
2022 to
November 30,
2023 | | | December 1,
2021 to
November 30,
2022 | |
Distributions paid from: | | | | | | | | |
Ordinary income | | $ | 3,019,787 | | | $ | 795,296 | |
| | | | | | | | |
Total taxable distributions | | | 3,019,787 | | | | 795,296 | |
Tax exempt distributions | | | 29,604,578 | | | | 24,737,819 | |
| | | | | | | | |
Total distributions paid | | $ | 32,624,365 | | | $ | 25,533,115 | |
| | | | | | | | |
| | | | | | | | |
AB High Income Municipal Portfolio | | December 1,
2022 to
November 30,
2023 | | | December 1,
2021 to
November 30,
2022 | |
Distributions paid from: | | | | | | | | |
Ordinary income | | $ | 10,219,989 | | | $ | 8,386,933 | |
| | | | | | | | |
Total taxable distributions | | | 10,219,989 | | | | 8,386,933 | |
Tax exempt distributions | | | 112,450,430 | | | | 124,253,199 | |
| | | | | | | | |
Total distributions paid | | $ | 122,670,419 | | | $ | 132,640,132 | |
| | | | | | | | |
| | |
| |
212 | AB MUNICIPAL INCOME FUND | | abfunds.com |
NOTES TO FINANCIAL STATEMENTS (continued)
| | | | | | | | |
| AB National Portfolio | | December 1,
2022 to
November 30,
2023 | | | December 1,
2021 to
November 30,
2022 | |
Distributions paid from: | | | | | | | | |
Ordinary income | | $ | 4,166,192 | | | $ | 1,383,281 | |
| | | | | | | | |
Total taxable distributions | | | 4,166,192 | | | | 1,383,281 | |
Tax exempt distributions | | | 49,857,652 | | | | 44,616,817 | |
| | | | | | | | |
Total distributions paid | | $ | 54,023,844 | | | $ | 46,000,098 | |
| | | | | | | | |
| | | | | | | | |
| AB New York Portfolio | | December 1,
2022 to
November 30,
2023 | | | December 1,
2021 to
November 30,
2022 | |
Distributions paid from: | | | | | | | | |
Ordinary income | | $ | 1,340,951 | | | $ | 304,070 | |
| | | | | | | | |
Total taxable distributions | | | 1,340,951 | | | | 304,070 | |
Tax exempt distributions | | | 13,914,418 | | | | 14,319,973 | |
| | | | | | | | |
Total distributions paid | | $ | 15,255,369 | | | $ | 14,624,043 | |
| | | | | | | | |
As of November 30, 2023, the Portfolios’ most recent tax year end, the components of accumulated earnings (deficit) on a tax basis were as follows:
| | | | | | | | | | | | | | | | |
| Portfolio | | Undistributed Tax-Exempt Income | | | Accumulated Capital and
Other Losses(a) | | | Unrealized Appreciation (Depreciation)(b) | | | Total Accumulated Earnings (Deficit)(c) | |
AB California | | $ | 179,077 | | | $ | (13,949,207 | ) | | $ | (37,118,523 | ) | | $ | (50,888,653 | ) |
AB High Income Municipal | | | 1,012,090 | | | | (81,487,418 | ) | | | (382,681,846 | ) | | | (463,157,174 | ) |
AB National | | | 684,290 | | | | (53,082,074 | ) | | | (77,214,375 | ) | | | (129,612,159 | ) |
AB New York | | | 59,363 | | | | (24,837,162 | ) | | | (27,422,767 | ) | | | (52,200,566 | ) |
| (a) | At November 30, 2023, AB California Portfolio, AB High Income Municipal Portfolio, AB National Portfolio, and AB New York Portfolio had capital loss carryforwards for federal income tax purposes. As of November 30, 2023, AB California Portfolio, AB High Income Municipal Portfolio, AB National Portfolio, and AB New York Portfolio had net capital loss carryforwards of $13,949,207, $81,487,418, $53,082,074, and $24,837,162, respectively. |
| (b) | The differences between book-basis and tax-basis unrealized appreciation (depreciation) are attributable primarily to the tax treatment of swaps, the tax deferral of losses on wash sales, debt restructuring, and the tax treatment of tender option bonds. |
| (c) | The differences between book-basis and tax-basis components of accumulated earnings (deficit) are attributable primarily to the tax treatment of defaulted securities and dividends payable. |
For tax purposes, net realized capital losses may be carried over to offset future capital gains, if any. Funds are permitted to carry forward capital losses for an indefinite period, and such losses will retain their character as either short-term or long-term capital losses.
| | |
| |
| abfunds.com | | AB MUNICIPAL INCOME FUND | 213 |
NOTES TO FINANCIAL STATEMENTS (continued)
As of November 30, 2023, the Portfolios’ most recent tax year end, the Portfolios had net capital loss carryforwards as follows:
| | | | | | | | |
| Portfolio | | Short-Term
Amount | | | Long-Term
Amount | |
AB California | | $ | 13,949,207 | | | $ | – 0 | – |
AB High Income Municipal | | | 73,681,599 | | | | 7,805,819 | |
AB National | | | 53,082,074 | | | | – 0 | – |
AB New York | | | 24,837,162 | | | | – 0 | – |
During the current fiscal year, permanent differences primarily due to contributions from the Adviser resulted in a net decrease in accumulated loss and a net decrease in additional paid-capital. These reclassifications had no effect on net assets.
NOTE I
Floating Rate Notes Issued in Connection with Securities Held
Each Portfolio may engage in tender option bond transactions in which the Portfolio may transfer a fixed rate bond (“Fixed Rate Bond”) into a Special Purpose Vehicle (the “SPV”, which is generally organized as a trust). The Portfolio buys a residual interest in the assets and cash flows of the SPV, often referred to as an inverse floating rate obligation (“Inverse Floater”). The SPV also issues floating rate notes (“Floating Rate Notes”) which are sold to third parties. The Floating Rate Notes pay interest at rates that generally reset weekly and their holders have the option to tender their notes to a liquidity provider for redemption at par. The Inverse Floater held by the Portfolio gives the Portfolio the right (1) to cause the holders of the Floating Rate Notes to tender their notes at par, and (2) to have the trustee transfer the Fixed Rate Bond held by the SPV to the Portfolio, thereby collapsing the SPV. The SPV may also be collapsed in certain other circumstances. In accordance with U.S. GAAP requirements regarding accounting for transfers and servicing of financial assets and extinguishments of liabilities, the Portfolio accounts for the transaction described above as a secured borrowing by including the Fixed Rate Bond in its portfolio of investments and the Floating Rate Notes as a liability under the caption “Payable for floating rate notes issued” in its statement of assets and liabilities. Interest expense related to the Portfolios’ liability with respect to Floating Rate Notes is recorded as incurred. The interest expense is also included in the Portfolios’ expense ratio. At May 31, 2024, the amount of Floating Rate Notes outstanding was $186,705,000 and the related interest rate ranged from 3.39% to 4.40% for AB High Income Municipal Portfolio. At May 31, 2024, AB California Portfolio, AB National Portfolio and AB New York Portfolio did not have any Floating Rate Notes outstanding. For the year
| | |
| |
214 | AB MUNICIPAL INCOME FUND | | abfunds.com |
NOTES TO FINANCIAL STATEMENTS (continued)
ended May 31, 2024, the average amount of Floating Rate Notes outstanding and the daily weighted average interest rate were as follows:
| | | | | | | | |
| Portfolio | | Average Amount Outstanding | | | Weighted Average Interest Rate | |
AB High Income Municipal | | $ | 264,631,831 | | | | 4.25 | % |
Each Portfolio may also purchase Inverse Floaters in the secondary market without first owning the underlying bond. Such an Inverse Floater is included in the portfolio of investments but is not required to be treated as a secured borrowing and reflected in the Portfolios’ financial statements as a secured borrowing. For the year ended May 31, 2024, AB California Portfolio engaged in such transactions.
The final rules implementing section 619 of the Dodd-Frank Wall Street Reform and Consumer Protection Act (the “Volcker Rule”) were issued on December 10, 2013. The Volcker Rule precludes banking entities and their affiliates from (i) sponsoring residual interest bond programs, such as the Fund’s TOB transactions (as such programs were then previously or are presently structured), and (ii) continuing certain relationships with or certain services for residual interest bond programs.
NOTE J
Recent Accounting Pronouncements
In December 2022, the Financial Accounting Standards Board issued an Accounting Standards Update, ASU 2022-06, “Reference Rate Reform (Topic 848)—Deferral of the Sunset Date of Topic 848”. ASU 2022-06 is an amendment to ASU 2020-04, which provided optional guidance to ease the potential accounting burden due to the discontinuation of the LIBOR and other interbank-offered based reference rates and which was effective as of March 12, 2020 through December 31, 2022. ASU 2022-06 extends the effective period through December 31, 2024. Management is currently evaluating the impact, if any, of applying ASU 2022-06.
NOTE K
Subsequent Events
Management has evaluated subsequent events for possible recognition or disclosure in the financial statements through the date the financial statements are issued. Management has determined that there are no material events that would require disclosure in the Portfolios’ financial statements through this date.
| | |
| |
| abfunds.com | | AB MUNICIPAL INCOME FUND | 215 |
FINANCIAL HIGHLIGHTS
Selected Data For A Share Of Capital Stock Outstanding Throughout Each Period
| | | | | | | | | | | | | | | | | | | | |
| | | AB California Portfolio | |
| | | Class A | |
| | | Year Ended May 31, | |
| | | 2024 | | | 2023 | | | 2022 | | | 2021 | | | 2020 | |
| | | | |
Net asset value, beginning of
period | | | $ 10.31 | | | | $ 10.60 | | | | $ 11.57 | | | | $ 10.96 | | | | $ 11.21 | |
| | | | |
Income From Investment
Operations | | | | | | | | | | | | | | | | | | | | |
| | | | | |
Net investment income(a)(b) | | | .32 | | | | .30 | | | | .24 | | | | .29 | | | | .33 | |
| | | | | |
Net realized and unrealized
gain (loss) on investment
transactions | | | .07 | | | | (.27 | ) | | | (.99 | ) | | | .61 | | | | (.25 | ) |
| | | | |
Net increase (decrease) in
net asset value from
operations | | | .39 | | | | .03 | | | | (.75 | ) | | | .90 | | | | .08 | |
| | | | |
Less: Dividends | |
| | | | | |
Dividends from net
investment income | | | (.32 | ) | | | (.32 | ) | | | (.22 | ) | | | (.29 | ) | | | (.33 | ) |
| | | | |
Net asset value, end of
period | | | $ 10.38 | | | | $ 10.31 | | | | $ 10.60 | | | | $ 11.57 | | | | $ 10.96 | |
| | | | |
Total Return | | | | | | | | | | | | | | | | | | | | |
| | | | | |
Total investment return
based on net asset
value(c) | | | 3.82 | % | | | .31 | % | | | (6.57 | )% | | | 8.30 | % | | | .68 | % |
| | | | | |
Ratios/Supplemental Data | | | | | | | | | | | | | | | | | | | | |
| | | | | |
Net assets, end of period
(000’s omitted) | | | $482,717 | | | | $459,793 | | | | $481,440 | | | | $547,704 | | | | $494,992 | |
| | | | | |
Ratio to average net assets of: | | | | | | | | | | | | | | | | | | | | |
| | | | | |
Expenses, net of waivers/
reimbursements(d) | | | .75 | % | | | .75 | % | | | .75 | % | | | .75 | % | | | .75 | % |
| | | | | |
Expenses, before waivers/
reimbursements(d) | | | .77 | % | | | .78 | % | | | .76 | % | | | .77 | % | | | .78 | % |
| | | | | |
Net investment
income(a) | | | 3.14 | % | | | 2.94 | % | | | 2.09 | % | | | 2.54 | % | | | 2.96 | % |
| | | | | |
Portfolio turnover rate | | | 23 | % | | | 30 | % | | | 17 | % | | | 23 | % | | | 16 | % |
See footnote summary on pages 228-229.
| | |
| |
216 | AB MUNICIPAL INCOME FUND | | abfunds.com |
FINANCIAL HIGHLIGHTS (continued)
Selected Data For A Share Of Capital Stock Outstanding Throughout Each Period
| | | | | | | | | | | | | | | | | | | | |
| | | AB California Portfolio | |
| | | Class C | |
| | | Year Ended May 31, | |
| | | 2024 | | | 2023 | | | 2022 | | | 2021 | | | 2020 | |
| | | | |
Net asset value, beginning of
period | | | $ 10.30 | | | | $ 10.60 | | | | $ 11.56 | | | | $ 10.96 | | | | $ 11.21 | |
| | | | |
Income From Investment
Operations | | | | | | | | | | | | | | | | | | | | |
| | | | | |
Net investment income(a)(b) | | | .25 | | | | .23 | | | | .15 | | | | .20 | | | | .25 | |
| | | | | |
Net realized and unrealized
gain (loss) on investment
transactions | | | .06 | | | | (.29 | ) | | | (.97 | ) | | | .61 | | | | (.26 | ) |
| | | | |
Net increase (decrease) in
net asset value from
operations | | | .31 | | | | (.06 | ) | | | (.82 | ) | | | .81 | | | | (.01 | ) |
| | | | |
Less: Dividends | | | | | | | | | | | | | | | | | | | | |
| | | | | |
Dividends from net
investment income | | | (.24 | ) | | | (.24 | ) | | | (.14 | ) | | | (.21 | ) | | | (.24 | ) |
| | | | |
Net asset value, end of
period | | | $ 10.37 | | | | $ 10.30 | | | | $ 10.60 | | | | $ 11.56 | | | | $ 10.96 | |
| | | | |
Total Return | | | | | | | | | | | | | | | | | | | | |
| | | | | |
Total investment return
based on net asset
value(c) | | | 3.05 | % | | | (.54 | )% | | | (7.19 | )% | | | 7.40 | % | | | (.08 | )% |
| | | | | |
Ratios/Supplemental Data | | | | | | | | | | | | | | | | | | | | |
| | | | | |
Net assets, end of period
(000’s omitted) | | | $20,782 | | | | $26,359 | | | | $28,401 | | | | $41,511 | | | | $42,622 | |
| | | | | |
Ratio to average net assets of: | | | | | | | | | | | | | | | | | | | | |
| | | | | |
Expenses, net of waivers/
reimbursements(d) | | | 1.50 | % | | | 1.50 | % | | | 1.50 | % | | | 1.50 | % | | | 1.50 | % |
| | | | | |
Expenses, before waivers/
reimbursements(d) | | | 1.52 | % | | | 1.54 | % | | | 1.51 | % | | | 1.52 | % | | | 1.53 | % |
| | | | | |
Net investment
income(a) | | | 2.38 | % | | | 2.19 | % | | | 1.33 | % | | | 1.80 | % | | | 2.21 | % |
| | | | | |
Portfolio turnover rate | | | 23 | % | | | 30 | % | | | 17 | % | | | 23 | % | | | 16 | % |
See footnote summary on pages 228-229.
| | |
| |
| abfunds.com | | AB MUNICIPAL INCOME FUND | 217 |
FINANCIAL HIGHLIGHTS (continued)
Selected Data For A Share Of Capital Stock Outstanding Throughout Each Period
| | | | | | | | | | | | | | | | | | | | |
| | | AB California Portfolio | |
| | | Advisor Class | |
| | | Year Ended May 31, | |
| | | 2024 | | | 2023 | | | 2022 | | | 2021 | | | 2020 | |
| | | | |
Net asset value, beginning of
period | | | $ 10.31 | | | | $ 10.60 | | | | $ 11.57 | | | | $ 10.96 | | | | $ 11.21 | |
| | | | |
Income From Investment
Operations | | | | | | | | | | | | | | | | | | | | |
| | | | | |
Net investment income(a)(b) | | | .35 | | | | .33 | | | | .26 | | | | .32 | | | | .36 | |
| | | | | |
Net realized and unrealized
gain (loss) on investment
transactions | | | .07 | | | | (.28 | ) | | | (.98 | ) | | | .61 | | | | (.26 | ) |
| | | | |
Net increase (decrease) in
net asset value from
operations | | | .42 | | | | .05 | | | | (.72 | ) | | | .93 | | | | .10 | |
| | | | |
Less: Dividends | | | | | | | | | | | | | | | | | | | | |
| | | | | |
Dividends from net
investment income | | | (.35 | ) | | | (.34 | ) | | | (.25 | ) | | | (.32 | ) | | | (.35 | ) |
| | | | |
Net asset value, end of
period | | | $ 10.38 | | | | $ 10.31 | | | | $ 10.60 | | | | $ 11.57 | | | | $ 10.96 | |
| | | | |
Total Return | | | | | | | | | | | | | | | | | | | | |
| | | | | |
Total investment return
based on net asset
value(c) | | | 4.09 | % | | | .56 | % | | | (6.34 | )% | | | 8.57 | % | | | .93 | % |
| | | | | |
Ratios/Supplemental Data | | | | | | | | | | | | | | | | | | | | |
| | | | | |
Net assets, end of period
(000’s omitted) | | | $655,014 | | | | $507,720 | | | | $464,558 | | | | $451,056 | | | | $381,036 | |
| | | | | |
Ratio to average net assets of: | | | | | | | | | | | | | | | | | | | | |
| | | | | |
Expenses, net of waivers/
reimbursements(d) | | | .50 | % | | | .50 | % | | | .50 | % | | | .50 | % | | | .50 | % |
| | | | | |
Expenses, before waivers/
reimbursements(d) | | | .52 | % | | | .53 | % | | | .51 | % | | | .52 | % | | | .53 | % |
| | | | | |
Net investment
income(a) | | | 3.39 | % | | | 3.19 | % | | | 2.34 | % | | | 2.78 | % | | | 3.20 | % |
| | | | | |
Portfolio turnover rate | | | 23 | % | | | 30 | % | | | 17 | % | | | 23 | % | | | 16 | % |
See footnote summary on pages 228-229.
| | |
| |
218 | AB MUNICIPAL INCOME FUND | | abfunds.com |
FINANCIAL HIGHLIGHTS (continued)
Selected Data For A Share Of Capital Stock Outstanding Throughout Each Period
| | | | | | | | | | | | | | | | | | | | |
| | | AB High Income Municipal Portfolio | |
| | | Class A | |
| | | Year Ended May 31, | |
| | | 2024 | | | 2023 | | | 2022 | | | 2021 | | | 2020 | |
| | | | |
Net asset value, beginning of
period | | | $ 10.14 | | | | $ 10.96 | | | | $ 12.25 | | | | $ 10.90 | | | | $ 11.65 | |
| | | | |
Income From Investment
Operations | | | | | | | | | | | | | | | | | | | | |
| | | | | |
Net investment income(a)(b) | | | .41 | | | | .40 | | | | .37 | | | | .39 | | | | .42 | |
| | | | | |
Net realized and unrealized
gain (loss) on investment
transactions | | | (.05 | ) | | | (.81 | ) | | | (1.29 | ) | | | 1.36 | | | | (.74 | ) |
| | | | | |
Contributions from
Affiliates | | | – 0 | – | | | .00 | (e) | | | .00 | (e) | | | – 0 | – | | | – 0 | – |
| | | | |
Net increase (decrease) in
net asset value from
operations | | | .36 | | | | (.41 | ) | | | (.92 | ) | | | 1.75 | | | | (.32 | ) |
| | | | |
Less: Dividends | | | | | | | | | | | | | | | | | | | | |
| | | | | |
Dividends from net
investment income | | | (.40 | ) | | | (.41 | ) | | | (.37 | ) | | | (.40 | ) | | | (.43 | ) |
| | | | |
Net asset value, end of
period | | | $ 10.10 | | | | $ 10.14 | | | | $ 10.96 | | | | $ 12.25 | | | | $ 10.90 | |
| | | | |
Total Return | | | | | | | | | | | | | | | | | | | | |
| | | | | |
Total investment return
based on net asset
value(c) | | | 3.62 | % | | | (3.66 | )% | | | (7.68 | )% | | | 16.40 | % | | | (2.97 | )% |
| | | | | |
Ratios/Supplemental Data | | | | | | | | | | | | | | | | | | | | |
| | | | | |
Net assets, end of period
(000’s omitted) | | | $559,773 | | | | $619,769 | | | | $769,846 | | | | $899,274 | | | | $680,380 | |
| | | | | |
Ratio to average net assets of: | | | | | | | | | | | | | | | | | | | | |
| | | | | |
Expenses, net of waivers/
reimbursements(d) | | | 1.20 | % | | | 1.15 | % | | | .85 | % | | | .85 | % | | | .85 | % |
| | | | | |
Expenses, before waivers/
reimbursements(d) | | | 1.21 | % | | | 1.16 | % | | | .85 | % | | | .85 | % | | | .85 | % |
| | | | | |
Net investment
income(a) | | | 4.08 | % | | | 3.87 | % | | | 3.06 | % | | | 3.27 | % | | | 3.59 | % |
| | | | | |
Portfolio turnover rate | | | 23 | % | | | 26 | % | | | 16 | % | | | 16 | % | | | 22 | % |
See footnote summary on pages 228-229.
| | |
| |
| abfunds.com | | AB MUNICIPAL INCOME FUND | 219 |
FINANCIAL HIGHLIGHTS (continued)
Selected Data For A Share Of Capital Stock Outstanding Throughout Each Period
| | | | | | | | | | | | | | | | | | | | |
| | | AB High Income Municipal Portfolio | |
| | | Class C | |
| | | Year Ended May 31, | |
| | | 2024 | | | 2023 | | | 2022 | | | 2021 | | | 2020 | |
| | | | |
Net asset value, beginning of
period | | | $ 10.13 | | | | $ 10.95 | | | | $ 12.25 | | | | $ 10.89 | | | | $ 11.65 | |
| | | | |
Income From Investment
Operations | | | | | | | | | | | | | | | | | | | | |
| | | | | |
Net investment income(a)(b) | | | .33 | | | | .32 | | | | .28 | | | | .30 | | | | .33 | |
| | | | | |
Net realized and unrealized
gain (loss) on investment
transactions | | | (.05 | ) | | | (.80 | ) | | | (1.30 | ) | | | 1.38 | | | | (.74 | ) |
| | | | | |
Contributions from
Affiliates | | | – 0 | – | | | .00 | (e) | | | .00 | (e) | | | – 0 | – | | | – 0 | – |
| | | | |
Net increase (decrease) in
net asset value from
operations | | | .28 | | | | (.48 | ) | | | (1.02 | ) | | | 1.68 | | | | (.41 | ) |
| | | | |
Less: Dividends | | | | | | | | | | | | | | | | | | | | |
| | | | | |
Dividends from net
investment income | | | (.32 | ) | | | (.34 | ) | | | (.28 | ) | | | (.32 | ) | | | (.35 | ) |
| | | | |
Net asset value, end of
period | | | $ 10.09 | | | | $ 10.13 | | | | $ 10.95 | | | | $ 12.25 | | | | $ 10.89 | |
| | | | |
Total Return | | | | | | | | | | | | | | | | | | | | |
| | | | | |
Total investment return
based on net asset
value(c) | | | 2.84 | % | | | (4.38 | )% | | | (8.46 | )% | | | 15.53 | % | | | (3.69 | )% |
| | | | | |
Ratios/Supplemental Data | | | | | | | | | | | | | | | | | | | | |
| | | | | |
Net assets, end of period
(000’s omitted) | | | $48,159 | | | | $72,948 | | | | $113,046 | | | | $177,019 | | | | $217,533 | |
| | | | | |
Ratio to average net assets of: | | | | | | | | | | | | | | | | | | | | |
| | | | | |
Expenses, net of waivers/
reimbursements(d) | | | 1.95 | % | | | 1.90 | % | | | 1.60 | % | | | 1.60 | % | | | 1.60 | % |
| | | | | |
Expenses, before waivers/
reimbursements(d) | | | 1.96 | % | | | 1.90 | % | | | 1.60 | % | | | 1.61 | % | | | 1.60 | % |
| | | | | |
Net investment
income(a) | | | 3.32 | % | | | 3.12 | % | | | 2.30 | % | | | 2.54 | % | | | 2.85 | % |
| | | | | |
Portfolio turnover rate | | | 23 | % | | | 26 | % | | | 16 | % | | | 16 | % | | | 22 | % |
See footnote summary on pages 228-229.
| | |
| |
220 | AB MUNICIPAL INCOME FUND | | abfunds.com |
FINANCIAL HIGHLIGHTS (continued)
Selected Data For A Share Of Capital Stock Outstanding Throughout Each Period
| | | | | | | | | | | | | | | | | | | | |
| | | AB High Income Municipal Portfolio | |
| | | Advisor Class | |
| | | Year Ended May 31, | |
| | | 2024 | | | 2023 | | | 2022 | | | 2021 | | | 2020 | |
| | | | |
Net asset value, beginning of
period | | | $ 10.13 | | | | $ 10.95 | | | | $ 12.25 | | | | $ 10.89 | | | | $ 11.65 | |
| | | | |
Income From Investment
Operations | | | | | | | | | | | | | | | | | | | | |
| | | | | |
Net investment income(a)(b) | | | .43 | | | | .42 | | | | .40 | | | | .42 | | | | .45 | |
| | | | | |
Net realized and unrealized
gain (loss) on investment
transactions | | | (.05 | ) | | | (.80 | ) | | | (1.30 | ) | | | 1.37 | | | | (.75 | ) |
| | | | | |
Contributions from
Affiliates | | | – 0 | – | | | .00 | (e) | | | .00 | (e) | | | – 0 | – | | | – 0 | – |
| | | | |
Net increase (decrease) in
net asset value from
operations | | | .38 | | | | (.38 | ) | | | (.90 | ) | | | 1.79 | | | | (.30 | ) |
| | | | |
Less: Dividends | | | | | | | | | | | | | | | | | | | | |
| | | | | |
Dividends from net
investment income | | | (.42 | ) | | | (.44 | ) | | | (.40 | ) | | | (.43 | ) | | | (.46 | ) |
| | | | |
Net asset value, end of
period | | | $ 10.09 | | | | $ 10.13 | | | | $ 10.95 | | | | $ 12.25 | | | | $ 10.89 | |
| | | | |
Total Return | | | | | | | | | | | | | | | | | | | | |
| | | | | |
Total investment return
based on net asset
value(c) | | | 3.88 | % | | | (3.42 | )% | | | (7.53 | )% | | | 16.70 | % | | | (2.72 | )% |
| | | | | |
Ratios/Supplemental Data | | | | | | | | | | | | | | | | | | | | |
| | | | | |
Net assets, end of period
(000’s omitted) | | | $1,903,555 | | | | $2,269,449 | | | | $2,609,004 | | | | $2,618,340 | | | | $1,872,364 | |
| | | | |
Ratio to average net assets of: | | | | | | | | | | | | | | | | | |
| | | | | |
Expenses, net of waivers/
reimbursements(d) | | | .95 | % | | | .90 | % | | | .60 | % | | | .60 | % | | | .60 | % |
| | | | | |
Expenses, before waivers/
reimbursements(d) | | | .96 | % | | | .90 | % | | | .60 | % | | | .60 | % | | | .60 | % |
| | | | | |
Net investment
income(a) | | | 4.33 | % | | | 4.12 | % | | | 3.32 | % | | | 3.52 | % | | | 3.84 | % |
| | | | | |
Portfolio turnover rate | | | 23 | % | | | 26 | % | | | 16 | % | | | 16 | % | | | 22 | % |
See footnote summary on pages 228-229.
| | |
| |
| abfunds.com | | AB MUNICIPAL INCOME FUND | 221 |
FINANCIAL HIGHLIGHTS (continued)
Selected Data For A Share Of Capital Stock Outstanding Throughout Each Period
| | | | | | | | | | | | | | | | | | | | |
| | | AB High Income Municipal Portfolio | |
| | | Class Z | |
| | | Year Ended May 31, | |
| | | 2024 | | | 2023 | | | 2022 | | | 2021 | | | 2020 | |
| | | | |
Net asset value, beginning of
period | | | $ 10.14 | | | | $ 10.96 | | | | $ 12.26 | | | | $ 10.90 | | | | $ 11.65 | |
| | | | |
Income From Investment
Operations | | | | | | | | | | | | | | | | | | | | |
| | | | | |
Net investment income(a)(b) | | | .44 | | | | .42 | | | | .40 | | | | .42 | | | | .43 | |
| | | | | |
Net realized and unrealized
gain (loss) on investment
transactions | | | (.07 | ) | | | (.80 | ) | | | (1.30 | ) | | | 1.37 | | | | (.71 | ) |
| | | | | |
Contributions from
Affiliates | | | – 0 | – | | | .00 | (e) | | | .00 | (e) | | | – 0 | – | | | – 0 | – |
| | | | |
Net increase (decrease) in
net asset value from
operations | | | .37 | | | | (.38 | ) | | | (.90 | ) | | | 1.79 | | | | (.28 | ) |
| | | | |
Less: Dividends | | | | | | | | | | | | | | | | | | | | |
| | | | | |
Dividends from net
investment income | | | (.42 | ) | | | (.44 | ) | | | (.40 | ) | | | (.43 | ) | | | (.47 | ) |
| | | | |
Net asset value, end of
period | | | $ 10.09 | | | | $ 10.14 | | | | $ 10.96 | | | | $ 12.26 | | | | $ 10.90 | |
| | | | |
Total Return | | | | | | | | | | | | | | | | | | | | |
| | | | | |
Total investment return
based on net asset
value(c) | | | 3.78 | % | | | (3.41 | )% | | | (7.52 | )% | | | 16.69 | % | | | (2.60 | )% |
| | | | | |
Ratios/Supplemental Data | | | | | | | | | | | | | | | | | | | | |
| | | | | |
Net assets, end of period
(000’s omitted) | | | $278,653 | | | | $50,391 | | | | $1,231 | | | | $1,845 | | | | $2,085 | |
| | | | | |
Ratio to average net assets of: | | | | | | | | | | | | | | | | | | | | |
| | | | | |
Expenses, net of waivers/
reimbursements(d) | | | .95 | % | | | .90 | % | | | .59 | % | | | .59 | % | | | .60 | % |
| | | | | |
Expenses, before waivers/
reimbursements(d) | | | .95 | % | | | .91 | % | | | .59 | % | | | .59 | % | | | .61 | % |
| | | | | |
Net investment
income(a) | | | 4.38 | % | | | 4.20 | % | | | 3.32 | % | | | 3.55 | % | | | 4.11 | % |
| | | | | |
Portfolio turnover rate | | | 23 | % | | | 26 | % | | | 16 | % | | | 16 | % | | | 22 | % |
See footnote summary on pages 228-229.
| | |
| |
222 | AB MUNICIPAL INCOME FUND | | abfunds.com |
FINANCIAL HIGHLIGHTS (continued)
Selected Data For A Share Of Capital Stock Outstanding Throughout Each Period
| | | | | | | | | | | | | | | | | | | | |
| | | AB National Portfolio | |
| | | Class A | |
| | | Year Ended May 31, | |
| | | 2024 | | | 2023 | | | 2022 | | | 2021 | | | 2020 | |
| | | | |
Net asset value, beginning of
period | | | $ 9.53 | | | | $ 9.88 | | | | $ 10.77 | | | | $ 10.20 | | | | $ 10.38 | |
| | | | |
Income From Investment
Operations | | | | | | | | | | | | | | | | | | | | |
| | | | | |
Net investment income(a)(b) | | | .32 | | | | .27 | | | | .22 | | | | .23 | | | | .27 | |
| | | | | |
Net realized and unrealized
gain (loss) on investment
transactions | | | (.01 | ) | | | (.34 | ) | | | (.91 | ) | | | .58 | | | | (.19 | ) |
| | | | | |
Contributions from
Affiliates | | | .00 | (e) | | | – 0 | – | | | – 0 | – | | | – 0 | – | | | – 0 | – |
| | | | |
Net increase (decrease) in
net asset value from
operations | | | .31 | | | | (.07 | ) | | | (.69 | ) | | | .81 | | | | .08 | |
| | | | |
Less: Dividends | | | | | | | | | | | | | | | | | | | | |
| | | | | |
Dividends from net
investment income | | | (.30 | ) | | | (.28 | ) | | | (.20 | ) | | | (.24 | ) | | | (.26 | ) |
| | | | |
Net asset value, end of
period | | | $ 9.54 | | | | $ 9.53 | | | | $ 9.88 | | | | $ 10.77 | | | | $ 10.20 | |
| | | | |
Total Return | | | | | | | | | | | | | | | | | | | | |
| | | | | |
Total investment return
based on net asset
value(c) | | | 3.27 | % | | | (.70 | )% | | | (6.45 | )% | | | 8.00 | % | | | .80 | % |
| | | | | |
Ratios/Supplemental Data | | | | | | | | | | | | | | | | | | | | |
| | | | | |
Net assets, end of period
(000’s omitted) | | | $406,540 | | | | $423,812 | | | | $508,814 | | | | $590,789 | | | | $549,816 | |
| | | | | |
Ratio to average net assets of: | | | | | | | | | | | | | | | | | | | | |
| | | | | |
Expenses, net of waivers/
reimbursements(d) | | | .75 | % | | | .75 | % | | | .75 | % | | | .75 | % | | | .75 | % |
| | | | | |
Expenses, before waivers/
reimbursements(d) | | | .78 | % | | | .80 | % | | | .77 | % | | | .78 | % | | | .78 | % |
| | | | | |
Net investment
income(a) | | | 3.32 | % | | | 2.85 | % | | | 2.05 | % | | | 2.21 | % | | | 2.57 | % |
| | | | | |
Portfolio turnover rate | | | 30 | % | | | 32 | % | | | 12 | % | | | 24 | % | | | 28 | % |
See footnote summary on pages 228-229.
| | |
| |
| abfunds.com | | AB MUNICIPAL INCOME FUND | 223 |
FINANCIAL HIGHLIGHTS (continued)
Selected Data For A Share Of Capital Stock Outstanding Throughout Each Period
| | | | | | | | | | | | | | | | | | | | |
| | | AB National Portfolio | |
| | | Class C | |
| | | Year Ended May 31, | |
| | | 2024 | | | 2023 | | | 2022 | | | 2021 | | | 2020 | |
| | | | |
Net asset value, beginning of
period | | | $ 9.52 | | | | $ 9.87 | | | | $ 10.76 | | | | $ 10.19 | | | | $ 10.37 | |
| | | | |
Income From Investment
Operations | | | | | | | | | | | | | | | | | | | | |
| | | | | |
Net investment income(a)(b) | | | .24 | | | | .20 | | | | .14 | | | | .16 | | | | .19 | |
| | | | | |
Net realized and unrealized
gain (loss) on investment
transactions | | | – 0 | – | | | (.34 | ) | | | (.90 | ) | | | .57 | | | | (.18 | ) |
| | | | | |
Contributions from
Affiliates | | | .00 | (e) | | | – 0 | – | | | – 0 | – | | | – 0 | – | | | – 0 | – |
| | | | |
Net increase (decrease) in
net asset value from
operations | | | .24 | | | | (.14 | ) | | | (.76 | ) | | | .73 | | | | .01 | |
| | | | |
Less: Dividends | | | | | | | | | | | | | | | | | | | | |
| | | | | |
Dividends from net
investment income | | | (.23 | ) | | | (.21 | ) | | | (.13 | ) | | | (.16 | ) | | | (.19 | ) |
| | | | |
Net asset value, end of
period | | | $ 9.53 | | | | $ 9.52 | | | | $ 9.87 | | | | $ 10.76 | | | | $ 10.19 | |
| | | | |
Total Return | | | | | | | | | | | | | | | | | | | | |
| | | | | |
Total investment return
based on net asset
value(c) | | | 2.50 | % | | | (1.44 | )% | | | (7.16 | )% | | | 7.20 | % | | | .05 | % |
| | | | | |
Ratios/Supplemental Data | | | | | | | | | | | | | | | | | | | | |
| | | | | |
Net assets, end of period
(000’s omitted) | | | $17,782 | | | | $24,613 | | | | $32,583 | | | | $52,879 | | | | $64,573 | |
| | | | | |
Ratio to average net assets of: | | | | | | | | | | | | | | | | | | | | |
| | | | | |
Expenses, net of waivers/
reimbursements(d) | | | 1.50 | % | | | 1.50 | % | | | 1.50 | % | | | 1.50 | % | | | 1.50 | % |
| | | | | |
Expenses, before waivers/
reimbursements(d) | | | 1.54 | % | | | 1.55 | % | | | 1.52 | % | | | 1.53 | % | | | 1.54 | % |
| | | | | |
Net investment
income(a) | | | 2.56 | % | | | 2.10 | % | | | 1.30 | % | | | 1.48 | % | | | 1.82 | % |
| | | | | |
Portfolio turnover rate | | | 30 | % | | | 32 | % | | | 12 | % | | | 24 | % | | | 28 | % |
See footnote summary on pages 228-229.
| | |
| |
224 | AB MUNICIPAL INCOME FUND | | abfunds.com |
FINANCIAL HIGHLIGHTS (continued)
Selected Data For A Share Of Capital Stock Outstanding Throughout Each Period
| | | | | | | | | | | | | | | | | | | | |
| | | AB National Portfolio | |
| | | Advisor Class | |
| | | Year Ended May 31, | |
| | | 2024 | | | 2023 | | | 2022 | | | 2021 | | | 2020 | |
| | | | |
Net asset value, beginning of
period | | | $ 9.53 | | | | $ 9.88 | | | | $ 10.77 | | | | $ 10.20 | | | | $ 10.38 | |
| | | | |
Income From Investment
Operations | | | | | | | | | | | | | | | | | | | | |
| | | | | |
Net investment income(a)(b) | | | .34 | | | | .30 | | | | .24 | | | | .26 | | | | .29 | |
| | | | | |
Net realized and unrealized
gain (loss) on investment
transactions | | | (.01 | ) | | | (.35 | ) | | | (.90 | ) | | | .58 | | | | (.18 | ) |
| | | | | |
Contributions from
Affiliates | | | .00 | (e) | | | – 0 | – | | | – 0 | – | | | – 0 | – | | | – 0 | – |
| | | | |
Net increase (decrease) in
net asset value from
operations | | | .33 | | | | (.05 | ) | | | (.66 | ) | | | .84 | | | | .11 | |
| | | | |
Less: Dividends | | | | | | | | | | | | | | | | | | | | |
| | | | | |
Dividends from net
investment income | | | (.32 | ) | | | (.30 | ) | | | (.23 | ) | | | (.27 | ) | | | (.29 | ) |
| | | | |
Net asset value, end of
period | | | $ 9.54 | | | | $ 9.53 | | | | $ 9.88 | | | | $ 10.77 | | | | $ 10.20 | |
| | | | |
Total Return | | | | | | | | | | | | | | | | | | | | |
| | | | | |
Total investment return
based on net asset
value(c) | | | 3.53 | % | | | (.45 | )% | | | (6.22 | )% | | | 8.27 | % | | | 1.05 | % |
| | | | | |
Ratios/Supplemental Data | | | | | | | | | | | | | | | | | | | | |
| | | | | |
Net assets, end of period
(000’s omitted) | | | $1,424,385 | | | | $1,232,211 | | | | $1,270,573 | | | | $1,209,849 | | | | $1,001,776 | |
| | | | |
Ratio to average net assets of: | | | | | | | | | | | | | | | | | |
| | | | | |
Expenses, net of waivers/
reimbursements(d) | | | .50 | % | | | .50 | % | | | .50 | % | | | .50 | % | | | .50 | % |
| | | | | |
Expenses, before waivers/
reimbursements(d) | | | .53 | % | | | .55 | % | | | .52 | % | | | .53 | % | | | .53 | % |
| | | | | |
Net investment
income(a) | | | 3.58 | % | | | 3.10 | % | | | 2.31 | % | | | 2.45 | % | | | 2.81 | % |
| | | | | |
Portfolio turnover rate | | | 30 | % | | | 32 | % | | | 12 | % | | | 24 | % | | | 28 | % |
See footnote summary on pages 228-229.
| | |
| |
| abfunds.com | | AB MUNICIPAL INCOME FUND | 225 |
FINANCIAL HIGHLIGHTS (continued)
Selected Data For A Share Of Capital Stock Outstanding Throughout Each Period
| | | | | | | | | | | | | | | | | | | | |
| | | AB New York Portfolio | |
| | | Class A | |
| | | Year Ended May 31, | |
| | | 2024 | | | 2023 | | | 2022 | | | 2021 | | | 2020 | |
| | | | |
Net asset value, beginning of
period | | | $ 9.15 | | | | $ 9.49 | | | | $ 10.34 | | | | $ 9.70 | | | | $ 10.05 | |
| | | | |
Income From Investment
Operations | | | | | | | | | | | | | | | | | | | | |
| | | | | |
Net investment income(a)(b) | | | .28 | | | | .25 | | | | .22 | | | | .23 | | | | .26 | |
| | | | | |
Net realized and unrealized
gain (loss) on investment
transactions | | | (.01 | ) | | | (.34 | ) | | | (.86 | ) | | | .65 | | | | (.35 | ) |
| | | | | |
Contributions from
Affiliates | | | – 0 | – | | | .00 | (e) | | | – 0 | – | | | – 0 | – | | | – 0 | – |
| | | | |
Net increase (decrease) in
net asset value from
operations | | | .27 | | | | (.09 | ) | | | (.64 | ) | | | .88 | | | | (.09 | ) |
| | | | |
Less: Dividends | | | | | | | | | | | | | | | | | | | | |
| | | | | |
Dividends from net
investment income | | | (.26 | ) | | | (.25 | ) | | | (.21 | ) | | | (.24 | ) | | | (.26 | ) |
| | | | |
Net asset value, end of
period | | | $ 9.16 | | | | $ 9.15 | | | | $ 9.49 | | | | $ 10.34 | | | | $ 9.70 | |
| | | | |
Total Return | | | | | | | | | | | | | | | | | | | | |
| | | | | |
Total investment return
based on net asset
value(c) | | | 3.02 | % | | | (.86 | )% | | | (6.29 | )% | | | 9.13 | % | | | (.92 | )% |
| | | | | |
Ratios/Supplemental Data | | | | | | | | | | | | | | | | | | | | |
| | | | | |
Net assets, end of period
(000’s omitted) | | | $305,467 | | | | $341,690 | | | | $380,361 | | | | $421,752 | | | | $414,853 | |
| | | | | |
Ratio to average net assets of: | | | | | | | | | | | | | | | | | | | | |
| | | | | |
Expenses, net of waivers/
reimbursements(d) | | | .75 | % | | | .76 | % | | | .75 | % | | | .75 | % | | | .75 | % |
| | | | | |
Expenses, before waivers/
reimbursements(d) | | | .82 | % | | | .83 | % | | | .79 | % | | | .80 | % | | | .80 | % |
| | | | | |
Net investment
income(a) | | | 3.03 | % | | | 2.73 | % | | | 2.17 | % | | | 2.31 | % | | | 2.64 | % |
| | | | | |
Portfolio turnover rate | | | 35 | % | | | 14 | % | | | 16 | % | | | 22 | % | | | 23 | % |
See footnote summary on pages 228-229.
| | |
| |
226 | AB MUNICIPAL INCOME FUND | | abfunds.com |
FINANCIAL HIGHLIGHTS (continued)
Selected Data For A Share Of Capital Stock Outstanding Throughout Each Period
| | | | | | | | | | | | | | | | | | | | |
| | | AB New York Portfolio | |
| | | Class C | |
| | | Year Ended May 31, | |
| | | 2024 | | | 2023 | | | 2022 | | | 2021 | | | 2020 | |
| | | | |
Net asset value, beginning of
period | | | $ 9.15 | | | | $ 9.49 | | | | $ 10.33 | | | | $ 9.69 | | | | $ 10.04 | |
| | | | |
Income From Investment
Operations | | | | | | | | | | | | | | | | | | | | |
| | | | | |
Net investment income(a)(b) | | | .21 | | | | .18 | | | | .14 | | | | .16 | | | | .19 | |
| | | | | |
Net realized and unrealized
gain (loss) on investment
transactions | | | (.02 | ) | | | (.33 | ) | | | (.85 | ) | | | .64 | | | | (.35 | ) |
| | | | | |
Contributions from
Affiliates | | | – 0 | – | | | .00 | (e) | | | – 0 | – | | | – 0 | – | | | – 0 | – |
| | | | |
Net increase (decrease) in
net asset value from
operations | | | .19 | | | | (.15 | ) | | | (.71 | ) | | | .80 | | | | (.16 | ) |
| | | | |
Less: Dividends | | | | | | | | | | | | | | | | | | | | |
| | | | | |
Dividends from net
investment income | | | (.19 | ) | | | (.19 | ) | | | (.13 | ) | | | (.16 | ) | | | (.19 | ) |
| | | | |
Net asset value, end of
period | | | $ 9.15 | | | | $ 9.15 | | | | $ 9.49 | | | | $ 10.33 | | | | $ 9.69 | |
| | | | |
Total Return | | | | | | | | | | | | | | | | | | | | |
| | | | | |
Total investment return
based on net asset
value(c) | | | 2.13 | % | | | (1.60 | )% | | | (6.91 | )% | | | 8.33 | % | | | (1.66 | )% |
| | | | | |
Ratios/Supplemental Data | | | | | | | | | | | | | | | | | | | | |
| | | | | |
Net assets, end of period
(000’s omitted) | | | $11,270 | | | | $18,205 | | | | $24,089 | | | | $39,563 | | | | $44,221 | |
| | | | | |
Ratio to average net assets of: | | | | | | | | | | | | | | | | | | | | |
| | | | | |
Expenses, net of waivers/
reimbursements(d) | | | 1.50 | % | | | 1.51 | % | | | 1.50 | % | | | 1.50 | % | | | 1.50 | % |
| | | | | |
Expenses, before waivers/
reimbursements(d) | | | 1.57 | % | | | 1.58 | % | | | 1.54 | % | | | 1.55 | % | | | 1.55 | % |
| | | | | |
Net investment
income(a) | | | 2.26 | % | | | 1.98 | % | | | 1.41 | % | | | 1.56 | % | | | 1.89 | % |
| | | | | |
Portfolio turnover rate | | | 35 | % | | | 14 | % | | | 16 | % | | | 22 | % | | | 23 | % |
See footnote summary on pages 228-229.
| | |
| |
| abfunds.com | | AB MUNICIPAL INCOME FUND | 227 |
FINANCIAL HIGHLIGHTS (continued)
Selected Data For A Share Of Capital Stock Outstanding Throughout Each Period
| | | | | | | | | | | | | | | | | | | | |
| | | AB New York Portfolio | |
| | | Advisor Class | |
| | | Year Ended May 31, | |
| | | 2024 | | | 2023 | | | 2022 | | | 2021 | | | 2020 | |
| | | | |
Net asset value, beginning of
period | | | $ 9.15 | | | | $ 9.49 | | | | $ 10.34 | | | | $ 9.70 | | | | $ 10.05 | |
| | | | |
Income From Investment
Operations | | | | | | | | | | | | | | | | | | | | |
| | | | | |
Net investment income(a)(b) | | | .30 | | | | .27 | | | | .25 | | | | .26 | | | | .29 | |
| | | | | |
Net realized and unrealized
gain (loss) on investment
transactions | | | – 0 | – | | | (.33 | ) | | | (.87 | ) | | | .64 | | | | (.35 | ) |
| | | | | |
Contributions from
Affiliates | | | – 0 | – | | | .00 | (e) | | | – 0 | – | | | – 0 | – | | | – 0 | – |
| | | | |
Net increase (decrease) in
net asset value from
operations | | | .30 | | | | (.06 | ) | | | (.62 | ) | | | .90 | | | | (.06 | ) |
| | | | |
Less: Dividends | | | | | | | | | | | | | | | | | | | | |
| | | | | |
Dividends from net
investment income | | | (.29 | ) | | | (.28 | ) | | | (.23 | ) | | | (.26 | ) | | | (.29 | ) |
| | | | |
Net asset value, end of
period | | | $ 9.16 | | | | $ 9.15 | | | | $ 9.49 | | | | $ 10.34 | | | | $ 9.70 | |
| | | | |
Total Return | | | | | | | | | | | | | | | | | | | | |
| | | | | |
Total investment return
based on net asset
value(c) | | | 3.28 | % | | | (.61 | )% | | | (6.06 | )% | | | 9.40 | % | | | (.67 | )% |
| | | | | |
Ratios/Supplemental Data | | | | | | | | | | | | | | | | | | | | |
| | | | | |
Net assets, end of period
(000’s omitted) | | | $174,591 | | | | $178,093 | | | | $192,990 | | | | $187,212 | | | | $145,160 | |
| | | | | |
Ratio to average net assets of: | | | | | | | | | | | | | | | | | | | | |
| | | | | |
Expenses, net of waivers/
reimbursements(d) | | | .50 | % | | | .51 | % | | | .50 | % | | | .50 | % | | | .50 | % |
| | | | | |
Expenses, before waivers/
reimbursements(d) | | | .57 | % | | | .58 | % | | | .54 | % | | | .55 | % | | | .55 | % |
| | | | | |
Net investment
income(a) | | | 3.28 | % | | | 2.98 | % | | | 2.42 | % | | | 2.55 | % | | | 2.89 | % |
| | | | | |
Portfolio turnover rate | | | 35 | % | | | 14 | % | | | 16 | % | | | 22 | % | | | 23 | % |
| (a) | Net of expenses waived/reimbursed by the Adviser. |
| (b) | Based on average shares outstanding. |
| (c) | Total investment return is calculated assuming an initial investment made at the net asset value at the beginning of the period, reinvestment of all dividends and distributions at net asset value during the period, and redemption on the last day of the period. Initial sales charges or contingent deferred sales charges are not reflected in the calculation of total investment return. Total return does not reflect the deduction of taxes that a shareholder would pay on fund distributions or the redemption of fund shares. Total investment return calculated for a period of less than one year is not annualized. |
| | |
| |
228 | AB MUNICIPAL INCOME FUND | | abfunds.com |
FINANCIAL HIGHLIGHTS (continued)
Selected Data For A Share Of Capital Stock Outstanding Throughout Each Period
| (d) | The expense ratios presented below exclude interest/bank overdraft expense: |
| | | | | | | | | | | | | | | | | | | | |
| | | Year Ended May 31, | |
| | | 2024 | | | 2023 | | | 2022 | | | 2021 | | | 2020 | |
| | | | |
AB California Portfolio | |
Class A | |
Net of waivers/reimbursements | | | .75 | % | | | .75 | % | | | .75 | % | | | .75 | % | | | .75 | % |
Before waivers/reimbursements | | | .77 | % | | | .78 | % | | | .76 | % | | | .77 | % | | | .78 | % |
Class C | |
Net of waivers/reimbursements | | | 1.50 | % | | | 1.50 | % | | | 1.50 | % | | | 1.50 | % | | | 1.50 | % |
Before waivers/reimbursements | | | 1.52 | % | | | 1.54 | % | | | 1.51 | % | | | 1.52 | % | | | 1.53 | % |
Advisor Class | |
Net of waivers/reimbursements | | | .50 | % | | | .50 | % | | | .50 | % | | | .50 | % | | | .50 | % |
Before waivers/reimbursements | | | .52 | % | | | .53 | % | | | .51 | % | | | .52 | % | | | .53 | % |
| |
| | | Year Ended May 31, | |
| | | 2024 | | | 2023 | | | 2022 | | | 2021 | | | 2020 | |
| | | | |
AB High Income Municipal Portfolio | |
Class A | |
Net of waivers/reimbursements | | | .80 | % | | | .80 | % | | | .78 | % | | | .79 | % | | | .80 | % |
Before waivers/reimbursements | | | .81 | % | | | .81 | % | | | .78 | % | | | .80 | % | | | .80 | % |
Class C | |
Net of waivers/reimbursements | | | 1.55 | % | | | 1.55 | % | | | 1.53 | % | | | 1.55 | % | | | 1.55 | % |
Before waivers/reimbursements | | | 1.56 | % | | | 1.56 | % | | | 1.53 | % | | | 1.55 | % | | | 1.55 | % |
Advisor Class | |
Net of waivers/reimbursements | | | .55 | % | | | .55 | % | | | .53 | % | | | .55 | % | | | .55 | % |
Before waivers/reimbursements | | | .56 | % | | | .56 | % | | | .53 | % | | | .55 | % | | | .55 | % |
Class Z | |
Net of waivers/reimbursements | | | .55 | % | | | .55 | % | | | .52 | % | | | .53 | % | | | .55 | % |
Before waivers/reimbursements | | | .55 | % | | | .56 | % | | | .53 | % | | | .54 | % | | | .56 | % |
| |
| | | Year Ended May 31, | |
| | | 2024 | | | 2023 | | | 2022 | | | 2021 | | | 2020 | |
| | | | |
AB National Portfolio | |
Class A | |
Net of waivers/reimbursements | | | .75 | % | | | .75 | % | | | .75 | % | | | .75 | % | | | .75 | % |
Before waivers/reimbursements | | | .78 | % | | | .80 | % | | | .77 | % | | | .78 | % | | | .78 | % |
Class C | |
Net of waivers/reimbursements | | | 1.50 | % | | | 1.50 | % | | | 1.50 | % | | | 1.50 | % | | | 1.50 | % |
Before waivers/reimbursements | | | 1.54 | % | | | 1.55 | % | | | 1.52 | % | | | 1.53 | % | | | 1.54 | % |
Advisor Class | |
Net of waivers/reimbursements | | | .50 | % | | | .50 | % | | | .50 | % | | | .50 | % | | | .50 | % |
Before waivers/reimbursements | | | .53 | % | | | .55 | % | | | .52 | % | | | .53 | % | | | .53 | % |
| |
| | | Year Ended May 31, | |
| | | 2024 | | | 2023 | | | 2022 | | | 2021 | | | 2020 | |
| | | | |
AB New York Portfolio | |
Class A | |
Net of waivers/reimbursements | | | .75 | % | | | .75 | % | | | .75 | % | | | .75 | % | | | .75 | % |
Before waivers/reimbursements | | | .82 | % | | | .82 | % | | | .79 | % | | | .80 | % | | | .80 | % |
Class C | |
Net of waivers/reimbursements | | | 1.50 | % | | | 1.50 | % | | | 1.50 | % | | | 1.50 | % | | | 1.50 | % |
Before waivers/reimbursements | | | 1.57 | % | | | 1.57 | % | | | 1.54 | % | | | 1.55 | % | | | 1.55 | % |
Advisor Class | |
Net of waivers/reimbursements | | | .50 | % | | | .50 | % | | | .50 | % | | | .50 | % | | | .50 | % |
Before waivers/reimbursements | | | .57 | % | | | .57 | % | | | .54 | % | | | .55 | % | | | .55 | % |
| (e) | Amount is less than $.005. |
See notes to financial statements.
| | |
| |
| abfunds.com | | AB MUNICIPAL INCOME FUND | 229 |
REPORT OF INDEPENDENT REGISTERED
PUBLIC ACCOUNTING FIRM
To the Shareholders and the Board of Directors of
AB Municipal Income Fund, Inc.:
Opinion on the Financial Statements
We have audited the accompanying statements of assets and liabilities of AB Municipal Income Fund, Inc. (the “Fund”) (comprising the AB California Portfolio, AB High Income Municipal Portfolio, AB National Portfolio and AB New York Portfolio (collectively referred to as the “Portfolios”)), including the portfolios of investments, as of May 31, 2024, and the related statements of operations for the year then ended, the statements of changes in net assets for each of the two years in the period then ended, the financial highlights for each of the five years in the period then ended and the related notes (collectively referred to as the “financial statements”). In our opinion, the financial statements present fairly, in all material respects, the financial position of each of the Portfolios comprising AB Municipal Income Fund, Inc. at May 31, 2024, the results of their operations for the year then ended, the changes in their net assets for each of the two years in the period then ended and their financial highlights for each of the five years in the period then ended, in conformity with U.S. generally accepted accounting principles.
Basis for Opinion
These financial statements are the responsibility of the Fund’s management. Our responsibility is to express an opinion on the Portfolios’ financial statements based on our audits. We are a public accounting firm registered with the Public Company Accounting Oversight Board (United States) (“PCAOB”) and are required to be independent with respect to the Fund in accordance with the U.S. federal securities laws and the applicable rules and regulations of the Securities and Exchange Commission and the PCAOB.
We conducted our audits in accordance with the standards of the PCAOB. Those standards require that we plan and perform the audit to obtain reasonable assurance about whether the financial statements are free of material misstatement, whether due to error or fraud. The Fund is not required to have, nor were we engaged to perform, an audit of the Fund’s internal control over financial reporting. As part of our audits, we are required to obtain an understanding of internal control over financial reporting but not for the purpose of expressing an opinion on the effectiveness of the Fund’s internal control over financial reporting. Accordingly, we express no such opinion.
Our audits included performing procedures to assess the risks of material misstatement of the financial statements, whether due to error or fraud,
| | |
| |
230 | AB MUNICIPAL INCOME FUND | | abfunds.com |
REPORT OF INDEPENDENT REGISTERED
PUBLIC ACCOUNTING FIRM (continued)
and performing procedures that respond to those risks. Such procedures included examining, on a test basis, evidence regarding the amounts and disclosures in the financial statements. Our procedures included confirmation of securities owned as of May 31, 2024, by correspondence with the custodian, brokers and others; when replies were not received from brokers or others, we performed other auditing procedures. Our audits also included evaluating the accounting principles used and significant estimates made by management, as well as evaluating the overall presentation of the financial statements. We believe that our audits provide a reasonable basis for our opinion.

We have served as the auditor of one or more of the AB investment companies since 1968.
New York, New York
July 29, 2024
| | |
| |
| abfunds.com | | AB MUNICIPAL INCOME FUND | 231 |
Information Regarding the Review and Approval of the Advisory Agreement in Respect of Each Fund
The disinterested directors (the “directors”) of AB Municipal Income Fund, Inc. (the “Company”) unanimously approved the continuance of the Company’s Advisory Agreement with the Adviser in respect of each of the portfolios listed below (each, a “Fund” and collectively, the “Funds”) at a meeting held in-person on August 1-2, 2023 (the “Meeting”):
| | • | | AB California Portfolio |
| | • | | AB High Income Municipal Portfolio |
Prior to approval of the continuance of the Advisory Agreement in respect of each Fund, the directors had requested from the Adviser, and received and evaluated, extensive materials. They reviewed the proposed continuance of the Advisory Agreement with the Adviser and with experienced counsel who are independent of the Adviser, who advised on the relevant legal standards. The directors also reviewed additional materials, including comparative analytical data prepared by the Senior Vice President of each Fund. The directors also discussed the proposed continuances in private sessions with counsel.
The directors considered their knowledge of the nature and quality of the services provided by the Adviser to the Funds gained from their experience as directors or trustees of most of the registered investment companies advised by the Adviser, their overall confidence in the Adviser’s integrity and competence they have gained from that experience, the Adviser’s initiative in identifying and raising potential issues with the directors and its responsiveness, frankness and attention to concerns raised by the directors in the past, including the Adviser’s willingness to consider and implement organizational and operational changes designed to improve investment results and the services provided to the AB Funds. The directors noted that they have four regular meetings each year, at each of which they review extensive materials and information from the Adviser, including information on the investment performance of the Funds and the money market fund advised by the Adviser in which the Funds invest a portion of their assets.
The directors also considered all factors they believed relevant, including the specific matters discussed below. During the course of their deliberations, the directors evaluated, among other things, the reasonableness of the advisory fee in respect of each Fund. The directors did not identify any particular information that was all-important or controlling, and different directors may have attributed different weights to the various factors. The directors determined that the selection of the Adviser to manage each Fund and the overall arrangements between each Fund and the Adviser,
| | |
| |
232 | AB MUNICIPAL INCOME FUND | | abfunds.com |
as provided in the Advisory Agreement, including the advisory fee, were fair and reasonable in light of the services performed, expenses incurred and such other matters as the directors considered relevant in the exercise of their business judgment. The material factors and conclusions that formed the basis for the directors’ determinations included the following:
Nature, Extent and Quality of Services Provided
The directors considered the scope and quality of services provided by the Adviser under the Advisory Agreement, including the quality of the investment research capabilities of the Adviser and the other resources it has dedicated to performing services for each Fund. The directors noted that the Adviser from time to time reviews each Fund’s investment strategies and from time to time proposes changes intended to improve a Fund’s relative or absolute performance for the directors’ consideration. They also noted the professional experience and qualifications of each Fund’s portfolio management team and other senior personnel of the Adviser. The directors also considered that the Advisory Agreement provides that each Fund will reimburse the Adviser for the cost to it of providing certain clerical, accounting, administrative and other services to such Fund by employees of the Adviser or its affiliates. Requests for these reimbursements are made on a quarterly basis and subject to approval by the directors. Reimbursements, to the extent requested and paid in respect of a Fund, result in a higher rate of total compensation from such Fund to the Adviser than the fee rate stated in the Advisory Agreement. The directors noted that the methodology used to determine the reimbursement amounts had been reviewed by an independent consultant at the request of the directors. The quality of administrative and other services, including the Adviser’s role in coordinating the activities of each Fund’s other service providers, also was considered. The directors concluded that, overall, they were satisfied with the nature, extent and quality of services provided to each of the Funds under the Advisory Agreement.
Costs of Services Provided and Profitability
The directors reviewed a schedule of the revenues and expenses and related notes indicating the profitability of each Fund to the Adviser for calendar years 2021 and 2022 that had been prepared with an expense allocation methodology arrived at in consultation with an independent consultant at the request of the directors. The directors noted the assumptions and methods of allocation used by the Adviser in preparing fund-specific profitability data and understood that there are a number of potentially acceptable allocation methodologies for information of this type. The directors noted that the profitability information reflected all revenues and expenses of the Adviser’s relationships with the Funds, including those relating to its subsidiaries that provide transfer agency and distribution services to the Funds. The directors recognized that it is difficult to make comparisons of the profitability of the Advisory Agreement with the profitability of fund advisory contracts for unaffiliated funds because
| | |
| |
| abfunds.com | | AB MUNICIPAL INCOME FUND | 233 |
comparative information is not generally publicly available and is affected by numerous factors. The directors focused on the profitability of the Adviser’s relationships with the Funds before taxes and distribution expenses. The directors concluded that the Adviser’s level of profitability from its relationship with each Fund was not unreasonable.
Fall-Out Benefits
The directors considered the other benefits to the Adviser and its affiliates from their relationships with the Funds and the money market fund advised by the Adviser in which the Funds invest, including, but not limited to, benefits relating to 12b-1 fees and sales charges received by the Funds’ principal underwriter (which is a wholly owned subsidiary of the Adviser) in respect of certain classes of the Funds’ shares; and transfer agency fees paid by the Funds to a wholly owned subsidiary of the Adviser. The directors recognized that the Adviser’s profitability would be somewhat lower without these benefits. The directors understood that the Adviser also might derive reputational and other benefits from its association with the Funds.
Investment Results
In addition to the information reviewed by the directors in connection with the Meeting, the directors receive detailed performance information for each Fund at each regular Board meeting during the year.
At the Meeting, the directors reviewed performance information prepared by an independent service provider (the “15(c) service provider”), showing the performance of the Advisor Class shares of each Fund against a group of similar funds (“peer group”) and a larger group of similar funds (“peer universe”), each selected by the 15(c) service provider, and information prepared by the Adviser showing performance of the Advisor Class shares against a broad-based securities market index, in each case for the 1-, 3-, 5- and 10-year periods ended May 31, 2023 and (in the case of comparisons with the broad-based securities market index) for the period from inception. Based on their review, and after discussing with the Adviser the reasons for the relative underperformance of AB National Portfolio and AB New York Portfolio in the most recent period, the directors concluded that each Fund’s investment performance was acceptable.
Advisory Fees and Other Expenses
The directors considered the advisory fee rate payable by each Fund to the Adviser and information prepared by the 15(c) service provider concerning advisory fee rates payable by other funds in the same category as such Fund. The directors recognized that it is difficult to make comparisons of advisory fees because there are variations in the services that are included in the fees payable by other funds. The directors compared each Fund’s contractual effective advisory fee rate with a peer group median and discussed with the Adviser the reasons it was above the median in the
| | |
| |
234 | AB MUNICIPAL INCOME FUND | | abfunds.com |
case of each of AB California Portfolio and AB National Portfolio. The directors noted that in the case of AB High Income Municipal Portfolio, it was equal to the median, and in the case of AB New York Portfolio, it was lower than the median. The directors also noted the Adviser’s total rate of compensation for each Fund, taking into account the impact of the administrative expense reimbursement paid to the Adviser in the latest fiscal year.
The Adviser informed the directors that there were no institutional products managed by the Adviser that utilize investment strategies similar to those of any of the Funds. In the case of each of AB California Portfolio, AB National Portfolio and AB New York Portfolio, the directors compared each Fund’s advisory fee rate with that for another fund advised by the Adviser utilizing similar investment strategies.
In connection with their review of each Fund’s advisory fee, the directors also considered the total expense ratio of the Advisor Class shares of each Fund in comparison to the medians for a peer group and a peer universe selected by the 15(c) service provider. The expense ratio of each Fund was based on the Fund’s latest fiscal year and reflected the impact of the Adviser’s expense cap for the Fund in the case of each of AB California Portfolio, AB National Portfolio and AB New York Portfolio. The directors noted that AB High Income Municipal Portfolio’s expense ratio was currently below the level of the Adviser’s cap. The directors noted that it was likely that the expense ratios of some of the other funds in each Fund’s category were lowered by waivers or reimbursements by those funds’ investment advisers, which in some cases might be voluntary or temporary. The directors view expense ratio information as relevant to their evaluation of the Adviser’s services because the Adviser is responsible for coordinating services provided to the Funds by others. Based on their review, the directors concluded the expense ratio for each of AB High Income Municipal Portfolio and AB New York Portfolio was acceptable. The directors noted that the expense ratio for each of AB California Portfolio and National Portfolio was above the medians. After reviewing and discussing the Adviser’s explanations of the reasons for this, the directors concluded that each Fund’s expense ratio was acceptable.
Economies of Scale
The directors noted that the advisory fee schedule for the Funds contains breakpoints that reduce the fee rates on assets above specified levels, and that the net assets of AB High Income Municipal Portfolio were higher than a breakpoint level. Accordingly, the Fund’s current effective advisory fee rate reflected a reduction due to the breakpoint and would be further reduced to the extent the net assets of the Fund increase. The directors took into consideration prior presentations by an independent consultant on economies of scale in the mutual fund industry and for the AB Funds, and presentations from time to time by the Adviser concerning certain of
| | |
| |
| abfunds.com | | AB MUNICIPAL INCOME FUND | 235 |
its views on economies of scale. The directors also had requested and received from the Adviser certain updates on economies of scale in advance of the Meeting. The directors believe that economies of scale may be realized (if at all) by the Adviser across a variety of products and services, and not only in respect of a single fund. The directors noted that there is no established methodology for setting breakpoints that give effect to the fund-specific services provided by a fund’s adviser and to the economies of scale that an adviser may realize in its overall mutual fund business or those components of it which directly or indirectly affect a fund’s operations. The directors observed that in the mutual fund industry as a whole, as well as among funds similar to the Funds, there is no uniformity or pattern in the fees and asset levels at which breakpoints (if any) apply. The directors also noted that the advisory agreements for many funds do not have breakpoints at all. Having taken these factors into account, the directors concluded that in the case of AB High Income Municipal Portfolio, the Fund’s breakpoint arrangements were acceptable and provide a means for sharing any economies of scale, and, in the case of the other Funds, such Funds’ shareholders would benefit from a sharing of economies of scale in the event a Fund’s net assets exceed a breakpoint in the future.
| | |
| |
236 | AB MUNICIPAL INCOME FUND | | abfunds.com |
AB MUNICIPAL INCOME FUND
1345 Avenue of the Americas
New York, NY 10105
800 221 5672
MI-0151-0524 
ITEM 8. CHANGES IN AND DISAGREEMENTS WITH ACCOUNTANTS FOR OPEN-END MANAGEMENT INVESTMENT COMPANIES.
There were no disagreements with accountants during the reporting period.
ITEM 9. PROXY DISCLOSURES FOR OPEN-END MANAGEMENT INVESTMENT COMPANIES
There were no shareholder meetings during the reporting period.
ITEM 10. REMUNERATION PAID TO DIRECTORS, OFFICERS, AND OTHERS OF OPEN-END MANAGEMENT INVESTMENT COMPANIES.
Aggregate remuneration paid to all Directors and advisory board members are included within the Financial Statements under Item 7 of this Form N-CSR.
ITEM 11. STATEMENT REGARDING BASIS FOR APPROVAL OF INVESTMENT ADVISORY CONTRACT.
Statement regarding basis for Approval of Investment Advisory Contract included within the Financial Statements under Item 7 of this Form N-CSR.
ITEM 12. DISCLOSURE OF PROXY VOTING POLICIES AND PROCEDURES FOR CLOSED-END MANAGEMENT INVESTMENT COMPANIES.
Not applicable to the registrant.
ITEM 13. PORTFOLIO MANAGERS OF CLOSED END MANAGEMENT INVESTMENT COMPANIES.
Not applicable to the registrant.
ITEM 14. PURCHASES OF EQUITY SECURITIES BY CLOSED-END MANAGEMENT INVESTMENT COMPANY OF AND AFFILIATED PURCHASERS.
Not applicable to the registrant.
ITEM 15. SUBMISSION OF MATTERS TO A VOTE OF SECURITY HOLDERS.
There have been no material changes to the procedures by which shareholders may recommend nominees to the Fund’s Board of Directors since the Fund last provided disclosure in response to this item.
ITEM 16. CONTROLS AND PROCEDURES.
(a) The registrant’s principal executive officer and principal financial officer have concluded that the registrant’s disclosure controls and procedures (as defined in Rule 30a-2(c) under the Investment Company Act of 1940, as amended) are effective at the reasonable assurance level based on their evaluation of these controls and procedures as of a date within 90 days of the filing date of this document.
(b) There were no changes in the registrant’s internal controls over financial reporting that occurred during the period covered by this report that has materially affected, or is reasonably likely to materially affect, the registrant’s internal control over financial reporting.
ITEM 17. DISCLOSURE OF SECURITIES LENDING ACTIVITIES FOR CLOSED-END MANAGEMENT INVESTMENT COMPANIES.
Not applicable to the registrant.
ITEM 18. RECOVERY OF ERRONEOUSLY AWARDED COMPENSATION.
Not applicable to the registrant
ITEM 19. EXHIBITS.
The following exhibits are attached to this Form N-CSR:
SIGNATURES
Pursuant to the requirements of the Securities Exchange Act of 1934 and the Investment Company Act of 1940, the registrant has duly caused this report to be signed on its behalf by the undersigned, thereunto duly authorized.
| | |
| (Registrant): AB Municipal Income Fund, Inc. |
| |
| By: | | /s/ Onur Erzan |
| | Onur Erzan |
| | President |
| |
| Date: | | July 30, 2024 |
Pursuant to the requirements of the Securities Exchange Act of 1934 and the Investment Company Act of 1940, this report has been signed below by the following persons on behalf of the registrant and in the capacities and on the dates indicated.
| | |
| By: | | /s/ Onur Erzan |
| | Onur Erzan |
| | President |
| |
| Date: | | July 30, 2024 |
| |
| By: | | /s/ Stephen M. Woetzel |
| | Stephen M. Woetzel |
| | Treasurer and Chief Financial Officer |
| |
| Date: | | July 30, 2024 |