First Citizens BancShares, Inc. Third Quarter 2022 Earnings Conference Call October 27, 2022

2 Agenda Page(s) Section I – Third Quarter 2022 Overview 4 – 6 Section II – Third Quarter 2022 Financial Results 7 – 27 Financial Highlights 8 Earnings Highlights 9 – 10 Notable Items 11 Net interest income and margin 12 – 14 Deposit Betas 15 Noninterest income and expense 16 – 18 Balance Sheet Highlights 19 Loans and Leases HFI 20 – 21 Deposits and Funding Mix 22 – 24 ACL and Credit Quality Trends 25 – 26 Capital 27 Section III – Financial Outlook 28 – 29 Key Earnings Estimate Assumptions 29 Section IV – Appendix 30 – 45 Section V – Non-GAAP Reconciliations 46 – 56
3 Important Notices Forward Looking Statements This communication contains “forward-looking statements” within the meaning of the Private Securities Litigation Reform Act of 1995 regarding the financial condition, results of operations, business plans and future performance of First Citizens BancShares, Inc. ("BancShares"). Words such as “anticipates,” “believes,” “estimates,” “expects,” “predicts,” “forecasts,” “intends,” “plans,” “projects,” “targets,” “designed,” “could,” “may,” “should,” “will,” “potential,” “continue”, “aims” or other similar words and expressions are intended to identify these forward-looking statements. These forward-looking statements are based on BancShares’ current expectations and assumptions regarding BancShares’ business, the economy, and other future conditions. Because forward-looking statements relate to future results and occurrences, they are subject to inherent risks, uncertainties, changes in circumstances and other risk factors that are difficult to predict. Many possible events or factors could affect BancShares’ future financial results and performance and could cause the actual results, performance or achievements of BancShares to differ materially from any anticipated results expressed or implied by such forward-looking statements. Such risks and uncertainties include, among others, general competitive, economic, political, geopolitical events (including the military conflict between Russia and Ukraine) and market conditions, the impacts of the global COVID-19 pandemic on BancShares’ business and customers, the financial success or changing conditions or strategies of BancShares’ customers or vendors, fluctuations in interest rates, actions of government regulators, including the recent and projected interest rate hikes by the Board of Governors of the Federal Reserve Board (the “Federal Reserve”), the potential impact of decisions by the Federal Reserve on BancShares’ capital plans, adverse developments with respect to U.S. or global economic conditions, including the significant turbulence in the capital or financial markets, the impact of the current inflationary environment, the impact of implementation and compliance with current or proposed laws, regulations and regulatory interpretations, the availability of capital and personnel, and the failure to realize the anticipated benefits of BancShares’ previous acquisition transaction(s), including the recently completed transaction with CIT Group Inc. (“CIT”), which acquisition risks include (1) disruption from the transaction, or recently completed mergers, with customer, supplier or employee relationships, (2) the possibility that the amount of the costs, fees, expenses and charges related to the transaction may be greater than anticipated, including as a result of unexpected or unknown factors, events or liabilities, (3) reputational risk and the reaction of the parties’ customers to the transaction, (4) the risk that the cost savings and any revenue synergies from the transaction may not be realized or take longer than anticipated to be realized, and (5) difficulties experienced in the integration of the businesses. Except to the extent required by applicable laws or regulations, BancShares disclaims any obligation to update forward-looking statements or to publicly announce the results of any revisions to any of the forward-looking statements included herein to reflect future events or developments. Additional factors which could affect the forward- looking statements can be found in BancShares’ Annual Report on Form 10-K for the fiscal year ended December 31, 2021, and its other filings with the Securities and Exchange Commission (the “SEC”). Non-GAAP Measures Certain measures in this presentation are "Non-GAAP,“ meaning they are not presented in accordance with generally accepted accounting principles in the U.S. and also are not codified in U.S. banking regulations currently applicable to BancShares. BancShares believes that Non-GAAP financial measures, when reviewed in conjunction with GAAP financial information, can provide transparency about or an alternative means of assessing its operating results and financial position to its investors, analysts and management. Refer to Section V of this presentation for a reconciliation of Non-GAAP measures to the most directly comparable GAAP measure. BancShares completed the acquisition of CIT on January 3, 2022 (the “CIT Merger”). BancShares’ financial information presented for the periods ended March 31, 2022, June 30, 2022 and September 30, 2022 reflects the acquisition of CIT. Certain 2021 financial information referenced as “Combined” in this presentation reflects the combination of BancShares and CIT for historical periods prior to completion of the CIT Merger. Certain financial results referenced as “Adjusted” in this presentation exclude notable items. The Combined and Adjusted financial measures are Non-GAAP. Refer to Section V of this presentation for a reconciliation of the Combined (Non- GAAP) to BancShares (GAAP) measures.
Third Quarter 2022 Overview Section I
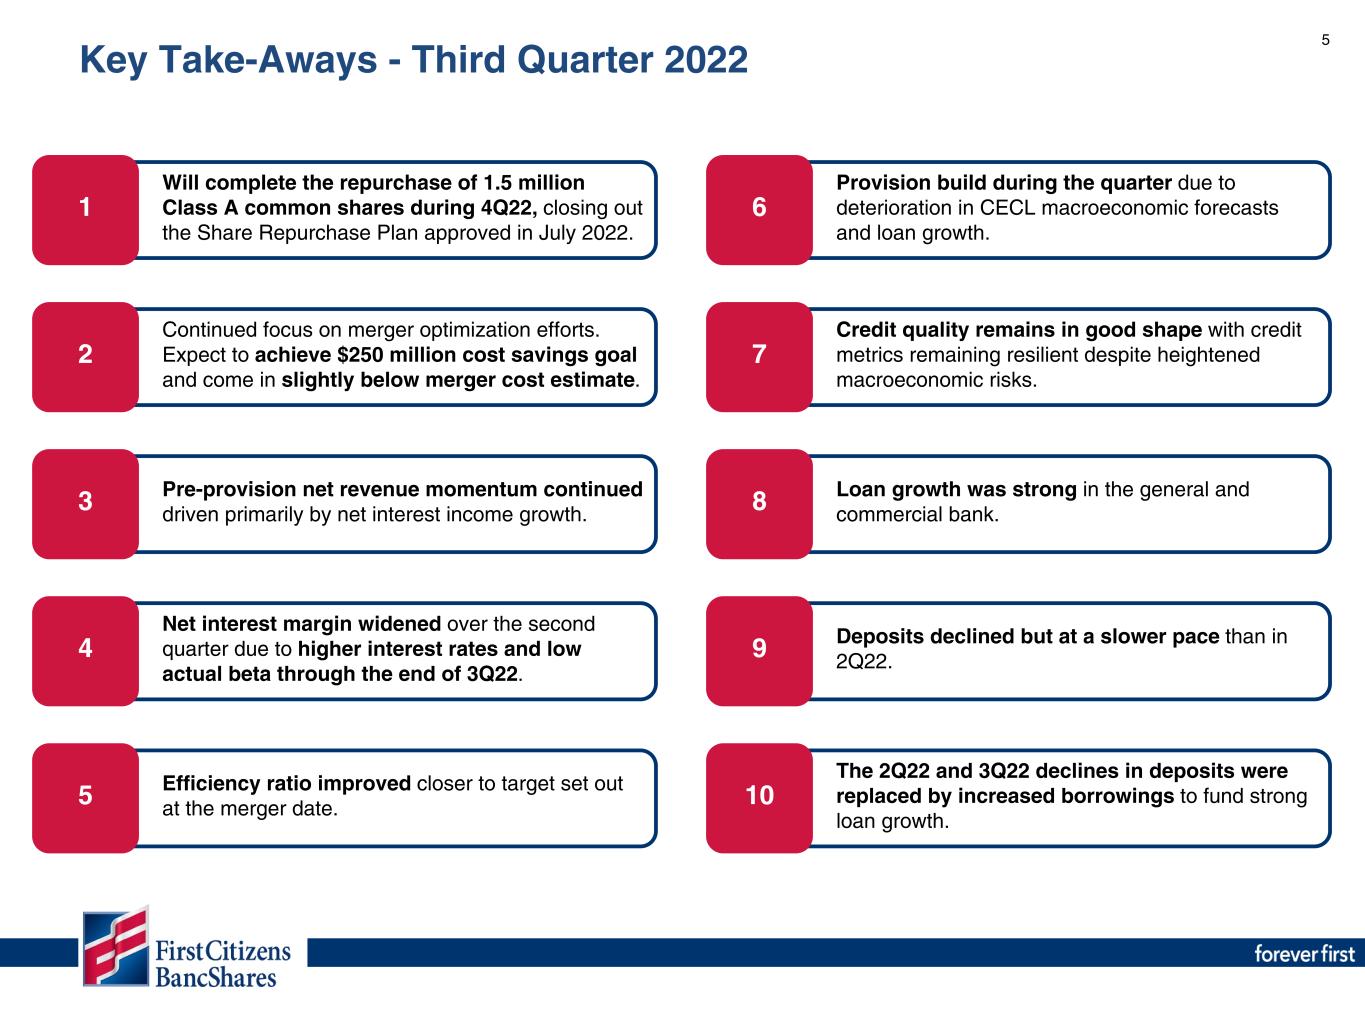
5 Will complete the repurchase of 1.5 million Class A common shares during 4Q22, closing out the Share Repurchase Plan approved in July 2022. Continued focus on merger optimization efforts. Expect to achieve $250 million cost savings goal and come in slightly below merger cost estimate. 2 Provision build during the quarter due to deterioration in CECL macroeconomic forecasts and loan growth. Credit quality remains in good shape with credit metrics remaining resilient despite heightened macroeconomic risks. 1 6 7 Efficiency ratio improved closer to target set out at the merger date.5 Pre-provision net revenue momentum continued driven primarily by net interest income growth. 3 Net interest margin widened over the second quarter due to higher interest rates and low actual beta through the end of 3Q22. 4 Loan growth was strong in the general and commercial bank.8 Key Take-Aways - Third Quarter 2022 Deposits declined but at a slower pace than in 2Q22.9 The 2Q22 and 3Q22 declines in deposits were replaced by increased borrowings to fund strong loan growth. 10

6 Share Repurchase Plan Update Announced the plan to repurchase 1.5 million shares in July 2022. ◦ FCB has repurchased 9.85% of Class A common shares and 9.23% of total common shares as of October 25, 2022. ◦ CET1 ratio down 98 bps since the prior quarter, primarily due to the share repurchase and RWA growth, only partially offset by earnings (11.35% at 2Q22 to 10.37% at 3Q22). ◦ The estimated total cost of repurchases is $1.2 billion, and the TBV earn back period is approximately 3 years. ◦ Repurchase estimated to be approximately 10% accretive to EPS in 2023. Highlights We have completed 98.5% of the Repurchase Plan as of October 25, 2022. Repurchase Summary (through 10/25/22) Month Shares Average Price Total Cost (in millions) August 2022 487,284 $ 820.11 $ 399.6 September 2022 540,130 819.53 442.7 October 2022 450,217 842.32 379.3 Total 1,477,631 $ 826.66 $ 1,221.6 1,500,000 (1,027,414) (450,217) Authorized Repurchased 3Q22 Repurchased 4Q22
Third Quarter 2022 Financial Results Section II
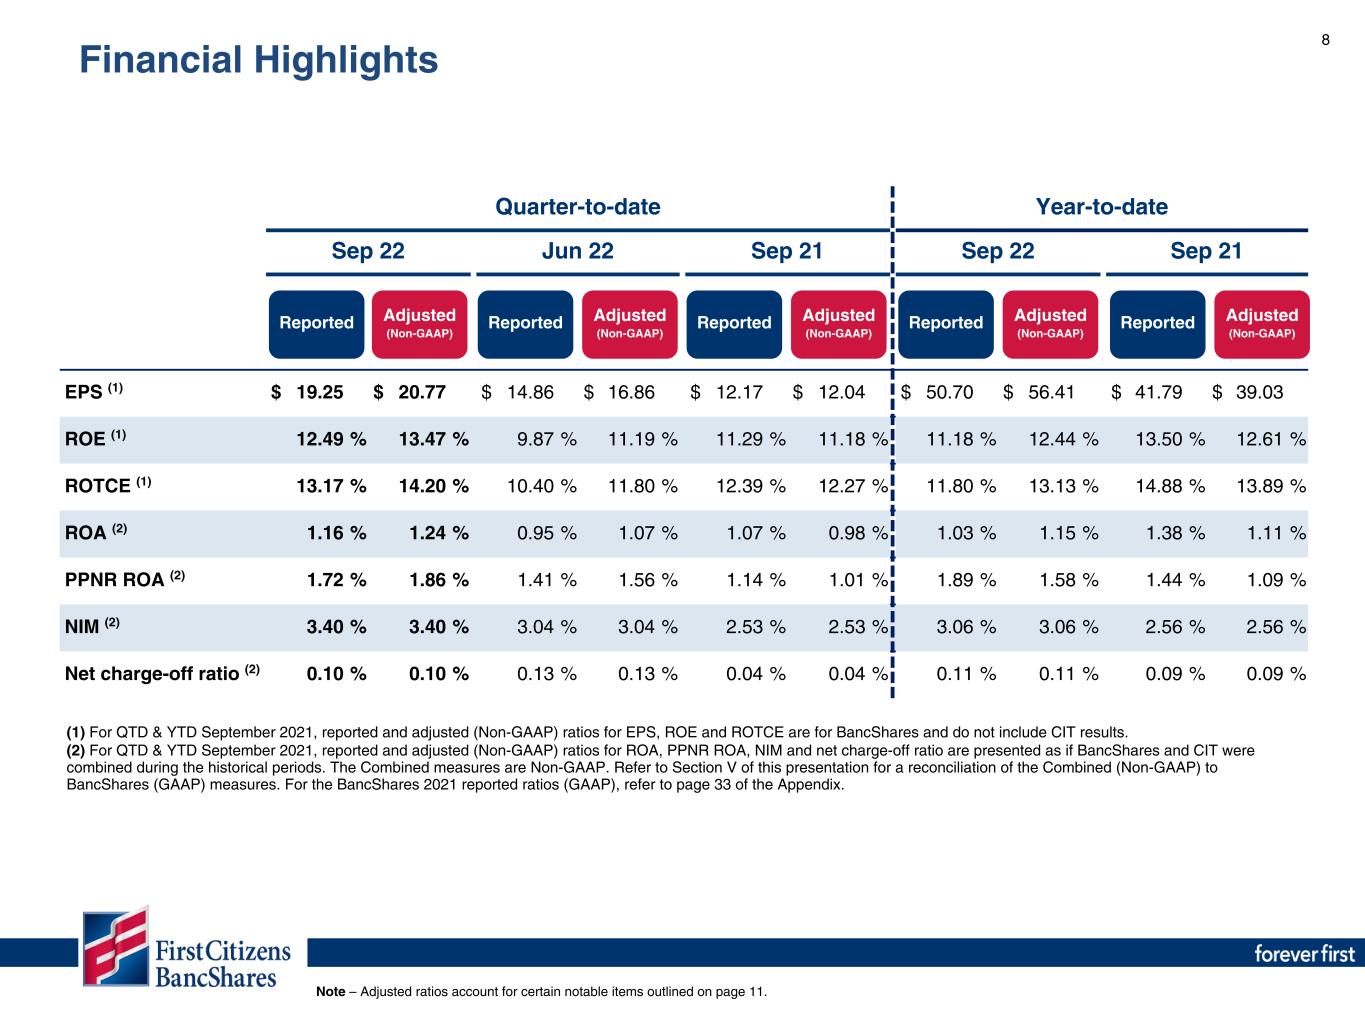
8 (1) For QTD & YTD September 2021, reported and adjusted (Non-GAAP) ratios for EPS, ROE and ROTCE are for BancShares and do not include CIT results. (2) For QTD & YTD September 2021, reported and adjusted (Non-GAAP) ratios for ROA, PPNR ROA, NIM and net charge-off ratio are presented as if BancShares and CIT were combined during the historical periods. The Combined measures are Non-GAAP. Refer to Section V of this presentation for a reconciliation of the Combined (Non-GAAP) to BancShares (GAAP) measures. For the BancShares 2021 reported ratios (GAAP), refer to page 33 of the Appendix. Quarter-to-date Year-to-date Sep 22 Jun 22 Sep 21 Sep 22 Sep 21 EPS (1) $ 19.25 $ 20.77 $ 14.86 $ 16.86 $ 12.17 $ 12.04 $ 50.70 $ 56.41 $ 41.79 $ 39.03 ROE (1) 12.49 % 13.47 % 9.87 % 11.19 % 11.29 % 11.18 % 11.18 % 12.44 % 13.50 % 12.61 % ROTCE (1) 13.17 % 14.20 % 10.40 % 11.80 % 12.39 % 12.27 % 11.80 % 13.13 % 14.88 % 13.89 % ROA (2) 1.16 % 1.24 % 0.95 % 1.07 % 1.07 % 0.98 % 1.03 % 1.15 % 1.38 % 1.11 % PPNR ROA (2) 1.72 % 1.86 % 1.41 % 1.56 % 1.14 % 1.01 % 1.89 % 1.58 % 1.44 % 1.09 % NIM (2) 3.40 % 3.40 % 3.04 % 3.04 % 2.53 % 2.53 % 3.06 % 3.06 % 2.56 % 2.56 % Net charge-off ratio (2) 0.10 % 0.10 % 0.13 % 0.13 % 0.04 % 0.04 % 0.11 % 0.11 % 0.09 % 0.09 % Reported Adjusted (Non-GAAP) Reported Adjusted (Non-GAAP) Reported Adjusted (Non-GAAP) Reported Adjusted (Non-GAAP) Reported Adjusted (Non-GAAP) Note – Adjusted ratios account for certain notable items outlined on page 11. Financial Highlights
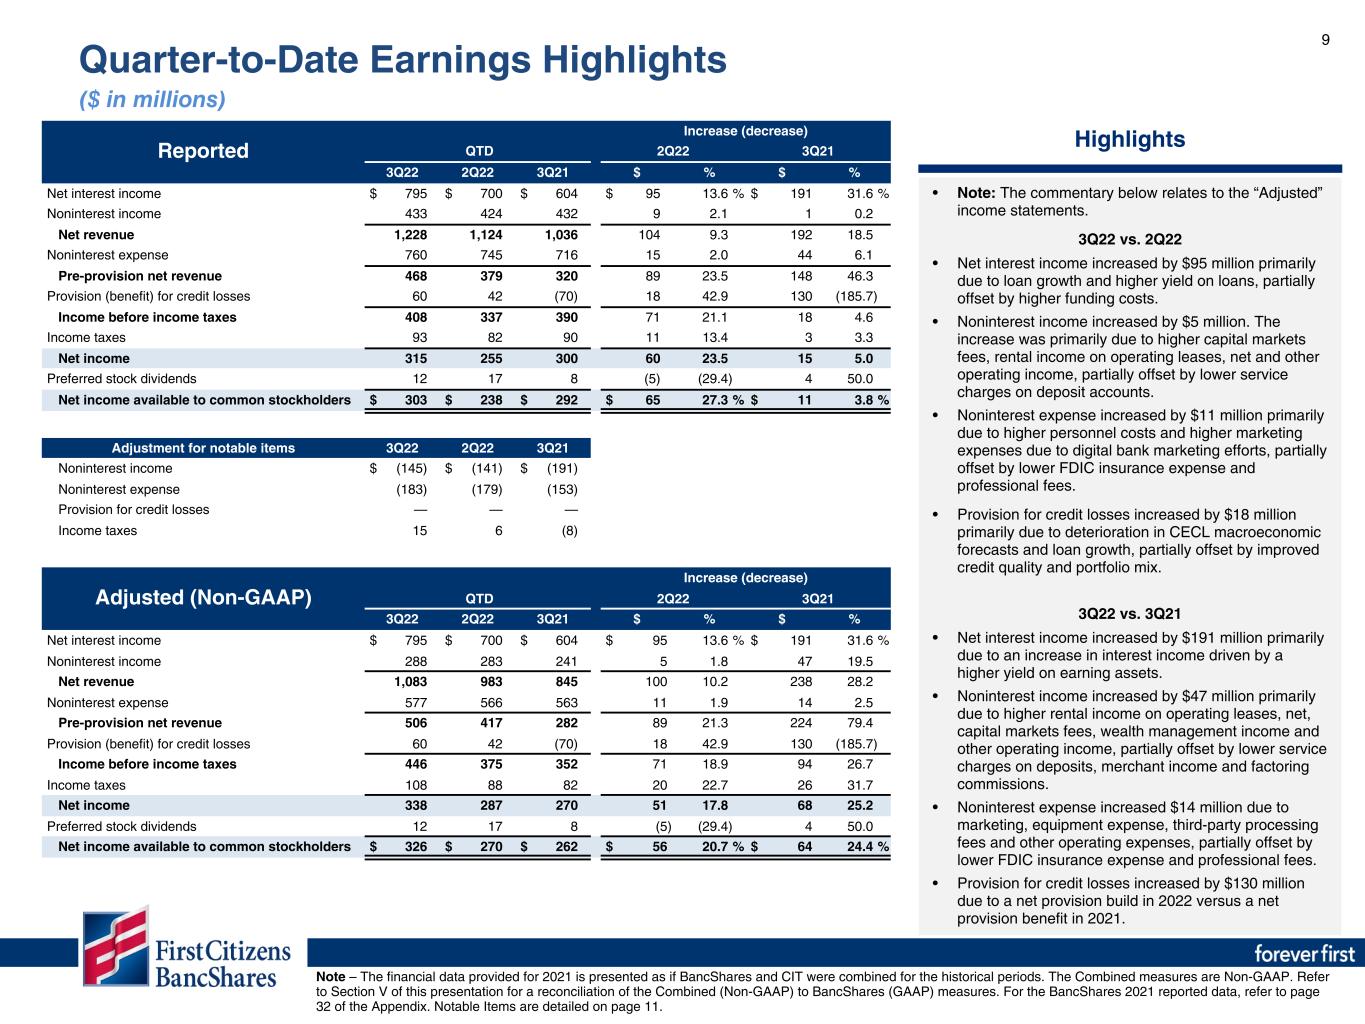
9 Reported Increase (decrease) QTD 2Q22 3Q21 3Q22 2Q22 3Q21 $ % $ % Net interest income $ 795 $ 700 $ 604 $ 95 13.6 % $ 191 31.6 % Noninterest income 433 424 432 9 2.1 1 0.2 Net revenue 1,228 1,124 1,036 104 9.3 192 18.5 Noninterest expense 760 745 716 15 2.0 44 6.1 Pre-provision net revenue 468 379 320 89 23.5 148 46.3 Provision (benefit) for credit losses 60 42 (70) 18 42.9 130 (185.7) Income before income taxes 408 337 390 71 21.1 18 4.6 Income taxes 93 82 90 11 13.4 3 3.3 Net income 315 255 300 60 23.5 15 5.0 Preferred stock dividends 12 17 8 (5) (29.4) 4 50.0 Net income available to common stockholders $ 303 $ 238 $ 292 $ 65 27.3 % $ 11 3.8 % Adjustment for notable items 3Q22 2Q22 3Q21 Noninterest income $ (145) $ (141) $ (191) Noninterest expense (183) (179) (153) Provision for credit losses — — — Income taxes 15 6 (8) Adjusted (Non-GAAP) Increase (decrease) QTD 2Q22 3Q21 3Q22 2Q22 3Q21 $ % $ % Net interest income $ 795 $ 700 $ 604 $ 95 13.6 % $ 191 31.6 % Noninterest income 288 283 241 5 1.8 47 19.5 Net revenue 1,083 983 845 100 10.2 238 28.2 Noninterest expense 577 566 563 11 1.9 14 2.5 Pre-provision net revenue 506 417 282 89 21.3 224 79.4 Provision (benefit) for credit losses 60 42 (70) 18 42.9 130 (185.7) Income before income taxes 446 375 352 71 18.9 94 26.7 Income taxes 108 88 82 20 22.7 26 31.7 Net income 338 287 270 51 17.8 68 25.2 Preferred stock dividends 12 17 8 (5) (29.4) 4 50.0 Net income available to common stockholders $ 326 $ 270 $ 262 $ 56 20.7 % $ 64 24.4 % Highlights • Note: The commentary below relates to the “Adjusted” income statements. 3Q22 vs. 2Q22 • Net interest income increased by $95 million primarily due to loan growth and higher yield on loans, partially offset by higher funding costs. • Noninterest income increased by $5 million. The increase was primarily due to higher capital markets fees, rental income on operating leases, net and other operating income, partially offset by lower service charges on deposit accounts. • Noninterest expense increased by $11 million primarily due to higher personnel costs and higher marketing expenses due to digital bank marketing efforts, partially offset by lower FDIC insurance expense and professional fees. • Provision for credit losses increased by $18 million primarily due to deterioration in CECL macroeconomic forecasts and loan growth, partially offset by improved credit quality and portfolio mix. 3Q22 vs. 3Q21 • Net interest income increased by $191 million primarily due to an increase in interest income driven by a higher yield on earning assets. • Noninterest income increased by $47 million primarily due to higher rental income on operating leases, net, capital markets fees, wealth management income and other operating income, partially offset by lower service charges on deposits, merchant income and factoring commissions. • Noninterest expense increased $14 million due to marketing, equipment expense, third-party processing fees and other operating expenses, partially offset by lower FDIC insurance expense and professional fees. • Provision for credit losses increased by $130 million due to a net provision build in 2022 versus a net provision benefit in 2021. Note – The financial data provided for 2021 is presented as if BancShares and CIT were combined for the historical periods. The Combined measures are Non-GAAP. Refer to Section V of this presentation for a reconciliation of the Combined (Non-GAAP) to BancShares (GAAP) measures. For the BancShares 2021 reported data, refer to page 32 of the Appendix. Notable Items are detailed on page 11. Quarter-to-Date Earnings Highlights ($ in millions)
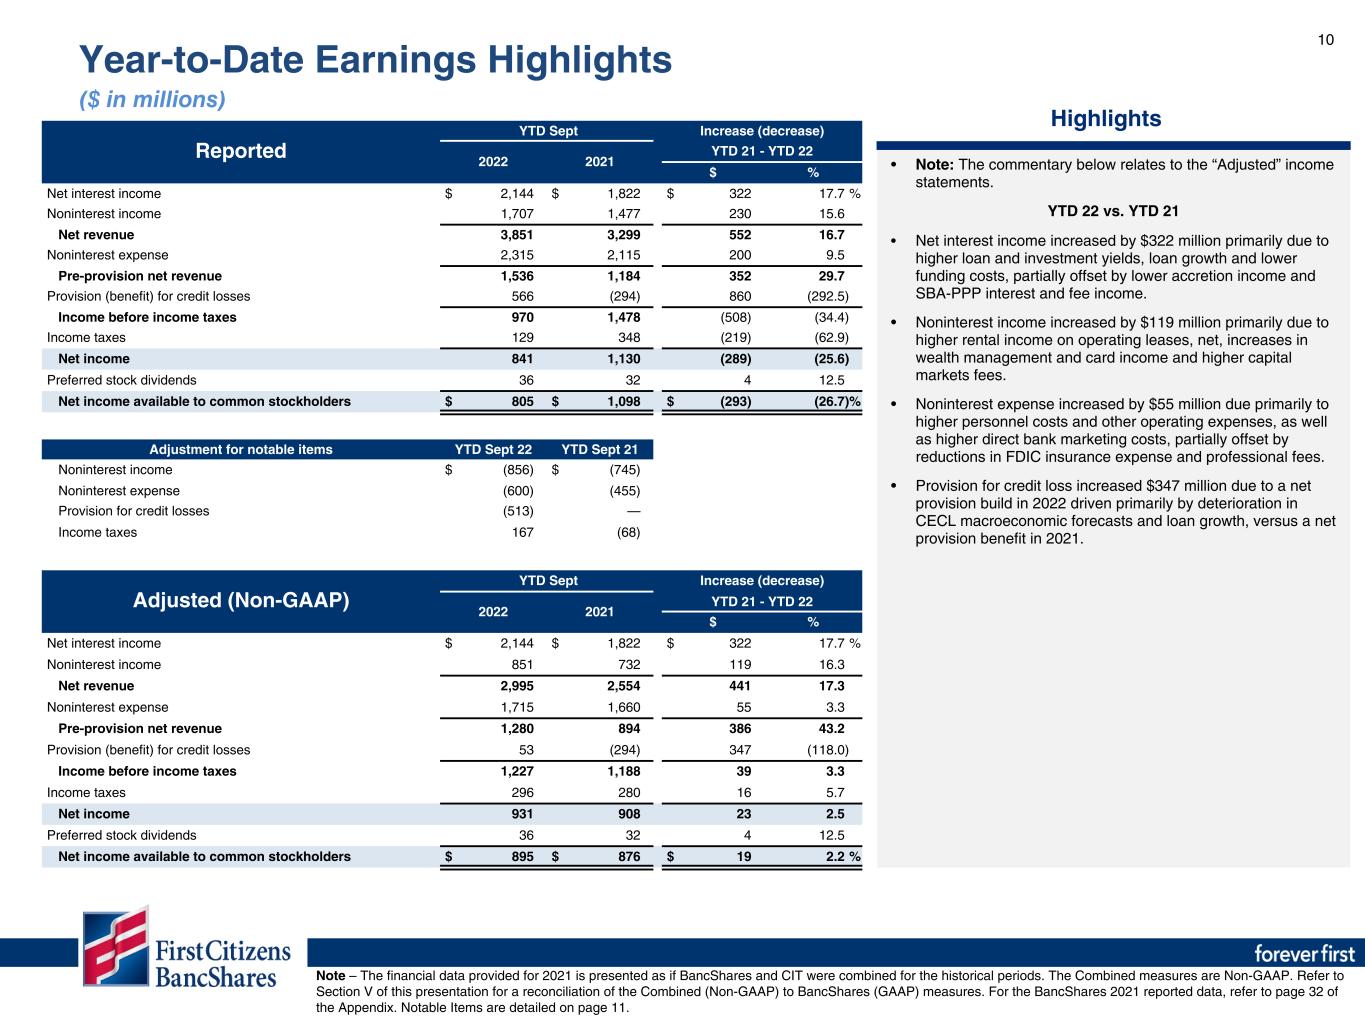
10 Reported YTD Sept Increase (decrease) 2022 2021 YTD 21 - YTD 22 $ % Net interest income $ 2,144 $ 1,822 $ 322 17.7 % Noninterest income 1,707 1,477 230 15.6 Net revenue 3,851 3,299 552 16.7 Noninterest expense 2,315 2,115 200 9.5 Pre-provision net revenue 1,536 1,184 352 29.7 Provision (benefit) for credit losses 566 (294) 860 (292.5) Income before income taxes 970 1,478 (508) (34.4) Income taxes 129 348 (219) (62.9) Net income 841 1,130 (289) (25.6) Preferred stock dividends 36 32 4 12.5 Net income available to common stockholders $ 805 $ 1,098 $ (293) (26.7) % Adjustment for notable items YTD Sept 22 YTD Sept 21 Noninterest income $ (856) $ (745) Noninterest expense (600) (455) Provision for credit losses (513) — Income taxes 167 (68) Adjusted (Non-GAAP) YTD Sept Increase (decrease) 2022 2021 YTD 21 - YTD 22 $ % Net interest income $ 2,144 $ 1,822 $ 322 17.7 % Noninterest income 851 732 119 16.3 Net revenue 2,995 2,554 441 17.3 Noninterest expense 1,715 1,660 55 3.3 Pre-provision net revenue 1,280 894 386 43.2 Provision (benefit) for credit losses 53 (294) 347 (118.0) Income before income taxes 1,227 1,188 39 3.3 Income taxes 296 280 16 5.7 Net income 931 908 23 2.5 Preferred stock dividends 36 32 4 12.5 Net income available to common stockholders $ 895 $ 876 $ 19 2.2 % Highlights • Note: The commentary below relates to the “Adjusted” income statements. YTD 22 vs. YTD 21 • Net interest income increased by $322 million primarily due to higher loan and investment yields, loan growth and lower funding costs, partially offset by lower accretion income and SBA-PPP interest and fee income. • Noninterest income increased by $119 million primarily due to higher rental income on operating leases, net, increases in wealth management and card income and higher capital markets fees. • Noninterest expense increased by $55 million due primarily to higher personnel costs and other operating expenses, as well as higher direct bank marketing costs, partially offset by reductions in FDIC insurance expense and professional fees. • Provision for credit loss increased $347 million due to a net provision build in 2022 driven primarily by deterioration in CECL macroeconomic forecasts and loan growth, versus a net provision benefit in 2021. Note – The financial data provided for 2021 is presented as if BancShares and CIT were combined for the historical periods. The Combined measures are Non-GAAP. Refer to Section V of this presentation for a reconciliation of the Combined (Non-GAAP) to BancShares (GAAP) measures. For the BancShares 2021 reported data, refer to page 32 of the Appendix. Notable Items are detailed on page 11. Year-to-Date Earnings Highlights ($ in millions)
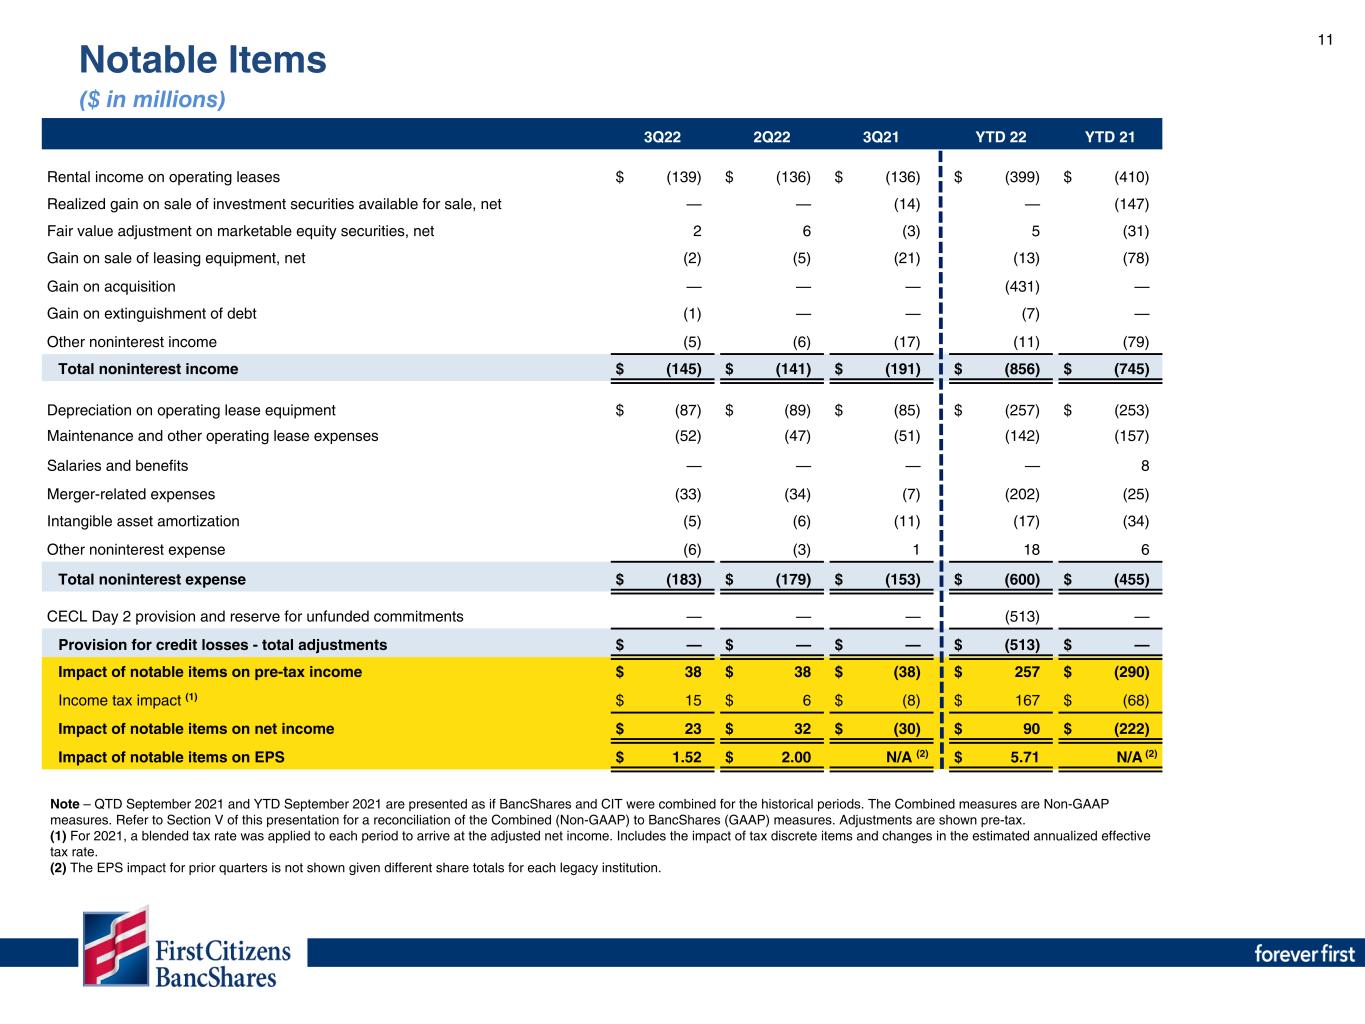
11 3Q22 2Q22 3Q21 YTD 22 YTD 21 Rental income on operating leases $ (139) $ (136) $ (136) $ (399) $ (410) Realized gain on sale of investment securities available for sale, net — — (14) — (147) Fair value adjustment on marketable equity securities, net 2 6 (3) 5 (31) Gain on sale of leasing equipment, net (2) (5) (21) (13) (78) Gain on acquisition — — — (431) — Gain on extinguishment of debt (1) — — (7) — Other noninterest income (5) (6) (17) (11) (79) Total noninterest income $ (145) $ (141) $ (191) $ (856) $ (745) Depreciation on operating lease equipment $ (87) $ (89) $ (85) $ (257) $ (253) Maintenance and other operating lease expenses (52) (47) (51) (142) (157) Salaries and benefits — — — — 8 Merger-related expenses (33) (34) (7) (202) (25) Intangible asset amortization (5) (6) (11) (17) (34) Other noninterest expense (6) (3) 1 18 6 Total noninterest expense $ (183) $ (179) $ (153) $ (600) $ (455) CECL Day 2 provision and reserve for unfunded commitments — — — (513) — Provision for credit losses - total adjustments $ — $ — $ — $ (513) $ — Impact of notable items on pre-tax income $ 38 $ 38 $ (38) $ 257 $ (290) Income tax impact (1) $ 15 $ 6 $ (8) $ 167 $ (68) Impact of notable items on net income $ 23 $ 32 $ (30) $ 90 $ (222) Impact of notable items on EPS $ 1.52 $ 2.00 N/A (2) $ 5.71 N/A (2) Note – QTD September 2021 and YTD September 2021 are presented as if BancShares and CIT were combined for the historical periods. The Combined measures are Non-GAAP measures. Refer to Section V of this presentation for a reconciliation of the Combined (Non-GAAP) to BancShares (GAAP) measures. Adjustments are shown pre-tax. (1) For 2021, a blended tax rate was applied to each period to arrive at the adjusted net income. Includes the impact of tax discrete items and changes in the estimated annualized effective tax rate. (2) The EPS impact for prior quarters is not shown given different share totals for each legacy institution. Notable Items ($ in millions)
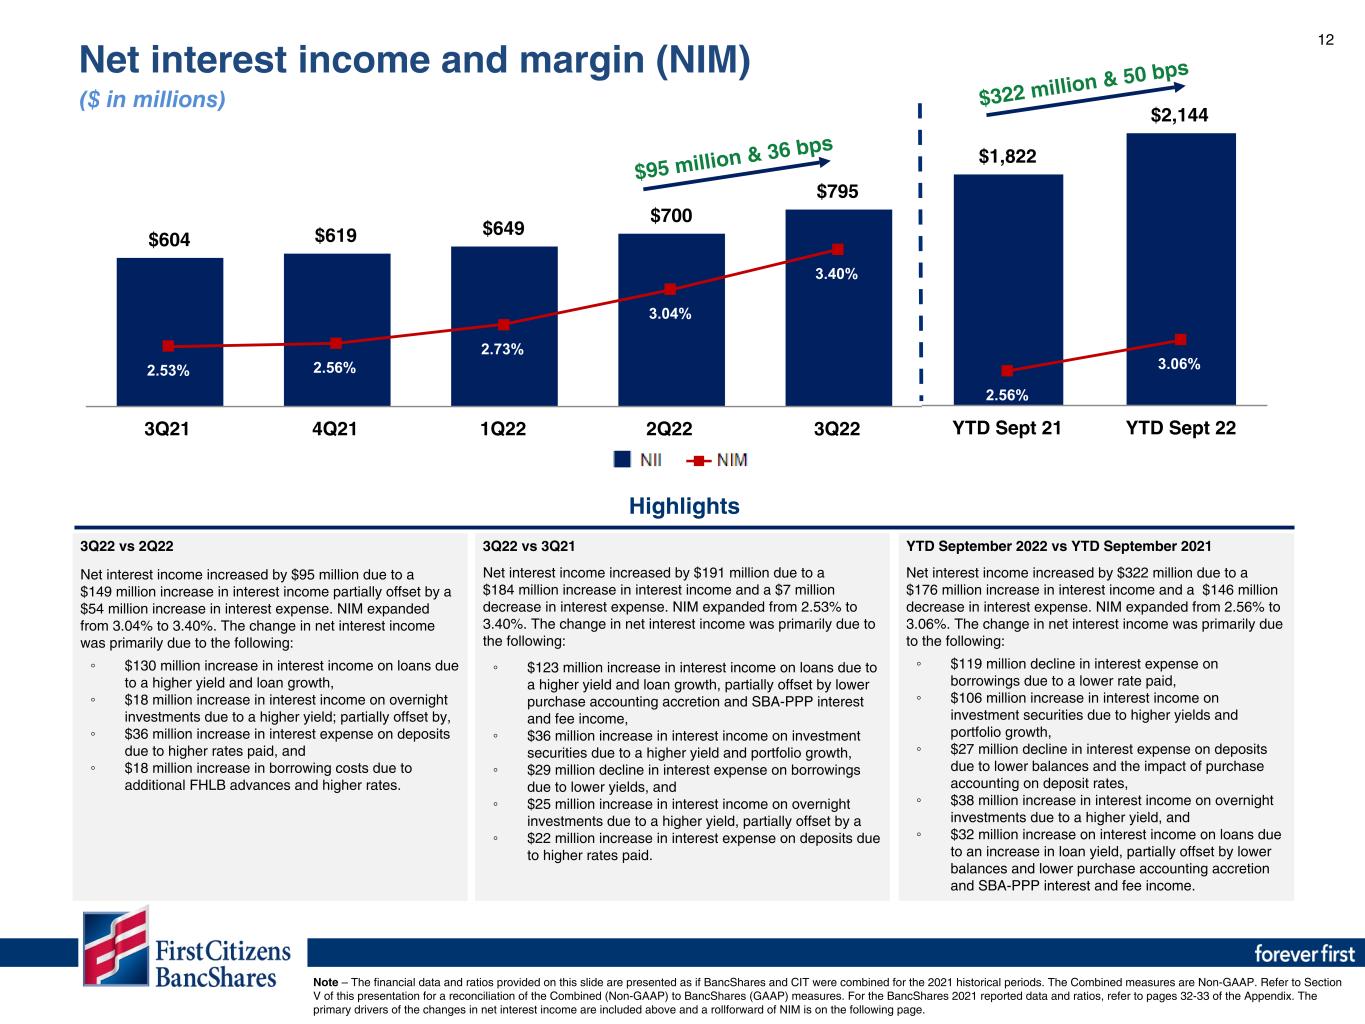
12 $1,822 $2,144 2.56% 3.06% YTD Sept 21 YTD Sept 22 $604 $619 $649 $700 $795 2.53% 2.56% 2.73% 3.04% 3.40% 3Q21 4Q21 1Q22 2Q22 3Q22 3Q22 vs 2Q22 Net interest income increased by $95 million due to a $149 million increase in interest income partially offset by a $54 million increase in interest expense. NIM expanded from 3.04% to 3.40%. The change in net interest income was primarily due to the following: ◦ $130 million increase in interest income on loans due to a higher yield and loan growth, ◦ $18 million increase in interest income on overnight investments due to a higher yield; partially offset by, ◦ $36 million increase in interest expense on deposits due to higher rates paid, and ◦ $18 million increase in borrowing costs due to additional FHLB advances and higher rates. YTD September 2022 vs YTD September 2021 Net interest income increased by $322 million due to a $176 million increase in interest income and a $146 million decrease in interest expense. NIM expanded from 2.56% to 3.06%. The change in net interest income was primarily due to the following: ◦ $119 million decline in interest expense on borrowings due to a lower rate paid, ◦ $106 million increase in interest income on investment securities due to higher yields and portfolio growth, ◦ $27 million decline in interest expense on deposits due to lower balances and the impact of purchase accounting on deposit rates, ◦ $38 million increase in interest income on overnight investments due to a higher yield, and ◦ $32 million increase on interest income on loans due to an increase in loan yield, partially offset by lower balances and lower purchase accounting accretion and SBA-PPP interest and fee income. $322 million & 50 bps Highlights $95 million & 36 bps 3Q22 vs 3Q21 Net interest income increased by $191 million due to a $184 million increase in interest income and a $7 million decrease in interest expense. NIM expanded from 2.53% to 3.40%. The change in net interest income was primarily due to the following: ◦ $123 million increase in interest income on loans due to a higher yield and loan growth, partially offset by lower purchase accounting accretion and SBA-PPP interest and fee income, ◦ $36 million increase in interest income on investment securities due to a higher yield and portfolio growth, ◦ $29 million decline in interest expense on borrowings due to lower yields, and ◦ $25 million increase in interest income on overnight investments due to a higher yield, partially offset by a ◦ $22 million increase in interest expense on deposits due to higher rates paid. Note – The financial data and ratios provided on this slide are presented as if BancShares and CIT were combined for the 2021 historical periods. The Combined measures are Non-GAAP. Refer to Section V of this presentation for a reconciliation of the Combined (Non-GAAP) to BancShares (GAAP) measures. For the BancShares 2021 reported data and ratios, refer to pages 32-33 of the Appendix. The primary drivers of the changes in net interest income are included above and a rollforward of NIM is on the following page. Net interest income and margin (NIM) ($ in millions)
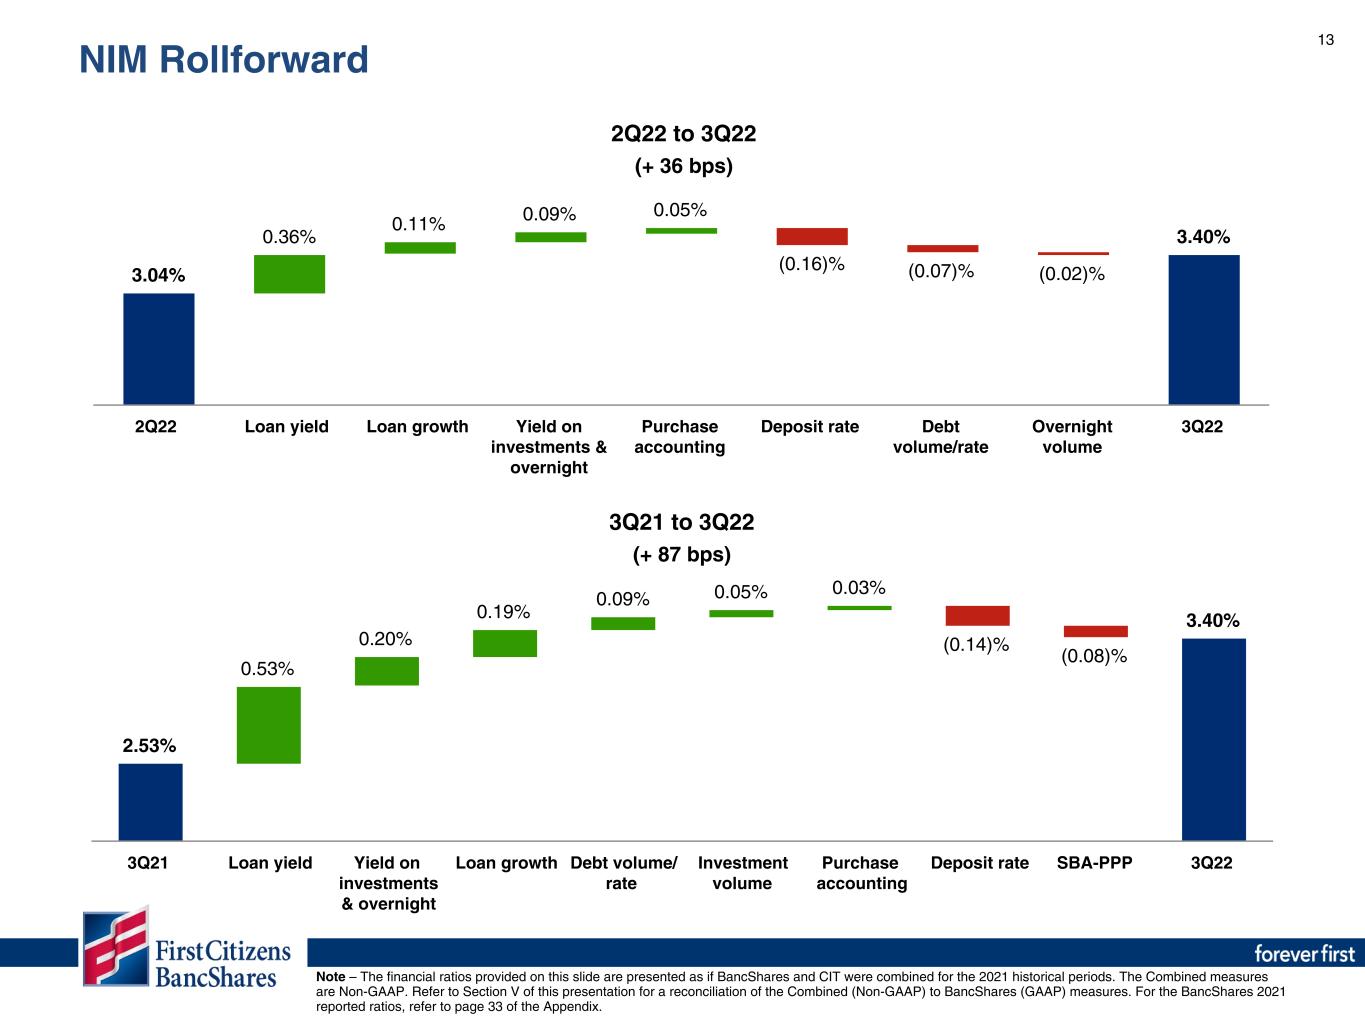
13 3.04% 0.36% 0.11% 0.09% 0.05% (0.16)% (0.07)% (0.02)% 3.40% 2Q22 Loan yield Loan growth Yield on investments & overnight Purchase accounting Deposit rate Debt volume/rate Overnight volume 3Q22 2.53% 0.53% 0.20% 0.19% 0.09% 0.05% 0.03% (0.14)% (0.08)% 3.40% 3Q21 Loan yield Yield on investments & overnight Loan growth Debt volume/ rate Investment volume Purchase accounting Deposit rate SBA-PPP 3Q22 3Q21 to 3Q22 (+ 87 bps) 2Q22 to 3Q22 (+ 36 bps) Note – The financial ratios provided on this slide are presented as if BancShares and CIT were combined for the 2021 historical periods. The Combined measures are Non-GAAP. Refer to Section V of this presentation for a reconciliation of the Combined (Non-GAAP) to BancShares (GAAP) measures. For the BancShares 2021 reported ratios, refer to page 33 of the Appendix. NIM Rollforward
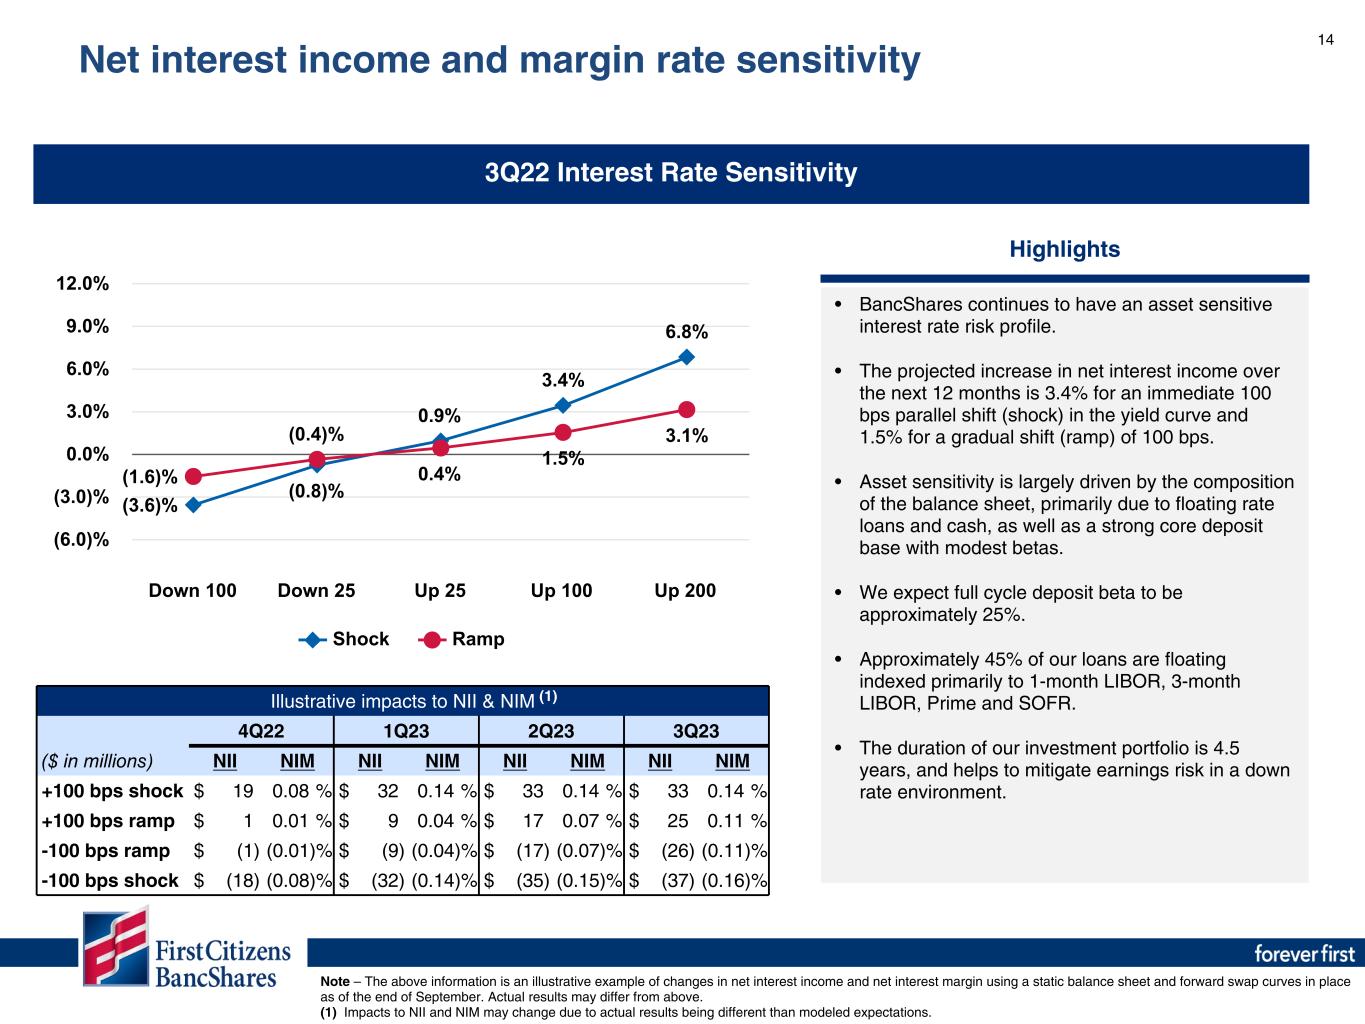
14 3Q22 Interest Rate Sensitivity Note – The above information is an illustrative example of changes in net interest income and net interest margin using a static balance sheet and forward swap curves in place as of the end of September. Actual results may differ from above. (1) Impacts to NII and NIM may change due to actual results being different than modeled expectations. Highlights • BancShares continues to have an asset sensitive interest rate risk profile. • The projected increase in net interest income over the next 12 months is 3.4% for an immediate 100 bps parallel shift (shock) in the yield curve and 1.5% for a gradual shift (ramp) of 100 bps. • Asset sensitivity is largely driven by the composition of the balance sheet, primarily due to floating rate loans and cash, as well as a strong core deposit base with modest betas. • We expect full cycle deposit beta to be approximately 25%. • Approximately 45% of our loans are floating indexed primarily to 1-month LIBOR, 3-month LIBOR, Prime and SOFR. • The duration of our investment portfolio is 4.5 years, and helps to mitigate earnings risk in a down rate environment. (3.6)% (0.8)% 0.9% 3.4% 6.8% (1.6)% (0.4)% 0.4% 1.5% 3.1% Shock Ramp Down 100 Down 25 Up 25 Up 100 Up 200 (6.0)% (3.0)% 0.0% 3.0% 6.0% 9.0% 12.0% Illustrative impacts to NII & NIM 4Q22 1Q23 2Q23 3Q23 ($ in millions) NII NIM NII NIM NII NIM NII NIM +100 bps shock $ 19 0.08 % $ 32 0.14 % $ 33 0.14 % $ 33 0.14 % +100 bps ramp $ 1 0.01 % $ 9 0.04 % $ 17 0.07 % $ 25 0.11 % -100 bps ramp $ (1) (0.01) % $ (9) (0.04) % $ (17) (0.07) % $ (26) (0.11) % -100 bps shock $ (18) (0.08) % $ (32) (0.14) % $ (35) (0.15) % $ (37) (0.16) % (1) Net interest income and margin rate sensitivity
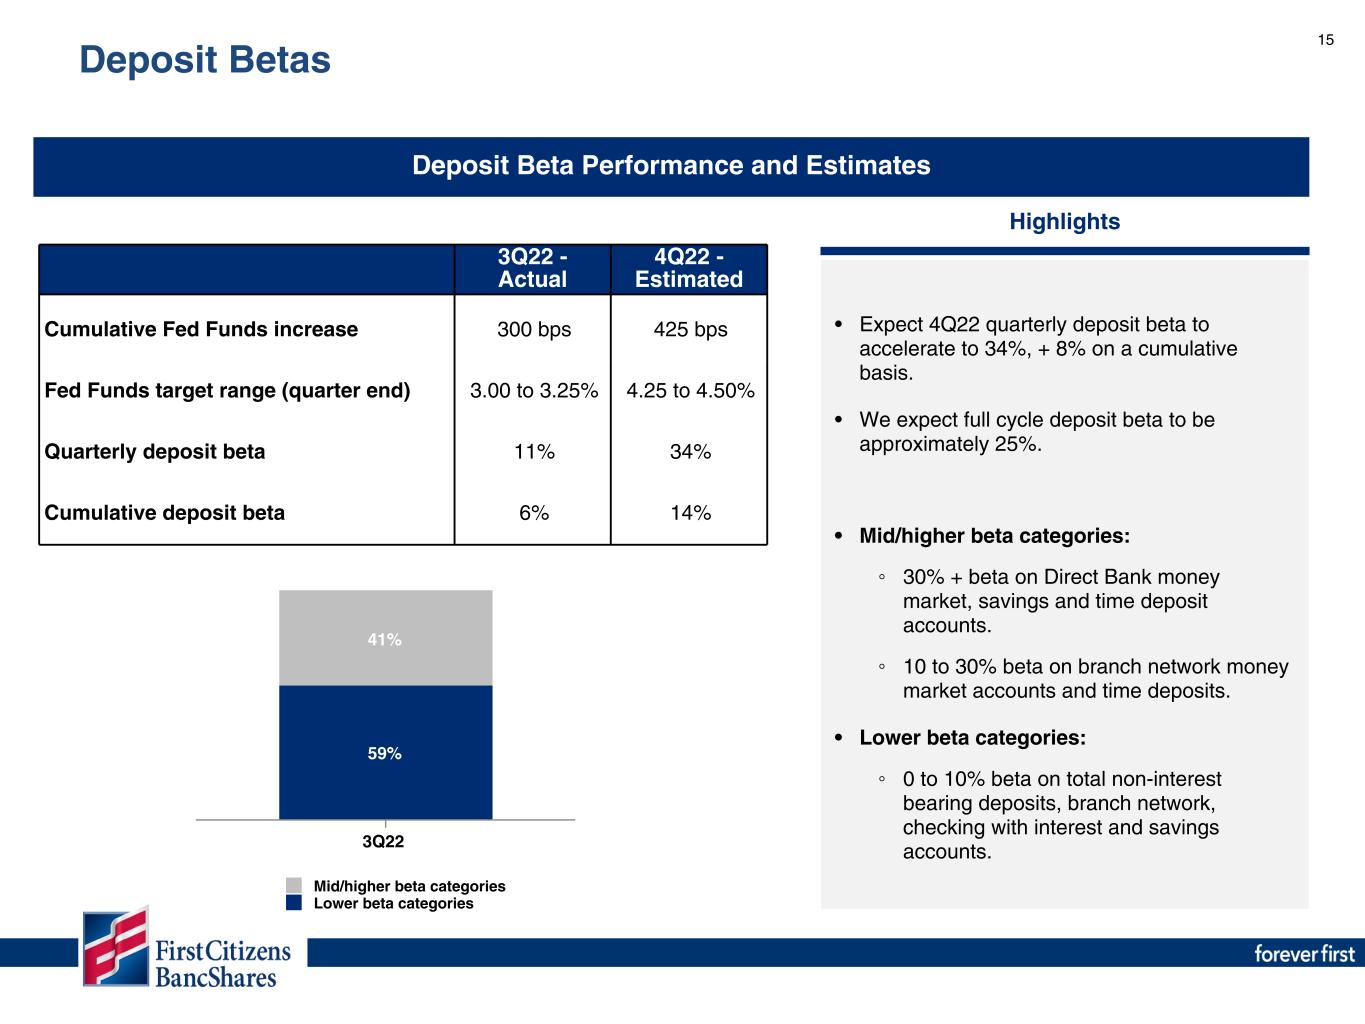
15 Deposit Beta Performance and Estimates Highlights • Expect 4Q22 quarterly deposit beta to accelerate to 34%, + 8% on a cumulative basis. • We expect full cycle deposit beta to be approximately 25%. • Mid/higher beta categories: ◦ 30% + beta on Direct Bank money market, savings and time deposit accounts. ◦ 10 to 30% beta on branch network money market accounts and time deposits. • Lower beta categories: ◦ 0 to 10% beta on total non-interest bearing deposits, branch network, checking with interest and savings accounts. 3Q22 - Actual 4Q22 - Estimated Cumulative Fed Funds increase 300 bps 425 bps Fed Funds target range (quarter end) 3.00 to 3.25% 4.25 to 4.50% Quarterly deposit beta 11% 34% Cumulative deposit beta 6% 14% Deposit Betas 59% 41% Mid/higher beta categories Lower beta categories 3Q22
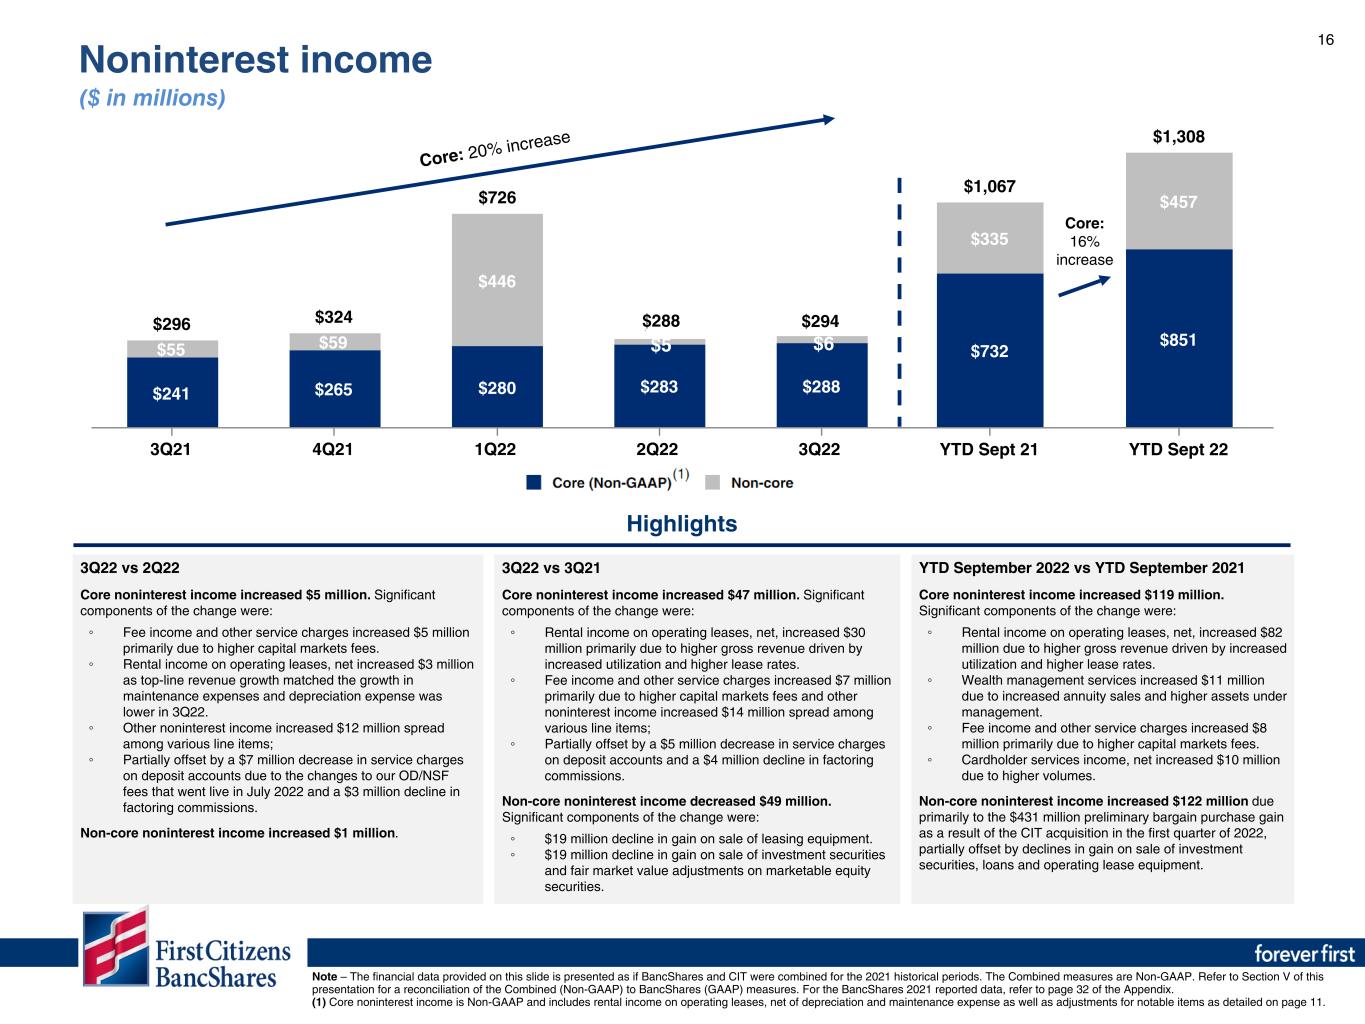
16 $1,067 $1,308 $732 $851 $335 $457 YTD Sept 21 YTD Sept 22 $296 $324 $726 $303 $313 $241 $265 $280 $283 $288 $55 $59 $446 3Q21 4Q21 1Q22 2Q22 3Q22 3Q22 vs 2Q22 Core noninterest income increased $5 million. Significant components of the change were: ◦ Fee income and other service charges increased $5 million primarily due to higher capital markets fees. ◦ Rental income on operating leases, net increased $3 million as top-line revenue growth matched the growth in maintenance expenses and depreciation expense was lower in 3Q22. ◦ Other noninterest income increased $12 million spread among various line items; ◦ Partially offset by a $7 million decrease in service charges on deposit accounts due to the changes to our OD/NSF fees that went live in July 2022 and a $3 million decline in factoring commissions. Non-core noninterest income increased $1 million. YTD September 2022 vs YTD September 2021 Core noninterest income increased $119 million. Significant components of the change were: ◦ Rental income on operating leases, net, increased $82 million due to higher gross revenue driven by increased utilization and higher lease rates. ◦ Wealth management services increased $11 million due to increased annuity sales and higher assets under management. ◦ Fee income and other service charges increased $8 million primarily due to higher capital markets fees. ◦ Cardholder services income, net increased $10 million due to higher volumes. Non-core noninterest income increased $122 million due primarily to the $431 million preliminary bargain purchase gain as a result of the CIT acquisition in the first quarter of 2022, partially offset by declines in gain on sale of investment securities, loans and operating lease equipment. Highlights Core: #N/A increase Core: 16% increase Core: 20% increase 3Q22 vs 3Q21 Core noninterest income increased $47 million. Significant components of the change were: ◦ Rental income on operating leases, net, increased $30 million primarily due to higher gross revenue driven by increased utilization and higher lease rates. ◦ Fee income and other service charges increased $7 million primarily due to higher capital markets fees and other noninterest income increased $14 million spread among various line items; ◦ Partially offset by a $5 million decrease in service charges on deposit accounts and a $4 million decline in factoring commissions. Non-core noninterest income decreased $49 million. Significant components of the change were: ◦ $19 million decline in gain on sale of leasing equipment. ◦ $19 million decline in gain on sale of investment securities and fair market value adjustments on marketable equity securities. Note – The financial data provided on this slide is presented as if BancShares and CIT were combined for the 2021 historical periods. The Combined measures are Non-GAAP. Refer to Section V of this presentation for a reconciliation of the Combined (Non-GAAP) to BancShares (GAAP) measures. For the BancShares 2021 reported data, refer to page 32 of the Appendix. (1) Core noninterest income is Non-GAAP and includes rental income on operating leases, net of depreciation and maintenance expense as well as adjustments for notable items as detailed on page 11. Noninterest income ($ in millions) $5 $6 288 294

17 $580 $567 $686 $609 $621 $563 $549 $572 $566 $577 $17 $18 $114 $43 $44 66.58% 62.51% 61.57% 57.55% 53.32% 3Q21 4Q21 1Q22 2Q22 3Q22 Highlights 3Q22 vs 3Q21 Core noninterest expense increased $14 million. Significant components of the change were: ◦ Marketing costs increased $6 million for the same reason as the linked quarter increase. ◦ Occupancy and equipment expense, professional fees and third-party processing fees increased $4 million each and other operating expenses were up $8 million spread among various line items; ◦ Partially offset by a $7 million reduction in FDIC insurance premiums and a $6 million decline in professional fees. Non-core noninterest expense increased $27 million driven primarily by a $26 million increase in merger-related expenses. Efficiency ratio improved from 66.58% to 53.32% due to 28% core net revenue growth versus 3% core noninterest expense growth. 3Q22 vs 2Q22 Core noninterest expense increased $11 million. Significant components of the change were: ◦ Personnel costs increased $10 million as a result of net staff additions, wage increases and higher temporary employee costs. ◦ Marketing costs increased $6 million due to higher expenses in the Direct Bank; ◦ Partially offset by a $4 million reduction in FDIC insurance premiums and a $2 million decline in professional fees. Non-core noninterest expense increased $1 million. Efficiency ratio improved from 57.55% to 53.32% as core net revenue grew by 10% and core noninterest expense declined by 2%. YTD September 2022 vs YTD September 2021 Core noninterest expense increased $55 million. Significant components of the change were: ◦ Personnel costs increased $19 million as a result of merit increases and higher temporary employee costs, partially offset by net staff reductions. ◦ Third-party processing expenses increased $11 million, marketing expenses increased $10 million and other operating expenses increased $22 million; ◦ Partially offset by a $12 million reduction in FDIC insurance premiums. Non-core noninterest expense increased $156 million driven primarily by a $177 million increase in merger-related expenses; partially offset by a $17 million reduction in intangible asset amortization. Efficiency ratio improved from 64.97% to 57.25% due to 17% core net revenue growth versus 3% core noninterest expense growth. Note – The financial data and ratios provided on this slide are presented as if BancShares and CIT were combined for the 2021 historical periods. The Combined measures are Non-GAAP. Refer to Section V of this presentation for a reconciliation of the Combined (Non-GAAP) to BancShares (GAAP) measures. For the BancShares 2021 reported data and ratios, refer to pages 32-33 of the Appendix. (1) Core noninterest expense does not include depreciation and maintenance expense on operating leases, as well as adjustments for notable items as detailed on page 11. Noninterest expense ($ in millions) $1,705 $1,916 $1,660 $1,715 $45 $201 64.97% 57.25% YTD Sept 21 YTD Sept 22

18 61%18% 17% 4% Personnel ($351) Occupancy & equipment ($102) Other expense - core ($97) Third-party processing fees ($27) 28% 15% 14% 12% 11% 8% 7% 5% Rental income on operating leases, net ($80) Fee income and other service charges ($44) Other income - core ($40) Wealth management services ($35) Cardholder and merchant services, net ($33) Factoring commissions ($24) Service charges on deposit accounts ($21) Insurance commissions ($11) Core noninterest income (Non-GAAP) Core noninterest expense (Non-GAAP) Note - Core noninterest income is Non-GAAP and includes rental income on operating leases, net of depreciation and maintenance expense as well as adjustments for notable items as detailed on page 11. Core noninterest expense does not include depreciation and maintenance expense on operating leases, as well as adjustments for notable items as detailed on page 11. 3Q22 Noninterest income and expense composition ($ in millions)

19 19 Increase (decrease) 3Q22 vs 2Q22 3Q22 vs 3Q21 SELECT BALANCES (1) 3Q22 2Q22 3Q21 $ % $ % Interest-earning deposits at banks $ 6,172 $ 6,476 $ 14,304 $ (304) (18.6) % $ (8,132) (56.8) % Investment securities 18,841 19,136 16,438 (295) (6.1) 2,403 14.6 Loans and leases 69,790 67,735 65,977 2,055 12.0 3,813 5.8 Operating lease equipment, net (2) 7,984 7,971 7,937 13 0.6 47 0.6 Deposits 87,553 89,329 90,320 (1,776) (7.9) (2,767) (3.1) Borrowings 8,343 4,459 6,131 3,884 345.7 2,212 36.1 Tangible common stockholders’ equity (non-GAAP) 8,461 9,265 9,410 (804) (34.4) (949) (10.1) Common stockholders' equity 8,952 9,761 9,892 (809) (32.9) (940) (9.5) Total stockholders' equity $ 9,833 $ 10,642 $ 10,757 $ (809) (30.1) % $ (924) (8.6) % Increase (decrease) KEY METRICS 3Q22 2Q22 3Q21 3Q22 vs 2Q22 3Q22 vs 3Q21 Common equity Tier 1 (CET1) capital ratio (3) 10.37 % 11.35 % 11.34 % (0.98) % (0.97) % Book value per common share (3) $ 597.75 $ 609.95 $ 432.07 $ (12.20) $ 165.68 Tangible book value per common share (non-GAAP) (3) $ 564.97 $ 578.92 $ 394.15 $ (13.95) $ 170.82 Tangible capital to tangible assets (1) 7.78 % 8.64 % 8.49 % (0.86) % (0.71) % Loan to deposit ratio (1) 79.71 % 75.83 % 73.05 % 3.88 % 6.66 % ACL to total loans and leases (1) 1.26 % 1.26 % 1.48 % — % (0.22) % Noninterest bearing deposits to total deposits (1) 30.37 % 29.75 % 27.58 % 0.62 % 2.79 % Balance Sheet Highlights ($ in millions, expect per share data) (1) The financial data and ratios provided are presented as if BancShares and CIT were combined for the 2021 historical periods. The Combined measures are Non-GAAP. Refer to Section V of this presentation for a reconciliation of the Combined (Non-GAAP) to BancShares (GAAP) measures. For the BancShares 2021 reported data and ratios, refer to pages 31 - 33 of the Appendix. (2) Operating lease equipment, net includes $7.2 billion of rail assets. (3) 3Q21 ratios for CET1, book value per common share and tangible book value per common share are BancShares and do not include CIT balances.

20 $65,977 $65,211 $65,524 $67,735 $69,790 $50,572 $50,079 $50,101 $51,477 $52,960 $15,405 $15,132 $15,423 $16,258 $16,830 Commercial Consumer 3Q21 4Q21 1Q22 2Q22 3Q22 Note – The financial data provided on this slide is presented as if BancShares and CIT were combined for the historical periods. The Combined measures are Non-GAAP. Refer to Section V of this presentation for a reconciliation of the Combined (Non-GAAP) to BancShares (GAAP) measures. For the BancShares 2021 reported data, refer to page 31 of the Appendix. Rail assets / operating leases are not included in the loan totals. Highlights 3Q22 vs 2Q22 • Loans grew $2.1 billion, or by 12.0% on an annualized basis. • Growth was driven primarily by our branch network, Commercial Finance, Business Capital and Mortgage. • The primary drivers of the growth by loan type were commercial & industrial, non-owner-occupied commercial mortgage and residential mortgage loans. 3Q22 vs 3Q21 • Loans grew $3.8 billion, or by 5.8%. Loans excluding the impact of purchase accounting and SBA-PPP increased $4.7 billion, or by 6.8%. • Growth was due to the same factors above for the linked quarter. • The primary drivers of the growth by loan type were commercial & industrial, residential mortgage and owner-occupied commercial mortgage loans. Loans and Leases HFI ($ in millions)

21 35% 20% 18% 14% 4% 3% 3% 3% Commercial & industrial ($24.3) Owner-occupied commercial mortgage ($14.0) Residential mortgage ($12.9) Non-owner-occupied commercial mortgage ($9.7) Commercial construction ($2.8) Leases ($2.2) Consumer other ($2.0) Revolving mortgage ($1.9) Note – Rail assets / operating leases are not included in the loan totals. The Commercial Banking segment includes Commercial Finance, Real Estate Finance and Business Capital. The General Banking segment includes Branch Network & Wealth, Mortgage, Consumer Indirect, Direct Bank, Community Association Banking and Other General Banking. 24% 9% 7% 41% 13% 2% 4% Commercial Finance ($16.9) Real Estate Finance ($6.0) Business Capital ($5.1) Branch Network & Wealth ($28.9) Mortgage ($9.1) Consumer Indirect ($1.1) Other ($2.7) Commercial Banking: General Banking: Type Segment 3Q22 Loans and Leases HFI Composition ($ in billions)
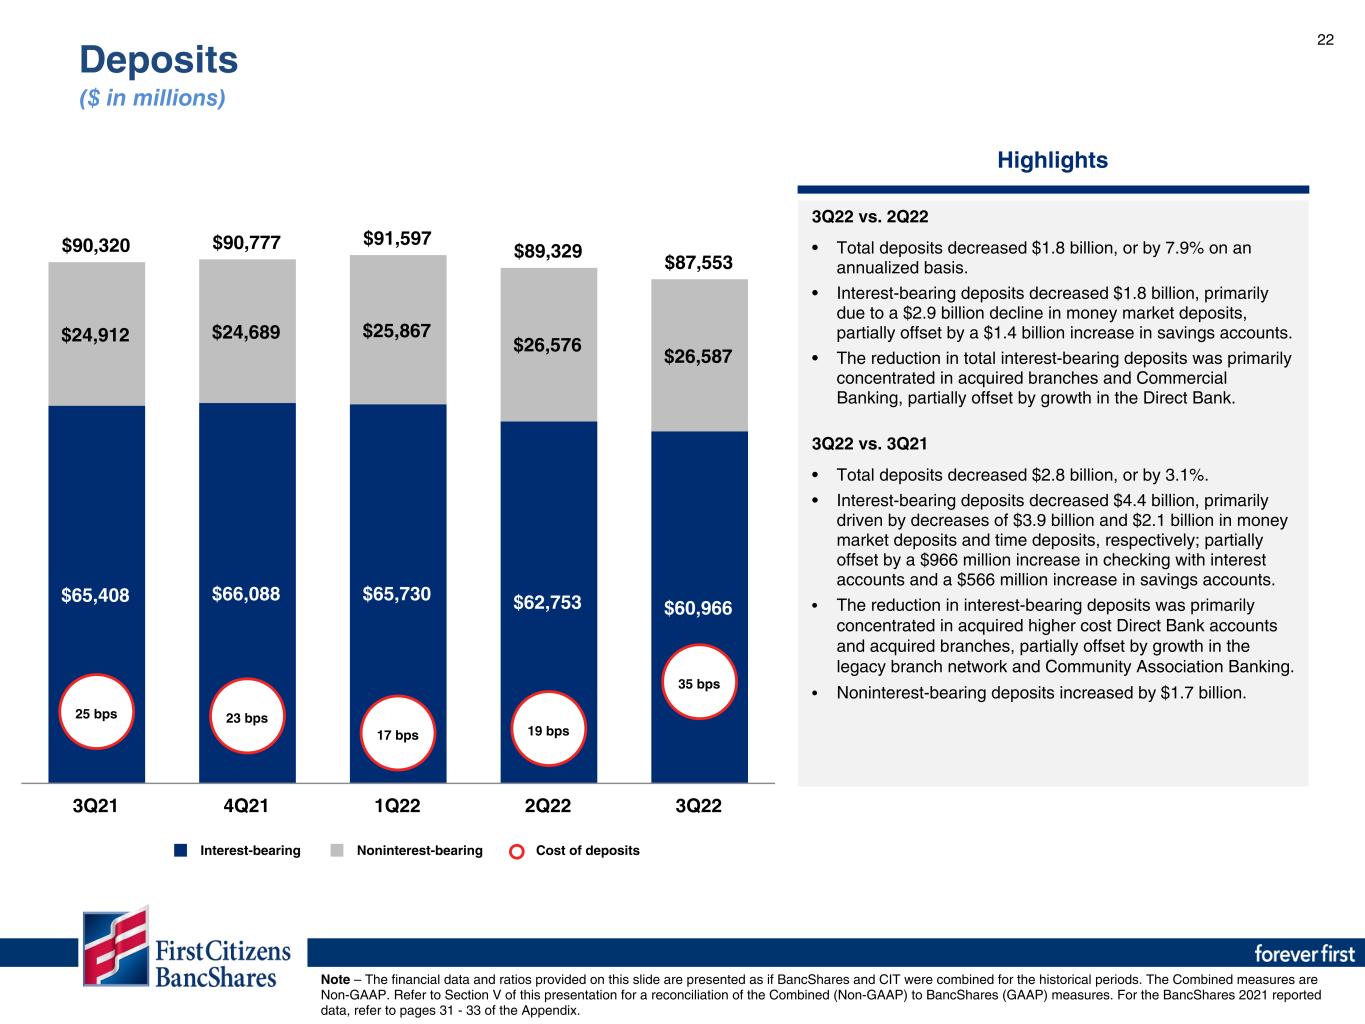
22 $90,320 $90,777 $91,597 $89,329 $87,553 $65,408 $66,088 $65,730 $62,753 $60,966 $24,912 $24,689 $25,867 $26,576 $26,587 25 bps 23 bps 17 bps 19 bps 35 bps Interest-bearing Noninterest-bearing Cost of deposits 3Q21 4Q21 1Q22 2Q22 3Q22 Highlights 3Q22 vs. 2Q22 • Total deposits decreased $1.8 billion, or by 7.9% on an annualized basis. • Interest-bearing deposits decreased $1.8 billion, primarily due to a $2.9 billion decline in money market deposits, partially offset by a $1.4 billion increase in savings accounts. • The reduction in total interest-bearing deposits was primarily concentrated in acquired branches and Commercial Banking, partially offset by growth in the Direct Bank. 3Q22 vs. 3Q21 • Total deposits decreased $2.8 billion, or by 3.1%. • Interest-bearing deposits decreased $4.4 billion, primarily driven by decreases of $3.9 billion and $2.1 billion in money market deposits and time deposits, respectively; partially offset by a $966 million increase in checking with interest accounts and a $566 million increase in savings accounts. • The reduction in interest-bearing deposits was primarily concentrated in acquired higher cost Direct Bank accounts and acquired branches, partially offset by growth in the legacy branch network and Community Association Banking. • Noninterest-bearing deposits increased by $1.7 billion. Note – The financial data and ratios provided on this slide are presented as if BancShares and CIT were combined for the historical periods. The Combined measures are Non-GAAP. Refer to Section V of this presentation for a reconciliation of the Combined (Non-GAAP) to BancShares (GAAP) measures. For the BancShares 2021 reported data, refer to pages 31 - 33 of the Appendix. Deposits ($ in millions)
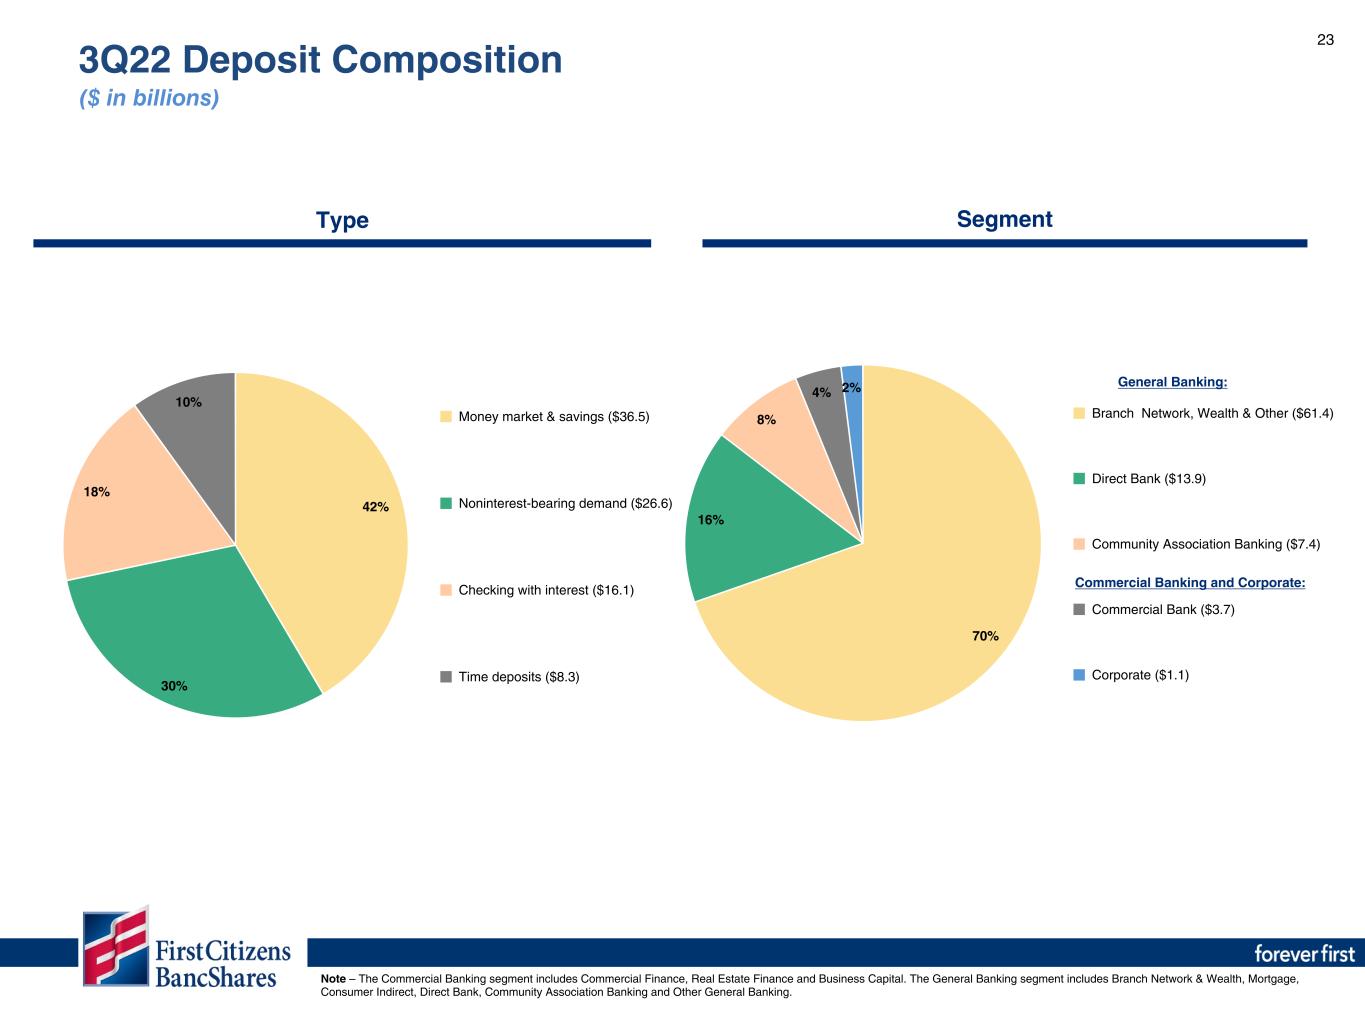
23 70% 16% 8% 4% 2% Branch Network, Wealth & Other ($61.4) Direct Bank ($13.9) Community Association Banking ($7.4) Commercial Bank ($3.7) Corporate ($1.1) Note – The Commercial Banking segment includes Commercial Finance, Real Estate Finance and Business Capital. The General Banking segment includes Branch Network & Wealth, Mortgage, Consumer Indirect, Direct Bank, Community Association Banking and Other General Banking. 42% 30% 18% 10% Money market & savings ($36.5) Noninterest-bearing demand ($26.6) Checking with interest ($16.1) Time deposits ($8.3) General Banking: Commercial Banking and Corporate: Type Segment 3Q22 Deposit Composition ($ in billions)
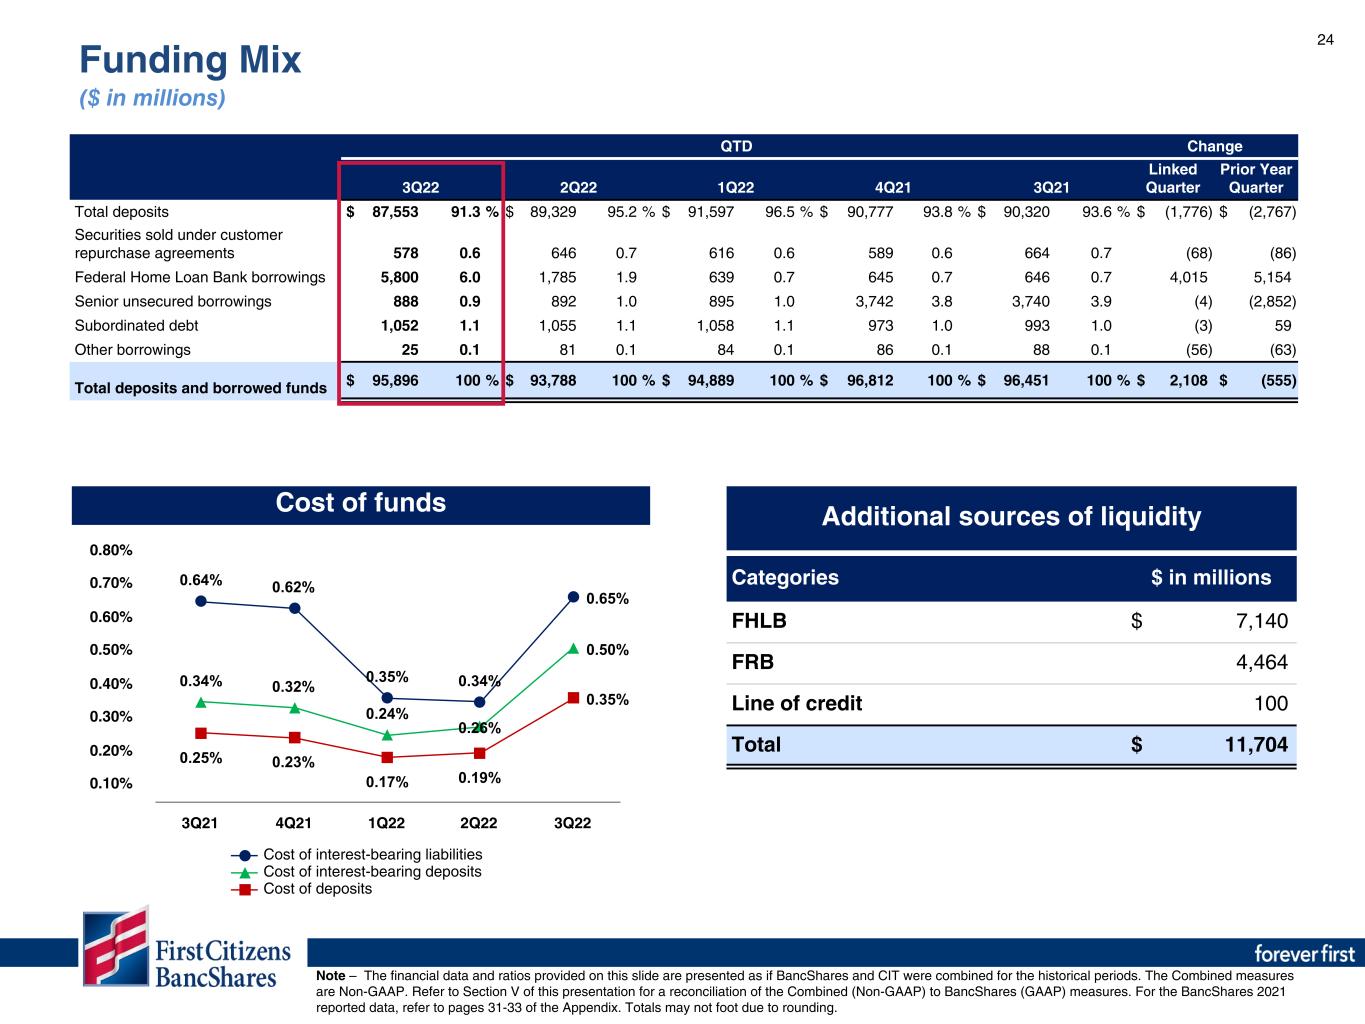
24 0.64% 0.62% 0.35% 0.34% 0.65% 0.34% 0.32% 0.24% 0.26% 0.50% 0.25% 0.23% 0.17% 0.19% 0.35% Cost of interest-bearing liabilities Cost of interest-bearing deposits Cost of deposits 3Q21 4Q21 1Q22 2Q22 3Q22 0.10% 0.20% 0.30% 0.40% 0.50% 0.60% 0.70% 0.80% Cost of funds Additional sources of liquidity Categories $ in millions FHLB $ 7,140 FRB 4,464 Line of credit 100 Total $ 11,704 QTD Change 3Q22 2Q22 1Q22 4Q21 3Q21 Linked Quarter Prior Year Quarter Total deposits $ 87,553 91.3 % $ 89,329 95.2 % $ 91,597 96.5 % $ 90,777 93.8 % $ 90,320 93.6 % $ (1,776) $ (2,767) Securities sold under customer repurchase agreements 578 0.6 646 0.7 616 0.6 589 0.6 664 0.7 (68) (86) Federal Home Loan Bank borrowings 5,800 6.0 1,785 1.9 639 0.7 645 0.7 646 0.7 4,015 5,154 Senior unsecured borrowings 888 0.9 892 1.0 895 1.0 3,742 3.8 3,740 3.9 (4) (2,852) Subordinated debt 1,052 1.1 1,055 1.1 1,058 1.1 973 1.0 993 1.0 (3) 59 Other borrowings 25 0.1 81 0.1 84 0.1 86 0.1 88 0.1 (56) (63) Total deposits and borrowed funds $ 95,896 100 % $ 93,788 100 % $ 94,889 100 % $ 96,812 100 % $ 96,451 100 % $ 2,108 $ (555) Note – The financial data and ratios provided on this slide are presented as if BancShares and CIT were combined for the historical periods. The Combined measures are Non-GAAP. Refer to Section V of this presentation for a reconciliation of the Combined (Non-GAAP) to BancShares (GAAP) measures. For the BancShares 2021 reported data, refer to pages 31-33 of the Appendix. Totals may not foot due to rounding. Funding Mix ($ in millions)
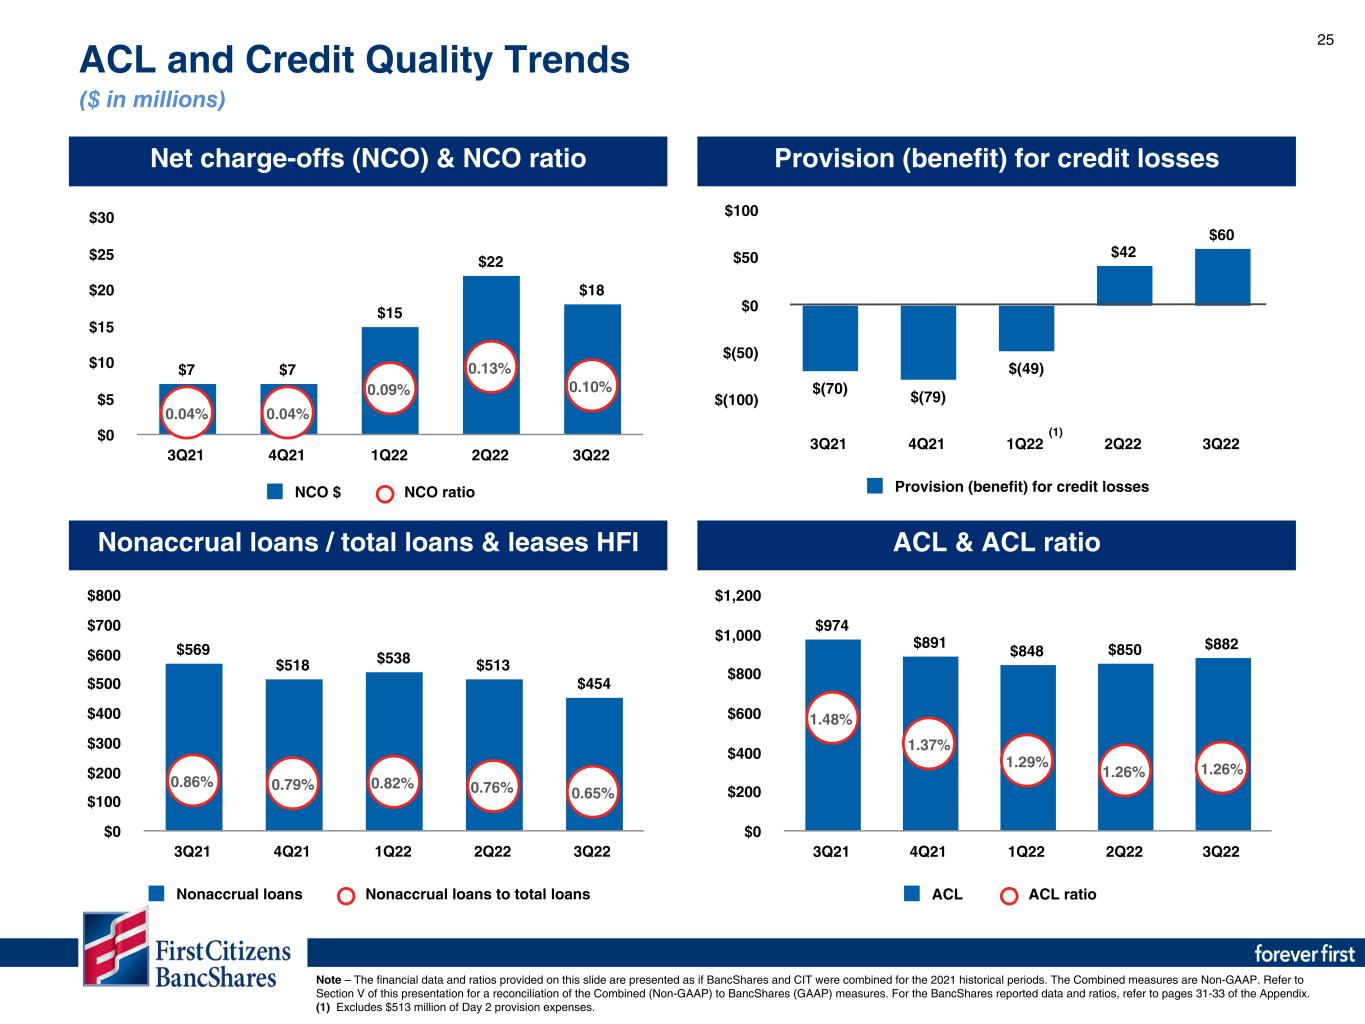
25 $(70) $(79) $(49) $42 $60 Provision (benefit) for credit losses 3Q21 4Q21 1Q22 2Q22 3Q22 $(100) $(50) $0 $50 $100 ACL and Credit Quality Trends ($ in millions) Net charge-offs (NCO) & NCO ratio Provision (benefit) for credit losses $7 $7 $15 $22 $18 0.04% 0.04% 0.09% 0.13% 0.10% NCO $ NCO ratio 3Q21 4Q21 1Q22 2Q22 3Q22 $0 $5 $10 $15 $20 $25 $30 $569 $518 $538 $513 $454 0.86% 0.79% 0.82% 0.76% 0.65% Nonaccrual loans Nonaccrual loans to total loans 3Q21 4Q21 1Q22 2Q22 3Q22 $0 $100 $200 $300 $400 $500 $600 $700 $800 Nonaccrual loans / total loans & leases HFI ACL & ACL ratio $974 $891 $848 $850 $882 1.48% 1.37% 1.29% 1.26% 1.26% ACL ACL ratio 3Q21 4Q21 1Q22 2Q22 3Q22 $0 $200 $400 $600 $800 $1,000 $1,200 (1) Note – The financial data and ratios provided on this slide are presented as if BancShares and CIT were combined for the 2021 historical periods. The Combined measures are Non-GAAP. Refer to Section V of this presentation for a reconciliation of the Combined (Non-GAAP) to BancShares (GAAP) measures. For the BancShares reported data and ratios, refer to pages 31-33 of the Appendix. (1) Excludes $513 million of Day 2 provision expenses.
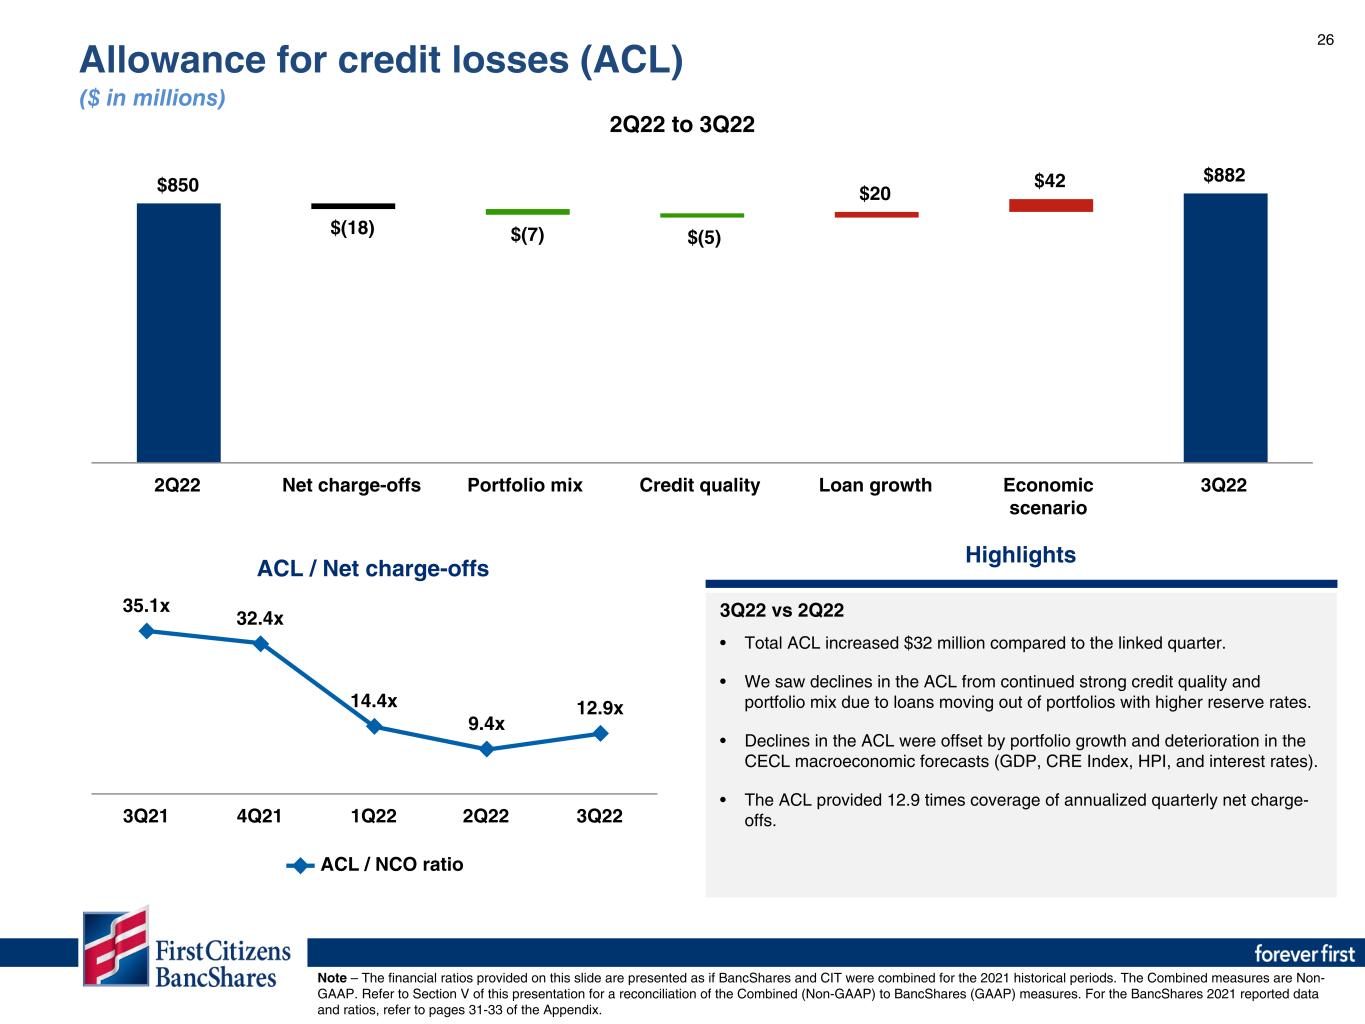
26 Highlights 3Q22 vs 2Q22 • Total ACL increased $32 million compared to the linked quarter. • We saw declines in the ACL from continued strong credit quality and portfolio mix due to loans moving out of portfolios with higher reserve rates. • Declines in the ACL were offset by portfolio growth and deterioration in the CECL macroeconomic forecasts (GDP, CRE Index, HPI, and interest rates). • The ACL provided 12.9 times coverage of annualized quarterly net charge- offs. $850 $(18) $20 $42 $882 2Q22 Net charge-offs Portfolio mix Credit quality Loan growth Economic scenario 3Q22 ACL / Net charge-offs 35.1x 32.4x 14.4x 9.4x 12.9x ACL / NCO ratio 3Q21 4Q21 1Q22 2Q22 3Q22 2Q22 to 3Q22 Note – The financial ratios provided on this slide are presented as if BancShares and CIT were combined for the 2021 historical periods. The Combined measures are Non- GAAP. Refer to Section V of this presentation for a reconciliation of the Combined (Non-GAAP) to BancShares (GAAP) measures. For the BancShares 2021 reported data and ratios, refer to pages 31-33 of the Appendix. Allowance for credit losses (ACL) ($ in millions) $(7) $(5)

27 7.68% 7.59% 9.55% 9.85% 9.31% Tier 1 Leverage ratio 3Q21 4Q21 1Q22 2Q22 3Q22 Risk-based capital ratios Capital ratio rollforward Tier 1 Leverage ratio Tangible book value per share (Non-GAAP) Capital Risk-Based Capital Tier 1 LeverageTotal Tier 1 CET1 December 31, 2021 14.35% 12.47% 11.50% 7.59% CIT acquisition - net (0.04)% (0.26)% (0.36)% 1.50% Pro forma combined - January 3, 2022 14.31% 12.21% 11.14% 9.09% Net income 0.94% 0.94% 0.94% 0.73% Common dividends (0.03)% (0.03)% (0.03)% (0.03)% Preferred dividends (0.04)% (0.04)% (0.04)% (0.04)% Stock repurchase plan (0.98)% (0.98)% (0.98)% (0.78)% Risk-weighted/average assets (0.85)% (0.72)% (0.66)% 0.22% SBA-PPP decline 0.00% 0.00% 0.00% 0.10% Other 0.11% (0.02)% 0.00% 0.02% September 30, 2022 13.46% 11.36% 10.37% 9.31% Change since 4Q21 (0.89)% (1.11)% (1.13)% 1.72% $410.74 $169.52 $51.22 ($49.35) ($15.75) ($1.41) $564.97 4Q21 CIT acquisition Retained earnings AOCI Share repurchases Common dividends 3Q22 11.34% 11.50% 11.34% 11.35% 10.37% 12.32% 12.47% 12.39% 12.37% 11.36% 14.30% 14.35% 14.47% 14.46% 13.46% CET1 Tier 1 Total 3Q21 4Q21 1Q22 2Q22 3Q22 Note – The financial ratios provided on this slide are BancShares and do not include CIT balances. Capital ratios are preliminary pending completion of quarterly regulatory filings.
Financial Outlook Section III
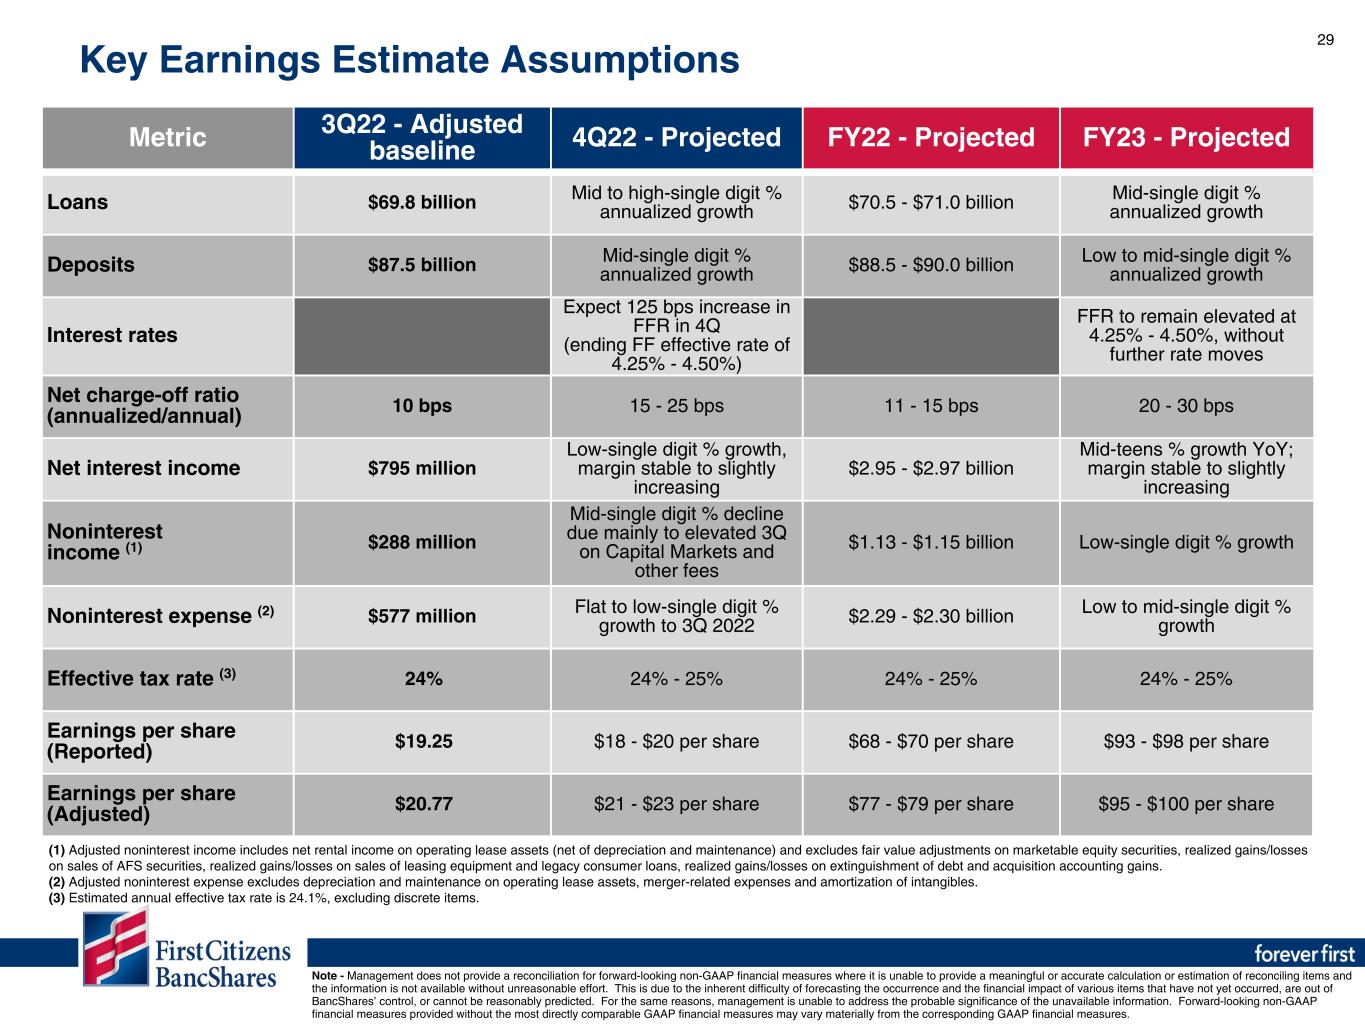
29 Metric 3Q22 - Adjusted baseline 4Q22 - Projected FY22 - Projected FY23 - Projected Loans $69.8 billion Mid to high-single digit % annualized growth $70.5 - $71.0 billion Mid-single digit % annualized growth Deposits $87.5 billion Mid-single digit % annualized growth $88.5 - $90.0 billion Low to mid-single digit % annualized growth Interest rates Expect 125 bps increase in FFR in 4Q (ending FF effective rate of 4.25% - 4.50%) FFR to remain elevated at 4.25% - 4.50%, without further rate moves Net charge-off ratio (annualized/annual) 10 bps 15 - 25 bps 11 - 15 bps 20 - 30 bps Net interest income $795 million Low-single digit % growth, margin stable to slightly increasing $2.95 - $2.97 billion Mid-teens % growth YoY; margin stable to slightly increasing Noninterest income (1) $288 million Mid-single digit % decline due mainly to elevated 3Q on Capital Markets and other fees $1.13 - $1.15 billion Low-single digit % growth Noninterest expense (2) $577 million Flat to low-single digit % growth to 3Q 2022 $2.29 - $2.30 billion Low to mid-single digit % growth Effective tax rate (3) 24% 24% - 25% 24% - 25% 24% - 25% Earnings per share (Reported) $19.25 $18 - $20 per share $68 - $70 per share $93 - $98 per share Earnings per share (Adjusted) $20.77 $21 - $23 per share $77 - $79 per share $95 - $100 per share Key Earnings Estimate Assumptions (1) Adjusted noninterest income includes net rental income on operating lease assets (net of depreciation and maintenance) and excludes fair value adjustments on marketable equity securities, realized gains/losses on sales of AFS securities, realized gains/losses on sales of leasing equipment and legacy consumer loans, realized gains/losses on extinguishment of debt and acquisition accounting gains. (2) Adjusted noninterest expense excludes depreciation and maintenance on operating lease assets, merger-related expenses and amortization of intangibles. (3) Estimated annual effective tax rate is 24.1%, excluding discrete items. Note - Management does not provide a reconciliation for forward-looking non-GAAP financial measures where it is unable to provide a meaningful or accurate calculation or estimation of reconciling items and the information is not available without unreasonable effort. This is due to the inherent difficulty of forecasting the occurrence and the financial impact of various items that have not yet occurred, are out of BancShares’ control, or cannot be reasonably predicted. For the same reasons, management is unable to address the probable significance of the unavailable information. Forward-looking non-GAAP financial measures provided without the most directly comparable GAAP financial measures may vary materially from the corresponding GAAP financial measures.
Appendix Section IV

31 3Q22 2Q22 1Q22 4Q21 3Q21 BancShares BancShares BancShares BancShares BancShares ASSETS Cash and due from banks $ 481 $ 583 $ 523 $ 338 $ 337 Interest-earning deposits at banks 6,172 6,476 9,285 9,115 9,875 Investments in marketable equity securities 92 94 100 98 123 Investment securities available for sale 9,088 9,210 9,295 9,203 7,371 Investment securities held to maturity 9,661 9,832 10,074 3,809 3,381 Assets held for sale 21 38 83 99 98 Loans and leases 69,790 67,735 65,524 32,372 32,516 Allowance for credit losses (882) (850) (848) (178) (183) Loans and leases, net of allowance for credit losses 68,908 66,885 64,676 32,194 32,333 Operating lease equipment, net 7,984 7,971 7,972 — — Premises and equipment, net 1,410 1,415 1,431 1,233 1,231 Bank-owned life insurance 1,342 1,334 1,326 116 116 Goodwill 346 346 346 346 350 Other intangible assets 145 150 156 19 22 Other assets 3,660 3,339 3,330 1,739 1,665 Total assets $ 109,310 $ 107,673 $ 108,597 $ 58,309 $ 56,902 LIABILITIES Deposits: Noninterest-bearing $ 26,587 $ 26,576 $ 25,867 $ 21,405 $ 21,514 Interest-bearing 60,966 62,753 65,730 30,001 28,551 Total deposits 87,553 89,329 91,597 51,406 50,065 Credit balances of factoring clients 1,147 1,070 1,150 — — Short-term borrowings 3,128 646 616 589 664 Long-term borrowings 5,215 3,813 2,676 1,195 1,219 Total borrowings 8,343 4,459 3,292 1,784 1,883 Other liabilities 2,434 2,173 1,988 381 372 Total liabilities 99,477 97,031 98,027 53,571 52,320 STOCKHOLDERS’ EQUITY Preferred stock 881 881 881 340 340 Common stock 15 16 16 10 10 Additional paid in capital 4,506 5,345 5,344 — — Retained earnings 5,160 4,865 4,634 4,378 4,264 Accumulated other comprehensive (loss) income (729) (465) (305) 10 (32) Total stockholders’ equity 9,833 10,642 10,570 4,738 4,582 Total liabilities and stockholders’ equity $ 109,310 $ 107,673 $ 108,597 $ 58,309 $ 56,902 BancShares Balance Sheets (unaudited) ($ in millions)
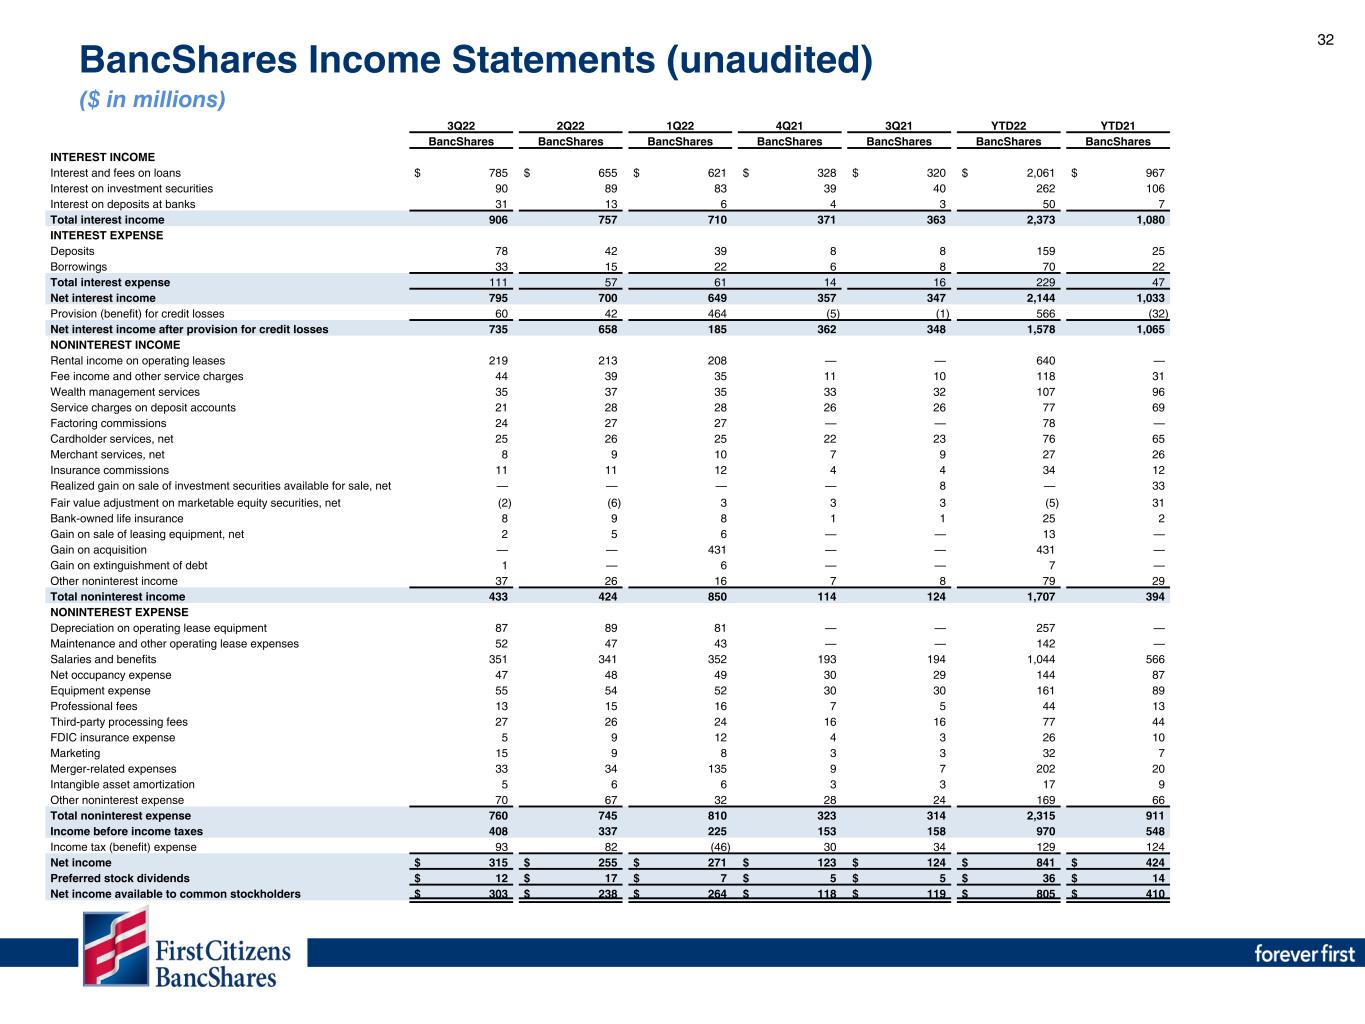
32 3Q22 2Q22 1Q22 4Q21 3Q21 YTD22 YTD21 BancShares BancShares BancShares BancShares BancShares BancShares BancShares INTEREST INCOME Interest and fees on loans $ 785 $ 655 $ 621 $ 328 $ 320 $ 2,061 $ 967 Interest on investment securities 90 89 83 39 40 262 106 Interest on deposits at banks 31 13 6 4 3 50 7 Total interest income 906 757 710 371 363 2,373 1,080 INTEREST EXPENSE Deposits 78 42 39 8 8 159 25 Borrowings 33 15 22 6 8 70 22 Total interest expense 111 57 61 14 16 229 47 Net interest income 795 700 649 357 347 2,144 1,033 Provision (benefit) for credit losses 60 42 464 (5) (1) 566 (32) Net interest income after provision for credit losses 735 658 185 362 348 1,578 1,065 NONINTEREST INCOME Rental income on operating leases 219 213 208 — — 640 — Fee income and other service charges 44 39 35 11 10 118 31 Wealth management services 35 37 35 33 32 107 96 Service charges on deposit accounts 21 28 28 26 26 77 69 Factoring commissions 24 27 27 — — 78 — Cardholder services, net 25 26 25 22 23 76 65 Merchant services, net 8 9 10 7 9 27 26 Insurance commissions 11 11 12 4 4 34 12 Realized gain on sale of investment securities available for sale, net — — — — 8 — 33 Fair value adjustment on marketable equity securities, net (2) (6) 3 3 3 (5) 31 Bank-owned life insurance 8 9 8 1 1 25 2 Gain on sale of leasing equipment, net 2 5 6 — — 13 — Gain on acquisition — — 431 — — 431 — Gain on extinguishment of debt 1 — 6 — — 7 — Other noninterest income 37 26 16 7 8 79 29 Total noninterest income 433 424 850 114 124 1,707 394 NONINTEREST EXPENSE Depreciation on operating lease equipment 87 89 81 — — 257 — Maintenance and other operating lease expenses 52 47 43 — — 142 — Salaries and benefits 351 341 352 193 194 1,044 566 Net occupancy expense 47 48 49 30 29 144 87 Equipment expense 55 54 52 30 30 161 89 Professional fees 13 15 16 7 5 44 13 Third-party processing fees 27 26 24 16 16 77 44 FDIC insurance expense 5 9 12 4 3 26 10 Marketing 15 9 8 3 3 32 7 Merger-related expenses 33 34 135 9 7 202 20 Intangible asset amortization 5 6 6 3 3 17 9 Other noninterest expense 70 67 32 28 24 169 66 Total noninterest expense 760 745 810 323 314 2,315 911 Income before income taxes 408 337 225 153 158 970 548 Income tax (benefit) expense 93 82 (46) 30 34 129 124 Net income $ 315 $ 255 $ 271 $ 123 $ 124 $ 841 $ 424 Preferred stock dividends $ 12 $ 17 $ 7 $ 5 $ 5 $ 36 $ 14 Net income available to common stockholders $ 303 $ 238 $ 264 $ 118 $ 119 $ 805 $ 410 BancShares Income Statements (unaudited) ($ in millions)

33 4Q21 3Q21 YTD21 BancShares BancShares BancShares ROA 0.84 % 0.88 % 1.05 % PPNR ROA 1.01 % 1.11 % 1.28 % NIM 2.58 % 2.61 % 2.69 % Net charge-off ratio (0.01) % 0.06 % 0.04 % Efficiency ratio 66.31 % 66.09 % 64.69 % Tangible capital to tangible assets (2) 6.96 % 6.84 % N/A Loan to deposits ratio (2) 62.97 %N 64.95 % N/A ACL to total loans and leases (2) 0.55 % 0.56 % N/A Noninterest bearing deposits to total deposits (2) 41.64 %N 42.97 % N/A Cost of deposits (2) 0.06 % 0.07 % 0.07 % Cost of interest bearing deposits (2) 0.11 % 0.12 % 0.13 % Cost of interest bearing liabilities (2) 0.19 % 0.20 % 0.21 % Nonaccrual loans to total loans and leases (2) 0.37 % 0.50 % N/A ACL / Net charge-offs (2) NM 9.7 x 1454.02 % BancShares Financial Ratios (unaudited) (1) (1) The above table includes ratios for legacy BancShares 2021 historical periods. Within the presentation, these ratios are presented as if legacy BancShares and legacy CIT were combined for the 2021 historical periods. (2) Ratios are not provided for periods not included in the presentation.
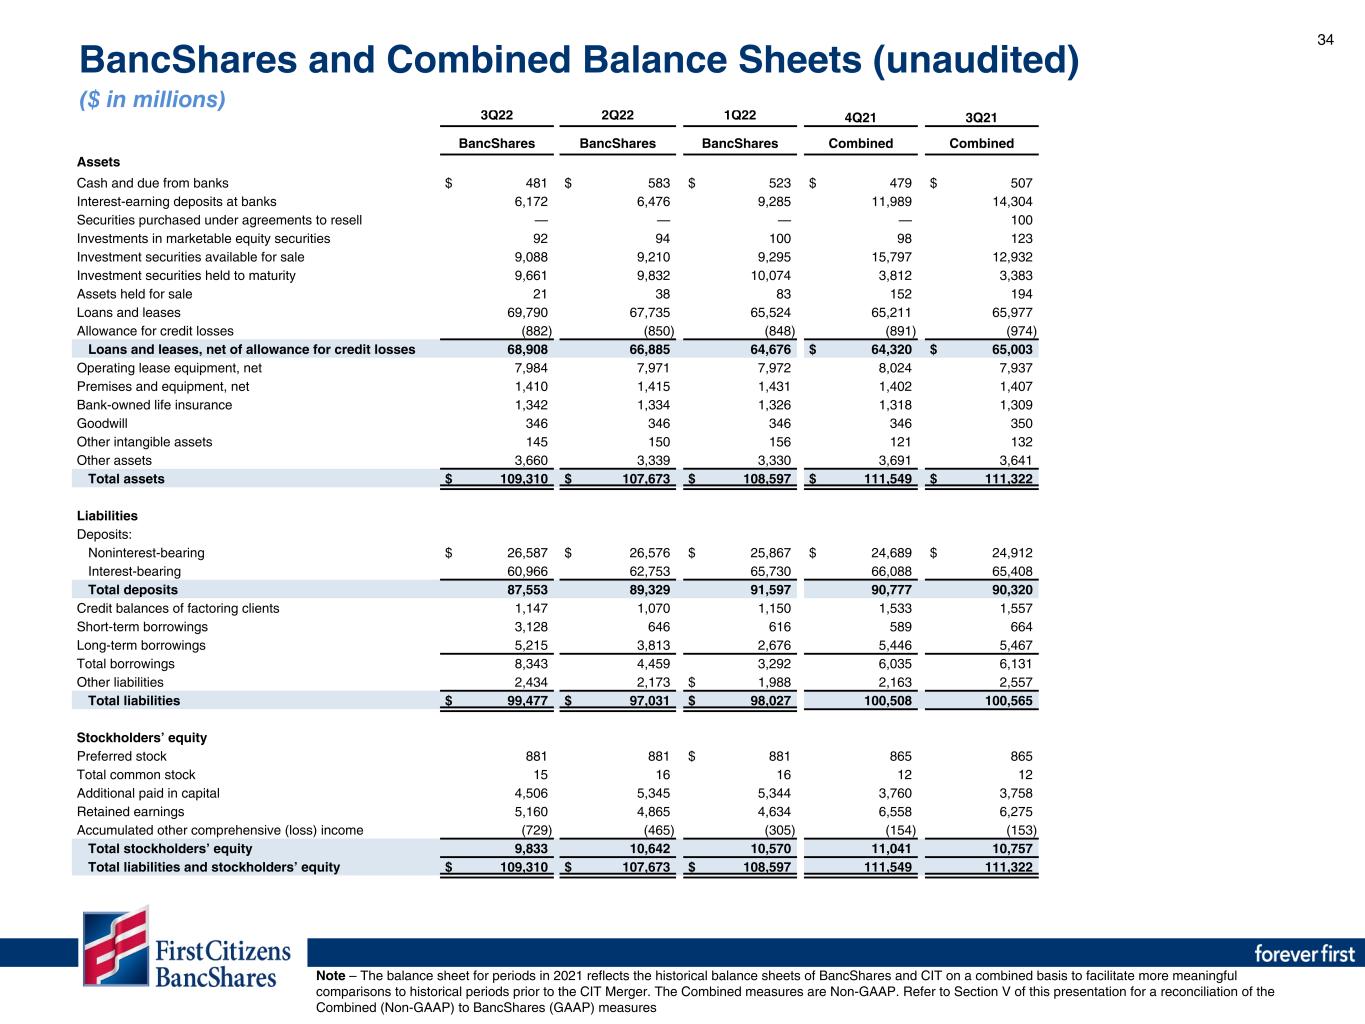
34 3Q22 2Q22 1Q22 4Q21 3Q21 BancShares BancShares BancShares Combined Combined Assets Cash and due from banks $ 481 $ 583 $ 523 $ 479 $ 507 Interest-earning deposits at banks 6,172 6,476 9,285 11,989 14,304 Securities purchased under agreements to resell — — — — 100 Investments in marketable equity securities 92 94 100 98 123 Investment securities available for sale 9,088 9,210 9,295 15,797 12,932 Investment securities held to maturity 9,661 9,832 10,074 3,812 3,383 Assets held for sale 21 38 83 152 194 Loans and leases 69,790 67,735 65,524 65,211 65,977 Allowance for credit losses (882) (850) (848) (891) (974) Loans and leases, net of allowance for credit losses 68,908 66,885 64,676 $ 64,320 $ 65,003 Operating lease equipment, net 7,984 7,971 7,972 8,024 7,937 Premises and equipment, net 1,410 1,415 1,431 1,402 1,407 Bank-owned life insurance 1,342 1,334 1,326 1,318 1,309 Goodwill 346 346 346 346 350 Other intangible assets 145 150 156 121 132 Other assets 3,660 3,339 3,330 3,691 3,641 Total assets $ 109,310 $ 107,673 $ 108,597 $ 111,549 $ 111,322 Liabilities Deposits: Noninterest-bearing $ 26,587 $ 26,576 $ 25,867 $ 24,689 $ 24,912 Interest-bearing 60,966 62,753 65,730 66,088 65,408 Total deposits 87,553 89,329 91,597 90,777 90,320 Credit balances of factoring clients 1,147 1,070 1,150 1,533 1,557 Short-term borrowings 3,128 646 616 589 664 Long-term borrowings 5,215 3,813 2,676 5,446 5,467 Total borrowings 8,343 4,459 3,292 6,035 6,131 Other liabilities 2,434 2,173 $ 1,988 2,163 2,557 Total liabilities $ 99,477 $ 97,031 $ 98,027 100,508 100,565 Stockholders’ equity Preferred stock 881 881 $ 881 865 865 Total common stock 15 16 16 12 12 Additional paid in capital 4,506 5,345 5,344 3,760 3,758 Retained earnings 5,160 4,865 4,634 6,558 6,275 Accumulated other comprehensive (loss) income (729) (465) (305) (154) (153) Total stockholders’ equity 9,833 10,642 10,570 11,041 10,757 Total liabilities and stockholders’ equity $ 109,310 $ 107,673 $ 108,597 111,549 111,322 Note – The balance sheet for periods in 2021 reflects the historical balance sheets of BancShares and CIT on a combined basis to facilitate more meaningful comparisons to historical periods prior to the CIT Merger. The Combined measures are Non-GAAP. Refer to Section V of this presentation for a reconciliation of the Combined (Non-GAAP) to BancShares (GAAP) measures BancShares and Combined Balance Sheets (unaudited) ($ in millions)

35 3Q22 2Q22 1Q22 4Q21 3Q21 BancShares BancShares BancShares Combined Combined INTEREST INCOME Interest and fees on loans $ 785 $ 655 $ 621 $ 668 $ 662 Interest on investment securities 90 89 83 60 54 Interest on deposits at banks 31 13 6 5 6 Total interest income 906 757 710 733 722 INTEREST EXPENSE Deposits 78 42 39 53 56 Borrowings 33 15 22 61 62 Total interest expense 111 57 61 114 118 Net interest income 795 700 649 619 604 Provision (benefit) for credit losses 60 42 464 (79) (70) Net interest income after provision for credit losses 735 658 185 698 674 NONINTEREST INCOME Rental income on operating leases 219 213 208 204 186 Fee income and other service charges 44 39 35 39 37 Wealth management services 35 37 35 33 32 Service charges on deposit accounts 21 28 28 27 26 Factoring commissions 24 27 27 33 28 Cardholder services, net 25 26 25 21 23 Merchant services, net 8 9 10 7 8 Insurance commissions 11 11 12 10 10 Realized gain on sale of investment securities available for sale, net — — — — 14 Fair value adjustment on marketable equity securities, net (2) (6) 3 7 3 Bank-owned life insurance 8 9 8 9 9 Gain on sale of leasing equipment, net 2 5 6 26 21 Gain on acquisition — — 431 — — Gain on extinguishment of debt 1 — 6 — — Other noninterest income 37 26 16 48 35 Total noninterest income 433 424 850 464 432 NONINTEREST EXPENSE Depreciation on operating lease equipment 87 89 81 88 85 Maintenance and other operating lease expenses 52 47 43 52 51 Salaries and benefits 351 341 352 326 347 Net occupancy expense 47 48 49 48 46 Equipment expense 55 54 52 52 51 Professional fees 13 15 16 20 19 Third-party processing fees 27 26 24 23 23 FDIC insurance expense 5 9 12 11 12 Marketing 15 9 8 8 9 Merger-related expenses 33 34 135 12 7 Intangible asset amortization 5 6 6 11 11 Other noninterest expense 70 67 32 56 55 Total noninterest expense 760 745 810 707 716 Income before income taxes 408 337 225 455 390 Income tax (benefit) expense 93 82 (46) 113 90 Net income 315 255 271 342 300 Preferred stock dividends 12 17 7 17 8 Net income available to common stockholders 303 238 264 325 292 BancShares and Combined Income Statements - QTD (unaudited) ($ in millions) Note – The income statements for periods in 2021 reflects the historical income statements of BancShares and CIT on a combined basis to facilitate more meaningful comparisons to historical periods prior to the CIT Merger. The Combined measures are Non-GAAP. Refer to Section V of this presentation for a reconciliation of the Combined (Non-GAAP) to BancShares (GAAP) measures
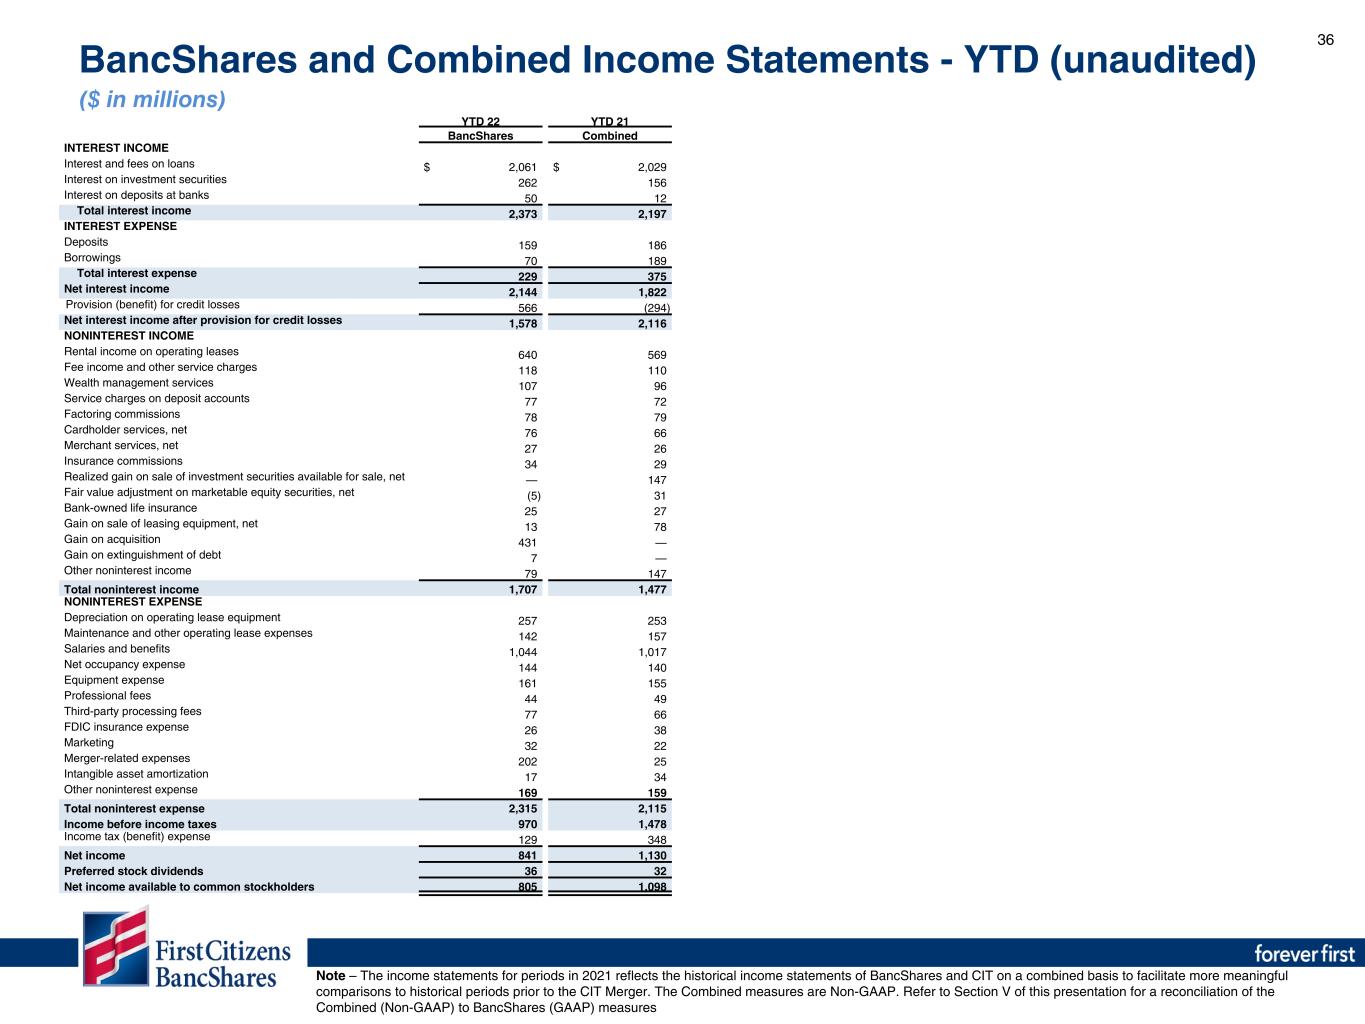
36 BancShares and Combined Income Statements - YTD (unaudited) ($ in millions) Note – The income statements for periods in 2021 reflects the historical income statements of BancShares and CIT on a combined basis to facilitate more meaningful comparisons to historical periods prior to the CIT Merger. The Combined measures are Non-GAAP. Refer to Section V of this presentation for a reconciliation of the Combined (Non-GAAP) to BancShares (GAAP) measures YTD 22 YTD 21 BancShares Combined INTEREST INCOME Interest and fees on loans $ 2,061 $ 2,029 Interest on investment securities 262 156 Interest on deposits at banks 50 12 Total interest income 2,373 2,197 INTEREST EXPENSE Deposits 159 186 Borrowings 70 189 Total interest expense 229 375 Net interest income 2,144 1,822 Provision (benefit) for credit losses 566 (294) Net interest income after provision for credit losses 1,578 2,116 NONINTEREST INCOME Rental income on operating leases 640 569 Fee income and other service charges 118 110 Wealth management services 107 96 Service charges on deposit accounts 77 72 Factoring commissions 78 79 Cardholder services, net 76 66 Merchant services, net 27 26 Insurance commissions 34 29 Realized gain on sale of investment securities available for sale, net — 147 Fair value adjustment on marketable equity securities, net (5) 31 Bank-owned life insurance 25 27 Gain on sale of leasing equipment, net 13 78 Gain on acquisition 431 — Gain on extinguishment of debt 7 — Other noninterest income 79 147 Total noninterest income 1,707 1,477 NONINTEREST EXPENSE Depreciation on operating lease equipment 257 253 Maintenance and other operating lease expenses 142 157 Salaries and benefits 1,044 1,017 Net occupancy expense 144 140 Equipment expense 161 155 Professional fees 44 49 Third-party processing fees 77 66 FDIC insurance expense 26 38 Marketing 32 22 Merger-related expenses 202 25 Intangible asset amortization 17 34 Other noninterest expense 169 159 Total noninterest expense 2,315 2,115 Income before income taxes 970 1,478 Income tax (benefit) expense 129 348 Net income 841 1,130 Preferred stock dividends 36 32 Net income available to common stockholders 805 1,098
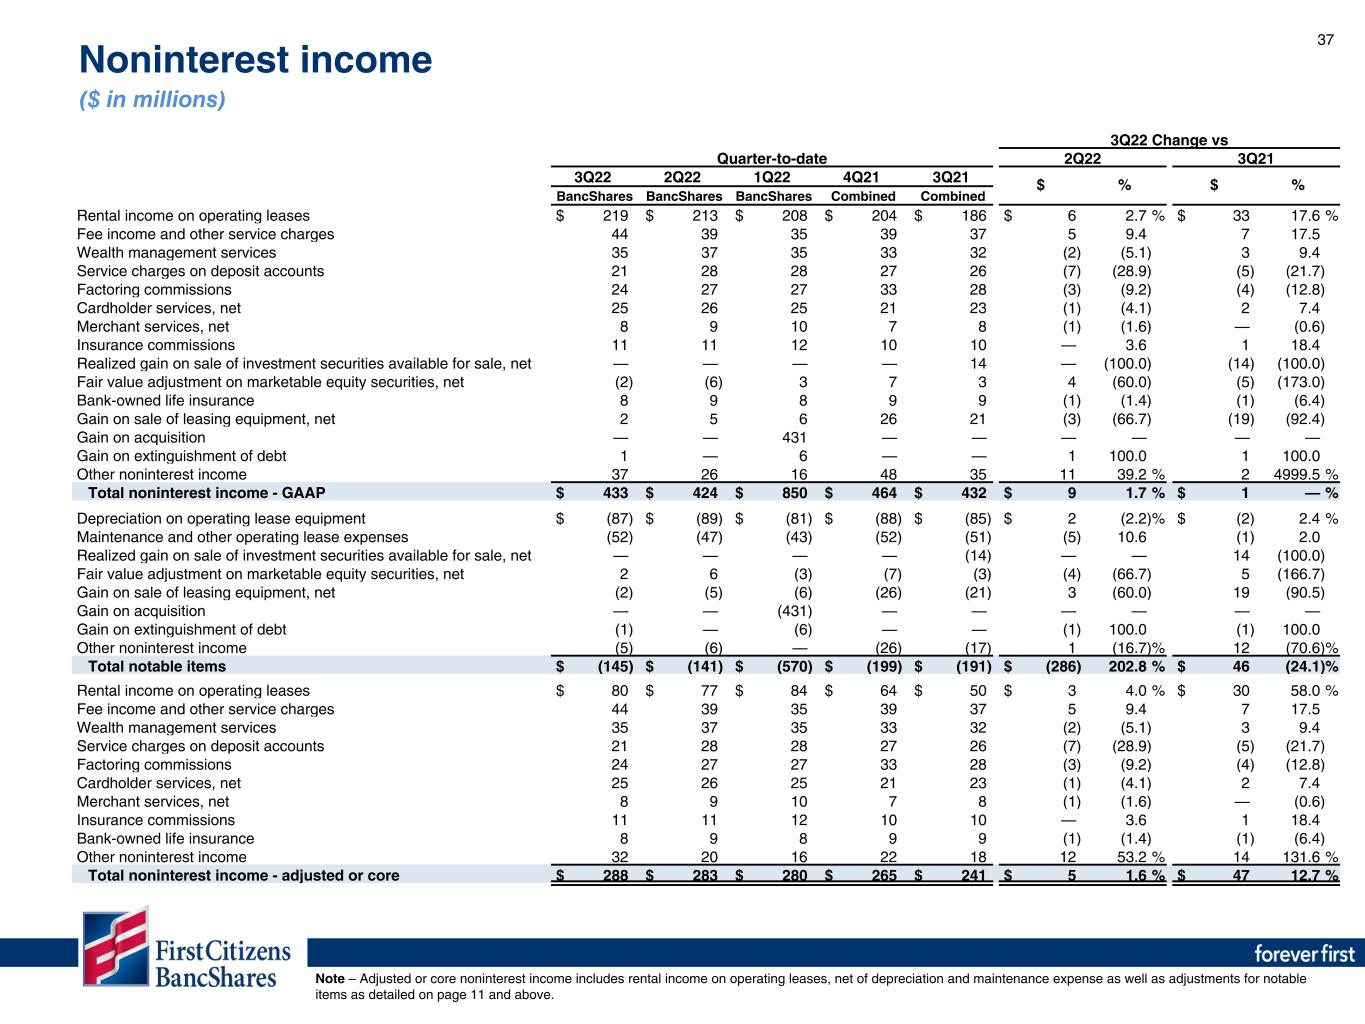
37 3Q22 Change vs Quarter-to-date 2Q22 3Q21 3Q22 2Q22 1Q22 4Q21 3Q21 $ % $ % BancShares BancShares BancShares Combined Combined Rental income on operating leases $ 219 $ 213 $ 208 $ 204 $ 186 $ 6 2.7 % $ 33 17.6 % Fee income and other service charges 44 39 35 39 37 5 9.4 7 17.5 Wealth management services 35 37 35 33 32 (2) (5.1) 3 9.4 Service charges on deposit accounts 21 28 28 27 26 (7) (28.9) (5) (21.7) Factoring commissions 24 27 27 33 28 (3) (9.2) (4) (12.8) Cardholder services, net 25 26 25 21 23 (1) (4.1) 2 7.4 Merchant services, net 8 9 10 7 8 (1) (1.6) — (0.6) Insurance commissions 11 11 12 10 10 — 3.6 1 18.4 Realized gain on sale of investment securities available for sale, net — — — — 14 — (100.0) (14) (100.0) Fair value adjustment on marketable equity securities, net (2) (6) 3 7 3 4 (60.0) (5) (173.0) Bank-owned life insurance 8 9 8 9 9 (1) (1.4) (1) (6.4) Gain on sale of leasing equipment, net 2 5 6 26 21 (3) (66.7) (19) (92.4) Gain on acquisition — — 431 — — — — — — Gain on extinguishment of debt 1 — 6 — — 1 100.0 1 100.0 Other noninterest income 37 26 16 48 35 11 39.2 % 2 4999.5 % Total noninterest income - GAAP $ 433 $ 424 $ 850 $ 464 $ 432 $ 9 1.7 % $ 1 — % Depreciation on operating lease equipment $ (87) $ (89) $ (81) $ (88) $ (85) $ 2 (2.2) % $ (2) 2.4 % Maintenance and other operating lease expenses (52) (47) (43) (52) (51) (5) 10.6 (1) 2.0 Realized gain on sale of investment securities available for sale, net — — — — (14) — — 14 (100.0) Fair value adjustment on marketable equity securities, net 2 6 (3) (7) (3) (4) (66.7) 5 (166.7) Gain on sale of leasing equipment, net (2) (5) (6) (26) (21) 3 (60.0) 19 (90.5) Gain on acquisition — — (431) — — — — — — Gain on extinguishment of debt (1) — (6) — — (1) 100.0 (1) 100.0 Other noninterest income (5) (6) — (26) (17) 1 (16.7) % 12 (70.6) % Total notable items $ (145) $ (141) $ (570) $ (199) $ (191) $ (286) 202.8 % $ 46 (24.1) % Rental income on operating leases $ 80 $ 77 $ 84 $ 64 $ 50 $ 3 4.0 % $ 30 58.0 % Fee income and other service charges 44 39 35 39 37 5 9.4 7 17.5 Wealth management services 35 37 35 33 32 (2) (5.1) 3 9.4 Service charges on deposit accounts 21 28 28 27 26 (7) (28.9) (5) (21.7) Factoring commissions 24 27 27 33 28 (3) (9.2) (4) (12.8) Cardholder services, net 25 26 25 21 23 (1) (4.1) 2 7.4 Merchant services, net 8 9 10 7 8 (1) (1.6) — (0.6) Insurance commissions 11 11 12 10 10 — 3.6 1 18.4 Bank-owned life insurance 8 9 8 9 9 (1) (1.4) (1) (6.4) Other noninterest income 32 20 16 22 18 12 53.2 % 14 131.6 % Total noninterest income - adjusted or core $ 288 $ 283 $ 280 $ 265 $ 241 $ 5 1.6 % $ 47 12.7 % Note – Adjusted or core noninterest income includes rental income on operating leases, net of depreciation and maintenance expense as well as adjustments for notable items as detailed on page 11 and above. Noninterest income ($ in millions)
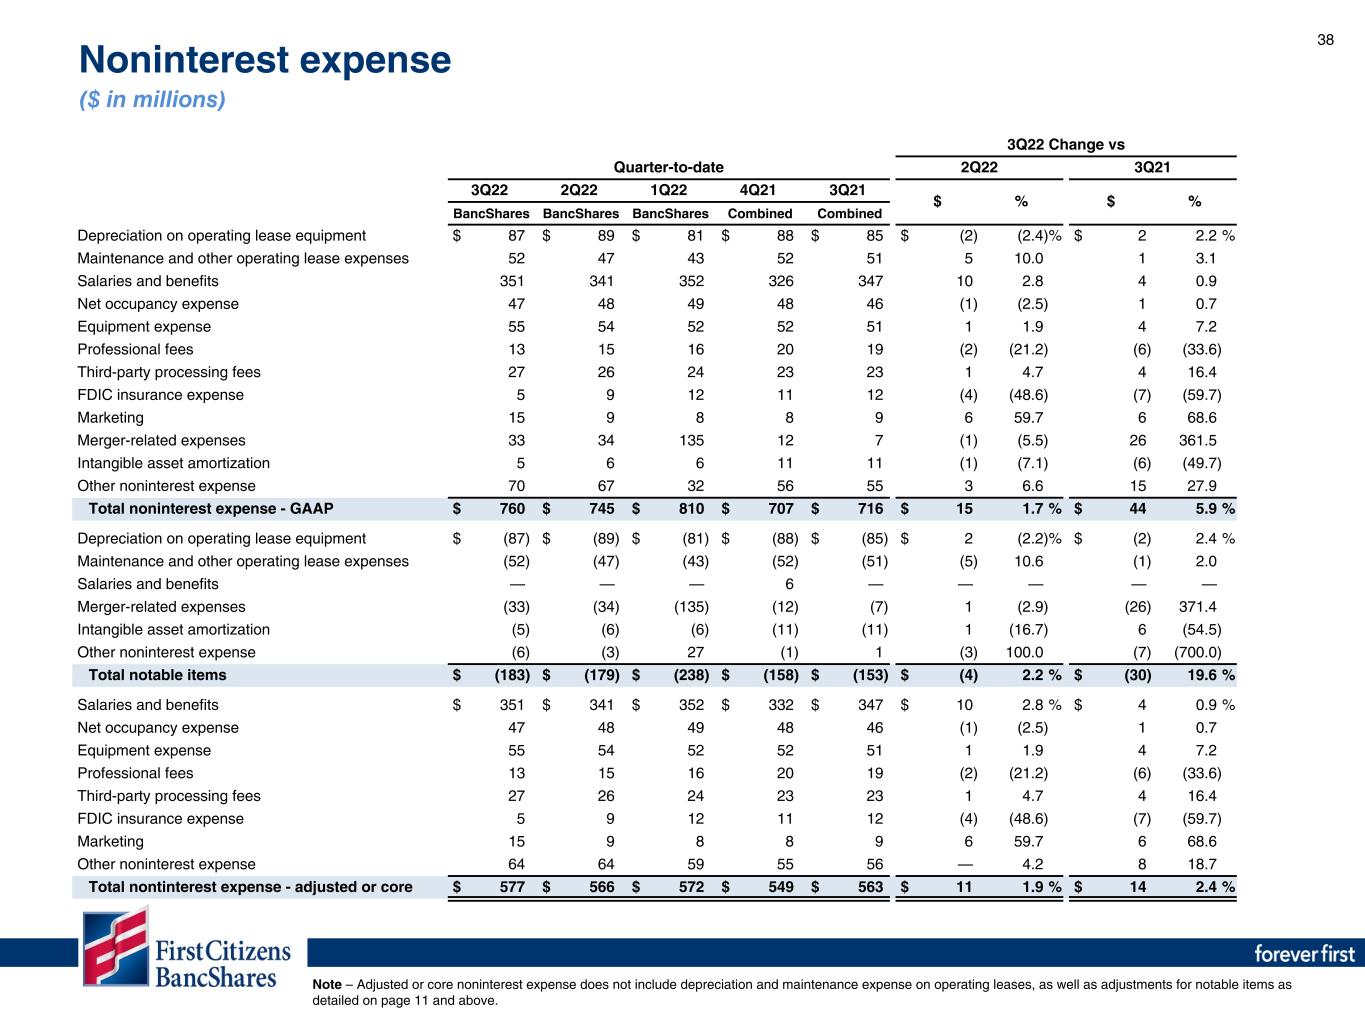
38 3Q22 Change vs Quarter-to-date 2Q22 3Q21 3Q22 2Q22 1Q22 4Q21 3Q21 $ % $ % BancShares BancShares BancShares Combined Combined Depreciation on operating lease equipment $ 87 $ 89 $ 81 $ 88 $ 85 $ (2) (2.4) % $ 2 2.2 % Maintenance and other operating lease expenses 52 47 43 52 51 5 10.0 1 3.1 Salaries and benefits 351 341 352 326 347 10 2.8 4 0.9 Net occupancy expense 47 48 49 48 46 (1) (2.5) 1 0.7 Equipment expense 55 54 52 52 51 1 1.9 4 7.2 Professional fees 13 15 16 20 19 (2) (21.2) (6) (33.6) Third-party processing fees 27 26 24 23 23 1 4.7 4 16.4 FDIC insurance expense 5 9 12 11 12 (4) (48.6) (7) (59.7) Marketing 15 9 8 8 9 6 59.7 6 68.6 Merger-related expenses 33 34 135 12 7 (1) (5.5) 26 361.5 Intangible asset amortization 5 6 6 11 11 (1) (7.1) (6) (49.7) Other noninterest expense 70 67 32 56 55 3 6.6 15 27.9 Total noninterest expense - GAAP $ 760 $ 745 $ 810 $ 707 $ 716 $ 15 1.7 % $ 44 5.9 % Depreciation on operating lease equipment $ (87) $ (89) $ (81) $ (88) $ (85) $ 2 (2.2) % $ (2) 2.4 % Maintenance and other operating lease expenses (52) (47) (43) (52) (51) (5) 10.6 (1) 2.0 Salaries and benefits — — — 6 — — — — — Merger-related expenses (33) (34) (135) (12) (7) 1 (2.9) (26) 371.4 Intangible asset amortization (5) (6) (6) (11) (11) 1 (16.7) 6 (54.5) Other noninterest expense (6) (3) 27 (1) 1 (3) 100.0 (7) (700.0) Total notable items $ (183) $ (179) $ (238) $ (158) $ (153) $ (4) 2.2 % $ (30) 19.6 % Salaries and benefits $ 351 $ 341 $ 352 $ 332 $ 347 $ 10 2.8 % $ 4 0.9 % Net occupancy expense 47 48 49 48 46 (1) (2.5) 1 0.7 Equipment expense 55 54 52 52 51 1 1.9 4 7.2 Professional fees 13 15 16 20 19 (2) (21.2) (6) (33.6) Third-party processing fees 27 26 24 23 23 1 4.7 4 16.4 FDIC insurance expense 5 9 12 11 12 (4) (48.6) (7) (59.7) Marketing 15 9 8 8 9 6 59.7 6 68.6 Other noninterest expense 64 64 59 55 56 — 4.2 8 18.7 Total nontinterest expense - adjusted or core $ 577 $ 566 $ 572 $ 549 $ 563 $ 11 1.9 % $ 14 2.4 % Noninterest expense ($ in millions) Note – Adjusted or core noninterest expense does not include depreciation and maintenance expense on operating leases, as well as adjustments for notable items as detailed on page 11 and above.
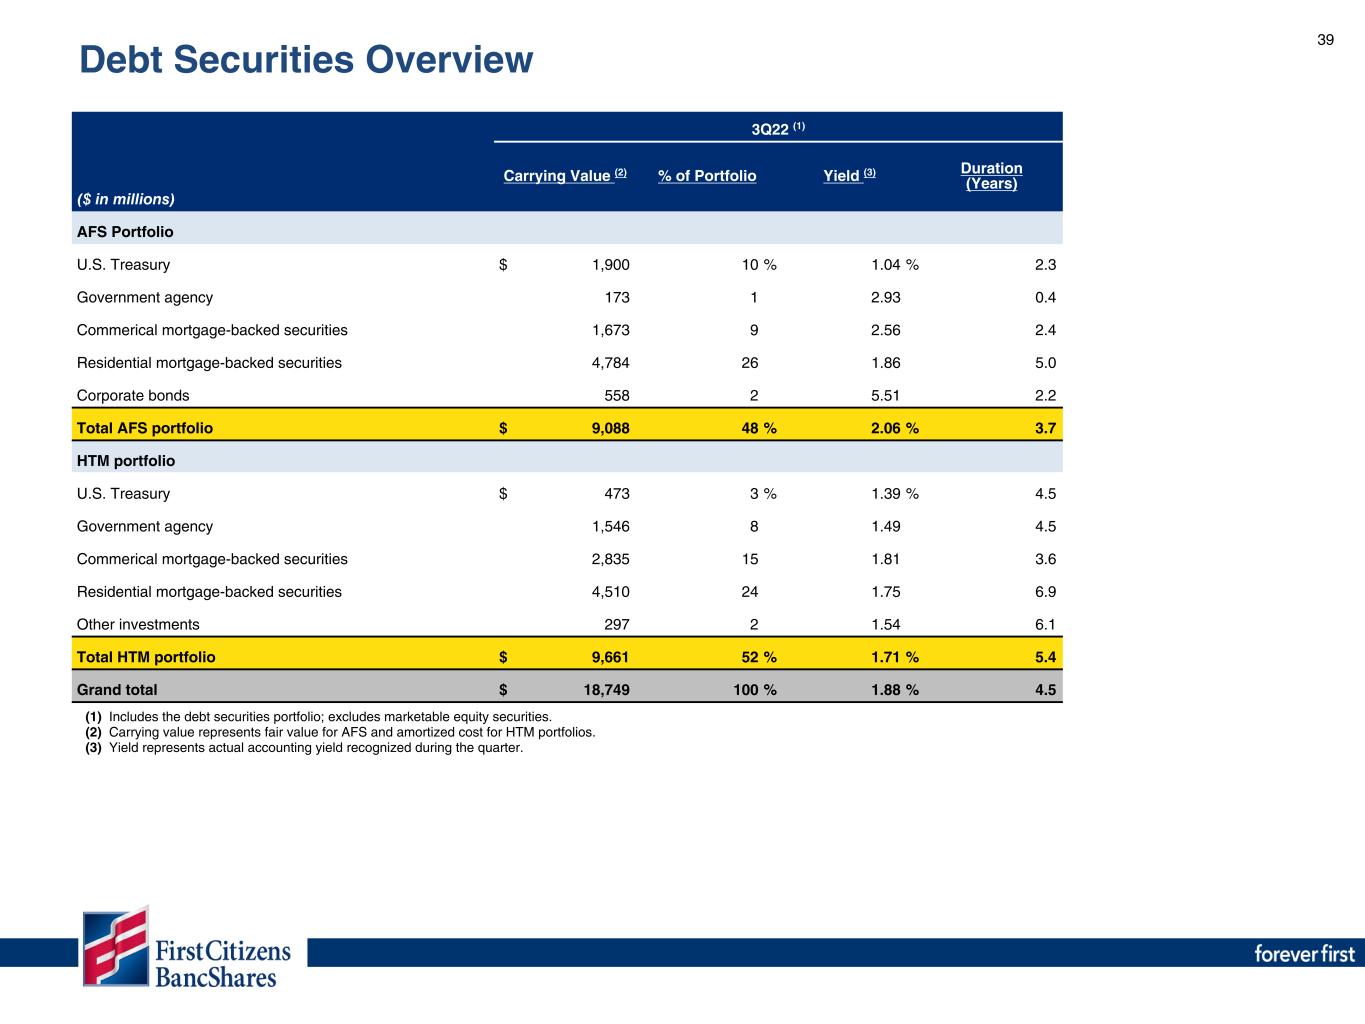
39 (1) (1) Includes the debt securities portfolio; excludes marketable equity securities. (2) Carrying value represents fair value for AFS and amortized cost for HTM portfolios. (3) Yield represents actual accounting yield recognized during the quarter. 3Q22 (1) ($ in millions) Carrying Value (2) % of Portfolio Yield (3) Duration (Years) AFS Portfolio U.S. Treasury $ 1,900 10 % 1.04 % 2.3 Government agency 173 1 2.93 0.4 Commerical mortgage-backed securities 1,673 9 2.56 2.4 Residential mortgage-backed securities 4,784 26 1.86 5.0 Corporate bonds 558 2 5.51 2.2 Total AFS portfolio $ 9,088 48 % 2.06 % 3.7 HTM portfolio U.S. Treasury $ 473 3 % 1.39 % 4.5 Government agency 1,546 8 1.49 4.5 Commerical mortgage-backed securities 2,835 15 1.81 3.6 Residential mortgage-backed securities 4,510 24 1.75 6.9 Other investments 297 2 1.54 6.1 Total HTM portfolio $ 9,661 52 % 1.71 % 5.4 Grand total $ 18,749 100 % 1.88 % 4.5 Debt Securities Overview
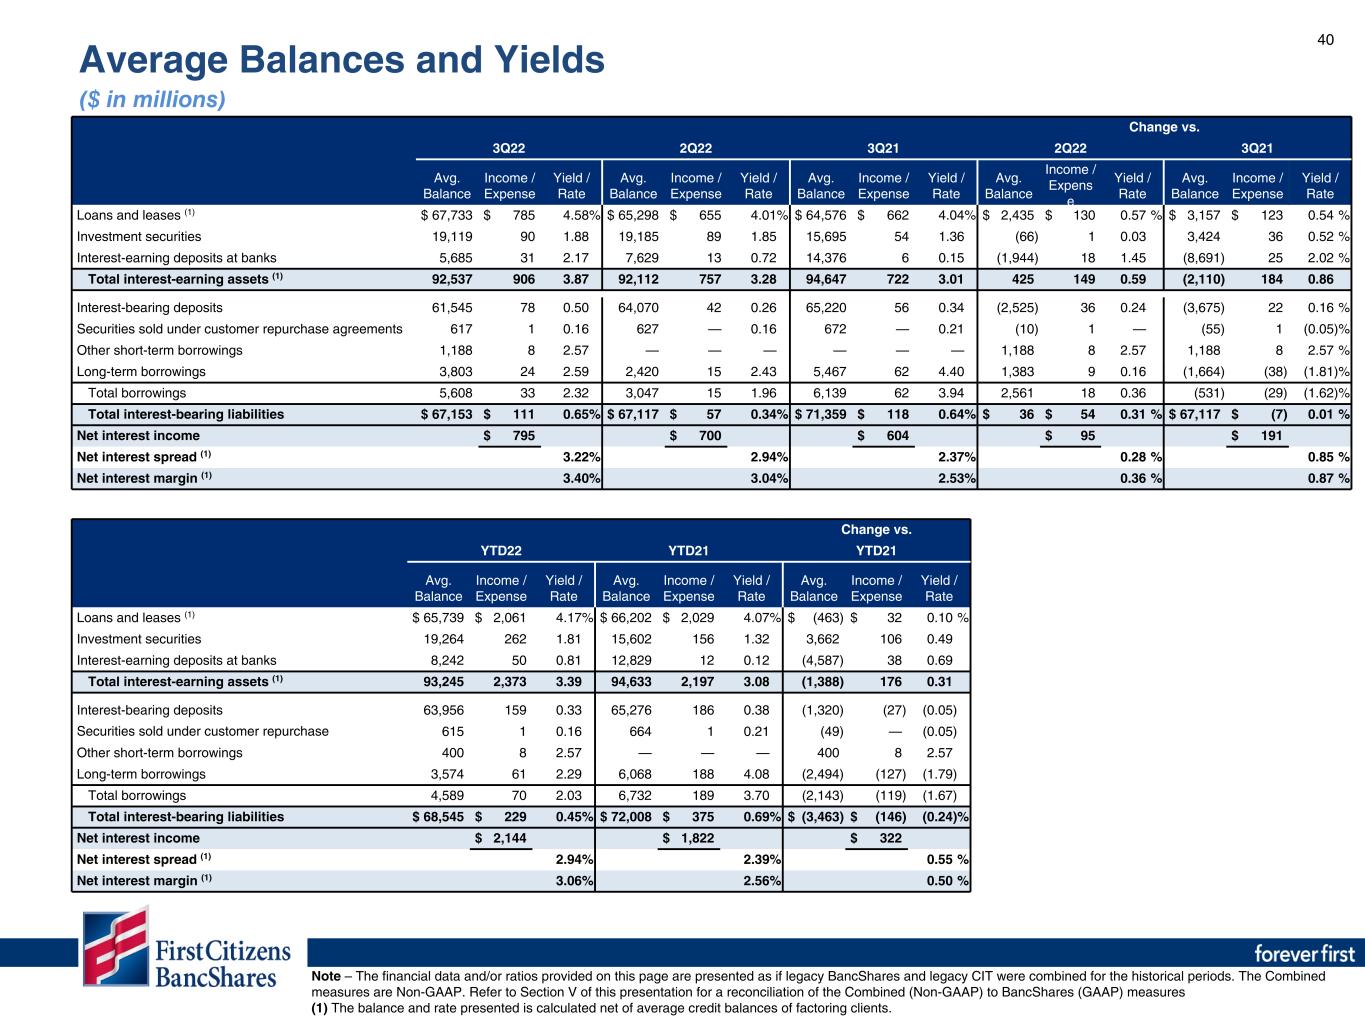
40 Change vs. 3Q22 2Q22 3Q21 2Q22 3Q21 Avg. Balance Income / Expense Yield / Rate Avg. Balance Income / Expense Yield / Rate Avg. Balance Income / Expense Yield / Rate Avg. Balance Income / Expens e Yield / Rate Avg. Balance Income / Expense Yield / Rate Loans and leases (1) $ 67,733 $ 785 4.58 % $ 65,298 $ 655 4.01 % $ 64,576 $ 662 4.04 % $ 2,435 $ 130 0.57 % $ 3,157 $ 123 0.54 % Investment securities 19,119 90 1.88 19,185 89 1.85 15,695 54 1.36 (66) 1 0.03 3,424 36 0.52 % Interest-earning deposits at banks 5,685 31 2.17 7,629 13 0.72 14,376 6 0.15 (1,944) 18 1.45 (8,691) 25 2.02 % Total interest-earning assets (1) 92,537 906 3.87 92,112 757 3.28 94,647 722 3.01 425 149 0.59 (2,110) 184 0.86 Interest-bearing deposits 61,545 78 0.50 64,070 42 0.26 65,220 56 0.34 (2,525) 36 0.24 (3,675) 22 0.16 % Securities sold under customer repurchase agreements 617 1 0.16 627 — 0.16 672 — 0.21 (10) 1 — (55) 1 (0.05) % Other short-term borrowings 1,188 8 2.57 — — — — — — 1,188 8 2.57 1,188 8 2.57 % Long-term borrowings 3,803 24 2.59 2,420 15 2.43 5,467 62 4.40 1,383 9 0.16 (1,664) (38) (1.81) % Total borrowings 5,608 33 2.32 3,047 15 1.96 6,139 62 3.94 2,561 18 0.36 (531) (29) (1.62) % Total interest-bearing liabilities $ 67,153 $ 111 0.65 % $ 67,117 $ 57 0.34 % $ 71,359 $ 118 0.64 % $ 36 $ 54 0.31 % $ 67,117 $ (7) 0.01 % Net interest income $ 795 $ 700 $ 604 $ 95 $ 191 Net interest spread (1) 3.22 % 2.94 % 2.37 % 0.28 % 0.85 % Net interest margin (1) 3.40 % 3.04 % 2.53 % 0.36 % 0.87 % Note – The financial data and/or ratios provided on this page are presented as if legacy BancShares and legacy CIT were combined for the historical periods. The Combined measures are Non-GAAP. Refer to Section V of this presentation for a reconciliation of the Combined (Non-GAAP) to BancShares (GAAP) measures (1) The balance and rate presented is calculated net of average credit balances of factoring clients. Change vs. YTD22 YTD21 YTD21 Avg. Balance Income / Expense Yield / Rate Avg. Balance Income / Expense Yield / Rate Avg. Balance Income / Expense Yield / Rate Loans and leases (1) $ 65,739 $ 2,061 4.17 % $ 66,202 $ 2,029 4.07 % $ (463) $ 32 0.10 % Investment securities 19,264 262 1.81 15,602 156 1.32 3,662 106 0.49 Interest-earning deposits at banks 8,242 50 0.81 12,829 12 0.12 (4,587) 38 0.69 Total interest-earning assets (1) 93,245 2,373 3.39 94,633 2,197 3.08 (1,388) 176 0.31 Interest-bearing deposits 63,956 159 0.33 65,276 186 0.38 (1,320) (27) (0.05) Securities sold under customer repurchase agreements 615 1 0.16 664 1 0.21 (49) — (0.05) Other short-term borrowings 400 8 2.57 — — — 400 8 2.57 Long-term borrowings 3,574 61 2.29 6,068 188 4.08 (2,494) (127) (1.79) Total borrowings 4,589 70 2.03 6,732 189 3.70 (2,143) (119) (1.67) Total interest-bearing liabilities $ 68,545 $ 229 0.45 % $ 72,008 $ 375 0.69 % $ (3,463) $ (146) (0.24) % Net interest income $ 2,144 $ 1,822 $ 322 Net interest spread (1) 2.94 % 2.39 % 0.55 % Net interest margin (1) 3.06 % 2.56 % 0.50 % Average Balances and Yields ($ in millions)
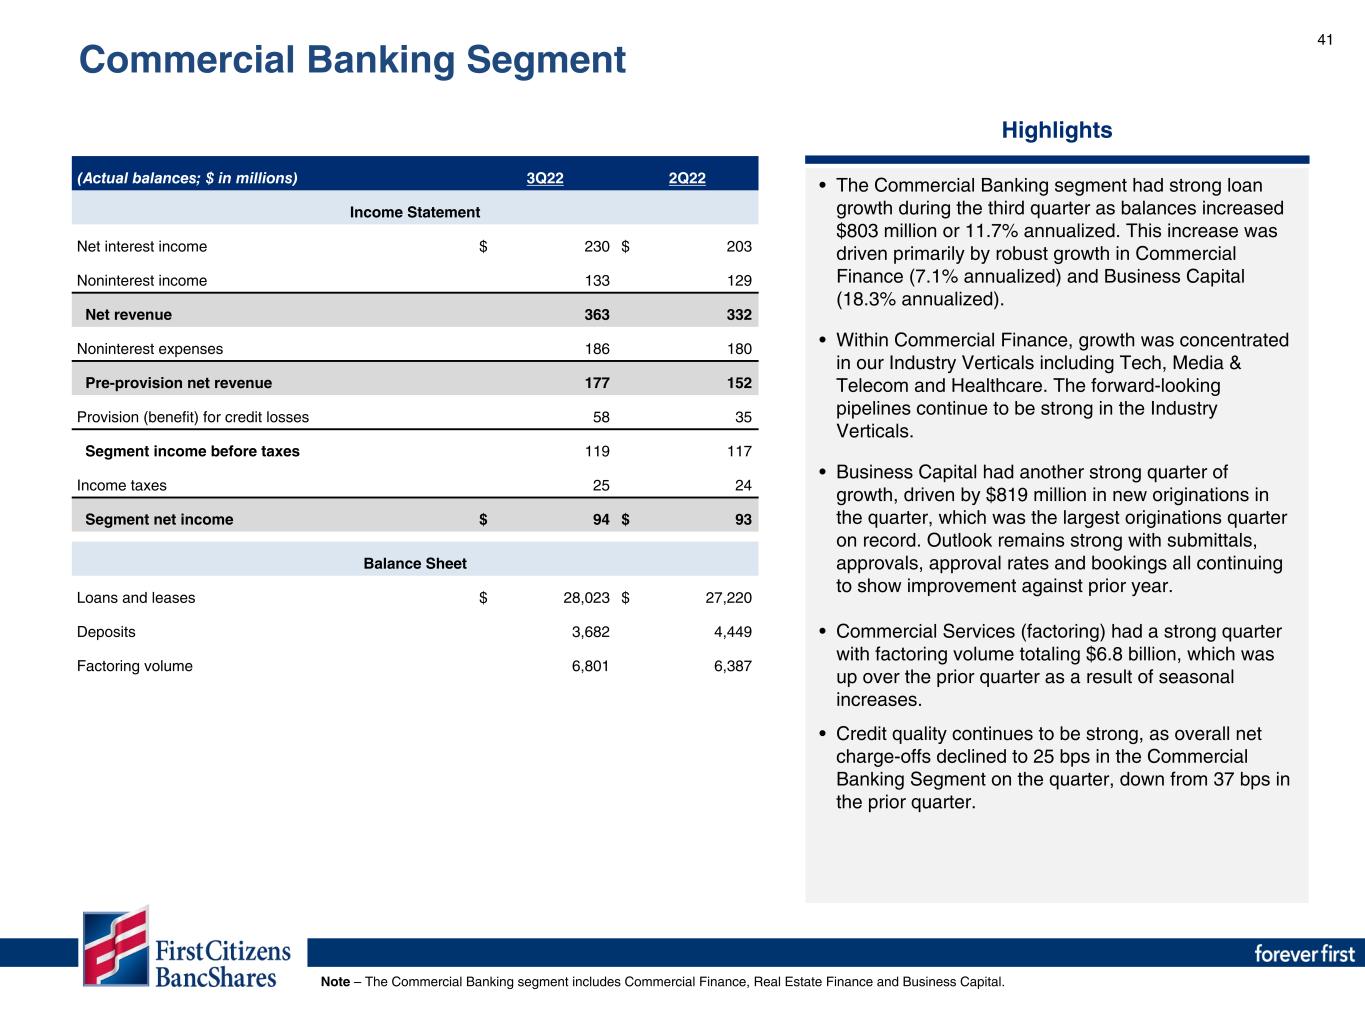
41 Highlights • The Commercial Banking segment had strong loan growth during the third quarter as balances increased $803 million or 11.7% annualized. This increase was driven primarily by robust growth in Commercial Finance (7.1% annualized) and Business Capital (18.3% annualized). • Within Commercial Finance, growth was concentrated in our Industry Verticals including Tech, Media & Telecom and Healthcare. The forward-looking pipelines continue to be strong in the Industry Verticals. • Business Capital had another strong quarter of growth, driven by $819 million in new originations in the quarter, which was the largest originations quarter on record. Outlook remains strong with submittals, approvals, approval rates and bookings all continuing to show improvement against prior year. • Commercial Services (factoring) had a strong quarter with factoring volume totaling $6.8 billion, which was up over the prior quarter as a result of seasonal increases. • Credit quality continues to be strong, as overall net charge-offs declined to 25 bps in the Commercial Banking Segment on the quarter, down from 37 bps in the prior quarter. Note – The Commercial Banking segment includes Commercial Finance, Real Estate Finance and Business Capital. (Actual balances; $ in millions) 3Q22 2Q22 Income Statement Net interest income $ 230 $ 203 Noninterest income 133 129 Net revenue 363 332 Noninterest expenses 186 180 Pre-provision net revenue 177 152 Provision (benefit) for credit losses 58 35 Segment income before taxes 119 117 Income taxes 25 24 Segment net income $ 94 $ 93 Balance Sheet Loans and leases $ 28,023 $ 27,220 Deposits 3,682 4,449 Factoring volume 6,801 6,387 Commercial Banking Segment
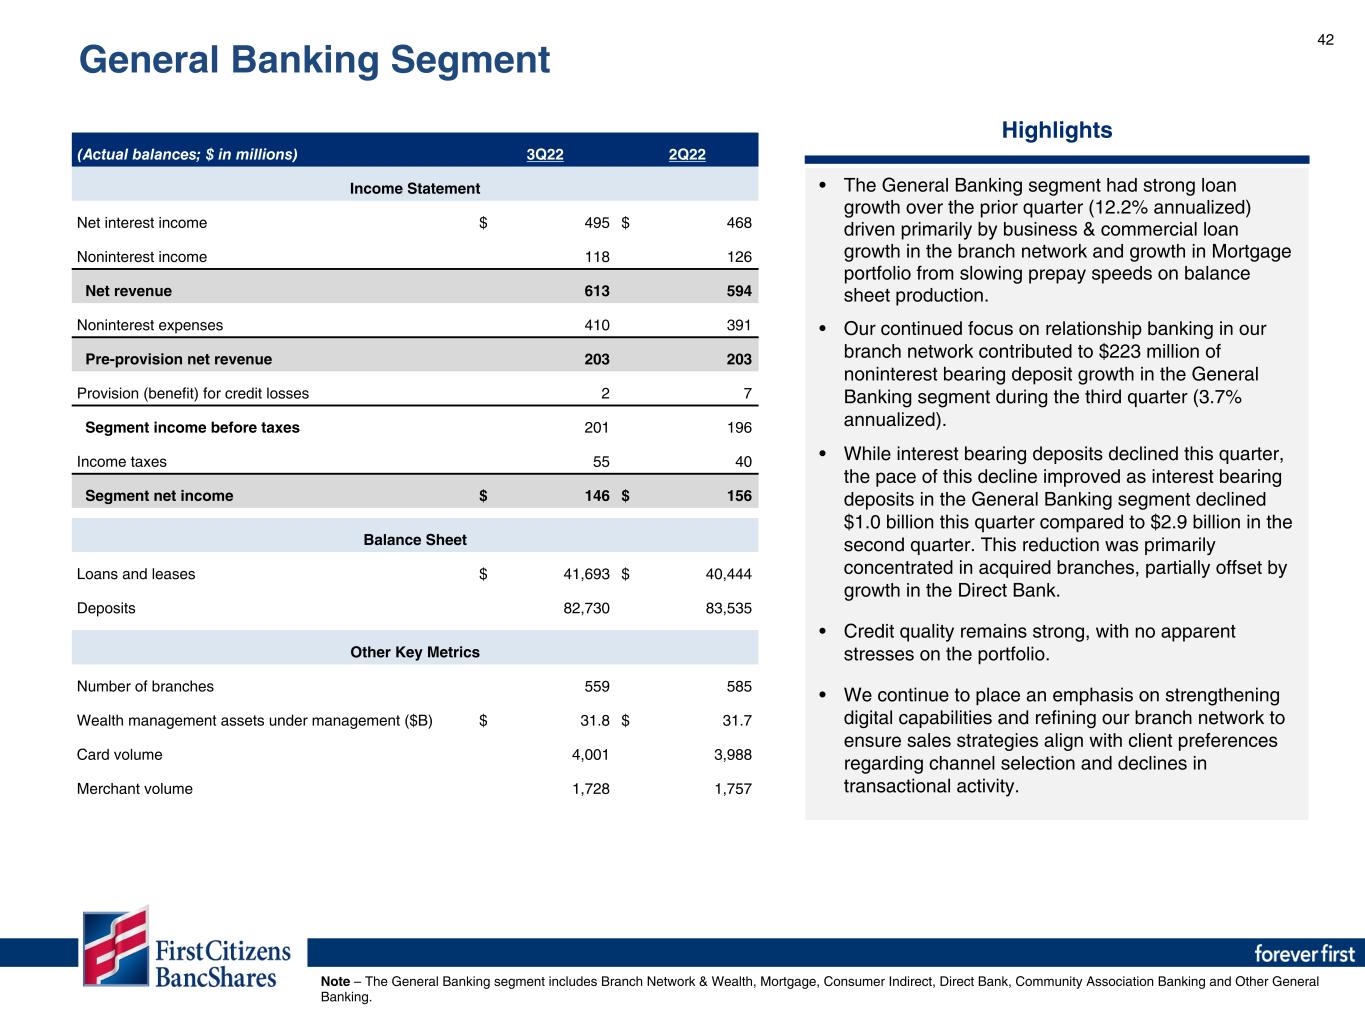
42 Highlights • The General Banking segment had strong loan growth over the prior quarter (12.2% annualized) driven primarily by business & commercial loan growth in the branch network and growth in Mortgage portfolio from slowing prepay speeds on balance sheet production. • Our continued focus on relationship banking in our branch network contributed to $223 million of noninterest bearing deposit growth in the General Banking segment during the third quarter (3.7% annualized). • While interest bearing deposits declined this quarter, the pace of this decline improved as interest bearing deposits in the General Banking segment declined $1.0 billion this quarter compared to $2.9 billion in the second quarter. This reduction was primarily concentrated in acquired branches, partially offset by growth in the Direct Bank. • Credit quality remains strong, with no apparent stresses on the portfolio. • We continue to place an emphasis on strengthening digital capabilities and refining our branch network to ensure sales strategies align with client preferences regarding channel selection and declines in transactional activity. Note – The General Banking segment includes Branch Network & Wealth, Mortgage, Consumer Indirect, Direct Bank, Community Association Banking and Other General Banking. (Actual balances; $ in millions) 3Q22 2Q22 Income Statement Net interest income $ 495 $ 468 Noninterest income 118 126 Net revenue 613 594 Noninterest expenses 410 391 Pre-provision net revenue 203 203 Provision (benefit) for credit losses 2 7 Segment income before taxes 201 196 Income taxes 55 40 Segment net income $ 146 $ 156 Balance Sheet Loans and leases $ 41,693 $ 40,444 Deposits 82,730 83,535 Other Key Metrics Number of branches 559 585 Wealth management assets under management ($B) $ 31.8 $ 31.7 Card volume 4,001 3,988 Merchant volume 1,728 1,757 General Banking Segment
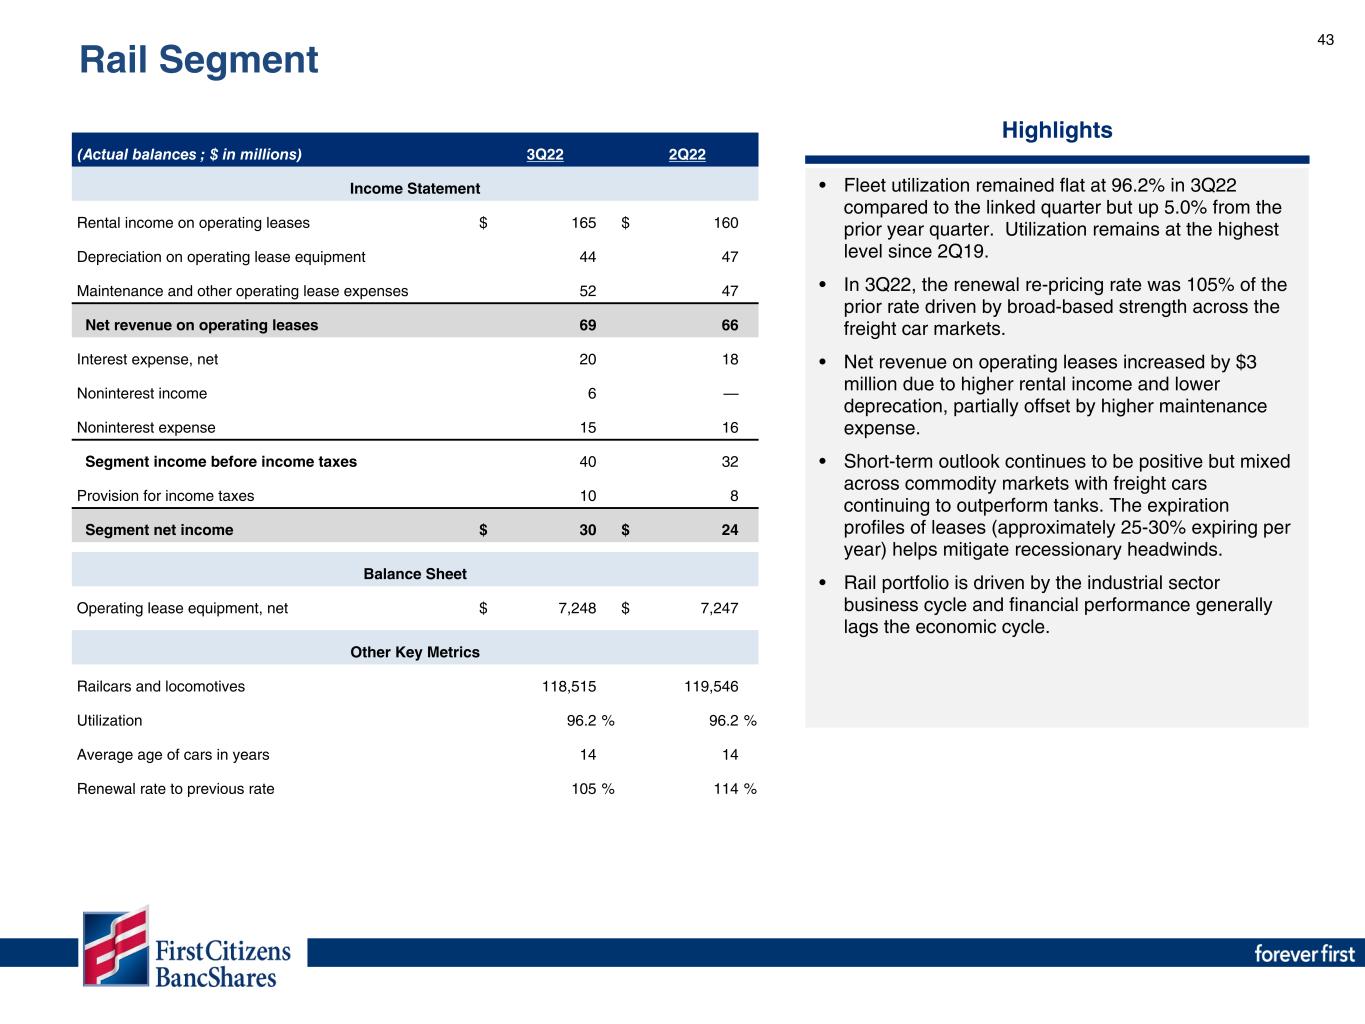
43 Highlights • Fleet utilization remained flat at 96.2% in 3Q22 compared to the linked quarter but up 5.0% from the prior year quarter. Utilization remains at the highest level since 2Q19. • In 3Q22, the renewal re-pricing rate was 105% of the prior rate driven by broad-based strength across the freight car markets. • Net revenue on operating leases increased by $3 million due to higher rental income and lower deprecation, partially offset by higher maintenance expense. • Short-term outlook continues to be positive but mixed across commodity markets with freight cars continuing to outperform tanks. The expiration profiles of leases (approximately 25-30% expiring per year) helps mitigate recessionary headwinds. • Rail portfolio is driven by the industrial sector business cycle and financial performance generally lags the economic cycle. (Actual balances ; $ in millions) 3Q22 2Q22 Income Statement Rental income on operating leases $ 165 $ 160 Depreciation on operating lease equipment 44 47 Maintenance and other operating lease expenses 52 47 Net revenue on operating leases 69 66 Interest expense, net 20 18 Noninterest income 6 — Noninterest expense 15 16 Segment income before income taxes 40 32 Provision for income taxes 10 8 Segment net income $ 30 $ 24 Balance Sheet Operating lease equipment, net $ 7,248 $ 7,247 Other Key Metrics Railcars and locomotives 118,515 119,546 Utilization 96.2 % 96.2 % Average age of cars in years 14 14 Renewal rate to previous rate 105 % 114 % Rail Segment
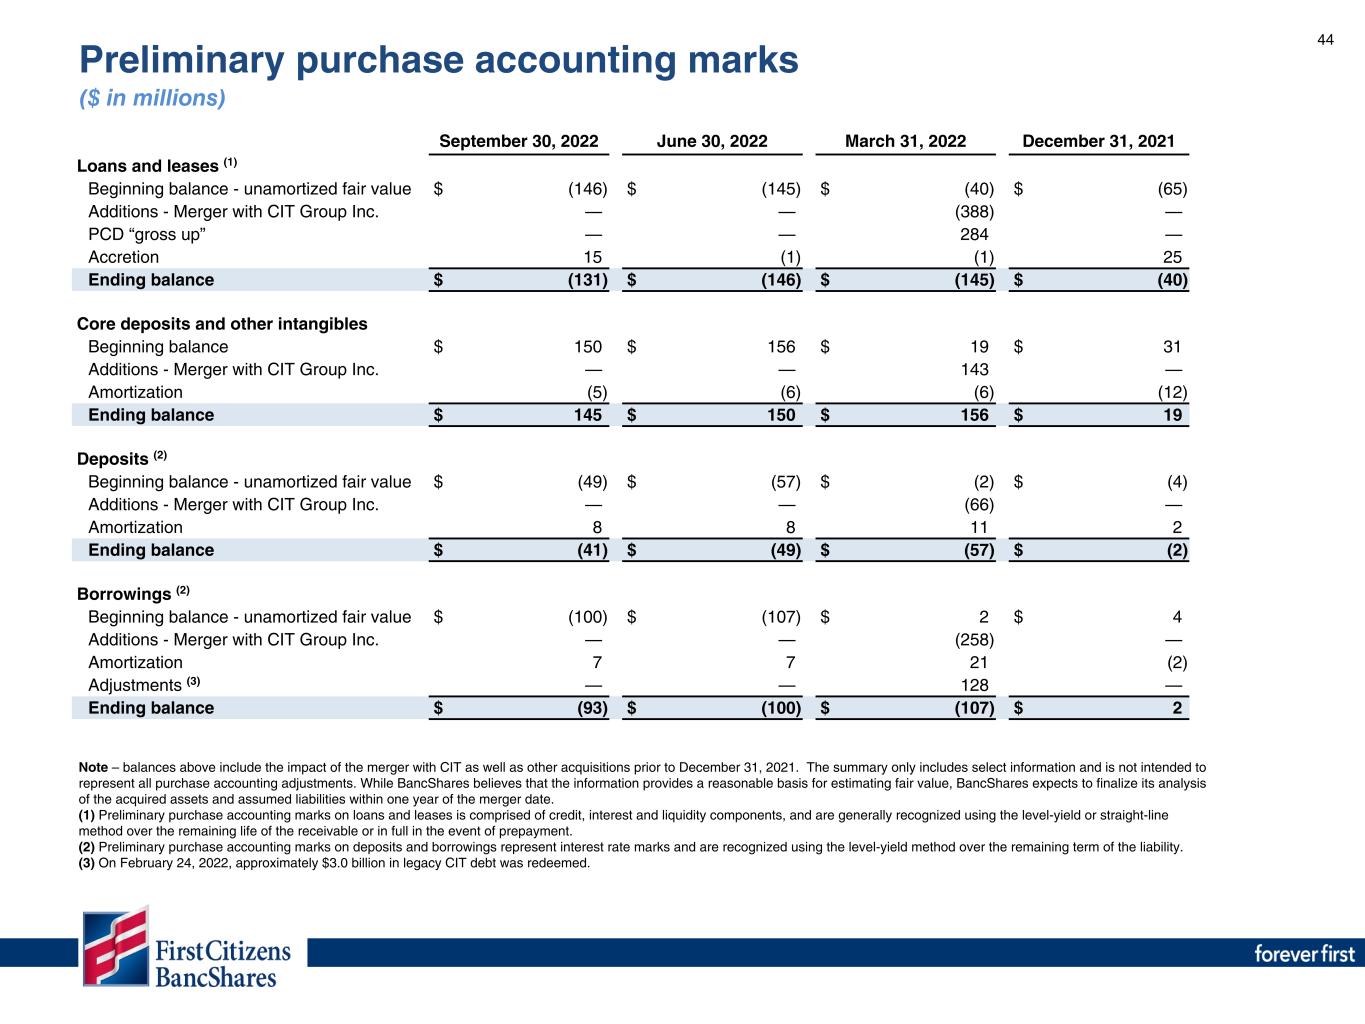
44 September 30, 2022 June 30, 2022 March 31, 2022 December 31, 2021 Loans and leases (1) Beginning balance - unamortized fair value $ (146) $ (145) $ (40) $ (65) Additions - Merger with CIT Group Inc. — — (388) — PCD “gross up” — — 284 — Accretion 15 (1) (1) 25 Ending balance $ (131) $ (146) $ (145) $ (40) Core deposits and other intangibles Beginning balance $ 150 $ 156 $ 19 $ 31 Additions - Merger with CIT Group Inc. — — 143 — Amortization (5) (6) (6) (12) Ending balance $ 145 $ 150 $ 156 $ 19 Deposits (2) Beginning balance - unamortized fair value $ (49) $ (57) $ (2) $ (4) Additions - Merger with CIT Group Inc. — — (66) — Amortization 8 8 11 2 Ending balance $ (41) $ (49) $ (57) $ (2) Borrowings (2) Beginning balance - unamortized fair value $ (100) $ (107) $ 2 $ 4 Additions - Merger with CIT Group Inc. — — (258) — Amortization 7 7 21 (2) Adjustments (3) — — 128 — Ending balance $ (93) $ (100) $ (107) $ 2 Note – balances above include the impact of the merger with CIT as well as other acquisitions prior to December 31, 2021. The summary only includes select information and is not intended to represent all purchase accounting adjustments. While BancShares believes that the information provides a reasonable basis for estimating fair value, BancShares expects to finalize its analysis of the acquired assets and assumed liabilities within one year of the merger date. (1) Preliminary purchase accounting marks on loans and leases is comprised of credit, interest and liquidity components, and are generally recognized using the level-yield or straight-line method over the remaining life of the receivable or in full in the event of prepayment. (2) Preliminary purchase accounting marks on deposits and borrowings represent interest rate marks and are recognized using the level-yield method over the remaining term of the liability. (3) On February 24, 2022, approximately $3.0 billion in legacy CIT debt was redeemed. Preliminary purchase accounting marks ($ in millions)
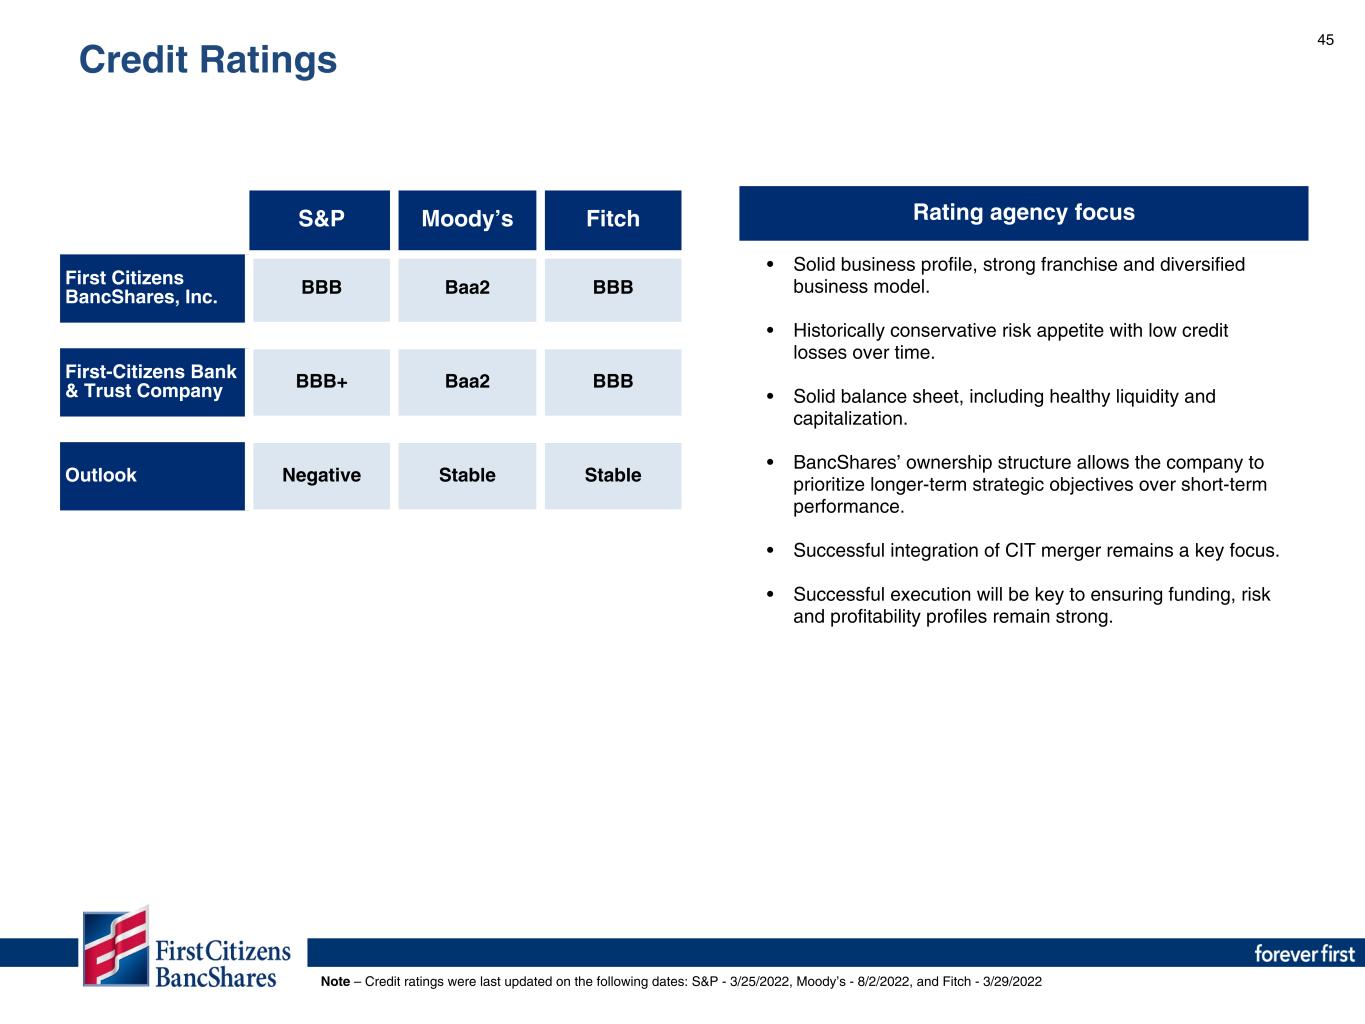
45 Rating agency focusS&P Moody’s Fitch First Citizens BancShares, Inc. BBB Baa2 BBB First-Citizens Bank & Trust Company BBB+ Baa2 BBB Outlook Negative Stable Stable • Solid business profile, strong franchise and diversified business model. • Historically conservative risk appetite with low credit losses over time. • Solid balance sheet, including healthy liquidity and capitalization. • BancShares’ ownership structure allows the company to prioritize longer-term strategic objectives over short-term performance. • Successful integration of CIT merger remains a key focus. • Successful execution will be key to ensuring funding, risk and profitability profiles remain strong. Note – Credit ratings were last updated on the following dates: S&P - 3/25/2022, Moody’s - 8/2/2022, and Fitch - 3/29/2022 Credit Ratings
Non-GAAP Reconciliations Section V
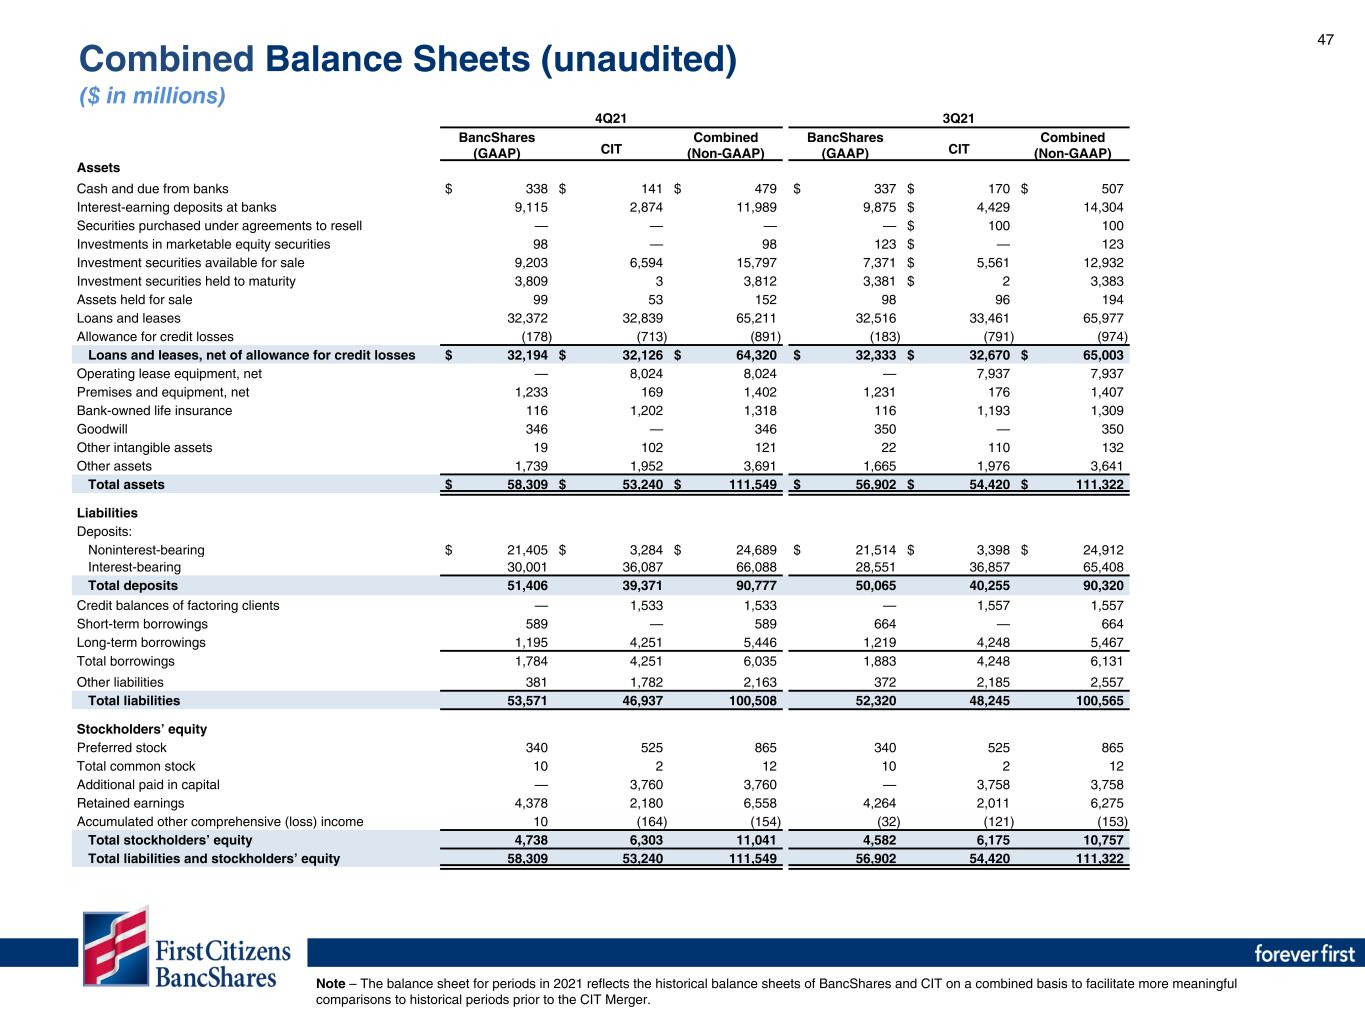
47 Note – The balance sheet for periods in 2021 reflects the historical balance sheets of BancShares and CIT on a combined basis to facilitate more meaningful comparisons to historical periods prior to the CIT Merger. Combined Balance Sheets (unaudited) ($ in millions) 4Q21 3Q21 BancShares (GAAP) CIT Combined (Non-GAAP) BancShares (GAAP) CIT Combined (Non-GAAP) Assets Cash and due from banks $ 338 $ 141 $ 479 $ 337 $ 170 $ 507 Interest-earning deposits at banks 9,115 2,874 11,989 9,875 $ 4,429 14,304 Securities purchased under agreements to resell — — — — $ 100 100 Investments in marketable equity securities 98 — 98 123 $ — 123 Investment securities available for sale 9,203 6,594 15,797 7,371 $ 5,561 12,932 Investment securities held to maturity 3,809 3 3,812 3,381 $ 2 3,383 Assets held for sale 99 53 152 98 96 194 Loans and leases 32,372 32,839 65,211 32,516 33,461 65,977 Allowance for credit losses (178) (713) (891) (183) (791) (974) Loans and leases, net of allowance for credit losses $ 32,194 $ 32,126 $ 64,320 $ 32,333 $ 32,670 $ 65,003 Operating lease equipment, net — 8,024 8,024 — 7,937 7,937 Premises and equipment, net 1,233 169 1,402 1,231 176 1,407 Bank-owned life insurance 116 1,202 1,318 116 1,193 1,309 Goodwill 346 — 346 350 — 350 Other intangible assets 19 102 121 22 110 132 Other assets 1,739 1,952 3,691 1,665 1,976 3,641 Total assets $ 58,309 $ 53,240 $ 111,549 $ 56,902 $ 54,420 $ 111,322 Liabilities Deposits: Noninterest-bearing $ 21,405 $ 3,284 $ 24,689 $ 21,514 $ 3,398 $ 24,912 Interest-bearing 30,001 36,087 66,088 28,551 36,857 65,408 Total deposits 51,406 39,371 90,777 50,065 40,255 90,320 Credit balances of factoring clients — 1,533 1,533 — 1,557 1,557 Short-term borrowings 589 — 589 664 — 664 Long-term borrowings 1,195 4,251 5,446 1,219 4,248 5,467 Total borrowings 1,784 4,251 6,035 1,883 4,248 6,131 Other liabilities 381 1,782 2,163 372 2,185 2,557 Total liabilities 53,571 46,937 100,508 52,320 48,245 100,565 Stockholders’ equity Preferred stock 340 525 865 340 525 865 Total common stock 10 2 12 10 2 12 Additional paid in capital — 3,760 3,760 — 3,758 3,758 Retained earnings 4,378 2,180 6,558 4,264 2,011 6,275 Accumulated other comprehensive (loss) income 10 (164) (154) (32) (121) (153) Total stockholders’ equity 4,738 6,303 11,041 4,582 6,175 10,757 Total liabilities and stockholders’ equity 58,309 53,240 111,549 56,902 54,420 111,322
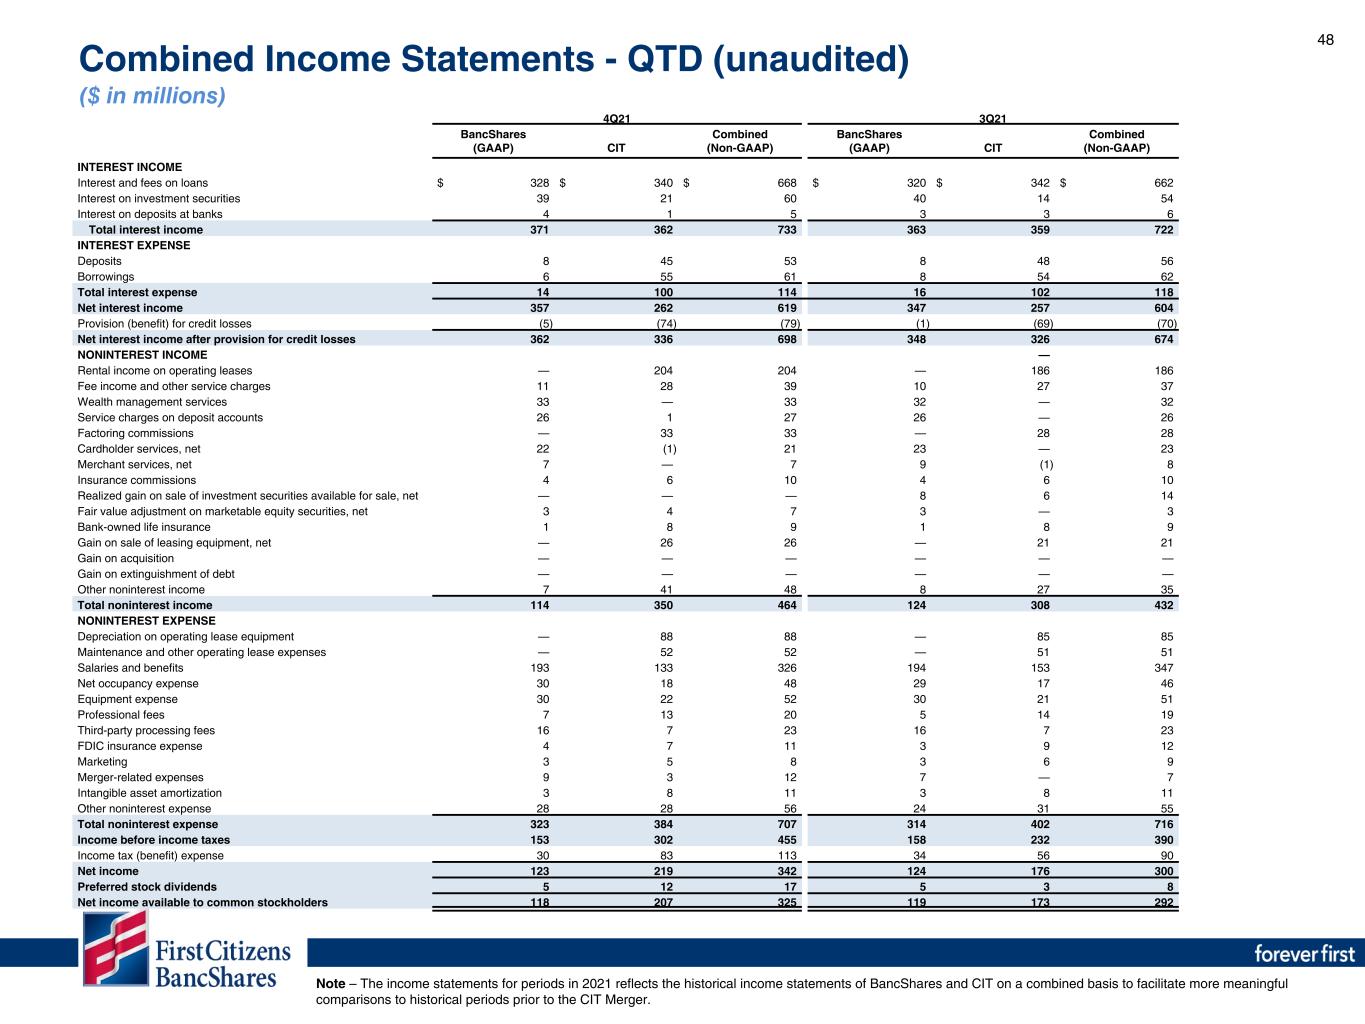
48 Combined Income Statements - QTD (unaudited) ($ in millions) Note – The income statements for periods in 2021 reflects the historical income statements of BancShares and CIT on a combined basis to facilitate more meaningful comparisons to historical periods prior to the CIT Merger. 4Q21 3Q21 BancShares (GAAP) CIT Combined (Non-GAAP) BancShares (GAAP) CIT Combined (Non-GAAP) INTEREST INCOME Interest and fees on loans $ 328 $ 340 $ 668 $ 320 $ 342 $ 662 Interest on investment securities 39 21 60 40 14 54 Interest on deposits at banks 4 1 5 3 3 6 Total interest income 371 362 733 363 359 722 INTEREST EXPENSE Deposits 8 45 53 8 48 56 Borrowings 6 55 61 8 54 62 Total interest expense 14 100 114 16 102 118 Net interest income 357 262 619 347 257 604 Provision (benefit) for credit losses (5) (74) (79) (1) (69) (70) Net interest income after provision for credit losses 362 336 698 348 326 674 NONINTEREST INCOME — Rental income on operating leases — 204 204 — 186 186 Fee income and other service charges 11 28 39 10 27 37 Wealth management services 33 — 33 32 — 32 Service charges on deposit accounts 26 1 27 26 — 26 Factoring commissions — 33 33 — 28 28 Cardholder services, net 22 (1) 21 23 — 23 Merchant services, net 7 — 7 9 (1) 8 Insurance commissions 4 6 10 4 6 10 Realized gain on sale of investment securities available for sale, net — — — 8 6 14 Fair value adjustment on marketable equity securities, net 3 4 7 3 — 3 Bank-owned life insurance 1 8 9 1 8 9 Gain on sale of leasing equipment, net — 26 26 — 21 21 Gain on acquisition — — — — — — Gain on extinguishment of debt — — — — — — Other noninterest income 7 41 48 8 27 35 Total noninterest income 114 350 464 124 308 432 NONINTEREST EXPENSE Depreciation on operating lease equipment — 88 88 — 85 85 Maintenance and other operating lease expenses — 52 52 — 51 51 Salaries and benefits 193 133 326 194 153 347 Net occupancy expense 30 18 48 29 17 46 Equipment expense 30 22 52 30 21 51 Professional fees 7 13 20 5 14 19 Third-party processing fees 16 7 23 16 7 23 FDIC insurance expense 4 7 11 3 9 12 Marketing 3 5 8 3 6 9 Merger-related expenses 9 3 12 7 — 7 Intangible asset amortization 3 8 11 3 8 11 Other noninterest expense 28 28 56 24 31 55 Total noninterest expense 323 384 707 314 402 716 Income before income taxes 153 302 455 158 232 390 Income tax (benefit) expense 30 83 113 34 56 90 Net income 123 219 342 124 176 300 Preferred stock dividends 5 12 17 5 3 8 Net income available to common stockholders 118 207 325 119 173 292

49 Combined Income Statements - YTD (unaudited) ($ in millions) Note – The income statements for periods in 2021 reflects the historical income statements of BancShares and CIT on a combined basis to facilitate more meaningful comparisons to historical periods prior to the CIT Merger. YTD 9/30/21 BancShares (GAAP) CIT Combined (Non-GAAP) INTEREST INCOME Interest and fees on loans $ 967 $ 1,062 $ 2,029 Interest on investment securities 106 50 156 Interest on deposits at banks 7 5 12 Total interest income 1,080 1,117 2,197 INTEREST EXPENSE Deposits 25 161 186 Borrowings 22 167 189 Total interest expense 47 328 375 Net interest income 1,033 789 1,822 Provision (benefit) for credit losses (32) (262) (294) Net interest income after provision for credit losses 1,065 1,051 2,116 NONINTEREST INCOME Rental income on operating leases — 569 569 Fee income and other service charges 31 79 110 Wealth management services 96 — 96 Service charges on deposit accounts 69 3 72 Factoring commissions — 79 79 Cardholder services, net 65 1 66 Merchant services, net 26 — 26 Insurance commissions 12 17 29 Realized gain on sale of investment securities available for sale, net 33 114 147 Fair value adjustment on marketable equity securities, net 31 — 31 Bank-owned life insurance 2 25 27 Gain on sale of leasing equipment, net — 78 78 Gain on acquisition — — — Gain on extinguishment of debt — — — Other noninterest income 29 118 147 Total noninterest income 394 1,083 1,477 NONINTEREST EXPENSE Depreciation on operating lease equipment — 253 253 Maintenance and other operating lease expenses — 157 157 Salaries and benefits 566 451 1,017 Net occupancy expense 87 53 140 Equipment expense 89 66 155 Professional fees 13 36 49 Third-party processing fees 44 22 66 FDIC insurance expense 10 28 38 Marketing 7 15 22 Merger-related expenses 20 5 25 Intangible asset amortization 9 25 34 Other noninterest expense 66 93 159 Total noninterest expense 911 1,204 2,115 Income before income taxes 548 930 1,478 Income tax (benefit) expense 124 224 348 Net income 424 706 1,130 Preferred stock dividends 14 18 32 Net income available to common stockholders 410 688 1,098
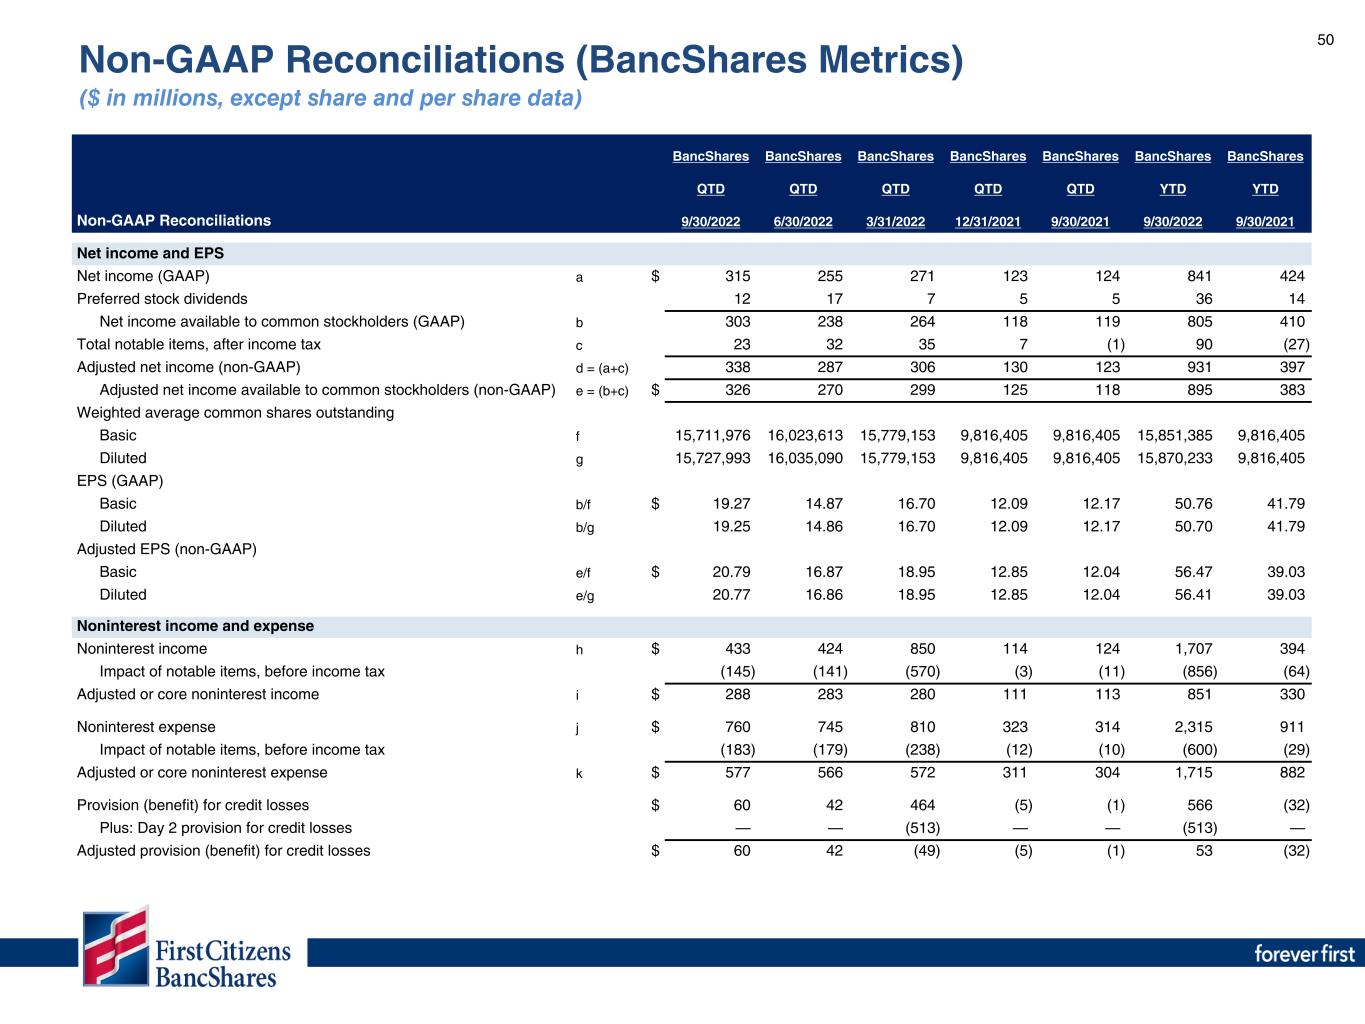
50 BancShares BancShares BancShares BancShares BancShares BancShares BancShares QTD QTD QTD QTD QTD YTD YTD Non-GAAP Reconciliations 9/30/2022 6/30/2022 3/31/2022 12/31/2021 9/30/2021 9/30/2022 9/30/2021 Net income and EPS Net income (GAAP) a $ 315 255 271 123 124 841 424 Preferred stock dividends 12 17 7 5 5 36 14 Net income available to common stockholders (GAAP) b 303 238 264 118 119 805 410 Total notable items, after income tax c 23 32 35 7 (1) 90 (27) Adjusted net income (non-GAAP) d = (a+c) 338 287 306 130 123 931 397 Adjusted net income available to common stockholders (non-GAAP) e = (b+c) $ 326 270 299 125 118 895 383 Weighted average common shares outstanding Basic f 15,711,976 16,023,613 15,779,153 9,816,405 9,816,405 15,851,385 9,816,405 Diluted g 15,727,993 16,035,090 15,779,153 9,816,405 9,816,405 15,870,233 9,816,405 EPS (GAAP) Basic b/f $ 19.27 14.87 16.70 12.09 12.17 50.76 41.79 Diluted b/g 19.25 14.86 16.70 12.09 12.17 50.70 41.79 Adjusted EPS (non-GAAP) Basic e/f $ 20.79 16.87 18.95 12.85 12.04 56.47 39.03 Diluted e/g 20.77 16.86 18.95 12.85 12.04 56.41 39.03 Noninterest income and expense Noninterest income h $ 433 424 850 114 124 1,707 394 Impact of notable items, before income tax (145) (141) (570) (3) (11) (856) (64) Adjusted or core noninterest income i $ 288 283 280 111 113 851 330 Noninterest expense j $ 760 745 810 323 314 2,315 911 Impact of notable items, before income tax (183) (179) (238) (12) (10) (600) (29) Adjusted or core noninterest expense k $ 577 566 572 311 304 1,715 882 Provision (benefit) for credit losses $ 60 42 464 (5) (1) 566 (32) Plus: Day 2 provision for credit losses — — (513) — — (513) — Adjusted provision (benefit) for credit losses $ 60 42 (49) (5) (1) 53 (32) Non-GAAP Reconciliations (BancShares Metrics) ($ in millions, except share and per share data)
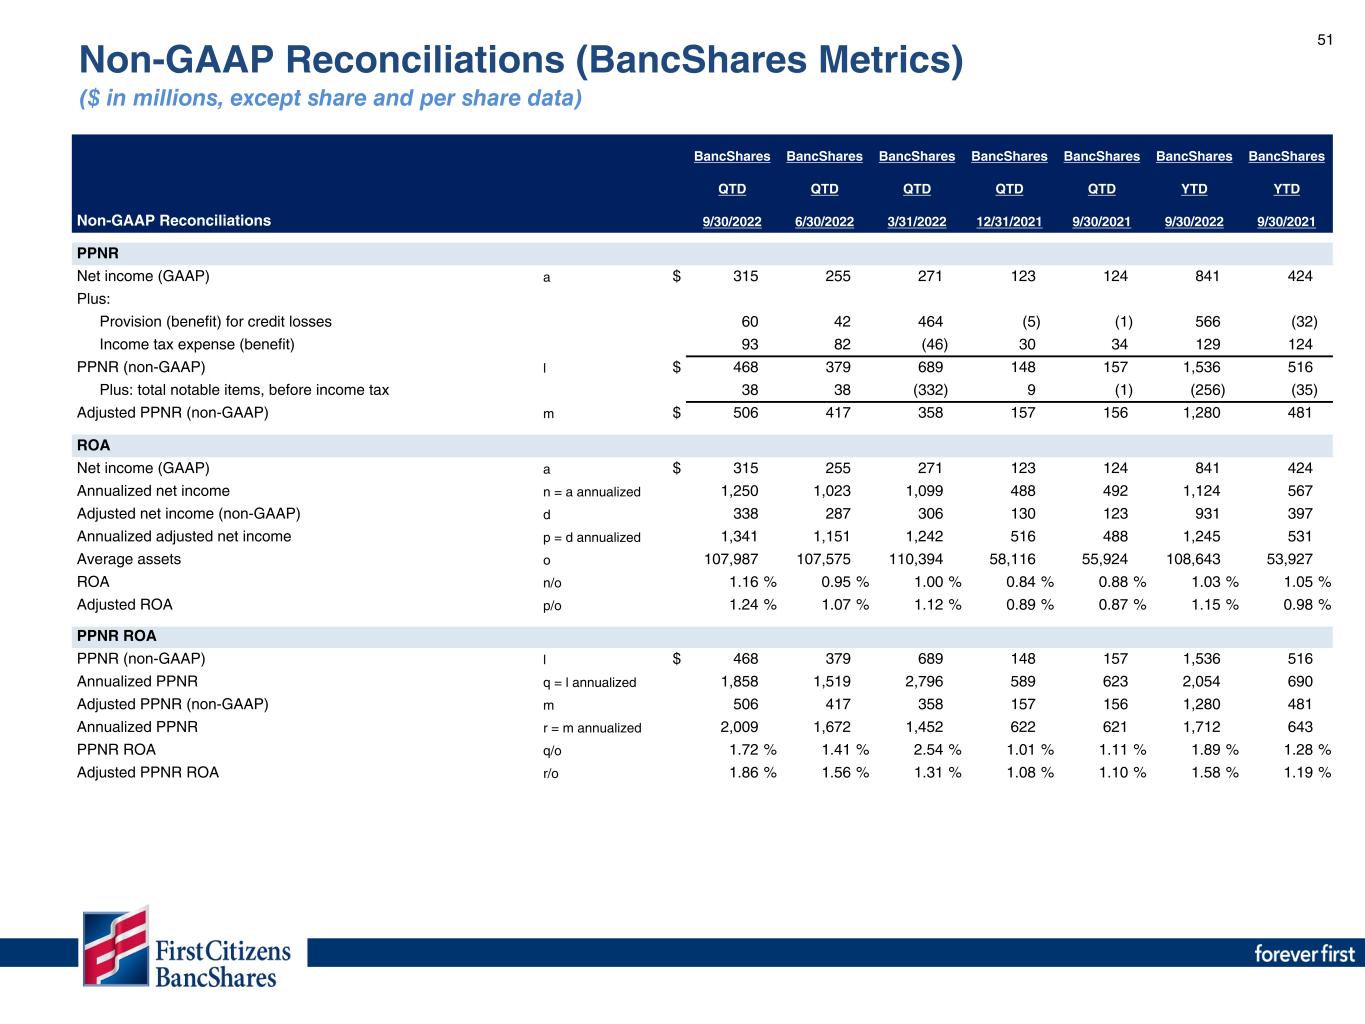
51 Non-GAAP Reconciliations (BancShares Metrics) ($ in millions, except share and per share data) BancShares BancShares BancShares BancShares BancShares BancShares BancShares QTD QTD QTD QTD QTD YTD YTD Non-GAAP Reconciliations 9/30/2022 6/30/2022 3/31/2022 12/31/2021 9/30/2021 9/30/2022 9/30/2021 PPNR Net income (GAAP) a $ 315 255 271 123 124 841 424 Plus: Provision (benefit) for credit losses 60 42 464 (5) (1) 566 (32) Income tax expense (benefit) 93 82 (46) 30 34 129 124 PPNR (non-GAAP) l $ 468 379 689 148 157 1,536 516 Plus: total notable items, before income tax 38 38 (332) 9 (1) (256) (35) Adjusted PPNR (non-GAAP) m $ 506 417 358 157 156 1,280 481 ROA Net income (GAAP) a $ 315 255 271 123 124 841 424 Annualized net income n = a annualized 1,250 1,023 1,099 488 492 1,124 567 Adjusted net income (non-GAAP) d 338 287 306 130 123 931 397 Annualized adjusted net income p = d annualized 1,341 1,151 1,242 516 488 1,245 531 Average assets o 107,987 107,575 110,394 58,116 55,924 108,643 53,927 ROA n/o 1.16 % 0.95 % 1.00 % 0.84 % 0.88 % 1.03 % 1.05 % Adjusted ROA p/o 1.24 % 1.07 % 1.12 % 0.89 % 0.87 % 1.15 % 0.98 % PPNR ROA PPNR (non-GAAP) l $ 468 379 689 148 157 1,536 516 Annualized PPNR q = l annualized 1,858 1,519 2,796 589 623 2,054 690 Adjusted PPNR (non-GAAP) m 506 417 358 157 156 1,280 481 Annualized PPNR r = m annualized 2,009 1,672 1,452 622 621 1,712 643 PPNR ROA q/o 1.72 % 1.41 % 2.54 % 1.01 % 1.11 % 1.89 % 1.28 % Adjusted PPNR ROA r/o 1.86 % 1.56 % 1.31 % 1.08 % 1.10 % 1.58 % 1.19 %
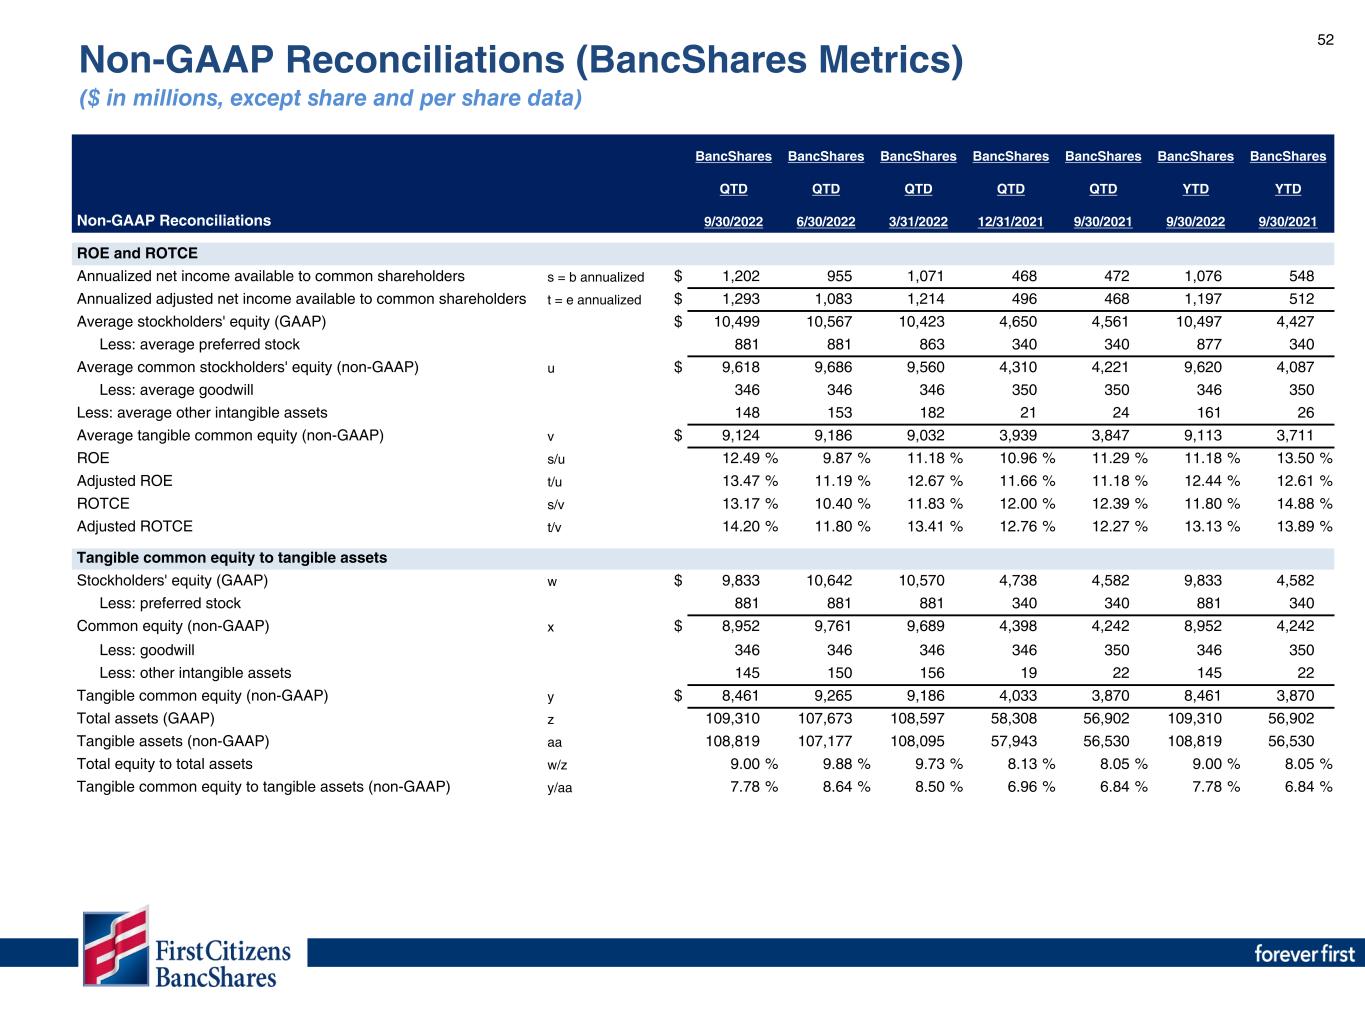
52 Non-GAAP Reconciliations (BancShares Metrics) ($ in millions, except share and per share data) BancShares BancShares BancShares BancShares BancShares BancShares BancShares QTD QTD QTD QTD QTD YTD YTD Non-GAAP Reconciliations 9/30/2022 6/30/2022 3/31/2022 12/31/2021 9/30/2021 9/30/2022 9/30/2021 ROE and ROTCE Annualized net income available to common shareholders s = b annualized $ 1,202 955 1,071 468 472 1,076 548 Annualized adjusted net income available to common shareholders t = e annualized $ 1,293 1,083 1,214 496 468 1,197 512 Average stockholders' equity (GAAP) $ 10,499 10,567 10,423 4,650 4,561 10,497 4,427 Less: average preferred stock 881 881 863 340 340 877 340 Average common stockholders' equity (non-GAAP) u $ 9,618 9,686 9,560 4,310 4,221 9,620 4,087 Less: average goodwill 346 346 346 350 350 346 350 Less: average other intangible assets 148 153 182 21 24 161 26 Average tangible common equity (non-GAAP) v $ 9,124 9,186 9,032 3,939 3,847 9,113 3,711 ROE s/u 12.49 % 9.87 % 11.18 % 10.96 % 11.29 % 11.18 % 13.50 % Adjusted ROE t/u 13.47 % 11.19 % 12.67 % 11.66 % 11.18 % 12.44 % 12.61 % ROTCE s/v 13.17 % 10.40 % 11.83 % 12.00 % 12.39 % 11.80 % 14.88 % Adjusted ROTCE t/v 14.20 % 11.80 % 13.41 % 12.76 % 12.27 % 13.13 % 13.89 % Tangible common equity to tangible assets Stockholders' equity (GAAP) w $ 9,833 10,642 10,570 4,738 4,582 9,833 4,582 Less: preferred stock 881 881 881 340 340 881 340 Common equity (non-GAAP) x $ 8,952 9,761 9,689 4,398 4,242 8,952 4,242 Less: goodwill 346 346 346 346 350 346 350 Less: other intangible assets 145 150 156 19 22 145 22 Tangible common equity (non-GAAP) y $ 8,461 9,265 9,186 4,033 3,870 8,461 3,870 Total assets (GAAP) z 109,310 107,673 108,597 58,308 56,902 109,310 56,902 Tangible assets (non-GAAP) aa 108,819 107,177 108,095 57,943 56,530 108,819 56,530 Total equity to total assets w/z 9.00 % 9.88 % 9.73 % 8.13 % 8.05 % 9.00 % 8.05 % Tangible common equity to tangible assets (non-GAAP) y/aa 7.78 % 8.64 % 8.50 % 6.96 % 6.84 % 7.78 % 6.84 %

53 Non-GAAP Reconciliations (BancShares Metrics) ($ in millions, except share and per share data) BancShares BancShares BancShares BancShares BancShares BancShares BancShares QTD QTD QTD QTD QTD YTD YTD Non-GAAP Reconciliations 9/30/2022 6/30/2022 3/31/2022 12/31/2021 9/30/2021 9/30/2022 9/30/2021 Book value and tangible book value per common share Common shares outstanding at period end bb 14,976,127 16,002,385 16,001,508 9,816,405 9,816,405 14,976,127 9,816,405 Book value per share x/bb $ 597.75 609.95 605.48 447.95 432.07 597.75 432.07 Tangible book value per share y/bb $ 564.97 578.92 574.09 410.74 394.15 564.97 394.15 Efficiency ratio Net interest income cc $ 795 700 649 357 347 2,144 1,033 Efficiency ratio (GAAP) j / (h + cc) 61.91 % 66.34 % 53.96 % 68.52 % 66.58 % 60.11 % 63.81 % Adjusted efficiency ratio (non-GAAP)(1) k / (i + cc) 53.32 % 57.55 % 61.50 % 66.31 % 66.09 % 57.25 % 64.69 %
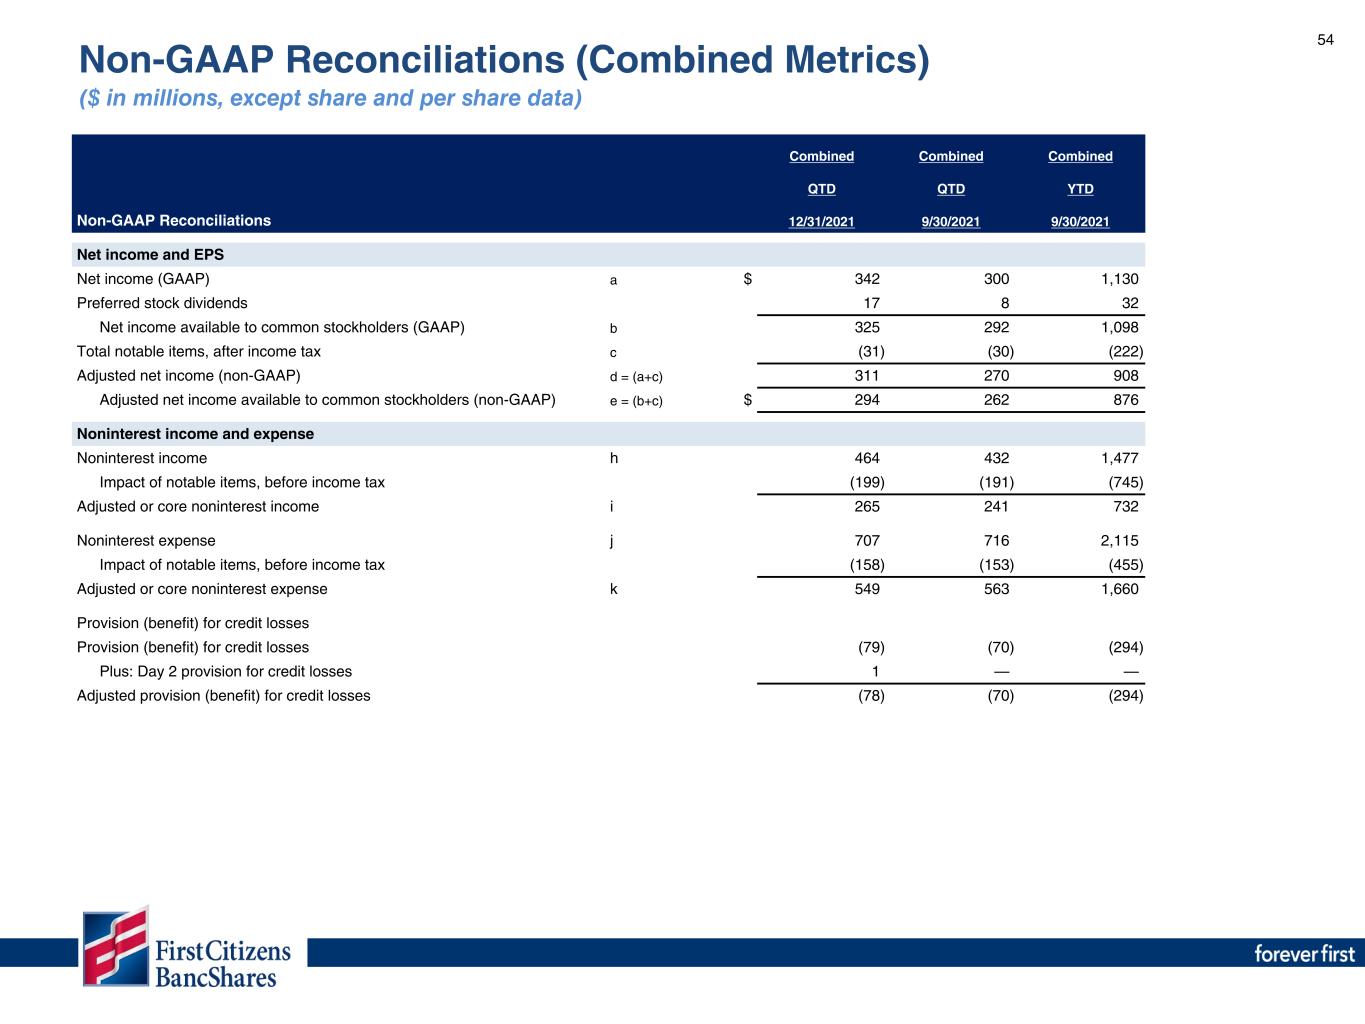
54 Non-GAAP Reconciliations (Combined Metrics) ($ in millions, except share and per share data) Combined Combined Combined QTD QTD YTD Non-GAAP Reconciliations 12/31/2021 9/30/2021 9/30/2021 Net income and EPS Net income (GAAP) a $ 342 300 1,130 Preferred stock dividends 17 8 32 Net income available to common stockholders (GAAP) b 325 292 1,098 Total notable items, after income tax c (31) (30) (222) Adjusted net income (non-GAAP) d = (a+c) 311 270 908 Adjusted net income available to common stockholders (non-GAAP) e = (b+c) $ 294 262 876 Noninterest income and expense Noninterest income h 464 432 1,477 Impact of notable items, before income tax (199) (191) (745) Adjusted or core noninterest income i 265 241 732 Noninterest expense j 707 716 2,115 Impact of notable items, before income tax (158) (153) (455) Adjusted or core noninterest expense k 549 563 1,660 Provision (benefit) for credit losses Provision (benefit) for credit losses (79) (70) (294) Plus: Day 2 provision for credit losses 1 — — Adjusted provision (benefit) for credit losses (78) (70) (294)
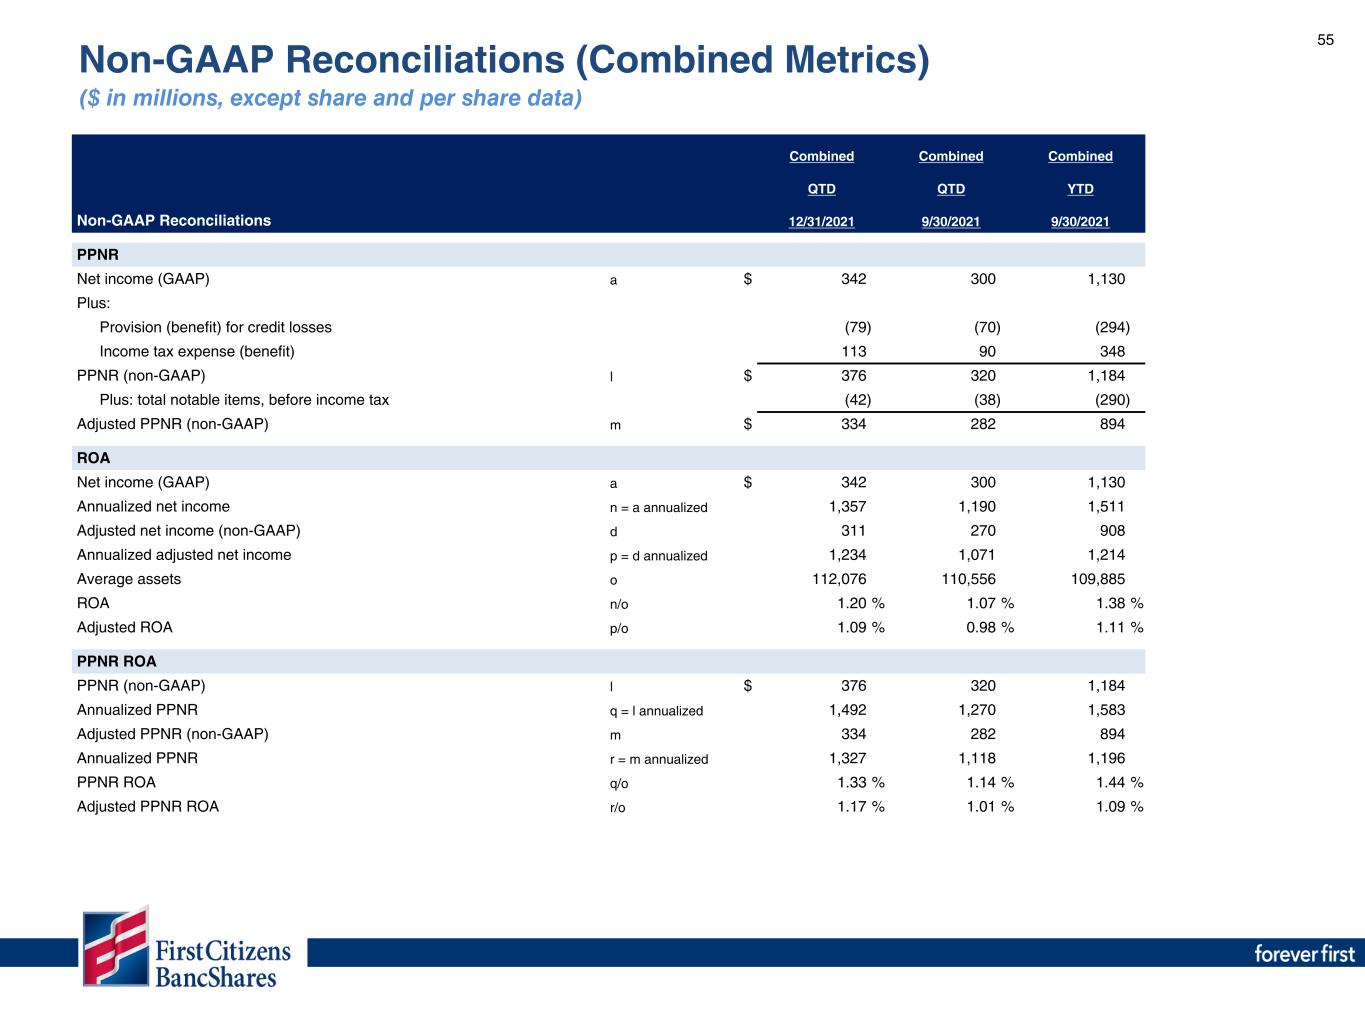
55 Non-GAAP Reconciliations (Combined Metrics) ($ in millions, except share and per share data) Combined Combined Combined QTD QTD YTD Non-GAAP Reconciliations 12/31/2021 9/30/2021 9/30/2021 PPNR Net income (GAAP) a $ 342 300 1,130 Plus: Provision (benefit) for credit losses (79) (70) (294) Income tax expense (benefit) 113 90 348 PPNR (non-GAAP) l $ 376 320 1,184 Plus: total notable items, before income tax (42) (38) (290) Adjusted PPNR (non-GAAP) m $ 334 282 894 ROA Net income (GAAP) a $ 342 300 1,130 Annualized net income n = a annualized 1,357 1,190 1,511 Adjusted net income (non-GAAP) d 311 270 908 Annualized adjusted net income p = d annualized 1,234 1,071 1,214 Average assets o 112,076 110,556 109,885 ROA n/o 1.20 % 1.07 % 1.38 % Adjusted ROA p/o 1.09 % 0.98 % 1.11 % PPNR ROA PPNR (non-GAAP) l $ 376 320 1,184 Annualized PPNR q = l annualized 1,492 1,270 1,583 Adjusted PPNR (non-GAAP) m 334 282 894 Annualized PPNR r = m annualized 1,327 1,118 1,196 PPNR ROA q/o 1.33 % 1.14 % 1.44 % Adjusted PPNR ROA r/o 1.17 % 1.01 % 1.09 %
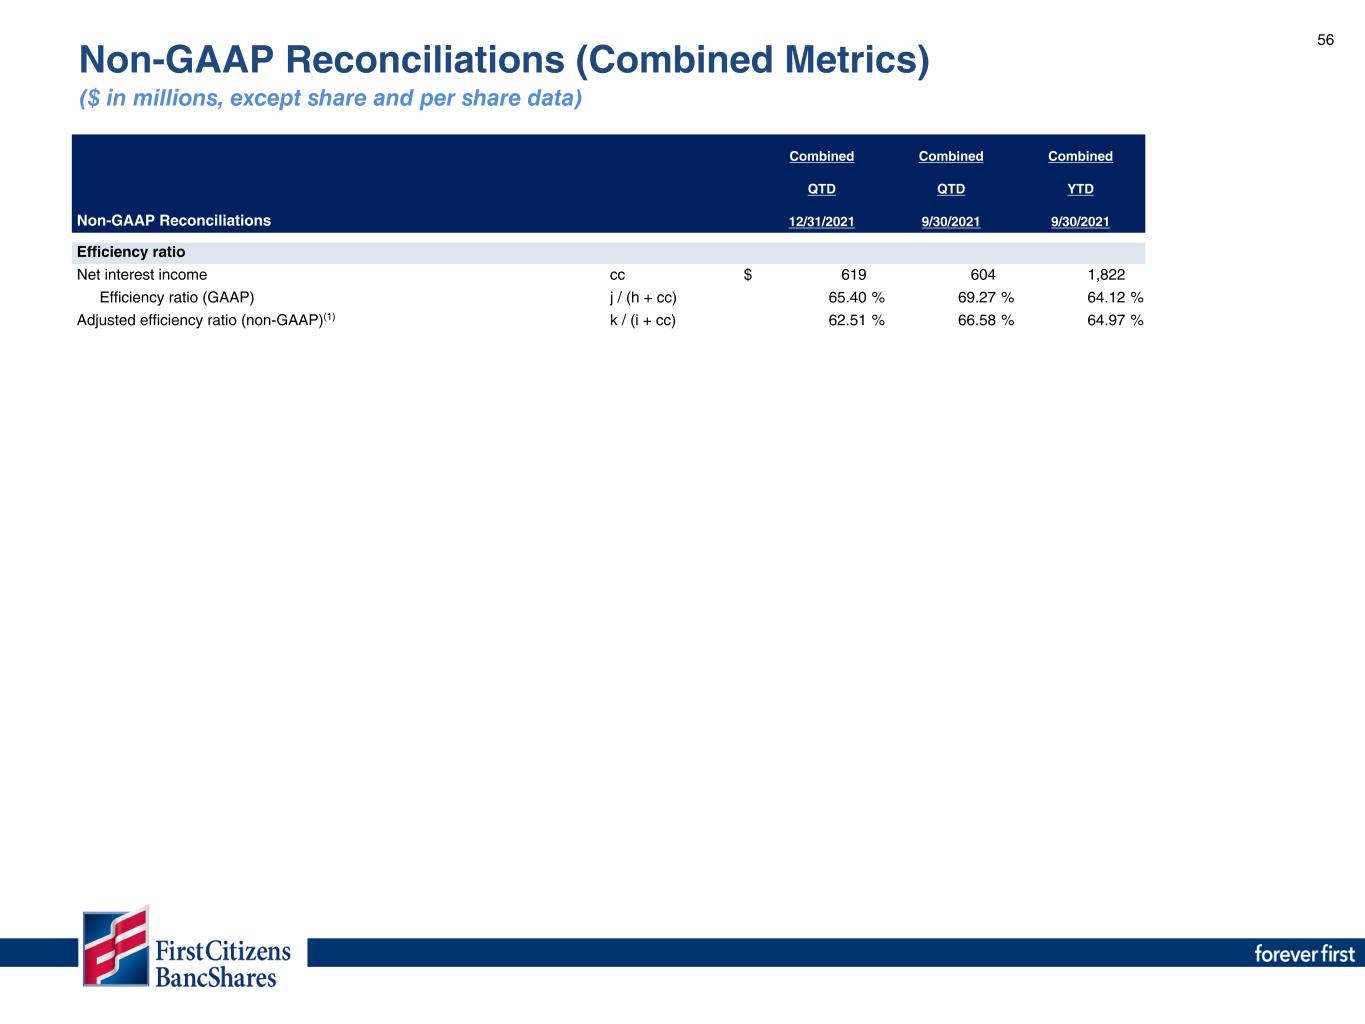
56 Non-GAAP Reconciliations (Combined Metrics) ($ in millions, except share and per share data) Combined Combined Combined QTD QTD YTD Non-GAAP Reconciliations 12/31/2021 9/30/2021 9/30/2021 Efficiency ratio Net interest income cc $ 619 604 1,822 Efficiency ratio (GAAP) j / (h + cc) 65.40 % 69.27 % 64.12 % Adjusted efficiency ratio (non-GAAP)(1) k / (i + cc) 62.51 % 66.58 % 64.97 %


