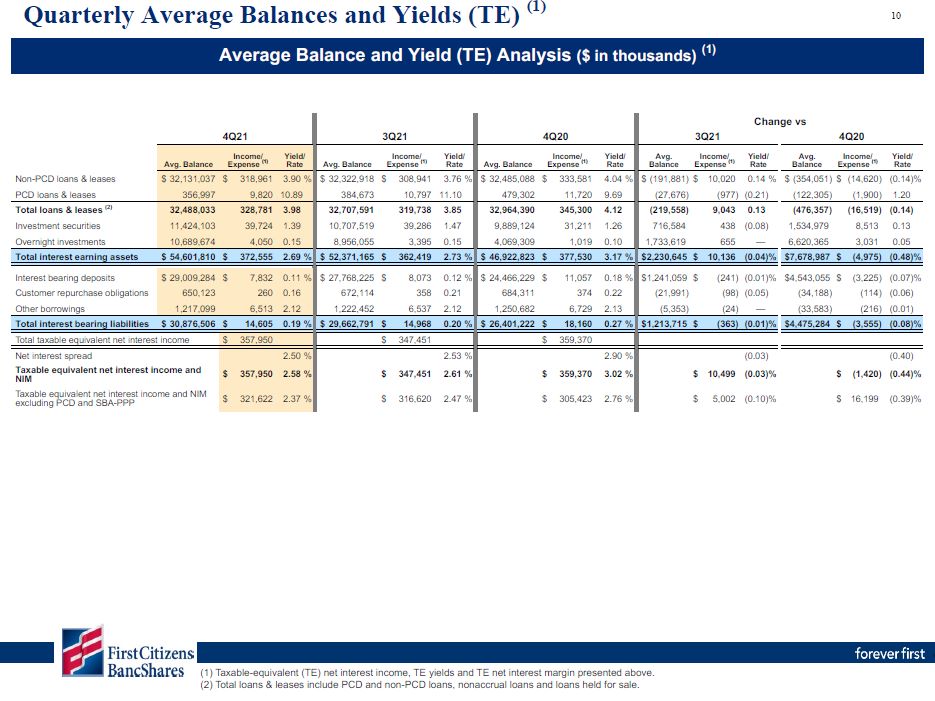
Quarterly Average Balances and Yields (TE) (1) 10 Taxable-equivalent (TE) net interest income, TE yields and TE net interest margin presented above.Total loans & leases include PCD and non-PCD loans, nonaccrual loans and loans held for sale. Average Balance and Yield (TE) Analysis ($ in thousands) (1) 4Q21 3Q21 4Q20 3Q21 Change vs 4Q20 Income/ Avg. Balance Expense (1) Yield/ Rate Avg. Balance Income/ Expense (1) Yield/ Rate Avg. Balance Income/ Expense (1) Yield/ Rate Avg. Balance Income/ Expense (1) Yield/ Rate Avg. Balance Income/ Expense (1) Yield/ Rate Non-PCD loans & leases $ 32,131,037 $ 318,961 3.90 % $ 32,322,918 $ 308,941 3.76 % $ 32,485,088 $ 333,581 4.04 % $ (191,881) $ 10,020 0.14 % $ (354,051) $ (14,620) (0.14)% PCD loans & leases 356,997 9,820 10.89 384,673 10,797 11.10 479,302 11,720 9.69 (27,676) (977) (0.21) (122,305) (1,900) 1.20 Total loans & leases (2) 32,488,033 328,781 3.98 32,707,591 319,738 3.85 32,964,390 345,300 4.12 (219,558) 9,043 0.13 (476,357) (16,519) (0.14) Investment securities 11,424,103 39,724 1.39 10,707,519 39,286 1.47 9,889,124 31,211 1.26 716,584 438 (0.08) 1,534,979 8,513 0.13 Overnight investments 10,689,674 4,050 0.15 8,956,055 3,395 0.15 4,069,309 1,019 0.10 1,733,619 655 — 6,620,365 3,031 0.05 Total interest earning assets $ 54,601,810 $ 372,555 2.69 % $ 52,371,165 $ 362,419 2.73 % $ 46,922,823 $ 377,530 3.17 % $2,230,645 $ 10,136 (0.04)% $7,678,987 $ (4,975) (0.48)% Interest bearing deposits $ 29,009,284 $ 7,832 0.11 % $ 27,768,225 $ 8,073 0.12 % $ 24,466,229 $ 11,057 0.18 % $1,241,059 $ (241) (0.01)% $4,543,055 $ (3,225) (0.07)% Customer repurchase obligations 650,123 260 0.16 672,114 358 0.21 684,311 374 0.22 (21,991) (98) (0.05) (34,188) (114) (0.06) Other borrowings 1,217,099 6,513 2.12 1,222,452 6,537 2.12 1,250,682 6,729 2.13 (5,353) (24) — (33,583) (216) (0.01) Total interest bearing liabilities $ 30,876,506 $ 14,605 0.19 % $ 29,662,791 $ 14,968 0.20 % $ 26,401,222 $ 18,160 0.27 % $1,213,715 $ (363) (0.01)% $4,475,284 $ (3,555) (0.08)% Total taxable equivalent net interest income $ 357,950 $ 347,451 $ 359,370 Net interest spread 2.50 % 2.53 % 2.90 % (0.03) (0.40) Taxable equivalent net interest income and NIM $ 357,950 2.58 % $ 347,451 2.61 % $ 359,370 3.02 % $ 10,499 (0.03)% $ (1,420) (0.44)% Taxable equivalent net interest income and NIM excluding PCD and SBA-PPP $ 321,622 2.37 % $ 316,620 2.47 % $ 305,423 2.76 % $ 5,002 (0.10)% $ 16,199 (0.39)%