UNITED STATES
SECURITIES AND EXCHANGE COMMISSION
WASHINGTON, D.C. 20549
FORM N-CSR
CERTIFIED SHAREHOLDER REPORT OF REGISTERED
MANAGEMENT INVESTMENT COMPANIES
Investment Company Act file number 811-04797
Oppenheimer Equity Income Fund
(Exact name of registrant as specified in charter)
6803 South Tucson Way, Centennial, Colorado 80112-3924
(Address of principal executive offices) (Zip code)
Arthur S. Gabinet
OFI Global Asset Management, Inc.
Two World Financial Center, New York, New York 10281-1008
(Name and address of agent for service)
Registrant’s telephone number, including area code: (303) 768-3200
Date of fiscal year end: October 31
Date of reporting period: 10/31/2013
Item 1. Reports to Stockholders.
OPPENHEIMER EQUITY INCOME FUND OPPENHEIMER FUNDS THE RIGHT WAY TO INVEST ANNUAL REPORT 10.31.2013
Class A Shares
AVERAGE ANNUAL TOTAL RETURNS AT 10/31/13
Class A Shares of the Fund | ||||||||
| Without Sales Charge | With Sales Charge | Russell 1000 Value Index | S&P 500 Index | |||||
| 1-Year | 26.57% | 19.29% | 28.29% | 27.18% | ||||
| 5-Year | 18.66 | 17.27 | 14.06 | 15.17 | ||||
| 10-Year | 9.24 | 8.60 | 7.81 | 7.46 | ||||
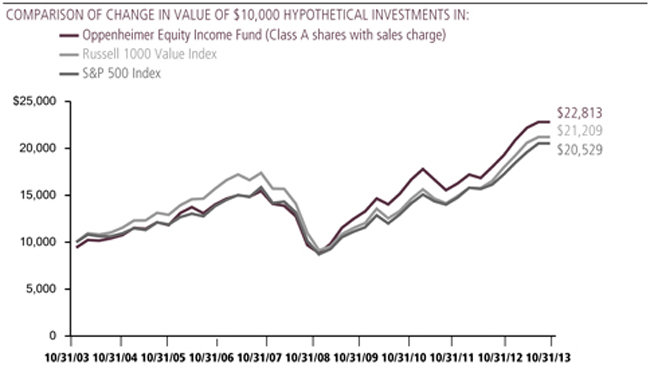
Performance data quoted represents past performance, which does not guarantee future results. The investment return and principal value of an investment in the Fund will fluctuate so that an investor’s shares, when redeemed, may be worth more or less than their original cost. Fund returns include changes in share price, reinvested distributions, and a 5.75% maximum applicable sales charge except where “without sales charge” is indicated. Current performance may be lower or higher than the performance quoted. Returns do not consider capital gains or income taxes on an individual’s investment. For performance data current to the most recent month-end, visit oppenheimerfunds.com or call 1.800.CALL OPP (225.5677).
2 OPPENHEIMER EQUITY INCOME FUND
The Fund’s Class A shares (without sales charge) produced a total return of 26.57% during the reporting period. In comparison, the Russell 1000 Value Index (the “Index”) returned 28.29%. The Fund’s underperformance relative to the Index stemmed primarily from less favorable stock selection in the information technology, health care and telecommunication services sectors. An overweight position in telecommunication services, which was a weaker performing sector of the Index, also detracted from relative performance. The Fund outperformed the Index primarily in the financials and consumer staples due to stronger relative stock selection. Stronger stock selection in materials and an underweight position in utilities contributed positively to performance to a lesser degree.
MARKET OVERVIEW
Over the first half of the period, risk markets rallied in response to accommodative polices established by central banks throughout the world. Prior to the start of the period, the Federal Reserve (the “Fed”) launched an open-ended quantitative easing program involving monthly purchases of $85 billion of U.S. government securities and mortgage-backed securities. The quantitative easing
program was designed to help boost the U.S. economy by keeping mortgage rates and other long-term interest rates low. While Europe continued to struggle with its sovereign debt crisis, analysts were encouraged when the head of the European Central Bank publicly stated his intent to support the euro as the European Union’s common currency. Even in Japan, which had been mired in economic weakness for years, new government leadership adopted stimulative economic policies and the Bank of Japan (the “BoJ”) announced a massive quantitative easing program.
3 OPPENHEIMER EQUITY INCOME FUND
In late May, relatively hawkish remarks by Fed chairman Ben Bernanke were widely interpreted as a signal that U.S. monetary policymakers would begin to back away from their quantitative easing program sooner than expected, sparking heightened volatility in financial markets throughout the world. As a result, higher dividend yielding sectors of the equity markets sold off. Market conditions generally stabilized over the summer of 2013. Despite a roughly two week U.S. government shutdown in October, equity markets generally resumed their upward trend through September and October as the Fed refrained from cutting back its quantitative easing program.
FUND REVIEW
The top three performing stocks for the Fund this period were in the financials sector: our convertible securities in MGIC Investment Corp., and our investments in Citigroup, Inc. and JPMorgan Chase & Co. MGIC is a mortgage bond insurer, which has been a challenging business for the past few years. Credit trends continued to improve during the period, driven by improvement in the housing market. Citigroup is a diversified financial services company that continued to benefit from the strengthening housing market in the U.S. with both its book of mortgage loans regaining health and demand for new
mortgage originations rising. During the period, the company’s CEO announced new targets for efficiency in each business segment. Additionally, the Fed announced stress tests results, which Citigroup passed with relatively healthy capital ratios. The market responded favorably to this news, helping push the company’s share price higher. JPMorgan Chase & Co., a leading global bank, performed positively during the period for a number of reasons. The company’s trading losses earlier in 2012 proved manageable and the housing market continued to improve, which helped the firm’s revenues and reserves. Furthermore, in terms of Citigroup and JPMorgan, rising interest rates and a steepening yield curve can potentially help banks improve their net interest income margin going forward.
Also contributing to performance this period were automaker Ford Motor Co. and auto supplier Lear Corp. We remain excited about the prospects for the auto sector, including both original equipment manufacturers (OEMs) and suppliers. Strong domestic results, a bottom in Europe, improving balance sheets and cash flows, and attractive valuations all could lead to continued strong relative performance for the group, in our opinion. Additionally, as we look out into 2014, we see European results potentially improving, or at least getting less bad, which could drive further price appreciation.
4 OPPENHEIMER EQUITY INCOME FUND
While individual detractors from performance were limited on an absolute basis this period, the most significant were CYS Investments, Inc., a convertible security in Peabody Energy Corp., and our investments in Apple, Inc. CYS Investments is an agency security real estate investment trust (REIT) that buys agency mortgage-backed securities and historically has had an above average dividend payout. While the recent increase in interest rates improves CYS’ ability to pay its dividend, it also hurts CYS’ book value as higher rates typically lead to lower bond prices. While book value may decline, we currently believe the recent sell off in the stock is overdone. Peabody Energy is a leading coal producer. Coal stocks underperformed the market this period due to weak demand, which stemmed from low natural gas prices and weak demand from China. Low gas prices make coal less competitive as a fuel source. Additionally, environmental concerns continue to weigh on sentiment toward coal stocks. We own the Peabody convertible bond that trades below par value. At period end, we like the risk/reward of this security and think the market is overly pessimistic about the prospects for coal demand. Investments in Apple hurt performance due in part to investor fears regarding the vitality of
the high end smartphone market. However, Apple performed better over the closing months of the period on the back of market anticipation surrounding the launch of the iPhone 5s and 5c.
STRATEGY & OUTLOOK
We remain cautiously optimistic about the market in the short term. Corporate earnings are solid and balance sheets are in great shape, in our opinion. Combined with attractive valuations and still low interest rates we think the remainder of the year could potentially continue to see gains. While the rise in interest rates has created some dislocation, we believe that this increase was inevitable and is a sign of a strengthening economy. We are mindful of the dysfunction in Washington D.C., but still expect an eventual agreement on the debt ceiling and resolution of budgetary spending issues to occur.

5 OPPENHEIMER EQUITY INCOME FUND
TOP TEN COMMON STOCK HOLDINGS
Citigroup, Inc. | 3.4 | % | ||
JPMorgan Chase & Co. | 3.4 | |||
Apple, Inc. | 3.3 | |||
Chevron Corp. | 2.5 | |||
MetLife, Inc. | 2.3 | |||
Ford Motor Co. | 2.3 | |||
Microsoft Corp. | 1.9 | |||
Pfizer, Inc. | 1.9 | |||
Merck & Co., Inc. | 1.8 | |||
Lear Corp. | 1.8 |
Portfolio holdings and allocations are subject to change. Percentages are as of October 31, 2013, and are based on net assets. For more current Fund holdings, please visit oppenheimerfunds.com.
TOP TEN COMMON STOCK INDUSTRIES
Oil, Gas & Consumable Fuels | 8.6 | % | ||
Diversified Financial Services | 7.9 | |||
Insurance | 5.8 | |||
Pharmaceuticals | 5.7 | |||
Diversified Telecommunication Services | 5.3 | |||
Real Estate Investment Trusts (REITs) | 4.1 | |||
Computers & Peripherals | 3.4 | |||
Automobiles | 2.8 | |||
Capital Markets | 2.5 | |||
Multiline Retail | 2.5 |
Portfolio holdings and allocations are subject to change. Percentages are as of October 31, 2013, and are based on net assets.
PORTFOLIO HOLDINGS
Common Stocks | 78.9 | % | ||
Convertible Corporate Bonds and Notes | 7.1 | |||
Structured Securities | 6.7 | |||
Preferred Stocks | 3.3 | |||
Non-Convertible Corporate Bonds and Notes | 2.1 | |||
Money Market Fund | 1.6 | |||
Mortgage-Backed Obligations | 0.1 | |||
Rights, Warrants and Certificates | 0.1 | |||
Exchange-Traded Options Purchased | 0.1 | |||
U.S. Government Obligation | — * | |||
Foreign Government Obligation | — * |
*Represents a value of less than 0.005%.
Portfolio holdings and allocations are subject to change. Percentages are as of October 31, 2013, and are based on the total market value of investments.
6 OPPENHEIMER EQUITY INCOME FUND
Share Class Performance
AVERAGE ANNUAL TOTAL RETURNS WITHOUT SALES CHARGE AS OF 10/31/13
Inception Date | 1-Year | 5-Year | 10-Year | |||||||
| Class A (OAEIX) | 2/13/87 | 26.57% | 18.66% | 9.24% | ||||||
| Class B (OBEIX) | 3/3/97 | 25.35% | 17.57% | 8.67% | ||||||
| Class C (OCEIX) | 3/3/97 | 25.62% | 17.72% | 8.33% | ||||||
| Class I (OIEIX) | 2/28/12 | 27.06% | 19.17% | * | N/A | |||||
| Class N (ONEIX) | 3/1/01 | 26.11% | 18.20% | 8.81% | ||||||
| Class Y (OYEIX) | 2/28/11 | 26.97% | 11.47% | * | N/A | |||||
AVERAGE ANNUAL TOTAL RETURNS WITH SALES CHARGE AS OF 10/31/13
| ||||||||||
Inception Date | 1-Year | 5-Year | 10-Year | |||||||
| Class A (OAEIX) | 2/13/87 | 19.29% | 17.27% | 8.60% | ||||||
| Class B (OBEIX) | 3/3/97 | 20.35% | 17.36% | 8.67% | ||||||
| Class C (OCEIX) | 3/3/97 | 24.62% | 17.72% | 8.33% | ||||||
| Class I (OIEIX) | 2/28/12 | 27.06% | 19.17% | * | N/A | |||||
| Class N (ONEIX) | 3/1/01 | 25.11% | 18.20% | 8.81% | ||||||
| Class Y (OYEIX) | 2/28/11 | 26.97% | 11.47% | * | N/A | |||||
* Shows performance since inception. | ||||||||||
Performance data quoted represents past performance, which does not guarantee future results. The investment return and principal value of an investment in the Fund will fluctuate so that an investor’s shares, when redeemed, may be worth more or less than their original cost. Current performance may be lower or higher than the performance quoted. Returns do not consider capital gains or income taxes on an individual’s investment. For performance data current to the most recent month-end, visit oppenheimerfunds.com or call 1.800.CALL OPP (225.5677). Fund returns include changes in share price, reinvested distributions, and the applicable sales charge: for Class A shares, the current maximum initial sales charge of 5.75%; for Class B shares, the contingent deferred sales charge of 5% (1-year) and 2% (5-year); and for Class C and N shares, the contingent deferred sales charge of 1% for the 1-year period. There is no sales charge for Class I and Class Y shares. Because Class B shares convert to Class A shares 72 months after purchase, the 10-year return for Class B shares uses Class A performance for the period after conversion.
The Fund’s performance is compared to the performance of the Russell 1000 Value Index and the S&P 500 Index. The Russell 1000 Value Index measures the performance of the large-cap value segment of the U.S. equity universe. It includes those Russell 1000 companies with lower price-to-book ratios and lower expected growth values. The S&P 500 Index is a capitalization-weighted index of 500 stocks intended to be a representative sample of leading companies in leading industries within the U.S. economy. The indices are unmanaged and cannot be purchased directly by investors. Index performance includes reinvestment of income, but does not reflect transaction costs, fees, expenses or taxes. Index performance is shown for illustrative purposes only as a benchmark for the Fund’s performance, and does not predict or depict performance of the Fund. The Fund’s performance reflects the effects of the Fund’s business and operating expenses.
7 OPPENHEIMER EQUITY INCOME FUND
The Fund’s investment strategy and focus can change over time. The mention of specific fund holdings does not constitute a recommendation by OppenheimerFunds, Inc. or its affiliates.
Before investing in any of the Oppenheimer funds, investors should carefully consider a fund’s investment objectives, risks, charges and expenses. Fund prospectuses and summary prospectuses contain this and other information about the funds, and may be obtained by asking your financial advisor, visiting oppenheimerfunds.com, or calling 1.800.CALL OPP (225.5677). Read prospectuses and summary prospectuses carefully before investing.
Shares of Oppenheimer funds are not deposits or obligations of any bank, are not guaranteed by any bank, are not insured by the FDIC or any other agency, and involve investment risks, including the possible loss of the principal amount invested.
8 OPPENHEIMER EQUITY INCOME FUND
Fund Expenses. As a shareholder of the Fund, you incur two types of costs: (1) transaction costs, which may include sales charges (loads) on purchase payments, contingent deferred sales charges on redemptions; and (2) ongoing costs, including management fees; distribution and service fees; and other Fund expenses. These examples are intended to help you understand your ongoing costs (in dollars) of investing in the Fund and to compare these costs with the ongoing costs of investing in other mutual funds.
The examples are based on an investment of $1,000.00 invested at the beginning of the period and held for the entire 6-month period ended October 31, 2013.
Actual Expenses. The first section of the table provides information about actual account values and actual expenses. You may use the information in this section for the class of shares you hold, together with the amount you invested, to estimate the expense that you paid over the period. Simply divide your account value by $1,000.00 (for example, an $8,600.00 account value divided by $1,000.00 = 8.60), then multiply the result by the number in the first section under the heading entitled “Expenses Paid During Period” to estimate the expenses you paid on your account during this period.
Hypothetical Example for Comparison Purposes. The second section of the table provides information about hypothetical account values and hypothetical expenses based on the Fund’s actual expense ratio for each class of shares, and an assumed rate of return of 5% per year for each class before expenses, which is not the actual return. The hypothetical account values and expenses may not be used to estimate the actual ending account balance or expenses you paid for the period. You may use this information to compare the ongoing costs of investing in the Fund and other funds. To do so, compare this 5% hypothetical example for the class of shares you hold with the 5% hypothetical examples that appear in the shareholder reports of the other funds.
Please note that the expenses shown in the table are meant to highlight your ongoing costs only and do not reflect any transactional costs, such as front-end or contingent deferred sales charges (loads), or a $12.00 fee imposed annually on accounts valued at less than $500.00 (subject to exceptions described in the Statement of Additional Information). Therefore, the “hypothetical” section of the table is useful in comparing ongoing costs only, and will not help you determine the relative total costs of owning different funds. In addition, if these transactional costs were included, your costs would have been higher.
9 OPPENHEIMER EQUITY INCOME FUND
| Beginning | Ending | Expenses | |||||||||||||||||
| Account | Account | Paid During | |||||||||||||||||
| Value | Value | 6 Months Ended | |||||||||||||||||
| Actual | May 1, 2013 | October 31, 2013 | October 31, 2013 | ||||||||||||||||
Class A | $ | 1,000.00 | $ | 1,092.20 | $ | 5.29 | |||||||||||||
Class B | 1,000.00 | 1,087.10 | 10.31 | ||||||||||||||||
Class C | 1,000.00 | 1,088.30 | 9.30 | ||||||||||||||||
Class I | 1,000.00 | 1,094.40 | 3.22 | ||||||||||||||||
Class N | 1,000.00 | 1,091.00 | 6.93 | ||||||||||||||||
Class Y | 1,000.00 | 1,094.20 | 3.75 | ||||||||||||||||
Hypothetical | |||||||||||||||||||
| (5% return before expenses) | |||||||||||||||||||
Class A | 1,000.00 | 1,020.16 | 5.10 | ||||||||||||||||
Class B | 1,000.00 | 1,015.38 | 9.95 | ||||||||||||||||
Class C | 1,000.00 | 1,016.33 | 8.98 | ||||||||||||||||
Class I | 1,000.00 | 1,022.13 | 3.11 | ||||||||||||||||
Class N | 1,000.00 | 1,018.60 | 6.69 | ||||||||||||||||
Class Y | 1,000.00 | 1,021.63 | 3.62 | ||||||||||||||||
Expenses are equal to the Fund’s annualized expense ratio for that class, multiplied by the average account value over the period, multiplied by 184/365 (to reflect the one-half year period). Those annualized expense ratios, excluding indirect expenses from affiliated funds, based on the 6-month period ended October 31, 2013 are as follows:
| Class | Expense Ratios | |||||
Class A | 1.00% | |||||
Class B | 1.95 | |||||
Class C | 1.76 | |||||
Class I | 0.61 | |||||
Class N | 1.31 | |||||
Class Y | 0.71 | |||||
The expense ratios reflect voluntary waivers and/or reimbursements of expenses by the Fund’s Manager and Transfer Agent. Some of these undertakings may be modified or terminated at any time, as indicated in the Fund’s prospectus. The “Financial Highlights” tables in the Fund’s financial statements, included in this report, also show the gross expense ratios, without such waivers or reimbursements and reduction to custodian expenses, if applicable.
10 OPPENHEIMER EQUITY INCOME FUND
| STATEMENTOF INVESTMENTS October 31, 2013 | ||||
| Shares | Value | |||||
| Common Stocks—79.4% | ||||||
| Consumer Discretionary—12.0% | ||||||
| Auto Components—2.2% | ||||||
| American Axle & Manufacturing Holdings, Inc.1,2 | 1,061,000 | $ | 19,745,210 | |||
| Lear Corp. | 1,225,000 | 94,802,750 | ||||
| 114,547,960 | ||||||
| Automobiles—2.8% | ||||||
| Ford Motor Co. | 7,029,500 | 120,274,745 | ||||
| General Motors Co.1,2 | 725,000 | 26,788,750 | ||||
| 147,063,495 | ||||||
| Hotels, Restaurants & Leisure—0.2% | ||||||
| Carnival Corp. | 185,000 | 6,410,250 | ||||
| McDonald’s Corp. | 82,500 | 7,962,900 | ||||
| 14,373,150 | ||||||
| Household Durables—0.8% | ||||||
| MDC Holdings, Inc. | 1,225,000 | 35,757,750 | ||||
| Standard Pacific Corp.1 | 912,600 | 7,236,918 | ||||
| 42,994,668 | ||||||
| Media—2.2% | ||||||
| Cablevision Systems Corp., Cl. A | 1,180,200 | 18,352,110 | ||||
| Comcast Corp., Special, Cl. A | 1,025,000 | 47,457,500 | ||||
| Time Warner Cable, Inc.2 | 434,000 | 52,145,100 | ||||
| 117,954,710 | ||||||
| Multiline Retail—2.5% | ||||||
| J.C. Penney Co., Inc.1,2 | 1,050,000 | 7,875,000 | ||||
| Kohl’s Corp.2 | 1,000,000 | 56,800,000 | ||||
| Target Corp. | 1,075,000 | 69,649,250 | ||||
| 134,324,250 | ||||||
| Specialty Retail—1.3% | ||||||
| Best Buy Co., Inc. | 407,500 | 17,441,000 | ||||
| Foot Locker, Inc.2 | 1,502,400 | 52,133,280 | ||||
| 69,574,280 | ||||||
| Consumer Staples—4.0% | ||||||
| Beverages—0.5% | ||||||
| Molson Coors Brewing Co., Cl. B, Non-Vtg., Cl. B | 210,000 | 11,340,000 | ||||
| PepsiCo, Inc. | 205,000 | 17,238,450 | ||||
| 28,578,450 | ||||||
| Food & Staples Retailing—1.9% | ||||||
| CVS Caremark Corp. | 182,000 | 11,331,320 | ||||
| Kroger Co. (The) 2 | 1,000,000 | 42,840,000 | ||||
| Walgreen Co. 2 | 780,000 | 46,207,200 | ||||
| 100,378,520 | ||||||
| Food Products—1.1% | ||||||
| Archer-Daniels-Midland Co.2 | 662,500 | 27,096,250 | ||||
| ConAgra Foods, Inc. | 100,000 | 3,181,000 | ||||
| General Mills, Inc.2 | 235,975 | 11,897,860 | ||||
| Pinnacle Foods, Inc. | 673,322 | 18,240,293 | ||||
| 60,415,403 | ||||||
| Household Products—0.1% | ||||||
| Procter & Gamble Co. (The) 2 | 69,000 | 5,571,750 | ||||
| Tobacco—0.4% | ||||||
| Philip Morris International, Inc. 2 | 240,000 | 21,388,800 |
11 OPPENHEIMER EQUITY INCOME FUND
| STATEMENTOF INVESTMENTS Continued | ||||
| Shares | Value | |||||
| Energy—10.4% | ||||||
| Energy Equipment & Services—1.8% | ||||||
| Baker Hughes, Inc. | 225,000 | $ | 13,070,250 | |||
| Cameron International Corp.1 | 102,500 | 5,623,150 | ||||
| Ensco plc, Cl. A | 790,000 | 45,543,500 | ||||
| Halliburton Co. | 708,835 | 37,589,520 | ||||
| 101,826,420 | ||||||
| Oil, Gas & Consumable Fuels—8.6% | ||||||
| Apache Corp. | 500,000 | 44,400,000 | ||||
| BP plc, Sponsored ADR | 1,810,000 | 84,165,000 | ||||
| Chevron Corp.2 | 1,099,750 | 131,926,010 | ||||
| CONSOL Energy, Inc.2 | 230,000 | 8,395,000 | ||||
| Exxon Mobil Corp. | 123,750 | 11,090,475 | ||||
| HollyFrontier Corp. | 112,500 | 5,181,750 | ||||
| Kinder Morgan Management LLC1 | 440,205 | 33,156,206 | ||||
| Kinder Morgan, Inc. | 1,925,000 | 67,971,750 | ||||
| Royal Dutch Shell plc, ADR | 695,000 | 46,328,700 | ||||
| Williams Cos., Inc. (The) 2 | 580,000 | 20,711,800 | ||||
| 453,326,691 | ||||||
| Financials—22.9% | ||||||
| Capital Markets—2.5% | ||||||
| Credit Suisse Group AG, ADR1 | 152,500 | 4,747,325 | ||||
| Goldman Sachs Group, Inc. (The) | 427,500 | 68,767,650 | ||||
| Morgan Stanley | 2,125,000 | 61,051,250 | ||||
| 134,566,225 | ||||||
| Commercial Banks—2.5% | ||||||
| CIT Group, Inc.1,2 | 750,000 | 36,120,000 | ||||
| M&T Bank Corp. | 36,250 | 4,079,213 | ||||
| Wells Fargo & Co. | 2,100,000 | 89,649,000 | ||||
| 129,848,213 | ||||||
| Diversified Financial Services—7.9% | ||||||
| Bank of America Corp.2 | 675,000 | 9,423,000 | ||||
| Citigroup, Inc. | 3,750,000 | 182,925,000 | ||||
| ING US, Inc. | 300,000 | 9,306,000 | ||||
| JPMorgan Chase & Co.2 | 3,480,000 | 179,359,200 | ||||
| KKR Financial Holdings LLC | 3,775,000 | 37,410,250 | ||||
| 418,423,450 | ||||||
| Insurance—5.8% | ||||||
| ACE Ltd. | 205,000 | 19,565,200 | ||||
| Assured Guaranty Ltd.2 | 3,425,000 | 70,212,500 | ||||
| Everest Re Group Ltd.2 | 347,500 | 53,424,650 | ||||
| MetLife, Inc. | 2,562,237 | 121,219,432 | ||||
| XL Group plc | 1,375,000 | 42,033,750 | ||||
| 306,455,532 | ||||||
| Real Estate Investment Trusts (REITs)—4.1% | ||||||
| American Homes 4 Rent, Cl. A1 | 285,000 | 4,411,800 | ||||
| American Homes 4 Rent, Cl. A1,3 | 850,000 | 13,158,000 | ||||
| Apollo Commercial Real Estate Finance, Inc.2 | 1,800,000 | 28,998,000 | ||||
| Ashford Hospitality Trust, Inc. | 1,605,000 | 20,961,300 | ||||
| Colony Financial, Inc. | 1,325,000 | 26,804,750 |
12 OPPENHEIMER EQUITY INCOME FUND
| Shares | Value | |||||
| Real Estate Investment Trusts (REITs) (Continued) | ||||||
| CYS Investments, Inc. | 3,650,000 | $ | 30,988,500 | |||
| Digital Realty Trust, Inc.2 | 405,200 | 19,311,832 | ||||
| Rayonier, Inc. | 350,000 | 16,457,000 | ||||
| Starwood Property Trust, Inc. | 1,707,500 | 43,865,675 | ||||
| Two Harbors Investment Corp. | 1,062,500 | 9,913,125 | ||||
| Weyerhaeuser Co. | 105,000 | 3,192,000 | ||||
| 218,061,982 | ||||||
| Thrifts & Mortgage Finance—0.1% | ||||||
| MGIC Investment Corp.1,2 | 675,000 | 5,494,500 | ||||
| Health Care—6.8% | ||||||
| Health Care Equipment & Supplies—0.5% | ||||||
| Baxter International, Inc.2 | 80,000 | 5,269,600 | ||||
| Medtronic, Inc. | 369,400 | 21,203,560 | ||||
| 26,473,160 | ||||||
| Health Care Providers & Services—0.6% | ||||||
| UnitedHealth Group, Inc. | 480,000 | 32,764,800 | ||||
| Pharmaceuticals—5.7% | ||||||
| GlaxoSmithKline plc, Sponsored ADR | 547,725 | 28,826,767 | ||||
| Johnson & Johnson2 | 155,000 | 14,354,550 | ||||
| Merck & Co., Inc. 2 | 2,150,000 | 96,943,500 | ||||
| Pfizer, Inc. | 3,225,000 | 98,943,000 | ||||
| Roche Holding AG, Sponsored ADR | 7,350 | 509,649 | ||||
| Teva Pharmaceutical Industries Ltd., Sponsored ADR2 | 1,715,000 | 63,609,350 | ||||
| 303,186,816 | ||||||
| Industrials—3.4% | ||||||
| Aerospace & Defense—1.4% | ||||||
| General Dynamics Corp.2 | 653,700 | 56,630,031 | ||||
| Textron, Inc. | 485,725 | 13,984,023 | ||||
| 70,614,054 | ||||||
| Commercial Services & Supplies—1.0% | ||||||
| Pitney Bowes, Inc. 2 | 817,000 | 17,434,780 | ||||
| R.R. Donnelley & Sons Co. | 1,997,600 | 37,095,432 | ||||
| 54,530,212 | ||||||
| Industrial Conglomerates—0.3% | ||||||
| General Electric Co. | 625,500 | 16,350,570 | ||||
| Marine—0.5% | ||||||
| Box Ships, Inc.4 | 960,000 | 3,648,000 | ||||
| Costamare, Inc. | 1,000,000 | 18,570,000 | ||||
| Diana Containerships, Inc.4 | 1,330,000 | 5,506,200 | ||||
| 27,724,200 | ||||||
| Road & Rail—0.2% | ||||||
| CSX Corp.2 | 395,000 | 10,293,700 | ||||
| Information Technology—7.4% | ||||||
| Communications Equipment—1.4% | ||||||
| Cisco Systems, Inc.2 | 875,000 | 19,687,500 | ||||
| QUALCOMM, Inc. | 770,000 | 53,491,900 | ||||
| 73,179,400 | ||||||
| Computers & Peripherals—3.4% | ||||||
| Apple, Inc.2 | 336,300 | 175,666,305 | ||||
| EMC Corp. | 185,000 | 4,452,950 | ||||
| 180,119,255 | ||||||
13 OPPENHEIMER EQUITY INCOME FUND
| STATEMENTOF INVESTMENTS Continued | ||||
| Shares | Value | |||||
| Electronic Equipment, Instruments, & Components—0.5% | ||||||
| Corning, Inc.2 | 1,500,000 | $ | 25,635,000 | |||
| Semiconductors & Semiconductor Equipment—0.2% | ||||||
| Intel Corp.2 | 375,000 | 9,161,250 | ||||
| Software—1.9% | ||||||
| Microsoft Corp. 2 | 2,825,000 | 99,863,750 | ||||
| Materials—4.4% | ||||||
| Chemicals—1.2% | ||||||
| Celanese Corp., Series A2 | 145,000 | 8,121,450 | ||||
| LyondellBasell Industries NV, Cl. A | 255,000 | 19,023,000 | ||||
| Potash Corp. of Saskatchewan, Inc. | 1,382,500 | 42,995,750 | ||||
| 70,140,200 | ||||||
| Metals & Mining—1.3% | ||||||
| Allegheny Technologies, Inc. | 1,034,500 | 34,241,950 | ||||
| Freeport-McMoRan Copper & Gold, Inc.2 | 950,000 | 34,922,000 | ||||
| 69,163,950 | ||||||
| Paper & Forest Products—1.9% | ||||||
| Domtar Corp.2 | 500,000 | 42,355,000 | ||||
| International Paper Co.2 | 1,357,500 | 60,558,075 | ||||
| 102,913,075 | ||||||
| Telecommunication Services—5.3% | ||||||
| Diversified Telecommunication Services—5.3% | ||||||
| AT&T, Inc.2 | 1,500,000 | 54,300,000 | ||||
| CenturyLink, Inc.2 | 2,675,000 | 90,575,500 | ||||
| Consolidated Communications Holdings, Inc.2 | 1,730,000 | 32,229,900 | ||||
| Frontier Communications Corp. | 15,125,000 | 66,701,250 | ||||
| Verizon Communications, Inc. | 150,000 | 7,576,500 | ||||
| Windstream Holdings, Inc. | 4,628,250 | 39,571,538 | ||||
| 290,954,688 | ||||||
| Utilities—2.8% | ||||||
| Electric Utilities—2.4% | ||||||
| American Electric Power Co., Inc. | 662,500 | 31,031,500 | ||||
| Edison International | 737,500 | 36,159,625 | ||||
| Exelon Corp.2 | 500,000 | 14,270,000 | ||||
| FirstEnergy Corp.2 | 646,500 | 24,482,955 | ||||
| PPL Corp. | 500,000 | 15,315,000 | ||||
| 121,259,080 | ||||||
| Energy Traders—0.3% | ||||||
| NRG Energy, Inc. | 500,000 | 14,265,000 | ||||
| Multi-Utilities—0.1% | ||||||
| CenterPoint Energy, Inc.1 | 77,500 | 4,030,000 | ||||
| Total Common Stocks (Cost $3,454,190,024) | 4,227,790,609 | |||||
| Preferred Stocks—3.3% | ||||||
| American Homes 4 Rent, Series A, 5% Cum., Non-Vtg.1 | 512,500 | 13,068,750 | ||||
| Beazer Homes USA, Inc., 7.50% Cv. | 779,250 | 22,504,740 | ||||
| Continental Airlines Finance Trust II, 6% Cv., Non-Vtg. | 380,250 | 17,348,906 | ||||
| General Motors Co., 4.75% Cv., Series B, Non-Vtg. | 1,575,000 | 80,829,000 | ||||
| iStar Financial, Inc., 4.50% Cv., Non-Vtg. | 250,525 | 14,279,925 | ||||
| MetLife, Inc., 5% Cv., Non-Vtg. | 462,500 | 13,287,625 | ||||
14 OPPENHEIMER EQUITY INCOME FUND
| Shares | Value | |||||
| Preferred Stocks (Continued) | ||||||
| PPL Corp. 8.75% Cv., Non-Vtg. | 265,000 | $ 13,992,000 | ||||
| Total Preferred Stocks (Cost $159,744,152) | 175,310,946 | |||||
| Units | ||||||
| Rights, Warrants and Certificates—0.1% | ||||||
| Kinder Morgan, Inc. Wts., Strike Price $40, Exp. 2/15/171 | ||||||
| (Cost $2,577,600) | 1,440,000 | 6,163,200 | ||||
| Principal Amount | ||||||
| Mortgage-Backed Obligations—0.1% | ||||||
| Banc of America Funding Trust, Series 2007-C, Cl. 1A4, 5.388%, 5/20/365 | $ 143,206 | 138,394 | ||||
| Banc of America Mortgage Trust, Collateralized Mtg. Obligations, Series 2004-E, Cl. 2A6, 2.859%, 6/25/345 | 222,493 | 220,718 | ||||
| Countrywide Alternative Loan Trust, Series 2005-29CB, Cl. A4, 5%, 7/25/35 | 1,223,472 | 1,053,792 | ||||
| Countrywide Home Loans: | ||||||
| Series 2005-29, Cl. A1, 5.75%, 12/25/35 | 120,668 | 110,372 | ||||
| Series 2006-6, Cl. A3, 6.00%, 4/25/36 | 203,448 | 187,848 | ||||
| Series 2007-J3, Cl. A9, 6.00%, 7/25/37 | 83,984 | 69,347 | ||||
| Deutsche Alt-B Securities Mortgage Loan Trust, Collateralized Mtg. Obligations, Series 2006-AB4, Cl. A1A, 6.005%, 10/25/365 | 361,281 | 271,357 | ||||
| Federal Home Loan Mortgage Corp. Gold Pool: | ||||||
| 8.00%, 4/1/16 | 5,237 | 5,469 | ||||
| 9.00%, 8/1/22-5/1/25 | 3,010 | 3,372 | ||||
| Federal Home Loan Mortgage Corp., Interest-Only Stripped | ||||||
| Mtg.-Backed Security: | ||||||
| Series 183, Cl. IO, 16.269%, 4/1/278 | 135,886 | 25,825 | ||||
| Series 192, Cl. IO, 12.098%, 2/1/288 | 39,145 | 9,942 | ||||
| Series 243, Cl. 6, 0.00%, 12/15/327,8 | 156,463 | 37,232 | ||||
| Federal Home Loan Mortgage Corp., Principal-Only Stripped Mtg.-Backed Security, Series | ||||||
| 176, Cl. PO, 3.709%, 6/1/269 | 40,331 | 38,675 | ||||
| Federal Home Loan Mortgage Corp., Real Estate Mtg. Investment Conduit Multiclass | ||||||
| Pass-Through Certificates, Series 151, Cl. F, 9%, 5/15/21 | 8,628 | 9,629 | ||||
| Federal Home Loan Mortgage Corp., Real Estate Mtg. Investment | ||||||
| Conduit Multiclass Pass-Through Certificates, Interest-Only Stripped | ||||||
| Mtg.-Backed Security: | ||||||
| Series 2130, Cl. SC, 53.623%, 3/15/298 | 131,113 | 24,986 | ||||
| Series 2796, Cl. SD, 53.751%, 7/15/268 | 186,208 | 32,656 | ||||
| Series 2802, Cl. AS, 0.00%, 4/15/337,8 | 34,969 | 719 | ||||
| Federal National Mortgage Assn. Pool: | ||||||
| 7.50%, 1/1/33 | 146,261 | 172,752 | ||||
| 8.50%, 7/1/32 | 6,745 | 7,884 | ||||
| Federal National Mortgage Assn., Interest-Only Stripped | ||||||
| Mtg.-Backed Security: | ||||||
| Series 214, Cl. 2, 41.609%, 3/1/238 | 240,300 | 38,202 | ||||
| Series 222, Cl. 2, 24.983%, 6/1/238 | 302,597 | 49,903 | ||||
| Series 247, Cl. 2, 43.871%, 10/1/238 | 79,645 | 13,277 | ||||
| Series 252, Cl. 2, 41.405%, 11/1/238 | 270,066 | 43,875 | ||||
| Series 319, Cl. 2, 5.787%, 2/1/328 | 73,189 | 20,205 | ||||
| Series 320, Cl. 2, 9.925%, 4/1/328 | 409,584 | 79,934 | ||||
15 OPPENHEIMER EQUITY INCOME FUND
| STATEMENTOF INVESTMENTS Continued | ||||
| Principal Amount | Value | |||||
| Mortgage-Backed Obligations (Continued) | ||||||
| Federal National Mortgage Assn., Interest-Only Stripped | ||||||
| Mtg.-Backed Security: Continued | ||||||
| Series 331, Cl. 9, 0.00%, 2/1/337,8 | $ 33,273 | $ | 7,439 | |||
| Series 334, Cl. 17, 6.263%, 2/1/338 | 162,367 | 35,158 | ||||
| Series 339, Cl. 12, 0.00%, 6/25/337,8 | 309,759 | 61,890 | ||||
| Series 343, Cl. 13, 0.00%, 9/1/337,8,10 | 290,028 | 41,281 | ||||
| Series 343, Cl. 18, 0.00%, 5/1/347,8 | 44,240 | 6,646 | ||||
| Series 345, Cl. 9, 0.00%, 1/1/347,8 | 235,503 | 34,822 | ||||
| Series 351, Cl. 10, 0.00%, 4/1/347,8 | 71,965 | 10,180 | ||||
| Series 351, Cl. 8, 0.00%, 4/1/347,8 | 151,582 | 21,499 | ||||
| Series 356, Cl. 10, 0.00%, 6/1/357,8 | 113,671 | 16,201 | ||||
| Series 356, Cl. 12, 0.00%, 2/1/357,8 | 55,976 | 7,960 | ||||
| Series 362, Cl. 13, 0.00%, 8/1/357,8 | 681,014 | 110,876 | ||||
| Series 364, Cl. 16, 0.00%, 9/1/357,8 | 251,885 | 39,085 | ||||
| Federal National Mortgage Assn., Real Estate Mtg. Investment | ||||||
| Conduit Multiclass Pass-Through Certificates, Interest-Only | ||||||
| Stripped Mtg.-Backed Security: | ||||||
| Series 2001-63, Cl. SD, 33.218%, 12/18/318 | 4,124 | 758 | ||||
| Series 2001-65, Cl. S, 26.052%, 11/25/318 | 269,611 | 51,073 | ||||
| Series 2001-68, Cl. SC, 30.162%, 11/25/318 | 2,598 | 509 | ||||
| Series 2001-81, Cl. S, 26.354%, 1/25/328 | 66,333 | 13,706 | ||||
| Series 2002-47, Cl. NS, 33.191%, 4/25/328 | 165,871 | 32,832 | ||||
| Series 2002-51, Cl. S, 33.385%, 8/25/328 | 152,307 | 30,148 | ||||
| Series 2002-52, Cl. SD, 35.111%, 9/25/328 | 209,516 | 40,936 | ||||
| Series 2002-7, Cl. SK, 25.175%, 1/25/328 | 4,601 | 795 | ||||
| Series 2002-77, Cl. BS, 26.351%, 12/18/328 | 9,001 | 1,707 | ||||
| Series 2002-77, Cl. SH, 38.37%, 12/18/328 | 107,079 | 21,463 | ||||
| Series 2002-9, Cl. MS, 28.295%, 3/25/328 | 102,101 | 21,045 | ||||
| Series 2002-90, Cl. SN, 28.944%, 8/25/328 | 7,479 | 1,183 | ||||
| Series 2002-90, Cl. SY, 35.232%, 9/25/328 | 4,084 | 645 | ||||
| Series 2003-4, Cl. S, 29.621%, 2/25/338 | 166,141 | 31,951 | ||||
| Series 2003-46, Cl. IH, 0.00%, 6/25/237,8 | 1,015,764 | 135,984 | ||||
| Series 2004-54, Cl. DS, 39.975%, 11/25/308 | 180,386 | 28,833 | ||||
| Series 2005-14, Cl. SE, 39.479%, 3/25/358 | 231,147 | 38,736 | ||||
| Series 2005-93, Cl. SI, 15.803%, 10/25/358 | 139,924 | 20,042 | ||||
| Series 2639, Cl. SA, 0.00%, 7/15/227,8 | 79,650 | 2,303 | ||||
| Federal National Mortgage Assn., Real Estate Mtg. Investment Conduit Multiclass Pass- | ||||||
| Through Certificates, Principal-Only Stripped Mtg.-Backed Security, Series 1993-184, Cl. | ||||||
| M, 4.281%, 9/25/239 | 118,819 | 111,867 | ||||
| First Horizon Alternative Mortgage Securities Trust, Series 2007-FA2, Cl. 1A1, 5.50%, | ||||||
| 4/25/37 | 380,626 | 283,757 | ||||
| Government National Mortgage Assn. I Pool: | ||||||
| 7.00%, 1/15/24-4/15/26 | 57,367 | 63,303 | ||||
| 7.50%, 5/15/27 | 235,349 | 270,064 | ||||
| 8.00%, 5/15/17 | 5,566 | 5,959 | ||||
| 8.50%, 8/15/17-12/15/17 | 3,732 | 3,963 | ||||
| Government National Mortgage Assn. II Pool, 1.625%, 3/20/265 | 9,536 | 9,883 | ||||
| Government National Mortgage Assn., Interest-Only Stripped Mtg.-Backed Security, Series | ||||||
| 2002-15, Cl. SM, 60.16%, 2/16/328 | 237,100 | 40,710 | ||||
| IndyMac Index Mortgage Loan Trust, Collateralized Mtg. Obligations, Series 2005-AR23, | ||||||
| Cl. 6A1, 4.654%, 11/25/355 | 498,095 | 416,516 |
16 OPPENHEIMER EQUITY INCOME FUND
| Principal Amount | Value | |||||
| Mortgage-Backed Obligations (Continued) | ||||||
| JP Morgan Mortgage Trust: | ||||||
| Series 2007-A3, Cl. 3A2M, 4.747%, 5/25/375 | $ 75,775 | $ 72,323 | ||||
| Series 2007-S3, Cl. 1A90, 7.00%, 8/25/37 | 546,786 | 499,361 | ||||
| MASTR Adjustable Rate Mortgages Trust, Collateralized Mtg. Obligations, Series 2004-13, Cl. 2A2, 2.643%, 4/21/345 | 233,938 | 240,960 | ||||
| RALI Trust, Mtg. Asset-Backed Pass-Through Certificates, Series 2006-QS13, Cl. 1A8, 6%, 9/25/36 | 34,962 | 27,279 | ||||
| RALI Trust, Mtg. Pass-Through Certificates, Series 2003-QS1, Cl. A2, 5.75%, 1/25/33 | 77,609 | 79,288 | ||||
| Residential Asset Securitization Trust, Series 2005-A15, Cl. 1A4, 5.75%, 2/25/36 | 86,274 | 78,163 | ||||
| WaMu Mortgage Pass-Through Certificates Trust, Series 2005-AR14, Cl. 1A4, 2.434%, 12/25/355 | 306,696 | 283,696 | ||||
| Wells Fargo Mortgage-Backed Securities Trust: | ||||||
| Series 2005-9, Cl. 2A6, 5.25%, 10/25/35 | 378,490 | 390,544 | ||||
| Series 2006-AR14, Cl. 1A2, 5.581%, 10/25/365 | 302,475 | 293,179 | ||||
| Series 2007-AR8, Cl. A1, 5.934%, 11/25/375 | 305,908 | 276,197 | ||||
Total Mortgage-Backed Obligations (Cost $7,152,373)
| 6,981,063
| |||||
| U.S. Government Obligation—0.0% | ||||||
Federal Home Loan Mortgage Corp. Nts., 5.25%, 4/18/16 (Cost $445,851)
| 425,000
| 474,552
| ||||
| Foreign Government Obligation—0.0% | ||||||
Federal Republic of Germany Unsec. Bonds, 6.25%, 1/4/24 (Cost $1)
| EUR
| 1
| 2
| |||
| Non-Convertible Corporate Bonds and Notes—2.1% | ||||||
| Agrium, Inc., 6.125% Sr. Unsec. Unsub. Nts., 1/15/41 | 240,000 | 264,447 | ||||
| Airgas, Inc., 3.25% Sr. Unsec. Nts., 10/1/15 | 481,000 | 499,036 | ||||
| Altria Group, Inc., 10.20% Sr. Unsec. Nts., 2/6/39 | 415,000 | 662,903 | ||||
| American Tower Corp., 7% Sr. Unsec. Nts., 10/15/17 | 370,000 | 429,858 | ||||
| Anadarko Petroleum Corp., 6.20% Sr. Unsec. Nts., 3/15/40 | 343,000 | 398,161 | ||||
| Arrow Electronics, Inc., 3.375% Sr. Unsec. Nts., 11/1/15 | 990,000 | 1,023,826 | ||||
| AT&T, Inc., 6.30% Sr. Unsec. Unsub. Nts., 1/15/38 | 761,000 | 827,307 | ||||
| Bank of America Corp., 5.875% Sr. Unsec. Nts., 1/5/21 | 210,000 | 243,906 | ||||
| Blackstone Holdings Finance Co. LLC, 6.625% Sr. Unsec. Nts., 8/15/193 | 940,000 | 1,118,235 | ||||
| BNP Paribas SA, 5.186% Jr. Sub. Perpetual Bonds3,5,6 | 170,000 | 175,950 | ||||
| British Telecommunications plc, 9.625% Sr. Unsec. Nts., 12/15/30 | 325,000 | 485,900 | ||||
| Bunge Ltd. Finance Corp.: | ||||||
| 5.35% Sr. Unsec. Unsub. Nts., 4/15/14 | 63,000 | 64,265 | ||||
| 8.50% Sr. Unsec. Nts., 6/15/19 | 365,000 | 456,325 | ||||
| Burlington Northern Santa Fe LLC, 5.75% Sr. Unsec. Nts., 5/1/40 | 143,000 | 158,761 | ||||
| Capital One Financial Corp., 4.75% Sr. Unsec. Nts., 7/15/21 | 262,000 | 282,377 | ||||
| CBS Corp., 7.875% Sr. Unsec. Nts., 7/30/30 | 296,000 | 369,049 | ||||
| Celgene Corp., 5.70% Sr. Unsec. Nts., 10/15/40 | 344,000 | 364,883 | ||||
| CenturyLink, Inc., 7.60% Sr. Unsec. Nts., 9/15/39 | 193,000 | 180,937 |
17 OPPENHEIMER EQUITY INCOME FUND
| STATEMENT OF INVESTMENTS Continued | ||||
| Principal Amount | Value | |||||
| Non-Convertible Corporate Bonds and Notes (Continued) | ||||||
| Citigroup, Inc., 6.125% Sr. Unsec. Nts., 11/21/17 | $ 968,000 | $ | 1,124,326 | |||
| Cloud Peak Energy Resources LLC/Cloud Peak Energy Finance Corp., 8.25% Sr. Unsec. Nts., 12/15/17 | 495,000 | 520,987 | ||||
| CNA Financial Corp.: | ||||||
| 5.75% Sr. Unsec. Unsub. Nts., 8/15/21 | 462,000 | 528,708 | ||||
| 5.875% Sr. Unsec. Unsub. Nts., 8/15/20 | 540,000 | 627,226 | ||||
| Comcast Cable Communications Holdings, Inc., 9.455% Sr. Unsec. Nts., 11/15/22 | 317,000 | 450,700 | ||||
| CSX Corp., 5.50% Sr. Unsec. Nts., 4/15/41 | 148,000 | 159,092 | ||||
| DIRECTV Holdings LLC/DIRECTV Financing Co., Inc., 6.375% Sr. Unsec. Nts., 3/1/41 | 431,000 | 443,412 | ||||
| El Paso Pipeline Partners Operating Co. LLC, 6.50% Sr. Unsec. Nts., 4/1/20 | 782,000 | 912,216 | ||||
| Energizer Holdings, Inc., 4.70% Sr. Unsec. Nts., 5/19/21 | 552,000 | 570,615 | ||||
| Ensco plc, 4.70% Sr. Unsec. Nts., 3/15/21 | 461,000 | 498,667 | ||||
| Family Dollar Stores, Inc., 5% Sr. Unsec. Nts., 2/1/21 | 301,000 | 316,381 | ||||
| Fifth Third Capital Trust IV, 6.50% Jr. Unsec. Sub. Nts., 4/15/375 | 1,017,000 | 1,008,101 | ||||
| FirstEnergy Solutions Corp., 6.80% Sr. Unsec. Nts., 8/15/39 | 317,000 | 324,956 | ||||
| Frontier Communications Corp., 8.25% Sr. Unsec. Nts., 4/15/17 | 465,000 | 539,981 | ||||
| General Electric Capital Corp., 6.375% Unsec. Sub. Nts., 11/15/675 | 1,005,000 | 1,094,194 | ||||
| Glen Meadow Pass-Through Trust, 6.505% Jr. Sub. Nts., 2/12/675,11 | 631,000 | 608,915 | ||||
| Glencore Canada Corp.: | ||||||
| 5.375% Sr. Unsec. Unsub. Nts., 6/1/15 | 170,000 | 179,807 | ||||
| 6.00% Sr. Unsec. Unsub. Nts., 10/15/15 | 411,000 | 444,310 | ||||
| Goldman Sachs Capital I, 6.345% Sub. Nts., 2/15/34 | 523,000 | 524,711 | ||||
| Goldman Sachs Group, Inc. (The), 5.25% Sr. Unsec. Nts., 7/27/21 | 169,000 | 186,771 | ||||
| Harris Corp., 6.15% Sr. Unsec. Nts., 12/15/40 | 168,000 | 183,405 | ||||
| HSBC Finance Capital Trust IX, 5.911% Unsec. Sub. Nts., 11/30/355 | 1,330,000 | 1,379,050 | ||||
| Huntington Bancshares, Inc., 7% Sub. Nts., 12/15/20 | 493,000 | 588,312 | ||||
| International Lease Finance Corp., 5.75% Sr. Unsec. Nts., 5/15/16 | 539,000 | 577,404 | ||||
| Interpublic Group of Cos., Inc. (The), 6.25% Sr. Unsec. Nts., 11/15/14 | 200,000 | 209,750 | ||||
| J.C. Penney Co., Inc., 5.65% Sr. Unsec. Nts., 6/1/20 | 4,875,000 | 3,662,344 | ||||
| JPMorgan Chase & Co., 7.90% Jr. Sub. Perpetual Bonds, Series 15,6 | 900,000 | 993,192 | ||||
| Juniper Networks, Inc., 5.95% Sr. Unsec. Nts., 3/15/41 | 219,000 | 226,057 | ||||
| Kinross Gold Corp., 3.625% Sr. Unsec. Nts., 9/1/16 | 419,000 | 422,133 | ||||
| KLA-Tencor Corp., 6.90% Sr. Unsec. Nts., 5/1/18 | 373,000 | 442,757 | ||||
| Lamar Media Corp., 9.75% Sr. Unsec. Nts., 4/1/14 | 487,000 | 505,262 | ||||
| Liberty Mutual Group, Inc., 5% Sr. Unsec. Nts., 6/1/213 | 808,000 | 872,709 | ||||
| Lincoln National Corp., 6.05% Jr. Unsec. Sub. Nts., 4/20/675 | 1,102,000 | 1,099,245 | ||||
| Lloyds TSB Bank plc, 6.50% Unsec. Sub. Nts., 9/14/203 | 598,000 | 676,381 | ||||
| Lorillard Tobacco Co., 7% Sr. Unsec. Nts., 8/4/41 | 354,000 | 392,494 | ||||
| Macquarie Bank Ltd., 6.625% Unsec. Sub. Nts., 4/7/213 | 735,000 | 817,826 | ||||
| Marriott International, Inc., 6.20% Sr. Unsec. Nts., 6/15/16 | 580,000 | 652,020 | ||||
| MBIA Insurance Corp.: | ||||||
| 11.504% Sub. Nts., 1/15/3312 | 100,000 | 67,000 | ||||
| 11.528% Sub. Nts., 1/15/333,12 | 34,080,000 | 22,833,600 | ||||
| McKesson Corp., 6% Sr. Unsec. Unsub. Nts., 3/1/41 | 288,000 | 333,240 | ||||
| Merrill Lynch & Co., Inc., 7.75% Jr. Sub. Nts., 5/14/38 | 369,000 | 472,624 | ||||
| MGIC Investment Corp., 5.375% Sr. Unsec. Nts., 11/1/15 | 22,930,000 | 23,847,200 |
18 OPPENHEIMER EQUITY INCOME FUND
| Principal Amount | Value | |||||
| Non-Convertible Corporate Bonds and Notes (Continued) | ||||||
| Morgan Stanley: | ||||||
| 5.50% Sr. Unsec. Nts., 7/24/20 | $ 218,000 | $ 246,348 | ||||
| 5.55% Sr. Unsec. Nts., 4/27/17 | 1,275,000 | 1,433,526 | ||||
| Mylan, Inc., 6% Sr. Unsec. Nts., 11/15/183 | 565,000 | 607,996 | ||||
| Nabors Industries, Inc., 6.15% Sr. Unsec. Nts., 2/15/18 | 680,000 | 767,615 | ||||
| Nexen, Inc., 6.40% Sr. Unsec. Unsub. Nts., 5/15/37 | 573,000 | 660,134 | ||||
| NII Capital Corp., 7.625% Sr. Unsec. Nts., 4/1/21 | 18,750,000 | 11,015,625 | ||||
| Nomura Holdings, Inc., 4.125% Sr. Unsec. Nts., 1/19/16 | 520,000 | 548,868 | ||||
| Oncor Electric Delivery Co. LLC, 7% Sr. Sec. Nts., 9/1/22 | 470,000 | 578,091 | ||||
| Potash Corp. of Saskatchewan, Inc., 5.625% Sr. Unsec. Nts., 12/1/40 | 323,000 | 347,974 | ||||
| PPL WEM Holdings plc, 5.375% Sr. Unsec. Unsub. Nts., 5/1/213 | 763,000 | 834,248 | ||||
| Quest Diagnostics, Inc., 5.75% Sr. Unsec. Nts., 1/30/40 | 345,000 | 340,589 | ||||
| Range Resources Corp., 8% Sr. Sub. Nts., 5/15/19 | 503,000 | 541,982 | ||||
| Ras Laffan Liquefied Natural Gas Co. Ltd. III, 5.50% Sr. Sec. Nts., 9/30/143 | 305,000 | 317,962 | ||||
| Rent-A-Center, Inc., 6.625% Sr. Unsec. Nts., 11/15/20 | 569,000 | 603,851 | ||||
| Rockies Express Pipeline LLC, 3.90% Sr. Unsec. Unsub. Nts., 4/15/153 | 930,000 | 932,325 | ||||
| Rowan Cos, Inc., 5% Sr. Unsec. Nts., 9/1/17 | 579,000 | 628,733 | ||||
| Service Corp. International, 6.75% Sr. Unsec. Nts., 4/1/15 | 530,000 | 567,762 | ||||
| SLM Corp., 6.25% Sr. Nts., 1/25/16 | 739,000 | 807,358 | ||||
| Standard Chartered plc, 6.409% Jr. Sub. Perpetual Bonds3,5,6 | 400,000 | 424,750 | ||||
| Swiss Re Capital I LP, 6.854% Jr. Sub. Perpetual Bonds3,5,6 | 1,077,000 | 1,152,390 | ||||
| Symantec Corp., 4.20% Sr. Unsec. Nts., 9/15/20 | 625,000 | 648,607 | ||||
| Texas-New Mexico Power Co., 6.95% Sec. Nts., 4/1/433 | 540,000 | 717,905 | ||||
| Time Warner Entertainment Co. LP, 8.375% Sr. Unsec. Nts., 7/15/33 | 279,000 | 306,150 | ||||
| TransAlta Corp., 5.75% Sr. Unsec. Nts., 12/15/13 | 251,000 | 252,289 | ||||
| TreeHouse Foods, Inc., 7.75% Sr. Unsec. Nts., 3/1/18 | 550,000 | 583,000 | ||||
| UBS Preferred Funding Trust V, 6.243% Jr. Sub. Perpetual Bonds, Series 15,6 | 243,000 | 260,617 | ||||
| Vale Canada Ltd., 5.70% Sr. Unsec. Nts., 10/15/15 | 31,000 | 33,286 | ||||
| Verizon Communications, Inc., 6.40% Sr. Unsec. Nts., 2/15/38 | 318,000 | 358,600 | ||||
| Virgin Media Secured Finance plc: | ||||||
| 5.25% Sr. Sec. Nts., 1/15/21 | 307,000 | 311,868 | ||||
| 6.50% Sr. Sec. Nts., 1/15/18 | 658,000 | 685,965 | ||||
| Wal-Mart Stores, Inc., 5.625% Sr. Unsec. Nts., 4/15/41 | 338,000 | 386,773 | ||||
| Weatherford International Ltd. (Bermuda), 5.125% Sr. Unsec. Unsub. Nts., 9/15/20 | 576,000 | 613,673 | ||||
| Wells Fargo & Co., 7.98% Jr. Sub. Perpetual Bonds, Series K5,6 | 382,000 | 432,615 | ||||
| Willis Group Holdings plc, 4.125% Sr. Unsec. Unsub. Nts., 3/15/16 | 563,000 | 594,270 | ||||
| Woodside Finance Ltd., 4.60% Sr. Unsec. Unsub. Nts., 5/10/213 | 390,000 | 417,496 | ||||
| Xstrata Finance Canada Ltd., 5.80% Sr. Unsec. Unsub. Nts., 11/15/163 | 78,000 | 85,955 | ||||
| ZFS Finance USA Trust V, 6.50% Jr. Sub. Nts., 5/9/373,5 | 598,000 | 639,113 | ||||
Total Non-Convertible Corporate Bonds and Notes (Cost $103,360,935)
|
| 111,010,516
|
| |||
| Convertible Corporate Bonds and Notes—7.1% | ||||||
| Colony Financial, Inc., 5% Cv. Sr. Unsec. Unsub. Nts., 4/15/23 | 5,000,000 | 5,215,625 | ||||
| General Cable Corp., 4.50% Cv. Sub. Nts., 11/15/29 | 32,465,000 | 37,781,144 | ||||
| iStar Financial, Inc., 3% Cv. Sr. Unsec. Nts., 11/15/16 | 5,450,000 | 6,989,625 | ||||
| Liberty Interactive LLC, 0.75% Cv. Sr. Unsec. Unsub. Nts., 3/30/433 | 9,000,000 | 10,800,000 | ||||
19 OPPENHEIMER EQUITY INCOME FUND
| STATEMENTOF INVESTMENTS Continued | ||||
| | Principal Amount | | Value | |||||||||
| Convertible Corporate Bonds and Notes (Continued) | ||||||||||||
| MGIC Investment Corp., 5% Cv. Sr. Unsec. Nts., 5%, 5/1/17 | $ | 13,000,000 | $ 14,616,875 | |||||||||
| MGIC Investment Corp., 9% Cv. Jr. Sub. Nts., 4/1/633 | 93,875,000 | 107,310,859 | ||||||||||
| Micron Technology, Inc., 2.125% Cv. Sr. Unsec. Nts., Series F, 2/15/333 | 7,250,000 | 12,633,125 | ||||||||||
| Molycorp, Inc., 3.25% Cv. Sr. Unsec. Nts., 3.25%, 6/15/16 | 9,500,000 | 6,923,125 | ||||||||||
| Molycorp, Inc., 6% Cv. Sr. Unsec. Nts., 6%, 9/1/17 | 6,500,000 | 4,964,375 | ||||||||||
| Navistar International Corp., 3% Cv. Sr. Sub. Nts., 10/15/14 | 17,945,000 | 18,516,997 | ||||||||||
| Navistar International Corp., 4.50% Cv. Sr. Sub. Nts., 4.50%, 10/15/183 | 20,907,000 | 21,220,605 | ||||||||||
| Peabody Energy Corp., 4.75% Cv. Jr. Sub. Nts., 12/15/41 | 55,000,000 | 45,787,500 | ||||||||||
| Radian Group, Inc., 2.25% Cv. Sr. Unsec. Nts., 3/1/19 | 15,016,000 | 22,617,850 | ||||||||||
| Starwood Property Trust, Inc., 4% Cv. Sr. Unsec. Nts., 1/15/19 | 12,965,000 | 13,913,066 | ||||||||||
| United Airlines, Inc., 4.50% Cv. Sr. Unsec. Nts., 1/15/15 | 27,205,000 | 50,618,303 | ||||||||||
| Total Convertible Corporate Bonds and Notes (Cost $308,259,065) | 379,909,074 | |||||||||||
| Shares | ||||||||||||
| Structured Securities—6.8% | ||||||||||||
| Bank of America Corp., Allegheny Technologies, Inc. Equity Linked Nts., 4/24/141,3 | 312,500 | 10,232,251 | ||||||||||
| Bank of America Corp., American International Group, Inc. Equity Linked Nts., 4/4/141,3 | 393,000 | 18,297,229 | ||||||||||
| Bank of America Corp., Best Buy Co., Inc. Equity Linked Nts., 1/23/141,3 | 342,349 | 11,534,422 | ||||||||||
| Bank of America Corp., Standard Pacific Corp. Equity Linked Nts., 2/12/141 | 1,590,331 | 12,826,482 | ||||||||||
| Bank of America Corp., Standard Pacific Corp. Equity Linked Nts., 5/2/141,3 | 1,203,370 | 10,000,005 | ||||||||||
| Barclays Bank plc, General Motors Co. Equity Linked Nts., 1/29/141 | 271,893 | 10,106,172 | ||||||||||
| Citigroup, Inc., American Axle & Manufacturing Holdings, Inc. Equity Linked Nts., 5/7/141,13 | 538,793 | 9,999,998 | ||||||||||
| Citigroup, Inc., Ensco plc, Cl. A Equity Linked Nts., 2/13/141,3 | 178,602 | 10,508,501 | ||||||||||
| Citigroup, Inc., Micron Technology, Inc. Equity Linked Nts., 11/1/131 | 1,063,954 | 12,274,954 | ||||||||||
| Credit Suisse AG (New York Branch), Apple, Inc. Equity Linked Nts., 2/14/141 | 30,640 | 16,004,751 | ||||||||||
| Credit Suisse AG (New York Branch), Apple, Inc. Equity Linked Nts., 4/25/141 | 19,105 | 10,004,243 | ||||||||||
| Credit Suisse AG (New York Branch), Citigroup, Inc. Equity Linked Nts., 1/24/141 | 190,155 | 9,416,515 | ||||||||||
| Credit Suisse AG (New York Branch), CVS Caremark Corp. Equity Linked Nts., 3/21/141 | 272,250 | 16,697,654 | ||||||||||
| Credit Suisse AG (New York Branch), Safeway, Inc. Equity Linked Nts., 12/31/131 | 411,865 | 12,083,893 | ||||||||||
| Credit Suisse AG (New York Branch), Safeway, Inc. Equity Linked Nts., 5/2/141,13 | 279,096 | 9,688,877 | ||||||||||
| Credit Suisse AG (New York Branch), Standard Pacific Corp. Equity Linked Nts., 3/19/141 | 821,725 | 6,559,947 | ||||||||||
| Credit Suisse AG, Micron Technology, Inc. Equity Linked Nts., 11/1/131 | 1,081,100 | 12,275,173 | ||||||||||
| Deutsche Bank AG (London Branch), Celanese Corp. Equity Linked Nts., 3/20/141,3 | 199,000 | 10,655,389 |
20 OPPENHEIMER EQUITY INCOME FUND
| Shares | Value | |||||
| Structured Securities (Continued) | ||||||
| Deutsche Bank AG (London Branch), Celanese Corp. Equity Linked Nts., 4/25/141,3 | 290,000 | $ | 16,405,943 | |||
| Deutsche Bank AG (London Branch), Standard Pacific Corp. Equity Linked Nts., 2/20/141 | 1,324,600 | 10,487,834 | ||||
| Goldman Sachs Group, Inc. (The), Ford Motor Co. Equity Linked Nts., 3/26/141,3 | 566,701 | 9,934,790 | ||||
| Goldman Sachs Group, Inc. (The), General Motors Co. Equity Linked Nts., 3/26/141,3 | 267,738 | 9,936,180 | ||||
| Goldman Sachs Group, Inc. (The), JPMorgan Chase & Co. Equity Linked Nts., 3/3/141,3 | 184,230 | 9,652,702 | ||||
| Goldman Sachs Group, Inc. (The), MBIA, Inc. Equity Linked Nts., 3/26/141,3 | 854,701 | 9,637,917 | ||||
| Goldman Sachs Group, Inc. (The), Mosaic Co. (The) Equity Linked Nts., 1/30/141,3 | 185,600 | 8,630,061 | ||||
| Goldman Sachs Group, Inc. (The), Standard Pacific Corp. Equity Linked Nts., 3/5/141,3 | 1,408,450 | 10,955,318 | ||||
| JPMorgan Chase & Co., Navistar International Corp. Equity Linked Nts., 11/19/131,3 | 259,943 | 9,600,054 | ||||
| JPMorgan Chase & Co., Navistar International Corp. Equity Linked Nts., 12/24/131,3 | 289,771 | 10,739,099 | ||||
| Merrill Lynch, Medtronic, Inc. Equity Linked Nts., 11/21/131,3 | 238,750 | 13,619,268 | ||||
| Morgan Stanley, Ford Motor Co. Equity Linked Nts., 2/3/141,3 | 571,756 | 10,091,643 | ||||
| Morgan Stanley, General Motors Co. Equity Linked Nts., 2/3/141,3 | 274,726 | 10,277,517 | ||||
| UBS AG (London), Micron Technology, Inc. Equity Linked Nts., 11/8/131,3 | 1,075,300 | 12,254,926 | ||||
| Total Structured Securities (Cost $344,401,409) | 361,389,708 |
| Exercise | Expiration | |||||||||
| Price | Date | Contracts | ||||||||
| Exchange-Traded Options Purchased—0.1% | ||||||||||
| Assured Guaranty Ltd. Call | USD | 21 .00 | 1/18/14 USD | 14,750 | 1,799,500 | |||||
| Assured Guaranty Ltd. Call | USD | 21 .00 | 4/19/14 USD | 2,000 | 390,000 | |||||
| Baxter International, Inc. Put | USD | 62 .50 | 11/16/13 USD | 1,250 | 11,250 | |||||
| Cameron International Corp. Put | USD | 50 .00 | 11/16/13 USD | 500 | 4,000 | |||||
| CenturyLink, Inc. Put | USD | 28 .00 | 11/16/13 USD | 1,000 | 5,000 | |||||
| Cisco Systems, Inc. Put | USD | 21 .00 | 11/16/13 USD | 1,250 | 22,500 | |||||
| Citigroup, Inc. Put | USD | 44 .00 | 11/16/13 USD | 2,500 | 7,500 | |||||
| Citigroup, Inc. Put | USD | 45 .00 | 11/16/13 USD | 6,500 | 32,500 | |||||
| Citigroup, Inc. Put | USD | 45 .00 | 11/16/13 USD | 3,000 | 99,000 | |||||
| CONSOL Energy, Inc. Put | USD | 33 .00 | 11/16/13 USD | 1,500 | 16,500 | |||||
| D.R. Horton, Inc. Put | USD | 17 .00 | 11/16/13 USD | 1,000 | 16,000 | |||||
| General Motors Co. Put | USD | 31 .00 | 11/16/13 USD | 1,500 | 1,500 | |||||
| General Motors Co. Put | USD | 32 .00 | 11/16/13 USD | 2,000 | 2,000 | |||||
| Kinder Morgan, Inc. Put | USD | 32 .50 | 11/16/13 USD | 7,500 | 60,000 | |||||
| MDC Holdings, Inc. Put | USD | 28 .00 | 11/16/13 USD | 1,000 | 30,000 | |||||
| Merck & Co., Inc. Put | USD | 44 .00 | 11/16/13 USD | 1,000 | 13,000 | |||||
| Micron Technology, Inc. Put | USD | 14 .00 | 11/16/13 USD | 4,000 | 8,000 | |||||
| Micron Technology, Inc. Put | USD | 14 .00 | 12/21/13 USD | 1,500 | 18,000 |
21 OPPENHEIMER EQUITY INCOME FUND
| STATEMENTOF INVESTMENTS Continued | ||||
| Exercise Price | Expiration Date | Contracts | Value | |||||||||||||||||
| Exchange-Traded Options Purchased (Continued) | ||||||||||||||||||||
Nordstrom, Inc. Put | USD | 55.00 | 11/16/13 USD | 2,250 | $ | 23,625 | ||||||||||||||
UnitedHealth Group, Inc. Put | USD | 65.00 | 11/16/13 USD | 2,000 | 36,000 | |||||||||||||||
Total Exchange-Traded Options Purchased (Cost $2,979,331) | 2,595,875 | |||||||||||||||||||
| Shares | ||||||||||||||||||||
| Investment Company—1.6% | ||||||||||||||||||||
Oppenheimer Institutional Money Market Fund, Cl. E, 0.11%4,14 (Cost $86,179,484) | 86,179,484 | 86,179,484 | ||||||||||||||||||
Total Investments, at Value (Cost $4,469,290,225) | 100.6% | 5,357,805,029 | ||||||||||||||||||
Liabilities in Excess of Other Assets | (0.6) | (33,249,395 | ) | |||||||||||||||||
|
| |||||||||||||||||||
Net Assets | 100.0 | $ | 5,324,555,634 | |||||||||||||||||
|
| |||||||||||||||||||
Footnotes to Statement of Investments
Principal amount is reported in U.S. Dollars, except for those denoted in the following currency:
EUR Euro
1. Non-income producing security.
2. All or a portion of the security position is held in segregated accounts and pledged to cover margin requirements with respect to outstanding written options. The aggregate market value of such securities is $427,669,621. See Note 6 of the accompanying Notes.
3. Represents securities sold under Rule 144A, which are exempt from registration under the Securities Act of 1933, as amended. These securities have been determined to be liquid under guidelines established by the Board of Trustees. These securities amount to $410,710,647 or 7.71% of the Fund’s net assets as of October 31, 2013.
4. Is or was an affiliate, as defined in the Investment Company Act of 1940, at or during the period ended October 31, 2013, by virtue of the Fund owning at least 5% of the voting securities of the issuer or as a result of the Fund and the issuer having the same investment adviser. Transactions during the period in which the issuer was an affiliate are as follows:
| Shares October 31, 2012 | Gross Additions | Gross Reductions | Shares October 31, 2013 | |||||||||||||
| Box Ships, Inc.a | 1,377,500 | — | 417,500 | 960,000 | ||||||||||||
| Diana Containerships, Inc. a | 1,481,078 | 115,000 | 266,078 | 1,330,000 | ||||||||||||
| Oppenheimer Institutional Money Market Fund, Cl. E | 37,325,668 | 890,188,258 | 841,334,442 | 86,179,484 | ||||||||||||
| Value | Income | Realized Loss | ||||||||||||||
| Box Ships, Inc. a | $ | — | b | $ | 813,918 | $ | 2,885,281 | |||||||||
| Diana Containerships, Inc. a | — | b | 1,421,250 | 349,773 | ||||||||||||
| Oppenheimer Institutional Money Market Fund, Cl. E | 86,179,484 | 137,457 | — | |||||||||||||
|
| |||||||||||||||
| Total | $ | 86,179,484 | $ | 2,372,625 | $ | 3,235,054 | ||||||||||
|
| |||||||||||||||
a. No longer an affiliate as of October 31, 2013.
b. The security is no longer an affiliate, therefore, the value has been excluded from this table.
22 OPPENHEIMER EQUITY INCOME FUND
| Footnotes to Statement of Investments (Continued) | ||||
5. Represents the current interest rate for a variable or increasing rate security.
6. This bond has no contractual maturity date, is not redeemable and contractually pays an indefinite stream of interest. Rate reported represents the current interest rate for this variable rate security.
7. Interest rate is less than 0.0005%.
8. Interest-Only Strips represent the right to receive the monthly interest payments on an underlying pool of mortgage loans. These securities typically decline in price as interest rates decline. Most other fixed income securities increase in price when interest rates decline. The principal amount of the underlying pool represents the notional amount on which current interest is calculated. The price of these securities is typically more sensitive to changes in prepayment rates than traditional mortgage-backed securities (for example, GNMA pass-throughs). Interest rates disclosed represent current yields based upon the current cost basis and estimated timing and amount of future cash flows. These securities amount to $1,285,152 or 0.02% of the Fund’s net assets as of October 31, 2013.
9. Principal-Only Strips represent the right to receive the monthly principal payments on an underlying pool of mortgage loans. The value of these securities generally increases as interest rates decline and prepayment rates rise. The price of these securities is typically more volatile than that of coupon-bearing bonds of the same maturity. Interest rates disclosed represent current yields based upon the current cost basis and estimated timing of future cash flows. These securities amount to $150,542 or less than 0.005% of the Fund’s net assets as of October 31, 2013.
10. The current amortization rate of the security’s cost basis exceeds the future interest payments currently estimated to be received. Both the amortization rate and interest payments are contingent on future mortgage pre-payment speeds and are therefore subject to change.
11. Restricted security. The aggregate value of restricted securities as of October 31, 2013 was $608,915, which represents 0.01% of the Fund’s net assets. See Note 7 of the accompanying Notes. Information concerning restricted securities is as follows:
| Security | Acquisition Date | Cost | Value | Unrealized Appreciation | ||||||||||||
| Glen Meadow Pass-Through Trust, 6.505% Jr. Sub. Nts., 2/12/67 | 1/5/11 | $ | 539,832 | $ | 608,915 | $ 69,083 | ||||||||||
12. This security is not accruing income because the issuer has missed an interest payment on it and/or is not anticipated to make future interest and/or principal payments. The rate shown is the original contractual interest rate. See Note 1 of the accompanying Notes.
13. All or a portion of the security position is when-issued or delayed delivery to be delivered and settled after October 31, 2013. See Note 1 of the accompanying Notes.
14. Rate shown is the 7-day yield as of October 31, 2013.
| Exchange-Traded Options Written at October 31, 2013 | ||||||||||||||||||||||||||||
| Description | Exercise Price | Expiration Date | Number of Contracts | Premiums Received | Value | |||||||||||||||||||||||
| American Axle & Manufacturing Holdings, Inc. Put | USD | 19.000 | 11/16/13 | USD | (750) | $ 65,740 | $ (63,000) | |||||||||||||||||||||
| American Axle & Manufacturing Holdings, Inc. Call | USD | 19.000 | 11/16/13 | USD | (1,325) | 104,701 | (78,175) | |||||||||||||||||||||
| American Axle & Manufacturing Holdings, Inc. Put | USD | 18.000 | 11/16/13 | USD | (1,500) | 70,945 | (67,500) | |||||||||||||||||||||
| American Axle & Manufacturing Holdings, Inc. Call | USD | 20.000 | 11/16/13 | USD | (1,350) | 58,601 | (32,400) | |||||||||||||||||||||
| Apple, Inc. Call | USD | 525.000 | 11/16/13 | USD | (250) | 280,861 | (203,750) | |||||||||||||||||||||
| Apple, Inc. Call | USD | 530.000 | 11/16/13 | USD | (75) | 65,521 | (47,625) | |||||||||||||||||||||
| Archer-Daniels-Midland Co. Call | USD | 42.000 | 11/16/13 | USD | (3,000) | 129,021 | (144,000) | |||||||||||||||||||||
| Archer-Daniels-Midland Co. Call | USD | 42.000 | 12/21/13 | USD | (1,000) | 78,963 | (109,000) | |||||||||||||||||||||
| Assured Guaranty Ltd. Call | USD | 20.000 | 11/16/13 | USD | (500) | 21,232 | (51,000) | |||||||||||||||||||||
| Assured Guaranty Ltd. Put | USD | 18.000 | 1/18/14 | USD | (16,500) | 2,367,411 | (1,023,000) | |||||||||||||||||||||
23 OPPENHEIMER EQUITY INCOME FUND
| STATEMENTOF INVESTMENTS Continued | ||||
| Exchange-Traded Options Written: Continued | ||||||||||||||
| Description | Exercise Price | Expiration Date | Number of Contracts | Premiums Received | Value | |||||||||||||||||||
Assured Guaranty Ltd. Call | USD | 21 .000 | 11/16/13 | USD | (250 | ) | $ 12,721 | $ (12,750) | ||||||||||||||||
Assured Guaranty Ltd. Put | USD | 21 .000 | 11/16/13 | USD | (1,000 | ) | 158,232 | (98,000) | ||||||||||||||||
Assured Guaranty Ltd. Call | USD | 22 .000 | 11/16/13 | USD | (250 | ) | 6,241 | (6,750) | ||||||||||||||||
AT&T, Inc. Call | USD | 36 .000 | 11/16/13 | USD | (1,000 | ) | 17,964 | (56,000) | ||||||||||||||||
Bank of America Corp. Call | USD | 15 .000 | 11/16/13 | USD | (3,500 | ) | 55,874 | (10,500) | ||||||||||||||||
Baxter International, Inc. Call | USD | 65 .000 | 11/16/13 | USD | (125 | ) | 26,870 | (19,625) | ||||||||||||||||
Baxter International, Inc. Put | USD | 65 .000 | 11/16/13 | USD | (1,500 | ) | 121,444 | (55,500) | ||||||||||||||||
Baxter International, Inc. Put | USD | 67 .500 | 11/16/13 | USD | (2,000 | ) | 357,123 | (328,000) | ||||||||||||||||
Baxter International, Inc. Put | USD | 70 .000 | 1/18/14 | USD | (949 | ) | 462,121 | (476,398) | ||||||||||||||||
Beazer Homes USA, Inc. Put | USD | 16 .000 | 11/16/13 | USD | (625 | ) | 33,727 | (10,937) | ||||||||||||||||
Best Buy, Inc. Put | USD | 35 .000 | 11/16/13 | USD | (1,000 | ) | 118,777 | (5,000) | ||||||||||||||||
BP plc Put | USD | 43 .000 | 11/16/13 | USD | (1,750 | ) | 212,684 | (8,750) | ||||||||||||||||
BP plc Put | USD | 42 .000 | 11/16/13 | USD | (1,950 | ) | 153,876 | (7,800) | ||||||||||||||||
Cameron International Corp. Put | USD | 52 .500 | 11/16/13 | USD | (500 | ) | 59,881 | (15,000) | ||||||||||||||||
Celanese Corp. Call | USD | 60 .000 | 11/16/13 | USD | (325 | ) | 15,913 | (4,063) | ||||||||||||||||
CenturyLink, Inc. Put | USD | 30 .000 | 11/16/13 | USD | (500 | ) | 21,982 | (5,000) | ||||||||||||||||
CenturyLink, Inc. Put | USD | 31 .000 | 11/16/13 | USD | (500 | ) | 42,981 | (5,500) | ||||||||||||||||
Cisco Systems, Inc. Call | USD | 23 .000 | 11/16/13 | USD | (600 | ) | 36,915 | (29,400) | ||||||||||||||||
Cisco Systems, Inc. Put | USD | 24 .000 | 11/16/13 | USD | (1,250 | ) | 149,953 | (201,250) | ||||||||||||||||
Cisco Systems, Inc. Put | USD | 23 .000 | 11/16/13 | USD | (2,000 | ) | 162,821 | (190,000) | ||||||||||||||||
Cisco Systems, Inc. Call | USD | 24 .000 | 11/16/13 | USD | (350 | ) | 11,486 | (7,350) | ||||||||||||||||
Cisco Systems, Inc. Call | USD | 25 .000 | 11/16/13 | USD | (250 | ) | 15,991 | (2,000) | ||||||||||||||||
CIT Group, Inc. Call | USD | 52 .500 | 11/16/13 | USD | (3,746 | ) | 213,805 | (14,984) | ||||||||||||||||
Citigroup, Inc. Put | USD | 49 .000 | 12/21/13 | USD | (1,000 | ) | 126,072 | (151,000) | ||||||||||||||||
Citigroup, Inc. Put | USD | 49 .000 | 11/16/13 | USD | (3,500 | ) | 417,408 | (290,500) | ||||||||||||||||
Citigroup, Inc. Put | USD | 48 .000 | 11/16/13 | USD | (1,000 | ) | 107,962 | (42,000) | ||||||||||||||||
CONSOL Energy, Inc. Put | USD | 35 .000 | 12/21/13 | USD | (1,000 | ) | 116,962 | (101,000) | ||||||||||||||||
CONSOL Energy, Inc. Put | USD | 34 .000 | 11/16/13 | USD | (500 | ) | 45,326 | (10,000) | ||||||||||||||||
CONSOL Energy, Inc. Call | USD | 36 .000 | 11/16/13 | USD | (1,500 | ) | 417,109 | (169,500) | ||||||||||||||||
CONSOL Energy, Inc. Call | USD | 38 .000 | 11/16/13 | USD | (321 | ) | 13,470 | (9,951) | ||||||||||||||||
CONSOL Energy, Inc. Put | USD | 35 .000 | 11/16/13 | USD | (500 | ) | 17,537 | (20,000) | ||||||||||||||||
Corning, Inc. Call | USD | 18 .000 | 11/16/13 | USD | (2,500 | ) | 96,739 | (17,500) | ||||||||||||||||
Corning, Inc. Call | USD | 15 .000 | 11/16/13 | USD | (1,000 | ) | 36,964 | (226,000) | ||||||||||||||||
Corning, Inc. Call | USD | 17 .000 | 11/16/13 | USD | (4,000 | ) | 203,909 | (172,000) | ||||||||||||||||
CSX Corp. Call | USD | 25 .000 | 11/16/13 | USD | (225 | ) | 17,542 | (26,550) | ||||||||||||||||
D.R. Horton, Inc. Put | USD | 19 .000 | 11/16/13 | USD | (7,500 | ) | 874,339 | (600,000) | ||||||||||||||||
D.R. Horton, Inc. Put | USD | 18 .000 | 11/16/13 | USD | (500 | ) | 25,482 | (19,500) | ||||||||||||||||
Digital Realty Trust, Inc. Call | USD | 50 .000 | 11/16/13 | USD | (450 | ) | 35,944 | (18,000) | ||||||||||||||||
Digital Realty Trust, Inc. Put | USD | 45 .000 | 11/16/13 | USD | (250 | ) | 10,446 | (11,250) | ||||||||||||||||
Domtar Corp. Put | USD | 85 .000 | 11/16/13 | USD | (250 | ) | 27,991 | (44,375) | ||||||||||||||||
Domtar Corp. Call | USD | 85 .000 | 11/16/13 | USD | (750 | ) | 200,220 | (108,750) | ||||||||||||||||
EMC Corp. Put | USD | 23 .000 | 11/16/13 | USD | (500 | ) | 14,142 | (2,500) | ||||||||||||||||
Ensco plc Put | USD | 55 .000 | 11/16/13 | USD | (2,500 | ) | 329,830 | (37,500) | ||||||||||||||||
Ensco plc Put | USD | 57 .500 | 11/16/13 | USD | (4,911 | ) | 1,437,767 | (417,435) | ||||||||||||||||
Exelon Corp. Put | USD | 30 .000 | 11/16/13 | USD | (500 | ) | 49,481 | (85,000) | ||||||||||||||||
Exelon Corp. Call | USD | 28 .000 | 11/16/13 | USD | (750 | ) | 37,285 | (62,250) | ||||||||||||||||
Exelon Corp. Call | USD | 29 .000 | 11/16/13 | USD | (250 | ) | 5,366 | (6,250) | ||||||||||||||||
Exelon Corp. Call | USD | 30 .000 | 11/16/13 | USD | (125 | ) | 5,995 | (1,250) | ||||||||||||||||
FirstEnergy Corp. Call | USD | 38 .000 | 11/16/13 | USD | (65 | ) | 1,883 | (2,925) | ||||||||||||||||
Foot Locker, Inc. Call | USD | 34 .000 | 11/16/13 | USD | (500 | ) | 41,981 | (55,000) | ||||||||||||||||
Foot Locker, Inc. Put | USD | 35 .000 | 11/16/13 | USD | (476 | ) | 71,858 | (38,080) | ||||||||||||||||
Foot Locker, Inc. Put | USD | 34 .000 | 11/16/13 | USD | (2,500 | ) | 275,076 | (92,500) | ||||||||||||||||
Ford Motor Co. Put | USD | 17 .000 | 11/16/13 | USD | (5,000 | ) | 125,570 | (105,000) | ||||||||||||||||
24 OPPENHEIMER EQUITY INCOME FUND
| ||||
| Exchange-Traded Options Written: Continued |
| Description | Exercise Price | Expiration Date | Number of Contracts | Premiums Received | Value | |||||||||||||||||||||||
Freeport-McMoRan Copper & Gold, Inc. Call | USD | 36 .000 | 11/16/13 | USD | (1,000 | ) | $ 60,963 | $ (117,000) | ||||||||||||||||||||
Freeport-McMoRan Copper & Gold, Inc. Call | USD | 34 .000 | 11/16/13 | USD | (230 | ) | 24,371 | (65,550) | ||||||||||||||||||||
Freeport-McMoRan Copper & Gold, Inc. Call | USD | 35 .000 | 11/16/13 | USD | (250 | ) | 15,991 | (50,000) | ||||||||||||||||||||
General Dynamics Corp. Call | USD | 90 .000 | 11/16/13 | USD | (1,000 | ) | 101,963 | (20,000) | ||||||||||||||||||||
General Mills, Inc. Call | USD | 49 .000 | 11/16/13 | USD | (150 | ) | 11,094 | (25,950) | ||||||||||||||||||||
General Motors Co. Call | USD | 38 .000 | 11/16/13 | USD | (2,500 | ) | 102,317 | (92,500) | ||||||||||||||||||||
General Motors Co. Put | USD | 36 .000 | 12/21/13 | USD | (2,500 | ) | 215,907 | (242,500) | ||||||||||||||||||||
General Motors Co. Put | USD | 35 .000 | 11/16/13 | USD | (1,000 | ) | 123,962 | (17,000) | ||||||||||||||||||||
General Motors Co. Put | USD | 36 .000 | 11/16/13 | USD | (5,250 | ) | 469,712 | (194,250) | ||||||||||||||||||||
General Motors Co. Put | USD | 37 .000 | 11/16/13 | USD | (500 | ) | 124,480 | (36,500) | ||||||||||||||||||||
Intel Corp. Call | USD | 25 .000 | 12/21/13 | USD | (2,000 | ) | 61,928 | (66,000) | ||||||||||||||||||||
International Paper Co. Put | USD | 41 .000 | 11/16/13 | USD | (495 | ) | 44,532 | (5,940) | ||||||||||||||||||||
International Paper Co. Call | USD | 47 .000 | 11/16/13 | USD | (125 | ) | 7,870 | (1,250) | ||||||||||||||||||||
J.C. Penney Co., Inc. Call | USD | 8 .000 | 11/16/13 | USD | (850 | ) | 58,325 | (23,800) | ||||||||||||||||||||
J.C. Penney Co., Inc. Put | USD | 9 .000 | 11/16/13 | USD | (1,000 | ) | 131,962 | (163,000) | ||||||||||||||||||||
J.C. Penney Co., Inc. Put | USD | 10 .000 | 1/18/14 | USD | (1,018 | ) | 307,394 | (301,328) | ||||||||||||||||||||
Johnson & Johnson Call | USD | 90 .000 | 11/16/13 | USD | (750 | ) | 157,471 | (230,250) | ||||||||||||||||||||
JPMorgan Chase & Co. Call | USD | 57 .500 | 11/16/13 | USD | (250 | ) | 4,741 | (500) | ||||||||||||||||||||
JPMorgan Chase & Co. Put | USD | 52 .500 | 11/16/13 | USD | (500 | ) | 48,481 | (65,000) | ||||||||||||||||||||
JPMorgan Chase & Co. Call | USD | 52 .500 | 11/16/13 | USD | (100 | ) | 4,396 | (4,200) | ||||||||||||||||||||
Kinder Morgan, Inc. Put | USD | 37 .500 | 11/16/13 | USD | (951 | ) | 274,800 | (199,710) | ||||||||||||||||||||
Kinder Morgan, Inc. Put | USD | 37 .500 | 12/21/13 | USD | (2,000 | ) | 554,239 | (448,000) | ||||||||||||||||||||
Kinder Morgan, Inc. Put | USD | 35 .000 | 11/16/13 | USD | (6,500 | ) | 782,520 | (227,500) | ||||||||||||||||||||
Kroger Co. Call | USD | 42 .000 | 11/16/13 | USD | (2,000 | ) | 178,236 | (240,000) | ||||||||||||||||||||
Kroger Co. Call | USD | 43 .000 | 11/16/13 | USD | (250 | ) | 12,241 | (11,250) | ||||||||||||||||||||
MBIA, Inc. Put | USD | 11 .000 | 11/16/13 | USD | (10,000 | ) | 765,730 | (330,000) | ||||||||||||||||||||
MBIA, Inc. Put | USD | 10 .000 | 11/16/13 | USD | (5,000 | ) | 276,772 | (47,500) | ||||||||||||||||||||
McDonald’s Corp. Call | USD | 97 .500 | 11/16/13 | USD | (100 | ) | 7,196 | (5,100) | ||||||||||||||||||||
MDC Holdings, Inc. Put | USD | 30 .000 | 11/16/13 | USD | (1,000 | ) | 99,778 | (95,000) | ||||||||||||||||||||
MDC Holdings, Inc. Put | USD | 29 .000 | 11/16/13 | USD | (750 | ) | 151,471 | (52,500) | ||||||||||||||||||||
Merck & Co., Inc. Call | USD | 47 .000 | 11/16/13 | USD | (250 | ) | 18,241 | (1,750) | ||||||||||||||||||||
Merck & Co., Inc. Call | USD | 48 .000 | 11/16/13 | USD | (50 | ) | 1,398 | (100) | ||||||||||||||||||||
Merck & Co., Inc. Call | USD | 46 .000 | 11/16/13 | USD | (150 | ) | 12,444 | (2,700) | ||||||||||||||||||||
Merck & Co., Inc. Put | USD | 46 .000 | 11/16/13 | USD | (2,000 | ) | 157,917 | (188,000) | ||||||||||||||||||||
MGIC Investment Corp. Call | USD | 8 .000 | 11/16/13 | USD | (250 | ) | 7,991 | (13,250) | ||||||||||||||||||||
Micron Technology, Inc. Put | USD | 16 .000 | 11/16/13 | USD | (10,000 | ) | 480,960 | (80,000) | ||||||||||||||||||||
Micron Technology, Inc. Put | USD | 15 .000 | 11/16/13 | USD | (1,000 | ) | 15,924 | (2,000) | ||||||||||||||||||||
Micron Technology, Inc. Put | USD | 16 .000 | 12/21/13 | USD | (1,500 | ) | 74,945 | (66,000) | ||||||||||||||||||||
Microsoft Corp. Call | USD | 36 .000 | 11/16/13 | USD | (500 | ) | 22,482 | (12,000) | ||||||||||||||||||||
Microsoft Corp. Call | USD | 35 .000 | 11/16/13 | USD | (1,000 | ) | 82,963 | (75,000) | ||||||||||||||||||||
Mosaic Co. (The) Put | USD | 50 .000 | 12/21/13 | USD | (1,000 | ) | 632,265 | (415,000) | ||||||||||||||||||||
Navistar International Corp. Put | USD | 34 .000 | 11/16/13 | USD | (500 | ) | 34,942 | (18,000) | ||||||||||||||||||||
Nordstrom, Inc. Put | USD | 57 .500 | 11/16/13 | USD | (1,500 | ) | 165,119 | (43,500) | ||||||||||||||||||||
Philip Morris International, Inc. Put | USD | 85 .000 | 11/16/13 | USD | (500 | ) | 32,982 | (5,500) | ||||||||||||||||||||
Philip Morris International, Inc. Call | USD | 87 .500 | 11/16/13 | USD | (125 | ) | 16,745 | (30,750) | ||||||||||||||||||||
Philip Morris International, Inc. Put | USD | 87 .500 | 11/16/13 | USD | (1,500 | ) | 238,442 | (37,500) | ||||||||||||||||||||
Pitney Bowes, Inc. Call | USD | 19 .000 | 11/16/13 | USD | (2,750 | ) | 334,146 | (569,250) | ||||||||||||||||||||
Pitney Bowes, Inc. Call | USD | 20 .000 | 11/16/13 | USD | (2,750 | ) | 168,429 | (316,250) | ||||||||||||||||||||
Pitney Bowes, Inc. Call | USD | 21 .000 | 11/16/13 | USD | (1,000 | ) | 48,364 | (64,000) | ||||||||||||||||||||
25 OPPENHEIMER EQUITY INCOME FUND
| STATEMENTOF INVESTMENTS Continued | ||||
| Exchange-Traded Options Written: Continued |
| Description | Exercise Price | Expiration Date | Number of Contracts | Premiums Received | Value | |||||||||||||||||||||||
PPL Corp. Put | USD | 30 .000 | 11/16/13 | USD | (500 | ) | $ | 29,482 | $ (7,500) | |||||||||||||||||||
Proctor & Gamble Co. (The) Call | USD | 80 .000 | 11/16/13 | USD | (250 | ) | 19,111 | (36,750) | ||||||||||||||||||||
Radian Group, Inc. Put | USD | 13 .000 | 11/16/13 | USD | (1,500 | ) | 63,341 | (11,250) | ||||||||||||||||||||
Standard Pacific Corp. Put | USD | 8 .000 | 12/21/13 | USD | (30,500 | ) | 2,195,029 | (1,525,000) | ||||||||||||||||||||
Standard Pacific Corp. Put | USD | 8 .000 | 11/16/13 | USD | (4,394 | ) | 170,302 | (153,790) | ||||||||||||||||||||
Take Two Interactive Software, Inc. Put | USD | 17 .000 | 11/16/13 | USD | (3,000 | ) | 246,411 | (60,000) | ||||||||||||||||||||
Take Two Interactive Software, Inc. Put | USD | 16 .000 | 11/16/13 | USD | (1,000 | ) | 49,964 | (5,000) | ||||||||||||||||||||
Target Corp. Put | USD | 65 .000 | 11/16/13 | USD | (250 | ) | 59,270 | (22,000) | ||||||||||||||||||||
Time Warner Cable, Inc. Call | USD | 120 .000 | 11/16/13 | USD | (25 | ) | 8,104 | (8,150) | ||||||||||||||||||||
Time Warner Cable, Inc. Call | USD | 110 .000 | 11/16/13 | USD | (250 | ) | 216,712 | (248,250) | ||||||||||||||||||||
Time Warner Cable, Inc. Call | USD | 105 .000 | 11/16/13 | USD | (2,465 | ) | 3,290,630 | (3,278,450) | ||||||||||||||||||||
Time Warner Cable, Inc. Call | USD | 115 .000 | 11/16/13 | USD | (1,000 | ) | 566,205 | (690,000) | ||||||||||||||||||||
United Continental Holdings Put | USD | 30 .000 | 12/21/13 | USD | (250 | ) | 14,991 | (15,750) | ||||||||||||||||||||
United Continental Holdings Put | USD | 28 .000 | 11/16/13 | USD | (1,000 | ) | 80,848 | (5,500) | ||||||||||||||||||||
UnitedHealth Group, Inc. Put | USD | 67 .500 | 11/16/13 | USD | (1,000 | ) | 108,068 | (69,000) | ||||||||||||||||||||
UnitedHealth Group, Inc. Put | USD | 70 .000 | 11/16/13 | USD | (1,000 | ) | 229,960 | (203,000) | ||||||||||||||||||||
Walgreen Co. Call | USD | 57 .500 | 11/16/13 | USD | (4,000 | ) | 464,369 | (832,000) | ||||||||||||||||||||
Williams Cos., Inc. (The) Call | USD | 36 .000 | 11/16/13 | USD | (100 | ) | 5,377 | (5,400) | ||||||||||||||||||||
Williams Cos., Inc. (The) Put | USD | 35 .000 | 12/21/13 | USD | (250 | ) | 34,240 | (25,750) | ||||||||||||||||||||
Williams Cos., Inc. (The) Call | USD | 37 .000 | 11/16/13 | USD | (150 | ) | 9,745 | (4,200) | ||||||||||||||||||||
|
| |||||||||||||||||||||||||||
Total of Exchange-Traded Options Written |
| $ | 26,489,735 | $ | (18,859,941) | |||||||||||||||||||||||
|
| |||||||||||||||||||||||||||
See accompanying Notes to Financial Statements.
26 OPPENHEIMER EQUITY INCOME FUND
| STATEMENTOF ASSETS AND LIABILITIES October 31, 2013 | ||||
| Assets | ||||||
| Investments, at value—see accompanying statement of investments: | ||||||
| Unaffiliated companies (cost $4,383,110,741) | $ | 5,271,625,545 | ||||
| Affiliated companies (cost $86,179,484) | 86,179,484 | |||||
|
| |||||
| 5,357,805,029 | ||||||
| ||||||
| Cash | 11,439,262 | |||||
| ||||||
| Receivables and other assets: | ||||||
| Investments sold | 25,383,228 | |||||
| Shares of beneficial interest sold | 13,900,786 | |||||
| Interest and dividends | 10,770,041 | |||||
| Other | 339,719 | |||||
|
| |||||
| Total assets |
| 5,419,638,065
|
| |||
| Liabilities | ||||||
| Options written, at value (premiums received $26,489,735) | 18,859,941 | |||||
| ||||||
| Payables and other liabilities: | ||||||
| Investments purchased (including $20,000,113 purchased on a when-issued or delayed delivery basis) | 66,578,935 | |||||
| Shares of beneficial interest redeemed | 7,183,169 | |||||
| Distribution and service plan fees | 1,012,680 | |||||
| Transfer and shareholder servicing agent fees | 629,069 | |||||
| Shareholder communications | 384,184 | |||||
| Trustees’ compensation | 367,900 | |||||
| Dividends | 10,233 | |||||
| Other | 56,320 | |||||
|
| |||||
| Total liabilities |
| 95,082,431
|
| |||
| ||||||
Net Assets | $ | 5,324,555,634 | ||||
|
| |||||
| Composition of Net Assets | ||||||
| Par value of shares of beneficial interest | $ | 17,573 | ||||
| ||||||
| Additional paid-in capital | 4,341,253,523 | |||||
| ||||||
| Accumulated net investment income | 5,343,628 | |||||
| ||||||
| Accumulated net realized gain on investments and foreign currency transactions | 81,796,296 | |||||
| ||||||
| Net unrealized appreciation on investments and translation of assets and liabilities denominated in foreign currencies | 896,144,614 | |||||
|
| |||||
Net Assets | $ | 5,324,555,634 | ||||
|
| |||||
27 OPPENHEIMER EQUITY INCOME FUND
| STATEMENTOF ASSETS AND LIABILITIES Continued | ||||
| Net Asset Value Per Share | ||||||
| Class A Shares: | ||||||
Net asset value and redemption price per share (based on net assets of $3,748,272,370 and 119,554,151 shares of beneficial interest outstanding) | $ | 31.35 | ||||
Maximum offering price per share (net asset value plus sales charge of 5.75% of offering price) | $ | 33.26 | ||||
| ||||||
Class B Shares: | ||||||
Net asset value, redemption price (excludes applicable contingent deferred sales charge) and offering price per share (based on net assets of $168,407,048 and 6,365,997 shares of beneficial interest outstanding) | $ | 26.45 | ||||
| ||||||
Class C Shares: | ||||||
Net asset value, redemption price (excludes applicable contingent deferred sales charge) and offering price per share (based on net assets of $803,867,345 and 30,335,030 shares of beneficial interest outstanding) | $ | 26.50 | ||||
| ||||||
Class I Shares: | ||||||
Net asset value, redemption price and offering price per share (based on net assets of $59,332,349 and 1,894,208 shares of beneficial interest outstanding) | $ | 31.32 | ||||
| ||||||
Class N Shares: | ||||||
Net asset value, redemption price (excludes applicable contingent deferred sales charge) and offering price per share (based on net assets of $182,857,633 and 6,033,463 shares of beneficial interest outstanding) | $ | 30.31 | ||||
| ||||||
Class Y Shares: | ||||||
Net asset value, redemption price and offering price per share (based on net assets of $361,818,889 and 11,546,274 shares of beneficial interest outstanding) | $ | 31.34 | ||||
See accompanying Notes to Financial Statements.
28 OPPENHEIMER EQUITY INCOME FUND
| STATEMENTOF OPERATIONS For the Year Ended October 31, 2013 | ||||
| Investment Income | ||||||
| Dividends: | ||||||
| Unaffiliated companies (net of foreign withholding taxes of $870,040) | $ | 119,388,847 | ||||
| Affiliated companies | 2,372,625 | |||||
| Interest | 31,918,559 | |||||
| Other income | 369,163 | |||||
|
| |||||
| Total investment income |
| 154,049,194
|
| |||
| Expenses | ||||||
| Management fees | 23,953,747 | |||||
| Distribution and service plan fees: | ||||||
| Class A | 7,332,756 | |||||
| Class B | 1,547,467 | |||||
| Class C | 6,054,636 | |||||
| Class N | 751,725 | |||||
| Transfer and shareholder servicing agent fees: | ||||||
| Class A | 4,993,168 | |||||
| Class B | 469,872 | |||||
| Class C | 1,018,662 | |||||
| Class I | 10,431 | |||||
| Class N | 399,674 | |||||
| Class Y | 315,471 | |||||
| Shareholder communications: | ||||||
| Class A | 823,220 | |||||
| Class B | 101,296 | |||||
| Class C | 187,181 | |||||
| Class I | 2,362 | |||||
| Class N | 27,339 | |||||
| Class Y | 39,001 | |||||
| Trustees’ compensation | 113,277 | |||||
| Custodian fees and expenses | 44,240 | |||||
| Other | 478,431 | |||||
|
| |||||
| Total expenses | 48,663,956 | |||||
| Less waivers and reimbursements of expenses | (117,131 | ) | ||||
|
| |||||
| Net expenses | 48,546,825 | |||||
| ||||||
Net Investment Income |
| 105,502,369
|
| |||
| Realized and Unrealized Gain (Loss) | ||||||
| Net realized gain (loss) on: | ||||||
| Investments from: | ||||||
Unaffiliated companies (including premiums on options exercised) | 205,230,132 | |||||
Affiliated companies | (3,235,054 | ) | ||||
| Closing and expiration of option contracts written | 50,126,993 | |||||
| Foreign currency transactions | 5,817 | |||||
|
| |||||
| Net realized gain | 252,127,888 | |||||
29 OPPENHEIMER EQUITY INCOME FUND
| STATEMENTOF OPERATIONS Continued | ||||
| Realized and Unrealized Gain (Loss) Continued | ||||||
| Net change in unrealized appreciation/depreciation on: | ||||||
| Investments | $ | 607,620,459 | ||||
| Translation of assets and liabilities denominated in foreign currencies | (4,898 | ) | ||||
| Option contracts written | 7,940,415 | |||||
|
| |||||
| Net change in unrealized appreciation/depreciation |
| 615,555,976
|
| |||
| ||||||
Net Increase in Net Assets Resulting from Operations | $ | 973,186,233 | ||||
|
| |||||
See accompanying Notes to Financial Statements.
30 OPPENHEIMER EQUITY INCOME FUND
| STATEMENTSOF CHANGES IN NET ASSETS | ||||
| Year Ended October 31, 2013 | Year Ended October 31, 2012 | |||||||||||
| ||||||||||||
| Operations | ||||||||||||
| Net investment income | $ | 105,502,369 | $ | 72,330,439 | ||||||||
| ||||||||||||
| Net realized gain | 252,127,888 | 93,447,356 | ||||||||||
| ||||||||||||
| Net change in unrealized appreciation/depreciation | 615,555,976 | 280,763,821 | ||||||||||
| ||||||||||||
Net increase in net assets resulting from operations
|
| 973,186,233
|
|
| 446,541,616
|
| ||||||
| ||||||||||||
| Dividends and/or Distributions to Shareholders | ||||||||||||
| Dividends from net investment income: | ||||||||||||
| Class A | (86,102,360) | (68,470,090) | ||||||||||
| Class B | (3,959,576) | (3,705,335) | ||||||||||
| Class C | (16,106,656) | (11,411,195) | ||||||||||
| Class I | (926,195) | (5,172) | ||||||||||
| Class N | (3,960,895) | (3,000,761) | ||||||||||
| Class Y | (8,068,147) | (4,239,736) | ||||||||||
| ||||||||||||
|
| (119,123,829)
|
|
| (90,832,289)
|
| |||||||
| ||||||||||||
| Distributions from net realized gain: | ||||||||||||
| Class A | (26,642,670) | — | ||||||||||
| Class B | (1,790,002) | — | ||||||||||
| Class C | (5,758,698) | — | ||||||||||
| Class I | (100,130) | — | ||||||||||
| Class N | (1,368,886) | — | ||||||||||
| Class Y | (2,106,354) | — | ||||||||||
| ||||||||||||
|
| (37,766,740)
|
|
| —
|
| |||||||
| ||||||||||||
| Beneficial Interest Transactions | ||||||||||||
| Net increase (decrease) in net assets resulting from beneficial interest transactions: | ||||||||||||
| Class A | 663,130,448 | 112,148,407 | ||||||||||
| Class B | (6,605,046) | 1,917,712 | ||||||||||
| Class C | 233,752,259 | 46,615,679 | ||||||||||
| Class I | 42,440,350 | 10,068,007 | ||||||||||
| Class N | 29,932,968 | 14,552,611 | ||||||||||
| Class Y | 112,261,454 | 75,500,314 | ||||||||||
| ||||||||||||
|
| 1,074,912,433
|
|
| 260,802,730
|
| |||||||
| ||||||||||||
| Net Assets | ||||||||||||
| Total increase | 1,891,208,097 | 616,512,057 | ||||||||||
| ||||||||||||
| Beginning of period | 3,433,347,537 | 2,816,835,480 | ||||||||||
| ||||||||||||
End of period (including accumulated net investment income (loss) of $5,343,628 and $(4,636,236), respectively)
| $ | 5,324,555,634 | $ | 3,433,347,537 | ||||||||
| ||||||||||||
See accompanying Notes to Financial Statements.
31 OPPENHEIMER EQUITY INCOME FUND
| FINANCIAL HIGHLIGHTS | ||||
| Class A | Year Ended October 31, 2013 | Year Ended October 31, 2012 | Year Ended October 31, 2011 | Year Ended October 29, 20101 | Year Ended October 31, 2009 | |||||||||||||||||||||||||
| ||||||||||||||||||||||||||||||
| Per Share Operating Data | ||||||||||||||||||||||||||||||
| Net asset value, beginning of period | $ | 25.80 | $ | 22.95 | $ | 22.87 | $ | 19.23 | $ | 15.65 | ||||||||||||||||||||
| ||||||||||||||||||||||||||||||
| Income (loss) from investment operations: | ||||||||||||||||||||||||||||||
| Net investment income2 | 0.75 | 0.61 | 0.51 | 0.40 | 0.70 | |||||||||||||||||||||||||
| Net realized and unrealized gain | 5.89 | 2.97 | 0.11 | 3.65 | 3.62 | |||||||||||||||||||||||||
| ||||||||||||||||||||||||||||||
| Total from investment operations | 6.64 | 3.58 | 0.62 | 4.05 | 4.32 | |||||||||||||||||||||||||
| ||||||||||||||||||||||||||||||
| Dividends and/or distributions to shareholders: | ||||||||||||||||||||||||||||||
| Dividends from net investment income | (0.82) | (0.73) | (0.54) | (0.41) | (0.74) | |||||||||||||||||||||||||
| Distributions from net realized gain | (0.27) | 0.00 | 0.00 | 0 .00 | 0.00 | |||||||||||||||||||||||||
| ||||||||||||||||||||||||||||||
| Total dividends and/or distributions to shareholders | (1.09) | (0.73) | (0.54) | (0.41) | (0.74) | |||||||||||||||||||||||||
| ||||||||||||||||||||||||||||||
| Net asset value, end of period | $ | 31.35 | $ | 25.80 | $ | 22.95 | $ | 22.87 | $ | 19.23 | ||||||||||||||||||||
| ||||||||||||||||||||||||||||||
| ||||||||||||||||||||||||||||||
| Total Return, at Net Asset Value3 | 26.57% | 15.94% | 2.64% | 21.25% | 28.82% | |||||||||||||||||||||||||
| ||||||||||||||||||||||||||||||
| Ratios/Supplemental Data | ||||||||||||||||||||||||||||||
| Net assets, end of period (in thousands) | $ | 3,748,273 | $ | 2,494,276 | $ | 2,116,802 | $ | 918,456 | $ | 323,033 | ||||||||||||||||||||
| ||||||||||||||||||||||||||||||
| Average net assets (in thousands) | $ | 3,048,993 | $ | 2,276,255 | $ | 1,591,296 | $ | 593,104 | $ | 225,561 | ||||||||||||||||||||
| ||||||||||||||||||||||||||||||
| Ratios to average net assets:4 | ||||||||||||||||||||||||||||||
| Net investment income | 2.62% | 2.51% | 2.13% | 1.86% | 4.29% | |||||||||||||||||||||||||
| Total expenses5 | 1.01% | 1.06% | 1.09% | 1.21% | 1.36% | |||||||||||||||||||||||||
| Expenses after payments, waivers and/or reimbursements and reduction to custodian expenses | 1.01% | 1.06% | 1.09% | 1.21% | 1.36% | |||||||||||||||||||||||||
| ||||||||||||||||||||||||||||||
| Portfolio turnover rate | 31% | 30% | 37% | 6 | 60% | 105% | ||||||||||||||||||||||||
1. October 29, 2010 represents the last business day of the Fund’s reporting period.
2. Per share amounts calculated based on the average shares outstanding during the period.
3. Assumes an initial investment on the business day before the first day of the fiscal period, with all dividends and distributions reinvested in additional shares on the reinvestment date, and redemption at the net asset value calculated on the last business day of the fiscal period. Sales charges are not reflected in the total returns. Total returns are not annualized for periods less than one full year. Returns do not reflect the deduction of taxes that a shareholder would pay on fund distributions or the redemption of fund shares.
4. Annualized for periods less than one full year.
5. Total expenses including indirect expenses from affiliated fund were as follows:
| Year Ended October 31, 2013 | 1.01 | % | ||||||
| Year Ended October 31, 2012 | 1.06 | % | ||||||
| Year Ended October 31, 2011 | 1.09 | % | ||||||
| Year Ended October 29, 2010 | 1.21 | % | ||||||
| Year Ended October 31, 2009 | 1.36 | % |
6. The portfolio turnover rate excludes purchase and sale transactions of To Be Announced (TBA) mortgage-related securities as follows:
| Purchase Transactions | Sale Transactions | |||||||||
| ||||||||||
| Year Ended October 31, 2011 | $— | $68,139,011 | ||||||||
See accompanying Notes to Financial Statements.
32 OPPENHEIMER EQUITY INCOME FUND
| Class B | Year Ended October 31, 2013 | Year Ended October 31, 2012 | Year Ended October 31, 2011 | Year Ended October 29, 20101 | Year Ended October 31, 2009 | |||||||||||||||||||||||||
| ||||||||||||||||||||||||||||||
| Per Share Operating Data | ||||||||||||||||||||||||||||||
| Net asset value, beginning of period | $ | 21.95 | $ | 19.64 | $ | 19.68 | $ | 16.61 | $ | 13.63 | ||||||||||||||||||||
| ||||||||||||||||||||||||||||||
| Income (loss) from investment operations: | ||||||||||||||||||||||||||||||
| Net investment income2 | 0.41 | 0.32 | 0.25 | 0.18 | 0.50 | |||||||||||||||||||||||||
| Net realized and unrealized gain | 4.98 | 2.55 | 0.08 | 3.15 | 3.11 | |||||||||||||||||||||||||
| ||||||||||||||||||||||||||||||
| Total from investment operations | 5.39 | 2.87 | 0.33 | 3.33 | 3.61 | |||||||||||||||||||||||||
| ||||||||||||||||||||||||||||||
| Dividends and/or distributions to shareholders: | ||||||||||||||||||||||||||||||
| Dividends from net investment income | (0.62) | (0.56) | (0.37) | (0.26) | (0.63) | |||||||||||||||||||||||||
| Distributions from net realized gain | (0.27) | 0.00 | 0.00 | 0.00 | 0.00 | |||||||||||||||||||||||||
| ||||||||||||||||||||||||||||||
| Total dividends and/or distributions to shareholders | (0.89) | (0.56) | (0.37) | (0.26) | (0.63) | |||||||||||||||||||||||||
| ||||||||||||||||||||||||||||||
| Net asset value, end of period | $ | 26.45 | $ | 21.95 | $ | 19.64 | $ | 19.68 | $ | 16.61 | ||||||||||||||||||||
| ||||||||||||||||||||||||||||||
| ||||||||||||||||||||||||||||||
Total Return, at Net Asset Value3
|
| 25.35%
|
|
| 14.90%
|
|
| 1.61%
|
|
| 20.22%
|
|
| 27.69%
|
| |||||||||||||||
| ||||||||||||||||||||||||||||||
| Ratios/Supplemental Data | ||||||||||||||||||||||||||||||
| Net assets, end of period (in thousands) | $ | 168,407 | $ | 146,117 | $ | 128,777 | $ | 65,791 | $ | 31,723 | ||||||||||||||||||||
| ||||||||||||||||||||||||||||||
| Average net assets (in thousands) | $ | 155,005 | $ | 138,448 | $ | 96,706 | $ | 48,363 | $ | 24,503 | ||||||||||||||||||||
| ||||||||||||||||||||||||||||||
| Ratios to average net assets:4 | ||||||||||||||||||||||||||||||
| Net investment income | 1.72% | 1.56% | 1.20% | 0.96% | 3.57% | |||||||||||||||||||||||||
| Total expenses5 | 1.94% | 2.02% | 2.06% | 2.25% | 2.48% | |||||||||||||||||||||||||
| Expenses after payments, waivers and/or reimbursements and reduction to custodian expenses | 1.94% | 2.02% | 2.02% | 2.13% | 2.22% | |||||||||||||||||||||||||
| ||||||||||||||||||||||||||||||
| Portfolio turnover rate | 31 % | 30 % | 37 % | 6 | 60 % | 105 % | ||||||||||||||||||||||||
1. October 29, 2010 represents the last business day of the Fund’s reporting period.
2. Per share amounts calculated based on the average shares outstanding during the period.
3. Assumes an initial investment on the business day before the first day of the fiscal period, with all dividends and distributions reinvested in additional shares on the reinvestment date, and redemption at the net asset value calculated on the last business day of the fiscal period. Sales charges are not reflected in the total returns. Total returns are not annualized for periods less than one full year. Returns do not reflect the deduction of taxes that a shareholder would pay on fund distributions or the redemption of fund shares.
4. Annualized for periods less than one full year.
5. Total expenses including indirect expenses from affiliated fund were as follows:
| Year Ended October 31, 2013 | 1.94 | % | ||||||
| Year Ended October 31, 2012 | 2.02 | % | ||||||
| Year Ended October 31, 2011 | 2.06 | % | ||||||
| Year Ended October 29, 2010 | 2.25 | % | ||||||
| Year Ended October 31, 2009 | 2.48 | % |
6. The portfolio turnover rate excludes purchase and sale transactions of To Be Announced (TBA) mortgage-related securities as follows:
| Purchase Transactions | Sale Transactions | |||||||||
| ||||||||||
| Year Ended October 31, 2011 | $— | $68,139,011 | ||||||||
See accompanying Notes to Financial Statements.
33 OPPENHEIMER EQUITY INCOME FUND
| FINANCIAL HIGHLIGHTS Continued | ||||
| Class C | Year Ended October 31, 2013 | Year Ended October 31, 2012 | Year Ended October 31, 2011 | Year Ended October 29, 20101 | Year Ended October 31, 2009 | |||||||||||||||||||||||||
| ||||||||||||||||||||||||||||||
| Per Share Operating Data | ||||||||||||||||||||||||||||||
| Net asset value, beginning of period | $ | 21.99 | $ | 19.68 | $ | 19.72 | $ | 16.65 | $ | 13.66 | ||||||||||||||||||||
| ||||||||||||||||||||||||||||||
| Income (loss) from investment operations: | ||||||||||||||||||||||||||||||
| Net investment income2 | 0.45 | 0.35 | 0.28 | 0.19 | 0.50 | |||||||||||||||||||||||||
| Net realized and unrealized gain | 5.00 | 2.55 | 0.09 | 3.16 | 3.13 | |||||||||||||||||||||||||
| ||||||||||||||||||||||||||||||
| Total from investment operations | 5.45 | 2.90 | 0.37 | 3.35 | 3.63 | |||||||||||||||||||||||||
| ||||||||||||||||||||||||||||||
| Dividends and/or distributions to shareholders: | ||||||||||||||||||||||||||||||
| Dividends from net investment income | (0.67) | (0.59) | (0.41) | (0.28) | (0.64) | |||||||||||||||||||||||||
| Distributions from net realized gain | (0.27) | 0.00 | 0.00 | 0.00 | 0.00 | |||||||||||||||||||||||||
| ||||||||||||||||||||||||||||||
| Total dividends and/or distributions to shareholders | (0.94) | (0.59) | (0.41) | (0.28) | (0.64) | |||||||||||||||||||||||||
| ||||||||||||||||||||||||||||||
| Net asset value, end of period | $ | 26.50 | $ | 21.99 | $ | 19.68 | $ | 19.72 | $ | 16.65 | ||||||||||||||||||||
| ||||||||||||||||||||||||||||||
| ||||||||||||||||||||||||||||||
Total Return, at Net Asset Value3
|
| 25.62%
|
|
| 15.05%
|
|
| 1.79%
|
|
| 20.30%
|
|
| 27.77%
|
| |||||||||||||||
| ||||||||||||||||||||||||||||||
| Ratios/Supplemental Data | ||||||||||||||||||||||||||||||
| Net assets, end of period (in thousands) | $ | 803,867 | $ | 458,291 | $ | 365,942 | $ | 128,951 | $ | 44,774 | ||||||||||||||||||||
| ||||||||||||||||||||||||||||||
| Average net assets (in thousands) | $ | 607,483 | $ | 408,320 | $ | 269,739 | $ | 80,931 | $ | 32,357 | ||||||||||||||||||||
| ||||||||||||||||||||||||||||||
| Ratios to average net assets:4 | ||||||||||||||||||||||||||||||
| Net investment income | 1.83% | 1.72% | 1.36% | 1.02% | 3.53% | |||||||||||||||||||||||||
| Total expenses5 | 1.77% | 1.85% | 1.86% | 2.05% | 2.28% | |||||||||||||||||||||||||
| Expenses after payments, waivers and/or reimbursements and reduction to custodian expenses | 1.77% | 1.85% | 1.86% | 2.05% | 2.17% | |||||||||||||||||||||||||
| ||||||||||||||||||||||||||||||
| Portfolio turnover rate | 31 % | 30 % | 37 % | 6 | 60 % | 105 % | ||||||||||||||||||||||||
1. October 29, 2010 represents the last business day of the Fund’s reporting period.
2. Per share amounts calculated based on the average shares outstanding during the period.
3. Assumes an initial investment on the business day before the first day of the fiscal period, with all dividends and distributions reinvested in additional shares on the reinvestment date, and redemption at the net asset value calculated on the last business day of the fiscal period. Sales charges are not reflected in the total returns. Total returns are not annualized for periods less than one full year. Returns do not reflect the deduction of taxes that a shareholder would pay on fund distributions or the redemption of fund shares.
4. Annualized for periods less than one full year.
5. Total expenses including indirect expenses from affiliated fund were as follows:
| Year Ended October 31, 2013 | 1.77 | % | ||||||
| Year Ended October 31, 2012 | 1.85 | % | ||||||
| Year Ended October 31, 2011 | 1.86 | % | ||||||
| Year Ended October 29, 2010 | 2.05 | % | ||||||
| Year Ended October 31, 2009 | 2.28 | % |
6. The portfolio turnover rate excludes purchase and sale transactions of To Be Announced (TBA) mortgage-related securities as follows:
| Purchase Transactions | Sale Transactions | |||||||||
| ||||||||||
| Year Ended October 31, 2011 | $— | $68,139,011 | ||||||||
See accompanying Notes to Financial Statements.
34 OPPENHEIMER EQUITY INCOME FUND
| Class I | Year Ended October 31, 2013 | Period Ended October 31, 20121 | ||||||||||||||
| ||||||||||||||||
Per Share Operating Data |
| |||||||||||||||
| Net asset value, beginning of period | $ | 25.78 | $ | 24.90 | ||||||||||||
| ||||||||||||||||
| Income (loss) from investment operations: | ||||||||||||||||
| Net investment income2 | 0.83 | 0.43 | ||||||||||||||
| Net realized and unrealized gain | 5.92 | 0.93 | ||||||||||||||
|
| |||||||||||||||
| Total from investment operations | 6.75 | 1.36 | ||||||||||||||
| ||||||||||||||||
| Dividends and/or distributions to shareholders: | ||||||||||||||||
| Dividends from net investment income | (0.94) | (0.48) | ||||||||||||||
| Distributions from net realized gain | (0.27) | 0.00 | ||||||||||||||
|
| |||||||||||||||
| Total dividends and/or distributions to shareholders | (1.21) | (0.48) | ||||||||||||||
| ||||||||||||||||
| Net asset value, end of period | $ | 31.32 | $ | 25.78 | ||||||||||||
|
| |||||||||||||||
| ||||||||||||||||
Total Return, at Net Asset Value3 | 27.06% | 5.57% | ||||||||||||||
| ||||||||||||||||
Ratios/Supplemental Data | ||||||||||||||||
| Net assets, end of period (in thousands) | $ | 59,332 | $ | 10,147 | ||||||||||||
| ||||||||||||||||
| Average net assets (in thousands) | $ | 34,913 | $ | 414 | ||||||||||||
| ||||||||||||||||
| Ratios to average net assets:4 | ||||||||||||||||
| Net investment income | 2.85% | 2.73% | ||||||||||||||
| Total expenses5 | 0.61% | 0.63% | ||||||||||||||
| Expenses after payments, waivers and/or reimbursements and reduction to custodian expenses5 | 0.61% | 0.63% | ||||||||||||||
| ||||||||||||||||
| Portfolio turnover rate | 31 % | 30 % | ||||||||||||||
1. For the period from February 28, 2012 (inception of offering) to October 31, 2012.
2. Per share amounts calculated based on the average shares outstanding during the period.
3. Assumes an initial investment on the business day before the first day of the fiscal period, with all dividends and distributions reinvested in additional shares on the reinvestment date, and redemption at the net asset value calculated on the last business day of the fiscal period. Sales charges are not reflected in the total returns. Total returns are not annualized for periods less than one full year. Returns do not reflect the deduction of taxes that a shareholder would pay on fund distributions or the redemption of fund shares.
4. Annualized for periods less than one full year.
5. Total expenses including indirect expenses from affiliated fund were as follows:
| Year Ended October 31, 2013 | 0.61 | % | ||||||
| Period Ended October 31, 2012 | 0.63 | % |
See accompanying Notes to Financial Statements.
35 OPPENHEIMER EQUITY INCOME FUND
| FINANCIAL HIGHLIGHTS Continued | ||||
| Class N | Year Ended October 31, 2013 | Year Ended October 31, 2012 | Year Ended October 31, 2011 | Year Ended October 29, 20101 | Year Ended October 31, 2009 | |||||||||||||||
| ||||||||||||||||||||
| Per Share Operating Data | ||||||||||||||||||||
| Net asset value, beginning of period | $ | 24.99 | $ | 22.25 | $ | 22.21 | $ | 18.70 | $ | 15.24 | ||||||||||
| ||||||||||||||||||||
| Income (loss) from investment operations: | ||||||||||||||||||||
| Net investment income2 | 0.63 | 0.49 | 0.41 | 0.30 | 0.64 | |||||||||||||||
| Net realized and unrealized gain | 5.70 | 2.89 | 0.08 | 3.55 | 3.51 | |||||||||||||||
|
| |||||||||||||||||||
| Total from investment operations | 6.33 | 3.38 | 0.49 | 3.85 | 4.15 | |||||||||||||||
| ||||||||||||||||||||
| Dividends and/or distributions to shareholders: | ||||||||||||||||||||
| Dividends from net investment income | (0.74) | (0.64) | (0.45) | (0.34) | (0.69) | |||||||||||||||
| Distributions from net realized gain | (0.27) | 0.00 | 0.00 | 0.00 | 0.00 | |||||||||||||||
|
| |||||||||||||||||||
| Total dividends and/or distributions to shareholders | (1.01) | (0.64) | (0.45) | (0.34) | (0.69) | |||||||||||||||
| ||||||||||||||||||||
| Net asset value, end of period | $ | 30.31 | $ | 24.99 | $ | 22.25 | $ | 22.21 | $ | 18.70 | ||||||||||
|
| |||||||||||||||||||
| ||||||||||||||||||||
Total Return, at Net Asset Value3
|
| 26.11%
|
|
| 15.51%
|
|
| 2.14%
|
|
| 20.77%
|
|
| 28.40%
|
| |||||
| ||||||||||||||||||||
Ratios/Supplemental Data | ||||||||||||||||||||
| Net assets, end of period (in thousands) | $ | 182,858 | $ | 124,081 | $ | 96,121 | $ | 40,582 | $ | 12,966 | ||||||||||
| ||||||||||||||||||||
| Average net assets (in thousands) | $ | 150,952 | $ | 111,920 | $ | 73,231 | $ | 25,675 | $ | 9,706 | ||||||||||
| ||||||||||||||||||||
| Ratios to average net assets:4 | ||||||||||||||||||||
| Net investment income | 2.27% | 2.08% | 1.73% | 1.48% | 4.08% | |||||||||||||||
| Total expenses5 | 1.36% | 1.48% | 1.55% | 1.83% | 2.36% | |||||||||||||||
| Expenses after payments, waivers and/or reimbursements and reduction to custodian expenses | 1.36% | 1.48% | 1.50% | 1.58% | 1.67% | |||||||||||||||
| ||||||||||||||||||||
| Portfolio turnover rate | 31 % | 30 % | 37 %6 | 60 % | 105 % | |||||||||||||||
1. October 29, 2010 represents the last business day of the Fund’s reporting period.
2. Per share amounts calculated based on the average shares outstanding during the period.
3. Assumes an initial investment on the business day before the first day of the fiscal period, with all dividends and distributions reinvested in additional shares on the reinvestment date, and redemption at the net asset value calculated on the last business day of the fiscal period. Sales charges are not reflected in the total returns. Total returns are not annualized for periods less than one full year. Returns do not reflect the deduction of taxes that a shareholder would pay on fund distributions or the redemption of fund shares.
4. Annualized for periods less than one full year.
5. Total expenses including indirect expenses from affiliated fund were as follows:
| Year Ended October 31, 2013 | 1.36 | % | ||||||
| Year Ended October 31, 2012 | 1.48 | % | ||||||
| Year Ended October 31, 2011 | 1.55 | % | ||||||
| Year Ended October 29, 2010 | 1.83 | % | ||||||
| Year Ended October 31, 2009 | 2.36 | % |
6. The portfolio turnover rate excludes purchase and sale transactions of To Be Announced (TBA) mortgage-related securities as follows:
| Purchase Transactions | Sale Transactions | |||||||||
| ||||||||||
| Year Ended October 31, 2011 | $— | $68,139,011 | ||||||||
See accompanying Notes to Financial Statements.
36 OPPENHEIMER EQUITY INCOME FUND
| Class Y | Year Ended October 31, 2013 | Year Ended October 31, 2012 | Period Ended October 31, 20111 | |||||||||||||
| ||||||||||||||||
| Per Share Operating Data | ||||||||||||||||
| Net asset value, beginning of period | $ | 25.79 | $ | 22.94 | $ | 25.76 | ||||||||||
| ||||||||||||||||
| Income (loss) from investment operations: | ||||||||||||||||
| Net investment income2 | 0.84 | 0.66 | 0.36 | |||||||||||||
| Net realized and unrealized gain (loss) | 5.89 | 2.99 | (2.78) | |||||||||||||
|
| |||||||||||||||
| Total from investment operations | 6.73 | 3.65 | (2.42) | |||||||||||||
| ||||||||||||||||
| Dividends and/or distributions to shareholders: | ||||||||||||||||
| Dividends from net investment income | (0.91) | (0.80) | (0.40) | |||||||||||||
| Distributions from net realized gain | (0.27) | 0.00 | 0.00 | |||||||||||||
|
| |||||||||||||||
| Total dividends and/or distributions to shareholders | (1.18) | (0.80) | (0.40) | |||||||||||||
| ||||||||||||||||
| Net asset value, end of period | $ | 31.34 | $ | 25.79 | $ | 22.94 | ||||||||||
|
| |||||||||||||||
| ||||||||||||||||
Total Return, at Net Asset Value3
|
| 26.97%
|
|
| 16.30%
|
|
| (9.45)%
|
| |||||||
| ||||||||||||||||
| Ratios/Supplemental Data | ||||||||||||||||
| Net assets, end of period (in thousands) | $ | 361,819 | $ | 200,436 | $ | 109,193 | ||||||||||
| ||||||||||||||||
| Average net assets (in thousands) | $ | 258,619 | $ | 131,940 | $ | 50,333 | ||||||||||
| ||||||||||||||||
| Ratios to average net assets:4 | ||||||||||||||||
| Net investment income | 2.89% | 2.73% | 2.32% | |||||||||||||
| Total expenses5 | 0.71% | 0.76% | 0.80% | |||||||||||||
| Expenses after payments, waivers and/or reimbursements and reduction to custodian expenses | 0.71% | 0.76% | 0.80% | |||||||||||||
| ||||||||||||||||
| Portfolio turnover rate | 31 % | 30 % | 37 % | 6 | ||||||||||||
1. For the period from February 28, 2011 (inception of offering) to October 31, 2011.
2. Per share amounts calculated based on the average shares outstanding during the period.
3. Assumes an initial investment on the business day before the first day of the fiscal period, with all dividends and distributions reinvested in additional shares on the reinvestment date, and redemption at the net asset value calculated on the last business day of the fiscal period. Sales charges are not reflected in the total returns. Total returns are not annualized for periods less than one full year. Returns do not reflect the deduction of taxes that a shareholder would pay on fund distributions or the redemption of fund shares.
4. Annualized for periods less than one full year.
5. Total expenses including indirect expenses from affiliated fund were as follows:
| Year Ended October 31, 2013 | 0.71 | % | ||||||
| Year Ended October 31, 2012 | 0.76 | % | ||||||
| Period Ended October 31, 2011 | 0.80 | % |
6. The portfolio turnover rate excludes purchase and sale transactions of To Be Announced (TBA) mortgage-related securities as follows:
| Purchase Transactions | Sale Transactions | |||||||||
| ||||||||||
| Period Ended October 31, 2011 | $— | $68,139,011 | ||||||||
See accompanying Notes to Financial Statements.
37 OPPENHEIMER EQUITY INCOME FUND
| NOTESTO FINANCIAL STATEMENTS | ||||
1. Significant Accounting Policies
Oppenheimer Equity Income Fund (the “Fund”) (formerly Oppenheimer Equity Income Fund, Inc.) is a diversified open-end management investment company registered under the Investment Company Act of 1940, as amended. The Fund’s investment objective is to seek total return. The Fund’s investment adviser was OppenheimerFunds, Inc. (“OFI” or the “Sub-Adviser”) through December 31, 2012. Effective January 1, 2013, the Fund’s investment adviser is OFI Global Asset Management, Inc. (“OFI Global” or the “Manager”), a wholly-owned subsidiary of OFI. The Manager has entered into a sub-advisory agreement with OFI, as of the same effective date.
The Fund offers Class A, Class C, Class I, Class N and Class Y shares, and previously offered Class B shares for new purchase through June 29, 2012. Subsequent to that date, no new purchases of Class B shares are permitted, however reinvestment of dividend and/or capital gain distributions and exchanges of Class B shares into and from other Oppenheimer funds will be allowed. Class A shares are sold at their offering price, which is normally net asset value plus a front-end sales charge. Class C and Class N shares are sold, and Class B shares were sold, without a front-end sales charge but may be subject to a contingent deferred sales charge (“CDSC”). Class N shares are sold only through retirement plans. Retirement plans that offer Class N shares may impose charges on those accounts. Class I and Class Y shares are sold to certain institutional investors or intermediaries without either a front-end sales charge or a CDSC, however, the intermediaries may impose charges on their accountholders who beneficially own Class I and Class Y shares. All classes of shares have identical rights and voting privileges with respect to the Fund in general and exclusive voting rights on matters that affect that class alone. Earnings, net assets and net asset value per share may differ due to each class having its own expenses, such as transfer and shareholder servicing agent fees and shareholder communications, directly attributable to that class. Class A, B, C and N shares have separate distribution and/or service plans under which they pay fees. Class I and Class Y shares do not pay such fees. Class B shares will automatically convert to Class A shares 72 months after the date of purchase.
The following is a summary of significant accounting policies consistently followed by the Fund.
Structured Securities. The Fund invests in structured securities whose market values, interest rates and/or redemption prices are linked to the performance of underlying foreign currencies, interest rate spreads, stock market indices, prices of individual securities, commodities or other financial instruments or the occurrence of other specific events. The structured securities are often leveraged, increasing the volatility of each note’s market value relative to the change in the underlying linked financial element or event. Fluctuations in value of these securities are recorded as unrealized gains and losses in the accompanying Statement of Operations. The Fund records a realized gain or loss when a structured security is sold or matures.
38 OPPENHEIMER EQUITY INCOME FUND
1. Significant Accounting Policies (Continued)
Securities on a When-Issued or Delayed Delivery Basis. The Fund may purchase securities on a “when-issued” basis, and may purchase or sell securities on a “delayed delivery” basis. “When-issued” or “delayed delivery” refers to securities whose terms and indenture are available and for which a market exists, but which are not available for immediate delivery. Delivery and payment for securities that have been purchased by the Fund on a when-issued basis normally takes place within six months and possibly as long as two years or more after the trade date. During this period, such securities do not earn interest, are subject to market fluctuation and may increase or decrease in value prior to their delivery. The purchase of securities on a when-issued basis may increase the volatility of the Fund’s net asset value to the extent the Fund executes such transactions while remaining substantially fully invested. When the Fund engages in when-issued or delayed delivery transactions, it relies on the buyer or seller, as the case may be, to complete the transaction. Their failure to do so may cause the Fund to lose the opportunity to obtain or dispose of the security at a price and yield it considers advantageous. The Fund may also sell securities that it purchased on a when-issued basis or forward commitment prior to settlement of the original purchase.
As of October 31, 2013, the Fund had purchased securities issued on a delayed delivery basis as follows:
| When-Issued or Delayed Delivery Basis Transactions | ||||
| Purchased securities | $20,000,113 | |||
Credit Risk. The Fund invests in high-yield, non-investment-grade bonds, which may be subject to a greater degree of credit risk. Credit risk relates to the ability of the issuer to meet interest or principal payments or both as they become due. The Fund may acquire securities that have missed an interest payment, and is not obligated to dispose of securities whose issuers or underlying obligors subsequently miss an interest payment. Information concerning securities not accruing interest as of October 31, 2013 is as follows:
| Cost | $ | 21,867,980 | ||
| Market Value | $ | 22,900,600 | ||
| Market Value as a % of Net Assets | 0.43% |
Investment in Oppenheimer Institutional Money Market Fund. The Fund is permitted to invest daily available cash balances in an affiliated money market fund. The Fund may invest the available cash in Class E shares of Oppenheimer Institutional Money Market Fund (“IMMF”) to seek current income while preserving liquidity. IMMF is a registered open-end management investment company, regulated as a money market fund under the Investment Company Act of 1940, as amended. The Manager is the investment adviser of IMMF, and the Sub-Adviser provides investment and related advisory services to IMMF. When applicable, the Fund’s investment in IMMF is included in the Statement of Investments. Shares of IMMF are valued at their net asset value per share. As a shareholder, the Fund is subject to its proportional share of IMMF’s Class E expenses, including its management fee. The Manager will waive fees and/or reimburse Fund expenses in an amount equal to the indirect management fees incurred through the Fund’s investment in IMMF.
39 OPPENHEIMER EQUITY INCOME FUND
| NOTESTO FINANCIAL STATEMENTS Continued | ||||
1. Significant Accounting Policies (Continued)
Foreign Currency Translation. The Fund’s accounting records are maintained in U.S. dollars. The values of securities denominated in foreign currencies and amounts related to the purchase and sale of foreign securities and foreign investment income are translated into U.S. dollars as of the close of the New York Stock Exchange (the “Exchange”), normally 4:00 P.M. Eastern time, on each day the Exchange is open for trading. Foreign exchange rates may be valued primarily using a reliable bank, dealer or service authorized by the Board of Trustees.
Reported net realized gains and losses from foreign currency transactions arise from sales of portfolio securities, sales and maturities of short-term securities, sales of foreign currencies, exchange rate fluctuations between the trade and settlement dates on securities transactions, and the difference between the amounts of dividends, interest, and foreign withholding taxes recorded on the Fund’s books and the U.S. dollar equivalent of the amounts actually received or paid. Net unrealized appreciation and depreciation on the translation of assets and liabilities denominated in foreign currencies arise from changes in the values of assets and liabilities, including investments in securities at fiscal period end, resulting from changes in exchange rates.
The effect of changes in foreign currency exchange rates on investments is separately identified from the fluctuations arising from changes in market values of securities held and reported with all other foreign currency gains and losses in the Fund’s Statement of Operations.
Allocation of Income, Expenses, Gains and Losses. Income, expenses (other than those attributable to a specific class), gains and losses are allocated on a daily basis to each class of shares based upon the relative proportion of net assets represented by such class. Operating expenses directly attributable to a specific class are charged against the operations of that class.
Federal Taxes. The Fund intends to comply with provisions of the Internal Revenue Code applicable to regulated investment companies and to distribute substantially all of its investment company taxable income, including any net realized gain on investments not offset by capital loss carryforwards, if any, to shareholders. Therefore, no federal income or excise tax provision is required. The Fund files income tax returns in U.S. federal and applicable state jurisdictions. The statute of limitations on the Fund’s tax return filings generally remain open for the three preceding fiscal reporting period ends.
The tax components of capital shown in the following table represent distribution requirements the Fund must satisfy under the income tax regulations, losses the Fund may be able to offset against income and gains realized in future years and unrealized appreciation or depreciation of securities and other investments for federal income tax purposes.
40 OPPENHEIMER EQUITY INCOME FUND
1. Significant Accounting Policies (Continued)
Undistributed Net Investment Income | Undistributed Long-Term Gain | Accumulated Loss Carryforward1,2,3,4 | Net Unrealized Appreciation Based on cost of Securities and Other Investments for Federal Income Tax Purposes | |||||||||
| $126,757,490 | $105,759,322 | $104,575,705 | $839,966,581 | |||||||||
1. As of October 31, 2013, the Fund had $84,655,500 of net capital loss carryforwards available to offset future realized capital gains, if any, and thereby reduce future taxable gain distributions. Details of the capital loss carryforwards are included in the table below. Capital loss carryovers with no expiration, if any, must be utilized prior to those with expiration dates.
| Expiring | ||||
| 2016 | $ | 17,942,781 | ||
| 2017 | 66,712,719 | |||
|
| |||
| Total | $ | 84,655,500 | ||
|
| |||
Of these losses, $84,655,500 are subject to Sec. 382 loss limitation rules resulting from merger activity. These limitations generally reduce the utilization of these losses to a maximum of $21,332,975 per year and have expiration dates ranging from 10/31/2016 to 10/31/2017.
2. The Fund had $19,920,205 of straddle losses which were deferred.
3. During the fiscal year ended October 31, 2013, the Fund utilized $21,332,975 of capital loss carryforward to offset capital gains realized in that fiscal year.
4. During the fiscal year ended October 31, 2012, the Fund utilized $47,862,150 of capital loss carryforward to offset capital gains realized in that fiscal year.
Net investment income (loss) and net realized gain (loss) may differ for financial statement and tax purposes. The character of dividends and distributions made during the fiscal year from net investment income or net realized gains may differ from their ultimate characterization for federal income tax purposes. Also, due to timing of dividends and distributions, the fiscal year in which amounts are distributed may differ from the fiscal year in which the income or net realized gain was recorded by the Fund.
Accordingly, the following amounts have been reclassified for October 31, 2013. Net assets of the Fund were unaffected by the reclassifications.
Increase to Paid-in Capital | Reduction to Accumulated Net Investment Loss | Reduction to Accumulated Net Realized Gain on Investments5 | ||||||
| $23,719,784 | $23,601,324 | $47,321,108 | ||||||
5. $23,719,783, including $12,784,134 of long-term capital gain, was distributed in connection with Fund share redemptions.
41 OPPENHEIMER EQUITY INCOME FUND
| NOTESTO FINANCIAL STATEMENTS Continued | ||||
1. Significant Accounting Policies (Continued)
The tax character of distributions paid during the years ended October 31, 2013 and October 31, 2012 was as follows:
| Year Ended October 31, 2013 | Year Ended October 31, 2012 | |||||||
| Distributions paid from: | ||||||||
| Ordinary income | $ | 128,865,329 | $ | 90,832,289 | ||||
| Long-term capital gain | 28,025,240 | — | ||||||
|
| |||||||
| Total | $ | 156,890,569 | $ | 90,832,289 | ||||
|
| |||||||
The aggregate cost of securities and other investments and the composition of unrealized appreciation and depreciation of securities and other investments for federal income tax purposes as of October 31, 2013 are noted in the following table. The primary difference between book and tax appreciation or depreciation of securities and other investments, if applicable, is attributable to the tax deferral of losses or tax realization of financial statement unrealized gain or loss.
| Federal tax cost of securities | $ | 4,505,548,053 | ||
| Federal tax cost of other investments | 19,920,205 | |||
|
| |||
| Total federal tax cost | $ | 4,525,468,258 | ||
|
| |||
| Gross unrealized appreciation | $ | 932,496,116 | ||
| Gross unrealized depreciation | (92,529,535 | ) | ||
|
| |||
| Net unrealized appreciation | $ | 839,966,581 | ||
|
|
Trustees’ Compensation. The Fund has adopted an unfunded retirement plan (the “Plan”) for the Fund’s independent trustees. Benefits are based on years of service and fees paid to each trustee during their period of service. The Plan was frozen with respect to adding new participants effective December 31, 2006 (the “Freeze Date”) and existing Plan Participants as of the Freeze Date will continue to receive accrued benefits under the Plan. Active independent trustees as of the Freeze Date have each elected a distribution method with respect to their benefits under the Plan. During the year ended October 31, 2013, the Fund’s projected benefit obligations, payments to retired trustees and accumulated liability were as follows:
| Projected Benefit Obligations Increased | $ | 35,531 | ||
| Payments Made to Retired Trustees | 23,277 | |||
| Accumulated Liability as of October 31, 2013 | 196,152 |
The Board of Trustees has adopted a compensation deferral plan for independent trustees that enables trustees to elect to defer receipt of all or a portion of the annual compensation they are entitled to receive from the Fund. For purposes of determining the amount owed to the Trustee under the plan, deferred amounts are treated as though equal dollar amounts had been invested in shares of the Fund or in other Oppenheimer funds selected by the Trustee. The Fund purchases shares of the funds selected for deferral by the Trustee in amounts equal to his or her deemed investment, resulting in a Fund asset equal to the deferred compensation liability. Such assets are included as a component of “Other” within the asset section of the Statement of Assets and Liabilities. Deferral of trustees’ fees under the plan will not affect the net assets of the Fund, and will not materially affect the Fund’s assets, liabilities or net investment income per share. Amounts will be deferred until distributed in accordance with the compensation deferral plan.
42 OPPENHEIMER EQUITY INCOME FUND
1. Significant Accounting Policies (Continued)
Dividends and Distributions to Shareholders. Dividends and distributions to shareholders, which are determined in accordance with income tax regulations and may differ from U.S. generally accepted accounting principles, are recorded on the ex-dividend date. Income and capital gain distributions, if any, are declared and paid annually or at other times as deemed necessary by the Manager.
Investment Income. Dividend income is recorded on the ex-dividend date or upon ex-dividend notification in the case of certain foreign dividends where the ex-dividend date may have passed. Non-cash dividends included in dividend income, if any, are recorded at the fair market value of the securities received. Interest income is recognized on an accrual basis. Discount and premium, which are included in interest income on the Statement of Operations, are amortized or accreted daily.
Custodian Fees. “Custodian fees and expenses” in the Statement of Operations may include interest expense incurred by the Fund on any cash overdrafts of its custodian account during the period. Such cash overdrafts may result from the effects of failed trades in portfolio securities and from cash outflows resulting from unanticipated shareholder redemption activity. The Fund pays interest to its custodian on such cash overdrafts, to the extent they are not offset by positive cash balances maintained by the Fund, at a rate equal to the Federal Funds Rate plus 0.50%. The “Reduction to custodian expenses” line item, if applicable, represents earnings on cash balances maintained by the Fund during the period. Such interest expense and other custodian fees may be paid with these earnings.
Security Transactions. Security transactions are recorded on the trade date. Realized gains and losses on securities sold are determined on the basis of identified cost.
Indemnifications. The Fund’s organizational documents provide current and former trustees and officers with a limited indemnification against liabilities arising in connection with the performance of their duties to the Fund. In the normal course of business, the Fund may also enter into contracts that provide general indemnifications. The Fund’s maximum exposure under these arrangements is unknown as this would be dependent on future claims that may be made against the Fund. The risk of material loss from such claims is considered remote.
Other. The preparation of financial statements in conformity with accounting principles generally accepted in the United States of America requires management to make estimates and assumptions that affect the reported amounts of assets and liabilities and disclosure of contingent assets and liabilities at the date of the financial statements and the reported amounts of increases and decreases in net assets from operations during the reporting period. Actual results could differ from those estimates.
43 OPPENHEIMER EQUITY INCOME FUND
| NOTESTO FINANCIAL STATEMENTS Continued | ||||
2. Securities Valuation
The Fund calculates the net asset value of its shares as of the close of the New York Stock Exchange (the “Exchange”), normally 4:00 P.M. Eastern time, on each day the Exchange is open for trading.
The Fund’s Board has adopted procedures for the valuation of the Fund’s securities and has delegated the day-to-day responsibility for valuation determinations under those procedures to the Manager. The Manager has established a Valuation Committee which is responsible for determining a “fair valuation” for any security for which market quotations are not “readily available.” The Valuation Committee’s fair valuation determinations are subject to review, approval and ratification by the Fund’s Board at its next regularly scheduled meeting covering the calendar quarter in which the fair valuation was determined.
Valuation Methods and Inputs
Securities are valued using unadjusted quoted market prices, when available, as supplied primarily by third party pricing services or dealers.
The following methodologies are used to determine the market value or the fair value of the types of securities described below:
Securities traded on a registered U.S. securities exchange (including exchange-traded derivatives other than futures and futures options) are valued based on the last sale price of the security reported on the principal exchange on which it is traded, prior to the time when the Fund’s assets are valued. In the absence of a sale, the security is valued at the last sale price on the prior trading day, if it is within the spread of the current day’s closing “bid” and “asked” prices, and if not, at the current day’s closing bid price. A security of a foreign issuer traded on a foreign exchange, but not listed on a registered U.S. securities exchange, is valued based on the last sale price on the principal exchange on which the security is traded, as identified by the third party pricing service used by the Manager, prior to the time when the Fund’s assets are valued. If the last sale price is unavailable, the security is valued at the most recent official closing price on the principal exchange on which it is traded. If the last sales price or official closing price for a foreign security is not available, the security is valued at the mean between the bid and asked price per the exchange or, if not available from the exchange, obtained from two dealers. If bid and asked prices are not available from either the exchange or two dealers, the security is valued by using one of the following methodologies (listed in order of priority); (1) using a bid from the exchange, (2) the mean between the bid and asked price as provided by a single dealer, or (3) a bid from a single dealer.
Shares of a registered investment company that are not traded on an exchange are valued at that investment company’s net asset value per share.
Corporate and government debt securities (of U.S. or foreign issuers) and municipal debt securities, event-linked bonds, loans, mortgage-backed securities, collateralized mortgage obligations, and asset-backed securities are valued at the mean between the “bid” and “asked” prices utilizing evaluated prices obtained from third party pricing services or broker-dealers who may use matrix pricing methods to determine the evaluated prices.
Short-term money market type debt securities with a remaining maturity of sixty days or less are valued at cost adjusted by the amortization of discount or premium to maturity (amortized cost), which approximates market value. Short-term debt securities with a remaining maturity in excess of sixty days are valued at the mean between the “bid” and “asked” prices utilizing evaluated prices obtained from third party pricing services or broker-dealers.
44 OPPENHEIMER EQUITY INCOME FUND
2. Securities Valuation (Continued)
Structured securities, swaps, swaptions, and other over-the-counter derivatives are valued utilizing evaluated prices obtained from third party pricing services or broker-dealers.
A description of the standard inputs that may generally be considered by the third party pricing vendors in determining their evaluated prices is provided below.
| Security Type | Standard inputs generally considered by third-party pricing vendors | |
| Corporate debt, government debt, municipal, mortgage-backed and asset-backed securities | Reported trade data, broker-dealer price quotations, benchmark yields, issuer spreads on comparable securities, the credit quality, yield, maturity, and other appropriate factors. | |
| ||
| Loans | Information obtained from market participants regarding reported trade data and broker-dealer price quotations. | |
| ||
| Event-linked bonds | Information obtained from market participants regarding reported trade data and broker-dealer price quotations. | |
| ||
| Structured securities | Relevant market information such as the price of underlying financial instruments, stock market indices, foreign currencies, interest rate spreads, commodities, or the occurrence of other specific events. | |
| ||
| Swaps | Relevant market information, including underlying reference assets such as credit spreads, credit event probabilities, index values, individual security values, forward interest rates, variable interest rates, volatility measures, and forward currency rates. | |
If a market value or price cannot be determined for a security using the methodologies described above, or if, in the “good faith” opinion of the Manager, the market value or price obtained does not constitute a “readily available market quotation,” or a significant event has occurred that would materially affect the value of the security the security is fair valued either (i) by a standardized fair valuation methodology applicable to the security type or the significant event as previously approved by the Valuation Committee and the Fund’s Board or (ii) as determined in good faith by the Manager’s Valuation Committee. The Valuation Committee considers all relevant facts that are reasonably available, through either public information or information available to the Manager, when determining the fair value of a security. Fair value determinations by the Manager are subject to review, approval and ratification by the Fund’s Board at its next regularly scheduled meeting covering the calendar quarter in which the fair valuation was determined. Those fair valuation standardized methodologies include, but are not limited to, valuing securities at the last sale price or initially at cost and subsequently adjusting the value based on: changes in company specific fundamentals, changes in an appropriate securities index, or changes in the value of similar
45 OPPENHEIMER EQUITY INCOME FUND
| NOTESTO FINANCIAL STATEMENTS Continued | ||||
2. Securities Valuation (Continued)
securities which may be further adjusted for any discounts related to security-specific resale restrictions. When possible, such methodologies use observable market inputs such as unadjusted quoted prices of similar securities, observable interest rates, currency rates and yield curves. The methodologies used for valuing securities are not necessarily an indication of the risks associated with investing in those securities nor can it be assured that the Fund can obtain the fair value assigned to a security if it were to sell the security.
To assess the continuing appropriateness of security valuations, the Manager, or its third party service provider who is subject to oversight by the Manager, regularly compares prior day prices, prices on comparable securities, and sale prices to the current day prices and challenges those prices exceeding certain tolerance levels with the third party pricing service or broker source. For those securities valued by fair valuations, whether through a standardized fair valuation methodology or a fair valuation determination, the Valuation Committee reviews and affirms the reasonableness of the valuations based on such methodologies and fair valuation determinations on a regular basis after considering all relevant information that is reasonably available.
Classifications
Each investment asset or liability of the Fund is assigned a level at measurement date based on the significance and source of the inputs to its valuation. Various data inputs are used in determining the value of each of the Fund’s investments as of the reporting period end. These data inputs are categorized in the following hierarchy under applicable financial accounting standards:
1) Level 1-unadjusted quoted prices in active markets for identical assets or liabilities (including securities actively traded on a securities exchange)
2) Level 2-inputs other than unadjusted quoted prices that are observable for the asset or liability (such as unadjusted quoted prices for similar assets and market corroborated inputs such as interest rates, prepayment speeds, credit risks, etc.)
3) Level 3-significant unobservable inputs (including the Manager’s own judgments about assumptions that market participants would use in pricing the asset or liability).
The inputs used for valuing securities are not necessarily an indication of the risks associated with investing in those securities.
The table below categorizes amounts that are included in the Fund’s Statement of Assets and Liabilities as of October 31, 2013 based on valuation input level:
Level 1— Unadjusted | Level 2— Other Significant | Level 3— Significant Unobservable Inputs | Value | |||||||||||||
Assets Table | ||||||||||||||||
Investments, at Value: | ||||||||||||||||
| Common Stocks | ||||||||||||||||
Consumer Discretionary | $ | 640,832,513 | $ | — | $ | — | $ | 640,832,513 | ||||||||
Consumer Staples | 216,332,923 | — | — | 216,332,923 | ||||||||||||
Energy | 555,153,070 | 41 | — | 555,153,111 | ||||||||||||
Financials | 1,199,691,902 | 13,158,000 | — | 1,212,849,902 | ||||||||||||
46 OPPENHEIMER EQUITY INCOME FUND
2. Securities Valuation (Continued)
Level 1— Quoted Prices | Level 2— Other Significant | Level 3— Significant Unobservable Inputs | Value | |||||||||||||
| ||||||||||||||||
Health Care | $ | 362,424,776 | $ | — | $ | — | $ | 362,424,776 | ||||||||
Industrials | 179,512,736 | — | — | 179,512,736 | ||||||||||||
Information Technology | 387,958,655 | — | — | 387,958,655 | ||||||||||||
Materials | 242,217,225 | — | — | 242,217,225 | ||||||||||||
Telecommunication Services | 290,954,688 | — | — | 290,954,688 | ||||||||||||
Utilities | 135,524,080 | 4,030,000 | — | 139,554,080 | ||||||||||||
| Preferred Stocks | 62,853,115 | 112,457,831 | — | 175,310,946 | ||||||||||||
| Rights, Warrants and Certificates | 6,163,200 | — | — | 6,163,200 | ||||||||||||
| Mortgage-Backed Obligations | — | 6,981,063 | �� | — | 6,981,063 | |||||||||||
| U.S. Government Obligation | — | 474,552 | — | 474,552 | ||||||||||||
| Foreign Government Obligation | — | 2 | — | 2 | ||||||||||||
| Non-Convertible Corporate Bonds and Notes | — | 111,010,516 | — | 111,010,516 | ||||||||||||
| Convertible Corporate Bonds and Notes | — | 379,909,074 | — | 379,909,074 | ||||||||||||
| Structured Securities | — | 361,389,708 | — | 361,389,708 | ||||||||||||
| Exchange-Traded Options Purchased | 2,595,875 | — | — | 2,595,875 | ||||||||||||
| Investment Company | 86,179,484 | — | — | 86,179,484 | ||||||||||||
|
| |||||||||||||||
| Total Assets | $ | 4,368,394,242 | $ | 989,410,787 | $ | — | $ | 5,357,805,029 | ||||||||
|
| |||||||||||||||
| Liabilities Table | ||||||||||||||||
| Other Financial Instruments: | ||||||||||||||||
| Options written, at value | $ | (18,859,941) | $ | — | $ | — | $ | (18,859,941) | ||||||||
|
| |||||||||||||||
| Total Liabilities | $ | (18,859,941) | $ | — | $ | — | $ | (18,859,941) | ||||||||
|
| |||||||||||||||
Currency contracts and forwards, if any, are reported at their unrealized appreciation/ depreciation at measurement date, which represents the change in the contract’s value from trade date. Futures, if any, are reported at their variation margin at measurement date, which represents the amount due to/from the Fund at that date. All additional assets and liabilities included in the above table are reported at their market value at measurement date.
3. Shares of Beneficial Interest
The Fund has authorized an unlimited number of $0.0001 par value shares of beneficial interest of each class. Transactions in shares of beneficial interest were as follows:
| Year Ended October 31, 2013 | Year Ended October 31, 20121 | |||||||||||||||
| Shares | Amount | Shares | Amount | |||||||||||||
| ||||||||||||||||
Class A | ||||||||||||||||
| Sold | 44,058,350 | $ | 1,272,584,370 | 27,311,664 | $ | 659,439,036 | ||||||||||
| Dividends and/or distributions reinvested | 3,861,959 | 103,823,368 | 2,649,369 | 62,501,553 | ||||||||||||
| Redeemed | (25,031,471 | ) | (713,277,290 | ) | (25,542,696 | ) | (609,792,182) | |||||||||
|
| |||||||||||||||
| Net increase | 22,888,838 | $ | 663,130,448 | 4,418,337 | $ | 112,148,407 | ||||||||||
|
| |||||||||||||||
47 OPPENHEIMER EQUITY INCOME FUND
| NOTESTO FINANCIAL STATEMENTS Continued | ||||
3. Shares of Beneficial Interest (Continued)
| Year Ended October 31, 2013 | Year Ended October 31, 20121 | |||||||||||||||
| Shares | Amount | Shares | Amount | |||||||||||||
| ||||||||||||||||
Class B | ||||||||||||||||
| Sold | 1,072,954 | $ | 26,323,574 | 1,723,951 | $ | 35,252,222 | ||||||||||
| Dividends and/or distributions reinvested | 242,309 | 5,423,354 | 173,244 | 3,465,508 | ||||||||||||
| Redeemed | (1,607,231 | ) | (38,351,974 | ) | (1,795,207 | ) | (36,800,018) | |||||||||
|
| |||||||||||||||
| Net increase (decrease) | (291,968 | ) | $ | (6,605,046 | ) | 101,988 | $ | 1,917,712 | ||||||||
|
| |||||||||||||||
| ||||||||||||||||
Class C | ||||||||||||||||
| Sold | 13,051,163 | $ | 321,164,661 | 6,395,596 | $ | 132,167,803 | ||||||||||
| Dividends and/or distributions reinvested | 856,332 | 19,486,539 | 498,770 | 10,034,084 | ||||||||||||
| Redeemed | (4,410,736 | ) | (106,898,941 | ) | (4,650,888 | ) | (95,586,208) | |||||||||
|
| |||||||||||||||
| Net increase | 9,496,759 | $ | 233,752,259 | 2,243,478 | $ | 46,615,679 | ||||||||||
|
| |||||||||||||||
| ||||||||||||||||
Class I | ||||||||||||||||
| Sold | 1,690,581 | $ | 47,799,309 | 394,414 | $ | 10,089,681 | ||||||||||
| Dividends and/or distributions reinvested | 32,165 | 903,370 | 191 | 4,978 | ||||||||||||
| Redeemed | (222,094 | ) | (6,262,329 | ) | (1,049 | ) | (26,652) | |||||||||
|
| |||||||||||||||
| Net increase | 1,500,652 | $ | 42,440,350 | 393,556 | $ | 10,068,007 | ||||||||||
|
| |||||||||||||||
Class N | ||||||||||||||||
| Sold | 2,588,728 | $ | 71,817,339 | 1,878,824 | $ | 43,578,275 | ||||||||||
| Dividends and/or distributions reinvested | 185,993 | 4,820,526 | 118,077 | 2,695,198 | ||||||||||||
| Redeemed | (1,706,947 | ) | (46,704,897 | ) | (1,350,680 | ) | (31,720,862) | |||||||||
|
| |||||||||||||||
| Net increase | 1,067,774 | $ | 29,932,968 | 646,221 | $ | 14,552,611 | ||||||||||
|
| |||||||||||||||
| ||||||||||||||||
Class Y | ||||||||||||||||
| Sold | 7,590,332 | $ | 219,492,586 | 5,180,844 | $ | 127,335,454 | ||||||||||
| Dividends and/or distributions reinvested | 286,727 | 7,766,987 | 126,004 | 3,009,754 | ||||||||||||
| Redeemed | (4,101,879 | ) | (114,998,119 | ) | (2,296,371 | ) | (54,844,894) | |||||||||
|
| |||||||||||||||
| Net increase | 3,775,180 | $ | 112,261,454 | 3,010,477 | $ | 75,500,314 | ||||||||||
|
| |||||||||||||||
1. For the year ended October 31, 2012, for Class A, Class B, Class C, Class N and Class Y shares, and for the period from February 28, 2012 (inception of offering) to October 31, 2012, for Class I shares.
4. Purchases and Sales of Securities
The aggregate cost of purchases and proceeds from sales of securities, other than short-term obligations and investments in IMMF, for the year ended October 31, 2013 were as follows:
| Purchases | Sales | |||||||
| Investment securities | $ | 2,135,789,596 | $ | 1,255,839,886 | ||||
| U.S. government and government agency obligations | — | 67,650 | ||||||
48 OPPENHEIMER EQUITY INCOME FUND
5. Fees and Other Transactions with Affiliates
Management Fees. Under the investment advisory agreement, the Fund pays the Manager a management fee based on the daily net assets of the Fund at an annual rate as shown in the following table:
| Fee Schedule Through October 31, 2013 | ||||||
| Up to $400 million | 0.70% | |||||
| Next $400 million | 0.68 | |||||
| Next $400 million | 0.65 | |||||
| Next $400 million | 0.60 | |||||
| Next $400 million | 0.55 | |||||
| Next $3.0 billion | 0.50 | |||||
| Over $5.0 billion | 0.45 | |||||
| Fee Schedule Effective November 1, 2013 | ||||||
| Up to $400 million | 0.70% | |||||
| Next $400 million | 0.68 | |||||
| Next $400 million | 0.65 | |||||
| Next $400 million | 0.60 | |||||
| Next $400 million | 0.55 | |||||
| Next $3.0 billion | 0.50 | |||||
| Next $5.0 billion | 0.45 | |||||
| Over $10.0 billion | 0.42 | |||||
Sub-Adviser Fees. The Manager has retained the Sub-Adviser to provide the day-to-day portfolio management of the Fund. Under the Sub-Advisory Agreement, the Manager pays the Sub-Adviser an annual fee in monthly installments, equal to a percentage of the investment management fee collected by the Manager from the Fund, which shall be calculated after any investment management fee waivers. The fee paid to the Sub-Adviser is paid by the Manager, not by the Fund.
Transfer Agent Fees. OppenheimerFunds Services (“OFS”), a division of OFI, acted as the transfer and shareholder servicing agent for the Fund through December 31, 2012. Effective January 1, 2013, OFI Global (the “Transfer Agent”) serves as the transfer and shareholder servicing agent for the Fund. Fees incurred by the Fund with respect to these services are detailed in the Statement of Operations.
Sub-Transfer Agent Fees. Effective January 1, 2013, the Transfer Agent has retained Shareholder Services, Inc., a wholly-owned subsidiary of OFI (the “Sub-Transfer Agent”), to provide the day-to-day transfer agent and shareholder servicing of the Fund. Under the Sub-Transfer Agency Agreement, the Transfer Agent pays the Sub-Transfer Agent an annual fee in monthly installments, equal to a percentage of the transfer agent fee collected by the Transfer Agent from the Fund, which shall be calculated after any applicable fee waivers. The fee paid to the Sub-Transfer Agent is paid by the Transfer Agent, not by the Fund.
Distribution and Service Plan (12b-1) Fees. Under its General Distributor’s Agreement with the Fund, OppenheimerFunds Distributor, Inc. (the “Distributor”) acts as the Fund’s principal underwriter in the continuous public offering of the Fund’s classes of shares.
Distribution and Service Plan for Class A Shares. The Fund has adopted a Distribution and Service Plan (the “Plan”) for Class A shares. Under the Plan, the Fund pays a service fee to the Distributor at an annual rate of 0.25% of the daily net assets of Class A shares. The Distributor currently uses all of those fees to pay dealers, brokers, banks and other financial institutions periodically for providing personal services and maintenance of accounts of their customers that hold Class A shares. Under the Plan, the Fund may also pay an asset-based sales charge to the Distributor. However, the Fund’s Board has currently set the rate at zero. Fees incurred by the Fund under the Plan are detailed in the Statement of Operations.
49 OPPENHEIMER EQUITY INCOME FUND
| NOTESTO FINANCIAL STATEMENTS Continued | ||||
5. Fees and Other Transactions with Affiliates (Continued)
Distribution and Service Plans for Class B, Class C and Class N Shares. The Fund has adopted Distribution and Service Plans (the “Plans”) for Class B, Class C and Class N shares under Rule 12b-1 of the Investment Company Act of 1940 to compensate the Distributor for its services in connection with the distribution of those shares and servicing accounts. Under the Plans, the Fund pays the Distributor an annual asset-based sales charge of 0.75% on Class B and Class C shares daily net assets and 0.25% on Class N shares daily net assets. The Distributor also receives a service fee of 0.25% per year under each plan. If either the Class B, Class C or Class N plan is terminated by the Fund or by the shareholders of a class, the Board of Trustees and its independent trustees must determine whether the Distributor shall be entitled to payment from the Fund of all or a portion of the service fee and/or asset-based sales charge in respect to shares sold prior to the effective date of such termination. Fees incurred by the Fund under the Plans are detailed in the Statement of Operations. The Distributor determines its uncompensated expenses under the Plans at calendar quarter ends. The Distributor’s aggregate uncompensated expenses under the Plans at September 30, 2013 were as follows:
| Class B | $ | 2,474,778 | ||
| Class C | 8,275,161 | |||
| Class N | 1,786,596 |
Sales Charges. Front-end sales charges and contingent deferred sales charges (“CDSC”) do not represent expenses of the Fund. They are deducted from the proceeds of sales of Fund shares prior to investment or from redemption proceeds prior to remittance, as applicable. The sales charges retained by the Distributor from the sale of shares and the CDSC retained by the Distributor on the redemption of shares is shown in the following table for the period indicated.
| Year Ended | Class A Front-End | Class A Contingent Deferred Sales Charges Retained by Distributor | Class B Contingent Deferred Sales Charges Retained by Distributor | Class C Contingent Deferred Sales Charges Retained by Distributor | Class N Contingent Deferred Sales Charges Retained by Distributor | |||||||||||||||
| October 31, 2013 | $2,271,701 | $15,418 | $232,389 | $31,916 | $2,813 | |||||||||||||||
Waivers and Reimbursements of Expenses. The Manager will waive fees and/or reimburse Fund expenses in an amount equal to the indirect management fees incurred through the Fund’s investment in IMMF. During the year ended October 31, 2013, the Manager waived fees and/or reimbursed the Fund $115,995 for IMMF management fees.
The Transfer Agent has voluntarily agreed to limit transfer and shareholder servicing agent fees for Classes B, C, N and Y shares to 0.35% of average annual net assets per class and for Class A shares to 0.30% of average annual net assets of the class.
50 OPPENHEIMER EQUITY INCOME FUND
5. Fees and Other Transactions with Affiliates (Continued)
During the year ended October 31, 2013, the Transfer Agent waived transfer and shareholder servicing agent fees as follows:
| Class N | $ | 1,136 |
Some of these undertakings may be modified or terminated at any time; some may not be modified or terminated until after one year from the date of the current prospectus, as indicated therein.
6. Risk Exposures and the Use of Derivative Instruments
The Fund’s investment objectives not only permit the Fund to purchase investment securities, they also allow the Fund to enter into various types of derivatives contracts, including, but not limited to, futures contracts, forward currency exchange contracts, credit default swaps, interest rate swaps, total return swaps, variance swaps and purchased and written options. In doing so, the Fund will employ strategies in differing combinations to permit it to increase, decrease, or change the level or types of exposure to market risk factors. These instruments may allow the Fund to pursue its objectives more quickly and efficiently than if it were to make direct purchases or sales of securities capable of effecting a similar response to market factors. Such contracts may be entered into through a bilateral over-the-counter (“OTC”) transaction, or through a securities or futures exchange and cleared through a clearinghouse.
Market Risk Factors. In accordance with its investment objectives, the Fund may use derivatives to increase or decrease its exposure to one or more of the following market risk factors:
Commodity Risk. Commodity risk relates to the change in value of commodities or commodity indexes as they relate to increases or decreases in the commodities market. Commodities are physical assets that have tangible properties. Examples of these types of assets are crude oil, heating oil, metals, livestock, and agricultural products.
Credit Risk. Credit risk relates to the ability of the issuer to meet interest and principal payments, or both, as they come due. In general, lower-grade, higher-yield bonds are subject to credit risk to a greater extent than lower-yield, higher-quality bonds.
Equity Risk. Equity risk relates to the change in value of equity securities as they relate to increases or decreases in the general market.
Foreign Exchange Rate Risk. Foreign exchange rate risk relates to the change in the U.S. dollar value of a security held that is denominated in a foreign currency. The U.S. dollar value of a foreign currency denominated security will decrease as the dollar appreciates against the currency, while the U.S. dollar value will increase as the dollar depreciates against the currency.
Interest Rate Risk. Interest rate risk refers to the fluctuations in value of fixed-income securities resulting from the inverse relationship between price and yield. For example, an increase in general interest rates will tend to reduce the market value of already issued fixed-income investments, and a decline in general interest rates will tend to increase their value. In addition, debt securities with longer maturities, which tend to have higher yields,
51 OPPENHEIMER EQUITY INCOME FUND
| NOTESTO FINANCIAL STATEMENTS Continued | ||||
6. Risk Exposures and the Use of Derivative Instruments (Continued)
are subject to potentially greater fluctuations in value from changes in interest rates than obligations with shorter maturities.
Volatility Risk. Volatility risk refers to the magnitude of the movement, but not the direction of the movement, in a financial instrument’s price over a defined time period. Large increases or decreases in a financial instrument’s price over a relative time period typically indicate greater volatility risk, while small increases or decreases in its price typically indicate lower volatility risk.
Derivatives may have little or no initial cash investment relative to their market value exposure and therefore can produce significant gains or losses in excess of their cost due to unanticipated changes in the market risk factors and the overall market. This use of embedded leverage allows the Fund to increase its market value exposure relative to its net assets and can substantially increase the volatility of the Fund’s performance. In instances where the Fund is using derivatives to decrease, or hedge, exposures to market risk factors for securities held by the Fund, there are also risks that those derivatives may not perform as expected resulting in losses for the combined or hedged positions. Some derivatives have the potential for unlimited loss, regardless of the size of the Fund’s initial investment.
Additional associated risks from investing in derivatives also exist and potentially could have significant effects on the valuation of the derivative and the Fund. Typically, the associated risks are not the risks that the Fund is attempting to increase or decrease exposure to, per its investment objectives, but are the additional risks from investing in derivatives. Examples of these associated risks are liquidity risk, which is the risk that the Fund will not be able to sell the derivative in the open market in a timely manner, and counterparty credit risk, which is the risk that the counterparty will not fulfill its obligation to the Fund.
The Fund’s actual exposures to these market risk factors and associated risks during the period are discussed in further detail, by derivative type, below.
Option Activity
The Fund may buy and sell put and call options, or write put and call options. When an option is written, the Fund receives a premium and becomes obligated to sell or purchase the underlying security, currency or other underlying financial instrument at a fixed price, upon exercise of the option.
Options can be traded through an exchange or through a privately negotiated arrangement with a dealer in an OTC transaction. Options traded through an exchange are generally cleared through a clearinghouse (such as The Options Clearing Corporation). The difference between the premium received or paid, and market value of the option, is recorded as unrealized appreciation or depreciation. The net change in unrealized appreciation or depreciation is reported in the Statement of Operations. When an option is exercised, the cost of the security purchased or the proceeds of the security sale are adjusted by the amount of premium received or paid. Upon the expiration or closing of the option transaction, a gain or loss is reported in the Statement of Operations.
52 OPPENHEIMER EQUITY INCOME FUND
6. Risk Exposures and the Use of Derivative Instruments (Continued)
The Fund has purchased call options on individual equity securities and/or equity indexes to increase exposure to equity risk. A purchased call option becomes more valuable as the price of the underlying financial instrument appreciates relative to the strike price.
The Fund has purchased put options on individual equity securities and/or equity indexes to decrease exposure to equity risk. A purchased put option becomes more valuable as the price of the underlying financial instrument depreciates relative to the strike price.
During the year ended October 31, 2013, the Fund had an ending monthly average market value of $168,423 and $905,526 on purchased call options and purchased put options, respectively.
Options written, if any, are reported in a schedule following the Statement of Investments and as a liability in the Statement of Assets and Liabilities. Securities held in collateral accounts to cover potential obligations with respect to outstanding written options are noted in the Statement of Investments.
The risk in writing a call option is that the market price of the security increases and if the option is exercised, the Fund must either purchase the security at a higher price for delivery or, if the Fund owns the underlying security, give up the opportunity for profit. The risk in writing a put option is that the Fund may incur a loss if the market price of the security decreases and the option is exercised. The risk in buying an option is that the Fund pays a premium whether or not the option is exercised. The Fund also has the additional risk that there may be an illiquid market where the Fund is unable to close the contract.
The Fund has written put options on individual equity securities and/or equity indexes to increase exposure to equity risk. A written put option becomes more valuable as the price of the underlying financial instrument appreciates relative to the strike price.
The Fund has written call options on individual equity securities and/or equity indexes to decrease exposure to equity risk. A written call option becomes more valuable as the price of the underlying financial instrument depreciates relative to the strike price.
During the year ended October 31, 2013, the Fund had ending monthly average market values of $4,259,462 and $16,179,443 on written call options and written put options, respectively.
Additional associated risks to the Fund include counterparty credit risk and liquidity risk.
Written option activity for the year ended October 31, 2013 was as follows:
| Call Options | Put Options | |||||||||||||||
| Number of Contracts | Amount of Premiums | Number of Contracts | Amount of Premiums | |||||||||||||
| ||||||||||||||||
| Options outstanding as of October 31, 2012 | 20,840 | $ 1,788,733 | 59,192 | $ 12,368,279 | ||||||||||||
| Options written | 481,918 | 53,534,438 | 907,920 | 134,194,201 | ||||||||||||
| Options closed or expired | (336,420 | ) | (30,509,515 | ) | (658,295 | ) | (92,366,147) | |||||||||
| Options exercised | (107,386 | ) | (16,444,010 | ) | (139,548 | ) | (36,076,244) | |||||||||
|
| |||||||||||||||
| Options outstanding as of October 31, 2013 | 58,952 | $ 8,369,646 | 169,269 | $ 18,120,089 | ||||||||||||
|
| |||||||||||||||
53 OPPENHEIMER EQUITY INCOME FUND
| NOTESTO FINANCIAL STATEMENTS Continued | ||||
6. Risk Exposures and the Use of Derivative Instruments (Continued)
The following table presents the valuations of derivative instruments by risk exposure as reported within the Statement of Assets and Liabilities as of October 31, 2013:
| Asset Derivatives | Liability Derivatives | |||||||||||
Derivatives Not Accounted for as Hedging Instruments | Statement of Assets and Liabilities Location | Value | Statement of Assets and Liabilities Location | Value | ||||||||
| Equity contracts | Investments, at value | $ | 2,595,875 | * | Options written, at value | $ | 18,859,941 | |||||
*Amounts relate to purchased option contracts.
| Amount of Realized Gain or (Loss) Recognized on Derivatives | ||||||||||||||||
Derivatives Not Accounted for as Hedging Instruments | Investments unaffiliated | Closing and contracts | Total | |||||||||||||
| Equity contracts | $19,312,393 | $50,126,993 | $69,439,386 | |||||||||||||
*Includes purchased option contracts, purchased swaption contracts and written option contracts exercised, if any.
| Amount of Change in Unrealized Gain or (Loss) Recognized on Derivatives | ||||||||||||||||
Derivatives Not Accounted for as Hedging Instruments | Investments* | Option contracts written | Total | |||||||||||||
| Equity contracts | $(233,166) | $7,940,415 | $7,707,249 | |||||||||||||
*Includes purchased option contracts and purchased swaption contracts, if any.
7. Restricted Securities
As of October 31, 2013, investments in securities included issues that are restricted. A restricted security may have a contractual restriction on its resale and is valued under methods approved by the Board of Trustees as reflecting fair value. Securities that are restricted are marked with an applicable footnote on the Statement of Investments. Restricted securities are reported on a schedule following the Statement of Investments.
8. Pending Litigation
Since 2009, seven class action lawsuits have been pending in the U.S. District Court for the District of Colorado against OppenheimerFunds, Inc. (“OFI”), OppenheimerFunds Distributor, Inc., the Fund’s principal underwriter and distributor (the “Distributor”), and certain funds (but not including the Fund) advised by OFI Global Asset Management, Inc. and distributed by the Distributor (the “Defendant Funds”). The lawsuits also name as defendants certain officers and current and former trustees of the respective Defendant Funds. The lawsuits raise claims under federal securities law and allege, among other things, that the disclosure documents of the respective Defendant Funds contained misrepresentations and omissions
54 OPPENHEIMER EQUITY INCOME FUND
8. Pending Litigation (Continued)
and that the respective Defendant Funds’ investment policies were not followed. The plaintiffs in these actions seek unspecified damages, equitable relief and awards of attorneys’ fees and litigation expenses. The Defendant Funds’ Boards of Trustees have also engaged counsel to represent the Funds and the present and former Independent Trustees named in those suits. On August 26, 2013, the parties in six of these lawsuits executed a memorandum of understanding setting forth the terms of proposed settlements of those actions. The proposed settlements are subject to a variety of contingencies, including the execution of settlement agreements, which will require preliminary and final approval by the court. The proposed settlements do not resolve a seventh outstanding lawsuit relating to Oppenheimer California Municipal Fund.
Other class action and individual lawsuits have been filed since 2008 in various state and federal courts against OFI and certain of its affiliates by investors seeking to recover investments they allegedly lost as a result of the “Ponzi” scheme run by Bernard L. Madoff and his firm, Bernard L. Madoff Investment Securities, LLC (“BLMIS”). Plaintiffs in these suits allege that they suffered losses as a result of their investments in several funds managed by an affiliate of OFI and assert a variety of claims, including breach of fiduciary duty, fraud, negligent misrepresentation, unjust enrichment, and violation of federal and state securities laws and regulations, among others. They seek unspecified damages, equitable relief and awards of attorneys’ fees and litigation expenses. Neither the Distributor, nor any of the Oppenheimer mutual funds, their independent trustees or directors are named as defendants in these lawsuits. None of the Oppenheimer mutual funds invested in any funds or accounts managed by Madoff or BLMIS. On February 28, 2011, a stipulation of partial settlement of three groups of consolidated putative class action lawsuits relating to these matters was filed in the U.S. District Court for the Southern District of New York. On August 19, 2011, the court entered an order and final judgment approving the settlement as fair, reasonable and adequate. In September 2011, certain parties filed notices of appeal from the court’s order approving the settlement. The settlement does not resolve other outstanding lawsuits against OFI and its affiliates relating to BLMIS.
On April 16, 2010, a lawsuit was filed in New York state court against OFI, an affiliate of OFI and AAArdvark IV Funding Limited (“AAArdvark IV”), an entity advised by OFI’s affiliate, in connection with investments made by the plaintiffs in AAArdvark IV. Plaintiffs allege breach of contract and common law fraud claims against the defendants and seek compensatory damages, costs and disbursements, including attorney fees. On April 11, 2013, the court granted defendants’ motion for summary judgment, dismissing plaintiffs’ fraud claim with prejudice and dismissing their contract claim without prejudice, and granted plaintiffs leave to replead their contract claim to assert a cause of action for specific performance within 30 days. On May 9, 2013, plaintiffs filed a notice of appeal from the court’s dismissal order. On July 15, 2011, a lawsuit was filed in New York state court against OFI, an affiliate of OFI and AAArdvark Funding Limited (“AAArdvark I”), an entity advised by OFI’s affiliate, in connection with investments made by the plaintiffs in AAArdvark I. The complaint alleges breach of contract and common law fraud claims against the defendants and seeks compensatory damages, costs and disbursements, including attorney fees. On November 9, 2011, a lawsuit was filed in New York state court against OFI, an affiliate of OFI
55 OPPENHEIMER EQUITY INCOME FUND
| NOTESTO FINANCIAL STATEMENTS Continued | ||||
8. Pending Litigation (Continued)
and AAArdvark XS Funding Limited (“AAArdvark XS”), an entity advised by OFI’s affiliate, in connection with investments made by the plaintiffs in AAArdvark XS. The complaint alleged breach of contract against the defendants and sought compensatory damages, costs and disbursements, including attorney fees. On November 8, 2013, the parties filed a stipulation of discontinuance dismissing the lawsuit with prejudice.
OFI believes the lawsuits and appeals described above are without legal merit and, with the exception of actions it has settled, is defending against them vigorously. While it is premature to render any opinion as to the outcome in these lawsuits, or whether any costs that the Defendant Funds may bear in defending the suits might not be reimbursed by insurance, OFI believes that these suits should not impair the ability of OFI or the Distributor to perform their respective duties to the Fund, and that the outcome of all of the suits together should not have any material effect on the operations of any of the Oppenheimer mutual funds.
56 OPPENHEIMER EQUITY INCOME FUND
REPORTOF INDEPENDENT REGISTERED PUBLIC ACCOUNTING FIRM | ||||
The Board of Trustees and Shareholders of Oppenheimer Equity Income Fund:
We have audited the accompanying statement of assets and liabilities of Oppenheimer Equity Income Fund (formerly Oppenheimer Equity Income Fund, Inc.), including the statement of investments, as of October 31, 2013, and the related statement of operations for the year then ended, the statements of changes in net assets for each of the years in the two-year period then ended, and the financial highlights for each of the years or periods in the five-year period then ended. These financial statements and financial highlights are the responsibility of the Fund’s management. Our responsibility is to express an opinion on these financial statements and financial highlights based on our audits.
We conducted our audits in accordance with the standards of the Public Company Accounting Oversight Board (United States). Those standards require that we plan and perform the audit to obtain reasonable assurance about whether the financial statements and financial highlights are free of material misstatement. An audit includes examining, on a test basis, evidence supporting the amounts and disclosures in the financial statements. Our procedures included confirmation of securities owned as of October 31, 2013, by correspondence with the custodian, transfer agent and brokers, or by other appropriate auditing procedures where replies from brokers were not received. An audit also includes assessing the accounting principles used and significant estimates made by management, as well as evaluating the overall financial statement presentation. We believe that our audits provide a reasonable basis for our opinion.
In our opinion, the financial statements and financial highlights referred to above present fairly, in all material respects, the financial position of Oppenheimer Equity Income Fund as of October 31, 2013, the results of its operations for the year then ended, the changes in its net assets for each of the years in the two-year period then ended, and the financial highlights for each of the years or periods in the five-year period then ended, in conformity with U.S. generally accepted accounting principles.
KPMG LLP
Denver, Colorado
December 26, 2013
57 OPPENHEIMER EQUITY INCOME FUND
| FEDERAL INCOME TAX INFORMATION Unaudited | ||||
In early 2013, if applicable, shareholders of record received information regarding all dividends and distributions paid to them by the Fund during calendar year 2012.
Capital gain distributions of $0.20403 per share were paid to Class A, Class B, Class C, Class N and Class Y shareholders, respectively, on December 6, 2012. Whether received in stock or in cash, the capital gain distribution should be treated by shareholders as a gain from the sale of the capital assets held for more than one year (long-term capital gains).
Dividends, if any, paid by the Fund during the fiscal year ended October 31, 2013 which are not designated as capital gain distributions should be multiplied by the maximum amount allowable but not less than 38.13% to arrive at the amount eligible for the corporate dividend-received deduction.
A portion, if any, of the dividends paid by the Fund during the fiscal year ended October 31, 2013 which are not designated as capital gain distributions are eligible for lower individual income tax rates to the extent that the Fund has received qualified dividend income as stipulated by recent tax legislation. The maximum amount allowable but not less than $104,089,338 of the Fund’s fiscal year taxable income may be eligible for the lower individual income tax rates. In early 2013, shareholders of record received information regarding the percentage of distributions that are eligible for lower individual income tax rates.
Recent tax legislation allows a regulated investment company to designate distributions not designated as capital gain distributions, as either interest related dividends or short-term capital gain dividends, both of which are exempt from the U.S. withholding tax applicable to non U.S. taxpayers. For the fiscal year ended October 31, 2013, the maximum amount allowable but not less than $42,995,793 of the ordinary distributions to be paid by the Fund qualifies as an interest related dividend and the maximum amount allowable but not less than $101,685,273 of the short-term capital gain distribution to be paid by the Fund qualifies as a short-term capital gain dividend.
The foregoing information is presented to assist shareholders in reporting distributions received from the Fund to the Internal Revenue Service. Because of the complexity of the federal regulations which may affect your individual tax return and the many variations in state and local tax regulations, we recommend that you consult your tax advisor for specific guidance.
58 OPPENHEIMER EQUITY INCOME FUND
BOARD APPROVAL OF THE FUND’S INVESTMENT ADVISORY AND SUB-ADVISORY AGREEMENTS Unaudited | ||||
The Fund has entered into an investment advisory agreement with OFI Global Asset Management, Inc. (“OFI Global” or the “Adviser”), a wholly-owned subsidiary of OppenheimerFunds, Inc. (“OFI” or the “Sub-Adviser”) (“OFI Global” and “OFI” together the “Managers”) and OFI Global has entered into a sub-advisory agreement with OFI whereby OFI provides investment sub-advisory services to the Fund (collectively, the “Agreements”). Each year, the Board of Trustees (the “Board”), including a majority of the independent Trustees, is required to determine whether to renew the Agreements. The Investment Company Act of 1940, as amended, requires that the Board request and evaluate, and that the Managers provide, such information as may be reasonably necessary to evaluate the terms of the Agreements. The Board employs an independent consultant to prepare a report that provides information, including comparative information that the Board requests for that purpose. In addition to in-person meetings focused on this evaluation, the Board receives information throughout the year regarding Fund services, fees, expenses and performance.
The Adviser, Sub-Adviser and the independent consultant provided information to the Board on the following factors: (i) the nature, quality and extent of the Managers’ services, (ii) the investment performance of the Fund and the Managers, (iii) the fees and expenses of the Fund, including comparative expense information, (iv) the profitability of the Managers and their affiliates, including an analysis of the cost of providing services, (v) whether economies of scale are realized as the Fund grows and whether fee levels reflect these economies of scale for Fund investors and (vi) other benefits to the Managers from their relationship with the Fund. The Board was aware that there are alternatives to retaining the Managers.
Outlined below is a summary of the principal information considered by the Board as well as the Board’s conclusions.
Nature, Quality and Extent of Services. The Board considered information about the nature, quality and extent of the services provided to the Fund and information regarding the Managers’ key personnel who provide such services. The Sub-Adviser’s duties include providing the Fund with the services of the portfolio manager and the Sub-Adviser’s investment team, who provide research, analysis and other advisory services in regard to the Fund’s investments; securities trading services; oversight of third-party service providers; monitoring compliance with applicable Fund policies and procedures and adherence to the Fund’s investment restrictions; and risk management. The Managers are responsible for providing certain administrative services to the Fund as well. Those services include providing and supervising all administrative and clerical personnel who are necessary in order to provide effective corporate administration for the Fund; compiling and maintaining records with respect to the Fund’s operations; preparing and filing reports required by the Securities and Exchange Commission; preparing periodic reports regarding the operations of the Fund for its shareholders; preparing proxy materials for shareholder meetings; and preparing the registration statements required by Federal and state securities laws for the sale of the Fund’s shares. The Managers also provide the Fund with office space, facilities and equipment.
The Board also considered the quality of the services provided and the quality of the Managers’ resources that are available to the Fund. The Board took account of the fact that the Sub-Adviser has had over fifty years of experience as an investment adviser and that its assets under management rank it among the top mutual fund managers in the United States. The Board evaluated the Sub-Adviser’s advisory, administrative, accounting, legal, compliance
59 OPPENHEIMER EQUITY INCOME FUND
BOARD APPROVAL OF THE FUND’S INVESTMENT ADVISORY AND SUB-ADVISORY AGREEMENTS Unaudited/Continued | ||||
services and risk management, and information the Board has received regarding the experience and professional qualifications of the Managers’ key personnel and the size and functions of its staff. In its evaluation of the quality of the portfolio management services provided, the Board considered the experience of Michael Levine, the portfolio manager for the Fund, and the Sub-Adviser’s investment team and analysts. The Board members also considered the totality of their experiences with the Managers as directors or trustees of the Fund and other funds advised by the Managers. The Board considered information regarding the quality of services provided by affiliates of the Managers, which its members have become knowledgeable about in connection with the renewal of the Fund’s service agreements. The Board concluded, in light of the Managers’ experience, reputation, personnel, operations and resources that the Fund benefits from the services provided under the Agreement.
Investment Performance of the Fund, the Adviser and the Sub-Adviser. Throughout the year, the Adviser and the Sub-Adviser provided information on the investment performance of the Fund, the Adviser and the Sub-Adviser, including comparative performance information. The Board also reviewed information, prepared by the Adviser, the Sub-Adviser and the independent consultant, comparing the Fund’s historical performance to its benchmarks and to the performance of other retail large value funds. The Board noted that the Fund’s one-year, three-year, five-year and ten-year performance was better than its category median.
Costs of Services by the Adviser. The Board reviewed the fees paid to the Adviser and the other expenses borne by the Fund. The Board also considered the comparability of the fees charged and the services provided to the Fund to the fees and services for other clients or accounts advised by the Adviser. The independent consultant provided comparative data in regard to the fees and expenses of the Fund and other retail front-end load large value funds with comparable asset levels and distribution features. The Fund’s contractual management fees and total expenses were lower than its peer group median and category median.
Economies of Scale and Profits Realized by the Adviser and Sub-Adviser. The Board considered information regarding the Managers’ costs in serving as the Fund’s investment adviser and sub-adviser, including the costs associated with the personnel and systems necessary to manage the Fund, and information regarding the Managers’ profitability from their relationship with the Fund. The Board reviewed whether the Managers may realize economies of scale in managing and supporting the Fund. The Board noted that the Fund currently has management fee breakpoints, which are intended to share with Fund shareholders economies of scale that may exist as the Fund’s assets grow. Based on the Board’s evaluation, the Managers agreed to a revised breakpoint schedule as negotiated by the Board that, effective November 2013, includes an additional breakpoint at 0.42% for assets in excess of $10 billion.
Other Benefits to the Managers. In addition to considering the profits realized by the Managers, the Board considered information that was provided regarding the direct and indirect benefits the Managers receive as a result of their relationship with the Fund, including compensation paid to the Managers’ affiliates and research provided to the Adviser in connection with permissible brokerage arrangements (soft dollar arrangements). The Board also considered that the Managers must be able to pay and retain experienced professional personnel at competitive rates to provide quality services to the Fund.
60 OPPENHEIMER EQUITY INCOME FUND
Conclusions. These factors were also considered by the independent Trustees meeting separately from the full Board, assisted by experienced counsel to the Fund and to the independent Trustees. Fund counsel and the independent Trustees’ counsel are independent of the Managers within the meaning and intent of the Securities and Exchange Commission Rules.
Based on its review of the information it received and its evaluations described above, the Board, including a majority of the independent Trustees, decided to continue the Agreements through September 30, 2014. In arriving at its decision, the Board did not identify any factor or factors as being more important than others, but considered all of the above information, and considered the terms and conditions of the Agreements, including the management fees, in light of all the surrounding circumstances.
61 OPPENHEIMER EQUITY INCOME FUND
| SPECIAL SHAREHOLDER MEETING Unaudited | ||||
On June 21, 2013, a shareholder meeting of Oppenheimer Equity Income Fund, Inc. (the “Fund”) was held at which the twelve Trustees identified below were elected to the Fund (Proposal No. 1). At the meeting the sub-proposals below (Proposal No. 2 (including certain of its sub-proposals)) and an Agreement and Plan of Reorganization to reorganize the Fund into a Delaware statutory trust (Proposal No. 3) were approved as described in the Fund’s proxy statement dated April 12, 2013. The following is a report of the votes cast:
Nominee/Proposal | For | Withheld | ||||||||
Trustees | ||||||||||
Brian F. Wruble | 73,698,351 | 2,341,076 | ||||||||
| David K. Downes | 73,623,030 | 2,416,397 | ||||||||
| Matthew P. Fink | 73,642,283 | 2,397,144 | ||||||||
| Edmund Giambastiani, Jr. | 73,651,151 | 2,388,276 | ||||||||
| Phillip A. Griffiths | 73,641,048 | 2,398,379 | ||||||||
| Mary F. Miller | 73,644,175 | 2,395,252 | ||||||||
| Joel W. Motley | 73,727,443 | 2,311,984 | ||||||||
| Joanne Pace | 73,711,125 | 2,328,302 | ||||||||
| Mary Ann Tynan | 73,706,658 | 2,332,769 | ||||||||
| Joseph M. Wikler | 73,639,724 | 2,399,703 | ||||||||
| Peter I. Wold | 73,718,160 | 2,321,268 | ||||||||
| William F. Glavin, Jr. | 73,665,435 | 2,373,992 | ||||||||
2a: Proposal to revise the fundamental policy relating to borrowing
For | Against | Abstain | ||||||||
| 52,353,413 | 2,558,867 | 2,691,100 | ||||||||
2b-1: Proposal to revise the fundamental policy relating to concentration of investments
For | Against | Abstain | ||||||||
| 52,495,128 | 2,412,960 | 2,695,294 | ||||||||
2c-1: Proposal to remove the fundamental policy relating to diversification of investments
For | Against | Abstain | ||||||||
| 52,149,095 | 2,711,282 | 2,743,013 | ||||||||
2d: Proposal to revise the fundamental policy relating to lending
For | Against | Abstain | ||||||||
| 52,116,387 | 2,579,643 | 2,907,356 | ||||||||
2e: Proposal to remove the additional fundamental policy relating to estate and commodities
For | Against | Abstain | ||||||||
| 52,358,067 | 2,396,689 | 2,848,627 | ||||||||
2f: Proposal to revise the fundamental policy relating to senior securities
For | Against | Abstain | ||||||||
| 52,298,232 | 2,428,670 | 2,876,480 | ||||||||
2g: Proposal to remove the additional fundamental policy relating to underwriting
For | Against | Abstain | ||||||||
| 52,211,007 | 2,542,241 | 2,850,134 | ||||||||
62 OPPENHEIMER EQUITY INCOME FUND
Proposal 3: To approve an Agreement and Plan of Reorganization that provides for the reorganization of a Fund from a Maryland corporation or Massachusetts business trust, as applicable, into a Delaware statutory trust.
For | Against | Abstain | ||||||||
| 52,917,125 | 1,974,220 | 2,712,046 | ||||||||
On August 2, 2013, following an adjournment from a shareholder meeting held on June 21, 2013, a meeting of the Fund was held at which the sub-proposal below (Proposal No. 2r) was approved as described in the Fund’s Proxy Statement. The following is a report of the votes cast:
2r: Proposal to convert the Fund’s investment objective from fundamental to non-fundamental
For | Against | Abstain | ||||||||
| 55,807,453 | 5,620,124 | 5,902,351 | ||||||||
63 OPPENHEIMER EQUITY INCOME FUND
PORTFOLIO PROXY VOTING POLICIESAND PROCEDURES; UPDATES TO STATEMENTS OF INVESTMENTS Unaudited | ||||
The Fund has adopted Portfolio Proxy Voting Policies and Procedures under which the Fund votes proxies relating to securities (“portfolio proxies”) held by the Fund. A description of the Fund’s Portfolio Proxy Voting Policies and Procedures is available (i) without charge, upon request, by calling the Fund toll-free at 1.800.CALL OPP (225.5677), (ii) on the Fund’s website at oppenheimerfunds.com, and (iii) on the SEC’s website at www.sec.gov. In addition, the Fund is required to file Form N-PX, with its complete proxy voting record for the 12 months ended June 30th, no later than August 31st of each year. The Fund’s voting record is available (i) without charge, upon request, by calling the Fund toll-free at 1.800.CALL OPP (225.5677), and (ii) in the Form N-PX filing on the SEC’s website at www.sec.gov.
The Fund files its complete schedule of portfolio holdings with the SEC for the first quarter and the third quarter of each fiscal year on Form N-Q. The Fund’s Form N-Q filings are available on the SEC’s website at www.sec.gov. Those forms may be reviewed and copied at the SEC’s Public Reference Room in Washington, D.C. Information on the operation of the Public Reference Room may be obtained by calling 1-800-SEC-0330.
Householding—Delivery of Shareholder Documents
This is to inform you about OppenheimerFunds’ “householding” policy. If more than one member of your household maintains an account in a particular fund, OppenheimerFunds will mail only one copy of the fund’s prospectus (or, if available, the fund’s summary prospectus), annual and semiannual report and privacy policy. The consolidation of these mailings, called householding, benefits your fund through reduced mailing expense, and benefits you by reducing the volume of mail you receive from OppenheimerFunds. Householding does not affect the delivery of your account statements.
Please note that we will continue to household these mailings for as long as you remain an OppenheimerFunds shareholder, unless you request otherwise. If you prefer to receive multiple copies of these materials, please call us at 1.800.CALL-OPP (225-5677). You may also notify us in writing or via email. We will begin sending you individual copies of the prospectus (or, if available, the summary prospectus), reports and privacy policy within 30 days of receiving your request to stop householding.
64 OPPENHEIMER EQUITY INCOME FUND
| TRUSTEES AND OFFICERS Unaudited | ||||
Name, Position(s) Held with the Fund, Length of | Principal Occupation(s) During the Past 5 Years; Other Trusteeships/Directorships Held; Number of Portfolios in the Fund Complex Currently Overseen | |
| INDEPENDENT TRUSTEES | The address of each Trustee in the chart below is 6803 S. Tucson Way, Centennial, Colorado 80112-3924. Each Trustee serves for an indefinite term, or until his or her resignation, retirement, death or removal. | |
Brian F. Wruble, Chairman of the Board of Trustees (since 2007), Trustee (since 2001) Year of Birth: 1943 | Director of Community Foundation of the Florida Keys (non-profit) (since July 2012); Chairman Emeritus and Non-Voting Trustee of The Jackson Laboratory (non-profit) (since August 2011); Director of Special Value Opportunities Fund, LLC (registered investment company) (affiliate of the Sub-Adviser’s parent company) (since September 2004); Member of Zurich Insurance Advisory Council (insurance) (since 2004); Treasurer (since 2007) and Trustee of the Institute for Advanced Study (non-profit educational institute) (since May 1992); Chairman (August 2007-August 2011) and Trustee (since August 1991) of the Board of Trustees of The Jackson Laboratory (non-profit); General Partner of Odyssey Partners, L.P. (hedge fund) (September 1995-December 2007); Special Limited Partner of Odyssey Investment Partners, LLC (private equity investment) (January 1999-September 2004). Oversees 51 portfolios in the OppenheimerFunds complex. Mr. Wruble has served on the Boards of certain Oppenheimer funds since April 2001, during which time he has become familiar with the Fund’s (and other Oppenheimer funds’) financial, accounting, regulatory and investment matters and has contributed to the Boards’ deliberations. | |
David K. Downes, Trustee (since 2005) Year of Birth: 1940 | Director of THL Credit Inc. (since June 2009); Independent Chairman GSK Employee Benefit Trust (since April 2006); Trustee of Employee Trusts (since January 2006); Chief Executive Officer and Board Member of Community Capital Management (investment management company) (since January 2004); President of The Community Reinvestment Act Qualified Investment Fund (investment management company) (since 2004); Director of Internet Capital Group (information technology company) (since October 2003); Director of Correctnet (January 2006-2007); Independent Chairman of the Board of Trustees of Quaker Investment Trust (registered investment company) (2004-2007); Chief Operating Officer and Chief Financial Officer of Lincoln National Investment Companies, Inc. (subsidiary of Lincoln National Corporation, a publicly traded company) and Delaware Investments U.S., Inc. (investment management subsidiary of Lincoln National Corporation) (1993-2003); President, Chief Executive Officer and Trustee of Delaware Investment Family of Funds (1993-2003); President and Board Member of Lincoln National Convertible Securities Funds, Inc. and the Lincoln National Income Funds, TDC (1993-2003); Chairman and Chief Executive Officer of Retirement Financial Services, Inc. (registered transfer agent and investment adviser and subsidiary of Delaware Investments U.S., Inc.) (1993-2003); President and Chief Executive Officer of Delaware Service Company, Inc. (1995-2003); Chief Administrative Officer, Chief Financial Officer, Vice Chairman and Director of Equitable Capital Management Corporation (investment subsidiary of Equitable Life Assurance Society) (1985-1992); Corporate Controller of Merrill Lynch Company (financial services holding company) (1977-1985); held the following positions at the Colonial Penn Group, Inc. (insurance company): Corporate Budget Director (1974-1977), Assistant Treasurer (1972-1974) and Director of Corporate Taxes (1969-1972); held the following positions at Price Waterhouse Company (financial services firm): Tax Manager (1967-1969), Tax Senior (1965-1967) and Staff Accountant (1963-1965); United States Marine Corps (1957-1959). Oversees 51 portfolios in the OppenheimerFunds complex. Mr. Downes has | |
65 OPPENHEIMER EQUITY INCOME FUND
| TRUSTEES AND OFFICERS Unaudited / Continued | ||||
David K. Downes, Continued | served on the Boards of certain Oppenheimer funds since December 2005, during which time he has become familiar with the Fund’s (and other Oppenheimer funds’) financial, accounting, regulatory and investment matters and has contributed to the Boards’ deliberations. | |
Matthew P. Fink, Trustee (since 2009) Year of Birth: 1941 | Trustee of the Committee for Economic Development (policy research foundation) (2005-2011); Director of ICI Education Foundation (education foundation) (October 1991-August 2006); President of the Investment Company Institute (trade association) (October 1991-June 2004); Director of ICI Mutual Insurance Company (insurance company) (October 1991-June 2004); Author of The Rise of Mutual Funds: An Insider’s View published by Oxford University Press (second edition 2010). Oversees 51 portfolios in the OppenheimerFunds complex. Mr. Fink has served on the Boards of certain Oppenheimer funds since January 2005, during which time he has become familiar with the Fund’s (and other Oppenheimer funds’) financial, accounting, regulatory and investment matters and has contributed to the Boards’ deliberations. | |
Edmund P. Giambastiani, Jr., Trustee (since 2013) Year of Birth: 1948 | Advisory Board Member of the Maxwell School of Citizenship and Public Affairs of Syracuse University (since April 2012); Director of Mercury Defense Systems Inc. (information technology) (August 2011-February 2013); Trustee of the U.S. Naval Academy Foundation (since November 2010); Advisory Board Member of the Massachusetts Institute of Technology Lincoln Laboratory (federally-funded research development center) (since May 2010); Director of The Boeing Company (aerospace and defense) (since October 2009); Trustee of MITRE Corporation (federally-funded research development center) (since September 2008); Independent Director of QinetiQ Group Plc (defense technology and security) (February 2008-August 2011); Director of Monster Worldwide, Inc. (on-line career services) (since January 2008, Lead Director since June 2011); Chairman of Alenia North America, Inc. (military and defense products) (January 2008-October 2009); Director of SRA International, Inc. (information technology and services) (January 2008-July 2011); President of Giambastiani Group LLC (national security and energy consulting) (since October 2007); United States Navy, career nuclear submarine officer (June 1970-October 2007), Vice Chairman of the Joint Chiefs of Staff (2005-October 2007), NATO Supreme Allied Commander Transformation (2003-2005), Commander, U.S. Joint Forces Command (2002-2005). Since his retirement from the U.S. Navy in October 2007, Admiral Giambastiani has also served on numerous U.S. Government advisory boards, investigations and task forces for the Secretaries of Defense, State and Interior and the Central Intelligence Agency. Oversees 51 portfolios in the OppenheimerFunds complex. Admiral Giambastiani has served on the Boards of certain Oppenheimer funds since February 2013, including as an Advisory Board Member for certain Oppenheimer funds, during which time he has become familiar with the Fund’s (and other Oppenheimer funds’) financial, accounting, regulatory and investment matters and has contributed to the Boards’ deliberations. For purposes of this report, Admiral Giambastiani is identified as a Trustee. | |
Phillip A. Griffiths, Trustee (since 2009) Year of Birth: 1938 | Fellow of the Carnegie Corporation (since 2007); Member of the National Academy of Sciences (since 1979); Council on Foreign Relations (since 2002); Foreign Associate of Third World Academy of Sciences (since 2002); Chair of Science Initiative Group (since 1999); Member of the American Philosophical Society (since 1996); Trustee of Woodward Academy (since 1983); Director of GSI Lumonics Inc. (precision technology products company) (2001-2010); Senior Advisor of The Andrew W. Mellon Foundation (2001-2010); Distinguished Presidential Fellow for International Affairs of the National Academy of Science | |
66 OPPENHEIMER EQUITY INCOME FUND
Phillip A. Griffiths, Continued | (2002-2010); Director of the Institute for Advanced Study (1991-2004); Director of Bankers Trust New York Corporation (1994-1999); Provost at Duke University (1983-1991). Oversees 51 portfolios in the OppenheimerFunds complex. Mr. Griffiths has served on the Boards of certain Oppenheimer funds since June 1999, during which time he has become familiar with the Fund’s (and other Oppenheimer funds’) financial, accounting, regulatory and investment matters and has contributed to the Boards’ deliberations. | |
Mary F. Miller, Trustee (since 2009) Year of Birth: 1942 | Trustee of International House (not-for-profit) (since June 2007); Trustee of the American Symphony Orchestra (not-for-profit) (October 1998-November 2011); and Senior Vice President and General Auditor of American Express Company (financial services company) (July 1998-February 2003). Oversees 51 portfolios in the OppenheimerFunds complex. Ms. Miller has served on the Boards of certain Oppenheimer funds since August 2004, during which time she has become familiar with the Fund’s (and other Oppenheimer funds’) financial, accounting, regulatory and investment matters and has contributed to the Boards’ deliberations. | |
Joel W. Motley, Trustee (since 2009) Year of Birth: 1952 | Member of the Vestry of Trinity Wall Street (since April 2012); Director of Southern Africa Legal Services Foundation (since March 2012); Board Member of Pulitzer Center for Crisis Reporting (non-profit journalism) (since December 2010); Managing Director of Public Capital Advisors, LLC (privately-held financial advisor) (since January 2006); Managing Director of Carmona Motley, Inc. (privately-held financial advisor) (since January 2002); Director of Columbia Equity Financial Corp. (privately-held financial advisor) (2002-2007); Managing Director of Carmona Motley Hoffman Inc. (privately-held financial advisor) (January 1998-December 2001); Member of the Finance and Budget Committee of the Council on Foreign Relations, Member of the Investment Committee and Board of Human Rights Watch and Member of the Investment Committee and Board of Historic Hudson Valley. Oversees 51 portfolios in the OppenheimerFunds complex. Mr. Motley has served on the Boards of certain Oppenheimer funds since October 2002, during which time he has become familiar with the Fund’s (and other Oppenheimer funds’) financial, accounting, regulatory and investment matters and has contributed to the Boards’ deliberations. | |
Joanne Pace, Trustee (since 2012) Year of Birth: 1958 | Board Director of Horizon Blue Cross Blue Shield of New Jersey (since November 2012); Advisory Board Director of The Alberleen Group LLC (since March 2012); Advisory Board Director of The Agile Trading Group LLC (since March 2012); Advisory Council Member of 100 Women in Hedge Funds (non-profit) (since December 2012); Advisory Council Member of Morgan Stanley Children’s Hospital (non-profit) (since May 2012); Board Director of The Komera Project (non-profit) (since April 2012); New York Advisory Board Director of Peace First (non-profit) (since March 2010); Senior Advisor of SECOR Asset Management, LP (2010-2011); Managing Director and Chief Operating Officer of Morgan Stanley Investment Management (2006-2010); Partner and Chief Operating Officer of FrontPoint Partners, LLC (hedge fund) (2005-2006); held the following positions at Credit Suisse: Managing Director (2003-2005); Global Head of Human Resources and member of Executive Board and Operating Committee (2004-2005), Global Head of Operations and Product Control (2003-2004); held the following positions at Morgan Stanley: Managing Director (1997-2003), Controller and Principal Accounting Officer (1999-2003); Chief Financial Officer (temporary assignment) for the Oversight Committee, Long Term Capital Management (1998-1999). Lead Independent Director and Chair of the Audit and Nominating Committee of The Global Chartist Fund, LLC of Oppenheimer | |
67 OPPENHEIMER EQUITY INCOME FUND
| TRUSTEES AND OFFICERS Unaudited / Continued | ||||
Joanne Pace, Continued | Asset Management (2011-2012); Board Director of Managed Funds Association (2008-2010); Board Director of Morgan Stanley Foundation (2007-2010) and Investment Committee Chair (2008-2010). Oversees 51 portfolios in the OppenheimerFunds complex. Ms. Pace has served on the Boards of certain Oppenheimer funds since November 2012, including as an Advisory Board Member for certain Oppenheimer funds, during which time she has become familiar with the Fund’s (and other Oppenheimer funds’) financial, accounting, regulatory and investment matters and has contributed to the Board’s deliberations. For purposes of this report, Ms. Pace is identified as a Trustee. | |
Mary Ann Tynan, Trustee (since 2009) Year of Birth: 1945 | Director and Secretary of the Appalachian Mountain Club (non-profit outdoor organization) (since January 2012); Director of Opera House Arts (non-profit arts organization) (since October 2011); Independent Director of the ICI Board of Governors (non-profit) (since October 2011); Vice Chair of Board of Trustees of Brigham and Women’s/Faulkner Hospitals (non-profit hospital) (since 2000); Chair of Board of Directors of Faulkner Hospital (non-profit hospital) (since 1990); Member of Audit and Compliance Committee of Partners Health Care System (non-profit) (since 2004); Board of Trustees of Middlesex School (educational institution) (since 1994); Chair of Board of Directors of Idealswork, Inc. (financial services provider) (since 2003); Partner, Senior Vice President and Director of Regulatory Affairs of Wellington Management Company, LLP (global investment manager) (1976-2002); Vice President and Corporate Secretary, John Hancock Advisers, Inc. (mutual fund investment adviser) (1970-1976). Oversees 51 portfolios in the OppenheimerFunds complex. Ms. Tynan has served on the Boards of certain Oppenheimer funds since October 2008, during which time she has become familiar with the Fund’s (and other Oppenheimer funds’) financial, accounting, regulatory and investment matters and has contributed to the Boards’ deliberations | |
Joseph M. Wikler, Trustee (since 2009) Year of Birth: 1941 | Director of C-TASC (bio-statistics services) (2007-2012); formerly, Director of the following medical device companies: Medintec (1992-2011) and Cathco (1996-2011); Member of the Investment Committee of the Associated Jewish Charities of Baltimore (since 1994); Director of Lakes Environmental Association (environmental protection organization) (1996-2008); Director of Fortis/Hartford mutual funds (1994-December 2001). Oversees 51 portfolios in the OppenheimerFunds complex. Mr. Wikler has served on the Boards of certain Oppenheimer funds since August 2005, during which time he has become familiar with the Fund’s (and other Oppenheimer funds’) financial, accounting, regulatory and investment matters and has contributed to the Boards’ deliberations. | |
Peter I. Wold, Trustee (since 2009) Year of Birth: 1948 | Director of Arch Coal, Inc. (since 2010); President of Wold Oil Properties, Inc. (oil and gas exploration and production company) (since 1994); Vice President of American Talc Company, Inc. (talc mining and milling) (since 1999); Managing Member of Hole-in-the-Wall Ranch (cattle ranching) (since 1979); Director and Chairman of Wyoming Enhanced Oil Recovery Institute Commission (enhanced oil recovery study) (2004-2012); Director and Chairman of the Denver Branch of the Federal Reserve Bank of Kansas City (1993-1999); and Director of PacifiCorp. (electric utility) (1995-1999). Oversees 51 portfolios in the OppenheimerFunds complex. Mr. Wold has served on the Boards of certain Oppenheimer funds since August 2005, during which time he has become familiar with the Fund’s (and other Oppenheimer funds’) financial, accounting, regulatory and investment matters and has contributed to the Boards’ deliberations. | |
68 OPPENHEIMER EQUITY INCOME FUND
| INTERESTED TRUSTEE AND OFFICER | Mr. Glavin is an “Interested Trustee” because he is affiliated with the Manager and the Sub-Adviser by virtue of his positions as an officer and director of the Manager and a director of the Sub-Adviser, and as a shareholder of the Sub-Adviser’s parent company. Both as a Trustee and as an officer, he serves for an indefinite term, or until his resignation, retirement, death or removal. Mr. Glavin’s address is Two World Financial Center, 225 Liberty Street, 11th Floor, New York, New York 10281-1008. | |
William F. Glavin, Jr., Trustee, President and Principal Executive Officer (since 2009) Year of Birth: 1958 | Director, Chairman and Chief Executive Officer of the Manager (since January 2013); President of the Manager (January 2013-May 2013); Chairman of the Sub-Adviser (December 2009-December 2012); Chief Executive Officer (January 2009-December 2012) and Director of the Sub-Adviser (since January 2009); President of the Sub-Adviser (May 2009-December 2012); Management Director (since June 2009), President (since December 2009) and Chief Executive Officer (since January 2011) of Oppenheimer Acquisition Corp. (“OAC”) (the Sub-Adviser’s parent holding company); Director of Oppenheimer Real Asset Management, Inc. (since March 2010); Executive Vice President (March 2006-February 2009) and Chief Operating Officer (July 2007-February 2009) of Massachusetts Mutual Life Insurance Company (OAC’s parent company); Director (May 2004-March 2006) and Chief Operating Officer and Chief Compliance Officer (May 2004-January 2005), President (January 2005-March 2006) and Chief Executive Officer (June 2005-March 2006) of Babson Capital Management LLC; Director (March 2005-March 2006), President (May 2003-March 2006) and Chief Compliance Officer (July 2005-March 2006) of Babson Capital Securities, Inc. (a broker-dealer); President (May 2003-March 2006) of Babson Investment Company, Inc.; Director (May 2004-August 2006) of Babson Capital Europe Limited; Director (May 2004-October 2006) of Babson Capital Guernsey Limited; Director (May 2004-March 2006) of Babson Capital Management LLC; Non-Executive Director (March 2005-March 2007) of Baring Asset Management Limited; Director (February 2005-June 2006) Baring Pension Trustees Limited; Director and Treasurer (December 2003-November 2006) of Charter Oak Capital Management, Inc.; Director (May 2006-September 2006) of C.M. Benefit Insurance Company; Director (May 2008-June 2009) and Executive Vice President (June 2007-July 2009) of C.M. Life Insurance Company; President (March 2006-May 2007) of MassMutual Assignment Company; Director (January 2005-December 2006), Deputy Chairman (March 2005-December 2006) and President (February 2005-March 2005) of MassMutual Holdings (Bermuda) Limited; Director (May 2008-June 2009) and Executive Vice President (June 2007-July 2009) of MML Bay State Life Insurance Company; Chief Executive Officer and President (April 2007-January 2009) of MML Distributors, LLC; and Chairman (March 2006-December 2008) and Chief Executive Officer (May 2007-December 2008) of MML Investors Services, Inc. An officer of 89 portfolios in the OppenheimerFunds complex. | |
| OTHER OFFICERS OF THE FUND | The addresses of the Officers in the chart below are as follows: for Messrs. Levine, Gabinet and Ms. Nasta, Two World Financial Center, 225 Liberty Street, New York, New York 10281-1008, for Messrs. Vandehey and Wixted, 6803 S. Tucson Way, Centennial, Colorado 80112-3924. Each Officer serves for an indefinite term or until his or her resignation, retirement, death or removal. | |
Michael S. Levine, Vice President (since 2007) Year of Birth: 1965 | Vice President of the Sub-Adviser (since June 1998) and Senior Portfolio Manager of the Sub-Adviser (since September 2000).A portfolio manager and an officer of other portfolios in the OppenheimerFunds complex. | |
69 OPPENHEIMER EQUITY INCOME FUND
| TRUSTEES AND OFFICERS Unaudited / Continued | ||||
Arthur S. Gabinet, Secretary and Chief Legal Officer (since 2011) Year of Birth: 1958 | Executive Vice President, Secretary and General Counsel of the Manager (since January 2013); General Counsel OFI SteelPath, Inc. (since January 2013); Executive Vice President (May 2010-December 2012) and General Counsel (since January 2011) of the Sub-Adviser; General Counsel of the Distributor (since January 2011); General Counsel of Centennial Asset Management Corporation (January 2011-December 2012); Executive Vice President (January 2011-December 2012) and General Counsel of HarbourView Asset Management Corporation (since January 2011); Assistant Secretary (since January 2011) and Director (since January 2011) of OppenheimerFunds International Ltd. and OppenheimerFunds plc; Director of Oppenheimer Real Asset Management, Inc. (January 2011-December 2012) and General Counsel (since January 2011); Executive Vice President (January 2011-December 2011) and General Counsel of Shareholder Financial Services, Inc. and Shareholder Services, Inc. (since January 2011); Executive Vice President (January 2011-December 2012) and General Counsel of OFI Private Investments Inc. (since January 2011); Vice President of OppenheimerFunds Legacy Program (January 2011-December 2011); Executive Vice President (January 2011-December 2012) and General Counsel of OFI Global Institutional, Inc. (since January 2011); General Counsel, Asset Management of the Sub-Adviser (May 2010-December 2010); Principal, The Vanguard Group (November 2005-April 2010); District Administrator, U.S. Securities and Exchange Commission (January 2003-October 2005). An officer of 89 portfolios in the OppenheimerFunds complex. | |
Christina M. Nasta, Vice President and Chief Business Officer (since 2011) Year of Birth: 1973 | Senior Vice President of OppenheimerFunds Distributor, Inc. (since January 2013); Senior Vice President of the Sub-Adviser (July 2010-December 2012); Vice President of the Sub-Adviser (January 2003-July 2010); Vice President of OppenheimerFunds Distributor, Inc. (January 2003-July 2010). An officer of 89 portfolios in the OppenheimerFunds complex. | |
Mark S. Vandehey, Vice President and Chief Compliance Officer (since 2004) Year of Birth: 1950 | Senior Vice President and Chief Compliance Officer of the Manager (since January 2013); Chief Compliance Officer of OFI SteelPath, Inc. (since January 2013); Senior Vice President of the Sub-Adviser (March 2004-December 2012); Chief Compliance Officer of the Sub-Adviser, OppenheimerFunds Distributor, Inc., OFI Global Trust Company, OFI Global Institutional, Inc., Oppenheimer Real Asset Management, Inc., OFI Private Investments, Inc., Harborview Asset Management Corporation, Trinity Investment Management Corporation, and Shareholder Services, Inc. (since March 2004); Vice President of OppenheimerFunds Distributor, Inc., Centennial Asset Management Corporation and Shareholder Services, Inc. (June 1983-December 2012). An officer of 89 portfolios in the OppenheimerFunds complex. | |
Brian W. Wixted, Treasurer and Principal Financial Year of Birth: 1959 | Senior Vice President of the Manager (since January 2013); Treasurer of the Sub-Adviser, HarbourView Asset Management Corporation, Shareholder Financial Services, Inc., Shareholder Services, Inc., and Oppenheimer Real Asset Management, Inc. (March 1999-June 2008), OFI Private Investments, Inc. (March 2000-June 2008), OppenheimerFunds International Ltd. and OppenheimerFunds plc (since May 2000), OFI Global Institutional, Inc. (November 2000-June 2008), and OppenheimerFunds Legacy Program (charitable trust program established by the Sub-Adviser) (June 2003-December 2011); Treasurer and Chief Financial Officer of OFI Global Trust Company (since May 2000); Assistant Treasurer of Oppenheimer Acquisition Corporation (March 1999-June 2008). An officer of 89 portfolios in the OppenheimerFunds complex. | |
The Fund’s Statement of Additional Information contains additional information about the Fund’s Trustees and Officers and is available without charge upon request, by calling 1.800.CALL OPP (225.5677).
70 OPPENHEIMER EQUITY INCOME FUND
| OPPENHEIMER EQUITY INCOME FUND | ||||
| Manager | OFI Global Asset Management, Inc. | |||
| Sub-Adviser | OppenheimerFunds, Inc. | |||
| Distributor | OppenheimerFunds Distributor, Inc. | |||
Transfer and Shareholder Servicing Agent | OFI Global Asset Management, Inc. | |||
| Sub-Transfer Agent | Shareholder Services, Inc. DBA OppenheimerFunds Services | |||
Independent Registered Public Accounting Firm | KPMG LLP | |||
| Legal Counsel | Kramer Levin Naftalis & Frankel LLP | |||
© 2013 OppenheimerFunds, Inc. All rights reserved.
71 OPPENHEIMER EQUITY INCOME FUND
| PRIVACY POLICY NOTICE | ||||
As an Oppenheimer fund shareholder, you are entitled to know how we protect your personal information and how we limit its disclosure.
Information Sources
We obtain nonpublic personal information about our shareholders from the following sources:
— Applications or other forms
— When you create a user ID and password for online account access
— When you enroll in eDocs Direct, our electronic document delivery service
— Your transactions with us, our affiliates or others
— A software program on our website, often referred to as a “cookie,” which indicates which parts of our site you’ve visited
— When you set up challenge questions to reset your password online
If you visit oppenheimerfunds.com and do not log on to the secure account information areas, we do not obtain any personal information about you. When you do log on to a secure area, we do obtain your user ID and password to identify you. We also use this information to provide you with products and services you have requested, to inform you about products and services that you may be interested in and assist you in other ways.
We do not collect personal information through our website unless you willingly provide it to us, either directly by email or in those areas of the website that request information. In order to update your personal information (including your mailing address, email address and phone number) you must first log on and visit your user profile.
If you have set your browser to warn you before accepting cookies, you will receive the warning message with each cookie. You can refuse cookies by turning them off in your browser. However, doing so may limit your access to certain sections of our website.
We use cookies to help us improve and manage our website. For example, cookies help us recognize new versus repeat visitors to the site, track the pages visited, and enable some special features on the website. This data helps us provide a better service for our website visitors.
Protection of Information
We do not disclose any non-public personal information (such as names on a customer list) about current or former customers to anyone, except as permitted by law.
Disclosure of Information
We send your financial advisor (as designated by you) copies of confirmations, account statements and other documents reporting activity in your fund accounts. We may also use details about you and your investments to help us, our financial service affiliates, or firms that jointly market their financial products and services with ours, to better serve your investment needs or suggest financial services or educational material that may be of interest to you. If this requires us to provide you with an opportunity to “opt in” or “opt out” of such information sharing with a firm not affiliated with us, you will receive notification on how to do so, before any such sharing takes place.
Right of Refusal
We will not disclose your personal information to unaffiliated third parties (except as permitted by law), unless we first offer you a reasonable opportunity to refuse or “opt out” of such disclosure.
72 OPPENHEIMER EQUITY INCOME FUND
Internet Security and Encryption
In general, the email services provided by our website are encrypted and provide a secure and private means of communication with us. To protect your own privacy, confidential and/or personal information should only be communicated via email when you are advised that you are using a secure website.
As a security measure, we do not include personal or account information in non-secure emails, and we advise you not to send such information to us in non-secure emails. Instead, you may take advantage of the secure features of our website to encrypt your email correspondence. To do this, you will need to use a browser that supports Secure Sockets Layer (SSL) protocol.
We do not guarantee or warrant that any part of our website, including files available for download, are free of viruses or other harmful code. It is your responsibility to take appropriate precautions, such as use of an anti-virus software package, to protect your computer hardware and software.
| — | All transactions, including redemptions, exchanges and purchases, are secured by SSL and 128-bit encryption. SSL is used to establish a secure connection between your PC and OppenheimerFunds’ server. It transmits information in an encrypted and scrambled format. |
| — | Encryption is achieved through an electronic scrambling technology that uses a “key” to code and then decode the data. Encryption acts like the cable converter box you may have on your television set. It scrambles data with a secret code so that no one can make sense of it while it is being transmitted. When the data reaches its destination, the same software unscrambles the data. |
| — | You can exit the secure area by either closing your browser, or for added security, you can use the Log Out button before you close your browser. |
Other Security Measures
We maintain physical, electronic and procedural safeguards to protect your personal account information. Our employees and agents have access to that information only so that they may offer you products or provide services, for example, when responding to your account questions.
How You Can Help
You can also do your part to keep your account information private and to prevent unauthorized transactions. If you obtain a user ID and password for your account, do not allow it to be used by anyone else. Also, take special precautions when accessing your account on a computer used by others.
Who We Are
This joint notice describes the privacy policies of the Oppenheimer funds, OppenheimerFunds, Inc., and each of its investment adviser subsidiaries, OppenheimerFunds Distributor, Inc. and OFI Global Trust Co. It applies to all Oppenheimer fund accounts you presently have, or may open in the future, using your Social Security number—whether or not you remain a shareholder of our funds. This notice was last updated November 2013. In the event it is updated or changed, we will post an updated notice on our website at oppenheimerfunds.com. If you have any questions about these privacy policies, write to us at P.O. Box 5270, Denver, CO 80217-5270, email us by clicking on the Contact Us section of our website at oppenheimerfunds.com or call us at 1.800.CALL OPP (225.5677).
73 OPPENHEIMER EQUITY INCOME FUND
THIS PAGE INTENTIONALLY LEFT BLANK.
74 OPPENHEIMER EQUITY INCOME FUND
THIS PAGE INTENTIONALLY LEFT BLANK.
75 OPPENHEIMER EQUITY INCOME FUND
THIS PAGE INTENTIONALLY LEFT BLANK.
76 OPPENHEIMER EQUITY INCOME FUND
THIS PAGE INTENTIONALLY LEFT BLANK.
77 OPPENHEIMER EQUITY INCOME FUND
THIS PAGE INTENTIONALLY LEFT BLANK.
78 OPPENHEIMER EQUITY INCOME FUND
THIS PAGE INTENTIONALLY LEFT BLANK.
79 OPPENHEIMER EQUITY INCOME FUND

Visit us at oppenheimerfunds.com for 24-hr access to account information and transactions or call us at 800.CALL OPP (800.225.5677) for 24-hr automated information and automated transactions. Representatives also available Mon–Fri 8am-8pm ET. Oppenheimer funds are distributed by OppenheimerFunds Distributor, Inc. Two World Financial Center, 225 Liberty Street, New York, NY 10281-1008 © 2013 OppenheimerFunds Distributor, Inc. All rights reserved. RA0835.001.1013 December 23, 2013
Item 2. Code of Ethics.
The registrant has adopted a code of ethics that applies to the registrant’s principal executive officer, principal financial officer, principal accounting officer or controller or persons performing similar functions.
Item 3. Audit Committee Financial Expert.
The Board of Trustees of the registrant has determined that David Downes, the Board’s Audit Committee Chairman, is an audit committee financial expert and that Mr. Downes is “independent” for purposes of this Item 3.
Item 4. Principal Accountant Fees and Services.
| (a) | Audit Fees |
The principal accountant for the audit of the registrant’s annual financial statements billed $32,500 in fiscal 2013 and $31,800 in fiscal 2012.
| (b) | Audit-Related Fees |
The principal accountant for the audit of the registrant’s annual financial statements billed no such fees in fiscal 2013 and no such fees in fiscal 2012.
The principal accountant for the audit of the registrant’s annual financial statements billed $459,080 in fiscal 2013 and $436,206 in fiscal 2012 to the registrant’s investment adviser or any entity controlling, controlled by, or under common control with the adviser that provides ongoing services to the registrant.
Such services include: Internal control reviews, compliance procedures, GIPS attestation procedures, internal audit training, surprise exams, system conversion testing, and entity reorganization
| (c) | Tax Fees |
The principal accountant for the audit of the registrant’s annual financial statements billed no such fees in fiscal 2013 and no such fees in fiscal 2012.
The principal accountant for the audit of the registrant’s annual financial statements billed $581,620 in fiscal 2013 and $386,424 in fiscal 2012 to the registrant’s investment adviser or any entity controlling, controlled by, or under common control with the adviser that provides ongoing services to the registrant.
Such services include: tax compliance, tax planning and tax advice. Tax compliance generally involves preparation of original and amended tax returns, claims for a refund and tax payment-planning services. Tax planning and tax advice includes assistance with tax audits and appeals, tax advice related to mergers and acquisitions and requests for rulings or technical advice from taxing authorities.
| (d) | All Other Fees |
The principal accountant for the audit of the registrant’s annual financial statements billed no such fees in fiscal 2013 and no such fees in fiscal 2012.
The principal accountant for the audit of the registrant’s annual financial statements billed no such fees in fiscal 2013 and no such fees in fiscal 2012 to the registrant’s investment adviser or any entity controlling, controlled by, or under common control with the adviser that provides ongoing services to the registrant.
Such fees would include the cost to the principal accountant of attending audit committee meetings and consultations regarding the registrant’s retirement plan with respect to its Trustees.
| (e) | (1) During its regularly scheduled periodic meetings, the registrant’s audit committee will pre-approve all audit, audit-related, tax and other services to be provided by the principal accountants of the registrant. |
The audit committee has delegated pre-approval authority to its Chairman for any subsequent new engagements that arise between regularly scheduled meeting dates provided that any fees such pre-approved are presented to the audit committee at its next regularly scheduled meeting.
Under applicable laws, pre-approval of non-audit services may be waived provided that: 1) the aggregate amount of all such services provided constitutes no more than five percent of the total amount of fees paid by the registrant to its principal accountant during the fiscal year in which services are provided 2) such services were not recognized by the registrant at the time of engagement as non-audit services and 3) such services are promptly brought to the attention of the audit committee of the registrant and approved prior to the completion of the audit.
(2) 0%
| (f) | Not applicable as less than 50%. |
| (g) | The principal accountant for the audit of the registrant’s annual financial statements billed $1,040,700 in fiscal 2013 and $822,630 in fiscal 2012 to the registrant and the registrant’s investment adviser or any entity controlling, controlled by, or under common control with the adviser that provides ongoing services to the registrant related to non-audit fees. Those billings did not include any prohibited non-audit services as defined by the Securities Exchange Act of 1934. |
| (h) | The registrant’s audit committee of the board of Trustees has considered whether the provision of non-audit services that were rendered to the registrant’s investment adviser, and any entity controlling, controlled by, or under common control with the investment adviser that provides ongoing services to the registrant that were not pre-approved pursuant to paragraph (c)(7)(ii) of Rule 2-01 of Regulation S-X is compatible with maintaining the principal accountant’s independence. No such services were rendered. |
Item 5. Audit Committee of Listed Registrants
Not applicable.
Item 6. Schedule of Investments.
a) Not applicable. The complete schedule of investments is included in Item 1 of this Form N-CSR.
b) Not applicable.
Item 7. Disclosure of Proxy Voting Policies and Procedures for Closed-End Management Investment Companies.
Not applicable.
Item 8. Portfolio Managers of Closed-End Management Investment Companies.
Not applicable.
Item 9. Purchases of Equity Securities by Closed-End Management Investment Company and Affiliated Purchasers.
Not applicable.
Item 10. Submission of Matters to a Vote of Security Holders.
The Fund’s Governance Committee Provisions with Respect to Nominations of Directors/Trustees to the Respective Boards
None
Item 11. Controls and Procedures.
Based on their evaluation of the registrant’s disclosure controls and procedures (as defined in rule 30a-3(c) under the Investment Company Act of 1940 (17 CFR 270.30a-3(c)) as of 10/31/2013, the registrant’s principal executive officer and principal financial officer found the registrant’s disclosure controls and procedures to provide reasonable assurances that information required to be disclosed by the registrant in the reports that it files under the Securities Exchange Act of 1934 (a) is accumulated and communicated to registrant’s management, including its principal executive officer and principal financial officer, to allow timely decisions regarding required disclosure, and (b) is recorded, processed, summarized and reported, within the time periods specified in the rules and forms adopted by the U.S. Securities and Exchange Commission.
There have been no changes in the registrant’s internal controls over financial reporting that occurred during the registrant’s second fiscal quarter of the period covered by this report that have materially affected, or are reasonably likely to materially affect, the registrant’s internal control over financial reporting.
Item 12. Exhibits.
| (a) | (1) Exhibit attached hereto. |
(2) Exhibits attached hereto.
(3) Not applicable.
| (b) | Exhibit attached hereto. |
SIGNATURES
Pursuant to the requirements of the Securities Exchange Act of 1934 and the Investment Company Act of 1940, the registrant has duly caused this report to be signed on its behalf by the undersigned, thereunto duly authorized.
Oppenheimer Equity Income Fund
| By: | /s/ William F. Glavin, Jr. | |
| William F. Glavin, Jr. | ||
| Principal Executive Officer | ||
| Date: | 12/9/2013 | |
Pursuant to the requirements of the Securities Exchange Act of 1934 and the Investment Company Act of 1940, this report has been signed below by the following persons on behalf of the registrant and in the capacities and on the dates indicated.
| By: | /s/ William F. Glavin, Jr. | |
| William F. Glavin, Jr. | ||
| Principal Executive Officer | ||
| Date: | 12/9/2013 | |
| By: | /s/ Brian W. Wixted | |
| Brian W. Wixted | ||
| Principal Financial Officer | ||
| Date: | 12/9/2013 | |