UNITED STATES
SECURITIES AND EXCHANGE COMMISSION
Washington, D.C. 20549
FORM N-CSR
CERTIFIED SHAREHOLDER REPORT OF REGISTERED MANAGEMENT INVESTMENT COMPANIES
Investment Company Act file number: 811-04802
Name of Fund: BlackRock Strategic Municipal Opportunities Fund of BlackRock Municipal Series Trust
Fund Address: 100 Bellevue Parkway, Wilmington, DE 19809
Name and address of agent for service: John M. Perlowski, Chief Executive Officer, BlackRock Strategic Municipal Opportunities Fund of BlackRock Municipal Series Trust, 55 East 52nd Street, New York, NY 10055
Registrant’s telephone number, including area code: (800) 441-7762
Date of fiscal year end: 05/31/2014
Date of reporting period: 05/31/2014
Item 1 – Report to Stockholders
MAY 31, 2014
| | | | |
ANNUAL REPORT | | | |  |
BlackRock California Municipal Bond Fund | of BlackRock California Municipal Series Trust
BlackRock New Jersey Municipal Bond Fund | of BlackRock Multi-State Municipal Series Trust
BlackRock Pennsylvania Municipal Bond Fund | of BlackRock Multi-State Municipal Series Trust
BlackRock Strategic Municipal Opportunities Fund | of BlackRock Municipal Series Trust
|
| Not FDIC Insured • May Lose Value • No Bank Guarantee |
| | | | | | |
| | | | | | | |
| 2 | | ANNUAL REPORT | | MAY 31, 2014 | | |
Dear Shareholder,
Most asset classes performed well for the 12-month period ended May 31, 2014. The period began with financial markets reacting to a spate of interest rate volatility sparked by the Federal Reserve’s first mention of gradually reducing (or “tapering”) the central bank’s asset purchase programs earlier than originally expected. After a sharp sell-off, markets broadly rebounded in late June as the Fed’s tone turned more dovish. At the same time, improving economic indicators and better corporate earnings helped extend gains through most of the summer. Although the tone of economic and financial news became mixed last autumn, it was a surprisingly positive period for the markets. Early on, the Fed defied investors’ expectations with its decision to delay tapering, but higher volatility returned in late September when the U.S. Treasury Department warned that the national debt would soon breach its statutory maximum. The ensuing political brinksmanship led to a partial government shutdown, roiling global financial markets through the first half of October. Equities and other so-called “risk assets” managed to resume their rally when politicians finally engineered a compromise to reopen the government and extend the debt ceiling.
The remainder of 2013 was a generally positive period for stock markets in the developed world, although investors continued to grapple with uncertainty about when and how much the Fed would scale back on stimulus – a condition that caused fixed income investments to struggle. When the Fed ultimately announced its tapering plans in mid-December, markets reacted positively, as this action signaled the Fed’s perception of real improvement in the economy, and investors were finally released from the anxiety that had gripped them for quite some time.
The start of the new year brought a stark change in sentiment. Heightened volatility in emerging markets – driven by concerns about reduced global liquidity, severe currency weakness, high levels of debt and uneven growth – combined with mixed U.S. economic data caused global equities to weaken in January while bond markets found renewed strength from investors seeking relatively safer assets. Although these headwinds persisted, equities were back on the rise in February as investors were encouraged by a one-year extension of the U.S. debt ceiling and market-friendly comments from new Fed Chair Janet Yellen. While it was clear that U.S. economic data had softened, investors were assuaged by increasing evidence that this was a temporary trend resulting from an unusually harsh winter.
In the months that followed, signs of decelerating growth in China and geopolitical tensions in Russia and Ukraine made for a bumpy ride, but markets were resilient as investors focused on improving U.S. economic data, stronger corporate earnings and a still-dovish central bank. Within developed markets, investors shifted from growth to value stocks as the strong performance of growth stocks in 2013 had pushed valuations higher in many of these sectors. Broadly speaking, the strongest performers of 2013 struggled most in 2014 and vice versa. Emerging markets particularly benefited from this broad rotation into cheaper valuations. For investors in these markets, technical factors heartily outweighed the growing list of geopolitical issues. Emerging market equities ended the period with a strong rally through May even as a military coup was underway in Thailand. May was a strong month for most of the world’s equity and fixed income markets. U.S. large cap stocks touched record highs while volatility trended to unusually low levels. In fixed income, investor appetite for bonds persevered as interest rate volatility remained contained against a strong supply-and-demand backdrop.
On the whole, equity markets in the developed world posted robust gains for the 12-month period ended May 31. Emerging markets generated positive, but less dramatic returns due to increased volatility amid heightened risks for the asset class. In fixed income, higher quality sectors including U.S. Treasury bonds, tax-exempt municipals and investment grade corporate bonds, were challenged by interest rate uncertainty, but produced positive results for the 12-month period as the rate market calmed in 2014. High yield bonds delivered strong performance as they benefited from income-oriented investors’ ongoing search for yield in the overall low-rate environment. Short-term interest rates remained near zero, keeping yields on money market securities close to historic lows.
At BlackRock, we believe investors need to think globally, extend their scope across a broad array of asset classes and be prepared to move freely as market conditions change over time. We encourage you to talk with your financial advisor and visit www.blackrock.com for further insight about investing in today’s world.
Sincerely,

Rob Kapito
President, BlackRock Advisors, LLC

Financial markets moved higher over the period despite modest global growth and a shift toward tighter monetary policy in the United States.
Rob Kapito
President, BlackRock Advisors, LLC
| | | | | | | | |
| Total Returns as of May 31, 2014 | |
| | | 6-month | | | 12-month | |
U.S. large cap equities
(S&P 500® Index) | | | 7.63 | % | | | 20.45 | % |
U.S. small cap equities
(Russell 2000® Index) | | | (0.10 | ) | | | 16.79 | |
International equities
(MSCI Europe, Australasia,
Far East Index) | | | 5.33 | | | | 18.04 | |
Emerging market equities
(MSCI Emerging Markets
Index) | | | 1.89 | | | | 4.27 | |
3-month Treasury bill
(BofA Merrill Lynch
3-Month U.S. Treasury Bill Index) | | | 0.03 | | | | 0.06 | |
U.S. Treasury securities
(BofA Merrill Lynch
10-Year U.S. Treasury Index) | | | 4.32 | | | | 0.46 | |
U.S. investment grade
bonds (Barclays U.S.
Aggregate Bond Index) | | | 3.28 | | | | 2.71 | |
Tax-exempt municipal
bonds (S&P Municipal
Bond Index) | | | 5.86 | | | | 2.97 | |
U.S. high yield bonds
(Barclays U.S. Corporate
High Yield 2% Issuer
Capped Index) | | | 5.14 | | | | 7.88 | |
| Past performance is no guarantee of future results. Index performance is shown for illustrative purposes only. You cannot invest directly in an index. | |
| | | | | | |
| | | | | | | |
| | THIS PAGE NOT PART OF YOUR FUND REPORT | | | | 3 |
| | | | |
| Fund Summary as of May 31, 2014 | | BlackRock California Municipal Bond Fund |
BlackRock California Municipal Bond Fund’s (the “Fund”) investment objective is to provide shareholders with income exempt from Federal and California income taxes.
| | |
| Portfolio Management Commentary | | |
How did the Fund perform?
| Ÿ | | For the 12-month period ended May 31, 2014, the Fund underperformed its primary benchmark, the S&P® Municipal Bond Index, and its secondary benchmark, the S&P® California Municipal Bond Index. Effective as of January 1, 2014, the Fund’s secondary benchmark, the S&P® California Municipal Bond Index, includes only those California bonds in the S&P® Municipal Bond Index that have maturities greater than 5 years. The following discussion of relative performance pertains to the S&P® California Municipal Bond Index. |
What factors influenced performance?
| Ÿ | | The Fund’s longer duration posture (greater sensitivity to interest rate movements), relative to the benchmark index, detracted from performance as interest rates increased in the first half of the period. (Bond prices generally fall when interest rates rise.) Additionally, the Fund’s high quality bias had a negative impact on relative results. Although high quality credits performed positively, credit spreads tightened more dramatically in lower-rated credits, driving their outperformance during the period. Holding no exposure to Puerto Rico credits proved to be a disadvantage as these credits, despite their weak credit fundamentals, rebounded later in the period due to large inflows, because of investors seeking higher yields. The Fund’s use of U.S. Treasury futures contracts to manage interest rate risk had a slightly negative impact on performance. |
| Ÿ | | Contributing positively to performance was the high coupon structure of the Fund’s municipal bond holdings. |
| Ÿ | | The Fund maintained leverage in the form of tender option bonds, which helped to generate a higher level of income while short-term borrowing costs remained low. However, leverage on the Fund’s assets amplified the negative effect of rising interest rates on the Fund’s total return. |
Describe recent portfolio activity.
| Ÿ | | During the 12-month period, activity in the Fund was focused on managing volatility. More specifically, the Fund reduced its duration profile by concentrating purchases in shorter-maturity municipal bonds with higher coupons while selling lower-yielding, longer-duration holdings. The Fund also significantly reduced leverage over the period. |
Describe portfolio positioning at period end.
| Ÿ | | Relative to the S&P® California Municipal Bond Index, the Fund ended the period with an underweight duration posture and overweight exposure to school district and utility revenue bonds. Exposure to water and utility bonds was maximized within the Fund’s investment guidelines. The Fund maintained a bias for higher quality California issues as valuations on lower-rated bonds were less attractive after a period of spread tightening. The average coupon rate of the Fund’s municipal bond holdings stood at 5.45%. The Fund continued to hold exposure to tender option bonds in order to increase income while the municipal yield curve remained relatively steep and short-term interest rates remained low. In addition, the Fund continued to hold 10-year U.S. Treasury futures contracts to manage interest rate risk. |
The views expressed reflect the opinions of BlackRock as of the date of this report and are subject to change based on changes in market, economic or other conditions. These views are not intended to be a forecast of future events and are no guarantee of future results.
| | |
| Overview of the Fund’s Long-Term Investments | | |
| | | | |
| Sector Allocation | | | |
County/City/Special District/School District | | | 31 | % |
Utilities | | | 27 | |
Health | | | 17 | |
State | | | 11 | |
Transportation | | | 9 | |
Education | | | 5 | |
For Fund compliance purposes, the Fund’s sector classifications refer to any one or more of the sector sub-classifications used by one or more widely recognized market indexes or rating group indexes, and/or as defined by the investment advisor. These definitions may not apply for purposes of this report, which may combine such sector sub-classifications for reporting ease.
| | | | |
| Credit Quality Allocation1 | | | |
AAA/Aaa | | | 18 | % |
AA/Aa | | | 55 | |
A | | | 26 | |
BBB/Baa | | | 1 | |
| | 1 | | Credit quality ratings shown above reflect the highest rating assigned by either Standard & Poor’s (“S&P”) or Moody’s Investors Service (“Moody’s”). These rating agencies are independent, nationally recognized statistical rating organizations and are widely used. Investment grade ratings are credit ratings of BBB/Baa or higher. Below investment grade ratings are credit ratings of BB/Ba or lower. Investments designated N/R are not rated by either rating agency. Unrated investments do not necessarily indicate low credit quality. Credit quality ratings are subject to change. |
| | | | |
| Call/Maturity Schedule2 | | | |
Calendar Year Ended December 31, | | | | |
2014 | | | 2 | % |
2015 | | | 2 | |
2016 | | | 9 | |
2017 | | | 7 | |
2018 | | | 7 | |
| | 2 | | Scheduled maturity dates and/or bonds that are subject to potential calls by issuers over the next five years. |
| | | | | | |
| | | | | | | |
| 4 | | ANNUAL REPORT | | MAY 31, 2014 | | |
| | |
| | | BlackRock California Municipal Bond Fund |
|
| Total Return Based on a $10,000 Investment |
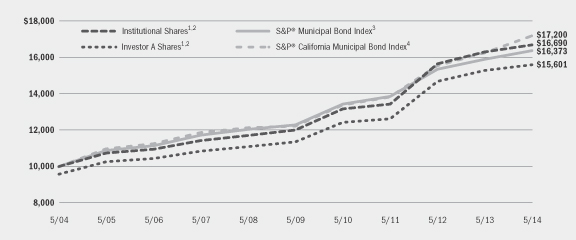
| | 1 | | Assuming maximum sales charges, if any, transaction costs and other operating expenses, including advisory fees. Institutional Shares do not have a sales charge. See “About Fund Performance” on page 13 for more information about the performance of Investor A Shares. |
| | 2 | | The Fund invests primarily in a portfolio of long-term investment grade California municipal bonds. |
| | 3 | | The S&P® Municipal Bond Index is composed of bonds held by managed municipal bond fund customers of Standard & Poor’s Securities Pricing, Inc. that are priced daily. Bonds in the S&P® Municipal Bond Index must have an outstanding par value of at least $2 million and a remaining maturity of not less than one month. |
| | 4 | | The S&P® California Municipal Bond Index includes all California bonds in the S&P® Municipal Bond Index. Effective as of January 1, 2014 the S&P® California Municipal Bond Index includes only those California bonds in the S&P® Municipal Bond Index that have maturities greater than 5 years. |
|
| Performance Summary for the Period Ended May 31, 2014 |
| | | | | | | | | | | | | | | | | | | | | | | | | | | | | | | | | | | | |
| | | | | | | | | | | | Average Annual Total Returns5 | |
| | | | | | | | | | | | 1 Year | | | 5 Years | | | 10 Years | |
| | | Standardized
30-Day Yields | | | Unsubsidized
30-Day Yields | | | 6-Month
Total Returns | | | w/o sales
charge | | | w/sales
charge | | | w/o sales
charge | | | w/sales
charge | | | w/o sales
charge | | | w/sales
charge | |
Institutional | | | 2.20 | % | | | 2.20 | % | | | 8.11 | % | | | 2.31 | % | | | N/A | | | | 6.81 | % | | | N/A | | | | 5.26 | % | | | N/A | |
Investor A | | | 1.92 | | | | 1.92 | | | | 8.02 | | | | 2.13 | | | | (2.21 | )% | | | 6.57 | | | | 5.65 | % | | | 5.00 | | | | 4.55 | % |
Investor A1 | | | 2.07 | | | | 2.07 | | | | 8.18 | | | | 2.36 | | | | (1.73 | ) | | | 6.75 | | | | 5.88 | | | | 5.18 | | | | 4.75 | |
Investor B | | | 1.76 | | | | 1.76 | | | | 7.86 | | | | 1.82 | | | | (2.08 | ) | | | 6.27 | | | | 5.95 | | | | 4.74 | | | | 4.74 | |
Investor C | | | 1.26 | | | | 1.26 | | | | 7.70 | | | | 1.44 | | | | 0.47 | | | | 5.79 | | | | 5.79 | | | | 4.24 | | | | 4.24 | |
Investor C1 | | | 1.67 | | | | 1.67 | | | | 7.92 | | | | 1.85 | | | | 0.88 | | | | 6.22 | | | | 6.22 | | | | 4.65 | | | | 4.65 | |
S&P® Municipal Bond Index | | | — | | | | — | | | | 5.86 | | | | 2.97 | | | | N/A | | | | 5.91 | | | | N/A | | | | 5.05 | | | | N/A | |
S&P® California Municipal
Bond Index | �� | | — | | | | — | | | | 8.23 | | | | 5.76 | | | | N/A | | | | 7.06 | | | | N/A | | | | 5.57 | | | | N/A | |
| | 5 | | Assuming maximum sales charges, if any. Average annual total returns with and without sales charges reflect reductions for distribution and service fees. See “About Fund Performance” on page 13 for a detailed description of share classes, including any related sales charges and fees. |
| | | | N/A — Not applicable as share class and index do not have a sales charge. |
| | | | Past performance is not indicative of future results. |
| | | | | | |
| | | | | | | |
| | ANNUAL REPORT | | MAY 31, 2014 | | 5 |
| | | | |
| Fund Summary as of May 31, 2014 | | BlackRock New Jersey Municipal Bond Fund |
BlackRock New Jersey Municipal Bond Fund’s (the “Fund”) investment objective is to provide shareholders with income exempt from Federal income tax and New Jersey personal income taxes.
|
| Portfolio Management Commentary |
How did the Fund perform?
| Ÿ | | For the 12-month period ended May 31, 2014, the Fund’s Investor A1 Shares performed in line with its primary benchmark, the S&P® Municipal Bond Index, while all other share classes underperformed the primary benchmark. The Fund underperformed its secondary benchmark, the S&P® New Jersey Municipal Bond Index. Effective as of January 1, 2014, the Fund’s secondary benchmark, the S&P® New Jersey Municipal Bond Index, includes only those New Jersey bonds in the S&P® Municipal Bond Index that have maturities greater than 5 years. The following discussion of relative performance pertains to the S&P® New Jersey Municipal Bond Index. |
What factors influenced performance?
| Ÿ | | The Fund’s longer duration posture (greater sensitivity to interest rate movements), relative to the benchmark index, detracted from performance as interest rates increased in the first half of the period. (Bond prices generally fall when interest rates rise.) Allocations to pre-refunded bonds and utilities, both lower-yielding sectors, were detrimental to relative performance. In the beginning of the period, the Fund’s exposure to Puerto Rico government-related credits, although limited, was a detractor from results as credit spreads on these bonds widened materially due to investors’ lack of confidence and a weak local economy. The Fund sold its exposure to these securities early in the period. The Fund’s zero-coupon holdings, which have longer durations for their respective maturities, also detracted. The Fund’s use of U.S. Treasury futures contracts to manage interest rate risk had a slightly negative impact on performance. |
| Ÿ | | Contributing positively to performance was the high coupon structure of the Fund’s municipal bond holdings. The Fund’s exposure to health care and transportation credits contributed positively to returns as these sectors were among the better performing during the period. An overweight to A and AA-rated credits also had a positive impact as these issues outperformed other investment grade quality tiers. Additionally, bonds purchased by the Fund after interest rates had increased over the first half of the period helped performance as interest rates fell during the latter half of the period against a positive supply-and-demand backdrop in the municipal market. New-issue purchases especially experienced strong market demand. |
| Ÿ | | The Fund maintained leverage in the form of tender option bonds, which helped to generate a higher level of income while short-term borrowing costs remained low. However, leverage on the Fund’s assets amplified the negative effect of rising interest rates on the Fund’s total return. |
Describe recent portfolio activity.
| Ÿ | | During the first half of the 12-month period, the Fund’s trading activity was focused on managing volatility. As interest rates began to fall in 2014, the Fund sought to capture relative value opportunities while reducing duration through the use of 10-year U.S. Treasury futures contracts. Throughout the period, the Fund participated in new-issue offerings as opportunities were presented in the market. Also during the period, the Fund sold the last of its Puerto Rico government-related holdings. |
Describe portfolio positioning at period end.
| Ÿ | | The Fund ended the period with a neutral duration bias as compared to the S&P® New Jersey Municipal Bond Index. |
The views expressed reflect the opinions of BlackRock as of the date of this report and are subject to change based on changes in market, economic or other conditions. These views are not intended to be a forecast of future events and are no guarantee of future results.
| | |
| Overview of the Fund’s Long-Term Investments | | |
| | | | |
| Sector Allocation | | | |
Transportation | | | 23 | % |
Health | | | 20 | |
Education | | | 17 | |
County/City/Special District/School District | | | 15 | |
State | | | 13 | |
Corporate | | | 5 | |
Housing | | | 4 | |
Utilities | | | 3 | |
For Fund compliance purposes, the Fund’s sector classifications refer to any one or more of the sector sub-classifications used by one or more widely recognized market indexes or rating group indexes, and/or as defined by the investment advisor. These definitions may not apply for purposes of this report, which may combine such sector sub-classifications for reporting ease.
| | | | |
| Credit Quality Allocation1 | | | |
AAA/Aaa | | | 6 | % |
AA/Aa | | | 37 | |
A | | | 36 | |
BBB/Baa | | | 10 | |
BB/Ba | | | 2 | |
B | | | 2 | |
N/R2 | | | 7 | |
| | 1 | | Credit quality ratings shown above reflect the highest rating assigned by either S&P or Moody’s. These rating agencies are independent, nationally recognized statistical rating organizations and are widely used. Investment grade ratings are credit ratings of BBB/Baa or higher. Below investment grade ratings are credit ratings of BB/Ba or lower. Investments designated N/R are not rated by either rating agency. Unrated investments do not necessarily indicate low credit quality. Credit quality ratings are subject to change. |
| | 2 | | The investment advisor evaluates the credit quality of unrated investments based upon certain factors including, but not limited to, credit ratings for similar investments and financial analysis of sectors and individual investments. Using this approach, the investment advisor has deemed certain of these unrated securities as investment grade quality. As of May 31, 2014, the market value of unrated securities deemed by the investment advisor to be investment grade was $12,252,328, representing 5% of the Fund’s long-term investments. |
| | | | |
| Call/Maturity Schedule3 | | | |
Calendar Year Ended December 31, | | | | |
2014 | | | 5 | % |
2015 | | | 5 | |
2016 | | | 3 | |
2017 | | | 10 | |
2018 | | | 9 | |
| | 3 | | Scheduled maturity dates and/or bonds that are subject to potential calls by issuers over the next five years. |
| | | | | | |
| | | | | | | |
| 6 | | ANNUAL REPORT | | MAY 31, 2014 | | |
| | |
| | | BlackRock New Jersey Municipal Bond Fund |
|
| Total Return Based on a $10,000 Investment |
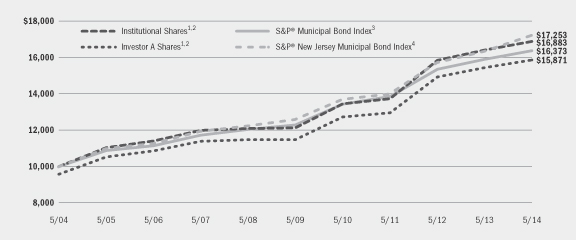
| | 1 | | Assuming maximum sales charges, if any, transaction costs and other operating expenses, including advisory fees. Institutional Shares do not have a sales charge. See “About Fund Performance” on page 13 for more information about the performance of Investor A Shares. |
| | 2 | | The Fund invests primarily in a portfolio of long-term investment grade New Jersey municipal bonds. |
| | 3 | | The S&P® Municipal Bond Index is composed of bonds held by managed municipal bond fund customers of Standard & Poor’s Securities Pricing, Inc. that are priced daily. Bonds in the S&P® Municipal Bond Index must have an outstanding par value of at least $2 million and a remaining maturity of not less than one month. |
| | 4 | | The S&P® New Jersey Municipal Bond Index includes all New Jersey bonds in the S&P® Municipal Bond Index. Effective as of January 1, 2014 the S&P® New Jersey Municipal Bond Index includes only those New Jersey bonds in the S&P® Municipal Bond Index that have maturities greater than 5 years. |
|
| Performance Summary for the Period Ended May 31, 2014 |
| | | | | | | | | | | | | | | | | | | | | | | | | | | | | | | | | | | | |
| | | | | | | | | | | | Average Annual Total Returns5 | |
| | | | | | | | | | | | 1 Year | | | 5 Years | | | 10 Years | |
| | | Standardized
30-Day Yields | | | Unsubsidized
30-Day Yields | | | 6-Month
Total Returns | | | w/o sales
charge | | | w/sales
charge | | | w/o sales
charge | | | w/sales
charge | | | w/o sales
charge | | | w/sales
charge | |
Institutional | | | 2.88 | % | | | 2.85 | % | | | 8.15 | % | | | 2.89 | % | | | N/A | | | | 6.85 | % | | | N/A | | | | 5.38 | % | | | N/A | |
Service | | | 2.72 | | | | 2.58 | | | | 8.08 | | | | 2.78 | | | | N/A | | | | 6.69 | | | | N/A | | | | 5.18 | | | | N/A | |
Investor A | | | 2.61 | | | | 2.51 | | | | 8.08 | | | | 2.78 | | | | (1.59 | )% | | | 6.69 | | | | 5.77 | % | | | 5.18 | | | | 4.73 | % |
Investor A1 | | | 2.76 | | | | 2.69 | | | | 8.16 | | | | 2.93 | | | | (1.19 | ) | | | 6.85 | | | | 5.98 | | | | 5.34 | | | | 4.91 | |
Investor C | | | 1.96 | | | | 1.91 | | | | 7.58 | | | | 1.99 | | | | 1.01 | | | | 5.88 | | | | 5.88 | | | | 4.38 | | | | 4.38 | |
Investor C1 | | | 2.37 | | | | 2.31 | | | | 7.89 | | | | 2.41 | | | | 1.42 | | | | 6.31 | | | | 6.31 | | | | 4.81 | | | | 4.81 | |
S&P® Municipal Bond Index | | | — | | | | — | | | | 5.86 | | | | 2.97 | | | | N/A | | | | 5.91 | | | | N/A | | | | 5.05 | | | | N/A | |
S&P® New Jersey Municipal
Bond Index | | | — | | | | — | | | | 8.13 | | | | 5.40 | | | | N/A | | | | 6.47 | | | | N/A | | | | 5.61 | | | | N/A | |
| | 5 | | Assuming maximum sales charges, if any. Average annual total returns with and without sales charges reflect reductions for distribution and service fees. See “About Fund Performance” on page 13 for a detailed description of share classes, including any related sales charges and fees. |
| | | | N/A — Not applicable as share class and index do not have a sales charge. |
| | | | Past performance is not indicative of future results. |
| | | | | | |
| | | | | | | |
| | ANNUAL REPORT | | MAY 31, 2014 | | 7 |
| | | | |
| Fund Summary as of May 31, 2014 | | BlackRock Pennsylvania Municipal Bond Fund |
BlackRock Pennsylvania Municipal Bond Fund’s (the “Fund”) investment objective is to provide shareholders with income exempt from Federal income tax and Pennsylvania personal income taxes.
|
| Portfolio Management Commentary |
How did the Fund perform?
| Ÿ | | For the 12-month period ended May 31, 2014, the Fund underperformed its primary benchmark, the S&P® Municipal Bond Index, and its secondary benchmark, the S&P® Pennsylvania Municipal Bond Index. Effective as of January 1, 2014, the Fund’s secondary benchmark, the S&P® Pennsylvania Municipal Bond Index, includes only those Pennsylvania bonds in the S&P® Municipal Bond Index that have maturities greater than 5 years. The following discussion of relative performance pertains to the S&P® Pennsylvania Municipal Bond Index. |
What factors influenced performance?
| Ÿ | | The Fund’s longer duration posture (greater sensitivity to interest rate movements), relative to the benchmark index, detracted from performance as interest rates increased in the first half of the period. (Bond prices generally fall when interest rates rise.) The Fund’s material shift in the middle of the period to a duration that was shorter than the benchmark index proved to be a disadvantage for relative performance as interest rates declined in the second half of the period. Additionally, the Fund’s modest exposure to Puerto Rico government-related credits in the earlier part of the period detracted from results as credit spreads on these bonds widened materially due to investors’ lack of confidence and a weak local economy. The Fund sold its exposure to these securities early in the period. The Fund’s use of U.S. Treasury futures contracts to manage interest rate risk also had a negative impact on performance. |
| Ÿ | | Conversely, the Fund’s long yield curve positioning had a positive impact on performance as shorter rates (two to ten years) increased more than longer rates (twenty years and longer). The Fund’s exposure to health care, housing and education credits also contributed positively to returns as these sectors were among the better performing during the period. Additionally, the Fund benefited from the high coupon structure of its municipal bond holdings. |
| Ÿ | | The Fund maintained leverage in the form of tender option bonds, which helped to generate a higher level of income while short-term borrowing costs remained low. However, leverage on the Fund’s assets amplified the negative effect of rising interest rates on the Fund’s total return. |
Describe recent portfolio activity.
| Ÿ | | During the 12-month period, trading activity was focused on maintaining the Fund’s high level of income. Cash was committed to purchasing bonds that presented attractive income opportunities with compelling valuations relative to their level of credit risk. As mentioned above, the Fund eliminated its exposure to Puerto Rico securities. The Fund significantly reduced duration during the period through the use of 10-year U.S. Treasury futures contracts. |
Describe portfolio positioning at period end.
| Ÿ | | Relative to the S&P® Pennsylvania Municipal Bond Index, the Fund ended the period with a shorter duration posture and underweight exposure to the tax-backed sector, while maintaining overweight exposures to education, housing and health care credits. |
The views expressed reflect the opinions of BlackRock as of the date of this report and are subject to change based on changes in market, economic or other conditions. These views are not intended to be a forecast of future events and are no guarantee of future results.
| | |
| Overview of the Fund’s Long-Term Investments | | |
| | | | |
| Sector Allocation | | | |
Education | | | 25 | % |
Health | | | 22 | |
State | | | 12 | |
Transportation | | | 12 | |
County/City/Special District/School District | | | 11 | |
Housing | | | 8 | |
Corporate | | | 6 | |
Utilities | | | 4 | |
For Fund compliance purposes, the Fund’s sector classifications refer to any one or more of the sector sub-classifications used by one or more widely recognized market indexes or rating group indexes, and/or as defined by the investment advisor. These definitions may not apply for purposes of this report, which may combine such sector sub-classifications for reporting ease.
| | | | |
| Call/Maturity Schedule3 | | | |
Calendar Year Ended December 31, | | | | |
2014 | | | 2 | % |
2015 | | | 7 | |
2016 | | | 4 | |
2017 | | | 6 | |
2018 | | | 10 | |
| | 3 | | Scheduled maturity dates and/or bonds that are subject to potential calls by issuers over the next five years. |
| | | | |
| Credit Quality Allocation1 | | | |
AAA/Aaa | | | 2 | % |
AA/Aa | | | 66 | |
A | | | 21 | |
BBB/Baa | | | 8 | |
N/R2 | | | 3 | |
| | 1 | | Credit quality ratings shown above reflect the highest rating assigned by either S&P or Moody’s. These rating agencies are independent, nationally recognized statistical rating organizations and are widely used. Investment grade ratings are credit ratings of BBB/Baa or higher. Below investment grade ratings are credit ratings of BB/Ba or lower. Investments designated N/R are not rated by either rating agency. Unrated investments do not necessarily indicate low credit quality. Credit quality ratings are subject to change. |
| | 2 | | The investment advisor evaluates the credit quality of unrated investments based upon certain factors including, but not limited to, credit ratings for similar investments and financial analysis of sectors and individual investments. Using this approach, the investment advisor has deemed certain of these unrated securities as investment grade quality. As of May 31, 2014, the market value of unrated securities deemed by the investment advisor to be investment grade was $3,260,370, representing 1% of the Fund’s long-term investments. |
| | | | | | |
| | | | | | | |
| 8 | | ANNUAL REPORT | | MAY 31, 2014 | | |
| | |
| | | BlackRock Pennsylvania Municipal Bond Fund |
|
| Total Return Based on a $10,000 Investment |
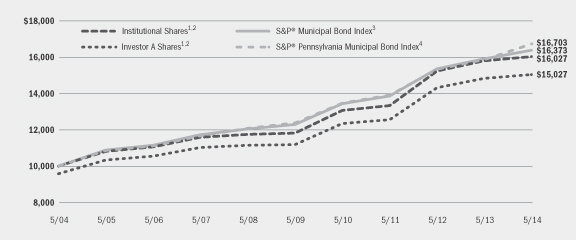
| | 1 | | Assuming maximum sales charges, if any, transaction costs and other operating expenses, including advisory fees. Institutional Shares do not have a sales charge. See “About Fund Performance” on page 13 for more information about the performance of Investor A Shares. |
| | 2 | | The Fund invests primarily in a portfolio of long-term investment grade Pennsylvania municipal bonds. |
| | 3 | | The S&P® Municipal Bond Index is composed of bonds held by managed municipal bond fund customers of Standard & Poor’s Securities Pricing, Inc. that are priced daily. Bonds in the S&P® Municipal Bond Index must have an outstanding par value of at least $2 million and a remaining maturity of not less than one month. |
| | 4 | | The S&P® Pennsylvania Municipal Bond Index includes all Pennsylvania bonds in the S&P® Municipal Bond Index. Effective as of January 1, 2014 the S&P® Pennsylvania Municipal Bond Index includes only those Pennsylvania bonds in the S&P® Municipal Bond Index that have maturities greater than 5 years. |
|
| Performance Summary for the Period Ended May 31, 2014 |
| | | | | | | | | | | | | | | | | | | | | | | | | | | | | | | | | | | | |
| | | | | | | | | | | | Average Annual Total Returns5 | |
| | | | | | | | | | | | 1 Year | | | 5 Years | | | 10 Years | |
| | | Standardized
30-Day Yields | | | Unsubsidized
30-Day Yields | | | 6-Month
Total Returns | | | w/o sales
charge | | | w/sales
charge | | | w/o sales
charge | | | w/sales
charge | | | w/o sales
charge | | | w/sales
charge | |
Institutional | | | 3.06 | % | | | 3.06 | % | | | 7.58 | % | | | 1.50 | % | | | N/A | | | | 6.30 | % | | | N/A | | | | 4.83 | % | | | N/A | |
Service | | | 2.85 | | | | 2.79 | | | | 7.58 | | | | 1.41 | | | | N/A | | | | 6.12 | | | | N/A | | | | 4.62 | | | | N/A | |
Investor A | | | 2.72 | | | | 2.68 | | | | 7.57 | | | | 1.41 | | | | (2.90 | )% | | | 6.11 | | | | 5.19 | % | | | 4.61 | | | | 4.16 | % |
Investor A1 | | | 2.88 | | | | 2.86 | | | | 7.66 | | | | 1.57 | | | | (2.49 | ) | | | 6.28 | | | | 5.42 | | | | 4.77 | | | | 4.35 | |
Investor C | | | 2.10 | | | | 2.10 | | | | 7.06 | | | | 0.53 | | | | (0.44 | ) | | | 5.26 | | | | 5.26 | | | | 3.81 | | | | 3.81 | |
Investor C1 | | | 2.48 | | | | 2.48 | | | | 7.28 | | | | 0.95 | | | | (0.03 | ) | | | 5.71 | | | | 5.71 | | | | 4.23 | | | | 4.23 | |
S&P® Municipal Bond Index | | | — | | | | — | | | | 5.86 | | | | 2.97 | | | | N/A | | | | 5.91 | | | | N/A | | | | 5.05 | | | | N/A | |
S&P® Pennsylvania Municipal
Bond Index | | | — | | | | — | | | | 7.75 | | | | 5.37 | | | | N/A | | | | 6.20 | | | | N/A | | | | 5.26 | | | | N/A | |
| | 5 | | Assuming maximum sales charges, if any. Average annual total returns with and without sales charges reflect reductions for distribution and service fees. See “About Fund Performance” on page 13 for a description of share classes, including any related sales charges and fees. |
| | | | N/A — Not applicable as share class and index do not have a sales charge. |
| | | | Past performance is not indicative of future results. |
| | | | | | |
| | | | | | | |
| | ANNUAL REPORT | | MAY 31, 2014 | | 9 |
| | | | |
| Fund Summary as of May 31, 2014 | | BlackRock Strategic Municipal Opportunities Fund |
BlackRock Strategic Municipal Opportunities Fund’s (the “Fund”) (formerly known as BlackRock Intermediate Municipal Fund) investment objective is to provide shareholders with a high level of income exempt from Federal income taxes.
|
| Portfolio Management Commentary |
| Ÿ | | On January 27, 2014, the Fund changed its name from BlackRock Intermediate Municipal Bond Fund to BlackRock Strategic Municipal Opportunities Fund and made changes to its investment strategies. Under the new investment strategies, the Fund continues to seek to achieve its investment objective by investing, under normal circumstances, at least 80% of its assets in municipal bonds. However, the new investment strategies provide greater flexibility with respect to the maturity of the issues in which the Fund invests. In addition, the Fund’s secondary benchmark changed from the S&P® Intermediate Municipal Bond Index to a custom blended benchmark comprised of 65% S&P® Municipal Bond Investment Grade Index, 30% S&P® Municipal Bond High Yield Index and 5% Barclays Taxable Municipal: U.S. Aggregate Eligible Index. |
How did the Fund perform?
| Ÿ | | For the 12-month period ended May 31, 2014, the Fund’s Institutional, Investor A and Investor A1 Shares outperformed the primary benchmark, the S&P® Municipal Bond Index, while the Investor C Shares underperformed the primary benchmark. For the period June 1, 2013 through January 26, 2014, under the BlackRock Intermediate Municipal Bond Fund strategy, the Fund underperformed the former secondary benchmark, the S&P® Intermediate Municipal Bond Index. For the period following the strategy change, under the BlackRock Strategic Municipal Opportunities Fund strategy, the Fund underperformed its new custom blended secondary benchmark. The following discussion of relative performance regarding the BlackRock Intermediate Municipal Bond Fund strategy pertains to the S&P® Intermediate Municipal Bond Index, while the discussion of relative performance regarding the BlackRock Strategic Municipal Opportunities Fund strategy pertains to the custom blended benchmark. |
What factors influenced performance?
| Ÿ | | During the period June 1, 2013 through January 27, 2014, the Fund was heavily weighted in longer-dated issues in the “belly” of the yield curve (i.e., five to seven-year maturities), within its intermediate maturity mandate. This positioning proved detrimental as these issues significantly underperformed other maturities during the period. The Fund’s longer duration (greater sensitivity to interest rate movements) relative to the S&P® Intermediate Municipal Bond Index hurt performance as interest rates increased. (Bond prices generally fall as interest rates rise.) The Fund’s higher yielding investment-grade (BBB-rated) holdings had a negative impact on returns as credit spreads widened in this segment. The Fund’s zero-coupon holdings, which have longer durations for their respective maturities, also negatively impacted performance. Additionally, the Fund was slightly overweight in tobacco, which was the weakest performing sector for the period. Conversely, the high coupon structure of the Fund’s municipal bond holdings had a positive impact on performance. Small exposures to pre-refunded and very short duration bonds added to results. |
| Ÿ | | The Fund used 10-year U.S. Treasury futures contracts to manage interest rate risk under both the old and new strategies, albeit to a greater extent in the new strategy. While these positions contributed positively to the performance of BlackRock Intermediate Municipal Fund strategy as interest rates increased in the earlier part of the 12-month reporting period, the futures contracts had a negative impact on the performance of the BlackRock Strategic Municipal Opportunities Fund as interest rates declined in the later months of the period. |
| Ÿ | | For the four-month period following the strategy change, the Fund’s positioning in U.S. Treasury futures contracts detracted from performance. Conversely, yield curve positioning boosted returns as the Fund held an overweight to longer-term bonds (maturities of 20 years and longer), which performed well as the yield curve flattened during this time period. The Fund’s larger allocations to health care, transportation and education had a positive impact on performance, as did security selection within these sectors. |
Describe recent portfolio activity.
| Ÿ | | In connection with the transition from a strategy focused on the intermediate portion of the yield curve to a broader municipal mandate in late January, the Fund sold the majority of its holdings in the intermediate portion of the yield curve and repositioned to achieve exposures elsewhere on the yield curve with concentrations on the short and long ends of the curve. The Fund also added to its below-investment grade holdings. In order to actively manage interest rate risk for the Fund’s more flexible investment approach, the Fund implemented a meaningfully larger position in U.S. Treasury futures contracts to protect against a rise in interest rates. |
Describe portfolio positioning at period end.
| Ÿ | | The Fund ended the period with a shorter duration posture as compared to the custom blended benchmark. The Fund was positioned with overweight exposures to both the short and long ends of the yield curve in order to benefit from rising yields and a flattening yield curve. The Fund maintained a preference for revenue bonds in the health care, utilities and transportation sectors. From a credit perspective, the Fund held concentrations in higher quality investment grade bonds as well as lower quality below-investment grade bonds. |
The views expressed reflect the opinions of BlackRock as of the date of this report and are subject to change based on changes in market, economic or other conditions. These views are not intended to be a forecast of future events and are no guarantee of future results.
| | | | | | |
| | | | | | | |
| 10 | | ANNUAL REPORT | | MAY 31, 2014 | | |
| | |
| | | BlackRock Strategic Municipal Opportunities Fund |
| | |
| Overview of the Fund’s Long-Term Investments | | |
| | | | |
| Sector Allocation | | | |
State | | | 25 | % |
Transportation | | | 14 | |
Utilities | | | 13 | |
Education | | | 13 | |
Health | | | 13 | |
County/City/Special District/School District | | | 12 | |
Corporate | | | 5 | |
Tobacco | | | 4 | |
Investment Companies | | | 1 | |
For Fund compliance purposes, the Fund’s sector classifications refer to any one or more of the sector sub-classifications used by one or more widely recognized market indexes or rating group indexes, and/or as defined by the investment advisor. These definitions may not apply for purposes of this report, which may combine such sector sub-classifications for reporting ease.
| | | | |
| Credit Quality Allocation1 | | | |
AAA/Aaa | | | 23 | % |
AA/Aa | | | 38 | |
A | | | 20 | |
BBB/Baa | | | 4 | |
BB/Ba | | | 5 | |
B | | | 4 | |
N/R2 | | | 6 | |
| | 1 | | Credit quality ratings shown above reflect the highest rating assigned by either S&P or Moody’s. These rating agencies are independent, nationally recognized statistical rating organizations and are widely used. Investment grade ratings are credit ratings of BBB/Baa or higher. Below investment grade ratings are credit ratings of BB/Ba or lower. Investments designated N/R are not rated by either rating agency. Unrated investments do not necessarily indicate low credit quality. Credit quality ratings are subject to change. |
| | 2 | | The investment advisor evaluates the credit quality of unrated investments based upon certain factors including, but not limited to, credit ratings for similar investments and financial analysis of sectors and individual investments. Using this approach, the investment advisor has deemed certain of these unrated securities as investment grade quality. As of May 31, 2014, the market value of unrated securities deemed by the investment advisor to be investment grade was $8,638,219, representing less than 1% of the Fund’s long-term investments. |
| | | | |
| Call/Maturity Schedule3 | | | |
Calendar Year Ended December 31, | | | | |
2014 | | | 2 | % |
2015 | | | 5 | |
2016 | | | 15 | |
2017 | | | 6 | |
2018 | | | 2 | |
| | 3 | | Scheduled maturity dates and/or bonds that are subject to potential calls by issuers over the next five years. |
| | | | | | |
| | | | | | | |
| | ANNUAL REPORT | | MAY 31, 2014 | | 11 |
| | | | |
| | | BlackRock Strategic Municipal Opportunities Fund |
|
| Total Return Based on a $10,000 Investment |
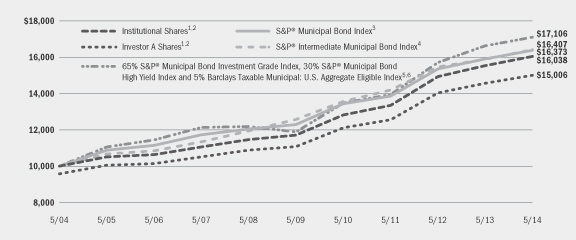
| | 1 | | Assuming maximum sales charges, if any, transaction costs and other operating expenses, including advisory fees. Institutional Shares do not have a sales charge. See “About Fund Performance” on page 13 for more information about the performance of Investor A Shares. |
| | 2 | | Under normal circumstances the Fund invests at least 80% of its assets in municipal bonds. |
| | 3 | | The S&P® Municipal Bond Index is composed of bonds held by managed municipal bond fund customers of Standard & Poor’s Securities Pricing, Inc. that are priced daily. Bonds in the S&P® Municipal Bond Index must have an outstanding par value of at least $2 million and a remaining maturity of not less than one month. |
| | 4 | | The S&P® Intermediate Municipal Bond Index includes all bonds in the S&P® Municipal Bond Index with a remaining maturity between 3 and 15 years. |
| | 5 | | Effective January 27, 2014, the Fund replaced the S&P Intermediate Municipal Bond Index, a benchmark against which it measured performance, with a custom weighted index comprised of the returns of the S&P Municipal Bond Investment Grade Index (65%), the S&P Municipal Bond High Yield Index (30%), and the Barclays Taxable Municipal: U.S. Aggregate Eligible Index (5%). Investment advisor believes the customized weighted index more accurately reflects the investment strategies of the Fund. |
| | 6 | | See “About Fund Performance” on page 13 for descriptions of the indexes. |
|
| Performance Summary for the Period Ended May 31, 2014 |
| | | | | | | | | | | | | | | | | | | | | | | | | | | | | | | | | | | | |
| | | | | | | | | | | | Average Annual Total Returns7 | |
| | | | | | | | | | | | 1 Year | | | 5 Years | | | 10 Years | |
| | | Standardized
30-Day Yields | | | Unsubsidized
30-Day Yields | | | 6-Month
Total Returns | | | w/o sales
charge | | | w/sales
charge | | | w/o sales
charge | | | w/sales
charge | | | w/o sales
charge | | | w/sales
charge | |
Institutional | | | 2.70 | % | | | 2.64 | % | | | 6.19 | % | | | 3.28 | % | | | N/A | | | | 6.50 | % | | | N/A | | | | 4.84 | % | | | N/A | |
Investor A | | | 2.37 | | | | 2.31 | | | | 6.17 | | | | 3.04 | | | | (1.34 | )% | | | 6.26 | | | | 5.34 | % | | | 4.59 | | | | 4.14 | % |
Investor A1 | | | 2.60 | | | | 2.55 | | | | 6.15 | | | | 3.19 | | | | 2.16 | | | | 6.39 | | | | 6.18 | | | | 4.74 | | | | 4.64 | |
Investor C | | | 1.73 | | | | 1.67 | | | | 5.68 | | | | 2.26 | | | | 1.27 | | | | 5.44 | | | | 5.44 | | | | 3.81 | | | | 3.81 | |
S&P® Municipal Bond Index | | | — | | | | — | | | | 5.86 | | | | 2.97 | | | | N/A | | | | 5.91 | | | | N/A | | | | 5.05 | | | | N/A | |
S&P® Intermediate Municipal
Bond Index | | | — | | | | — | | | | 4.45 | | | | 3.36 | | | | N/A | | | | 5.47 | | | | N/A | | | | 5.08 | | | | N/A | |
S&P Municipal Bond Investment Grade Index | | | — | | | | — | | | | 5.59 | | | | 3.00 | | | | N/A | | | | 5.64 | | | | N/A | | | | 5.00 | | | | N/A | |
S&P Municipal Bond High Yield Index | | | — | | | | — | | | | 9.75 | | | | 2.11 | | | | N/A | | | | 11.25 | | | | N/A | | | | 6.17 | | | | N/A | |
Barclays Taxable Municipal: U.S. Aggregate
Eligible Index | | | — | | | | — | | | | 10.89 | | | | 5.21 | | | | N/A | | | | 10.25 | | | | N/A | | | | 7.31 | | | | N/A | |
65% S&P® Municipal Bond Investment Grade Index, 30% S&P® Municipal Bond High Yield Index and 5% Barclays Taxable Municipal U.S. Aggregate Eligible Index | | | — | | | | — | | | | 7.09 | | | | 2.87 | | | | N/A | | | | 7.55 | | | | N/A | | | | 5.51 | | | | N/A | |
| | 7 | | Assuming maximum sales charges, if any. Average annual total returns with and without sales charges reflect reductions for distribution and service fees. See “About Fund Performance” on page 13 for a description of share classes, including any related sales charges and fees. |
| | | | N/A — Not applicable as share class and index do not have a sales charge. |
| | | | Past performance is not indicative of future results. |
| | | | | | |
| | | | | | | |
| 12 | | ANNUAL REPORT | | MAY 31, 2014 | | |
| Ÿ | | Institutional Shares are not subject to any sales charge. These shares bear no ongoing distribution or service fees and are available only to eligible investors. |
| Ÿ | | Service Shares (available only in BlackRock New Jersey Municipal Bond Fund and BlackRock Pennsylvania Municipal Bond Fund) are not subject to any sales charge. These shares are subject to a service fee of 0.25% per year (but no distribution fee) and are available only to eligible investors. Prior to the Service Shares inception date of October 2, 2006, Service Share performance results are those of Institutional Shares (which have no distribution or service fees) restated to reflect Service Share fees. |
| Ÿ | | Investor A Shares are subject to a maximum initial sales charge (front-end load) of 4.25% and a service fee of 0.25% per year (but no distribution fee). Certain redemptions of these shares may be subject to a contingent deferred sales charge (“CDSC”) where no initial sales charge was paid at the time of purchase. Prior to the Investor A Shares inception date of October 2, 2006, Investor A Share performance results are those of Institutional Shares (which have no distribution or service fees) restated to reflect Investor A Share fees. |
| Ÿ | | Investor A1 Shares (for all Funds except BlackRock Strategic Municipal Opportunities Fund) are subject to a maximum initial sales charge (front-end load) of 4.00% and a service fee of 0.10% per year (but no distribution fee). Investor A1 Shares for BlackRock Strategic Municipal Opportunities Fund incur a maximum initial sales charge (front-end load) of 1.00% and a service fee of 0.10% per year (but no distribution fee). Certain redemptions of these shares may be subject to a CDSC where no initial sales charge was paid at the time of purchase. |
| Ÿ | | Investor B Shares (available only in BlackRock California Municipal Bond Fund) are subject to a maximum CDSC of 4.00% declining to 0% after six years. In addition, these shares are subject to a distribution fee of 0.25% and a service fee of 0.25% per year. |
These shares automatically convert to Investor A1 Shares after approximately 10 years. (There is no initial sales charge for automatic share conversions.) On June 10, 2013, all issued and outstanding Investor B Shares of BlackRock New Jersey Municipal Bond Fund and BlackRock Pennsylvania Municipal Bond Fund were converted into Investor A Shares with the same relative aggregate net asset value and all issued and outstanding Investor B Shares of BlackRock Strategic Municipal Opportunities Fund were converted into Investor A1 Shares with the same relative aggregate net asset value.
| Ÿ | | Investor C Shares are subject to a 1.00% CDSC if redeemed within one year of purchase. In addition, these shares are subject to a distribution fee of 0.75% per year and a service fee of 0.25% per year. Prior to the Investor C Shares inception date of October 2, 2006, Investor C Share performance results are those of Institutional Shares (which have no distribution or service fees) restated to reflect Investor C Share fees. |
| Ÿ | | Investor C1 Shares (available in all Funds except BlackRock Strategic Municipal Opportunities Fund) are subject to a 1.00% CDSC if redeemed within one year of purchase. In addition, these shares are subject to a distribution fee of 0.35% per year and a service fee of 0.25% per year. |
Investor A1, Investor B and Investor C1 Shares are only available through exchanges and dividend reinvestments by existing shareholders and for purchase by certain employer-sponsored retirement plans.
On June 10, 2013, all issued and outstanding Investor B1 Shares of BlackRock New Jersey Municipal Bond Fund and BlackRock Pennsylvania Municipal Bond Fund were converted into Investor A1 Shares with the same relative aggregate net asset value.
Performance information reflects past performance and does not guarantee future results. Current performance may be lower or higher than the performance data quoted. Refer to www.blackrock.com/funds to obtain performance data current to the most recent month end. Performance results do not reflect the deduction of taxes that a shareholder would pay on fund distributions or the redemption of fund shares. Figures shown in each of the performance tables on the previous pages assume reinvestment of all dividends and capital gain distributions, if any, at net asset value (“NAV”) on the payable date. Investment return and principal value of shares will fluctuate so that shares, when redeemed, may be worth more or less than their original costs. Dividends paid to each class of shares will vary because of the different levels of service, distribution and transfer agency fees applicable to each class, which are deducted from the income available to be paid to shareholders. The Funds’ investment advisor waived and/or reimbursed a portion of each Fund’s expenses. Without such waiver and/or reimbursement, the Funds’ performance would have been lower. The standardized 30-day yield includes the effects of any waivers and/or reimbursements. The unsubsidized 30-day yield excludes the effects of any waivers and/or reimbursements.
S&P® Municipal Bond Investment Grade Index consists of bonds in the S&P Municipal Bond Index that are rated investment grade by Standard & Poor’s, Moody’s and/or Fitch.
S&P® Municipal Bond High Yield Index consists of bonds in the S&P Municipal Bond Index that are not rated or are rated below investment grade.
Barclays Taxable Municipal: U.S. Aggregate Eligible Index is a rules-based, market-value weighted index engineered for the long-term taxable bond market. To be included in the index, the bonds must meet the eligibility requirements of the U.S. Aggregate Index. Bonds must be rated investment-grade (Baa3/BBB- or higher) by at least two of the following ratings agencies if all three rate the bond: Moody’s, S&P, Fitch. If only two of the three agencies rate the security, the lower rating is used to determine index eligibility. If only one of the three agencies rates a security, the rating must be investment-grade. They must have an outstanding par value of at least $7 million and be issued as part of a transaction of at least $75 million. The bonds must be fixed rate and must be at least one year from their maturity date. Remarketed issues (unless converted to fixed rate), bonds with floating rates, and derivatives, are excluded from the benchmark.
| | | | | | |
| | | | | | | |
| | ANNUAL REPORT | | MAY 31, 2014 | | 13 |
Shareholders of these Funds may incur the following charges: (a) transactional expenses, such as sales charges; and (b) operating expenses, including investment advisory fees, service and distribution fees, including 12b-1 fees, and other Fund expenses. The expense examples shown below (which are based on a hypothetical investment of $1,000 invested on December 1, 2013 and held through May 31, 2014) are intended to assist shareholders both in calculating expenses based on an investment in the Funds and in comparing these expenses with similar costs of investing in other mutual funds.
The expense examples provide information about actual account values and actual expenses. In order to estimate the expenses a shareholder paid during the period covered by this report, shareholders can divide their account value by $1,000 and then multiply the result by the number corresponding to their Fund and share class under the heading entitled “Expenses Paid During the Period.”
The expense examples also provide information about hypothetical account values and hypothetical expenses based on a Fund’s actual expense ratio and an assumed rate of return of 5% per year before expenses. In order to assist shareholders in comparing the ongoing expenses of investing in these Funds and other funds, compare the 5% hypothetical examples with the 5% hypothetical examples that appear in other funds’ shareholder reports.
The expenses shown in the expense examples are intended to highlight shareholders’ ongoing costs only and do not reflect any transactional expenses, such as sales charges, if any. Therefore, the hypothetical examples are useful in comparing ongoing expenses only, and will not help shareholders determine the relative total expenses of owning different funds. If these transactional expenses were included, shareholder expenses would have been higher.
| | | | | | | | | | | | | | | | | | | | | | | | | | | | |
| | | Actual | | | Hypothetical2 | | | | |
BlackRock California Municipal Bond Fund
(Including Interest Expense and Fees) | | Beginning
Account Value
December 1, 2013 | | | Ending
Account Value
May 31, 2014 | | | Expenses Paid
During the Period1 | | | Beginning
Account Value
December 1, 2013 | | | Ending
Account Value
May 31, 2014 | | | Expenses Paid
During the Period1 | | | Annualized
Expense
Ratio | |
Institutional | | $ | 1,000.00 | | | $ | 1,081.10 | | | $ | 4.10 | | | $ | 1,000.00 | | | $ | 1,021.03 | | | $ | 3.98 | | | | 0.79 | % |
Investor A | | $ | 1,000.00 | | | $ | 1,080.20 | | | $ | 5.03 | | | $ | 1,000.00 | | | $ | 1,020.03 | | | $ | 4.89 | | | | 0.97 | % |
Investor A1 | | $ | 1,000.00 | | | $ | 1,081.80 | | | $ | 4.26 | | | $ | 1,000.00 | | | $ | 1,020.83 | | | $ | 4.13 | | | | 0.82 | % |
Investor B | | $ | 1,001.00 | | | $ | 1,078.60 | | | $ | 6.53 | | | $ | 1,001.00 | | | $ | 1,018.63 | | | $ | 6.34 | | | | 1.26 | % |
Investor C | | $ | 1,000.00 | | | $ | 1,077.00 | | | $ | 8.96 | | | $ | 1,000.00 | | | $ | 1,016.33 | | | $ | 8.70 | | | | 1.73 | % |
Investor C1 | | $ | 1,000.00 | | | $ | 1,079.20 | | | $ | 6.89 | | | $ | 1,000.00 | | | $ | 1,018.33 | | | $ | 6.69 | | | | 1.33 | % |
BlackRock California Municipal Bond Fund
(Excluding Interest Expense and Fees) | | | | | | | | | | | | | | | | | | | | | |
Institutional | | $ | 1,000.00 | | | $ | 1,081.10 | | | $ | 3.74 | | | $ | 1,000.00 | | | $ | 1,021.33 | | | $ | 3.63 | | | | 0.72 | % |
Investor A | | $ | 1,000.00 | | | $ | 1,080.20 | | | $ | 4.67 | | | $ | 1,000.00 | | | $ | 1,020.43 | | | $ | 4.53 | | | | 0.90 | % |
Investor A1 | | $ | 1,000.00 | | | $ | 1,081.80 | | | $ | 3.89 | | | $ | 1,000.00 | | | $ | 1,021.13 | | | $ | 3.78 | | | | 0.75 | % |
Investor B | | $ | 1,001.00 | | | $ | 1,078.60 | | | $ | 6.17 | | | $ | 1,001.00 | | | $ | 1,019.03 | | | $ | 5.99 | | | | 1.19 | % |
Investor C | | $ | 1,000.00 | | | $ | 1,077.00 | | | $ | 8.60 | | | $ | 1,000.00 | | | $ | 1,016.63 | | | $ | 8.35 | | | | 1.66 | % |
Investor C1 | | $ | 1,000.00 | | | $ | 1,079.20 | | | $ | 6.53 | | | $ | 1,000.00 | | | $ | 1,018.63 | | | $ | 6.34 | | | | 1.26 | % |
BlackRock New Jersey Municipal Bond Fund
(Including Interest Expense and Fees) | | | | | | | | | | | | | | | | | | | | | |
Institutional | | $ | 1,000.00 | | | $ | 1,081.50 | | | $ | 4.00 | | | $ | 1,000.00 | | | $ | 1,021.13 | | | $ | 3.88 | | | | 0.77 | % |
Service | | $ | 1,000.00 | | | $ | 1,080.80 | | | $ | 4.67 | | | $ | 1,000.00 | | | $ | 1,020.43 | | | $ | 4.53 | | | | 0.90 | % |
Investor A | | $ | 1,000.00 | | | $ | 1,080.80 | | | $ | 4.67 | | | $ | 1,000.00 | | | $ | 1,020.43 | | | $ | 4.53 | | | | 0.90 | % |
Investor A1 | | $ | 1,000.00 | | | $ | 1,081.60 | | | $ | 3.89 | | | $ | 1,000.00 | | | $ | 1,021.23 | | | $ | 3.78 | | | | 0.75 | % |
Investor C | | $ | 1,000.00 | | | $ | 1,075.80 | | | $ | 8.64 | | | $ | 1,000.00 | | | $ | 1,016.63 | | | $ | 8.40 | | | | 1.67 | % |
Investor C1 | | $ | 1,000.00 | | | $ | 1,078.90 | | | $ | 6.53 | | | $ | 1,000.00 | | | $ | 1,018.63 | | | $ | 6.34 | | | | 1.26 | % |
BlackRock New Jersey Municipal Bond Fund
(Excluding Interest Expense and Fees) | | | | | | | | | | | | | | | | | | | | | |
Institutional | | $ | 1,000.00 | | | $ | 1,081.50 | | | $ | 3.84 | | | $ | 1,000.00 | | | $ | 1,021.23 | | | $ | 3.73 | | | | 0.74 | % |
Service | | $ | 1,000.00 | | | $ | 1,080.80 | | | $ | 4.51 | | | $ | 1,000.00 | | | $ | 1,020.63 | | | $ | 4.38 | | | | 0.87 | % |
Investor A | | $ | 1,000.00 | | | $ | 1,080.80 | | | $ | 4.51 | | | $ | 1,000.00 | | | $ | 1,020.63 | | | $ | 4.38 | | | | 0.87 | % |
Investor A1 | | $ | 1,000.00 | | | $ | 1,080.80 | | | $ | 3.74 | | | $ | 1,000.00 | | | $ | 1,021.33 | | | $ | 3.63 | | | | 0.72 | % |
Investor C | | $ | 1,000.00 | | | $ | 1,075.80 | | | $ | 8.49 | | | $ | 1,000.00 | | | $ | 1,016.73 | | | $ | 8.25 | | | | 1.64 | % |
Investor C1 | | $ | 1,000.00 | | | $ | 1,078.90 | | | $ | 6.38 | | | $ | 1,000.00 | | | $ | 1,018.83 | | | $ | 6.19 | | | | 1.23 | % |
| | 1 | | For each class of the Fund, expenses are equal to the annualized net expense ratio for the class, multiplied by the average account value over the period, multiplied by 182/365 (to reflect the one-half year period shown). |
| | 2 | | Hypothetical 5% annual return before expenses is calculated by pro rating the number of days in the most recent fiscal half year divided by 365. |
| | | | | | |
| | | | | | | |
| 14 | | ANNUAL REPORT | | MAY 31, 2014 | | |
| | | | |
| Disclosure of Expenses (concluded) | | |
| | |
| Expense Examples (concluded) | | |
| | | | | | | | | | | | | | | | | | | | | | | | | | | | |
| | | Actual | | | Hypothetical2 | | | | |
BlackRock Pennsylvania Municipal Bond Fund
(Including Interest Expense and Fees) | | Beginning
Account Value
December 1, 2013 | | | Ending
Account Value
May 31, 2014 | | | Expenses Paid
During the Period1 | | | Beginning
Account Value
December 1, 2013 | | | Ending
Account Value
May 31, 2014 | | | Expenses Paid
During the Period1 | | | Annualized
Expense
Ratio | |
Institutional | | $ | 1,000.00 | | | $ | 1,075.80 | | | $ | 3.98 | | | $ | 1,000.00 | | | $ | 1,021.13 | | | $ | 3.88 | | | | 0.77 | % |
Service | | $ | 1,000.00 | | | $ | 1,075.80 | | | $ | 4.97 | | | $ | 1,000.00 | | | $ | 1,020.13 | | | $ | 4.84 | | | | 0.96 | % |
Investor A | | $ | 1,000.00 | | | $ | 1,075.70 | | | $ | 4.97 | | | $ | 1,000.00 | | | $ | 1,020.13 | | | $ | 4.84 | | | | 0.96 | % |
Investor A1 | | $ | 1,000.00 | | | $ | 1,076.60 | | | $ | 4.14 | | | $ | 1,000.00 | | | $ | 1,020.93 | | | $ | 4.03 | | | | 0.80 | % |
Investor C | | $ | 1,000.00 | | | $ | 1,070.60 | | | $ | 8.93 | | | $ | 1,000.00 | | | $ | 1,016.33 | | | $ | 8.70 | | | | 1.73 | % |
Investor C1 | | $ | 1,000.00 | | | $ | 1,072.80 | | | $ | 6.82 | | | $ | 1,000.00 | | | $ | 1,018.33 | | | $ | 6.64 | | | | 1.32 | % |
BlackRock Pennsylvania Municipal Bond Fund
(Excluding Interest Expense and Fees) | | | | | | | | | | | | | | | | | | | | | |
Institutional | | $ | 1,000.00 | | | $ | 1,075.80 | | | $ | 3.62 | | | $ | 1,000.00 | | | $ | 1,021.43 | | | $ | 3.53 | | | | 0.70 | % |
Service | | $ | 1,000.00 | | | $ | 1,075.80 | | | $ | 4.61 | | | $ | 1,000.00 | | | $ | 1,020.53 | | | $ | 4.48 | | | | 0.89 | % |
Investor A | | $ | 1,000.00 | | | $ | 1,075.80 | | | $ | 4.61 | | | $ | 1,000.00 | | | $ | 1,020.53 | | | $ | 4.48 | | | | 0.89 | % |
Investor A1 | | $ | 1,000.00 | | | $ | 1,075.70 | | | $ | 3.78 | | | $ | 1,000.00 | | | $ | 1,021.33 | | | $ | 3.68 | | | | 0.73 | % |
Investor C | | $ | 1,000.00 | | | $ | 1,070.60 | | | $ | 8.57 | | | $ | 1,000.00 | | | $ | 1,016.63 | | | $ | 8.35 | | | | 1.66 | % |
Investor C1 | | $ | 1,000.00 | | | $ | 1,072.80 | | | $ | 6.51 | | | $ | 1,000.00 | | | $ | 1,018.63 | | | $ | 6.34 | | | | 1.26 | % |
BlackRock Strategic Municipal Opportunities Fund
(Including Interest Expense and Fees) | | | | | | | | | | | | | | | | | | | | | |
Institutional | | $ | 1,000.00 | | | $ | 1,061.90 | | | $ | 3.55 | | | $ | 1,000.00 | | | $ | 1,021.49 | | | $ | 3.48 | | | | 0.69 | % |
Investor A | | $ | 1,000.00 | | | $ | 1,061.70 | | | $ | 4.73 | | | $ | 1,000.00 | | | $ | 1,020.34 | | | $ | 4.63 | | | | 0.92 | % |
Investor A1 | | $ | 1,000.00 | | | $ | 1,061.50 | | | $ | 3.96 | | | $ | 1,000.00 | | | $ | 1,021.09 | | | $ | 3.88 | | | | 0.77 | % |
Investor C | | $ | 1,000.00 | | | $ | 1,056.80 | | | $ | 8.56 | | | $ | 1,000.00 | | | $ | 1,016.60 | | | $ | 8.40 | | | | 1.67 | % |
BlackRock Strategic Municipal Opportunities Fund
(Excluding Interest Expense and Fees) | | | | | | | | | | | | | | | | | | | | | |
Institutional | | $ | 1,000.00 | | | $ | 1,061.90 | | | $ | 3.39 | | | $ | 1,000.00 | | | $ | 1,021.64 | | | $ | 3.33 | | | | 0.66 | % |
Investor A | | $ | 1,000.00 | | | $ | 1,061.70 | | | $ | 4.57 | | | $ | 1,000.00 | | | $ | 1,020.49 | | | $ | 4.48 | | | | 0.89 | % |
Investor A1 | | $ | 1,000.00 | | | $ | 1,061.50 | | | $ | 3.80 | | | $ | 1,000.00 | | | $ | 1,021.24 | | | $ | 3.73 | | | | 0.74 | % |
Investor C | | $ | 1,000.00 | | | $ | 1,056.80 | | | $ | 8.41 | | | $ | 1,000.00 | | | $ | 1,016.75 | | | $ | 8.25 | | | | 1.64 | % |
| | 1 | | For each class of the Fund, expenses are equal to the annualized net expense ratio for the class, multiplied by the average account value over the period, multiplied by 182/365 (to reflect the one-half year period shown). |
| | 2 | | Hypothetical 5% annual return before expenses is calculated by pro rating the number of days in the most recent fiscal half year divided by 365. |
| | | | | | |
| | | | | | | |
| | ANNUAL REPORT | | MAY 31, 2014 | | 15 |
| | |
| The Benefits and Risks of Leveraging | | |
The Funds may utilize leverage to seek to enhance yield and NAV. However, these objectives cannot be achieved in all interest rate environments.
Each Fund may leverage its assets through the use of proceeds received in tender option bond (“TOB”) transactions, as described in Note 3 of the Notes to Financial Statements. In a TOB transaction, a third party sponsor establishes a special purpose entity (a “TOB Trust”) into which the Fund transfers municipal bonds or other municipal securities. TOB investments generally will provide the Fund with economic benefits in periods of declining short-term interest rates, but expose the Fund to risks during periods of rising short-term interest rates. Additionally, fluctuations in the market value of municipal bonds deposited into a TOB Trust may adversely affect the Fund’s NAV per share.
In general, the concept of leveraging is based on the premise that the financing cost of leverage, which will be based on short-term interest rates, will normally be lower than the income earned by each Fund on its longer-term portfolio investments purchased with the proceeds from leverage. To the extent that the total assets of each Fund (including the assets obtained from leverage) are invested in higher-yielding portfolio investments, the Fund’s shareholders will benefit from the incremental net income.
The interest earned on securities purchased with the proceeds from leverage is paid to Fund shareholders in the form of dividends, and the value of these portfolio holdings is reflected in the Fund’s per share NAV. However, in order to benefit shareholders, the return on assets purchased with leverage proceeds must exceed the ongoing costs associated with the leverage. If interest and other ongoing costs of leverage exceed a Fund’s return on assets purchased with leverage proceeds, income to shareholders will be lower than if the Fund had not used leverage.
Furthermore, the value of each Fund’s portfolio investments generally varies inversely with the direction of long-term interest rates, although other factors can influence the value of portfolio investments. As a result, changes in interest rates can influence each Fund’s NAV positively or negatively in addition to the impact on Fund performance from leverage. Changes in the direction of interest rates are difficult to predict accurately, and there is no assurance that a Fund’s leveraging strategy will be successful.
The use of leverage also will generally cause greater changes in each Fund’s NAV and dividend rates than a comparable fund that does not use leverage. In a declining market, leverage is likely to cause a greater decline in the NAV of a Fund’s shares than if the Fund were not leveraged. In addition, each Fund may be required to sell portfolio securities at inopportune times or at distressed values in order to comply with regulatory requirements applicable to the use of leverage or as required by the terms of leverage instruments, which may cause the Fund to incur losses. The use of leverage may limit a Fund’s ability to invest in certain types of securities or use certain types of hedging strategies. Each Fund will incur expenses in connection with the use of leverage, all of which are borne by Fund shareholders and may reduce income.
| | |
| Derivative Financial Instruments | | |
The Funds may invest in various derivative financial instruments, including financial futures contracts and swaps, as specified in Note 4 of the Notes to Financial Statements, which may constitute forms of economic leverage. Such derivative financial instruments are used to obtain exposure to a security, index and/or market without owning or taking physical custody of securities or to hedge market and/or interest rate risks. Derivative financial instruments involve risks, including the imperfect correlation between the value of a derivative financial instrument and the underlying asset, possible default of the counterparty to the transaction or illiquidity of the derivative financial instrument. The Funds’ ability to use a derivative financial instrument successfully depends on the investment advisor’s ability to predict pertinent market movements accurately, which cannot be assured. The use of derivative financial instruments may result in losses greater than if they had not been used, may require a Fund to sell or purchase portfolio investments at inopportune times or for distressed values, may limit the amount of appreciation a Fund can realize on an investment, may result in lower dividends paid to shareholders or may cause a Fund to hold an investment that it might otherwise sell. The Funds’ investments in these instruments are discussed in detail in the Notes to Financial Statements.
| | | | | | |
| | | | | | | |
| 16 | | ANNUAL REPORT | | MAY 31, 2014 | | |
| | |
Schedule of Investments May 31, 2014 | | BlackRock California Municipal Bond Fund (Percentages shown are based on Net Assets) |
| | | | | | | | |
| Municipal Bonds | | Par
(000) | | | Value | |
California — 92.4% | | | | | | | | |
County/City/Special District/School District — 29.3% | |
Centinela Valley Union High School District, GO, Election of 2010, Series A, 5.75%, 8/01/36 | | $ | 1,690 | | | $ | 2,026,986 | |
Centinela Valley Union High School District, GO, Refunding, Election of 2008, Series B, 6.00%, 8/01/36 | | | 2,000 | | | | 2,422,400 | |
City & County of San Francisco California, COP, Series C, AMT, 5.25%, 3/01/33 | | | 140 | | | | 156,869 | |
City of Los Angeles California, COP, Senior, Sonnenblick Del Rio West Los Angeles (AMBAC), 6.20%, 11/01/31 | | | 4,000 | | | | 4,017,840 | |
City of Martinez California, GO, Election of 2008, Series A, 5.88%, 2/01/39 | | | 6,035 | | | | 6,887,746 | |
City of Sacramento California Unified School District, GO, Election of 2002 (NPFGC), 5.00%, 7/01/30 | | | 7,000 | | | | 7,268,730 | |
City of San Jose California Hotel Tax, RB, Convention Center Expansion & Renovation Project, 6.50%, 5/01/42 | | | 2,395 | | | | 2,846,026 | |
County of Orange California Sanitation District, COP, Series A, 5.00%, 2/01/39 | | | 2,800 | | | | 3,155,824 | |
County of Orange California Water District, COP, Refunding, Series A, 5.00%, 8/15/32 | | | 3,015 | | | | 3,435,713 | |
County of San Joaquin California Transportation Authority, Refunding RB, Limited Tax, Measure K, Series A: | | | | | | | | |
6.00%, 3/01/36 | | | 2,955 | | | | 3,608,232 | |
5.50%, 3/01/41 | | | 10,450 | | | | 11,797,214 | |
County of San Mateo California Community College District, GO, Election of 2005, Series B, 5.00%, 9/01/38 | | | 19,000 | | | | 20,543,560 | |
County of Santa Clara California Financing Authority, Refunding LRB, Series L, 5.25%, 5/15/36 | | | 7,450 | | | | 8,330,665 | |
County of Ventura California, COP, Refunding, Public Financing Authority III, 5.75%, 8/15/29 | | | 1,000 | | | | 1,185,490 | |
Grossmont Healthcare District, GO, Election of 2006, Series B: | | | | | | | | |
6.00%, 7/15/34 | | | 2,755 | | | | 3,271,838 | |
6.13%, 7/15/40 | | | 3,045 | | | | 3,598,216 | |
Long Beach Community College District, GO, Refunding, Election of 2008, Series B, 5.00%, 8/01/39 | | | 12,000 | | | | 13,295,760 | |
Los Angeles Community College District California, GO, Election of 2008, Series C, 5.25%, 8/01/39 | | | 5,435 | | | | 6,279,001 | |
Los Angeles Community College District California, GO, Refunding, Election of 2008, Series A, 6.00%, 8/01/33 | | | 6,250 | | | | 7,463,688 | |
Millbrae School District, GO, Series B-2, 6.00%, 7/01/41 | | | 2,585 | | | | 3,028,069 | |
Pittsburg Unified School District, GO, Election of 2006, Series B (AGM), 5.63%, 8/01/39 | | | 5,000 | | | | 5,696,900 | |
| Municipal Bonds | | Par
(000) | | | Value | |
California (continued) | | | | | | | | |
County/City/Special District/School District (concluded) | |
Riverside County Transportation Commission, Refunding RB, Limited Tax, Series A, 5.25%, 6/01/39 | | $ | 3,000 | | | $ | 3,447,390 | |
San Diego Regional Building Authority, RB, County Operations Center & Annex, Series A, 5.38%, 2/01/36 | | | 5,455 | | | | 6,258,685 | |
San Francisco California Bay Area Rapid Transit District, GO, Election of 2004, Series B, 5.00%, 8/01/32 | | | 13,250 | | | | 14,763,547 | |
San Francisco California Bay Area Rapid Transit District, Refunding RB, Series A (NPFGC), 5.00%, 7/01/30 | | | 5,270 | | | | 5,472,315 | |
San Jose California Financing Authority, LRB, Convention Center Expansion & Renovation Project, Series A, 5.75%, 5/01/42 | | | 2,010 | | | | 2,374,795 | |
San Leandro California Unified School District, GO, Election of 2010, Series A, 5.75%, 8/01/41 | | | 5,000 | | | | 5,690,600 | |
West Contra Costa California Unified School District, GO, Election of 2010, Series A (AGM), 5.25%, 8/01/41 | | | 4,395 | | | | 4,820,304 | |
| | | | | | | | |
| | | | | | | | 163,144,403 | |
Education — 2.8% | | | | | | | | |
California Educational Facilities Authority, Refunding RB: | | | | | | | | |
Pitzer College, 6.00%, 4/01/40 | | | 2,500 | | | | 2,924,225 | |
San Francisco University, 6.13%, 10/01/30 | | | 1,250 | | | | 1,508,200 | |
California Municipal Finance Authority, RB, Emerson College, 6.00%, 1/01/42 | | | 7,000 | | | | 8,071,210 | |
University of California, RB, Series O, 5.75%, 5/15/34 | | | 2,500 | | | | 2,929,500 | |
| | | | | | | | |
| | | | | | | | 15,433,135 | |
Health — 16.9% | | | | | | | | |
ABAG Finance Authority for Nonprofit Corps., Refunding RB, Sharp Healthcare: | | | | | | | | |
Series A, 6.00%, 8/01/30 | | | 2,020 | | | | 2,459,552 | |
Series B, 6.38%, 8/01/14 (a) | | | 5,000 | | | | 5,052,500 | |
Series B, 6.25%, 8/01/39 | | | 3,775 | | | | 4,381,794 | |
California Health Facilities Financing Authority, RB: | | | | | | | | |
Adventist Health System West, Series A, 5.75%, 9/01/39 | | | 5,285 | | | | 6,084,990 | |
Children’s Hospital, Series A, 5.25%, 11/01/41 | | | 7,060 | | | | 7,673,443 | |
Scripps Health, Series A, 5.00%, 11/15/40 | | | 7,530 | | | | 8,173,062 | |
Sutter Health, Series A (BHAC), 5.00%, 11/15/42 | | | 14,415 | | | | 15,159,535 | |
Sutter Health, Series B, 6.00%, 8/15/42 | | | 9,680 | | | | 11,651,719 | |
California Health Facilities Financing Authority, Refunding RB: | | | | | | | | |
Catholic Healthcare West, Series A, 6.00%, 7/01/29 | | | 2,780 | | | | 3,207,453 | |
Catholic Healthcare West, Series A, 6.00%, 7/01/39 | | | 6,000 | | | | 6,707,940 | |
| | | | | | | | |
| | AGC | | Assured Guarantee Corp. | | GARB | | General Airport Revenue Bonds |
| | AGM | | Assured Guaranty Municipal Corp. | | GO | | General Obligation Bonds |
| | AMBAC | | American Municipal Bond Assurance Corp. | | HFA | | Housing Finance Agency |
| | AMT | | Alternative Minimum Tax (subject to) | | HUD | | Department of Housing and Urban Development |
| | ARB | | Airport Revenue Bonds | | IDA | | Industrial Development Authority |
| | BHAC | | Berkshire Hathaway Assurance Corp. | | LRB | | Lease Revenue Bonds |
| | CAB | | Capital Appreciation Bonds | | M/F | | Multi-Family |
| | CIFG | | CIFG Assurance North America, Inc | | MRB | | Mortgage Revenue Bonds |
| | COP | | Certificates of Participation | | NPFGC | | National Public Finance Guarantee Corp. |
| | EDA | | Economic Development Authority | | RB | | Revenue Bonds |
| | EDC | | Economic Development Corp. | | S/F | | Single-Family |
| | ETF | | Exchange-Traded Fund | | SPDR | | Standard & Poor’s Depository Receipts |
| | GAN | | Grant Anticipation Notes | | | | |
See Notes to Financial Statements.
| | | | | | |
| | | | | | | |
| | ANNUAL REPORT | | MAY 31, 2014 | | 17 |
| | |
Schedule of Investments (continued) | | BlackRock California Municipal Bond Fund (Percentages shown are based on Net Assets) |
| | | | | | | | |
| Municipal Bonds | | Par (000) | | | Value | |
California (continued) | | | | | | | | |
Health (concluded) | |
California Health Facilities Financing Authority, Refunding RB (concluded): | | | | | | | | |
Providence Health & Services, Series C, 6.50%, 10/01/33 | | $ | 4,150 | | | $ | 4,915,634 | |
California Statewide Communities Development Authority, RB, Kaiser Permanente, Series A, 5.00%, 4/01/42 | | | 10,000 | | | | 10,813,200 | |
California Statewide Communities Development Authority, Refunding RB: | | | | | | | | |
Kaiser Permanente, Series C, 5.25%, 8/01/31 | | | 2,500 | | | | 2,624,725 | |
Trinity Health Credit Group Composite Issue, 5.00%, 12/01/41 | | | 5,000 | | | | 5,371,600 | |
| | | | | | | | |
| | | | | | | | 94,277,147 | |
State — 11.8% | | | | | | | | |
California State Public Works Board, LRB: | | | | | | | | |
Department of Education, Riverside Campus Project, Series B, 6.50%, 4/01/34 | | | 10,000 | | | | 11,928,200 | |
Department of General Services, Buildings 8 & 9, Series A, 6.25%, 4/01/34 | | | 2,425 | | | | 2,864,992 | |
Various Capital Projects, Series I, 5.25%, 11/01/32 | | | 1,115 | | | | 1,285,863 | |
Various Capital Projects, Series I, 5.50%, 11/01/33 | | | 2,295 | | | | 2,725,381 | |
Various Capital Projects, Sub-Series I-1, 6.38%, 11/01/34 | | | 1,725 | | | | 2,077,107 | |
Various Correctional Facilities, Series A, 5.00%, 9/01/39 | | | 18,935 | | | | 20,899,317 | |
State of California, GO, Various Purposes: | | | | | | | | |
6.00%, 3/01/33 | | | 4,195 | | | | 5,071,965 | |
6.00%, 4/01/38 | | | 15,900 | | | | 18,768,996 | |
| | | | | | | | |
| | | | | | | | 65,621,821 | |
Transportation — 9.0% | | | | | | | | |
City & County of San Francisco California Airports Commission, ARB: | | | | | | | | |
Series E, 6.00%, 5/01/39 | | | 5,150 | | | | 6,114,234 | |
Special Facility Lease, SFO Fuel, Series A, AMT (AGM), 6.10%, 1/01/20 | | | 1,250 | | | | 1,255,613 | |
City & County of San Francisco California Airports Commission, Refunding ARB, 2nd Series A, AMT, 5.25%, 5/01/33 | | | 1,645 | | | | 1,846,463 | |
City of Los Angeles California Department of Airports, Refunding ARB, Los Angeles International Airport, Senior Series A: | | | | | | | | |
5.00%, 5/15/34 | | | 8,600 | | | | 9,647,824 | |
5.00%, 5/15/40 | | | 11,705 | | | | 12,842,843 | |
City of Los Angeles California Department of Airports, Refunding RB, Los Angeles International Airport, Senior Series A, AMT: | | | | | | | | |
5.38%, 5/15/33 | | | 1,000 | | | | 1,121,720 | |
5.38%, 5/15/38 | | | 325 | | | | 348,082 | |
City of San Jose California, Refunding ARB, Series A-1, AMT: | | | | | | | | |
5.75%, 3/01/34 | | | 4,570 | | | | 5,142,895 | |
6.25%, 3/01/34 | | | 2,450 | | | | 2,848,983 | |
County of Orange California, ARB, Series B, 5.75%, 7/01/34 | | | 3,000 | | | | 3,398,640 | |
County of Sacramento California, ARB: | | | | | | | | |
Senior Series B, 5.75%, 7/01/39 | | | 1,600 | | | | 1,833,936 | |
Subordinated & Passenger Facility Charges/Grant, Series C (AGC), 5.75%, 7/01/39 | | | 3,150 | | | | 3,621,271 | |
| | | | | | | | |
| | | | | | | | 50,022,504 | |
| Municipal Bonds | | Par (000) | | | Value | |
California (concluded) | | | | | | | | |
Utilities — 22.6% | | | | | | | | |
City of Los Angeles California Wastewater System, Refunding RB, Series A, 5.38%, 6/01/39 | | $ | 5,000 | | | $ | 5,767,250 | |
City of Petaluma California Wastewater, Refunding RB, 6.00%, 5/01/36 | | | 5,625 | | | | 6,629,906 | |
County of Orange California Sanitation District, COP, Series B (AGM), 5.00%, 2/01/37 | | | 8,015 | | | | 8,759,754 | |
County of Sacramento California Sanitation Districts Financing Authority, RB, Sacramento Regional County Sanitation (NPFGC), 5.00%, 12/01/36 | | | 12,770 | | | | 13,579,618 | |
County of San Diego California Water Authority, COP, Refunding, Series A (AGM), 5.00%, 5/01/33 | | | 4,760 | | | | 5,294,500 | |
Dublin-San Ramon Services District Water, Refunding RB, 5.50%, 8/01/36 | | | 4,235 | | | | 4,863,855 | |
Los Angeles Department of Water & Power, RB, Power System, Sub-Series A-1, 5.25%, 7/01/38 | | | 5,330 | | | | 6,020,928 | |
Los Angeles Department of Water & Power, Refunding RB, Series A, 5.25%, 7/01/39 | | | 8,000 | | | | 8,906,400 | |
Metropolitan Water District of Southern California, RB, Authorization, Series A, 5.00%, 1/01/39 | | | 17,005 | | | | 19,021,623 | |
Metropolitan Water District of Southern California, Refunding RB, Series A, 5.00%, 10/01/35 | | | 5,000 | | | | 5,667,350 | |
San Diego Public Facilities Financing Authority Sewer, Refunding RB, Senior Series A: | | | | | | | | |
5.25%, 5/15/29 | | | 4,000 | | | | 4,667,080 | |
5.25%, 5/15/34 | | | 13,000 | | | | 14,895,790 | |
5.25%, 5/15/39 | | | 1,600 | | | | 1,821,200 | |
San Diego Public Facilities Financing Authority Water, Refunding RB, Series B, 5.75%, 8/01/35 | | | 5,000 | | | | 5,912,600 | |
San Juan Water District, COP, Series A, 6.00%, 2/01/39 | | | 5,700 | | | | 6,647,853 | |
Tuolumne Wind Project Authority, RB, Tuolumne Co. Project, Series A, 5.88%, 1/01/29 | | | 6,395 | | | | 7,658,652 | |
| | | | | | | | |
| | | | | | | | 126,114,359 | |
| Total Municipal Bonds — 92.4% | | | | | | | 514,613,369 | |
| | | | | | | | |
| | | | | | | | | |
| | |
Municipal Bonds Transferred to
Tender Option Bond Trusts (b) | | | | | | |
California — 9.6% | | | | | | | | |
County/City/Special District/School District — 2.5% | | | | | |
County of Orange California Water District, COP, Refunding, Series A, 5.25%, 8/15/34 | | | 12,200 | | | | 14,025,852 | |
Education — 2.0% | | | | | | | | |
California State University, Refunding RB, Systemwide, Series A (AGM), 5.00%, 11/01/32 | | | 10,000 | | | | 11,007,200 | |
Utilities — 5.1% | | | | | | | | |
City & County of San Francisco California Public Utilities Commission, RB, Water Revenue, Series B, 5.00%, 11/01/39 | | | 13,000 | | | | 14,484,340 | |
San Diego Public Facilities Financing Authority Sewer, Refunding RB, Senior Series A, 5.25%, 5/15/39 | | | 12,108 | | | | 13,782,040 | |
| | | | | | | | |
| | | | | | | | 28,266,380 | |
Total Municipal Bonds Transferred to
Tender Option Bond Trusts — 9.6% | | | | 53,299,432 | |
Total Long-Term Investments
(Cost — $524,228,870) — 102.0% | | | | 567,912,801 | |
See Notes to Financial Statements.
| | | | | | |
| | | | | | | |
| 18 | | ANNUAL REPORT | | MAY 31, 2014 | | |
| | |
Schedule of Investments (continued) | | BlackRock California Municipal Bond Fund (Percentages shown are based on Net Assets) |
| | | | | | | | |
| Short-Term Securities | | Shares | | | Value | |
BIF California Municipal Money Fund, 0.00% (c)(d) | | | 1,239,217 | | | $ | 1,239,217 | |
Total Short-Term Securities
(Cost — $1,239,217) — 0.2% | | | | 1,239,217 | |
| Total Investments (Cost — $525,468,087) — 102.2% | | | | 569,152,018 | |
| Other Assets Less Liabilities — 2.0% | | | | | | | 11,269,318 | |
Liability for TOB Trust Certificates, Including Interest
Expense and Fees Payable — (4.2)% | | | | (23,656,283 | ) |
| | | | | | | | |
| Net Assets — 100.0% | | | | | | $ | 556,765,053 | |
| | | | | | | | |
|
| Notes to Schedule of Investments |
| (a) | | U.S. government securities, held in escrow, are used to pay interest on this security, as well as to retire the bond in full at the date indicated, typically at a premium to par. |
| (b) | | Represent bonds transferred to a TOB. In exchange for which the Fund acquired residual interest certificates. These bonds serve as collateral in a financing transaction. See Note 3 of the Notes to Financial Statements for details of municipal bonds transferred to TOBs. |
| (c) | | Investments in issuers considered to be an affiliate of the Fund during the year ended May 31, 2014, for purposes of Section 2(a)(3) of the Investment Company Act of 1940, as amended, were as follows: |
| | | | | | | | | | | | | | | | |
| Affiliate | | Shares Held
at May 31,
2013 | | | Net
Activity | | | Shares Held
at May 31,
2014 | | | Income | |
BIF California Municipal Money Fund | | | 1,311,039 | | | | (71,822 | ) | | | 1,239,217 | | | $ | 195 | |
| (d) | | Represents the current yield as of report date. |
| Ÿ | | Financial futures contracts outstanding as of May 31, 2014 were as follows: |
| | | | | | | | | | | | | | | | |
| Contracts Sold | | | Issue | | Exchange | | Expiration | | Notional
Value | | | Unrealized
Depreciation | |
| | (600 | ) | | 10-Year U.S. Treasury Note | | Chicago Board of Trade | | September 2014 | | $ | 75,309,375 | | | $ | (399,278 | ) |
| Ÿ | | For Fund compliance purposes, the Fund’s sector classifications refer to any one or more of the sector sub-classifications used by one or more widely recognized market indexes or rating group indexes, and/or as defined by the investment advisor. These definitions may not apply for purposes of this report, which may combine such sector sub-classifications for reporting ease. |
| Ÿ | | Fair Value Measurements — Various inputs are used in determining the fair value of investments and derivative financial instruments. These inputs to valuation techniques are categorized into a disclosure hierarchy consisting of three broad levels for financial statement purposes as follows: |
| | Ÿ | | Level 1 — unadjusted price quotations in active markets/exchanges for identical assets or liabilities that the Fund has the ability to access |
| | Ÿ | | Level 2 — other observable inputs (including, but not limited to, quoted prices for similar assets or liabilities in markets that are active, quoted prices for identical or similar assets or liabilities in markets that are not active, inputs other than quoted prices that are observable for the assets or liabilities (such as interest rates, yield curves, volatilities, prepayment speeds, loss severities, credit risks and default rates) or other market-corroborated inputs) |
| | Ÿ | | Level 3 — unobservable inputs based on the best information available in the circumstances, to the extent observable inputs are not available (including the Fund’s own assumptions used in determining the fair value of investments and derivative financial instruments) |
The hierarchy gives the highest priority to unadjusted quoted prices in active markets for identical assets or liabilities (Level 1 measurements) and the lowest priority to unobservable inputs (Level 3 measurements). Accordingly, the degree of judgment exercised in determining fair value is greatest for instruments categorized in Level 3. The inputs used to measure fair value may fall into different levels of the fair value hierarchy. In such cases, for disclosure purposes, the fair value hierarchy classification is determined based on the lowest level input that is significant to the fair value measurement in its entirety.
Changes in valuation techniques may result in transfers into or out of an assigned level within the disclosure hierarchy. In accordance with the Fund’s policy, transfers between different levels of the fair value disclosure hierarchy are deemed to have occurred as of the beginning of the reporting period. The categorization of a value determined for investments and derivative financial instruments is based on the pricing transparency of the investment and derivative financial instrument and is not necessarily an indication of the risks associated with investing in those securities. For information about the Fund’s policy regarding valuation of investments and derivative financial instruments, please refer to Note 2 of the Notes to Financial Statements.
See Notes to Financial Statements.
| | | | | | |
| | | | | | | |
| | ANNUAL REPORT | | MAY 31, 2014 | | 19 |
| | |
Schedule of Investments (concluded) | | BlackRock California Municipal Bond Fund |
The following tables summarize the Fund’s investments and derivative financial instruments categorized in the disclosure hierarchy as of May 31, 2014:
| | | | | | | | | | | | | | |
| | | Level 1 | | | Level 2 | | | Level 3 | | Total | |
Assets: | | | | | | | | | | | | | | |
| Investments: | | | | | | | | | | | | | | |
Long-Term Investments1 | | | — | | | $ | 567,912,801 | | | — | | $ | 567,912,801 | |
Short-Term Securities | | $ | 1,239,217 | | | | — | | | — | | | 1,239,217 | |
| | | | | | | | | | | | | | |
Total | | $ | 1,239,217 | | | $ | 567,912,801 | | | — | | $ | 569,152,018 | |
| | | | | | | | | | | | | | |
1 See above Schedule of Investments for values in each sector. | | | | |
| | | Level 1 | | | Level 2 | | | Level 3 | | Total | |
| Derivative Financial Instruments2 | | | | | | | |
Liabilities: | | | | | | | | | | | | | | |
Interest rate contracts | | $ | (399,278 | ) | | | — | | | — | | $ | (399,278 | ) |
2 Derivative financial instruments are financial futures contracts, which are valued at the unrealized appreciation/depreciation on the instrument. | |
The Fund may hold assets and/or liabilities in which the fair value approximates the carrying amount for financial statement purposes. As of May 31, 2014, such assets and/or liabilities are categorized within the disclosure hierarchy as follows:
| | | | | | | | | | | | | | |
| | | Level 1 | | | Level 2 | | | Level 3 | | Total | |
Assets: | | | | | | | | | | | | | | |
Cash pledged for financial futures contracts | | $ | 785,000 | | | | — | | | — | | $ | 785,000 | |
Liabilities: | | | | | | | | | | | | | | |
TOB trust certificates | | | — | | | $ | (23,652,530 | ) | | — | | | (23,652,530 | ) |
| | | | | | | | | | | | | | |
Total | | $ | 785,000 | | | $ | (23,652,530 | ) | | — | | $ | (22,867,530 | ) |
| | | | | | | | | | | | | | |
There were no transfers between levels during the year ended May 31, 2014.
See Notes to Financial Statements.
| | | | | | |
| | | | | | | |
| 20 | | ANNUAL REPORT | | MAY 31, 2014 | | |
| | |
Schedule of Investments May 31, 2014 | | BlackRock New Jersey Municipal Bond Fund (Percentages shown are based on Net Assets) |
| | | | | | | | |
| Municipal Bonds | | Par (000) | | | Value | |
New Jersey — 94.9% | | | | | | | | |
Corporate — 5.4% | | | | | | | | |
New Jersey EDA, RB, AMT: | | | | | | | | |
5.13%, 1/01/39 | | $ | 1,000 | | | $ | 1,074,790 | |
Continental Airlines, Inc. Project, 5.25%, 9/15/29 | | | 3,500 | | | | 3,611,510 | |
Continental Airlines, Inc. Project, Series B, 5.63%, 11/15/30 | | | 1,000 | | | | 1,064,310 | |
Mandatory Put Bonds, Solid Waste Disposal, Waste Management, Series A, 5.30%, 6/01/15 | | | 2,000 | | | | 2,000,000 | |
New Jersey EDA, Refunding RB: | | | | | | | | |
New Jersey American Water Co., Inc. Project, Series A, AMT, 5.70%, 10/01/39 | | | 1,445 | | | | 1,580,917 | |
New Jersey American Water Co., Inc. Project, Series B, AMT, 5.60%, 11/01/34 | | | 1,000 | | | | 1,103,960 | |
New Jersey American Water Co., Inc. Project, Series D, AMT, 4.88%, 11/01/29 | | | 1,000 | | | | 1,075,440 | |
Newark Airport Marriott Hotel, 7.00%, 10/01/14 | | | 1,250 | | | | 1,253,538 | |
| | | | | | | | |
| | | | | | | | 12,764,465 | |
County/City/Special District/School District — 11.7% | | | | | | | | |
City of Perth Amboy New Jersey, GO, CAB, Refunding (AGM): | | | | | | | | |
5.00%, 7/01/35 | | | 1,250 | | | | 1,299,900 | |
5.00%, 7/01/36 | | | 300 | | | | 311,622 | |
Collingswood School District, GO, Refunding, Board of Education of the Borough of Collingswood, 2.75%, 6/01/30 | | | 1,165 | | | | 1,010,102 | |
County of Essex New Jersey Improvement Authority, LRB, Newark Project, Series A (AGM), 5.00%, 11/01/20 | | | 735 | | | | 818,621 | |
County of Essex New Jersey Improvement Authority, Refunding RB, Project Consolidation (NPFGC), 5.50%, 10/01/29 | | | 1,500 | | | | 1,880,115 | |
County of Union New Jersey, GO, Refunding, County Vocational Technical School, Series C, 3.50%, 3/01/31 | | | 1,640 | | | | 1,658,860 | |
County of Union New Jersey Utilities Authority, Refunding RB, Series A: | | | | | | | | |
Covanta Union, Inc., AMT, 4.75%, 12/01/31 | | | 1,250 | | | | 1,309,425 | |
Solid Waste System, County Deficiency Agreement, 5.00%, 6/15/41 | | | 2,000 | | | | 2,184,460 | |
Essex County Improvement Authority, LRB, Newark Project, Series A (AGM), 6.00%, 11/01/30 | | | 1,090 | | | | 1,230,719 | |
Hudson County Improvement Authority, RB, Harrison Parking Facility Project, Series C: | | | | | | | | |
4.88%, 1/01/46 | | | 1,000 | | | | 1,046,540 | |
5.25%, 1/01/46 | | | 4,900 | | | | 5,223,890 | |
Middlesex County Improvement Authority, RB, Heldrich Center Hotel, Senior Series A, 5.00%, 1/01/15 | | | 195 | | | | 169,535 | |
New Jersey EDA, RB, Goethals Bridge Replacement Project, AMT (AGM), 5.13%, 7/01/42 | | | 1,000 | | | | 1,066,650 | |
New Jersey EDA, Refunding RB, Special Assessment, Kapkowski Road Landfill Project, 6.50%, 4/01/28 | | | 2,500 | | | | 2,925,875 | |
New Jersey Health Care Facilities Financing Authority, LRB, Greystone Park Psychiatric Hospital Project, Series A: | | | | | | | | |
5.00%, 9/15/29 | | | 2,000 | | | | 2,246,240 | |
(AGM), 3.50%, 9/15/31 | | | 750 | | | | 729,067 | |
New Jersey Sports & Exposition Authority, Refunding RB, (NPFGC), 5.50%, 3/01/21 | | | 805 | | | | 935,378 | |
Newark Housing Authority, Refunding RB, Newark Redevelopment Project (NPFGC), 4.38%, 1/01/37 | | | 1,775 | | | | 1,780,982 | |
| | | | | | | | |
| | | | | | | | 27,827,981 | |
Education — 16.8% | | | | | | | | |
New Jersey EDA,RB: | | | | | | | | |
5.00%, 9/01/17 (a) | | | 315 | | | | 358,842 | |
5.00%, 9/01/37 | | | 185 | | | | 202,183 | |
| Municipal Bonds | | Par (000) | | | Value | |
New Jersey (continued) | | | | | | | | |
Education (concluded) | | | | | | | | |
New Jersey EDA,RB (concluded): | | | | | | | | |
4.00%, 6/15/35 | | $ | 500 | | | $ | 502,940 | |
5.50%, 12/15/18 (a) | | | 965 | | | | 1,157,315 | |
5.50%, 12/15/34 | | | 535 | | | | 609,782 | |
Patterson Charter School of Science and Technology, Inc. Project, series A, 6.00%, 7/01/32 | | | 700 | | | | 734,195 | |
Patterson Charter School of Science and Technology, Inc. Project, series A, 6.10%, 7/01/44 | | | 355 | | | | 370,379 | |
Rutgers - The State University of New Jersey, College Avenue Redevelopment Project, 5.00%, 6/15/38 | | | 2,000 | | | | 2,237,360 | |
Team Academy Charter School Project, 6.00%, 10/01/43 | | | 1,000 | | | | 1,053,200 | |
New Jersey EDA, Refunding RB, Seeing Eye, Inc. Project (AMBAC), 5.00%, 12/01/24 | | | 5,500 | | | | 5,620,945 | |
New Jersey Educational Facilities Authority, RB, Higher Education Capital Improvement Fund, 5.00%, 9/01/33 | | | 2,750 | | | | 3,047,633 | |
New Jersey Educational Facilities Authority, Refunding RB: | | | | | | | | |
College of New Jersey, Series D (AGM), 5.00%, 7/01/35 | | | 3,750 | | | | 4,138,987 | |
Georgian Court University, Series D, 5.00%, 7/01/33 | | | 500 | | | | 512,905 | |
Kean University, Series A, 5.25%, 9/01/29 | | | 1,705 | | | | 1,855,466 | |
Kean University, Series A (AGC), 5.50%, 9/01/36 | | | 1,000 | | | | 1,137,610 | |
Ramapo College, Series B, 5.00%, 7/01/42 | | | 560 | | | | 606,794 | |
Rowan University, Series B (AGC), 5.00%, 7/01/27 | | | 1,250 | | | | 1,401,325 | |
Rowan University, Series B (AGM), 3.00%, 7/01/27 | | | 220 | | | | 216,020 | |
Rowan University, Series B (AGM), 3.00%, 7/01/28 | | | 285 | | | | 276,678 | |
University of Medicine & Dentistry, Series B, 7.50%, 6/01/19 (a) | | | 2,500 | | | | 3,261,825 | |
William Paterson University, Series C (AGC), 5.00%, 7/01/38 | | | 3,200 | | | | 3,443,520 | |
New Jersey Higher Education Student Assistance Authority, Refunding RB: | | | | | | | | |
Series 1, AMT, 5.75%, 12/01/28 | | | 1,000 | | | | 1,131,840 | |
Series 1A, 5.00%, 12/01/25 | | | 85 | | | | 89,259 | |
Series 1A, 5.00%, 12/01/26 | | | 555 | | | | 582,811 | |
New Jersey Institute of Technology, RB, Series A: | | | | | | | | |
5.00%, 7/01/32 | | | 1,500 | | | | 1,671,750 | |
5.00%, 7/01/42 | | | 915 | | | | 995,447 | |
Rutgers - The State University of New Jersey, Refunding RB, Series L, 5.00%, 5/01/43 | | | 2,500 | | | | 2,779,050 | |
| | | | | | | | |
| | | | | | | | 39,996,061 | |
Health — 20.4% | | | | | | | | |
County of Burlington New Jersey Bridge Commission, Refunding RB, The Evergreens Project, 5.63%, 1/01/38 | | | 1,850 | | | | 1,801,623 | |
New Jersey EDA, RB: | | | | | | | | |
1st Mortgage, Lions Gate Project, Series A, 5.88%, 1/01/37 | | | 1,000 | | | | 1,000,950 | |
Masonic Charity Foundation of New Jersey, 5.25%, 6/01/24 | | | 875 | | | | 884,940 | |
Masonic Charity Foundation of New Jersey, 5.25%, 6/01/32 | | | 500 | | | | 505,445 | |
New Jersey EDA, Refunding RB: | | | | | | | | |
First Mortgage, Winchester, Series A, 5.80%, 11/01/31 | | | 1,500 | | | | 1,506,675 | |
See Notes to Financial Statements.
| | | | | | |
| | | | | | | |
| | ANNUAL REPORT | | MAY 31, 2014 | | 21 |
| | |
Schedule of Investments (continued) | | BlackRock New Jersey Municipal Bond Fund (Percentages shown are based on Net Assets) |
| | | | | | | | |
| Municipal Bonds | | Par (000) | | | Value | |
New Jersey (continued) | | | | | | | | |
Health (concluded) | | | | | | | | |
New Jersey EDA, Refunding RB (concluded): | | | | | | | | |
Seabrook Village, Inc. Facility, 5.25%, 11/15/26 | | $ | 2,000 | | | $ | 2,039,160 | |
Seabrook Village, Inc. Facility, 5.25%, 11/15/36 | | | 600 | | | | 604,038 | |
New Jersey Health Care Facilities Financing Authority, RB: | | | | | | | | |
Children’s Specialized Hospital, Series A, 5.50%, 7/01/36 | | | 460 | | | | 467,194 | |
Hunterdon Medical Center, Series A, 5.25%, 7/01/25 | | | 750 | | | | 810,878 | |
Hunterdon Medical Center, Series A, 5.13%, 7/01/35 | | | 1,100 | | | | 1,126,268 | |
Meridian Health System Obligated Group, Series I (AGC), 5.00%, 7/01/38 | | | 1,870 | | | | 1,971,504 | |
Robert Wood Johnson University Hospital, Series A, 5.25%, 7/01/35 | | | 1,460 | | | | 1,621,330 | |
Robert Wood Johnson University Hospital, Series A, 5.50%, 7/01/43 | | | 495 | | | | 553,078 | |
Virtua Health, Series A (AGC), 5.50%, 7/01/38 | | | 3,620 | | | | 3,915,971 | |
New Jersey Health Care Facilities Financing Authority, Refunding RB: | | | | | | | | |
5.00%, 7/01/29 | | | 285 | | | | 321,531 | |
AHS Hospital Corp., 6.00%, 7/01/37 | | | 2,985 | | | | 3,484,301 | |
CAB, St. Barnabas Health Care System, Series B, 0.00%, 7/01/36 (b) | | | 7,360 | | | | 2,426,371 | |
CAB, St. Barnabas Health Care System, Series B, 0.00%, 7/01/37 (b) | | | 7,000 | | | | 2,188,130 | |
General Hospital Center at Passaic (AGM), 6.75%, 7/01/19 (c) | | | 125 | | | | 147,056 | |
Hackensack University Medical Center (AGC), 5.25%, 1/01/36 | | | 3,600 | | | | 3,962,196 | |
Holy Name Medical Center, 5.00%, 7/01/25 | | | 500 | | | | 526,205 | |
Meridian Health System Obligated Group, 5.00%, 7/01/27 | | | 1,500 | | | | 1,659,450 | |
Robert Wood Johnson University Hospital, 5.00%, 7/01/31 | | | 1,500 | | | | 1,599,105 | |
South Jersey Hospital, 5.00%, 7/01/46 | | | 3,100 | | | | 3,155,118 | |
St. Barnabas Health Care System, Series A, 5.00%, 7/01/25 | | | 2,230 | | | | 2,510,556 | |
St. Barnabas Health Care System, Series A, 5.00%, 7/01/29 | | | 4,185 | | | | 4,318,920 | |
St. Barnabas Health Care System, Series A, 5.63%, 7/01/32 | | | 1,540 | | | | 1,696,033 | |
St. Barnabas Health, Series A, 5.00%, 7/01/24 | | | 1,000 | | | | 1,138,790 | |
St. Luke’s Warren Hospital Obligated Group, 5.00%, 8/15/34 | | | 460 | | | | 494,381 | |
St. Luke’s Warren Hospital Obligated Group, 4.00%, 8/15/37 | | | 230 | | | | 220,572 | |
| | | | | | | | |
| | | | | | | | 48,657,769 | |
Housing — 3.8% | | | | | | | | |
Middlesex County Improvement Authority, RB, New Brunswick Apartments Rental Housing, AMT (Fannie Mae), 5.15%, 2/01/24 | | | 1,860 | | | | 1,862,883 | |
New Jersey Housing & Mortgage Finance Agency, RB, S/F Housing: | | | | | | | | |
Series AA, 6.50%, 10/01/38 | | | 630 | | | | 648,900 | |
Series U, AMT, 4.90%, 10/01/27 | | | 1,590 | | | | 1,635,776 | |
Series U, AMT, 4.95%, 10/01/32 | | | 405 | | | | 413,890 | |
Newark Housing Authority, RB, M/F Housing, Series A: | | | | | | | | |
5.00%, 12/01/30 | | | 1,640 | | | | 1,834,602 | |
4.38%, 12/01/33 | | | 2,515 | | | | 2,617,210 | |
| | | | | | | | |
| | | | | | | | 9,013,261 | |
| Municipal Bonds | | Par (000) | | | Value | |
New Jersey (continued) | | | | | | | | |
State — 13.2% | | | | | | | | |
Garden State Preservation Trust, RB (AGM): | | | | | | | | |
CAB, Series B, 0.00%, 11/01/24 (b) | | $ | 10,000 | | | $ | 7,466,600 | |
CAB, Series B, 0.00%, 11/01/27 (b) | | | 4,135 | | | | 2,713,676 | |
Election of 2005, Series A, 5.80%, 11/01/15 (a) | | | 1,640 | | | | 1,770,183 | |
Election of 2005, Series A, 5.75%, 11/01/28 | | | 2,080 | | | | 2,687,006 | |
New Jersey EDA, RB: | | | | | | | | |
CAB, Motor Vehicle Surcharge, Series A (NPFGC), 0.00%, 7/01/21 (b) | | | 1,675 | | | | 1,352,161 | |
Kapkowski Road Landfill Project, Series B, AMT, 6.50%, 4/01/31 | | | 2,000 | | | | 2,326,080 | |
Motor Vehicle Surcharges, Series A (NPFGC), 5.00%, 7/01/27 | | | 2,000 | | | | 2,020,440 | |
Motor Vehicle Surcharges, Series A (NPFGC), 5.00%, 7/01/29 | | | 1,100 | | | | 1,111,242 | |
School Facilities Construction (AGC), 6.00%, 12/15/18 (a) | | | 985 | | | | 1,203,118 | |
School Facilities Construction (AGC), 6.00%, 12/15/34 | | | 15 | | | | 17,433 | |
School Facilities Construction, Series KK, 5.00%, 3/01/38 | | | 1,070 | | | | 1,157,804 | |
New Jersey EDA, Refunding RB: | | | | | | | | |
CAB, Economic Fund, Series A (NPFGC), 0.00%, 3/15/21 (b) | | | 2,000 | | | | 1,667,400 | |
Cigarette Tax, 5.00%, 6/15/22 | | | 1,700 | | | | 1,955,493 | |
Cigarette Tax, 5.00%, 6/15/29 | | | 640 | | | | 689,101 | |
State of New Jersey, COP, Equipment Lease Purchase, Series A: | | | | | | | | |
5.25%, 6/15/29 | | | 1,000 | | | | 1,088,420 | |
5.25%, 6/15/30 | | | 1,110 | | | | 1,203,851 | |
State of New Jersey, GO, Refunding, Series N (NPFGC), 5.50%, 7/15/17 | | | 1,000 | | | | 1,145,510 | |
| | | | | | | | |
| | | | | | | | 31,575,518 | |
Transportation — 21.0% | | | | | | | | |
Delaware River Joint Toll Bridge Commission, Refunding RB, Series A: | | | | | | | | |
3.00%, 7/01/28 | | | 1,000 | | | | 963,990 | |
3.13%, 7/01/30 | | | 1,000 | | | | 940,120 | |
Delaware River Port Authority, RB, Series D, 5.00%, 1/01/40 | | | 1,875 | | | | 2,000,831 | |
Delaware River Port Authority of Pennsylvania & New Jersey, RB, 5.00%, 1/01/40 | | | 1,500 | | | | 1,647,225 | |
New Jersey EDA, RB, Private Activity, The Goethals Bridge Replacement Project, AMT, 5.38%, 1/01/43 | | | 905 | | | | 966,730 | |
New Jersey State Turnpike Authority, RB: | | | | | | | | |
Growth & Income Securities, Series B (AMBAC), 0.00%, 1/01/35 (d) | | | 1,510 | | | | 1,544,594 | |
Series C (AGM), 5.00%, 1/01/15 (a) | | | 2,500 | | | | 2,571,150 | |
New Jersey State Turnpike Authority, Refunding RB: | | | | | | | | |
Series A (BHAC), 5.25%, 1/01/30 | | | 1,000 | | | | 1,241,640 | |
Series B, 3.50%, 1/01/30 | | | 1,000 | | | | 986,250 | |
Series C (NPFGC), 6.50%, 1/01/16 | | | 355 | | | | 388,906 | |
Series I, 5.00%, 1/01/35 | | | 2,500 | | | | 2,692,650 | |
New Jersey Transportation Trust Fund Authority, RB: | | | | | | | | |
CAB, Transportation System, Series A, 0.00%, 12/15/32 (b) | | | 10,000 | | | | 4,202,900 | |
CAB, Transportation System, Series A, 0.00%, 12/15/35 (b) | | | 5,500 | | | | 1,946,725 | |
CAB, Transportation System, Series A, 0.00%, 12/15/38 (b) | | | 12,050 | | | | 3,568,969 | |
CAB, Transportation System, Series C (AGM), 0.00%, 12/15/34 (b) | | | 4,870 | | | | 1,794,400 | |
CAB, Transportation System, Series C (AMBAC), 0.00%, 12/15/35 (b) | | | 1,380 | | | | 495,682 | |
See Notes to Financial Statements.
| | | | | | |
| | | | | | | |
| 22 | | ANNUAL REPORT | | MAY 31, 2014 | | |
| | |
Schedule of Investments (continued) | | BlackRock New Jersey Municipal Bond Fund (Percentages shown are based on Net Assets) |
| | | | | | | | |
| Municipal Bonds | | Par (000) | | | Value | |
New Jersey (concluded) | | | | | | | | |
Transportation (concluded) | | | | | | | | |
New Jersey Transportation Trust Fund Authority, RB (concluded): | | | | | | | | |
Series B, 5.25%, 6/15/26 | | $ | 1,500 | | | $ | 1,718,280 | |
Transportation Program, Series AA, 5.25%, 6/15/31 | | | 2,000 | | | | 2,270,900 | |
Transportation System, Series A, 6.00%, 6/15/35 | | | 3,185 | | | | 3,845,059 | |
New Jersey Transportation Trust Fund Authority, Refunding RB, Transportation System, Series B (NPFGC), 5.50%, 12/15/21 | | | 1,800 | | | | 2,181,096 | |
Port Authority of New York & New Jersey, ARB: | | | | | | | | |
Consolidated, 85th Series, 5.20%, 9/01/18 | | | 1,000 | | | | 1,171,660 | |
Consolidated, 93rd Series, 6.13%, 6/01/94 | | | 1,000 | | | | 1,174,670 | |
Special Project, JFK International Air Terminal LLC Project, Series 8, 6.00%, 12/01/42 | | | 1,000 | | | | 1,113,520 | |
Special Project, JFK International Air Terminal LLC, Series 6, AMT (NPFGC), 5.75%, 12/01/22 | | | 2,000 | | | | 2,012,480 | |
Port Authority of New York & New Jersey, Refunding ARB, Consolidated, AMT: | | | | | | | | |
147th Series, 4.75%, 4/15/37 | | | 4,700 | | | | 4,811,296 | |
177th Series, 3.50%, 7/15/37 | | | 1,000 | | | | 906,140 | |
177th Series, 4.00%, 1/15/43 | | | 100 | | | | 98,652 | |
178th Series, 5.00%, 12/01/43 | | | 285 | | | | 306,646 | |
South Jersey Transportation Authority, Refunding RB, Transportation System, Series A: | | | | | | | | |
5.00%, 11/01/28 | | | 295 | | | | 322,742 | |
5.00%, 11/01/29 | | | 295 | | | | 320,518 | |
| | | | | | | | |
| | | | | | | | 50,206,421 | |
Utilities — 2.6% | | | | | | | | |
Gloucester County Pollution Control Financing Authority, Refunding RB, AMT, 5.00%, 12/01/24 | | | 500 | | | | 552,020 | |
North Hudson Sewerage Authority, Refunding RB, Sewerage, Series A (NPFGC),
0.00%, 8/01/21 (b)(c) | | | 5,000 | | | | 4,342,900 | |
Passaic Valley Water Commission, RB, Series A, 6.00%, 12/15/24 | | | 1,195 | | | | 1,376,963 | |
| | | | | | | | |
| | | | | | | | 6,271,883 | |
| Total Municipal Bonds in New Jersey | | | | | | | 226,313,359 | |
| | | | | | | | |
Puerto Rico — 0.3% | | | | | | | | |
Housing — 0.3% | | | | | | | | |
Puerto Rico Housing Finance Authority, Refunding RB, Subordinate, Capital Fund Modernization, 5.13%, 12/01/27 | | | 750 | | | | 753,435 | |
| Total Municipal Bonds — 95.2% | | | | | | | 227,066,794 | |
Municipal Bonds Transferred to
Tender Option Bond Trusts (e) | | Par (000) | | | Value | |
New Jersey — 5.4% | | | | | | | | |
County/City/Special District/School District — 2.9% | |
County of Union New Jersey Utilities Authority, Refunding LRB, Resource Recovery Facility, Covanta Union, Inc., Series A, AMT, 5.25%, 12/01/31 | | $ | 6,300 | | | $ | 6,840,099 | |
Transportation — 2.5% | | | | | | | | |
New Jersey Transportation Trust Fund Authority, RB, Transportation System, Series B, 5.25%, 6/15/36 (f) | | | 5,001 | | | | 5,506,954 | |
Port Authority of New York & New Jersey, RB, Consolidated, 169th Series, AMT, 5.00%, 10/15/41 | | | 495 | | | | 533,669 | |
| | | | | | | | |
| | | | | | | | 6,040,623 | |
Total Municipal Bonds Transferred to
Tender Option Bond Trusts — 5.4% | | | | 12,880,722 | |
Total Long-Term Investments
(Cost — $220,535,814) — 100.6% | | | | | | | 239,947,516 | |
| | | | | | | | |
| | |
| | |
| Short-Term Securities | | Shares | | | | |
BIF New Jersey Municipal Money Fund, 0.00% (g)(h) | | | 2,097,379 | | | | 2,097,379 | |
Total Short-Term Securities
(Cost — $2,097,379) — 0.9% | | | | | | | 2,097,379 | |
| Total Investments (Cost — $222,633,193) — 101.5% | | | | 242,044,895 | |
| Other Assets Less Liabilities — 1.5% | | | | | | | 3,685,901 | |
Liability for TOB Trust Certificates, Including Interest
Expense and Fees Payable — (3.0)% | | | | (7,233,028 | ) |
| | | | | | | | |
| Net Assets — 100.0% | | | | | | $ | 238,497,768 | |
| | | | | | | | |
|
| Notes to Schedule of Investments |
| (a) | | U.S. government securities, held in escrow, are used to pay interest on this security, as well as to retire the bond in full at the date indicated, typically at a premium to par. |
| (c) | | Security is collateralized by municipal or U.S. Treasury obligations. |
| (d) | | Represents a step-up bond that pays an initial coupon rate for the first period and then a higher coupon rate for the following periods. Rate shown is as of report date. |
| (e) | | Represent bonds transferred to a TOB. In exchange for which the Fund acquired residual interest certificates. These bonds serve as collateral in a financing transaction. See Note 3 of the Notes to Financial Statements for details of municipal bonds transferred to TOBs. |
| (f) | | All or a portion of security is subject to a recourse agreement, which may require the Fund to pay the liquidity provider in the event there is a shortfall between the TOB trust certificates and proceeds received from the sale of the security contributed to the TOB trust. In the case of a shortfall, the aggregate maximum potential amount the Fund could ultimately be required to pay under the agreements, which expire June 15, 2019, is $3,886,081. |
See Notes to Financial Statements.
| | | | | | |
| | | | | | | |
| | ANNUAL REPORT | | MAY 31, 2014 | | 23 |
| | |
Schedule of Investments (concluded) | | BlackRock New Jersey Municipal Bond Fund |
| (g) | | Investments in issuers considered to be an affiliate of the Fund during the year ended May 31, 2014, for purposes of Section 2(a)(3) of the Investment Company Act of 1940, as amended, were as follows: |
| | | | | | | | | | | | | | | | |
| Affiliate | | Shares Held
at May 31,
2013 | | | Net Activity | | | Shares Held
at May 31,
2014 | | | Income | |
BIF New Jersey Municipal Money Fund | | | 8,686,142 | | | | (6,588,763 | ) | | | 2,097,379 | | | | — | |
| (h) | | Represents the current yield as of report date. |
| Ÿ | | Financial futures contracts outstanding as of May 31, 2014 were as follows: |
| | | | | | | | | | | | | | | | |
| Contracts Sold | | | Issue | | Exchange | | Expiration | | Notional
Value | | | Unrealized
Depreciation | |
| | (355 | ) | | 10-Year U.S. Treasury Note | | Chicago Board of Trade | | September 2014 | | $ | 44,558,047 | | | $ | (183,544 | ) |
| Ÿ | | For Fund compliance purposes, the Fund’s sector classifications refer to any one or more of the sector sub-classifications used by one or more widely recognized market indexes or rating group indexes, and/or as defined by the investment advisor. These definitions may not apply for purposes of this report, which may combine such sector sub-classifications for reporting ease. |
| Ÿ | | Fair Value Measurements — Various inputs are used in determining the fair value of investments and derivative financial instruments. These inputs to valuation techniques are categorized into a disclosure hierarchy consisting of three broad levels for financial statement purposes as follows: |
| | Ÿ | | Level 1 — unadjusted price quotations in active markets/exchanges for identical assets or liabilities that the Fund has the ability to access |
| | Ÿ | | Level 2 — other observable inputs (including, but not limited to, quoted prices for similar assets or liabilities in markets that are active, quoted prices for identical or similar assets or liabilities in markets that are not active, inputs other than quoted prices that are observable for the assets or liabilities (such as interest rates, yield curves, volatilities, prepayment speeds, loss severities, credit risks and default rates) or other market-corroborated inputs) |
| | Ÿ | | Level 3 — unobservable inputs based on the best information available in the circumstances, to the extent observable inputs are not available (including the Fund’s own assumptions used in determining the fair value of investments and derivative financial instruments) |
The hierarchy gives the highest priority to unadjusted quoted prices in active markets for identical assets or liabilities (Level 1 measurements) and the lowest priority to unobservable inputs (Level 3 measurements). Accordingly, the degree of judgment exercised in determining fair value is greatest for instruments categorized in Level 3. The inputs used to measure fair value may fall into different levels of the fair value hierarchy. In such cases, for disclosure purposes, the fair value hierarchy classification is determined based on the lowest level input that is significant to the fair value measurement in its entirety.
Changes in valuation techniques may result in transfers into or out of an assigned level within the disclosure hierarchy. In accordance with the Fund’s policy, transfers between different levels of the fair value disclosure hierarchy are deemed to have occurred as of the beginning of the reporting period. The categorization of a value determined for investments and derivative financial instruments is based on the pricing transparency of the investment and derivative financial instrument and is not necessarily an indication of the risks associated with investing in those securities. For information about the Fund’s policy regarding valuation of investments and derivative financial instruments, please refer to Note 2 of the Notes to Financial Statements.
The following tables summarize the Fund’s investments and derivative financial instruments categorized in the disclosure hierarchy as of May 31, 2014:
| | | | | | | | | | | | | | |
| | | Level 1 | | | Level 2 | | | Level 3 | | Total | |
Assets: | | | | | | | | | | | | | | |
| Investments: | | | | | | | | | | | | | | |
Long-Term Investments1 | | | — | | | $ | 239,947,516 | | | — | | $ | 239,947,516 | |
Short-Term Securities | | $ | 2,097,379 | | | | — | | | — | | | 2,097,379 | |
| | | | | | | | | | | | | | |
Total | | $ | 2,097,379 | | | $ | 239,947,516 | | | — | | $ | 242,044,895 | |
| | | | | | | | | | | | | | |
1 See above Schedule of Investments for values in each sector. | |
| | | Level 1 | | | Level 2 | | | Level 3 | | Total | |
| Derivative Financial Instruments2 | | | | | | | |
Liabilities: | | | | | | | | | | | | | | |
Interest rate contracts | | $ | (183,544 | ) | | | — | | | — | | $ | (183,544 | ) |
2 Derivative financial instruments are financial futures contracts, which are valued at the unrealized appreciation/depreciation on the instrument. | |
The Fund may hold assets and/or liabilities in which the fair value approximates the carrying amount for financial statement purposes. As of May 31, 2014, such assets and/or liabilities are categorized within the disclosure hierarchy as follows:
| | | | | | | | | | | | | | |
| | | Level 1 | | | Level 2 | | | Level 3 | | Total | |
Assets: | | | | | | | | | | | | | | |
Cash pledged for financial futures contracts | | $ | 464,000 | | | | — | | | — | | $ | 464,000 | |
Liabilities: | | | | | | | | | | | | | | |
TOB trust certificates | | | — | | | $ | (7,231,154 | ) | | — | | | (7,231,154 | ) |
| | | | | | | | | | | | | | |
Total | | $ | 464,000 | | | $ | (7,231,154 | ) | | — | | $ | (6,767,154 | ) |
| | | | | | | | | | | | | | |
There were no transfers between levels during the year ended May 31, 2014.
See Notes to Financial Statements.
| | | | | | |
| | | | | | | |
| 24 | | ANNUAL REPORT | | MAY 31, 2014 | | |
| | |
Schedule of Investments May 31, 2014 | | BlackRock Pennsylvania Municipal Bond Fund (Percentages shown are based on Net Assets) |
| | | | | | | | |
| Municipal Bonds | | Par (000) | | | Value | |
Pennsylvania — 85.7% | | | | | | | | |
Corporate — 6.9% | | | | | |
County of Bradford Pennsylvania IDA, Refunding RB, International Paper Co. Project, Series B, AMT, 5.20%, 12/01/19 | | $ | 1,000 | | | $ | 1,041,540 | |
County of Delaware Pennsylvania IDA, RB, Water Facilities, Aqua Pennsylvania, Inc. Project, Series C, AMT (NPFGC), 5.00%, 2/01/35 | | | 5,670 | | | | 5,746,659 | |
Pennsylvania Economic Development Financing Authority, RB: | | | | | | | | |
American Water Co. Project, 6.20%, 4/01/39 | | | 3,490 | | | | 4,006,555 | |
Aqua Pennsylvania, Inc. Project, Series A, 5.00%, 10/01/39 | | | 3,000 | | | | 3,215,670 | |
Aqua Pennsylvania, Inc. Project, Series A, AMT, 6.75%, 10/01/18 | | | 9,400 | | | | 11,336,400 | |
Waste Management, Inc. Project, Series A, AMT, 5.10%, 10/01/27 | | | 300 | | | | 312,714 | |
Pennsylvania Economic Development Financing Authority, Refunding RB, Series A, AMT: | | | | | | | | |
Amtrak Project, 5.00%, 11/01/41 | | | 1,510 | | | | 1,595,979 | |
Aqua Pennsylvania, Inc. Project, 5.00%, 12/01/34 | | | 1,540 | | | | 1,666,788 | |
| | | | | | | | |
| | | | | | | | 28,922,305 | |
County/City/Special District/School District — 12.1% | | | | | | | | |
Allentown Neighborhood Improvement Zone Development Authority, Refunding RB, Series A: | | | | | | | | |
5.00%, 5/01/35 | | | 2,310 | | | | 2,383,042 | |
5.00%, 5/01/42 | | | 5,400 | | | | 5,523,822 | |
County of Allegheny Pennsylvania, GO, Refunding, Series C-57 (NPFGC), 5.00%, 11/01/21 | | | 5,775 | | | | 5,882,242 | |
County of Allegheny Pennsylvania IDA, Refunding RB, Residential Resource, Inc. Project, 5.13%, 9/01/31 | | | 670 | | | | 667,287 | |
County of Lycoming Pennsylvania Water & Sewer Authority, RB (AGM), 5.00%, 11/15/41 | | | 825 | | | | 873,378 | |
County of Northampton Pennsylvania IDA, Tax Allocation Bonds, 7.00%, 7/01/32 | | | 1,950 | | | | 2,089,152 | |
County of York Pennsylvania, GO, Refunding, 5.00%, 3/01/36 | | | 2,500 | | | | 2,727,900 | |
Philadelphia Redevelopment Authority, RB, Quality Redevelopment Neighborhood, Series B, AMT (NPFGC), 5.00%, 4/15/27 | | | 415 | | | | 428,438 | |
Philadelphia School District, GO, Series E, 6.00%, 9/01/38 | | | 6,600 | | | | 7,268,250 | |
Philipsburg-Osceola Pennsylvania Area School District, GO (AGM), 5.00%, 4/01/41 | | | 1,235 | | | | 1,313,867 | |
Souderton Area School District, GO (NPFGC), 5.00%, 5/15/15 (a) | | | 4,290 | | | | 4,482,406 | |
State Public School Building Authority, RB, Community College, Allegheny County Project (AGM), 5.00%, 7/15/34 | | | 5,070 | | | | 5,489,188 | |
State Public School Building Authority, Refunding RB, Harrisburg School District Project, Series A (AGC), 5.00%, 11/15/33 | | | 3,050 | | | | 3,206,892 | |
Township of Bristol Pennsylvania School District, GO, 5.25%, 6/01/43 | | | 5,980 | | | | 6,635,886 | |
Township of Falls Authority, RB, Water & Sewer Authority, 5.00%, 12/01/37 | | | 2,115 | | | | 2,292,258 | |
| | | | | | | | |
| | | | | | | | 51,264,008 | |
Education — 23.0% | | | | | | | | |
County of Adams Pennsylvania IDA, Refunding RB, Gettysburg College: | | | | | | | | |
5.00%, 8/15/24 | | | 580 | | | | 647,466 | |
5.00%, 8/15/25 | | | 765 | | | | 847,574 | |
5.00%, 8/15/26 | | | 760 | | | | 836,448 | |
| Municipal Bonds | | Par (000) | | | Value | |
Pennsylvania (continued) | | | | | | | | |
Education (concluded) | |
County of Cumberland Pennsylvania Municipal Authority, RB, AICUP Financing Program, Dickinson College Project, 5.00%, 11/01/39 | | $ | 1,000 | | | $ | 1,068,850 | |
County of Delaware Pennsylvania Authority, Refunding RB: | | | | | | | | |
Haverford College, 5.00%, 11/15/35 | | | 6,070 | | | | 6,634,267 | |
Villanova University, 5.25%, 12/01/31 | | | 600 | | | | 659,388 | |
Pennsylvania Higher Educational Facilities Authority, RB: | | | | | | | | |
Drexel University, Series A (NPFGC), 5.00%, 5/01/37 | | | 2,650 | | | | 2,850,022 | |
Shippensburg University Student Services, Student Housing, 5.00%, 10/01/44 | | | 2,450 | | | | 2,505,150 | |
State System of Higher Education, Series A (NPFGC), 5.00%, 6/15/26 | | | 3,300 | | | | 3,674,088 | |
Thomas Jefferson University, 5.00%, 3/01/40 | | | 11,000 | | | | 11,704,990 | |
Pennsylvania Higher Educational Facilities Authority, Refunding RB: | | | | | | | | |
Drexel University, Series A, 5.25%, 5/01/41 | | | 7,140 | | | | 7,732,906 | |
La Salle University, 5.00%, 5/01/37 | | | 1,595 | | | | 1,676,568 | |
La Salle University, 5.00%, 5/01/42 | | | 2,655 | | | | 2,783,104 | |
State System of Higher Education, Series AL, 5.00%, 6/15/35 | | | 9,500 | | | | 10,269,785 | |
Thomas Jefferson University, 4.00%, 3/01/37 | | | 755 | | | | 748,228 | |
Trustees of The University of Pennsylvania, Series C, 4.75%, 7/15/35 | | | 11,630 | | | | 12,064,380 | |
University of the Sciences Philadelphia (AGC), 5.00%, 11/01/32 | | | 5,000 | | | | 5,275,150 | |
Widener University, Series A, 5.25%, 7/15/33 | | | 2,420 | | | | 2,597,555 | |
Widener University, Series A, 5.50%, 7/15/38 | | | 365 | | | | 393,751 | |
Pennsylvania State University, RB: | | | | | | | | |
5.00%, 3/01/40 | | | 10,000 | | | | 11,166,600 | |
Series A, 5.00%, 8/15/28 | | | 5,045 | | | | 5,629,715 | |
Series A, 5.00%, 8/15/29 | | | 2,000 | | | | 2,221,900 | |
Swarthmore Borough Authority, Refunding RB, Swarthmore College Project, 5.00%, 9/15/38 | | | 1,830 | | | | 2,056,865 | |
Township of East Hempfield IDA, RB, Student Services, Inc., Student Housing Project at Millersville University of Pennsylvania: | | | | | | | | |
5.00%, 7/01/35 | | | 765 | | | | 785,770 | |
5.00%, 7/01/45 | | | 450 | | | | 456,548 | |
| | | | | | | | |
| | | | | | | | 97,287,068 | |
Health — 12.3% | | | | | | | | |
County of Centre Pennsylvania Hospital Authority, RB, Mount Nittany Medical Center Project, 7.00%, 11/15/46 | | | 4,110 | | | | 4,918,108 | |
County of Cumberland Pennsylvania Municipal Authority, Refunding RB: | | | | | | | | |
Asbury Pennsylvania Obligated Group, 5.25%, 1/01/41 | | | 2,540 | | | | 2,488,184 | |
Diakon Lutheran, 6.38%, 1/01/39 | | | 3,000 | | | | 3,260,370 | |
County of Dauphin Pennsylvania General Authority, Refunding RB, Pinnacle Health System Project, Series A, 6.00%, 6/01/29 | | | 5,000 | | | | 5,605,650 | |
County of Lancaster Pennsylvania Hospital Authority, Refunding RB, Brethren Village Project, Series A, 6.50%, 7/01/40 | | | 1,750 | | | | 1,823,097 | |
County of Lebanon Pennsylvania Good Samaritan Hospital Authority, Refunding RB, Pleasant View Retirement, Series A, 5.30%, 12/15/26 | | | 1,000 | | | | 1,004,140 | |
County of Montgomery Pennsylvania Higher Education & Health Authority, Refunding RB, Abington Memorial Hospital Obligated Group, Series A, 5.13%, 6/01/33 | | | 3,255 | | | | 3,431,616 | |
See Notes to Financial Statements.
| | | | | | |
| | | | | | | |
| | ANNUAL REPORT | | MAY 31, 2014 | | 25 |
| | |
Schedule of Investments (continued) | | BlackRock Pennsylvania Municipal Bond Fund (Percentages shown are based on Net Assets) |
| | | | | | | | |
| Municipal Bonds | | Par (000) | | | Value | |
Pennsylvania (continued) | | | | | | | | |
Health (concluded) | | | | | | | | |
County of Montgomery Pennsylvania IDA, RB, ACTS Retirement-Life Community: | | | | | | | | |
Series A, 4.50%, 11/15/36 | | $ | 880 | | | $ | 880,590 | |
Series A-1, 6.25%, 11/15/29 | | | 480 | | | | 544,042 | |
County of Montgomery Pennsylvania IDA, Refunding RB: | | | | | | | | |
ACTS Retirement-Life Communities, 5.00%, 11/15/27 | | | 1,385 | | | | 1,488,473 | |
ACTS Retirement-Life Communities, 5.00%, 11/15/28 | | | 895 | | | | 955,475 | |
Foulkeways at Gwynedd Project, Series A, 5.00%, 12/01/24 | | | 1,000 | | | | 1,029,940 | |
Lancaster IDA, Refunding RB: | | | | | | | | |
5.38%, 5/01/28 | | | 730 | | | | 774,275 | |
5.75%, 5/01/35 | | | 1,285 | | | | 1,380,386 | |
Pennsylvania Higher Educational Facilities Authority, Refunding RB, University of Pittsburgh Medical Center, Series E, 5.00%, 5/15/31 | | | 4,800 | | | | 5,168,064 | |
Philadelphia Hospitals & Higher Education Facilities Authority, Refunding RB: | | | | | | | | |
Jefferson Health System of Chester Philadelphia, Series B, 5.00%, 5/15/40 | | | 6,000 | | | | 6,321,720 | |
Presbyterian Medical Center,
6.65%, 12/01/19 (b) | | | 2,390 | | | | 2,808,656 | |
South Fork Municipal Authority, Refunding RB, Conemaugh Valley Memorial Hospital, Series B (AGC), 5.38%, 7/01/35 | | | 3,590 | | | | 3,894,540 | |
Southcentral General Authority, Refunding RB, Wellspan Health Obligation Group, Series A, 6.00%, 6/01/29 | | | 3,750 | | | | 4,314,562 | |
| | | | | | | | |
| | | | | | | | 52,091,888 | |
Housing — 7.5% | | | | | | | | |
City of Philadelphia Pennsylvania IDA, RB, Retirement Facilities: | | | | | | | | |
Rieder House Project, Series A, 6.10%, 7/01/33 | | | 490 | | | | 494,366 | |
Saligman House Project, Section 8, Series C (HUD), 6.10%, 7/01/33 | | | 490 | | | | 494,366 | |
Pennsylvania HFA, RB, S/F Mortgage, Series 114-C: | | | | | | | | |
3.65%, 10/01/37 | | | 4,120 | | | | 3,939,791 | |
3.70%, 10/01/42 | | | 7,020 | | | | 6,612,349 | |
Pennsylvania HFA, Refunding RB, S/F Mortgage: | | | | | | | | |
Series 92-A, AMT, 4.75%, 4/01/31 | | | 1,845 | | | | 1,854,354 | |
Series 96-A, AMT, 4.70%, 10/01/37 | | | 5,885 | | | | 5,916,956 | |
Series 99-A, AMT, 5.15%, 4/01/38 | | | 2,295 | | | | 2,362,243 | |
Series 110-B, 4.75%, 10/01/39 | | | 1,725 | | | | 1,796,536 | |
Series 113, 4.85%, 10/01/37 | | | 8,100 | | | | 8,110,530 | |
| | | | | | | | |
| | | | | | | | 31,581,491 | |
State — 7.1% | | | | | | | | |
Commonwealth Financing Authority, RB, Series B (AGC), 5.00%, 6/01/31 | | | 3,420 | | | | 3,758,854 | |
Commonwealth of Pennsylvania, GO: | | | | | | | | |
1st Series, 5.00%, 3/15/29 | | | 3,900 | | | | 4,468,542 | |
1st Series, 5.00%, 6/15/29 | | | 3,000 | | | | 3,539,670 | |
2nd Series A, 5.00%, 8/01/24 | | | 6,000 | | | | 6,728,160 | |
Pennsylvania Economic Development Financing Authority, Refunding RB, Unemployment Compensation, Series B, 5.00%, 7/01/23 | | | 5,825 | | | | 6,117,065 | |
State Public School Building Authority, Refunding RB, School District of Philadelphia Project, Series B (AGM), 5.00%, 6/01/24 | | | 5,000 | | | | 5,418,000 | |
| | | | | | | | |
| | | | | | | | 30,030,291 | |
| Municipal Bonds | | Par (000) | | | Value | |
Pennsylvania (concluded) | | | | | | | | |
Transportation — 12.5% | | | | | | | | |
City of Philadelphia Pennsylvania, ARB, Series A: | | | | | | | | |
5.00%, 6/15/40 | | $ | 14,000 | | | $ | 14,690,900 | |
AMT (AGM), 5.00%, 6/15/32 | | | 9,500 | | | | 9,802,290 | |
AMT (AGM), 5.00%, 6/15/37 | | | 1,250 | | | | 1,280,050 | |
Delaware River Port Authority, RB, Series D, 5.00%, 1/01/40 | | | 7,500 | | | | 8,003,325 | |
Pennsylvania Turnpike Commission, RB: | | | | | | | | |
CAB, Sub-Series A-3, 0.00%, 12/01/42 (c) | | | 6,740 | | | | 1,568,937 | |
CAB, Sub-Series A-3 (AGM),
0.00%, 12/01/40 (c) | | | 2,850 | | | | 785,973 | |
Series A, 5.00%, 12/01/38 | | | 4,000 | | | | 4,445,160 | |
Series A (AMBAC), 5.50%, 12/01/31 | | | 1,600 | | | | 1,636,208 | |
Sub-Series A, 5.13%, 12/01/26 | | | 1,285 | | | | 1,428,111 | |
Sub-Series A, 6.00%, 12/01/41 | | | 1,200 | | | | 1,317,252 | |
Southeastern Pennsylvania Transportation Authority, RB, Capital Grant Receipts: | | | | | | | | |
5.00%, 6/01/28 | | | 3,140 | | | | 3,477,550 | |
5.00%, 6/01/29 | | | 4,155 | | | | 4,577,065 | |
| | | | | | | | |
| | | | | | | | 53,012,821 | |
Utilities — 4.3% | |
City of Philadelphia Pennsylvania Gas Works, RB: | | | | | | | | |
9th Series, 5.25%, 8/01/40 | | | 3,300 | | | | 3,695,472 | |
12th Series B (NPFGC), 7.00%, 5/15/20 (b) | | | 1,040 | | | | 1,247,781 | |
City of Philadelphia Pennsylvania Water & Wastewater, RB: | | | | | | | | |
Series A, 5.25%, 1/01/36 | | | 1,450 | | | | 1,557,242 | |
Series C (AGM), 5.00%, 8/01/40 | | | 2,650 | | | | 2,832,320 | |
County of Allegheny Pennsylvania Sanitary Authority, RB, Sewer Improvement, 5.25%, 12/01/41 | | | 2,090 | | | | 2,310,516 | |
County of Allegheny Pennsylvania Sanitary Authority, Refunding RB, Sewer Improvement (AGM), 5.00%, 6/01/40 | | | 1,000 | | | | 1,084,240 | |
County of Delaware Pennsylvania Regional Water Quality Control Authority, RB, Sewer Improvements, 5.00%, 5/01/33 | | | 980 | | | | 1,098,943 | |
Pennsylvania Economic Development Financing Authority, RB, Philadelphia Biosolids Facility, 6.25%, 1/01/32 | | | 3,895 | | | | 4,182,490 | |
| | | | | | | | |
| | | | | | | | 18,009,004 | |
| Total Municipal Bonds in Pennsylvania | | | | | | | 362,198,876 | |
| | | | | | | | |
Guam — 1.0% | | | | | |
State — 0.5% | | | | | |
Territory of Guam, RB, Limited Obligation Bonds, Section 30, Series A, 5.63%, 12/01/29 | | | 1,760 | | | | 1,928,203 | |
Tobacco — 0.3% | | | | | | | | |
Guam Economic Development & Commerce Authority, Refunding RB, Tobacco Settlement, Asset-Backed, 5.63%, 6/01/47 | | | 1,750 | | | | 1,381,835 | |
Utility — 0.2% | |
Guam Government Waterworks Authority, Refunding RB, Water & Wastewater System, 6.00%, 7/01/25 | | | 1,000 | | | | 1,021,330 | |
| Total Municipal Bonds in Guam | | | | | | | 4,331,368 | |
| Total Municipal Bonds — 86.7% | | | | | | | 366,530,244 | |
See Notes to Financial Statements.
| | | | | | |
| | | | | | | |
| 26 | | ANNUAL REPORT | | MAY 31, 2014 | | |
| | |
Schedule of Investments (continued) | | BlackRock Pennsylvania Municipal Bond Fund (Percentages shown are based on Net Assets) |
| | | | | | | | |
Municipal Bonds Transferred to
Tender Option Bond Trusts (d) | | Par (000) | | | Value | |
Pennsylvania — 22.8% | | | | | | | | |
Education — 3.7% | | | | | | | | |
Pennsylvania Higher Educational Facilities Authority, RB, University of Pennsylvania Health System, Series A, 5.75%, 8/15/41 | | $ | 9,280 | | | $ | 10,517,395 | |
University of Pittsburgh, RB, The Commonwealth System of Higher Education, Capital Project, Series B, 5.00%, 9/15/28 | | | 4,448 | | | | 5,110,902 | |
| | | | | | | | |
| | | | | | | | 15,628,297 | |
Health — 11.8% | | | | | | | | |
County of Berks Pennsylvania Municipal Authority, Refunding RB, Reading Hospital & Medical Center Project, Series A-3, 5.50%, 11/01/31 | | | 10,000 | | | | 11,461,200 | |
Geisinger Authority Pennsylvania, RB, Health System: | | | | | | | | |
Series A, 5.13%, 6/01/34 | | | 7,460 | | | | 8,126,178 | |
Series A, 5.25%, 6/01/39 | | | 5,997 | | | | 6,512,052 | |
Series A-1, 5.13%, 6/01/41 | | | 12,570 | | | | 13,658,059 | |
Philadelphia Hospitals & Higher Education Facilities Authority, RB, The Children’s Hospital of Philadelphia Project, Series C, 5.00%, 7/01/41 | | | 9,380 | | | | 10,133,683 | |
| | | | | | | | |
| | | | | | | | 49,891,172 | |
Housing — 1.5% | | | | | | | | |
Pennsylvania HFA, Refunding RB, S/F Mortgage, Series 115A, AMT, 4.20%, 10/01/33 | | | 6,250 | | | | 6,289,063 | |
| | | | | | | | |
Municipal Bonds Transferred to
Tender Option Bond Trusts (d) | | Par (000) | | | Value | |
Pennsylvania (concluded) | |
State — 5.8% | |
Commonwealth of Pennsylvania, GO, Series 1, 5.00%, 3/15/28 | | $ | 10,797 | | | $ | 12,402,403 | |
Pennsylvania Turnpike Commission, RB, Oil Franchise Tax, Senior Series C (NPFGC), 5.00%, 12/01/32 | | | 11,000 | | | | 12,214,400 | |
| | | | | | | | |
| | | | | | | | 24,616,803 | |
Total Municipal Bonds Transferred to
Tender Option Bond Trusts — 22.8% | | | | | | | 96,425,335 | |
Total Long-Term Investments
(Cost — $430,973,481) — 109.5% | | | | | | | 462,955,579 | |
| | | | | | | | |
| | | | | | | | | |
| | |
| Short-Term Securities | | Shares | | | | |
BIF Pennsylvania Municipal Money Fund, 0.00% (e)(f) | | | 524,643 | | | | 524,643 | |
Total Short-Term Securities
(Cost — $524,643) — 0.1% | | | | 524,643 | |
| Total Investments (Cost — $431,498,124) — 109.6% | | | | 463,480,222 | |
| Other Assets Less Liabilities — 1.3% | | | | 5,464,681 | |
Liability for TOB Trust Certificates, Including Interest
Expense and Fees Payable — (10.9)% | | | | (46,138,369 | ) |
| | | | | | | | |
| Net Assets — 100.0% | | | $ | 422,806,534 | |
| | | | | | | | |
|
| Notes to Schedule of Investments |
| (a) | | U.S. government securities, held in escrow, are used to pay interest on this security, as well as to retire the bond in full at the date indicated, typically at a premium to par. |
| (b) | | Security is collateralized by municipal or U.S. Treasury obligations. |
| (d) | | Represent bonds transferred to a TOB. In exchange for which the Fund acquired residual interest certificates. These bonds serve as collateral in a financing transaction. See Note 3 of the Notes to Financial Statements for details of municipal bonds transferred to TOBs. |
| (e) | | Investments in issuers considered to be an affiliate of the Fund during the year ended May 31, 2014, for purposes of Section 2(a)(3) of the Investment Company Act of 1940, as amended, were as follows: |
| | | | | | | | | | | | | | | | |
| Affiliate | | Shares Held
at May 31,
2013 | | | Net
Activity | | | Shares Held
at May 31,
2014 | | | Income | |
BIF Pennsylvania Municipal Money Fund | | | 8,122,950 | | | | (7,598,307 | ) | | | 524,643 | | | | — | |
| (f) | | Represents the current yield as of report date. |
| Ÿ | | Financial futures contracts outstanding as of May 31, 2014 were as follows: |
| | | | | | | | | | | | | | | | |
| Contracts Sold | | | Issue | | Exchange | | Expiration | | Notional
Value | | | Unrealized
Appreciation | |
| | (290 | ) | | 10-Year U.S. Treasury Note | | Chicago Board of Trade | | September 2014 | | $ | 36,399,531 | | | $ | 18,137 | |
| Ÿ | | For Fund compliance purposes, the Fund’s sector classifications refer to any one or more of the sector sub-classifications used by one or more widely recognized market indexes or rating group indexes, and/or as defined by the investment advisor. These definitions may not apply for purposes of this report, which may combine such sector sub-classifications for reporting ease. |
| Ÿ | | Fair Value Measurements — Various inputs are used in determining the fair value of investments and derivative financial instruments. These inputs to valuation techniques are categorized into a disclosure hierarchy consisting of three broad levels for financial statement purposes as follows: |
| | Ÿ | | Level 1 — unadjusted price quotations in active markets/exchanges for identical assets or liabilities that the Fund has the ability to access |
| | Ÿ | | Level 2 — other observable inputs (including, but not limited to, quoted prices for similar assets or liabilities in markets that are active, quoted prices for identical or similar assets or liabilities in markets that are not active, inputs other than quoted prices that are observable for the assets or liabilities (such as interest rates, yield curves, volatilities, prepayment speeds, loss severities, credit risks and default rates) or other market-corroborated inputs) |
| | Ÿ | | Level 3 — unobservable inputs based on the best information available in the circumstances, to the extent observable inputs are not available (including the Fund’s own assumptions used in determining the fair value of investments and derivative financial instruments) |
See Notes to Financial Statements.
| | | | | | |
| | | | | | | |
| | ANNUAL REPORT | | MAY 31, 2014 | | 27 |
| | |
Schedule of Investments (concluded) | | BlackRock Pennsylvania Municipal Bond Fund |
The hierarchy gives the highest priority to unadjusted quoted prices in active markets for identical assets or liabilities (Level 1 measurements) and the lowest priority to unobservable inputs (Level 3 measurements). Accordingly, the degree of judgment exercised in determining fair value is greatest for instruments categorized in Level 3. The inputs used to measure fair value may fall into different levels of the fair value hierarchy. In such cases, for disclosure purposes, the fair value hierarchy classification is determined based on the lowest level input that is significant to the fair value measurement in its entirety.
Changes in valuation techniques may result in transfers into or out of an assigned level within the disclosure hierarchy. In accordance with the Fund’s policy, transfers between different levels of the fair value disclosure hierarchy are deemed to have occurred as of the beginning of the reporting period. The categorization of a value determined for investments and derivative financial instruments is based on the pricing transparency of the investment and derivative financial instrument and is not necessarily an indication of the risks associated with investing in those securities. For information about the Fund’s policy regarding valuation of investments and derivative financial instruments, please refer to Note 2 of the Notes to Financial Statements.
The following tables summarize the Fund’s investments and derivative financial instruments categorized in the disclosure hierarchy as of May 31, 2014:
| | | | | | | | | | | | | | | | |
| | | Level 1 | | | Level 2 | | | Level 3 | | | Total | |
Assets: | | | | | | | | | | | | | | | | |
| Investments: | | | | | | | | | | | | | | | | |
Long-Term Investments1 | | | — | | | $ | 462,955,579 | | | | — | | | $ | 462,955,579 | |
Short-Term Securities | | $ | 524,643 | | | | — | | | | — | | | | 524,643 | |
| | | | | | | | | | | | | | | | |
Total | | $ | 524,643 | | | $ | 462,955,579 | | | | — | | | $ | 463,480,222 | |
| | | | | | | | | | | | | | | | |
1 See above Schedule of Investments for values in each sector. | |
| | | Level 1 | | | Level 2 | | | Level 3 | | | Total | |
| Derivative Financial Instruments2 | | | | | | | | | | | | | | | | |
Assets: | | | | | | | | | | | | | | | | |
Interest rate contracts | | $ | 18,137 | | | | — | | | | — | | | $ | 18,137 | |
2 Derivative financial instruments are financial futures contracts, which are valued at the unrealized appreciation/depreciation on the instrument. | |
The Fund may hold assets and/or liabilities in which the fair value approximates the carrying amount for financial statement purposes. As of May 31, 2014, such assets and/or liabilities are categorized within the disclosure hierarchy as follows: | |
| | | Level 1 | | | Level 2 | | | Level 3 | | | Total | |
Assets: | | | | | | | | | | | | | | | | |
Cash pledged for financial futures contracts | | $ | 396,000 | | | | — | | | | — | | | $ | 396,000 | |
Liabilities: | | | | | | | | | | | | | | | | |
TOB trust certificates | | | — | | | $ | (46,126,645 | ) | | | — | | | | (46,126,645 | ) |
| | | | |
Total | | $ | 396,000 | | | $ | (46,126,645 | ) | | | — | | | $ | (45,730,645 | ) |
| | | | |
There were no transfers between levels during the year ended May 31, 2014.
See Notes to Financial Statements.
| | | | | | |
| | | | | | | |
| 28 | | ANNUAL REPORT | | MAY 31, 2014 | | |
| | |
Schedule of Investments May 31, 2014 | | BlackRock Strategic Municipal Opportunities Fund (Percentages shown are based on Net Assets) |
| | | | | | | | |
| Corporate Bonds — 0.2% | | Par (000) | | | Value | |
HP Communities LLC, 5.78%, 3/15/46 (a) | | $ | 2,000 | | | $ | 2,039,200 | |
| Total Corporate Bonds — 0.2% | | | | | | | 2,039,200 | |
| | | | | | | | |
| | | | | | | | | |
| | |
| Municipal Bonds | | | | | | |
Alabama — 0.2% | | | | | | | | |
County of Jefferson Alabama Sewer, Refunding RB, Sub-Lien, Series D, 7.00%, 10/01/51 | | | 3,000 | | | | 3,537,570 | |
Alaska — 0.2% | | | | | | | | |
Northern Tobacco Securitization Corp., Refunding RB, Tobacco Settlement, Asset-Backed, Series A, 5.00%, 6/01/46 | | | 4,500 | | | | 3,379,230 | |
Arizona — 1.8% | | | | | | | | |
Arizona Transportation Board, Refunding RB, GAN, 4.00%, 7/01/15 | | | 4,500 | | | | 4,687,425 | |
Arizona Water Infrastructure Finance Authority, RB,
Series A, 5.00%, 10/01/16 (b) | | | 5,000 | | | | 5,548,500 | |
City of Phoenix Arizona IDA, RB, Series A (a): | | | | | | | | |
6.50%, 7/01/34 | | | 965 | | | | 994,423 | |
6.75%, 7/01/44 | | | 1,690 | | | | 1,742,829 | |
County of Pima Arizona IDA, Refunding RB, Tucson Electric Power Co. Project, San Juan Project,
Series A, 4.95%, 10/01/20 | | | 1,500 | | | | 1,699,965 | |
Northern Arizona University, Refunding RB, 5.00%, 6/01/44 | | | 7,380 | | | | 8,104,790 | |
Salt Verde Financial Corp., RB, Senior, 5.25%, 12/01/19 | | | 2,000 | | | | 2,243,520 | |
| | | | | | | | |
| | | | | | | | 25,021,452 | |
California — 16.0% | | | | | | | | |
Anaheim Public Financing Authority California, RB, Senior, Public Improvements Project, Series A (AGM), 6.00%, 9/01/24 | | | 5,000 | | | | 5,985,850 | |
Bay Area Toll Authority, RB, San Francisco Bay Area Toll Bridge, Series C-1, 0.95%, 4/01/45 (c) | | | 5,000 | | | | 4,982,150 | |
California County Tobacco Securitization Agency, RB: | | | | | | | | |
6.00%, 6/01/42 | | | 885 | | | | 884,965 | |
County Securitization, Series A, 5.25%, 6/01/21 | | | 3,745 | | | | 3,760,467 | |
California Educational Facilities Authority, RB, 5.00%, 3/15/39 | | | 4,375 | | | | 5,575,412 | |
California Educational Facilities Authority, Refunding RB: | | | | | | | | |
5.00%, 10/01/32 | | | 10,000 | | | | 13,020,000 | |
5.00%, 6/01/43 | | | 10,210 | | | | 13,185,092 | |
California Health Facilities Financing Authority, RB, Sutter Health, Series A, 5.00%, 8/15/52 | | | 5,000 | | | | 5,389,700 | |
California Municipal Finance Authority, RB, 5.88%, 8/15/49 | | | 1,000 | | | | 996,200 | |
California Pollution Control Financing Authority, Refunding RB, Pacific Gas, Series C, AMT (NPFGC), 4.75%, 12/01/23 | | | 1,000 | | | | 1,078,280 | |
California State Department of Water Resources, Refunding RB, Series L, 5.00%, 5/01/19 | | | 5,000 | | | | 5,930,450 | |
California State Public Works Board, LRB, Various Capital Projects, Series A, 5.00%, 4/01/37 | | | 5,000 | | | | 5,431,350 | |
California State Public Works Board, RB, Various Capital Projects, Series A, 5.00%, 4/01/16 | | | 10,095 | | | | 10,945,605 | |
California Statewide Communities Development Authority, RB, Kaiser Permanente, Series A, 5.00%, 4/01/42 | | | 10,250 | | | | 11,083,530 | |
California Statewide Communities Development Authority, Refunding RB, Irvine LLC, UCI-East Campus, 5.00%, 5/15/38 | | | 5,000 | | | | 5,074,350 | |
| Municipal Bonds | | Par (000) | | | Value | |
California (concluded) | | | | | | | | |
California Statewide Financing Authority, RB, Tobacco Settlement: | | | | | | | | |
Series A, 6.00%, 5/01/37 | | $ | 585 | | | $ | 585,006 | |
Series A, 6.00%, 5/01/43 | | | 2,500 | | | | 2,499,800 | |
Series B, 6.00%, 5/01/37 | | | 265 | | | | 265,003 | |
Series B, 6.00%, 5/01/43 | | | 2,500 | | | | 2,499,800 | |
City & County of San Francisco California Airports Commission-San Francisco International Airport, Refunding RB: | | | | | | | | |
Series B, 4.90%, 5/01/29 | | | 5,000 | | | | 5,667,050 | |
Series D, 5.00%, 5/01/19 | | | 2,155 | | | | 2,554,903 | |
County of Los Angeles California Metropolitan Transportation Authority, Refunding RB, 5.00%, 7/01/16 | | | 3,250 | | | | 3,576,755 | |
County of Riverside California Transportation Commission, Refunding RB, Series A, 5.25%, 6/01/30 | | | 9,000 | | | | 10,728,180 | |
Cupertino Union School District, GO, Series B, 5.00%, 8/01/36 | | | 3,000 | | | | 3,431,850 | |
East Bay Municipal Utility District Water System Revenue, Refunding RB (d): | | | | | | | | |
Series A, 5.00%, 6/01/32 | | | 5,000 | | | | 5,910,800 | |
Series B, 5.00%, 6/01/25 | | | 5,000 | | | | 6,289,650 | |
Series B, 5.00%, 6/01/28 | | | 9,015 | | | | 11,366,202 | |
Series B, 5.00%, 6/01/29 | | | 5,000 | | | | 6,256,100 | |
Foothill-Eastern Transportation Corridor Agency, Refunding RB, Series A, 6.00%, 1/15/49 | | | 3,770 | | | | 4,302,513 | |
Golden State Tobacco Securitization Corp., Refunding RB, 5.75%, 6/01/47 | | | 4,000 | | | | 3,355,000 | |
Inland Valley Development Agency, Refunding, Tax Allocation Bonds, Series A, 5.00%, 9/01/44 | | | 5,000 | | | | 5,341,850 | |
Los Angeles Department of Water & Power, Refunding RB, Series A, 5.00%, 7/01/43 | | | 5,000 | | | | 5,531,500 | |
Southern California Public Power Authority, RB, Project No. 1, Series A, 5.25%, 11/01/19 | | | 2,445 | | | | 2,797,080 | |
State of California, GO, Refunding, Various Purposes: | | | | | | | | |
5.00%, 10/01/23 | | | 5,000 | | | | 6,109,450 | |
5.00%, 11/01/43 | | | 10,000 | | | | 11,050,800 | |
State of California, GO, Various Purposes: | | | | | | | | |
5.00%, 9/01/42 | | | 6,380 | | | | 6,983,867 | |
5.00%, 5/01/44 | | | 5,000 | | | | 5,548,600 | |
State of California Department of Water, Refunding RB, 5.00%, 12/01/16 | | | 5,315 | | | | 5,939,512 | |
University of California, Refunding RB: | | | | | | | | |
Limited Project, Series G, 5.00%, 5/15/37 | | | 5,000 | | | | 5,546,300 | |
Series AF, 5.00%, 5/15/36 | | | 5,000 | | | | 5,621,500 | |
| | | | | | | | |
| | | | | | | | 223,082,472 | |
Colorado — 1.3% | | | | | | | | |
City & County of Denver Colorado, Refunding RB, Special Facilities, United Airlines Project, Series A, AMT, 5.75%, 10/01/32 | | | 5,000 | | | | 5,160,000 | |
City of Lakewood Colorado Plaza Metropolitan District No. 1, Refunding, Tax Allocation Bonds, 4.00%, 12/01/23 | | | 1,000 | | | | 989,870 | |
Colorado Educational & Cultural Facilities Authority, RB, Charter Littleton Preparatory School, 5.00%, 12/01/22 | | | 200 | | | | 204,870 | |
Denver Urban Renewal Authority, Refunding, Tax Allocation Bond, Stapleton, Senior-Series A-1, 5.00%, 12/01/23 | | | 5,000 | | | | 5,802,500 | |
Regional Transportation District, RB (AMBAC), 5.00%, 11/01/16 (b) | | | 5,000 | | | | 5,556,150 | |
| | | | | | | | |
| | | | | | | | 17,713,390 | |
See Notes to Financial Statements.
| | | | | | |
| | | | | | | |
| | ANNUAL REPORT | | MAY 31, 2014 | | 29 |
| | |
Schedule of Investments (continued) | | BlackRock Strategic Municipal Opportunities Fund (Percentages shown are based on Net Assets) |
| | | | | | | | |
| Municipal Bonds | | Par (000) | | | Value | |
Delaware — 1.8% | | | | | | | | |
Delaware Transportation Authority, Refunding RB, 5.00%, 7/01/20 | | $ | 10,000 | | | $ | 12,025,400 | |
Public Charter School Receivables Co. LLC, 4.00%, 12/31/14 (a) | | | 7,000 | | | | 7,000,000 | |
State of Delaware, GO, 5.00%, 3/01/17 | | | 5,000 | | | | 5,609,550 | |
| | | | | | | | |
| | | | | | | | 24,634,950 | |
District of Columbia — 1.5% | | | | | | | | |
District of Columbia Water & Sewer Authority, RB, Series A, 5.00%, 10/01/44 | | | 10,000 | | | | 11,143,200 | |
Metropolitan Washington Airports Authority, Refunding RB, 5.00%, 10/01/53 | | | 10,000 | | | | 10,433,500 | |
| | | | | | | | |
| | | | | | | | 21,576,700 | |
Florida — 3.5% | | | | | | | | |
Capital Trust Agency Inc, RB: | | | | | | | | |
8.25%, 1/01/44 | | | 940 | | | | 946,063 | |
8.25%, 1/01/49 | | | 3,010 | | | | 3,017,525 | |
County of Alachua Florida Health Facilities Authority, RB, East Ridge Retirement Village, Inc. Project, 6.25%, 11/15/44 | | | 2,000 | | | | 2,072,940 | |
County of Brevard Florida Health Facilities Authority, Refunding RB, Series A, 5.00%, 4/01/31 | | | 5,655 | | | | 6,191,151 | |
County of Collier Florida IDA, Refunding RB (a): | | | | | | | | |
Arlington of Naples Project, Series B-2, 6.50%, 5/15/20 | | | 3,500 | | | | 3,520,125 | |
Series A, 8.25%, 5/15/49 | | | 1,000 | | | | 1,077,360 | |
County of Miami-Dade Florida Aviation Revenue, Refunding RB, AMT, Series A (CIFG), 5.00%, 10/01/38 | | | 5,000 | | | | 5,059,600 | |
County of Orange Florida Health Facilities Authority, RB, 5.50%, 7/01/38 | | | 1,000 | | | | 1,001,350 | |
County of Palm Beach Florida Health Facilities Authority, Refunding RB, 7.50%, 6/01/49 | | | 1,000 | | | | 1,112,780 | |
Florida Higher Educational Facilities Financial Authority, Refunding RB, 5.00%, 4/01/27 | | | 6,155 | | | | 6,627,519 | |
Midtown Miami Community Development District, Refunding, Special Assessment Bonds, Series B, 5.00%, 5/01/37 | | | 1,885 | | | | 1,906,565 | |
State of Florida Department of Transportation, RB, 5.00%, 7/01/36 | | | 5,000 | | | | 5,591,650 | |
Sterling Hill Community Development District, Refunding RB, Special Assessment Bonds, Series B, 5.50%, 11/01/10 (e)(f) | | | 155 | | | | 99,247 | |
Tampa Bay Water, Refunding RB, 5.50%, 10/01/21 | | | 5,000 | | | | 6,225,100 | |
Tolomato Community Development District (e)(f): | | | | | | | | |
Series 1, 6.38%, 5/01/17 | | | 15 | | | | 15,105 | |
Series 2, 6.38%, 5/01/17 | | | 1,290 | | | | 802,496 | |
Series 3, 6.38%, 5/01/17 | | | 425 | | | | 4 | |
Tolomato Community Development District, Refunding, Special Assessment, Convertible CAB: | | | | | | | | |
Series A-1, 6.38%, 5/01/17 | | | 305 | | | | 300,815 | |
Series A-2, 0.00%, 5/01/39 (g) | | | 150 | | | | 109,836 | |
Series A-3, 0.00%, 5/01/40 (g) | | | 360 | | | | 214,776 | |
Series A-4, 0.00%, 5/01/40 (g) | | | 190 | | | | 83,902 | |
Village Community Development District No. 10, Special Assessment Bonds, Sumter County, 4.50%, 5/01/23 | | | 3,550 | | | | 3,606,658 | |
| | | | | | | | |
| | | | | | | | 49,582,567 | |
Guam — 0.7% | | | | | | | | |
Guam Government Waterworks Authority, RB: | | | | | | | | |
5.25%, 7/01/22 | | | 525 | | | | 591,959 | |
5.25%, 7/01/25 | | | 1,735 | | | | 1,926,717 | |
5.00%, 7/01/28 | | | 1,250 | | | | 1,334,575 | |
5.63%, 7/01/40 | | | 3,000 | | | | 3,100,380 | |
| Municipal Bonds | | Par (000) | | | Value | |
Guam (concluded) | | | | | | | | |
Territory of Guam, GO, Series A: | | | | | | | | |
6.00%, 11/15/19 | | $ | 570 | | | $ | 621,602 | |
7.00%, 11/15/39 | | | 2,390 | | | | 2,598,002 | |
| | | | | | | | |
| | | | | | | | 10,173,235 | |
Illinois — 2.9% | | | | | | | | |
City of Chicago Illinois, GO: | | | | | | | | |
Taxable Project, Recovery Zone, Series D, 6.26%, 1/01/40 | | | 1,500 | | | | 1,542,870 | |
Refunding Series A, 5.00%, 1/01/35 | | | 5,000 | | | | 5,169,100 | |
Refunding Series A, 5.25%, 1/01/37 | | | 5,000 | | | | 5,099,500 | |
City of Chicago Illinois O’Hare International Airport, RB, 3rd Lien, Series F, 5.00%, 1/01/40 | | | 3,500 | | | | 3,668,175 | |
City of Chicago Illinois O’Hare International Airport, Refunding GARB, Senior Lien, AMT: | | | | | | | | |
Series A, 5.00%, 1/01/23 | | | 5,000 | | | | 5,772,350 | |
Series B, 5.00%, 1/01/22 | | | 5,000 | | | | 5,780,250 | |
Illinois Finance Authority, Refunding RB: | | | | | | | | |
Lutheran Home & Services Obligated Group, 5.63%, 5/15/42 | | | 2,500 | | | | 2,532,300 | |
Primary Health Care Centers Program, 5.90%, 7/01/14 | | | 115 | | | | 115,149 | |
Railsplitter Tobacco Settlement Authority, RB, 6.25%, 6/01/24 | | | 3,000 | | | | 3,326,880 | |
State of Illinois, GO, 5.00%, 5/01/35 | | | 7,000 | | | | 7,380,520 | |
| | | | | | | | |
| | | | | | | | 40,387,094 | |
Indiana — 1.2% | | | | | | | | |
City of Carmel Indiana, RB, Barrington Carmel Project, Series A, 7.13%, 11/15/42 | | | 2,000 | | | | 2,121,220 | |
City of Valparaiso Indiana, RB, Exempt Facilities, Pratt Paper LLC Project, AMT, 5.88%, 1/01/24 | | | 750 | | | | 828,750 | |
Indiana Bond Bank, RB, Series A, 5.00%, 10/15/17 | | | 2,000 | | | | 2,223,280 | |
Indiana Finance Authority, RB, Private Activity Bond, Ohio River Bridges East End Crossing Project, Series A, AMT, 5.00%, 7/01/48 | | | 7,980 | | | | 8,214,532 | |
Indiana Finance Authority, Refunding RB, US Steel Corp. Project, 6.00%, 12/01/19 | | | 3,000 | | | | 3,224,760 | |
| | | | | | | | |
| | | | | | | | 16,612,542 | |
Iowa — 1.0% | | | | | | | | |
Iowa Finance Authority, Refunding RB, Midwestern Disaster Area, Iowa Fertilizer Co. Project: | | | | | | | | |
5.00%, 12/01/19 | | | 5,320 | | | | 5,545,728 | |
5.50%, 12/01/22 | | | 2,500 | | | | 2,600,875 | |
Iowa Higher Education Loan Authority, Refunding RB, Private College Facility, Upper Iowa University Project, 5.00%, 9/01/20 | | | 1,000 | | | | 1,042,970 | |
Iowa Tobacco Settlement Authority, Refunding RB, Asset-Backed, Series C: | | | | | | | | |
5.50%, 6/01/42 | | | 2,000 | | | | 1,703,920 | |
5.63%, 6/01/46 | | | 3,000 | | | | 2,570,460 | |
| | | | | | | | |
| | | | | | | | 13,463,953 | |
Kansas — 0.4% | | | | | | | | |
State of Kansas Department of Transportation, Refunding RB, Series B, 5.00%, 9/01/22 | | | 5,000 | | | | 6,147,100 | |
Kentucky — 0.4% | | | | | | | | |
Lexington-Fayette Urban County Government Public Facilities Corp., Refunding LRB, Eastern State Hospital Project, Series A, 5.00%, 6/01/24 | | | 5,000 | | | | 5,705,900 | |
Louisiana — 0.8% | | | | | | | | |
Louisiana Local Government Environmental Facilities & Community Development Authority, RB: | | | | | | | | |
5.00%, 2/01/26 | | | 3,130 | | | | 3,661,443 | |
5.00%, 2/01/27 | | | 2,225 | | | | 2,582,824 | |
See Notes to Financial Statements.
| | | | | | |
| | | | | | | |
| 30 | | ANNUAL REPORT | | MAY 31, 2014 | | |
| | |
Schedule of Investments (continued) | | BlackRock Strategic Municipal Opportunities Fund (Percentages shown are based on Net Assets) |
| | | | | | | | |
| Municipal Bonds | | Par (000) | | | Value | |
Louisiana (concluded) | | | | | | | | |
Louisiana Public Facilities Authority, RB, 5.00%, 10/01/41 | | $ | 5,000 | | | $ | 5,400,700 | |
| | | | | | | | |
| | | | | | | | 11,644,967 | |
Maine — 0.8% | | | | | | | | |
Maine Health & Higher Educational Facilities Authority, Refunding RB, Bowdoin College, Series A, 5.00%, 7/01/39 | | | 5,000 | | | | 5,501,200 | |
State of Maine, GO, Series B, 4.00%, 6/01/16 | | | 4,740 | | | | 5,091,755 | |
| | | | | | | | |
| | | | | | | | 10,592,955 | |
Maryland — 2.6% | | | | | | | | |
County of Howard Maryland, Tax Allocation Bonds, Annapolis Junction Town Center Project, 6.10%, 2/15/44 | | | 1,170 | | | | 1,237,485 | |
Maryland EDC, Refunding RB, CNX Marine Terminals, Inc., 5.75%, 9/01/25 | | | 1,770 | | | | 1,914,308 | |
State of Maryland, GO: | | | | | | | | |
2nd Series, 5.00%, 7/15/18 | | | 5,000 | | | | 5,828,400 | |
2rd Series B, 5.00%, 8/01/16 | | | 5,000 | | | | 5,507,150 | |
Refunding 1st Series, 5.00%, 8/01/20 | | | 10,000 | | | | 12,071,700 | |
Refunding 2nd Series E, 5.00%, 8/01/15 | | | 3,435 | | | | 3,629,490 | |
University System of Maryland, RB, Series A, 5.00%, 4/01/20 | | | 5,000 | | | | 5,990,600 | |
| | | | | | | | |
| | | | | | | | 36,179,133 | |
Massachusetts — 3.4% | | | | | | | | |
Commonwealth of Massachusetts, GO, Refunding, Series B, 5.00%, 8/01/16 | | | 3,005 | | | | 3,306,822 | |
Commonwealth of Massachusetts, GO, Series E: | | | | | | | | |
5.00%, 12/01/16 | | | 6,005 | | | | 6,695,095 | |
(AMBAC), 5.00%, 11/01/16 (b) | | | 5,000 | | | | 5,557,450 | |
Massachusetts Bay Transportation Authority, Refunding RB, Series B, 5.25%, 7/01/16 | | | 10,000 | | | | 11,037,500 | |
Massachusetts Development Finance Agency, Refunding RB: | | | | | | | | |
Covanta Energy Project, Series C, AMT, 5.25%, 11/01/42 | | | 2,000 | | | | 2,031,140 | |
Series A, 5.00%, 9/01/43 | | | 5,795 | | | | 6,559,940 | |
Massachusetts Health & Educational Facilities Authority, RB, Refunding, Series D, 5.50%, 7/01/40 | | | 1,000 | | | | 1,002,970 | |
Massachusetts Port Authority, RB, Delta Air Lines, Inc. Project, Series A, AMT (AMBAC): | | | | | | | | |
5.50%, 1/01/15 | | | 4,000 | | | | 4,001,960 | |
5.00%, 1/01/27 | | | 1,000 | | | | 994,600 | |
University of Massachusetts Building Authority, Refunding RB, 5.00%, 11/01/44 | | | 5,000 | | | | 5,668,650 | |
| | | | | | | | |
| | | | | | | | 46,856,127 | |
Michigan — 1.4% | | | | | | | | |
City of Detroit Michigan Sewage Disposal System, Refunding RB, Senior Lien, Series A, 5.00%, 7/01/23 | | | 2,000 | | | | 1,980,500 | |
Michigan Tobacco Settlement Finance Authority, RB, Series A, 7.31%, 6/01/34 | | | 5,985 | | | | 5,157,035 | |
Royal Oak Hospital Finance Authority, Refunding RB, William Beaumont Hospital Obligated Group: | | | | | | | | |
Series D, 5.00%, 9/01/39 | | | 10,000 | | | | 10,741,900 | |
Series W, 6.25%, 8/01/23 | | | 2,000 | | | | 2,011,180 | |
| | | | | | | | |
| | | | | | | | 19,890,615 | |
Minnesota — 0.8% | | | | | | | | |
State of Minnesota, GO: | | | | | | | | |
Series A, 5.00%, 8/01/15 | | | 5,000 | | | | 5,283,100 | |
Series D, 5.00%, 10/01/16 | | | 4,900 | | | | 5,431,405 | |
| | | | | | | | |
| | | | | | | | 10,714,505 | |
| Municipal Bonds | | Par (000) | | | Value | |
Missouri — 2.1% | | | | | | | | |
Health & Educational Facilities Authority of the State of Missouri, Refunding RB, Series A, 5.00%, 6/01/26 | | $ | 4,000 | | | $ | 4,660,320 | |
Missouri Highway & Transportation Commission, Refunding RB, Series A (d): | | | | | | | | |
5.00%, 5/01/21 | | | 5,000 | | | | 6,076,650 | |
5.00%, 5/01/22 | | | 5,000 | | | | 6,136,150 | |
5.00%, 5/01/23 | | | 5,000 | | | | 6,196,900 | |
University of Missouri, Refunding RB, Series A, 5.00%, 11/01/19 | | | 5,000 | | | | 5,945,550 | |
| | | | | | | | |
| | | | | | | | 29,015,570 | |
Nevada — 0.5% | | | | | | | | |
Las Vegas Special Improvement District 607, Refunding, Special Assessment, Local Improvement: | | | | | | | | |
5.00%, 6/01/23 | | | 440 | | | | 469,220 | |
5.00%, 6/01/24 | | | 310 | | | | 331,288 | |
Las Vegas Valley Water District Nevada, GO, Limited Tax, Build America Bonds, Series C, 7.01%, 6/01/39 | | | 1,025 | | | | 1,123,964 | |
State of Nevada, Refunding RB, 5.00%, 12/01/16 | | | 4,460 | | | | 4,970,759 | |
| | | | | | | | |
| | | | | | | | 6,895,231 | |
New Jersey — 5.8% | | | | | | | | |
County of Gloucester New Jersey Pollution Control Financing Authority, Refunding RB, AMT, 5.00%, 12/01/24 | | | 1,500 | | | | 1,656,060 | |
New Jersey EDA, RB: | | | | | | | | |
AMT, Series A, 10.50%, 6/01/32 (a) | | | 3,500 | | | | 3,590,125 | |
Continental Airlines, Inc. Project, AMT, 4.88%, 9/15/19 | | | 8,815 | | | | 9,008,137 | |
Patterson Charter School for Science and Technology, Inc. Project, Series A, 5.00%, 7/01/22 | | | 630 | | | | 651,559 | |
New Jersey EDA, Refunding RB, School Facilities Construction, Series DD-1, 5.00%, 12/15/16 | | | 5,000 | | | | 5,543,200 | |
New Jersey Educational Facilities Authority, Refunding RB: | | | | | | | | |
Series A, 5.00%, 7/01/26 | | | 5,000 | | | | 6,186,250 | |
University of Medicine & Dentistry, Series B, 6.50%, 6/01/19 (b) | | | 2,000 | | | | 2,512,640 | |
New Jersey Health Care Facilities Financing Authority, RB: | | | | | | | | |
5.50%, 7/01/33 | | | 2,000 | | | | 2,000,840 | |
Robert Wood Johnson University Hospital, Series A, 5.00%, 7/01/22 | | | 1,010 | | | | 1,172,963 | |
New Jersey Health Care Facilities Financing Authority, Refunding RB: | | | | | | | | |
Holy Name Medical Center, 4.00%, 7/01/17 | | | 2,000 | | | | 2,117,880 | |
St. Barnabas Health, Series A, 5.00%, 7/01/23 | | | 1,100 | | | | 1,264,153 | |
St. Barnabas Health, Series A, 5.00%, 7/01/24 | | | 2,100 | | | | 2,391,459 | |
New Jersey Transportation Trust Fund Authority, RB, Transportation System, Series A, 5.00%, 6/15/42 | | | 10,000 | | | | 10,688,800 | |
Rutgers - The State University of New Jersey, Refunding RB, Series L, 5.00%, 5/01/43 | | | 5,645 | | | | 6,275,095 | |
State of New Jersey, GO, 5.00%, 6/01/17 | | | 6,500 | | | | 7,314,255 | |
State of New Jersey, GO, Refunding, Series H, 5.25%, 7/01/18 | | | 5,000 | | | | 5,820,300 | |
Tobacco Settlement Financing Corp. New Jersey, Refunding RB, Series 1A: | | | | | | | | |
4.50%, 6/01/23 | | | 7,500 | | | | 7,494,525 | |
5.00%, 6/01/29 | | | 3,805 | | | | 3,276,333 | |
5.00%, 6/01/41 | | | 2,500 | | | | 1,962,350 | |
| | | | | | | | |
| | | | | | | | 80,926,924 | |
See Notes to Financial Statements.
| | | | | | |
| | | | | | | |
| | ANNUAL REPORT | | MAY 31, 2014 | | 31 |
| | |
Schedule of Investments (continued) | | BlackRock Strategic Municipal Opportunities Fund (Percentages shown are based on Net Assets) |
| | | | | | | | |
| Municipal Bonds | | Par (000) | | | Value | |
New Mexico — 0.2% | | | | | | | | |
City of Santa Fe New Mexico, Refunding RB, Gross Tax Receipts, Series A, 5.00%, 6/01/15 | | $ | 3,000 | | | $ | 3,145,230 | |
New York — 9.5% | | | | | | | | |
City of New York New York, GO, Refunding, Series E: | | | | | | | | |
5.00%, 8/01/16 | | | 5,725 | | | | 6,296,527 | |
5.00%, 8/01/24 | | | 5,000 | | | | 5,815,400 | |
City of New York New York Industrial Development Agency, RB, JetBlue Airways Corp. Project, AMT, 5.13%, 5/15/30 | | | 600 | | | | 593,544 | |
City of New York New York Industrial Development Agency, Refunding RB, Terminal One Group Association Project, AMT, 5.50%, 1/01/21 (c) | | | 1,500 | | | | 1,605,945 | |
City of New York New York Water & Sewer System, Refunding RB, 2nd General Resolution, Series CC, 5.00%, 6/15/47 | | | 10,000 | | | | 10,926,800 | |
County of Chautauqua New York Industrial Development Agency, RB, NRG Dunkirk Power Project, 5.88%, 4/01/42 | | | 3,000 | | | | 3,227,490 | |
County of Dutchess New York Industrial Development Agency, RB, Bard College Civic Facility, Series A-2, 4.50%, 8/01/36 | | | 2,480 | | | | 2,299,133 | |
County of Dutchess New York Industrial Development Agency, Refunding RB, 5.00%, 8/01/46 | | | 3,400 | | | | 3,346,280 | |
County of Essex New York Industrial Development Agency, Refunding RB, International Paper Co. Project, Series A, AMT, 5.20%, 12/01/23 | | | 2,300 | | | | 2,352,003 | |
County of Westchester New York Healthcare Corp., Refunding RB, Senior Lien, Remarketing, Series A, 5.00%, 11/01/23 | | | 5,685 | | | | 6,363,164 | |
County of Westchester New York Local Development Corp., RB, Pace University, Series A, 5.50%, 5/01/42 | | | 2,500 | | | | 2,675,425 | |
Erie Tobacco Asset Securitization Corp., Refunding RB, Series A, 5.00%, 6/01/45 | | | 865 | | | | 691,896 | |
Metropolitan Transportation Authority, RB: | | | | | | | | |
Series E, 5.00%, 11/15/38 | | | 5,000 | | | | 5,472,900 | |
Sub-Series B-2, 5.00%, 11/15/22 | | | 5,000 | | | | 5,980,350 | |
Metropolitan Transportation Authority, Refunding RB, Series D, 5.00%, 11/15/16 | | | 6,875 | | | | 7,636,200 | |
New York Counties Tobacco Trust IV, Refunding RB, Series A: | | | | | | | | |
5.00%, 6/01/42 | | | 1,240 | | | | 967,324 | |
5.00%, 6/01/45 | | | 515 | | | | 397,987 | |
New York State Dormitory Authority, New York University Hospitals Center, RB, Series A: | | | | | | | | |
5.00%, 7/01/22 | | | 1,725 | | | | 1,950,423 | |
5.13%, 7/01/23 | | | 1,665 | | | | 1,878,736 | |
5.00%, 7/01/43 | | | 5,000 | | | | 5,566,950 | |
New York State Dormitory Authority, Refunding RB: | | | | | | | | |
5.00%, 9/01/38 | | | 2,500 | | | | 2,508,975 | |
Series A, 5.00%, 2/15/27 | | | 10,000 | | | | 11,908,900 | |
Series A, 5.00%, 7/01/42 | | | 5,000 | | | | 5,520,400 | |
New York State Thruway Authority, Refunding RB, Series J, 5.00%, 1/01/27 | | | 5,000 | | | | 5,841,200 | |
New York State Urban Development Corp., RB, Service Contract, Series B, 5.00%, 1/01/21 | | | 1,470 | | | | 1,679,695 | |
Niagara Area Development Corp., Refunding RB, Solid Waste Disposal Facility, Covanta Energy Project, Series B, 4.00%, 11/01/24 | | | 1,000 | | | | 1,011,450 | |
Port Authority of New York & New Jersey, ARB, JFK International Air Terminal LLC Project, 5.00%, 12/01/20 | | | 1,500 | | | | 1,677,450 | |
Port Authority of New York & New Jersey, Refunding ARB, Consolidated, 178th Series, AMT, 5.00%, 12/01/22 | | | 5,025 | | | | 5,970,906 | |
| Municipal Bonds | | Par (000) | | | Value | |
New York (concluded) | | | | | | | | |
Triborough Bridge & Tunnel Authority, Refunding RB, Series B, 5.00%, 11/15/22 | | $ | 5,000 | | | $ | 6,079,500 | |
TSASC Inc, Refunding RB: | | | | | | | | |
5.00%, 6/01/26 | | | 7,000 | | | | 6,851,670 | |
5.00%, 6/01/34 | | | 1,160 | | | | 1,001,672 | |
Utility Debt Securitization Authority, Refunding RB, Series TE, 5.00%, 12/15/29 | | | 5,000 | | | | 5,920,050 | |
| | | | | | | | |
| | | | | | | | 132,016,345 | |
North Carolina — 1.1% | | | | | | | | |
City of Charlotte North Carolina, Refunding RB, Charlotte-Douglas International Airport, Special Facilities Revenue, US Airways, Inc. Project, AMT, 5.60%, 7/01/27 | | | 4,500 | | | | 4,512,240 | |
North Carolina Medical Care Commission, RB, 1st Mortgage, Galloway Ridge Project, Series A: | | | | | | | | |
4.13%, 1/01/17 | | | 200 | | | | 205,152 | |
4.30%, 1/01/18 | | | 555 | | | | 571,794 | |
4.50%, 1/01/19 | | | 520 | | | | 538,049 | |
4.75%, 1/01/21 | | | 270 | | | | 279,218 | |
5.00%, 1/01/22 | | | 290 | | | | 300,266 | |
North Carolina Medical Care Commission, Refunding RB, 1st Mortgage, Retirement Facilities Whitestone Project, Series A, 7.75%, 3/01/41 | | | 2,500 | | | | 2,785,100 | |
State of North Carolina, GO, Refunding Series A, 5.00%, 6/01/19 | | | 5,000 | | | | 5,931,900 | |
| | | | | | | | |
| | | | | | | | 15,123,719 | |
Ohio — 1.6% | | | | | | | | |
Buckeye Tobacco Settlement Financing Authority, RB, Asset-Backed, Senior Turbo Term, Series A-2, 6.50%, 6/01/47 | | | 2,500 | | | | 2,198,725 | |
County of Hamilton Ohio, RB, Christ Hospital Project, 5.00%, 6/01/42 | | | 7,000 | | | | 7,372,400 | |
State of Ohio, GO, Refunding Series B, 5.00%, 8/01/22 | | | 10,000 | | | | 12,193,700 | |
| | | | | | | | |
| | | | | | | | 21,764,825 | |
Oklahoma — 0.1% | | | | | | | | |
County of Oklahoma Finance Authority, Refunding RB, Epworth Villa Project, Series A, 5.00%, 4/01/23 | | | 1,050 | | | | 1,093,313 | |
Oregon — 0.2% | | | | | | | | |
State of Oregon, GO, State Property, Series J, 5.00%, 5/01/17 | | | 2,545 | | | | 2,869,666 | |
Pennsylvania — 3.3% | | | | | | | | |
City of Philadelphia Pennsylvania, Refunding ARB, Series A, AMT, 5.00%, 6/15/21 | | | 5,000 | | | | 5,771,400 | |
City of Philadelphia Pennsylvania Hospitals & Higher Education Facilities Authority, RB, Temple University Health System Obligated Group, Series A: | | | | | | | | |
5.63%, 7/01/36 | | | 1,045 | | | | 1,065,670 | |
5.63%, 7/01/42 | | | 2,500 | | | | 2,520,050 | |
Commonwealth of Pennsylvania, GO: | | | | | | | | |
5.00%, 6/15/19 | | | 5,000 | | | | 5,907,450 | |
5.00%, 6/01/25 | | | 6,885 | | | | 8,146,608 | |
County of Allegheny Pennsylvania, GO, Refunding (AGM), 0.70%, 11/01/26 (c) | | | 9,750 | | | | 9,095,775 | |
Pennsylvania Economic Development Financing Authority, RB, National Gypsum Co., Series B, AMT, 6.13%, 11/01/27 | | | 3,000 | | | | 3,000,690 | |
Pennsylvania HFA, RB, S/F Mortgage, Series 103-C, 4.38%, 4/01/18 | | | 1,160 | | | | 1,265,351 | |
Pennsylvania Higher Educational Facilities Authority, Refunding RB, Series A, 5.00%, 9/01/17 | | | 5,000 | | | | 5,694,750 | |
See Notes to Financial Statements.
| | | | | | |
| | | | | | | |
| 32 | | ANNUAL REPORT | | MAY 31, 2014 | | |
| | |
Schedule of Investments (continued) | | BlackRock Strategic Municipal Opportunities Fund (Percentages shown are based on Net Assets) |
| | | | | | | | |
| Municipal Bonds | | Par (000) | | | Value | |
Pennsylvania (concluded) | | | | | | | | |
Susquehanna Area Regional Airport Authority, ARB, AMT, Series A, 5.00%, 1/01/27 | | $ | 3,100 | | | $ | 3,349,023 | |
| | | | | | | | |
| | | | | | | | 45,816,767 | |
Puerto Rico — 0.2% | | | | | | | | |
Commonwealth of Puerto Rico, GO, Refunding, Series A, 8.00%, 7/01/35 | | | 2,500 | | | | 2,231,200 | |
South Carolina — 3.3% | | | | | | | | |
Charleston Educational Excellence Finance Corp., Refunding RB, Charleston County School District, 5.00%, 12/01/30 | | | 5,005 | | | | 5,769,213 | |
State of South Carolina, GO, Refunding, 4.00%, 6/01/15 | | | 4,550 | | | | 4,726,085 | |
State of South Carolina, GO, Refunding, Series A: | | | | | | | | |
5.00%, 4/01/16 | | | 2,250 | | | | 2,444,558 | |
4.00%, 6/01/16 | | | 4,645 | | | | 4,988,730 | |
5.00%, 10/01/16 (d) | | | 7,085 | | | | 7,851,668 | |
5.00%, 10/01/17 (d) | | | 7,750 | | | | 8,856,467 | |
5.00%, 10/01/19 (d) | | | 5,000 | | | | 5,960,500 | |
State of South Carolina Public Service Authority, Refunding RB, Series D, 5.00%, 12/01/43 | | | 5,000 | | | | 5,399,950 | |
| | | | | | | | |
| | | | | | | | 45,997,171 | |
Tennessee — 1.0% | | | | | | | | |
State of Tennessee, GO, Refunding: | | | | | | | | |
Series A, 4.00%, 5/01/16 | | | 8,270 | | | | 8,859,651 | |
Series C, 5.25%, 9/01/15 | | | 5,000 | | | | 5,318,150 | |
| | | | | | | | |
| | | | | | | | 14,177,801 | |
Texas — 7.0% | | | | | | | | |
Alliance Airport Authority Texas, Refunding RB, FedEx Corp. Project, AMT, 4.85%, 4/01/21 | | | 3,730 | | | | 3,890,539 | |
Arlington Higher Education Finance Corp., RB, Series A, 7.13%, 3/01/44 | | | 1,250 | | | | 1,283,813 | |
Central Texas Regional Mobility Authority, Refunding RB, Subordinate Lien, 5.00%, 1/01/23 | | | 500 | | | | 545,120 | |
City of Houston Texas Airport System, RB, Special Facilities, Continental Airlines, Inc., AMT, Series A, 6.63%, 7/15/38 | | | 3,000 | | | | 3,289,920 | |
City of Houston Texas Airport System, Refunding ARB, Series A, AMT: | | | | | | | | |
6.50%, 7/15/30 | | | 1,000 | | | | 1,109,130 | |
Subordinate Lien, 5.00%, 7/01/23 | | | 5,000 | | | | 5,848,200 | |
City of Houston Texas Airport System, Refunding RB, United Airlines, Inc. Terminal E Project, AMT (d): | | | | | | | | |
4.75%, 7/01/24 | | | 1,250 | | | | 1,267,575 | |
5.00%, 7/01/29 | | | 1,000 | | | | 1,011,490 | |
City of Houston Texas Utility System Revenue, Refunding RB, Series C, 5.00%, 5/15/23 | | | 5,000 | | | | 6,103,450 | |
County of Harris Texas Cultural Education Facilities Finance Corp., RB, 1st Mortgage, Brazos Presbyterian Homes, Inc. Project, Series B, 5.75%, 1/01/28 | | | 500 | | | | 558,800 | |
County of Harris Texas Cultural Education Facilities Finance Corp., Refunding RB: | | | | | | | | |
1st Mortgage, Brazos Presbyterian Homes, Inc. Project, 4.00%, 1/01/23 | | | 1,325 | | | | 1,351,050 | |
Young Men’s Christian Association of the Greater Houston Area, Series A, 5.00%, 6/01/38 | | | 1,450 | | | | 1,520,687 | |
Dallas-Fort Worth International Airport, ARB, Joint Improvement, Series D, AMT, 5.00%, 11/01/42 | | | 10,000 | | | | 10,479,100 | |
Dallas-Fort Worth International Airport Facilities Improvement Corp., ARB, Series 2001-A-1, AMT, 6.15%, 1/01/16 | | | 2,145 | | | | 2,144,936 | |
| Municipal Bonds | | Par (000) | | | Value | |
Texas (concluded) | | | | | | | | |
Houston Community College System, GO, 5.00%, 2/15/43 | | $ | 5,920 | | | $ | 6,590,736 | |
North East Independent School District, GO, Refunding, 5.25%, 2/01/28 | | | 9,600 | | | | 12,267,168 | |
Red River Health Facilities Development Corp., MRB, Eden Home, Inc. Project, 5.63%, 12/15/22 | | | 2,570 | | | | 2,629,136 | |
Texas Public Finance Authority, RB, Series A, 5.00%, 1/01/16 | | | 5,550 | | | | 5,970,745 | |
Town of Flower Mound, Special Assessment Bonds, 6.75%, 9/01/43 | | | 2,000 | | | | 2,013,540 | |
University of Texas System, Refunding RB, Series B, 5.00%, 8/15/16 (b) | | | 25,000 | | | | 27,556,500 | |
| | | | | | | | |
| | | | | | | | 97,431,635 | |
Utah — 2.4% | | | | | | | | |
County of Utah Utah, Refunding RB, US Steel Corp. Project, 5.38%, 11/01/15 | | | 3,000 | | | | 3,094,500 | |
Jordan School District, GO, Refunding, 5.00%, 6/15/21 | | | 9,000 | | | | 10,968,750 | |
State of Utah, GO, Refunding, , 5.00%, 7/01/16 | | | 5,000 | | | | 5,489,450 | |
State of Utah, GO, Series C: | | | | | | | | |
Series A, 5.00%, 7/01/15 | | | 10,000 | | | | 10,527,300 | |
5.00%, 7/01/16 | | | 3,000 | | | | 3,293,670 | |
| | | | | | | | |
| | | | | | | | 33,373,670 | |
Virginia — 1.9% | | | | | | | | |
City of Alexandria Virginia, GO, 5.00%, 6/15/15 | | | 2,305 | | | | 2,421,610 | |
County of Fairfax Virginia, GO, Refunding Series A, 5.00%, 10/01/22 | | | 5,000 | | | | 6,178,750 | |
County of Hanover Virginia EDA, Refunding RB, Covenant Woods, Series A: | | | | | | | | |
4.00%, 7/01/22 | | | 1,320 | | | | 1,298,457 | |
5.00%, 7/01/47 | | | 1,985 | | | | 1,879,517 | |
County of Henrico Virginia EDA, Refunding RB, United Methodist Homes: | | | | | | | | |
3.38%, 6/01/20 | | | 1,000 | | | | 995,750 | |
5.00%, 6/01/22 | | | 625 | | | | 679,031 | |
5.00%, 6/01/23 | | | 420 | | | | 451,198 | |
Dulles Town Center Community Development Authority, Refunding, Special Assessment, Dulles Town Center Project, 4.00%, 3/01/23 | | | 1,000 | | | | 965,500 | |
Shops at White Oak Village Community Development Authority, Special Assessment, 5.30%, 3/01/17 | | | 1,342 | | | | 1,436,477 | |
Virginia Public School Authority, RB, 5.00%, 4/15/16 | | | 10,000 | | | | 10,880,300 | |
| | | | | | | | |
| | | | | | | | 27,186,590 | |
Washington — 1.8% | | | | | | | | |
Energy Northwest, Refunding RB, Series A, 2.00%, 7/01/15 | | | 10,000 | | | | 10,201,800 | |
Greater Wenatchee Regional Events Center Public Facilities District, Refunding RB, Series A, 5.25%, 9/01/32 | | | 2,255 | | | | 2,269,071 | |
King County School District No. 403 Renton, GO, Refunding, 5.00%, 12/01/21 | | | 5,075 | | | | 6,156,381 | |
State of Washington, GO, Series A, Various Purpose, 5.00%, 8/01/37 | | | 5,000 | | | | 5,642,250 | |
Washington State Convention Center Public Facilities District, RB, Build America Bonds, Series B, 6.79%, 7/01/40 | | | 1,250 | | | | 1,501,488 | |
| | | | | | | | |
| | | | | | | | 25,770,990 | |
West Virginia — 0.1% | | | | | | | | |
Tobacco Settlement Finance Authority, RB, Series A, 7.47%, 6/01/47 | | | 2,395 | | | | 2,060,107 | |
See Notes to Financial Statements.
| | | | | | |
| | | | | | | |
| | ANNUAL REPORT | | MAY 31, 2014 | | 33 |
| | |
Schedule of Investments (continued) | | BlackRock Strategic Municipal Opportunities Fund (Percentages shown are based on Net Assets) |
| | | | | | | | |
| Municipal Bonds | | Par (000) | | | Value | |
Wisconsin — 1.7% | | | | | | | | |
State of Wisconsin, GO, Series A (b): | | | | | | | | |
5.00%, 5/01/16 | | $ | 10,000 | | | $ | 10,897,500 | |
5.00%, 5/01/16 | | | 10,000 | | | | 10,897,500 | |
Wisconsin Health & Educational Facilities Authority, Refunding RB: | | | | | | | | |
5.50%, 5/01/34 | | | 875 | | | | 885,631 | |
5.75%, 5/01/39 | | | 1,060 | | | | 1,072,317 | |
| | | | | | | | |
| | | | | | | | 23,752,948 | |
| Total Municipal Bonds — 86.5% | | | | | | | 1,207,546,159 | |
| | | | | | | | |
| | | | | | | | | |
| |
Municipal Bonds Transferred to
Tender Option Bond Trusts (h) | | | | |
Arizona — 0.8% | | | | | | | | |
Arizona State University, Refunding RB, Arizona State University System Board of Regents, Series A, 5.00%, 7/01/42 | | | 10,000 | | | | 11,025,900 | |
California — 6.0% | | | | | | | | |
California Health Facilities Financing Authority, RB: | | | | | | | | |
5.00%, 8/15/43 | | | 10,000 | | | | 10,962,597 | |
Stanford Hospital and Clinics, Series A, 5.00%, 8/15/51 | | | 10,000 | | | | 10,831,500 | |
Sutter Health, Series A, 5.00%, 8/15/52 | | | 10,000 | | | | 10,779,398 | |
City of Los Angeles California Department of Airports, Refunding RB, 5.00%, 5/15/35 | | | 10,000 | | | | 11,144,200 | |
County of Ventura California Public Financing Authority, Refunding LRB, Series A, 5.00%, 11/01/38 | | | 8,450 | | | | 9,296,014 | |
Los Angeles Department of Water & Power, RB, Series B, 5.00%, 7/01/43 | | | 10,000 | | | | 11,063,000 | |
San Marcos Unified School District, GO, Series C, 5.00%, 8/01/40 | | | 10,000 | | | | 11,125,600 | |
Ventura County Public Financing Authority, Refunding RB, Series A, 5.00%, 11/01/43 | | | 8,530 | | | | 9,287,037 | |
| | | | | | | | |
| | | | | | | | 84,489,346 | |
District of Columbia — 0.8% | | | | | | | | |
District of Columbia Water & Sewer Authority, RB, Sub-Lien, Series A, 5.00%, 10/01/44 | | | 10,000 | | | | 11,143,200 | |
Florida — 0.8% | | | | | | | | |
Tampa Bay Water, RB, 5.00%, 10/01/38 | | | 10,000 | | | | 11,253,300 | |
Maryland — 0.8% | | | | | | | | |
Maryland Health & Higher Educational Facilities Authority, RB, Series C, 5.00%, 5/15/43 | | | 10,000 | | | | 11,047,600 | |
Missouri — 1.6% | | | | | | | | |
Health & Educational Facilities Authority of the State of Missouri, RB, 5.00%, 1/01/44 | | | 10,000 | | | | 11,015,372 | |
Health & Educational Facilities Authority of the State of Missouri, Refunding RB, Series A, 5.00%, 11/15/48 (i) | | | 10,000 | | | | 10,683,400 | |
| | | | | | | | |
| | | | | | | | 21,698,772 | |
Nevada — 0.8% | | | | | | | | |
Las Vegas Valley Water District, GO, Series B, 5.00%, 6/01/37 | | | 10,000 | | | | 10,973,200 | |
New Jersey — 0.8% | | | | | | | | |
New Jersey Transportation Trust Fund Authority, RB, Series B, 5.00%, 6/15/42 (i) | | | 10,000 | | | | 10,614,500 | |
Municipal Bonds Transferred to
Tender Option Bond Trusts (h) | | Par (000) | | | Value | |
New York — 0.8% | | | | | | | | |
City of New York New York Municipal Water Finance Authority, Refunding RB, Water & Sewer System, 2nd General Resolution, Fiscal 2013, Series C, 5.00%, 6/15/47 | | $ | 10,000 | | | $ | 10,926,800 | |
South Carolina — 0.8% | | | | | | | | |
City of Charleston SC Waterworks & Sewer System Revenue, Refunding RB, 5.00%, 1/01/41 | | | 10,000 | | | | 11,017,300 | |
Tennessee — 0.8% | | | | | | | | |
Rutherford County Health & Educational Facilities Board, RB, Series C, 5.00%, 11/15/47 | | | 10,000 | | | | 10,806,600 | |
Texas — 2.3% | | | | | | | | |
County of El Paso Texas Hospital District, GO, 5.00%, 8/15/43 | | | 10,000 | | | | 11,039,000 | |
Dallas-Fort Worth International Airport, RB, Series A, AMT, 5.00%, 11/1/45 (i) | | | 10,000 | | | | 10,451,500 | |
Tarrant Regional Water District, Refunding RB, 5.00%, 3/01/52 | | | 10,000 | | | | 10,858,100 | |
| | | | | | | | |
| | | | | | | | 32,348,600 | |
Washington — 0.8% | | | | | | | | |
State of Washington, GO, Series A, 5.00%, 8/01/38 | | | 10,000 | | | | 11,276,100 | |
Wisconsin — 1.5% | | | | | | | | |
Wisconsin Health & Educational Facilities Authority, RB, Series D, 5.00%, 11/15/41 | | | 10,000 | | | | 10,847,200 | |
Wisconsin Health & Educational Facilities Authority, Refunding RB, Froedtert & Community Health, Inc., Obligated Group, Series A, 5.00%, 4/01/42 | | | 10,000 | | | | 10,835,100 | |
| | | | | | | | |
| | | | | | | | 21,682,300 | |
Total Municipal Bonds Transferred to
Tender Option Bond Trusts — 19.4% | | | | | | | 270,303,518 | |
| | | | | | | | |
| | | | | | | | | |
| | |
| Investment Companies | | Shares | | | | |
Market Vectors High Yield Municipal Index ETF | | | 150,000 | | | | 4,579,500 | |
SPDR Nuveen S&P High Yield Municipal Bond ETF | | | 100,000 | | | | 5,656,000 | |
| Total Investment Companies — 0.7% | | | | | | | 10,235,500 | |
Total Long-Term Investments
(Cost — $1,461,528,974) — 106.8% | | | | | | | 1,490,124,377 | |
| | | | | | | | |
| | | | | | | | | |
| | |
| Short-Term Securities | | | | | | |
FFI Institutional Tax-Exempt Fund, 0.01% (j)(k) | | | 128,952,002 | | | | 128,952,002 | |
Total Short-Term Securities
(Cost — $128,952,002) — 9.2% | | | | | | | 128,952,002 | |
| Total Investments (Cost — $1,590,480,976) — 116.0% | | | | 1,619,076,379 | |
| Liabilities in Excess of Other Assets — (6.6)% | | | | | | | (92,159,904 | ) |
Liability for TOB Trust Certificates, Including Interest
Expense and Fees Payable — (9.4)% | | | | (130,994,192 | ) |
| | | | | | | | |
| Net Assets — 100.0% | | | | | | $ | 1,395,922,283 | |
| | | | | | | | |
See Notes to Financial Statements.
| | | | | | |
| | | | | | | |
| 34 | | ANNUAL REPORT | | MAY 31, 2014 | | |
| | |
Schedule of Investments (continued) | | BlackRock Strategic Municipal Opportunities Fund |
|
| Notes to Schedule of Investments |
| (a) | | Security exempt from registration pursuant to Rule 144A under the Securities Act of 1933, as amended. These securities may be resold in transactions exempt from registration to qualified institutional investors. |
| (b) | | U.S. government securities, held in escrow, are used to pay interest on this security, as well as to retire the bond in full at the date indicated, typically at a premium to par. |
| (c) | | Variable rate security. Rate shown is as of report date. |
| (d) | | When-issued security. Unsettled when-issued transactions were as follows: |
| | | | | | | | |
| Counterparty | | Value | | | Unrealized
Appreciation | |
Citigroup Global Markets, Inc. | | $ | 2,279,065 | | | $ | 59,540 | |
J.P. Morgan Securities LLC | | $ | 46,580,587 | | | $ | 191,236 | |
Merrill Lynch, Pierce, Fenner & Smith, Inc. | | $ | 18,409,700 | | | $ | 69,500 | |
Wells Fargo Securities, LLC | | $ | 5,910,800 | | | $ | 21,450 | |
| (e) | | Non-income producing security. |
| (f) | | Issuer filed for bankruptcy and/or is in default of principal and/or interest payments. |
| (g) | | Represents a step-up bond that pays an initial coupon rate for the first period and then a higher coupon rate for the following periods. Rate shown is as of report date. |
| (h) | | Represent bonds transferred to a TOB. In exchange for which the Fund acquired residual interest certificates. These bonds serve as collateral in a financing transaction. See Note 3 of the Notes to Financial Statements for details of municipal bonds transferred to TOBs. |
| (i) | | All or a portion of security is subject to a recourse agreement, which may require the Fund to pay the liquidity provider in the event there is a shortfall between the TOB trust certificates and proceeds received from the sale of the security contributed to the TOB trust. In the case of a shortfall, the aggregate maximum potential amount the Fund could ultimately be required to pay under the agreements, which expire from May 1, 2019 to November 15, 2021, is $15,770,833. |
| (j) | | Investments in issuers considered to be an affiliate of the Fund during the year ended May 31, 2014, for purposes of Section 2(a)(3) of the Investment Company Act of 1940, as amended, were as follows: |
| | | | | | | | | | | | | | | | |
| Affiliate | | Shares Held
at May 31,
2013 | | | Net
Activity | | | Shares Held
at May 31,
2014 | | | Income | |
FFI Institutional Tax-Exempt Fund | | | 9,744,786 | | | | 119,207,216 | | | | 128,952,002 | | | $ | 9,914 | |
| (k) | | Represents the current yield as of report date. |
| Ÿ | | Financial futures contracts outstanding as of May 31, 2014 were as follows: |
| | | | | | | | | | | | | | | | | | |
| Contracts Sold | | Issue | | | Exchange | | Expiration | | | Notional
Value | | | Unrealized
Depreciation | |
| (3,000) | | | 5-Year U.S. Treasury Note | | | Chicago Board of Trade | | | September 2014 | | | $ | 359,273,439 | | | $ | (474,414 | ) |
| (4,400) | | | 10-Year U.S. Treasury Note | | | Chicago Board of Trade | | | September 2014 | | | $ | 552,268,750 | | | | (1,938,755 | ) |
| (800) | | | Long U.S. Treasury Bond | | | Chicago Board of Trade | | | September 2014 | | | | $109,975,000 | | | | (704,476 | ) |
| Total | | | | | | | | | | | | | | | | $ | (3,117,645 | ) |
| | | | | | | | | | | | | | | | | | |
| Ÿ | | OTC credit default swaps — buy protection outstanding as of May 31, 2014 were as follows: |
| | | | | | | | | | | | | | | | | | | | | | | | |
| Issuer | | Pay Fixed Rate | | | Counterparty | | Expiration
Date | | Notional Amount
(000) | | | Market
Value | | | Premiums
Received | | | Unrealized
Depreciation | |
Markit MCDX North America Series 22 | | | 1.00 | % | | Citibank N.A. | | 6/20/19 | | $ | 25,000 | | | $ | (344,911 | ) | | $ | (263,965 | ) | | $ | (80,946 | ) |
| Ÿ | | OTC credit default swaps — sold protection outstanding as of May 31, 2014 were as follows: |
| | | | | | | | | | | | | | | | | | | | | | | | | | | | |
| Issuer | | Receive
Fixed Rate | | | Counterparty | | Expiration
Date | | Credit
Rating1 | | | Notional Amount
(000)2 | | | Market
Value | | | Premiums
Received | | | Unrealized
Appreciation | |
Markit MCDX North America Series 12 | | | 1.00 | % | | Citibank N.A. | | 6/20/19 | | | AA | | | $ | 25,000 | | | $ | (83,544 | ) | | $ | (187,464 | ) | | $ | 103,920 | |
1 Using Standard & Poor’s rating of the underlying securities of the index. | |
2 The maximum potential amount the Fund may pay should a negative credit event take place as defined under the terms of the agreement. | |
| Ÿ | | Fair Value Measurements — Various inputs are used in determining the fair value of investments and derivative financial instruments. These inputs to valuation techniques are categorized into a disclosure hierarchy consisting of three broad levels for financial statement purposes as follows: |
| | Ÿ | | Level 1 — unadjusted price quotations in active markets/exchanges for identical assets or liabilities that the Fund has the ability to access |
| | Ÿ | | Level 2 — other observable inputs (including, but not limited to, quoted prices for similar assets or liabilities in markets that are active, quoted prices for identical or similar assets or liabilities in markets that are not active, inputs other than quoted prices that are observable for the assets or liabilities (such as interest rates, yield curves, volatilities, prepayment speeds, loss severities, credit risks and default rates) or other market-corroborated inputs) |
| | Ÿ | | Level 3 — unobservable inputs based on the best information available in the circumstances, to the extent observable inputs are not available (including the Fund’s own assumptions used in determining the fair value of investments and derivative financial instruments) |
The hierarchy gives the highest priority to unadjusted quoted prices in active markets for identical assets or liabilities (Level 1 measurements) and the lowest priority to unobservable inputs (Level 3 measurements). Accordingly, the degree of judgment exercised in determining fair value is greatest for instruments categorized in Level 3. The inputs
See Notes to Financial Statements.
| | | | | | |
| | | | | | | |
| | ANNUAL REPORT | | MAY 31, 2014 | | 35 |
| | |
Schedule of Investments (concluded) | | BlackRock Strategic Municipal Opportunities Fund |
used to measure fair value may fall into different levels of the fair value hierarchy. In such cases, for disclosure purposes, the fair value hierarchy classification is determined based on the lowest level input that is significant to the fair value measurement in its entirety.
Changes in valuation techniques may result in transfers into or out of an assigned level within the disclosure hierarchy. In accordance with the Fund’s policy, transfers between different levels of the fair value disclosure hierarchy are deemed to have occurred as of the beginning of the reporting period. The categorization of a value determined for investments and derivative financial instruments is based on the pricing transparency of the investment and derivative financial instrument and is not necessarily an indication of the risks associated with investing in those securities. For information about the Fund’s policy regarding valuation of investments and derivative financial instruments, please refer to Note 2 of the Notes to Financial Statements.
The following tables summarize the Fund’s investments and derivative financial instruments categorized in the disclosure hierarchy as of May 31, 2014:
| | | | | | | | | | | | | | |
| | | Level 1 | | | Level 2 | | | Level 3 | | Total | |
Assets: | | | | | | | | | | | | | | |
| Investments: | | | | | | | | | | | | | | |
Long-Term Investments1 | | | — | | | $ | 1,479,888,877 | | | — | | $ | 1,479,888,877 | |
Investment Companies | | $ | 10,235,500 | | | | — | | | — | | | 10,235,500 | |
Short-Term Securities | | | 128,952,002 | | | | — | | | — | | | 128,952,002 | |
| | | | | | | | | | | | | | |
Total | | $ | 139,187,502 | | | $ | 1,479,888,877 | | | — | | $ | 1,619,076,379 | |
| | | | | | | | | | | | | | |
1 See above Schedule of Investments for values in each state or political subdivision. | | | | |
| | | Level 1 | | | Level 2 | | | Level 3 | | Total | |
| Derivative Financial Instruments2 | | | | | | | | | | | | | | |
Assets: | | | | | | | | | | | | | | |
Credit contracts | | | — | | | $ | 103,920 | | | — | | $ | 103,920 | |
Liabilities: | | | | | | | | | | | | | | |
Credit contracts | | | — | | | | (80,946 | ) | | — | | | (80,946 | ) |
Interest rate contracts | | $ | (3,117,645 | ) | | | — | | | — | | | (3,117,645 | ) |
| | | | | | | | | | | | | | |
Total | | $ | (3,117,645 | ) | | $ | 22,974 | | | — | | $ | (3,094,671 | ) |
| | | | | | | | | | | | | | |
2 Derivative financial instruments are financial futures contracts and swaps, which are valued at the unrealized appreciation/depreciation on the instrument. | |
The Fund may hold assets and/or liabilities in which the fair value approximates the carrying amount for financial statement purposes. As of May 31, 2014, such assets and/or liabilities are categorized within the disclosure hierarchy as follows: | |
| | | | | | | | | | | | | | |
| | | Level 1 | | | Level 2 | | | Level 3 | | Total | |
Assets: | | | | | | | | | | | | | | |
Cash pledged for financial futures contracts | | $ | 8,967,000 | | | | — | | | — | | $ | 8,967,000 | |
Liabilities: | | | | | | | | | | | | | | |
TOB trust certificates | | | — | | | $ | (130,984,993 | ) | | — | | | (130,984,993 | ) |
| | | | | | | | | | | | | | |
Total | | $ | 8,967,000 | | | $ | (130,984,993 | ) | | — | | $ | (122,017,993 | ) |
| | | | | | | | | | | | | | |
There were no transfers between levels during the year ended May 31, 2014.
See Notes to Financial Statements.
| | | | | | |
| | | | | | | |
| 36 | | ANNUAL REPORT | | MAY 31, 2014 | | |
| | |
| Statements of Assets and Liabilities | | |
| | | | | | | | | | | | | | | | |
| May 31, 2014 | | BlackRock
California
Municipal
Bond Fund | | | BlackRock
New Jersey
Municipal
Bond Fund | | | BlackRock
Pennsylvania
Municipal
Bond Fund | | | BlackRock
Strategic
Municipal
Opportunities
Fund | |
| | | | | | | | | | | | | | | | |
| Assets | | | | | | | | | | | | | | | | |
Investments at value — unaffiliated1 | | $ | 567,912,801 | | | $ | 239,947,516 | | | $ | 462,955,579 | | | $ | 1,490,124,377 | |
Investments at value — affiliated2 | | | 1,239,217 | | | | 2,097,379 | | | | 524,643 | | | | 128,952,002 | |
Cash pledged for financial futures contracts | | | 785,000 | | | | 464,000 | | | | 396,000 | | | | 8,967,000 | |
Interest receivable | | | 6,655,741 | | | | 3,489,876 | | | | 6,542,157 | | | | 16,445,410 | |
Investments sold receivable | | | 5,546,612 | | | | — | | | | 10,000 | | | | 25,167,515 | |
Capital shares sold receivable | | | 1,196,582 | | | | 619,824 | | | | 272,532 | | | | 20,001,300 | |
TOB trust receivable | | | — | | | | — | | | | — | | | | 13,330,000 | |
Variation margin receivable on financial futures contracts | | | 65,622 | | | | 38,826 | | | | 31,716 | | | | 666,631 | |
Unrealized appreciation on OTC swaps | | | — | | | | — | | | | — | | | | 103,920 | |
Swaps receivable | | | — | | | | — | | | | — | | | | 51,389 | |
Prepaid expenses | | | 29,994 | | | | 5,936 | | | | 8,805 | | | | 76,586 | |
| | | | |
Total assets | | | 583,431,569 | | | | 246,663,357 | | | | 470,741,432 | | | | 1,703,886,130 | |
| | | | |
| | | | | | | | | | | | | | | | |
| Accrued Liabilities | | | | | | | | | | | | | | | | |
Investments purchased payable | | | — | | | | — | | | | — | | | | 173,153,504 | |
Capital shares redeemed payable | | | 1,490,879 | | | | 216,160 | | | | 278,475 | | | | 1,258,272 | |
Income dividends payable | | | 949,134 | | | | 462,672 | | | | 1,100,494 | | | | 1,169,793 | |
Investment advisory fees payable | | | 258,697 | | | | 104,293 | | | | 197,307 | | | | 436,648 | |
Swap premiums received | | | — | | | | — | | | | — | | | | 451,429 | |
Service and distribution fees payable | | | 101,791 | | | | 42,736 | | | | 38,449 | | | | 153,607 | |
Unrealized depreciation on OTC swaps | | | — | | | | — | | | | — | | | | 80,946 | |
Swaps payable | | | — | | | | — | | | | — | | | | 51,389 | |
Interest expense and fees payable | | | 3,753 | | | | 1,874 | | | | 11,724 | | | | 9,199 | |
Officer’s and Trustees’ fees payable | | | 3,960 | | | | 3,303 | | | | 3,731 | | | | 4,556 | |
Other affiliates payable | | | 1,350 | | | | 572 | | | | 1,082 | | | | — | |
Other accrued expenses payable | | | 204,422 | | | | 102,825 | | | | 176,991 | | | | 209,511 | |
| | | | |
Total accrued liabilities | | | 3,013,986 | | | | 934,435 | | | | 1,808,253 | | | | 176,978,854 | |
| | | | |
| | | | | | | | | | | | | | | | |
| Other Liabilities | | | | | | | | | | | | | | | | |
TOB trust certificates | | | 23,652,530 | | | | 7,231,154 | | | | 46,126,645 | | | | 130,984,993 | |
| | | | |
Total liabilities | | | 26,666,516 | | | | 8,165,589 | | | | 47,934,898 | | | | 307,963,847 | |
| | | | |
Net Assets | | $ | 556,765,053 | | | $ | 238,497,768 | | | $ | 422,806,534 | | | $ | 1,395,922,283 | |
| | | | |
| | | | | | | | | | | | | | | | |
| Net Assets Consist of | | | | | | | | | | | | | | | | |
Paid-in capital | | $ | 539,009,825 | | | $ | 224,651,138 | | | $ | 419,752,744 | | | $ | 1,367,489,600 | |
Undistributed net investment income | | | 576,072 | | | | 833,473 | | | | 840,664 | | | | 38,578 | |
Accumulated net realized gain (loss) | | | (26,105,497 | ) | | | (6,215,001 | ) | | | (29,787,109 | ) | | | 2,893,373 | |
Net unrealized appreciation/depreciation | | | 43,284,653 | | | | 19,228,158 | | | | 32,000,235 | | | | 25,500,732 | |
| | | | |
Net Assets | | $ | 556,765,053 | | | $ | 238,497,768 | | | $ | 422,806,534 | | | $ | 1,395,922,283 | |
| | | | |
1 Investments at cost — unaffiliated | | $ | 524,228,870 | | | $ | 220,535,814 | | | $ | 430,973,481 | | | $ | 1,461,528,974 | |
2 Investments at cost — affiliated | | $ | 1,239,217 | | | $ | 2,097,379 | | | $ | 524,643 | | | $ | 128,952,002 | |
| | | | | | | | | | | | | | | | |
| | | | | | |
| See Notes to Financial Statements. | | | | |
| | | | | | | |
| | ANNUAL REPORT | | MAY 31, 2014 | | 37 |
| | |
| Statements of Assets and Liabilities (concluded) | | |
| | | | | | | | | | | | | | | | |
| May 31, 2014 | | BlackRock
California
Municipal Bond Fund | | | BlackRock New Jersey
Municipal Bond Fund | | | BlackRock
Pennsylvania
Municipal Bond Fund | | | BlackRock
Strategic
Municipal
Opportunities
Fund | |
| | | | | | | | | | | | | | | | |
| Net Asset Value | | | | | | | | | | | | | | | | |
| Institutional | | | | | | | | | | | | | | | | |
Net assets | | $ | 206,904,538 | | | $ | 109,181,759 | | | $ | 311,954,120 | | | $ | 953,868,599 | |
| | | | |
Shares outstanding, unlimited number of shares authorized, $0.10 par value | | | 16,925,178 | | | | 9,846,611 | | | | 27,817,288 | | | | 84,022,777 | |
| | | | |
Net asset value per share | | $ | 12.22 | | | $ | 11.09 | | | $ | 11.21 | | | $ | 11.35 | |
| | | | |
| Service | | | | | | | | | | | | | | | | |
Net assets | | | — | | | $ | 17,881,163 | | | $ | 7,421,806 | | | | — | |
| | | | |
Shares outstanding, unlimited number of shares authorized, $0.10 par value | | | — | | | | 1,612,731 | | | | 661,600 | | | | — | |
| | | | |
Net asset value per share | | | — | | | $ | 11.09 | | | $ | 11.22 | | | | — | |
| | | | |
| Investor A | | | | | | | | | | | | | | | | |
Net assets | | $ | 111,545,197 | | | $ | 45,073,413 | | | $ | 55,499,605 | | | $ | 283,505,931 | |
| | | | |
Shares outstanding, unlimited number of shares authorized, $0.10 par value | | | 9,132,145 | | | | 4,061,104 | | | | 4,943,889 | | | | 24,984,339 | |
| | | | |
Net asset value per share value | | $ | 12.21 | | | $ | 11.10 | | | $ | 11.23 | | | $ | 11.35 | |
| | | | |
| Investor A1 | | | | | | | | | | | | | | | | |
Net assets | | $ | 154,845,514 | | | $ | 31,337,773 | | | $ | 17,823,276 | | | $ | 37,707,733 | |
| | | | |
Shares outstanding, unlimited number of shares authorized, $0.10 par value | | | 12,666,253 | | | | 2,822,844 | | | | 1,587,376 | | | | 3,322,218 | |
| | | | |
Net asset value per share value | | $ | 12.23 | | | $ | 11.10 | | | $ | 11.23 | | | $ | 11.35 | |
| | | | |
| Investor B | | | | | | | | | | | | | | | | |
Net assets | | $ | 946,643 | | | | — | | | | — | | | | — | |
| | | | |
Shares outstanding, unlimited number of shares authorized, $0.10 par value | | | 77,388 | | | | — | | | | — | | | | — | |
| | | | |
Net asset value per share value | | $ | 12.23 | | | | — | | | | — | | | | — | |
| | | | |
| Investor C | | | | | | | | | | | | | | | | |
Net assets | | $ | 65,203,393 | | | $ | 26,429,439 | | | $ | 24,647,327 | | | $ | 120,840,020 | |
| | | | |
Shares outstanding, unlimited number of shares authorized, $0.10 par value | | | 5,333,127 | | | | 2,384,253 | | | | 2,195,997 | | | | 10,645,502 | |
| | | | |
Net asset value per share value | | $ | 12.23 | | | $ | 11.08 | | | $ | 11.22 | | | $ | 11.35 | |
| | | | |
| Investor C1 | | | | | | | | | | | | | | | | |
Net assets | | $ | 17,319,768 | | | $ | 8,594,221 | | | $ | 5,460,400 | | | | — | |
| | | | |
Shares outstanding, unlimited number of shares authorized, $0.10 par value | | | 1,416,562 | | | | 775,109 | | | | 486,904 | | | | — | |
| | | | |
Net asset value per share value | | $ | 12.23 | | | $ | 11.09 | | | $ | 11.21 | | | | — | |
| | | | |
| | | | | | |
| See Notes to Financial Statements. | | | | |
| | | | | | | |
| 38 | | ANNUAL REPORT | | MAY 31, 2014 | | |
| | | | | | | | | | | | | | | | |
| Year Ended May 31, 2014 | | BlackRock
California
Municipal
Bond Fund | | | BlackRock New Jersey
Municipal Bond Fund | | | BlackRock
Pennsylvania
Municipal Bond Fund | | | BlackRock
Strategic
Municipal
Opportunities
Fund | |
| | | | | | | | | | | | | | | | |
| Investment Income | | | | | | | | | | | | | |
Interest | | $ | 27,202,681 | | | $ | 11,161,540 | | | $ | 22,722,635 | | | $ | 28,130,965 | |
Income — affiliated | | | 195 | | | | — | | | | — | | | | 9,914 | |
| | | | |
Total income | | | 27,202,876 | | | | 11,161,540 | | | | 22,722,635 | | | | 28,140,879 | |
| | | | |
| | | | | | | | | | | | | | | | |
| Expenses | | | | | | | | | | | | | |
Investment advisory | | | 3,116,596 | | | | 1,270,767 | | | | 2,416,544 | | | | 4,261,332 | |
Service — Service | | | — | | | | 44,413 | | | | 17,410 | | | | — | |
Service — Investor A | | | 303,253 | | | | 108,409 | | | | 135,427 | | | | 522,177 | |
Service — Investor A1 | | | 156,016 | | | | 31,910 | | | | 18,031 | | | | 39,959 | |
Service and distribution — Investor B | | | 9,258 | | | | 54 | | | | 34 | | | | 66 | |
Service and distribution — Investor B1 | | | — | | | | 125 | | | | 72 | | | | — | |
Service and distribution — Investor C | | | 693,889 | | | | 256,192 | | | | 255,261 | | | | 1,100,090 | |
Service and distribution — Investor C1 | | | 108,282 | | | | 51,920 | | | | 35,429 | | | | — | |
Transfer agent — Institutional | | | 215,240 | | | | 154,085 | | | | 574,387 | | | | 270,713 | |
Transfer agent — Service | | | — | | | | 20,530 | | | | 6,699 | | | | — | |
Transfer agent — Investor A | | | 41,845 | | | | 25,480 | | | | 42,026 | | | | 91,627 | |
Transfer agent — Investor A1 | | | 56,095 | | | | 15,528 | | | | 11,684 | | | | 19,136 | |
Transfer agent — Investor B | | | 1,989 | | | | 18 | | | | 10 | | | | 32 | |
Transfer agent — Investor B1 | | | — | | | | 44 | | | | 18 | | | | — | |
Transfer agent — Investor C | | | 31,219 | | | | 13,196 | | | | 16,815 | | | | 58,053 | |
Transfer agent — Investor C1 | | | 7,213 | | | | 3,934 | | | | 3,180 | | | | — | |
Accounting services | | | 133,776 | | | | 56,422 | | | | 98,851 | | | | 161,365 | |
Registration | | | 81,933 | | | | 28,748 | | | | 28,284 | | | | 185,370 | |
Professional | | | 71,438 | | | | 67,045 | | | | 66,630 | | | | 136,476 | |
Custodian | | | 44,629 | | | | 16,146 | | | | 26,192 | | | | 46,905 | |
Officer and Trustees | | | 28,335 | | | | 23,283 | | | | 26,618 | | | | 31,517 | |
Printing | | | 24,926 | | | | 14,824 | | | | 17,549 | | | | 45,659 | |
Miscellaneous | | | 41,205 | | | | 33,465 | | | | 36,913 | | | | 52,748 | |
| | | | |
Total expenses excluding interest expense and fees | | | 5,167,137 | | | | 2,236,538 | | | | 3,834,064 | | | | 7,023,225 | |
Interest expense and fees1 | | | 469,136 | | | | 58,250 | | | | 325,447 | | | | 218,532 | |
| | | | |
Total expenses | | | 5,636,273 | | | | 2,294,788 | | | | 4,159,511 | | | | 7,241,757 | |
Less fees waived by Manager | | | (2,922 | ) | | | (77,216 | ) | | | (124 | ) | | | (400,595 | ) |
Less transfer agent fees waived and/or reimbursed — class specific | | | — | | | | (79,654 | ) | | | (330,109 | ) | | | — | |
| | | | |
Total expenses after fees waived and/or reimbursed | | | 5,633,351 | | | | 2,137,918 | | | | 3,829,278 | | | | 6,841,162 | |
| | | | |
Net investment income | | | 21,569,525 | | | | 9,023,622 | | | | 18,893,357 | | | | 21,299,717 | |
| | | | |
| | | | | | | | | | | | | | | | |
| Realized and Unrealized Gain (Loss) | | | | | | | | | | | | | | | | |
Net realized gain (loss) from: | | | | | | | | | | | | | | | | |
Investments | | | (25,594,279 | ) | | | (3,354,504 | ) | | | (6,559,989 | ) | | | 13,492,788 | |
Financial futures contracts | | | (103,076 | ) | | | (745,252 | ) | | | (876,093 | ) | | | (9,754,633 | ) |
Swaps | | | — | | | | — | | | | — | | | | 12,490 | |
| | | | |
| | | (25,697,355 | ) | | | (4,099,756 | ) | | | (7,436,082 | ) | | | 3,750,645 | |
| | | | |
Net change in unrealized appreciation/depreciation on: | | | | | | | | | | | | | | | | |
Investments | | | 1,561,412 | | | | (627,458 | ) | | | (11,190,343 | ) | | | (1,360,690 | ) |
Financial futures contracts | | | (778,744 | ) | | | (216,778 | ) | | | (725,714 | ) | | | (3,518,872 | ) |
Swaps | | | — | | | | — | | | | — | | | | 22,974 | |
| | | | |
| | | 782,668 | | | | (844,236 | ) | | | (11,916,057 | ) | | | (4,856,588 | ) |
| | | | |
Total realized and unrealized loss | | | (24,914,687 | ) | | | (4,943,992 | ) | | | (19,352,139 | ) | | | (1,105,943 | ) |
| | | | |
Net Increase (Decrease) in Net Assets Resulting from Operations | | $ | (3,345,162 | ) | | $ | 4,079,630 | | | $ | (458,782 | ) | | $ | 20,193,774 | |
| | | | |
|
1 Related to TOBs. | |
| | | | | | |
| See Notes to Financial Statements. | | | | |
| | | | | | | |
| | ANNUAL REPORT | | MAY 31, 2014 | | 39 |
| | |
| Statements of Changes in Net Assets | | |
| | | | | | | | |
| | | BlackRock California
Municipal Bond Fund | |
| | | Year Ended May 31, | |
| Increase (Decrease) in Net Assets: | | 2014 | | | 2013 | |
| | | | | | | | |
| Operations | | | | | |
Net investment income | | $ | 21,569,525 | | | $ | 24,123,689 | |
Net realized gain (loss) | | | (25,697,355 | ) | | | 7,499,250 | |
Net change in unrealized appreciation/depreciation | | | 782,668 | | | | (6,915,690 | ) |
| | | | |
Net increase (decrease) in net assets resulting from operations | | | (3,345,162 | ) | | | 24,707,249 | |
| | | | |
| | | | | | | | |
| Dividends and Distributions to Shareholders From1 | | | | | | | | |
| Net investment income: | | | | | | | | |
Institutional | | | (8,031,062 | ) | | | (9,724,092 | ) |
Investor A | | | (4,595,449 | ) | | | (5,115,970 | ) |
Investor A1 | | | (6,144,174 | ) | | | (6,400,877 | ) |
Investor B | | | (65,739 | ) | | | (164,586 | ) |
Investor C | | | (2,100,933 | ) | | | (2,086,192 | ) |
Investor C1 | | | (620,485 | ) | | | (701,810 | ) |
| Net realized gain: | | | | | | | | |
Institutional | | | (1,596,406 | ) | | | (349,878 | ) |
Investor A | | | (1,006,555 | ) | | | (185,024 | ) |
Investor A1 | | | (1,375,156 | ) | | | (220,540 | ) |
Investor B | | | (15,021 | ) | | | (5,977 | ) |
Investor C | | | (582,215 | ) | | | (102,472 | ) |
Investor C1 | | | (158,915 | ) | | | (28,140 | ) |
| | | | |
Decrease in net assets resulting from dividends and distributions to shareholders | | | (26,292,110 | ) | | | (25,085,558 | ) |
| | | | |
| | | | | | | | |
| Capital Share Transactions | | | | | | | | |
Net increase (decrease) in net assets derived from capital share transactions | | | (168,739,856 | ) | | | 185,351,361 | |
| | | | |
| | | | | | | | |
| Net Assets | | | | | | | | |
Total increase (decrease) in net assets | | | (198,377,128 | ) | | | 184,973,052 | |
Beginning of year | | | 755,142,181 | | | | 570,169,129 | |
| | | | |
End of year | | $ | 556,765,053 | | | $ | 755,142,181 | |
| | | | |
Undistributed net investment income, end of year | | $ | 576,072 | | | $ | 579,231 | |
| | | | |
1 Determined in accordance with federal income tax regulations. | | | | | | | | |
| | | | | | |
| See Notes to Financial Statements. | | | | |
| | | | | | | |
| 40 | | ANNUAL REPORT | | MAY 31, 2014 | | |
| | |
| Statements of Changes in Net Assets | | |
| | | | | | | | |
| | | BlackRock New Jersey
Municipal Bond Fund | |
| | | Year Ended May 31, | |
| Increase (Decrease) in Net Assets: | | 2014 | | | 2013 | |
| | | | | | | | |
| Operations | | | | | | | | |
Net investment income | | $ | 9,023,622 | | | $ | 9,395,002 | |
Net realized gain (loss) | | | (4,099,756 | ) | | | 1,133,515 | |
Net change in unrealized appreciation/depreciation | | | (844,236 | ) | | | (2,147,472 | ) |
| | | | |
Net increase in net assets resulting from operations | | | 4,079,630 | | | | 8,381,045 | |
| | | | |
| | | | | | | | |
| Dividends to Shareholders From1 | | | | | | | | |
| Net investment income: | | | | | | | | |
Institutional | | | (4,166,294 | ) | | | (4,710,228 | ) |
Service | | | (695,263 | ) | | | (651,499 | ) |
Investor A | | | (1,694,910 | ) | | | (1,685,598 | ) |
Investor A1 | | | (1,298,776 | ) | | | (1,425,294 | ) |
Investor B | | | (154 | ) | | | (6,641 | ) |
Investor B1 | | | (844 | ) | | | (52,765 | ) |
Investor C | | | (804,734 | ) | | | (813,833 | ) |
Investor C1 | | | (307,553 | ) | | | (368,528 | ) |
| | | | |
Decrease in net assets resulting from dividends to shareholders | | | (8,968,528 | ) | | | (9,714,386 | ) |
| | | | |
| | | | | | | | |
| Capital Share Transactions | | | | | | | | |
Net increase (decrease) in net assets derived from capital share transactions | | | (26,638,117 | ) | | | 26,865,314 | |
| | | | |
| | | | | | | | |
| Net Assets | | | | | | | | |
Total increase (decrease) in net assets | | | (31,527,015 | ) | | | 25,531,973 | |
Beginning of year | | | 270,024,783 | | | | 244,492,810 | |
| | | | |
End of year | | $ | 238,497,768 | | | $ | 270,024,783 | |
| | | | |
Undistributed net investment income, end of year | | $ | 833,473 | | | $ | 785,247 | |
| | | | |
1 Determined in accordance with federal income tax regulations. | | | | | | | | |
| | | | | | |
| See Notes to Financial Statements. | | | | |
| | | | | | | |
| | ANNUAL REPORT | | MAY 31, 2014 | | 41 |
| | |
| Statements of Changes in Net Assets | | |
| | | | | | | | |
| | | BlackRock Pennsylvania
Municipal Bond Fund | |
| | | Year Ended May 31, | |
| Increase (Decrease) in Net Assets: | | 2014 | | | 2013 | |
| | | | | | | | |
| Operations | | | | | | | | |
Net investment income | | $ | 18,893,357 | | | $ | 21,371,784 | |
Net realized gain (loss) | | | (7,436,082 | ) | | | 1,220,944 | |
Net change in unrealized appreciation/depreciation | | | (11,916,057 | ) | | | (4,352,426 | ) |
| | | | |
Net increase (decrease) in net assets resulting from operations | | | (458,782 | ) | | | 18,240,302 | |
| | | | |
| | | | | | | | |
| Dividends to Shareholders From1 | | | | | | | | |
| Net investment income | | | | | | | | |
Institutional | | | (14,461,048 | ) | | | (16,854,849 | ) |
Service | | | (292,552 | ) | | | (251,301 | ) |
Investor A | | | (2,279,593 | ) | | | (2,115,366 | ) |
Investor A1 | | | (790,660 | ) | | | (928,462 | ) |
Investor B | | | (106 | ) | | | (4,429 | ) |
Investor B1 | | | (533 | ) | | | (40,954 | ) |
Investor C | | | (876,193 | ) | | | (948,357 | ) |
Investor C1 | | | (227,290 | ) | | | (282,626 | ) |
| | | | |
Decrease in net assets resulting from dividends to shareholders | | | (18,927,975 | ) | | | (21,426,344 | ) |
| | | | |
| | | | | | | | |
| Capital Share Transactions | | | | | | | | |
Net increase (decrease) in net assets derived from capital share transactions | | | (86,889,862 | ) | | | 25,700,127 | |
| | | | |
| | | | | | | | |
| Net Assets | | | | | | | | |
Total increase (decrease) in net assets | | | (106,276,619 | ) | | | 22,514,085 | |
Beginning of year | | | 529,083,153 | | | | 506,569,068 | |
| | | | |
End of year | | $ | 422,806,534 | | | $ | 529,083,153 | |
| | | | |
Undistributed net investment income, end of year | | $ | 840,664 | | | $ | 1,001,787 | |
| | | | |
1 Determined in accordance with federal income tax regulations. | | | | | | | | |
| | | | | | |
| See Notes to Financial Statements. | | | | |
| | | | | | | |
| 42 | | ANNUAL REPORT | | MAY 31, 2014 | | |
| | |
| Statements of Changes in Net Assets | | |
| | | | | | | | |
| | | BlackRock Strategic
Municipal Opportunities Fund | |
| | | Year Ended May 31, | |
| Increase (Decrease) in Net Assets: | | 2014 | | | 2013 | |
| | | | | | | | |
| Operations | | | | | | | | |
Net investment income | | $ | 21,299,717 | | | $ | 19,807,325 | |
Net realized gain | | | 3,750,645 | | | | 6,293,323 | |
Net change in unrealized appreciation/depreciation | | | (4,856,588 | ) | | | (4,164,722 | ) |
| | | | |
Net increase in net assets resulting from operations | | | 20,193,774 | | | | 21,935,926 | |
| | | | |
| | | | | | | | |
| Dividends and Distributions to Shareholders From1 | | | | | | | | |
| Net investment income: | | | | | | | | |
Institutional | | | (12,315,644 | ) | | | (10,684,105 | ) |
Investor A | | | (5,729,443 | ) | | | (5,434,027 | ) |
Investor A1 | | | (1,160,124 | ) | | | (1,366,034 | ) |
Investor B | | | (564 | ) | | | (32,487 | ) |
Investor C | | | (2,188,161 | ) | | | (2,308,082 | ) |
| Net realized gain: | | | | | | | | |
Institutional | | | (2,608,678 | ) | | | (1,557,308 | ) |
Investor A | | | (1,484,002 | ) | | | (912,083 | ) |
Investor A1 | | | (307,374 | ) | | | (197,799 | ) |
Investor B | | | — | | | | (4,426 | ) |
Investor C | | | (771,646 | ) | | | (516,995 | ) |
| | | | |
Decrease in net assets resulting from dividends and distributions to shareholders | | | (26,565,636 | ) | | | (23,013,346 | ) |
| | | | |
| | | | | | | | |
| Capital Share Transactions | | | | | | | | |
Net increase in net assets derived from capital share transactions | | | 557,996,806 | | | | 319,161,959 | |
| | | | |
| | | | | | | | |
| Net Assets | | | | | | | | |
Total increase in net assets | | | 551,624,944 | | | | 318,084,539 | |
Beginning of year | | | 844,297,339 | | | | 526,212,800 | |
| | | | |
End of year | | $ | 1,395,922,283 | | | $ | 844,297,339 | |
| | | | |
Undistributed net investment income, end of year | | $ | 38,578 | | | $ | 253,435 | |
| | | | |
1 Determined in accordance with federal income tax regulations. | | | | | | | | |
| | | | | | |
| See Notes to Financial Statements. | | | | |
| | | | | | | |
| | ANNUAL REPORT | | MAY 31, 2014 | | 43 |
| | | | | | | | |
| Year Ended May 31, 2014 | | BlackRock
California
Municipal Bond
Fund | | | BlackRock
Pennsylvania
Municipal Bond
Fund | |
| | | | | | | | |
| Cash Provided by Operating Activities | | | | | | | | |
Net decrease in net assets resulting from operations | | $ | (3,345,162 | ) | | $ | (458,782 | ) |
Adjustments to reconcile net decrease in net assets resulting from operations to net cash provided by operating activities: | | | | | | | | |
Decrease in interest receivable | | | 1,415,447 | | | | 1,944,346 | |
Decrease in variation margin receivable on financial futures contracts | | | 33,989 | | | | 75,067 | |
Decrease in prepaid expenses | | | 4,969 | | | | 6,739 | |
(Increase) decrease in cash pledged for financial futures contracts | | | (207,000 | ) | | | 137,000 | |
Decrease in investment advisory fees payable | | | (98,819 | ) | | | (51,541 | ) |
Decrease in interest expense and fees payable | | | (22,811 | ) | | | (24,261 | ) |
Decrease in other affiliates payable | | | (1,639 | ) | | | (1,606 | ) |
Decrease in service and distribution fees payable | | | (41,621 | ) | | | (9,944 | ) |
Increase (decrease) in other accrued expenses payable | | | 40,175 | | | | (38,048 | ) |
Increase in Officer’s and Trustees’ fees payable | | | 2,997 | | | | 3,113 | |
Net realized loss on investments | | | 25,594,279 | | | | 6,559,989 | |
Net unrealized gain (loss) on investments | | | (1,561,412 | ) | | | 11,190,343 | |
Amortization of premium and accretion of discount on investments | | | 3,987,151 | | | | 1,229,046 | |
Proceeds from sales of long-term investments | | | 461,670,207 | | | | 164,638,904 | |
Purchases of long-term investments | | | (220,873,239 | ) | | | (51,779,549 | ) |
Net proceeds from sales of short-term securities | | | 71,822 | | | | 7,598,307 | |
| | | | |
Cash provided by operating activities | | | 266,669,333 | | | | 141,019,123 | |
| | | | |
| | | | | | | | |
| Cash Used for Financing Activities | | | | | | | | |
Proceeds from issuance of capital shares | | | 132,695,557 | | | | 41,966,336 | |
Payments on redemption of capital shares | | | (319,201,766 | ) | | | (134,191,054 | ) |
Proceeds from TOB trust certificates | | | 7,195,000 | | | | — | |
Repayments of TOB trust certificates | | | (78,285,366 | ) | | | (34,975,000 | ) |
Cash dividends paid to shareholders | | | (9,072,758 | ) | | | (13,819,405 | ) |
| | | | |
Cash used for financing activities | | | (266,669,333 | ) | | | (141,019,123 | ) |
| | | | |
| | | | | | | | |
| Cash | | | | | | | | |
Net increase (decrease) in cash | | | — | | | | — | |
Cash at beginning of year | | | — | | | | — | |
| | | | |
Cash at end of year | | | — | | | | — | |
| | | | |
| | | | | | | | |
| Supplemental Disclosure of Cash Flow Information | | | | | | | | |
Cash paid during the year for interest and fees | | $ | 491,947 | | | $ | 349,708 | |
| | | | |
| | | | | | | | |
| Non-cash Financing Activities | | | | | | | | |
Capital shares issued in reinvestment of dividends paid to shareholders | | $ | 17,500,179 | | | $ | 5,386,390 | |
| | | | |
| | | | | | |
| See Notes to Financial Statements. | | | | |
| | | | | | | |
| 44 | | ANNUAL REPORT | | MAY 31, 2014 | | |
| | |
| Financial Highlights | | BlackRock California Municipal Bond Fund |
| | | | | | | | | | | | | | | | | | | | | | | | | | | | | | | | | | | | | | | | | | |
| | | Institutional | | | | | Investor A | |
| | | Year Ended May 31, | | | | | Year Ended May 31, | |
| | | 2014 | | | 2013 | | | 2012 | | | 2011 | | | 2010 | | | | | 2014 | | | 2013 | | | 2012 | | | 2011 | | | 2010 | |
| | | | | | | | | | | | | | | | | | | | | | | | | | | | | | | | | | | | | | | | | | |
| Per Share Operating Performance | |
Net asset value, beginning of year | | $ | 12.54 | | | $ | 12.48 | | | $ | 11.20 | | | $ | 11.54 | | | $ | 11.02 | | | | | $ | 12.53 | | | $ | 12.47 | | | $ | 11.19 | | | $ | 11.53 | | | $ | 11.01 | |
| | | | | | | | | | |
Net investment income1 | | | 0.47 | | | | 0.45 | | | | 0.53 | | | | 0.55 | | | | 0.53 | | | | | | 0.45 | | | | 0.42 | | | | 0.49 | | | | 0.53 | | | | 0.50 | |
Net realized and unrealized gain (loss) | | | (0.22 | ) | | | 0.09 | | | | 1.28 | | | | (0.34 | ) | | | 0.52 | | | | | | (0.23 | ) | | | 0.09 | | | | 1.29 | | | | (0.35 | ) | | | 0.53 | |
| | | | | | | | | | |
Net increase from investment operations | | | 0.25 | | | | 0.54 | | | | 1.81 | | | | 0.21 | | | | 1.05 | | | | | | 0.22 | | | | 0.51 | | | | 1.78 | | | | 0.18 | | | | 1.03 | |
| | | | | | | | | | |
| Dividends and distributions from:2 | | | | | | | | | | | | | | | | | | | | | | | | | | | | | | | | | | | | | | | | | | |
Net investment income | | | (0.47 | ) | | | (0.46 | ) | | | (0.53 | ) | | | (0.55 | ) | | | (0.53 | ) | | | | | (0.44 | ) | | | (0.43 | ) | | | (0.50 | ) | | | (0.52 | ) | | | (0.51 | ) |
Net realized gain | | | (0.10 | ) | | | (0.02 | ) | | | — | | | | — | | | | — | | | | | | (0.10 | ) | | | (0.02 | ) | | | — | | | | — | | | | — | |
| | | | | | | | | | |
Total dividends and distributions | | | (0.57 | ) | | | (0.48 | ) | | | (0.53 | ) | | | (0.55 | ) | | | (0.53 | ) | | | | | (0.54 | ) | | | (0.45 | ) | | | (0.50 | ) | | | (0.52 | ) | | | (0.51 | ) |
| | | | | | | | | | |
Net asset value, end of year | | $ | 12.22 | | | $ | 12.54 | | | $ | 12.48 | | | $ | 11.20 | | | $ | 11.54 | | | | | $ | 12.21 | | | $ | 12.53 | | | $ | 12.47 | | | $ | 11.19 | | | $ | 11.53 | |
| | | | | | | | | | |
| | | | | | | | | | | | | | | | | | | | | | | | | | | | | | | | | | | | | | | | | | |
| Total Investment Return3 | | | | | | | | | | | | | | | | | | | | | | | | | | | | | | | | | | | | | | | | | | |
Based on net asset value | | | 2.31% | | | | 4.26% | | | | 16.55% | | | | 1.89% | | | | 9.72% | | | | | | 2.13% | | | | 4.02% | | | | 16.29% | | | | 1.65% | | | | 9.47% | |
| | | | | | | | | | |
| | | | | | | | | | | | | | | | | | | | | | | | | | | | | | | | | | | | | | | | | | |
| Ratio to Average Net Assets | |
Total expenses | | | 0.81% | | | | 0.73% | | | | 0.78% | | | | 0.83% | | | | 0.79% | | | | | | 0.99% | | | | 0.96% | | | | 1.01% | | | | 1.07% | | | | 1.02% | |
| | | | | | | | | | |
Total expenses after fees waived | | | 0.81% | | | | 0.72% | | | | 0.78% | | | | 0.83% | | | | 0.78% | | | | | | 0.99% | | | | 0.96% | | | | 1.01% | | | | 1.07% | | | | 1.02% | |
| | | | | | | | | | |
Total expenses after fees waived and excluding interest expense and fees4 | | | 0.73% | | | | 0.65% | | | | 0.68% | | | | 0.70% | | | | 0.73% | | | | | | 0.91% | | | | 0.88% | | | | 0.91% | | | | 0.94% | | | | 0.97% | |
| | | | | | | | | | |
Net investment income | | | 3.96% | | | | 3.54% | | | | 4.44% | | | | 4.90% | | | | 4.67% | | | | | | 3.79% | | | | 3.32% | | | | 4.19% | | | | 4.66% | | | | 4.43% | |
| | | | | | | | | | |
| | | | | | | | | | | | | | | | | | | | | | | | | | | | | | | | | | | | | | | | | | |
| Supplemental Data | | | | | | | | | | | | | | | | | | | | | | | | | | | | | | | | | | | | | | | | | | |
Net assets, end of year (000) | | $ | 206,904 | | | $ | 293,150 | | | $ | 174,726 | | | $ | 87,977 | | | $ | 59,097 | | | | | $ | 111,545 | | | $ | 166,056 | | | $ | 117,051 | | | $ | 56,575 | | | $ | 48,331 | |
| | | | | | | | | | |
Portfolio turnover | | | 33% | | | | 51% | | | | 42% | | | | 41% | | | | 53% | | | | | | 33% | | | | 51% | | | | 42% | | | | 41% | | | | 53% | |
| | | | | | | | | | |
| 1 | | Based on average shares outstanding. |
| 2 | | Determined in accordance with federal income tax regulations. |
| 3 | | Where applicable, excludes the effects of any sales charges and assumes the reinvestment of dividends and distributions. |
| 4 | | Interest expense and fees relate to TOBs. See Note 3 of the Notes to Financial Statements for details of municipal bonds transferred to TOBs. |
| | | | | | |
| See Notes to Financial Statements. | | | | |
| | | | | | | |
| | ANNUAL REPORT | | MAY 31, 2014 | | 45 |
| | |
| Financial Highlights (continued) | | BlackRock California Municipal Bond Fund |
| | | | | | | | | | | | | | | | | | | | | | | | | | | | | | | | | | | | | | | | | | |
| | | Investor A1 | | | | | Investor B | |
| | | Year Ended May 31, | | | | | Year Ended May 31, | |
| | | 2014 | | | 2013 | | | 2012 | | | 2011 | | | 2010 | | | | | 2014 | | | 2013 | | | 2012 | | | 2011 | | | 2010 | |
| | | | | | | | | | | | | | | | | | | | | | | | | | | | | | | | | | | | | | | | | | |
| Per Share Operating Performance | |
Net asset value, beginning of year | | $ | 12.54 | | | $ | 12.48 | | | $ | 11.20 | | | $ | 11.54 | | | $ | 11.02 | | | | | $ | 12.55 | | | $ | 12.49 | | | $ | 11.21 | | | $ | 11.55 | | | $ | 11.03 | |
| | | | | | | | | | |
Net investment income1 | | | 0.46 | | | | 0.44 | | | | 0.52 | | | | 0.54 | | | | 0.52 | | | | | | 0.41 | | | | 0.39 | | | | 0.45 | | | | 0.50 | | | | 0.47 | |
Net realized and unrealized gain (loss) | | | (0.21 | ) | | | 0.09 | | | | 1.28 | | | | (0.34 | ) | | | 0.52 | | | | | | (0.22 | ) | | | 0.08 | | | | 1.30 | | | | (0.35 | ) | | | 0.53 | |
| | | | | | | | | | |
Net increase from investment operations | | | 0.25 | | | | 0.53 | | | | 1.80 | | | | 0.20 | | | | 1.04 | | | | | | 0.19 | | | | 0.47 | | | | 1.75 | | | | 0.15 | | | | 1.00 | |
| | | | | | | | | | |
| Dividends and distributions from:2 | | | | | | | | | | | | | | | | | | | | | | | | | | | | | | | | | | | | | | | | | | |
Net investment income | | | (0.46 | ) | | | (0.45 | ) | | | (0.52 | ) | | | (0.54 | ) | | | (0.52 | ) | | | | | (0.41 | ) | | | (0.39 | ) | | | (0.47 | ) | | | (0.49 | ) | | | (0.48 | ) |
Net realized gain | | | (0.10 | ) | | | (0.02 | ) | | | — | | | | — | | | | — | | | | | | (0.10 | ) | | | (0.02 | ) | | | — | | | | — | | | | — | |
| | | | | | | | | | |
Total dividends and distributions | | | (0.56 | ) | | | (0.47 | ) | | | (0.52 | ) | | | (0.54 | ) | | | (0.52 | ) | | | | | (0.51 | ) | | | (0.41 | ) | | | (0.47 | ) | | | (0.49 | ) | | | (0.48 | ) |
| | | | | | | | | | |
Net asset value, end of year | | $ | 12.23 | | | $ | 12.54 | | | $ | 12.48 | | | $ | 11.20 | | | $ | 11.54 | | | | | $ | 12.23 | | | $ | 12.55 | | | $ | 12.49 | | | $ | 11.21 | | | $ | 11.55 | |
| | | | | | | | | | |
| | | | | | | | | | | | | | | | | | | | | | | | | | | | | | | | | | | | | | | | | | |
| Total Investment Return3 | | | | | | | | | | | | | | | | | | | | | | | | | | | | | | | | | | | | | | | | | | |
Based on net asset value | | | 2.36% | | | | 4.17% | | | | 16.45% | | | | 1.82% | | | | 9.63% | | | | | | 1.82% | | | | 3.73% | | | | 15.94% | | | | 1.39% | | | | 9.17% | |
| | | | | | | | | | |
| | | | | | | | | | | | | | | | | | | | | | | | | | | | | | | | | | | | | | | | | | |
| Ratios to Average Net Assets | |
Total expenses | | | 0.84% | | | | 0.82% | | | | 0.87% | | | | 0.91% | | | | 0.87% | | | | | | 1.30% | | | | 1.25% | | | | 1.31% | | | | 1.34% | | | | 1.29% | |
| | | | | | | | | | |
Total expenses after fees waived | | | 0.84% | | | | 0.81% | | | | 0.86% | | | | 0.91% | | | | 0.86% | | | | | | 1.30% | | | | 1.24% | | | | 1.30% | | | | 1.33% | | | | 1.28% | |
| | | | | | | | | | |
Total expenses after fees waived and excluding interest expense and fees4 | | | 0.76% | | | | 0.74% | | | | 0.77% | | | | 0.78% | | | | 0.81% | | | | | | 1.22% | | | | 1.17% | | | | 1.21% | | | | 1.20% | | | | 1.23% | |
| | | | | | | | | | |
Net investment income | | | 3.94% | | | | 3.48% | | | | 4.42% | | | | 4.81% | | | | 4.57% | | | | | | 3.49% | | | | 3.07% | | | | 3.83% | | | | 4.37% | | | | 4.14% | |
| | | | | | | | | | |
| | | | | | | | | | | | | | | | | | | | | | | | | | | | | | | | | | | | | | | | | | |
| Supplemental Data | | | | | | | | | | | | | | | | | | | | | | | | | | | | | | | | | | | | | | | | | | |
Net assets, end of year (000) | | $ | 154,845 | | | $ | 177,677 | | | $ | 183,008 | | | $ | 169,576 | | | $ | 187,784 | | | | | $ | 947 | | | $ | 3,570 | | | $ | 7,382 | | | $ | 11,626 | | | $ | 19,989 | |
| | | | | | | | | | |
Portfolio turnover | | | 33% | | | | 51% | | | | 42% | | | | 41% | | | | 53% | | | | | | 33% | | | | 51% | | | | 42% | | | | 41% | | | | 53% | |
| | | | | | | | | | |
| 1 | | Based on average shares outstanding. |
| 2 | | Determined in accordance with federal income tax regulations. |
| 3 | | Where applicable, excludes the effects of any sales charges and assumes the reinvestment of dividends and distributions. |
| 4 | | Interest expense and fees relate to TOBs. See Note 3 of the Notes to Financial Statements for details of municipal bonds transferred to TOBs. |
| | | | | | |
| See Notes to Financial Statements. | | | | |
| | | | | | | |
| 46 | | ANNUAL REPORT | | MAY 31, 2014 | | |
| | |
| Financial Highlights (concluded) | | BlackRock California Municipal Bond Fund |
| | | | | | | | | | | | | | | | | | | | | | | | | | | | | | | | | | | | | | | | | | |
| | | Investor C | | | | | Investor C1 | |
| | | Year Ended May 31, | | | | | Year Ended May 31, | |
| | | 2014 | | | 2013 | | | 2012 | | | 2011 | | | 2010 | | | | | 2014 | | | 2013 | | | 2012 | | | 2011 | | | 2010 | |
| | | | | | | | | | | | | | | | | | | | | | | | | | | | | | | | | | | | | | | | | | |
| Per Share Operating Performance | | | | | | | | | | | | | | | | | | | | | | | | | | | | | | | | | | | | | | | | | | |
Net asset value, beginning of year | | $ | 12.54 | | | $ | 12.48 | | | $ | 11.20 | | | $ | 11.54 | | | $ | 11.02 | | | | | $ | 12.54 | | | $ | 12.48 | | | $ | 11.20 | | | $ | 11.54 | | | $ | 11.02 | |
| | | | | | | | | | |
Net investment income1 | | | 0.36 | | | | 0.32 | | | | 0.41 | | | | 0.44 | | | | 0.42 | | | | | | 0.40 | | | | 0.38 | | | | 0.46 | | | | 0.49 | | | | 0.46 | |
Net realized and unrealized gain (loss) | | | (0.21 | ) | | | 0.09 | | | | 1.29 | | | | (0.34 | ) | | | 0.52 | | | | | | (0.21 | ) | | | 0.09 | | | | 1.28 | | | | (0.35 | ) | | | 0.53 | |
| | | | | | | | | | |
Net increase from investment operations | | | 0.15 | | | | 0.41 | | | | 1.70 | | | | 0.10 | | | | 0.94 | | | | | | 0.19 | | | | 0.47 | | | | 1.74 | | | | 0.14 | | | | 0.99 | |
| | | | | | | | | | |
Dividends and distributions from:2 | | | | | | | | | | | | | | | | | | | | | | | | | | | | | | | | | | | | | | | | | | |
Net investment income | | | (0.36 | ) | | | (0.33 | ) | | | (0.42 | ) | | | (0.44 | ) | | | (0.42 | ) | | | | | (0.40 | ) | | | (0.39 | ) | | | (0.46 | ) | | | (0.48 | ) | | | (0.47 | ) |
Net realized gain | | | (0.10 | ) | | | (0.02 | ) | | | — | | | | — | | | | — | | | | | | (0.10 | ) | | | (0.02 | ) | | | — | | | | — | | | | — | |
| | | | | | | | | | |
Total dividends and distributions | | | (0.46 | ) | | | (0.35 | ) | | | (0.42 | ) | | | (0.44 | ) | | | (0.42 | ) | | | | | (0.50 | ) | | | (0.41 | ) | | | (0.46 | ) | | | (0.48 | ) | | | (0.47 | ) |
| | | | | | | | | | |
Net asset value, end of year | | $ | 12.23 | | | $ | 12.54 | | | $ | 12.48 | | | $ | 11.20 | | | $ | 11.54 | | | | | $ | 12.23 | | | $ | 12.54 | | | $ | 12.48 | | | $ | 11.20 | | | $ | 11.54 | |
| | | | | | | | | | |
| | | | | | | | | | | | | | | | | | | | | | | | | | | | | | | | | | | | | | | | | | |
| Total Investment Return3 | | | | | | | | | | | | | | | | | | | | | | | | | | | | | | | | | | | | | | | | | | |
Based on net asset value | | | 1.44% | | | | 3.23% | | | | 15.42% | | | | 0.91% | | | | 8.65% | | | | | | 1.85% | | | | 3.65% | | | | 15.87% | | | | 1.31% | | | | 9.09% | |
| | | | | | | | | | |
| | | | | | | | | | | | | | | | | | | | | | | | | | | | | | | | | | | | | | | | | | |
| Ratios to Average Net Assets | | | | | | | | | | | | | | | | | | | | | | | | | | | | | | | | | | | | | | | | | | |
Total expenses | | | 1.75% | | | | 1.73% | | | | 1.76% | | | | 1.81% | | | | 1.77% | | | | | | 1.34% | | | | 1.32% | | | | 1.37% | | | | 1.41% | | | | 1.37% | |
| | | | | | | | | | |
Total expenses after fees waived | | | 1.75% | | | | 1.72% | | | | 1.76% | | | | 1.81% | | | | 1.77% | | | | | | 1.34% | | | | 1.31% | | | | 1.37% | | | | 1.40% | | | | 1.36% | |
| | | | | | | | | | |
Total expenses after fees waived and excluding interest expense and fees4 | | | 1.67% | | | | 1.64% | | | | 1.66% | | | | 1.68% | | | | 1.72% | | | | | | 1.26% | | | | 1.24% | | | | 1.27% | | | | 1.28% | | | | 1.31% | |
| | | | | | | | | | |
Net investment income | | | 3.03% | | | | 2.56% | | | | 3.45% | | | | 3.91% | | | | 3.68% | | | | | | 3.44% | | | | 2.98% | | | | 3.93% | | | | 4.29% | | | | 4.07% | |
| | | | | | | | | | |
| | | | | | | | | | | | | | | | | | | | | | | | | | | | | | | | | | | | | | | | | | |
| Supplemental Data | | | | | | | | | | | | | | | | | | | | | | | | | | | | | | | | | | | | | | | | | | |
Net assets, end of year (000) | | $ | 65,203 | | | $ | 92,635 | | | $ | 63,515 | | | $ | 30,434 | | | $ | 29,583 | | | | | $ | 17,320 | | | $ | 22,054 | | | $ | 24,486 | | | $ | 24,195 | | | $ | 28,506 | |
| | | | | | | | | | |
Portfolio turnover | | | 33% | | | | 51% | | | | 42% | | | | 41% | | | | 53% | | | | | | 33% | | | | 51% | | | | 42% | | | | 41% | | | | 53% | |
| | | | | | | | | | |
| 1 | | Based on average shares outstanding. |
| 2 | | Determined in accordance with federal income tax regulations. |
| 3 | | Where applicable, excludes the effects of any sales charges and assumes the reinvestment of dividends and distributions. |
| 4 | | Interest expense and fees relate to TOBs. See Note 3 of the Notes to Financial Statements for details of municipal bonds transferred to TOBs. |
| | | | | | |
| See Notes to Financial Statements. | | | | |
| | | | | | | |
| | ANNUAL REPORT | | MAY 31, 2014 | | 47 |
| | |
| Financial Highlights | | BlackRock New Jersey Municipal Bond Fund |
| | | | | | | | | | | | | | | | | | | | | | | | | | | | | | | | | | | | | | | | | | |
| | | Institutional | | | | | Service | |
| | | Year Ended May 31, | | | | | Year Ended May 31, | |
| | | 2014 | | | 2013 | | | 2012 | | | 2011 | | | 2010 | | | | | 2014 | | | 2013 | | | 2012 | | | 2011 | | | 2010 | |
| | | | | | | | | | | | | | | | | | | | | | | | | | | | | | | | | | | | | | | | | | |
| Per Share Operating Performance | |
Net asset value, beginning of year | | $ | 11.22 | | | $ | 11.26 | | | $ | 10.18 | | | $ | 10.45 | | | $ | 9.85 | | | | | $ | 11.22 | | | $ | 11.26 | | | $ | 10.17 | | | $ | 10.45 | | | $ | 9.85 | |
| | | | | | | | | | |
Net investment income1 | | | 0.43 | | | | 0.43 | | | | 0.45 | | | | 0.48 | | | | 0.47 | | | | | | 0.42 | | | | 0.41 | | | | 0.43 | | | | 0.46 | | | | 0.46 | |
Net realized and unrealized gain (loss) | | | (0.13 | ) | | | (0.02 | ) | | | 1.09 | | | | (0.27 | ) | | | 0.58 | | | | | | (0.14 | ) | | | (0.01 | ) | | | 1.10 | | | | (0.28 | ) | | | 0.58 | |
| | | | | | | | | | |
Net increase from investment operations | | | 0.30 | | | | 0.41 | | | | 1.54 | | | | 0.21 | | | | 1.05 | | | | | | 0.28 | | | | 0.40 | | | | 1.53 | | | | 0.18 | | | | 1.04 | |
| | | | | | | | | | |
Dividends from net investment income2 | | | (0.43 | ) | | | (0.45 | ) | | | (0.46 | ) | | | (0.48 | ) | | | (0.45 | ) | | | | | (0.41 | ) | | | (0.44 | ) | | | (0.44 | ) | | | (0.46 | ) | | | (0.44 | ) |
| | | | | | | | | | |
Net asset value, end of year | | $ | 11.09 | | | $ | 11.22 | | | $ | 11.26 | | | $ | 10.18 | | | $ | 10.45 | | | | | $ | 11.09 | | | $ | 11.22 | | | $ | 11.26 | | | $ | 10.17 | | | $ | 10.45 | |
| | | | | | | | | | |
| | | | | | | | | | | | | | | | | | | | | | | | | | | | | | | | | | | | | | | | | | |
| Total Investment Return3 | | | | | | | | | | | | | | | | | | | | | | | | | | | | | | | | | | | | | | | | | | |
Based on net asset value | | | 2.89% | | | | 3.56% | | | | 15.41% | | | | 2.10% | | | | 10.91% | | | | | | 2.78% | | | | 3.47% | | | | 15.31% | | | | 1.76% | | | | 10.80% | |
| | | | | | | | | | |
| | | | | | | | | | | | | | | | | | | | | | | | | | | | | | | | | | | | | | | | | | |
| Ratio to Average Net Assets | | | | | | | | | | | | | | | | | | | | | | | | | | | | | | | | | | | | | | | | | | |
Total expenses | | | 0.83% | | | | 0.83% | | | | 0.82% | | | | 0.83% | | | | 0.82% | | | | | | 1.04% | | | | 1.03% | | | | 1.02% | | | | 1.01% | | | | 1.03% | |
| | | | | | | | | | |
Total expenses after fees waived and/or reimbursed and paid indirectly | | | 0.79% | | | | 0.79% | | | | 0.68% | | | | 0.62% | | | | 0.77% | | | | | | 0.90% | | | | 0.89% | | | | 0.88% | | | | 0.86% | | | | 0.87% | |
| | | | | | | | | | |
Total expenses after fees waived and/or reimbursed and paid indirectly and excluding interest expense and fees | | | 0.76% | 4 | | | 0.78% | 4 | | | 0.68% | 4 | | | 0.62% | | | | 0.77% | 4 | | | | | 0.87% | 4 | | | 0.87% | 4 | | | 0.87% | 4 | | | 0.86% | | | | 0.87% | 4 |
| | | | | | | | | | |
Net investment income | | | 4.04% | | | | 3.74% | | | | 4.19% | | | | 4.72% | | | | 4.57% | | | | | | 3.94% | | | | 3.64% | | | | 4.00% | | | | 4.50% | | | | 4.47% | |
| | | | | | | | | | |
| | | | | | | | | | | | | | | | | | | | | | | | | | | | | | | | | | | | | | | | | | |
| Supplemental Data | | | | | | | | | | | | | | | | | | | | | | | | | | | | | | | | | | | | | | | | | | |
Net assets, end of year (000) | | $ | 109,182 | | | $ | 120,851 | | | $ | 119,558 | | | $ | 114,377 | | | $ | 158,244 | | | | | $ | 17,881 | | | $ | 19,388 | | | $ | 14,375 | | | $ | 12,804 | | | $ | 10,521 | |
| | | | | | | | | | |
Portfolio turnover | | | 12% | | | | 8% | | | | 18% | | | | 14% | | | | 18% | | | | | | 12% | | | | 8% | | | | 18% | | | | 14% | | | | 18% | |
| | | | | | | | | | |
| 1 | | Based on average shares outstanding. |
| 2 | | Determined in accordance with federal income tax regulations. |
| 3 | | Where applicable, assumes the reinvestment of dividends and distributions. |
| 4 | | Interest expense and fees relate to TOBs. See Note 3 of the Notes to Financial Statements for details of municipal bonds transferred to TOBs. |
| | | | | | |
| See Notes to Financial Statements. | | | | |
| | | | | | | |
| 48 | | ANNUAL REPORT | | MAY 31, 2014 | | |
| | |
| Financial Highlights (continued) | | BlackRock New Jersey Municipal Bond Fund |
| | | | | | | | | | | | | | | | | | | | | | | | | | | | | | | | | | | | | | | | | | |
| | | Investor A | | | | | Investor A1 | |
| | | Year Ended May 31, | | | | | Year Ended May 31, | |
| | | 2014 | | | 2013 | | | 2012 | | | 2011 | | | 2010 | | | | | 2014 | | | 2013 | | | 2012 | | | 2011 | | | 2010 | |
| | | | | | | | | | | | | | | | | | | | | | | | | | | | | | | | | | | | | | | | | | |
| Per Share Operating Performance | | | | | | | | | | | | | | | | | | | | | | | | | | | | | | | | | | | | | | | | | | |
Net asset value, beginning of year | | $ | 11.23 | | | $ | 11.27 | | | $ | 10.19 | | | $ | 10.46 | | | $ | 9.86 | | | | | $ | 11.23 | | | $ | 11.27 | | | $ | 10.19 | | | $ | 10.46 | | | $ | 9.86 | |
| | | | | | | | | | |
Net investment income1 | | | 0.42 | | | | 0.41 | | | | 0.43 | | | | 0.46 | | | | 0.46 | | | | | | 0.43 | | | | 0.43 | | | | 0.44 | | | | 0.48 | | | | 0.47 | |
Net realized and unrealized gain (loss) | | | (0.14 | ) | | | (0.01 | ) | | | 1.09 | | | | (0.27 | ) | | | 0.58 | �� | | | | | (0.13 | ) | | | (0.02 | ) | | | 1.09 | | | | (0.28 | ) | | | 0.59 | |
| | | | | | | | | | |
Net increase from investment operations | | | 0.28 | | | | 0.40 | | | | 1.52 | | | | 0.19 | | | | 1.04 | | | | | | 0.30 | | | | 0.41 | | | | 1.53 | | | | 0.20 | | | | 1.06 | |
| | | | | | | | | | |
Dividends from net investment income2 | | | (0.41 | ) | | | (0.44 | ) | | | (0.44 | ) | | | (0.46 | ) | | | (0.44 | ) | | | | | (0.43 | ) | | | (0.45 | ) | | | (0.45 | ) | | | (0.47 | ) | | | (0.46 | ) |
| | | | | | | | | | |
Net asset value, end of year | | $ | 11.10 | | | $ | 11.23 | | | $ | 11.27 | | | $ | 10.19 | | | $ | 10.46 | | | | | $ | 11.10 | | | $ | 11.23 | | | $ | 11.27 | | | $ | 10.19 | | | $ | 10.46 | |
| | | | | | | | | | |
| | | | | | | | | | | | | | | | | | | | | | | | | | | | | | | | | | | | | | | | | | |
| Total Investment Return3 | | | | | | | | | | | | | | | | | | | | | | | | | | | | | | | | | | | | | | | | | | |
Based on net asset value | | | 2.78% | | | | 3.47% | | | | 15.18% | | | | 1.86% | | | | 10.79% | | | | | | 2.93% | | | | 3.62% | | | | 15.35% | | | | 2.02% | | | | 10.96% | |
| | | | | | | | | | |
| | | | | | | | | | | | | | | | | | | | | | | | | | | | | | | | | | | | | | | | | | |
| Ratios to Average Net Assets | | | | | | | | | | | | | | | | | | | | | | | | | | | | | | | | | | | | | | | | | | |
Total expenses | | | 0.99% | | | | 0.97% | | | | 0.95% | | | | 0.96% | | | | 0.97% | | | | | | 0.83% | | | | 0.82% | | | | 0.82% | | | | 0.81% | | | | 0.83% | |
| | | | | | | | | | |
Total expenses after fees waived and/or reimbursed and paid indirectly | | | 0.90% | | | | 0.89% | | | | 0.88% | | | | 0.87% | | | | 0.87% | | | | | | 0.75% | | | | 0.74% | | | | 0.73% | | | | 0.71% | | | | 0.72% | |
| | | | | | | | | | |
Total expenses after fees waived and/or reimbursed and paid indirectly and excluding interest expense and fees | | | 0.87% | 4 | | | 0.87% | 4 | | | 0.87% | 4 | | | 0.87% | | | | 0.87% | 4 | | | | | 0.72% | 4 | | | 0.72% | 4 | | | 0.72% | 4 | | | 0.71% | | | | 0.72% | 4 |
| | | �� | | | | | | | |
Net investment income | | | 3.93% | | | | 3.64% | | | | 3.98% | | | | 4.48% | | | | 4.46% | | | | | | 4.09% | | | | 3.80% | | | | 4.14% | | | | 4.64% | | | | 4.62% | |
| | | | | | | | | | |
| | | | | | | | | | | | | | | | | | | | | | | | | | | | | | | | | | | | | | | | | | |
| Supplemental Data | | | | | | | | | | | | | | | | | | | | | | | | | | | | | | | | | | | | | | | | | | |
Net assets, end of year (000) | | $ | 45,073 | | | $ | 53,521 | | | $ | 37,824 | | | $ | 27,441 | | | $ | 27,210 | | | | | $ | 31,338 | | | $ | 34,941 | | | $ | 36,387 | | | $ | 33,063 | | | $ | 36,704 | |
| | | | | | | | | | |
Portfolio turnover | | | 12% | | | | 8% | | | | 18% | | | | 14% | | | | 18% | | | | | | 12% | | | | 8% | | | | 18% | | | | 14% | | | | 18% | |
| | | | | | | | | | |
| 1 | | Based on average shares outstanding. |
| 2 | | Determined in accordance with federal income tax regulations. |
| 3 | | Where applicable, excludes the effects of any sales charges and assumes the reinvestment of dividends and distributions. |
| 4 | | Interest expense and fees relate to TOBs. See Note 3 of the Notes to Financial Statements for details of municipal bonds transferred to TOBs. |
| | | | | | |
| See Notes to Financial Statements. | | | | |
| | | | | | | |
| | ANNUAL REPORT | | MAY 31, 2014 | | 49 |
| | |
| Financial Highlights (concluded) | | BlackRock New Jersey Municipal Bond Fund |
| | | | | | | | | | | | | | | | | | | | | | | | | | | | | | | | | | | | | | | | | | |
| | | Investor C | | | | | Investor C1 | |
| | | Year Ended May 31, | | | | | Year Ended May 31, | |
| | | 2014 | | | 2013 | | | 2012 | | | 2011 | | | 2010 | | | | | 2014 | | | 2013 | | | 2012 | | | 2011 | | | 2010 | |
| | | | | | | | | | | | | | | | | | | | | | | | | | | | | | | | | | | | | | | | | | |
| Per Share Operating Performance | | | | | | | | | | | | | | | | | | | | | | | | | | | | | | | | | | | | | | | | | | |
Net asset value, beginning of year | | $ | 11.21 | | | $ | 11.25 | | | $ | 10.17 | | | $ | 10.45 | | | $ | 9.84 | | | | | $ | 11.22 | | | $ | 11.26 | | | $ | 10.17 | | | $ | 10.45 | | | $ | 9.85 | |
| | | | | | | | | | |
Net investment income1 | | | 0.34 | | | | 0.33 | | | | 0.34 | | | | 0.38 | | | | 0.38 | | | | | | 0.38 | | | | 0.38 | | | | 0.39 | | | | 0.42 | | | | 0.42 | |
Net realized and unrealized gain (loss) | | | (0.14 | ) | | | (0.02 | ) | | | 1.09 | | | | (0.28 | ) | | | 0.60 | | | | | | (0.13 | ) | | | (0.02 | ) | | | 1.10 | | | | (0.28 | ) | | | 0.59 | |
| | | | | | | | | | |
Net increase from investment operations | | | 0.20 | | | | 0.31 | | | | 1.43 | | | | 0.10 | | | | 0.98 | | | | | | 0.25 | | | | 0.36 | | | | 1.49 | | | | 0.14 | | | | 1.01 | |
| | | | | | | | | | |
Dividends from net investment income2 | | | (0.33 | ) | | | (0.35 | ) | | | (0.35 | ) | | | (0.38 | ) | | | (0.37 | ) | | | | | (0.38 | ) | | | (0.40 | ) | | | (0.40 | ) | | | (0.42 | ) | | | (0.41 | ) |
| | | | | | | | | | |
Net asset value, end of year | | $ | 11.08 | | | $ | 11.21 | | | $ | 11.25 | | | $ | 10.17 | | | $ | 10.45 | | | | | $ | 11.09 | | | $ | 11.22 | | | $ | 11.26 | | | $ | 10.17 | | | $ | 10.45 | |
| | | | | | | | | | |
| | | | | | | | | | | | | | | | | | | | | | | | | | | | | | | | | | | | | | | | | | |
| Total Investment Return3 | | | | | | | | | | | | | | | | | | | | | | | | | | | | | | | | | | | | | | | | | | |
Based on net asset value | | | 1.99% | | | | 2.68% | | | | 14.33% | | | | 0.98% | | | | 10.07% | | | | | | 2.41% | | | | 3.10% | | | | 14.89% | | | | 1.40% | | | | 10.41% | |
| | | | | | | | | | |
| | | | | | | | | | | | | | | | | | | | | | | | | | | | | | | | | | | | | | | | | | |
| Ratios to Average Net Assets | | | | | | | | | | | | | | | | | | | | | | | | | | | | | | | | | | | | | | | | | | |
Total expenses | | | 1.73% | | | | 1.72% | | | | 1.71% | | | | 1.71% | | | | 1.73% | | | | | | 1.32% | | | | 1.32% | | | | 1.31% | | | | 1.30% | | | | 1.32% | |
| | | | | | | | | | |
Total expenses after fees waived and paid indirectly | | | 1.67% | | | | 1.66% | | | | 1.65% | | | | 1.64% | | | | 1.64% | | | | | | 1.26% | | | | 1.25% | | | | 1.24% | | | | 1.22% | | | | 1.23% | |
| | | | | | | | | | |
Total expenses after fees waived and paid indirectly and excluding interest expense and fees | | | 1.64% | 4 | | | 1.64% | 4 | | | 1.64% | 4 | | | 1.64% | | | | 1.64% | 4 | | | | | 1.23% | 4 | | | 1.23% | 4 | | | 1.23% | 4 | | | 1.22% | | | | 1.23% | 4 |
| | | | | | | | | | |
Net investment income | | | 3.16% | | | | 2.87% | | | | 3.22% | | | | 3.71% | | | | 3.69% | | | | | | 3.58% | | | | 3.29% | | | | 3.65% | | | | 4.14% | | | | 4.11% | |
| | | | | | | | | | |
| | | | | | | | | | | | | | | | | | | | | | | | | | | | | | | | | | | | | | | | | | |
| Supplemental Data | | | | | | | | | | | | | | | | | | | | | | | | | | | | | | | | | | | | | | | | | | |
Net assets, end of year (000) | | $ | 26,429 | | | $ | 30,139 | | | $ | 22,635 | | | $ | 17,639 | | | $ | 18,802 | | | | | $ | 8,594 | | | $ | 10,070 | | | $ | 11,228 | | | $ | 12,948 | | | $ | 14,942 | |
| | | | | | | | | | |
Portfolio turnover | | | 12% | | | | 8% | | | | 18% | | | | 14% | | | | 18% | | | | | | 12% | | | | 8% | | | | 18% | | | | 14% | | | | 18% | |
| | | | | | | | | | |
| 1 | | Based on average shares outstanding. |
| 2 | | Determined in accordance with federal income tax regulations. |
| 3 | | Where applicable, excludes the effects of any sales charges and assumes the reinvestment of dividends and distributions. |
| 4 | | Interest expense and fees relate to TOBs. See Note 3 of the Notes to Financial Statements for details of municipal bonds transferred to TOBs. |
| | | | | | |
| See Notes to Financial Statements. | | | | |
| | | | | | | |
| 50 | | ANNUAL REPORT | | MAY 31, 2014 | | |
| | |
| Financial Highlights | | BlackRock Pennsylvania Municipal Bond Fund |
| | | | | | | | | | | | | | | | | | | | | | | | | | | | | | | | | | | | | | | | | | |
| | | Institutional | | | | | Service | |
| | | Year Ended May 31, | | | | | Year Ended May 31, | |
| | | 2014 | | | 2013 | | | 2012 | | | 2011 | | | 2010 | | | | | 2014 | | | 2013 | | | 2012 | | | 2011 | | | 2010 | |
| | | | | | | | | | | | | | | | | | | | | | | | | | | | | | | | | | | | | | | | | | |
| Per Share Operating Performance | |
Net asset value, beginning of year | | $ | 11.54 | | | $ | 11.60 | | | $ | 10.62 | | | $ | 10.93 | | | $ | 10.34 | | | | | $ | 11.54 | | | $ | 11.60 | | | $ | 10.62 | | | $ | 10.93 | | | $ | 10.34 | |
| | | | | | | | | | |
Net investment income1 | | | 0.47 | | | | 0.49 | | | | 0.51 | | | | 0.52 | | | | 0.49 | | | | | | 0.45 | | | | 0.46 | | | | 0.48 | | | | 0.49 | | | | 0.46 | |
Net realized and unrealized gain (loss) | | | (0.33 | ) | | | (0.06 | ) | | | 0.98 | | | | (0.31 | ) | | | 0.59 | | | | | | (0.32 | ) | | | (0.05 | ) | | | 0.98 | | | | (0.30 | ) | | | 0.60 | |
| | | | | | | | | | |
Net increase from investment operations | | | 0.14 | | | | 0.43 | | | | 1.49 | | | | 0.21 | | | | 1.08 | | | | | | 0.13 | | | | 0.41 | | | | 1.46 | | | | 0.19 | | | | 1.06 | |
| | | | | | | | | | |
Dividends from net investment income2 | | | (0.47 | ) | | | (0.49 | ) | | | (0.51 | ) | | | (0.52 | ) | | | (0.49 | ) | | | | | (0.45 | ) | | | (0.47 | ) | | | (0.48 | ) | | | (0.50 | ) | | | (0.47 | ) |
| | | | | | | | | | |
Net asset value, end of year | | $ | 11.21 | | | $ | 11.54 | | | $ | 11.60 | | | $ | 10.62 | | | $ | 10.93 | | | | | $ | 11.22 | | | $ | 11.54 | | | $ | 11.60 | | | $ | 10.62 | | | $ | 10.93 | |
| | | | | | | | | | |
| | | | | | | | | | | | | | | | | | | | | | | | | | | | | | | | | | | | | | | | | | |
| Total Investment Return3 | | | | | | | | | | | | | | | | | | | | | | | | | | | | | | | | | | | | | | | | | | |
Based on net asset value | | | 1.50% | | | | 3.71% | | | | 14.29% | | | | 1.99% | | | | 10.61% | | | | | | 1.41% | | | | 3.53% | | | | 14.05% | | | | 1.81% | | | | 10.41% | |
| | | | | | | | | | |
| | | | | | | | | | | | | | | | | | | | | | | | | | | | | | | | | | | | | | | | | | |
| Ratio to Average Net Assets | | | | | | | | | | | | | | | | | | | | | | | | | | | | | | | | | | | | | | | | | | |
Total expenses | | | 0.87% | | | | 0.92% | | | | 0.91% | | | | 0.91% | | | | 0.86% | | | | | | 1.04% | | | | 1.10% | | | | 1.10% | | | | 1.08% | | | | 1.07% | |
| | | | | | | | | | |
Total expenses after fees waived and/or reimbursed and paid indirectly | | | 0.78% | | | | 0.82% | | | | 0.78% | | | | 0.71% | | | | 0.74% | | | | | | 0.96% | | | | 1.00% | | | | 0.99% | | | | 0.91% | | | | 0.92% | |
| | | | | | | | | | |
Total expenses after fees waived and/or reimbursed and paid indirectly and excluding interest expense and fees4 | | | 0.71% | | | | 0.71% | | | | 0.67% | | | | 0.62% | | | | 0.70% | | | | | | 0.89% | | | | 0.89% | | | | 0.89% | | | | 0.82% | | | | 0.88% | |
| | | | | | | | | | |
Net investment income | | | 4.39% | | | | 4.16% | | | | 4.58% | | | | 4.86% | | | | 4.55% | | | | | | 4.20% | | | | 3.97% | | | | 4.34% | | | | 4.71% | | | | 4.38% | |
| | | | | | | | | | |
| | | | | | | | | | | | | | | | | | | | | | | | | | | | | | | | | | | | | | | | | | |
| Supplemental Data | | | | | | | | | | | | | | | | | | | | | | | | | | | | | | | | | | | | | | | | | | |
Net assets, end of year (000) | | $ | 311,954 | | | $ | 397,618 | | | $ | 403,032 | | | $ | 387,251 | | | $ | 445,217 | | | | | $ | 7,422 | | | $ | 7,973 | | | $ | 3,912 | | | $ | 2,648 | | | $ | 1,302 | |
| | | | | | | | | | |
Portfolio turnover | | | 11% | | | | 10% | | | | 24% | | | | 25% | | | | 26% | | | | | | 11% | | | | 10% | | | | 24% | | | | 25% | | | | 26% | |
| | | | | | | | | | |
| 1 | | Based on average shares outstanding. |
| 2 | | Determined in accordance with federal income tax regulations. |
| 3 | | Where applicable, assumes the reinvestment of dividends and distributions. |
| 4 | | Interest expense and fees relate to TOBs. See Note 3 of the Notes to Financial Statements for details of municipal bonds transferred to TOBs. |
| | | | | | |
| See Notes to Financial Statements. | | | | |
| | | | | | | |
| | ANNUAL REPORT | | MAY 31, 2014 | | 51 |
| | |
| Financial Highlights (continued) | | BlackRock Pennsylvania Municipal Bond Fund |
| | | | | | | | | | | | | | | | | | | | | | | | | | | | | | | | | | | | | | | | | | |
| | | Investor A | | | | | Investor A1 | |
| | | Year Ended May 31, | | | | | Year Ended May 31, | |
| | | 2014 | | | 2013 | | | 2012 | | | 2011 | | | 2010 | | | | | 2014 | | | 2013 | | | 2012 | | | 2011 | | | 2010 | |
| | | | | | | | | | | | | | | | | | | | | | | | | | | | | | | | | | | | | | | | | | |
| Per Share Operating Performance | |
Net asset value, beginning of year | | $ | 11.55 | | | $ | 11.61 | | | $ | 10.63 | | | $ | 10.94 | | | $ | 10.35 | | | | | $ | 11.55 | | | $ | 11.61 | | | $ | 10.63 | | | $ | 10.94 | | | $ | 10.35 | |
| | | | | | | | | | |
Net investment income1 | | | 0.46 | | | | 0.46 | | | | 0.49 | | | | 0.49 | | | | 0.47 | | | | | | 0.47 | | | | 0.49 | | | | 0.51 | | | | 0.51 | | | | 0.48 | |
Net realized and unrealized gain (loss) | | | (0.33 | ) | | | (0.05 | ) | | | 0.97 | | | | (0.31 | ) | | | 0.59 | | | | | | (0.32 | ) | | | (0.06 | ) | | | 0.97 | | | | (0.31 | ) | | | 0.59 | |
| | | | | | | | | | |
Net increase from investment operations | | | 0.13 | | | | 0.41 | | | | 1.46 | | | | 0.18 | | | | 1.06 | | | | | | 0.15 | | | | 0.43 | | | | 1.48 | | | | 0.20 | | | | 1.07 | |
| | | | | | | | | | |
Dividends from net investment income2 | | | (0.45 | ) | | | (0.47 | ) | | | (0.48 | ) | | | (0.49 | ) | | | (0.47 | ) | | | | | (0.47 | ) | | | (0.49 | ) | | | (0.50 | ) | | | (0.51 | ) | | | (0.48 | ) |
| | | | | | | | | | |
Net asset value, end of year | | $ | 11.23 | | | $ | 11.55 | | | $ | 11.61 | | | $ | 10.63 | | | $ | 10.94 | | | | | $ | 11.23 | | | $ | 11.55 | | | $ | 11.61 | | | $ | 10.63 | | | $ | 10.94 | |
| | | | | | | | | | |
| | | | | | | | | | | | | | | | | | | | | | | | | | | | | | | | | | | | | | | | | | |
| Total Investment Return3 | | | | | | | | | | | | | | | | | | | | | | | | | | | | | | | | | | | | | | | | | | |
Based on net asset value | | | 1.41% | | | | 3.53% | | | | 14.04% | | | | 1.76% | | | | 10.40% | | | | | | 1.57% | | | | 3.69% | | | | 14.22% | | | | 1.94% | | | | 10.58% | |
| | | | | | | | | | |
| | | | | | | | | | | | | | | | | | | | | | | | | | | | | | | | | | | | | | | | | | |
| Ratios to Average Net Assets | | | | | | | | | | | | | | | | | | | | | | | | | | | | | | | | | | | | | | | | | | |
Total expenses | | | 1.02% | | | | 1.06% | | | | 1.03% | | | | 1.02% | | | | 0.98% | | | | | | 0.86% | | | | 0.89% | | | | 0.89% | | | | 0.88% | | | | 0.84% | |
| | | | | | | | | | |
Total expenses after fees waived and/or reimbursed and paid indirectly | | | 0.96% | | | | 1.00% | | | | 0.99% | | | | 0.94% | | | | 0.93% | | | | | | 0.80% | | | | 0.84% | | | | 0.83% | | | | 0.76% | | | | 0.77% | |
| | | | | | | | | | |
Total expenses after fees waived and/or reimbursed and paid indirectly and excluding interest expense and fees4 | | | 0.89% | | | | 0.89% | | | | 0.89% | | | | 0.85% | | | | 0.89% | | | | | | 0.73% | | | | 0.73% | | | | 0.73% | | | | 0.67% | | | | 0.73% | |
| | | | | | | | | | |
Net investment income | | | 4.20% | | | | 3.97% | | | | 4.36% | | | | 4.63% | | | | 4.37% | | | | | | 4.37% | | | | 4.14% | | | | 4.52% | | | | 4.81% | | | | 4.53% | |
| | | | | | | | | | |
| | | | | | | | | | | | | | | | | | | | | | | | | | | | | | | | | | | | | | | | | | |
| Supplemental Data | | | | | | | | | | | | | | | | | | | | | | | | | | | | | | | | | | | | | | | | | | |
Net assets, end of year (000) | | $ | 55,500 | | | $ | 61,553 | | | $ | 42,275 | | | $ | 33,779 | | | $ | 35,515 | | | | | $ | 17,823 | | | $ | 21,169 | | | $ | 22,677 | | | $ | 20,940 | | | $ | 22,892 | |
| | | | | | | | | | |
Portfolio turnover | | | 11% | | | | 10% | | | | 24% | | | | 25% | | | | 26% | | | | | | 11% | | | | 10% | | | | 24% | | | | 25% | | | | 26% | |
| | | | | | | | | | |
| 1 | | Based on average shares outstanding. |
| 2 | | Determined in accordance with federal income tax regulations. |
| 3 | | Where applicable, excludes the effects of any sales charges and assumes the reinvestment of dividends and distributions. |
| 4 | | Interest expense and fees relate to TOBs. See Note 3 of the Notes to Financial Statements for details of municipal bonds transferred to TOBs. |
| | | | | | |
| See Notes to Financial Statements. | | | | |
| | | | | | | |
| 52 | | ANNUAL REPORT | | MAY 31, 2014 | | |
| | |
| Financial Highlights (concluded) | | BlackRock Pennsylvania Municipal Bond Fund |
| | | | | | | | | | | | | | | | | | | | | | | | | | | | | | | | | | | | | | | | | | |
| | | Investor C | | | | | Investor C1 | |
| | | Year Ended May 31, | | | | | Year Ended May 31, | |
| | | 2014 | | | 2013 | | | 2012 | | | 2011 | | | 2010 | | | | | 2014 | | | 2013 | | | 2012 | | | 2011 | | | 2010 | |
| | | | | | | | | | | | | | | | | | | | | | | | | | | | | | | | | | | | | | | | | | |
| Per Share Operating Performance | | | | | | | | | | | | | | | | | | | | | | | | | | | | | | | | | | | | | | | | | | |
Net asset value, beginning of year | | $ | 11.55 | | | $ | 11.61 | | | $ | 10.63 | | | $ | 10.94 | | | $ | 10.35 | | | | | $ | 11.54 | | | $ | 11.60 | | | $ | 10.62 | | | $ | 10.93 | | | $ | 10.34 | |
| | | | | | | | | | |
Net investment income1 | | | 0.37 | | | | 0.37 | | | | 0.39 | | | | 0.41 | | | | 0.38 | | | | | | 0.42 | | | | 0.42 | | | | 0.45 | | | | 0.46 | | | | 0.43 | |
Net realized and unrealized gain (loss) | | | (0.33 | ) | | | (0.05 | ) | | | 0.99 | | | | (0.31 | ) | | | 0.59 | | | | | | (0.34 | ) | | | (0.05 | ) | | | 0.97 | | | | (0.31 | ) | | | 0.59 | |
| | | | | | | | | | |
Net increase from investment operations | | | 0.04 | | | | 0.32 | | | | 1.38 | | | | 0.10 | | | | 0.97 | | | | | | 0.08 | | | | 0.37 | | | | 1.42 | | | | 0.15 | | | | 1.02 | |
| | | | | | | | | | |
Dividends from net investment income2 | | | (0.37 | ) | | | (0.38 | ) | | | (0.40 | ) | | | (0.41 | ) | | | (0.38 | ) | | | | | (0.41 | ) | | | (0.43 | ) | | | (0.44 | ) | | | (0.46 | ) | | | (0.43 | ) |
| | | | | | | | | | |
Net asset value, end of year | | $ | 11.22 | | | $ | 11.55 | | | $ | 11.61 | | | $ | 10.63 | | | $ | 10.94 | | | | | $ | 11.21 | | | $ | 11.54 | | | $ | 11.60 | | | $ | 10.62 | | | $ | 10.93 | |
| | | | | | | | | | |
| | | | | | | | | | | | | | | | | | | | | | | | | | | | | | | | | | | | | | | | | | |
| Total Investment Return3 | | | | | | | | | | | | | | | | | | | | | | | | | | | | | | | | | | | | | | | | | | |
Based on net asset value | | | 0.53% | | | | 2.73% | | | | 13.15% | | | | 0.94% | | | | 9.54% | | | | | | 0.95% | | | | 3.15% | | | | 13.63% | | | | 1.42% | | | | 10.01% | |
| | | | | | | | | | |
| | | | | | | | | | | | | | | | | | | | | | | | | | | | | | | | | | | | | | | | | | |
| Ratios to Average Net Assets | | | | | | | | | | | | | | | | | | | | | | | | | | | | | | | | | | | | | | | | | | |
Total expenses | | | 1.76% | | | | 1.79% | | | | 1.80% | | | | 1.78% | | | | 1.74% | | | | | | 1.35% | | | | 1.37% | | | | 1.38% | | | | 1.37% | | | | 1.33% | |
| | | | | | | | | | |
Total expenses after fees waived and/or reimbursed and paid indirectly | | | 1.75% | | | | 1.78% | | | | 1.78% | | | | 1.76% | | | | 1.71% | | | | | | 1.33% | | | | 1.37% | | | | 1.36% | | | | 1.27% | | | | 1.29% | |
| | | | | | | | | | |
Total expenses after fees waived and/or reimbursed paid indirectly and excluding interest expense and fees4 | | | 1.67% | | | | 1.67% | | | | 1.68% | | | | 1.66% | | | | 1.67% | | | | | | 1.26% | | | | 1.26% | | | | 1.26% | | | | 1.18% | | | | 1.25% | |
| | | | | | | | | | |
Net investment income | | | 3.42% | | | | 3.20% | | | | 3.56% | | | | 3.82% | | | | 3.58% | | | | | | 3.84% | | | | 3.62% | | | | 3.99% | | | | 4.29% | | | | 4.01% | |
| | | | | | | | | | |
| | | | | | | | | | | | | | | | | | | | | | | | | | | | | | | | | | | | | | | | | | |
| Supplemental Data | | | | | | | | | | | | | | | | | | | | | | | | | | | | | | | | | | | | | | | | | | |
Net assets, end of year (000) | | $ | 24,647 | | | $ | 32,733 | | | $ | 24,714 | | | $ | 16,603 | | | $ | 17,283 | | | | | $ | 5,460 | | | $ | 7,386 | | | $ | 7,988 | | | $ | 7,989 | | | $ | 10,805 | |
| | | | | | | | | | |
Portfolio turnover | | | 11% | | | | 10% | | | | 24% | | | | 25% | | | | 26% | | | | | | 11% | | | | 10% | | | | 24% | | | | 25% | | | | 26% | |
| | | | | | | | | | |
| 1 | | Based on average shares outstanding. |
| 2 | | Determined in accordance with federal income tax regulations. |
| 3 | | Where applicable, excludes the effects of any sales charges and assumes the reinvestment of dividends and distributions. |
| 4 | | Interest expense and fees relate to TOBs. See Note 3 of the Notes to Financial Statements for details of municipal bonds transferred to TOBs. |
| | | | | | |
| See Notes to Financial Statements. | | | | |
| | | | | | | |
| | ANNUAL REPORT | | MAY 31, 2014 | | 53 |
| | |
| Financial Highlights | | BlackRock Strategic Municipal Opportunities Fund |
| | | | | | | | | | | | | | | | | | | | | | | | | | | | | | | | | | | | | | | | | | |
| | | Institutional | | | | | Investor A | |
| | | Year Ended May 31, | | | | | Year Ended May 31, | |
| | | 2014 | | | 2013 | | | 2012 | | | 2011 | | | 2010 | | | | | 2014 | | | 2013 | | | 2012 | | | 2011 | | | 2010 | |
| | | | | | | | | | | | | | | | | | | | | | | | | | | | | | | | | | | | | | | | | | |
| Per Share Operating Performance | |
Net asset value, beginning of year | | $ | 11.41 | | | $ | 11.36 | | | $ | 10.52 | | | $ | 10.50 | | | $ | 9.96 | | | | | $ | 11.41 | | | $ | 11.36 | | | $ | 10.51 | | | $ | 10.50 | | | $ | 9.95 | |
| | | | | | | | | | |
Net investment income1 | | | 0.32 | | | | 0.35 | | | | 0.40 | | | | 0.41 | | | | 0.39 | | | | | | 0.30 | | | | 0.32 | | | | 0.37 | | | | 0.38 | | | | 0.37 | |
Net realized and unrealized gain | | | 0.04 | | | | 0.11 | | | | 0.83 | | | | 0.02 | | | | 0.54 | | | | | | 0.03 | | | | 0.11 | | | | 0.85 | | | | 0.01 | | | | 0.54 | |
| | | | | | | | | | |
Net increase from investment operations | | | 0.36 | | | | 0.46 | | | | 1.23 | | | | 0.43 | | | | 0.93 | | | | | | 0.33 | | | | 0.43 | | | | 1.22 | | | | 0.39 | | | | 0.91 | |
| | | | | | | | | | |
| Dividends and distributions from:2 | | | | | | | | | | | | | | | | | | | | | | | | | | | | | | | | | | | | | | | | | | |
Net investment income | | | (0.33 | ) | | | (0.36 | ) | | | (0.39 | ) | | | (0.41 | ) | | | (0.39 | ) | | | | | (0.30 | ) | | | (0.33 | ) | | | (0.37 | ) | | | (0.38 | ) | | | (0.36 | ) |
Net realized gain | | | (0.09 | ) | | | (0.05 | ) | | | — | | | | — | | | | — | | | | | | (0.09 | ) | | | (0.05 | ) | | | — | | | | — | | | | — | |
| | | | | | | | | | |
Total dividends and distributions | | | (0.42 | ) | | | (0.41 | ) | | | (0.39 | ) | | | (0.41 | ) | | | (0.39 | ) | | | | | (0.39 | ) | | | (0.38 | ) | | | (0.37 | ) | | | (0.38 | ) | | | (0.36 | ) |
| | | | | | | | | | |
Net asset value, end of year | | $ | 11.35 | | | $ | 11.41 | | | $ | 11.36 | | | $ | 10.52 | | | $ | 10.50 | | | | | $ | 11.35 | | | $ | 11.41 | | | $ | 11.36 | | | $ | 10.51 | | | $ | 10.50 | |
| | | | | | | | | | |
| | | | | | | | | | | | | | | | | | | | | | | | | | | | | | | | | | | | | | | | | | |
| Total Investment Return3 | | | | | | | | | | | | | | | | | | | | | | | | | | | | | | | | | | | | | | | | | | |
Based on net asset value | | | 3.28% | | | | 4.02% | | | | 11.91% | | | | 4.10% | | | | 9.46% | | | | | | 3.04% | | | | 3.75% | | | | 11.76% | | | | 3.75% | | | | 9.31% | |
| | | | | | | | | | |
| | | | | | | | | | | | | | | | | | | | | | | | | | | | | | | | | | | | | | | | | | |
| Ratio to Average Net Assets | | | | | | | | | | | | | | | | | | | | | | | | | | | | | | | | | | | | | | | | | | |
Total expenses | | | 0.73% | | | | 0.70% | | | | 0.70% | | | | 0.72% | | | | 0.78% | | | | | | 0.96% | | | | 0.96% | | | | 0.94% | | | | 0.96% | | | | 1.01% | |
| | | | | | | | | | |
Total expenses after fees waived and/or reimbursed and paid indirectly | | | 0.68% | | | | 0.65% | | | | 0.65% | | | | 0.67% | | | | 0.72% | | | | | | 0.91% | | | | 0.91% | | | | 0.89% | | | | 0.91% | | | | 0.96% | |
| | | | | | | | | | |
Total expenses after fees waived and/or reimbursed and paid indirectly and excluding interest expense and fees4 | | | 0.65% | | | | 0.62% | | | | 0.64% | | | | 0.66% | | | | 0.72% | | | | | | 0.88% | | | | 0.88% | | | | 0.88% | | | | 0.90% | | | | 0.96% | |
| | | | | | | | | | |
Net investment income | | | 2.95% | | | | 3.04% | | | | 3.61% | | | | 3.86% | | | | 3.78% | | | | | | 2.73% | | | | 2.77% | | | | 3.37% | | | | 3.63% | | | | 3.54% | |
| | | | | | | | | | |
| | | | | | | | | | | | | | | | | | | | | | | | | | | | | | | | | | | | | | | | | | |
| Supplemental Data | | | | | | | | | | | | | | | | | | | | | | | | | | | | | | | | | | | | | | | | | | |
Net assets, end of year (000) | | $ | 953,869 | | | $ | 425,281 | | | $ | 256,517 | | | $ | 164,130 | | | $ | 129,811 | | | | | $ | 283,506 | | | $ | 238,482 | | | $ | 139,600 | | | $ | 67,194 | | | $ | 42,294 | |
| | | | | | | | | | |
Portfolio turnover | | | 200% | | | | 17% | | | | 15% | | | | 30% | | | | 23% | | | | | | 200% | | | | 17% | | | | 15% | | | | 30% | | | | 23% | |
| | | | | | | | | | |
| 1 | | Based on average shares outstanding. |
| 2 | | Determined in accordance with federal income tax regulations. |
| 3 | | Where applicable, excludes the effects of any sales charges and assumes the reinvestment of dividends and distributions. |
| 4 | | Interest expense and fees relate to TOBs. See Note 3 of the Notes to Financial Statements for details of municipal bonds transferred to TOBs. |
| | | | | | |
| See Notes to Financial Statements. | | | | |
| | | | | | | |
| 54 | | ANNUAL REPORT | | MAY 31, 2014 | | |
| | |
| Financial Highlights (concluded) | | BlackRock Strategic Municipal Opportunities Fund |
| | | | | | | | | | | | | | | | | | | | | | | | | | | | | | | | | | | | | | | | | | |
| | | Investor A1 | | | | | Investor C | |
| | | Year Ended May 31, | | | | | Year Ended May 31, | |
| | | 2014 | | | 2013 | | | 2012 | | | 2011 | | | 2010 | | | | | 2014 | | | 2013 | | | 2012 | | | 2011 | | | 2010 | |
| | | | | | | | | | | | | | | | | | | | | | | | | | | | | | | | | | | | | | | | | | |
| Per Share Operating Performance | |
Net asset value, beginning of year | | $ | 11.41 | | | $ | 11.36 | | | $ | 10.51 | | | $ | 10.50 | | | $ | 9.96 | | | | | $ | 11.41 | | | $ | 11.36 | | | $ | 10.52 | | | $ | 10.50 | | | $ | 9.96 | |
| | | | | | | | | | |
Net investment income1 | | | 0.32 | | | | 0.34 | | | | 0.38 | | | | 0.39 | | | | 0.38 | | | | | | 0.22 | | | | 0.23 | | | | 0.28 | | | | 0.30 | | | | 0.28 | |
Net realized and unrealized gain | | | 0.03 | | | | 0.11 | | | | 0.85 | | | | 0.01 | | | | 0.54 | | | | | | 0.03 | | | | 0.11 | | | | 0.84 | | | | 0.02 | | | | 0.54 | |
| | | | | | | | | | |
Net increase from investment operations | | | 0.35 | | | | 0.45 | | | | 1.23 | | | | 0.40 | | | | 0.92 | | | | | | 0.25 | | | | 0.34 | | | | 1.12 | | | | 0.32 | | | | 0.82 | |
| | | | | | | | | | |
| Dividends and distributions from:2 | | | | | | | | | | | | | | | | | | | | | | | | | | | | | | | | | | | | | | | | | | |
Net investment income | | | (0.32 | ) | | | (0.35 | ) | | | (0.38 | ) | | | (0.39 | ) | | | (0.38 | ) | | | | | (0.22 | ) | | | (0.24 | ) | | | (0.28 | ) | | | (0.30 | ) | | | (0.28 | ) |
Net realized gain | | | (0.09 | ) | | | (0.05 | ) | | | — | | | | — | | | | — | | | | | | (0.09 | ) | | | (0.05 | ) | | | — | | | | — | | | | — | |
| | | | | | | | | | |
Total dividends and distributions | | | (0.41 | ) | | | (0.40 | ) | | | (0.38 | ) | | | (0.39 | ) | | | (0.38 | ) | | | | | (0.31 | ) | | | (0.29 | ) | | | (0.28 | ) | | | (0.30 | ) | | | (0.28 | ) |
| | | | | | | | | | |
Net asset value, end of year | | $ | 11.35 | | | $ | 11.41 | | | $ | 11.36 | | | $ | 10.51 | | | $ | 10.50 | | | | | $ | 11.35 | | | $ | 11.41 | | | $ | 11.36 | | | $ | 10.52 | | | $ | 10.50 | |
| | | | | | | | | | |
| | | | | | | | | | | | | | | | | | | | | | | | | | | | | | | | | | | | | | | | | | |
| Total Investment Return3 | | | | | | | | | | | | | | | | | | | | | | | | | | | | | | | | | | | | | | | | | | |
Based on net asset value | | | 3.19% | | | | 3.91% | | | | 11.90% | | | | 3.89% | | | | 9.35% | | | | | | 2.26% | | | | 2.98% | | | | 10.80% | | | | 3.06% | | | | 8.38% | |
| | | | | | | | | | |
| | | | | | | | | | | | | | | | | | | | | | | | | | | | | | | | | | | | | | | | | | |
| Ratios to Average Net Assets | | | | | | | | | | | | | | | | | | | | | | | | | | | | | | | | | | | | | | | | | | |
Total expenses | | | 0.81% | | | | 0.80% | | | | 0.81% | | | | 0.82% | | | | 0.88% | | | | | | 1.72% | | | | 1.71% | | | | 1.71% | | | | 1.72% | | | | 1.77% | |
| | | | | | | | | | |
Total expenses after fees waived and/or reimbursed and paid indirectly | | | 0.76% | | | | 0.75% | | | | 0.76% | | | | 0.77% | | | | 0.82% | | | | | | 1.66% | | | | 1.66% | | | | 1.65% | | | | 1.67% | | | | 1.72% | |
| | | | | | | | | | |
Total expenses after fees waived and/or reimbursed and paid indirectly and excluding interest expense and fees4 | | | 0.73% | | | | 0.72% | | | | 0.75% | | | | 0.77% | | | | 0.82% | | | | | | 1.64% | | | | 1.63% | | | | 1.64% | | | | 1.67% | | | | 1.72% | |
| | | | | | | | | | |
Net investment income | | | 2.89% | | | | 2.97% | | | | 3.51% | | | | 3.75% | | | | 3.68% | | | | | | 1.98% | | | | 2.03% | | | | 2.60% | | | | 2.86% | | | | 2.78% | |
| | | | | | | | | | |
| | | | | | | | | | | | | | | | | | | | | | | | | | | | | | | | | | | | | | | | | | |
| Supplemental Data | | | | | | | | | | | | | | | | | | | | | | | | | | | | | | | | | | | | | | | | | | |
Net assets applicable, end of year (000) | | $ | 37,708 | | | $ | 44,121 | | | $ | 46,021 | | | $ | 44,952 | | | $ | 48,372 | | | | | $ | 120,840 | | | $ | 135,599 | | | $ | 82,483 | | | $ | 37,243 | | | $ | 31,006 | |
| | | | | | | | | | |
Portfolio turnover | | | 200% | | | | 17% | | | | 15% | | | | 30% | | | | 23% | | | | | | 200% | | | | 17% | | | | 15% | | | | 30% | | | | 23% | |
| | | | | | | | | | |
| 1 | | Based on average shares outstanding. |
| 2 | | Determined in accordance with federal income tax regulations. |
| 3 | | Where applicable, excludes the effects of any sales charges and assumes the reinvestment of dividends and distributions. |
| 4 | | Interest expense and fees relate to TOBs. See Note 3 of the Notes to Financial Statements for details of municipal bonds transferred to TOBs. |
| | | | | | |
| See Notes to Financial Statements. | | | | |
| | | | | | | |
| | ANNUAL REPORT | | MAY 31, 2014 | | 55 |
| | |
| Notes to Financial Statements | | |
1. Organization:
BlackRock California Municipal Bond Fund, a series of BlackRock California Municipal Series Trust, BlackRock New Jersey Municipal Bond Fund and BlackRock Pennsylvania Municipal Bond Fund, each a series of BlackRock Multi-State Municipal Series Trust, and BlackRock Strategic Municipal Opportunities Fund (formerly known as BlackRock Intermediate Municipal Fund), a series of BlackRock Municipal Series Trust (each a “Fund” or collectively, the “Funds”), are registered under the Investment Company Act of 1940, as amended (the “1940 Act”). BlackRock California Municipal Bond Fund and BlackRock Strategic Municipal Opportunities Fund are registered as diversified, open-end management investment companies. BlackRock New Jersey Municipal Bond Fund and BlackRock Pennsylvania Municipal Bond Fund are registered as non-diversified, open-end management investment companies. BlackRock California Municipal Series Trust, BlackRock Multi-State Municipal Series Trust and BlackRock Municipal Series Trust (each a “Trust” or collectively, the “Trusts”) are organized as Massachusetts business trusts.
Each Fund offers multiple classes of shares. Institutional Shares are sold without a sales charge and only to certain eligible investors. Service Shares are sold without a sales charge. Investor A and Investor A1 Shares are generally sold with an initial sales charge, but may be subject to a CDSC for certain redemptions where no initial sales charge was paid at the time of purchase. Investor B, Investor B1, Investor C and Investor C1 Shares may be subject to a CDSC. All classes of shares have identical voting, dividend, liquidation and other rights and the same terms and conditions, except that Service, Investor A, Investor A1, Investor B, Investor C and Investor C1 Shares bear certain expenses related to the shareholder servicing of such shares, and Investor B, Investor C and Investor C1 Shares also bear certain expenses related to the distribution of such shares. Investor B Shares automatically convert to Investor A1 Shares after approximately ten years for BlackRock California Municipal Bond Fund. On June 10, 2013, certain of the Funds’ share classes converted into other existing share classes, with the same relative aggregate net asset value of the Funds as follows:
| | | | |
| | | Original Shares | | New Shares |
BlackRock New Jersey Municipal Bond Fund | | Investor B | | Investor A |
BlackRock New Jersey Municipal Bond Fund | | Investor B1 | | Investor A1 |
BlackRock Pennsylvania Municipal Bond Fund | | Investor B | | Investor A |
BlackRock Pennsylvania Municipal Bond Fund | | Investor B1 | | Investor A1 |
BlackRock Strategic Municipal Opportunities Fund | | Investor B | | Investor A1 |
Investor A1, Investor B and Investor C1 Shares are only available through exchanges, dividend reinvestment by existing shareholders and for purchase by certain employer-sponsored benefit plans. Each class has exclusive voting rights with respect to matters relating to its shareholder servicing and distribution expenditures (except that Investor B and Investor B1 shareholders may vote on material changes to the Investor A and Investor A1 distribution and service plans).
2. Significant Accounting Policies:
The Funds’ financial statements are prepared in conformity with accounting principles generally accepted in the United States of America (“U.S. GAAP”), which may require management to make estimates and assumptions that affect the reported amounts of assets and liabilities in the financial statements and the reported amounts of increases and decreases in net assets from operations during the reporting period. Actual results could differ from those estimates. The following is a summary of significant accounting policies followed by the Funds:
Valuation: U.S. GAAP defines fair value as the price the Funds would receive to sell an asset or pay to transfer a liability in an orderly transaction between market participants at the measurement date. The Funds determine the fair values of their financial instruments at market value using independent dealers or pricing services under policies approved by the Board of Trustees of each Trust (the “Board”). The BlackRock Global Valuation Methodologies Committee (the “Global Valuation Committee”) is the committee formed by management to develop global pricing policies and procedures and to provide oversight of the pricing function for the Funds for all financial instruments.
Municipal investments (including commitments to purchase such investments on a “when-issued” basis) are valued on the basis of prices provided by dealers or pricing services. In determining the value of a particular investment, pricing services may use certain information with respect to transactions in such investments, quotations from dealers, pricing matrixes, market transactions in comparable investments and information with respect to various relationships between investments. Financial futures contracts traded on exchanges are valued at their last sale price. Swap agreements are valued utilizing quotes received daily by the Funds’ pricing service or through brokers, which are derived using daily swap curves and models that incorporate a number of market data factors, such as discounted cash flows, trades and values of the underlying reference instruments. Short-term securities with remaining maturities of 60 days or less may be valued at amortized cost, which approximates fair value. Investments in open-end registered investment companies are valued at NAV each business day.
Bond investments are valued on the basis of last available bid prices or current market quotations provided by dealers or pricing services.
In the event that the application of these methods of valuation results in a price for an investment that is deemed not to be representative of the market value of such investment, or if a price is not available, the investment will be valued by the Global Valuation Committee, or its delegate, in accordance with a policy approved by the Board as reflecting fair value (“Fair Value Assets”). When determining the price for Fair Value Assets, the Global Valuation Committee, or its delegate, seeks to determine the price that each Fund might reasonably expect to receive from the current sale of that asset in an arm’s-length transaction. Fair value determinations shall be based upon all available factors that the Global Valuation Committee, or its delegate, deems relevant consistent with the principles of fair value measurement. The pricing of all Fair Value Assets is subsequently reported to the Board or a committee thereof on a quarterly basis.
Segregation and Collateralization: In cases where a Fund enters into certain investments (e.g., financial futures contracts and swaps) or certain borrowings (e.g.,TOBs) that would be “senior securities” for 1940 Act purposes, the Fund may segregate or designate on its books and records
| | | | | | |
| | | | | | | |
| 56 | | ANNUAL REPORT | | MAY 31, 2014 | | |
| | |
| Notes to Financial Statements (continued) | | |
cash or liquid securities having a market value at least equal to the amount of the Fund’s future obligations under such investments or borrowings. Doing so allows the investment or borrowing to be excluded from treatment as a “senior security.” Furthermore, if required by an exchange or counterparty agreement, the Fund may be required to deliver/deposit cash and/or securities to/with an exchange, or broker-dealer or custodian as collateral for certain investments or obligations.
Investment Transactions and Investment Income: For financial reporting purposes, investment transactions are recorded on the dates the transactions are entered into (the trade dates). Realized gains and losses on investment transactions are determined on the identified cost basis. Interest income, including amortization and accretion of premiums and discounts on debt securities, is recognized on the accrual basis. Income, expenses and realized and unrealized gains and losses are allocated daily to each class based on its relative net assets.
Dividends and Distributions: Dividends from net investment income are declared daily and paid monthly. Distributions of capital gains are recorded on the ex-dividend date. The character and timing of dividends and distributions are determined in accordance with federal income tax regulations, which may differ from U.S. GAAP.
Income Taxes: It is the Funds’ policy to comply with the requirements of the Internal Revenue Code of 1986, as amended, applicable to regulated investment companies, and to distribute substantially all of their taxable income to their shareholders. Therefore, no federal income tax provision is required.
Each Fund files U.S. federal and various state and local tax returns. No income tax returns are currently under examination. The statute of limitations on the Funds’ U.S. federal tax returns remains open for each of the four years ended May 31, 2014. The statutes of limitations on the Funds’ state and local tax returns may remain open for an additional year depending upon the jurisdiction.
Management has analyzed tax laws and regulations and their application to the Funds’ facts and circumstances and does not believe there are any uncertain tax positions that require recognition of a tax liability.
Recent Accounting Standard: In June 2014, the Financial Accounting Standards Board issued guidance to improve the financial reporting of reverse repurchase agreements and other similar transactions. The guidance includes expanded disclosure requirements for entities that enter into reverse repurchase agreements and similar transactions accounted for as secured borrowings. The guidance is effective for financial statements with fiscal years beginning on or after December 15, 2014 and interim periods within those fiscal years. Management is evaluating the impact, if any, of this guidance on the Funds’ financial statement disclosures.
Other: Expenses directly related to a Fund or its classes are charged to that Fund or class. Other operating expenses shared by several funds are pro rated among those funds on the basis of relative net assets or other appropriate methods. Expenses directly related to the Funds and other shared expenses pro rated to the Funds are allocated daily to each class based on its relative net assets or other appropriate methods.
The Funds have an arrangement with the custodian whereby fees may be reduced by credits earned on uninvested cash balances, which, if applicable, are shown as fees paid indirectly in the Statements of Operations. The custodian imposes fees on overdrawn cash balances, which can be offset by accumulated credits earned or may result in additional custody charges.
3. Securities and Other Investments:
Zero-Coupon Bonds: The Funds may invest in zero-coupon bonds, which are normally issued at a significant discount from face value and do not provide for periodic interest payments. Zero-coupon bonds may experience greater volatility in market value than similar maturity debt obligations which provide for regular interest payments.
Forward Commitments and When-Issued Delayed Delivery Securities: The Funds may purchase securities on a when-issued basis and may purchase or sell securities on a forward commitment basis. Settlement of such transactions normally occurs within a month or more after the purchase or sale commitment is made. The Funds may purchase securities under such conditions with the intention of actually acquiring them, but may enter into a separate agreement to sell the securities before the settlement date. Since the value of securities purchased may fluctuate prior to settlement, the Funds may be required to pay more at settlement than the security is worth. In addition, the Funds are not entitled to any of the interest earned prior to settlement. When purchasing a security on a delayed delivery basis, the Funds assume the rights and risks of ownership of the security, including the risk of price and yield fluctuations. In the event of default by the counterparty, the Funds’ maximum amount of loss is the unrealized appreciation of unsettled when-issued transactions, which is shown in the Schedules of Investments.
Municipal Bonds Transferred to TOBs: The Funds leverage their assets through the use of TOBs. A TOB is a special purpose entity established by a third party sponsor, into which a fund, or an agent on behalf of a fund, transfers municipal bonds into a trust (“TOB Trust”). Other funds managed by the investment advisor may also contribute municipal bonds to a TOB into which a Fund has contributed bonds. A TOB typically issues two classes of beneficial interests: short-term floating rate certificates (“TOB Trust Certificates”), which are sold to third party investors, and residual certificates (“TOB Residuals”), which are generally issued to the participating funds that contributed the municipal bonds to the TOB Trust. If multiple funds participate in the same TOB, the rights and obligations under the TOB Residual will be shared among the funds ratably in proportion to their participation.
The TOB Residuals held by a Fund include the right of a Fund (1) to cause the holders of a proportional share of the TOB Trust Certificates to tender their certificates at par plus accrued interest upon the occurrence of certain mandatory tender events defined in the TOB agreements, and (2) to transfer, subject to a specified number of days’ prior notice, a corresponding share of the municipal bonds from the TOB to a Fund. The TOB may also be collapsed without the consent of a Fund, as the TOB Residual holder, upon the occurrence of certain termination events as defined in the TOB agreements. Such termination events may include the bankruptcy or default of the municipal bond, a substantial downgrade in credit quality of the municipal bond, the inability of the TOB to obtain
| | | | | | |
| | | | | | | |
| | ANNUAL REPORT | | MAY 31, 2014 | | 57 |
| | |
| Notes to Financial Statements (continued) | | |
renewal of the liquidity support agreement, a substantial decline in market value of the municipal bond and a judgment or ruling that interest on the municipal bond is subject to federal income taxation. Upon the occurrence of a termination event, the TOB would generally be liquidated in full with the proceeds typically applied first to any accrued fees owed to the trustee, remarketing agent and liquidity provider, and then to the holders of the TOB Trust Certificates up to par plus accrued interest owed on the TOB Trust Certificates, with the balance paid out to the TOB Residual holder. During the year ended May 31, 2014, no TOBs in which the Funds participated were terminated without the consent of the Funds.
The cash received by the TOB from the sale of TOB Trust certificates, less transaction expenses, is paid to a Fund. The Fund typically invests the cash received in additional municipal bonds. Each Fund’s transfer of the municipal bonds to a TOB Trust is accounted for as a secured borrowing: therefore the municipal bonds deposited into a TOB are presented in the Funds’ Schedules of Investments and TOB Trust Certificates are shown in other liabilities in the Statements of Assets and Liabilities. The carrying amount of each Fund’s payable to the holder of the TOB Trust Certificates, as reported in Statement of Assets and Liabilities as TOB Trust Certificates, approximates its fair value.
The Funds may invest in TOBs on either a non-recourse or recourse basis. TOB Trusts are typically supported by a liquidity facility provided by a bank or other financial institution (the “Liquidity Provider”) that allows the holders of the TOB Trust Certificates to tender their certificates in exchange for payment from the Liquidity Provider of par plus accrued interest on any business day prior to the occurrence of the termination events described above. When a Fund invests in TOBs on a non-recourse basis, and the Liquidity Provider is required to make a payment under the liquidity facility due to a termination event, the Liquidity Provider will typically liquidate all or a portion of the municipal securities held in the TOB Trust and then fund, on a net basis, the balance, if any, of the amount owed under the liquidity facility over the liquidation proceeds (the “Liquidation Shortfall”). If a Fund invests in a TOB on a recourse basis, the Fund will typically enter into a reimbursement agreement with the Liquidity Provider where the Fund is required to repay the Liquidity Provider the amount of any Liquidation Shortfall. As a result, a Fund investing in a recourse TOB will bear the risk of loss with respect to any Liquidation Shortfall. If multiple Funds participate in any such TOB, these losses will be shared ratably, including the maximum potential amounts owed by Funds at May 31, 2014, in proportion to their participation. The recourse TOB Trusts are identified in the Schedule of Investments including the maximum potential amounts owed by the Funds at May 31, 2014.
Interest income, including amortization and accretion of premiums and discounts, from the underlying municipal bonds is recorded by the Funds on an accrual basis. Interest expense incurred on the secured borrowing and other expenses related to remarketing, administration and trustee services to a TOB are shown as interest expense and fees in the Statements of Operations. The TOB Trust Certificates have interest rates that generally reset weekly and their holders have the option to tender such certificates to the TOB for redemption at par at each reset date. At May 31, 2014, the aggregate value of the underlying municipal bonds transferred to TOBs, the related liability for TOB Trust Certificates and the range of interest rates on the liability for TOB Trust Certificates were as follows:
| | | | | | | | | | | | |
| | | Underlying
Municipal Bonds
Transferred to TOBs | | | Liability
for TOB Trust
Certificates | | | Range of Interest Rates | |
BlackRock California Municipal Bond Fund | | $ | 53,299,432 | | | $ | 23,652,530 | | | | 0.06% - 0.14% | |
BlackRock New Jersey Municipal Bond Fund | | $ | 12,880,772 | | | $ | 7,231,154 | | | | 0.08% - 0.11% | |
BlackRock Pennsylvania Municipal Bond Fund | | $ | 96,425,335 | | | $ | 46,126,645 | | | | 0.07% - 0.12% | |
BlackRock Strategic Municipal Opportunities Fund | | $ | 270,303,518 | | | $ | 130,984,993 | | | | 0.04% - 0.13% | |
For the year ended May 31, 2014, the Funds’ average TOB trust certificates outstanding and the daily weighted average interest rate, including fees, were as follows:
| | | | | | | | |
| | | Average TOB Trust
Certificates
Outstanding | | | Daily Weighted
Average
Interest Rate | |
BlackRock California Municipal Bond Fund | | $ | 77,346,153 | | | | 0.61 | % |
BlackRock New Jersey Municipal Bond Fund | | $ | 7,300,039 | | | | 0.80 | % |
BlackRock Pennsylvania Municipal Bond Fund | | $ | 53,084,534 | | | | 0.61 | % |
BlackRock Strategic Municipal Opportunities Fund | | $ | 37,349,240 | | | | 0.59 | % |
Should short-term interest rates rise, the Funds’ investments in TOBs may adversely affect the Funds’ net investment income and dividends to shareholders. Also, fluctuations in the market value of municipal bonds deposited into the TOB Trust may adversely affect the Funds’ NAVs per share.
4. Derivative Financial Instruments:
The Funds engage in various portfolio investment strategies using derivative contracts both to increase the returns of the Funds and/or to economically hedge their exposure to certain risks such as credit risk and interest rate risk. These contracts may be transacted on an exchange or over-the-counter (“OTC”).
Financial Futures Contracts: The Funds purchase and/or sell financial futures to gain exposure to, or economically hedge against, changes in interest rates (interest rate risk). Financial futures contracts are agreements between the Funds and a counterparty to buy or sell a specific quantity of an underlying instrument at a specified price and at a specified date. Depending on the terms of the particular contract, financial futures contracts are settled either through physical delivery of the underlying instrument on the settlement date or by payment of a cash settlement amount on the settlement date.
Upon entering into a financial futures contract, the Funds are required to deposit initial margin with the broker in the form of cash or securities in an amount that varies depending on a contract’s size and risk profile. The initial margin deposit must then be maintained at an established level over the life of the contract. Securities deposited as initial margin are designated on the Schedules of Investments and cash deposited, if any, is recorded on the Statements of Assets and Liabilities as cash pledged for financial futures contracts. Pursuant to the contract, the Funds agree to receive from or pay to the broker an amount of cash equal to the daily fluctuation in value of the contract. Such receipts or payments are known
| | | | | | |
| | | | | | | |
| 58 | | ANNUAL REPORT | | MAY 31, 2014 | | |
| | | | |
| Notes to Financial Statements (continued) | | |
as variation margin. Variation margin is recorded by the Funds as unrealized appreciation or depreciation, and if, applicable as a receivable or payable for variation margin in the Statements of Assets and Liabilities.
When the contract is closed, the Funds record a realized gain or loss equal to the difference between the value of the contract at the time it was opened and the value at the time it was closed. The use of financial futures contracts involves the risk of an imperfect correlation in the movements in the price of financial futures contracts, interest rates and the underlying assets.
Swaps: Strategic Municipal Opportunities Fund enters into swap agreements in which the Fund and a counterparty agree either to make periodic net payments on a specified notional amount or a net payment upon termination. Swap agreements are privately negotiated in the OTC market and may be entered into as a bilateral contract (“OTC swaps”) or centrally cleared (“centrally cleared swaps”). Swaps are marked-to-market daily and changes in value are recorded as unrealized appreciation (depreciation).
For OTC swaps, any upfront premiums paid are recorded as assets and any upfront fees received are recorded as liabilities and are shown as swap premiums paid and swap premiums received, respectively, in the Statements of Assets and Liabilities and amortized over the term of the OTC swap. Payments received or made by the Fund for OTC swaps are recorded in the Statements of Operations as realized gains or losses, respectively. When an OTC swap is terminated, the Fund will record a realized gain or loss equal to the difference between the proceeds from (or cost of) the closing transaction and the Fund’s basis in the contract, if any. Generally, the basis of the contracts is the premium received or paid.
Swap transactions involve, to varying degrees, elements of interest rate, credit and market risk in excess of the amounts recognized in the Statements of Assets and Liabilities. Such risks involve the possibility that there will be no liquid market for these agreements, that the counterparty to the agreements may default on its obligation to perform or disagree as to the meaning of the contractual terms in the agreements, and that there may be unfavorable changes in interest rates and/or market values associated with these transactions.
| Ÿ | | Credit default swaps — Strategic Municipal Opportunities Fund enters into credit default swaps to manage its exposure to the market or certain sectors of the market, to reduce its risk exposure to defaults of corporate and/or sovereign issuers or to create exposure to corporate and/or sovereign issuers to which it is not otherwise exposed (credit risk). The Fund may either buy or sell (write) credit default swaps on single-name issuers (corporate or sovereign), a combination or basket of single-name issuers or traded indexes. Credit default swaps on single-name issuers are agreements in which the protection buyer pays fixed periodic payments to the seller in consideration for a guarantee from the protection seller to make a specific payment should a negative credit event take place with respect to the referenced entity (e.g., bankruptcy, failure to pay, obligation accelerators, repudiation, moratorium or restructuring). Credit default swaps on traded indexes are agreements in which the buyer pays fixed periodic payments to the seller in consideration for a guarantee from the seller to make a specific payment should a write-down, principal or interest shortfall or default of all or individual underlying securities included in the index occur. As a buyer, if an underlying credit event occurs, the Fund will either (i) receive from the seller an amount equal to the notional amount of the swap and deliver the referenced security or underlying securities comprising the index, or (ii) receive a net settlement of cash equal to the notional amount of the swap less the recovery value of the security or underlying securities comprising the index. As a seller (writer), if an underlying credit event occurs, the Fund will either pay the buyer an amount equal to the notional amount of the swap and take delivery of the referenced security or underlying securities comprising the index or pay a net settlement of cash equal to the notional amount of the swap less the recovery value of the security or underlying securities comprising the index. |
The following is a summary of the Funds’ derivative financial instruments categorized by risk exposure:
| | | | | | | | | | | | | | | | | | |
| Fair Values of Derivative Financial Instruments as of May 31, 2014 | |
| Derivative Assets | |
| | | | | BlackRock
California
Municipal
Bond Fund | | | BlackRock
New Jersey
Municipal
Bond Fund | | | BlackRock
Pennsylvania
Municipal
Bond Fund | | | BlackRock
Strategic
Municipal
Opportunities
Fund | |
| | | Statements of Assets and Liabilities Location | | Value | |
| Interest rate contracts: | | | | | | | | | | | | | | | | | | |
Financial futures contracts | | Unrealized appreciation1 | | | — | | | | — | | | $ | 18,137 | | | | — | |
Credit contracts | | Unrealized appreciation on OTC swaps | | | — | | | | — | | | | — | | | $ | 103,920 | |
| | | |
| | | | | | | | | | | | | | | |
| | | Derivative Liabilities | | | | | | | | | | |
| | | Statements of Assets and Liabilities Location | | Value | |
Interest rate contracts: | | | | | | | | | | | | | | | | | | |
Financial futures contracts | | Net unrealized depreciation1 | | $ | (399,278 | ) | | $ | (183,544 | ) | | | — | | | $ | (3,117,645 | ) |
Credit contracts | | Unrealized depreciation on OTC swaps; Swap premiums received | | | — | | | | — | | | | — | | | | (532,375 | ) |
| | | |
Total | | | | $ | (399,278 | ) | | $ | (183,544 | ) | | | | | | $ | (3,650,020 | ) |
| | | | | | | | | | | | | | | | | | |
| | 1 | | Includes cumulative appreciation/depreciation on financial futures contracts, if any, as reported in the Schedules of Investments. Only current day’s variation margin is reported within the Statements of Assets and Liabilities. |
| | | | | | |
| | | | | | | |
| | ANNUAL REPORT | | MAY 31, 2014 | | 59 |
| | |
| Notes to Financial Statements (continued) | | |
| | | | | | | | | | | | | | | | |
The Effect of Derivative Financial Instruments in the Statements of Operations
Year Ended May 31, 2014 | |
| | | Net Realized Gain (Loss) From | |
| | | BlackRock
California
Municipal
Bond Fund | | | BlackRock
New Jersey
Municipal
Bond Fund | | | BlackRock
Pennsylvania
Municipal Bond Fund | | | BlackRock
Strategic
Municipal
Opportunities
Fund | |
| Interest rate contract: | | | | | | | | | | | | | | | | |
Financial futures contracts | | $ | (103,076 | ) | | $ | (745,252 | ) | | $ | (876,093 | ) | | $ | (9,754,633 | ) |
| Credit contracts: | | | | | | | | | | | | | | | | |
Swaps | | | — | | | | — | | | | — | | | | 12,490 | |
| | | | | | | | | | | | | | | | |
Total | | $ | (103,076 | ) | | $ | (745,252 | ) | | $ | (876,093 | ) | | $ | (9,742,143 | ) |
| | | | | | | | | | | | | | | | |
| | | Net Change in Unrealized Appreciation/Depreciation on | |
| | | BlackRock
California
Municipal
Bond Fund | | | BlackRock
New Jersey
Municipal
Bond Fund | | | BlackRock
Pennsylvania
Municipal
Bond Fund | | | BlackRock
Strategic
Municipal
Opportunities
Fund | |
| Interest rate contract: | | | | | | | | | | | | | | | | |
Financial futures contracts | | $ | (778,744 | ) | | $ | (216,778 | ) | | $ | (725,714 | ) | | $ | (3,518,872 | ) |
| Credit contracts: | | | | | | | | | | | | | | | | |
Swaps | | | — | | | | — | | | | — | | | | 22,974 | |
| | | | | | | | | | | | | | | | |
Total | | $ | (778,744 | ) | | $ | (216,778 | ) | | $ | (725,714 | ) | | $ | (3,495,898 | ) |
| | | | | | | | | | | | | | | | |
For the year ended May 31, 2014, the average quarterly balances of outstanding derivative financial instruments were as follows:
| | | | | | | | | | | | | | | | |
| | | BlackRock
California
Municipal
Bond Fund | | | BlackRock
New Jersey
Municipal
Bond Fund | | | BlackRock
Pennsylvania
Municipal
Bond Fund | | | BlackRock
Strategic
Municipal
Opportunities
Fund | |
Financial futures contracts: | | | | | | | | | | | | | | | | |
Average number of contracts purchased | | | — | | | | 93 | 1 | | | — | | | | 306 | 1 |
Average number of contracts sold | | | 340 | | | | 182 | | | | 228 | | | | 2,540 | |
Average notional value of contracts purchased | | | — | | | $ | 11,524,484 | 1 | | | — | | | $ | 37,919,268 | 1 |
Average notional value of contracts sold | | $ | 42,704,492 | | | $ | 22,769,961 | | | $ | 28,444,414 | | | $ | 316,044,727 | |
Credit default swaps: | | | | | | | | | | | | | | | | |
Average number of contracts — buy protection | | | — | | | | — | | | | — | | | | 1 | |
Average number of contracts — sold protection | | | — | | | | — | | | | — | | | | 1 | |
Average notional value — buy protection | | | — | | | | — | | | | — | | | $ | 6,250,000 | |
Average notional value — sold protection | | | — | | | | — | | | | — | | | $ | 6,250,000 | |
| | 1 | | Actual amounts for the period are shown due to limited outstanding derivative financial instruments as of each quarter. |
Counterparty Credit Risk: A derivative contract may suffer a mark-to-market loss if the value of the contract decreases due to an unfavorable change in the market rates or values of the underlying instrument. Losses can also occur if the counterparty does not perform under the contract.
A Fund’s risk of loss from counterparty credit risk on OTC derivatives is generally limited to the aggregate unrealized gain netted against any collateral held by such Fund.
With exchange-traded futures, there is less counterparty credit risk to the Funds since the exchange or clearinghouse, as counterparty to such instruments, guarantees against a possible default. The clearinghouse stands between the buyer and the seller of the contract; therefore, credit risk is limited to failure of the clearinghouse. While offset rights may exist under applicable law, a Fund does not have a contractual right of offset against a clearing broker or clearinghouse in the event of a default (including the bankruptcy or insolvency) of the clearing broker or clearinghouse. Additonally, credit risk exists in exchange traded futures with respect to initial and variation margin that is held in a clearing broker’s customer accounts. While clearing brokers are required to segregate customer margin from their own assets, in the event that a clearing broker becomes insolvent or goes into bankruptcy and at that time there is a shortfall in the aggregate amount of margin held by the clearing broker for all its clients, typically the shortfall would be allocated on a pro rata basis across all the clearing broker’s customers, potentially resulting in losses to the Funds.
In order to better define its contractual rights and to secure rights that will help the Funds mitigate its counterparty risk, the Funds may enter into an International Swaps and Derivatives Association, Inc. Master Agreement (“ISDA Master Agreement”) or similar agreement with its derivative contract counterparties. An ISDA Master Agreement is a bilateral agreement between each Fund and a counterparty that governs certain OTC derivatives and typically contains, among other things, collateral posting terms and netting provisions in the event of a default and/or termination
| | | | | | |
| | | | | | | |
| 60 | | ANNUAL REPORT | | MAY 31, 2014 | | |
| | | | |
| Notes to Financial Statements (continued) | | |
event. Under an ISDA Master Agreement, each Fund may, under certain circumstances, offset with the counterparty certain derivative financial instruments’ payables and/or receivables with collateral held and/or posted and create one single net payment. The provisions of the ISDA Master Agreement typically permit a single net payment in the event of default including the bankruptcy or insolvency of the counterparty. Bankruptcy or insolvency laws of a particular jurisdiction may impose restrictions on or prohibitions against the right of offset in bankruptcy, insolvency or other events. In addition, certain ISDA Master Agreements allow counterparties to OTC derivatives to terminate derivative contracts prior to maturity in the event the Funds’ net assets decline by a stated percentage or the Funds fail to meet the terms of its ISDA Master Agreements, which would cause the Funds to accelerate payment of any net liability owed to the counterparty.
Collateral Requirements: For derivatives traded under an ISDA Master Agreement, the collateral requirements are typically calculated by netting the mark-to-market amount for each transaction under such agreement and comparing that amount to the value of any collateral currently pledged by the Funds and the counterparty.
Cash collateral that has been pledged to cover obligations of the Funds and cash collateral received from the counterparty, if any, is reported separately on the Statements of Assets and Liabilities as cash pledged as collateral and cash received as collateral, respectively. Non-cash collateral pledged by the Funds, if any, is noted in the Schedules of Investments. Generally, the amount of collateral due from or to a party has to exceed a minimum transfer amount threshold (typically either $250,000 or $500,000) before a transfer is required, which is determined at the close of business of the Funds and any additional required collateral is delivered to/pledged by the Funds on the next business day. Typically, the Funds and counterparties are not permitted to sell, re-pledge or use the collateral they receive. To the extent amounts due to the Funds from their counterparties are not fully collateralized, contractually or otherwise, the Funds bear the risk of loss from counterparty non-performance.
For financial reporting purposes, the Funds do not offset derivative assets and derivative liabilities that are subject to netting arrangements, if any, in the Statements of Assets and Liabilities.
At May 31, 2014, the Funds’ derivative assets and liabilities (by type) are as follows:
| | | | | | | | | | | | | | | | | | | | | | | | | | | | | | | | |
| | | BlackRock California
Municipal Bond Fund | | | BlackRock New Jersey
Municipal Bond Fund | | | BlackRock Pennsylvania
Municipal Bond Fund | | | BlackRock Strategic
Municipal Opportunities
Fund | |
| | | Assets | | | Liabilities | | | Assets | | | Liabilities | | | Assets | | | Liabilities | | | Assets | | | Liabilities | |
| Derivative Financial Instruments: | | | | | | | | | | | | | | | | | | | | | | | | | | | | | | | | |
Financial futures contracts | | $ | 65,622 | | | | — | | | $ | 38,826 | | | | — | | | $ | 31,716 | | | | — | | | $ | 666,631 | | | | — | |
OTC swaps1 | | | — | | | | — | | | | — | | | | — | | | | — | | | | — | | | | 103,920 | | | $ | 532,375 | |
| | | | | | | | | | | | | | | | | | | | | | | | | | | | | | | | |
Total derivative assets and liabilities in the Statements of Assets and Liabilities | | | 65,622 | | | | — | | | | 38,826 | | | | — | | | | 31,716 | | | | — | | | | 770,551 | | | | 532,375 | |
| | | | | | | | | | | | | | | | | | | | | | | | | | | | | | | | |
Derivatives not subject to an Master Netting Agreement of similar agreement (“MNA”) | | | (65,622 | ) | | | — | | | | (38,826 | ) | | | — | | | | (31,716 | ) | | | — | | | | (666,631 | ) | | | — | |
| | | | | | | | | | | | | | | | | | | | | | | | | | | | | | | | |
Total derivative assets and liabilities subject to an MNA | | | — | | | | — | | | | — | | | | — | | | | — | | | | — | | | $ | 103,920 | | | $ | 532,375 | |
| | | | | | | | | | | | | | | | | | | | | | | | | | | | | | | | |
| | 1 | | Includes unrealized appreciation/depreciation on OTC swaps and swap premiums paid/received in the Statements of Assets and Liabilities. |
The following table presents BlackRock Strategic Municipal Opportunities Fund’s derivative assets and liabilities by counterparty net of amounts available for offset under an MNA and net of the related collateral received and pledged by the Fund as of May 31, 2014:
| | | | | | | | | | | | | | | | | | | | |
| Counterparty | | Derivative Assets Subject to an
MNA by Counterparty | | | Derivatives Available for Offset2 | | | Non-cash Collateral
Received | | | Cash Collateral Received | | | Net Amount of
Derivative Assets | |
Citibank N.A. | | $ | 103,920 | | | $ | (103,920 | ) | | | — | | | | — | | | | — | |
| | | | | | | | | | | | | | | | | | | | |
| Counterparty | | Derivative Liabilities Subject to an
MNA by Counterparty | | | Derivatives Available for Offset2 | | | Non-cash Collateral
Pledged | | | Cash Collateral Pledged | | | Net Amount of
Derivative Liabilities3 | |
Citibank N.A | | $ | 532,375 | | | $ | (103,920 | ) | | | — | | | | — | | | $ | 428,455 | |
| | 2 | | The amount of derivatives available for offset is limited to the amount of derivative assets and/or liabilities that are subject to an MNA. |
| | 3 | | Net amount represents the net amount payable due to the counterparty in the event of default. |
5. Investment Advisory Agreement and Other Transactions with Affiliates:
The PNC Financial Services Group, Inc. is the largest stockholder and an affiliate, for 1940 Act purposes, of BlackRock, Inc. (“BlackRock”).
Each Trust, on behalf of each Fund, entered into an Investment Advisory Agreement with BlackRock Advisors, LLC (the “Manager”), the Funds’ investment advisor, an indirect, wholly owned subsidiary of BlackRock, to provide investment advisory and administration services. The Manager is responsible for the management of each Fund’s portfolio and provides the necessary personnel, facilities, equipment and certain other services necessary to the operations of each Fund. For such services, BlackRock California Municipal Bond Fund, BlackRock New Jersey Municipal Bond Fund and BlackRock Pennsylvania Municipal Bond Fund pays the
| | | | | | |
| | | | | | | |
| | ANNUAL REPORT | | MAY 31, 2014 | | 61 |
| | |
| Notes to Financial Statements (continued) | | |
Manager a monthly fee based on a percentage of each Fund’s average daily net assets at the following annual rates:
| | | | |
| Average Daily Net Assets | | Investment Advisory Fee | |
First $500 Million | | | 0.55 | % |
$500 — $1 Billion | | | 0.525 | % |
Greater than $1 Billion | | | 0.50 | % |
BlackRock Strategic Municipal Opportunities Fund pays the Manager a monthly fee based on a percentage of the Fund’s average daily net assets at the following annual rates:
| | | | |
| Average Daily Net Assets | | Investment Advisory Fee | |
First $1 Billion | | | 0.55 | % |
$1 Billion — $3 Billion | | | 0.52 | % |
$3 Billion — $5 Billion | | | 0.50 | % |
$5 Billion — $10 Billion | | | 0.48 | % |
Greater than $10 Billion | | | 0.47 | % |
The Manager, with respect to each Fund, entered into a sub-advisory agreement with BlackRock Investment Management, LLC (“BIM”), an affiliate of the Manager. The Manager pays BIM, for services it provides, a monthly fee that is a percentage of the investment advisory fees paid by each Fund to the Manager. Effective July 1, 2014, the sub-advisory agreement between the Manager and BIM, with respect to the Funds, expired.
The Manager, with respect to BlackRock Strategic Municipal Opportunities Fund, contractually agreed to waive 0.05% of the Fund’s investment advisory fee until October 1, 2015. For the year ended May 31, 2014, the Manager waived $387,543, which is included in fees waived by Manager in the Statements of Operations.
The Manager, with respect to BlackRock New Jersey Municipal Bond Fund and BlackRock Pennsylvania Municipal Bond Fund, voluntarily agreed to waive and/or reimburse fees and/or expenses, in order to limit expenses, excluding interest expense, acquired fund fees and expenses and certain other fund expenses, which constitute extraordinary expenses not incurred in the ordinary course of the Funds’ business. These voluntary waivers and/or reimbursements may be reduced or discontinued at any time without notice. The expense limitations as a percentage of net assets are as follows:
| | | | | | | | |
| | | BlackRock New Jersey
Municipal Bond Fund | | | BlackRock
Pennsylvania
Municipal Bond Fund | |
Institutional | | | 0.78 | % | | | 0.71 | % |
Service | | | 0.87 | % | | | 0.89 | % |
Investor A | | | 0.87 | % | | | 0.89 | % |
Investor A1 | | | 0.72 | % | | | 0.73 | % |
Investor B | | | 1.64 | % | | | 1.68 | % |
Investor B1 | | | 1.13 | % | | | 1.15 | % |
Investor C | | | 1.64 | % | | | 1.67 | % |
Investor C1 | | | 1.23 | % | | | 1.26 | % |
As a result, for the year ended May 31, 2014, the Manager waived and/or reimbursed the following amounts, which are shown as transfer agent fees waived and/or reimbursed — class specific in the Statements of Operations.
| | | | | | | | |
| | | BlackRock New Jersey
Municipal Bond Fund | | | BlackRock
Pennsylvania
Municipal Bond Fund | |
Institutional | | $ | 6,961 | | | $ | 281,571 | |
Service | | $ | 20,528 | | | $ | 5,206 | |
Investor A | | $ | 25,484 | | | $ | 30,122 | |
Investor A1 | | $ | 15,475 | | | $ | 9,460 | |
Investor B | | $ | 17 | | | $ | 8 | |
Investor B1 | | $ | 42 | | | $ | 13 | |
Investor C | | $ | 8.100 | | | $ | 2,975 | |
Investor C1 | | $ | 3,047 | | | $ | 754 | |
In addition, for BlackRock New Jersey Municipal Bond Fund for the year ended May 31, 2014, the Manager waived $72,426, which is included in fees waived by Manager in the Statements of Operations.
The Manager voluntarily agreed to waive its investment advisory fees by the amount of investment advisory fees each Fund pays to the Manager indirectly through its investment in affiliated money market funds. However, the Manager does not waive its investment advisory fees by the amount of investment advisory fees paid in connection with each Fund’s investment in other affiliated investment companies, if any. These amounts waived or reimbursed are included in fees waived by Manager in the Statements of Operations. For the year ended May 31, 2014, the amounts waived were as follows:
| | | | |
BlackRock California Municipal Bond Fund | | $ | 2,922 | |
BlackRock New Jersey Municipal Bond Fund | | $ | 4,790 | |
BlackRock Pennsylvania Municipal Bond Fund | | $ | 124 | |
BlackRock Strategic Municipal Opportunities Fund | | $ | 13,052 | |
For the year ended May 31, 2014, each Fund reimbursed the Manager for certain accounting services, which is included in accounting services in the Statements of Operations. The reimbursements were as follows:
| | | | |
BlackRock California Municipal Bond Fund | | $ | 7,305 | |
BlackRock New Jersey Municipal Bond Fund | | $ | 2,564 | |
BlackRock Pennsylvania Municipal Bond Fund | | $ | 4,851 | |
BlackRock Strategic Municipal Opportunities Fund | | $ | 8,950 | |
Each Trust, on behalf of each Fund, entered into a Distribution Agreement and Distribution and Service Plan with BlackRock Investments, LLC (“BRIL”), an affiliate of the Manager. Pursuant to the Distribution and Service Plan and in accordance with Rule 12b-1 under the 1940 Act, each Fund pay BRIL ongoing service and distribution fees. The fees are accrued daily and paid monthly at annual rates based upon the average daily net assets of the shares of each Fund as follows:
| | | | | | | | | | | | | | | | |
| | | Service Fees | |
| | | BlackRock
California
Municipal
Bond Fund | | | BlackRock New Jersey
Municipal
Bond Fund | | | BlackRock
Pennsylvania
Municipal
Bond Fund | | | BlackRock
Strategic
Municipal
Opportunities
Fund | |
Service | | | — | | | | 0.25 | % | | | 0.25 | % | | | — | |
Investor A | | | 0.25 | % | | | 0.25 | % | | | 0.25 | % | | | 0.25 | % |
Investor A1 | | | 0.10 | % | | | 0.10 | % | | | 0.10 | % | | | 0.10 | % |
Investor B | | | 0.25 | % | | | 0.25 | % | | | 0.25 | % | | | 0.20 | % |
Investor B1 | | | — | | | | 0.25 | % | | | 0.25 | % | | | — | |
Investor C | | | 0.25 | % | | | 0.25 | % | | | 0.25 | % | | | 0.25 | % |
Investor C1 | | | 0.25 | % | | | 0.25 | % | | | 0.25 | % | | | — | |
| | | | | | |
| | | | | | | |
| 62 | | ANNUAL REPORT | | MAY 31, 2014 | | |
| | |
| Notes to Financial Statements (continued) | | |
| | | | | | | | | | | | | | | | |
| | | Distribution Fees | |
| | | BlackRock
California
Municipal
Bond Fund | | | BlackRock New Jersey
Municipal
Bond Fund | | | BlackRock
Pennsylvania
Municipal
Bond Fund | | | BlackRock
Strategic
Municipal
Opportunities
Fund | |
Investor B | | | 0.25 | % | | | 0.75 | % | | | 0.75 | % | | | 0.10 | % |
Investor B1 | | | — | | | | 0.25 | % | | | 0.25 | % | | | — | |
Investor C | | | 0.75 | % | | | 0.75 | % | | | 0.75 | % | | | 0.75 | % |
Investor C1 | | | 0.35 | % | | | 0.35 | % | | | 0.35 | % | | | — | |
Pursuant to sub-agreements with BRIL, broker-dealers and BRIL provide shareholder servicing and distribution services to each Fund. The ongoing service and/or distribution fee compensates BRIL and each broker-dealer for providing shareholder servicing and/or distribution related services to Service, Investor A, Investor A1, Investor B, Investor B1, Investor C and Investor C1 shareholders.
Pursuant to written agreements, certain financial intermediaries, some of which may be affiliates, provide the Funds with sub-accounting, recordkeeping, sub-transfer agency and other administrative services with respect to sub-accounts they service. For these services, these entities receive an annual fee per shareholder account, which will vary depending on share class and/or net assets. For the year ended May 31, 2014, the Funds paid the following to affiliates in return for these services, which is included in transfer agent-class specific in the Statements of Operations:
| | | | | | | | | | | | | | | | |
| | | BlackRock
California
Municipal
Bond Fund | | | BlackRock New Jersey
Municipal
Bond Fund | | | BlackRock
Pennsylvania
Municipal
Bond Fund | | | BlackRock
Strategic
Municipal
Opportunities
Fund | |
Institutional | | $ | 205,628 | | | $ | 148,380 | | | $ | 558,112 | | | $ | 251,217 | |
Service | | | — | | | $ | 11,219 | | | $ | 5,742 | | | | — | |
Investor A | | $ | 37,489 | | | $ | 21,001 | | | $ | 35,543 | | | $ | 79,315 | |
Investor A1 | | $ | 40,563 | | | $ | 11,677 | | | $ | 7,562 | | | $ | 14,533 | |
Investor B | | $ | 1,671 | | | $ | 8 | | | | — | | | $ | 16 | |
Investor B1 | | | — | | | $ | 26 | | | $ | 16 | | | | — | |
Investor C | | $ | 27,184 | | | $ | 10,831 | | | $ | 13,541 | | | $ | 47,315 | |
Investor C1 | | $ | 6,148 | | | $ | 3,151 | | | $ | 2,541 | | | | — | |
The Manager maintains a call center, which is responsible for providing certain shareholder services to the Funds, such as responding to shareholder inquiries and processing transactions based upon instructions from shareholders with respect to the subscription and redemption of Fund shares. For the year ended May 31, 2014, the Funds reimbursed the Manager the following amounts for costs incurred in running the call center, which are included in transfer agent — class specific in the Statements of Operations:
| | | | | | | | | | | | | | | | |
| | | BlackRock
California
Municipal
Bond Fund | | | BlackRock New Jersey
Municipal
Bond Fund | | | BlackRock
Pennsylvania
Municipal
Bond Fund | | | BlackRock
Strategic
Municipal
Opportunities
Fund | |
Institutional | | $ | 1,142 | | | $ | 492 | | | $ | 1,057 | | | $ | 1,245 | |
Service | | | — | | | $ | 2,090 | | | | — | | | | — | |
Investor A | | $ | 847 | | | $ | 552 | | | $ | 407 | | | | — | |
Investor A1 | | $ | 3,309 | | | $ | 629 | | | $ | 844 | | | $ | 422 | |
Investor B | | | — | | | $ | 2 | | | $ | 2 | | | $ | 4 | |
Investor B1 | | | — | | | $ | 8 | | | $ | 2 | | | | — | |
Investor C | | $ | 626 | | | $ | 308 | | | $ | 239 | | | $ | 1,308 | |
Investor C1 | | $ | 114 | | | $ | 69 | | | $ | 38 | | | | — | |
For the year ended May 31, 2014, affiliates earned underwriting discounts, direct commissions and dealer concessions on sales of the Funds’ Investor A Shares as follows:
| | | | | | | | | | | | | | | | |
| | | BlackRock
California
Municipal
Bond Fund | | | BlackRock New Jersey
Municipal
Bond Fund | | | BlackRock
Pennsylvania
Municipal
Bond Fund | | | BlackRock Strategic Municipal
Opportunities Fund | |
Investor A | | $ | 11,009 | | | $ | 6,486 | | | $ | 8,251 | | | $ | 36,955 | |
For the year ended May 31, 2014, affiliates received CDSC’s as follows:
| | | | | | | | | | | | | | | | |
| | | BlackRock
California
Municipal
Bond Fund | | | BlackRock New Jersey
Municipal
Bond Fund | | | BlackRock
Pennsylvania
Municipal
Bond Fund | | | BlackRock
Strategic
Municipal
Opportunities
Fund | |
Investor A | | $ | 108,901 | | | $ | 13,961 | | | $ | 1,001 | | | $ | 25,855 | |
Investor A1 | | | — | | | | — | | | | — | | | $ | 271 | |
Investor B | | $ | 2 | | | | — | | | | — | | | | — | |
Investor C | | $ | 41,186 | | | $ | 7,227 | | | $ | 5,759 | | | $ | 54,358 | |
Certain officers and/or Trustees of the Trusts are officers and/or directors of BlackRock or its affiliates. The Funds reimburse the Manager for a portion of the compensation paid to the Funds’ Chief Compliance Officer, which is included in officer and trustees in the Statements of Operations.
The Funds may purchase securities from, or sell securities to, an affiliated fund provided the affiliation is due solely to having a common investment adviser, common officers, or common trustees. For the year ended May 31, 2014, the purchase and sale transactions with an affiliated fund in compliance with Rule 17a-7 under the 1940 Act were as follows:
| | | | | | | | |
| | | Purchases | | | Sales | |
BlackRock California Municipal Bond Fund | | | — | | | $ | 8,370,228 | |
6. Purchases and Sales:
Purchases and sales of investments, excluding short-term securities, for the year ended May 31, 2014, were as follows:
| | | | | | | | |
| | | Purchases | | | Sales | |
BlackRock California Municipal Bond Fund | | $ | 210,579,569 | | | $ | 467,216,819 | |
BlackRock New Jersey Municipal Bond Fund | | $ | 29,220,348 | | | $ | 52,682,624 | |
BlackRock Pennsylvania Municipal Bond Fund | | $ | 51,779,549 | | | $ | 164,648,904 | |
BlackRock Strategic Municipal Opportunities Fund | | $ | 2,266,739,517 | | | $ | 1,650,594,319 | |
7. Income Tax Information:
U.S. GAAP requires that certain components of net assets be adjusted to reflect permanent differences between financial and tax reporting. These reclassifications have no effect on net assets or net asset values per share. The following permanent differences as of May 31, 2014 attributable to the accounting for swap agreements, amortization methods on fixed income securities, the expiration of capital loss carryforwards and
| | | | | | |
| | | | | | | |
| | ANNUAL REPORT | | MAY 31, 2014 | | 63 |
| | |
| Notes to Financial Statements (continued) | | |
distributions received from a regulated investment company were reclassified to the following accounts:
| | | | | | | | | | | | | | | | |
| | | BlackRock
California
Municipal
Bond Fund | | | BlackRock
New Jersey
Municipal
Bond Fund | | | BlackRock
Pennsylvania
Municipal
Bond Fund | | | BlackRock
Strategic
Municipal
Opportunities
Fund | |
Paid-in capital | | | — | | | $ | (127,616 | ) | | | — | | | $ | 11,102 | |
Undistributed net investment income | | $ | (14,842 | ) | | $ | (6,868 | ) | | $ | (126,505 | ) | | $ | (120,638 | ) |
Accumulated net realized gain (loss) | | $ | 14,842 | | | $ | 134,484 | | | $ | 126,505 | | | $ | 109,536 | |
The tax character of distributions paid during the fiscal years ended May 31, 2014 and May 31, 2013 was as follows:
| | | | | | | | | | | | | | | | |
| | | BlackRock
California
Municipal
Bond Fund | | | BlackRock
New Jersey
Municipal
Bond Fund | | | BlackRock
Pennsylvania
Municipal
Bond Fund | | | BlackRock
Strategic
Municipal
Opportunities
Fund | |
| Tax-exempt income1 | |
5/31/14 | | $ | 21,557,874 | | | $ | 8,946,318 | | | $ | 18,858,665 | | | $ | 21,306,467 | |
5/31/13 | | | 24,193,526 | | | | 9,360,973 | | | | 21,389,950 | | | | 19,824,735 | |
| Ordinary income2 | |
5/31/14 | | | — | | | | 22,210 | | | | 69,310 | | | | 1,292,798 | |
5/31/13 | | | 630,103 | | | | 353,413 | | | | 36,394 | | | | 316,917 | |
| Long-term capital gains3 | |
5/31/14 | | | 4,734,236 | | | | — | | | | — | | | | 3,966,371 | |
5/31/13 | | | 261,929 | | | | — | | | | — | | | | 2,871,694 | |
| | | | |
| Total | |
5/31/14 | | $ | 26,292,110 | | | $ | 8,968,528 | | | $ | 18,927,975 | | | $ | 26,565,636 | |
| | | | |
5/31/13 | | $ | 25,085,558 | | | $ | 9,714,386 | | | $ | 21,426,344 | | | $ | 23,013,346 | |
| | | | |
| 1 | | The Funds designate these amounts paid during the fiscal year ended May 31, 2014, as exempt-interest dividends. |
| 2 | | Ordinary income consists primarily of taxable income recognized from market discount and net short-term capital gains. Additionally, all ordinary income distributions are comprised of interest related dividends and are eligible for exemption from U.S. withholding tax for nonresident aliens and foreign corporations. |
| 3 | | The Funds designate these amounts paid during the fiscal year ended May 31, 2014, as capital gain dividends. |
As of May 31, 2014, the tax components of accumulated net earnings were as follows:
| | | | | | | | | | | | | | | | |
| | | BlackRock
California
Municipal
Bond Fund | | | BlackRock
New Jersey
Municipal
Bond Fund | | | BlackRock
Pennsylvania
Municipal
Bond Fund | | | BlackRock
Strategic
Municipal
Opportunities
Fund | |
Undistributed tax-exempt income | | $ | 409,994 | | | $ | 830,609 | | | $ | 318,507 | | | | — | |
Undistributed ordinary income | | | 134 | | | | — | | | | 51,449 | | | $ | 125,151 | |
Undistributed long-term capital gains | | | — | | | | — | | | | — | | | | 394,927 | |
Capital loss carryforwards | | | (21,900,397 | ) | | | (4,889,588 | ) | | | (26,365,008 | ) | | | — | |
Net unrealized gains4 | | | 43,849,170 | | | | 18,988,412 | | | | 31,291,832 | | | | 27,912,605 | |
Qualified late-year losses5 | | | (4,603,673 | ) | | | (1,082,803 | ) | | | (2,242,990 | ) | | | — | |
| | | | |
Total | | $ | 17,755,228 | | | $ | 13,846,630 | | | $ | 3,053,790 | | | $ | 28,432,683 | |
| | | | |
| 4 | | The differences between book-basis and tax-basis net unrealized gains were attributable primarily to the tax deferral of losses on wash sales and straddles, amortization methods of premiums and discounts on fixed income securities, the accrual of income on securities in default, the realization for tax purposes of unrealized gains/losses on certain futures contracts and the treatment of residual interests in TOBs. |
| 5 | | The Funds have elected to defer certain qualified late-year losses and recognize such losses in the year ending May 31, 2015. |
As of May 31, 2014, the Funds had capital loss carryforwards available to offset future realized capital gains through the indicated expiration dates as follows:
| | | | | | | | | | | | |
| Expires May 31, | | BlackRock
California
Municipal
Bond Fund | | | BlackRock
New Jersey
Municipal
Bond Fund | | | BlackRock
Pennsylvania
Municipal
Bond Fund | |
2017 | | | — | | | $ | 1,037,279 | | | $ | 9,367,197 | |
2018 | | | — | | | | 260,363 | | | | 6,928,880 | |
2019 | | | — | | | | 243,757 | | | | 720,781 | |
No expiration date6 | | $ | 21,900,397 | | | | 3,348,189 | | | | 9,348,150 | |
| | | | |
Total | | $ | 21,900,397 | | | $ | 4,889,588 | | | $ | 26,365,008 | |
| | | | |
| 6 | | Must be utilized prior to losses subject to expiration. |
As of May 31, 2014, gross unrealized appreciation and depreciation based on cost for federal income tax purposes were as follows:
| | | | | | | | | | | | | | | | |
| | | BlackRock
California
Municipal
Bond Fund | | | BlackRock
New Jersey
Municipal
Bond Fund | | | BlackRock
Pennsylvania
Municipal
Bond Fund | | | BlackRock
Strategic
Municipal
Opportunities
Fund | |
Tax cost | | $ | 501,650,318 | | | $ | 215,793,312 | | | $ | 386,011,987 | | | $ | 1,459,962,905 | |
| | | | |
Gross unrealized appreciation | | $ | 44,375,580 | | | $ | 20,158,775 | | | $ | 33,201,087 | | | $ | 30,290,113 | |
Gross unrealized depreciation | | | (526,410 | ) | | | (1,138,346 | ) | | | (1,859,497 | ) | | | (2,161,632 | ) |
| | | | |
Net unrealized appreciation | | $ | 43,849,170 | | | $ | 19,020,429 | | | $ | 31,341,590 | | | $ | $28,128,481 | |
| | | | |
8. Borrowings:
The Funds, along with certain other funds managed by the Manager and its affiliates (“Participating Funds”), are a party to a 364-day, $1.1 billion credit agreement with a group of lenders, under which the Funds may borrow to fund shareholder redemptions. The agreement expires in April 2015. Excluding commitments designated for a certain individual fund, other Participating Funds, including the Funds, can borrow up to an aggregate commitment amount of $650 million, subject to asset coverage and other limitations as specified in the agreement. The credit agreement has the following terms: a fee of 0.06% per annum on unused commitment amounts and interest at a rate equal to the higher of (a) the one-month LIBOR plus 0.80% per annum or (b) the Fed Funds rate plus 0.80% per annum on amounts borrowed. Participating Funds paid administration and arrangement fees which, along with commitment fees, were allocated among such funds based upon portions of the aggregate commitment available to them and relative net assets of Participating Funds. The Funds did not borrow under the credit agreement during the year ended May 31, 2014.
| | | | | | |
| | | | | | | |
| 64 | | ANNUAL REPORT | | MAY 31, 2014 | | |
| | | | |
| Notes to Financial Statements (continued) | | |
9. Concentration, Market and Credit Risk:
Each Fund invests a substantial amount of its assets in issuers located in a single state or limited number of states. Please see the Schedules of Investments for concentrations in specific states or U.S. territories.
Many municipalities insure repayment of their bonds, which may reduce the potential for loss due to credit risk. The market value of these bonds may fluctuate for other reasons, including market perception of the value of such insurance, and there is no guarantee that the insurer will meet its obligation.
In the normal course of business, the Funds invest in securities and enter into transactions where risks exist due to fluctuations in the market (market risk) or failure of the issuer of a security to meet all its obligations (issuer credit risk). The value of securities held by the Funds may decline in response to certain events, including those directly involving the issuers whose securities are owned by the Funds; conditions affecting the general economy; overall market changes; local, regional or global political, social or economic instability; and currency and interest rate and price fluctuations. Similar to issuer credit risk, the Funds may be exposed to counterparty credit risk, or the risk that an entity with which the Funds have unsettled or open transactions may fail to or be unable to perform on its commitments. The Funds manage counterparty credit risk by entering into transactions only with counterparties that they believe have the financial resources to honor their obligations and by monitoring the financial stability of those counterparties. Financial assets, which potentially expose the Funds to market, issuer and counterparty credit risks, consist principally of financial instruments and receivables due from counterparties. The extent of the Funds’ exposure to market, issuer and counterparty credit risks with respect to these financial assets is generally approximated by their value recorded in the Statements of Assets and Liabilities, less any collateral held by the Funds.
As of May 31, 2014, the BlackRock California Municipal Bond Fund invested a significant portion of its assets in securities in the county/city/special district/school district, and utilities sectors, BlackRock New Jersey Municipal Bond Fund invested a significant portion of its assets in securities in the transportation, and health sectors, BlackRock Pennsylvania Municipal invested a significant portion of its assets in securities in the education, and health sectors and BlackRock Strategic Municipal Opportunities Fund invested a significant portion of its assets in securities in the state sector. Changes in economic conditions affecting the county/city/special district/school district, health, education, state, transportation and utilities sector would have a greater impact on the Funds and could affect the value, income and/or liquidity of positions in such securities.
The Funds may hold a significant amount of bonds subject to calls by the issuers at defined dates and prices. When bonds are called by issuers and the Funds reinvest the proceeds received, such investments may be in securities with lower yields than the bonds originally held, and correspondingly, could adversely impact the yield and total return performance of a fund.
On December 10, 2013, regulators published final rules implementing section 619 of the Dodd-Frank Wall Street Reform and Consumer Protection Act (the “Volcker Rule”), which prohibit banking entities from engaging in proprietary trading of certain instruments and limit such entities’ investments in, and relationships with, “covered funds, as defined in the rules.” Banking entities subject to the Volcker Rule are required to fully comply by July 21, 2015. The Volcker Rule may preclude banking entities and their affiliates from (i) sponsoring TOB trust programs (as such programs are presently structured) and (ii) continuing relationships with or services for existing TOB trust programs. As a result, TOB trusts may need to be restructured or unwound. There can be no assurances that TOB trusts can be restructured, that new sponsors of TOB trusts will develop, or that alternative forms of leverage will be available to the Fund. Any alternative forms of leverage may be more or less advantageous to the Fund than existing TOB leverage.
10. Capital Share Transactions:
Transactions in capital shares for each class were as follows:
| | | | | | | | | | | | | | | | | | |
| BlackRock California Municipal Bond Fund | | Year Ended
May 31, 2014 | | | | | Year Ended
May 31, 2013 | |
| | Shares | | | Amount | | | | | Shares | | | Amount | |
| Institutional | | | | | | | | | | | | | | |
Shares sold | | | 7,800,219 | | | $ | 92,277,258 | | | | | | 23,772,457 | | | $ | 302,773,858 | |
Shares issued in reinvestment of dividends | | | 579,362 | | | | 6,769,494 | | | | | | 628,233 | | | | 7,993,926 | |
Shares redeemed | | | (14,832,343 | ) | | | (171,846,995 | ) | | | | | (15,023,315 | ) | | | (190,926,983 | ) |
| | | | | | | | | | | | | | |
Net increase (decrease) | | | (6,452,762 | ) | | $ | (72,800,243 | ) | | | | | 9,377,375 | | | $ | 119,840,801 | |
| | | | | | | | | | | | | | |
| | | | | | | | | | | | | | | | | | |
| Investor A | | | | | | | | | | | | | | | | | | |
Shares sold | | | 2,465,253 | | | $ | 28,904,915 | | | | | | 7,184,184 | | | $ | 91,235,940 | |
Shares issued in reinvestment of dividends | | | 354,240 | | | | 4,135,859 | | | | | | 325,977 | | | | 4,142,748 | |
Shares redeemed | | | (6,940,663 | ) | | | (81,223,756 | ) | | | | | (3,643,845 | ) | | | (46,276,394 | ) |
| | | | | | | | | | | | | | |
Net increase (decrease) | | | (4,121,170 | ) | | $ | (48,182,982 | ) | | | | | 3,866,316 | | | $ | 49,102,294 | |
| | | | | | | | | | | | | | |
| | | | | | |
| | | | | | | |
| | ANNUAL REPORT | | MAY 31, 2014 | | 65 |
| | |
| Notes to Financial Statements (continued) | | |
| | | | | | | | | | | | | | | | | | |
| BlackRock California Municipal Bond Fund (concluded) | | Year Ended
May 31, 2014 | | | | | Year Ended
May 31, 2013 | |
| | Shares | | | Amount | | | | | Shares | | | Amount | |
| Investor A1 | | | | | | | | | | | | | | |
Shares sold | | | 206,468 | | | $ | 2,422,145 | | | | | | 250,661 | | | $ | 3,179,221 | |
Shares issued in reinvestment of dividends | | | 361,820 | | | | 4,229,954 | | | | | | 299,778 | | | | 3,810,621 | |
Shares redeemed | | | (2,070,752 | ) | | | (24,144,274 | ) | | | | | (1,045,802 | ) | | | (13,316,968 | ) |
| | | | | | | | | | | | | | |
Net decrease | | | (1,502,464 | ) | | $ | (17,492,175 | ) | | | | | (495,363 | ) | | $ | (6,327,126 | ) |
| | | | | | | | | | | | | | |
| | | | | | | | | | | | | | | | | | |
| Investor B | | | | | | | | | | | | | | | | | | |
Shares sold | | | 124 | | | $ | 1,433 | | | | | | 522 | | | $ | 6,630 | |
Shares issued in reinvestment of dividends | | | 3,560 | | | | 41,516 | | | | | | 7,003 | | | | 88,996 | |
Shares redeemed and automatic conversion of shares | | | (210,777 | ) | | | (2,477,540 | ) | | | | | (314,196 | ) | | | (3,988,470 | ) |
| | | | | | | | | | | | | | |
Net decrease | | | (207,093 | ) | | $ | (2,434,591 | ) | | | | | (306,671 | ) | | $ | (3,892,844 | ) |
| | | | | | | | | | | | | | |
| | | | | | | | | | | | | | | | | | |
| Investor C | | | | | | | | | | | | | | | | | | |
Shares sold | | | 758,332 | | | $ | 8,955,739 | | | | | | 3,219,819 | | | $ | 40,959,561 | |
Shares issued in reinvestment of dividends | | | 167,638 | | | | 1,956,206 | | | | | | 124,760 | | | | 1,586,645 | |
Shares redeemed | | | (2,979,404 | ) | | | (34,781,958 | ) | | | | | (1,046,957 | ) | | | (13,338,756 | ) |
| | | | | | | | | | | | | | |
Net increase (decrease) | | | (2,053,434 | ) | | $ | (23,870,013 | ) | | | | | 2,297,622 | | | $ | 29,207,450 | |
| | | | | | | | | | | | | | |
| | | | | | | | | | | | | | | | | | |
| Investor C1 | | | | | | | | | | | | | | | | | | |
Shares sold | | | 1,780 | | | $ | 20,683 | | | | | | 5,779 | | | $ | 73,677 | |
Shares issued in reinvestment of dividends | | | 31,440 | | | | 367,150 | | | | | | 29,812 | | | | 378,971 | |
Shares redeemed | | | (375,152 | ) | | | (4,347,685 | ) | | | | | (238,911 | ) | | | (3,031,862 | ) |
| | | | | | | | | | | | | | |
Net decrease | | | (341,932 | ) | | $ | (3,959,852 | ) | | | | | (203,320 | ) | | $ | (2,579,214 | ) |
| | | | | | | | | | | | | | |
Total Net Increase (Decrease) | | | (14,678,855 | ) | | $ | (168,739,856 | ) | | | | | 14,535,959 | | | $ | 185,351,361 | |
| | | | | | | | | | | | | | |
| | | | | | | | | | | | | | | | | | |
| BlackRock New Jersey Municipal Bond Fund | | | | | | | | | | | | | | |
| Institutional | | | | | | | | | | | | | | |
Shares sold | | | 1,779,455 | | | $ | 19,142,716 | | | | | | 1,522,996 | | | $ | 17,382,424 | |
Shares issued in reinvestment of dividends | | | 89,306 | | | | 948,587 | | | | | | 94,866 | | | | 1,080,653 | |
Shares redeemed | | | (2,795,858 | ) | | | (29,525,153 | ) | | | | | (1,463,977 | ) | | | (16,663,817 | ) |
| | | | | | | | | | | | | | |
Net increase (decrease) | | | (927,097 | ) | | $ | (9,433,850 | ) | | | | | 153,885 | | | $ | 1,799,260 | |
| | | | | | | | | | | | | | |
| | | | | | | | | | | | | | | | | | |
| Service | | | | | | | | | | | | | | | | | | |
Shares sold | | | 237,123 | | | $ | 2,512,079 | | | | | | 573,047 | | | $ | 6,537,644 | |
Shares issued in reinvestment of dividends | | | 54,956 | | | | 583,227 | | | | | | 46,344 | | | | 527,948 | |
Shares redeemed | | | (407,882 | ) | | | (4,305,615 | ) | | | | | (167,806 | ) | | | (1,911,638 | ) |
| | | | | | | | | | | | | | |
Net increase (decrease) | | | (115,803 | ) | | $ | (1,210,309 | ) | | | | | 451,585 | | | $ | 5,153,954 | |
| | | | | | | | | | | | | | |
| | | | | | | | | | | | | | | | | | |
| Investor A | | | | | | | | | | | | | | | | | | |
Shares sold | | | 1,551,053 | | | $ | 16,525,698 | | | | | | 2,000,104 | | | $ | 22,776,711 | |
Shares issued in reinvestment of dividends | | | 134,010 | | | | 1,425,478 | | | | | | 116,047 | | | | 1,322,859 | |
Shares redeemed | | | (2,390,845 | ) | | | (25,372,079 | ) | | | | | (705,913 | ) | | | (8,064,453 | ) |
| | | | | | | | | | | | | | |
Net increase (decrease) | | | (705,782 | ) | | $ | (7,420,903 | ) | | | | | 1,410,238 | | | $ | 16,035,117 | |
| | | | | | | | | | | | | | |
| | | | | | | | | | | | | | | | | | |
| Investor A1 | | | | | | | | | | | | | | | | | | |
Shares sold | | | 90,223 | | | $ | 995,957 | | | | | | 117,416 | | | $ | 1,336,599 | |
Shares issued to shareholders in reinvestment of dividends | | | 71,657 | | | | 761,977 | | | | | | 74,819 | | | | 853,568 | |
Shares redeemed | | | (450,173 | ) | | | (4,789,415 | ) | | | | | (309,275 | ) | | | (3,527,532 | ) |
| | | | | | | | | | | | | | |
Net decrease | | | (288,293 | ) | | $ | (3,031,481 | ) | | | | | (117,040 | ) | | $ | (1,337,365 | ) |
| | | | | | | | | | | | | | |
| | | | | | |
| | | | | | | |
| 66 | | ANNUAL REPORT | | MAY 31, 2014 | | |
| | | | |
| Notes to Financial Statements (continued) | | |
| | | | | | | | | | | | | | | | | | |
| BlackRock New Jersey Municipal Bond Fund (concluded) | | Year Ended
May 31, 2014 | | | | | Year Ended
May 31, 2013 | |
| | Shares | | | Amount | | | | | Shares | | | Amount | |
| Investor B | | | | | | | | | | | | | | |
Shares sold | | | — | | | | — | | | | | | — | | | $ | 7 | |
Shares issued to shareholders in reinvestment of dividends | | | — | | | | — | | | | | | 447 | | | | 5,087 | |
Shares redeemed and automatic conversion of shares | | | (17,618 | ) | | $ | (195,247 | ) | | | | | (4,508 | ) | | | (51,210 | ) |
| | | | | | | | | | | | | | |
Net decrease | | | (17,618 | ) | | $ | (195,247 | ) | | | | | (4,061 | ) | | $ | (46,116 | ) |
| | | | | | | | | | | | | | |
| | | | | | | | | | | | | | | | | | |
| Investor B1 | | | | | | | | | | | | | | | | | | |
Shares sold | | | — | | | | — | | | | | | 12 | | | $ | 139 | |
Shares issued to shareholders in reinvestment of dividends | | | — | | | | — | | | | | | 3,034 | | | | 34,577 | |
Shares redeemed | | | (81,704 | ) | | $ | (905,769 | ) | | | | | (120,443 | ) | | | (1,370,220 | ) |
| | | | | | | | | | | | | | |
Net decrease | | | (81,704 | ) | | $ | (905,769 | ) | | | | | (117,397 | ) | | $ | (1,335,504 | ) |
| | | | | | | | | | | | | | |
| | | | | | | | | | | | | | | | | | |
| Investor C | | | | | | | | | | | | | | | | | | |
Shares sold | | | 371,350 | | | $ | 3,939,892 | | | | | | 1,020,680 | | | $ | 11,650,677 | |
Shares issued to shareholders in reinvestment of dividends | | | 57,114 | | | | 606,463 | | | | | | 57,015 | | | | 649,320 | |
Shares redeemed | | | (731,885 | ) | | | (7,711,140 | ) | | | | | (401,252 | ) | | | (4,571,365 | ) |
| | | | | | | | | | | | | | |
Net increase (decrease) | | | (303,421 | ) | | $ | (3,164,785 | ) | | | | | 676,443 | | | $ | 7,728,632 | |
| | | | | | | | | | | | | | |
| | | | | | | | | | | | | | | | | | |
| Investor C1 | | | | | | | | | | | | | | | | | | |
Shares sold | | | 1,111 | | | $ | 11,629 | | | | | | 33 | | | $ | 375 | |
Shares issued to shareholders in reinvestment of dividends | | | 17,496 | | | | 185,848 | | | | | | 21,025 | | | | 239,512 | |
Shares redeemed | | | (141,321 | ) | | | (1,473,250 | ) | | | | | (120,665 | ) | | | (1,372,551 | ) |
| | | | | | | | | | | | | | |
Net decrease | | | (122,714 | ) | | $ | (1,275,773 | ) | | | | | (99,607 | ) | | $ | (1,132,664 | ) |
| | | | | | | | | | | | | | |
Total Net Increase (Decrease) | | | (2,562,432 | ) | | $ | (26,638,117 | ) | | | | | 2,354,046 | | | $ | 26,865,314 | |
| | | | | | | | | | | | | | |
| | | | | | | | | | | | | | | | | | |
| BlackRock Pennsylvania Municipal Bond Fund | | | | | | | | | | | | | | | | | | |
| Institutional | | | | | | | | | | | | | | |
Shares sold | | | 1,880,083 | | | $ | 20,306,515 | | | | | | 3,950,011 | | | $ | 46,393,090 | |
Shares issued in reinvestment of dividends | | | 166,975 | | | | 1,802,537 | | | | | | 152,874 | | | | 1,792,488 | |
Shares redeemed | | | (8,689,280 | ) | | | (92,961,113 | ) | | | | | (4,390,552 | ) | | | (51,455,720 | ) |
| | | | | | | | | | | | | | |
Net decrease | | | (6,642,222 | ) | | $ | (70,852,061 | ) | | | | | (287,667 | ) | | $ | (3,270,142 | ) |
| | | | | | | | | | | | | | |
| | | | | | | | | | | | | | | | | | |
| Service | | | | | | | | | | | | | | | | | | |
Shares sold | | | 239,457 | | | $ | 2,578,070 | | | | | | 454,305 | | | $ | 5,331,684 | |
Shares issued in reinvestment of dividends | | | 26,132 | | | | 282,273 | | | | | | 19,886 | | | | 233,230 | |
Shares redeemed | | | (294,778 | ) | | | (3,164,022 | ) | | | | | (120,562 | ) | | | (1,416,649 | ) |
| | | | | | | | | | | | | | |
Net increase (decrease) | | | (29,189 | ) | | $ | (303,679 | ) | | | | | 353,629 | | | $ | 4,148,265 | |
| | | | | | | | | | | | | | |
| | | | | | | | | | | | | | | | | | |
| Investor A | | | | | | | | | | | | | | | | | | |
Shares sold | | | 1,373,680 | | | $ | 14,737,209 | | | | | | 2,163,364 | | | $ | 25,410,189 | |
Shares issued in reinvestment of dividends | | | 188,718 | | | | 2,040,540 | | | | | | 160,231 | | | | 1,880,513 | |
Shares redeemed | | | (1,947,891 | ) | | | (20,846,115 | ) | | | | | (635,311 | ) | | | (7,459,020 | ) |
| | | | | | | | | | | | | | |
Net increase (decrease) | | | (385,493 | ) | | $ | (4,068,366 | ) | | | | | 1,688,284 | | | $ | 19,831,682 | |
| | | | | | | | | | | | | | |
| | | | | | | | | | | | | | | | | | |
| Investor A1 | | | | | | | | | | | | | | | | | | |
Shares sold | | | 49,585 | | | $ | 563,518 | | | | | | 86,753 | | | $ | 1,014,993 | |
Shares issued in reinvestment of dividends | | | 37,363 | | | | 404,139 | | | | | | 40,464 | | | | 475,087 | |
Shares redeemed | | | (331,962 | ) | | | (3,568,440 | ) | | | | | (247,668 | ) | | | (2,904,896 | ) |
| | | | | | | | | | | | | | |
Net decrease | | | (245,014 | ) | | $ | (2,600,783 | ) | | | | | (120,451 | ) | | $ | (1,414,816 | ) |
| | | | | | | | | | | | | | |
| | | | | | | | | | | | | | | | | | |
| | | | | | |
| | | | | | | |
| | ANNUAL REPORT | | MAY 31, 2014 | | 67 |
| | |
| Notes to Financial Statements (continued) | | |
| | | | | | | | | | | | | | | | | | |
BlackRock Pennsylvania Municipal Bond Fund (concluded) | | Year Ended
May 31, 2014 | | | | | Year Ended
May 31, 2013 | |
| | Shares | | | Amount | | | | | Shares | | | Amount | |
| Investor B | | | | | | | | | | | | | | |
Shares sold | | | — | | | | — | | | | | | 4,775 | | | $ | 56,728 | |
Shares issued in reinvestment of dividends | | | — | | | | — | | | | | | 357 | | | | 4,187 | |
Shares redeemed and automatic conversion of shares | | | (10,644 | ) | | $ | (121,108 | ) | | | | | (6,910 | ) | | | (81,382 | ) |
| | | | | | | | | | | | | | |
Net decrease | | | (10,644 | ) | | $ | (121,108 | ) | | | | | (1,778 | ) | | $ | (20,467 | ) |
| | | | | | | | | | | | | | |
| | | | | | | | | | | | | | | | | | |
| Investor B1 | | | | | | | | | | | | | | | | | | |
Shares sold | | | — | | | | — | | | | | | — | | | | — | |
Shares issued in reinvestment of dividends | | | — | | | | — | | | | | | 1,931 | | | | 22,630 | |
Shares redeemed | | | (45,807 | ) | | $ | (521,315 | ) | | | | | (113,682 | ) | | $ | (1,329,239 | ) |
| | | | | | | | | | | | | | |
Net decrease | | | (45,807 | ) | | $ | (521,315 | ) | | | | | (111,751 | ) | | $ | (1,306,609 | ) |
| | | | | | | | | | | | | | |
| | | | | | | | | | | | | | | | | | |
| Investor C | | | | | | | | | | | | | | | | | | |
Shares sold | | | 322,578 | | | $ | 3,505,852 | | | | | | 960,965 | | | $ | 11,300,415 | |
Shares issued in reinvestment of dividends | | | 65,760 | | | | 710,204 | | | | | | 67,798 | | | | 795,498 | |
Shares redeemed | | | (1,026,852 | ) | | | (10,993,211 | ) | | | | | (323,167 | ) | | | (3,793,772 | ) |
| | | | | | | | | | |
Net increase (decrease) | | | (638,514 | ) | | $ | (6,777,155 | ) | | | | | 705,596 | | | $ | 8,302,141 | |
| | | | | | | | | | |
| | | | | | | | | | | | | | | | | | |
| Investor C1 | | | | | | | | | | | | | | | | | | |
Shares sold | | | 955 | | | $ | 10,170 | | | | | | 2 | | | $ | 24 | |
Shares issued in reinvestment of dividends | | | 13,589 | | | | 146,697 | | | | | | 16,628 | | | | 194,964 | |
Shares redeemed | | | (167,753 | ) | | | (1,802,262 | ) | | | | | (65,222 | ) | | | (764,915 | ) |
| | | | | | | | | | |
Net decrease | | | (153,209 | ) | | $ | (1,645,395 | ) | | | | | (48,592 | ) | | $ | (569,927 | ) |
| | | | | | | | | | |
| Total Net Increase (Decrease) | | | (8,150,092 | ) | | $ | (86,889,862 | ) | | | | | 2,177,270 | | | $ | 25,700,127 | |
| | | | | | | | | | |
| | | | | | | | | | | | | | | | | | |
| BlackRock Strategic Municipal Opportunities Fund | | | | | | | | | | | | | | | | | | |
| Institutional | | | | | | | | | | | | | | | | | | |
Shares sold | | | 74,244,925 | | | $ | 830,142,254 | | | | | | 25,825,649 | | | $ | 298,110,756 | |
Shares issued in reinvestment of dividends | | | 840,070 | | | | 9,251,386 | | | | | | 596,496 | | | | 6,880,398 | |
Shares redeemed | | | (28,328,093 | ) | | | (309,223,607 | ) | | | | | (11,733,089 | ) | | | (135,539,292 | ) |
| | | | | | | | | | |
Net increase | | | 46,756,902 | | | $ | 530,170,033 | | | | | | 14,689,056 | | | $ | 169,451,862 | |
| | | | | | | | | | |
| | | | | | | | | | | | | | | | | | |
| Investor A | | | | | | | | | | | | | | | | | | |
Shares sold | | | 15,812,719 | | | $ | 175,930,126 | | | | | | 13,975,538 | | | $ | 161,392,666 | |
Shares issued in reinvestment of dividends | | | 559,069 | | | | 6,130,474 | | | | | | 466,507 | | | | 5,376,675 | |
Shares redeemed | | | (12,295,974 | ) | | | (134,512,814 | ) | | | | | (5,827,011 | ) | | | (67,449,800 | ) |
| | | | | | | | | | |
Net increase | | | 4,075,814 | | | $ | 47,547,786 | | | | | | 8,615,034 | | | $ | 99,319,541 | |
| | | | | | | | | | |
| | | | | | | | | | | | | | | | | | |
| Investor A1 | | | | | | | | | | | | | | | | | | |
Shares sold | | | 87,378 | | | $ | 987,696 | | | | | | 85,003 | | | $ | 980,103 | |
Shares issued in reinvestment of dividends | | | 86,140 | | | | 943,848 | | | | | | 90,365 | | | | 1,041,226 | |
Shares redeemed | | | (718,764 | ) | | | (7,895,979 | ) | | | | | (359,759 | ) | | | (4,157,601 | ) |
| | | | | | | | | | |
Net decrease | | | (545,246 | ) | | $ | (5,964,435 | ) | | | | | (184,391 | ) | | $ | (2,136,272 | ) |
| | | | | | | | | | |
| | | | | | | | | | | | | | | | | | |
| Investor B | | | | | | | | | | | | | | | | | | |
Shares sold | | | — | | | | — | | | | | | 14,643 | | | $ | 169,759 | |
Shares issued in reinvestment of dividends | | | — | | | | — | | | | | | 1,747 | | | | 20,127 | |
Shares redeemed and automatic conversion of shares | | | (71,299 | ) | | $ | (807,109 | ) | | | | | (85,173 | ) | | | (981,687 | ) |
| | | | | | | | | | |
Net decrease | | | (71,299 | ) | | $ | (807,109 | ) | | | | | (68,783 | ) | | $ | (791,801 | ) |
| | | | | | | | | | |
| | | | | | |
| | | | | | | |
| 68 | | ANNUAL REPORT | | MAY 31, 2014 | | |
| | | | |
| Notes to Financial Statements (concluded) | | |
| | | | | | | | | | | | | | | | | | |
BlackRock Strategic Municipal Opportunities Fund (concluded) | | Year Ended
May 31, 2014 | | | | | Year Ended
May 31, 2013 | |
| | Shares | | | Amount | | | | | Shares | | | Amount | |
| Investor C | | | | | | | | | | | | | | |
Shares sold | | | 3,847,916 | | | $ | 42,684,444 | | | | | | 6,149,451 | | | $ | 70,962,740 | |
Shares issued in reinvestment of dividends | | | 221,993 | | | | 2,430,881 | | | | | | 207,811 | | | | 2,394,958 | |
Shares redeemed | | | (5,308,870 | ) | | | (58,064,794 | ) | | | | | (1,733,930 | ) | | | (20,039,069 | ) |
| | | | | | | | | | | | | | |
Net increase (decrease) | | | (1,238,961 | ) | | $ | (12,949,469 | ) | | | | | 4,623,332 | | | $ | 53,318,629 | |
| | | | | | | | | | | | | | |
Total Net Increase | | | 48,977,210 | | | $ | 557,996,806 | | | | | | 27,674,248 | | | $ | 319,161,959 | |
| | | | | | | | | | | | | | |
11. Subsequent Events:
Management’s evaluation of the impact of all subsequent events on the Funds’ financial statements was completed through the date the financial statements were issued and has determined that there were no subsequent events requiring adjustment or additional disclosure in the financial statements.
| | | | | | |
| | | | | | | |
| | ANNUAL REPORT | | MAY 31, 2014 | | 69 |
| | | | |
| Report of Independent Registered Public Accounting Firm | | |
To the Shareholders of BlackRock California Municipal Bond Fund, BlackRock New Jersey Municipal Bond Fund, BlackRock Pennsylvania Municipal Bond Fund and BlackRock Strategic Municipal Opportunities Fund and the Board of Trustees of BlackRock California Municipal Series Trust, BlackRock Multi-State Municipal Series Trust and BlackRock Municipal Series Trust:
We have audited the accompanying statements of assets and liabilities, including the schedules of investments, of BlackRock California Municipal Bond Fund of BlackRock California Municipal Series Trust, BlackRock New Jersey Municipal Bond Fund and BlackRock Pennsylvania Municipal Bond Fund, two of the portfolios constituting BlackRock Multi-State Municipal Series Trust, and BlackRock Strategic Municipal Opportunities Fund (formerly BlackRock Intermediate Municipal Fund) of BlackRock Municipal Series Trust (collectively, the “Funds”), as of May 31, 2014, and the related statements of operations for the year then ended, the statements of changes in net assets for each of the two years in the period then ended, the statements of cash flows for the year then ended for BlackRock California Municipal Bond Fund and BlackRock Pennsylvania Municipal Bond Fund, and the financial highlights for each of the five years in the period then ended. These financial statements and financial highlights are the responsibility of the Funds’ management. Our responsibility is to express an opinion on these financial statements and financial highlights based on our audits.
We conducted our audits in accordance with the standards of the Public Company Accounting Oversight Board (United States). Those standards require that we plan and perform the audit to obtain reasonable assurance about whether the financial statements and financial highlights are free of material misstatement. The Funds are not required to have, nor were we engaged to perform, an audit of their internal control over financial reporting. Our audits included consideration of internal control over financial reporting as a basis for designing audit procedures that are appropriate in the circumstances, but not for the purpose of expressing an opinion on the effectiveness of the Funds’ internal control over financial reporting. Accordingly, we express no such opinion. An audit also includes examining, on a test basis, evidence supporting the amounts and disclosures in the financial statements, assessing the accounting principles used and significant estimates made by management, as well as evaluating the overall financial statement presentation. Our procedures included confirmation of securities owned as of May 31, 2014, by correspondence with the custodians and brokers; where replies were not received from brokers, we performed other auditing procedures. We believe that our audits provide a reasonable basis for our opinion.
In our opinion, the financial statements and financial highlights referred to above present fairly, in all material respects, the financial positions of BlackRock California Municipal Bond Fund, BlackRock New Jersey Municipal Bond Fund, BlackRock Pennsylvania Municipal Bond Fund, and BlackRock Strategic Municipal Opportunities Fund, as of May 31, 2014, the results of their operations for the year then ended, the changes in their net assets for each of the two years in the period then ended, the cash flows for the year then ended for BlackRock California Municipal Bond Fund and BlackRock Pennsylvania Municipal Bond Fund, and the financial highlights for each of the five years in the period then ended, in conformity with accounting principles generally accepted in the United States of America.
Deloitte & Touche LLP
Boston, Massachusetts
July 25, 2014
| | | | | | |
| | | | | | | |
| 70 | | ANNUAL REPORT | | MAY 31, 2014 | | |
| | |
| Disclosure of Investment Advisory Agreements |
The Board of Trustees of BlackRock California Municipal Series Trust (the “California Municipal Series Trust”), BlackRock Multi-State Municipal Series Trust (the “Multi-State Municipal Series Trust”) and BlackRock Municipal Series Trust (the “Municipal Series Trust,” along with the California Municipal Series Trust and the Multi-State Municipal Series Trust, each, a “Trust”), met in person on April 8, 2014 (the “April Meeting”) and May 13-14, 2014 (the “May Meeting”) to consider the approval of the investment advisory agreements (collectively, the “Advisory Agreements” or the “Agreements”) between the California Municipal Series Trust, on behalf of its series BlackRock California Municipal Bond Fund (the “California Municipal Bond Fund”), the Multi-State Municipal Series Trust, on behalf of its series BlackRock New Jersey Municipal Bond Fund (the “New Jersey Municipal Bond Fund”) and BlackRock Pennsylvania Municipal Bond Fund (the “Pennsylvania Municipal Bond Fund”), and the Municipal Series Trust, on behalf of its series BlackRock Strategic Municipal Opportunities Fund (the “Strategic Municipal Opportunities Fund,” collectively with the California Municipal Bond Fund, the New Jersey Municipal Bond Fund and the Pennsylvania Municipal Bond Fund, the “Funds” and each, a “Fund”), respectively, and BlackRock Advisors, LLC (the “Manager” or “BlackRock”), each Fund’s investment advisor. At the May Meeting, it was noted that the sub-advisory agreements (collectively, the “Sub-Advisory Agreements”) between the Manager and BlackRock Investment Management, LLC, with respect to the Funds, would expire effective July 1, 2014. It was also noted that the non-renewal of the Sub-Advisory Agreements would not result in any change in the nature or quality of services provided to the Funds, or in the portfolio management team that serves each Fund. For simplicity: (a) the Board of Trustees of the Trusts are referred to herein collectively as the “Board,” and the members are referred to as “Board Members;” and (b) the shareholders of Funds are referred to herein collectively as “shareholders.”
Activities and Composition of the Board
The Board consists of thirteen individuals, ten of whom are not “interested persons” of any Trust as defined in the Investment Company Act of 1940, as amended (the “1940 Act”) (the “Independent Board Members”). The Board Members are responsible for the oversight of the operations of each Fund and perform the various duties imposed on the directors of investment companies by the 1940 Act. The Independent Board Members have retained independent legal counsel to assist them in connection with their duties. The Chairman of the Board is an Independent Board Member. The Board has established five standing committees: an Audit Committee, a Governance and Nominating Committee, a Compliance Committee, a Performance Oversight Committee and an Executive Committee, each of which is chaired by an Independent Board Member and composed of Independent Board Members (except for the Performance Oversight Committee and the Executive Committee, each of which also has one interested Board Member).
The Agreements
Pursuant to the 1940 Act, the Board is required to consider the continuation of the Agreements on an annual basis. The Board has four quarterly meetings per year, each extending over two days, and a fifth one-day meeting to consider specific information surrounding the consideration of renewing the Agreements. In connection with this process, the Board assessed, among other things, the nature, scope and quality of the services provided to each Fund by BlackRock, its personnel and its affiliates, including (as applicable) investment management; administrative and shareholder services; oversight of fund service providers; marketing services; risk oversight; compliance and assistance in meeting applicable legal and regulatory requirements.
The Board, acting directly and through its committees, considers at each of its meetings, and from time to time as appropriate, factors that are relevant to its annual consideration of the renewal of the Agreements, including the services and support provided by BlackRock to each Fund and its shareholders. Among the matters the Board considered were: (a) investment performance for one-year, three-year, five-year and/or since inception periods, as applicable, against peer funds, and applicable benchmarks, if any, as well as senior management’s and portfolio managers’ analysis of the reasons for any over-performance or underperformance against its peers and/or benchmark, as applicable; (b) fees, including advisory, administration, if applicable, and other amounts paid to BlackRock and its affiliates by each Fund for services, such as marketing and distribution, call center and fund accounting; (c) Fund operating expenses and how BlackRock allocates expenses to each Fund; (d) the resources devoted to, risk oversight of, and compliance reports relating to, implementation of each Fund’s investment objective, policies and restrictions, and meeting new regulatory requirements; (e) each Fund’s compliance with its Code of Ethics and other compliance policies and procedures; (f) the nature, cost and character of non-investment management services provided by BlackRock and its affiliates; (g) BlackRock’s and other service providers’ internal controls and risk and compliance oversight mechanisms; (h) BlackRock’s implementation of the proxy voting policies approved by the Board; (i) execution quality of portfolio transactions; (j) BlackRock’s implementation of each Fund’s valuation and liquidity procedures; (k) an analysis of management fees for products with similar investment objectives across the open-end fund, exchange-traded fund (“ETF”), closed-end fund and institutional account product channels, as applicable, and the similarities and differences between the services provided to these products as compared to each Fund; (l) BlackRock’s compensation methodology for its investment professionals and the incentives it creates; and (m) periodic updates on BlackRock’s business.
The Board has engaged in an ongoing strategic review with BlackRock of opportunities to consolidate funds and of BlackRock’s commitment to investment performance. BlackRock also furnished information to the Board in response to specific questions. These questions covered issues such as: BlackRock’s profitability; investment performance; subadvisory and advisory relationships with other clients (including mutual funds sponsored by third parties); the viability of specific funds; manager capacity and the potential for closing certain funds to new investments; portfolio managers’ investments in funds they manage; supplemental service agreements with third party distribution partners; and management fee levels and breakpoints. The Board further discussed with BlackRock: BlackRock’s management structure; portfolio turnover, execution quality and use of soft dollars; BlackRock’s portfolio manager compensation and performance accountability; marketing support for the funds;
| | | | | | |
| | | | | | | |
| | ANNUAL REPORT | | MAY 31, 2014 | | 71 |
| | |
| Disclosure of Investment Advisory Agreements (continued) |
services provided to the funds by BlackRock affiliates; and BlackRock’s oversight of relationships with third party service providers.
Board Considerations in Approving the Agreements
The Approval Process: Prior to the April Meeting, the Board requested and received materials specifically relating to the Agreements. The Board is continuously engaged in a process with its independent legal counsel and BlackRock to review the nature and scope of the information provided to better assist its deliberations. The materials provided in connection with the April Meeting included (a) information independently compiled and prepared by Lipper, Inc. (“Lipper”) on Fund fees and expenses as compared with a peer group of funds as determined by Lipper (“Expense Peers”) and the investment performance of each Fund as compared with a peer group of funds as determined by Lipper1 and, for the Strategic Municipal Opportunities Fund, a customized peer group selected by BlackRock; (b) information on the profits realized by BlackRock and its affiliates pursuant to the Agreements and a discussion of fall-out benefits to BlackRock and its affiliates; (c) a general analysis provided by BlackRock concerning investment management fees charged to other clients, such as institutional clients, ETFs and closed-end funds, under similar investment mandates, as well as the performance of such other clients, as applicable; (d) review of non-management fees; (e) the existence, impact and sharing of potential economies of scale; (f) a summary of aggregate amounts paid by each Fund to BlackRock; (g) sales and redemption data regarding each Fund’s shares; and (h) if applicable, a comparison of management fees to similar BlackRock open-end funds, as classified by Lipper.
At the April Meeting, the Board reviewed materials relating to its consideration of the Agreements. As a result of the discussions that occurred during the April Meeting, and as a culmination of the Board’s year-long deliberative process, the Board presented BlackRock with questions and requests for additional information. BlackRock responded to these requests with additional written information in advance of the May Meeting.
At the May Meeting, the Board, including the Independent Board Members, approved the continuation of each of the Advisory Agreements between the Manager and each Trust, on behalf of its respective Fund(s) for a one-year term ending June 30, 2015. In approving the continuation of the Agreements, the Board considered: (a) the nature, extent and quality of the services provided by BlackRock; (b) the investment performance of each Fund and BlackRock; (c) the advisory fee and the cost of the services and profits to be realized by BlackRock and its affiliates from their relationship with each Fund; (d) each Fund’s costs to investors compared to the costs of Expense Peers and performance compared to the relevant performance comparison as previously discussed; (e) economies of scale; (f) fall-out benefits to BlackRock and its affiliates as a result of its relationship with each Fund; and (g) other factors deemed relevant by the Board Members.
The Board also considered other matters it deemed important to the approval process, such as payments made to BlackRock or its affiliates relating to the distribution of Fund shares and securities lending, services related to the valuation and pricing of Fund portfolio holdings, direct and indirect benefits to BlackRock and its affiliates from their relationship with each Fund and advice from independent legal counsel with respect to the review process and materials submitted for the Board’s review. The Board noted the willingness of BlackRock personnel to engage in open, candid discussions with the Board. The Board did not identify any particular information as determinative, and each Board Member may have attributed different weights to the various items considered.
A. Nature, Extent and Quality of the Services Provided by BlackRock: The Board, including the Independent Board Members, reviewed the nature, extent and quality of services provided by BlackRock, including the investment advisory services and the resulting performance of each Fund. Throughout the year, the Board compared Fund performance to the performance of a comparable group of mutual funds and/or the performance of a relevant benchmark, as applicable. The Board met with BlackRock’s senior management personnel responsible for investment activities, including the senior investment officers. The Board also reviewed the materials provided by each Fund’s portfolio management team discussing the Fund’s performance and the Fund’s investment objective, strategies and outlook.
The Board considered, among other factors, with respect to BlackRock: the number, education and experience of investment personnel generally and each Fund’s portfolio management team; investments by portfolio managers in the funds they manage; portfolio trading capabilities; use of technology; commitment to compliance; credit analysis capabilities; risk analysis and oversight capabilities; and the approach to training and retaining portfolio managers and other research, advisory and management personnel. The Board engaged in a review of BlackRock’s compensation structure with respect to each Fund’s portfolio management team and BlackRock’s ability to attract and retain high-quality talent and create performance incentives.
In addition to advisory services, the Board considered the quality of the administrative and other non-investment advisory services provided to each Fund. BlackRock and its affiliates provide each Fund with certain administrative, shareholder and other services (in addition to any such services provided to each Fund by third parties) and officers and other personnel as are necessary for the operations of the Fund. In particular, BlackRock and its affiliates provide each Fund with the following administrative services including, among others: (i) preparing disclosure documents, such as the prospectus, the summary prospectus (as applicable), the statement of additional information and periodic shareholder reports; (ii) oversight of daily accounting and pricing; (iii) overseeing and coordinating the activities of other service providers; (iv) organizing Board meetings and preparing the materials for such Board meetings; (v) providing legal and compliance support; (vi) furnishing analytical and other support to assist the Board in its consideration of strategic issues such as the merger or consolidation of certain open-end funds; and (vii) performing other administrative functions necessary for the operation of each Fund, such as tax reporting, fulfilling regulatory filing requirements and call center services. The Board reviewed the structure and duties of BlackRock’s fund administration, shareholder services, legal
| | 1 | | Funds are ranked by Lipper in quartiles, ranging from first to fourth, where first is the most desirable quartile position and fourth is the least desirable. |
| | | | | | |
| | | | | | | |
| 72 | | ANNUAL REPORT | | MAY 31, 2014 | | |
| | |
| Disclosure of Investment Advisory Agreements (continued) |
and compliance departments and considered BlackRock’s policies and procedures for assuring compliance with applicable laws and regulations.
B. The Investment Performance of each Fund and BlackRock: The Board, including the Independent Board Members, also reviewed and considered the performance history of each Fund. In preparation for the April Meeting, the Board worked with its independent legal counsel, BlackRock and Lipper to develop a template for, and was provided with, reports independently prepared by Lipper, which included a comprehensive analysis of each Fund’s performance. The Board also reviewed a narrative and statistical analysis of the Lipper data that was prepared by BlackRock, which analyzed various factors that affect Lipper’s rankings. In connection with its review, the Board received and reviewed information regarding the investment performance of each Fund as compared to other funds in its applicable Lipper category and, for the Strategic Municipal Opportunities Fund, a customized peer group selected by BlackRock. The Board was provided with a description of the methodology used by Lipper to select peer funds and periodically meets with Lipper representatives to review its methodology. The Board and its Performance Oversight Committee regularly review, and meet with Fund management to discuss, the performance of each Fund throughout the year.
The Board noted that for the one-, three- and five-year periods reported, the California Municipal Bond Fund ranked in the fourth, third and fourth quartiles, respectively, against its Lipper Performance Universe Composite. BlackRock believes that the Lipper Performance Universe Composite is an appropriate performance metric for the California Municipal Bond Fund in that it measures a blend of total return and yield. The Board and BlackRock reviewed and discussed the reasons for the California Municipal Bond Fund’s underperformance during these periods. The Board was informed that, among other things, underperformance stems predominantly from an above market average duration posture. The negative price performance of local school districts was also a negative contributing factor to performance with the California Municipal Bond Fund being overweight in this sector.
The Board and BlackRock also discussed BlackRock’s strategy for improving the California Municipal Bond Fund’s performance and BlackRock’s commitment to providing the resources necessary to assist the California Municipal Bond Fund’s portfolio managers in seeking to improve the California Municipal Bond Fund’s performance.
The Board noted that for the one-, three- and five-year periods reported, the New Jersey Municipal Bond Fund ranked in the second, first and second quartiles, respectively, against its Lipper Performance Universe Composite. BlackRock believes that the Lipper Performance Universe Composite is an appropriate performance metric for the New Jersey Municipal Bond Fund in that it measures a blend of total return and yield.
The Board noted that for the one-, three- and five-year periods reported, the Pennsylvania Municipal Bond Fund ranked in the second, first and first quartiles, respectively, against its Lipper Performance Universe Composite. BlackRock believes that the Lipper Performance Universe Composite is an appropriate performance metric for the Pennsylvania Municipal Bond Fund in that it measures a blend of total return and yield.
The Board noted that for the one-, three- and five-year periods reported, the Strategic Municipal Opportunities Fund ranked in the third, first and first quartiles, respectively, against its Customized Lipper Peer Group Composite. BlackRock believes that the Customized Lipper Peer Group Composite is an appropriate performance metric for the Strategic Municipal Opportunities Fund in that it measures a blend of total return and yield. The Board and BlackRock reviewed and discussed the reasons for the Strategic Municipal Opportunities Fund’s underperformance during the one-year period and noted that they will monitor the Strategic Municipal Opportunities Fund’s performance. The Board noted that effective January 27, 2014, the Strategic Municipal Opportunities Fund had undergone a change in its investment strategy, and in that connection had changed its name from BlackRock Intermediate Municipal Fund.
C. Consideration of the Advisory/Management Fees and the Cost of the Services and Profits to be Realized by BlackRock and its Affiliates from their Relationship with each Fund: The Board, including the Independent Board Members, reviewed each Fund’s contractual management fee rate compared with the other funds in its Lipper category. The contractual management fee rate represents a combination of the advisory fee and any administrative fees, before taking into account any reimbursements or fee waivers. The Board also compared each Fund’s total expense ratio, as well as its actual management fee rate, to those of other funds in its Lipper category. The total expense ratio represents a fund’s total net operating expenses, including any 12b-1 or non 12b-1 service fees. The total expense ratio gives effect to any expense reimbursements or fee waivers that benefit a fund, and the actual management fee rate gives effect to any management fee reimbursements or waivers that benefit a fund. The Board considered the services provided and the fees charged by BlackRock and its affiliates to other types of clients with similar investment mandates, as applicable, including institutional accounts.
The Board received and reviewed statements relating to BlackRock’s financial condition. The Board was also provided with a profitability analysis that detailed the revenues earned and the expenses incurred by BlackRock for services provided to each Fund. The Board reviewed BlackRock’s profitability with respect to each Fund and other funds the Board currently oversees for the year ended December 31, 2013 compared to available aggregate profitability data provided for the two prior years. The Board reviewed BlackRock’s profitability with respect to certain other fund complexes managed by the Manager and/or its affiliates. The Board reviewed BlackRock’s assumptions and methodology of allocating expenses in the profitability analysis, noting the inherent limitations in allocating costs among various advisory products. The Board recognized that profitability may be affected by numerous factors including, among other things, fee waivers and expense reimbursements by the Manager, the types of funds managed, precision of expense allocations and business mix. As a result, calculating and comparing profitability at individual fund levels is difficult.
The Board noted that, in general, individual fund or product line profitability of other advisors is not publicly available. The Board reviewed BlackRock’s overall operating margin, in general, compared to that of certain other publicly-traded asset management firms. The Board considered the differences between BlackRock and these other firms, including
| | | | | | |
| | | | | | | |
| | ANNUAL REPORT | | MAY 31, 2014 | | 73 |
| | |
| Disclosure of Investment Advisory Agreements (continued) |
the contribution of technology at BlackRock, BlackRock’s expense management, and the relative product mix.
In addition, the Board considered the cost of the services provided to each Fund by BlackRock, and BlackRock’s and its affiliates’ profits relating to the management and distribution of each Fund and the other funds advised by BlackRock and its affiliates. As part of its analysis, the Board reviewed BlackRock’s methodology in allocating its costs to the management of each Fund. The Board also considered whether BlackRock has the financial resources necessary to attract and retain high quality investment management personnel to perform its obligations under the Agreements and to continue to provide the high quality of services that is expected by the Board. The Board further considered factors including but not limited to BlackRock’s commitment of time, assumption of risk and liability profile in servicing the Fund in contrast to what is required of BlackRock with respect to other products with similar investment objectives across the open-end fund, ETF, closed-end fund and institutional account product channels, as applicable.
The Board noted that the California Municipal Bond Fund’s contractual management fee rate ranked in the fourth quartile, and that the actual management fee rate and total expense ratio each ranked in the fourth quartile, relative to the California Municipal Bond Fund’s Expense Peers. The Board also noted that the California Municipal Bond Fund has an advisory fee arrangement that includes breakpoints that adjust the fee rate downward as the size of the California Municipal Bond Fund increases above certain contractually specified levels. After discussion between the Board, including the Independent Board Members, and BlackRock, the Board and BlackRock contractually agreed to a cap on the California Municipal Bond Fund’s total expenses as a percentage of the California Municipal Bond Fund’s average daily net assets on a class-by-class basis, as applicable. These reductions, which may result in savings to shareholders, are effective on June 1, 2014.
The Board noted that the New Jersey Municipal Bond Fund’s contractual management fee rate ranked in the third quartile, and that the actual management fee rate and total expense ratio each ranked in the fourth quartile, relative to the New Jersey Municipal Bond Fund’s Expense Peers. The Board determined that the New Jersey Municipal Bond Fund’s actual management fee rate was appropriate in light of the median actual management fee rate paid by the New Jersey Municipal Bond Fund’s Expense Peers. The Board also noted that the New Jersey Municipal Bond Fund has an advisory fee arrangement that includes breakpoints that adjust the fee rate downward as the size of the New Jersey Municipal Bond Fund increases above certain contractually specified levels. The Board further noted that BlackRock has voluntarily agreed to a cap on the New Jersey Municipal Bond Fund’s total expenses as a percentage of the New Jersey Municipal Bond Fund’s average daily net assets on a class-by-class basis. The Board noted that the voluntary cap is scheduled to convert to a contractual cap. In addition, after discussion between the Board, including the Independent Board Members, and BlackRock, the Board and BlackRock contractually agreed to a cap to further limit the New Jersey Municipal Bond Fund’s total expenses as a percentage of the New Jersey Municipal Bond Fund’s average daily net assets on a class-by-class basis, as applicable. These reductions, which may result in savings to shareholders, are effective on June 1, 2014.
The Board noted that the Pennsylvania Municipal Bond Fund’s contractual management fee rate ranked in the third quartile, and that the actual management fee rate and total expense ratio ranked in the fourth and third quartiles, respectively, relative to the Pennsylvania Municipal Bond Fund’s Expense Peers. The Board also noted that the Pennsylvania Municipal Bond Fund has an advisory fee arrangement that includes breakpoints that adjust the fee rate downward as the size of the Pennsylvania Municipal Bond Fund increases above certain contractually specified levels. The Board further noted that BlackRock has voluntarily agreed to a cap on the Pennsylvania Municipal Bond Fund’s total expenses as a percentage of the Pennsylvania Municipal Bond Fund’s average daily net assets on a class-by-class basis. The Board noted that the voluntary cap is scheduled to convert to a contractual cap.
The Board noted that the Strategic Municipal Opportunities Fund’s contractual management fee rate ranked in the fourth quartile, and that the actual management fee rate and total expense ratio each ranked in the fourth quartile, relative to the Strategic Municipal Opportunities Fund’s Expense Peers. The Board determined that the Strategic Municipal Opportunities Fund’s total expense ratio was appropriate in light of the median total expense ratio paid by the Strategic Municipal Opportunities Fund’s Expense Peers. The Board further noted that the Strategic Municipal Opportunities Fund has an advisory fee arrangement that includes breakpoints that adjust the fee rate downward as the size of the Strategic Municipal Opportunities Fund increases above certain contractually specified levels. Additionally, the Board noted that BlackRock has contractually agreed to waive a portion of the advisory fee for the Strategic Municipal Opportunities Fund.
D. Economies of Scale: The Board, including the Independent Board Members, considered the extent to which economies of scale might be realized as the assets of each Fund increase, as well as the existence of expense caps, as applicable. The Board also considered the extent to which each Fund benefits from such economies and whether there should be changes in the advisory fee rate or breakpoint structure in order to enable each Fund to participate in these economies of scale, for example through the use of revised breakpoints in the advisory fee based upon the asset level of the Fund. In its consideration, the Board Members took into account the existence of any expense caps and further considered the continuation and/or implementation, as applicable, of such caps.
E. Other Factors Deemed Relevant by the Board Members: The Board, including the Independent Board Members, also took into account other ancillary or “fall-out” benefits that BlackRock or its affiliates may derive from their respective relationships with each Fund, both tangible and intangible, such as BlackRock’s ability to leverage its investment professionals who manage other portfolios and risk management personnel, an increase in BlackRock’s profile in the investment advisory community, and the engagement of BlackRock’s affiliates as service providers to each Fund, including for administrative, distribution, securities lending and cash management services. The Board also considered BlackRock’s overall operations and its efforts to expand the scale of, and improve the
| | | | | | |
| | | | | | | |
| 74 | | ANNUAL REPORT | | MAY 31, 2014 | | |
| | |
| Disclosure of Investment Advisory Agreements (concluded) |
quality of, its operations. The Board also noted that BlackRock may use and benefit from third party research obtained by soft dollars generated by certain registered fund transactions to assist in managing all or a number of its other client accounts. The Board further noted that it had considered the investment by BlackRock’s funds in ETFs without any offset against the management fees payable by the funds to BlackRock.
In connection with its consideration of the Agreements, the Board also received information regarding BlackRock’s brokerage and soft dollar practices. The Board received reports from BlackRock which included information on brokerage commissions and trade execution practices throughout the year.
The Board noted the competitive nature of the open-end fund marketplace, and that shareholders are able to redeem their Fund shares if they believe that each Fund’s fees and expenses are too high or if they are dissatisfied with the performance of the Fund.
Conclusion
The Board, including the Independent Board Members, approved the continuation of the Advisory Agreements between the Manager and each Trust, on behalf of its respective Fund(s), for a one-year term ending June 30, 2015. Based upon its evaluation of all of the aforementioned factors in their totality, the Board, including the Independent Board Members, was satisfied that the terms of the Agreements were fair and reasonable and in the best interest of each Fund and its shareholders. In arriving at its decision to approve the Agreements, the Board did not identify any single factor or group of factors as all-important or controlling, but considered all factors together, and different Board Members may have attributed different weights to the various factors considered. The Independent Board Members were also assisted by the advice of independent legal counsel in making this determination. The contractual fee arrangements for each Fund reflect the results of several years of review by the Board Members and predecessor Board Members, and discussions between such Board Members (and predecessor Board Members) and BlackRock. As a result, the Board Members’ conclusions may be based in part on their consideration of these arrangements in prior years.
| | | | | | |
| | | | | | | |
| | ANNUAL REPORT | | MAY 31, 2014 | | 75 |
| | | | | | | | | | |
Name, Address
and Year of Birth | | Position(s)
Held with
Trusts | | Length
of Time
Served as
a Trustee2 | | Principal Occupation(s) During Past Five Years | | Number of BlackRock-
Advised Registered
Investment Companies
(“RICs”) Consisting of
Investment Portfolios
(“Portfolios”) Overseen | | Public
Directorships |
| Independent Trustees1 | | | | | | | | |
Robert M. Hernandez 55 East 52nd Street New York, NY 10055 1944 | | Chairman of the Board and Trustee | | Since 2007 | | Director, Vice Chairman and Chief Financial Officer of USX Corporation (energy and steel business) from 1991 to 2001; Director, TE Connectivity (electronics) from 2006 to 2012. | | 29 RICs consisting of 96 Portfolios | | ACE Limited (insurance company); Eastman Chemical Company; RTI International Metals, Inc. (metals) |
Fred G. Weiss 55 East 52nd Street New York, NY 10055 1941 | | Vice Chairman of the Board and Trustee | | Since 2007 | | Managing Director, FGW Associates (consulting and investment company) since 1997; Director and Treasurer, Michael J. Fox Foundation for Parkinson’s Research since 2000; Director, BTG International Plc (medical technology commercialization company) from 2001 to 2007. | | 29 RICs consisting of 96 Portfolios | | Actavis plc (pharmaceuticals) |
James H. Bodurtha 55 East 52nd Street New York, NY 10055 1944 | | Trustee | | Since 1995 | | Director, The China Business Group, Inc. (consulting and investing firm) from 1996 to 2013 and Executive Vice President thereof from 1996 to 2003; Chairman of the Board, Berkshire Holding Corporation since 1980. | | 29 RICs consisting of 96 Portfolios | | None |
Bruce R. Bond 55 East 52nd Street New York, NY 10055 1946 | | Trustee | | Since 2007 | | Trustee and Member of the Governance Committee, State Street Research Mutual Funds from 1997 to 2005; Board Member of Governance, Audit and Finance Committee, Avaya Inc. (computer equipment) from 2003 to 2007. | | 29 RICs consisting of 96 Portfolios | | None |
Donald W. Burton 55 East 52nd Street New York, NY 10055 1944 | | Trustee | | Since 2007 | | Managing General Partner, The Burton Partnership, LP (an investment partnership) since 1979; Managing General Partner, The South Atlantic Venture Funds from 1983 to 2012; Director, IDology, Inc. (technology solutions) since 2006; Director, Knology, Inc. (telecommunications) from 1996 to 2012; Director, Capital Southwest from 2006 to 2012. | | 29 RICs consisting of 96 Portfolios | | None |
Honorable Stuart E. Eizenstat 55 East 52nd Street New York, NY 10055 1943 | | Trustee | | Since 2007 | | Partner and Head of International Practice, Covington and Burling LLP (law firm) since 2001; International Advisory Board Member, The Coca-Cola Company from 2002 to 2011; Advisory Board Member, Veracity Worldwide, LLC (risk management) from 2007 to 2012; Member of the International Advisory Board GML Ltd. (energy) since 2003; Advisory Board Member, BT Americas (telecommunications) from 2004 to 2009. | | 29 RICs consisting of 96 Portfolios | | Alcatel-Lucent (telecommunications); Global Specialty Metallurgical; UPS Corporation (delivery service) |
Kenneth A. Froot 55 East 52nd Street New York, NY 10055 1957 | | Trustee | | Since 2005 | | Professor, Harvard University since 1992. | | 29 RICs consisting of 96 Portfolios | | None |
John F. O’Brien 55 East 52nd Street New York, NY 10055 1943 | | Trustee | | Since 2007 | | Chairman, Woods Hole Oceanographic Institute since 2009 and Trustee thereof from 2003 to 2009; Director, Ameresco, Inc. (energy solutions company) from 2006 to 2007. | | 29 RICs consisting of 96 Portfolios | | Cabot Corporation (chemicals); LKQ Corporation (auto parts manufacturing); TJX Companies, Inc. (retailer) |
Roberta Cooper Ramo 55 East 52nd Street New York, NY 10055 1942 | | Trustee | | Since 2000 | | Shareholder and Attorney, Modrall, Sperling, Roehl, Harris & Sisk, P.A. (law firm) since 1993; Chairman of the Board, Cooper’s Inc. (retail) since 1999; Director, ECMC Group (service provider to students, schools and lenders) since 2001; President, The American Law Institute (non-profit) since 2008. | | 29 RICs consisting of 96 Portfolios | | None |
| | | | | | |
| | | | | | | |
| 76 | | ANNUAL REPORT | | MAY 31, 2014 | | |
| | |
| Officers and Trustees (continued) | | |
| | | | | | | | | | |
Name, Address
and Year of Birth | | Position(s)
Held with
Trusts | | Length
of Time
Served as
a Trustee2 | | Principal Occupation(s) During Past Five Years | | Number of BlackRock-
Advised Registered
Investment Companies
(“RICs”) Consisting of
Investment Portfolios
(“Portfolios”) Overseen | | Public
Directorships |
| Independent Trustees1 (concluded) | | | | | | | | |
David H. Walsh 55 East 52nd Street New York, NY 10055 1941 | | Trustee | | Since 2007 | | Director, National Museum of Wildlife Art since 2007; Trustee, University of Wyoming Foundation from 2008 to 2012; Director, Ruckelshaus Institute and Haub School of Natural Resources at the University of Wyoming from 2006 to 2008; Director, The American Museum of Fly Fishing since 1997. | | 29 RICs consisting of 96 Portfolios | | None |
| | 1 Each Independent Trustee holds office until his or her successor is duly elected and qualifies or until his or her earlier death, resignation or removal as provided by the Trust’s by-laws or charter or statute. In no event may an Independent Trustee hold office beyond December 31 of the year in which he or she turns 74. |
| | 2 Date shown is the earliest date a person has served for the Trusts covered by this annual report. Following the combination of Merrill Lynch Investment Managers, L.P. (“MLIM”) and BlackRock, Inc. (“BlackRock”) in September 2006, the various legacy MLIM and legacy BlackRock fund boards were realigned and consolidated into three new fund boards in 2007. As a result, although the chart shows certain Trustees as joining the Trusts’ board in 2007, those Trustees first became members of the boards of other legacy MLIM or legacy BlackRock funds as follows: James H. Bodurtha, 1995; Bruce R. Bond, 2005; Donald W. Burton, 2002; Honorable Stuart E. Eizenstat, 2001; Kenneth A. Froot, 2005; Robert M. Hernandez, 1996; John F. O’Brien, 2005; Roberta Cooper Ramo, 1999; David H. Walsh, 2003; and Fred G. Weiss, 1998. |
| Interested Trustees3 | | | | | | | | | | |
Paul L. Audet 55 East 52nd Street New York, NY 10055 1953 | | President and Trustee | | Since 2011 | | Senior Managing Director of BlackRock and Head of U.S. Mutual Funds since 2011; Chair of the U.S. Mutual Funds Committee reporting to the Global Executive Committee since 2011; Head of BlackRock’s Real Estate business from 2008 to 2011; Member of BlackRock’s Global Operating and Corporate Risk Management Committees and of the BlackRock Alternative Investors Executive Committee and Investment Committee for the Private Equity Fund of Funds business since 2008; Head of BlackRock’s Global Cash Management business from 2005 to 2010; Acting Chief Financial Officer of BlackRock from 2007 to 2008; Chief Financial Officer of BlackRock from 1998 to 2005. | | 144 RICs consisting of 333 Portfolios | | None |
Laurence D. Fink 55 East 52nd Street New York, NY 10055 1952 | | Trustee | | Since 2007 | | Chairman and Chief Executive Officer of BlackRock since its formation in 1998 and of BlackRock’s predecessor entities since 1988 and Chairman of the Executive and Management Committees; Formerly Managing Director, The First Boston Corporation, Member of its Management Committee, Co-head of its Taxable Fixed Income Division and Head of its Mortgage and Real Estate Products Group; Chairman of the Board of several of BlackRock’s alternative investment vehicles; Director of several of BlackRock’s offshore funds; Member of the Board of Trustees of New York University, Chair of the Financial Affairs Committee and a member of the Executive Committee, the Ad Hoc Committee on Board Governance, and the Committee on Trustees; Co-Chairman of the NYU Hospitals Center Board of Trustees, Chairman of the Development/Trustee Stewardship Committee and Chairman of the Finance Committee; Trustee, The Boys’ Club of New York. | | 29 RICs consisting of 96 Portfolios | | BlackRock |
Henry Gabbay 55 East 52nd Street New York, NY 10055 1947 | | Trustee | | Since 2007 | | Consultant, BlackRock from 2007 to 2008; Managing Director, BlackRock from 1989 to 2007; Chief Administrative Officer, BlackRock Advisors, LLC from 1998 to 2007; President of BlackRock Funds and BlackRock Allocation Target Shares (formerly BlackRock Bond Allocation Target Shares) from 2005 to 2007 and Treasurer of certain closed-end funds in the BlackRock fund complex from 1989 to 2006. | | 144 RICs consisting of 333 Portfolios | | None |
| | 3 Messrs. Audet and Fink are both “interested persons,” as defined in the 1940 Act, of the Trusts based on their positions with BlackRock and its affiliates. Mr. Gabbay is an “interested person” of the Trusts based on his former positions with BlackRock and its affiliates as well as his ownership of BlackRock and The PNC Financial Services Group, Inc. securities. Mr. Audet and Mr. Gabbay are also Directors of the BlackRock registered closed-end funds and Directors of other BlackRock registered open-end funds. Interested Trustees serve until their resignation, removal or death, or until December 31 of the year in which they turn 72. |
| | | | | | |
| | | | | | | |
| | ANNUAL REPORT | | MAY 31, 2014 | | 77 |
| | | | |
| Officers and Trustees (concluded) | | |
| | | | | | |
Name, Address
and Year of Birth | | Position(s)
Held with
Trusts | | Length
of Time
Served | | Principal Occupation(s) During Past Five Years |
| Officers1 | | | | | | |
John M. Perlowski 55 East 52nd Street New York, NY 10055 1964 | | Chief Executive Officer | | Since 2010 | | Managing Director of BlackRock since 2009; Global Head of BlackRock Fund Services since 2009; Managing Director and Chief Operating Officer of the Global Product Group at Goldman Sachs Asset Management, L.P. from 2003 to 2009; Treasurer of Goldman Sachs Mutual Funds from 2003 to 2009 and Senior Vice President thereof from 2007 to 2009; Director of Goldman Sachs Offshore Funds from 2002 to 2009; Director of Family Resource Network (charitable foundation) since 2009. |
Brendan Kyne 55 East 52nd Street New York, NY 10055 1977 | | Vice President | | Since 2009 | | Managing Director of BlackRock, Inc. since 2010; Director of BlackRock, Inc. from 2008 to 2009; Head of Americas Product Development for BlackRock since 2013, Head of Product Development and Management for BlackRock’s U.S. Retail Group 2009 to 2013 and Co-head thereof from 2007 to 2009; Vice President of BlackRock, Inc. from 2005 to 2008. |
Neal Andrews 55 East 52nd Street New York, NY 10055 1966 | | Chief Financial Officer | | Since 2007 | | Managing Director of BlackRock since 2006; Senior Vice President and Line of Business Head of Fund Accounting and Administration at PNC Global Investment Servicing (U.S.) Inc. from 1992 to 2006. |
Jay Fife 55 East 52nd Street New York, NY 10055 1970 | | Treasurer | | Since 2007 | | Managing Director of BlackRock since 2007; Director of BlackRock in 2006; Assistant Treasurer of the MLIM and Fund Asset Management, L.P. advised funds from 2005 to 2006; Director of MLIM Fund Services Group from 2001 to 2006. |
Charles Park 55 East 52nd Street New York, NY 10055 1967 | | Chief Compliance Officer and Anti-Money Laundering Officer | | Since 2014 | | Chief Compliance Officer of BlackRock Advisors, LLC and the BlackRock-advised Funds in the Equity-Bond Complex, the Equity-Liquidity Complex and the Closed-End Complex since 2014; Principal of and Chief Compliance Officer for iShares® Delaware Trust Sponsor LLC since 2012 and BlackRock Fund Advisors (“BFA”) since 2006; Chief Compliance Officer for the BFA-advised iShares exchange traded funds since 2006; Chief Compliance Officer for BlackRock Asset Management International Inc. since 2012. |
Benjamin Archibald 55 East 52nd Street New York, NY 10055 1975 | | Secretary | | Since 2012 | | Managing Director of BlackRock since 2014; Director of BlackRock, Inc. from 2012 to 2013; Assistant Secretary of the BlackRock-advised Funds from 2010 to 2012; General Counsel and Chief Operating Officer of Uhuru Capital Management from 2009 to 2010; Executive Director and Counsel of Goldman Sachs Asset Management from 2005 to 2009. |
| | 1 Officers of the Trusts serve at the pleasure of the Board. |
| | | Further information about the Officers and Trustees is available in the Funds’ Statement of Additional Information, which can be obtained without charge by calling (800) 441-7762. |
| | | | | | | | |
Investment Advisor BlackRock Advisors, LLC Wilmington, DE 19809 | | Custodians State Street Bank and Trust Company2 Boston, MA 02110 The Bank of New York Mellon3 New York, NY 10286 | | Transfer Agent BNY Mellon
Investment Servicing (US) Inc. Wilmington, DE 19809 | | Accounting Agent State Street Bank and Trust Company Boston, MA 02110 | | Legal Counsel Willkie Farr & Gallagher LLP
New York, NY 10019 |
Sub-Advisor BlackRock Investment Management, LLC Princeton, NJ 08540 | | | Distributor BlackRock Investments, LLC New York, NY 10022 | | Independent Registered Public Accounting Firm
Deloitte & Touche LLP Boston, MA 02116 | | Address of the Funds
100 Bellevue Parkway Wilmington, DE 19809 |
| 2 | | For all Funds except BlackRock California Municipal Bond Fund. |
| 3 | | For BlackRock California Municipal Bond Fund. |
Effective May 14, 2014, Brian Kindelan resigned as Chief Compliance Officer and Anti-Money Laundering Officer of the Trust and Charles Park became Chief Compliance Officer and Anti-Money Laundering Officer of the Trust.
| | | | | | |
| | | | | | | |
| 78 | | ANNUAL REPORT | | MAY 31, 2014 | | |
Electronic Delivery
Electronic copies of most financial reports and prospectuses are available on the Funds’ website or shareholders can sign up for e-mail notifications of quarterly statements, annual and semi-annual reports and prospectuses by enrolling in the Funds’ electronic delivery program.
To enroll:
Shareholders Who Hold Accounts with Investment Advisors, Banks or Brokerages:
Please contact your financial advisor. Please note that not all investment advisors, banks or brokerages may offer this service.
Shareholders Who Hold Accounts Directly with BlackRock:
| 1) | Access the BlackRock website at http://www.blackrock.com/edelivery |
| 2) | Select “eDelivery” under the “More Information” section |
Householding
The Funds will mail only one copy of shareholder documents, including prospectuses, annual and semi-annual reports and proxy statements, to shareholders with multiple accounts at the same address. This practice is commonly called “householding” and is intended to reduce expenses and eliminate duplicate mailings of shareholder documents. Mailings of your shareholder documents may be householded indefinitely unless you instruct us otherwise. If you do not want the mailing of these documents to be combined with those for other members of your household, please call the Funds at (800) 441-7762.
Availability of Quarterly Schedule of Investments
The Funds file their complete schedule of portfolio holdings with the SEC for the first and third quarters of each fiscal year on Form N-Q. The Funds’ Forms N-Q are available on the SEC’s website at http://www.sec.gov and may also be reviewed and copied at the SEC’s Public Reference Room in Washington, DC. Information on how to access documents on the SEC’s website without charge may be obtained by calling (800) SEC-0330. The Funds’ Forms N-Q may also be obtained upon request and without charge by calling (800) 441-7762.
Availability of Proxy Voting Policies and Procedures
A description of the policies and procedures that the Funds use to determine how to vote proxies relating to portfolio securities is available (1) without charge, upon request, by calling (800) 441-7762; (2) at http://www.blackrock.com; and (3) on the SEC’s website at http://www.sec.gov.
Availability of Proxy Voting Record
Information about how the Funds voted proxies relating to securities held in the Funds’ portfolios during the most recent 12-month period ended June 30 is available upon request and without charge (1) at http://www.blackrock.com or by calling (800) 441-7762 and (2) on the SEC’s website at http://www.sec.gov.
| | | | | | |
| | | | | | | |
| | ANNUAL REPORT | | MAY 31, 2014 | | 79 |
| | | | |
| Additional Information (continued) | | |
Account Information
Call us at (800) 441-7762 from 8:00 AM to 6:00 PM EST on any business day to get information about your account balances, recent transactions and share prices. You can also reach us on the Web at http://www.blackrock.com/funds.
Automatic Investment Plans
Investor Class shareholders who want to invest regularly can arrange to have $50 or more automatically deducted from their checking or savings account and invested in any of the BlackRock funds.
Systematic Withdrawal Plans
Investor Class shareholders can establish a systematic withdrawal plan and receive periodic payments of $50 or more from their BlackRock funds, as long as their account balance is at least $10,000.
Retirement Plans
Shareholders may make investments in conjunction with Traditional, Rollover, Roth, Coverdell, Simple IRAs, SEP IRAs and 403(b) Plans.
| | | | | | |
| | | | | | | |
| 80 | | ANNUAL REPORT | | MAY 31, 2014 | | |
| | |
| Additional Information (concluded) | | |
|
| BlackRock Privacy Principles |
BlackRock is committed to maintaining the privacy of its current and former fund investors and individual clients (collectively, “Clients”) and to safeguarding their non-public personal information. The following information is provided to help you understand what personal information BlackRock collects, how we protect that information and why in certain cases we share such information with select parties.
If you are located in a jurisdiction where specific laws, rules or regulations require BlackRock to provide you with additional or different privacy-related rights beyond what is set forth below, then BlackRock will comply with those specific laws, rules or regulations.
BlackRock obtains or verifies personal non-public information from and about you from different sources, including the following: (i) information we receive from you or, if applicable, your financial intermediary, on applications, forms or other documents; (ii) information about your transactions with us, our affiliates, or others; (iii) information we receive from a consumer reporting agency; and (iv) from visits to our websites.
BlackRock does not sell or disclose to non-affiliated third parties any non-public personal information about its Clients, except as permitted by law or as is necessary to respond to regulatory requests or to service Client accounts. These non-affiliated third parties are required to protect the confidentiality and security of this information and to use it only for its intended purpose.
We may share information with our affiliates to service your account or to provide you with information about other BlackRock products or services that may be of interest to you. In addition, BlackRock restricts access to non-public personal information about its Clients to those BlackRock employees with a legitimate business need for the information. BlackRock maintains physical, electronic and procedural safeguards that are designed to protect the non-public personal information of its Clients, including procedures relating to the proper storage and disposal of such information.
| | | | | | |
| | | | | | | |
| | ANNUAL REPORT | | MAY 31, 2014 | | 81 |
| | | | |
| A World-Class Mutual Fund Family | | |
BlackRock offers a diverse lineup of open-end mutual funds crossing all investment styles and managed by experts in equity, fixed income and tax-exempt investing.
BlackRock ACWI ex-US Index Fund
BlackRock All-Cap Energy & Resources Portfolio
BlackRock Basic Value Fund
BlackRock Capital Appreciation Fund
BlackRock Commodity Strategies Fund
BlackRock Disciplined Small Cap Core Fund
BlackRock Emerging Markets Dividend Fund
BlackRock Emerging Markets Fund
BlackRock Emerging Markets Long/Short Equity Fund
BlackRock Energy & Resources Portfolio
BlackRock Equity Dividend Fund
BlackRock EuroFund
BlackRock Flexible Equity Fund
BlackRock Focus Growth Fund
BlackRock Global Dividend Portfolio
BlackRock Global Long/Short Equity Fund
BlackRock Global Opportunities Portfolio
BlackRock Global SmallCap Fund
BlackRock Health Sciences Opportunities Portfolio
BlackRock International Fund
BlackRock International Index Fund
BlackRock International Opportunities Portfolio
BlackRock Large Cap Core Fund
BlackRock Large Cap Core Plus Fund
BlackRock Large Cap Growth Fund
BlackRock Large Cap Value Fund
BlackRock Latin America Fund
BlackRock Long-Horizon Equity Fund
BlackRock Mid-Cap Growth Equity Portfolio
BlackRock Mid Cap Value Opportunities Fund
BlackRock Natural Resources Trust
BlackRock Pacific Fund
BlackRock Real Estate Securities Fund
BlackRock Russell 1000® Index Fund
BlackRock Science & Technology Opportunities Portfolio
BlackRock Small Cap Growth Equity Portfolio
BlackRock Small Cap Growth Fund II
BlackRock Small Cap Index Fund
BlackRock S&P 500 Stock Fund
BlackRock U.S. Opportunities Portfolio
BlackRock Value Opportunities Fund
| | |
| Taxable Fixed Income Funds | | |
BlackRock Bond Index Fund
BlackRock Core Bond Portfolio
BlackRock CoreAlpha Bond Fund
BlackRock CoRI Funds
2015
2017
2019
2021
2023
BlackRock Emerging Markets Flexible Dynamic Bond Portfolio
BlackRock Floating Rate Income Portfolio
BlackRock Global Long/Short Credit Fund
BlackRock GNMA Portfolio
BlackRock High Yield Bond Portfolio
BlackRock Inflation Protected Bond Portfolio
BlackRock Investment Grade Bond Portfolio
BlackRock Low Duration Bond Portfolio
BlackRock Secured Credit Portfolio
BlackRock Short Obligations Fund
BlackRock Short-Term Treasury Fund
BlackRock Strategic Income Opportunities Portfolio
BlackRock Total Return Fund
BlackRock U.S. Government Bond Portfolio
BlackRock U.S. Mortgage Portfolio
BlackRock Ultra-Short Obligations Fund
BlackRock World Income Fund
| | |
| Municipal Fixed Income Funds | | |
BlackRock California Municipal Bond Fund
BlackRock High Yield Municipal Fund
BlackRock National Municipal Fund
BlackRock New Jersey Municipal Bond Fund
BlackRock New York Municipal Bond Fund
BlackRock Pennsylvania Municipal Bond Fund
BlackRock Short-Term Municipal Fund
BlackRock Strategic Municipal Opportunities Fund
| | | | | | | | | | | | | | | | |
| BlackRock Balanced Capital Fund | | LifePath® Active Portfolios | | | | LifePath® Index Portfolios |
| BlackRock Emerging Market Allocation Portfolio | | | | 2015 | | 2040 | | | | | | | | Retirement | | 2040 |
| BlackRock Global Allocation Fund | | | | 2020 | | 2045 | | | | | | | | 2020 | | 2045 |
| BlackRock Managed Volatility Portfolio | | | | 2025 | | 2050 | | | | | | | | 2025 | | 2050 |
| BlackRock Multi-Asset Income Portfolio | | | | 2030 | | 2055 | | | | | | | | 2030 | | 2055 |
| BlackRock Multi-Asset Real Return Fund | | | | 2035 | | | | | | | | | | 2035 | | |
| BlackRock Strategic Risk Allocation Fund | | | | | | | | | | | | | | | | |
| | | | | | | | | | | | | | | | |
| BlackRock Prepared Portfolios | | LifePath® Portfolios | | | | | | | | |
Conservative Prepared Portfolio | | | | Retirement | | 2040 | | | | | | | | | | |
Moderate Prepared Portfolio | | | | 2020 | | 2045 | | | | | | | | | | |
Growth Prepared Portfolio | | | | 2025 | | 2050 | | | | | | | | | | |
Aggressive Growth Prepared Portfolio | | | | 2030 | | 2055 | | | | | | | | | | |
| | | | 2035 | | | | | | | | | | | | |
BlackRock mutual funds are currently distributed by BlackRock Investments, LLC. You should consider the investment objectives, risks, charges and expenses of the funds under consideration carefully before investing. Each fund’s prospectus contains this and other information and is available at www.blackrock.com or by calling (800) 441-7762 or from your financial advisor. The prospectus should be read carefully before investing.
| | | | | | |
| | | | | | | |
| 82 | | ANNUAL REPORT | | MAY 31, 2014 | | |
These reports are not authorized for use as an offer of sale or a solicitation of an offer to buy shares of the Funds unless accompanied or preceded by the Funds’ current prospectus. Past performance results shown in this report should not be considered a representation of future performance. Investment returns and principal value of shares will fluctuate so that shares, when redeemed, may be worth more or less than their original cost. Statements and other information herein are as dated and are subject to change.

| | |
| MUNI4-5/14-AR | |  |
| Item 2 – | Code of Ethics – The registrant (or the “Fund”) has adopted a code of ethics, as of the end of the period covered by this report, applicable to the registrant’s principal executive officer, principal financial officer, principal accounting officer or controller, or persons performing similar functions. During the period covered by this report, there have been no amendments to or waivers granted under the code of ethics. A copy of the code of ethics is available without charge at www.blackrock.com. |
| Item 3 – | Audit Committee Financial Expert – The registrant’s board of trustees (the “board of trustees”), has determined that (i) the registrant has the following audit committee financial experts serving on its audit committee and (ii) each audit committee financial expert is independent: |
Robert M. Hernandez
Fred G. Weiss
Stuart E. Eizenstat
Under applicable securities laws, a person determined to be an audit committee financial expert will not be deemed an “expert” for any purpose, including without limitation for the purposes of Section 11 of the Securities Act of 1933, as a result of being designated or identified as an audit committee financial expert. The designation or identification of a person as an audit committee financial expert does not impose on such person any duties, obligations, or liabilities greater than the duties, obligations, and liabilities imposed on such person as a member of the audit committee and board of trustees in the absence of such designation or identification.
| Item 4 – | Principal Accountant Fees and Services |
The following table presents fees billed by Deloitte & Touche LLP (“D&T”) in each of the last two fiscal years for the services rendered to the Fund:
| | | | | | | | | | | | | | | | |
| | | (a) Audit Fees | | (b) Audit-Related Fees1 | | (c) Tax Fees2 | | (d) All Other Fees3 |
| Entity Name | | Current
Fiscal Year
End | | Previous
Fiscal Year End | | Current
Fiscal Year End | | Previous
Fiscal Year End | | Current
Fiscal Year End | | Previous
Fiscal Year End | | Current
Fiscal Year End | | Previous
Fiscal Year End |
| BlackRock Strategic Municipal Opportunities Fund of BlackRock Municipal Series Trust | | $31,613 | | $31,613 | | $0 | | $0 | | $12,600 | | $12,600 | | $0 | | $0 |
The following table presents fees billed by D&T that were required to be approved by the registrant’s audit committee (the “Committee”) for services that relate directly to the operations or financial reporting of the Fund and that are rendered on behalf of BlackRock Advisors, LLC (“Investment Adviser” or “BlackRock”) and entities controlling, controlled by, or under common control with BlackRock (not including any sub-adviser whose role is primarily portfolio management and is subcontracted with or overseen by another investment adviser) that provide ongoing services to the Fund (“Fund Service Providers”):
2
| | | | |
| | | Current Fiscal Year End | | Previous Fiscal Year End |
(b) Audit-Related Fees1 | | $0 | | $0 |
(c) Tax Fees2 | | $0 | | $0 |
(d) All Other Fees3 | | $2,555,000 | | $2,865,000 |
1 The nature of the services includes assurance and related services reasonably related to the performance of the audit of financial statements not included in Audit Fees.
2 The nature of the services includes tax compliance, tax advice and tax planning.
3 Aggregate fees borne by BlackRock in connection with the review of compliance procedures and attestation thereto performed by D&T with respect to all of the registered closed-end funds and some of the registered open-end funds advised by BlackRock.
(e)(1) Audit Committee Pre-Approval Policies and Procedures:
The Committee has adopted policies and procedures with regard to the pre-approval of services. Audit, audit-related and tax compliance services provided to the registrant on an annual basis require specific pre-approval by the Committee. The Committee also must approve other non-audit services provided to the registrant and those non-audit services provided to the Investment Adviser and Fund Service Providers that relate directly to the operations and the financial reporting of the registrant. Certain of these non-audit services that the Committee believes are (a) consistent with the SEC’s auditor independence rules and (b) routine and recurring services that will not impair the independence of the independent accountants may be approved by the Committee without consideration on a specific case-by-case basis (“general pre-approval”). The term of any general pre-approval is 12 months from the date of the pre-approval, unless the Committee provides for a different period. Tax or other non-audit services provided to the registrant which have a direct impact on the operations or financial reporting of the registrant will only be deemed pre-approved provided that any individual project does not exceed $10,000 attributable to the registrant or $50,000 per project. For this purpose, multiple projects will be aggregated to determine if they exceed the previously mentioned cost levels.
Any proposed services exceeding the pre-approved cost levels will require specific pre-approval by the Committee, as will any other services not subject to general pre-approval (e.g., unanticipated but permissible services). The Committee is informed of each service approved subject to general pre-approval at the next regularly scheduled in-person board meeting. At this meeting, an analysis of such services is presented to the Committee for ratification. The Committee may delegate to the Committee Chairman the authority to approve the provision of and fees for any specific engagement of permitted non-audit services, including services exceeding pre-approved cost levels.
(e)(2) None of the services described in each of Items 4(b) through (d) were approved by the Committee pursuant to the de minimis exception in paragraph (c)(7)(i)(C) of Rule 2-01 of Regulation S-X.
(f) Not Applicable
(g) The aggregate non-audit fees paid to the accountant for services rendered by the accountant to the registrant, the Investment Adviser and the Fund Service Providers were:
3
| | | | | | | | | | | | |
| Entity Name | | | | Current Fiscal
Year End | | | | Previous Fiscal
Year End | | | | |
| BlackRock Strategic Municipal Opportunities Fund of BlackRock Municipal Series Trust | | | | $12,600 | | | | $12,600 | | | | |
Additionally, SSAE 16 Review (Formerly, SAS No. 70) fees for the current and previous fiscal years of $2,555,000 and $2,865,000, respectively, were billed by D&T to the Investment Adviser.
(h) The Committee has considered and determined that the provision of non-audit services that were rendered to the Investment Adviser and the Fund Service Providers that were not pre-approved pursuant to paragraph (c)(7)(ii) of Rule 2-01 of Regulation S-X is compatible with maintaining the principal accountant’s independence.
| Item 5 – | Audit Committee of Listed Registrants – Not Applicable |
(a) The registrant’s Schedule of Investments is included as part of the Report to Stockholders filed under Item 1 of this Form.
(b) Not Applicable due to no such divestments during the semi-annual period covered since the previous Form N-CSR filing.
| Item 7 – | Disclosure of Proxy Voting Policies and Procedures for Closed-End Management Investment Companies – Not Applicable |
| Item 8 – | Portfolio Managers of Closed-End Management Investment Companies – Not Applicable |
| Item 9 – | Purchases of Equity Securities by Closed-End Management Investment Company and Affiliated Purchasers –Not Applicable |
| Item 10 – | Submission of Matters to a Vote of Security Holders – There have been no material changes to these procedures. |
| Item 11 – | Controls and Procedures |
(a) The registrant’s principal executive and principal financial officers, or persons performing similar functions, have concluded that the registrant’s disclosure controls and procedures (as defined in Rule 30a-3(c) under the Investment Company Act of 1940, as amended (the “1940 Act”)) are effective as of a date within 90 days of the filing of this report based on the evaluation of these controls and procedures required by Rule 30a-3(b) under the 1940 Act and Rule 15d-15(b) under the Securities Exchange Act of 1934, as amended.
(b) There were no changes in the registrant’s internal control over financial reporting (as defined in Rule 30a-3(d) under the 1940 Act) that occurred during the second fiscal quarter of the period covered by this report that have materially affected, or are reasonably likely to materially affect, the registrant’s internal control over financial reporting.
4
| Item 12 – | Exhibits attached hereto |
| | (a)(1) | Code of Ethics – See Item 2 |
| | (a)(2) | Certifications – Attached hereto |
| | (b) | Certifications – Attached hereto |
5
Pursuant to the requirements of the Securities Exchange Act of 1934 and the Investment Company Act of 1940, the registrant has duly caused this report to be signed on its behalf by the undersigned, thereunto duly authorized.
BlackRock Strategic Municipal Opportunities Fund of BlackRock Municipal Series Trust
| | | | |
| By: | | /s/ John M. Perlowski | | |
| | John M. Perlowski | | |
| | Chief Executive Officer (principal executive officer) of |
| | BlackRock Strategic Municipal Opportunities Fund of BlackRock Municipal Series Trust |
Date: July 29, 2014
Pursuant to the requirements of the Securities Exchange Act of 1934 and the Investment Company Act of 1940, this report has been signed below by the following persons on behalf of the registrant and in the capacities and on the dates indicated.
| | | | |
| By: | | /s/ John M. Perlowski | | |
| | John M. Perlowski | | |
| | Chief Executive Officer (principal executive officer) of |
| | BlackRock Strategic Municipal Opportunities Fund of BlackRock Municipal Series Trust |
Date: July 29, 2014
| | | | |
| By: | | /s/ Neal J. Andrews | | |
| | Neal J. Andrews | | |
| | Chief Financial Officer (principal financial officer) of |
| | BlackRock Strategic Municipal Opportunities Fund of BlackRock Municipal Series Trust |
Date: July 29, 2014
6