UNITED STATES
SECURITIES AND EXCHANGE COMMISSION
Washington, D.C. 20549
FORM N-CSR
CERTIFIED SHAREHOLDER REPORT OF REGISTERED
MANAGEMENT INVESTMENT COMPANIES
Investment Company Act File No.: 811-04809
Liberty All-Star Equity Fund
(Exact name of registrant as specified in charter)
1290 Broadway, Suite 1100, Denver, Colorado 80203
(Address of principal executive offices) (Zip code)
Alex Marks
ALPS Fund Services, Inc.
1290 Broadway, Suite 1100
Denver, Colorado 80203
(Name and address of agent for service)
Registrant’s telephone number, including area code: 303-623-2577
Date of fiscal year end: December 31
Date of reporting period: January 1 - December 31, 2014
Item 1. Report of Shareholders.

| | | | |
LIBERTY ALL-STAR® EQUITY FUND | | | | 1 |
PRESIDENT’S LETTER (UNAUDITED) | | | |
| | |
Fellow Shareholders: | | February 2015 |
Although roiled by periodic sell-offs, U.S. equity markets rose once again in 2014, as the S&P 500® Index and the widely followed Dow Jones Industrial Average (DJIA) posted numerous record highs throughout the year. The S&P 500 returned 13.69 percent while the DJIA gained 10.04 percent. The technology-focused NASDAQ Composite Index returned 14.75 percent.
The S&P 500 Index recorded positive returns each quarter in 2014, with the first and third quarters in the range of 1 percent-plus while the second and fourth quarters were in the mid-single digits. The U.S. economy was the main source of strength for equities. An abnormally harsh winter caused gross domestic product (GDP) to decline 2.1 percent in the first quarter. Growth was strong in the second and third quarters, however, when GDP rose 4.6 percent and 5.0 percent, respectively. The employment picture in the U.S. also brightened. Except for January, which was distorted by the weather, every month in 2014 was marked by the creation of more than 200,000 non-farm jobs. The ongoing job growth meant that by May all of the 8.7 million jobs lost during the Great Recession had finally been recouped. Throughout the fiscal year, the Federal Reserve (Fed) kept short-term interest rates at record low levels, even as it continued to wind down its program of quantitative easing (QE), first launched in December 2008. In October, the Fed ended the program altogether. Another powerful theme running throughout the year was the industrial renaissance in the U.S., as auto, capital equipment and energy output gained strength. U.S. energy production stood out as a growth driver, as hydraulic fracturing methodologies unlocked previously inaccessible or economically impractical oil and gas deposits. The price of oil began a gradual descent at mid-year, a move that accelerated in the fourth quarter. From a peak of $106 per barrel in June, the price of West Texas Intermediate (WTI) crude fell to an average of $59 per barrel in December (and continued to slide in early 2015).
The steep, rapid decline in the price of oil was interpreted by many to be a sign of slowing economic growth
worldwide and investors responded by selling equities in one of the several sell-offs that made 2014 a positive, but choppy year. Fears of higher interest rates and geopolitical tensions, chiefly in Ukraine, fueled a retrenchment in the first quarter. A significant sell-off in biotechnology, information technology and social networking stocks hit the NASDAQ Composite in April. And falling oil prices led to a one-week decline of 3.1 percent in the S&P 500 in early October.
One characteristic of the 2014 investment environment that warrants comment was how challenging it was for active managers and actively managed funds. According to data provider Lipper, 2014 was the worst year for active managers relative to the market in three decades, while data from research firm Morningstar indicates that less than 20 percent of U.S. equity fund managers beat their benchmark. As Liberty All-Star® Equity Fund is actively managed, we asked the Fund’s five investment managers to comment on this in our annual Manager Roundtable, which begins on page 9 of this report. We recommend their thoughts and insights to you.
Liberty All-Star® Equity Fund
After strongly outperforming the market in 2013, Liberty All-Star® Equity Fund returns lagged in 2014. The Fund returned 8.87 percent with shares valued at net asset value (NAV) with dividends reinvested and 6.98 percent with shares valued at market price with dividends reinvested. (Fund returns are net of fees.) The Lipper Large-Cap Core Mutual Fund Average returned 11.32 percent. The Fund posted positive returns for three quarters, but experienced a negative return of -1.38 percent in the third quarter, hurt in part by the sell-off in energy stocks. The discount at which Fund shares traded relative to their underlying NAV widened compared with 2013, ranging from a low of -10.5 percent to a high of -13.6 percent.
Looking longer term, the Fund’s average annual returns are in-line with most indices, as they lag the S&P 500 by just 42 basis points for the trailing three-year period (with
| | |
www.all-starfunds.com | | USA |
| | | | |
| 2 | | | | LIBERTY ALL-STAR® EQUITY FUND |
| | | PRESIDENT’S LETTER (UNAUDITED) |
| | | | |
shares valued at market price with dividends reinvested) and are ahead of the Lipper average by 87 basis points for the same period. By the same measure, the Fund trails the S&P 500 for the past five years, but once again is ahead of the Lipper.
As previously discussed, it had been a challenging environment for active managers’ relative performance during 2014 and, actually, for most years subsequent to the 2008 financial crisis. The massive liquidity provided by the Federal Reserve in response to the crisis certainly pushed stock indices to record highs and interest rates to record lows. It has, however, been a challenging period for active managers, as the transmission mechanism for that liquidity into domestic stocks has been largely through index funds and index exchange-traded funds (ETFs) rather than actively managed products. Looking longer term, there are also periods when active managers, on balance, have outperformed stock indices, which points to the cyclical nature of those performance patterns. The last such period was from 2000-2007, a time frame beginning after the bursting of the technology bubble and, coincidentally, was approximately the same duration as the current post-crisis period. It is worth noting that for the past 15 years, from January 1, 2000, to December 31, 2014, the Fund’s NAV reinvested return after fund expenses exceeds both the Lipper average and the S&P 500. No one can predict the timing of when or for how long active managers generally out- or underperform stock indices, but viewing active managers’ relative performance in the context of a combined cycle is relevant.
Fund distributions totaled $0.39 per share in 2014. As shareholders may recall, the Fund’s distribution policy has been in place since 1988 and is a major component of the Fund’s total return. These distributions add up to $24.66 since 1987 (the Fund’s first full calendar year of operations). We continue to emphasize that shareholders should include these distributions when determining the return on their investment in the Fund.
One of the key principles on which the Fund was founded is multi-management, or the practice of allocating the Fund’s assets to carefully selected investment managers
representing both value and growth styles of investing. Thus, we are once again offering insights into the managers’ thinking through the previously mentioned roundtable discussion, and invite shareholders to read the managers’ comments.
In a difficult environment for active managers, the Fund lagged key benchmarks in 2014. After a strong 2013, however, the Fund’s market price returns over the past two years average 19.52 percent. If the start of the year is any indicator, 2015 may be highly volatile. We are confident in the Fund’s five investment managers’ ability to navigate whatever market conditions prevail in the year ahead. For our part, we will continue to manage the Fund with our sights set on rewarding long-term returns for shareholders.
Sincerely,

William R. Parmentier, Jr.
President and Chief Executive Officer
Liberty All-Star® Equity Fund
| | | | | | |
ANNUAL REPORT | | 
| | DECEMBER 31, 2014 | | |
| | | | |
LIBERTY ALL-STAR® EQUITY FUND | | | | 3 |
PRESIDENT’S LETTER (UNAUDITED) | | | |
| | | | | | | | | | | | | | |
| |
FUND STATISTICS AND SHORT-TERM PERFORMANCE PERIODS ENDED DECEMBER 31, 2014 | | | |
| |
FUND STATISTICS: | | | |
| | | | |
Net Asset Value (NAV) | | | | | | | $6.84 | | | | | | | |
Market Price | | | | | | | $5.98 | | | | | | | |
Discount | | | | | | | -12.6% | | | | | | | |
| | | | |
| | | Quarter | | | | | | 2014 | | | |
Distributions* | | | $0.09 | | | | | | | | $0.39 | | | |
Market Price Trading Range | | | $5.22 to $6.09 | | | | | | | | $5.22 to $6.09 | | | |
Premium/(Discount) Range | | | -11.8% to -13.6% | | | | | | | | -10.5% to -13.6% | | | |
| | | | |
PERFORMANCE: | | | | | | | | | | | | | | |
| | | | |
Shares Valued at NAV with Dividends Reinvested | | | 4.30% | | | | | | | | 8.87% | | | |
Shares Valued at Market Price with Dividends Reinvested | | | 4.16% | | | | | | | | 6.98% | | | |
Dow Jones Industrial Average | | | 5.20% | | | | | | | | 10.04% | | | |
NASDAQ Composite Index | | | 5.70% | | | | | | | | 14.75% | | | |
Lipper Large-Cap Core Mutual Fund Average | | | 4.27% | | | | | | | | 11.32% | | | |
S&P 500® Index | | | 4.93% | | | | | | | | 13.69% | | | |
| | | | | | | | | | | | | | | | | | | | |
| |
LONG-TERM PERFORMANCE SUMMARY AND DISTRIBUTIONS PERIODS ENDED
DECEMBER 31, 2014 | | ANNUALIZED RATES OF RETURN | |
| 3 YEARS | | | 5 YEARS | | | 10 YEARS | | | 15 YEARS | | | 25 YEARS | |
| | | | | |
LIBERTY ALL-STAR® EQUITY FUND | | | | | | | | | | | | | | | | | | | | |
| | | | | |
Distributions | | | $1.06 | | | | $1.71 | | | | $5.32 | | | | $10.49 | | | | $21.89 | |
Shares Valued at NAV with Dividends Reinvested | | | 18.67% | | | | 12.84% | | | | 5.95% | | | | 4.80% | | | | 9.21% | |
Shares Valued at Market Price with Dividends Reinvested | | | 19.99% | | | | 14.08% | | | | 4.25% | | | | 5.51% | | | | 9.28% | |
Dow Jones Industrial Average | | | 16.29% | | | | 14.22% | | | | 7.91% | | | | 5.44% | | | | 10.42% | |
Lipper Large-Cap Core Mutual Fund Average | | | 19.12% | | | | 13.90% | | | | 7.05% | | | | 4.29% | | | | 9.21% | |
NASDAQ Composite Index | | | 23.60% | | | | 17.19% | | | | 9.17% | | | | 1.82% | | | | 10.18% | |
S&P 500® Index | | | 20.41% | | | | 15.45% | | | | 7.67% | | | | 4.24% | | | | 9.62% | |
| * | All 2014 distributions consist of ordinary dividends and long-term capital gains. A breakdown of each 2014 distribution for federal income tax purposes can be found in the table on page 39. |
Returns for the Fund are total returns, which include dividends. Performance returns are net of management fees and other Fund expenses.
Figures shown for the Lipper Large-Cap Core Mutual Fund Average are based on open-end mutual funds’ total returns, which include dividends, and are net of Fund expenses. Figures shown for the unmanaged Dow Jones Industrial Average, NASDAQ Composite Index and the S&P 500® Index are total returns, including dividends. A description of the Lipper benchmark and the market indices can be found on page 39.
Past performance cannot predict future results. Performance will fluctuate with market conditions. Current performance may be lower or higher than the performance data shown. Performance information does not reflect the deduction of taxes that shareholders would pay on Fund distributions or the sale of Fund shares. An investment in the Fund involves risk, including loss of principal.
Closed-end funds raise money in an initial public offering and shares are listed and traded on an exchange. Open-end mutual funds continuously issue and redeem shares at net asset value. Shares of closed-end funds frequently trade at a discount to net asset value. The price of the Fund’s shares is determined by a number of factors, several of which are beyond the control of the Fund. Therefore, the Fund cannot predict whether its shares will trade at, below or above net asset value.
| | |
www.all-starfunds.com | | USA |
| | | | |
| 4 | | | | LIBERTY ALL-STAR® EQUITY FUND |
| | | UNIQUE FUND ATTRIBUTES (UNAUDITED) |
| | | | |
| | | | | | | | |
| | | | | |
| | | | | Unique Attributes of Liberty All-Star® Equity Fund | | | | |
| | | | | |
| | | | | Several attributes help to make the Fund a core equity holding for investors seeking diversification, income and the potential for long-term appreciation. | | | | |
| | | | | | | | | |
| | | | | | |
| | 
| | Multi-management for Individual Investors | | |
| |
| | |
| | | |
| | | | Liberty All-Star® Equity Fund is multi-managed, an investment discipline that is followed by large institutional investors to diversify their portfolios. In 1986, Liberty All-Star® Equity Fund became the first closed-end fund to bring multi-management to individual investors. | | |
| | | |
| | 
| | Real-time Trading and Liquidity | | |
| |
| | |
| | | |
| | | | The Fund has a fixed number of shares that trade on the New York Stock Exchange and other exchanges. Share pricing is continuous—not just end-of-day, as it is with open-end mutual funds. In addition, Fund shares offer immediate liquidity and there are no annual sales fees. | | |
| | | | | | |
ANNUAL REPORT | |
| | DECEMBER 31, 2014 | | |
| | | | |
LIBERTY ALL-STAR® EQUITY FUND | | | | 5 |
UNIQUE FUND ATTRIBUTES (UNAUDITED) | | | |
| | | | |

| | Access to Institutional Managers | | |
|
|
| | |
| | The Fund’s investment managers invest primarily for pension funds, endowments, foundations and other institutions. Because institutional managers are closely monitored by their clients, they tend to be more disciplined and consistent in their investment process. | | |
| | |

| | Monitoring and Rebalancing | | |
|
|
| | |
| | ALPS Advisors continuously monitors these investment managers to ensure that they are performing as expected and adhering to their style and strategy, and will replace managers when warranted. Periodic rebalancing maintains the Fund’s structural integrity and is a well-recognized investment discipline. | | |
| | |

| | Alignment and Objectivity | | |
|
|
| | |
| | Alignment with shareholders’ best interests and objective decision-making help to ensure that the Fund is managed openly and equitably. In addition, the Fund is governed by a Board of Trustees that is elected by and responsible to shareholders. | | |
| | |

| | Distribution Policy | | |
|
|
| | |
| | Since 1988, the Fund has followed a policy of paying annual distributions on its shares at a rate that approximates historical equity market returns. The current annual distribution rate is 6 percent of the Fund’s net asset value (paid quarterly at 1.5 percent per quarter), providing a systematic mechanism for distributing funds to shareholders. | | |
| | |
www.all-starfunds.com | | USA |
| | | | |
| 6 | | | | LIBERTY ALL-STAR® EQUITY FUND |
| | | | INVESTMENT MANAGERS/PORTFOLIO CHARACTERISTICS (UNAUDITED) |
| | | | |
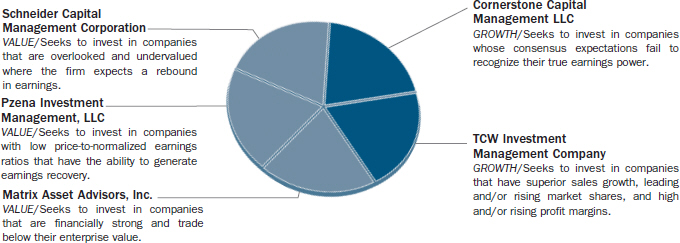
THE FUND’S ASSETS ARE APPROXIMATELY EQUALLY DISTRIBUTED AMONG THREE VALUE MANAGERS AND TWO GROWTH MANAGERS:
MANAGERS’ DIFFERING INVESTMENT STRATEGIES ARE REFLECTED IN PORTFOLIO CHARACTERISTICS
The portfolio characteristics table below is a regular feature of the Fund’s shareholder reports. It serves as a useful tool for understanding the value of a multi-managed portfolio. The characteristics are different for each of the Fund’s five investment managers. These differences are a reflection of the fact that each pursues a different investment style. The shaded column highlights the characteristics of the Fund as a whole, while the final column shows portfolio characteristics for the S&P 500® Index.
| | | | | | | | | | | | | | | | | | |
| | | | INVESTMENT STYLE SPECTRUM | | | | | | | | | | | | |
| PORTFOLIO CHARACTERISTICS AS OF DECEMBER 31, 2014 | | VALUE | | | | GROWTH | | | | | | | | |
| | 
| | |
| | | | | | | | | | | | | | | | | |
| | | | | | | | |
| | | Schneider | | Pzena | | Matrix | | Cornerstone | | TCW | | Total Fund | | S&P
500® Index | | |
| | | | | | | | |
Number of Holdings | | 36 | | 41 | | 35 | | 43 | | 31 | | 158* | | 502 | | |
| | | | | | | | |
Percent of Holdings in Top 10 | | 55% | | 36% | | 36% | | 39% | | 44% | | 17% | | 18% | | |
| | | | | | | | |
Weighted Average Market Capitalization (billions) | | $44 | | $86 | | $106 | | $67 | | $64 | | $74 | | $131 | | |
| | | | | | | | |
Average Five-Year Earnings Per Share Growth | | 5% | | 13% | | 17% | | 25% | | 19% | | 18% | | 15% | | |
| | | | | | | | |
Dividend Yield | | 1.5% | | 1.9% | | 2.1% | | 0.7% | | 0.6% | | 1.4% | | 2.0% | | |
| | | | | | | | |
Price/Earnings Ratio** | | 15x | | 13x | | 17x | | 25x | | 33x | | 18x | | 19x | | |
| | | | | | | | |
Price/Book Value Ratio | | 1.4x | | 2.0x | | 2.1x | | 4.0x | | 5.7x | | 2.6x | | 3.0x | | |
| * | Certain holdings are held by more than one manager. |
| ** | Excludes negative earnings. |
| | | | | | |
ANNUAL REPORT | |
| | DECEMBER 31, 2014 | | |
| | | | |
LIBERTY ALL-STAR® EQUITY FUND | | | | 7 |
INVESTMENT GROWTH (UNAUDITED) | | | |
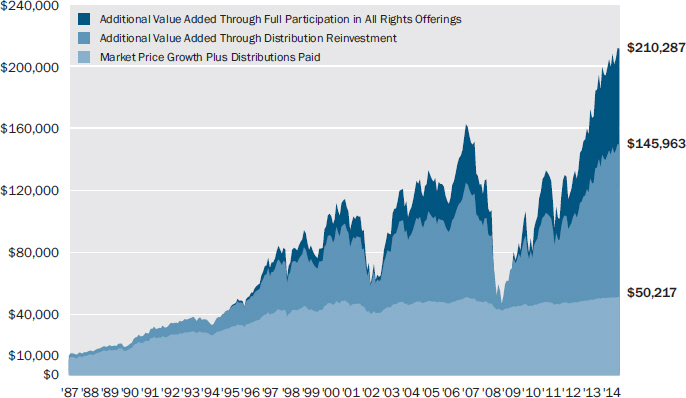
GROWTH OF A HYPOTHETICAL $10,000 INVESTMENT
The graph below illustrates the growth of a hypothetical $10,000 investment assuming the purchase of shares of beneficial interest at the closing market price (NYSE: USA) of $6.00 on December 31, 1987, and tracking its progress through December 31, 2014. For certain information, it also assumes that a shareholder exercised all primary rights in the Fund’s rights offerings (see below). This graph covers the period since the Fund commenced its 10 percent distribution policy in 1988. Effective with the 2009 second quarter distribution, the annual distribution rate was changed from 10 percent to 6 percent.
| | |

| | The growth of the investment assuming all distributions were received in cash and not reinvested back into the Fund. The value of the investment under this scenario grew to $50,217 (including the December 31, 2014 value of the original investment of $9,967 plus distributions during the period of $39,133 and tax credits on retained capital gains of $1,117). |
| |

| | The additional value realized through reinvestment of all distributions and tax credits. The value of the investment under this scenario grew to $145,963. |
| |

| | The additional value realized through full participation in all the rights offerings under the terms of each offering. The value of the investment under this scenario grew to $210,287 excluding the cost to fully participate in all the rights offerings under the terms of each offering which was $49,966. |
Past performance cannot predict future results. Performance will fluctuate with changes in market conditions. Current performance may be lower or higher than the performance data shown. Performance information does not reflect the deduction of taxes that shareholders would pay on Fund distributions or the sale of Fund shares. An investment in the Fund involves risk, including loss of principal.
| | |
www.all-starfunds.com | | USA |
| | | | |
| 8 | | | | LIBERTY ALL-STAR® EQUITY FUND |
| | | TABLE OF DISTRIBUTIONS AND RIGHTS OFFERINGS (UNAUDITED) |
| | | | |
| | | | | | | | | | | | | | |
| | | | | |
| | | | | | | RIGHTS OFFERINGS | | | | |
| | | YEAR | | PER SHARE
DISTRIBUTIONS | | MONTH
COMPLETED | | SHARES NEEDED TO PURCHASE
ONE ADDITIONAL SHARE | | SUBSCRIPTION
PRICE | | TAX CREDITS* | | |
| | | 1988 | | $0.64 | | | | | | | | | | |
| | | 1989 | | 0.95 | | | | | | | | | | |
| | | 1990 | | 0.90 | | | | | | | | | | |
| | | 1991 | | 1.02 | | | | | | | | | | |
| | | 1992 | | 1.07 | | April | | 10 | | $10.05 | | | | |
| | | 1993 | | 1.07 | | October | | 15 | | 10.41 | | $0.18 | | |
| | | 1994 | | 1.00 | | September | | 15 | | 9.14 | | | | |
| | | 1995 | | 1.04 | | | | | | | | | | |
| | | 1996 | | 1.18 | | | | | | | | 0.13 | | |
| | | 1997 | | 1.33 | | | | | | | | 0.36 | | |
| | | 1998 | | 1.40 | | April | | 20 | | 12.83 | | | | |
| | | 1999 | | 1.39 | | | | | | | | | | |
| | | 2000 | | 1.42 | | | | | | | | | | |
| | | 2001 | | 1.20 | | | | | | | | | | |
| | | 2002 | | 0.88 | | May | | 10 | | 8.99 | | | | |
| | | 2003 | | 0.78 | | | | | | | | | | |
| | | 2004 | | 0.89 | | July | | 10** | | 8.34 | | | | |
| | | 2005 | | 0.87 | | | | | | | | | | |
| | | 2006 | | 0.88 | | | | | | | | | | |
| | | 2007 | | 0.90 | | December | | 10 | | 6.51 | | | | |
| | | 2008 | | 0.65 | | | | | | | | | | |
| | | 2009*** | | 0.31 | | | | | | | | | | |
| | | 2010 | | 0.31 | | | | | | | | | | |
| | | 2011 | | 0.34 | | | | | | | | | | |
| | | 2012 | | 0.32 | | | | | | | | | | |
| | | 2013 | | 0.35 | | | | | | | | | | |
| | | 2014 | | 0.39 | | | | | | | | | | |
| | Total | | $23.48 | | | | | | | | | | |
| * | The Fund’s net investment income and net realized capital gains exceeded the amount to be distributed under the Fund’s distribution policy. In each case, the Fund elected to pay taxes on the undistributed income and passed through a proportionate tax credit to shareholders. |
| ** | The number of shares offered was increased by an additional 25% to cover a portion of the over-subscription requests. |
| *** | Effective with the second quarter distribution, the annual distribution rate was changed from 10 percent to 6 percent. |
DISTRIBUTION POLICY
The current policy is to pay distributions on its shares totaling approximately 6 percent of its net asset value per year, payable in four quarterly installments of 1.5% of the Fund’s net asset value at the close of the New York Stock Exchange on the Friday prior to each quarterly declaration date. Sources of distributions to shareholders may include ordinary dividends, long-term capital gains and return of capital. The actual amounts and sources of the amounts for tax reporting purposes will depend upon the Fund’s investment experience during the remainder of its fiscal year and may be subject to changes based on tax regulations. If a distribution includes anything other than net investment income, the Fund provides a Section 19(a) notice of the best estimate of its distribution sources at that time. These estimates may not match the final tax characterization (for the full year’s distributions) contained in shareholders’ 1099-DIV forms after the end of the year. If the Fund’s net investment income and net realized capital gains for any year exceed the amount distributed under the distribution policy, the Fund may, in its discretion, retain and not distribute capital gains and pay income tax thereon to the extent of such excess.
| | | | | | |
ANNUAL REPORT | |
| | DECEMBER 31, 2014 | | |
| | | | |
LIBERTY ALL-STAR® EQUITY FUND | | | | 9 |
MANAGER ROUNDTABLE (UNAUDITED) | | | |
Manager Roundtable
Periods of volatility—brief, but extreme—appeared periodically throughout 2014, the final spasm being driven by sharp declines in the price of oil and its implications for slowing economic growth around the world. How do the Fund’s investment managers view this, and what do they think it portends for 2015? Almost uniformly, their response is to invest in high conviction stocks—quality names with sound fundamentals and competitive business models—at those times when volatility creates buying opportunities.
Liberty All-Star® Equity Fund’s five investment managers represent long experience, deep knowledge, a proven track record and, given that they represent both growth and value styles of investing, a broad point of view on the stock market and equity investing generally. Thus, once again, we are grateful to be able to call upon this resource to provide Fund shareholders with commentary and insight. The Fund’s Investment Advisor, ALPS Advisors, serves as moderator of the roundtable. Participating investment management firms, the portfolio manager for each, and their respective styles and strategies are:
CORNERSTONE CAPITAL MANAGEMENT LLC
Portfolio Manager/Thomas G. Kamp, CFA
President and Chief Investment Officer
Investment Style/Growth – Cornerstone’s portfolio is focused on stocks in which its research has identified Perception Gaps (underappreciated opportunities) for growth in the key metrics that drive the financial statements of the company. Stock selection is further based on the fundamentals of revenue, earnings, cash flow, and management depth and credibility.
MATRIX ASSET ADVISORS, INC.
Portfolio Manager/David A. Katz, CFA
President and Chief Executive Officer
Investment Style/Value – Matrix follows an opportunistic value-oriented investment philosophy. Matrix believes that value can be found in all sectors of the economy, and thus looks for investment opportunities beyond traditional value industries.
PZENA INVESTMENT MANAGEMENT, LLC
Portfolio Managers:
Richard S. Pzena, Founder and Co-Chief Investment Officer John P. Goetz, Managing Principal and Co-Chief Investment Officer Benjamin S. Silver, CFA, Principal and Co-Director of Research Investment Style/Value – Pzena uses fundamental research and a disciplined process to identify good companies with a sustainable business advantage that the firm believes are undervalued on the basis of current price to an estimated normal level of earnings.
SCHNEIDER CAPITAL MANAGEMENT CORPORATION
Portfolio Manager/Arnold C. Schneider, III, CFA
President and Chief Investment Officer
Investment Style/Value – The firm practices a disciplined, fundamental approach to add value over time. Research focuses on uncovering new ideas and owning undervalued stocks before they experience a rebound in earnings and come to the attention of other investors.
TCW INVESTMENT MANAGEMENT COMPANY
Portfolio Manager/Craig C. Blum, CFA
Managing Director
Investment Style/Growth – TCW seeks to invest in companies that have superior sales growth, leading and/ or rising market shares, and high and/or rising profit margins. TCW’s concentrated growth equity strategy seeks companies with distinct advantages in their business model.
There can be several interpretations of the volatility that hit equity markets in the fourth quarter: Sell-offs in late September/early October—principally taken down by economically sensitive sectors—and in December with the further collapse in world oil prices and its implications for slower growth around the world. But rallies followed both pull-backs. Based on your investment style and strategy, what’s your analysis of these scenarios and their implications for 2015? Let’s start with the growth style managers and hear first from Tom Kamp.
Kamp (Cornerstone – Growth): The upward movement in the market over the last two and a quarter years came with remarkably little volatility. However, we believe the long period of low volatility has ended. We expect the normal “to and fro” of the market to return now that the unprecedented
| | |
volatility- dampening influence of Quantitative Easing (QE) has been removed against the backdrop of a slow growth economy and rising global fiscal and monetary crosscurrents. We expect the market to be choppier as sentiment and fundamentals react to geopolitical, economic and company-specific data. This change is welcomed since our process thrives on the | | “We expect the market to be choppier [in reaction to] to geopolitical, economic and company-specific data. This is welcomed since our process thrives on short-term dislocations in high conviction stock ideas...” Tom Kamp (Cornerstone –Growth) |
short-term dislocations in high conviction stock ideas that normally exist.
| | |
www.all-starfunds.com | | USA |
| | | | |
| 10 | | | | LIBERTY ALL-STAR® EQUITY FUND |
| | | | MANAGER ROUNDTABLE (UNAUDITED) |
| | | | |
After the significant upward movement in the equity market over the last six years, accompanied by significant valuation expansion, it is not likely that the equity market will have a strong return in the coming year. However, against a backdrop of near zero interest rates that have nowhere to go but up, the alternatives are not good. Barring a geopolitical crisis with Russia, our current expectation is for a 6 percent total return for the S&P 500 Index in 2015. This expectation is in-line with the current expectation of earnings growth. Current earnings expectations are probably still a bit high considering that energy sector earnings expectations need to fall somewhat further to reflect the current forward oil price curve. Offsetting this expected decline is a 1.9 percent dividend yield on the S&P 500. Therefore, if the valuation multiple of 16.4 times the next 12 months’ earnings per share is maintained, we may see something close to a 6 percent total return for the market in 2015.
| | |
Blum (TCW – Growth): The sell-off in oil was abrupt and far greater than most had imagined possible over a year ago. This has many possible ramifications. Most obviously, lower oil prices will lead to reduced revenue for oil-producing nations, i.e., Russia and Saudi Arabia, and, as investment | | “As we enter 2015, we expect higher volatility and, thus, more opportunities to add to our portfolio of companies with pricing power, resilient business models and growing end markets.” Craig Blum (TCW – Growth) |
in oil drilling potentially declines, earnings for oil service companies will be pressured. The U.S. dollar will likely continue to strengthen, becoming a potential headwind for many multinational corporations, particularly in the technology sector. Encouragingly, the oil price drop equates to cheaper gasoline prices, which should act as a massive tax break for the U.S. consumer. As we enter 2015, we expect higher volatility and, thus, more opportunities to add to our portfolio of companies with pricing power, resilient business models and growing end markets.
Let’s get the value perspective. David Katz, what is your view?
Katz (Matrix – Value): After a multi-year period of little downside volatility, the market returned to a more normal environment of generally favorable returns mixed with periodic macro- or fear-driven sell-offs. Ultimately, favorable fundamentals enabled stock prices to trade higher and overwhelm these pull-backs.
We would not read too much into this return to more typical volatility. Over the last 30-plus years, bouts of market volatility ebbed and flowed around the “hysteria du jour.” All have subsequently been resolved, and stocks have ultimately traded higher, achieving healthy returns
for investors over time. We expect this recently greater volatility to continue in 2015, sparked by concerns about the Fed raising interest rates, international economic growth and geopolitical uncertainty. In the end though, fundamentals and valuations will drive stock prices, similar to the fourth quarter of 2014. We believe these latter considerations are generally favorable and should allow for positive stock returns.
While these scares are unsettling, they create investment opportunities for a disciplined and seasoned investor. We attempt to take advantage of these sell-offs by buying into stocks or sectors where the decline is overdone, and where there is compelling upside potential when the dust settles.
Pzena (Pzena – Value): Resilience of the U.S. economy, as witnessed by strong GDP and employment growth, helped U.S. markets recover from bouts of uncertainty driven by questionable economic prospects outside the U.S. during 2014. Inevitably, markets will continue to react to economic and geopolitical news in the coming year, but our advice is to stick to a valuation-based investment approach that filters out the day-to-day noise and focuses on the long-term prospects of a company based on the strength of its underlying business franchise. Volatility has increased from abnormally low levels, and our experience has shown that investors tend to overreact to near-term events, thereby creating opportunities to invest in leading businesses at a fraction of their underlying value. We see these types of opportunities today in financial services, mature technology and energy companies, which make up the bulk of our portfolio’s exposures.
Schneider (Schneider Capital Management – Value): The sharp market movements in the latter portion of 2014 were symptomatic of investors’ shortened investment horizons. The resulting volatility caused some stock prices to move, either up or down, more than the underlying fundamentals support. However, low oil prices have widened overall credit spreads markedly in the second half of the year, which is a modest negative for equities and will likely lead to more episodes like these. Additionally, these oil prices have unleashed powerful geopolitical strains that will add to volatility.
As deep-value investors, we are constantly in search of stocks where our research indicates that a company is selling well below what we believe to be its true intrinsic value and where earnings will be improving in the next 12 months. Market volatility creates opportunities to purchase such stocks at temporarily lowered prices or, in some cases, to sell stocks at shorter-lived elevated prices.
| | | | | | |
ANNUAL REPORT | |
| | DECEMBER 31, 2014 | | |
| | | | |
LIBERTY ALL-STAR® EQUITY FUND | | | | 11 |
MANAGER ROUNDTABLE (UNAUDITED) | | | |
Thank you very much. A question for the value style managers: The fact that you base buy/sell decisions on stock-by-stock bottom-up analysis notwithstanding, we would still like to inquire whether you believe the sell-off in the energy sector creates buying opportunities, or whether you view the decline in energy prices as more of a secular phenomenon that is likely to persist for some time to come. Let’s start with Arnie Schneider.
Schneider (Schneider Capital Management – Value): The market’s dramatic reaction to the short-term collapse in energy prices has created some very compelling investment opportunities in oil, gas and other energy-related companies that we believe offer significant upside potential.
At current prices, the industry cannot remotely begin to economically offset its 5 percent supply curve decline. We continue to maintain our long-term economic view of $90 per barrel for West Texas Intermediate crude, but expect the recovery to take a few years. In the interim, the modest 4 percent current spare capacity of nearly 4 million barrels per day will begin to dissipate as U.S. production growth slows and global demand increases.
The Saudis have remained steadfast in their statements and actions that they will not cut production to support prices. While they have the financial wherewithal to survive with oil at or below $60 per barrel for possibly five years, many other oil producing countries, especially Venezuela, Iran, Nigeria and Russia, require oil at or above $100 per barrel to keep their fragile economies going.
| | |
Katz (Matrix – Value): We believe this historic sell-off in oil prices has become overextended and that prices are far too low for the longer term. While short-term prices can be irrational, we believe simple supply/demand economics will kick in. Supply will fall as it becomes less attractive to drill, and demand will rise as consumers, businesses and | | “We believe this historic sell-off in oil prices has become overextended and that prices are far too low for the longer term. While short-term prices can be irrational, we believe simple supply/ demand economics will kick in.” David Katz (Matrix– Value) |
oil-consuming economies see a major expense falling sharply. We are already seeing this play out: New well permits are down significantly, capital expenditure programs for many drillers have been slashed by billions of dollars, consumers are driving more and new SUV and truck sales are growing. In addition, many OPEC nations have a strong incentive to see higher prices, and we think OPEC might change its current course over the next few months in a manner aimed at achieving that objective. Ultimately, we think the microeconomics of energy production argue for an oil price closer to $80 plus, and we expect movement toward that level during 2015.
After the recent sell-off, we believe that many energy stocks are selling at very attractive valuations. We hold very high quality, production-related companies that are well-situated to navigate these very low prices and their stock prices should be significantly higher in the more normal environment we foresee over the coming year. As we get greater clarity on the timing of oil’s recovery—and/ or believe catalysts are in place to realize value sooner—we might add to positions or add names in other areas of the sector.
Pzena (Pzena – Value): It is our belief that the market dynamic that led to the recent collapse in oil prices and ensuing sell-off in the energy sector is straightforward: consistently high oil prices attracted capital investment that stimulated production that has resulted in the supply of oil exceeding demand. Although we believe that oil prices should ultimately normalize at higher levels, it will take time for the market to stabilize and there are structural reasons why supply is not likely to be curtailed in the near future. As a result, there remains downside risk to both the oil price and to related equities in the near term. The bulk of our investments in the energy sector are in the integrated oil companies that have strong balance sheets and diversified business models that can also benefit should weaker players exit the market. Although our original investment thesis on the integrateds was not based on a forecast of high oil prices, we believe our holdings are attractive even if oil prices remain low for an extended period. Our research will continue to focus on businesses across the energy sector that have downside protection and are attractively valued based on a range of oil prices.
Now, a question for the growth style managers: The recent sell-off in equities spread way beyond the energy sector owing to its implications for slower economies around the world and, in some cases, outright deflation. Shouldn’t that have favorable implications for the stocks of companies that have strong positions in high growth markets? Or are investors saying that their growth will be impacted as well? Craig Blum, will you start us off?
Blum (TCW – Growth): Global central banks have been pumping money into the system for years, yet deflation has become the bigger risk of late given the precipitous drop in the price of oil. QE tapering concluded late last year and interest rates should arguably be higher, but the world is flush with cash and searching for yield with a backdrop of slower global growth, falling inflation and low liquidity. There are risks and we expect some
| | |
www.all-starfunds.com | | USA |
| | | | |
| 12 | | | | LIBERTY ALL-STAR® EQUITY FUND |
| | | MANAGER ROUNDTABLE (UNAUDITED) |
| | | | |
volatility but note that the fundamentals for a majority of our companies are very strong. We view the recent volatility as a net positive for our concentrated portfolio of companies with defensible business models, pricing power, best of breed management teams and growing end markets.
Kamp (Cornerstone – Growth): The recent sell-off reflected fears that growth expectations—for revenue, earnings and cash flow—would have to be revised downward. Some industries and companies were affected more than others, however, because some are more likely to be impacted than others. The tension in the market is one of trying to determine when the negative estimate revisions are fully reflected in a given stock. Until those estimates have bottomed, the greatest risk exists in the stocks of those companies with the largest negative revisions. These stocks are often the fastest growers. Safety can be found in the stocks of less affected companies that can plow through the economic difficulty due to any of a variety of factors. Once the estimates have bottomed, however, investors will most highly prize those companies that can generate superior earnings growth in a slow growth environment, especially in one accompanied by low interest rates. Such is the focus of our research.
Two thousand fourteen was a challenging year for active managers, active management referring to investment funds for which a portfolio manager or team makes decisions about which stocks and in what weight will be held. The opposite is passive management or indexing, in which portfolio holdings mirror the components of a market index. From your perspective, why was 2014 such a difficult year for active managers? Let’s stay with the growth managers and invite Tom Kamp to go first.
Kamp (Cornerstone – Growth): The S&P 500 beat the expectations of many investors for a low double-digit return, in-line with earnings growth. Although I don’t have the data to support this statement, I suspect that most managers underperformed the most in the first quarter, which continued the momentum-driven market environment of valuation expansion that we saw in 2013. The subsequent quarters provided greater volatility, which benefits active managers with superior research-based insights.
It is also worth mentioning that the large size of Apple Computer in the benchmark makes it very difficult for active managers to take a positive active weight. This stock represents 6.24 percent of the Russell 1000®
Growth Index. Few managers had a positive active weight in this stock, which was a superb performer in 2014.
Craig Blum, what about TCW’s thoughts?
Blum (TCW – Growth): First, six years of QE has led to asset reflation and a global thirst for yield; currently about one-third of the stocks in the S&P 500 carry dividend yields greater than 10-year U.S. Treasuries. Second, interest rates have plummeted, boosting the performance of stocks seen as bond proxies, a majority of which come from the utility, telecom and consumer staples sectors. It is very unusual for defensive stocks to lead an advance in the S&P 500 of more than 14 percent. Third, although much has been made of stock correlations coming down, which is true, most people are unaware that during the majority of 2014 the delta, or difference, between the top and bottom decile performing stocks within the S&P 500 was near the lowest it has been in over 25 years, according to a study by Bank of America Merrill Lynch. This means there is little investor differentiation between the quality and business model advantages of companies. Lastly, and probably most obviously, as money has more moved to passive investing, the stocks in these market-cap weighted indices are unnaturally bid up.
Value managers, let’s hear from you on this question. David Katz, please lead off.
Katz (Matrix – Value): The past year was a difficult one for active managers, with a number of crosscurrents that rendered fundamental stock selection for both growth and value less effective over the period. Some of these factors follow:
While it was a “risk-on” year for stocks, the lower risk sectors, such as utilities and consumer staples, had the best returns. Both generally have a low revenue and earnings growth outlook, yet are selling at the upper ends of their historical valuation parameters. The valuations and fundamentals of these groups were unattractive to both value and growth investors, and their underweights hurt relative returns. Conversely, certain groups with very attractive valuation metrics, like energy and industrials, had a difficult period, which resulted in the cheap getting cheaper. This also hurt relative returns. Next, owning small and mid-sized companies likely hurt returns as these capitalizations lagged the major indices. Finally, specific industries like social media and biotech started the year selling at very rich valuations. Many extended their gains to levels that value investors found questionable but where growth investors thought there were more attractive alternatives.
| | | | | | |
ANNUAL REPORT | |
| | DECEMBER 31, 2014 | | |
| | | | |
LIBERTY ALL-STAR® EQUITY FUND | | | | 13 |
MANAGER ROUNDTABLE (UNAUDITED) | | | |
The silver lining to the difficult 2014 environment is that it has further stretched some valuations to extremes. As in previous cycles, we believe this phenomenon has set the stage for active managers to produce very attractive returns in the upcoming year.
| | |
Pzena (Pzena – Value): There were two factors that we believe contributed to making 2014 a challenging year for active managers: the decline in interest rates from already low levels at the beginning of the year and the collapse in oil prices. Conventional wisdom at the outset of 2014 anticipated higher interest rates as the Federal Reserve’s quantitative | | “...two factors contributed to making 2014 a challenging year for active managers: the decline in interest rates from already low levels at the beginning of the year and the collapse in oil prices.” Rich Pzena (Pzena – Value) |
easing program wound down and the U.S. economy continued its gradual improvement. Instead, interest rates on 10-year treasuries fell from 3.0 percent to 2.2 percent, creating challenges for managers underexposed to stocks that typically do well in falling interest rate environments.
After three years of relatively stable prices, oil plunged 48 percent from $110 to $57 per barrel for Brent crude during the year as increases in the supply of oil outpaced slowing demand growth. As a result, energy was the worst performing sector for 2014, which may have also created challenges for active managers overexposed to this sector.
Schneider (Schneider Capital Management – Value):
| | |
In general, 2014 was a year in which managers that looked more like their benchmark did much better than those who were different than their benchmark. Investors demonstrated risk-averse tendencies, gravitating to stocks that quickly returned capital to shareholders via dividends or share repurchases. | | “In general, 2014 was a year in which managers that looked more like their benchmark did much better than those who were different than their benchmark.” Arnie Schneider (Schneider Capital Management – Value) |
The largest, mega-capitalization stocks were among the best performers, and diversification, especially in regard to sector weights, i.e., overweights or underweights, was a detriment to performance. The perceived “safe” sectors of health care, utilities and consumer staples performed much better than the broad market.
High active share1 was a drag on returns as the benchmark names tended to outperform non-benchmark names. Lastly, a lack of exposure to the top performing stocks in the indexes was a drag on returns for most active managers.
What is a stock in the portion of the Liberty All-Star Equity Fund that you manage that did especially well for you in 2014, and what is a stock whose prospects you like for 2015? Arnie Schneider, please go first for the value managers.
Schneider (Schneider Capital Management – Value): Our position in Marriott International helped performance in 2014. Strong demand and continued low supply drove revenue and margin improvement for Marriott and the hotel industry. The outlook for growth in rooms carrying Marriott brands also improved in 2014, driven by new hotels (primarily in international markets) as well as brand conversions and acquisitions of smaller brands. Marriott also continued to use growing free cash flow to reduce the share count.
We expect Citigroup to be a strong performer in 2015. Last year Citigroup was hurt by litigation and repositioning charges, a weak trading environment and its qualitative failure of the Fed stress test despite strong capital levels. We expect Citigroup to pass the stress test and begin share repurchases in 2015, as already strong capital ratios have continued to improve. Additionally, the completed repositioning or exiting of several underperforming businesses will drive significantly improved operating efficiency and earnings in 2015 and beyond.
Katz (Matrix – Value): One strong performer was Teva Pharmaceutical, which benefited from many positive factors, including investor and board activism, to drive shareholder value, favorable fundamentals and significant multiple expansion. After years of underperformance, Teva’s board reacted to shareholder pressure and named a new CEO charged with increasing value through stringent cost controls and aggressive portfolio repositioning. The company also had a number of favorable clinical and legal developments benefiting its flagship product, Copaxone. Consequently, the stock saw significant appreciation. While it was one of our top 2014 performers, it is still attractively valued and should continue its gains this year.
Qualcomm is particularly well positioned for 2015. It is the premier wireless communication equipment player worldwide, and a significant beneficiary of the continued rollout of smartphones. The company’s technological superiority and the global growth of the end market led
| 1 | High active share is an investment term that emerged from an academic study at Yale University. Active share relates to the difference between a manager’s portfolio holdings and those in the relevant benchmark. The greater the difference, the higher the active share. |
| | |
www.all-starfunds.com | | USA |
| | | | |
| 14 | | | | LIBERTY ALL-STAR® EQUITY FUND |
| | | MANAGER ROUNDTABLE (UNAUDITED) |
| | | | |
to a decade-plus of strong revenue growth, double-digit earnings growth and massive free cash flow generation, accumulating to nearly $19 a share in net cash as of September 30, 2014. While Qualcomm’s dominant position and long-term outlook continue to be very favorable, the stock was only modestly higher last year, lagging the market and its peers. As a result of short-term setbacks, the stock didn’t participate in the technology sector’s strong gains in 2014 and sells at a modest 14.2 times 2015 earnings. Management is very shareholder oriented and has been aggressively both growing its dividend, currently at 2.3 percent, and executing a multi-billion dollar share repurchase program. We expect that business will continue to grow and that China’s regulatory investigation of the company’s pricing will be resolved. While we anticipate considerable fines and concessions to settle the dispute, we believe that the stock is poised for a meaningful move higher as these overhangs dissipate and the company delivers strong and growing earnings and cash flows.
Pzena (Pzena – Value): Hewlett-Packard (symbol: HPQ), a global leader in technology products and services, advanced 46 percent during the year as investors realized their fears of this strong franchises’ demise had been overblown. In addition, an increase in corporate spending on PCs helped the company deliver consensus-beating earnings results. Although we have harvested some profits, HPQ remains an attractive opportunity. Regarding opportunities heading into 2015, we believe the global banks, such as Bank of America, Citigroup and JPMorgan, represent some of the best risk/reward opportunities in our investment universe today. Although investors are focused on regulatory and legal uncertainties, we believe there is a real case for significant earnings upside through normalization of interest rates, securities trading activity and expense rationalization. Coupled with depressed valuations, we see these as compelling investment opportunities.
Craig Blum and Tom Kamp, wrap it up for us with insights into your growth portfolios.
Blum (TCW – Growth): Allergan, which we first purchased in December 2008, was our best performing stock in 2014. We were initially attracted to the company’s cash flow generation and strong portfolio of therapeutic products. In April, Valeant Pharmaceuticals (with Pershing Square in its corner) made an unsolicited bid for the company, valuing it at $47 billion. Seven months later, Actavis entered into an agreement to purchase Allergan for about $66 billion. For 2015 and beyond, we are particularly constructive on Illumina, the market leader in the rapidly growing end market of next generation
gene sequencing. Illumina’s technology is widely used in genetic research and increasingly used for broader functions, such as drug discovery, clinical diagnostics, forensics, agbio and personalized medicine. The pace of innovation in the industry has been staggering: 13 years ago, the sequencing cost per genome was about $100 million. Today, with Illumina’s HiSeqX, the human genome can now be sequenced in under three hours for about $1,000 per genome.
Kamp (Cornerstone – Growth): One of the top performing stocks in the portfolio was Gilead Sciences. We successfully traded around a core position in this name, driven by the fundamentals as we understood them throughout the year. We began the year with a modest position as a result of a trim in late 2013 as the reward-to-risk ratio declined in anticipation of the launch of the company’s blockbuster drug for Hepatitis C, Sovaldi. We used the pull-back in April and May that hit many biotech/pharma stocks and the fears that doctors would hold off treatment in advance of the anticipated all-oral version of the drug to add to our Gilead holdings. As the stock recovered to record levels, we trimmed and ultimately exited in early September, very close to the top in the stock’s price. We exited since the stock price was full relative to each of our valuation methodologies and competition from another company, Abbvie, was coming. Once the competitive product was announced and pharma benefits company Express Scripps signed Abbvie to an exclusive arrangement, Gilead’s stock price sank almost 20 percent. We used that weakness to re-enter the stock since we believed the reaction was overdone.
One of the stocks that we are most excited about is Affiliated Managers Group, Inc. (symbol: AMG), a global asset management company that invests in leading boutique investment management firms. We purchased AMG on a pullback in the company’s valuation in December caused by a slowing in net inflows, a slower rate of acquisitions and a choppy equity market. While net inflows have slowed somewhat, inflows remain well above peer levels. Management recently indicated that the acquisition pipeline is strong, setting up 2015 for a big year. Emerging catalysts of share repurchases and a structurally declining tax rate are also underappreciated by the market. As a result, we believe that AMG should regain its historical average relative market multiple of 1.1 to 1.2x versus its current multiple of 0.9x. With a high reward–risk-ratio, AMG is very attractive to us.
Many thanks to all for sharing excellent insights into your investment philosophy and for perspective that may be useful to individual investors.
| | | | | | |
ANNUAL REPORT | |
| | DECEMBER 31, 2014 | | |
| | | | |
LIBERTY ALL-STAR® EQUITY FUND | | | | 15 |
TOP 20 HOLDINGS AND ECONOMIC SECTORS (UNAUDITED) | | | |
as of December 31, 2014
| | | | | | |
| | | |
| | | TOP 20 HOLDINGS * | | PERCENT OF NET ASSETS | | |
| | | |
| | | JPMorgan Chase & Co. | | 2.18% | | |
| | | |
| | | Salesforce.com, Inc. | | 2.05 | | |
| | | |
| | | State Street Corp. | | 1.96 | | |
| | | |
| | | Citigroup, Inc. | | 1.81 | | |
| | | |
| | | Google, Inc., Class A & C | | 1.74 | | |
| | | |
| | | Visa, Inc., Class A | | 1.73 | | |
| | | |
| | | Starbucks Corp. | | 1.57 | | |
| | | |
| | | SunTrust Banks, Inc. | | 1.52 | | |
| | | |
| | | Hewlett-Packard Co. | | 1.50 | | |
| | | |
| | | American International Group, Inc. | | 1.40 | | |
| | | |
| | | MetLife, Inc. | | 1.35 | | |
| | | |
| | | Precision Castparts Corp. | | 1.34 | | |
| | | |
| | | QUALCOMM, Inc. | | 1.27 | | |
| | | |
| | | Facebook, Inc., Class A | | 1.23 | | |
| | | |
| | | Marriott International, Inc., Class A | | 1.23 | | |
| | | |
| | | Microsoft Corp. | | 1.19 | | |
| | | |
| | | Bank of America Corp. | | 1.18 | | |
| | | |
| | | Morgan Stanley | | 1.13 | | |
| | | |
| | | Schlumberger Ltd. | | 1.13 | | |
| | | |
| | | Amazon.com, Inc. | | 0.98 | | |
| | | |
| | | | 29.49% | | |
| | | | | | |
| | | |
| | | ECONOMIC SECTORS * | | PERCENT OF NET ASSETS | | |
| | | |
| | | Financials | | 28.49% | | |
| | | |
| | | Information Technology | | 20.16 | | |
| | | |
| | | Consumer Discretionary | | 16.38 | | |
| | | |
| | | Health Care | | 11.88 | | |
| | | |
| | | Energy | | 10.40 | | |
| | | |
| | | Industrials | | 6.12 | | |
| | | |
| | | Consumer Staples | | 3.66 | | |
| | | |
| | | Materials | | 0.57 | | |
| | | |
| | | Utilities | | 0.08 | | |
| | | |
| | | Other Net Assets | | 2.26 | | |
| | | |
| | | | 100.00% | | |
| |
| | * Because the Fund is actively managed, there can be no guarantee that the Fund will continue to hold securities of the indicated issuers and sectors in the future. |
| | |
www.all-starfunds.com | | USA |
| | | | |
| 16 | | | | LIBERTY ALL-STAR® EQUITY FUND |
| | | MAJOR STOCK CHANGES IN THE QUARTER (UNAUDITED) |
December 31, 2014 |
The following are the major ($5 million or more) stock changes—both purchases and sales—that were made in the Fund’s portfolio during the fourth quarter of 2014.
| | | | | | | | | | |
| | | SHARES | | |
| SECURITY NAME | | PURCHASES (SALES) | | HELD AS OF 12/31/14 | | |
PURCHASES | | | | | | | | | | |
EOG Resources, Inc. | | 61,848 | | | | 61,848 | | | | |
| | | | | |
Facebook, Inc., Class A | | 70,689 | | | | 193,715 | | | | |
| | | | | |
Ford Motor Co. | | 326,400 | | | | 326,400 | | | | |
| | | | | |
Gilead Sciences, Inc. | | 56,903 | | | | 69,403 | | | | |
| | | | | |
Las Vegas Sands Corp. | | 84,678 | | | | 84,678 | | | | |
| | | | | |
Stanley Black & Decker, Inc. | | 52,875 | | | | 52,875 | | | | |
| | | | | |
State Street Corp. | | 75,176 | | | | 302,276 | | | | |
| | | | | |
WPX Energy, Inc. | | 610,965 | | | | 610,965 | | | | |
SALES | | | | | | | | | | |
Bank of America Corp. | | (466,540) | | | | 807,524 | | | | |
| | | | | |
Becton, Dickinson & Co. | | (43,350) | | | | 0 | | | | |
| | | | | |
CME Group, Inc. | | (72,045) | | | | 0 | | | | |
| | | | | |
General Motors Co. | | (157,600) | | | | 0 | | | | |
| | | | | |
Schlumberger Ltd. | | (86,523) | | | | 161,815 | | | | |
| | | | | | |
ANNUAL REPORT | |
| | DECEMBER 31, 2014 | | |
| | | | |
LIBERTY ALL-STAR® EQUITY FUND | | | | 17 |
SCHEDULE OF INVESTMENTS | | | |
as of December 31, 2014
| | | | | | | | | | | | | | |
COMMON STOCKS (97.74%) | | | SHARES | | | | | | MARKET VALUE | | | |
| | | | |
u CONSUMER DISCRETIONARY (16.38%) | | | | | | | | | | | | |
| | Auto Components (1.08%) | | | | | | | | | | | | |
| | Delphi Automotive PLC | | | 14,411 | | | | | $ | 1,047,968 | | | |
| | Johnson Controls, Inc. | | | 150,000 | | | | | | 7,251,000 | | | |
| | TRW Automotive Holdings Corp.(a) | | | 48,400 | | | | | | 4,977,940 | | | |
| | | | | | | | | | | 13,276,908 | | | |
| | | | | |
| | Automobiles (0.57%) | | | | | | | | | | | | |
| | Ford Motor Co. | | | 326,400 | | | | | | 5,059,200 | | | |
| | Tesla Motors, Inc.(a) | | | 8,880 | | | | | | 1,975,001 | | | |
| | | | | | | | | | | 7,034,201 | | | |
| | | | | |
| | Hotels, Restaurants & Leisure (5.12%) | | | | | | | | | | | | |
| | Carnival Corp. | | | 247,850 | | | | | | 11,235,041 | | | |
| | Chipotle Mexican Grill, Inc.(a) | | | 9,390 | | | | | | 6,427,549 | | | |
| | Las Vegas Sands Corp. | | | 84,678 | | | | | | 4,924,872 | | | |
| | Marriott International, Inc., Class A | | | 193,281 | | | | | | 15,081,716 | | | |
| | McDonald’s Corp. | | | 62,000 | | | | | | 5,809,400 | | | |
| | Starbucks Corp. | | | 233,682 | | | | | | 19,173,608 | | | |
| | | | | | | | | | | 62,652,186 | | | |
| | | | | |
| | Household Durables (2.08%) | | | | | | | | | | | | |
| | Lennar Corp., Class A | | | 173,040 | | | | | | 7,753,922 | | | |
| | PulteGroup, Inc. | | | 271,088 | | | | | | 5,817,549 | | | |
| | Taylor Morrison Home Corp., Class A(a) | | | 71,159 | | | | | | 1,344,194 | | | |
| | Toll Brothers, Inc.(a) | | | 307,516 | | | | | | 10,538,573 | | | |
| | | | | | | | | | | 25,454,238 | | | |
| | | | | |
| | Internet & Catalog Retail (1.75%) | | | | | | | | | | | | |
| | Amazon.com, Inc.(a) | | | 38,506 | | | | | | 11,950,337 | | | |
| | priceline.com, Inc.(a) | | | 8,350 | | | | | | 9,520,754 | | | |
| | | | | | | | | | | 21,471,091 | | | |
| | | | | |
| | Media (3.00%) | | | | | | | | | | | | |
| | CBS Corp., Class B | | | 59,019 | | | | | | 3,266,111 | | | |
| | Comcast Corp., Class A | | | 113,109 | | | | | | 6,561,453 | | | |
| | The Interpublic Group of Cos., Inc. | | | 128,075 | | | | | | 2,660,118 | | | |
| | News Corp., Class A(a) | | | 305,600 | | | | | | 4,794,864 | | | |
| | News Corp., Class B(a) | | | 112,445 | | | | | | 1,695,671 | | | |
| | Omnicom Group, Inc. | | | 93,825 | | | | | | 7,268,623 | | | |
| | Time Warner Cable, Inc. | | | 21,324 | | | | | | 3,242,527 | | | |
| | The Walt Disney Co. | | | 76,999 | | | | | | 7,252,536 | | | |
| | | | | | | | | | | 36,741,903 | | | |
| | | | | |
| | Multi-Line Retail (0.41%) | | | | | | | | | | | | |
| | Dollar General Corp.(a) | | | 70,563 | | | | | | 4,988,804 | | | |
| | | | | |
| | Specialty Retail (1.90%) | | | | | | | | | | | | |
| | The Home Depot, Inc. | | | 60,760 | | | | | | 6,377,977 | | | |
| | Office Depot, Inc.(a) | | | 482,550 | | | | | | 4,137,866 | | | |
See Notes to Schedule of Investments and Financial Statements.
| | |
www.all-starfunds.com | | USA |
| | | | |
| 18 | | | | LIBERTY ALL-STAR® EQUITY FUND |
| | | SCHEDULE OF INVESTMENTS |
| | as of December 31, 2014 |
| | | | | | | | | | | | | | |
| COMMON STOCKS (continued) | | SHARES | | | | | MARKET VALUE | | | |
| | | | | |
| | Specialty Retail (1.90%) (continued) | | | | | | | | | | | | |
| | Staples, Inc. | | | 367,550 | | | | | $ | 6,660,006 | | | |
| | Tiffany & Co. | | | 57,315 | | | | | | 6,124,681 | | | |
| | | | | | | | | | | 23,300,530 | | | |
| | | | | |
| | Textiles, Apparel & Luxury Goods (0.47%) | | | | | | | | | | | | |
| | NIKE, Inc., Class B | | | 59,396 | | | | | | 5,710,925 | | | |
| | | | |
u CONSUMER STAPLES (3.66%) | | | | | | | | | | | | |
| | Beverages (0.88%) | | | | | | | | | | | | |
| | Diageo PLC(b) | | | 23,316 | | | | | | 2,660,123 | | | |
| | PepsiCo, Inc. | | | 61,500 | | | | | | 5,815,440 | | | |
| | SABMiller PLC(b) | | | 45,418 | | | | | | 2,341,752 | | | |
| | | | | | | | | | | 10,817,315 | | | |
| | | | | |
| | Food & Staples Retailing (1.06%) | | | | | | | | | | | | |
| | Costco Wholesale Corp. | | | 44,775 | | | | | | 6,346,856 | | | |
| | CVS Health Corp. | | | 68,500 | | | | | | 6,597,235 | | | |
| | | | | | | | | | | 12,944,091 | | | |
| | | | | |
| | Food Products (0.59%) | | | | | | | | | | | | |
| | Mead Johnson Nutrition Co. | | | 71,900 | | | | | | 7,228,826 | | | |
| | | | | |
| | Household Products (0.67%) | | | | | | | | | | | | |
| | The Procter & Gamble Co. | | | 90,500 | | | | | | 8,243,645 | | | |
| | | | | |
| | Personal Products (0.46%) | | | | | | | | | | | | |
| | The Estee Lauder Cos., Inc., Class A | | | 73,074 | | | | | | 5,568,239 | | | |
| | | | |
u ENERGY (10.40%) | | | | | | | | | | | | |
| | Energy Equipment & Services (2.45%) | | | | | | | | | | | | |
| | Baker Hughes, Inc. | | | 66,300 | | | | | | 3,717,441 | | | |
| | Oceaneering International, Inc. | | | 60,775 | | | | | | 3,574,178 | | | |
| | Schlumberger Ltd. | | | 161,815 | | | | | | 13,820,619 | | | |
| | Weatherford International Ltd.(a) | | | 781,088 | | | | | | 8,943,457 | | | |
| | | | | | | | | | | 30,055,695 | | | |
| | | | | |
| | Oil, Gas & Consumable Fuels (7.95%) | | | | | | | | | | | | |
| | Anadarko Petroleum Corp. | | | 63,929 | | | | | | 5,274,143 | | | |
| | Arch Coal, Inc.(c) | | | 1,565,642 | | | | | | 2,786,843 | | | |
| | BP PLC(b) | | | 244,300 | | | | | | 9,312,724 | | | |
| | Chesapeake Energy Corp. | | | 518,266 | | | | | | 10,142,466 | | | |
| | Chevron Corp. | | | 58,000 | | | | | | 6,506,440 | | | |
| | Cobalt International Energy, Inc.(a) | | | 172,093 | | | | | | 1,529,907 | | | |
| | ConocoPhillips | | | 86,500 | | | | | | 5,973,690 | | | |
| | Devon Energy Corp. | | | 163,230 | | | | | | 9,991,308 | | | |
| | EOG Resources, Inc. | | | 61,848 | | | | | | 5,694,345 | | | |
| | Exxon Mobil Corp. | | | 44,775 | | | | | | 4,139,449 | | | |
See Notes to Schedule of Investments and Financial Statements.
| | | | | | |
ANNUAL REPORT | |
| | DECEMBER 31, 2014 | | |
| | | | |
LIBERTY ALL-STAR® EQUITY FUND | | | | 19 |
SCHEDULE OF INVESTMENTS | | | |
as of December 31, 2014 | | | | |
| | | | | | | | | | |
| COMMON STOCKS (continued) | | SHARES | | | MARKET VALUE | |
| | | |
| | Oil, Gas & Consumable Fuels (7.95%) (continued) | | | | | | | | |
| | Murphy Oil Corp. | | | 94,175 | | | $ | 4,757,721 | |
| | Occidental Petroleum Corp. | | | 85,000 | | | | 6,851,850 | |
| | Peabody Energy Corp.(c) | | | 897,320 | | | | 6,945,257 | |
| | Royal Dutch Shell PLC, Class A(b) | | | 154,493 | | | | 10,343,306 | |
| | WPX Energy, Inc.(a) | | | 610,965 | | | | 7,105,523 | |
| | | | | | | | | 97,354,972 | |
| | |
u FINANCIALS (28.49%) | | | | | | | | |
| | Banks (0.37%) | | | | | | | | |
| | First Niagara Financial Group, Inc. | | | 539,370 | | | | 4,546,889 | |
| | | |
| | Capital Markets (6.03%) | | | | | | | | |
| | Affiliated Managers Group, Inc.(a) | | | 24,375 | | | | 5,173,350 | |
| | Ameriprise Financial, Inc. | | | 34,980 | | | | 4,626,105 | |
| | The Charles Schwab Corp. | | | 262,600 | | | | 7,927,894 | |
| | Franklin Resources, Inc. | | | 85,600 | | | | 4,739,672 | |
| | The Goldman Sachs Group, Inc. | | | 37,450 | | | | 7,258,934 | |
| | Morgan Stanley | | | 357,175 | | | | 13,858,390 | |
| | State Street Corp. | | | 305,276 | | | | 23,964,166 | |
| | UBS Group AG(a) | | | 370,400 | | | | 6,315,320 | |
| | | | | | | | | 73,863,831 | |
| | | |
| | Commercial Banks (5.07%) | | | | | | | | |
| | Barclays PLC(b) | | | 261,781 | | | | 3,929,333 | |
| | BB&T Corp. | | | 205,000 | | | | 7,972,450 | |
| | Comerica, Inc. | | | 70,225 | | | | 3,289,339 | |
| | First Republic Bank | | | 102,030 | | | | 5,317,803 | |
| | The PNC Financial Services Group, Inc. | | | 70,666 | | | | 6,446,859 | |
| | Regions Financial Corp. | | | 651,453 | | | | 6,879,344 | |
| | SunTrust Banks, Inc. | | | 444,978 | | | | 18,644,578 | |
| | Wells Fargo & Co. | | | 176,000 | | | | 9,648,320 | |
| | | | | | | | | 62,128,026 | |
| | | |
| | Consumer Finance (2.73%) | | | | | | | | |
| | American Express Co. | | | 42,500 | | | | 3,954,200 | |
| | Capital One Financial Corp. | | | 101,000 | | | | 8,337,550 | |
| | Visa, Inc., Class A | | | 80,561 | | | | 21,123,094 | |
| | | | | | | | | 33,414,844 | |
| | | |
| | Diversified Financial Services (5.99%) | | | | | | | | |
| | Bank of America Corp. | | | 807,524 | | | | 14,446,604 | |
| | Citigroup, Inc. | | | 408,754 | | | | 22,117,679 | |
| | JPMorgan Chase & Co. | | | 426,500 | | | | 26,690,370 | |
| | Voya Financial, Inc. | | | 239,370 | | | | 10,144,501 | |
| | | | | | | | | 73,399,154 | |
| | | |
| | Insurance (6.79%) | | | | | | | | |
| | ACE Ltd. | | | 84,900 | | | | 9,753,312 | |
| | The Allstate Corp. | | | 68,807 | | | | 4,833,692 | |
See Notes to Schedule of Investments and Financial Statements.
| | |
www.all-starfunds.com | | USA |
| | | | |
| 20 | | | | LIBERTY ALL-STAR® EQUITY FUND |
| | | SCHEDULE OF INVESTMENTS |
| | | | as of December 31, 2014 |
| | | | | | | | | | |
| COMMON STOCKS (continued) | | SHARES | | | MARKET VALUE | |
| | | |
| | Insurance (6.79%) (continued) | | | | | | | | |
| | American International Group, Inc. | | | 305,531 | | | $ | 17,112,791 | |
| | Assured Guaranty Ltd. | | | 246,096 | | | | 6,396,035 | |
| | Axis Capital Holdings Ltd. | | | 156,000 | | | | 7,970,040 | |
| | First American Financial Corp. | | | 110,452 | | | | 3,744,323 | |
| | Genworth Financial, Inc., Class A(a) | | | 207,100 | | | | 1,760,350 | |
| | The Hartford Financial Services Group, Inc. | | | 238,295 | | | | 9,934,519 | |
| | MetLife, Inc. | | | 304,725 | | | | 16,482,575 | |
| | Willis Group Holdings PLC | | | 115,350 | | | | 5,168,833 | |
| | | | | | | | | 83,156,470 | |
| | | |
| | Real Estate Investment Trusts (1.25%) | | | | | | | | |
| | American Tower Corp. | | | 118,260 | | | | 11,690,001 | |
| | NorthStar Realty Finance Corp. | | | 170,314 | | | | 2,994,120 | |
| | Paramount Group, Inc.(a) | | | 31,582 | | | | 587,110 | |
| | | | | | | | | 15,271,231 | |
| | | |
| | Real Estate Management & Development (0.26%) | | | | | | | | |
| | Forest City Enterprises, Inc., Class A(a) | | | 147,310 | | | | 3,137,703 | |
| | |
u HEALTH CARE (11.88%) | | | | | | | | |
| | Biotechnology (2.91%) | | | | | | | | |
| | Alexion Pharmaceuticals, Inc.(a) | | | 46,507 | | | | 8,605,190 | |
| | BioMarin Pharmaceutical, Inc.(a) | | | 79,045 | | | | 7,145,668 | |
| | Celgene Corp.(a) | | | 85,630 | | | | 9,578,572 | |
| | Gilead Sciences, Inc.(a) | | | 69,403 | | | | 6,541,927 | |
| | Pharmacyclics, Inc.(a) | | | 30,940 | | | | 3,782,724 | |
| | | | | | | | | 35,654,081 | |
| | | |
| | Health Care Equipment & Supplies (1.84%) | | | | | | | | |
| | Baxter International, Inc. | | | 69,025 | | | | 5,058,842 | |
| | Hologic, Inc.(a) | | | 336,400 | | | | 8,995,336 | |
| | Zimmer Holdings, Inc. | | | 74,500 | | | | 8,449,790 | |
| | | | | | | | | 22,503,968 | |
| | | |
| | Health Care Providers & Services (2.04%) | | | | | | | | |
| | Catamaran Corp.(a) | | | 206,150 | | | | 10,668,263 | |
| | Cigna Corp. | | | 80,500 | | | | 8,284,255 | |
| | Envision Healthcare Holdings, Inc.(a) | | | 98,163 | | | | 3,405,274 | |
| | Laboratory Corp. of America Holdings(a) | | | 24,025 | | | | 2,592,298 | |
| | | | | | | | | 24,950,090 | |
| | | |
| | Health Care Technology (1.52%) | | | | | | | | |
| | athenahealth, Inc.(a)(c) | | | 54,000 | | | | 7,867,800 | |
| | Cerner Corp.(a) | | | 166,668 | | | | 10,776,753 | |
| | | | | | | | | 18,644,553 | |
| | | |
| | Life Sciences Tools & Services (1.16%) | | | | | | | | |
| | Illumina, Inc.(a) | | | 42,700 | | | | 7,881,566 | |
| | Thermo Fisher Scientific, Inc. | | | 50,000 | | | | 6,264,500 | |
| | | | | | | | | 14,146,066 | |
See Notes to Schedule of Investments and Financial Statements.
| | | | | | |
ANNUAL REPORT | |
| | DECEMBER 31, 2014 | | |
| | | | |
LIBERTY ALL-STAR® EQUITY FUND | | | | 21 |
SCHEDULE OF INVESTMENTS | | | |
as of December 31, 2014 | | | | |
| | | | | | | | | | |
| COMMON STOCKS (continued) | | SHARES | | | MARKET VALUE | |
| | | |
| | Pharmaceuticals (2.41%) | | | | | | | | |
| | Abbott Laboratories | | | 107,925 | | | $ | 4,858,784 | |
| | Allergan, Inc. | | | 30,555 | | | | 6,495,687 | |
| | Johnson & Johnson | | | 66,500 | | | | 6,953,905 | |
| | Perrigo Co. PLC | | | 20,942 | | | | 3,500,665 | |
| | Teva Pharmaceutical Industries Ltd.(b) | | | 134,200 | | | | 7,717,842 | |
| | | | | | | | | 29,526,883 | |
| | |
uINDUSTRIALS (6.12%) | | | | | | | | |
| | Aerospace & Defense (1.94%) | | | | | | | | |
| | The Boeing Co. | | | 4,845 | | | | 629,753 | |
| | Bombardier, Inc., Class B | | | 872,993 | | | | 3,134,045 | |
| | Precision Castparts Corp. | | | 68,262 | | | | 16,442,950 | |
| | Textron, Inc. | | | 84,399 | | | | 3,554,042 | |
| | | | | | | | | 23,760,790 | |
| | | |
| | Building Products (0.49%) | | | | | | | | |
| | Masco Corp. | | | 238,725 | | | | 6,015,870 | |
| | | |
| | Electrical Equipment (0.72%) | | | | | | | | |
| | Eaton Corp. PLC | | | 129,000 | | | | 8,766,840 | |
| | | |
| | Machinery (1.43%) | | | | | | | | |
| | Caterpillar, Inc. | | | 62,000 | | | | 5,674,860 | |
| | Parker-Hannifin Corp. | | | 52,825 | | | | 6,811,784 | |
| | Stanley Black & Decker, Inc. | | | 52,875 | | | | 5,080,230 | |
| | | | | | | | | 17,566,874 | |
| | | |
| | Trading Companies & Distributors (1.23%) | | | | | | | | |
| | Fastenal Co. | | | 242,593 | | | | 11,537,723 | |
| | United Rentals, Inc.(a) | | | 33,961 | | | | 3,464,362 | |
| | | | | | | | | 15,002,085 | |
| | | |
| | Transportation Infrastructure (0.31%) | | | | | | | | |
| | Aegean Marine Petroleum Network, Inc. | | | 271,629 | | | | 3,808,238 | |
| | |
uINFORMATION TECHNOLOGY (20.16%) | | | | | | | | |
| | Communications Equipment (2.00%) | | | | | | | | |
| | Cisco Systems, Inc. | | | 319,000 | | | | 8,872,985 | |
| | QUALCOMM, Inc. | | | 209,400 | | | | 15,564,702 | |
| | | | | | | | | 24,437,687 | |
| | | |
| | Computers & Peripherals (2.12%) | | | | | | | | |
| | Hewlett-Packard Co. | | | 457,525 | | | | 18,360,478 | |
| | Stratasys Ltd.(a)(c) | | | 91,148 | | | | 7,575,311 | |
| | | | | | | | | 25,935,789 | |
| | | |
| | Electronic Equipment & Instruments (1.76%) | | | | | | | | |
| | Avnet, Inc. | | | 13,021 | | | | 560,163 | |
| | Corning, Inc. | | | 256,200 | | | | 5,874,666 | |
| | TE Connectivity Ltd. | | | 150,475 | | | | 9,517,544 | |
See Notes to Schedule of Investments and Financial Statements.
| | |
www.all-starfunds.com | | USA |
| | | | |
| 22 | | | | LIBERTY ALL-STAR® EQUITY FUND |
| | | SCHEDULE OF INVESTMENTS |
| | | | as of December 31, 2014 |
| | | | |
| | | | | | | | | | | | | | |
| COMMON STOCKS (continued) | | SHARES | | | | | MARKET VALUE | | | |
| | | | | |
| | Electronic Equipment & Instruments (1.76%) (continued) | | | | | | | | | | | | |
| | Trimble Navigation Ltd.(a) | | | 210,915 | | | | | $ | 5,597,684 | | | |
| | | | | | | | | | | 21,550,057 | | | |
| | Internet Software & Services (6.31%) | | | | | | | | | | | | |
| | Alibaba Group Holding Ltd.(a)(b) | | | 46,367 | | | | | | 4,819,386 | | | |
| | CoStar Group, Inc.(a) | | | 27,426 | | | | | | 5,036,237 | | | |
| | Equinix, Inc. | | | 33,006 | | | | | | 7,483,450 | | | |
| | Facebook, Inc., Class A(a) | | | 193,715 | | | | | | 15,113,644 | | | |
| | Google, Inc., Class A(a) | | | 18,227 | | | | | | 9,672,340 | | | |
| | Google, Inc., Class C(a) | | | 22,110 | | | | | | 11,638,704 | | | |
| | LinkedIn Corp., Class A(a) | | | 33,420 | | | | | | 7,676,908 | | | |
| | Mercadolibre, Inc. | | | 32,920 | | | | | | 4,202,897 | | | |
| | Rackspace Hosting, Inc.(a) | | | 249,141 | | | | | | 11,662,290 | | | |
| | | | | | | | | | | 77,305,856 | | | |
| | IT Services (0.38%) | | | | | | | | | | | | |
| | Teradata Corp.(a) | | | 106,000 | | | | | | 4,630,080 | | | |
| | | | | |
| | Semiconductors & Semiconductor Equipment (1.91%) | | | | | | | | | | | | |
| | ARM Holdings PLC(b) | | | 148,620 | | | | | | 6,881,106 | | | |
| | Intel Corp. | | | 218,275 | | | | | | 7,921,200 | | | |
| | Micron Technology, Inc.(a) | | | 244,061 | | | | | | 8,544,575 | | | |
| | | | | | | | | | | 23,346,881 | | | |
| | Software (5.68%) | | | | | | | | | | | | |
| | Microsoft Corp. | | | 314,775 | | | | | | 14,621,299 | | | |
| | Oracle Corp. | | | 191,025 | | | | | | 8,590,394 | | | |
| | Salesforce.com, Inc.(a) | | | 422,738 | | | | | | 25,072,591 | | | |
| | ServiceNow, Inc.(a) | | | 111,300 | | | | | | 7,551,705 | | | |
| | Splunk, Inc.(a) | | | 90,900 | | | | | | 5,358,555 | | | |
| | Symantec Corp. | | | 327,482 | | | | | | 8,401,550 | | | |
| | | | | | | | | | | 69,596,094 | | | |
u MATERIALS (0.57%) | | | | | | | | | | | | |
| | Chemicals (0.57%) | | | | | | | | | | | | |
| | EI du Pont de Nemours & Co. | | | 95,000 | | | | | | 7,024,300 | | | |
| | | | |
u UTILITIES (0.08%) | | | | | | | | | | | | |
| | Electric Utilities (0.08%) | | | | | | | | | | | | |
| | FirstEnergy Corp. | | | 26,225 | | | | | | 1,022,513 | | | |
| | | | |
TOTAL COMMON STOCKS
(COST OF $931,992,224) | | | | | | | | | 1,196,957,312 | | | |
See Notes to Schedule of Investments and Financial Statements.
| | | | | | |
ANNUAL REPORT | |
| | DECEMBER 31, 2014 | | |
| | | | |
LIBERTY ALL-STAR® EQUITY FUND | | | | 23 |
SCHEDULE OF INVESTMENTS | | | |
| as of December 31, 2014 | | | | |
| | | | | | | | | | | | | | |
| SHORT TERM INVESTMENTS (4.58%) | | PAR VALUE/SHARES | | | | | MARKET VALUE | | | |
| | | | |
u REPURCHASE AGREEMENT (3.31%) | | | | | | | | | | | | |
| | Repurchase agreement with State Street Bank & Trust Co., dated 12/31/14, due 01/02/15 at 0.01%, collateralized by Federal Home Loan Mortgage Corp., 3.00%, 03/15/43, market value of $41,347,791 and par value of $51,395,000. (Repurchase proceeds of $40,525,023). (COST OF $40,525,000) | | | $ 40,525,000 | | | | | $ | 40,525,000 | | | |
| | | | |
u INVESTMENTS PURCHASED WITH CASH COLLATERAL FROM SECURITIES LOANED (1.27%) | | | | | | | | | | | | |
| | State Street Navigator Securities Lending Prime Portfolio, 0.19% (COST OF $15,594,222) | | | 15,594,222 | | | | | | 15,594,222 | | | |
| | | | |
TOTAL SHORT TERM INVESTMENTS (COST OF $56,119,222) | | | | | | | | | 56,119,222 | | | |
| | | | |
TOTAL INVESTMENTS (102.32%) (COST OF $988,111,446)(d) | | | | | | | | | 1,253,076,534 | | | |
| | | | |
LIABILITIES IN EXCESS OF OTHER ASSETS (-2.32%) | | | | | | | | | (28,374,696 | ) | | |
| | | | |
NET ASSETS (100.00%) | | | | | | | | $ | 1,224,701,838 | | | |
| | | | | | | | |
| | | | |
NET ASSET VALUE PER SHARE | | | | | | | | | | | | |
(179,031,327 SHARES OUTSTANDING) | | | | | | | | $ | 6.84 | | | |
| | | | | | | | |
Notes to Schedule of Investments:
| | (a) | Non-income producing security. |
| | (b) | American Depositary Receipt. |
| | (c) | Security, or a portion of the security position, is currently on loan. |
| | (d) | Cost of investments for federal income tax purposes is $995,160,632. |
Gross unrealized appreciation and depreciation at December 31, 2014 based on cost of investments for federal income tax purposes is as follows:
| | | | |
Gross unrealized appreciation | | $ | 311,047,967 | |
Gross unrealized depreciation | | | (53,132,065 | ) |
Net unrealized appreciation | | $ | 257,915,902 | |
See Notes to Schedule of Investments and Financial Statements.
| | |
www.all-starfunds.com | | USA |
| | | | | | |
| 24 | | | | | | LIBERTY ALL-STAR® EQUITY FUND |
| | | | STATEMENT OF ASSETS AND LIABILITIES |
| | | | | | December 31, 2014 |
| | | | |
| | | | |
| |
ASSETS: | | | | |
Investments at market value (Cost $988,111,446) | | $ | 1,253,076,534 | |
Cash | | | 3,274 | |
Receivable for investment securities sold | | | 5,808,835 | |
Dividends and interest receivable | | | 1,063,398 | |
Prepaid and other assets | | | 2,110 | |
| |
TOTAL ASSETS | | | 1,259,954,151 | |
| |
LIABILITIES: | | | | |
Payable for investments purchased | | | 7,444,812 | |
Distributions payable to shareholders | | | 11,053,482 | |
Investment advisory fee payable | | | 742,000 | |
Payable for administration, pricing and bookkeeping fees | | | 190,055 | |
Payable for collateral upon return of securities loaned | | | 15,594,222 | |
Accrued expenses | | | 227,742 | |
| |
TOTAL LIABILITIES | | | 35,252,313 | |
| |
NET ASSETS | | $ | 1,224,701,838 | |
| | | | | |
| |
NET ASSETS REPRESENTED BY: | | | | |
Paid-in capital | | $ | 983,711,254 | |
Distributions in excess of net investment income | | | (11,053,482 | ) |
Accumulated net realized loss on investments | | | (12,921,022 | ) |
Net unrealized appreciation on investments | | | 264,965,088 | |
| |
NET ASSETS | | $ | 1,224,701,838 | |
| | | | | |
| |
Shares of common stock outstanding
(unlimited number of shares of beneficial interest without par value authorized) | | | 179,031,327 | |
| |
NET ASSET VALUE PER SHARE | | $ | 6.84 | |
| | | | | |
See Notes to Financial Statements.
| | | | | | |
ANNUAL REPORT | |
| | DECEMBER 31, 2014 | | |
| | | | |
LIBERTY ALL-STAR® EQUITY FUND | | | | 25 |
STATEMENT OF OPERATIONS | | | |
Year Ended December 31, 2014 | | | | |
| | | | |
| | | | |
| |
INVESTMENT INCOME: | | | | |
Dividends (Net of foreign taxes withheld at source which amounted to $108,316) | | $ | 15,953,968 | |
Securities lending income | | | 16,710 | |
Interest | | | 3,468 | |
| |
TOTAL INVESTMENT INCOME | | | 15,974,146 | |
| |
EXPENSES: | | | | |
Investment advisory fee | | | 8,553,568 | |
Administration fee | | | 2,138,392 | |
Pricing and bookkeeping fees | | | 195,494 | |
Audit fee | | | 49,166 | |
Custodian fee | | | 102,547 | |
Insurance expense | | | 59,960 | |
Legal fees | | | 335,418 | |
NYSE fee | | | 154,112 | |
Shareholder communication expenses | | | 150,485 | |
Transfer agent fees | | | 112,782 | |
Trustees’ fees and expenses | | | 231,700 | |
Miscellaneous expenses | | | 108,594 | |
| |
TOTAL EXPENSES | | | 12,192,218 | |
| |
NET INVESTMENT INCOME | | | 3,781,928 | |
| |
REALIZED AND UNREALIZED GAIN ON INVESTMENTS: | | | | |
| |
Net realized gain on investment transactions | | | 47,267,828 | |
Net change in unrealized appreciation on investments | | | 44,084,187 | |
| |
NET REALIZED AND UNREALIZED GAIN ON INVESTMENTS | | | 91,352,015 | |
| |
NET INCREASE IN NET ASSETS RESULTING FROM OPERATIONS | | $ | 95,133,943 | |
| | | | | |
See Notes to Financial Statements
| | |
www.all-starfunds.com | | USA |
| | | | |
| 26 | | | | LIBERTY ALL-STAR® EQUITY FUND |
| | | STATEMENTS OF CHANGES IN NET ASSETS |
| | | | |
| | | | | | | | |
| |
| | | Year Ended December 31, | |
| | | 2014 | | | 2013 | |
| | |
FROM OPERATIONS: | | | | | | | | |
Net investment income | | $ | 3,781,928 | | | $ | 4,844,127 | |
Net realized gain on investment transactions | | | 47,267,828 | | | | 106,711,684 | |
Net change in unrealized appreciation on investments | | | 44,084,187 | | | | 200,751,072 | |
Net Increase in Net Assets From Operations | | | 95,133,943 | | | | 312,306,883 | |
| | |
DISTRIBUTIONS TO SHAREHOLDERS: | | | | | | | | |
From net investment income | | | (14,835,410 | ) | | | (57,133,067 | ) |
From net realized gains on investments | | | (52,825,167 | ) | | | (6,914,894 | ) |
Tax return of capital | | | (1,286,981 | ) | | | – | |
Total Distributions | | | (68,947,558 | ) | | | (64,047,961 | ) |
| | |
CAPITAL SHARE TRANSACTIONS: | | | | | | | | |
Dividend reinvestments | | | 21,199,279 | | | | 22,735,370 | |
Shares repurchased through tender offer
(including costs of $– and $228,118) | | | – | | | | (84,804,604 | ) |
Net increase/(decrease) resulting from Capital Share Transactions | | | 21,199,279 | | | | (62,069,234 | ) |
Net Increase in Net Assets | | | 47,385,664 | | | | 186,189,688 | |
| | |
NET ASSETS: | | | | | | | | |
Beginning of period | | | 1,177,316,174 | | | | 991,126,486 | |
End of period (Includes distributions in excess of net investment income of
$(11,053,482) and $0, respectively) | | $ | 1,224,701,838 | | | $ | 1,177,316,174 | |
| | | | | | | | | |
See Notes to Financial Statements
| | | | | | |
ANNUAL REPORT | | | | DECEMBER 31, 2014 | | |
| | | | |
LIBERTY ALL-STAR® EQUITY FUND | | | | 27 |
FINANCIAL HIGHLIGHTS | | | |
| | | | | | | | | | | | | | | | | | | | | | |
| | | Year Ended December 31, |
| | | 2014 | | | 2013 | | | 2012 | | | 2011 | | | 2010 | | | |
| | | | | | |
PER SHARE OPERATING PERFORMANCE: | | | | | | | | | | | | | | | | | | | | | | |
Net asset value at beginning of year | | $ | 6.71 | | | $ | 5.35 | | | $ | 4.99 | | | $ | 5.69 | | | $ | 5.23 | | | |
| | | | | | |
INCOME FROM INVESTMENT OPERATIONS: | | | | | | | | | | | | | | | | | | | | | | |
Net investment income(a) | | | 0.02 | | | | 0.03 | | | | 0.04 | | | | 0.02 | | | | 0.00 | (b) | | |
Net realized and unrealized gain/(loss) on investments | | | 0.50 | | | | 1.66 | | | | 0.64 | | | | (0.38 | ) | | | 0.77 | | | |
Total from Investment Operations | | | 0.52 | | | | 1.69 | | | | 0.68 | | | | (0.36 | ) | | | 0.77 | | | |
| | | | | | |
LESS DISTRIBUTIONS TO SHAREHOLDERS: | | | | | | | | | | | | | | | | | | | | | | |
Net investment income | | | (0.08 | ) | | | (0.31 | ) | | | (0.32 | ) | | | (0.26 | ) | | | (0.24 | ) | | |
Net realized gain on investments | | | (0.30 | ) | | | (0.04 | ) | | | – | | | | – | | | | – | | | |
Tax return of capital | | | (0.01 | ) | | | – | | | | – | | | | (0.08 | ) | | | (0.07 | ) | | |
Total Distributions | | | (0.39 | ) | | | (0.35 | ) | | | (0.32 | ) | | | (0.34 | ) | | | (0.31 | ) | | |
Change due to tender offer(c) | | | – | | | | 0.02 | | | | – | | | | – | | | | – | | | |
Net asset value at end of year | | $ | 6.84 | | | $ | 6.71 | | | $ | 5.35 | | | $ | 4.99 | | | $ | 5.69 | | | |
Market price at end of year | | $ | 5.98 | | | $ | 5.97 | | | $ | 4.77 | | | $ | 4.22 | | | $ | 4.93 | | | |
| | | | | | | | | | | | | | | | | | | | | | |
| | | | | |
TOTAL INVESTMENT RETURN FOR SHAREHOLDERS:(d) | | | | | | | | | | | | | | | | | | | |
Based on net asset value | | | 8.9 | % | | | 33.8 | % | | | 14.7 | % | | | (5.8 | %) | | | 16.3 | % | | |
Based on market price | | | 7.0 | % | | | 33.5 | % | | | 20.9 | % | | | (8.1 | %) | | | 21.7 | % | | |
| | | | | | |
RATIOS AND SUPPLEMENTAL DATA: | | | | | | | | | | | | | | | | | | | | | | |
Net assets at end of year (millions) | | $ | 1,225 | | | $ | 1,177 | | | $ | 991 | | | $ | 912 | | | $ | 1,039 | | | |
Ratio of expenses to average net assets after reimbursement | | | N/A | | | | N/A | | | | 1.07 | % | | | N/A | | | | N/A | | | |
Ratio of expenses to average net assets before reimbursement | | | 1.03 | % | | | 1.05 | % | | | 1.08 | % | | | 1.05 | % | | | 1.08 | % | | |
Ratio of net investment income to average net assets | | | 0.32 | % | | | 0.44 | % | | | 0.72 | % | | | 0.33 | % | | | 0.08 | % | | |
Portfolio turnover rate | | | 36 | % | | | 41 | % | | | 45 | % | | | 48 | % | | | 52 | % | | |
| (a) | Calculated using average shares outstanding during the period. |
| (b) | Less than $0.005 per share. |
| (c) | Effect of Fund’s tender offer for shares at a price below net asset value, net of costs. |
| (d) | Calculated assuming all distributions are reinvested at actual reinvestment prices. The net asset value and market price returns will differ depending upon the level of any discount from or premium to net asset value at which the Fund’s shares traded during the period. Past performance is not a guarantee of future results. |
See Notes to Financial Statements
| | |
www.all-starfunds.com | | USA |
| | | | |
| 28 | | | | LIBERTY ALL-STAR® EQUITY FUND |
| | | NOTES TO FINANCIAL STATEMENTS |
NOTE 1. ORGANIZATION
Liberty All-Star® Equity Fund (the “Fund”) is a Massachusetts business trust registered under the Investment Company Act of 1940 (the “Act”), as amended, as a diversified, closed-end management investment company.
Investment Goal
The Fund seeks total investment return comprised of long-term capital appreciation and current income through investing primarily in a diversified portfolio of equity securities.
Fund Shares
The Fund may issue an unlimited number of shares of beneficial interest.
NOTE 2. SIGNIFICANT ACCOUNTING POLICIES
The following is a summary of significant accounting policies consistently followed by the Fund in the preparation of its financial statements.
Use of Estimates
The preparation of financial statements in conformity with accounting principles generally accepted in the United States of America (“GAAP”) requires management to make estimates and assumptions that affect the reported amounts and disclosures in the financial statements. Actual results could differ from these estimates. The Fund is considered an investment company under U.S. GAAP and follows the accounting and reporting guidance applicable to investment companies in the Financial Accounting Standards Board Accounting Standards Codification Topic 946.
Security Valuation
Equity securities, including common stocks and exchange-traded funds, are valued at the last sale price at the close of the principal exchange on which they trade, except for securities listed on the NASDAQ Stock Market LLC (“NASDAQ”) exchange, which are valued at the NASDAQ official closing price. Unlisted securities or listed securities for which there were no sales during the day are valued at the closing bid price on such exchanges or over-the-counter markets.
Cash collateral from securities lending activity is reinvested in the State Street Navigator Securities Lending Prime Portfolio, a registered investment company under the 1940 Act, which operates as a money market fund in compliance with Rule 2a-7 under the 1940 Act. Shares of registered investment companies are valued daily at that investment company’s net asset value per share. Repurchase agreements are valued at cost, which approximates fair value.
The Fund’s investments are valued at market value or, in the absence of market value with respect to any portfolio securities, at fair value according to procedures adopted by the Fund’s Board of Trustees (the “Board”). When market quotations are not readily available, or in management’s judgment they do not accurately reflect fair value of a security, or an event occurs after the market close but before the Fund is priced that materially affects the value of a security, the securities will be valued by the Adviser, ALPS Advisors Inc. using fair valuation procedures established by the Board. Examples of potentially significant events that could materially impact a Fund’s net asset value include, but are not limited to: single issuer events such as corporate actions, reorganizations, mergers, spin-offs, liquidations, acquisitions and buyouts; corporate announcements on earnings or product offerings; regulatory news; and litigation and multiple issuer events such as governmental actions; natural disasters or armed conflicts that affect a country or a region; or significant market fluctuations. Potential significant events are monitored by the Adviser and/or Valuation Committee through independent reviews of market indicators, general news sources and communications from the Fund’s custodian.
Foreign Securities
The Fund may directly purchase securities of foreign issuers. Investing in securities of foreign issuers involves special risks not typically associated with investing in securities of U.S. issuers. The risks include possible reevaluation of currencies, the inability to repatriate foreign currency, less complete financial information about companies and possible future adverse political and economic developments. Moreover, securities of many foreign issuers and their markets may be less liquid and their prices more volatile than those of securities of comparable U.S. issuers. At December 31, 2014, the Fund only held American Depositary Receipts and did not hold any securities denominated in foreign currencies.
Security Transactions
Security transactions are recorded on trade date. Cost is determined and gains/(losses) are based upon the specific identification method for both financial statement and federal income tax purposes.
Income Recognition
Interest income is recorded on the accrual basis. Corporate actions and dividend income are recorded on the ex-date.
The Fund estimates components of distributions from real estate investment trusts (“REITs”). Distributions received in excess of income are recorded as a reduction of the cost of the related investments. Once the REIT reports annually the tax character of its distributions, the Fund revises its estimates. If the Fund no longer owns the applicable securities, any distributions received in excess of income are recorded as realized gains.
| | | | | | |
ANNUAL REPORT | |
| | DECEMBER 31, 2014 | | |
| | | | |
LIBERTY ALL-STAR® EQUITY FUND | | | | 29 |
NOTES TO FINANCIAL STATEMENTS | | | |
December 31, 2014
Repurchase Agreements
The Fund engages in repurchase agreement transactions with institutions that the Fund’s investment advisor has determined are creditworthy. The Fund, through its custodian, receives delivery of underlying securities collateralizing a repurchase agreement. Collateral is at least equal, at all times, to the value of the repurchase obligation including interest. A repurchase agreement transaction involves certain risks in the event of default or insolvency of the counterparty. These risks include possible delays or restrictions upon a Fund’s ability to dispose of the underlying securities and a possible decline in the value of the underlying securities during the period while the Fund seeks to assert its rights. These collateral agreements mitigate the counterparty credit risk by providing for a single net
settlement with a counterparty of all financial transactions covered by the agreement in an event of default as defined under such agreement.
Repurchase agreements are entered into by the Fund under a Master Repurchase Agreement (“MRA”) which permits the Fund, under certain circumstances, including an event of default (such as bankruptcy or insolvency), to offset payables and/or receivables under the MRA with collateral held and/or posted to the counterparty and create one single net payment due or from the Fund.
At December 31, 2014, the open repurchase agreement with the counterparty State Street Bank & Trust Co., and subject to a MRA on a net payment basis, was as follows:
| | | | | | | | | | | | | | | | | | | | | | | | |
| | | | | | | | | | | | Gross Amounts Not Offset in the
Statement of Financial Position | |
| Description | | Gross
Amounts of
Recognized
Assets | | | Gross Amounts
Offset in the
Statement of Assets
and Liabilities | | | Net Amounts
Presented in the
Statement of Assets
and Liabilities | | | Financial
Instruments
Collateral
Received* | | | Cash
Collateral
Received | | | Net
Amount | |
Repurchase Agreement | | $ | 40,525,000 | | | $ | – | | | $ | 40,525,000 | | | $ | (40,525,000 | ) | | $ | – | | | $ | – | |
Total | | $ | 40,525,000 | | | $ | – | | | $ | 40,525,000 | | | $ | (40,525,000 | ) | | $ | – | | | $ | – | |
| | |
|
* These amounts do not include the excess collateral received. | |
Lending of Portfolio Securities
The Fund may lend its portfolio securities only to borrowers that are approved by the Fund’s securities lending agent, State Street Bank & Trust Co. (“SSB”). The Fund will limit such lending to not more than 30% of the value of its total assets. The borrower pledges and maintains with the Fund collateral consisting of cash (U.S. Dollar only), securities issued or guaranteed by the U.S. government or its agencies or instrumentalities, or by irrevocable bank letters of credit issued by a person other than the Borrower or an affiliate of the Borrower. The initial collateral received by the Fund is required to have a value of no less than 102% of the market value of the loaned securities for securities traded on U.S. exchanges and a value of no less than 105% of the market value for all other securities. The collateral is maintained thereafter, at a market value equal to no less than 100% of the current value of the securities on loan. The market value of the loaned securities is determined at the close of each business day and any additional required collateral is delivered to the Fund on the next business day. During the term of the loan, the Fund is entitled to all distributions made on or in respect of the loaned securities. Loans of securities are terminable at any time and the borrower, after notice, is required to return borrowed securities within the standard time period for settlement of securities transactions.
Any cash collateral received is reinvested in a money market fund managed by SSB as disclosed in the Fund’s Schedule of Investments and is reflected in the Statement of Assets and Liabilities as a payable for collateral upon return of securities loaned. Non-cash collateral, in the form of Securities issued or guaranteed by the U.S. government or its agencies or instrumentalities, is not disclosed in the Fund’s Statements of Assets and Liabilities as it is held by the lending agent on behalf of the Fund and the Fund does not have the ability to re-hypothecate these securities. As of December 31, 2014, the market value of securities on loan was $18,054,189 and the total cash collateral and non-cash collateral received was $15,594,222 and $4,257,538, respectively. Income earned by the Fund from securities lending activity is disclosed in the Statement of Operations.
The risks of securities lending include the risk that the borrower may not provide additional collateral when required or may not return the securities when due. To mitigate these risks, the Fund benefits from a borrower default indemnity provided by SSB. SSB’s indemnity allows for full replacement of securities lent. However, the Fund could suffer a loss if the value of the investments purchased with cash collateral falls below the value of the cash collateral received.
| | |
www.all-starfunds.com | | USA |
| | | | |
| 30 | | | | LIBERTY ALL-STAR® EQUITY FUND |
| | | NOTES TO FINANCIAL STATEMENTS |
| | | | December 31, 2014 |
Fair Value Measurements
The Fund discloses the classification of its fair value measurements following a three-tier hierarchy based on the inputs used to measure fair value. Inputs refer broadly to the assumptions that market participants would use in pricing the asset or liability, including assumptions about risk. Inputs may be observable or unobservable. Observable inputs reflect the assumptions market participants would use in pricing the asset or liability that are developed based on market data obtained from sources independent of the reporting entity. Unobservable inputs reflect the reporting entity’s own assumptions about the assumptions market participants would use in pricing the asset or liability that are developed based on the best information available.
Valuation techniques used to value the Fund’s investments by major category are as follows:
Equity securities, exchange-traded funds, and registered investment companies are categorized as Level 1 in the hierarchy. In the event there were no sales during the day or closing prices are not available, securities are valued at the mean of the most recent quoted bid and ask prices on such day and are generally categorized as Level 2 in the hierarchy. Repurchase agreements are valued at cost, which approximates fair value, and are categorized as Level 2 in the hierarchy.
Various inputs are used in determining the value of the Fund’s investments as of the end of the reporting period. When inputs used fall into different levels of the fair value hierarchy, the level in the hierarchy within which the fair value measurement falls is determined based on the lowest level input that is significant to the fair value measurement in its entirety. The designated input levels are not necessarily an indication of the risk or liquidity associated with these investments.
These inputs are categorized in the following hierarchy under applicable financial accounting standards:
| | | | |
Level 1 | | – | | Unadjusted quoted prices in active markets for identical investments, unrestricted assets or liabilities that a Fund has the ability to access at the measurement date; |
| | |
Level 2 | | – | | Quoted prices which are not active, quoted prices for similar assets or liabilities in active markets or inputs other than quoted prices that are observable (either directly or indirectly) for substantially the full term of the asset or liability; and |
| | |
Level 3 | | – | | Significant unobservable prices or inputs (including the Fund’s own assumptions in determining the fair value of investments) where there is little or no market activity for the asset or liability at the measurement date. |
The following is a summary of the inputs used to value the Fund’s investments as of December 31, 2014:
| | | | | | | | | | | | | | | | |
| | | Valuation Inputs | | | | |
Investments in Securities at Value* | | | Level 1 | | | | Level 2 | | | | Level 3 | | | | Total | |
Common Stocks | | $ | 1,196,957,312 | | | $ | – | | | $ | – | | | $ | 1,196,957,312 | |
Short-Term Investment | | | – | | | | 40,525,000 | | | | – | | | | 40,525,000 | |
Investment Purchased with Collateral from Securities Loaned | | | 15,594,222 | | | | – | | | | – | | | | 15,594,222 | |
TOTAL | | $ | 1,212,551,534 | | | $ | 40,525,000 | | | $ | – | | | $ | 1,253,076,534 | |
| | | | | | | | | | | | | | | | | |
| * | See Schedule of Investments for industry classification. |
The Fund recognizes transfers between the levels as of the end of the period. For the year ended December 31, 2014, the Fund did not have any transfers between Level 1 and Level 2 securities. The Fund did not have any securities which used significant unobservable inputs (Level 3) in determining fair value during the period.
Distributions to Shareholders
The Fund currently has a policy of paying distributions on its shares of beneficial interest totaling approximately 6% of its net asset value per year. The distributions are payable in four quarterly distributions of 1.5% of the Fund’s net asset value at the close of the NYSE on the Friday prior to each quarterly declaration date. Distributions to shareholders are recorded on ex-date.
NOTE 3. FEDERAL TAX INFORMATION AND TAX BASIS INFORMATION
The timing and character of income and capital gain distributions are determined in accordance with income tax regulations, which may differ from GAAP. Reclassifications are made to the Fund’s capital accounts for permanent tax differences to reflect income and gains available for distribution (or available capital loss carryforwards) under income tax regulations. If, for any calendar year, the total distributions made under the distribution policy exceed the Fund’s net investment income and net realized capital gains, the excess will generally be treated as a non-taxable return of capital, reducing the shareholder’s adjusted basis in his or her shares. If the Fund’s net investment income and net realized capital gains for any year exceed the amount distributed under the distribution policy, the Fund may, in its discretion, retain and not distribute net realized capital gains and pay income tax thereon to the extent of such excess.
| | | | | | |
ANNUAL REPORT | |
| | DECEMBER 31, 2014 | | |
| | | | |
LIBERTY ALL-STAR® EQUITY FUND | | | | 31 |
NOTES TO FINANCIAL STATEMENTS | | | |
December 31, 2014 | | | | |
Classification of Distributions to Shareholders
Net investment income and net realized gain/(loss) may differ for financial statement and tax purposes. The character of distributions made during the year from net investment income or net realized gains may differ from its ultimate characterization for federal income tax purposes. The amounts and characteristics of tax basis distributions and composition of distributable earnings/(accumulated losses) are finalized at fiscal year-end. Also, due to the timing of dividend distributions, the fiscal year in which amounts are distributed may differ from the fiscal year in which the income or realized gain was recorded by the Fund.
The tax character distributions paid during the years ended December 31, 2014 and December 31, 2013 were as follows:
| | | | | | | | |
| | | 12/31/2014 | | | 12/31/2013 | |
Distributions paid from: | | | | | | | | |
Ordinary income | | $ | 27,469,252 | | | $ | 57,133,067 | |
Long-term capital gain | | | 40,191,325 | | | | 6,914,894 | |
Tax return of capital | | | 1,286,981 | | | | – | |
| | | $ | 68,947,558 | | | $ | 64,047,961 | |
| | | | | | | | | |
As of December 31, 2014, the components of distributable earnings on a tax basis were as follows:
| | | | | | | | | | | | |
Accumulated
Capital Loss | | Net
Unrealized
Appreciation | | | Other
Cumulative
Effect of
Timing
Differences | | | Total | |
$(5,871,836) | | $ | 257,915,902 | | | $ | (11,053,482 | ) | | $ | 240,990,584 | |
As of December 31, 2014, the costs of investments for federal income tax purposes and accumulated net unrealized appreciation/(depreciation) on investments were as follows:
| | | | | | | | | | | | |
Cost of
Investments | | Gross
Unrealized
Appreciation
(excess of
value over
tax cost) | | | Gross
Unrealized
Depreciation
(excess of
tax cost over
value) | | | Net
Unrealized
Appreciation | |
$995,160,632 | | $ | 311,047,967 | | | | $(53,132,065) | | | $ | 257,915,902 | |
The differences between book-basis and tax-basis are primarily due to deferral of losses from wash sales and the differing treatment of certain other investments.
The fund elects to defer to the fiscal year ending December 31, 2015, capital losses recognized during the period from November 1, 2014 to December 31, 2014 in the amount of $5,871,836.
Federal Income Tax Status
For federal income tax purposes, the Fund currently qualifies, and intends to remain qualified, as a regulated investment company under the provisions of Subchapter M of the Internal Revenue Code of 1986, as amended, by distributing substantially all of its investment company taxable net income including realized gain, not offset by capital loss carryforwards, if any, to its shareholders. Accordingly, no provision for federal income or excise taxes has been made.
As of and during the year ended December 31, 2014, the Fund did not have a liability for any unrecognized tax benefits. The Fund files U.S. federal, state, and local tax returns as required. The Fund’s tax returns are subject to examination by the relevant tax authorities until expiration of the applicable statute of limitations which is generally three years after the filing of the tax return. Tax returns for open years have incorporated no uncertain tax positions that require a provision for income taxes.
NOTE 4. FEES AND COMPENSATION PAID TO AFFILIATES
Investment Advisory Fee
ALPS Advisors, Inc. (“AAI”) serves as the investment advisor to the Fund. AAI receives a monthly investment advisory fee based on the Fund’s average daily net assets at the following annual rates:
| | | | |
Average Daily
Net Assets | | Annual
Fee Rate | | |
First $400 million | | 0.800% | | |
Next $400 million | | 0.720% | | |
Next $400 million | | 0.648% | | |
Over $1.2 billion | | 0.584% | | |
AAI retains multiple Portfolio Managers to manage the Fund’s investments in various asset classes. AAI pays each Portfolio Manager a portfolio management fee based on the assets of the investment portfolio that they manage. The portfolio management fee is paid from the investment advisory fees collected by AAI and is based on the Fund’s average daily net assets at the following annual rates:
| | | | |
Average Daily
Net Assets | | Annual
Fee Rate | | |
First $400 million | | 0.400% | | |
Next $400 million | | 0.360% | | |
Next $400 million | | 0.324% | | |
Over $1.2 billion | | 0.292% | | |
| | |
www.all-starfunds.com | | USA |
| | | | |
| 32 | | | | LIBERTY ALL-STAR® EQUITY FUND |
| | | NOTES TO FINANCIAL STATEMENTS |
| | | | December 31, 2014 |
Administration, Bookkeeping and Pricing Services Agreement
ALPS Fund Services, Inc. (“ALPS”) provides administrative and other services to the Fund for a monthly administration fee based on the Fund’s average daily net assets at the following annual rates:
| | | | |
Average Daily
Net Assets | | Annual
Fee Rate | | |
First $400 million | | 0.200% | | |
Next $400 million | | 0.180% | | |
Next $400 million | | 0.162% | | |
Over $1.2 billion | | 0.146% | | |
In addition, ALPS provides bookkeeping and pricing services to the Fund for an annual fee consisting of: (i) $38,000 paid monthly plus 0.015% on the average daily net assets for the month; and (ii) a multi-manager fee based on the number of portfolio managers; provided that during any 12-month period, the aggregate amount of (i) shall not exceed $140,000 (exclusive of out-of-pocket expenses and charges). The Fund also reimburses ALPS for out-of-pocket expenses and charges, including fees payable to third parties for pricing the Fund’s portfolio securities and direct internal costs incurred by ALPS in connection with providing fund accounting oversight and monitoring and certain other services.
Fees Paid to Officers
All officers of the Fund, including the Fund’s Chief Compliance Officer, are employees of AAI or its affiliates, and receive no compensation from the Fund. The Board of Trustees has appointed a Chief Compliance Officer to the Fund in accordance with federal securities regulations.
NOTE 5. PORTFOLIO INFORMATION
Purchases and Sales of Securities
For the year ended December 31, 2014, the cost of purchases and proceeds from sales of securities, excluding short-term obligations, were $421,721,045 and $463,866,589, respectively.
NOTE 6. CAPITAL TRANSACTIONS
On July 29, 2013, the Fund’s Board of Trustees authorized the Fund to conduct a tender offer for up to 7.5% of its outstanding shares of beneficial interest at a price equal to 96% of its net asset value per share as determined on the day of the tender offer expiration of September 23, 2013. Approximately 64,581,723 shares of beneficial interest or approximately 34.2% of the Fund’s outstanding shares were properly tendered and not withdrawn. The Fund accepted 14,143,225 shares for payment at a price equal to $5.98 per share, which represented 96% of the Fund’s net asset value per share as of September 23, 2013. Because the tender offer was oversubscribed, all tenders of shares were subject to proration in accordance with the
terms of the tender offer, including adjustments to avoid purchase of fractional shares. Accordingly, on a pro rata basis, the Fund accepted and purchased approximately 21.9% of the shares properly tendered in the tender offer.
During the years ended December 31, 2014 and December 31, 2013, distributions in the amounts of $21,199,279 and $22,735,370, respectively, were paid in newly issued shares valued at market value or net asset value, but not less than 95% of market value. Such distributions resulted in the issuance of 3,609,021 and 4,248,183 shares, respectively.
Under the Fund’s Automatic Dividend Reinvestment and Direct Purchase Plan (the “Plan”), shareholders automatically participate and have all their Fund dividends and distributions reinvested. Under the Plan, all dividends and distributions will be reinvested in additional shares of the Fund. Distributions declared payable in cash will be reinvested for the accounts of participants in the Plan in additional shares purchased by the Plan Agent on the open market at prevailing market prices, subject to certain limitations as described more fully in the Plan. Distributions declared payable in shares are paid to participants in the Plan entirely in newly issued full and fractional shares valued at the lower of market value or net asset value per share on the valuation date for the distribution (but not at a discount of more than 5 percent from market price). Dividends and distributions are subject to taxation, whether received in cash or in shares.
NOTE 7. INDEMNIFICATION
In the normal course of business, the Fund enters into contracts that contain a variety of representations and warranties and which provide general indemnities. The Fund’s maximum exposure under these arrangements is unknown, as this would involve future claims against the Fund. Also, under the Fund’s organizational documents and by contract, the Trustees and Officers of the Fund are indemnified against certain liabilities that may arise out of their duties to the Fund. However, based on experience, the Fund expects the risk of loss due to these warranties and indemnities to be minimal.
| | | | | | |
ANNUAL REPORT | |
| | DECEMBER 31, 2014 | | |
| | | | |
LIBERTY ALL-STAR® EQUITY FUND | | | | 33 |
REPORT OF INDEPENDENT REGISTERED PUBLIC ACCOUNTING FIRM | | | |
TO THE BOARD OF TRUSTEES AND SHAREHOLDERS OF LIBERTY ALL-STAR® EQUITY FUND:
We have audited the accompanying statement of assets and liabilities of Liberty All-Star® Equity Fund (the “Fund”), including the schedule of investments, as of December 31, 2014, and the related statement of operations for the year then ended, the statements of changes in net assets for each of the two years in the period then ended, and the financial highlights for each of the five years in the period then ended. These financial statements and financial highlights are the responsibility of the Fund’s management. Our responsibility is to express an opinion on these financial statements and financial highlights based on our audits.
We conducted our audits in accordance with the standards of the Public Company Accounting Oversight Board (United States). Those standards require that we plan and perform the audit to obtain reasonable assurance about whether the financial statements and financial highlights are free of material misstatement. The Fund is not required to have, nor were we engaged to perform, an audit of its internal control over financial reporting. Our audits included consideration of internal control over financial reporting as a basis for designing audit procedures that are appropriate in the circumstances, but not for the purpose of expressing an opinion on the effectiveness of the Fund’s internal control over financial reporting. Accordingly, we express no such opinion. An audit also includes examining, on a test basis, evidence supporting the amounts and disclosures in the financial statements, assessing the accounting principles used and significant estimates made by management, as well as evaluating the overall financial statement presentation. Our procedures included confirmation of securities owned as of December 31, 2014, by correspondence with the custodian and brokers; where replies were not received from brokers, we performed other auditing procedures. We believe that our audits provide a reasonable basis for our opinion.
In our opinion, such financial statements and financial highlights referred to above present fairly, in all material respects, the financial position of Liberty All-Star® Equity Fund, as of December 31, 2014, the results of its operations for the year then ended, the changes in its net assets for each of the two years in the period then ended, and the financial highlights for each of the five years in the period then ended, in conformity with accounting principles generally accepted in the United States of America.
DELOITTE & TOUCHE LLP
Denver, Colorado
February 19, 2015
| | |
www.all-starfunds.com | | USA |
| | | | |
| 34 | | | | LIBERTY ALL-STAR® EQUITY FUND |
| | | BOARD CONSIDERATION OF THE RENEWAL OF THE FUND MANAGEMENT
AND PORTFOLIO MANAGEMENT AGREEMENTS (UNAUDITED) |
| | | | |
The Investment Company Act of 1940 requires that the Board of Trustees (“Board”) of the Liberty All-Star Equity Fund (“Fund”), including all of the Trustees who are not “interested persons” of the Fund (“Independent Trustees”), annually review the Fund’s investment advisory agreements and consider whether to renew them for an additional year. At its meeting on September 11, 2014, the Board, including a majority of the Independent Trustees, conducted such a review and approved the continuation of the Fund Management Agreement between the Fund and ALPS Advisors, Inc. (“AAI”) and the five separate Portfolio Management Agreements, among the Fund, AAI and the following independent investment management firms (each, a “Portfolio Manager”): Cornerstone Capital Management LLC (“Cornerstone”), Matrix Asset Advisors, Inc. (“Matrix”), Pzena Investment Management, LLC (“Pzena”), Schneider Capital Management Corporation (“Schneider”) and TCW Investment Management Company (“TCW”).
Prior to the Board action, the Independent Trustees met to consider management’s recommendations with respect to the renewal of the Fund Management Agreement and the Portfolio Management Agreements (each, an “Agreement” and, collectively, the “Agreements”). In reaching its decision to renew each Agreement, the Board considered the overall fairness of the Agreement and whether the Agreement was in the best interest of the Fund. The Board further considered factors it deemed relevant with respect to the Fund, including (1) the nature, extent and quality of services provided to the Fund by AAI, its affiliates, and each Portfolio Manager; (2) the performance of the Fund and the Portfolio Managers; (3) the level of the Fund’s management and portfolio management fees and expense ratios; (4) the costs of the services provided and profits realized by AAI and its affiliates from their relationship with the Fund; (5) the extent to which economies of scale would be realized as the Fund grows and whether fee levels will reflect economies of scale for the benefit of shareholders; (6) the “fall-out” benefits to AAI, each Portfolio Manager and their respective affiliates (i.e., any direct or indirect benefits to be derived by AAI, each Portfolio Manager and their respective affiliates from their relationships with the Fund); and (7) other general information about AAI and each Portfolio Manager. In considering each Agreement, the Board did not identify any single factor or information as all-important or controlling and each Trustee may have attributed different weight to each factor.
The Board considered these factors in the context of the Fund’s multi-manager methodology, which seeks to achieve more consistent and less volatile performance over the long term than if a single Portfolio Manager was employed. The Fund allocates its portfolio assets among Portfolio Managers recommended by AAI and
approved by the Board, currently five for the Fund. The Board considered that each Portfolio Manager employs a different investment style and/or strategy, and from time to time AAI rebalances the Fund’s portfolio assets among the Portfolio Managers. The Board also took into account that AAI continuously analyzes and evaluates each Portfolio Manager’s investment performance and portfolio composition and, from time to time, recommends changes in the Portfolio Managers.
In connection with its deliberations, the Board took into account information furnished throughout the year at regular Board meetings, as well as information prepared specifically in connection with the annual renewal and approval process. Information furnished and discussed throughout the year included AAI’s analysis of the Fund’s investment performance and related financial information for the Fund, presentations given by the Fund’s Portfolio Managers, as well as periodic reports on legal, compliance, brokerage commissions and execution and other services provided by AAI, the Portfolio Managers and their affiliates. Information furnished specifically in connection with the renewal process included, among other things, a report of the Fund’s investment performance over various time periods as compared to a peer universe and a market index and the Fund’s fees and expenses as compared to comparable groups of closed-end funds and open-end multi-managed funds based, in part, on information prepared by AAI regarding review of the Lipper peer groups. The information provided by AAI generally included information reflecting the Fund’s management fees, expense ratios, investment performance and profitability, including AAI’s profitability with respect to the Fund.
As part of the process to consider the Agreements, legal counsel to the Independent Trustees requested information from AAI and each Portfolio Manager. In response to these requests, the Independent Trustees received reports from AAI and each Portfolio Manager that addressed specific factors designed to inform the Board’s consideration of each Agreement. Counsel also provided the Independent Trustees and the Board with a memorandum discussing the legal standards applicable to their consideration of the Agreements. Based on its evaluation of all material factors, the Board unanimously concluded that the terms of each Agreement were reasonable and fair and that the renewal of each Agreement was in the best interests of the Fund and its shareholders. The following is a summary of the Board’s considerations and conclusions regarding these matters.
| | | | | | |
ANNUAL REPORT | |
| | DECEMBER 31, 2014 | | |
| | | | |
LIBERTY ALL-STAR® EQUITY FUND | | | | 35 |
BOARD CONSIDERATION OF THE RENEWAL OF THE FUND MANAGEMENT AND PORTFOLIO MANAGEMENT AGREEMENTS (UNAUDITED) | | | |
NATURE, EXTENT AND QUALITY OF THE SERVICES PROVIDED
The Board considered the nature, extent and quality of the portfolio manager selection, evaluation and monitoring services provided by AAI, and the portfolio management services provided by each Portfolio Manager, in light of the investment objective of the Fund. The Board also considered the nature, extent and quality of the administrative services provided to the Fund by ALPS Fund Services, Inc., an affiliate of AAI. The Board considered the steps that AAI has taken to encourage strong performance, including AAI’s willingness to recommend Portfolio Manager changes when necessary to address performance issues.
The Board also considered each Portfolio Manager’s demonstrated consistency in investment approach. The Board considered that Cornerstone and TCW manage the large-cap growth portions of the Fund’s portfolio and Matrix, Pzena and Schneider manage the large-cap value portions of the Fund’s portfolio. The Board also considered the background and experience of the personnel at AAI responsible for Portfolio Manager selection, evaluation and monitoring for the Fund and the personnel at each Portfolio Manager responsible for managing the Fund’s portfolio. The Board also considered the overall financial strength of AAI and each Portfolio Manager, the effect on the Fund of any turnover in personnel at each Portfolio Manager, the insurance maintained by AAI and each Portfolio Manager and the compliance records of AAI and each Portfolio Manager. The Board concluded that the nature, extent and quality of the services provided by AAI and the Portfolio Managers were appropriate and consistent with the terms of the Agreements and that the Fund was likely to continue to benefit from services provided under the Agreements.
INVESTMENT PERFORMANCE
The Board considered the long-term and short-term investment performance of the Fund over multiple periods, which generally included annual total returns both on an absolute basis and relative to an appropriate benchmark and/or Lipper peer universe based on materials showing the performance of the Lipper peer group. The Board took into account the Fund’s performance based on both net asset value (“NAV”) and market price and, in general, considered long-term performance to be more important in its evaluation than short-term performance. In addition, the Board considered the performance of the Fund’s Portfolio Managers, including the performance of other investment companies and accounts managed by the Portfolio Managers and the performance of the allocated portions of the Fund in the context of the Portfolio Managers’ different investment strategies and styles and
the contribution of each Portfolio Manager to the Fund’s overall strategy and performance.
Among other information, the Board received information regarding the Fund’s return on an absolute and a relative basis, based on NAV and market price, for certain periods ended December 31, 2013 and June 30, 2014. In particular, the Board received information which indicated that, based on NAV, the Fund outperformed the Lipper Large-Cap Core Mutual Fund Average (“Lipper Average”) for the one-, five-, fifteen- and twenty-five year periods, but underperformed the Lipper Average for the three- and ten-year periods ended December 31, 2013. This information also indicated that, based on NAV, the Fund outperformed the S&P 500® for the one- and fifteen-year periods, and while its performance was generally comparable for the five- and twenty-five year periods, the Fund underperformed the S&P 500® for the three- and ten-year periods when Fund expenses for the periods ended December 31, 2013 were included. The Board considered that, based on NAV, the Fund outperformed the Lipper Average for the one- fifteen- and twenty-five year periods and, while its performance was generally comparable, the Fund underperformed the Lipper Average for the year-to-date, three-, five-, and ten-year periods ended June 30, 2014. The Board also considered that, based on NAV, the Fund outperformed the S&P 500® for the one- and fifteen-year periods, and underperformed for all other relevant periods when Fund expenses for the periods ended June 30, 2014 were included.
Additionally, the Board received information which indicated that, based on market price, the Fund outperformed the Lipper Average for the one-, five-, fifteen- and twenty-five year periods and underperformed the Lipper Average for the other relevant periods ended December 31, 2013. This information also indicated that, based on market price, the Fund outperformed the S&P 500® for the one-, five- and fifteen year periods and the Fund’s performance was generally comparable to or underperformed the S&P 500® for the other relevant periods ended December 31, 2013. The Board considered that, based on market price, the Fund outperformed the Lipper Average for the one-, five-, fifteen- and twenty-five year periods and underperformed the Lipper Average for the other relevant periods ended June 30, 2014. Additionally, the Board considered that, based on market price, the Fund outperformed the S&P 500® for the five-year period and underperformed for the other relevant periods ended June 30, 2014.
In addition to the performance of the Fund and each Portfolio Manager’s sleeve of the Fund, the Board considered management’s and the Portfolio Managers’ explanations for differences between the Fund’s performance and
| | |
www.all-starfunds.com | | USA |
| | | | |
| 36 | | | | LIBERTY ALL-STAR® EQUITY FUND |
| | | BOARD CONSIDERATION OF THE RENEWAL OF THE FUND MANAGEMENT AND PORTFOLIO MANAGEMENT AGREEMENTS (UNAUDITED) |
| | | | |
the relevant benchmarks and peer groups. The Board determined that the performance information supported the renewal of the Agreements.
COSTS OF THE SERVICES PROVIDED TO THE FUND
The Board considered the fees paid by the Fund to AAI and the fees paid by AAI to the Portfolio Managers as well as information provided by AAI about the management fees, overall expense ratio and expense reimbursement by AAI for selected closed-end funds and multi-manager open-end equity funds. The Board took into account that the Fund’s management fee and total expense ratio were lower than the median of a representative group of closed-end funds selected by AAI. The Board also considered that the Fund’s management fee was higher than the median, but that the Fund’s total expense ratio was lower. The Board determined, however, that the Fund’s higher contractual management fee was generally consistent with the higher costs and greater complexity associated with the management of a closed-end multi-manager fund. The Board also considered the additional expense incurred by the Fund as a result of the tender offer that was conducted in the past year, which increased the Fund’s total expense ratio.
The Board considered that AAI currently does not have any institutional clients with investment objectives and strategies comparable to those of the Fund. The Board considered the breakpoint schedule that lowers the management fee rate as the Fund’s assets increase. The Board also considered the management fees paid to the Portfolio Managers and the fee rates charged by the Portfolio Managers to their other accounts, including institutional accounts. The Board considered that the Portfolio Managers were paid by AAI, not the Fund. The Board also considered the differences in the level of services provided by and the differences in responsibility of AAI and the Portfolio Managers to the Fund and to other accounts. The Board concluded that the management fees payable by the Fund to AAI and the fees payable by AAI to the Portfolio Managers were reasonable in relation to the nature and quality of the services provided, taking into account the management fees paid by selected closed-end funds and open-end equity funds.
PROFITABILITY AND COSTS OF SERVICES TO AAI
The Board considered the level of profits realized by AAI in connection with the operation of the Fund. The Board considered the profitability information setting forth the overall profitability of the Fund to AAI for the year ended December 31, 2013, as well as the overall profitability information relating to the calendar years ended December 31, 2012 and 2011. In reviewing the information, attention was given to the methodology followed in allocating costs to the Fund, it being recognized that allocation methodologies are inherently subjective and
various allocation methodologies may be reasonable while producing different results. The Board took into account management’s ongoing costs and expenditures in providing and improving services for the Fund as well as the ongoing need to meet regulatory and compliance requirements. In addition, the Board considered information prepared by management comparing the profitability of AAI on an overall basis to other investment company managers. The Board also considered the extent to which AAI and its affiliates might derive ancillary benefits from the Fund, noting that an affiliate of AAI serves as the Fund’s administrator and receives compensation for acting in this capacity.
The Board considered that AAI has advised the Board that it does not regard Portfolio Manager profitability as meaningful to an evaluation of the Portfolio Manager Agreements because the willingness of the Portfolio Managers to serve in such capacity depends primarily upon arm’s-length negotiations with AAI, AAI generally is aware of the fees charged by the Portfolio Managers to other clients, and AAI believes that the fees agreed upon with the Portfolio Managers are reasonable in light of the quality of investment advisory services rendered. The Board accepted AAI’s explanations in light of the Board’s findings as to the reasonableness of the aggregate management fees paid by the Fund and the fact that each Portfolio Manager’s fee is paid by AAI and not the Fund. The Board acknowledged that, as a business matter, AAI was entitled to earn reasonable profits for its services to the Fund. The Board determined that AAI’s profitability was reasonable in relation to the services provided and to the costs of providing management services to the Fund and supported the renewal of the Agreements.
EXTENT OF ECONOMIES OF SCALE AS THE FUND GROWS AND WHETHER FEE LEVELS REFLECT ECONOMIES OF SCALE
The Board considered whether economies of scale are realized by AAI as the Fund grows larger and the extent to which this is reflected in the level of management fees charged. The Board took into consideration the fee breakpoint schedules under the Agreements and concluded that the schedules reflect economies of scale with respect to the selection, evaluation and monitoring of Portfolio Managers and other services performed by AAI and the management of Fund assets by each Portfolio Manager. In this regard, the Board considered that the Fund has reached an asset size at which the Fund and its shareholders are benefiting from reduced management fee rates due to breakpoints in the management fees. Based on the foregoing, the Board concluded that the Fund was realizing economies of scale under the Agreements and management fee schedule, which support the renewal of the Agreements.
| | | | | | |
ANNUAL REPORT | |
| | DECEMBER 31, 2014 | | |
| | | | |
LIBERTY ALL-STAR® EQUITY FUND | | | | 37 |
BOARD CONSIDERATION OF THE RENEWAL OF THE FUND MANAGEMENT AND PORTFOLIO MANAGEMENT AGREEMENTS (UNAUDITED) | | | |
BENEFITS TO BE DERIVED FROM THE RELATIONSHIP WITH THE FUND
The Board also considered the potential “fall-out” benefits that AAI or the Portfolio Managers might receive in connection with their association with the Fund. In its consideration of the Agreements, the Board considered, among other things, that AAI and the Portfolio Managers may derive ancillary benefits from the Fund’s operations. For example, under the Agreements, AAI may request that transactions giving rise to brokerage commissions be executed through brokers and dealers that provide brokerage or research services to the Fund or AAI. Each Portfolio Manager, through its position as a Portfolio Manager to the Fund, also may engage in soft dollar transactions. In advance of the meeting, the Board received information regarding each Portfolio Manager’s procedures for executing portfolio transactions for the allocated portion of the Fund and each Portfolio Manager’s soft dollar policies and procedures. In addition, the Board considered that a Portfolio Manager may be affiliated with registered broker-dealers who may, from time to time, receive brokerage commissions from the Fund in connection with the purchase and sale of portfolio securities; provided, however, that those transactions, among other things, must be consistent with seeking best execution. The Board determined that the foregoing ancillary benefits were consistent with the renewal of the Agreements.
CONCLUSIONS
Based on its evaluation of all material factors, the Board unanimously concluded that the terms of each Agreement were reasonable and fair and that the renewal of each Agreement was in the best interests of the Fund and its shareholders.
| | |
www.all-starfunds.com | | USA |
| | | | |
| 38 | | | | LIBERTY ALL-STAR® EQUITY FUND |
| | | AUTOMATIC DIVIDEND REINVESTMENT AND DIRECT PURCHASE PLAN (UNAUDITED) |
| | | | |
Under the Fund’s Automatic Dividend Reinvestment and Direct Purchase Plan (the “Plan”), shareholders automatically participate and have all their Fund dividends and distributions reinvested by Computershare Trust Company, N.A., as agent for participants in the Plan (the “Plan Agent”), in additional shares of the Fund. For further information, call Investor Assistance at 1-800-LIB-FUND (1-800-542-3863) weekdays between 9 a.m. and 5 p.m. Eastern Time.
Shareholders whose shares are held in the name of a brokerage firm, bank or other nominee can participate in the Plan only if their brokerage firm, bank or nominee is able to do so on their behalf. Shareholders participating in the Plan through a brokerage firm may not be able to transfer their shares to another brokerage firm and continue to participate in the Plan.
Under the Plan, all dividends and distributions will be reinvested in additional shares of the Fund. Distributions declared payable in cash will be reinvested for the accounts of participants in the Plan in additional shares purchased by the Plan Agent on the open market at prevailing market prices. If, prior to the Plan Agent’s completion of such open market purchases, the market price of a share plus estimated brokerage commissions exceeds the net asset value, the remainder of the distribution will be paid in newly issued shares valued at net asset value (but not at a discount of more than 5% from market price). Distributions declared payable in shares (or cash at the option of shareholders) are paid to participants in the Plan entirely in newly issued full and fractional shares valued at the lower of market value or net asset value per share on the valuation date for the distribution (but not at a discount of more than 5 percent from market price). Dividends and distributions are subject to taxation, whether received in cash or in shares.
Plan participants have the option of making additional investments of $100 or more on a monthly basis up to a maximum of $120,000 in a calendar year. These direct purchases will be invested on or shortly after the 15th of each month and direct purchases should be sent so as to be received by the Plan Agent at least two business days prior to the next investment date. Barring suspension of trading, direct purchases will be invested within 35 days after such date. Alternatively, participants can authorize an automatic monthly deduction from a checking or savings account at a U.S. bank or other financial institution. A participant may withdraw a direct purchase by written notice received by the Plan Agent at least two business days before such payment is to be invested.
The Plan Agent maintains all shareholder accounts in the Plan and furnishes confirmations of all transactions in the account, including information needed by shareholders for tax records. Shares in the account of each Plan participant will be held by the Plan Agent in book-entry or noncertificated form in the name of the participant, and each shareholder’s proxy will include those shares purchased or received pursuant to the Plan.
There is no charge to participants for reinvesting distributions pursuant to the Plan. The Plan Agent’s fees are paid by the Fund, therefore indirectly by shareholders. There are no brokerage charges with respect to shares issued directly by the Fund as a result of dividends or distributions declared payable in shares. However, each participant bears a per share fee (which includes any brokerage commissions the Plan Agent is required to pay) incurred with respect to the Plan Agent’s open market purchases in connection with the reinvestment of distributions declared payable in cash.
With respect to direct purchases, the Plan Agent will charge $1.25 for purchase by check and $2.00 for automatic investment transactions, plus a per share fee (which includes any brokerage commissions the Plan Agent is required to pay). Sales of shares held in the Plan will also be subject to a service fee of $2.50 and a per share fee currently $0.10. All fees described in this summary are subject to change. Please contact the Plan Agent for the current fees.
Shareholders may terminate their participation in the Plan by notifying the Plan Agent by telephone, through the Internet or in writing. Such termination will be effective immediately if notice is received by The Plan Agent prior to any dividend record date and all subsequent dividends and distributions will be paid in cash instead of shares.
The Fund reserves the right to amend or terminate the Plan.
The full text of the Plan may be found on the Fund’s website at www.all-starfunds.com.
| | | | | | |
ANNUAL REPORT | |
| | DECEMBER 31, 2014 | | |
| | | | |
LIBERTY ALL-STAR® EQUITY FUND | | | | 39 |
TAX INFORMATION (UNAUDITED) | | | |
All 2014 distributions, whether received in cash or shares of the Fund, consist of the following:
(1) ordinary dividends,
(2) short-term capital gains,
(3) return of capital, and
(4) long-term capital gains
The table below details the breakdown of each 2014 distribution for federal income tax purposes.
| | | | | | | | | | | | |
| | | | | | | TOTAL ORDINARY DIVIDENDS | | | | |
| RECORD DATE | | PAYABLE DATE | | AMOUNT PER
SHARE | | QUALIFIED | | NON-QUALIFIED | | LONG-TERM
CAPITAL GAINS** | | RETURN OF
CAPITAL |
01/24/14 | | 03/10/14 | | $0.10 | | 26.16% | | 2.20% | | 69.42% | | 2.22% |
05/02/14 | | 06/16/14 | | $0.10 | | 26.16% | | 2.20% | | 69.42% | | 2.22% |
08/01/14 | | 09/15/14 | | $0.10 | | 26.16% | | 2.20% | | 69.42% | | 2.22% |
10/31/14 | | 01/02/15 | | $0.027962 | | 26.16% | | 2.20% | | 69.42% | | 2.22% |
10/31/14* | | 01/02/15 | | $0.062038 | | – | | – | | – | | – |
| * | Pursuant to Section 852 of the Internal Revenue Code, the taxability of this distribution will be reported in the Form 1099-DIV for 2015. |
| ** | Pursuant to Section 852(b) (3) of the Internal Revenue Code, Liberty All-Star Equity Fund designated $40,191,325 as long-term capital gain dividends. |
Tax Designations
The Fund designates the following as a percentage of taxable ordinary income distributions for the calendar year ended December 31, 2014:
| | |
Qualified Dividend Income | | 92.26% |
Dividend Received Deduction | | 78.72% |
DESCRIPTION OF LIPPER BENCHMARK AND MARKET INDICES (UNAUDITED)
Dow Jones Industrial Average
A price-weighted measure of 30 U.S. blue-chip companies.
Lipper Large-Cap Core Mutual Fund Average
The average of funds that, by portfolio practice, invest at least 75% of their equity assets in companies with market capitalizations (on a three-year weighted basis) above Lipper’s U.S. domestic equity large-cap floor. These funds typically have an average price-to-earnings ratio, price-to-book ratio, and three-year sales-per-share growth value, compared to the S&P 500® Index.
NASDAQ Composite Index
Measures all NASDAQ domestic and international based common type stocks listed on the NASDAQ Stock Market.
Russell 1000® Growth Index
Measures the performance of those Russell 1000® companies with higher price-to-book ratios and higher forecasted growth values. The Russell 1000® Index measures the performance of the 1,000 largest companies in the Russell 3000® Index.
Russell 1000® Value Index
Measures the performance of those Russell 1000® companies with lower price-to-book ratios and lower forecasted growth values. The Russell 1000® Index measures the performance of the 1,000 largest companies in the Russell 3000® Index.
Russell 3000® Index
Measures the performance of the 3,000 largest U.S. companies based on total market capitalization, which represents approximately 98% of the investable U.S. equity market.
S&P 500® Index
A large cap U.S. equities index that includes 500 leading companies and captures approximately 80% coverage of available market capitalization.
An investor cannot invest directly in an index.
| | |
www.all-starfunds.com | | USA |
| | | | |
| 40 | | | | LIBERTY ALL-STAR® EQUITY FUND |
| | | TRUSTEES AND OFFICERS (UNAUDITED) |
| | | | |
The names of the Trustees and Officers of the Liberty All-Star® Equity Fund, the date each was first elected or appointed to office, their term of office, their principal business occupations and other directorships they have held during at least the last five years, are shown below.
INDEPENDENT TRUSTEES
| | | | | | | | |
NAME (AGE)
AND ADDRESS* | | POSITION WITH EQUITY
FUND, TERM OF OFFICE
AND LENGTH OF SERVICE | | PRINCIPAL OCCUPATION(S)
DURING PAST FIVE YEARS | | NUMBER OF PORTFOLIOS IN FUND COMPLEX OVERSEEN BY DIRECTOR | | OTHER DIRECTORSHIPS HELD |
|
|
| | | | |
| John A. Benning, Year of Birth: 1934 | | Trustee Since 2002, Term expires 2015 | | Retired since December, 1999. | | 2 | | Director, Liberty All-Star® Growth Fund, Inc. (since 2002). |
|
|
| | | | |
| Thomas W. Brock, Year of Birth: 1947 | | Trustee Since 2005, Term expires 2017 | | Director, Silver Bay Realty (December 2012 – present); Former Chief Executive Officer, Stone Harbor Investment Partners LP (April 2006-2012); Adjunct Professor, Columbia University Graduate School of Business (since 1998). | | 2 | | Director, Liberty All-Star® Growth Fund, Inc. (since 2005). |
|
|
| | | | |
| George R. Gaspari, Year of Birth: 1940 | | Trustee Since 2006, Term Expires 2017 | | Financial Services Consultant (1996 – 2012). | | 2 | | Director, Liberty All-Star® Growth Fund, Inc. (since 1999); Trustee (since 1999) and Chairman-Audit Committee (since January 2015), The Select Sector SPDR Trust (since 1999) |
|
|
| | | | |
Richard W. Lowry, Year of Birth: 1936 | | Trustee Since 1986, Term expires 2016 Chairman since 2004 | | Private Investor since August 1987. | | 2 | | Director, Liberty All-Star® Growth Fund, Inc. (since 1994). |
|
|
| | | | |
John J. Neuhauser, Year of Birth: 1943 | | Trustee Since 1998, Term Expires 2016 | | President, St. Michael’s College (since August, 2007); University Professor December 2005 – 2007, Boston College (formerly Academic Vice President and Dean of Faculties, from August 1999 to December 2005, Boston College). | | 2 | | Director, Liberty All-Star®Growth Fund, Inc. (since 1998); Trustee, Columbia Funds Series Trust I (since 1985). |
|
|
| | | | |
Richard C. Rantzow, Year of Birth: 1938 | | Trustee Since 2006, Term expires 2016 | | Retired; Ernst & Young, Partner (1993); Chief Financial Officer, MillerSports (1993-1998). | | 2 | | Director and Chairman-Audit Committee, Liberty All-Star®Growth Fund, Inc. (since 2006); Trustee and Chairman-Audit Committee, Clough Global Allocation Fund (since 2004), Trustee, Clough Global Equity Fund (since 2005) and Trustee and Chairman- Audit Committee, Clough Global Opportunities Fund (since 2006) |
| * | The address for all Directors and Officers is: c/o ALPS Fund Services, Inc., 1290 Broadway, Suite 1100; Denver, CO 80203. |
| | | | | | |
ANNUAL REPORT | |
| | DECEMBER 31, 2014 | | |
| | | | |
LIBERTY ALL-STAR® EQUITY FUND | | | | 41 |
TRUSTEES AND OFFICERS (UNAUDITED) | | | |
INTERESTED TRUSTEE
| | | | | | | | |
NAME (AGE)
AND ADDRESS* | | POSITION WITH EQUITY
FUND, TERM OF OFFICE
AND LENGTH OF SERVICE | | PRINCIPAL OCCUPATION(S)
DURING PAST FIVE YEARS | | NUMBER OF PORTFOLIOS IN FUND COMPLEX OVERSEEN BY DIRECTOR** | | OTHER DIRECTORSHIPS HELD |
|
|
| | | | |
| Edmund J. Burke,** Year of Birth: 1961 | | Trustee Since 2006, Term expires 2015; | | Chief Executive Officer and President of ALPS Holdings, Inc., a DST Company (since November 2011); CEO and a Director of: ALPS Holdings, Inc. (since 2005); Director of ALPS Advisors, Inc. (since 2001), ALPS Distributors, Inc. (since 2000), ALPS Fund Services, Inc., (since 2000) and ALPS Portfolio Solutions Distributor, Inc. (since 2013). Mr. Burke is also a Director of Boston Financial Data Services (since 2013). | | 2 | | Director, Liberty All-Star® Growth Fund, Inc. (since 2006); President (since 2006), Trustee and Chairman (since 2009), Financial Investors Trust; Trustee (since 2004) and President (since 2006), Clough Global Allocation Fund, Trustee (since 2006), and President (since 2005), Clough Global Equity Fund, Trustee and President (since 2006), Clough Global Opportunities Fund. Mr. Burke is deemed an affiliate of the Funds as defined under the 1940 Act. |
OFFICERS
| | | | | | |
NAME (AGE) AND ADDRESS* | | POSITION WITH EQUITY FUND | | YEAR FIRST ELECTED OR APPOINTED TO OFFICE | | PRINCIPAL OCCUPATION(S) DURING PAST FIVE
YEARS |
|
|
| | | |
William R. Parmentier, Jr., Year of Birth: 1952 | | President | | 1999 | | Chief Investment Officer, ALPS Advisors, Inc. (since 2006); President of the Liberty All-Star Fund (since April 1999); Senior Vice President, Banc of America Investment Advisors, Inc. (2005-2006). Mr. Parmentier is deemed an affiliate of the Funds as defined under the 1940 Act. |
|
|
| | | |
Mark T. Haley, CFA, Year of Birth: 1964 | | Senior Vice President | | 1999 | | Senior Vice President of the Liberty All-Star Funds (since January 1999); Vice President, ALPS Advisors, Inc. (since 2006); Vice President, Banc of America Investment Advisors (1999-2006). Mr. Haley is deemed an affiliate of the Funds as defined under the 1940 Act. |
|
|
| | | |
Edmund J. Burke Year of Birth: 1961 | | Vice President | | 2006 | | Chief Executive Officer and President of ALPS Holdings, Inc., a DST Company (since November 2011); CEO and a Director of: ALPS Holdings, Inc. (since 2005); Director of ALPS Advisors, Inc. (since 2001), ALPS Distributors, Inc. (since 2000), ALPS Fund Services, Inc., (since 2000) and ALPS Portfolio Solutions Distributor, Inc. (since 2013). Mr. Burke is also a Director of Boston Financial Data Services (since 2013).Mr. Burke is deemed an affiliate of the Funds as defined under the 1940 Act. |
| * | The address for all Trustees is: c/o ALPS Fund Services, Inc., 1290 Broadway, Suite 1100; Denver, CO 80203. |
| ** | Mr. Burke is an “interested person” of the Funds, as defined in the 1940 Act, because he is an officer of ALPS Holdings, Inc. and a Director of ALPS Advisors, Inc. and ALPS Fund Services, Inc. |
| | |
www.all-starfunds.com | | USA |
| | | | |
| 42 | | | | LIBERTY ALL-STAR® EQUITY FUND |
| | | TRUSTEES AND OFFICERS (UNAUDITED) |
| | | | |
OFFICERS (continued)
| | | | | | |
NAME (AGE)
AND ADDRESS* | | POSITION WITH
EQUITY FUND | | YEAR FIRST ELECTED OR
APPOINTED TO OFFICE | | PRINCIPAL OCCUPATION(S) DURING PAST FIVE YEARS |
|
|
| | | |
Kimberly R. Storms, Year of Birth: 1972 | | Treasurer | | 2013 | | Director of Fund Administration and Senior Vice President of ALPS Fund Services, Inc. Ms. Storms is currently Treasurer of Financial Investors Trust and ALPS Series Trust; and Chief Financial Officer of Arbitrage Funds. Ms. Storms is also on the Board of Directors of the Denver Center for Crime Victims. Ms. Storms is deemed an affiliate of the Funds as defined under the 1940 Act. |
|
|
| | | |
Melanie H. Zimdars, Year of Birth: 1976 | | Chief Compliance Officer | | 2009 | | Ms. Zimdars is Vice President and Deputy Chief Compliance Officer with ALPS. Prior to joining ALPS in September 2009, Ms. Zimdars served as Principal Financial Officer, Treasurer and Secretary for the Wasatch Funds from February 2007 to December 2008. From November 2006 to February 2007, she served as Assistant Treasurer for the Wasatch Funds and served as a Senior Compliance Officer for Wasatch Advisors, Inc. since 2005. Ms. Zimdars is currently the CCO for ALPS Variable Investment Trust, ALPS ETF Trust, Broadview Opportunity Trust, Liberty All-Star Growth Fund, Inc., PowerShares QQQ Trust and BLDRS Index Funds Trust. Because of her position with ALPS, Ms. Zimdars is deemed to be an affiliate of the Trust. |
|
|
| | | |
Erin D. Nelson, Year of Birth: 1977 | | Secretary | | 2013 | | Vice President and Assistant General Counsel of ALPS Advisors, Inc. and Vice President of ALPS Fund Services, Inc., and ALPS Portfolio Solutions Distributor, Inc. Ms. Nelson is currently Secretary of ALPS ETF Trust, Clough Global Allocation Fund, Clough Global Equity Fund, Clough Global Opportunities Fund, and Principal Real Estate Income Fund. Ms. Nelson is deemed an affiliate of the Funds as defined under the 1940 Act. |
|
|
| | | |
Alex J. Marks, Year of Birth: 1974 | | Assistant Secretary | | 2011 | | Employee of ALPS Fund Services, Inc. since June 2011. Mr. Marks also served as an employee of ALPS Fund Services, Inc. from July 2006 to September 2010. Mr. Marks is deemed an affiliate of the Funds as defined under the 1940 Act. |
| * | The address for all Trustees is: c/o ALPS Fund Services, Inc., 1290 Broadway, Suite 1100; Denver, CO 80203 |
| | | | | | |
ANNUAL REPORT | |
| | DECEMBER 31, 2014 | | |
| | | | |
LIBERTY ALL-STAR® EQUITY FUND | | | | 43 |
PRIVACY POLICY (UNAUDITED) | | | |
This Privacy Policy Notice discloses the privacy policies of the Liberty All-Star® Funds, which are advised by ALPS Advisors, Inc. and serviced by ALPS Fund Services, Inc. (the “Companies”). The Companies and the Funds are referred to herein collectively as “we” or “us.”
PROTECTING YOUR PRIVACY IS A TOP PRIORITY
We realize that our ability to offer superior products and services depends on the personal and financial information we collect from you. We value your business and are committed to maintaining your trust. That is why we have made your privacy a top priority.
THE INFORMATION WE HAVE AND WHERE WE GET IT
We collect information about you from a variety of sources, including:
| Ÿ | | Information we receive from you on applications or other forms, such as your name, address and phone number; your social security number; and your assets, income and other household information; |
| Ÿ | | Information about your other transactions with us, our affiliates or others, such as your account balances and transactions history; and |
| Ÿ | | Information from visitors to our websites provided through online forms, site visitorship data and online information-collecting devices known as “cookies.” |
We do not solicit personal or financial information from minors without written parental consent, nor do we knowingly market products and services to minors.
HOW WE USE THIS INFORMATION
We may share all of the information we collect with the Companies as part of the ordinary course of providing financial products and services to you, for the purpose of offering you new products and services to address your financial needs, for product development purposes and as otherwise required or permitted by law.
To assist in our business dealings with you, we may also share this information with companies (other than the Companies) that perform services, including marketing services, on our behalf (such as vendors that package and mail our investor statements and marketing research firms that enhance our ability to market our products and services). We do not share your information with mailing list or direct marketing companies. Thus, the information you provide to us will not result in unwanted solicitations from third-party marketers.
Finally, we may share this information with other entities outside of the Companies for the following purposes, including among others:
| Ÿ | | To respond to a subpoena or court order, judicial process or regulatory inquiry; |
| Ÿ | | To report suspicious transactions to government agencies and law enforcement officials; |
| Ÿ | | To protect against fraud; |
| Ÿ | | To provide products and services with the consent or the direction of a customer; or |
| Ÿ | | In connection with the proposed or actual sale or merger of all or a portion of a business or operating unit. |
Except as described above, and except for information we provide to nonaffiliated third parties as otherwise required or permitted by law, we do not share information about you with nonaffiliated third parties.
SECURITY OF PERSONAL FINANCIAL INFORMATION
We restrict access to information about you to those employees we determine need to know that information to provide products and services to you. We maintain physical, electronic and procedural safeguards to protect this information.
If you provide information to us via our websites in order to view your account activity or conduct transactions, we use 128-bit SSL encryption security with passwords to ensure a safe transmission of data between you and us. Information you provide is stored and transmitted in a secure environment, accessible only by a select group of people who are given a secure passcode to access the information.
We continuously assess new technology for protecting information and upgrade our systems where appropriate.
IF YOU HAVE ANY QUESTIONS OR CONCERNS ABOUT THIS PRIVACY POLICY NOTICE, PLEASE WRITE TO US AT:
ALPS Advisors, Inc.
Attn: Compliance Department
1290 Broadway, Suite 1100
Denver, CO 80203
FORMER CUSTOMERS
If, for whatever reason, our customer relationship with you ends, we will preserve your information as necessary to comply with applicable laws. The measures we take to protect the privacy of customer information, as described in this Privacy Policy Notice, will continue to apply to you. We also will comply with more restrictive state laws to the extent they apply.
We reserve the right to change this Privacy Policy Notice, and any of the policies described herein, at any time. The examples contained in this Privacy Policy Notice are illustrations; they are not intended to be exclusive.
| | |
www.all-starfunds.com | | USA |

Item 2. Code of Ethics.
| | (a) | The registrant has, as of the end of the period covered by this report, adopted a code of ethics that applies to the registrant’s principal executive officer, principal financial officer, principal accounting officer or controller, or persons performing similar functions, regardless of whether these individuals are employed by the registrant or a third party. |
| | (c) | During the period covered by this report, there were not any amendments to a provision of the code of ethics adopted in 2(a) above. |
| | (d) | During the period covered by this report, there were not any waivers or implicit waivers to a provision of the code of ethics adopted in 2(a) above. |
| | (f) | The registrant’s Board of Trustees adopted, effective December 10, 2007, a revised code of ethics described in 2(a) above. The revised code of ethics is incorporated by reference to the registrant’s Form N-CSR filing made on March 7, 2008. There have been no revisions to such code of ethics since that date. |
Item 3. Audit Committee Financial Expert.
| | (a) | (1)(i) The registrant’s Board of Trustees has determined that there is one audit committee financial expert serving on its audit committee. |
(2) The registrant’s Board of Trustees has determined that Mr. Richard C. Rantzow is an “audit committee financial expert” and is “independent” as defined in paragraph (a)(2) of Item 3 of Form N-CSR.
Item 4. Principal Accountant Fees and Services.
(a) Audit Fees. The aggregate fees billed for each of the fiscal years ended December 31, 2013 and December 31, 2014 were approximately $41,000 and $41,000, respectively, for professional services rendered by the principal accountant for the audit of the registrant’s annual financial statements or services that are normally provided by the accountant in connection with the statutory and regulatory filings or engagements for those fiscal years
(b) Audit-Related Fees. The aggregate fees billed in each of the fiscal years ended December 31, 2013 December 31, 2014 were $0 and $0, respectively, for assurance and related services by the principal accountant that are reasonably related to the performance of the audit of the registrant’s financial statements and are not reported under paragraph (a) of this Item
(c) Tax Fees. The aggregate fees billed in each of the fiscal years ended December 31, 2013 and December 31, 2014 were approximately $3,915 and $3,940, respectively.
Tax Fees in both fiscal years 2013 and 2014 consist primarily of the review of annual tax returns and include amounts for professional services rendered by the principal accountant for tax compliance, tax advice and tax planning.
(d) All Other Fees. The aggregate fees billed in each of the fiscal years ended December 31, 2013 and December 31, 2014 were $0 and $0, respectively, for products and services provided by the principal accountant, other than the services reported in paragraphs (a) through (c) of this Item.
(e)(1) Audit Committee Pre-Approval Policies and Procedures
The registrant’s Audit Committee is required to pre-approve the engagement of the registrant’s independent accountants to provide audit and non-audit services to the registrant and non-audit services to its investment adviser (not including any sub-adviser whose role is primarily portfolio management and is subcontracted with or overseen by another investment adviser) or any entity controlling, controlled by, or under common control with such investment adviser that provides ongoing services to the registrant (“Adviser Affiliates”), if the engagement relates directly to the operations or financial reporting of the registrant, including the fees and other compensation to be paid to the independent accountants.
The Audit Committee has adopted a Policy for Engagement of Independent Accountants for Audit and Non-Audit Services (“Policy”). The Policy sets forth the understanding of the Audit Committees regarding the engagement of the registrant’s independent accountants to provide (i) audit and permissible audit-related, tax and other services to the registrant; (ii) non-audit services to the registrant’s investment adviser (not including any sub-adviser whose role is primarily portfolio management and is subcontracted with or overseen by another investment adviser) and Adviser Affiliates, if the engagement relates directly to the operations or financial reporting of a Fund; and (iii) other audit and non-audit services to the registrant’s investment adviser (not including any sub-adviser whose role is primarily portfolio management and is subcontracted with or overseen by another investment adviser) and Adviser Affiliates. Unless a type of service receives general pre-approval under the Policy, it requires specific pre-approval by the Audit Committee if it is to be provided by the independent accountants. Pre-approval of non-audit services to the registrant, the registrant’s investment adviser (not including any sub-adviser whose role is primarily portfolio management and is subcontracted with or overseen by another investment adviser) and Adviser Affiliates may be waived provided that the “de minimis” requirements set forth in the SEC’s rules relating to pre-approval of non-audit services are met.
Under the Policy, the Audit Committee may delegate pre-approval authority to any pre-designated member or members who are Independent Trustees/Directors. The member(s) to whom such authority is delegated must report, for informational purposes only, any pre-approval decisions to the Audit Committee at its next regular meeting. The Audit Committee’s responsibilities with respect to the pre-approval of services performed by the independent accountants may not be delegated to management.
The Policy requires the Fund Treasurer and/or Director of Board Administration to submit to the Audit Committee, on an annual basis, a schedule of the types of services that are subject to general pre-approval. The schedule(s) provide a description of each type of service that is subject to general pre-approval and, where possible, will provide estimated fee caps for each instance of providing each service. The Audit Committees will review and approve the types of services and review the projected fees for the next fiscal year and may add to, or subtract from, the list of general pre-approved services from time to time based on subsequent determinations. That approval acknowledges that each Audit Committee is in agreement with the specific types of services that the independent accountants will be permitted to perform.
(e)(2) The percentage of services described in each of paragraphs (b) through (d) of this Item that were approved pursuant to the “de minimis” exception under paragraph (c)(7)(i)(C) of Rule 2-01 of Regulation S-X during both fiscal years ended December 31, 2013 and December 31, 2014 was zero.
(f) Not Applicable.
(g) The aggregate non-audit fees billed by the registrant’s account for each of the fiscal years ended December 31, 2013 and December 31, 2014 $225,415 and $303,560, respectively, for services rendered to the registrant, and rendered to the registrant’s investment adviser (not including any sub-adviser whose role is primarily portfolio management and is subcontracted with or overseen by another investment adviser), and any entity controlling, controlled by, or under common control with the adviser that provides ongoing services to the registrant. These fees consisted of non-audit fees billed to (i) the registrant of $3,915 in 2013 and $3,940 in 2014 as described in response to paragraph (c) of this Item, and (ii) to ALPS Fund Services, Inc. (“AFS”), an entity under common control with the ALPS Advisors, Inc., the registrant’s investment adviser, of $221,500 in 2013 and $299,620 in 2014. The non-audit fees billed to AFS related to SSAE 16 services and other compliance related matters.
(h) The registrant’s Audit Committee has considered whether the provision of non-audit services that were rendered to the registrant’s investment adviser (not including any sub-adviser whose role is primarily portfolio management and is subcontracted with or overseen by another investment adviser), and any entity controlling, controlled by, or
under common control with the investment adviser that provides ongoing services to the registrant that were not pre-approved pursuant to paragraph (c)(7)(ii) of Rule 2-01 of Regulation S-X, is compatible with maintaining the principal accountant’s independence. The Audit Committee determined that the provision of such services is compatible with maintaining the principal accountant’s independence.
Item 5. Audit Committee of Listed Registrants.
The registrant has a separately-designated standing audit committee established in accordance with Section 3(a)(58)(A) of the Securities Exchange Act of 1934 (15 U.S.C. 78c(a)(58)(A)).
As of December 31, 2014, John A. Benning, Thomas W. Brock, George R. Gaspari, Richard W. Lowry, John J. Neuhauser and Richard C. Rantzow are each independent trustees and collectively constitute the entire Audit Committee.
Item 6. Investments.
| | (a) | The registrant’s “Schedule I – Investments in securities of unaffiliated issuers as of the close of the reporting period (as set forth in 17 CFR 210.12-12) is included as part of the report of shareholders filed under Item 1 of this Form N-CSR. |
Item 7. Disclosure of Proxy Voting Policies and Procedures for Closed-End Management Investment Companies.
The Fund has delegated to ALPS Advisors, Inc. (“AAI”) the responsibility to vote proxies relating to portfolio securities held by the Fund. In deciding to delegate this responsibility to AAI, the Fund’s Board reviewed and approved the policies and procedures adopted by AAI. These included the procedures that AAI follows when a vote presents a conflict between the interests of the Fund and its shareholders and AAI, its affiliates, its other clients or other persons.
All proxies regarding client securities for which AAI has authority to vote will, unless AAI determines in accordance with policies stated below to refrain from voting, be voted in a manner considered by AAI to be in the best interest of AAI’s clients without regard to any resulting benefit or detriment to AAI or its affiliates. The best interest of clients is defined for this purpose as the interest of enhancing or protecting the economic value of client accounts, considered as a group rather than individually, as AAI determines in its sole and absolute discretion. There may also be instances where a fund relies upon Section 12(d)(1)(F), and by law, the fund may be required to vote proxies in the same proportion as the vote of all other shareholders of the acquired fund (i.e., “echo vote”). In the event a client believes that its other interests require a different vote, AAI will vote as the client clearly instructs, provided AAI receives such instructions in time to act accordingly.
AAI endeavors to vote, in accordance with this Policy, all proxies of which it becomes aware, subject to the following general exceptions (unless otherwise agreed) when AAI expects to routinely refrain from voting:
| | 1. | Proxies will usually not be voted in cases where the security has been loaned from the Client’s account and subsequently, AAI determines that the type of proxy issue is not material to shareholders. AAI will utilize the below considerations to determine if a security then on loan should be recalled for voting purposes. Decisions will generally be made on a case-by-case basis depending on whether, in AAI’s judgment: |
| | • | | the matter to be voted on has critical significance to the potential value of the security in question; |
| | • | | the security represents a significant holding and whether the security is considered a long-term holding; and |
| | • | | AAI believes it can recall the security in time to cast the vote. |
| | 2. | Proxies will usually not be voted in cases where AAI deems the costs to the Client and/or the administrative inconvenience of voting the security outweigh the benefit of doing so (e.g., international issuers that impose share blocking restrictions). |
AAI seeks to avoid the occurrence of actual or apparent material conflicts of interest in the proxy voting process by voting in accordance with predetermined voting guidelines and observing other procedures that are intended to guard against and manage conflicts of interest (refer to Section III, Conflicts of Interest below).
For purposes of this policy, a material conflict of interest is a relationship or activity engaged in by AAI, an AAI affiliate, or an AAI associate that creates an incentive (or appearance thereof) to favor the interests of AAI, the affiliate, or associate, rather than the Client’s interests. For example, AAI may have a conflict of interest if either AAI has a significant business relationship with a company that is soliciting a proxy, or if an AAI associate involved in the proxy voting decision-making process has a significant personal or family relationship with the particular company. A conflict of interest is considered to be “material” to the extent that a reasonable person could expect the conflict to influence AAI’s decision on the particular vote at issue. In all cases where there is deemed to be a material conflict of interest, AAI will seek to resolve it in the Client’s best interests.
AAI follows the proxy guidelines and uses other research services provided by Institutional Shareholder Services, Inc. (“ISS”) or another independent third party. In providing proxy voting services to AAI, ISS provides vote recommendations on a pre-determined policy. Generally, AAI will vote proxies based on ISS’ pre-determined voting policy. In doing so, AAI demonstrates that its vote would not be a product of a conflict of interest as AAI would have little or no discretion on how the proxy was voted.
For those proxy proposals that: (1) are not addressed by AAI’s proxy voting guidelines; (2) the guidelines specify the issue must be evaluated and determined on a case-by-case basis; or (3) an AAI investment associate believes that an exception to the guidelines may be in the best economic interest of AAI’s clients (collectively, “Proxy Referrals”), AAI may vote the proxy, subject to the conflicts of interest procedures set forth below.
In the case of Proxy Referrals, Compliance will collect and review any information deemed reasonably appropriate to evaluate if AAI or any person participating in the proxy voting decision-making process has, or has the appearance of, a material conflict of interest. AAI investment personnel involved in the particular Proxy Referral must report any personal conflict of interest circumstances to AAI’s Chief Compliance Officer (“CCO”), or designee, in writing (see Appendix B - “Conflicts of Interest Disclosure and Certification Form”). Compliance will consider information about AAI’s significant business relationships, as well as other relevant information. The information considered by Compliance may include information regarding: (1) AAI client and other business relationships; (2) any relevant personal conflicts; and (3) communications between investment professionals and parties outside the AAI investment division regarding the proxy matter. Compliance will consult with relevant experts, including legal counsel, as necessary.
If Compliance determines that it reasonably believes (1) AAI has a material conflict of interest, or (2) certain individuals should be recused from participating in the proxy vote at issue, Compliance will inform the Chair of the Proxy Committee. Where a material conflict of interest is determined to have arisen in the proxy voting process, AAI’s policy is to invoke one or more of the following conflict management procedures:
| | 1. | Causing the proxies to be voted in accordance with the recommendations of an independent third party (which generally will be AAI’s proxy voting agent); |
| | 2. | Causing the proxies to be delegated to a qualified, independent third party, which may include AAI’s proxy voting agent; and |
| | 3. | In unusual cases, with the Client’s consent and upon ample notice, forwarding the proxies to AAI’s Clients so that they may vote the proxies directly. |
Affiliate Investment Companies and Public Companies
AAI considers proxies solicited by open-end and closed-end investment companies for which AAI or an affiliate serves as an investment adviser or principal underwriter to present a material conflict of interest for AAI. Consequently, the proxies of such affiliates will be voted following one of the conflict management procedures discussed above.
Management of Conflicts of Interest – Additional Procedures
AAI has various compliance policies and procedures in place in order to address any material conflicts of interest that might arise in this context.
| | 1. | AAI’s Code of Ethics affirmatively requires that associates of AAI act in a manner whereby no actual or apparent conflict of interest may be seen as arising between the associate’s interests and those of AAI’s Clients. |
| | 2. | By assuming his or her responsibilities pursuant to this Policy, each member of the Proxy Committee (including the chairperson) and any AAI or ALPS associate advising or acting under the supervision or oversight of the Proxy Committee undertakes: |
| | — | | To disclose in writing to AAI’s CCO, or designee, any actual or apparent personal material conflicts of interest which he or she may have (e.g., by way of substantial ownership of securities, relationships with nominees for directorship, members of an issuer’s or dissident’s management or otherwise) in determining whether or how AAI will vote proxies. Additionally, each member must disclose any direct, indirect or perceived influence or attempt to influence such action which the member or associate views as being inconsistent with the purpose or provisions of this Policy or the Code of Ethics of AAI. In the event any member of the Proxy Committee has a conflict of interest regarding a given matter, he or she will abstain from participating in the Committee’s determination of whether and/or how to vote in the matter; and |
| | — | | To refrain from taking into consideration, in the decision as to whether or how AAI will vote proxies the existence of any current or prospective material business relationship between AAI, ALPS or any of their affiliates, on one hand, and any party (or its affiliates) that is soliciting or is otherwise interested in the proxies to be voted, on the other hand. |
| | 3. | In certain circumstances, AAI follows the proxy guidelines and uses other research services provided by Institutional Shareholder Services, Inc. (“ISS”) or another independent third party. AAI has undertaken a review of ISS’ conflicts of interest procedures, and will continue to monitor them on an ongoing basis. In the event that AAI determines that it would be appropriate to use another third party, it will undertake a similar conflicts of interest assessment review. |
A description of the Fund’s proxy voting policies and procedures is available (i) on the Securities and Exchange Commission’s (“SEC”) website at www.sec.gov, and (ii) without charge, upon request, by calling 1-800-542-3863. Information regarding how the Fund voted proxies relating to portfolio securities during the 12-month period ended June 30th is available from the SEC’s website at www.sec.gov. Information regarding how the Fund voted proxies relating to portfolio securities is also available at www.all-starfunds.com.
Item 8. Portfolio Managers of Closed-End Management Investment Companies.
Cornerstone Capital Management, LLC (“Cornerstone”)
(a)(1) MANAGEMENT. The portion of the Fund allocated to Cornerstone is managed by Thomas G. Kamp, CFA, President and Chief Investment Officer of Cornerstone. Tom joined Cornerstone in February 2006 after thirteen years with Alliance Capital Management. As Cornerstone’s Chief Investment Officer, Tom leads the research team, is a member of the Investment Policy Committee and is responsible for all portfolio management decisions. At Alliance Capital Management, he was a Senior Vice President and Portfolio Manager within the Large Capitalization Growth Equity Group. He managed the Minneapolis office of Alliance and by December 2005, had responsibility for over $9 billion in assets including the AllianceBernstein Large Cap Growth Fund, the Alliance Premier Institutional Fund, the ACM Global Investments – American Growth Portfolio (Luxembourg based), the ACM Funds, Inc. – American Growth Fund (UK based), and the Alliance American Premier Growth Fund (Japan based). He was also responsible for over $5 billion of assets from public and private institutions and high net worth individuals around the world. Prior to joining Alliance Capital in 1993, Tom evaluated and participated in funding emerging companies for IAI Venture Capital Group. He earned an MBA with a specialization in Accounting from Northwestern University and a BSME with a minor in Applied Mathematics from Southern Methodist University. He has earned the right to use the CFA Institute Chartered Financial Analyst designation.
(a)(2) OTHER ACCOUNTS. The table below provides information regarding the other accounts managed by Thomas G. Kamp as of December 31, 2014:
| | | | | | | | |
Type of Account | | Number of
Accounts
Managed | | Total Assets
Managed
(in millions) | | Number of
Accounts Managed
for which Advisory
Fee is
Performance-
Based | | Assets Managed for
which Advisory Fee
is Performance-
Based
(in millions) |
Thomas G. Kamp | | | | | | | | |
Registered Investment Companies | | 6 | | $2,326.43 | | 0 | | N/A |
Other pooled investment vehicles | | 7 | | $822.26 | | 0 | | N/A |
Other accounts | | 21 | | $1,471.48 | | 0 | | N/A |
MATERIAL CONFILCTS OF INTEREST: None
(a)(3) COMPENSATION STRUCTURE. Mr. Kamp’s compensation consists of base salary, bonus and stock options.
(a)(4) OWNERSHIP BY PORTFOLIO MANAGERS.
| | |
| Portfolio Managers | | Dollar Range of the Registrant’s Securities Owned
by the Portfolio Managers |
Thomas G. Kamp | | None |
Matrix Asset Advisors, Inc. (“Matrix”)
(a)(1) MANAGEMENT. The portion of the Fund allocated to Matrix is managed by David A. Katz, Head of the Investment Policy Committee. Mr. Katz, CFA, graduated summa cum laude from Union College with a Bachelor of Arts degree in Economics. He received a Master of Business Administration degree, with a concentration in Finance, from New York University Graduate School of Business in 1987, graduating with distinction. His numerous works on Value Investing have earned him various awards and distinctions at the undergraduate and graduate levels. Mr. Katz has earned the right to use the CFA Institute Chartered Financial Analyst designation. After initially working at Management Asset Corporation (Westport, CT), Mr. Katz co-founded Value Matrix Management with John M. Gates in 1986. He served as the firm’s Senior Vice President and Chief Investment Officer and was Head of the Investment Policy Committee. In 1990 he merged the Value Matrix Management organization into Matrix Asset Advisors. Mr. Katz is the firm’s President and Chief Investment Officer, chairs the Investment Policy Committee and is a Portfolio Manager/Analyst.
(a)(2) OTHER ACCOUNTS. The table below provides information regarding the other accounts managed by Mr. Katz as of December 31, 2014:
| | | | | | | | |
Type of Account | | Number of
Accounts
Managed | | Total Assets
Managed
(in millions) | | Number of
Accounts Managed
for which Advisory
Fee is
Performance-
Based | | Assets Managed for
which Advisory Fee
is Performance-
Based
(in millions) |
David A. Katz | | | | | | | | |
Registered Investment Companies | | 1 | | $75.2 | | 0 | | N/A |
Other pooled investment vehicles | | 0 | | $0 | | 0 | | N/A |
Other accounts | | 456 | | $720.3 | | 0 | | N/A |
MATERIAL CONFILCTS OF INTEREST: None
(a)(3) COMPENSATION STRUCTURE. Matrix Portfolio Managers, including Mr. Katz, are paid competitively with meaningful potential bonuses based on individual performance and firm success. Base salary is approximately 50-75% of total compensation, with bonus, equity and profit sharing participation. Discretionary bonus is based on overall performance of the firm, and not performance of any particular account. Portfolio Managers are incented through competitive compensation and benefits, as well as high degrees of responsibility, input and autonomy. The firm has created a “stakeholder” program and profit sharing plan, in which key personnel are granted participation in the profitability of the firm in a parallel fashion as the owners of the firm. Such participation is contingent on continued employment. In addition, the firm has offered equity ownership to retain key investment professionals.
(a)(4) OWNERSHIP BY PORTFOLIO MANAGERS.
| | |
| Portfolio Managers | | Dollar Range of the Registrant’s Securities Owned
by the Portfolio Managers |
David A. Katz | | None |
Pzena Investment Management, LLC (“Pzena”)
(a)(1): MANAGEMENT. The portion of the Fund allocated to Pzena is managed by a team of portfolio managers. Individual portfolio managers on the team do not have any latitude to make independent portfolio decisions. All decisions require unanimous consent of a four-person portfolio management team. For the Fund, Richard Pzena, John Goetz, and Benjamin Silver have joint decision-making responsibility and “veto authority” over any decision.
Richard S. Pzena – Mr. Pzena is the Founder, Managing Principal, Chief Executive Officer and Co-Chief Investment Officer of the firm. Prior to forming Pzena Investment Management in 1995, Mr. Pzena was the Director of U.S. Equity Investments and Chief Research Officer for Sanford C. Bernstein & Company. He joined Bernstein in 1986 as an oil industry analyst and was named to the Institutional Investor All America Research Team from 1988-1990. During 1990 and 1991, Mr. Pzena served as Chief Investment Officer, Small Cap Equities, and assumed his broader domestic equity role in 1991. Prior to joining Bernstein, Mr. Pzena worked for the Amoco Corporation in various financial and planning roles. He earned a B.S. summa cum laude and an M.B.A. from the Wharton School of the University of Pennsylvania in 1979 and 1980, respectively.
John P. Goetz – Mr. Goetz is a Managing Principal and Co-Chief Investment Officer at the firm. Prior to joining Pzena Investment Management in 1996, Mr. Goetz held a range of key positions at Amoco Corporation for over 14 years, most recently as the Global Business Manager for Amoco’s $1 billion polypropylene business where he had bottom line responsibility for operations and development worldwide. Prior positions included strategic planning, joint venture investments and project financing in various oil and chemical businesses. Prior to joining Amoco, Mr. Goetz had been employed by The Northern Trust Company and Bank of America. He earned a B.A. summa cum laude in Mathematics and Economics from Wheaton College in 1979 and an M.B.A. from the Kellogg School at Northwestern University in 1982.
Benjamin S. Silver, CFA, CPA – Mr. Silver is a Principal, Co–Director of Research, and Portfolio Manager for Focused Value, Large Cap Focused Value, Large Cap Expanded Value and Small Cap Focused Value. Prior to joining Pzena Investment Management in 2001, Mr. Silver was a Research Analyst at Levitas & Company, a value based equity hedge fund. Mr. Silver was previously employed as a Manager for Ernst & Young LLP in their Financial Services Group from 1991 to 1996. He earned a B.S. magna cum laude in Accounting from Sy Syms School of Business at Yeshiva University. Mr. Silver is a Certified Public Accountant and holds the Chartered Financial Analyst designation.
(a)(2): OTHER ACCOUNTS. The table below provides information regarding the other accounts managed by Messrs. Pzena, Goetz, and Silver, as of December 31, 2014.
| | | | | | | | |
Type of Account | | Number of
Accounts
Managed | | Total Assets
Managed (in millions) | | Number of
Accounts Managed
for which Advisory
Fee is
Performance-
Based | | Assets Managed for
which Advisory Fee
is Performance-
Based (in millions) |
Richard S. Pzena | | | | | | | | |
Registered Investment Companies | | 9 | | $10,033 | | 2 | | $6,796 |
Other pooled investment vehicles | | 28 | | $1,014 | | 0 | | $0 |
Other accounts | | 119 | | $5,496 | | 3 | | $771 |
| | | | |
John P. Goetz | | | | | | | | |
Registered Investment Companies | | 9 | | $9,401 | | 1 | | $5,502 |
Other pooled investment vehicles | | 35 | | $5,397 | | 1 | | $253 |
Other accounts | | 51 | | $7,677 | | 2 | | $142 |
| | | | | | | | |
Benjamin Silver | | | | | | | | |
Registered Investment Companies | | 6 | | $8,527 | | 1 | | $5,502 |
Other pooled investment vehicles | | 26 | | $997 | | 0 | | $0 |
Other accounts | | 105 | | $5,160 | | 3 | | $771 |
MATERIAL CONFLICTS OF INTEREST: Conflicts of interest may arise in managing the Fund’s portfolio investments, on the one hand, and the portfolios of Pzena’s other clients and/or accounts (together “Accounts”), on the other. Set forth below is a brief description of some of the material conflicts which may arise and Pzena’s policy or procedure for handling them.
Although Pzena has designed such procedures to prevent and address conflicts, there is no guarantee that such procedures will detect every situation in which a conflict arises.
The management of multiple Accounts inherently means there may be competing interests for the portfolio management team’s time and attention. Pzena seeks to minimize this by utilizing one investment approach (i.e., “classic” value investing), and by managing all Accounts on a product specific basis. Thus, all large cap value Accounts, whether they are mutual fund accounts, institutional accounts or individual accounts, are managed using the same investment discipline, strategy and proprietary investment model as the Fund.
If the portfolio management team identifies a limited investment opportunity which may be suitable for more than one Account, the Fund may not be able to take full advantage of that opportunity. However, Pzena has adopted procedures for allocating portfolio transactions across Accounts so that each Account is treated fairly.
With respect to securities transactions for the Accounts, Pzena determines which broker to use to execute each order, consistent with its duty to seek best execution. Pzena aggregates like orders where it believes doing so is beneficial to the Accounts. However, with respect to certain Accounts, Pzena may be limited by clients with respect to the selection of brokers or it may be instructed to direct trades through particular brokers. In these cases, Pzena may place separate, non-simultaneous transactions for the Fund and another Account which may temporarily affect the market price of the security or the execution of the transaction to the detriment of one or the other.
Conflicts of interest may arise when members of the portfolio management team transact personally in securities investments made or to be made for the Fund or other Accounts. To address this, Pzena has adopted a written Code of Business Conduct and Ethics designed to prevent and detect personal trading activities that may interfere or conflict with client interests (including Fund shareholders’ interests) or its current investment strategy.
Pzena manages some Accounts under performance-based fee arrangements. Pzena recognizes that this type of incentive compensation creates the risk for potential conflicts of interest. The structure may create inherent pressure to allocate investments having a greater potential for higher returns to those Accounts with higher performance fees. To prevent conflicts of interest associated with managing accounts with different fee structures, Pzena generally requires portfolio decisions to be made on a product specific basis (i.e., for all large cap value Accounts). Pzena also requires pre-allocation of all client orders based on specific fee-neutral criteria set forth above. Additionally, Pzena requires average pricing of all aggregated orders. Finally, Pzena has adopted a policy prohibiting portfolio managers (and all employees) from placing the investment interests of one client or a group of clients with the same investment objectives above the investment interests of any other client or group of clients with the same or similar investment objectives.
(a)(3): COMPENSATION STRUCTURE. Pzena portfolio managers, including Messrs. Pzena, Goetz, and Silver, and other investment professionals at Pzena are compensated through a combination of a fixed base salary, performance bonus and equity ownership, if appropriate due to superior performance. Pzena avoids a compensation model that is driven by individual security performance, as this can lead to short-term thinking which is contrary to the firm’s value investment philosophy. Pzena considers both quantitative and qualitative factors when determining performance bonuses; however, performance bonuses are not based directly on the performance of the Fund or other clients. For investment professionals, Pzena examines such things as effort, efficiency, ability to focus on the correct issues, stock modeling ability, and ability to successfully interact with company management. However, Pzena always looks at the person as a whole and the contributions that he/she has made and is likely to make in the future. The time frame Pzena examines for bonus compensation is annual. Ultimately, equity ownership is the primary tool used by Pzena for attracting and retaining the best people. Shares may be in the form of capital interests or profits only interests. All shares are voting shares (i.e., not phantom stock).
(a)(4) OWNERSHIP BY PORTFOLIO MANAGERS:
| | |
| Portfolio Managers | | Dollar Range of the Registrant’s Securities Owned
by the Portfolio Managers |
Richard S. Pzena | | None |
John P. Goetz | | None |
Benjamin Silver | | None |
Schneider Capital Management Corporation (“Schneider”)
(a)(1) MANAGEMENT. The portion of the Fund allocated to Schneider is managed by Arnold C. Schneider III, CFA. Mr. Schneider serves as President and Chief Investment Officer and manages the portion of Fund allocated to Schneider. Prior to founding Schneider, Mr. Schneider was a Senior Vice President and Partner of the Wellington Management Company. He has earned the right to use the CFA Institute Chartered Financial Analyst designation. Mr. Schneider received a B.S. in Finance from the McIntire School of Commerce of the University of Virginia.
(a)(2) OTHER ACCOUNTS. The table below provides information about the other accounts managed by Mr. Schneider as of December 31, 2014:
| | | | | | | | |
Type of Account | | Number of
Accounts
Managed | | Total Assets
Managed (in millions) | | Number of
Accounts
Managed for
which
Advisory Fee is
Performance-
Based | | Assets Managed for
which Advisory Fee
is Performance-
Based (in millions) |
Arnold C. Schneider III | | | | | | | | |
| | | | |
Registered Investment Companies | | 6 | | $387 | | 0 | | N/A |
Other pooled investment vehicles | | 3 | | $129 | | 0 | | N/A |
Other accounts | | 4 | | $562 | | 0 | | N/A |
MATERIAL CONFILCTS OF INTEREST: None
(a)(3) COMPENSATION STRUCTURE. Mr. Schneider’s compensation consists of a fixed base salary and a bonus. A portion of his bonus may be deferred. Generally, his salary is fixed at the beginning of each year; his bonus and any deferred compensation are discretionary and based on the overall profitability of the firm.
(a)(4) OWNERSHIP BY PORTFOLIO MANAGER.
| | |
| Portfolio Managers | | Dollar Range of the Registrant’s Securities Owned
by the Portfolio Managers |
Arnold C. Schneider III | | None |
TCW Investment Management Company (“TCW”)
(a)(1) MANAGEMENT. The portion of the Fund allocated to TCW is managed by Craig C. Blum, CFA, Portfolio Manager, Managing Director and US Equities – Mr. Blum is Co-Portfolio Manager of the Concentrated Core and Select Equities investment strategies. He joined TCW in 1999 as part of a program designed to fast-track high potential individuals, providing them with in-depth knowledge of the firm’s various investment groups. After gaining experience in the High Yield and Mortgage-Backed Securities Groups, in 2000 Mr. Blum joined the US Equity Research Group as an Analyst covering data networking, communications equipment, and enterprise hardware and software companies. In 2002, Mr. Blum became a member of the Concentrated Core / Select Equities Group, and in 2004 he was promoted to Co-Portfolio Manager. Prior to joining TCW, Mr. Blum focused on commercial mortgage-backed securities cash flow modeling and deal structuring as a Senior Analyst with FMAC Capital Markets. Prior to that, he worked in institutional sales and mortgage-backed securities analysis at PaineWebber. Mr. Blum began his investment career in 1994 at Merrill Lynch where he developed a financial advisory business focused on high net worth and corporate clients. He has more than 10 years’ experience in the
investment management industry. Mr. Blum received his Bachelor of Science in Applied Mathematics and Computer Science from the University of California at Los Angeles (UCLA) in 1993, and his MBA in Finance from the UCLA Anderson Graduate School of Management in 1999. Mr. Blum has earned the right to use the CFA Institute Chartered Financial Analyst designation.
(a)(2) OTHER ACCOUNTS. The table below provides information about the other accounts managed by Mr. Blum as of December 31, 2014:
| | | | | | | | |
Type of Account | | Number of
Accounts
Managed | | Total Assets
Managed
(in millions) | | Number of
Accounts Managed
for which Advisory
Fee is
Performance-
Based | | Assets Managed for
which Advisory Fee
is Performance-
Based
(in millions) |
Craig C. Blum | | | | | | | | |
| | | | |
Registered Investment Companies | | 2 | | $2,056 | | 0 | | n/a |
Other pooled investment vehicles | | 4 | | $430 | | 1 | | $106 |
Other accounts | | 55 | | $5,690 | | 2 | | $354 |
(a)(3) COMPENSATION STRUCTURE. The overall objective of the Advisor’s compensation program for portfolio managers is to attract competent and expert investment professionals and to retain them over the long-term. Compensation is comprised of several components which, in the aggregate, are designed to achieve these objectives and to reward the portfolio managers for their contributions to the successful performance of the accounts they manage. Portfolio managers are compensated through a combination of base salary, profit sharing based compensation (“profit sharing”), bonus and equity incentive participation in the Advisor’s parent company (“equity incentives”). Profit sharing and equity incentives generally represent most of the portfolio managers’ compensation. In some cases, portfolio managers are eligible for discretionary bonuses.
Salary. Salary is agreed to with managers at time of employment and is reviewed from time to time. It does not change significantly and often does not constitute a significant part of the portfolio manager’s compensation.
Profit Sharing. Profit sharing is linked quantitatively to a fixed percentage of net income relating to accounts in the investment strategy area for which the portfolio managers are responsible and is typically paid quarterly. In most cases, revenues are allocated to a pool and profit sharing compensation is paid out after the deduction of certain expenses (including base salaries) related to the strategy group. The profit sharing percentage used to compensate a portfolio manager for management of the Funds is generally the same as that used to compensate portfolio managers for all other client accounts in the same strategy managed by the Advisor or one of the other TCW Advisors (together, “the TCW Group”). Income included in a profit sharing pool will relate to the products managed by the portfolio manager. In some cases, the pool includes revenues related to more than one equity or fixed income product where the portfolio managers work together as a team, in which case each participant in the pool is entitled to profit sharing derived from all the included products. In certain cases, a portfolio manager may also participate in a profit sharing pool that includes revenues from products besides the strategies offered in the Funds, including alternative investment products; the portfolio manager would be entitled to participate in such pool where he or she supervises, is involved in the management of, or is associated with a group, other members of which manage, such products. Profit sharing arrangements are generally the result of agreement between the portfolio manager and the TCW Group, although in some cases they may be discretionary based on supervisor allocation.
In some cases, the profit sharing percentage is subject to increase based on the relative pre-tax performance of the investment strategy composite returns, net of fees and expenses, to that of the benchmark. The measurement of performance relative to the benchmark can be based on single year or multiple year metrics, or a combination thereof. The benchmark used is the one associated with the Fund managed by the portfolio manager as disclosed in the prospectus. Benchmarks vary from strategy to strategy but, within a given strategy, the same benchmark applies to all accounts, including the Fund.
Discretionary Bonus/Guaranteed Minimums. In general, portfolio managers do not receive discretionary bonuses. However, in some cases bonuses may be paid on a discretionary basis out of a department profit sharing pool, as determined by the supervisor(s) in the department. In other cases where portfolio managers do not receive profit sharing or where the company has determined the combination of salary and profit sharing does not adequately
compensate the portfolio manager, discretionary bonuses may be paid by the TCW Group. Also, pursuant to contractual arrangements, some portfolio managers may be entitled to a mandatory bonus if the sum of their salary and profit sharing does not meet certain minimum thresholds.
Equity Incentives. Many portfolio managers participate in equity incentives based on overall firm performance of the TCW Group and its affiliates, through ownership or participation in restricted unit plans that vest over time or unit appreciation plans of the Advisor’s parent company. The plans include the Fixed Income Retention Plan, Restricted Unit Plan and 2013 Equity Unit Incentive Plan.
Under the Fixed Income Retention Plan, certain portfolio managers in the fixed income area were awarded cash and/or partnership units in the Advisor’s parent company, either on a contractually-determined basis or on a discretionary basis. Awards under this plan were made in 2010 that vest over a period of time and other awards are granted annually.
Under the Restricted Unit Plan, certain portfolio managers in the fixed income and equity areas were awarded partnership units in the Advisor’s parent company. Awards under this plan vest over time. Vesting is in part dependent on satisfaction of performance criteria.
Under the 2013 Equity Unit Incentive Plan, certain portfolio managers in the fixed income and equity areas are awarded options to acquire partnership units in the Advisor’s parent company with a strike price equal to the fair market value of the option at the date of grant. The options granted under the plan are subject to vesting and other conditions.
Other Plans and Compensation Vehicles. Portfolio managers may also elect to participate in the TCW Group’s 401(k) plan, to which they may contribute a portion of their pre- and post-tax compensation to the plan for investment on a tax-deferred basis.
(a)(3) POTENTIAL CONFLICTS OF INTEREST IN MANAGING MULTIPLE ACCOUNTS. Like other investment professionals with multiple clients, a portfolio manager for a Fund may face certain potential conflicts of interest in connection with managing both the Fund and other accounts at the same time. The paragraphs below describe some of these potential conflicts, which may be faced by investment professionals at most major financial firms. ALPS Advisors, Inc. and the Fund have adopted compliance policies and procedures that attempt to address certain of these potential conflicts.
The management of accounts with different advisory fee rates and/or fee structures, including accounts that pay advisory fees based on account performance (“performance fee accounts”), may raise potential conflicts of interest by creating an incentive to favor higher-fee accounts. These potential conflicts may include, among others:
• The most attractive investments could be allocated to higher-fee accounts or performance fee accounts.
• The trading of higher-fee accounts could be favored as to timing and/or execution price. For example, higher-fee accounts could be permitted to sell securities earlier than other accounts when a prompt sale is desirable or to buy securities at an earlier and more opportune time.
• The trading of other accounts could be used to benefit higher-fee accounts (front-running).
• The investment management team could focus their time and efforts primarily on higher-fee accounts due to a personal stake in compensation.
Potential conflicts of interest may also arise when the portfolio managers have personal investments in other accounts that may create an incentive to favor those accounts.
A potential conflict of interest may arise when a Fund and other accounts purchase or sell the same securities. On occasions when a portfolio manager considers the purchase or sale of a security to be in the best interests of a Fund as well as other accounts, the adviser’s trading desk may, to the extent permitted by applicable laws and regulations, aggregate the securities to be sold or purchased in order to obtain the best execution and lower
brokerage commissions, if any. Aggregation of trades may create the potential for unfairness to a Fund or another account if one account is favored over another in allocating the securities purchased or sold – for example, by allocating a disproportionate amount of a security that is likely to increase in value to a favored account.
“Cross trades,” in which one account sells a particular security to another account (potentially saving transaction costs for both accounts), may also pose a potential conflict of interest. Cross trades may be seen to involve a potential conflict of interest if, for example, one account is permitted to sell a security to another account at a higher price than an independent third party would pay. The Fund has adopted compliance procedures that provide that any transactions between a Fund and another advised account are to be made at an independent current market price, as required by law.
Another potential conflict of interest may arise based on the different investment objectives and strategies of a Fund and other accounts. For example, another account may have a shorter-term investment horizon or different investment objectives, policies or restrictions than a Fund. Depending on another account’s objectives or other factors, a portfolio manager may give advice and make decisions that may differ from advice given, or the timing or nature of decisions made, with respect to a Fund. In addition, investment decisions are the product of many factors in addition to basic suitability for the particular account involved. Thus, a particular security may be bought or sold for certain accounts even though it could have been bought or sold for other accounts at the same time. More rarely, a particular security may be bought for one or more accounts managed by a portfolio manager when one or more other accounts are selling the security (including short sales). There may be circumstances when purchases or sales of portfolio securities for one or more accounts may have an adverse effect on other accounts.
A Fund’s portfolio manager who is responsible for managing multiple funds and/or accounts may devote unequal time and attention to the management of those funds and/or accounts. As a result, the portfolio manager may not be able to formulate as complete a strategy or identify equally attractive investment opportunities for each of those accounts as might be the case if he or she were to devote substantially more attention to the management of a single fund. The effects of this potential conflict may be more pronounced where funds and/or accounts overseen by a particular portfolio manager have different investment strategies.
A Fund’s portfolio managers may be able to select or influence the selection of the brokers and dealers that are used to execute securities transactions for the Fund. In addition to executing trades, some brokers and dealers provide portfolio managers with brokerage and research services (as those terms are defined in Section 28(e) of the Securities Exchange Act of 1934), which may result in the payment of higher brokerage fees than might have otherwise be available. These services may be more beneficial to certain funds or accounts than to others. Although the payment of brokerage commissions is subject to the requirement that the portfolio manager determine in good faith that the commissions are reasonable in relation to the value of the brokerage and research services provided to the fund, a portfolio manager’s decision as to the selection of brokers and dealers could yield disproportionate costs and benefits among the funds and/or accounts that he or she manages.
The adviser or an affiliate may provide more services (such as distribution or recordkeeping) for some types of funds or accounts than for others. In such cases, a portfolio manager may benefit, either directly or indirectly, by devoting disproportionate attention to the management of fund and/or accounts that provide greater overall returns to the investment manager and its affiliates.
A Fund’s portfolio manager(s) may also face other potential conflicts of interest in managing the Fund, and the description above is not a complete description of every conflict that could be deemed to exist in managing both a Fund and other accounts. In addition, a Fund’s portfolio manager may also manage other accounts (including their personal assets or the assets of family members) in their personal capacity. The management of these accounts may also involve certain of the potential conflicts described above. Investment personnel at the advisers, including each Fund’s portfolio manager, are subject to restrictions on engaging in personal securities transactions pursuant to Codes of Ethics adopted by the adviser.
The Fund’s sub-adviser has trade allocation and other policies and procedures that it believes are reasonably designed to address these and other potential conflicts of interest.
(a)(4) OWNERSHIP BY PORTFOLIO MANAGERS.
| | |
| Portfolio Managers | | Dollar Range of the Registrant’s Securities Owned
by the Portfolio Managers |
Craig C. Blum | | None |
Item 9. Purchases of Equity Securities by Closed-End Management Investment Company and Affiliated Purchasers.
During the fiscal year ended December 31, 2014, there were no purchases made by or on behalf of the registrant or any “affiliated purchaser”, as defined in Rule 10b-18(a)(3) under the Securities Exchange Act of 1934 (“Exchange Act”), of shares or other units of any class of the registrant’s equity securities that are registered by the registrant pursuant to Section 12 of the Exchange Act.
Item 10. Submission of Matters to a Vote of Security Holders.
There have not been any material changes to the procedures by which shareholders may recommend nominees to the registrant’s Board of Trustees, since those procedures were last disclosed in response to the requirements of Item 407(c)(2)(iv) of Regulation S-K or this Item.
Item 11. Controls and Procedures.
| | (a) | The registrant’s principal executive officer and principal financial officers, based on their evaluation of the registrant’s disclosure controls and procedures as of a date within 90 days of the filing of this report, have concluded that such controls and procedures are adequately designed to ensure that information required to be disclosed by the registrant in Form N-CSR is accumulated and communicated to the registrant’s management, including the principal executive officer and principal financial officer, or persons performing similar functions, as appropriate to allow timely decisions regarding required disclosure. |
| | (b) | There were no changes in the registrant’s internal control over financial reporting that occurred during the registrant’s second fiscal quarter of the period covered by this report that has materially affected, or is reasonably likely to materially affect, the registrant’s internal control over financial reporting. |
Item 12. Exhibits.
(a)(1) The registrant’s Code of Ethics for Principal Executive and Senior Financial Officers that applies to the registrant’s principal executive officer and principal financial officer and as described in Item 2 hereof is incorporated by reference to Exhibit-99-12(a)(1) to the registrant’s Form N-CSR for its fiscal year ended December 31, 2007, filed electronically with the Securities and Exchange Commission on March 7, 2008.
(a)(2) Certifications pursuant to Rule 30a-2(a) under the Investment Company Act of 1940 (17 CFR 270.30a-2(a)) are attached hereto as Exhibit 99.CERT.
(a)(3) Not Applicable.
(b) Certifications pursuant to Rule 30a-2(b) under the Investment Company Act of 1940 (17 CFR 270.30a-2(b)) are attached hereto as Exhibit 99.906CERT.
SIGNATURES
Pursuant to the requirements of the Securities Exchange Act of 1934 and the Investment Company Act of 1940, the registrant has duly caused this report to be signed on its behalf by the undersigned, thereunto duly authorized.
LIBERTY ALL-STAR EQUITY FUND
| | | | |
| By: | | /s/ William R. Parmentier, Jr. | | |
| | William R. Parmentier, Jr. (Principal Executive Officer) |
| | President | | |
| | |
| Date: | | March 4, 2015 | | |
| | |
| By: | | /s/ Kimberly R. Storms | | |
| | Kimberly R. Storms (Principal Financial Officer) |
| | Treasurer | | |
| | |
| Date: | | March 4, 2015 | | |