
June 2008
Jefferies Annual
Healthcare Conference

Forward Looking Statements
This presentation contains, and answers given to questions that may be asked today may constitute, forward-looking statements
that are subject to a number of risks and uncertainties, many of which are outside our control. All statements regarding our
strategy, future operations, financial position, estimated revenues or losses, projected costs, prospects, plans and objectives,
other than statements of historical fact included in our prospectus, are forward-looking statements. When used in this
presentation or in answers given to questions asked today, the words “may,” “will,” “could,” “would,” “expect,” “intend,” “plan,”
“anticipate,” “believe,” “estimate,” “project,” “potential,” “continue,” and similar expressions are intended to identify forward-
looking statements, although not all forward-looking statements contain these identifying words. You should not place undue
reliance on forward-looking statements. While we believe that we have a reasonable basis for each forward-looking statement
that we make, we caution you that these statements are based on a combination of facts and factors currently known by us and
projections of future events or conditions, about which we cannot be certain. For a more complete discussion regarding these
and other factors which could affect the Company's financial performance, refer to the Company's various filings with the
Securities and Exchange Commission, including its filing on Form 10-K for the year ended December 31, 2007, in particular
information under the headings "Special Caution Regarding Forward-Looking Statements" and “Risk Factors.” These cautionary
statements qualify all of the forward-looking statements. In addition, market and industry statistics contained in this presentation
are based on information available to us that we believe is accurate. This information is generally based on publications that are
not produced for purposes of securities offerings or economic analysis.
All forward-looking statements speak only as of the date of this presentation. Except as required by law, we assume no
obligation to update these forward-looking statements publicly or to update the factors that could cause actual results to differ
materially, even if new information becomes available in the future.

Investment Highlights
Leading regional home health provider
40+% three year revenue CAGR
Decentralized operating model
Strong capital position
Raised $42 million in equity in 2008
Disciplined approach to acquisitions driven by seasoned
management
Growing force in consolidating home health care market
12 acquisitions in three years
Three geographic clusters: Northeast, Southeast and Midwest
Patient Care acquisition brings annual revenue run rate
to $200 million

Acquiring Patient Care for
$46.5 million
8 branch locations, $47 million in
revenue
Strong local brand
Tremendous growth opportunity
Major expansion of Northeast
operations
Enter New Jersey with 3 branches
Densify Connecticut adding 4
branches for 10 total branches with
~$30 million in revenue
Initial presence in Pennsylvania
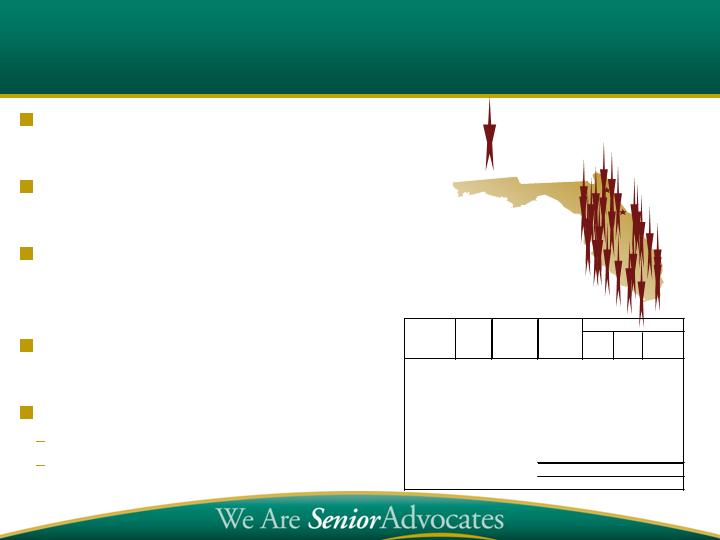
Patient Care Acquisition
Locations
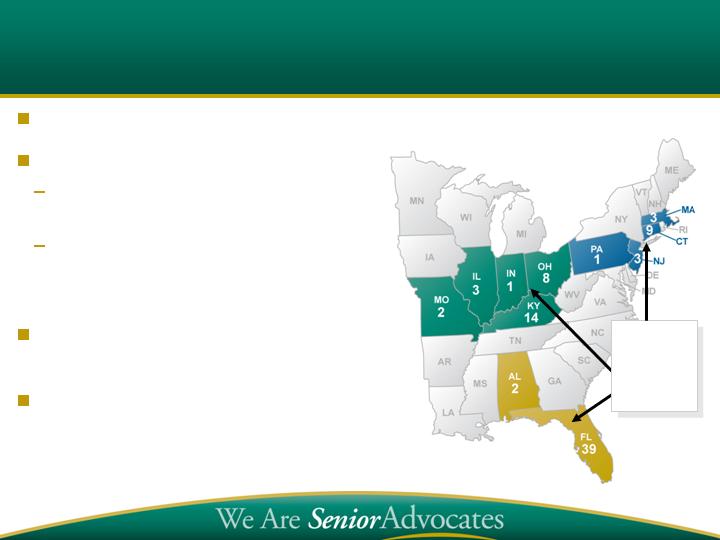
Founded Louisville, KY -- 1976
Two home health segments:
Visiting Nurse Medicare-certified
(~80% of revenue)
Personal Care primarily Medicaid-
Waiver (~20% of revenue) Non-
skilled
89 locations in three geographic
clusters, spanning 11 states
Revenue run rate over $200 million
with Patient Care
Almost Family Overview
Almost Family Locations
Geographic
Focus:
Northeast
Midwest
Southeast

6
10 years at AFAM
VP Operations Personal Care
–
David Pruitt
at AFAM as senior operator
18 years
SVP VN Operations North
–
Anne Liechty
ital management
osp
h
ears
13 y
SVP
AFAM
10 years as
SVP Administration
–
Todd Lyles
ccounting
9 years Big Six public a
CFO
AFAM
15 years as
CFO
SVP and
–
ve Guenthner
Ste
hareholder
Founding s
CEO
AFAM
26 years as
CEO
–
William Yarmuth
Core Team Together for Over a Decade
Experienced Management Team
Recently Added Talent to Manage Growth
Phyllis
Montville
–
SVP VN Operations South
Florida
2+ years
at AFAM
, 20+ years as senior operator of home health
b
usinesses
Cathy Newhouse
–
SVP Clinical Programs, Sales
and
Marketing
22 years with Gentiva
Michael
Moses
–
VP Group Living Programs
Founder Quality of Life Home Care
Nancy Ralston and James Spriggs
–
VPs
Operations North Florida
Founders Apex Home Health Care
Ray Rasa
–
VP Operations Northeast
20+ years home health, Gentiva and Patient Care
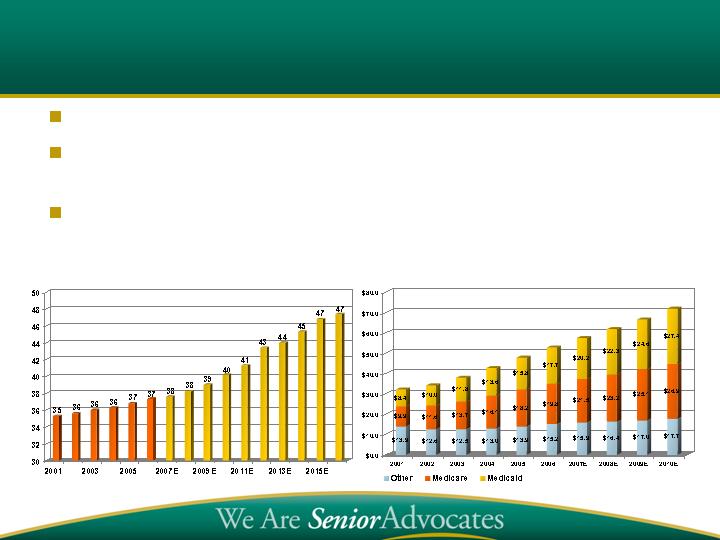
Compelling Market Opportunity
U.S. Population age 65 and over
(Millions)
Source: CMS
Aging U.S. population with higher incidence of chronic illness
Patient preference for home care and payor preference for cost-
effective care settings
Spending: $19.8B Medicare, $17.7B Medicaid in 2006
Home Health Expenditures
($Billions)
$32.2
$34.2
$38.0
$42.7
$47.9
$52.7
$57.6
$62.0
$66.7
$71.8
5

Fragmented Home Health Market -
Calls for Consolidation
Source: CMS, MedPAC, National Association for Home Care and Hospice
~8,800 Medicare-certified
home health agencies in U.S.
~7,000 agencies are
independently-owned
operations
Almost Family’s acquisition
criteria
Geographically
complementary markets
Multi-site, free-standing
agencies or hospital-based
agencies
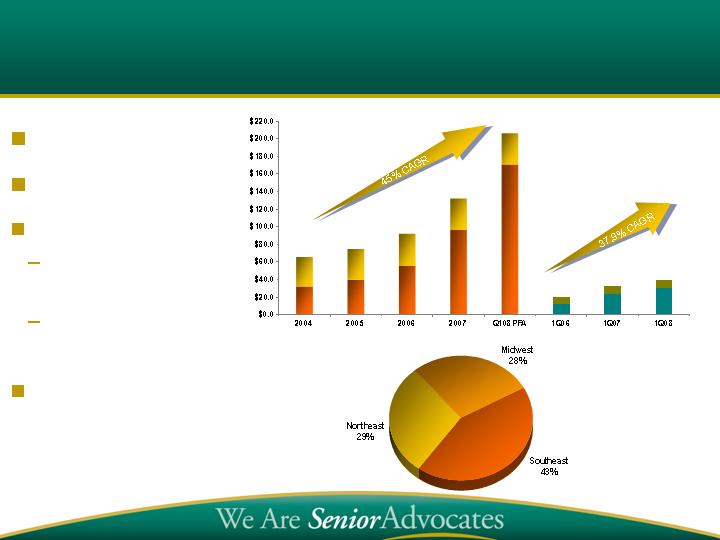
Track Record of Strong Performance
($Millions)
$65.3
$75.1
$91.8
Revenues
$132.1
$39.0
$31.7
$20.5
45% revenue CAGR
61% EPS CAGR
Last 18 months:
30% organic
growth
Acquired $98M
revenue
Balanced geography
$218.1

Local emphasis leads to increased market share
Local brands, local managers and sales maintain referral relationships
Senior Advocacy philosophy is Common Bond
Singular focus on home-bound, geriatric population
Individualized approach advocates for patients and their needs
Curative and Restorative Care
Frail Elderly Management and Disease State Management
Increase referrals by improving outcomes
Specialty programs in response to local needs
Consistent delivery of highest quality patient care
Same store revenue growth is best quality measure
Local Emphasis Drives Growth
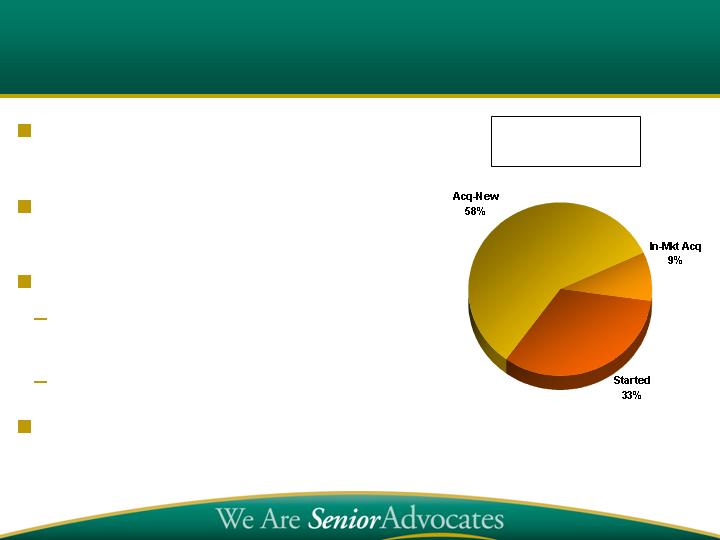
“Densification” – Increase density of
geographic clusters
Enter non-contiguous states/markets
through acquisition
Build on Local Brand
Use start-ups as extenders of existing
service area
Plan to open 5 to 10 start-ups in 2008
Optimize span of control
Disciplined Development Strategy
Branch Development
Last 4 Years
32
5
18

Continuing Local Brand Identity – Loyalty of employees,
patients and referral sources to the local brand
Managing Successfully:
Placing senior management closer to the local market
Local “course knowledge”, hometown business
Standard local office operating model, with local office
flexibility in marketing and clinical programs
Information system allows effective control through study and
analysis of local activities
Proven model for consolidation of fragmented industry
Bringing it All Together –
Rapid Growth with Local Emphasis
Proven, replicable model for
targeted states
Largest Medicare U.S home
care market
Completed 10 acquisitions and
400+% revenue growth over
four years
~$80 million provider in Florida,
32 locations
Seek continued densification
Cover 80% of population
Plan 3-5 startups in 2008
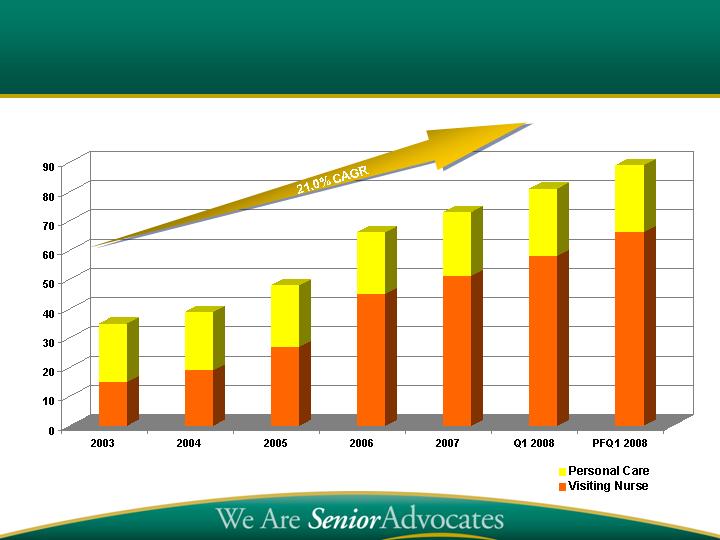
Strong Florida Market Track Record
VN Location
%
Branches
Year
# Brchs
Rev $ in
(000's)
Rev
Growth
Start
Acq
Comb
2001
8
11,038
$
3
5
2002
8
12,203
$
10.6%
2003
8
13,583
$
11.3%
2004
12
16,272
$
19.8%
4
2005
14
20,362
$
25.1%
1
2
(1)
2006
25
29,089
$
42.9%
1
18
(8)
2007
26
55,301
$
90.1%
1
2007PF*
32
78,547
$
170.0%
6
2004-2008
478.3%
6
27
-
* Proforma Full Year Quality of Life & Apex

Strong Florida Market Track Record
32 branches
30 branches
25 branches
14 branches
12 branches
8 branches
8 branches
8 branches
*Pro forma full year Apex acquisition
$0.0
$10.0
$20.0
$30.0
$40.0
$50.0
$60.0
$70.0
$80.0
$90.0
2001
2002
2003
2004
2005
2006
2007
2007PF*

Replicating Florida Success
In Northeast and Midwest
Shifting development emphasis to Northeast and Midwest
Patient Care quadruples Northeast presence
Annual revenue increases from $16 million to $63 million pro
forma
Service quality and specialties drive organic growth
Geographic clusters leverage:
Span of control
Referral relationships
Significant acquisition focus in Midwest

Financial Highlights
Long term EPS growth driven by organic volumes
Prudent management of capital structure with
appropriate leverage
Proven ability to access debt and equity
Scalable infrastructure keeps tight rein on
operating costs
Strong track record of investing capital in
accretive acquisitions
66
48
39
35
# of Locations
58
21
45
21
27
20
19
15
20
Track Record of Increasing Locations
51
22
73
23
81
65
24
89
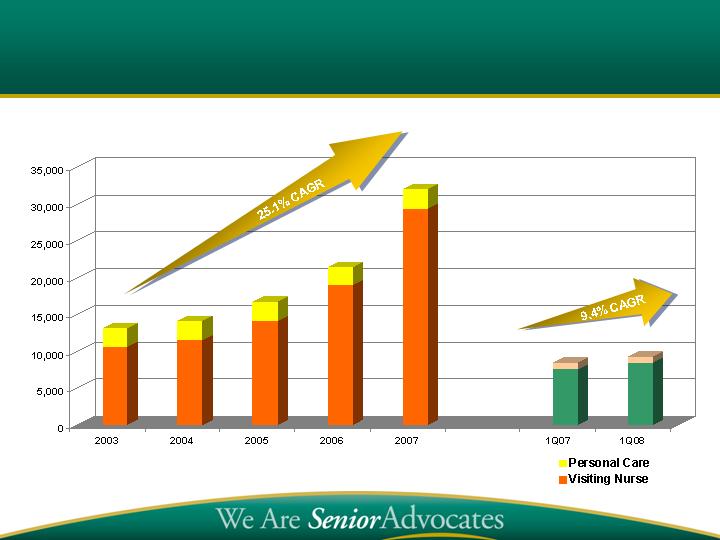
21,415
16,707
14,100
13,065
Admissions
Growing Patient Admissions
32,025
19%
81%
18%
82%
15%
85%
88%
12%
8%
92%
8,467
89%
11%
9,287
91%
9%
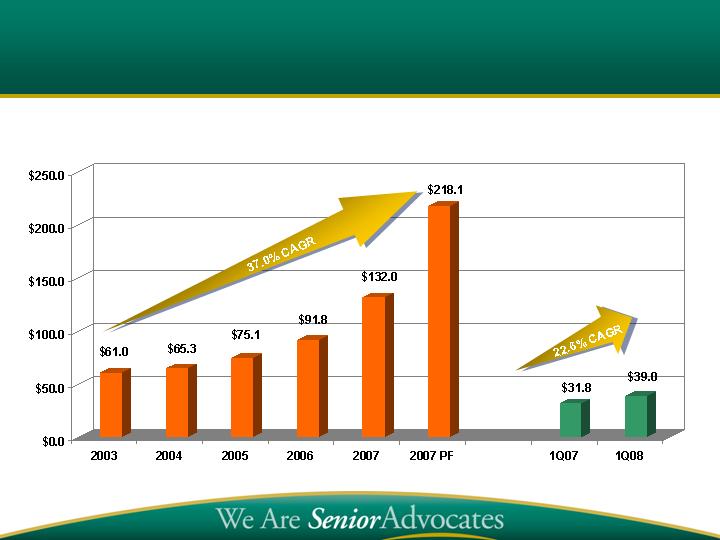
Proven Revenue Performance
Continuing Operations
($Millions)
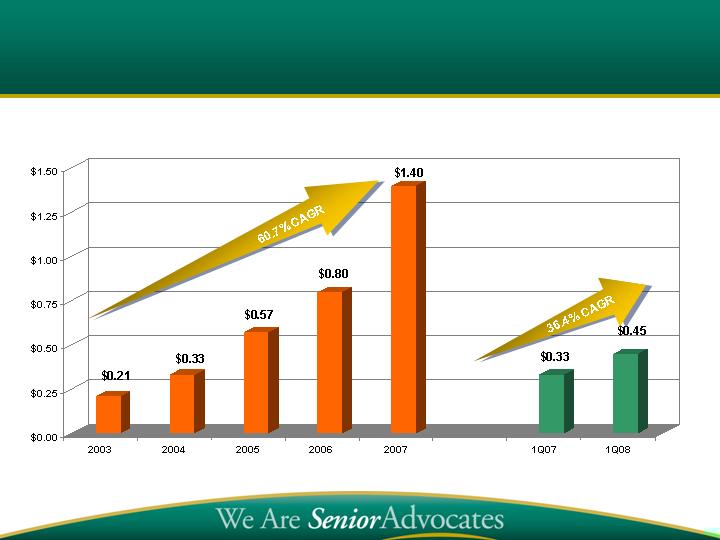
Proven EPS Growth
Continuing Operations EPS
($Millions)
Based on diluted shares.

Recent Patient Care Acquisition
Balances geography – Northeast represents ~30% of revenue
Strong local brand with tremendous opportunities for branch expansion
New Jersey
Only for-profit provider in four Northeast counties
Easily support more branches
Connecticut
Regulations allow unlimited branches anywhere in state
Pennsylvania
Just getting started
Earnings accretion:
Limited in 2008, due to timing and transition costs
2009, similar margins to rest of VN business
Pro forma leverage below 2X EBITDA

Same store sales growth (including post-acquisition)
10%-15% same store volume growth
Incremental 30%-40% same store revenue margin
Favorable acquisition economics
Agency contribution 20%-25% of revenue, paying 4x-5x
Incremental overhead 2%-3% of revenue
Strong ROI, accretive investments
Follow-on startups enhance returns
Margin implications
Volume-based incremental margin largely offsets rate cuts (case-mix creep adj)
EPS implications
Conditions right for long-term EPS growth as a consolidator
Investment Thesis: Long-Term EPS Growth