Exhibit 99.1

May 2009
Investor Presentation

Forward Looking Statements
This presentation contains, and answers given to questions that may be asked today may constitute, forward-looking statements
that are subject to a number of risks and uncertainties, many of which are outside our control. All statements regarding our
strategy, future operations, financial position, estimated revenues or losses, projected costs, prospects, plans and objectives,
other than statements of historical fact included in our prospectus, are forward-looking statements. When used in this
presentation or in answers given to questions asked today, the words “may,” “will,” “could,” “would,” “expect,” “intend,” “plan,”
“anticipate,” “believe,” “estimate,” “project,” “potential,” “continue,” and similar expressions are intended to identify forward-
looking statements, although not all forward-looking statements contain these identifying words. You should not place undue
reliance on forward-looking statements. While we believe that we have a reasonable basis for each forward-looking statement
that we make, we caution you that these statements are based on a combination of facts and factors currently known by us and
projections of future events or conditions, about which we cannot be certain. For a more complete discussion regarding these
and other factors which could affect the Company's financial performance, refer to the Company's various filings with the
Securities and Exchange Commission, including its filing on Form 10-K for the year ended December 31, 2008, in particular
information under the headings "Special Caution Regarding Forward-Looking Statements" and “Risk Factors.” These cautionary
statements qualify all of the forward-looking statements. In addition, market and industry statistics contained in this presentation
are based on information available to us that we believe is accurate. This information is generally based on publications that are
not produced for purposes of securities offerings or economic analysis.
All forward-looking statements speak only as of the date of this presentation. Except as required by law, we assume no
obligation to update these forward-looking statements publicly or to update the factors that could cause actual results to differ
materially, even if new information becomes available in the future.

15
45
3
2
3
2
11
1
3
3
10
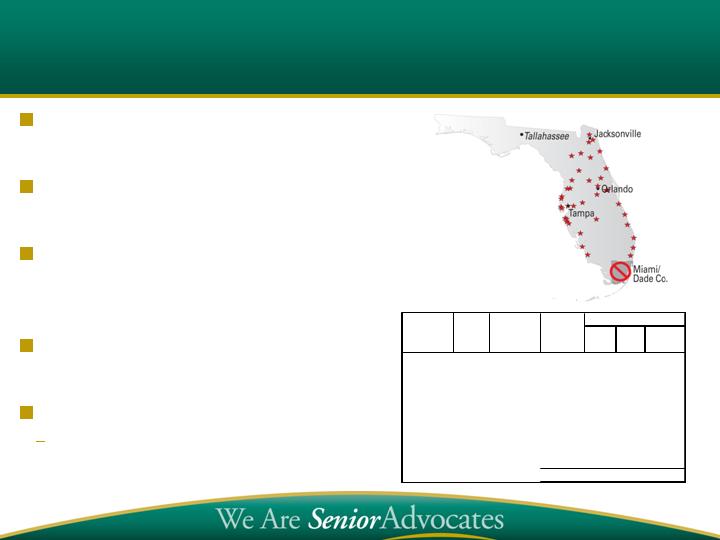
Founded Louisville, KY -- 1976
Two home health segments:
Visiting Nurse Medicare-certified
(~85% of revenue)
Personal Care primarily Medicaid-
Waiver (~15% of revenue) Non-
skilled
98 locations in three geographic
clusters, spanning 11 states
Revenue run rate over $275 million
Almost Family Overview
Geographic
Focus:
Northeast
Midwest
Florida
Geographic
Focus:
Northeast
Midwest
Southeast
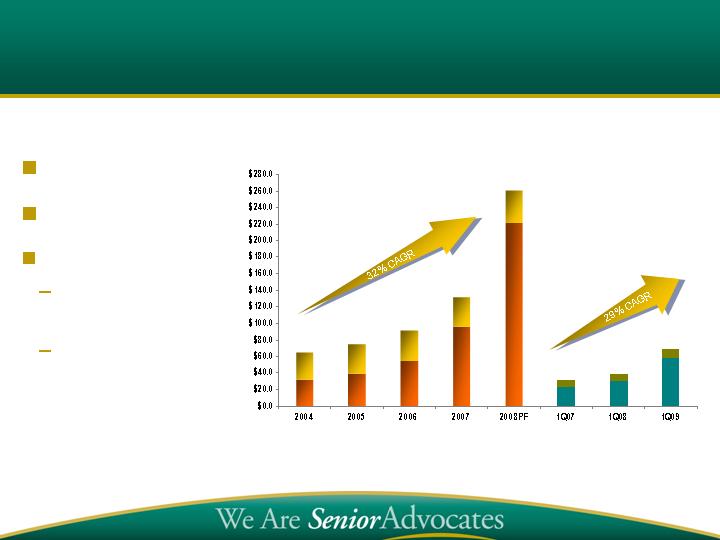
($Millions)
$65.3
$75.1
$91.8
$132.1
$69.2
$30.0
$31.9
$260.7
32% revenue CAGR
75% EPS CAGR
Last 24 months:
43% organic
growth
Acquired $98M
revenue
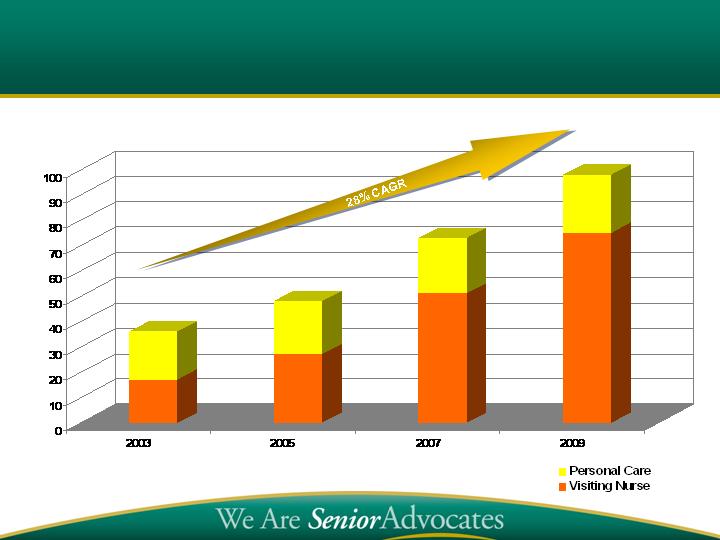
Track Record of Strong Performance
Revenue in Millions

ears at AFAM
y
23
SVP VN Operations North
–
Anne Liechty
ital management
13 years hosp
years as AFAM SVP
12
SVP Administration
–
Todd Lyles
9 years Big Six public accounting
years as AFAM CFO
17
SVP and CFO
–
Steve Guenthner
Founding shareholder
years as AFAM CEO
28
CEO
–
William Yarmuth
Core Team Together for Over a Decade
Experienced Management Team
Recently Added Talent to Manage Growth
Phyllis
Montville
–
SVP VN Operations South
Florida
3
+ years
at AFAM
, 20+ years as senior operator of home health
b
usinesses
Cathy Newhouse
–
SVP Clinical Programs, Sales
and
Marketing
22 years with Gentiva
Michael
Moses
–
VP Group Living Programs
Founder Quality of Life Home Care
Nancy Ralston and James Spriggs
–
VPs
Operations North Florida
Founders Apex Home Health Care
Ray Rasa
–
VP Operations Northeast
20+ years home health, Gentiva and Patient Care
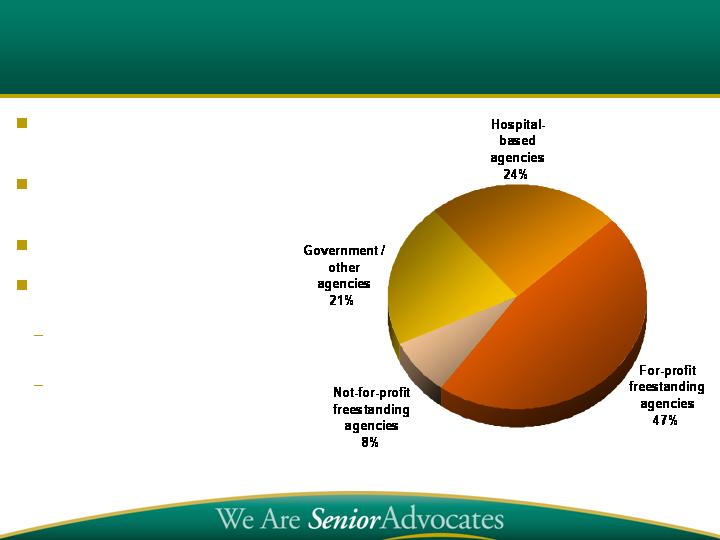
Fragmented Home Health Market -
Calls for Consolidation
Source: CMS, MedPAC, National Association for Home Care and Hospice
~9,200 Medicare-certified home
health agencies in U.S.
~7,000 agencies are
independently-owned operations
$16B Annual Medicare Spend
Almost Family’s acquisition
criteria
Geographically
complementary markets
Multi-site, free-standing
agencies or hospital-based
agencies

45 million beneficiaries
Limited Resources – 1 out of 2 have income of less than $21,000 (near poverty
level)
1 out of 3 have 3 or more chronic health conditions
1 out of 3 have cognitive or mental impairment
1 out of 3 are in poor health
1 out of 5 have significant limitations in activities of daily living
1 out of 8 is over 85 years old
1 out of 20 lives in a nursing home
The US Government is obligated to provide for their health care needs and
spends $477B per year doing it – Projected to double in 10 years
Home health is the lowest cost way to meet that obligation – we represent about
4% of the entire Medicare spend
Characteristics of the Medicare Population
Source: Kaiser Family Foundation Medicare Primer 2009

80+ year old, sick patients
Co-morbid chronic conditions, sickest of the sick, intensities increasing
Want to stay in their homes – out of the hospital – out of long term care
Want to restore their ability to care for themselves
Our Nurses and Therapists deliver:
Avoided hospital episodes by identifying skilled needs before patient
needs hospitalization
Earlier hospital discharges, fewer re-admissions, fewer ER visits
A better quality of life for the patients and their families
Lower costs to the Medicare program
Advocating the needs of seniors improves their lives and
saves significant dollars for the Medicare program
What is home health really about?
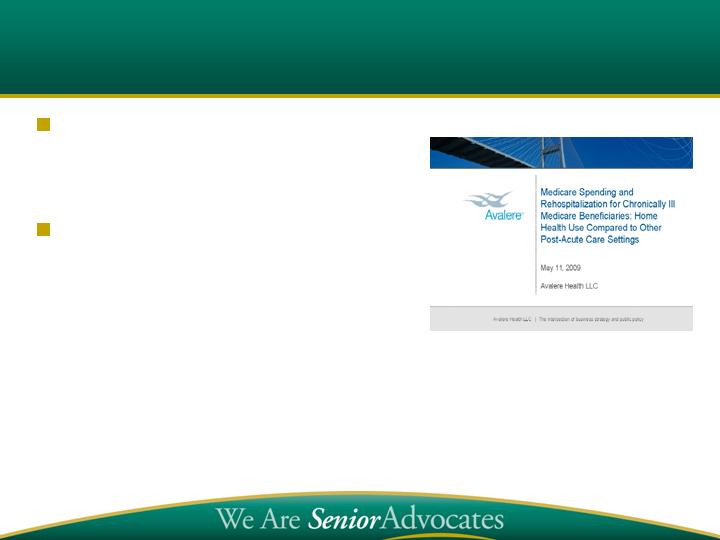
Home Health Works Post Hospital Stay --
AHHQI – Avalere Study
Studied three high cost conditions:
diabetes, COPD and CHF --
572,093 periods of care
Compared early use of home
health post-hospital to other non-
home health post-acute care
Avalere Conclusion:
“The post-hospital period of care costs and odds of
hospital readmission are statistically significantly
lower for diabetes patients, COPD patients, and CHF
patients requiring PAC who use early home health,
in every SOI category.”

Avalere: Home Health Compared to Other
Post-Acute Settings
$216 million
(Included in $1.71B
above)
Reduction in Medicare spending over 2005-2006
associated with the 24,000 fewer readmissions
24,000
Fewer hospital readmissions over 2005-2006
period associated with use of early home health
$1.77 billion
Reduction in Medicare post-hospital spending
over 2005-2006 if lower period-of-care costs
associated with early home health were applied
to periods of care for non-home health user
$1.71 billion
Reduction in Medicare post-hospital spending
over 2005-2006 associated with use of early
home health
Result
Impact Analysis

Federal Chronic Care Initiatives are
Aligned with Home Health Care Strengths
Senate Finance proposal for Chronic Care Management
Innovation Center, proposes options that :
“(1) places the patient, including family members and other
informal caregivers, at the center of the care team;
(2) focuses on in-person contact with beneficiaries;
(3) maintains a close relationship between care
coordinators and primary care physicians; and
(4) relies on a team-based approach to interventions such
as comprehensive care assessments, care planning …
and self-management coaching”.
Home
Health

Continuing Local Brand Identity – Loyalty of employees,
patients and referral sources to the local brand
Managing Successfully:
Placing senior management closer to the local market
Local “course knowledge”, hometown business
Growing locally based sales & marketing staff
Standard local office operating model, with local office
flexibility in marketing and clinical programs
Information system allows effective control through study
and analysis of local activities
AFAM’s Local Emphasis Drives Growth

Senior Advocacy philosophy is Common Bond
Singular focus on home-bound, geriatric population
Curative and Restorative Care
Individualized approach advocates for patients and their needs
Frail Elderly Care Management and Disease State Management
Increase referrals by improving outcomes
Credentialing Clinicians as Geriatric Specialists
Specialty programs in response to local needs
Consistent delivery of highest quality patient care
Same store revenue growth is best quality measure
AFAM’s Senior Advocacy Mission
“Densification” – Increase density of
existing geographic clusters
Make selected acquisitions to enter
states and markets contiguous to
existing operations
Build on Local Brand
Use start-ups as extenders of
existing service area
Opened 14 start-ups in 2008
Planning 5-10 startups in 2009
Optimize span of control
AFAM’s Disciplined Development Strategy
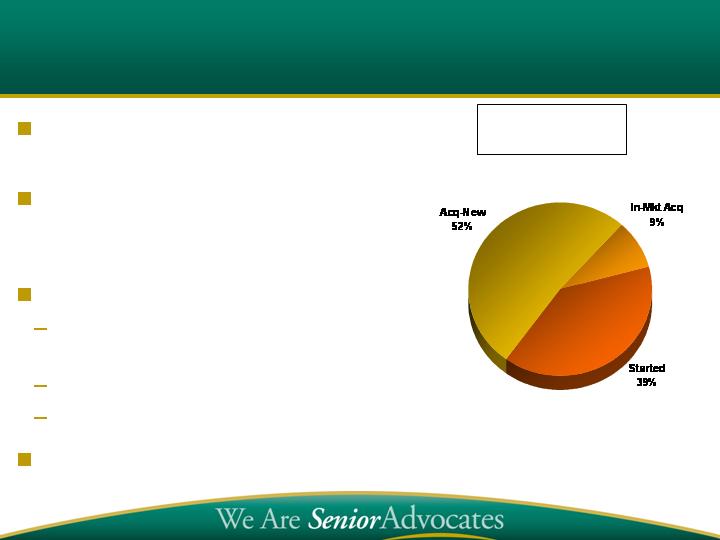
Branch Development
Last 4 Years
33
6
25
Proven, replicable model for
targeted states
Largest Medicare U.S home
care market
Completed 10 acquisitions and
400+% revenue growth over
four years
~$100 million provider in
Florida, 38 VN locations
Seek continued densification
Cover 80% of population
Densification Works
%
Branches
Year
# Brchs
Rev $ in
(000's)
Rev
Growth
Start
Acq
Comb
2001
8
11,038
$
3
5
2002
8
12,203
$
10.6%
2003
8
13,583
$
11.3%
2004
12
16,272
$
19.8%
4
2005
14
20,362
$
25.1%
1
2
(1)
2006
25
29,089
$
42.9%
1
18
(8)
2007*
26
55,301
$
90.1%
1
2008
37
103,219
$
86.6%
8
3
Q109LTM
38
106,045
$
91.8%
1
2004-2009
551.7%
15
24
(9)

Local Market Emphasis
Senior Advocacy Mission
Densification
Seasoned Management
History of Strong Organic
Growth
Proven model for
consolidation of fragmented
industry
Bringing it All Together

Financial Highlights
Long term EPS growth driven by organic volumes
Prudent management of capital structure with
appropriate leverage
Proven ability to access debt and equity
Scalable infrastructure keeps tight rein on
operating costs
Strong track record of investing capital in
accretive acquisitions
48
36
# of Locations
21
27
19
17
Track Record of Increasing Locations
51
22
73
75
23
98
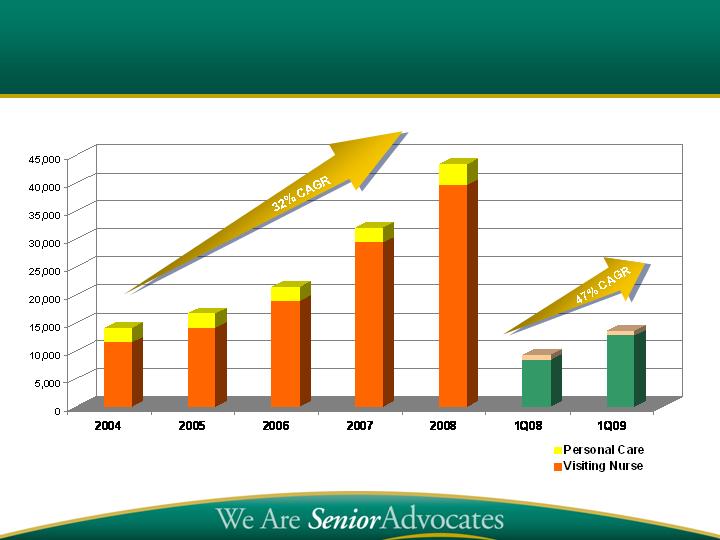
21,415
16,707
14,100
Admissions
Growing Patient Admissions
32,025
18%
82%
15%
85%
88%
12%
8%
92%
9,290
91%
9%
13,627
93%
7%
8%
92%
43,337
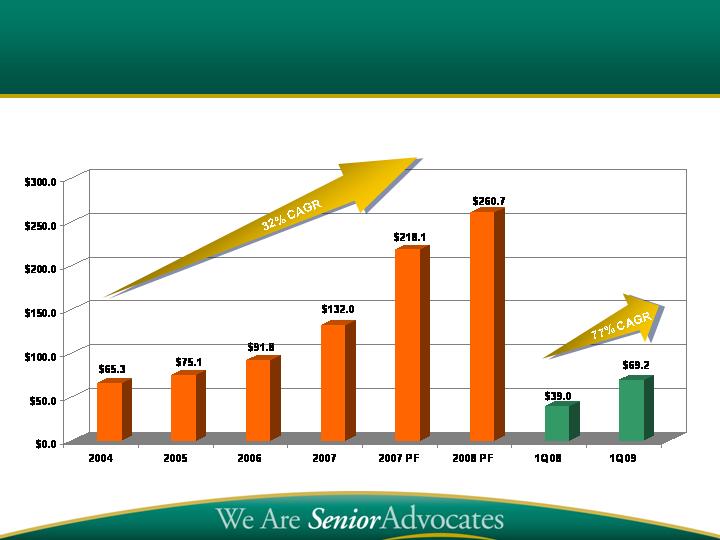
Proven Revenue Performance
Continuing Operations
($Millions)
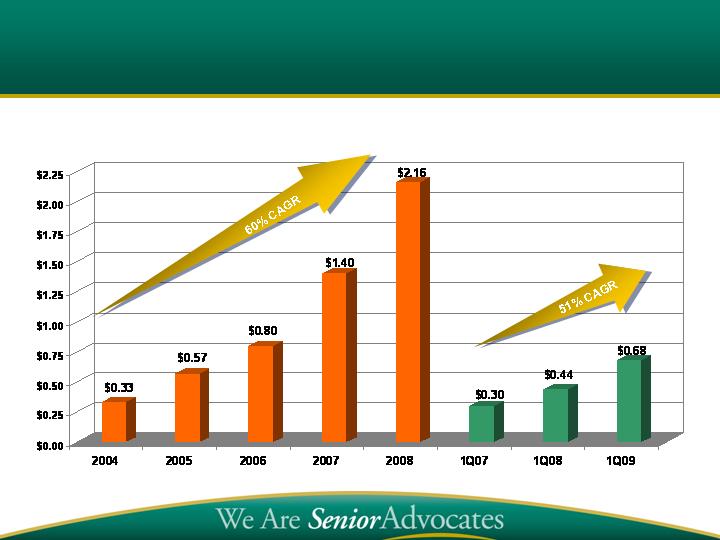
Proven EPS Growth
Continuing Operations EPS
($Millions)
Based on diluted shares.

Financial Update -- 2008 and Q1 2009
2008 Highlights
Revenues up 61%
EPS up 59%
VN organic revenue up 36%
Q1 2009
Revenues up 77%
EPS up 55%
VN organic revenue up 41%
Financial Measures:
AR DSO 47 at March 2009
LTM EBITDA $36M
Debt $29.8M
2008 Organic Medicare
Growth
Admissions 12%
Episodes 38%
Q109 Organic Medicare
Growth
Admissions 14%
Episodes 36%

Reimbursement Uncertainty–
WHAT is going on?
President’s Feb 2009 budget proposal set
everything spinning
Follows MedPac -- 5.5% cut in 2010, then “rebasing” in 2011
Proposing post-acute bundling phase-in that could begin in 2015
Obama’s “need for speed” and absence of any other voice puts all
the emphasis on MedPac’s recommendations
Senate and House resolutions do NOT reflect cuts
to home health reimbursement
Political Process at work – you count on:
Continuous annual reconsideration of rates
Long term downward pressure on margins
Ups and Downs in expectations until Federal budget cycle is done

Reimbursement Uncertainty –
How do we deal with it?
Make sure Home Health has a seat at the table
Collaborate with NAHC and AHHQI to educate and inform
Research, grassroots, CEO time in DC
Deal with long term margin shrink:
#1 Organic admissions growth
#2 Excel at the operational fundamentals
#3 Be a consolidator and densify geographic span of control
Deal with short term uncertainty:
Manage debt levels more conservatively
Value acquisitions more conservatively,
Pace ourselves until we know more

Same store sales growth (including post-acquisition)
10%-15% same store volume growth
Incremental 30%-40% same store revenue margin (subject to change with rates)
Favorable acquisition economics
Agency contribution 20%-25% of revenue, paying 4x-5x (subject to change with rates)
Incremental overhead 2%-3% of revenue
Strong ROI, accretive investments
Follow-on startups enhance returns
Margin implications
Volume-based incremental margin largely offsets rate cuts (case-mix creep adj)
Continue emphasis on efficiency of operations, improved clinical outcomes
EPS implications
Conditions remain for long-term EPS growth as a consolidator
Investment Thesis Remains:
Long-Term EPS Growth as Low Cost Provider

Investment Highlights
Annual revenue run rate now over $275 million
Leading regional home health provider
40+% three year revenue CAGR
Decentralized operating model
Strong capital position
$50 million available for future growth
Disciplined approach to acquisitions driven by seasoned
management
Growing force in consolidating home health care market
13 acquisitions in three years
Three geographic clusters: Northeast, Southeast and Midwest