United States
Securities and Exchange Commission
Washington, D.C. 20549
Form N-CSR
Certified Shareholder Report of Registered Management Investment Companies
811-4743
(Investment Company Act File Number)
Federated Equity Income Fund, Inc.
_______________________________________________________________
(Exact Name of Registrant as Specified in Charter)
Federated Investors Funds
4000 Ericsson Drive
Warrendale, Pennsylvania 15086-7561
(Address of Principal Executive Offices)
(412) 288-1900
(Registrant's Telephone Number)
Peter J. Germain, Esquire
Federated Investors Tower
1001 Liberty Avenue
Pittsburgh, Pennsylvania 15222-3779
(Name and Address of Agent for Service)
(Notices should be sent to the Agent for Service)
Date of Fiscal Year End:11/30/18
Date of Reporting Period:11/30/18
| Item 1. | Reports to Stockholders |

Annual Shareholder Report
November 30, 2018
| Share Class | Ticker | A | LEIFX | B | LEIBX | C | LEICX |
| | F | LFEIX | R | FDERX | Institutional | LEISX |
Federated Equity Income Fund, Inc.
Fund Established 1986
IMPORTANT NOTICE REGARDING REPORT DELIVERY
Beginning on January 1, 2021, as permitted by regulations adopted by the Securities and Exchange Commission, paper copies of the Fund's shareholder reports like this one will no longer be sent by mail, unless you specifically request paper copies of the reports from the Fund or from your financial intermediary, such as a broker-dealer or bank. Instead, the reports will be made available on a website, and you will be notified by mail each time a report is posted and provided with a website link to access the report.
If you already elected to receive shareholder reports electronically, you will not be affected by this change and you need not take any action. You may elect to receive shareholder reports and other communications from the Fund or your financial intermediary electronically by contacting your financial intermediary (such as a broker-dealer or bank); other shareholders may call the Fund at 1-800-341-7400, Option 4.
You may elect to receive all future reports in paper free of charge. You can inform the Fund or your financial intermediary that you wish to continue receiving paper copies of your shareholder reports by contacting your financial intermediary (such as a broker-dealer or bank); other shareholders may call the Fund at 1-800-341-7400, Option 4. Your election to receive reports in paper will apply to all funds held with the Fund complex or your financial intermediary.
Not FDIC Insured ■ May Lose Value ■ No Bank Guarantee
J. Christopher
Donahue
President
Federated Equity Income Fund, Inc.
Letter from the President
Dear Valued Shareholder,
I am pleased to present the Annual Shareholder Report for your fund covering the period from December 1, 2017 through November 30, 2018. This report includes Management's Discussion of Fund Performance, a complete listing of your fund's holdings, performance information and financial statements along with other important fund information.
In addition, our website, FederatedInvestors.com, offers easy access to Federated resources that include timely fund updates, economic and market insights from our investment strategists, and financial planning tools.
Thank you for investing with Federated. I hope you find this information useful and look forward to keeping you informed.
Sincerely,
J. Christopher Donahue, President
CONTENTS
| 1 |
| 6 |
| 8 |
| 15 |
| 21 |
| 23 |
| 25 |
| 26 |
| 39 |
| 41 |
| 43 |
| 43 |
| 50 |
| 57 |
| 57 |
Management's Discussion of Fund Performance (unaudited)
The total return of Federated Equity Income Fund, Inc. (the “Fund”), based on net asset value for the 12-month reporting period ended November 30, 2018, was -0.47% for Class A Shares, -1.26% for Class B Shares, -1.25% for Class C Shares, -0.71% for Class F Shares, -0.68% for Class R Shares and -0.22% for Institutional Shares. The -0.22% total return of the Institutional Shares for the reporting period consisted of -2.02% in price appreciation and 1.80% in reinvested dividends. The total return of the Russell 1000® Value Index (“R1000V”),1 a broad-based securities market index, was 2.96% for the same period. The total return of the Morningstar Large Value Funds Average (“MLVFA”),2 a peer group average of the Fund, was 2.47% during the same period. The Fund's and MLVFA's total returns for the most recently completed fiscal year reflected actual cash flows, transaction costs and other expenses which were not reflected in the total return of the R1000V.
The Fund's investment strategy focused on stocks of dividend-paying companies3 with favorable valuations, strong balance sheets and improving business fundamentals in order to achieve the Fund's objective of providing above average income and capital appreciation. The Fund's portfolio managers focused on realization of the Fund's total return and income objectives by purchasing and holding income-producing equity securities with favorable valuation levels. During the reporting period, the most significant factors affecting the Fund's performance relative to the R1000V were sector allocation and security selection.
The following discussion will focus on the performance of the Fund's Institutional Shares.
MARKET OVERVIEW
During the reporting period, domestic equity markets including the S&P 500 Index4 ascended to all-time highs despite several pockets of heightened volatility throughout the reporting period. Trade and tariff rhetoric dominated headlines during the reporting period, driving much of the volatility. The United States (U.S.) economy accelerated to well above 3% year-over-year growth, driven by improving consumer spending, general economic activity and strong employment trends. Tax cuts helped drive strong company earnings throughout the reporting period. Companies reported both strong revenue and earnings growth. Equity markets gradually rose to all-time peaks towards the end of the third quarter of 2018 until the confluence of the trade war with China, Federal Reserve (the “Fed”) rate hikes, fears of U.S. and global economic slowdowns and the impending U.S. midterm election injected a shock to the market in October and November. The S&P 500 declined about 5% during those months to finish the reporting period well off all-time highs.
Annual Shareholder Report
The S&P 500 returned 6.27% for the reporting period. In general for the reporting period, growth stocks significantly outperformed value stocks. The S&P 500's performance in the Health Care, Consumer Discretionary and Information Technology sectors dominated weaker performance in the Materials, Communication Services and Energy sectors.
U.S. Treasury yields ended the reporting period with a flatter curve with short rates, as measured by the 2-year U.S. Treasury yield, rising 100 basis points and long rates, as measured by the 30-year U.S. Treasury yield, rising 46 basis points. Continued strong job growth, four rate hikes during the reporting period and the continuing ramp up of the Fed's balance sheet reduction drove the yield curve to flatten. During the reporting period, the 10-year U.S. Treasury yield ranged from 2.34% to 3.24%, closing the period at 2.99%.
Sector Allocation and security selection
Overall, both stock selection and sector allocation negatively contributed to Fund performance relative to the R1000V during the reporting period. Fund performance during the reporting period was helped by an overweight position in the Information Technology sector and an underweight position in the Utilities sector. An underweight position in the Health Care sector and an overweight position in the Industrials sector detracted from Fund performance relative to the R1000V. The Fund's stock selection in the Energy and Health Care sectors contributed positively, but it was offset by selection in the Information Technology and Consumer Discretionary sectors, which in turn contributed negatively to Fund performance relative to the R1000V. During the reporting period, the Fund used a small allocation to high-yield5 bonds and various types of derivative securities6 including equity futures and options to seek to protect the Fund from volatile market conditions. Equity call options contributed 0.01% to the Fund's return while equity index futures added 0.18%. Equity put options detracted from Fund performance, having a -0.14% contribution. Overall, derivatives were a net positive contributor to Fund performance during the reporting period.
| 1 | Please see the footnotes to the line graphs under “Fund Performance and Growth of a $10,000 Investment” below for the definition of, and more information about, the R1000V. |
| 2 | Please see the footnotes to the line graphs under “Fund Performance and Growth of a $10,000 Investment” below for the definition of, and more information about, the MLVFA. |
| 3 | There are no guarantees that dividend-paying stocks will continue to pay dividends. In addition, dividend-paying stocks may not experience the same capital appreciation potential as non-dividend paying stocks. |
| 4 | The S&P 500 is a capitalization-weighted index of 500 stocks designed to measure performance of the broad domestic economy through changes in the aggregate market value of 500 stocks representing all major industries. The index is unmanaged, and it is not possible to invest directly in an index. |
| 5 | High-yield, lower-rated securities generally entail greater market, credit/default and liquidity risks, and may be more volatile than investment-grade securities. |
| 6 | The Fund's use of derivative instruments involves risks different from, or possibly greater than, the risks associated with investing directly in securities and other traditional instruments. |
Annual Shareholder Report
FUND PERFORMANCE AND GROWTH OF A $10,000 INVESTMENT
The graph below illustrates the hypothetical investment of $10,0001 in the Federated Equity Income Fund, Inc. from November 30, 2008 to November 30, 2018, compared to the Russell 1000® Value Index (R1000V)2 and the Morningstar Large Value Funds Average (MLVFA).3The Average Annual Total Return table below shows returns for each class averaged over the stated periods.
Growth of a $10,000 Investment
Growth of $10,000 as of November 30, 2018
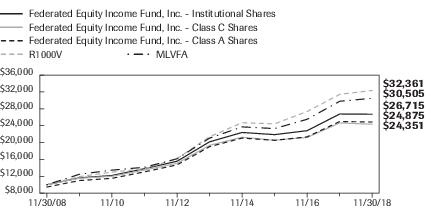
| Federated Equity Income Fund, Inc. - | Institutional Shares | Class C Shares | Class A Shares | R1000V | MLVFA |
| F | F | F | I | I |
| 11/30/2008 | 10,000 | 10,000 | 9,451 | 10,000 | 10,000 |
| 11/30/2009 | 11,631 | 11,541 | 10,992 | 11,924 | 12,479 |
| 11/30/2010 | 12,188 | 12,000 | 11,519 | 12,992 | 13,460 |
| 11/30/2011 | 13,807 | 13,482 | 13,049 | 13,794 | 14,147 |
| 11/30/2012 | 15,567 | 15,077 | 14,713 | 16,201 | 16,148 |
| 11/30/2013 | 20,172 | 19,350 | 19,027 | 21,372 | 21,052 |
| 11/30/2014 | 22,397 | 21,256 | 21,069 | 24,710 | 23,715 |
| 11/30/2015 | 21,884 | 20,563 | 20,533 | 24,436 | 23,319 |
| 11/30/2016 | 22,821 | 21,218 | 21,356 | 27,372 | 25,523 |
| 11/30/2017 | 26,774 | 24,658 | 24,992 | 31,431 | 29,793 |
| 11/30/2018 | 26,715 | 24,351 | 24,875 | 32,361 | 30,505 |
41 graphic description end -->
| ■ | Total returns shown for Class A Shares include the maximum sales charge of 5.50% ($10,000 investment minus $550 sales charge = $9,450). |
| ■ | The returns shown for Class C Shares include the maximum contingent deferred sales charge of 1.00% as applicable. |
The Fund offers multiple share classes whose performance may be greater than or less than its other share class(es) due to differences in sales charges and expenses. See the Average Annual Total Return table below for the returns of additional classes not shown in the line graph above.
Annual Shareholder Report
Average Annual Total Returnsfor the Period Ended 11/30/2018
(returns reflect all applicable sales charges and contingent deferred sales charges as specified below in footnote #1)
| | 1 Year | 5 Years | 10 Years |
| Class A Shares | -5.93% | 4.32% | 9.54% |
| Class B Shares | -6.46% | 4.34% | 9.46% |
| Class C Shares | -2.19% | 4.71% | 9.31% |
| Class F Shares | -2.64% | 5.04% | 9.75% |
| Class R Shares4 | -0.68% | 5.33% | 9.93% |
| Institutional Shares5 | -0.22% | 5.78% | 10.33% |
| R1000V | 2.96% | 8.65% | 12.46% |
| MLVFA | 2.47% | 7.95% | 12.29% |
Performance data quoted represents past performance which is no guarantee of future results. Investment return and principal value will fluctuate so that an investor's shares, when redeemed, may be worth more or less than their original cost. Mutual fund performance changes over time and current performance may be lower or higher than what is stated. For current to the most recent month-end performance and after-tax returns, visit FederatedInvestors.com or call 1-800-341-7400. Returns shown do not reflect the deduction of taxes that a shareholder would pay on Fund distributions or the redemption of Fund shares. Mutual funds are not obligations of or guaranteed by any bank and are not federally insured.
Annual Shareholder Report
| 1 | Represents a hypothetical investment of $10,000 in the Fund after deducting applicable sales charges: For Class A Shares, the maximum sales charge of 5.50% ($10,000 investment minus $550 sales charge = $9,450); for Class B Shares, the maximum contingent deferred sales charge is 5.50% on any redemption less than one year from the purchase date; for Class C Shares, a 1.00% contingent deferred sales charge would be applied to any redemption less than one year from the purchase date; for Class F Shares, the maximum sales charge of 1.00% ($10,000 investment minus $100 sales charge = $9,900) and a contingent deferred sales charge of 1.00% on any redemption less than four years from the purchase date. The Fund's performance assumes the reinvestment of all dividends and distributions. R1000V has been adjusted to reflect reinvestment of dividends on securities in the index. |
| 2 | The R1000V measures the performance of the large-cap value segment of the U.S. equity universe. It includes those Russell 1000® Index companies with lower price-to-book ratios and lower expected growth values. The R1000V is constructed to provide a comprehensive and unbiased barometer for the large-cap value segment. The R1000V is completely reconstituted annually to ensure new and growing equities are included and that the represented companies continue to reflect value characteristics. The R1000V is not adjusted to reflect sales charges, expenses or other fees that the Securities and Exchange Commission (SEC) requires to be reflected in the Fund's performance. The index is unmanaged and unlike the Fund, is not affected by cash flows. It is not possible to invest directly in an index. |
| 3 | Morningstar figures represent the average of the total returns reported by all the funds designated by Morningstar as falling into the respective category indicated. They do not reflect sales charges. The Morningstar figures in the Growth of $10,000 line graph are based on historical return information published by Morningstar and reflect the return of the funds comprising the category in the year of publication. Because the funds designated by Morningstar as falling into the category can change over time, the Morningstar figures in the line graph may not match the Morningstar figures in the Average Annual Total Returns table, which reflect the return of the funds that currently comprise the category. |
| 4 | The Fund's Class R Shares commenced operations on January 25, 2013. For the period prior to the commencement of operations of Class R Shares, the performance information shown is for Class A Shares, adjusted to reflect the expenses of Class R Shares for each year for which Class R Shares expenses would have exceeded the actual expenses paid by Class A Shares. Additionally, the performance information shown has been adjusted to reflect the absence of sales charges applicable to Class A Shares. |
| 5 | The Fund's Institutional Shares commenced operations on March 30, 2012. For the period prior to the commencement of operations of Institutional Shares, the performance information shown is for Class A Shares. The performance of the Class A Shares has not been adjusted to reflect the expenses of the Institutional Shares, since the Institutional Shares have a lower expense ratio than the expenses of the Class A Shares. The performance of the Class A Shares has been adjusted to remove any voluntary waiver of Fund expenses related to the Class A Shares that occurred during the period prior to the commencement of Institutional Shares. |
Annual Shareholder Report
Portfolio of Investments Summary Tables (unaudited)
At November 30, 2018, the Fund's portfolio composition1 was as follows:
| Security Type | Percentage of
Total Net Assets |
| Domestic Equity Securities | 85.9% |
| International Equity Securities | 7.4% |
| Domestic Fixed-Income Securities | 3.3% |
| International Fixed-Income Securities | 0.5% |
| Other Security Type2 | 0.2% |
| Derivatives3 | 0.1% |
| Cash Equilvalents4 | 1.8% |
| Other Assets and Liabilities—Net5 | 0.8% |
| TOTAL | 100.0% |
| 1 | See the Fund's Prospectus for a description of the principal types of securities in which the Fund invests. As of the date specified above, the Fund owned shares of one or more affiliated investment companies. For purposes of this table, the affiliated investment company (other than an affiliated money market mutual fund) is not treated as a single portfolio security, but rather the Fund is treated as owning a pro rata portion of each security and each other asset and liability owned by the affiliated investment company. Accordingly, the percentages of total net assets shown in the table will differ from those presented on the Portfolio of Investments. |
| 2 | Other Security Type consists of purchased call options. |
| 3 | Based upon net unrealized appreciation (depreciation) or value of the derivative contracts as applicable. Derivative contracts may consist of futures, forwards, options and swaps. The impact of a derivative contract on the Fund's performance may be larger than its unrealized appreciation (depreciation) or value may indicate. In many cases, the notional value or amount of a derivative contract may provide a better indication of the contract's significance to the portfolio. More complete information regarding the Fund's direct investments in derivative contracts, including unrealized appreciation (depreciation), value and notional values or amounts of such contracts, can be found in the table at the end of the Portfolio of Investments included in this Report. |
| 4 | Cash Equivalents include any investments in money market mutual funds and/or overnight repurchase agreements. |
| 5 | Assets, other than investments in securities and derivative contracts, less liabilities. See Statement of Assets and Liabilities. |
Annual Shareholder Report
At November 30, 2018, the Fund's sector composition6 was as follows:
| Security Classification | Percentage of
Equity Securities |
| Financials | 22.5% |
| Health Care | 14.4% |
| Information Technology | 10.4% |
| Energy | 10.3% |
| Industrials | 8.7% |
| Communication Services | 7.6% |
| Consumer Staples | 6.5% |
| Utilities | 6.3% |
| Consumer Discretionary | 6.3% |
| Real Estate | 4.2% |
| Materials | 2.8% |
| TOTAL | 100.0% |
| 6 | Sector classifications are based upon, and individual portfolio securities are assigned to, the classifications of the Global Industry Classification Standard (GICS) except that the Adviser assigns a classification to securities not classified by the GICS and to securities for which the Adviser does not have access to the classification made by the GICS. |
Annual Shareholder Report
Portfolio of Investments
November 30, 2018
Shares or
Contracts | | | Value in
U.S. Dollars |
| | | COMMON STOCKS—93.3% | |
| | | Communication Services—7.1% | |
| 362,564 | | AT&T, Inc. | $11,326,499 |
| 488,949 | | Comcast Corp., Class A | 19,073,901 |
| 2,011,985 | | Koninklijke KPN NV, ADR | 5,874,996 |
| 241,011 | | Lions Gate Entertainment Corp. | 4,345,428 |
| 336,548 | | News Corp., Inc. | 4,368,393 |
| 195,014 | | Telenor ASA, ADR | 3,789,122 |
| 1,850,182 | | VEON Ltd., ADR | 5,032,495 |
| 214,137 | | Verizon Communications, Inc. | 12,912,461 |
| 152,303 | | Viacom, Inc., Class B | 4,700,071 |
| | | TOTAL | 71,423,366 |
| | | Consumer Discretionary—5.9% | |
| 72,425 | | Best Buy Co., Inc. | 4,677,931 |
| 60,478 | | Columbia Sportswear Co. | 5,523,456 |
| 129,434 | | D. R. Horton, Inc. | 4,817,533 |
| 185,992 | | DSW, Inc., Class A | 5,159,418 |
| 26,237 | | Home Depot, Inc. | 4,731,056 |
| 124,720 | | M.D.C. Holdings, Inc. | 3,673,004 |
| 16,220 | | McDonald's Corp. | 3,057,632 |
| 55,141 | | Royal Caribbean Cruises Ltd. | 6,234,793 |
| 178,516 | | Subaru Corp., ADR | 1,977,065 |
| 113,020 | | TJX Cos., Inc. | 5,521,027 |
| 30,590 | | Tractor Supply Co. | 2,910,027 |
| 46,100 | | V.F. Corp. | 3,747,469 |
| 79,483 | | Yum! Brands, Inc. | 7,329,922 |
| | | TOTAL | 59,360,333 |
| | | Consumer Staples—6.0% | |
| 103,719 | | Archer-Daniels-Midland Co. | 4,773,148 |
| 85,736 | | Cal-Maine Foods, Inc. | 4,005,586 |
| 274,212 | | Empire Co. Ltd., Class A | 5,194,683 |
| 84,697 | | Energizer Holdings, Inc. | 3,796,967 |
| 52,298 | | Heineken NV, ADR | 2,397,027 |
| 73,076 | | Imperial Brands PLC, ADR | 2,225,895 |
| 168,543 | | Kroger Co. | 4,998,985 |
| 91,791 | | Molson Coors Brewing Co., Class B | 6,037,094 |
Annual Shareholder Report
Shares or
Contracts | | | Value in
U.S. Dollars |
| | | COMMON STOCKS—continued | |
| | | Consumer Staples—continued | |
| 34,765 | | Philip Morris International, Inc. | $3,008,216 |
| 51,161 | | Spectrum Brands Holdings, Inc. | 2,526,330 |
| 80,267 | | Tate & Lyle PLC, ADR | 2,925,732 |
| 100,667 | | Tyson Foods, Inc., Class A | 5,934,320 |
| 91,809 | | Walgreens Boots Alliance, Inc. | 7,773,468 |
| 55,382 | | WalMart, Inc. | 5,408,052 |
| | | TOTAL | 61,005,503 |
| | | Energy—9.6% | |
| 182,401 | | BP PLC, ADR | 7,359,880 |
| 66,023 | | Chevron Corp. | 7,852,776 |
| 185,120 | | ConocoPhillips | 12,251,242 |
| 68,284 | | Devon Energy Corp. | 1,845,716 |
| 25,124 | | EOG Resources, Inc. | 2,595,560 |
| 200,664 | | Equinor ASA, ADR | 4,691,524 |
| 31,764 | | Exxon Mobil Corp. | 2,525,238 |
| 35,452 | | HollyFrontier Corp. | 2,214,686 |
| 493,432 | | Marathon Oil Corp. | 8,235,380 |
| 97,441 | | Marathon Petroleum Corp. | 6,349,255 |
| 109,592 | | Murphy Oil Corp. | 3,495,985 |
| 124,772 | | PBF Energy, Inc. | 4,826,181 |
| 425,012 | | Patterson-UTI Energy, Inc. | 5,899,167 |
| 43,935 | | Phillips 66 | 4,108,801 |
| 376,945 | | RPC, Inc. | 4,930,441 |
| 271,778 | | Repsol SA, ADR | 4,666,428 |
| 119,772 | | Royal Dutch Shell PLC, Class A, ADR | 7,234,229 |
| 47,496 | | Schlumberger Ltd. | 2,142,070 |
| 43,873 | | Valero Energy Corp. | 3,505,453 |
| | | TOTAL | 96,730,012 |
| | | Financials—21.1% | |
| 34,552 | | Aflac, Inc. | 1,580,408 |
| 107,337 | | Allstate Corp. | 9,573,387 |
| 1,070,813 | | Bank of America Corp. | 30,411,089 |
| 16,756 | | CME Group, Inc. | 3,184,981 |
| 59,727 | | Capital One Financial Corp. | 5,356,317 |
| 161,790 | | Citigroup, Inc. | 10,482,374 |
| 122,346 | | Comerica, Inc. | 9,687,356 |
| 71,793 | | Discover Financial Services | 5,118,841 |
| 78,329 | | East West Bancorp, Inc. | 4,205,484 |
Annual Shareholder Report
Shares or
Contracts | | | Value in
U.S. Dollars |
| | | COMMON STOCKS—continued | |
| | | Financials—continued | |
| 74,685 | | Evercore, Inc., Class A | $6,165,994 |
| 83,731 | | First American Financial Corp. | 4,046,719 |
| 141,057 | | Hartford Financial Services Group, Inc. | 6,233,309 |
| 352,965 | | JPMorgan Chase & Co. | 39,246,178 |
| 57,917 | | Kemper Corp. | 4,407,484 |
| 119,372 | | LPL Investment Holdings, Inc. | 7,660,101 |
| 199,138 | | Lazard Ltd., Class A | 7,989,417 |
| 206,733 | | Morgan Stanley | 9,176,878 |
| 194,109 | | Navient Corp. | 2,232,254 |
| 26,641 | | PNC Financial Services Group | 3,617,315 |
| 117,471 | | Progressive Corp., OH | 7,787,153 |
| 125,537 | | Raymond James Financial, Inc. | 10,009,065 |
| 50,687 | | The Bank of NT Butterfield & Son Ltd. | 2,011,260 |
| 56,060 | | The Travelers Cos., Inc. | 7,308,542 |
| 120,099 | | Universal Insurance Holdings, Inc. | 5,271,145 |
| 108,760 | | Virtual Financial, Inc. | 2,737,489 |
| 48,590 | | Walker & Dunlop, Inc. | 2,294,906 |
| 98,934 | | Zions Bancorp | 4,814,128 |
| | | TOTAL | 212,609,574 |
| | | Health Care—13.4% | |
| 54,225 | | AbbVie, Inc. | 5,111,791 |
| 41,699 | | Allergan PLC | 6,530,063 |
| 32,976 | | AmerisourceBergen Corp. | 2,931,566 |
| 33,284 | | Amgen, Inc. | 6,931,393 |
| 19,808 | | Anthem, Inc. | 5,745,707 |
| 146,091 | | Bristol-Myers Squibb Co. | 7,810,025 |
| 174,490 | | CVS Health Corp. | 13,994,097 |
| 50,605 | | Cardinal Health, Inc. | 2,774,672 |
| 79,539 | | Eli Lilly & Co. | 9,436,507 |
| 69,972 | | Gilead Sciences, Inc. | 5,033,786 |
| 46,720 | | HCA Healthcare, Inc. | 6,727,213 |
| 114,437 | | Johnson & Johnson | 16,810,795 |
| 40,702 | | McKesson Corp. | 5,067,399 |
| 106,787 | | Medtronic PLC | 10,414,936 |
| 273,946 | | Merck & Co., Inc. | 21,734,876 |
| 111,490 | | Patterson Cos., Inc. | 2,828,501 |
| 84,824 | | Roche Holding AG, ADR | 2,750,842 |
Annual Shareholder Report
Shares or
Contracts | | | Value in
U.S. Dollars |
| | | COMMON STOCKS—continued | |
| | | Health Care—continued | |
| 11,008 | | UnitedHealth Group, Inc. | $3,097,211 |
| | | TOTAL | 135,731,380 |
| | | Industrials—8.1% | |
| 111,625 | | ABB Ltd., ADR | 2,263,755 |
| 625,857 | | ADT, Inc. | 4,887,943 |
| 148,994 | | Advanced Drainage System, Inc. | 4,063,066 |
| 150,300 | | Arcadis NV | 1,894,390 |
| 119,177 | | Arconic, Inc. | 2,559,922 |
| 78,761 | | Caterpillar, Inc. | 10,685,505 |
| 34,956 | | Deere & Co. | 5,413,985 |
| 237,880 | | Delta Air Lines, Inc. | 14,441,695 |
| 193,567 | | Fluor Corp. | 7,922,697 |
| 144,281 | | GrafTech International Ltd. | 2,281,083 |
| 256,519 | | International Consolidated Airlines Group SA, ADR | 4,124,825 |
| 40,176 | | KAR Auction Services, Inc. | 2,295,657 |
| 19,526 | | Lockheed Martin Corp. | 5,866,196 |
| 55,170 | | Raytheon Co. | 9,673,508 |
| 20,912 | | Rockwell Automation, Inc. | 3,645,798 |
| | | TOTAL | 82,020,025 |
| | | Information Technology—9.7% | |
| 110,491 | | Advantest Corp., ADR | 2,342,409 |
| 36,459 | | Apple, Inc. | 6,510,848 |
| 101,067 | | Applied Materials, Inc. | 3,767,778 |
| 24,100 | | Broadcom, Inc. | 5,721,581 |
| 586,891 | | Cisco Systems, Inc. | 28,094,472 |
| 20,719 | | IBM Corp. | 2,574,750 |
| 483,918 | | Intel Corp. | 23,861,997 |
| 46,275 | | KLA-Tencor Corp. | 4,560,864 |
| 49,205 | | Microsoft Corp. | 5,456,342 |
| 29,578 | | Skyworks Solutions, Inc. | 2,152,391 |
| 104,109 | | Texas Instruments, Inc. | 10,395,284 |
| 142,090 | | Travelport Worldwide Ltd. | 2,171,135 |
| | | TOTAL | 97,609,851 |
| | | Materials—2.6% | |
| 410,035 | | Anglo American PLC, ADR | 4,104,491 |
| 103,922 | | Chemours Co./The | 2,959,699 |
| 418,525 | | Freeport-McMoRan, Inc. | 4,997,189 |
| 95,289 | | Huntsman Corp. | 1,926,744 |
Annual Shareholder Report
Shares or
Contracts | | | Value in
U.S. Dollars |
| | | COMMON STOCKS—continued | |
| | | Materials—continued | |
| 36,573 | | Nucor Corp. | $2,209,375 |
| 162,822 | | Olin Corp. | 3,505,558 |
| 59,216 | | Sealed Air Corp. | 2,163,160 |
| 77,332 | | Steel Dynamics, Inc. | 2,722,086 |
| 210,865 | | Svenska Cellulosa AB SCA, ADR | 1,697,463 |
| | | TOTAL | 26,285,765 |
| | | Real Estate—3.9% | |
| 64,855 | | Digital Realty Trust, Inc. | 7,460,919 |
| 135,488 | | Duke Realty Corp. | 3,855,989 |
| 13,435 | | Equinix, Inc. | 5,176,237 |
| 194,268 | | Invitation Homes, Inc. | 4,168,991 |
| 57,141 | | ProLogis, Inc. | 3,847,875 |
| 42,402 | | Regency Centers Corp. | 2,699,311 |
| 19,668 | | Simon Property Group, Inc. | 3,652,151 |
| 79,715 | | Sun Communities, Inc. | 8,298,332 |
| | | TOTAL | 39,159,805 |
| | | Utilities—5.9% | |
| 72,910 | | Dominion Energy, Inc. | 5,431,795 |
| 101,062 | | Duke Energy Corp. | 8,951,061 |
| 126,484 | | Exelon Corp. | 5,867,593 |
| 47,109 | | NextEra Energy, Inc. | 8,560,176 |
| 87,666 | | Public Service Enterprises Group, Inc. | 4,900,529 |
| 38,881 | | Sempra Energy | 4,479,869 |
| 108,433 | | Southern Co. | 5,132,134 |
| 87,827 | | WEC Energy Group, Inc. | 6,365,701 |
| 190,113 | | Xcel Energy, Inc. | 9,971,427 |
| | | TOTAL | 59,660,285 |
| | | TOTAL COMMON STOCKS
(IDENTIFIED COST $853,903,601) | 941,595,899 |
| | | PURCHASED CALL OPTION—0.2% | |
| 10,000 | | Invesco QQQ Trust Series 1, Notional Amount $169,370,000, Exercise Price $175.00, Expiration Date 12/31/2018
(AT COST $1,680,000) | 1,910,000 |
Annual Shareholder Report
Shares or
Contracts | | | Value in
U.S. Dollars |
| | | INVESTMENT COMPANIES—5.6% | |
| 16,936,723 | | Federated Institutional Prime Value Obligations Fund, Institutional Shares, 2.36%1 | $16,936,723 |
| 6,487,087 | | High Yield Bond Portfolio | 39,246,875 |
| | | TOTAL INVESTMENT COMPANIES
(IDENTIFIED COST $56,848,451) | 56,183,598 |
| | | TOTAL INVESTMENT IN SECURITIES—99.1%
(IDENTIFIED COST $912,432,052)2 | 999,689,497 |
| | | OTHER ASSETS AND LIABILITIES - NET—0.9%3 | 9,052,504 |
| | | TOTAL NET ASSETS—100% | $1,008,742,001 |
At November 30, 2018, the Fund had the following outstanding future contracts:
| Description | Number of
Contracts | Notional
Value | Expiration
Date | Value and
Unrealized
Appreciation |
| 4S&P 500 Index Long Futures | 60 | $41,374,500 | December 2018 | $596,304 |
Unrealized Appreciation on Future Contracts is included in “Other Assets and Liabilities—Net.”
Affiliated fund holdings are investment companies which are managed by the Adviser or an affiliate of the Adviser. Transactions with affiliated fund holdings during the period ended November 30, 2018, were as follows:
| | Federated
Institutional
Prime Value
Obligations Fund,
Institutional Shares | High Yield
Bond Portfolio | Total of
Affiliated
Transactions |
| Balance of Shares Held 11/30/2017 | 74,071,265 | 6,094,628 | 80,165,893 |
| Purchases/Additions | 318,486,994 | 392,459 | 318,879,453 |
| Sales/Reductions | (375,621,536) | — | (375,621,536) |
| Balance of Shares Held 11/30/2018 | 16,936,723 | 6,487,087 | 23,423,810 |
| Value | $16,936,723 | $39,246,875 | $56,183,598 |
| Change in Unrealized Appreciation/ Depreciation | $— | $(2,268,017) | $(2,268,017) |
| Net Realized Gain/(Loss) | $(12,387) | $— | $(12,387) |
| Dividend Income | $262,928 | $2,448,328 | $2,711,256 |
| 1 | 7-day net yield. |
| 2 | The cost of investments for federal tax purposes amounts to $916,385,822. |
| 3 | Assets, other than investments in securities, less liabilities. See Statement of Assets and Liabilities. |
| 4 | Non-income-producing security. |
Note: The categories of investments are shown as a percentage of total net assets at November 30, 2018.
Annual Shareholder Report
Various inputs are used in determining the value of the Fund's investments. These inputs are summarized in the three broad levels listed below:
Level 1—quoted prices in active markets for identical securities.
Level 2—other significant observable inputs (including quoted prices for similar securities, interest rates, prepayment speeds, credit risk, etc.). Also includes securities valued at amortized cost.
Level 3—significant unobservable inputs (including the Fund's own assumptions in determining the fair value of investments).
The inputs or methodology used for valuing securities are not an indication of the risk associated with investing in those securities.
The following is a summary of the inputs used, as of November 30, 2018, in valuing the Fund's assets carried at fair value:
| Valuation Inputs | | | | |
| | Level 1—
Quoted
Prices | Level 2—
Other
Significant
Observable
Inputs | Level 3—
Significant
Unobservable
Inputs | Total |
| Common Stocks | | | | |
| Domestic | $867,037,388 | $— | $— | $867,037,388 |
| International | 72,664,121 | 1,894,390 | — | 74,558,511 |
| Purchased Call Option | 1,910,000 | — | — | 1,910,000 |
| Investment Companies1 | 16,936,723 | — | — | 56,183,598 |
| TOTAL SECURITIES | $958,548,232 | $1,894,390 | $— | $999,689,497 |
| Other Financial Instruments2 | | | | |
| Assets | $596,304 | $— | $— | $596,304 |
| Liabilities | — | — | — | — |
| TOTAL OTHER FINANCIAL INSTRUMENTS | $596,304 | $— | $— | $596,304 |
| 1 | As permitted by U.S. generally accepted accounting principles (GAAP), Investment Company valued at $39,246,875 is measured at fair value using the net asset value (NAV) per share practical expedient and have not been categorized in the chart above but is included in the Total column. The price of shares redeemed in High Yield Bond Portfolio is the next determined NAV after receipt of a shareholder redemption request. |
| 2 | Other financial instruments are futures contracts. |
The following acronym is used throughout this portfolio:
| ADR | —American Depositary Receipt |
See Notes which are an integral part of the Financial Statements
Annual Shareholder Report
Financial Highlights–Class A Shares
(For a Share Outstanding Throughout Each Period)
| Year Ended November 30 | 2018 | 2017 | 2016 | 2015 | 2014 |
| Net Asset Value, Beginning of Period | $25.85 | $22.94 | $22.91 | $25.35 | $24.30 |
| Income From Investment Operations: | | | | | |
| Net investment income | 0.43 | 0.48 | 0.52 | 0.451 | 0.40 |
| Net realized and unrealized gain (loss) | (0.52) | 3.32 | 0.35 | (1.05) | 2.11 |
| TOTAL FROM INVESTMENT OPERATIONS | (0.09) | 3.80 | 0.87 | (0.60) | 2.51 |
| Less Distributions: | | | | | |
| Distributions from net investment income | (0.43) | (0.48) | (0.61) | (0.36) | (0.40) |
| Distributions from net realized gain | (0.85) | (0.41) | (0.23) | (1.48) | (1.06) |
| TOTAL DISTRIBUTIONS | (1.28) | (0.89) | (0.84) | (1.84) | (1.46) |
| Net Asset Value, End of Period | $24.48 | $25.85 | $22.94 | $22.91 | $25.35 |
| Total Return2 | (0.47)% | 17.02% | 4.01% | (2.58)% | 10.78% |
| Ratios to Average Net Assets: | | | | | |
| Net expenses | 1.12% | 1.12% | 1.13%3 | 1.12%3 | 1.12%3 |
| Net investment income | 1.70% | 2.05% | 2.40% | 1.90% | 1.65% |
| Expense waiver/reimbursement4 | 0.00%5 | 0.00%5 | 0.01% | 0.00%5 | 0.00%5 |
| Supplemental Data: | | | | | |
| Net assets, end of period (000 omitted) | $785,283 | $864,977 | $865,164 | $987,263 | $1,128,344 |
| Portfolio turnover | 133% | 70% | 133% | 123% | 118% |
| 1 | Per share numbers have been calculated using the average shares method. |
| 2 | Based on net asset value, which does not reflect the sales charge, redemption fee or contingent deferred sales charge, if applicable. |
| 3 | The net expense ratio is calculated without reduction for expense offset arrangements. The net expense ratios are 1.13%, 1.12% and 1.12% for the year ended November 30, 2016, 2015 and 2014, respectively, after taking into account these expense reductions. |
| 4 | This expense decrease is reflected in both the net expense and the net investment income ratios shown above. |
| 5 | Represents less than 0.01%. |
See Notes which are an integral part of the Financial Statements
Annual Shareholder Report
Financial Highlights–Class B Shares
(For a Share Outstanding Throughout Each Period)
| Year Ended November 30 | 2018 | 2017 | 2016 | 2015 | 2014 |
| Net Asset Value, Beginning of Period | $25.77 | $22.86 | $22.84 | $25.27 | $24.26 |
| Income From Investment Operations: | | | | | |
| Net investment income | 0.23 | 0.32 | 0.36 | 0.251 | 0.21 |
| Net realized and unrealized gain (loss) | (0.52) | 3.29 | 0.32 | (1.03) | 2.10 |
| TOTAL FROM INVESTMENT OPERATIONS | (0.29) | 3.61 | 0.68 | (0.78) | 2.31 |
| Less Distributions: | | | | | |
| Distributions from net investment income | (0.23) | (0.29) | (0.43) | (0.17) | (0.24) |
| Distributions from net realized gain | (0.85) | (0.41) | (0.23) | (1.48) | (1.06) |
| TOTAL DISTRIBUTIONS | (1.08) | (0.70) | (0.66) | (1.65) | (1.30) |
| Net Asset Value, End of Period | $24.40 | $25.77 | $22.86 | $22.84 | $25.27 |
| Total Return2 | (1.26)% | 16.16% | 3.14% | (3.33)% | 9.89% |
| Ratios to Average Net Assets: | | | | | |
| Net expenses | 1.91% | 1.91% | 1.94%3 | 1.91%3 | 1.92%3 |
| Net investment income | 0.89% | 1.25% | 1.59% | 1.08% | 0.86% |
| Expense waiver/reimbursement4 | 0.00%5 | 0.00%5 | 0.00%5 | 0.00%5 | 0.01% |
| Supplemental Data: | | | | | |
| Net assets, end of period (000 omitted) | $29,846 | $39,880 | $45,951 | $56,032 | $67,749 |
| Portfolio turnover | 133% | 70% | 133% | 123% | 118% |
| 1 | Per share numbers have been calculated using the average shares method. |
| 2 | Based on net asset value, which does not reflect the sales charge, redemption fee or contingent deferred sales charge, if applicable. |
| 3 | The net expense ratio is calculated without reduction for expense offset arrangements. The net expense ratios are 1.94%, 1.91% and 1.92% for the year ended November 30, 2016, 2015 and 2014, respectively, after taking into account these expense reductions. |
| 4 | This expense decrease is reflected in both the net expense and the net investment income ratios shown above. |
| 5 | Represents less than 0.01%. |
See Notes which are an integral part of the Financial Statements
Annual Shareholder Report
Financial Highlights–Class C Shares
(For a Share Outstanding Throughout Each Period)
| Year Ended November 30 | 2018 | 2017 | 2016 | 2015 | 2014 |
| Net Asset Value, Beginning of Period | $25.81 | $22.89 | $22.87 | $25.30 | $24.29 |
| Income From Investment Operations: | | | | | |
| Net investment income | 0.23 | 0.29 | 0.35 | 0.271 | 0.21 |
| Net realized and unrealized gain (loss) | (0.52) | 3.34 | 0.34 | (1.04) | 2.10 |
| TOTAL FROM INVESTMENT OPERATIONS | (0.29) | 3.63 | 0.69 | (0.77) | 2.31 |
| Less Distributions: | | | | | |
| Distributions from net investment income | (0.23) | (0.30) | (0.44) | (0.18) | (0.24) |
| Distributions from net realized gain | (0.85) | (0.41) | (0.23) | (1.48) | (1.06) |
| TOTAL DISTRIBUTIONS | (1.08) | (0.71) | (0.67) | (1.66) | (1.30) |
| Net Asset Value, End of Period | $24.44 | $25.81 | $22.89 | $22.87 | $25.30 |
| Total Return2 | (1.25)% | 16.21% | 3.18% | (3.30)% | 9.90% |
| Ratios to Average Net Assets: | | | | | |
| Net expenses | 1.88% | 1.88% | 1.89%3 | 1.88%3 | 1.89%3 |
| Net investment income | 0.91% | 1.27% | 1.63% | 1.13% | 0.88% |
| Expense waiver/reimbursement4 | 0.00%5 | 0.00%5 | 0.01% | 0.00%5 | 0.00%5 |
| Supplemental Data: | | | | | |
| Net assets, end of period (000 omitted) | $33,925 | $79,347 | $89,043 | $106,212 | $122,977 |
| Portfolio turnover | 133% | 70% | 133% | 123% | 118% |
| 1 | Per share numbers have been calculated using the average shares method. |
| 2 | Based on net asset value, which does not reflect the sales charge, redemption fee or contingent deferred sales charge, if applicable. |
| 3 | The net expense ratio is calculated without reduction for expense offset arrangements. The net expense ratios are 1.89%, 1.88% and 1.89% for the year ended November 30, 2016, 2015 and 2014, respectively, after taking into account these expense reductions. |
| 4 | This expense decrease is reflected in both the net expense and the net investment income ratios shown above. |
| 5 | Represents less than 0.01%. |
See Notes which are an integral part of the Financial Statements
Annual Shareholder Report
Financial Highlights–Class F Shares
(For a Share Outstanding Throughout Each Period)
| Year Ended November 30 | 2018 | 2017 | 2016 | 2015 | 2014 |
| Net Asset Value, Beginning of Period | $25.87 | $22.95 | $22.93 | $25.36 | $24.31 |
| Income From Investment Operations: | | | | | |
| Net investment income | 0.37 | 0.42 | 0.46 | 0.401 | 0.34 |
| Net realized and unrealized gain (loss) | (0.52) | 3.33 | 0.34 | (1.05) | 2.11 |
| TOTAL FROM INVESTMENT OPERATIONS | (0.15) | 3.75 | 0.80 | (0.65) | 2.45 |
| Less Distributions: | | | | | |
| Distributions from net investment income | (0.37) | (0.42) | (0.55) | (0.30) | (0.34) |
| Distributions from net realized gain | (0.85) | (0.41) | (0.23) | (1.48) | (1.06) |
| TOTAL DISTRIBUTIONS | (1.22) | (0.83) | (0.78) | (1.78) | (1.40) |
| Net Asset Value, End of Period | $24.50 | $25.87 | $22.95 | $22.93 | $25.36 |
| Total Return2 | (0.71)% | 16.78% | 3.70% | (2.78)% | 10.51% |
| Ratios to Average Net Assets: | | | | | |
| Net expenses | 1.36% | 1.36% | 1.38%3 | 1.36%3 | 1.36%3 |
| Net investment income | 1.45% | 1.81% | 2.15% | 1.70% | 1.40% |
| Expense waiver/reimbursement4 | 0.00%5 | 0.00%5 | 0.00%5 | 0.00%5 | 0.00%5 |
| Supplemental Data: | | | | | |
| Net assets, end of period (000 omitted) | $47,958 | $53,205 | $50,825 | $55,424 | $53,854 |
| Portfolio turnover | 133% | 70% | 133% | 123% | 118% |
| 1 | Per share numbers have been calculated using the average shares method. |
| 2 | Based on net asset value, which does not reflect the sales charge, redemption fee or contingent deferred sales charge, if applicable. |
| 3 | The net expense ratio is calculated without reduction for expense offset arrangements. The net expense ratios are 1.38%, 1.36% and 1.36% for the year ended November 30, 2016, 2015 and 2014, respectively, after taking into account these expense reductions. |
| 4 | This expense decrease is reflected in both the net expense and the net investment income ratios shown above. |
| 5 | Represents less than 0.01%. |
See Notes which are an integral part of the Financial Statements
Annual Shareholder Report
Financial Highlights–Class R Shares
(For a Share Outstanding Throughout Each Period)
| Year Ended November 30 | 2018 | 2017 | 2016 | 2015 | 2014 |
| Net Asset Value, Beginning of Period | $25.86 | $22.94 | $22.92 | $25.35 | $24.30 |
| Income From Investment Operations: | | | | | |
| Net investment income | 0.39 | 0.46 | 0.48 | 0.421 | 0.36 |
| Net realized and unrealized gain (loss) | (0.53) | 3.31 | 0.34 | (1.05) | 2.11 |
| TOTAL FROM INVESTMENT OPERATIONS | (0.14) | 3.77 | 0.82 | (0.63) | 2.47 |
| Less Distributions: | | | | | |
| Distributions from net investment income | (0.39) | (0.44) | (0.57) | (0.32) | (0.36) |
| Distributions from net realized gain | (0.85) | (0.41) | (0.23) | (1.48) | (1.06) |
| TOTAL DISTRIBUTIONS | (1.24) | (0.85) | (0.80) | (1.80) | (1.42) |
| Net Asset Value, End of Period | $24.48 | $25.86 | $22.94 | $22.92 | $25.35 |
| Total Return2 | (0.68)% | 16.88% | 3.80% | (2.70)% | 10.59% |
| Ratios to Average Net Assets: | | | | | |
| Net expenses | 1.29% | 1.28% | 1.29%3 | 1.28%3 | 1.29%3 |
| Net investment income | 1.52% | 1.88% | 2.24% | 1.78% | 1.48% |
| Expense waiver/reimbursement4 | 0.25% | 0.25% | 0.25% | 0.25% | 0.25% |
| Supplemental Data: | | | | | |
| Net assets, end of period (000 omitted) | $18,836 | $21,524 | $21,944 | $23,732 | $25,145 |
| Portfolio turnover | 133% | 70% | 133% | 123% | 118% |
| 1 | Per share numbers have been calculated using the average shares method. |
| 2 | Based on net asset value. |
| 3 | The net expense ratio is calculated without reduction for expense offset arrangements. The net expense ratios are 1.29%, 1.28% and 1.29% for the year ended November 30, 2016, 2015 and 2014, respectively, after taking into account these expense reductions. |
| 4 | This expense decrease is reflected in both the net expense and the net investment income ratios shown above. |
See Notes which are an integral part of the Financial Statements
Annual Shareholder Report
Financial Highlights–Institutional Shares
(For a Share Outstanding Throughout Each Period)
| Year Ended November 30 | 2018 | 2017 | 2016 | 2015 | 2014 |
| Net Asset Value, Beginning of Period | $25.84 | $22.93 | $22.90 | $25.34 | $24.29 |
| Income From Investment Operations: | | | | | |
| Net investment income | 0.50 | 0.54 | 0.57 | 0.491 | 0.46 |
| Net realized and unrealized gain (loss) | (0.53) | 3.32 | 0.35 | (1.03) | 2.12 |
| TOTAL FROM INVESTMENT OPERATIONS | (0.03) | 3.86 | 0.92 | (0.54) | 2.58 |
| Less Distributions: | | | | | |
| Distributions from net investment income | (0.49) | (0.54) | (0.66) | (0.42) | (0.47) |
| Distributions from net realized gain | (0.85) | (0.41) | (0.23) | (1.48) | (1.06) |
| TOTAL DISTRIBUTIONS | (1.34) | (0.95) | (0.89) | (1.90) | (1.53) |
| Net Asset Value, End of Period | $24.47 | $25.84 | $22.93 | $22.90 | $25.34 |
| Total Return2 | (0.22)% | 17.32% | 4.28% | (2.33)% | 11.08% |
| Ratios to Average Net Assets: | | | | | |
| Net expenses | 0.88% | 0.87% | 0.87%3 | 0.86%3 | 0.85%3 |
| Net investment income | 1.95% | 2.30% | 2.64% | 2.06% | 1.93% |
| Expense waiver/reimbursement4 | 0.01% | 0.00%5 | 0.00%5 | 0.00%5 | 0.00%5 |
| Supplemental Data: | | | | | |
| Net assets, end of period (000 omitted) | $92,893 | $113,942 | $115,923 | $149,593 | $255,673 |
| Portfolio turnover | 133% | 70% | 133% | 123% | 118% |
| 1 | Per share numbers have been calculated using the average shares method. |
| 2 | Based on net asset value. |
| 3 | The net expense ratio is calculated without reduction for expense offset arrangements. The net expense ratios are 0.87%, 0.86% and 0.85% for the year ended November 30, 2016, 2015 and 2014, respectively, after taking into account these expense reductions. |
| 4 | This expense decrease is reflected in both the net expense and the net investment income ratios shown above. |
| 5 | Represents less than 0.01%. |
See Notes which are an integral part of the Financial Statements
Annual Shareholder Report
Statement of Assets and Liabilities
November 30, 2018
| Assets: | | |
| Investment in securities, at value including $56,183,598 of investment in affiliated holdings (identified cost $912,432,052) | | $999,689,497 |
| Restricted cash (Note 2) | | 1,800,000 |
| Income receivable | | 2,893,431 |
| Income receivable from affiliated holdings | | 259,991 |
| Receivable for investments sold | | 10,752,294 |
| Receivable for shares sold | | 635,559 |
| TOTAL ASSETS | | 1,016,030,772 |
| Liabilities: | | |
| Payable for investments purchased | $5,053,040 | |
| Payable for shares redeemed | 1,143,112 | |
| Payable for daily variation margin on futures contracts | 466,724 | |
| Payable for investment adviser fee (Note 5) | 16,434 | |
| Payable for administrative fees (Note 5) | 2,195 | |
| Payable for transfer agent fee | 230,631 | |
| Payable for distribution services fee (Note 5) | 52,839 | |
| Payable for other service fees (Notes 2 and 5) | 199,314 | |
| Accrued expenses (Note 5) | 124,482 | |
| TOTAL LIABILITIES | | 7,288,771 |
| Net assets for 41,216,739 shares outstanding | | $1,008,742,001 |
| Net Assets Consist of: | | |
| Paid-in capital | | $795,800,421 |
| Total distributable earnings | | 212,941,580 |
| TOTAL NET ASSETS | | $1,008,742,001 |
Annual Shareholder Report
Statement of Assets and Liabilities–continued
| Net Asset Value, Offering Price and Redemption Proceeds Per Share | | |
| Class A Shares: | | |
| Net asset value per share ($785,282,931 ÷ 32,080,899 shares outstanding), $0.001 par value, 400,000,000 shares authorized | | $24.48 |
| Offering price per share (100/94.50 of $24.48) | | $25.90 |
| Redemption proceeds per share | | $24.48 |
| Class B Shares: | | |
| Net asset value per share ($29,846,310 ÷ 1,223,410 shares outstanding), $0.001 par value, 100,000,000 shares authorized | | $24.40 |
| Offering price per share | | $24.40 |
| Redemption proceeds per share (94.50/100 of $24.40) | | $23.06 |
| Class C Shares: | | |
| Net asset value per share ($33,925,106 ÷ 1,388,320 shares outstanding), $0.001 par value, 300,000,000 shares authorized | | $24.44 |
| Offering price per share | | $24.44 |
| Redemption proceeds per share (99.00/100 of $24.44) | | $24.20 |
| Class F Shares: | | |
| Net asset value per share ($47,957,863 ÷ 1,957,849 shares outstanding), $0.001 par value, 100,000,000 shares authorized | | $24.50 |
| Offering price per share (100/99.00 of $24.50) | | $24.75 |
| Redemption proceeds per share (99.00/100 of $24.50) | | $24.26 |
| Class R Shares: | | |
| Net asset value per share ($18,836,294 ÷ 769,403 shares outstanding), $0.001 par value, 300,000,000 shares authorized | | $24.48 |
| Offering price per share | | $24.48 |
| Redemption proceeds per share | | $24.48 |
| Institutional Shares: | | |
| Net asset value per share ($92,893,497 ÷ 3,796,858 shares outstanding), $0.001 par value, 400,000,000 shares authorized | | $24.47 |
| Offering price per share | | $24.47 |
| Redemption proceeds per share | | $24.47 |
See Notes which are an integral part of the Financial Statements
Annual Shareholder Report
Statement of Operations
Year Ended November 30, 2018
| Investment Income: | | | |
| Dividends (including $2,711,256 received from affiliated holdings* and net of foreign taxes withheld of $384,536) | | | $31,516,780 |
| Interest | | | 8,902 |
| TOTAL INCOME | | | 31,525,682 |
| Expenses: | | | |
| Investment adviser fee (Note 5) | | $6,717,977 | |
| Administrative fee (Note 5) | | 897,253 | |
| Custodian fees | | 60,935 | |
| Transfer agent fee (Note 2) | | 1,687,283 | |
| Directors'/Trustees' fees (Note 5) | | 15,806 | |
| Auditing fees | | 31,040 | |
| Legal fees | | 13,804 | |
| Portfolio accounting fees | | 177,861 | |
| Distribution services fee (Note 5) | | 972,798 | |
| Other service fees (Notes 2 and 5) | | 2,459,780 | |
| Share registration costs | | 92,070 | |
| Printing and postage | | 87,831 | |
| Taxes | | 300 | |
| Miscellaneous (Note 5) | | 15,708 | |
| TOTAL EXPENSES | | 13,230,446 | |
Annual Shareholder Report
Statement of Operations–continued
| Waiver and Reimbursements: | | | |
| Reimbursement of investment adviser fee (Note 5) | $(9,135) | | |
| Waiver/reimbursement of other operating expenses (Notes 2 and 5) | (57,488) | | |
| TOTAL WAIVER AND REIMBURSEMENTS | | $(66,623) | |
| Net expenses | | | $13,163,823 |
| Net investment income | | | 18,361,859 |
| Realized and Unrealized Gain (Loss) on Investments, Futures Contracts, Written Options and Foreign Currency Transactions: | | | |
| Net realized gain on investments (including net realized loss of $(12,387) on sales of investments in affiliated holdings*) | | | 125,983,593 |
| Net realized loss on foreign currency transactions | | | (7,061) |
| Net realized gain on futures contracts | | | 2,237,274 |
| Net realized gain on written options | | | 139,398 |
| Net change in unrealized appreciation of investments (including net change in unrealized appreciation of $(2,268,017) on investments in affiliated holdings*) | | | (148,248,750) |
| Net change in unrealized appreciation/depreciation of translation of assets and liabilities in foreign currency | | | 637 |
| Net change in unrealized appreciation of futures contracts | | | 288,407 |
| Net realized and unrealized loss on investments, futures contracts, written options and foreign currency transactions | | | (19,606,502) |
| Change in net assets resulting from operations | | | $(1,244,643) |
| * | See information listed after the Fund's Portfolio of Investments. |
See Notes which are an integral part of the Financial Statements
Annual Shareholder Report
Statement of Changes in Net Assets
| Year Ended November 30 | 2018 | 2017 |
| Increase (Decrease) in Net Assets | | |
| Operations: | | |
| Net investment income | $18,361,859 | $22,910,254 |
| Net realized gain | 128,353,204 | 37,115,035 |
| Net change in unrealized appreciation/depreciation | (147,959,706) | 122,402,321 |
| CHANGE IN NET ASSETS RESULTING FROM OPERATIONS | (1,244,643) | 182,427,610 |
| Distributions to Shareholders (Note 2): | | |
| Class A Shares | (42,165,371) | (32,460,501) |
| Class B Shares | (1,595,600) | (1,330,199) |
| Class C Shares | (3,162,878) | (2,627,177) |
| Class F Shares | (2,461,097) | (1,817,829) |
| Class R Shares | (1,021,217) | (783,304) |
| Institutional Shares | (5,897,964) | (4,541,393) |
| CHANGE IN NET ASSETS RESULTING FROM DISTRIBUTIONS TO SHAREHOLDERS | (56,304,127) | (43,560,403) |
| Share Transactions: | | |
| Proceeds from sale of shares | 109,112,765 | 79,942,408 |
| Net asset value of shares issued to shareholders in payment of distributions declared | 52,913,646 | 40,797,111 |
| Cost of shares redeemed | (268,610,375) | (275,581,564) |
| CHANGE IN NET ASSETS RESULTING FROM SHARE TRANSACTIONS | (106,583,964) | (154,842,045) |
| Change in net assets | (164,132,734) | (15,974,838) |
| Net Assets: | | |
| Beginning of period | 1,172,874,735 | 1,188,849,573 |
| End of period | $1,008,742,001 | $1,172,874,735 |
See Notes which are an integral part of the Financial Statements
Annual Shareholder Report
Notes to Financial Statements
November 30, 2018
1. ORGANIZATION
Federated Equity Income Fund, Inc. (the “Fund”) is registered under the Investment Company Act of 1940, as amended (the “Act”), as a diversified, open-end management investment company. The Fund offers six classes of shares: Class A Shares, Class B Shares, Class C Shares, Class F Shares, Class R Shares and Institutional Shares. All shares of the Fund have equal rights with respect to voting, except on class-specific matters. The investment objective of the Fund is to provide above average income and capital appreciation.
On March 30, 2017, the Fund's T Share Class became effective with the Securities and Exchange Commission (SEC), but is not yet offered for sale.
Class B Shares are closed to new accounts, new investors and new purchases by existing shareholders (excluding reinvestment of dividends and capital gains). Class B Shares of the Fund may be exchanged for Class B Shares of any other Federated fund.
Effective August 1, 2018, an automatic conversion feature for Class C Shares was implemented. Pursuant to this automatic conversion feature, after Class C Shares have been held for ten years from the date of purchase, they will automatically convert to Class A Shares on the next monthly conversion processing date.
2. SIGNIFICANT ACCOUNTING POLICIES
The following is a summary of significant accounting policies consistently followed by the Fund in the preparation of its financial statements. These policies are in conformity with GAAP.
Investment Valuation
In calculating its NAV, the Fund generally values investments as follows:
| ■ | Equity securities listed on an exchange or traded through a regulated market system are valued at their last reported sale price or official closing price in their principal exchange or market. |
| ■ | Fixed-income securities are fair valued using price evaluations provided by a pricing service approved by the Fund's Board of Directors (the “Directors”). |
| ■ | Shares of other mutual funds or non-exchange-traded investment companies are valued based upon their reported NAVs. |
| ■ | Derivative contracts listed on exchanges are valued at their reported settlement or closing price, except that options are valued at the mean of closing bid and asked quotations. |
| ■ | Over-the-counter (OTC) derivative contracts are fair valued using price evaluations provided by a pricing service approved by the Directors. |
| ■ | For securities that are fair valued in accordance with procedures established by and under the general supervision of the Directors, certain factors may be considered, such as: the last traded or purchase price of the security, information obtained by contacting the issuer or dealers, analysis of the issuer's financial statements or other available documents, fundamental analytical data, the nature and duration of restrictions on disposition, the movement of the market in which the security is normally traded, public trading in similar securities or derivative contracts of the issuer or comparable issuers, movement of a relevant index, or other factors including but not limited to industry changes and relevant government actions. |
Annual Shareholder Report
If any price, quotation, price evaluation or other pricing source is not readily available when the NAV is calculated, if the Fund cannot obtain price evaluations from a pricing service or from more than one dealer for an investment within a reasonable period of time as set forth in the Fund's valuation policies and procedures, or if information furnished by a pricing service, in the opinion of the valuation committee (“Valuation Committee”), is deemed not representative of the fair value of such security, the Fund uses the fair value of the investment determined in accordance with the procedures described below. There can be no assurance that the Fund could obtain the fair value assigned to an investment if it sold the investment at approximately the time at which the Fund determines its NAV per share.
Fair Valuation and Significant Events Procedures
The Directors have ultimate responsibility for determining the fair value of investments for which market quotations are not readily available. The Directors have appointed a Valuation Committee comprised of officers of the Fund, Federated Equity Management Company of Pennsylvania (the “Adviser”) and certain of the Adviser's affiliated companies to assist in determining fair value and in overseeing the calculation of the NAV. The Directors have also authorized the use of pricing services recommended by the Valuation Committee to provide fair value evaluations of the current value of certain investments for purposes of calculating the NAV. The Valuation Committee employs various methods for reviewing third-party pricing-service evaluations including periodic reviews of third-party pricing services' policies, procedures and valuation methods (including key inputs, methods, models and assumptions), transactional back-testing, comparisons of evaluations of different pricing services, and review of price challenges by the Adviser based on recent market activity. In the event that market quotations and price evaluations are not available for an investment, the Valuation Committee determines the fair value of the investment in accordance with procedures adopted by the Directors. The Directors periodically review and approve the fair valuations made by the Valuation Committee and any changes made to the procedures.
Factors considered by pricing services in evaluating an investment include the yields or prices of investments of comparable quality, coupon, maturity, call rights and other potential prepayments, terms and type, reported transactions, indications as to values from dealers and general market conditions. Some pricing services provide a single price evaluation reflecting the bid-side of the market for an investment (a “bid” evaluation). Other pricing services offer both bid evaluations and price evaluations indicative of a price between the prices bid and asked for the investment (a “mid” evaluation). The Fund normally uses bid evaluations for any U.S. Treasury and Agency securities, mortgage-backed securities and municipal securities. The Fund normally uses mid evaluations for any other types of fixed-income securities and any OTC derivative contracts. In the event that market quotations and price evaluations are not available for an investment, the fair value of the investment is determined in accordance with procedures adopted by the Directors.
The Directors also have adopted procedures requiring an investment to be priced at its fair value whenever the Adviser determines that a significant event affecting the value of the investment has occurred between the time as of which the price of the investment would otherwise be determined and the time as of which the NAV is computed. An event is considered significant if there is both an affirmative expectation that the investment's value
Annual Shareholder Report
will change in response to the event and a reasonable basis for quantifying the resulting change in value. Examples of significant events that may occur after the close of the principal market on which a security is traded, or after the time of a price evaluation provided by a pricing service or a dealer, include:
| ■ | With respect to securities traded principally in foreign markets, significant trends in U.S. equity markets or in the trading of foreign securities index futures contracts; |
| ■ | Political or other developments affecting the economy or markets in which an issuer conducts its operations or its securities are traded; |
| ■ | Announcements concerning matters such as acquisitions, recapitalizations, litigation developments, or a natural disaster affecting the issuer's operations or regulatory changes or market developments affecting the issuer's industry. |
The Directors have adopted procedures whereby the Valuation Committee uses a pricing service to determine the fair value of equity securities traded principally in foreign markets when the Adviser determines that there has been a significant trend in the U.S. equity markets or in index futures trading. For other significant events, the Fund may seek to obtain more current quotations or price evaluations from alternative pricing sources. If a reliable alternative pricing source is not available, the Fund will determine the fair value of the investment in accordance with the fair valuation procedures approved by the Directors. The Directors have ultimate responsibility for any fair valuations made in response to a significant event.
Investment Income, Gains and Losses, Expenses and Distributions
Investment transactions are accounted for on a trade-date basis. Realized gains and losses from investment transactions are recorded on an identified-cost basis. Interest income and expenses are accrued daily. Dividend income and distributions to shareholders are recorded on the ex-dividend date. Foreign dividends are recorded on the ex-dividend date or when the Fund is informed of the ex-dividend date. Distributions of net investment income, if any, are declared and paid monthly. Non-cash dividends included in dividend income, if any, are recorded at fair value. Amortization/accretion of premium and discount is included in investment income. Investment income, realized and unrealized gains and losses, and certain fund-level expenses are allocated to each class based on relative average daily net assets, except that select classes will bear certain expenses unique to those classes. The detail of the total fund expense waiver and reimbursements of $66,623 is disclosed in various locations in this Note 2 and Note 5. For the year ended November 30, 2018, transfer agent fees for the Fund were as follows:
| | Transfer Agent
Fees Incurred | Transfer Agent
Fees Reimbursed |
| Class A Shares | $1,206,302 | $— |
| Class B Shares | 64,874 | — |
| Class C Shares | 99,278 | — |
| Class F Shares | 73,012 | — |
| Class R Shares | 66,047 | — |
| Institutional Shares | 177,770 | (5,753) |
| TOTAL | $1,687,283 | $(5,753) |
Annual Shareholder Report
Dividends are declared separately for each class. No class has preferential dividend rights; differences in per share dividend rates are generally due to differences in separate class expenses. The distributions disclosed on the Statement of Changes in Net Assets for the year ended November 30, 2017, were from the following sources:
| Net Investment Income | |
| Class A Shares | $17,069,594 |
| Class B Shares | 513,690 |
| Class C Shares | 1,022,616 |
| Class F Shares | 909,774 |
| Class R Shares | 390,002 |
| Institutional Shares | 2,459,532 |
| Net Realized Gain | |
| Class A Shares | $15,390,907 |
| Class B Shares | 816,509 |
| Class C Shares | 1,604,561 |
| Class F Shares | 908,055 |
| Class R Shares | 393,302 |
| Institutional Shares | 2,081,861 |
Undistributed net investment income at November 30, 2017, was $644,349.
Other Service Fees
The Fund may pay other service fees up to 0.25% of the average daily net assets of the Fund's Class A Shares, Class B Shares, Class C Shares and Class F Shares to unaffiliated financial intermediaries or to Federated Shareholder Services Company (FSSC) for providing services to shareholders and maintaining shareholder accounts. Subject to the terms described in the Expense Limitation note, FSSC may voluntarily reimburse the Fund for other service fees. For the year ended November 30, 2018, other service fees for the Fund were as follows:
| | Other Service
Fees Incurred |
| Class A Shares | $2,084,449 |
| Class B Shares | 87,632 |
| Class C Shares | 158,982 |
| Class F Shares | 128,717 |
| TOTAL | $2,459,780 |
Federal Taxes
It is the Fund's policy to comply with the Subchapter M provision of the Internal Revenue Code and to distribute to shareholders each year substantially all of its income. Accordingly, no provision for federal income tax is necessary. As of and during the year ended November 30, 2018, the Fund did not have a liability for any uncertain tax positions. The Fund
Annual Shareholder Report
recognizes interest and penalties, if any, related to tax liabilities as income tax expense in the Statement of Operations. As of November 30, 2018, tax years 2015 through 2018 remain subject to examination by the Fund's major tax jurisdictions, which include the United States of America, the state of Maryland and the Commonwealth of Pennsylvania.
The Fund may be subject to taxes imposed by governments of countries in which it invests. Such taxes are generally based on either income or gains earned or repatriated. The Fund accrues and applies such taxes to net investment income, net realized gains and net unrealized gains as income and/or gains are earned.
When-Issued and Delayed-Delivery Transactions
The Fund may engage in when-issued or delayed-delivery transactions. The Fund records when-issued securities on the trade date and maintains security positions such that sufficient liquid assets will be available to make payment for the securities purchased. Securities purchased on a when-issued or delayed-delivery basis are marked to market daily and begin earning interest on the settlement date. Losses may occur on these transactions due to changes in market conditions or the failure of counterparties to perform under the contract.
Futures Contracts
The Fund purchases and sells financial futures contracts to seek to increase return and to manage duration risk, market risk, sector/asset class risk and yield curve risk. Upon entering into a financial futures contract with a broker, the Fund is required to deposit in a segregated account, either U.S. government securities or a specified amount of Restricted cash, which is shown in the Statement of Assets and Liabilities. Futures contracts are valued daily and unrealized gains or losses are recorded in a “variation margin” account. Daily, the Fund receives from or pays to the broker a specified amount of cash based upon changes in the variation margin account. When a contract is closed, the Fund recognizes a realized gain or loss. Futures contracts have market risks, including the risk that the change in the value of the contract may not correlate with the changes in the value of the underlying securities. There is minimal counterparty risk to the Fund since futures contracts are exchange traded and the exchange's clearinghouse, as counterparty to all exchange traded futures contracts, guarantees the futures contracts against default.
Futures contracts outstanding at period end are listed after the Fund's Portfolio of Investments.
The average notional value of long contracts held by the Fund throughout the period was $25,060,900. This is based on amounts held as of each month-end throughout the fiscal period.
Foreign Exchange Contracts
The Fund enters into foreign exchange contracts to manage currency risk. Purchased contracts are used to acquire exposure to foreign currencies, whereas, contracts to sell are used to hedge the Fund's securities against currency fluctuations. Risks may arise upon entering into these transactions from the potential inability of counterparties to meet the terms of their commitments and from unanticipated movements in security prices or foreign exchange rates. The foreign exchange contracts are adjusted by the daily exchange rate of the underlying currency and any gains or losses are recorded for financial statement purposes as unrealized until the settlement date.
At November 30, 2018, the Fund had no outstanding foreign exchange contracts.
Annual Shareholder Report
Foreign Currency Translation
The accounting records of the Fund are maintained in U.S. dollars. All assets and liabilities denominated in foreign currencies are translated into U.S. dollars based on the rates of exchange of such currencies against U.S. dollars on the date of valuation. Purchases and sales of securities, income and expenses are translated at the rate of exchange quoted on the respective date that such transactions are recorded. The Fund does not isolate that portion of the results of operations resulting from changes in foreign exchange rates on investments from the fluctuations arising from changes in market prices of securities held. Such fluctuations are included with the net realized and unrealized gain or loss from investments.
Reported net realized foreign exchange gains or losses arise from sales of foreign currencies, currency gains or losses realized between the trade and settlement dates on securities transactions, the difference between the amounts of dividends, interest and foreign withholding taxes recorded on the Fund's books, and the U.S. dollar equivalent of the amounts actually received or paid. Net unrealized foreign exchange gains and losses arise from changes in the value of assets and liabilities other than investments in securities at fiscal year end, resulting from changes in the exchange rate.
Restricted Securities
The Fund may purchase securities which are considered restricted. Restricted securities are securities that either: (a) cannot be offered for public sale without first being registered, or being able to take advantage of an exemption from registration, under the Securities Act of 1933; or (b) are subject to contractual restrictions on public sales. In some cases, when a security cannot be offered for public sale without first being registered, the issuer of the restricted security has agreed to register such securities for resale, at the issuer's expense, either upon demand by the Fund or in connection with another registered offering of the securities. Many such restricted securities may be resold in the secondary market in transactions exempt from registration. Restricted securities may be determined to be liquid under criteria established by the Directors. The Fund will not incur any registration costs upon such resales. The Fund's restricted securities, like other securities, are priced in accordance with procedures established by and under the general supervision of the Directors.
Option Contracts
The Fund buys or sells put and call options to seek to increase yield, income and return, and to manage currency risk, individual security risk, market risk and sector/asset class risk. The seller (“writer”) of an option receives a payment or premium, from the buyer, which the writer keeps regardless of whether the buyer exercises the option. When the Fund writes a put or call option, an amount equal to the premium received is recorded as a liability and subsequently marked to market to reflect the current value of the option written. Premiums received from writing options which expire are treated as realized gains. The Fund, as a writer of an option, bears the market risk of an unfavorable change in the price of the underlying reference instrument. When the Fund purchases a put or call option, an amount equal to the premium paid is recorded as an increase to the cost of the investment and subsequently marked to market to reflect the current value of the option purchased. Premiums paid for purchasing options which expire are treated as realized losses. Premiums received/paid for writing/purchasing options which are exercised or closed are added to the proceeds or offset against amounts paid on the underlying reference instrument to determine the realized gain or loss. The risk associated with purchasing put and call options is limited to the premium paid.
Annual Shareholder Report
Options can trade on securities or commodities exchanges. In this case, the exchange sets all the terms of the contract except for the price. Most exchanges require investors to maintain margin accounts through their brokers to cover their potential obligations to the exchange. This protects investors against potential defaults by the counterparty.
The average market value of purchased put and call options held by the Fund throughout the period were $26,352 and $183,000, respectively. This is based on amounts held as of each month-end throughout the fiscal period.
The average market value of written put options held by the Fund throughout the period was $3,046. This is based on amounts held as of each month-end throughout the fiscal period.
At November 30, 2018, the Fund had no outstanding written option contracts.
Additional Disclosure Related to Derivative Instruments
| Fair Value of Derivative Instruments |
| | Assets | Liabilities |
| | Statement of
Assets and
Liabilities
Location | Fair
Value | Statement of
Assets and
Liabilities
Location | Fair
Value |
Derivatives not accounted for as hedging
instruments under ASC Topic 815 | | | | |
| Equity contracts | Purchased options,
in securities
at value | $1,910,000 | | $— |
| Equity contracts | | $— | Payable for
daily variation
margin on
futures contracts | $(596,304)* |
| * | Includes appreciation of futures contracts as reported in the footnotes to the Portfolio of Investments. Only the current day's variation margin is reported within the Statement of Assets and Liabilities. |
The Effect of Derivative Instruments on the Statement of Operations for the Year Ended November 30, 2018
| Amount of Realized Gain or (Loss) on Derivatives Recognized in Income |
| | Futures
Contracts | Purchased
Options1 | Written
Options | Total |
| Equity contracts | $2,237,274 | $(2,073,341) | $139,398 | $303,331 |
| 1 | The net realized gain (loss) on Purchased Options is found within the net realized gain on investments and foreign currency transactions on the Statement of Operations. |
| | |
| Change in Unrealized Appreciation or (Depreciation) on Derivatives Recognized in Income |
| | Futures
Contracts | Purchased
Options2 | Total |
| Equity contracts | $288,407 | $754,375 | $1,042,782 |
| 2 | The net change in unrealized appreciation of Purchased Options is found within the Net Change in unrealized depreciation of investment on the Statement of Operations. |
Annual Shareholder Report
Other
The preparation of financial statements in conformity with GAAP requires management to make estimates and assumptions that affect the amounts of assets, liabilities, expenses and revenues reported in the financial statements. Actual results could differ from those estimated. The Fund applies investment company accounting and reporting guidance.
3. Capital Stock
The following tables summarize share activity:
| Year Ended November 30 | 2018 | 2017 |
| Class A Shares: | Shares | Amount | Shares | Amount |
| Shares sold | 2,335,016 | $59,915,831 | 1,341,763 | $32,010,613 |
| Shares issued to shareholders in payment of distributions declared | 1,558,659 | 39,522,144 | 1,288,382 | 30,400,991 |
| Shares redeemed | (5,268,094) | (134,371,687) | (6,896,273) | (164,916,830) |
NET CHANGE RESULTING FROM
CLASS A SHARE TRANSACTIONS | (1,374,419) | $(34,933,712) | (4,266,128) | $(102,505,226) |
| Year Ended November 30 | 2018 | 2017 |
| Class B Shares: | Shares | Amount | Shares | Amount |
| Shares sold | 18,555 | $524,312 | 102,338 | $2,415,464 |
| Shares issued to shareholders in payment of distributions declared | 58,021 | 1,466,278 | 52,133 | 1,220,463 |
| Shares redeemed | (400,718) | (10,176,479) | (616,804) | (14,699,164) |
NET CHANGE RESULTING FROM
CLASS B SHARE TRANSACTIONS | (324,142) | $(8,185,889) | (462,333) | $(11,063,237) |
| Year Ended November 30 | 2018 | 2017 |
| Class C Shares: | Shares | Amount | Shares | Amount |
| Shares sold | 179,752 | $4,572,695 | 366,105 | $8,678,327 |
| Shares issued to shareholders in payment of distributions declared | 121,330 | 3,072,613 | 102,493 | 2,404,043 |
| Shares redeemed | (1,987,467) | (51,015,887) | (1,283,413) | (30,486,439) |
NET CHANGE RESULTING FROM
CLASS C SHARE TRANSACTIONS | (1,686,385) | $(43,370,579) | (814,815) | $(19,404,069) |
| Year Ended November 30 | 2018 | 2017 |
| Class F Shares: | Shares | Amount | Shares | Amount |
| Shares sold | 134,389 | $3,433,461 | 208,553 | $4,987,236 |
| Shares issued to shareholders in payment of distributions declared | 91,335 | 2,317,165 | 72,433 | 1,709,026 |
| Shares redeemed | (324,367) | (8,287,470) | (439,070) | (10,506,879) |
NET CHANGE RESULTING FROM
CLASS F SHARE TRANSACTIONS | (98,643) | $(2,536,844) | (158,084) | $(3,810,617) |
Annual Shareholder Report
| Year Ended November 30 | 2018 | 2017 |
| Class R Shares: | Shares | Amount | Shares | Amount |
| Shares sold | 156,832 | $4,002,767 | 167,753 | $4,008,819 |
| Shares issued to shareholders in payment of distributions declared | 38,798 | 983,948 | 32,030 | 755,278 |
| Shares redeemed | (258,605) | (6,569,142) | (324,059) | (7,735,743) |
NET CHANGE RESULTING FROM
CLASS R SHARE TRANSACTIONS | (62,975) | $(1,582,427) | (124,276) | $(2,971,646) |
| Year Ended November 30 | 2018 | 2017 |
| Institutional Shares: | Shares | Amount | Shares | Amount |
| Shares sold | 1,432,413 | $36,663,699 | 1,176,957 | $27,841,949 |
| Shares issued to shareholders in payment of distributions declared | 219,027 | 5,551,498 | 182,538 | 4,307,310 |
| Shares redeemed | (2,263,429) | (58,189,710) | (2,006,979) | (47,236,509) |
NET CHANGE RESULTING FROM
INSTITUTIONAL SHARE TRANSACTIONS | (611,989) | $(15,974,513) | (647,484) | $(15,087,250) |
NET CHANGE RESULTING FROM
TOTAL FUND SHARE TRANSACTIONS | (4,158,553) | $(106,583,964) | (6,473,120) | $(154,842,045) |
4. FEDERAL TAX INFORMATION
The tax character of distributions as reported on the Statement of Changes in Net Assets for the years ended November 30, 2018 and 2017, was as follows:
| | 2018 | 2017 |
| Ordinary income | $32,817,465 | $22,365,208 |
| Long-term capital gains | $23,486,662 | $21,195,195 |
As of November 30, 2018, the components of distributable earnings on a tax-basis were as follows:
| Undistributed ordinary income | $34,660,701 |
| Undistributed long-term capital gains | $96,446,013 |
| Net unrealized appreciation | $83,303,675 |
| Capital loss deferrals | $(1,468,809) |
The difference between book-basis and tax-basis net unrealized appreciation/depreciation is attributable to differing treatments for deferral of losses on wash sales, mark to market of futures contracts and deferral of straddle loss and partnership adjustments.
At November 30, 2018, the cost of investments for federal tax purposes was $916,385,822. The net unrealized appreciation of investments for federal tax purposes was $81,834,866. This consists of net unrealized appreciation from investments for those securities having an excess of value over cost of $128,195,525 and net unrealized depreciation from investments for those securities having an excess of cost over value of $46,360,659. The amounts presented are inclusive of derivative contracts.
At November 30, 2018, for federal income tax purposes, the Fund had $1,468,809 in straddle loss deferrals.
Annual Shareholder Report
5. INVESTMENT ADVISER FEE AND OTHER TRANSACTIONS WITH AFFILIATES
Investment Adviser Fee
The advisory agreement between the Fund and the Adviser provides for an annual fee equal to 0.60% of the Fund's average daily net assets. Subject to the terms described in the Expense Limitation note, the Adviser may voluntarily choose to waive any portion of its fee.
The Adviser has agreed to reimburse the Fund for certain investment adviser fees as a result of transactions in other affiliated investment companies. For the year ended November 30, 2018, the Adviser reimbursed $9,135.
For the year ended November 30, 2018, the Adviser voluntarily reimbursed $5,753 of transfer agent fees.
Administrative Fee
Federated Administrative Services (FAS), under the Administrative Services Agreement, provides the Fund with administrative personnel and services. For purposes of determining the appropriate rate breakpoint, “Investment Complex” is defined as all of the Federated Funds subject to a fee under the Administrative Services Agreement. The fee paid to FAS is based on the average daily net assets of the Investment Complex as specified below:
| Administrative Fee | Average Daily Net Assets
of the Investment Complex |
| 0.100% | on assets up to $50 billion |
| 0.075% | on assets over $50 billion |
Subject to the terms described in the Expense Limitation note, FAS may voluntarily choose to waive any portion of its fee. For the year ended November 30, 2018, the annualized fee paid to FAS was 0.080% of average daily net assets of the Fund.
Prior to September 1, 2017, the breakpoints of the Administrative Fee paid to FAS, described above, were:
| Administrative Fee | Average Daily Net Assets
of the Investment Complex |
| 0.150% | on the first $5 billion |
| 0.125% | on the next $5 billion |
| 0.100% | on the next $10 billion |
| 0.075% | on assets in excess of $20 billion |
In addition, FAS may charge certain out-of-pocket expenses to the Fund.
Annual Shareholder Report
Distribution Services Fee
The Fund has adopted a Distribution Plan (the “Plan”) pursuant to Rule 12b-1 under the Act. Under the terms of the Plan, the Fund will compensate Federated Securities Corp. (FSC), the principal distributor, from the daily net assets of the Fund's Class A Shares, Class B Shares, Class C Shares, Class F Shares and Class R Shares to finance activities intended to result in the sale of these shares. The Plan provides that the Fund may incur distribution expenses at the following percentages of average daily net assets annually, to compensate FSC:
| Share Class Name | Percentage of Average Daily
Net Assets of Class |
| Class A Shares | 0.05% |
| Class B Shares | 0.75% |
| Class C Shares | 0.75% |
| Class F Shares | 0.25% |
| Class R Shares | 0.50% |
Subject to the terms described in the Expense Limitation note, FSC may voluntarily choose to waive any portion of its fee. For the year ended November 30, 2018, distribution services fees for the Fund were as follows:
| | Distribution Services
Fees Incurred | Distribution Services
Fees Waived |
| Class B Shares | $262,895 | $— |
| Class C Shares | 477,541 | — |
| Class F Shares | 128,890 | — |
| Class R Shares | 103,472 | (51,735) |
| TOTAL | $972,798 | $(51,735) |
When FSC receives fees, it may pay some or all of them to financial intermediaries whose customers purchase shares. For the year ended November 30, 2018, FSC retained $358,691 of fees paid by the Fund. For the year ended November 30, 2018, the Fund's Class A Shares did not incur a distribution services fee; however, it may begin to incur this fee upon approval of the Directors.
Sales Charges
Front-end sales charges and contingent deferred sales charges (CDSC) do not represent expenses of the Fund. They are deducted from the proceeds of sales of Fund shares prior to investment or from redemption proceeds prior to remittance, as applicable. For the year ended November 30, 2018, FSC retained $26,891 in sales charges from the sale of Class A Shares. FSC also retained $617, $39,020, $1,822 and $14,400 of CDSC relating to redemptions of Class A Shares, Class B Shares, Class C Shares and Class F Shares, respectively.
Other Service Fees
For the year ended November 30, 2018, FSSC received $288,147 of the other service fees disclosed in Note 2.
Annual Shareholder Report
Expense Limitation
The Adviser and certain of its affiliates (which may include FSC, FAS and FSSC) on their own initiative have agreed to waive certain amounts of their respective fees and/or reimburse expenses. Effective February 1, 2019, total annual fund operating expenses (as shown in the financial highlights, excluding interest expense, extraordinary expenses and proxy-related expenses paid by the Fund, if any) paid by the Fund's Class R Shares (after the voluntary waivers and/or reimbursements) will not exceed 1.35% (the “Fee Limit”) up to but not including the later of (the “Termination Date”): (a) February 1, 2020; or (b) the date of the Fund's next effective Prospectus. While the Adviser and its applicable affiliates currently do not anticipate terminating or increasing these arrangements prior to the Termination Date, these arrangements may only be terminated or the Fee Limit increased prior to the Termination Date with the agreement of the Directors.
Interfund Transactions
During the year ended November 30, 2018, the Fund engaged in purchase and sale transactions with funds that have a common investment adviser (or affiliated investment advisers), common Directors/Trustees and/or common Officers. These purchase and sale transactions complied with Rule 17a-7 under the Act and amounted to $13,953,069 and $8,079,312, respectively.
Directors'/Trustees' and Miscellaneous Fees
Certain Officers and Directors of the Fund are Officers and Directors or Trustees of certain of the above companies. To efficiently facilitate payment, Directors'/Trustees' fees and certain expenses related to conducting meetings of the Directors/Trustees and other miscellaneous expenses are paid by an affiliate of the Adviser which in due course are reimbursed by the Fund. These expenses related to conducting meetings of the Directors/Trustees and other miscellaneous expenses may be included in Accrued and Miscellaneous Expenses on the Statement of Assets and Liabilities and Statement of Operations, respectively.
6. INVESTMENT TRANSACTIONS
Purchases and sales of investments, excluding long-term U.S. government securities and short-term obligations, for the year ended November 30, 2018, were as follows:
| Purchases | $1,458,184,837 |
| Sales | $1,537,745,706 |
7. concentration of risk
The Fund may invest a portion of its assets in securities of companies that are deemed by the Fund's management to be classified in similar business sectors. Economic developments may have an effect on the liquidity and volatility of the portfolio securities.
8. LINE OF CREDIT
The Fund participates with certain other Federated Funds, on a several basis, in an up to $500,000,000 unsecured, 364-day, committed, revolving line of credit (LOC) agreement. The LOC was made available to finance temporarily the repurchase or redemption of shares of the Fund, failed trades, payment of dividends, settlement of trades and for other short-term, temporary or emergency general business purposes. The Fund cannot borrow under the LOC if an inter-fund loan is outstanding. The Fund's ability to borrow under the LOC also is subject to the limitations of the Act and various conditions precedent that must be satisfied before the
Annual Shareholder Report
Fund can borrow. Loans under the LOC are charged interest at a fluctuating rate per annum equal to the highest, on any day, of (a) (i) the federal funds effective rate, (ii) the one month London Interbank Offered Rate (LIBOR), and (iii) 0.0%, plus (b) a margin. The LOC also requires the Fund to pay, quarterly in arrears and at maturity, its pro rata share of a commitment fee based on the amount of the lenders' commitment that has not been utilized. As of November 30, 2018, the Fund had no outstanding loans. During the year ended November 30, 2018, the Fund did not utilize the LOC.
9. INTERFUND LENDING
Pursuant to an Exemptive Order issued by the SEC, the Fund, along with other funds advised by subsidiaries of Federated Investors, Inc., may participate in an interfund lending program. This program provides an alternative credit facility allowing the Fund to borrow from other participating affiliated funds. As of November 30, 2018, there were no outstanding loans. During the year ended November 30, 2018, the program was not utilized.
10. FEDERAL TAX INFORMATION (UNAUDITED)
For the year ended November 30, 2018, the amount of long-term capital gains designated by the Fund was $23,486,662.
For the fiscal year ended November 30, 2018, 85.86% of total ordinary income distributions made by the Fund are qualifying dividends which may be subject to a maximum tax rate of 15%, as provided for by the Jobs and Growth Tax Relief Act of 2003. Complete information is reported in conjunction with the reporting of your distributions on Form 1099-DIV.
Of the ordinary income distributions made by the Fund during the year ended November 30, 2018, 71.84% qualify for the dividend received deduction available to corporate shareholders.
Annual Shareholder Report
Report of Independent Registered Public Accounting Firm
TO THE BOARD OF DIRECTORS AND SHAREHOLDERS OF Federated equity income fund, inc.:
Opinion on the Financial Statements
We have audited the accompanying statement of assets and liabilities of Federated Equity Income Fund, Inc. (the “Fund”), including the portfolio of investments, as of November 30, 2018, and the related statement of operations for the year then ended, the statement of changes in net assets for each of the two years in the period then ended, the financial highlights for each of the five years in the period then ended and the related notes (collectively referred to as the “financial statements”). In our opinion, the financial statements present fairly, in all material respects, the financial position of the Fund at November 30, 2018, the results of its operations for the year then ended, the changes in its net assets for each of the two years in the period then ended and its financial highlights for each of the five years in the period then ended, in conformity with U.S. generally accepted accounting principles.
Basis for Opinion
These financial statements are the responsibility of the Fund's management. Our responsibility is to express an opinion on the Fund's financial statements based on our audits. We are a public accounting firm registered with the Public Company Accounting Oversight Board (United States) (“PCAOB”) and are required to be independent with respect to the Fund in accordance with the U.S. federal securities laws and the applicable rules and regulations of the Securities and Exchange Commission and the PCAOB.
We conducted our audits in accordance with standards of the PCAOB. Those standards require that we plan and perform the audit to obtain reasonable assurance about whether the financial statements are free of material misstatement, whether due to error or fraud. The Fund is not required to have, nor were we engaged to perform, an audit of the Fund's internal control over financial reporting. As part of our audits, we are required to obtain an understanding of internal control over financial reporting, but not for the purpose of expressing an opinion on the effectiveness of the Fund's internal control over financial reporting. Accordingly, we express no such opinion.
Annual Shareholder Report
Our audits included performing procedures to assess the risks of material misstatement of the financial statements, whether due to error or fraud, and performing procedures that respond to those risks. Such procedures included examining, on a test basis, evidence regarding the amounts and disclosures in the financial statements. Our procedures included confirmation of securities owned as of November 30, 2018, by correspondence with the custodian and others or by other appropriate auditing procedures where replies from others were not received. Our audits also included evaluating the accounting principles used and significant estimates made by management, as well as evaluating the overall presentation of the financial statements. We believe that our audits provide a reasonable basis for our opinion.
We have served as the auditor of one or more Federated investment companies since 1979.
Boston, Massachusetts
January 23, 2019
Annual Shareholder Report
Shareholder Expense Example (unaudited)
As a shareholder of the Fund, you incur two types of costs: (1) transaction costs, including sales charges (loads) on purchase or redemption payments; and (2) ongoing costs, including management fees and to the extent applicable, distribution (12b-1) fees and/or other service fees and other Fund expenses. This Example is intended to help you to understand your ongoing costs (in dollars) of investing in the Fund and to compare these costs with the ongoing costs of investing in other mutual funds. It is based on an investment of $1,000 invested at the beginning of the period and held for the entire period from June 1, 2018 to November 30, 2018.
ACTUAL EXPENSES
The first section of the table below provides information about actual account values and actual expenses. You may use the information in this section, together with the amount you invested, toestimate the expenses that you incurred over the period. Simply divide your account value by $1,000 (for example, an $8,600 account value divided by $1,000 = 8.6), then multiply the result by the number in the first section under the heading entitled “Expenses Paid During Period” to estimate the expenses attributable to your investment during this period.
HYPOTHETICAL EXAMPLE FOR COMPARISON PURPOSES
The second section of the table below provides information about hypothetical account values and hypothetical expenses based on the Fund's actual expense ratio and anassumed rate of return of 5% per year before expenses, which is not the Fund's actual return. Thus, you shouldnot use the hypothetical account values and expenses to estimate the actual ending account balance or your expenses for the period. Rather, these figures are required to be provided to enable you to compare the ongoing costs of investing in the Fund with other funds. To do so, compare this 5% hypothetical example with the 5% hypothetical examples that appear in the shareholder reports of the other funds.
Annual Shareholder Report
Please note that the expenses shown in the table are meant to highlight your ongoing costs only and do not reflect any transaction costs, such as sales charges (loads) on purchase or redemption payments. Therefore, the second section of the table is useful in comparing ongoing costs only, and will not help you determine the relativetotal costs of owning different funds. In addition, if these transaction costs were included, your costs would have been higher.
| | Beginning
Account Value
6/1/2018 | Ending
Account Value
11/30/2018 | Expenses Paid
During Period1 |
| Actual: | | | |
| Class A Shares | $1,000 | $971.50 | $5.54 |
| Class B Shares | $1,000 | $967.50 | $9.42 |
| Class C Shares | $1,000 | $967.80 | $9.32 |
| Class F Shares | $1,000 | $970.20 | $6.82 |
| Class R Shares | $1,000 | $970.10 | $6.52 |
| Institutional Shares | $1,000 | $972.70 | $4.40 |
Hypothetical (assuming a 5% return
before expenses): | | | |
| Class A Shares | $1,000 | $1,019.50 | $5.67 |
| Class B Shares | $1,000 | $1,015.50 | $9.65 |
| Class C Shares | $1,000 | $1,015.60 | $9.55 |
| Class F Shares | $1,000 | $1,018.20 | $6.98 |
| Class R Shares | $1,000 | $1,018.50 | $6.68 |
| Institutional Shares | $1,000 | $1,020.60 | $4.51 |
| 1 | Expenses are equal to the Fund's annualized net expense ratios, multiplied by the average account value over the period, multiplied by 183/365 (to reflect the one-half-year period). The annualized net expense ratios are as follows: |
| | |
| Class A Shares | 1.12% |
| Class B Shares | 1.91% |
| Class C Shares | 1.89% |
| Class F Shares | 1.38% |
| Class R Shares | 1.32% |
| Institutional Shares | 0.89% |
Annual Shareholder Report
In Memoriam
With profound sadness, Federated announces the passing of Richard B. (“Dick”) Fisher. He will be greatly missed.
RICHARD B. FISHER
(Former Officer of the Federated Funds, Chairman of Federated Securities Corp., and Vice Chairman of Federated Investors, Inc.)
Dick Fisher, along with John F. (“Jack”) Donahue and Thomas J. Donnelly, Esq., co-founded Federated in 1955 and served as a leader, particularly for Federated's sales division, and an officer of the Federated Funds. Mr. Fisher was a family man of deep faith, with exemplary character, prodigious generosity, immeasurable devotion, undeniable charm and a good sense of humor. He served his religion, family, community, and the Federated Funds and Federated, as well as their shareholders, officers and employees, with distinction. His integrity, intelligence, and keen sense of duty to shareholders, coupled with his faith and devotion to family, allowed him to become the consummate gentleman and salesman par excellence who will be greatly missed. Among his many achievements, Mr. Fisher led the sales strategy and execution for Federated's Fund for U.S. Government Securities, the first fund to invest exclusively in government bonds, and spearheaded the campaign for sales of Federated's Government Income Securities Fund, the first of what would become Federated's Fortress family of funds. Federated expresses deep gratitude to Mr. Fisher for his inspiring leadership, distinguished service and contributions as a husband, father, co-founder, officer, colleague and friend.
Board of Directors and Corporation Officers
The Board of Directors is responsible for managing the Corporation's business affairs and for exercising all the Corporation's powers except those reserved for the shareholders. The following tables give information about each Director and the senior officers of the Fund. Where required, the tables separately list Directors who are “interested persons” of the Fund (i.e., “Interested” Directors) and those who are not (i.e., “Independent” Directors). Unless otherwise noted, the address of each person listed is Federated Investors Tower, 1001 Liberty Avenue, Pittsburgh, PA 15222. The address of all Independent Directors listed is 4000 Ericsson Drive, Warrendale, PA 15086-7561; Attention: Mutual Fund Board. As of December 31, 2018, the Corporation comprised one portfolio(s), and the Federated Fund Family consisted of 40 investment companies (comprising 102 portfolios). Unless otherwise noted, each Officer is elected annually. Unless otherwise noted, each Director oversees all portfolios in the Federated Fund Family and serves for an indefinite term. The Fund's Statement of Additional Information includes additional information about Corporation Directors and is available, without charge and upon request, by calling 1-800-341-7400.
Annual Shareholder Report
Interested DIRECTORS Background
Name
Birth Date
Positions Held with Fund
Date Service Began | Principal Occupation(s) for Past Five Years,
Other Directorships Held and Previous Position(s) |
J. Christopher Donahue*
Birth Date: April 11, 1949
President and Director
Indefinite Term
Began serving: June 1986 | Principal Occupations: Principal Executive Officer and President of certain of the Funds in the Federated Fund Family; Director or Trustee of the Funds in the Federated Fund Family; President, Chief Executive Officer and Director, Federated Investors, Inc.; Chairman and Trustee, Federated Investment Management Company; Trustee, Federated Investment Counseling; Chairman and Director, Federated Global Investment Management Corp.; Chairman and Trustee, Federated Equity Management Company of Pennsylvania; Trustee, Federated Shareholder Services Company; Director, Federated Services Company.
Previous Positions: President, Federated Investment Counseling; President and Chief Executive Officer, Federated Investment Management Company, Federated Global Investment Management Corp. and Passport Research, Ltd; Chairman, Passport Research, Ltd. |
John B. Fisher*
Birth Date: May 16, 1956
Director
Indefinite Term
Began serving: May 2016 | Principal Occupations:Principal Executive Officer and President of certain of the Funds in the Federated Fund Family; Director or Trustee of certain of the Funds in the Federated Fund Family; Vice President, Federated Investors, Inc.; President, Director/Trustee and CEO, Federated Advisory Services Company, Federated Equity Management Company of Pennsylvania, Federated Global Investment Management Corp., Federated Investment Counseling, Federated Investment Management Company; President of some of the Funds in the Federated Fund Complex and Director, Federated Investors Trust Company.
Previous Positions: President and Director of the Institutional Sales Division of Federated Securities Corp.; President and Director of Federated Investment Counseling; President and CEO of Passport Research, Ltd.; Director, Edgewood Securities Corp.; Director, Federated Services Company; Director, Federated Investors, Inc.; Chairman and Director, Southpointe Distribution Services, Inc. and President, Technology, Federated Services Company. |
| * | Reasons for “interested” status: J. Christopher Donahue and John B. Fisher are interested due to their beneficial ownership of shares of Federated Investors, Inc. and due to positions they hold with Federated and its subsidiaries. |
Annual Shareholder Report
INDEPENDENT DIRECTORS Background
Name
Birth Date
Positions Held with Fund
Date Service Began | Principal Occupation(s) for Past Five Years,
Other Directorships Held, Previous Position(s) and Qualifications |
John T. Collins
Birth Date: January 24, 1947
Director
Indefinite Term
Began serving: October 2013 | Principal Occupations: Director or Trustee of the Federated Fund Family; formerly, Chairman and CEO, The Collins Group, Inc. (a private equity firm) (Retired).
Other Directorships Held: Director, Chairman of the Compensation Committee, KLX Energy Services Holdings, Inc. (oilfield services); former Director of KLX Corp. (aerospace).
Qualifications: Mr. Collins has served in several business and financial management roles and directorship positions throughout his career. Mr. Collins previously served as Chairman and CEO of The Collins Group, Inc. (a private equity firm) and as a Director of KLX Corp. Mr. Collins serves as Chairman Emeriti, Bentley University. Mr. Collins previously served as Director and Audit Committee Member, Bank of America Corp.; Director, FleetBoston Financial Corp.; and Director, Beth Israel Deaconess Medical Center (Harvard University Affiliate Hospital). |
G. Thomas Hough
Birth Date: February 28, 1955
Director
Indefinite Term
Began serving: August 2015 | Principal Occupations: Director or Trustee of the Federated Fund Family; formerly, Vice Chair, Ernst & Young LLP (public accounting firm) (Retired).
Other Directorships Held: Director, Member of Governance and Compensation Committees, Publix Super Markets, Inc.; Director, Chair of the Audit Committee, Equifax, Inc.; Director, Member of the Audit Committee, Haverty Furniture Companies, Inc.
Qualifications: Mr. Hough has served in accounting, business management and directorship positions throughout his career. Mr. Hough most recently held the position of Americas Vice Chair of Assurance with Ernst & Young LLP (public accounting firm). Mr. Hough serves on the President's Cabinet and Business School Board of Visitors for the University of Alabama and is on the Business School Board of Visitors for Wake Forest University. Mr. Hough previously served as an Executive Committee member of the United States Golf Association. |
Annual Shareholder Report
Name
Birth Date
Positions Held with Fund
Date Service Began | Principal Occupation(s) for Past Five Years,
Other Directorships Held, Previous Position(s) and Qualifications |
Maureen Lally-Green
Birth Date: July 5, 1949
Director
Indefinite Term
Began serving: August 2009 | Principal Occupations: Director or Trustee of the Federated Fund Family; Dean of the Duquesne University School of Law; Professor and Adjunct Professor of Law, Duquesne University School of Law; formerly, Interim Dean of the Duquesne University School of Law; formerly, Associate General Secretary and Director, Office of Church Relations, Diocese of Pittsburgh.
Other Directorships Held: Director, CNX Resources Corporation (formerly known as CONSOL Energy Inc.).
Qualifications: Judge Lally-Green has served in various legal and business roles and directorship positions throughout her career and currently serves as the Dean of the School of Law of Duquesne University. Judge Lally-Green previously served as a member of the Superior Court of Pennsylvania and as a Professor of Law, Duquesne University School of Law. Judge Lally-Green also currently holds the positions on not for profit or for profit boards of directors as follows: Director and Chair, UPMC Mercy Hospital; Director and Vice Chair, Our Campaign for the Church Alive!, Inc.; Regent, Saint Vincent Seminary; Member, Pennsylvania State Board of Education (public); and Director CNX Resources Corporation (formerly known as CONSOL Energy Inc.). Judge Lally-Green has held the positions of: Director, Auberle; Director, Epilepsy Foundation of Western and Central Pennsylvania; Director, Ireland Institute of Pittsburgh; Director, Saint Thomas More Society; Director and Chair, Catholic High Schools of the Diocese of Pittsburgh, Inc.; Director, Pennsylvania Bar Institute; Director, St. Vincent College; and Director and Chair, North Catholic High School, Inc. |
Charles F. Mansfield, Jr.
Birth Date: April 10, 1945
Director
Indefinite Term
Began serving: January 1999 | Principal Occupations: Director or Trustee of the Federated Fund Family; Management Consultant and Author.
Other Directorships Held: None.
Qualifications: Mr. Mansfield has served as a Marine Corps officer and in several banking, business management, educational roles and directorship positions throughout his long career. He remains active as a Management Consultant and Author. |
Annual Shareholder Report
Name
Birth Date
Positions Held with Fund
Date Service Began | Principal Occupation(s) for Past Five Years,
Other Directorships Held, Previous Position(s) and Qualifications |
Thomas M. O'Neill
Birth Date: June 14, 1951
Director
Indefinite Term
Began serving: August 2006 | Principal Occupations: Director or Trustee, Chair of the Audit Committee of the Federated Fund Family; Sole Proprietor, Navigator Management Company (investment and strategic consulting).
Other Directorships Held: None.
Qualifications: Mr. O'Neill has served in several business, mutual fund and financial management roles and directorship positions throughout his career. Mr. O'Neill serves as Director, Medicines for Humanity and Director, The Golisano Children's Museum of Naples, Florida. Mr. O'Neill previously served as Chief Executive Officer and President, Managing Director and Chief Investment Officer, Fleet Investment Advisors; President and Chief Executive Officer, Aeltus Investment Management, Inc.; General Partner, Hellman, Jordan Management Co., Boston, MA; Chief Investment Officer, The Putnam Companies, Boston, MA; Credit Analyst and Lending Officer, Fleet Bank; Director and Consultant, EZE Castle Software (investment order management software); and Director, Midway Pacific (lumber). |
P. Jerome Richey
Birth Date: February 23, 1949
Director
Indefinite Term
Began serving: October 2013 | Principal Occupations: Director or Trustee of the Federated Fund Family; Management Consultant; Retired; formerly, Senior Vice Chancellor and Chief Legal Officer, University of Pittsburgh and Executive Vice President and Chief Legal Officer, CNX Resources Corporation (formerly known as CONSOL Energy Inc.).
Other Directorships Held: None.
Qualifications: Mr. Richey has served in several business and legal management roles and directorship positions throughout his career. Mr. Richey most recently held the positions of Senior Vice Chancellor and Chief Legal Officer, University of Pittsburgh. Mr. Richey previously served as Chairman of the Board, Epilepsy Foundation of Western Pennsylvania and Chairman of the Board, World Affairs Council of Pittsburgh. Mr. Richey previously served as Chief Legal Officer and Executive Vice President, CNX Resources Corporation (formerly known as CONSOL Energy Inc.); and Board Member, Ethics Counsel and Shareholder, Buchanan Ingersoll & Rooney PC (a law firm). |
John S. Walsh
Birth Date: November 28, 1957
Director
Indefinite Term
Began serving: January 1999 | Principal Occupations: Director or Trustee, and Chair of the Board of Directors or Trustees, of the Federated Fund Family; President and Director, Heat Wagon, Inc. (manufacturer of construction temporary heaters); President and Director, Manufacturers Products, Inc. (distributor of portable construction heaters); President, Portable Heater Parts, a division of Manufacturers Products, Inc.
Other Directorships Held: None.
Qualifications: Mr. Walsh has served in several business management roles and directorship positions throughout his career. Mr. Walsh previously served as Vice President, Walsh & Kelly, Inc. (paving contractors). |
Annual Shareholder Report
OFFICERS
Name
Birth Date
Address
Positions Held with Fund
Date Service Began | Principal Occupation(s) for Past Five Years
and Previous Position(s) |
Lori A. Hensler
Birth Date: January 6, 1967
TREASURER
Officer since: April 2013 | Principal Occupations: Principal Financial Officer and Treasurer of the Federated Fund Family; Senior Vice President, Federated Administrative Services; Financial and Operations Principal for Federated Securities Corp. and Edgewood Services, Inc.; and Assistant Treasurer, Federated Investors Trust Company. Ms. Hensler has received the Certified Public Accountant designation.
Previous Positions: Controller of Federated Investors, Inc.; Senior Vice President and Assistant Treasurer, Federated Investors Management Company; Treasurer, Federated Investors Trust Company; Assistant Treasurer, Federated Administrative Services, Federated Administrative Services, Inc., Federated Securities Corp., Edgewood Services, Inc., Federated Advisory Services Company, Federated Equity Management Company of Pennsylvania, Federated Global Investment Management Corp., Federated Investment Counseling, Federated Investment Management Company, Passport Research, Ltd., and Federated MDTA, LLC; Financial and Operations Principal for Federated Securities Corp., Edgewood Services, Inc. and Southpointe Distribution Services, Inc. |
Peter J. Germain
Birth Date: September 3, 1959
CHIEF LEGAL OFFICER, SECRETARY and EXECUTIVE VICE PRESIDENT
Officer since: January 2005 | Principal Occupations: Mr. Germain is Chief Legal Officer, Secretary and Executive Vice President of the Federated Fund Family. He is General Counsel, Chief Legal Officer, Secretary and Executive Vice President, Federated Investors, Inc.; Trustee and Senior Vice President, Federated Investors Management Company; Trustee and President, Federated Administrative Services; Director and President, Federated Administrative Services, Inc.; Director and Vice President, Federated Securities Corp.; Director and Secretary, Federated Private Asset Management, Inc.; Secretary, Federated Shareholder Services Company; and Secretary, Retirement Plan Service Company of America. Mr. Germain joined Federated in 1984 and is a member of the Pennsylvania Bar Association.
Previous Positions: Deputy General Counsel, Special Counsel, Managing Director of Mutual Fund Services, Federated Investors, Inc.; Senior Vice President, Federated Services Company; and Senior Corporate Counsel, Federated Investors, Inc. |
Stephen Van Meter
Birth Date: June 5, 1975
CHIEF COMPLIANCE OFFICER AND SENIOR VICE PRESIDENT
Officer since: July 2015 | Principal Occupations: Senior Vice President and Chief Compliance Officer of the Federated Fund Family; Vice President and Chief Compliance Officer of Federated Investors, Inc. and Chief Compliance Officer of certain of its subsidiaries. Mr. Van Meter joined Federated in October 2011. He holds FINRA licenses under Series 3, 7, 24 and 66.
Previous Positions: Mr. Van Meter previously held the position of Compliance Operating Officer, Federated Investors, Inc. Prior to joining Federated, Mr. Van Meter served at the United States Securities and Exchange Commission in the positions of Senior Counsel, Office of Chief Counsel, Division of Investment Management and Senior Counsel, Division of Enforcement. |
Annual Shareholder Report
Name
Birth Date
Address
Positions Held with Fund
Date Service Began | Principal Occupation(s) for Past Five Years
and Previous Position(s) |
Stephen F. Auth
Birth Date: September 13, 1956
101 Park Avenue
41st Floor
New York, NY 10178
CHIEF INVESTMENT OFFICER
Officer since: November 2002 | Principal Occupations: Stephen F. Auth is Chief Investment Officer of various Funds in the Federated Fund Family; Executive Vice President, Federated Investment Counseling, Federated Global Investment Management Corp. and Federated Equity Management Company of Pennsylvania.
Previous Positions: Executive Vice President, Federated Investment Management Company and Passport Research, Ltd. (investment advisory subsidiary of Federated); Senior Vice President, Global Portfolio Management Services Division; Senior Vice President, Federated Investment Management Company and Passport Research, Ltd.; Senior Managing Director and Portfolio Manager, Prudential Investments. |
Annual Shareholder Report
Evaluation and Approval of Advisory Contract–May 2018
Federated Equity Income Fund, Inc. (the “Fund”)
At its meetings in May 2018, the Fund's Board of Directors (the “Board”), including a majority of those Directors who are not “interested persons” of the Fund, as defined in the Investment Company Act of 1940 (the “Independent Directors”), reviewed and unanimously approved the continuation of the Fund's investment advisory contract for an additional one-year term. The Board's decision regarding the contract reflects the exercise of its business judgment after considering all of the information received on whether to continue the existing arrangements.
The Board had previously appointed a Senior Officer, whose duties included specified responsibilities relating to the process by which advisory fees are to be charged to a fund advised by Federated Equity Management Company of Pennsylvania (the “Adviser”) or its affiliates (collectively, “Federated”) (each, a “Federated fund”). The Senior Officer's responsibilities included preparing and furnishing to the Board an annual independent written evaluation that covered topics discussed below. In December 2017, the Senior Officer position was eliminated. Notwithstanding the elimination of the Senior Officer position, at the request of the Independent Directors, the Fund's Chief Compliance Officer (the CCO) furnished to the Board in advance of its May 2018 meetings an independent written evaluation covering substantially the same topics that had been covered in the Senior Officer's written evaluation in prior years. The Board considered the CCO's independent written evaluation (the “CCO Fee Evaluation Report”), along with other information, in evaluating the reasonableness of the Fund's management fee and in deciding to approve the continuation of the investment advisory contract. Consistent with the former Senior Officer position, the CCO, in preparing the CCO Fee Evaluation Report, has the authority to retain consultants, experts or staff as reasonably necessary to assist in the performance of his duties, reports directly to the Board, and can be terminated only with the approval of a majority of the Independent Directors.
The Board also considered judicial decisions concerning allegedly excessive investment advisory fees in making its decision. Using these judicial decisions as a guide, the Board observed that the following factors may be relevant to an adviser's fiduciary duty with respect to its receipt of compensation from a fund: (1) the nature and quality of the services provided by an adviser to a fund and its shareholders (including the performance of the fund, its benchmark, and comparable funds); (2) an adviser's cost of providing the services (including the profitability to an adviser of providing advisory services to a fund); (3) the extent to which an adviser may realize “economies of scale” as a fund grows larger and, if such economies of scale exist, whether they have been shared with a fund and its shareholders or the family of funds; (4) any “fall-out” financial benefits
Annual Shareholder Report
that accrue to an adviser because of its relationship with a fund (including research services received from brokers that execute fund trades and any fees paid to affiliates of an adviser for services rendered to a fund); (5) comparative fee and expense structures (including a comparison of fees paid to an adviser with those paid by similar funds both internally and externally as well as management fees charged to institutional and other advisory clients of the Adviser or its affiliates for what might be viewed as like services); and (6) the extent of care, conscientiousness and independence with which the fund's board members perform their duties and their expertise (including whether they are fully informed about all facts the board deems relevant to its consideration of an adviser's services and fees). The Board noted that the Securities and Exchange Commission (SEC) disclosure requirements regarding the basis for the Board's approval of the Fund's investment advisory contract generally align with the factors listed above. The Board was aware of these factors and was guided by them in its review of the Fund's investment advisory contract to the extent it considered them to be appropriate and relevant, as discussed further below.
The Board considered and weighed these factors in light of its substantial accumulated experience in governing the Fund and working with Federated on matters relating to the Federated funds. The Independent Directors were assisted in their deliberations by independent legal counsel.
In addition to the extensive materials that comprise and accompany the CCO Fee Evaluation Report, the Board received detailed information about the Fund and the Federated organization throughout the year, and in connection with its May meetings at which the Board's formal approval of the advisory and subadvisory contracts occurred. In this regard, Federated provided much of this information at each regular meeting of the Board, and furnished additional information specifically in connection with the May meetings. In the months preceding the May meetings, the Board requested and reviewed written materials prepared by Federated in response to requests on behalf of the Independent Directors encompassing a wide variety of topics. At the May meetings, in addition to meeting in separate sessions of the Independent Directors without management present, senior management of the Adviser also met with the Independent Directors and their counsel to discuss the materials presented and such additional matters as the Independent Directors deemed reasonably necessary to evaluate the advisory and subadvisory contracts. Between regularly scheduled meetings, the Board also received information on particular matters as the need arose.
The Board's consideration of the investment advisory contract included review of the CCO Fee Evaluation Report, accompanying data and additional information covering the following matters, among others: the Adviser's investment philosophy, revenue, profitability, personnel and processes; investment and operating strategies; the Fund's short-term and long-term performance (in absolute terms, both on a gross basis and net of expenses, as well as in terms relative to its particular investment program and certain competitor or “peer
Annual Shareholder Report
group” funds and/or other benchmarks, as appropriate) and comments on the reasons for performance; the Fund's investment objectives; the Fund's expenses, including the advisory fee and the overall expense structure of the Fund (both in absolute terms and relative to similar and/or competing funds), with due regard for contractual or voluntary expense limitations; the use and allocation of brokerage commissions derived from trading the Fund's portfolio securities (if any); and the nature, quality and extent of the advisory and other services provided to the Fund by the Adviser and its affiliates. The Board also considered the preferences and expectations of Fund shareholders; the entrepreneurial and other risks assumed by the Adviser in sponsoring the Fund; the continuing state of competition in the mutual fund industry and market practices; the range of comparable fees for similar funds in the mutual fund industry; the Fund's relationship to the Federated funds which include a comprehensive array of funds with different investment objectives, policies and strategies which are generally available for exchange without the incurrence of additional sales charges; compliance and audit reports concerning the Federated funds and the Federated companies that service them (including communications from regulatory agencies), as well as Federated's responses to any issues raised therein; and relevant developments in the mutual fund industry and how the Federated funds and/or Federated are responding to them. The Board's evaluation process is evolutionary. The criteria considered and the emphasis placed on relevant criteria change in recognition of changing circumstances in the mutual fund marketplace.
While mindful that courts have cautioned against giving too much weight to comparative information concerning fees charged by other advisers for managing funds with comparable investment programs, the Board has found the use of such comparisons to be relevant to its deliberations. In this regard, the Board was presented with, and considered, information regarding the contractual advisory fee rates, net advisory fee rates, total expense ratios and each element of the Fund's total expense ratio (i.e., gross and net advisory fees, custody fees, portfolio accounting fees and transfer agency fees) relative to an appropriate group of peer funds compiled by Federated using data supplied by independent fund ranking organizations (the “Peer Group”). The Board received a description of the composition and methodology used to select the Peer Group. The Board focused on comparisons with other similar mutual funds more heavily than non-mutual fund products or services because it is believed that they are more relevant. For example, other mutual funds are the products most like the Fund, in that they are readily available to Fund shareholders as alternative investment vehicles. Also, they are the type of investment vehicle, in fact, chosen and maintained by the Fund's investors. The range of their fees and expenses, therefore, appears to be a relevant indicator of what consumers have found to be reasonable in the marketplace in which the Fund competes.
Annual Shareholder Report
The Board reviewed the contractual advisory fee rate and other expenses of the Fund and noted the position of the Fund's fee rates relative to its Peer Group. In this regard, the Board noted that the contractual advisory fee rate was below the median of the relevant Peer Group and the Board was satisfied that the overall expense structure of the Fund remained competitive.
For comparison, the CCO reviewed the fees charged by Federated for providing advisory services to products other than the Federated funds (e.g., institutional and separate accounts and third-party unaffiliated mutual funds for which Federated serves as sub-adviser) (referenced to as “Comparable Funds/Accounts”). With respect to Comparable Funds/Accounts other than third-party mutual funds, the CCO concluded that they are inherently different products. Those differences include, but are not limited to, different types of targeted investors; different applicable laws and regulations; different legal structures; different average account sizes and portfolio management techniques made necessary by different cash flows and different associated costs; and the time spent by portfolio managers and their teams, as well as personnel in the Funds Financial Services, Legal, Compliance and Risk Management departments, in reviewing securities pricing, addressing different administrative responsibilities, addressing different degrees of risk associated with management and a variety of different costs. The CCO also reviewed the differences in the nature of the services required for Federated to manage its proprietary mutual fund business versus managing a discrete pool of assets as a sub-adviser to another institution's mutual fund, and that Federated generally performs significant additional services and assumes substantially greater risk in managing the Fund and other Federated funds than in its role as sub-adviser to an unaffiliated third-party mutual fund. The CCO did not consider the fees for providing advisory services to Comparable Funds/Accounts to be determinative in judging the appropriateness of the Federated funds' advisory fees.
The CCO noted that the services, administrative responsibilities and risks associated with such relationships are quite different than serving as a primary adviser to a fund.
Following such evaluation, and full deliberations, the Board concluded that the fees and expenses of the Fund are reasonable and supported renewal of the Fund's investment advisory contract.
The Board considered the nature, extent and quality of the services provided to the Fund by the Adviser and the resources of the Adviser and its affiliates dedicated to the Fund. In this regard, the Board evaluated, among other things, the Adviser's personnel, experience, track record, overall reputation and willingness to invest in personnel and infrastructure that benefit the Fund. In addition, the Board reviewed the qualifications, backgrounds and responsibilities of the portfolio management team primarily responsible for the day-to-day management of the Fund and the Adviser's ability and experience in attracting and retaining qualified personnel to service the Fund. The Board noted the compliance program of the Adviser and the compliance-related resources
Annual Shareholder Report
provided to the Fund by the Adviser, including the Adviser's commitment to respond to rulemaking initiatives of the SEC. The Fund's ability to deliver competitive performance when compared to its Peer Group was also deemed to be relevant by the Board as a useful indicator of how the Adviser is executing the Fund's investment program. The Adviser's ability to execute this program was one of the Board's considerations in reaching a conclusion that the nature, extent and quality of the Adviser's investment management services warrant the continuation of the investment advisory contract.
In evaluating the Fund's investment performance, the Board considered performance results in light of the Fund's investment objective, strategies and risks, as disclosed in the Fund's prospectus. The Board considered detailed investment reports on the Fund's performance that were provided to the Board throughout the year and in connection with the May meetings. The CCO also reviewed information regarding the performance of other mutual funds in the Peer Group, noting the CCO's view that comparisons to fund peer groups may be helpful, though not conclusive, in evaluating the performance of the Adviser in managing the Fund. The Board considered, in evaluating such comparisons, that in some cases individual funds may exhibit significant and unique differences in their objectives and management techniques when compared to other funds within a Peer Group.
For the periods covered by the CCO Fee Evaluation Report, the Fund's performance for the one-year period was above the median of the relevant Peer Group, and the Fund's performance fell below the median of the relevant Peer Group for the three-year and five-year periods. The Board discussed the Fund's performance with the Adviser and recognized the efforts being taken by the Adviser in the context of other factors considered relevant by the Board.
Following such evaluation, and full deliberations, the Board concluded that the performance of the Fund supported renewal of the Fund's investment advisory contract.
The Board also received financial information about Federated, including information regarding the compensation and ancillary (or “fall-out”) benefits Federated derived from its relationships with the Federated funds. This information covered not only the fees under the investment advisory contracts, but also fees received by Federated's subsidiaries for providing other services to the Federated funds under separate contracts (e.g., for serving as the Federated funds' administrator and distributor). In this regard, the Board considered that certain Federated subsidiaries provide distribution and shareholder services to the Federated funds, for which they may be compensated through distribution and servicing fees paid pursuant to Rule 12b-1 plans or otherwise. The information also detailed any indirect benefit Federated may derive from its receipt of research services from brokers who execute Federated fund trades. In addition, the Board considered the fact that, in order for a Federated fund to be competitive in the marketplace, the Adviser and its affiliates frequently waived fees and/or reimbursed expenses and have disclosed to Federated fund investors
Annual Shareholder Report
and/or indicated to the Board their intention to do so in the future. Moreover, the Board receives regular reporting as to the institution, adjustment or elimination of these voluntary waivers. The Board considered Federated's previous reductions in contractual management fees to certain Federated funds in response to the CCO's recommendations.
Federated furnished information, requested by the CCO, that reported revenues on a fund-by-fund basis and made estimates of the allocation of expenses on a fund-by-fund basis, using allocation methodologies specified by the CCO. The CCO noted that, while these cost allocation reports apply consistent allocation processes, the inherent difficulties in allocating costs continues to cause the CCO to question the precision of the process and to conclude that such reports may be unreliable, since a single change in an allocation estimate may dramatically alter the resulting estimate of cost and/or profitability of a Federated fund and may produce unintended consequences. The allocation information, including the CCO's view that fund-by-fund estimations may be unreliable, was considered in the evaluation by the Board.
The Board and the CCO also reviewed information compiled by Federated comparing its profitability information to other publicly held fund management companies, including information regarding profitability trends over time. In this regard, the CCO concluded that Federated's profit margins did not appear to be excessive. The CCO also noted that Federated appeared financially sound, with the resources necessary to fulfill its obligations under its contracts with the Fund.
The CCO Fee Evaluation Report also discussed the notion of possible realization of “economies of scale” as a fund grows larger. In this regard, the Board considered that the Adviser has made significant and long-term investments in areas that support all of the Federated funds, such as personnel and processes for the portfolio management, shareholder services, compliance, internal audit and risk management functions, as well as systems technology (including technology relating to cybersecurity) and that the benefits of these efforts (as well as any economies of scale, should they exist) were likely to be shared with the Federated fund family as a whole. The Board noted that the Adviser's investments in these areas are extensive. In addition, the Board considered that the Adviser and its affiliates have frequently waived fees and/or reimbursed expenses and that this has allowed fund shareholders to share potential economies of scale with shareholders. The Board also considered that such waivers and reimbursements can provide protection from an increase in expenses if a Federated fund's assets decline. Federated, as it does throughout the year, and specifically in connection with the Board's review of the advisory and subadvisory contracts, furnished information relative to revenue sharing or adviser-paid fees. Federated and the CCO noted that this information should be viewed to determine if there was an incentive to either not apply breakpoints, or to apply breakpoints at higher levels, and should not be viewed to determine the appropriateness of advisory fees because it would represent marketing and
Annual Shareholder Report
distribution expenses. The Board also noted the absence of any applicable regulatory or industry guidelines on this subject, which (as discussed in the CCO Fee Evaluation Report) is compounded by the lack of any common industry practice or general pattern with respect to structuring fund advisory fees with “breakpoints” that serve to reduce the fee as a fund attains a certain size.
The CCO stated that his observations and the information accompanying the CCO Fee Evaluation Report supported a finding by the Board that the management fee for the Fund was reasonable. Under these circumstances, no changes were recommended to, and no objection was raised to the continuation of, the Fund's investment advisory contract. The CCO also recognized that the Board's evaluation of the Federated funds' advisory and subadvisory arrangements is a continuing and on-going process that is informed by the information that the Board requests and receives from management throughout the course of the year and, in this regard, the CCO noted certain items for future reporting to the Board or further consideration by management as the Board continues its on-going oversight of the Federated funds.
In its decision to continue an existing investment advisory contract, the Board was mindful of the potential disruptions of the Fund's operations and various risks, uncertainties and other effects that could occur as a result of a decision to terminate or not renew an investment advisory contract. In particular, the Board recognized that many shareholders have invested in the Fund on the strength of the Adviser's industry standing and reputation and with the expectation that the Adviser will have a continuing role in providing advisory services to the Fund. Thus, the Board's approval of the investment advisory contract reflected the fact that it is the shareholders who have effectively selected the Adviser by virtue of having invested in the Fund. The Board concluded that, in light of the factors summarized above, including the nature, quality and scope of the services provided to the Fund by the Adviser and its affiliates, continuation of the investment advisory contract was appropriate.
The Board based its decision to approve the investment advisory contract on the totality of the circumstances and relevant factors and with a view to past and future long-term considerations. Not all of the factors and considerations identified above were necessarily relevant to the Fund, nor did the Board consider any one of them to be determinative. With respect to the factors that were relevant, the Board's decision to approve the continuation of the contract reflects its view that Federated's performance and actions provided a satisfactory basis to support the decision to continue the existing arrangement.
Annual Shareholder Report
Voting Proxies on Fund Portfolio Securities
A description of the policies and procedures that the Fund uses to determine how to vote proxies, if any, relating to securities held in the Fund's portfolio is available, without charge and upon request, by calling 1-800-341-7400. A report on “Form N-PX” of how the Fund voted any such proxies during the most recent 12-month period ended June 30 is available via the Proxy Voting Record (Form N-PX) link associated with the Fund and share class name at www.FederatedInvestors.com/FundInformation. Form N-PX filings are also available at the SEC's website at www.sec.gov.
Quarterly Portfolio Schedule
The Fund files with the SEC a complete schedule of its portfolio holdings, as of the close of the first and third quarters of its fiscal year, on “Form N-Q.” These filings are available on the SEC's website at www.sec.gov. You may also access this information via the link to the Fund and share class name at www.FederatedInvestors.com/FundInformation.
Annual Shareholder Report
Mutual funds are not bank deposits or obligations, are not guaranteed by any bank and are not insured or guaranteed by the U.S. government, the Federal Deposit Insurance Corporation, the Federal Reserve Board or any other government agency. Investment in mutual funds involves investment risk, including the possible loss of principal.
This Report is authorized for distribution to prospective investors only when preceded or accompanied by the Fund's Prospectus, which contains facts concerning its objective and policies, management fees, expenses and other information.
Federated Equity Income Fund, Inc.
Federated Investors Funds
4000 Ericsson Drive
Warrendale, PA 15086-7561
Contact us at FederatedInvestors.com
or call 1-800-341-7400.
Federated Securities Corp., Distributor
CUSIP 313915100
CUSIP 313915209
CUSIP 313915308
CUSIP 313915407
CUSIP 313915605
CUSIP 313915506
8042506 (1/19)
Federated is a registered trademark of Federated Investors, Inc.
2019 ©Federated Investors, Inc.
(a) As of the end of the period covered by this report, the registrant has adopted a code of ethics (the "Section 406 Standards for Investment Companies - Ethical Standards for Principal Executive and Financial Officers") that applies to the registrant's Principal Executive Officer and Principal Financial Officer; the registrant's Principal Financial Officer also serves as the Principal Accounting Officer.
(c) There was no amendment to the registrant’s code of ethics described in Item 2(a) above during the period covered by the report.
(d) There was no waiver granted, either actual or implicit, from a provision to the registrant’s code of ethics described in Item 2(a) above during the period covered by the report.
(e) Not Applicable
(f)(3) The registrant hereby undertakes to provide any person, without charge, upon request, a copy of the code of ethics. To request a copy of the code of ethics, contact the registrant at 1-800-341-7400, and ask for a copy of the Section 406 Standards for Investment Companies - Ethical Standards for Principal Executive and Financial Officers.
Item 3. Audit Committee Financial Expert
The registrant's Board has determined that each of the following members of the Board's Audit Committee is an “audit committee financial expert,” and is "independent," for purposes of this Item: John T. Collins, G. Thomas Hough and Thomas M. O'Neill.
| Item 4. | Principal Accountant Fees and Services |
(a) Audit Fees billed to the registrant for the two most recent fiscal years:
Fiscal year ended 2018 - $30,600
Fiscal year ended 2017 - $30,020
(b) Audit-Related Fees billed to the registrant for the two most recent fiscal years:
Fiscal year ended 2018 - $0
Fiscal year ended 2017 - $2,686
Fiscal year ended 2017- Audit consent for N-1A filing.
Amount requiring approval of the registrant’s audit committee pursuant to paragraph (c)(7)(ii) of Rule 2-01 of Regulation S-X, $0 and $0 respectively.
(c) Tax Fees billed to the registrant for the two most recent fiscal years:
Fiscal year ended 2018 - $0
Fiscal year ended 2017 - $0
Amount requiring approval of the registrant’s audit committee pursuant to paragraph (c)(7)(ii) of Rule 2-01 of Regulation S-X, $0 and $0 respectively.
(d) All Other Fees billed to the registrant for the two most recent fiscal years:
Fiscal year ended 2018 - $0
Fiscal year ended 2017 - $0
Amount requiring approval of the registrant’s audit committee pursuant to paragraph (c)(7)(ii) of Rule 2-01 of Regulation S-X, $26,576 and $29,725 respectively. Fiscal year ended 2018 – Service fee for analysis of potential Passive Foreign Investment Company holdings. Fiscal year ended 2017 – Service fee for analysis of potential Passive Foreign Investment Company holdings.
(e)(1) Audit Committee Policies regarding Pre-approval of Services.
The Audit Committee is required to pre-approve audit and non-audit services performed by the independent auditor in order to assure that the provision of such services do not impair the auditor’s independence. Unless a type of service to be provided by the independent auditor has received general pre-approval, it will require specific pre-approval by the Audit Committee. Any proposed services exceeding pre-approved cost levels will require specific pre-approval by the Audit Committee.
Certain services have the general pre-approval of the Audit Committee. The term of the general pre-approval is 12 months from the date of pre-approval, unless the Audit Committee specifically provides for a different period. The Audit Committee will annually review the services that may be provided by the independent auditor without obtaining specific pre-approval from the Audit Committee and may grant general pre-approval for such services. The Audit Committee will revise the list of general pre-approved services from time to time, based on subsequent determinations. The Audit Committee will not delegate its responsibilities to pre-approve services performed by the independent auditor to management.
The Audit Committee has delegated pre-approval authority to its Chairman. The Chairman will report any pre-approval decisions to the Audit Committee at its next scheduled meeting. The Committee will designate another member with such pre-approval authority when the Chairman is unavailable.
AUDIT SERVICES
The annual Audit services engagement terms and fees will be subject to the specific pre-approval of the Audit Committee. The Audit Committee must approve any changes in terms, conditions and fees resulting from changes in audit scope, registered investment company (RIC) structure or other matters.
In addition to the annual Audit services engagement specifically approved by the Audit Committee, the Audit Committee may grant general pre-approval for other Audit Services, which are those services that only the independent auditor reasonably can provide. The Audit Committee has pre-approved certain Audit services, all other Audit services must be specifically pre-approved by the Audit Committee.
AUDIT-RELATED SERVICES
Audit-related services are assurance and related services that are reasonably related to the performance of the audit or review of the Company’s financial statements or that are traditionally performed by the independent auditor. The Audit Committee believes that the provision of Audit-related services does not impair the independence of the auditor, and has pre-approved certain Audit-related services, all other Audit-related services must be specifically pre-approved by the Audit Committee.
TAX SERVICES
The Audit Committee believes that the independent auditor can provide Tax services to the Company such as tax compliance, tax planning and tax advice without impairing the auditor’s independence. However, the Audit Committee will not permit the retention of the independent auditor in connection with a transaction initially recommended by the independent auditor, the purpose of which may be tax avoidance and the tax treatment of which may not be supported in the Internal Revenue Code and related regulations. The Audit Committee has pre-approved certain Tax services, all Tax services involving large and complex transactions must be specifically pre-approved by the Audit Committee.
ALL OTHER SERVICES
With respect to the provision of services other than audit, review or attest services the pre-approval requirement is waived if:
| (1) | The aggregate amount of all such services provided constitutes no more than five percent of the total amount of revenues paid by the registrant, the registrant’s adviser (not including any sub-adviser whose role is primarily portfolio management and is subcontracted with or overseen by another investment adviser), and any entity controlling, controlled by, or under common control with the investment adviser that provides ongoing services to the registrant to its accountant during the fiscal year in which the services are provided; |
| (2) | Such services were not recognized by the registrant, the registrant’s adviser (not including any sub-adviser whose role is primarily portfolio management and is subcontracted with or overseen by another investment adviser), and any entity controlling, controlled by, or under common control with the investment adviser that provides ongoing services to the registrant at the time of the engagement to be non-audit services; and |
| (3) | Such services are promptly brought to the attention of the Audit Committee of the issuer and approved prior to the completion of the audit by the Audit Committee or by one or more members of the Audit Committee who are members of the board of directors to whom authority to grant such approvals has been delegated by the Audit Committee. |
The Audit Committee may grant general pre-approval to those permissible non-audit services classified as All Other services that it believes are routine and recurring services, and would not impair the independence of the auditor.
The SEC’s rules and relevant guidance should be consulted to determine the precise definitions of prohibited non-audit services and the applicability of exceptions to certain of the prohibitions.
PRE-APPROVAL FEE LEVELS
Pre-approval fee levels for all services to be provided by the independent auditor will be established annually by the Audit Committee. Any proposed services exceeding these levels will require specific pre-approval by the Audit Committee.
PROCEDURES
Requests or applications to provide services that require specific approval by the Audit Committee will be submitted to the Audit Committee by both the independent auditor and the Principal Accounting Officer and/or Internal Auditor, and must include a joint statement as to whether, in their view, the request or application is consistent with the SEC’s rules on auditor independence.
(e)(2) Percentage of services identified in items 4(b) through 4(d) that were approved by the registrants audit committee pursuant to paragraph (c)(7)(i)(C) of Rule 2-01 of Regulation S-X:
4(b)
Fiscal year ended 2018 – 0%
Fiscal year ended 2017 - 0%
Percentage of services provided to the registrants investment adviser and any entity controlling, controlled by, or under common control with the investment adviser that provides ongoing services to the registrant that were approved by the registrants audit committee pursuant to paragraph (c)(7)(i)(C) of Rule 2-01 of Regulation S-X, 0% and 0% respectively.
4(c)
Fiscal year ended 2018 – 0%
Fiscal year ended 2017 – 0%
Percentage of services provided to the registrants investment adviser and any entity controlling, controlled by, or under common control with the investment adviser that provides ongoing services to the registrant that were approved by the registrants audit committee pursuant to paragraph (c)(7)(i)(C) of Rule 2-01 of Regulation S-X, 0% and 0% respectively.
4(d)
Fiscal year ended 2018 – 0%
Fiscal year ended 2017 – 0%
Percentage of services provided to the registrants investment adviser and any entity controlling, controlled by, or under common control with the investment adviser that provides ongoing services to the registrant that were approved by the registrants audit committee pursuant to paragraph (c)(7)(i)(C) of Rule 2-01 of Regulation S-X, 0% and 0% respectively.
| (g) | Non-Audit Fees billed to the registrant, the registrant’s investment adviser, and certain entities controlling, controlled by or under common control with the investment adviser: |
Fiscal year ended 2018 - $1,082,436
Fiscal year ended 2017 - $136,318
| (h) | The registrant’s Audit Committee has considered that the provision of non-audit services that were rendered to the registrant’s adviser (not including any sub-adviser whose role is primarily portfolio management and is subcontracted with or overseen by another investment adviser), and any entity controlling, controlled by, or under common control with the investment adviser that provides ongoing services to the registrant that were not pre-approved pursuant to paragraph (c)(7)(ii) of Rule 2-01 of Regulation S-X is compatible with maintaining the principal accountant’s independence. |
The registrant’s management and Audit Committee continue to believe that the registrant’s registered public accounting firm, Ernst & Young LLP (“EY”), has the ability to exercise objective and impartial judgment on all issues encompassed within their audit services. EY is required to make a determination that it satisfies certain independence requirements under the federal securities laws. Like other registrants, there is a risk that activities or relationships of EY, or its partners or employees, can prevent a determination from being made that it satisfies such independence requirements with respect to the registrant, which could render it ineligible to serve as the registrant’s independent public accountant.
In its required communications to the Audit Committee of the registrant’s Board, EY informed the Audit Committee that EY and/ or covered person professionals within EY maintain lending relationships with certain owners of greater than 10% of the shares of certain investment companies within the “investment company complex” as defined under Rule 2-01(f)(14) of Regulation S-X, which are affiliates of the registrant. EY has advised the Audit Committee that these lending relationships implicate Rule 2-01(c)(1)(ii)(A) of Regulation S-X (referred to as the “Loan Rule”). The Loan Rule prohibits an independent public accountant, or covered person professionals at such firm, from having a financial relationship (such as a loan) with a lender that is a record or beneficial owner of more than 10% of an audit client’s equity securities. For purposes of the Loan Rule, audit clients include the registrant, as well as all registered investment companies advised by advisory subsidiaries of Federated Investors, Inc., the Adviser (for which EY serves as independent public accountant), and their respective affiliates (collectively, the “Federated Fund Complex”).
EY informed the Audit Committee that EY believes that these lending relationships described above do not and will not impair EY’s ability to exercise objective and impartial judgment in connection with the audits of the financial statements for the registrant and a reasonable investor with knowledge of all relevant facts and circumstances would conclude that EY has been and is capable of objective and impartial judgment on all issues encompassed within EY’s audits.
On June 20, 2016, the Division of Investment Management of the Securities and Exchange Commission (“SEC”) issued a no-action letter to another mutual fund complex (see Fidelity Management & Research Company et al., No-Action Letter) related to similar Loan Rule matters as those described above (the “Letter”). In the Letter, the SEC Staff confirmed that it would not recommend enforcement action against an investment company that relied on the audit services performed by an independent public accountant where the Loan Rule was implicated in certain specified circumstances provided that: (1) the auditor has complied with PCAOB Rule 3526(b)(1) and 3526(b)(2); (2) the Loan Rule is implicated because of lending relationships; and (3) notwithstanding such lending relationships that implicate the Loan Rule, the auditor has concluded that it is objective and impartial with respect to the issues encompassed within its engagement as auditor of the funds. The circumstances described in the Letter are substantially similar to the circumstances that implicated the Loan Rule with respect to EY and the registrant. On September 22, 2017, the SEC extended the expiration of the Letter until the effectiveness of any amendments to the Loan Rule designed to address the concerns in the Letter. On May 2, 2018, the SEC proposed amendments to the Loan Rule, which, if adopted as proposed, would refocus the analysis that must be conducted to determine whether an auditor is independent when the auditor has a lending relationship with certain shareholders of an audit client at any time during an audit or professional engagement period.
Additionally, on July 18, 2018, EY informed the registrant that Rule 2-01(c)(1)(i)(A) of Regulation S-X (“Investment Rule”) also has been implicated since July 2, 2018. The Investment Rule prohibits public accounting firms, or covered person professionals and their immediate family members, from having certain direct financial investments in their audit clients and affiliated entities. EY informed the registrant that a pension trust of a non-US affiliated entity of EY had previously made, and as of July 18, 2018 maintained, an investment in a fund (“Hermes Fund”) managed by Hermes Alternative Investment Management Limited (“HAIML”), which is a wholly owned subsidiary of Hermes Fund Managers Limited (“HFML”). The pension trust’s investment in the Hermes Fund involved the Investment Rule because an indirect wholly owned subsidiary of Federated Investors, Inc. (an affiliate of the registrant’s adviser), acquired a 60% majority interest in HFML on July 2, 2018, effective July 1, 2018 (“Hermes Acquisition”). The pension trust first invested in the Hermes Fund in 2007, well prior to the Hermes Acquisition. The pension trust’s investment represented less than 3.3% of the Hermes Fund’s assets as of July 18, 2018. EY subsequently informed the registrant that EY’s affiliated entity’s pension trust had submitted an irrevocable redemption notice to redeem its investment in the Hermes Fund. Pursuant to the redemption terms of the Hermes Fund, the pension trust’s redemption would not be effected until December 26, 2018 at the earliest. The redemption notice could not be revoked by the pension trust. The redemption notice would only be revoked by HAIML, as the adviser for Hermes Fund, if, and to the extent, the pension trust successfully sold its interest in the Hermes Fund in a secondary market transaction. EY also informed the registrant that the pension trust simultaneously submitted a request to HAIML to conduct a secondary market auction for the pension trust’s interests in the Hermes Fund. In addition, the only voting rights shareholders of the Hermes Fund had under the Hermes Fund’s governing documents relate to key appointments, including the election of the non-executive members of the Hermes Fund’s committee, the appointment of the Hermes Fund’s trustee and the adoption of the Hermes Fund’s financial statements. The next meeting of the Hermes Fund at which shareholders could vote on the election of members to the Hermes Fund’s committee was not until June 2019, and the size of the pension trust’s investment in the Hermes Fund would not allow it to unilaterally elect a committee member or the trustee. EY does not audit the Hermes Fund and the Hermes Fund’s assets and operations are not consolidated in the registrant’s financial statements that are subject to audit by EY. Finally, no member of EY’s audit team that provides audit services to the registrant is a beneficiary of EY’s affiliated entity’s pension trust. Management reviewed this matter with the registrant’s Audit Committee, and, based on that review, as well as a letter from EY to the registrant dated July 26, 2018, in which EY indicated that it had determined that this matter does not impair EY’s ability to exercise objective and impartial judgment in connection with the audit of the financial statements for the registrant and the belief that a reasonable investor with knowledge of all relevant facts and circumstances would conclude that EY has been and is capable of exercising objective and impartial judgment on all issues encompassed within EY’s audit, the registrant’s management and Audit Committee made a determination that such matter does not impair EY’s ability to exercise objective and impartial judgment in connection with the audit of the financial statements for the registrant. On August 29, 2018, EY informed the registrant that EY’s affiliated entity’s pension trust sold its entire interest in the Hermes Fund, effective as of August 29, 2018.
If it were to be determined that, with respect to the Loan Rule, the relief available under the Letter was improperly relied upon, or that the independence requirements under the federal securities laws were not complied with regarding the registrant, for certain periods, and/or given the implication of the Investment Rule for certain periods, any of the registrant’s filings with the SEC which contain financial statements of the registrant for such periods may be determined not to be consistent with or comply with applicable federal securities laws, the registrant’s ability to offer shares under its current registration statement may be impacted, andcertain financial reporting and/or other covenants with, and representations and warranties to, the registrant’s lender under its committed line of credit may be impacted. Such eventscould have a material adverse effect on the registrant and the Federated Fund Complex.
| Item 5. | Audit Committee of Listed Registrants |
Not Applicable
| Item 6. | Schedule of Investments |
(a) The registrant’s Schedule of Investments is included as part of the Report to Stockholders filed under Item 1 of this form.
(b) Not Applicable; Fund had no divestments during the reporting period covered since the previous Form N-CSR filing.
| Item 7. | Disclosure of Proxy Voting Policies and Procedures for Closed-End Management Investment Companies |
Not Applicable
| Item 8. | Portfolio Managers of Closed-End Management Investment Companies |
Not Applicable
| Item 9. | Purchases of Equity Securities by Closed-End Management Investment Company and Affiliated Purchasers |
Not Applicable
| Item 10. | Submission of Matters to a Vote of Security Holders |
No Changes to Report
| Item 11. | Controls and Procedures |
(a) The registrant’s President and Treasurer have concluded that the
registrant’s disclosure controls and procedures (as defined in rule 30a-3(c) under the Act) are effective in design and operation and are sufficient to form the basis of the certifications required by Rule 30a-(2) under the Act, based on their evaluation of these disclosure controls and procedures within 90 days of the filing date of this report on Form N-CSR.
(b) There were no changes in the registrant’s internal control over financial reporting (as defined in rule 30a-3(d) under the Act) during the second fiscal quarter of the period covered by this report that have materially affected, or are reasonably likely to materially affect, the registrant’s internal control over financial reporting.
| Item 12. | Disclosure of Securities Lending Activities for Closed-End Management Investment Companies |
Not Applicable
(a)(1) Code of Ethics- Not Applicable to this Report.
(a)(2) Certifications of Principal Executive Officer and Principal Financial Officer.
(a)(3) Not Applicable.
(b) Certifications pursuant to 18 U.S.C. Section 1350.
SIGNATURES
Pursuant to the requirements of the Securities Exchange Act of 1934 and the Investment Company Act of 1940, the registrant has duly caused this report to be signed on its behalf by the undersigned, thereunto duly authorized.
RegistrantFederated Equity Income Fund, Inc._
By/S/ Lori A. Hensler
Lori A. Hensler, Principal Financial Officer
DateJanuary 23, 2019
Pursuant to the requirements of the Securities Exchange Act of 1934 and the Investment Company Act of 1940, this report has been signed below by the following persons on behalf of the registrant and in the capacities and on the dates indicated.
By/S/ J. Christopher Donahue
J. Christopher Donahue, Principal Executive Officer
DateJanuary 23, 2019
By/S/ Lori A. Hensler
Lori A. Hensler, Principal Financial Officer
DateJanuary 23, 2019