
Investor Presentation July 2017 Exhibit 99.1
SAFE HARBOR By accepting this Presentation, recipients acknowledge that they have read, understood and accepted the terms of this Disclaimer. This Presentation is the property of, and contains the proprietary and confidential information of Parexel International Corporation, West Street Merger Sub, Inc. and their respective subsidiaries (collectively, the “Company”) and is being provided solely for informational purposes. This presentation contains “forward-looking” statements within the meaning of Section 27A of the Securities Act of 1933 and Section 21E of the Securities Exchange Act of 1934, including statements regarding future results and events, including, without limitation, statements regarding the Company’s existing capital resources and future cash flows from operations, and statements regarding expected financial results, future growth and customer demand. For this purpose, any statements contained herein that are not statements of historical fact may be deemed forward-looking statements. Without limiting the foregoing, the words “believes,” “anticipates,” “plans,” “expects,” “intends,” “appears,” “estimates,” “projects,” “targets,” and similar expressions are intended to identify forward-looking statements. These statements involve a number of risks and uncertainties. The Company’s actual future results may differ materially from the results discussed in the forward-looking statements contained in this presentation. Important factors that might cause such a difference include, but are not limited to, risks associated with: actual operating performance; actual expense savings and other operating improvements resulting from restructurings, the loss, modification, or delay of contracts; the Company’s ability to win new business, manage growth and costs, and attract and retain employees; the Company’s ability to complete additional acquisitions, and to integrate newly acquired businesses; the impact on the Company’s business of government regulation of the drug, medical device and biotechnology industry; consolidation within the pharmaceutical industry and competition within the biopharmaceutical services industry; the potential for significant liability to clients and third parties; the potential adverse impact of health care reform; the impact on the Company’s business of its acquisition by Pamplona Capital Management LLP and the financings thereof; and the effects of foreign currency exchange rate fluctuations and other international economic, political, and other risks. Such factors and others are discussed more fully in the section entitled “Risk Factors” of the Company’s most recent Annual Report on Form 10-K, and subsequent reports on Form 10-Q, as filed with the SEC. The forward-looking statements included in this presentation represent the Company’s estimates as of the date of this presentation.
SAFE HARBOR All information herein speaks only as of (1) the date hereof, in the case of information about the Company (2) the date of such information, in the case of information from persons other than the Company. The Company specifically disclaims any obligation to update these forward-looking statements in the future. These forward-looking statements should not be relied upon as representing the Company’s estimates or views as of any date subsequent to the date of this presentation. Except as provided in the definitive loan documentation, no representation or warranty, express or implied, is or will be given by the Company or its affiliates, directors, officers, partners, employees, agents or advisers or any other person as to the accuracy, completeness, reasonableness or fairness of any information contained in the Presentation and no responsibility or liability whatsoever is accepted for the accuracy or sufficiency thereof or for any errors, omissions or misstatements, negligent or otherwise relating thereto. Accordingly, this Presentation should not be relied upon for the purpose of evaluating the performance of the Company or for any other purpose, and neither the Company nor any of its affiliates, directors, officers, partners, employees, agents or advisers nor any other person, shall be liable for any direct, indirect or consequential liability, loss or damages suffered by any person as a result of this Presentation or their reliance on any statement, estimate, target, projection or forward-looking information in or omission from this Presentation and any such liability is expressly disclaimed. This presentation includes references to non-GAAP financial measures. These non-GAAP measures are not prepared in accordance with generally accepted accounting principles. Pro forma information is not meant to be considered superior to or a substitute for the Company’s results of operations prepared in accordance with GAAP. A reconciliation of the non-GAAP financial measures to the most directly comparable GAAP measures is available on certain slides of this presentation. In all cases, interested parties should conduct their own investigation and analysis of the Company and the information contained herein. All trademarks and logos depicted in this Presentation are the property of their respective owners and are displayed solely for purposes of illustration.
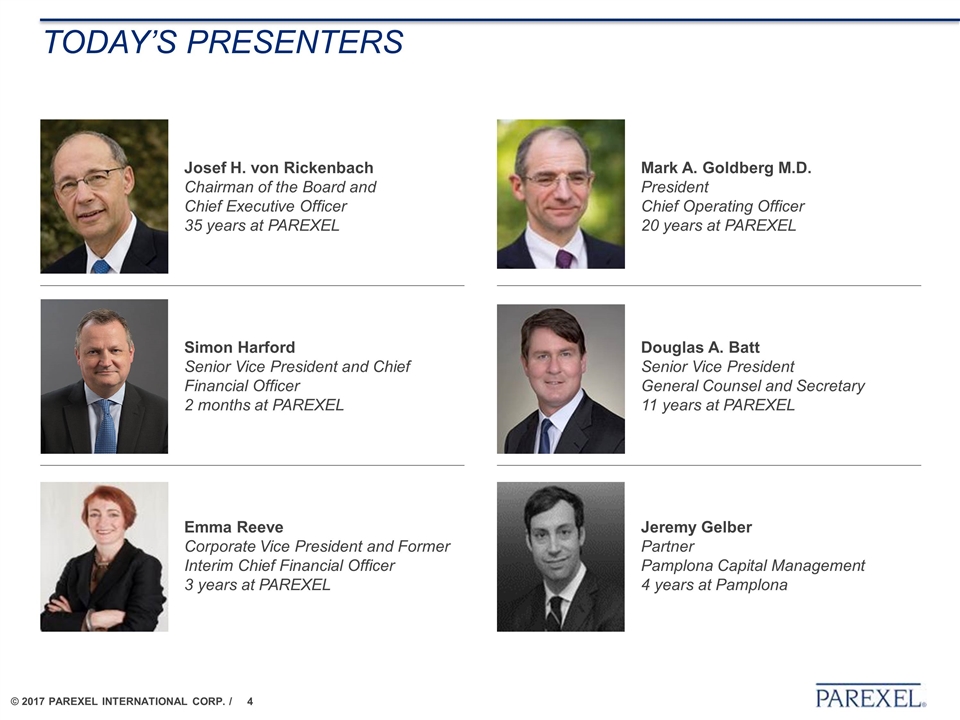
Today’s Presenters Josef H. von Rickenbach Chairman of the Board and Chief Executive Officer 35 years at PAREXEL Simon Harford Senior Vice President and Chief Financial Officer 2 months at PAREXEL Emma Reeve Corporate Vice President and Former Interim Chief Financial Officer 3 years at PAREXEL Mark A. Goldberg M.D. President Chief Operating Officer 20 years at PAREXEL Douglas A. Batt Senior Vice President General Counsel and Secretary 11 years at PAREXEL Jeremy Gelber Partner Pamplona Capital Management 4 years at Pamplona
Agenda TRANSACTION OVERVIEW BUSINESS OVERVIEW KEY CREDIT HIGHLIGHTS HISTORICAL FINANCIALS

transaction OVERVIEW
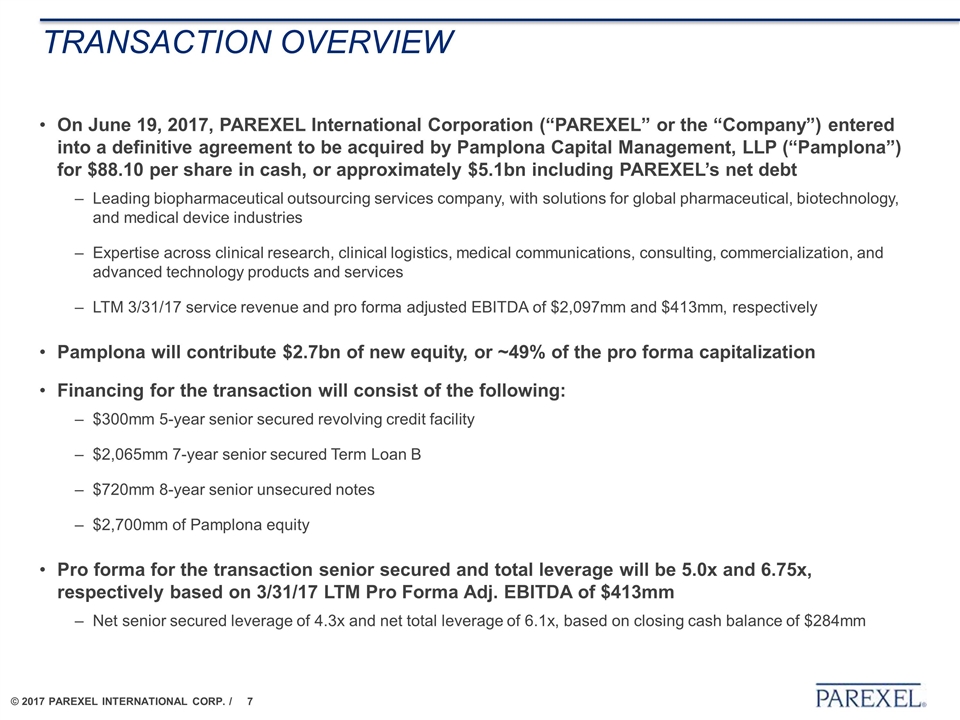
TRANSACTION OVERVIEW On June 19, 2017, PAREXEL International Corporation (“PAREXEL” or the “Company”) entered into a definitive agreement to be acquired by Pamplona Capital Management, LLP (“Pamplona”) for $88.10 per share in cash, or approximately $5.1bn including PAREXEL’s net debt Leading biopharmaceutical outsourcing services company, with solutions for global pharmaceutical, biotechnology, and medical device industries Expertise across clinical research, clinical logistics, medical communications, consulting, commercialization, and advanced technology products and services LTM 3/31/17 service revenue and pro forma adjusted EBITDA of $2,097mm and $413mm, respectively Pamplona will contribute $2.7bn of new equity, or ~49% of the pro forma capitalization Financing for the transaction will consist of the following: $300mm 5-year senior secured revolving credit facility $2,065mm 7-year senior secured Term Loan B $720mm 8-year senior unsecured notes $2,700mm of Pamplona equity Pro forma for the transaction senior secured and total leverage will be 5.0x and 6.75x, respectively based on 3/31/17 LTM Pro Forma Adj. EBITDA of $413mm Net senior secured leverage of 4.3x and net total leverage of 6.1x, based on closing cash balance of $284mm
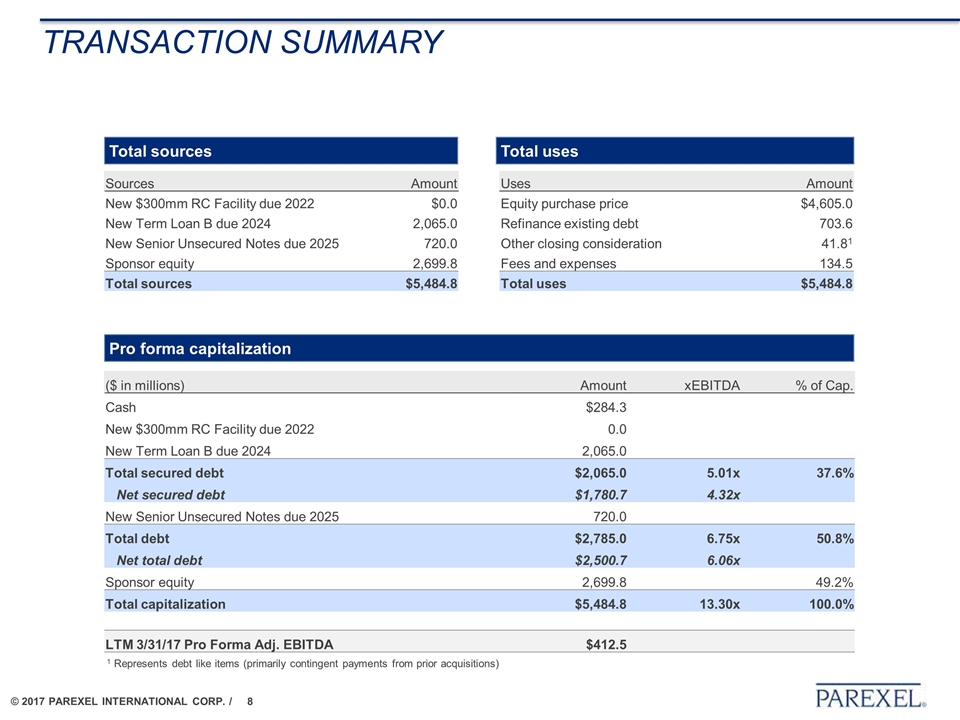
TRANSACTION SUMMARY ($ in millions) Amount xEBITDA % of Cap. Cash $284.3 New $300mm RC Facility due 2022 0.0 New Term Loan B due 2024 2,065.0 Total secured debt $2,065.0 5.01x 37.6% Net secured debt $1,780.7 4.32x New Senior Unsecured Notes due 2025 720.0 Total debt $2,785.0 6.75x 50.8% Net total debt $2,500.7 6.06x Sponsor equity 2,699.8 49.2% Total capitalization $5,484.8 13.30x 100.0% LTM 3/31/17 Pro Forma Adj. EBITDA $412.5 Sources Amount Uses Amount New $300mm RC Facility due 2022 $0.0 Equity purchase price $4,605.0 New Term Loan B due 2024 2,065.0 Refinance existing debt 703.6 New Senior Unsecured Notes due 2025 720.0 Other closing consideration 41.81 Sponsor equity 2,699.8 Fees and expenses 134.5 Total sources $5,484.8 Total uses $5,484.8 Pro forma capitalization Total sources Total uses 1 Represents debt like items (primarily contingent payments from prior acquisitions)
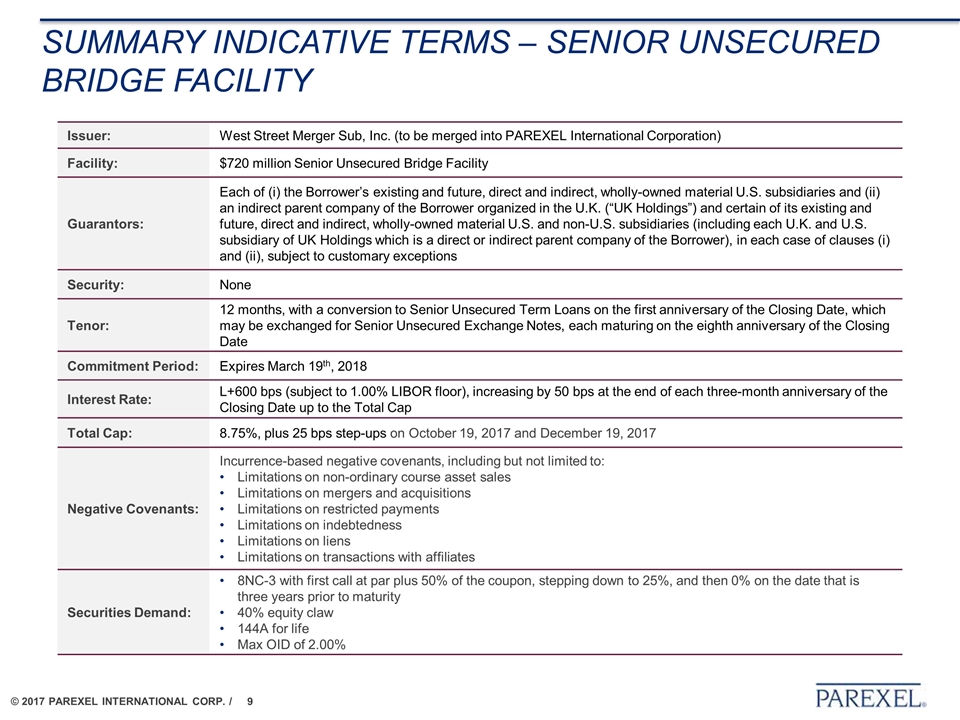
SUMMARY INDICATIVE TERMS – SENIOR UNSECURED bridge facility Issuer: West Street Merger Sub, Inc. (to be merged into PAREXEL International Corporation) Facility: $720 million Senior Unsecured Bridge Facility Guarantors: Each of (i) the Borrower’s existing and future, direct and indirect, wholly-owned material U.S. subsidiaries and (ii) an indirect parent company of the Borrower organized in the U.K. (“UK Holdings”) and certain of its existing and future, direct and indirect, wholly-owned material U.S. and non-U.S. subsidiaries (including each U.K. and U.S. subsidiary of UK Holdings which is a direct or indirect parent company of the Borrower), in each case of clauses (i) and (ii), subject to customary exceptions Security: None Tenor: 12 months, with a conversion to Senior Unsecured Term Loans on the first anniversary of the Closing Date, which may be exchanged for Senior Unsecured Exchange Notes, each maturing on the eighth anniversary of the Closing Date Commitment Period: Expires March 19th, 2018 Interest Rate: L+600 bps (subject to 1.00% LIBOR floor), increasing by 50 bps at the end of each three-month anniversary of the Closing Date up to the Total Cap Total Cap: 8.75%, plus 25 bps step-ups on October 19, 2017 and December 19, 2017 Negative Covenants: Incurrence-based negative covenants, including but not limited to: Limitations on non-ordinary course asset sales Limitations on mergers and acquisitions Limitations on restricted payments Limitations on indebtedness Limitations on liens Limitations on transactions with affiliates Securities Demand: 8NC-3 with first call at par plus 50% of the coupon, stepping down to 25%, and then 0% on the date that is three years prior to maturity 40% equity claw 144A for life Max OID of 2.00%
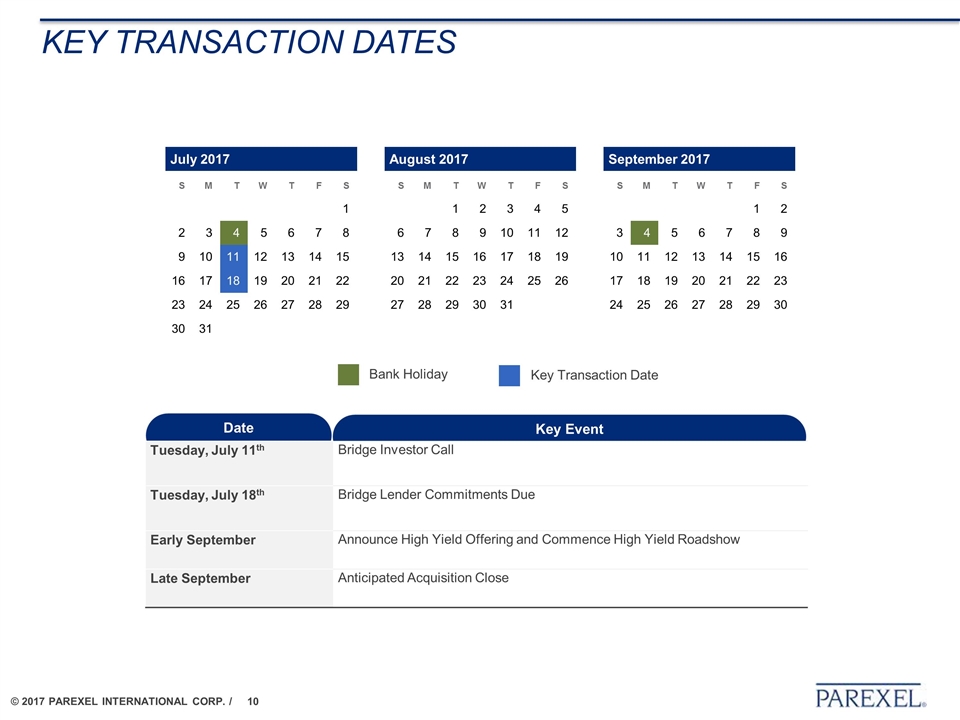
Key transaction dates Date Key Event Bank Holiday Key Transaction Date Tuesday, July 11th Bridge Investor Call Tuesday, July 18th Bridge Lender Commitments Due Early September Announce High Yield Offering and Commence High Yield Roadshow Late September Anticipated Acquisition Close July 2017 August 2017 September 2017 S M T W T F S S M T W T F S S M T W T F S 1 1 2 3 4 5 1 2 2 3 4 5 6 7 8 6 7 8 9 10 11 12 3 4 5 6 7 8 9 9 10 11 12 13 14 15 13 14 15 16 17 18 19 10 11 12 13 14 15 16 16 17 18 19 20 21 22 20 21 22 23 24 25 26 17 18 19 20 21 22 23 23 24 25 26 27 28 29 27 28 29 30 31 24 25 26 27 28 29 30 30 31
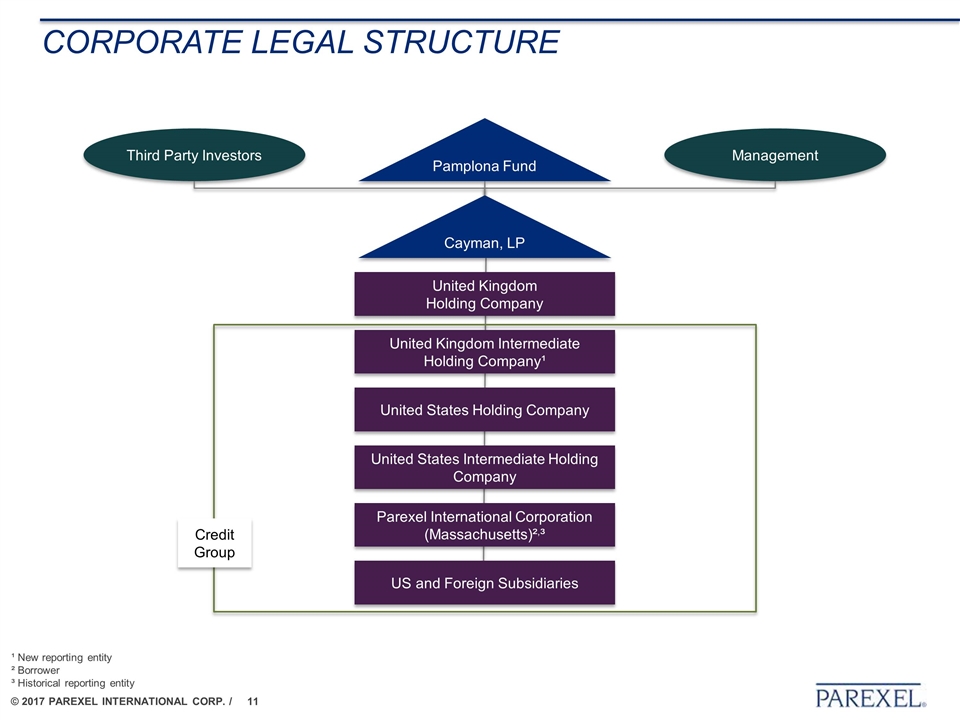
CORPORATE LEGAL STRUCTURE Third Party Investors Management United Kingdom Holding Company Pamplona Fund Cayman, LP United Kingdom Intermediate Holding Company¹ United States Holding Company United States Intermediate Holding Company Parexel International Corporation (Massachusetts)²,³ US and Foreign Subsidiaries Credit Group ¹ New reporting entity ² Borrower ³ Historical reporting entity
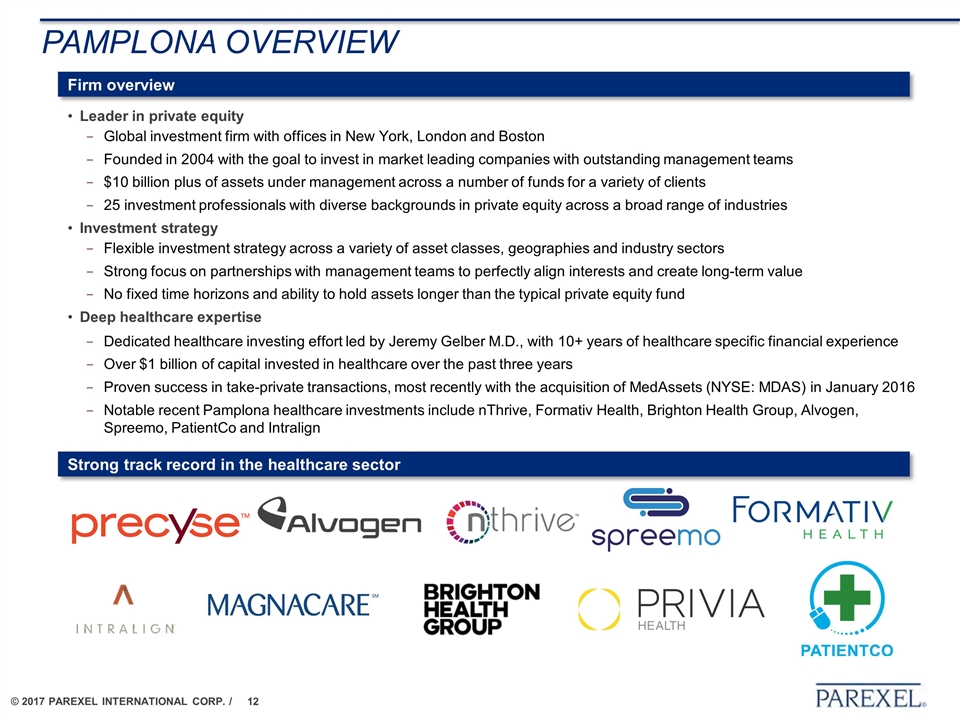
PAMPLONA Overview Leader in private equity Global investment firm with offices in New York, London and Boston Founded in 2004 with the goal to invest in market leading companies with outstanding management teams $10 billion plus of assets under management across a number of funds for a variety of clients 25 investment professionals with diverse backgrounds in private equity across a broad range of industries Investment strategy Flexible investment strategy across a variety of asset classes, geographies and industry sectors Strong focus on partnerships with management teams to perfectly align interests and create long-term value No fixed time horizons and ability to hold assets longer than the typical private equity fund Deep healthcare expertise Dedicated healthcare investing effort led by Jeremy Gelber M.D., with 10+ years of healthcare specific financial experience Over $1 billion of capital invested in healthcare over the past three years Proven success in take-private transactions, most recently with the acquisition of MedAssets (NYSE: MDAS) in January 2016 Notable recent Pamplona healthcare investments include nThrive, Formativ Health, Brighton Health Group, Alvogen, Spreemo, PatientCo and Intralign Firm overview Strong track record in the healthcare sector
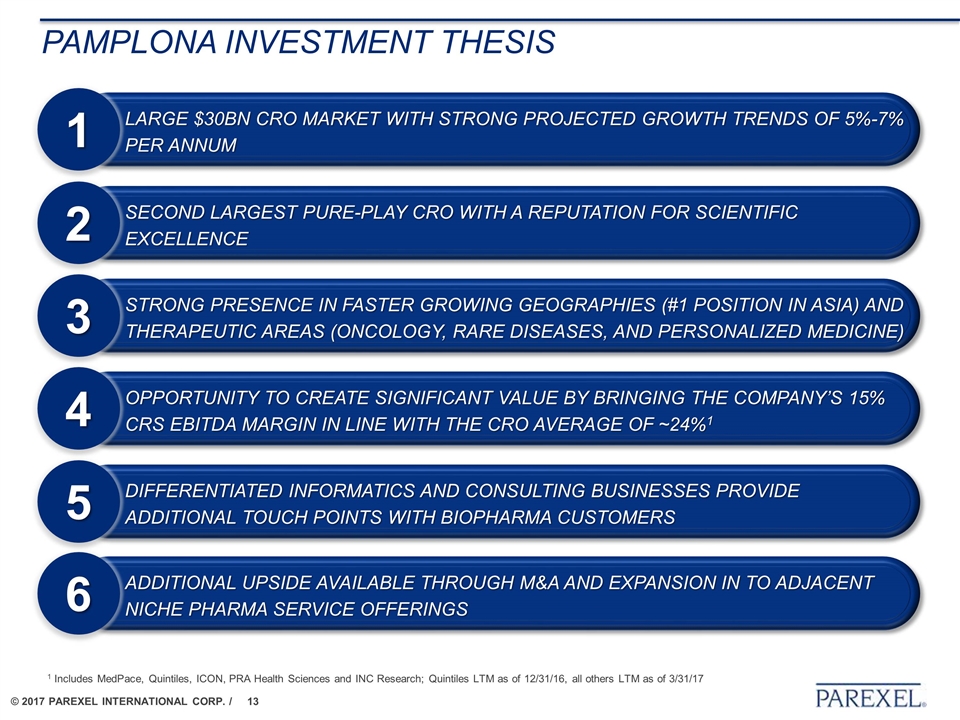
Pamplona Investment thesis Strong presence in faster growing geographies (#1 position in Asia) and therapeutic areas (oncology, rare diseases, and personalized medicine) 3 Second largest pure-play CRO with a reputation for scientific excellence 2 Opportunity to create significant value by bringing the Company’s 15% CRS EBITDA margin in line with the CRO average of ~24%1 4 Large $30bn CRO market with strong projected growth trends of 5%-7% per annum 1 Differentiated informatics and consulting businesses provide additional touch points with biopharma customers 5 Additional upside available through M&A and expansion in to adjacent niche pharma service offerings 6 1 Includes MedPace, Quintiles, ICON, PRA Health Sciences and INC Research; Quintiles LTM as of 12/31/16, all others LTM as of 3/31/17

Business overview
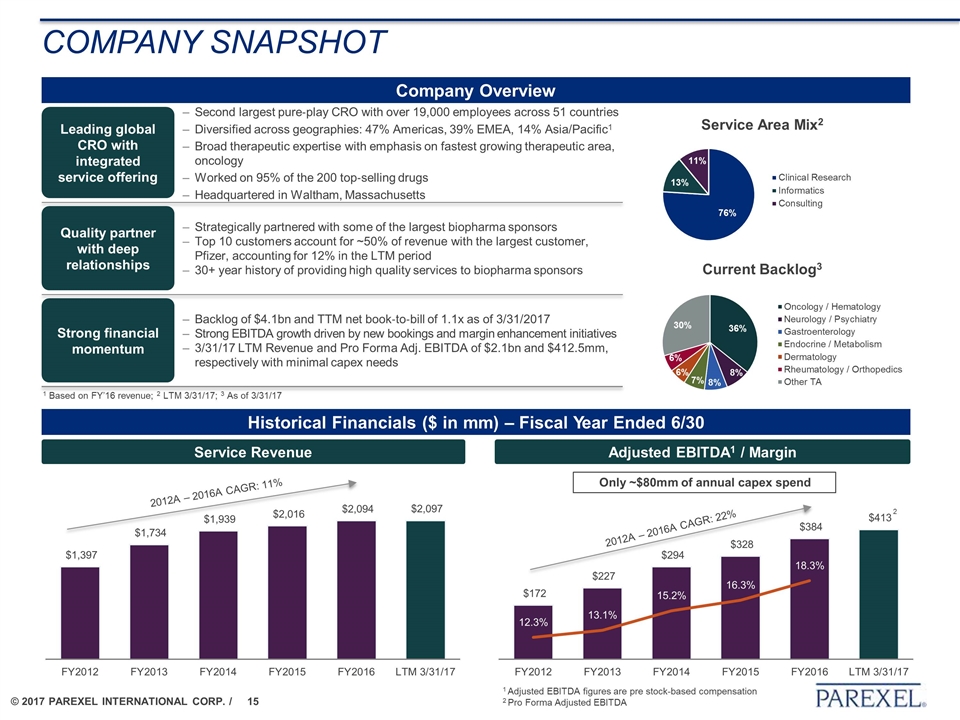
Company Snapshot Company Overview Historical Financials ($ in mm) – Fiscal Year Ended 6/30 Service Revenue Adjusted EBITDA1 / Margin Second largest pure‐play CRO with over 19,000 employees across 51 countries Diversified across geographies: 47% Americas, 39% EMEA, 14% Asia/Pacific1 Broad therapeutic expertise with emphasis on fastest growing therapeutic area, oncology Worked on 95% of the 200 top‐selling drugs Headquartered in Waltham, Massachusetts Leading global CRO with integrated service offering Quality partner with deep relationships Strong financial momentum Strategically partnered with some of the largest biopharma sponsors Top 10 customers account for ~50% of revenue with the largest customer, Pfizer, accounting for 12% in the LTM period 30+ year history of providing high quality services to biopharma sponsors Backlog of $4.1bn and TTM net book‐to‐bill of 1.1x as of 3/31/2017 Strong EBITDA growth driven by new bookings and margin enhancement initiatives 3/31/17 LTM Revenue and Pro Forma Adj. EBITDA of $2.1bn and $412.5mm, respectively with minimal capex needs Only ~$80mm of annual capex spend 2012A – 2016A CAGR: 11% 2012A – 2016A CAGR: 22% 2 1 Adjusted EBITDA figures are pre stock-based compensation 2 Pro Forma Adjusted EBITDA 1 Based on FY’16 revenue; 2 LTM 3/31/17; 3 As of 3/31/17 Current Backlog3 Service Area Mix2
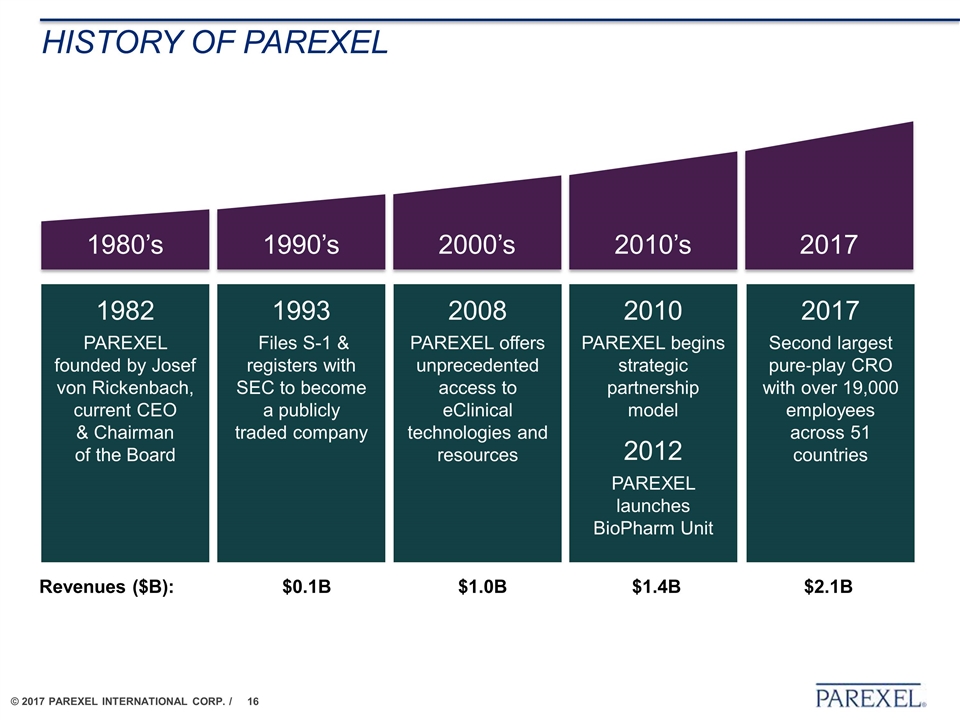
1993 Files S-1 & registers with SEC to become a publicly traded company 2008 PAREXEL offers unprecedented access to eClinical technologies and resources 2010 PAREXEL begins strategic partnership model 2012 PAREXEL launches BioPharm Unit 2017 Second largest pure‐play CRO with over 19,000 employees across 51 countries 1982 PAREXEL founded by Josef von Rickenbach, current CEO & Chairman of the Board 1990’s 2000’s 2010’s 2017 1980’s Revenues ($B): $0.1B $1.0B $1.4B $2.1B History of PAREXEL
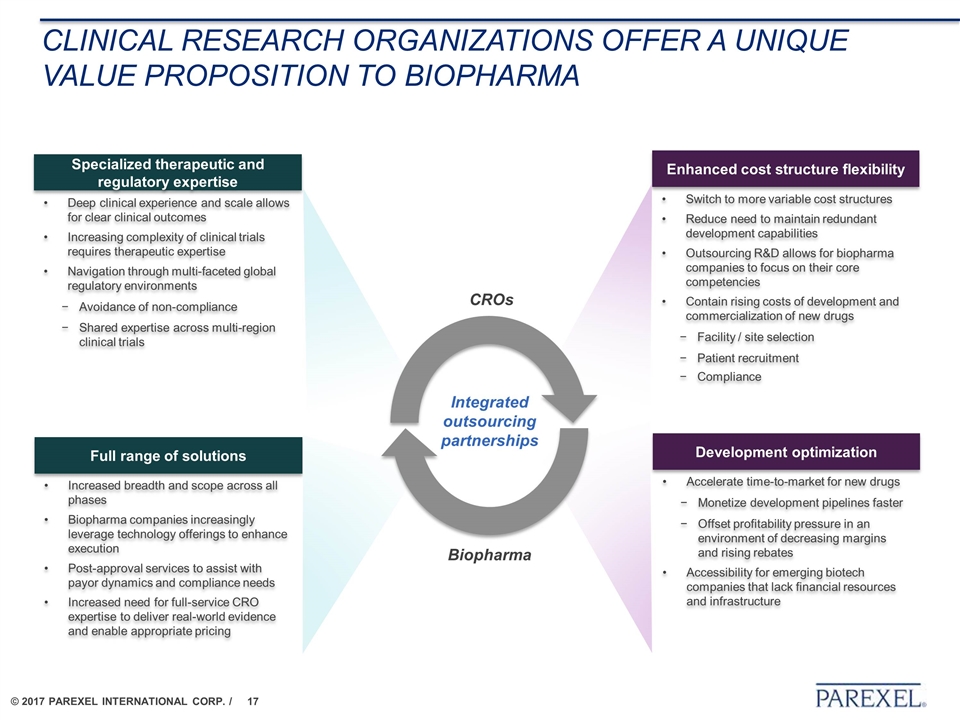
Clinical research organizations OFFER A UNIQUE VALUE PROPOSITION to Biopharma ü Enhanced cost structure flexibility Development optimization Specialized therapeutic and regulatory expertise Full range of solutions Switch to more variable cost structures Reduce need to maintain redundant development capabilities Outsourcing R&D allows for biopharma companies to focus on their core competencies Contain rising costs of development and commercialization of new drugs Facility / site selection Patient recruitment Compliance Accelerate time-to-market for new drugs Monetize development pipelines faster Offset profitability pressure in an environment of decreasing margins and rising rebates Accessibility for emerging biotech companies that lack financial resources and infrastructure Deep clinical experience and scale allows for clear clinical outcomes Increasing complexity of clinical trials requires therapeutic expertise Navigation through multi-faceted global regulatory environments Avoidance of non-compliance Shared expertise across multi-region clinical trials Increased breadth and scope across all phases Biopharma companies increasingly leverage technology offerings to enhance execution Post-approval services to assist with payor dynamics and compliance needs Increased need for full-service CRO expertise to deliver real-world evidence and enable appropriate pricing Biopharma CROs Integrated outsourcing partnerships
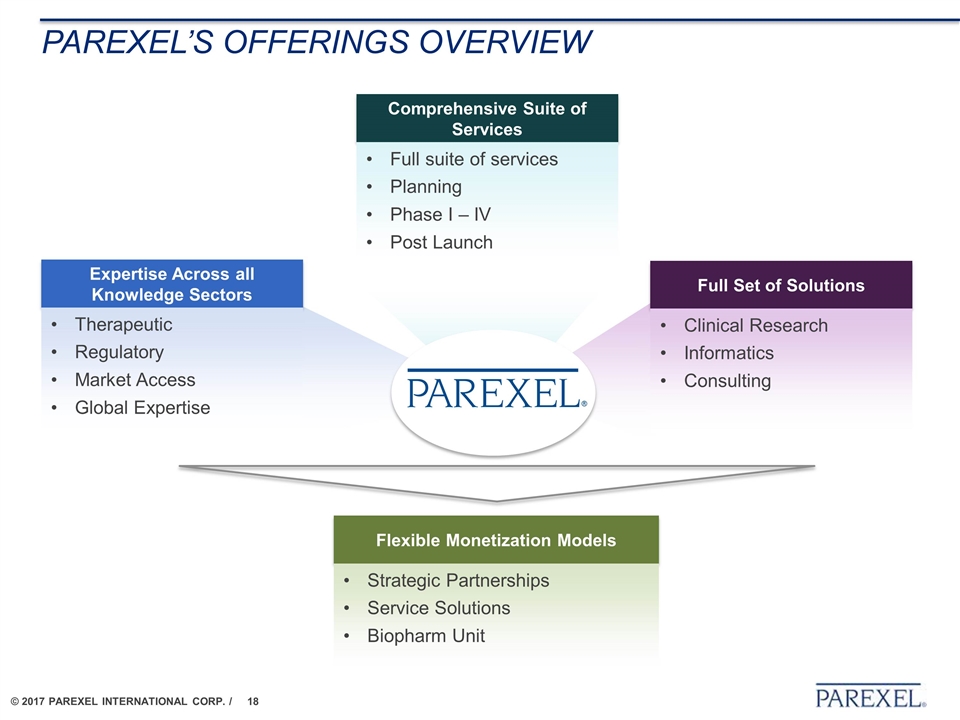
Parexel’s offerings overview Comprehensive Suite of Services Full suite of services Planning Phase I – IV Post Launch Full Set of Solutions Clinical Research Informatics Consulting Expertise Across all Knowledge Sectors Therapeutic Regulatory Market Access Global Expertise Flexible Monetization Models Strategic Partnerships Service Solutions Biopharm Unit
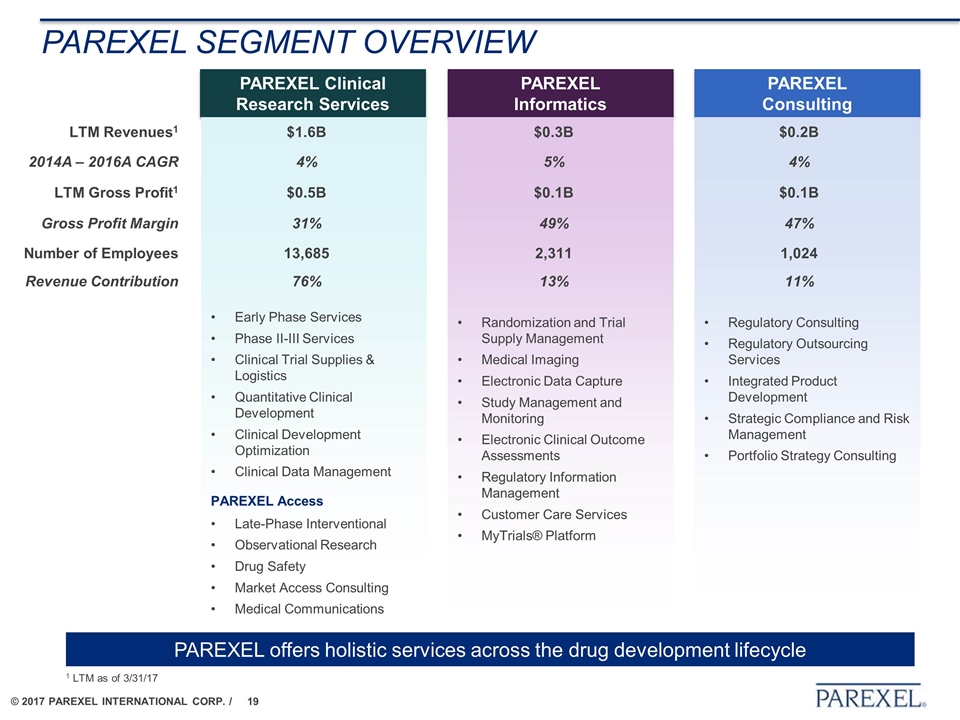
Parexel segment overview PAREXEL Clinical Research Services Early Phase Services Phase II-III Services Clinical Trial Supplies & Logistics Quantitative Clinical Development Clinical Development Optimization Clinical Data Management PAREXEL Access Late-Phase Interventional Observational Research Drug Safety Market Access Consulting Medical Communications PAREXEL Informatics Randomization and Trial Supply Management Medical Imaging Electronic Data Capture Study Management and Monitoring Electronic Clinical Outcome Assessments Regulatory Information Management Customer Care Services MyTrials® Platform PAREXEL Consulting Regulatory Consulting Regulatory Outsourcing Services Integrated Product Development Strategic Compliance and Risk Management Portfolio Strategy Consulting LTM Revenues1 $1.6B $0.3B $0.2B 2014A – 2016A CAGR 4% 5% 4% LTM Gross Profit1 $0.5B $0.1B $0.1B Gross Profit Margin 31% 49% 47% Number of Employees 13,685 2,311 1,024 Revenue Contribution 76% 13% 11% PAREXEL offers holistic services across the drug development lifecycle 1 LTM as of 3/31/17
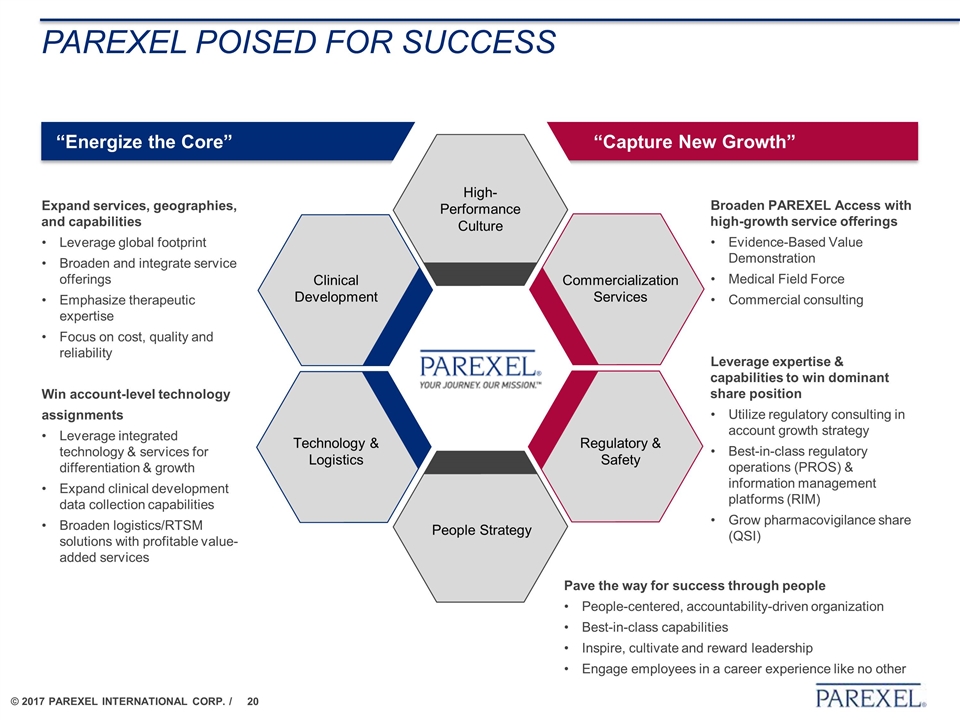
“Capture New Growth” “Energize the Core” PAREXEL poised for success Win account-level technology assignments Leverage integrated technology & services for differentiation & growth Expand clinical development data collection capabilities Broaden logistics/RTSM solutions with profitable value-added services Expand services, geographies, and capabilities Leverage global footprint Broaden and integrate service offerings Emphasize therapeutic expertise Focus on cost, quality and reliability Technology & Logistics Clinical Development People Strategy High-Performance Culture Commercialization Services Regulatory & Safety Pave the way for success through people People-centered, accountability-driven organization Best-in-class capabilities Inspire, cultivate and reward leadership Engage employees in a career experience like no other Broaden PAREXEL Access with high-growth service offerings Evidence-Based Value Demonstration Medical Field Force Commercial consulting Leverage expertise & capabilities to win dominant share position Utilize regulatory consulting in account growth strategy Best-in-class regulatory operations (PROS) & information management platforms (RIM) Grow pharmacovigilance share (QSI)
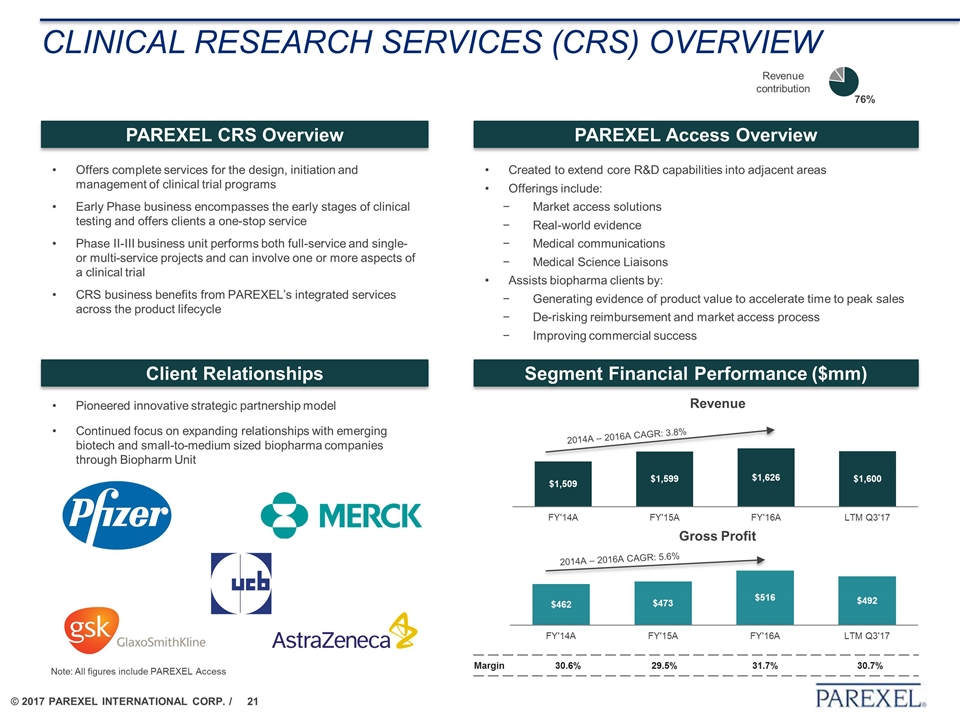
Clinical Research Services (CRS) overview Offers complete services for the design, initiation and management of clinical trial programs Early Phase business encompasses the early stages of clinical testing and offers clients a one-stop service Phase II-III business unit performs both full-service and single- or multi-service projects and can involve one or more aspects of a clinical trial CRS business benefits from PAREXEL’s integrated services across the product lifecycle PAREXEL CRS Overview PAREXEL Access Overview Revenue contribution Segment Financial Performance ($mm) Client Relationships Created to extend core R&D capabilities into adjacent areas Offerings include: Market access solutions Real-world evidence Medical communications Medical Science Liaisons Assists biopharma clients by: Generating evidence of product value to accelerate time to peak sales De-risking reimbursement and market access process Improving commercial success Pioneered innovative strategic partnership model Continued focus on expanding relationships with emerging biotech and small-to-medium sized biopharma companies through Biopharm Unit Revenue Gross Profit 2014A – 2016A CAGR: 5.6% 2014A – 2016A CAGR: 3.8% Margin 30.6% 29.5% 31.7% 30.7% Note: All figures include PAREXEL Access
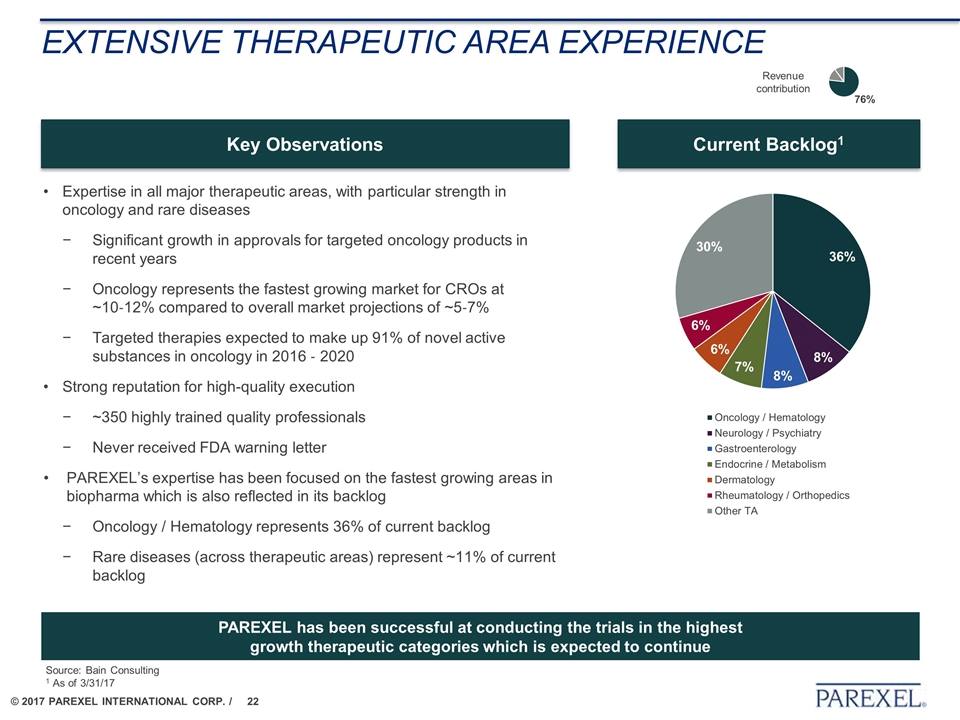
EXTENSIVE THERAPEUTIC AREA EXPERIENCE Expertise in all major therapeutic areas, with particular strength in oncology and rare diseases Significant growth in approvals for targeted oncology products in recent years Oncology represents the fastest growing market for CROs at ~10‐12% compared to overall market projections of ~5‐7% Targeted therapies expected to make up 91% of novel active substances in oncology in 2016 ‐ 2020 Strong reputation for high-quality execution ~350 highly trained quality professionals Never received FDA warning letter PAREXEL’s expertise has been focused on the fastest growing areas in biopharma which is also reflected in its backlog Oncology / Hematology represents 36% of current backlog Rare diseases (across therapeutic areas) represent ~11% of current backlog Current Backlog1 Key Observations PAREXEL has been successful at conducting the trials in the highest growth therapeutic categories which is expected to continue Revenue contribution Source: Bain Consulting 1 As of 3/31/17
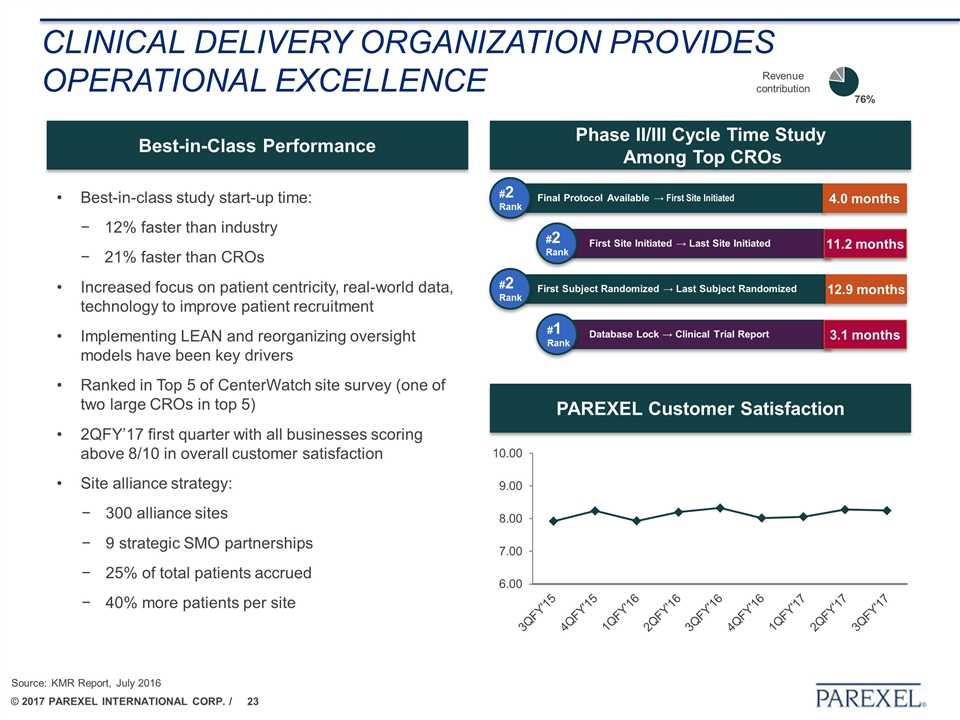
Clinical delivery organization PROVIDES Operational Excellence Best-in-class study start-up time: 12% faster than industry 21% faster than CROs Increased focus on patient centricity, real-world data, technology to improve patient recruitment Implementing LEAN and reorganizing oversight models have been key drivers Ranked in Top 5 of CenterWatch site survey (one of two large CROs in top 5) 2QFY’17 first quarter with all businesses scoring above 8/10 in overall customer satisfaction Site alliance strategy: 300 alliance sites 9 strategic SMO partnerships 25% of total patients accrued 40% more patients per site Best-in-Class Performance Phase II/III Cycle Time Study Among Top CROs PAREXEL Customer Satisfaction #2 Rank 4.0 months Final Protocol Available → First Site Initiated 11.2 months First Site Initiated → Last Site Initiated #2 Rank 12.9 months First Subject Randomized → Last Subject Randomized 3.1 months Database Lock → Clinical Trial Report #2 Rank #1 Rank Source: KMR Report, July 2016 Revenue contribution
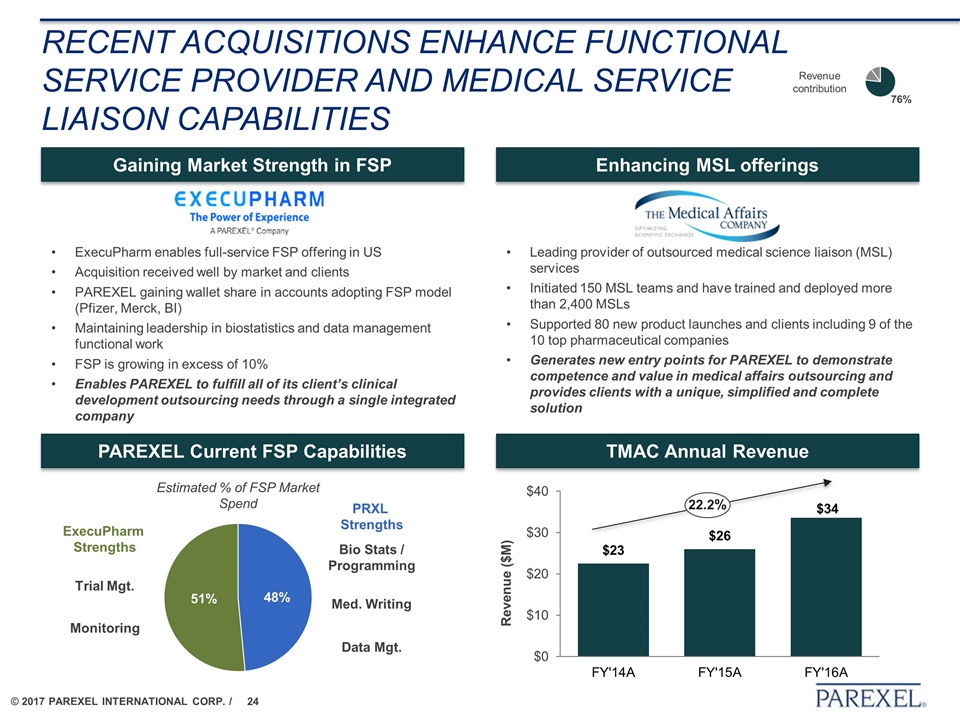
Recent acquisitions enhance Functional service provider and Medical service liaison capabilities ExecuPharm enables full-service FSP offering in US Acquisition received well by market and clients PAREXEL gaining wallet share in accounts adopting FSP model (Pfizer, Merck, BI) Maintaining leadership in biostatistics and data management functional work FSP is growing in excess of 10% Enables PAREXEL to fulfill all of its client’s clinical development outsourcing needs through a single integrated company Gaining Market Strength in FSP Med. Writing Data Mgt. Bio Stats / Programming Monitoring Trial Mgt. Estimated % of FSP Market Spend PRXL Strengths ExecuPharm Strengths PAREXEL Current FSP Capabilities Enhancing MSL offerings Leading provider of outsourced medical science liaison (MSL) services Initiated 150 MSL teams and have trained and deployed more than 2,400 MSLs Supported 80 new product launches and clients including 9 of the 10 top pharmaceutical companies Generates new entry points for PAREXEL to demonstrate competence and value in medical affairs outsourcing and provides clients with a unique, simplified and complete solution TMAC Annual Revenue 22.2% Revenue contribution
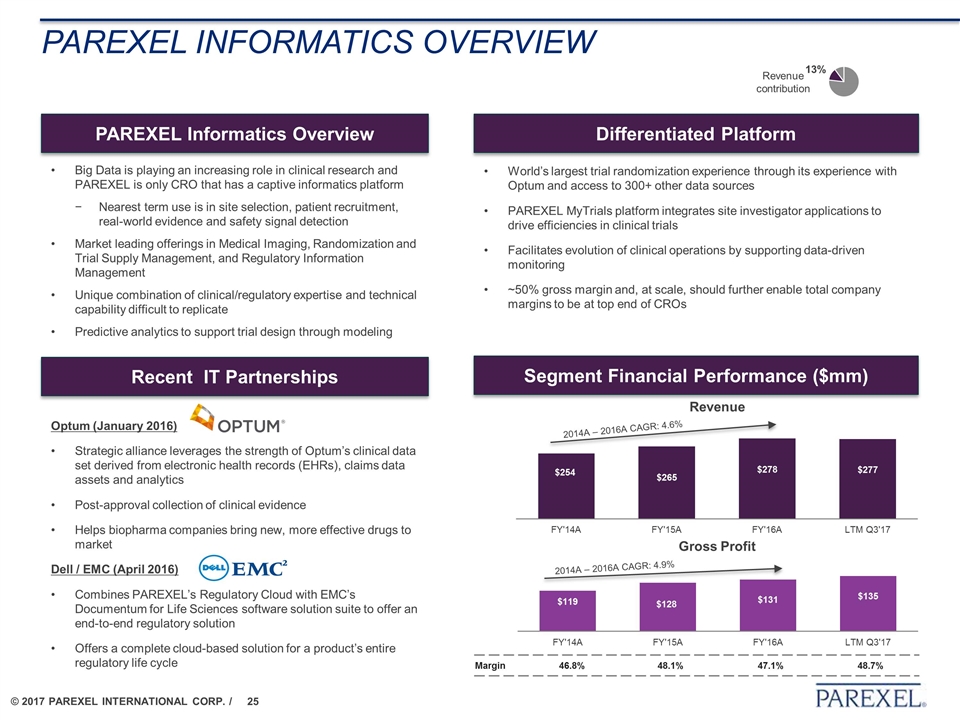
PAREXEL Informatics overview PAREXEL Informatics Overview World’s largest trial randomization experience through its experience with Optum and access to 300+ other data sources PAREXEL MyTrials platform integrates site investigator applications to drive efficiencies in clinical trials Facilitates evolution of clinical operations by supporting data-driven monitoring ~50% gross margin and, at scale, should further enable total company margins to be at top end of CROs Differentiated Platform Segment Financial Performance ($mm) Revenue contribution Recent IT Partnerships Optum (January 2016) Strategic alliance leverages the strength of Optum’s clinical data set derived from electronic health records (EHRs), claims data assets and analytics Post-approval collection of clinical evidence Helps biopharma companies bring new, more effective drugs to market Dell / EMC (April 2016) Combines PAREXEL’s Regulatory Cloud with EMC’s Documentum for Life Sciences software solution suite to offer an end-to-end regulatory solution Offers a complete cloud-based solution for a product’s entire regulatory life cycle Big Data is playing an increasing role in clinical research and PAREXEL is only CRO that has a captive informatics platform Nearest term use is in site selection, patient recruitment, real-world evidence and safety signal detection Market leading offerings in Medical Imaging, Randomization and Trial Supply Management, and Regulatory Information Management Unique combination of clinical/regulatory expertise and technical capability difficult to replicate Predictive analytics to support trial design through modeling Revenue Gross Profit 2014A – 2016A CAGR: 4.6% 2014A – 2016A CAGR: 4.9% Margin 46.8% 48.1% 47.1% 48.7%
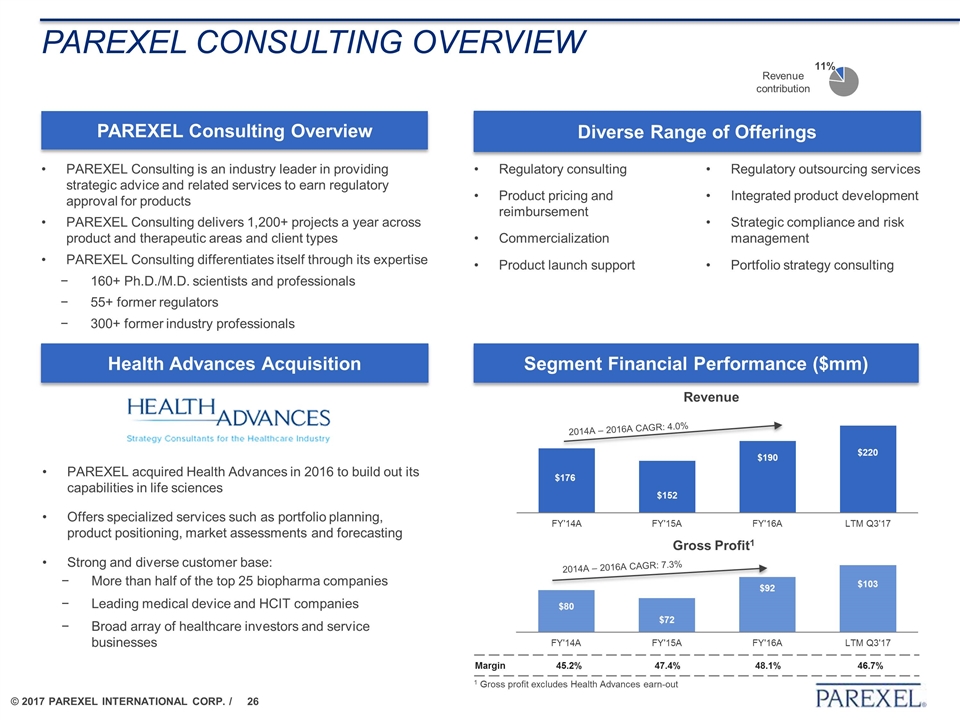
PAREXEL Consulting overview PAREXEL Consulting Overview PAREXEL Consulting is an industry leader in providing strategic advice and related services to earn regulatory approval for products PAREXEL Consulting delivers 1,200+ projects a year across product and therapeutic areas and client types PAREXEL Consulting differentiates itself through its expertise 160+ Ph.D./M.D. scientists and professionals 55+ former regulators 300+ former industry professionals Diverse Range of Offerings Segment Financial Performance ($mm) Revenue contribution Health Advances Acquisition Regulatory consulting Product pricing and reimbursement Commercialization Product launch support PAREXEL acquired Health Advances in 2016 to build out its capabilities in life sciences Offers specialized services such as portfolio planning, product positioning, market assessments and forecasting Strong and diverse customer base: More than half of the top 25 biopharma companies Leading medical device and HCIT companies Broad array of healthcare investors and service businesses Regulatory outsourcing services Integrated product development Strategic compliance and risk management Portfolio strategy consulting Revenue Gross Profit1 2014A – 2016A CAGR: 4.0% 2014A – 2016A CAGR: 7.3% 1 Gross profit excludes Health Advances earn-out Margin 45.2% 47.4% 48.1% 46.7%

Key credit highlights
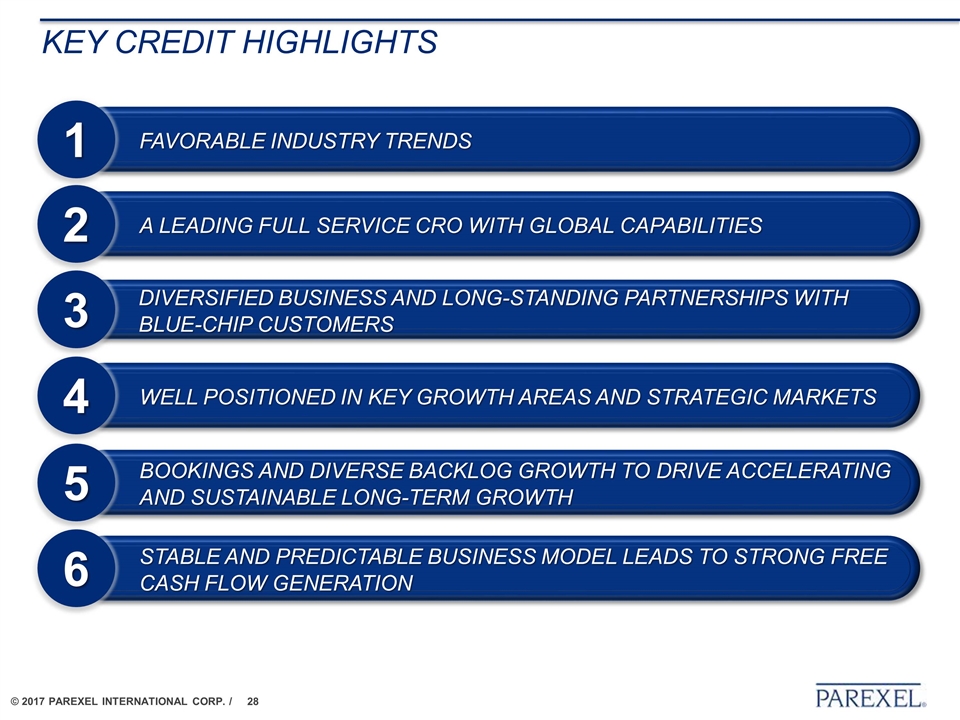
Key credit highlights DIVERSIFIED BUSINESS AND LONG-STANDING PARTNERSHIPS WITH BLUE-CHIP CUSTOMERS 3 A LEADING FULL SERVICE CRO WITH GLOBAL CAPABILITIES 2 WELL POSITIONED IN KEY GROWTH AREAS AND STRATEGIC MARKETS 4 FAVORABLE INDUSTRY TRENDS 1 BOOKINGS AND DIVERSE BACKLOG GROWTH TO DRIVE ACCELERATING AND SUSTAINABLE LONG-TERM GROWTH 5 STABLE AND PREDICTABLE BUSINESS MODEL LEADS TO STRONG FREE CASH FLOW GENERATION 6
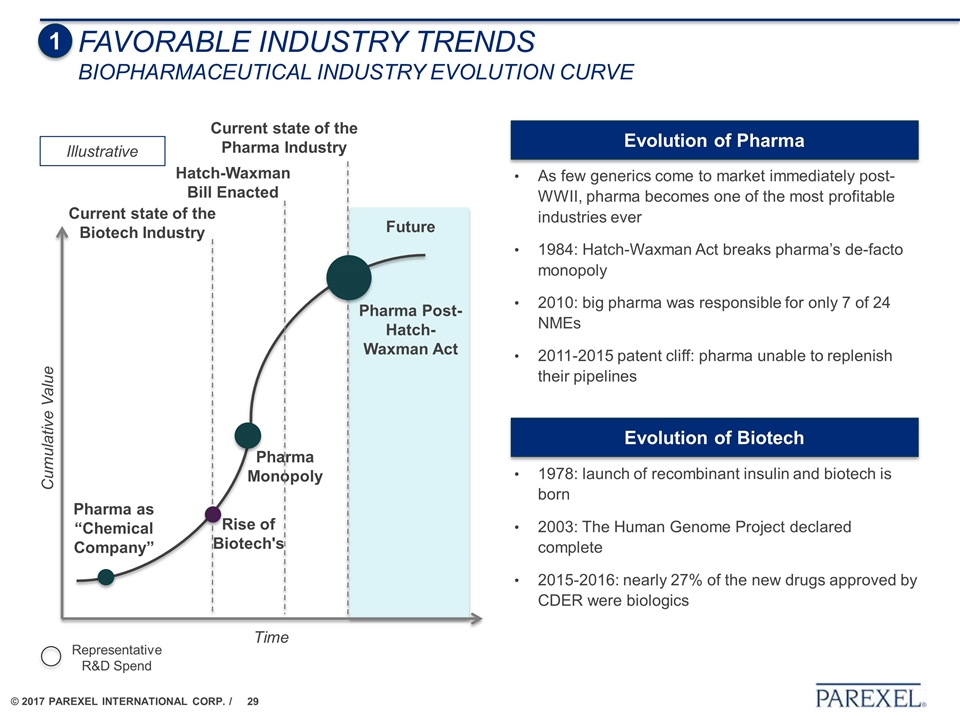
Time Cumulative Value Pharma as “Chemical Company” Pharma Monopoly Pharma Post-Hatch-Waxman Act Rise of Biotech's Future Illustrative Current state of the Pharma Industry Representative R&D Spend Current state of the Biotech Industry Hatch-Waxman Bill Enacted As few generics come to market immediately post-WWII, pharma becomes one of the most profitable industries ever 1984: Hatch-Waxman Act breaks pharma’s de-facto monopoly 2010: big pharma was responsible for only 7 of 24 NMEs 2011-2015 patent cliff: pharma unable to replenish their pipelines Evolution of Pharma 1978: launch of recombinant insulin and biotech is born 2003: The Human Genome Project declared complete 2015-2016: nearly 27% of the new drugs approved by CDER were biologics Evolution of Biotech 1 FAVORABLE INDUSTRY TRENDS Biopharmaceutical Industry Evolution Curve
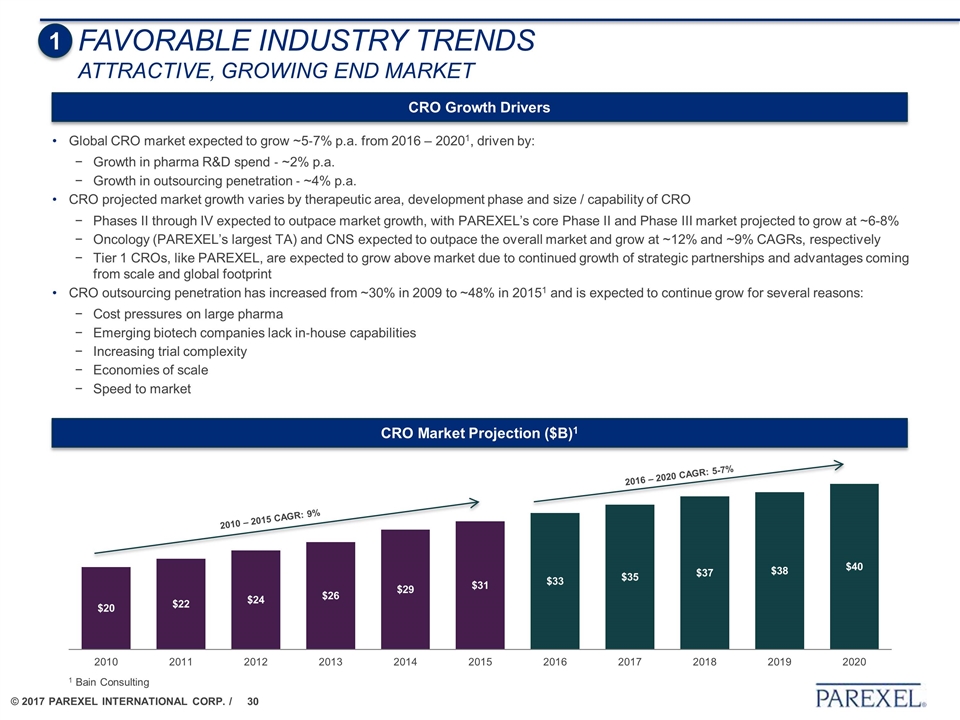
1 FAVORABLE INDUSTRY TRENDS Attractive, growing end market CRO Market Projection ($B)1 1 Bain Consulting CRO Growth Drivers Global CRO market expected to grow ~5‐7% p.a. from 2016 – 20201, driven by: Growth in pharma R&D spend ‐ ~2% p.a. Growth in outsourcing penetration ‐ ~4% p.a. CRO projected market growth varies by therapeutic area, development phase and size / capability of CRO Phases II through IV expected to outpace market growth, with PAREXEL’s core Phase II and Phase III market projected to grow at ~6-8% Oncology (PAREXEL’s largest TA) and CNS expected to outpace the overall market and grow at ~12% and ~9% CAGRs, respectively Tier 1 CROs, like PAREXEL, are expected to grow above market due to continued growth of strategic partnerships and advantages coming from scale and global footprint CRO outsourcing penetration has increased from ~30% in 2009 to ~48% in 20151 and is expected to continue grow for several reasons: Cost pressures on large pharma Emerging biotech companies lack in‐house capabilities Increasing trial complexity Economies of scale Speed to market 2010 – 2015 CAGR: 9% 2016 – 2020 CAGR: 5-7%
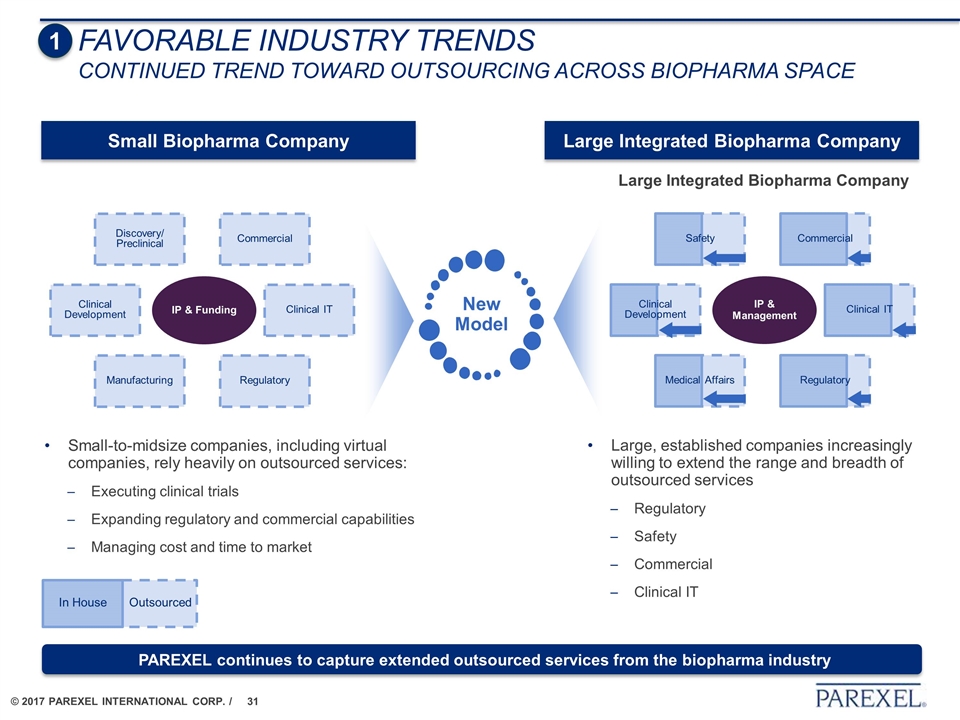
IP & Funding Clinical Development Manufacturing Commercial Regulatory Discovery/ Preclinical Clinical IT Large, established companies increasingly willing to extend the range and breadth of outsourced services Regulatory Safety Commercial Clinical IT Large Integrated Biopharma Company Small-to-midsize companies, including virtual companies, rely heavily on outsourced services: Executing clinical trials Expanding regulatory and commercial capabilities Managing cost and time to market New Model Outsourced In House IP & Management Clinical Development Medical Affairs Commercial Regulatory Safety Clinical IT Large Integrated Biopharma Company Small Biopharma Company FAVORABLE INDUSTRY TRENDS Continued trend toward outsourcing across biopharma space 1 PAREXEL continues to capture extended outsourced services from the biopharma industry
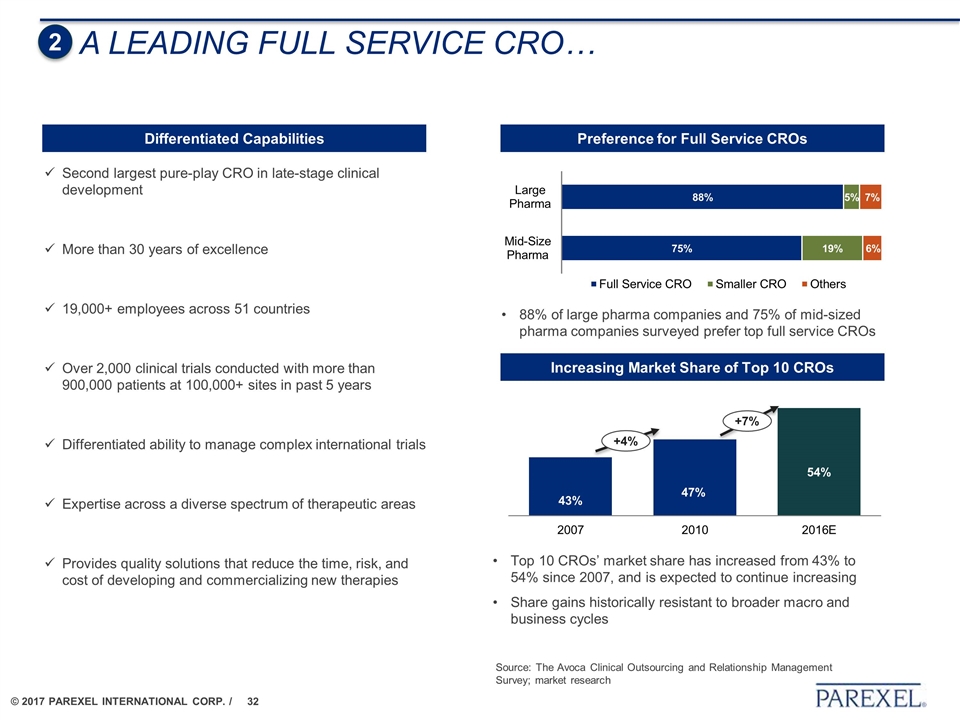
A LEADING FULL SERVICE CRO… Second largest pure-play CRO in late-stage clinical development More than 30 years of excellence 19,000+ employees across 51 countries Over 2,000 clinical trials conducted with more than 900,000 patients at 100,000+ sites in past 5 years Differentiated ability to manage complex international trials Expertise across a diverse spectrum of therapeutic areas Provides quality solutions that reduce the time, risk, and cost of developing and commercializing new therapies Differentiated Capabilities 2 Preference for Full Service CROs Increasing Market Share of Top 10 CROs 88% of large pharma companies and 75% of mid-sized pharma companies surveyed prefer top full service CROs +4% +7% Top 10 CROs’ market share has increased from 43% to 54% since 2007, and is expected to continue increasing Share gains historically resistant to broader macro and business cycles Source: The Avoca Clinical Outsourcing and Relationship Management Survey; market research
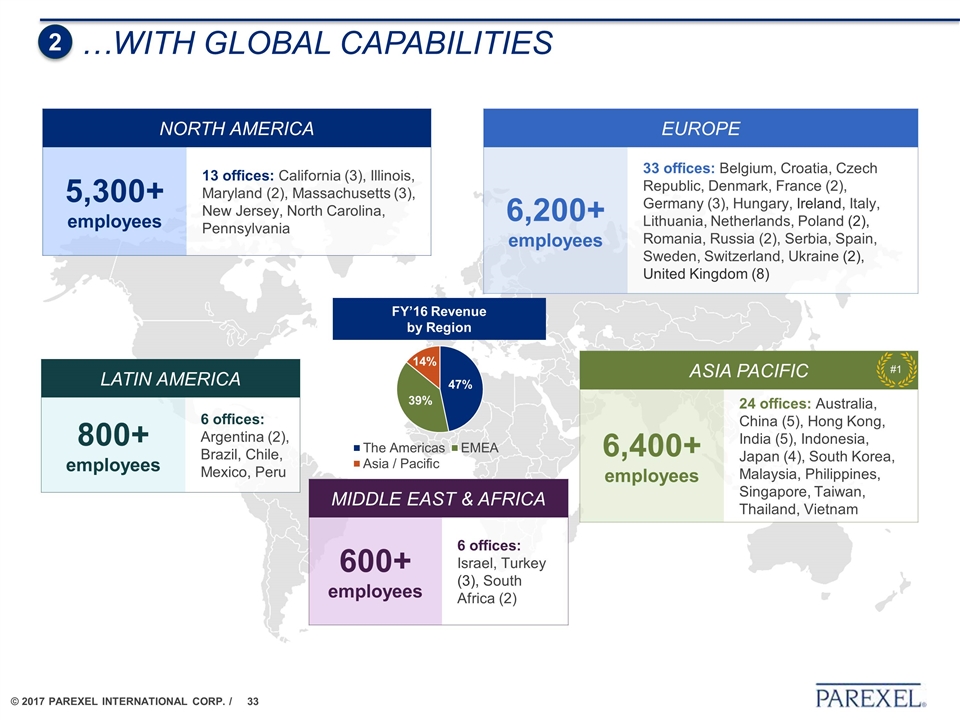
…With global capabilities 2 NORTH AMERICA 5,300+ employees 13 offices: California (3), Illinois, Maryland (2), Massachusetts (3), New Jersey, North Carolina, Pennsylvania LATIN AMERICA 800+ employees 6 offices: Argentina (2), Brazil, Chile, Mexico, Peru EUROPE 6,200+ employees 33 offices: Belgium, Croatia, Czech Republic, Denmark, France (2), Germany (3), Hungary, Ireland, Italy, Lithuania, Netherlands, Poland (2), Romania, Russia (2), Serbia, Spain, Sweden, Switzerland, Ukraine (2), United Kingdom (8) ASIA PACIFIC 6,400+ employees 24 offices: Australia, China (5), Hong Kong, India (5), Indonesia, Japan (4), South Korea, Malaysia, Philippines, Singapore, Taiwan, Thailand, Vietnam MIDDLE EAST & AFRICA 600+ employees 6 offices: Israel, Turkey (3), South Africa (2) FY’16 Revenue by Region #1
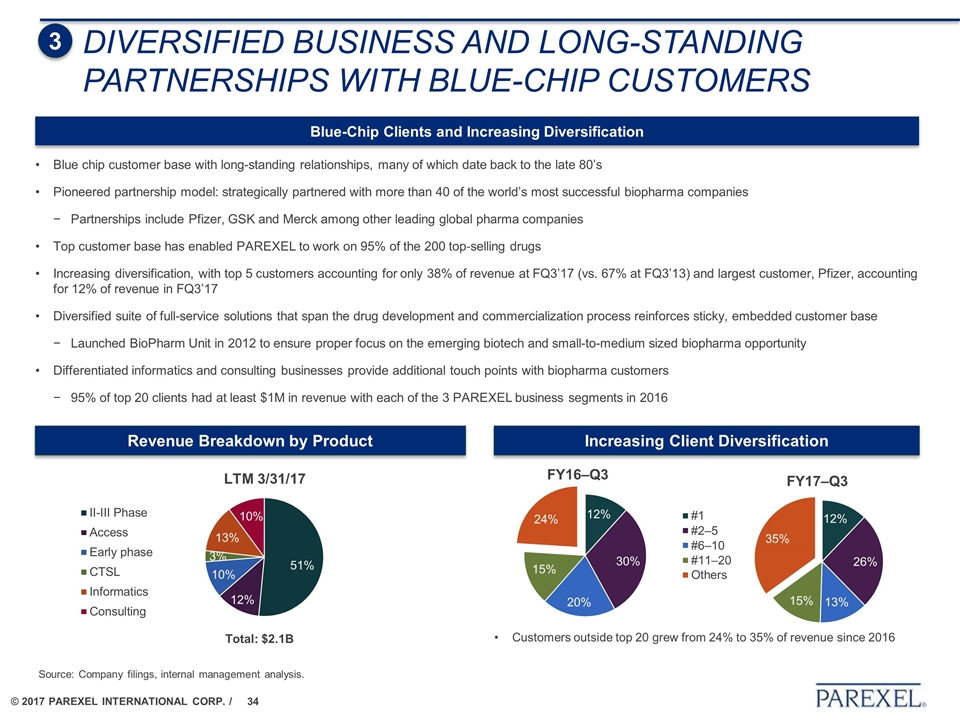
DIVERSIFIED BUSINESS AND LONG-STANDING PARTNERSHIPS WITH BLUE-CHIP CUSTOMERS 3 Source: Company filings, internal management analysis. Revenue Breakdown by Product Increasing Client Diversification Total: $2.1B Customers outside top 20 grew from 24% to 35% of revenue since 2016 Blue-Chip Clients and Increasing Diversification Blue chip customer base with long-standing relationships, many of which date back to the late 80’s Pioneered partnership model: strategically partnered with more than 40 of the world’s most successful biopharma companies Partnerships include Pfizer, GSK and Merck among other leading global pharma companies Top customer base has enabled PAREXEL to work on 95% of the 200 top‐selling drugs Increasing diversification, with top 5 customers accounting for only 38% of revenue at FQ3’17 (vs. 67% at FQ3’13) and largest customer, Pfizer, accounting for 12% of revenue in FQ3’17 Diversified suite of full-service solutions that span the drug development and commercialization process reinforces sticky, embedded customer base Launched BioPharm Unit in 2012 to ensure proper focus on the emerging biotech and small-to-medium sized biopharma opportunity Differentiated informatics and consulting businesses provide additional touch points with biopharma customers 95% of top 20 clients had at least $1M in revenue with each of the 3 PAREXEL business segments in 2016
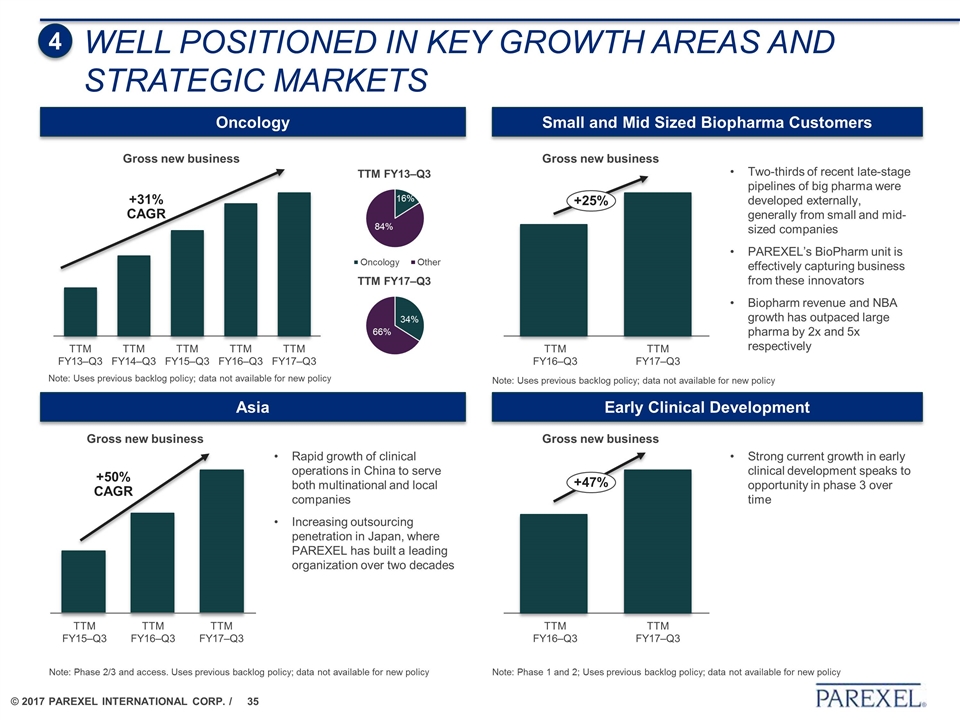
WELL POSITIONED IN KEY GROWTH AREAS AND STRATEGIC MARKETS Small and Mid Sized Biopharma Customers Early Clinical Development Oncology Asia +31% CAGR Note: Uses previous backlog policy; data not available for new policy Gross new business Gross new business Note: Uses previous backlog policy; data not available for new policy Two-thirds of recent late-stage pipelines of big pharma were developed externally, generally from small and mid-sized companies PAREXEL’s BioPharm unit is effectively capturing business from these innovators Biopharm revenue and NBA growth has outpaced large pharma by 2x and 5x respectively +25% Strong current growth in early clinical development speaks to opportunity in phase 3 over time Rapid growth of clinical operations in China to serve both multinational and local companies Increasing outsourcing penetration in Japan, where PAREXEL has built a leading organization over two decades Note: Phase 2/3 and access. Uses previous backlog policy; data not available for new policy Note: Phase 1 and 2; Uses previous backlog policy; data not available for new policy Gross new business +47% Gross new business +50% CAGR 4
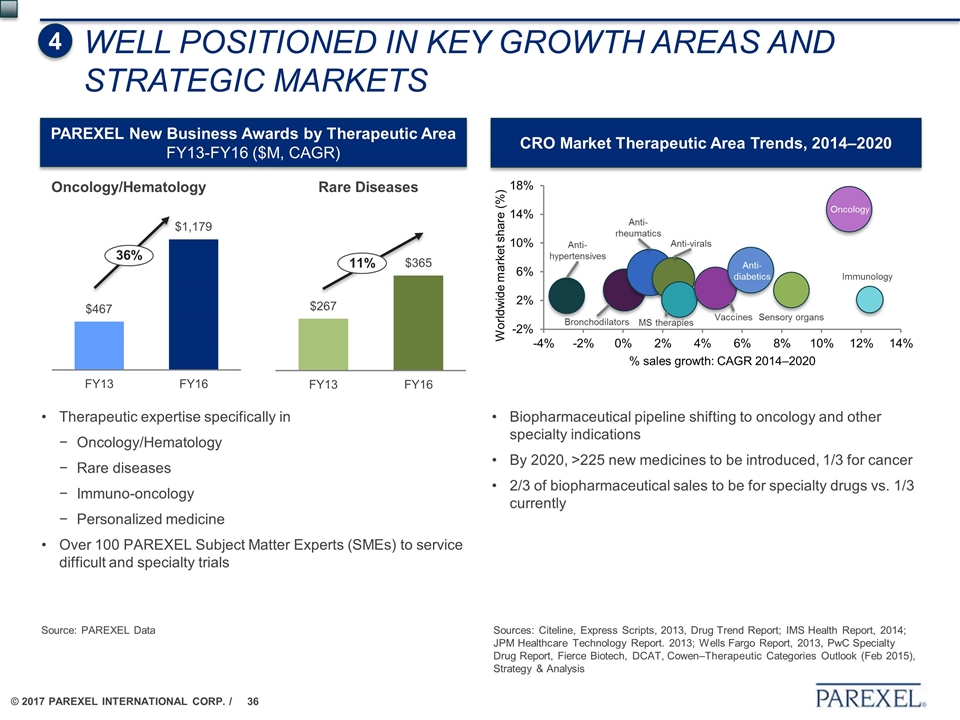
Oncology/Hematology Rare Diseases Sources: Citeline, Express Scripts, 2013, Drug Trend Report; IMS Health Report, 2014; JPM Healthcare Technology Report. 2013; Wells Fargo Report, 2013, PwC Specialty Drug Report, Fierce Biotech, DCAT, Cowen–Therapeutic Categories Outlook (Feb 2015), Strategy & Analysis 36% 11% PAREXEL New Business Awards by Therapeutic Area FY13-FY16 ($M, CAGR) Therapeutic expertise specifically in Oncology/Hematology Rare diseases Immuno-oncology Personalized medicine Over 100 PAREXEL Subject Matter Experts (SMEs) to service difficult and specialty trials CRO Market Therapeutic Area Trends, 2014–2020 Biopharmaceutical pipeline shifting to oncology and other specialty indications By 2020, >225 new medicines to be introduced, 1/3 for cancer 2/3 of biopharmaceutical sales to be for specialty drugs vs. 1/3 currently Anti- hypertensives Anti- rheumatics Bronchodilators Anti-virals Anti- diabetics Sensory organs Immunology Oncology Vaccines MS therapies WELL POSITIONED IN KEY GROWTH AREAS AND STRATEGIC MARKETS 4 Source: PAREXEL Data
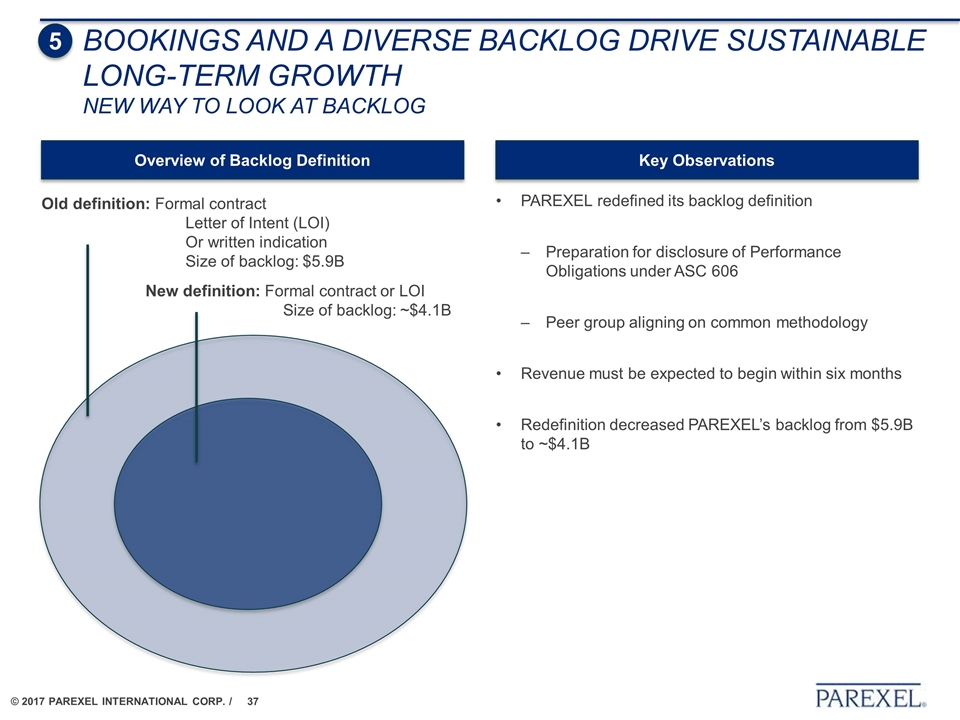
PAREXEL redefined its backlog definition Preparation for disclosure of Performance Obligations under ASC 606 Peer group aligning on common methodology Revenue must be expected to begin within six months Redefinition decreased PAREXEL’s backlog from $5.9B to ~$4.1B Old definition: Formal contract Letter of Intent (LOI) Or written indication Size of backlog: $5.9B New definition: Formal contract or LOI Size of backlog: ~$4.1B Overview of Backlog Definition Key Observations 5 BOOKINGS AND a diverse BACKLOG DRIVE Sustainable LONG-TERM GROWTH New way to look at backlog
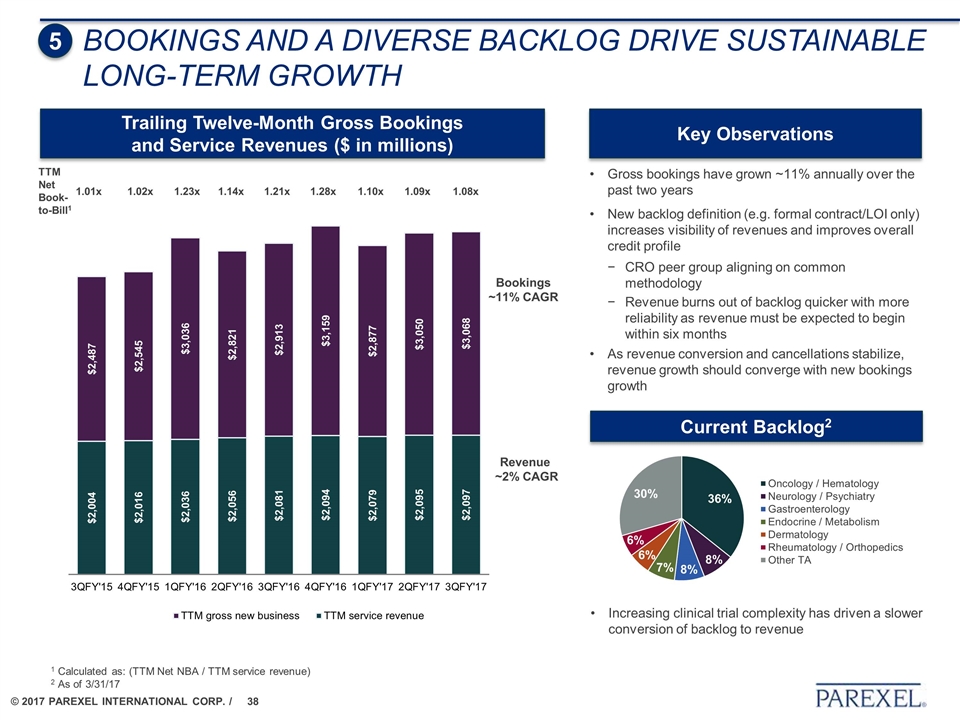
BOOKINGS AND a diverse BACKLOG DRIVE Sustainable LONG-TERM GROWTH Gross bookings have grown ~11% annually over the past two years New backlog definition (e.g. formal contract/LOI only) increases visibility of revenues and improves overall credit profile CRO peer group aligning on common methodology Revenue burns out of backlog quicker with more reliability as revenue must be expected to begin within six months As revenue conversion and cancellations stabilize, revenue growth should converge with new bookings growth 5 Trailing Twelve-Month Gross Bookings and Service Revenues ($ in millions) Key Observations TTM Net Book-to-Bill1 1.01x 1.02x 1.23x 1.14x 1.21x 1.28x 1.10x 1.09x 1.08x 1 Calculated as: (TTM Net NBA / TTM service revenue) 2 As of 3/31/17 Bookings ~11% CAGR Revenue ~2% CAGR Current Backlog2 Increasing clinical trial complexity has driven a slower conversion of backlog to revenue
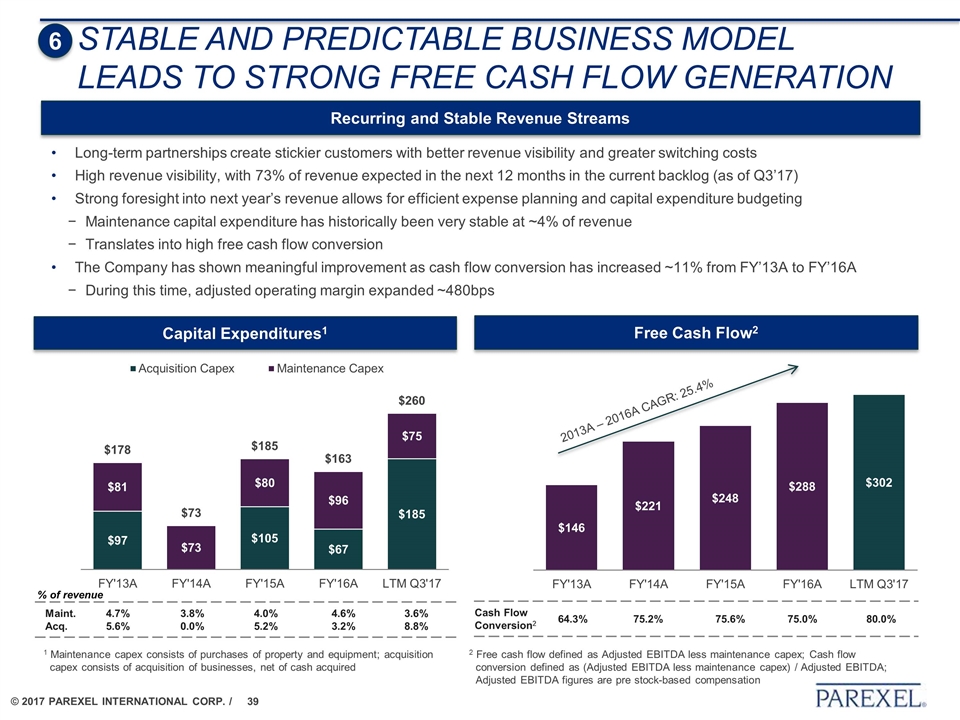
STABLE AND PREDICTABLE BUSINESS model leads to STRONG FREE CASH FLOW GENERATION Cash Flow Conversion2 64.3% 75.2% 75.6% 75.0% 80.0% Recurring and Stable Revenue Streams Free Cash Flow2 Long-term partnerships create stickier customers with better revenue visibility and greater switching costs High revenue visibility, with 73% of revenue expected in the next 12 months in the current backlog (as of Q3’17) Strong foresight into next year’s revenue allows for efficient expense planning and capital expenditure budgeting Maintenance capital expenditure has historically been very stable at ~4% of revenue Translates into high free cash flow conversion The Company has shown meaningful improvement as cash flow conversion has increased ~11% from FY’13A to FY’16A During this time, adjusted operating margin expanded ~480bps 2 Free cash flow defined as Adjusted EBITDA less maintenance capex; Cash flow conversion defined as (Adjusted EBITDA less maintenance capex) / Adjusted EBITDA; Adjusted EBITDA figures are pre stock-based compensation 2013A – 2016A CAGR: 25.4% 6 Capital Expenditures1 % of revenue Maint. Acq. 4.7% 5.6% 3.8% 0.0% 4.0% 5.2% 4.6% 3.2% 3.6% 8.8% 1 Maintenance capex consists of purchases of property and equipment; acquisition capex consists of acquisition of businesses, net of cash acquired

financials historical
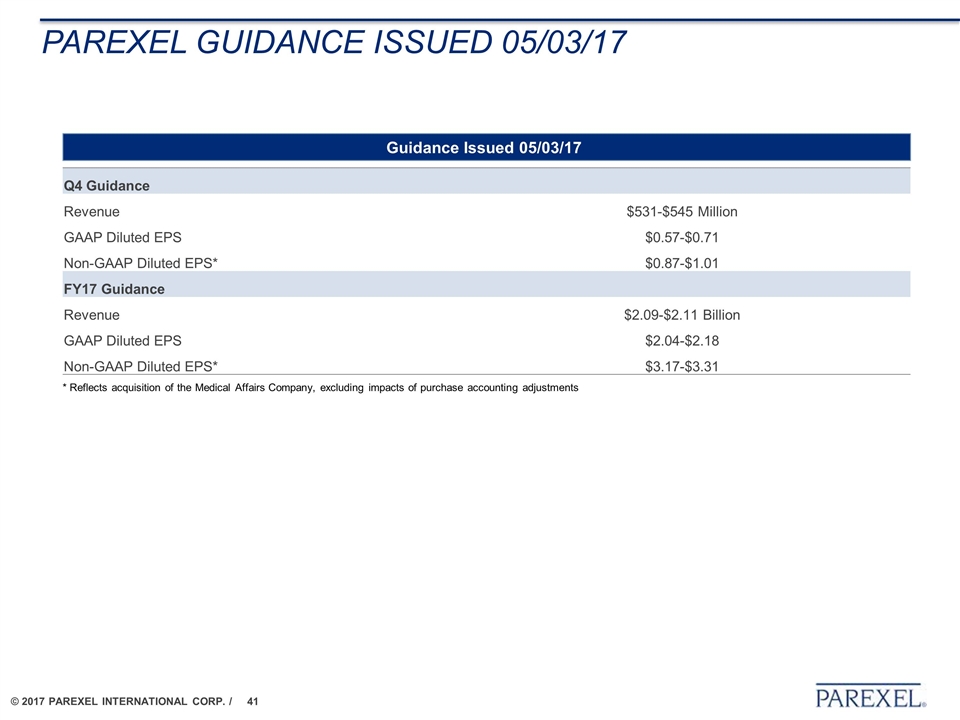
Parexel guidance issued 05/03/17 Q4 Guidance Revenue $531-$545 Million GAAP Diluted EPS $0.57-$0.71 Non-GAAP Diluted EPS* $0.87-$1.01 FY17 Guidance Revenue $2.09-$2.11 Billion GAAP Diluted EPS $2.04-$2.18 Non-GAAP Diluted EPS* $3.17-$3.31 Guidance Issued 05/03/17 * Reflects acquisition of the Medical Affairs Company, excluding impacts of purchase accounting adjustments
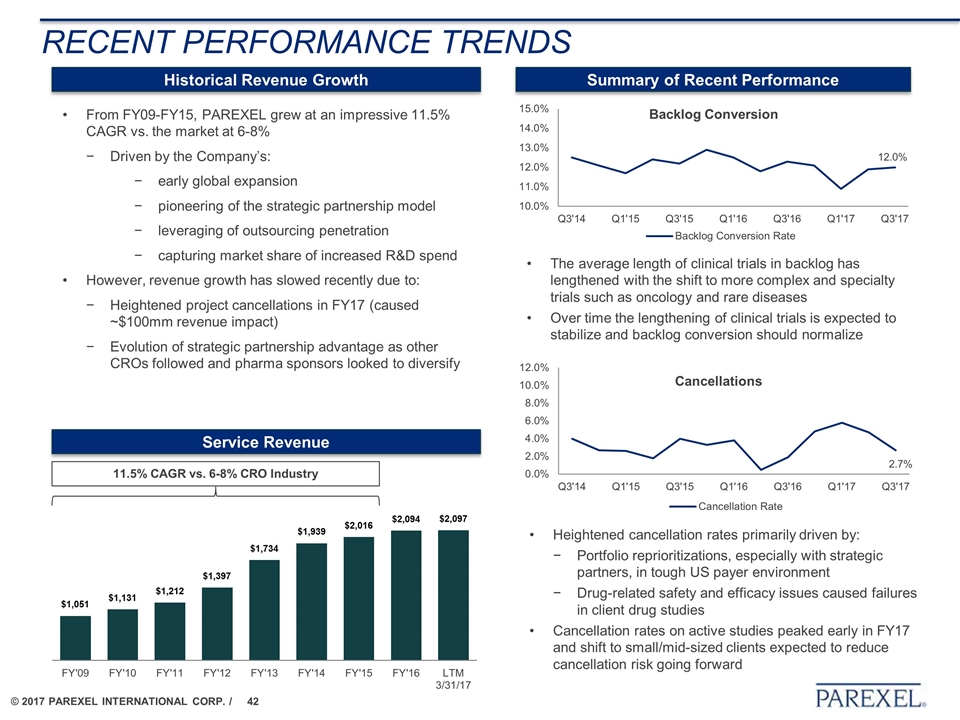
RECENT PERFORMANCE TRENDS Historical Revenue Growth Summary of Recent Performance From FY09-FY15, PAREXEL grew at an impressive 11.5% CAGR vs. the market at 6-8% Driven by the Company’s: early global expansion pioneering of the strategic partnership model leveraging of outsourcing penetration capturing market share of increased R&D spend However, revenue growth has slowed recently due to: Heightened project cancellations in FY17 (caused ~$100mm revenue impact) Evolution of strategic partnership advantage as other CROs followed and pharma sponsors looked to diversify The average length of clinical trials in backlog has lengthened with the shift to more complex and specialty trials such as oncology and rare diseases Over time the lengthening of clinical trials is expected to stabilize and backlog conversion should normalize 11.5% CAGR vs. 6-8% CRO Industry Service Revenue Backlog Conversion Cancellations Heightened cancellation rates primarily driven by: Portfolio reprioritizations, especially with strategic partners, in tough US payer environment Drug-related safety and efficacy issues caused failures in client drug studies Cancellation rates on active studies peaked early in FY17 and shift to small/mid-sized clients expected to reduce cancellation risk going forward 12.0% 2.7%
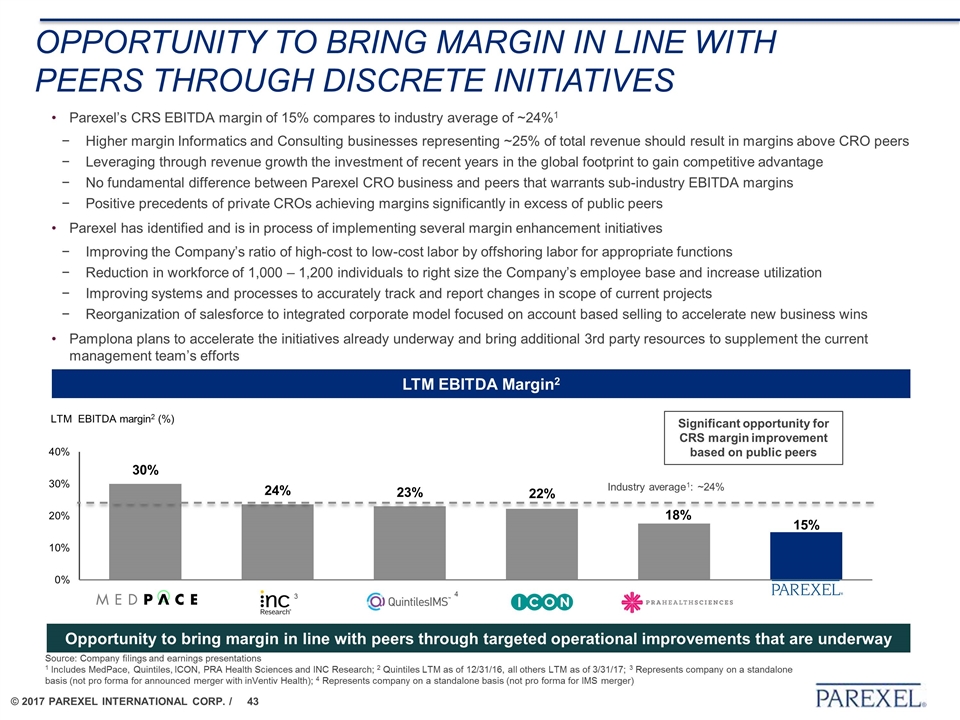
OPPORTUNITY TO BRING MARGIN IN LINE WITH PEERS THROUGH DISCRETE INITIATIVES Parexel’s CRS EBITDA margin of 15% compares to industry average of ~24%1 Higher margin Informatics and Consulting businesses representing ~25% of total revenue should result in margins above CRO peers Leveraging through revenue growth the investment of recent years in the global footprint to gain competitive advantage No fundamental difference between Parexel CRO business and peers that warrants sub-industry EBITDA margins Positive precedents of private CROs achieving margins significantly in excess of public peers Parexel has identified and is in process of implementing several margin enhancement initiatives Improving the Company’s ratio of high-cost to low-cost labor by offshoring labor for appropriate functions Reduction in workforce of 1,000 – 1,200 individuals to right size the Company’s employee base and increase utilization Improving systems and processes to accurately track and report changes in scope of current projects Reorganization of salesforce to integrated corporate model focused on account based selling to accelerate new business wins Pamplona plans to accelerate the initiatives already underway and bring additional 3rd party resources to supplement the current management team’s efforts Opportunity to bring margin in line with peers through targeted operational improvements that are underway Source: Company filings and earnings presentations 1 Includes MedPace, Quintiles, ICON, PRA Health Sciences and INC Research; 2 Quintiles LTM as of 12/31/16, all others LTM as of 3/31/17; 3 Represents company on a standalone basis (not pro forma for announced merger with inVentiv Health); 4 Represents company on a standalone basis (not pro forma for IMS merger) 3 Industry average1: ~24% Significant opportunity for CRS margin improvement based on public peers LTM EBITDA Margin2 4
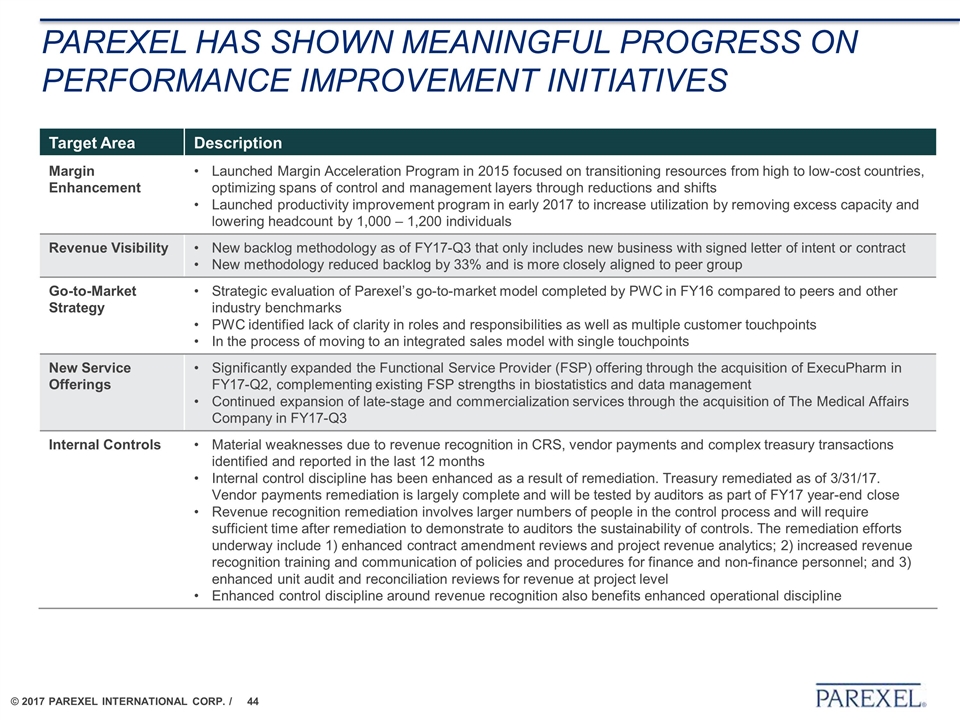
PaREXEl has shown meaningful progress on performance improvement initiatives Target Area Description Margin Enhancement Launched Margin Acceleration Program in 2015 focused on transitioning resources from high to low-cost countries, optimizing spans of control and management layers through reductions and shifts Launched productivity improvement program in early 2017 to increase utilization by removing excess capacity and lowering headcount by 1,000 – 1,200 individuals Revenue Visibility New backlog methodology as of FY17-Q3 that only includes new business with signed letter of intent or contract New methodology reduced backlog by 33% and is more closely aligned to peer group Go-to-Market Strategy Strategic evaluation of Parexel’s go-to-market model completed by PWC in FY16 compared to peers and other industry benchmarks PWC identified lack of clarity in roles and responsibilities as well as multiple customer touchpoints In the process of moving to an integrated sales model with single touchpoints New Service Offerings Significantly expanded the Functional Service Provider (FSP) offering through the acquisition of ExecuPharm in FY17-Q2, complementing existing FSP strengths in biostatistics and data management Continued expansion of late-stage and commercialization services through the acquisition of The Medical Affairs Company in FY17-Q3 Internal Controls Material weaknesses due to revenue recognition in CRS, vendor payments and complex treasury transactions identified and reported in the last 12 months Internal control discipline has been enhanced as a result of remediation. Treasury remediated as of 3/31/17. Vendor payments remediation is largely complete and will be tested by auditors as part of FY17 year-end close Revenue recognition remediation involves larger numbers of people in the control process and will require sufficient time after remediation to demonstrate to auditors the sustainability of controls. The remediation efforts underway include 1) enhanced contract amendment reviews and project revenue analytics; 2) increased revenue recognition training and communication of policies and procedures for finance and non-finance personnel; and 3) enhanced unit audit and reconciliation reviews for revenue at project level Enhanced control discipline around revenue recognition also benefits enhanced operational discipline
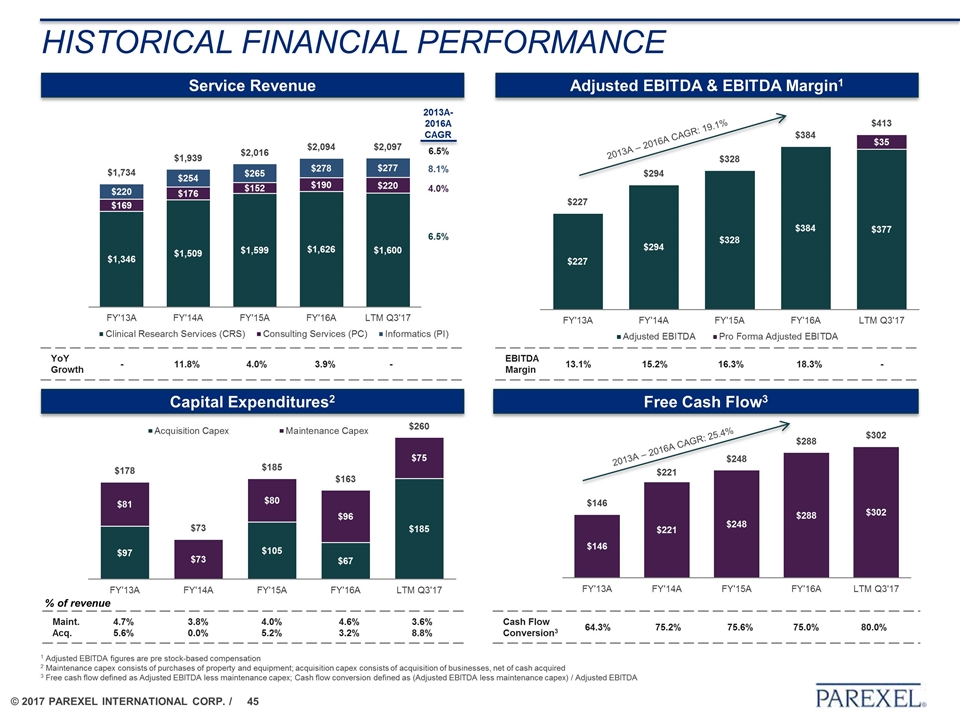
HISTORICAL FINANCIAL PERFORMANCE Service Revenue Adjusted EBITDA & EBITDA Margin1 Capital Expenditures2 Free Cash Flow3 EBITDA Margin 13.1% 15.2% 16.3% 18.3% - YoY Growth - 11.8% 4.0% 3.9% - % of revenue Maint. Acq. 4.7% 5.6% 3.8% 0.0% 4.0% 5.2% 4.6% 3.2% 3.6% 8.8% Cash Flow Conversion3 64.3% 75.2% 75.6% 75.0% 80.0% 2013A – 2016A CAGR: 25.4% 2013A – 2016A CAGR: 19.1% 1 Adjusted EBITDA figures are pre stock-based compensation 2 Maintenance capex consists of purchases of property and equipment; acquisition capex consists of acquisition of businesses, net of cash acquired 3 Free cash flow defined as Adjusted EBITDA less maintenance capex; Cash flow conversion defined as (Adjusted EBITDA less maintenance capex) / Adjusted EBITDA
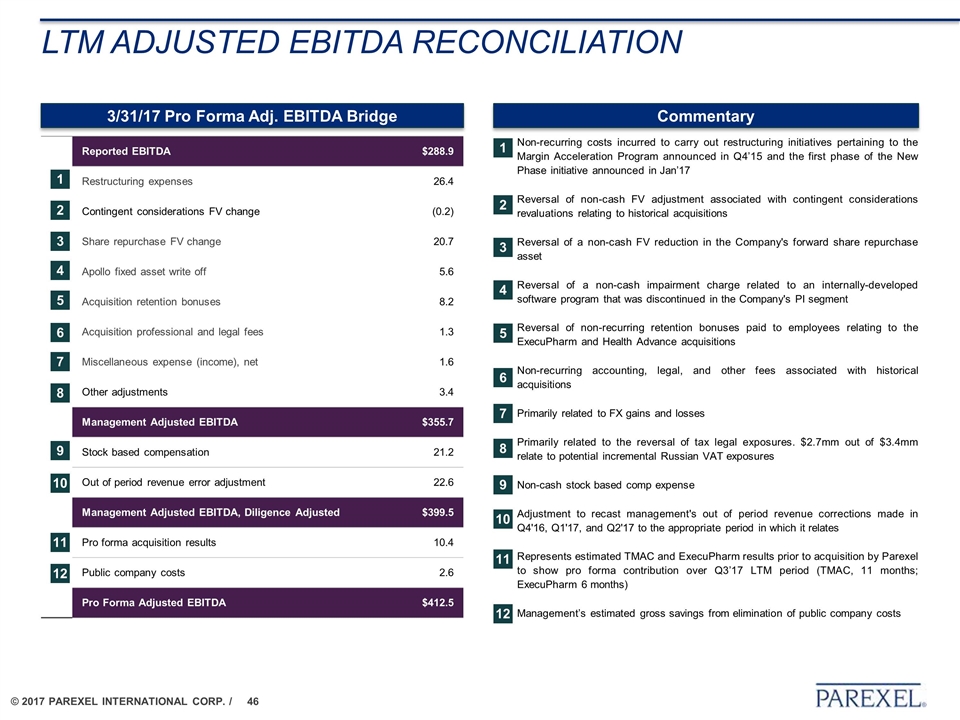
Non-recurring costs incurred to carry out restructuring initiatives pertaining to the Margin Acceleration Program announced in Q4’15 and the first phase of the New Phase initiative announced in Jan’17 Reversal of non-cash FV adjustment associated with contingent considerations revaluations relating to historical acquisitions Reversal of a non-cash FV reduction in the Company's forward share repurchase asset Reversal of a non-cash impairment charge related to an internally-developed software program that was discontinued in the Company's PI segment Reversal of non-recurring retention bonuses paid to employees relating to the ExecuPharm and Health Advance acquisitions Non-recurring accounting, legal, and other fees associated with historical acquisitions Primarily related to FX gains and losses Primarily related to the reversal of tax legal exposures. $2.7mm out of $3.4mm relate to potential incremental Russian VAT exposures Non-cash stock based comp expense Adjustment to recast management's out of period revenue corrections made in Q4'16, Q1'17, and Q2'17 to the appropriate period in which it relates Represents estimated TMAC and ExecuPharm results prior to acquisition by Parexel to show pro forma contribution over Q3’17 LTM period (TMAC, 11 months; ExecuPharm 6 months) Management’s estimated gross savings from elimination of public company costs Reported EBITDA $288.9 Restructuring expenses 26.4 Contingent considerations FV change (0.2) Share repurchase FV change 20.7 Apollo fixed asset write off 5.6 Acquisition retention bonuses 8.2 Acquisition professional and legal fees 1.3 Miscellaneous expense (income), net 1.6 Other adjustments 3.4 Management Adjusted EBITDA $355.7 Stock based compensation 21.2 Out of period revenue error adjustment 22.6 Management Adjusted EBITDA, Diligence Adjusted $399.5 Pro forma acquisition results 10.4 Public company costs 2.6 Pro Forma Adjusted EBITDA $412.5 LTM adjusted ebitda reconciliation 1 2 3 4 5 6 7 Commentary 3/31/17 Pro Forma Adj. EBITDA Bridge 8 11 10 9 12 1 2 3 4 5 6 7 8 11 10 9 12


