Car-Mart is subject to various risks, including the risks described below. Car-Mart’s business, operating results, and financial condition could be materially and adversely affected by any of these risks. Additional risks not presently known to the Company or that Car-Mart currently deems immaterial may also impair its business and operations.
Substantially all of Car-Mart’s automobile contracts involve loans made to individuals with impaired or limited credit histories, or higher debt-to-income ratios than permitted by traditional lenders. Loans made to borrowers who are restricted in their ability to obtain financing from traditional lenders generally entail a higher risk of delinquency, default and repossession, and higher losses than loans made to borrowers with better credit. Delinquency interrupts the flow of projected interest income and repayment of principal from a loan, and a default can ultimately lead to a loss if the net realizable value of the automobile securing the loan is insufficient to cover the principal and interest due on the loan or the vehicle cannot be recovered. Car-Mart’s profitability depends, in part, upon its ability to properly evaluate the creditworthiness of non-prime borrowers and efficiently service such loans. Although the Company believes that its underwriting criteria and collection methods enable it to manage the higher risks inherent in loans made to non-prime borrowers, no assurance can be given that such criteria or methods will afford adequate protection against such risks. If the Company experiences higher losses than anticipated, its financial condition, results of operations and business prospects could be materially and adversely affected.
The Company’s earnings are impacted by its net interest income, which is the difference between the income earned on interest-bearing assets and the interest paid on interest-bearing notes payable. The Company’s finance receivables generally bear interest at fixed rates ranging from 6% to 19%, while its revolving notes payable contain variable interest rates that fluctuate with market interest rates. However, interest rates charged on finance receivables originated in the State of Arkansas are limited to the federal primary credit rate (currently 2.25%) plus 5%. Typically, the Company charges interest on its Arkansas loans at or near the maximum rate allowed by law. Thus, while the interest rates charged on the Company’s loans do not fluctuate once established, new loans originated in Arkansas are set at a spread above the federal primary credit rate which does fluctuate. At April 30, 2008, approximately 56% of the Company’s finance receivables were originated in Arkansas. Assuming that this percentage is held constant for future loan originations, the long-term effect of decreases in the federal primary credit rate would generally have a negative effect on the profitability of the Company because the amount of interest income lost on Arkansas originated loans would likely exceed the amount of interest expense saved on the Company’s variable rate borrowings.
From time to time, the Company has to recognize losses resulting from the inability of certain borrowers to repay loans and the insufficient realizable value of the collateral securing loans. The Company maintains an allowance for credit losses in an attempt to cover credit losses inherent in its loan portfolio. Additional credit losses will likely occur in the future and may occur at a rate greater than the Company has experienced to date. The allowance for credit losses is based primarily upon historical credit loss experience, with consideration given to delinquency levels, collateral values, economic conditions and underwriting and collections practices. This evaluation is inherently subjective as it requires estimates of material factors that may be susceptible to significant change. If the Company’s assumptions and judgments prove to be incorrect, its current allowance may not be sufficient and adjustments may be necessary to allow for different economic conditions or adverse developments in its loan portfolio.
A reduction in the availability or access to sources of inventory would adversely affect the Company’s business by increasing the costs of vehicles purchased.
Car-Mart acquires vehicles primarily through wholesalers, new car dealers, individuals and from auctions. There can be no assurance that sufficient inventory will continue to be available to the Company or will be available at comparable costs. Any reduction in the availability of inventory or increases in the cost of vehicles would adversely affect gross profit percentages as the Company focuses on keeping payments affordable to its customer base. The Company could have to absorb cost increases.
The used automotive retail industry is highly competitive and fragmented, which could result in increased costs to the Company for vehicles and adverse price competition.
The Company competes principally with other independent Buy Here/Pay Here dealers, and to a lesser degree with (i) the used vehicle retail operations of franchised automobile dealerships, (ii) independent used vehicle dealers, and (iii) individuals who sell used vehicles in private transactions. The Company competes for both the purchase and resale of used vehicles. The Company’s competitors may sell the same or similar makes of vehicles that Car-Mart offers in the same or similar markets at competitive prices. Increased competition in the market, including new entrants to the market, could result in increased wholesale costs for used vehicles and lower-than-expected vehicle sales and margins. Further, if any of Car-Mart’s competitors seek to gain or retain market share by reducing prices for used vehicles, the Company would likely reduce its prices in order to remain competitive, which may result in a decrease in its sales and profitability and require a change in its operating strategies.
An economic slowdown will have adverse consequences for the used automotive industry and may have greater consequences for the non-prime segment of the industry.
In the normal course of business, the used automotive retail industry is subject to changes in regional U.S. economic conditions, including, but not limited to, interest rates, gasoline prices, inflation, personal discretionary spending levels, and consumer sentiment about the economy in general. Any significant changes in economic conditions could adversely affect consumer demand and/or increase costs, resulting in lower profitability for the Company. Due to the Company’s focus on non-prime borrowers, its actual rate of delinquencies, repossessions and credit losses on loans could be higher under adverse economic conditions than those experienced in the automotive retail finance industry in general.
The used automotive industry operates in a highly regulated environment with significant attendant compliance costs and penalties for non-compliance.
The used automotive industry is subject to a wide range of federal, state, and local laws and regulations, such as local licensing requirements and laws regarding advertising, vehicle sales, financing, and employment practices. Facilities and operations are also subject to federal, state, and local laws and regulations relating to environmental protection and human health and safety. The violation of these laws and regulations could result in administrative, civil, or criminal penalties against the Company, or in a cease and desist order. As a result, the Company has incurred, and will continue to incur, capital and operating expenditures, and other costs in complying with these laws and regulations. Further, over the past several years, private plaintiffs and federal, state, and local regulatory and law enforcement authorities have increased their scrutiny of advertising, sales, and finance and insurance activities in the sale of motor vehicles.
12
Inclement weather can adversely impact the Company’s operating results.
The occurrence of weather events, such as rain, snow, wind, storms, hurricanes, or other natural disasters, adversely affecting consumer traffic at Car-Mart’s automotive dealerships, could negatively impact the Company’s operating results.
Risks Related to the Company
The Company’s business is geographically concentrated; therefore, the Company’s results of operations may be adversely affected by unfavorable conditions in its local markets.
The Company’s performance is subject to local economic, competitive, and other conditions prevailing in the nine states where Car-Mart operates. The Company provides financing in connection with the sale of substantially all of its vehicles. These sales are made primarily to customers residing in Arkansas, Oklahoma, Texas, Kentucky and Missouri, with approximately 53% of revenues resulting from sales to Arkansas customers. The Company’s current results of operations depend substantially on general economic conditions and consumer spending habits in these local markets.
Car-Mart’s success depends upon the continued contributions of its management teams.
The Company is dependent upon the continued contributions of its management teams and other key employees. Since the Company maintains a decentralized operation in which each store is responsible for buying and selling its own vehicles, making credit decisions and collecting loans it originates, the key employees at each store are important factors in the Company’s ability to implement its business strategy. Consequently, the loss of the services of key employees could have a material adverse effect on the Company’s results of operations. In addition, when Car-Mart decides to open new lots, the Company will need to hire additional personnel. The market for qualified employees in the industry and in the regions in which Car-Mart operates is highly competitive and may subject the Company to increased labor costs during periods of low unemployment.
The Company’s business is dependent upon the efficient operation of its information systems.
Car-Mart relies on its information systems to manage its sales, inventory, consumer financing, and customer information effectively. The failure of the Company’s information systems to perform as designed, or the failure to maintain and continually enhance or protect the integrity of these systems, could disrupt the Company’s business, impact sales and profitability, or expose the Company to customer or third-party claims.
Changes in the availability or cost of capital and working capital financing could adversely affect the Company’s growth and business strategies.
The Company generates cash from income from continuing operations. The cash is primarily used to fund finance receivables growth, which have historically grown slightly faster than revenues. To the extent finance receivables growth exceeds income from continuing operations, generally the Company increases its borrowings under its revolving credit facilities to provide the cash necessary to make loans. On a long-term basis, the Company expects its principal sources of liquidity to consist of income from continuing operations and borrowings under revolving credit facilities and/or fixed interest term loans. Any adverse changes in the Company’s ability to borrow under revolving credit facilities or fixed interest term loans, or any increase in the cost of such borrowings, would likely have a negative impact on the Company’s ability to finance receivables growth which would adversely affect the Company’s growth and business strategies.
13
Further, Car-Mart’s current credit facilities contain various reporting and performance covenants. Any failure by the Company to comply with these covenants could have a material adverse effect on the Company’s ability to implement its business strategy.
The Company’s growth is dependent upon the availability of suitable lot sites.
The Company leases a majority of the properties where its stores are located. If and when the Company decides to open new stores, the inability to acquire suitable real estate, either through lease or purchase, at favorable terms could limit the expansion of the Company’s lot base and could have a material adverse effect on the Company’s expansion strategy and future operating results.
Car-Mart’s business is subject to seasonal fluctuations.
The Company’s third fiscal quarter (November through January) has historically been the slowest period for car and truck sales. Conversely, the Company’s first and fourth fiscal quarters (May through July and February through April) have historically been the busiest times for car and truck sales. Therefore, Car-Mart generally realizes a higher proportion of its revenue and operating profit during the first and fourth fiscal quarters. However, in fiscal 2008, tax refund anticipation sales began in early November 2007 and continued through January 2008. The success of the tax refund anticipation sales effort led to higher sales levels during the third quarter of fiscal 2008. The Company expects this trend to continue in future periods. If conditions arise that impair vehicle sales during the first or fourth fiscal quarters, the adverse effect on the Company’s revenues and operating profit for the year could be disproportionately large.
Item 1B. Unresolved Staff Comments
Not applicable.
Item 2. Properties
As of April 30, 2008, the Company leased approximately 70% of its facilities, including dealerships and the Company’s corporate offices. These facilities are located principally in the states of Arkansas, Oklahoma, Texas, Kentucky and Missouri. The Company’s corporate offices are located in approximately 12,000 square feet of leased space in Bentonville, Arkansas. For additional information regarding the Company’s properties, see “Contractual Payment Obligations” and “Off-Balance Sheet Arrangements” under Item 7 of Part II.
Item 3. Legal Proceedings
In the ordinary course of business, the Company has become a defendant in various types of legal proceedings. The Company does not expect the final outcome of any of these actions, individually or in the aggregate, to have a material adverse effect on the Company’s financial position, annual results of operations or cash flows. However, the results of legal proceedings cannot be predicted with certainty, and an unfavorable resolution of one or more of these legal proceedings could have a material adverse effect on the Company’s financial position, annual results of operations or cash flows.
14
Item 4. Submission of Matters to a Vote of Security Holders
No matters were submitted to a vote of security holders of the Company during the fourth quarter ended April 30, 2008.
15
PART II
Item 5. Market for Registrant’s Common Equity, Related Stockholder Matters and Issuer Purchases of Equity Securities
General
The Company’s common stock is traded on the NASDAQ Stock Market under the symbol CRMT. The following table sets forth, by fiscal quarter, the high and low closing sales prices reported by NASDAQ for the Company’s common stock for the periods indicated.
| | | | | | | | | | | | | |
| | Fiscal 2008 | | Fiscal 2007 | |
| | High | | Low | | High | | Low | |
| | | | | | | | | |
| | | | | | | | | |
First quarter | | $ | 13.92 | | $ | 12.18 | | $ | 20.58 | | $ | 15.04 | |
Second quarter | | | 12.50 | | | 10.62 | | | 17.01 | | | 13.90 | |
Third quarter | | | 13.59 | | | 10.30 | | | 15.08 | | | 10.41 | |
Fourth quarter | | | 14.65 | | | 10.90 | | | 13.84 | | | 10.56 | |
�� As of July 3, 2008, there were approximately 1,039 stockholders of record. This number excludes stockholders holding stock under nominee security position listings.
Stockholder Return Performance Graph
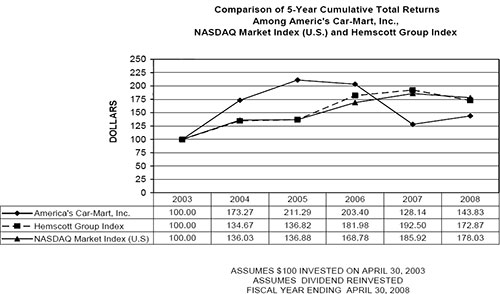
Set forth below is a line graph comparing the fiscal year end percentage change in the cumulative total stockholder return on the Company’s common stock to (i) the cumulative total return of the NASDAQ Market Index (U.S. companies), and (ii) the Hemscott Group 744 Index – Auto Dealerships (“Automobile Index”), for the period of five fiscal years commencing on May 1, 2003 and ending on April 30, 2008. The graph assumes that the value of the investment in the Company’s common stock and each index was $100 on May 1, 2003.
16
The dollar value at April 30, 2008 of $100 invested in the Company’s common stock on May 1, 2003 was $143.83, compared to $172.87 for the Automobile Index described above and $178.03 for the NASDAQ Market Index (U.S. Companies).
Dividend Policy
Since its inception the Company has paid no cash dividends on its common stock. The Company currently intends to follow a policy of retaining earnings to finance future growth. Payment of cash dividends in the future will be determined by the Company’s Board of Directors and will depend upon, among other things, the Company’s future earnings, operations, capital requirements and surplus, general financial condition, contractual restrictions that may exist, and such other factors as the Board of Directors may deem relevant. Colonial’s revolving credit facility prohibits dividends to the Company and Car-Mart of Arkansas’s revolving credit facility limits dividends to the Company to 75% of Car-Mart of Arkansas’s net income. Thus, the Company is limited in the amount of cash dividends or other distributions it can make to its shareholders.
Stock Split
In March 2005, the Company’s Board of Directors declared a three-for-two common stock split, effected in the form of a 50% stock dividend, that was paid in April 2005. All share and per share numbers and amounts in this Form 10-K have been adjusted to reflect this three-for-two common stock split.
Equity Compensation Plan Information
The following table provides information as of April 30, 2008 with respect to the Company’s equity compensation plans:
| | | | | | | | | | | | | | | | |
Plan Category | | Number of Securities to
be Issued upon
Exercise of
Outstanding Options,
Warrants and Rights | | Weighted-Average
Exercise Price of
Outstanding Options,
Warrants and Rights | | Number of Securities
Remaining Available for
Future Issuance under
Equity Compensation
Plans | |
| | | | | | | | |
Equity compensation plans: | | | | | | | | | | | | | | | | |
Approved by security holders | | | | 593,647 | | | | $ | 12.11 | | | | | 640,000 | | |
Not approved by security holders (1) | | | | 18,750 | | | | | 13.11 | | | | | — | | |
| | | | | | | | | | | | | | | | |
Total | | | | 612,397 | | | | $ | 12.14 | | | | | 640,000 | | |
| |
(1) | For a description of equity compensation plans not approved by security holders, see “Warrants” in Note J to the Company’s financial statements included elsewhere herein. |
17
Issuer Purchases of Equity Securities
The Company is authorized to repurchase up to 1 million shares of its common stock under the common stock repurchase program last amended and approved by the Board of Directors and announced on December 2, 2005. The following table sets forth information with respect to purchases made by or on behalf of the Company of shares of the Company’s common stock during the periods indicated:
| | | | | | | | | | | | | | | | | | | | | |
Period | | Total Number
of Shares
Purchased | | Average Price
Paid per Share | | Total Number of
Shares Purchased
as part of Publicly
Announced Plans
or Programs (2) | | Maximum Number
of Shares that may
yet be Purchased
under the Plans or
Programs (2) | |
| | | | | | | | | | |
| | | | | | | | | | | | | | | | | | | | | |
February 1, 2008 to February 29, 2008 | | | | — | | | | | — | | | | | — | | | | | 711,783 | | |
March 1, 2008 to March 31, 2008 | | | | 105,724 | | | | $ | 12.38 | | | | | 105,724 | | | | | 606,059 | | |
April 1, 2008 to April 30, 2008 | | | | — | | | | | — | | | | | — | | | | | 606,059 | | |
Total | | | | 105,724 | | | | $ | 12.38 | | | | | 105,724 | | | | | 606,059 | | |
| |
(2) | The above stock repurchase program has no expiration date. |
Item 6. Selected Financial Data
The financial data set forth below was derived from the audited consolidated financial statements of the Company and should be read in conjunction with the consolidated financial statements and related notes thereto, and Management’s Discussion and Analysis of Financial Condition and Results of Operations contained elsewhere herein.
| | | | | | | | | | | | | | | | |
| | Years Ended April 30,
(In thousands) | |
| | | |
| | 2008 | | 2007 | | 2006 | | 2005 | | 2004 | |
| | | | | | | | | | | |
| | | | | | | | | | | | | | | | |
Revenues | | $ | 274,631 | | $ | 240,334 | | $ | 234,207 | | $ | 204,788 | | $ | 176,184 | |
| | | | | | | | | | | | | | | | |
Income from continuing operations | | $ | 15,033 | | $ | 4,232 | | $ | 16,705 | | $ | 17,976 | | $ | 15,639 | |
| | | | | | | | | | | | | | | | |
Net income | | $ | 15,033 | | $ | 4,232 | | $ | 16,705 | | $ | 17,976 | | $ | 15,804 | |
| | | | | | | | | | | | | | | | |
Diluted earnings per share from continuing operations | | $ | 1.26 | | $ | 0.35 | | $ | 1.39 | | $ | 1.49 | | $ | 1.31 | |
| | | | | | | | | | | | | | | | |
Total assets | | $ | 200,589 | | $ | 173,598 | | $ | 177,613 | | $ | 143,668 | | $ | 117,241 | |
Total debt | | $ | 40,337 | | $ | 40,829 | | $ | 43,588 | | $ | 29,145 | | $ | 22,534 | |
Stockholders’ equity | | $ | 137,222 | | $ | 123,728 | | $ | 119,251 | | $ | 103,265 | | $ | 84,577 | |
Shares outstanding | | | 11,688 | | | 11,875 | | | 11,848 | | | 11,844 | | | 11,637 | |
Item 7. Management’s Discussion and Analysis of Financial Condition and Results of Operations
The following discussion should be read in conjunction with the Company’s consolidated financial statements appearing elsewhere in this annual report.
Overview
America’s Car-Mart, Inc., a Texas corporation (the “Company”), is the largest publicly held automotive retailer in the United States focused exclusively on the “Buy Here/Pay Here” segment of the used car market. References to the Company typically include the Company’s consolidated subsidiaries. The Company’s operations are principally conducted through its two operating subsidiaries, America’s Car-Mart, Inc., an Arkansas corporation (“Car-Mart of Arkansas”), and Colonial Auto Finance, Inc., an Arkansas corporation (“Colonial”). Collectively, Car-Mart of Arkansas and Colonial are referred to herein as “Car-Mart.” The Company primarily sells older model used vehicles and provides financing for substantially all of its customers. Many of the Company’s customers have limited financial resources and would not qualify for conventional financing as a result of limited credit histories or past credit problems. As of April 30, 2008, the Company operated 91 stores located primarily in small cities throughout the South-Central United States.
18
Car-Mart has been operating since 1981. Car-Mart has grown its revenues between approximately 3% and 21% per year over the last ten years (average 16%). Historically, finance receivables have tended to grow slightly faster than revenues. In fiscal 2008, revenues increased 14.3% and finance receivables principal increased 16.6%. After subtracting deferred revenue associated with the payment protection plan product, finance receivables increased 14% during fiscal 2008. The average term for installment sales contracts at April 30, 2008 was relatively flat as compared to April 30, 2007 (27.26 months vs. 27.13 months). In fiscal 2007, revenues increased 2.6% while finance receivables decreased 3.6% due to higher charge offs experienced for the year. In fiscal 2006, finance receivables grew 21.6% compared to revenue growth of 14.4%. The increase in 2006 primarily related to 1) an increase in the average term for installment sales contracts (to 27.25 months), 2) the timing of customer payments, particularly at year-end, 3) the purchase of finance receivables from Dan’s Auto Sales in Lexington, KY in March 2006, 4) the increase in the percentage of 30-day plus past due amounts at year-end (to 3.7%), and 5) an increase in the average interest rate charged resulting in a higher percentage of customer payments going to interest as opposed to principal reduction. Revenue growth results from same store revenue growth and the addition of new stores. Going forward, it is anticipated that the historical experience of finance receivables growing slightly faster than revenues will continue.
The Company’s primary focus is on collections. Each store is responsible for its own collections with supervisory involvement of the corporate office. Over the last five fiscal years, Car-Mart’s credit losses as a percentage of sales have ranged between approximately 20.1% in 2005 and 29.1% in 2007 (average of 22.8%). Credit losses in fiscal 2007 (29.1%) were higher than the Company’s average over the last five years. Credit losses in fiscal 2007 were negatively affected by higher losses experienced during the Company’s second through fourth quarters (31.4%). The 2007 credit losses included an approximate $5 million pre-tax charge (2.3%) to increase the allowance for credit losses to 22% of the finance receivables principal balance from 19.2%. Credit losses were higher due to several factors and included higher losses experienced in most of the dealerships, including mature dealerships, as the Company saw weakness in the performance of its portfolio as customers had difficulty making payments under the terms of their loans. Additionally, significant negative external economic issues, including higher fuel prices, were prevalent throughout fiscal 2007 and fiscal 2008. Credit losses in fiscal 2008 returned to a more historical level at 22% of sales as the Company continued to focus on its operational initiatives, including credit and collections efforts.
The Company’s gross margins as a percentage of sales have been fairly consistent from year to year. Over the last five fiscal years, Car-Mart’s gross margins as a percentage of sales have ranged between approximately 42% and 48%. Gross margins as a percentage of sales for fiscal 2008 were 42.3% (43.0% for the fourth quarter). The Company’s gross margins are set based upon the cost of the vehicle purchased, with lower-priced vehicles typically having higher gross margin percentages. In recent years, the Company’s gross margins have been negatively affected by the increase in the average retail sales price (a function of a higher purchase price) and higher operating costs, mostly related to increased vehicle repair costs and higher fuel costs. Additionally, the percentage of wholesale sales to retail sales, which relate for the most part to repossessed vehicles sold at or near cost, was higher in fiscal 2007 and during the first quarter of fiscal 2008 due to the increased level of repossession activity coupled with relatively flat retail sales levels. The Company expects that its gross margin percentage will not change significantly in the near term from its current level.
19
Hiring, training and retaining qualified associates are critical to the Company’s success. The rate at which the Company adds new stores and is able to implement operating initiatives is limited by the number of trained managers the Company has at its disposal. Excessive turnover, particularly at the Store Manager level, could impact the Company’s ability to add new stores and to meet operational initiatives. The Company has added resources to recruit, train and develop personnel, especially personnel targeted to fill lot manager positions. The Company expects to continue to invest in the development of its workforce in fiscal 2009 and beyond.
20
Consolidated Operations
(Operating Statement Dollars in Thousands)
| | | | | | | | | | | | | | | | | | | | | | | | | |
| | | | | | | | | | | % Change | | | | | | | | | | |
| | | | | | | | | | | | | | |
| | Years Ended April 30, | | 2008
vs.
2007 | | 2007
vs.
2006 | | As a % of Sales | |
| | | | | | | |
| | 2008 | | 2007 | | 2006 | | | | 2008 | | 2007 | | 2006 | |
| | | | | | | | | | | | | | | | | |
Operating Statement: | | | | | | | | | | | | | | | | | | | | | | | | | |
Revenues: | | | | | | | | | | | | | | | | | | | | | | | | | |
Sales | | | 250,337 | | $ | 216,898 | | $ | 214,482 | | | 15.4 | % | | 1.1 | % | | 100.0 | % | | 100.0 | % | | 100.0 | % |
Interest income and other | | | 24,294 | | | 23,436 | | | 19,725 | | | 3.7 | | | 18.8 | | | 9.7 | | | 10.8 | | | 9.2 | |
| | | | | | | | | | | | | | | | | | | | | | | | | |
Total | | | 274,631 | | | 240,334 | | | 234,207 | | | 14.3 | | | 2.6 | | | 109.7 | | | 110.8 | | | 109.2 | |
| | | | | | | | | | | | | | | | | | | | | | | | | |
| | | | | | | | | | | | | | | | | | | | | | | | | |
Costs and expenses: | | | | | | | | | | | | | | | | | | | | | | | | | |
Cost of sales | | | 144,537 | | | 125,073 | | | 119,433 | | | 15.6 | % | | 4.7 | | | 57.7 | | | 57.7 | | | 55.7 | |
SG&A | | | 47,263 | | | 41,778 | | | 39,261 | | | 13.1 | | | 6.4 | | | 18.9 | | | 19.3 | | | 18.3 | |
Provision for credit loss | | | 55,046 | | | 63,077 | | | 45,810 | | | (12.7 | ) | | 37.7 | | | 22.0 | | | 29.1 | | | 21.4 | |
Interest expense | | | 2,947 | | | 3,728 | | | 2,458 | | | (20.9 | ) | | 51.7 | | | 1.2 | | | 1.7 | | | 1.1 | |
Depreciation and amort | | | 1,148 | | | 994 | | | 724 | | | 15.5 | | | 37.3 | | | .5 | | | .5 | | | .3 | |
Loss on Lot Closures | | | 527 | | | — | | | — | | | | | | | | | .2 | | | | | | | |
| | | | | | | | | | | | | | | | | | | | | | | | | |
Total | | | 251,468 | | | 234,650 | | | 207,686 | | | 7.2 | | | 13.0 | | | 100.5 | | | 108.2 | | | 96.8 | |
| | | | | | | | | | | | | | | | | | | | | | | | | |
| | | | | | | | | | | | | | | | | | | | | | | | | |
Pretax income | | $ | 23,163 | | $ | 5,684 | | $ | 26,521 | | | 307.5 | | | (78.6 | ) | | 9.3 | | | 2.6 | | | 12.4 | |
| | | | | | | | | | | | | | | | | | | | | | | | | |
| | | | | | | | | | | | | | | | | | | | | | | | | |
Operating Data: | | | | | | | | | | | | | | | | | | | | | | | | | |
Retail units sold | | | 27,207 | | | 25,199 | | | 27,415 | | | 8.0 | % | | (8.1 | %) | | | | | | | | | |
Average stores in operation | | | 93.0 | | | 89.7 | | | 81.5 | | | 3.7 | | | 10.1 | | | | | | | | | | |
Average units sold per store | | | 293 | | | 281 | | | 336 | | | 4.3 | | | (16.4 | ) | | | | | | | | | |
Average retail sales price | | $ | 8,690 | | $ | 8,125 | | $ | 7,494 | | | 7.0 | | | 8.4 | | | | | | | | | | |
Same store revenue growth | | | 13.0 | % | | (3.2 | %) | | 9.8 | % | | | | | | | | | | | | | | | |
Receivables average yield | | | 12.7 | % | | 12.5 | % | | 11.6 | % | | | | | | | | | | | | | | | |
2008 Compared to 2007
Revenues increased $34.3 million, or 14.3%, in fiscal 2008 as compared to fiscal 2007, principally as a result of (i) revenue growth from stores that operated a full 12 months in both periods ($27.7 million), (ii) stores opened during fiscal 2007 or stores that opened or closed a satellite location during fiscal 2008 or fiscal 2007 ($6.7 million), (iii) revenues from stores opened during fiscal 2008 ($.6 million) offset by a $.7 million decrease in revenues for a store that closed in fiscal 2008.
Revenues increased 14.3% in fiscal 2008 as compared to revenue growth of 2.6% in fiscal 2007. The increase in revenue growth year over year is attributable to (i) an 8% increase in retail unit volumes in fiscal 2008 together with a 7% increase in the average unit sales price, (ii) a 3.7% increase in interest and other income, and (iii) increased wholesale sales during fiscal 2008. Presently, the Company expects that its average retail sales price will increase in fiscal 2009, but at a rate less than increases seen in fiscal years 2008 and 2007.
Cost of sales, as a percentage of sales, was flat at 57.7% in fiscal 2008 compared to fiscal 2007. The Company’s gross margins are set based upon the cost of the vehicle purchased, with lower-priced vehicles typically having higher gross margin percentages. The Company’s gross margins have been negatively affected in recent years by the increase in the average retail sales price (a function of a higher purchase price) and to a lesser extent by higher operating costs, mostly related to increased vehicle repair costs and higher fuel costs. Additionally, the percentage of wholesale sales was higher in fiscal 2008 and 2007 than in previous years, which has had a negative effect on overall gross margin percentages. The consumer demand for vehicles the Company purchases for resale remains high. This high demand has been exacerbated by the decrease in domestic new car sales, which results in higher purchase costs for the Company.
21
Selling, general and administrative expense, as a percentage of sales, decreased .4% to 18.9% in fiscal 2008 from 19.3% in fiscal 2007. The percentage decrease was principally the result of higher sales levels as a large majority of the Company’s operating costs are more fixed in nature. In dollar terms, overall expenses increased $5.5 million which consisted primarily of increased payroll costs. Payroll costs increased due to the increase in incentive based compensation, which is tied to profitability. Also, stock based compensation was $1.6 million in fiscal 2008 compared to $533,000 in fiscal 2007. The Company also experienced an increase in lot level expenditures associated with the opening and/or expansion of dealerships to support higher sales volumes. Additionally, the Company incurred some increased costs associated with strengthening controls and enhancing the corporate infrastructure to improve efficiencies and allow for future growth.
Provision for credit losses, as a percentage of sales, decreased 7.1% to 22.0% in fiscal 2008 from 29.1% in fiscal 2007. Credit losses in fiscal 2008 were positively affected by lower losses during the entire year at most dealerships. The fiscal 2007 credit losses included an approximate $5 million pre-tax charge (2.3%) which increased the allowance for credit losses to 22% of the finance receivable principal balance from 19.2%. Credit losses were higher in fiscal 2007 due to higher losses experienced in most of the dealerships, including mature dealerships, as the Company saw weakness in the performance of its portfolio as customers had difficulty making payments under the terms of their loans. Additionally, significant negative external economic issues, including higher fuel prices, were prevalent throughout fiscal years 2007 and 2008.
Interest expense, as a percentage of sales, decreased .5% to 1.2% in fiscal 2008 from 1.7% in fiscal 2007. The decrease was principally the result of lower average borrowing levels and lower average interest rates on the credit facilities during fiscal 2008.
In fiscal 2008, the Company incurred $527,000 in losses associated with the closure of four dealerships. One of the dealerships was in Kansas and the other three were satellite locations in Texas.
The effective income tax rate in fiscal 2008 was 35.1%. This rate is lower than historical rates (excluding fiscal 2007) due to the distribution of profits among the Company’s operating subsidiaries. It is anticipated that the effective income tax rate going forward will be more in the 36-37% range where it has been historically.
2007 Compared to 2006
Revenues increased $6.1 million, or 2.6%, in fiscal 2007 as compared to fiscal 2006, principally as a result of (i) revenue growth from stores opened during fiscal 2006 or stores that opened or closed a satellite location during fiscal 2007 or fiscal 2006 ($7.4 million), (ii) revenues from stores opened during fiscal 2007 ($5.9 million) offset by a $7.2 million decrease in revenues for stores that operated a full 12 months in both periods.
Revenues increased 2.6% in fiscal 2007 as compared to revenue growth of 14.4% in fiscal 2006. The decrease in revenue growth year over year is attributable to (i) a decrease in retail unit volumes in fiscal 2007 offset by an 8.4% increase in the average unit sales price, (ii) a lower growth rate for interest and other income, offset by (iii) increased wholesale sales during fiscal 2007.
22
Cost of sales, as a percentage of sales, increased 2.0% to 57.7% in fiscal 2007 from 55.7% in fiscal 2006. The Company’s gross margins are set based upon the cost of the vehicle purchased, with lower-priced vehicles typically having higher gross margin percentages. The Company’s gross margins were negatively affected by the increase in the average retail sales price (a function of a higher purchase price) and higher operating costs, mostly related to increased vehicle repair costs and higher fuel costs. Additionally, the percentage of wholesale sales was higher in fiscal 2007 versus fiscal 2006 which had a negative effect on gross margins. Consumer demand for the primary vehicles the Company acquires for its stores was high and was exacerbated by the slow down in domestic new car sales, resulting in higher purchase costs for vehicles.
Selling, general and administrative expense, as a percentage of sales, increased 1.0% to 19.3% in fiscal 2007 from 18.3% in fiscal 2006. The percentage increase was principally the result of an increase in advertising and payroll costs and additional lot level expenditures associated with the opening of new dealerships. Included in payroll costs for 2007 is approximately $533,000 in stock based compensation associated with the adoption of SFAS 123R on May 1, 2006. Also, the percentage was negatively affected by the lower sales level increase. Had sales levels been at planned volumes, selling, general and administrative expense, as a percentage of sales, would have been lower. Additionally, the Company incurred increased costs associated with strengthening controls and enhancing the corporate infrastructure to improve efficiencies and allow for future growth.
Provision for credit losses, as a percentage of sales, increased 7.7% to 29.1% in fiscal 2007 from 21.4% in fiscal 2006. Credit losses in fiscal 2007 were negatively affected by higher losses experienced during the Company’s second through fourth quarters (31.4%). The 2007 credit losses included an approximate $5 million pre-tax charge (2.3%) to increase the allowance for credit losses to 22% of the finance receivable principal balance from 19.2%. Credit losses were higher due to several factors and included higher losses experienced in most of the dealerships, including mature dealerships, as the Company saw weakness in the performance of its portfolio as customers had difficulty making payments under the terms of their loans. Additionally, significant negative external economic issues, including higher fuel prices, were prevalent throughout fiscal 2007.
Interest expense, as a percentage of sales, increased .6% to 1.7% in fiscal 2007 from 1.1% in fiscal 2006. The increase was principally the result of higher average borrowing levels and higher average interest rates on the credit facility during fiscal 2007.
The effective income tax rate in 2007 was 26%. This lower tax rate resulted primarily from the elimination of tax reserves established in prior years related to Internal Revenue Service (“IRS”) examinations of the Company’s 2002 tax returns and certain items in subsequent years. The reserves were eliminated based on notification received from the IRS that the Company would not be assessed any additional taxes, penalties or interest related to the examinations. Going forward, the Company expects its effective tax rate to be closer to historical rates.
Financial Condition
The following table sets forth the major balance sheet accounts of the Company at April 30, 2008, 2007 and 2006 (in thousands):
| | | | | | | | | | |
| | April 30, | |
| | 2008 | | 2007 | | 2006 | |
| | | | | | | |
Assets: | | | | | | | | | | |
Finance receivables, net | | $ | 163,344 | | $ | 139,194 | | $ | 149,379 | |
Inventory | | | 13,532 | | | 13,682 | | | 10,923 | |
Property and equipment, net | | | 18,140 | | | 16,883 | | | 15,436 | |
| | | | | | | | | | |
Liabilities: | | | | | | | | | | |
Accounts payable and accrued liabilities | | | 14,934 | | | 8,706 | | | 11,838 | |
Revolving credit facilities & notes payable | | | 40,337 | | | 40,829 | | | 43,588 | |
23
Historically, finance receivables have tended to grow slightly faster than revenue growth. This has historically been due, to a large extent, to an increasing average term necessitated by increases in the average retail sales price. In fiscal 2008, revenues increased 14.3% and finance receivables increased 16.6%. After subtracting deferred revenue associated with the payment protection plan product, finance receivables increased 14% during fiscal 2008. The average term for installment sales contracts at April 30, 2008 was relatively flat as compared to April 30, 2007 (27.26 months vs. 27.13 months). In fiscal 2007, revenues increased 2.6% while finance receivables decreased 3.6% due to higher charge offs experienced for the year. In fiscal 2006, finance receivables grew 21.6% compared to revenue growth of 14.4%. The increase in 2006 primarily related to 1) an increase in the average term for installment sales contracts (to 27.25 months from 25.9 months at April 30, 2005), 2) the timing of customer payments, particularly at year-end, 3) the purchase of finance receivables from Dan’s Auto Sales in Lexington, KY in March 2006, 4) the increase in the percentage of 30-day plus past due amounts at year-end (to 3.7%), and 5) an increase in the average interest rate charged resulting in a higher percentage of customer payments going to interest as opposed to principal reduction. It is anticipated that the historical experience of finance receivables growing slightly faster than revenues will again be the trend into the future.
In fiscal 2008, inventory decreased by 1.1% ($150,000) as compared to revenue growth of 14.3%. Improvements in inventory management as well as the timing of sales, particularly at year-end, allowed the Company to maintain overall inventory levels while growing revenues. The Company will continue to manage inventory levels into the future to ensure adequate supply, in volume and mix, to meet sales demand.
Property and equipment, net increased $1.3 million in fiscal 2008 as the Company incurred expenditures to refurbish and expand a number of existing locations.
Accounts payable and accrued liabilities increased $6.2 million in fiscal 2008 due to significantly higher sales volumes, most pronounced toward the end of fiscal 2008. Sales were up 31.5% in the fourth quarter of fiscal 2008 compared to the fourth quarter of fiscal 2007. Also, the unearned portion of the payment protection plan product, which was introduced in the first quarter of fiscal 2008, was $4.6 million at April 30, 2008.
Borrowings on the Company’s revolving credit facilities fluctuate primarily based upon a number of factors including (i) net income, (ii) finance receivables changes, (iii) capital expenditures, and (iv) common stock repurchases. Historically, income from continuing operations, as well as borrowings on the revolving credit facilities, have funded the finance receivables growth and capital asset purchases.
24
Liquidity and Capital Resources
The following table sets forth certain historical information with respect to the Company’s statements of cash flows (in thousands):
| | | | | | | | | | |
| | Years Ended April 30, | |
| | 2008 | | 2007 | | 2006 | |
| | | | | | | |
Operating activities: | | | | | | | | | | |
Net income | | $ | 15,033 | | $ | 4,232 | | $ | 16,705 | |
Provision for credit losses | | | 55,046 | | | 63,077 | | | 45,810 | |
Claims for payment protection plan | | | 1,871 | | | — | | | — | |
Depreciation and amortization | | | 1,148 | | | 994 | | | 709 | |
Stock based compensation | | | 1,600 | | | 533 | | | — | |
Finance receivable originations | | | (230,920 | ) | | (196,200 | ) | | (196,190 | ) |
Finance receivable collections | | | 129,232 | | | 124,092 | | | 111,315 | |
Inventory | | | 20,249 | | | 16,811 | | | 10,692 | |
Current Income Taxes | | | (1,390 | ) | | (3,695 | ) | | 1,509 | |
Deferred Income Taxes | | | 3,130 | | | (754 | ) | | (898 | ) |
Accrued Interest on Finance Receivables | | | (139 | ) | | 124 | | | (294 | ) |
Change in deferred payment protection plan revenue | | | 4,631 | | | — | | | — | |
Accounts payable and accrued liabilities | | | 3,690 | | | (692 | ) | | 1,389 | |
Other | | | (106 | ) | | (213 | ) | | (251 | ) |
| | | | | | | | | | |
Total | | | 3,075 | | | 8,309 | | | (9,504 | ) |
| | | | | | | | | | |
| | | | | | | | | | |
Investing activities: | | | | | | | | | | |
Purchase of property and equipment | | | (2,559 | ) | | (2,716 | ) | | (5,011 | ) |
Proceeds from sale of property and equipment | | | 112 | | | 357 | | | 157 | |
Proceeds from sale of finance receivables related to lot closure | | | 343 | | | | | | | |
Payment for business acquired | | | — | | | (460 | ) | | (1,200 | ) |
| | | | | | | | | | |
Total | | | (2,104 | ) | | (2,819 | ) | | (6,054 | ) |
| | | | | | | | | | |
| | | | | | | | | | |
Financing activities: | | | | | | | | | | |
Debt facilities, net | | | (492 | ) | | (2,759 | ) | | 14,444 | |
Change in cash overdrafts | | | 2,556 | | | (2,441 | ) | | 1,629 | |
Purchase of common stock | | | (3,538 | ) | | (454 | ) | | (1,312 | ) |
Exercise of stock options and warrants, including tax benefits and issuance of common stock | | | 399 | | | 166 | | | 593 | |
| | | | | | | | | | |
Total | | | (1,075 | ) | | (5,488 | ) | | 15,354 | |
| | | | | | | | | | |
| | | | | | | | | | |
Cash provided by (used in) continuing operations | | $ | (104 | ) | $ | 2 | | $ | (204 | ) |
| | | | | | | | | | |
The Company generates cash flow from income from operations. Historically, most or all of this cash is used to fund finance receivables growth and for capital expenditures. To the extent finance receivables growth and capital expenditures exceeds income from operations, generally the Company increases its borrowings under its revolving credit facilities. The majority of the Company’s growth has been self-funded.
The Company tends to lease the majority of the properties where its stores are located. As of April 30, 2008, the Company leased approximately 70% of its store properties. The Company expects to continue to lease the majority of the properties where its stores are located.
Car-Mart’s credit facilities limit distributions from Car-Mart to the Company beyond (i) the repayment of an intercompany loan ($10.0 million at April 30, 2008), and (ii) dividends equal to 75% of Car-Mart of Arkansas’ net income. At April 30, 2008, the Company’s net assets (excluding its $126 million equity investment in Car-Mart) consisted of $4,000 in cash, $1.4 million in other net assets and a $10.0 million receivable from Car-Mart. Thus, the Company is limited in the amount of dividends or other distributions it can make to its shareholders without the consent of Car-Mart’s lender.
At April 30, 2008, the Company had $.2 million of cash on hand and an additional $19.4 million of availability under its revolving credit facilities (see Note F to the consolidated financial statements). On a short-term basis, the Company’s principal sources of liquidity include income from operations and borrowings under its revolving credit facilities. On a longer-term basis, the Company expects its principal sources of liquidity to consist of income from operations and borrowings under revolving credit facilities and/or fixed interest term loans. Further, while the Company has no specific plans to issue debt or equity securities, the Company believes, if necessary, it could raise additional capital through the issuance of such securities.
25
The Company expects to use cash to (i) grow its finance receivables portfolio by a percentage that is slightly larger than the percentage that its revenues grow, (ii) purchase property and equipment of approximately $3 million in the next 12 months in connection with refurbishing existing stores and adding three to four new stores, and (iii) reduce debt to the extent excess cash is available. In addition, occasionally the Company may use cash to repurchase its common stock.
The Company’s revolving credit facilities mature in April 2009. The Company expects that it will be able to renew or refinance its revolving credit facilities on or before the date they mature. The Company believes it will have adequate liquidity to satisfy its capital needs for the foreseeable future.
Contractual Payment Obligations
The following is a summary of the Company’s contractual obligations as of April 30, 2008, including renewal periods under operating leases that are reasonably assured (in thousands):
| | | | | | | | | | | | | | | | |
| | Payments Due by Period | |
| | | |
Contractual Obligations | | Total | | Less Than
1 Year | | 1-3 Years | | 3-5 Years | | More Than
5 Years | |
| | | | | | | | | | | | |
| | | | | | | | | | | | | | | | |
Revolving lines of credit | | $ | 30,587 | | $ | 30,587 | | $ | — | | $ | — | | $ | — | |
Notes payable | | | 9,749 | | | 864 | | | 1,925 | | | 2,226 | | | 4,734 | |
Interest payments | | | 3,392 | | | 669 | | | 1,142 | | | 842 | | | 739 | |
Operating leases | | | 25,215 | | | 2,342 | | | 4,708 | | | 4,558 | | | 13,607 | |
| | | | | | | | | | | | | | | | |
| | | | | | | | | | | | | | | | |
Total | | $ | 68,943 | | $ | 34,462 | | $ | 7,775 | | $ | 7,626 | | $ | 19,080 | |
| | | | | | | | | | | | | | | | |
We calculate estimated interest payments for the long term debt using the applicable rates and payment dates. We typically expect to settle such interest payments with cash flows from operations and short-term borrowings.
The above excludes estimated interest payments on the Company’s revolving line of credit. The Company paid $2.9 million in interest payments on the revolving line of credit debt in fiscal 2008.
The $25.2 million of lease commitments includes $3.4 million of non-cancelable lease commitments under the primary lease terms, and $21.8 million of lease commitments for renewal periods at the Company’s option that are reasonably assured.
Off-Balance Sheet Arrangements
The Company has entered into operating leases for approximately 70% of its store and office facilities. Generally these leases are for periods of three to five years and usually contain multiple renewal options. The Company uses leasing arrangements to maintain flexibility in its store locations and to preserve capital. The Company expects to continue to lease the majority of its store and office facilities under arrangements substantially consistent with the past. For the years ended April 30, 2008, 2007 and 2006, rent expense for all operating leases amounted to approximately $2.7 million, $2.8 million and $2.4 million, respectively.
Other than its operating leases, the Company is not a party to any off-balance sheet arrangement that management believes is reasonably likely to have a current or future effect on the Company’s financial condition, revenues or expenses, results of operations, liquidity, capital expenditures or capital resources that are material to investors.
26
Related Finance Company Contingency
Car-Mart of Arkansas and Colonial do not meet the affiliation standard for filing consolidated income tax returns, and as such they file separate federal and state income tax returns. Car-Mart of Arkansas routinely sells its finance receivables to Colonial at what the Company believes to be fair market value and is able to take a tax deduction at the time of sale for the difference between the tax basis of the receivables sold and the sales price. These types of transactions, based upon facts and circumstances, have been permissible under the provisions of the Internal Revenue Code (“IRC”) as described in the Treasury Regulations. For financial accounting purposes, these transactions are eliminated in consolidation, and a deferred tax liability has been recorded for this timing difference. The sale of finance receivables from Car-Mart of Arkansas to Colonial provides certain legal protection for the Company’s finance receivables and, principally because of certain state apportionment characteristics of Colonial, also has the effect of reducing the Company’s overall effective state income tax rate by approximately 240 basis points. The actual interpretation of the Regulations is in part a facts and circumstances matter. The Company believes it satisfies the material provisions of the Regulations. Failure to satisfy those provisions could result in the loss of a tax deduction at the time the receivables are sold, and have the effect of increasing the Company’s overall effective income tax rate as well as the timing of required tax payments.
In May 2007, the Internal Revenue Service (“IRS”) concluded on the previously disclosed examinations of the Company’s tax returns for fiscal 2002 and certain items in subsequent years. The IRS concluded that the Company would not be assessed any additional taxes, penalties or interest related to the examinations. The examinations focused on whether or not the Company satisfied the provisions of the Treasury Regulations which would entitle Car-Mart of Arkansas to a tax deduction at the time it sells its finance receivables to Colonial. Based upon the favorable IRS conclusion, the Company recognized $500,000 of net income in the fourth quarter of fiscal 2007 for the elimination of associated income tax reserves.
Critical Accounting Estimates
The preparation of financial statements in conformity with generally accepted accounting principles in the United States of America requires the Company to make estimates and assumptions in determining the reported amounts of assets and liabilities and disclosure of contingent assets and liabilities at the date of the financial statements and the reported amounts of revenues and expenses during the reporting period. Actual results could differ from the Company’s estimates. The Company believes the most significant estimate made in the preparation of the accompanying consolidated financial statements relates to the determination of its allowance for credit losses, which is discussed below. The Company’s accounting policies are discussed in Note B to the accompanying consolidated financial statements.
The Company maintains an allowance for credit losses on an aggregate basis at a level it considers sufficient to cover estimated losses in the collection of its finance receivables. The allowance for credit losses is based primarily upon historical credit loss experience, with consideration given to recent credit loss trends and changes in loan characteristics (i.e., average amount financed and term), delinquency levels, collateral values, economic conditions and underwriting and collection practices. The allowance for credit losses is periodically reviewed by management with any changes reflected in current operations. Although it is at least reasonably possible that events or circumstances could occur in the future that are not presently foreseen which could cause actual credit losses to be materially different from the recorded allowance for credit losses, the Company believes that it has given appropriate consideration to all relevant factors and has made reasonable assumptions in determining the allowance for credit losses.
27
At October 31, 2006 (the end of the Company’s 2007 second quarter), management increased the allowance for credit loss percentage from 19.2% to 22% due to higher credit loss experience and trends. A change in accounting estimate was recognized to reflect the decision to increase the allowance for credit losses, resulting in a pretax, non-cash charge of $5,271,000 for the Company’s second quarter of fiscal 2007.
Recent Accounting Pronouncements
In September 2006, the FASB issued Statement of Financial Accounting Standard No. 157, “Fair Value Measurements” (“SFAS 157”), which defines fair value, establishes a framework for measuring fair value in generally accepted accounting principles, and expands disclosures about fair value measurements. SFAS 157 does not require any new fair value measurements, but provides guidance on how to measure fair value by providing a fair value hierarchy used to classify the source of the information.
In February 2008, the FASB issued FASB Staff Position 157-2, “Effective Date of FASB Statement No. 157,” to provide a one-year deferral of the effective date of Statement 157 for nonfinancial assets and nonfinancial liabilities, except those that are recognized or disclosed in financial statements at fair value on a recurring basis. For nonfinancial assets and nonfinancial liabilities subject to the deferral, the effective date of Statement 157 is postponed to fiscal years beginning after November 15, 2008. The Company does not believe the adoption of Statement 157 will have a material impact on the Company’s financial statements.
In February 2007, the FASB issued Statement 159, “The Fair Value Option for Financial Assets and Financial Liabilities – Including an Amendment of FASB Statement 115”. The statement permits entities to choose to measure certain financial instruments and other items at fair value. The objective is to improve financial reporting by providing entities with the opportunity to mitigate volatility in reported earnings caused by measuring related assets and liabilities differently without having to apply complex hedge accounting provisions. Unrealized gains and losses on any items for which Car-Mart elects the fair value measurement option would be reported in earnings. Statement 159 is effective for fiscal years beginning after November 15, 2007. However, early adoption is permitted for fiscal years beginning on or before November 15, 2007. The Company does not believe the adoption of Statement 159 will have a material impact on the Company’s financial statements.
In March 2008, the FASB issued Statement 161, “Disclosures about Derivative Instruments and Hedging Activities.” Due to the use and complexity of derivative instruments, there were concerns regarding the existing disclosure requirements in FASB 133. Accordingly, this Statement requires enhanced disclosures about an entity’s derivative and hedging activities. Entities will be required to provide enhanced disclosures about (i) how and why an entity uses derivative instruments, (ii) how derivative instruments and related hedging items are accounted for under Statement 133 and its related interpretations, and (iii) how derivative instruments and related hedging items affect an entity’s financial position, financial performance, and cash flows. This Statement is effective for financial statements issued for fiscal years after November 15, 2008. The Company does not believe the adoption of Statement 161 will have a material impact on the Company’s financial statements.
28
Seasonality
The Company’s third fiscal quarter (November through January) has historically been the slowest period for car and truck sales. Conversely, the Company’s first and fourth fiscal quarters (May through July and February through April) have historically been the busiest times for car and truck sales. Therefore, Car-Mart generally realizes a higher proportion of its revenue and operating profit during the first and fourth fiscal quarters. However, in fiscal 2008, tax refund anticipation sales began in early November 2007 and continued through January 2008. The success of the tax refund anticipation sales effort led to higher sales levels during the third quarter of fiscal 2008. The Company expects this trend to continue in future periods. If conditions arise that impair vehicle sales during the first or fourth fiscal quarters, the adverse effect on the Company’s revenues and operating profit for the year could be disproportionately large.
Impact of Inflation
Inflation has not historically been a significant factor impacting the Company’s results; however, recent purchase price increases for vehicles, most pronounced over the last two fiscal years, have had a negative effect on the Company’s gross profit percentages. This is due to the fact that the Company focuses on keeping payments affordable to its customer base and at the same time ensuring that the term of the loan matches the economic life of the vehicle.
Item 7A. Quantitative and Qualitative Disclosures about Market Risk
The Company is exposed to market risk on its financial instruments from changes in interest rates. In particular, the Company has exposure to changes in the federal primary credit rate and the prime interest rate of its lender. The Company does not use financial instruments for trading purposes or to manage interest rate risk. The Company’s earnings are impacted by its net interest income, which is the difference between the income earned on interest-bearing assets and the interest paid on interest-bearing notes payable. As described below, a decrease in market interest rates would generally have an adverse effect on the Company’s profitability.
The Company’s financial instruments consist of fixed rate finance receivables, variable rate revolving notes payable, an $8.7 million fixed rate term loan and a $1.1 million fixed rate term loan (see Note F to the consolidated financial statements). The Company’s finance receivables generally bear interest at fixed rates ranging from 6% to 19%. These finance receivables generally have remaining maturities from one to 36 months. The Company’s revolving notes payable contain variable interest rates that fluctuate with market interest rates (i.e., the rate charged on the Company’s revolving credit facility fluctuates with the prime interest rate of its lender). On May 16, 2008 the Company entered into a five year interest rate swap agreement which will effectively fix the interest rate on a notional $20 million of the revolving credit facilities. Interest rates charged on finance receivables originated in the State of Arkansas are limited to the federal primary credit rate (2.25% at April 30, 2008) plus 5.0%. Typically, the Company charges interest on its Arkansas loans at or near the maximum rate allowed by law. Thus, while the interest rates charged on the Company’s loans do not fluctuate once established, new loans originated in Arkansas are set at a spread above the federal primary credit rate which does fluctuate. At April 30, 2008, approximately 56% of the Company’s finance receivables were originated in Arkansas. The remaining loan portfolio carries interest rates approximating 17%. Assuming that these percentages are held constant for future loan originations, the long-term effect of decreases in the federal primary credit rate would generally have a negative effect on the profitability of the Company. This is the case because the amount of interest income lost on Arkansas originated loans would likely exceed the amount of interest expense saved on the Company’s variable rate borrowings (assuming the prime interest rate of its lender decreases by the same percentage as the decrease in the federal primary credit rate). The initial impact within the first few months on profitability resulting from a decrease in the federal primary credit rate and the rate charged on its variable interest rate borrowings could be positive, as the immediate interest expense savings could outweigh the loss of interest income on new loan originations. As the amount of new loans originated at the lower interest rate increases to an amount in excess of the amount of variable interest rate borrowings, the effect on profitability would become negative.
29
The table below illustrates the estimated impact that hypothetical changes in the federal primary credit rate would have on the Company’s continuing pretax earnings. The calculations assume (i) the increase or decrease in the federal primary credit rate remains in effect for two years, (ii) the increase or decrease in the federal primary credit rate results in a like increase or decrease in the rate charged on the Company’s variable rate borrowings, (iii) the principal amount of finance receivables ($208.2 million) and variable interest rate borrowings ($10.6 million- excludes the $20 million notional amount underlying the interest rate swap agreement), and the percentage of Arkansas originated finance receivables (56%), remain constant during the periods, and (iv) the Company’s historical collection and charge-off experience continues throughout the periods.
| | | | | | | | | |
Increase (Decrease)
in Interest Rates | | Year 1
Increase (Decrease)
in Pretax Earnings | | Year 2
Increase (Decrease)
in Pretax Earnings | |
| | | | | | |
| | (in thousands) | | (in thousands) | |
+200 basis points | | $ | 786 | | | $ | 1,867 | | |
+100 basis points | | | 393 | | | | 933 | | |
-100 basis points | | | (393 | ) | | | (933 | ) | |
-200 basis points | | | (786 | ) | | | (1,867 | ) | |
Item 8. Financial Statements and Supplementary Data
30
Report of Independent Registered Public Accounting Firm
Stockholders and Board of Directors
America’s Car-Mart, Inc.
We have audited the accompanying consolidated balance sheets of America’s Car-Mart, Inc. (a Texas corporation) and subsidiaries as of April 30, 2008 and 2007, and the related consolidated statements of operations, cash flows, and stockholders’ equity for each of the three years in the period ended April 30, 2008.These financial statements are the responsibility of the Company’s management. Our responsibility is to express an opinion on these financial statements based on our audits.
We conducted our audits in accordance with the standards of the Public Company Accounting Oversight Board (United States). Those standards require that we plan and perform the audit to obtain reasonable assurance about whether the financial statements are free of material misstatement. An audit includes examining, on a test basis, evidence supporting the amounts and disclosures in the financial statements. An audit also includes assessing the accounting principles used and significant estimates made by management, as well as evaluating the overall financial statement presentation. We believe that our audits provide a reasonable basis for our opinion.
In our opinion, the consolidated financial statements referred to above present fairly, in all material respects, the financial position of America’s Car-Mart, Inc. and subsidiaries as of April 30, 2008 and 2007, and the results of their operations and their cash flows for each of the three years in the period ended April 30, 2008 in conformity with accounting principles generally accepted in the United States of America.
As discussed in Note B to the consolidated financial statements, the Company adopted the provisions of Statements of Financial Accounting Standards No. 123(R),Share-Based Payments effective May 1, 2006.
We also have audited, in accordance with the standards of the Public Company Accounting Oversight Board (United States), America’s Car-Mart, Inc. and subsidiaries’ internal control over financial reporting as of April 30, 2008, based on criteria established inInternal Control—Integrated Framework issued by the Committee of Sponsoring Organizations of the Treadway Commission (COSO)and our report dated July 3, 2008 expressed an unqualified opinion.
/s/ GRANT THORNTON LLP
Tulsa, Oklahoma
July 3, 2008
31
Consolidated Balance Sheets
America’s Car-Mart, Inc.
(Dollars in thousands)
| | | | | | | |
| | April 30, 2008 | | April 30, 2007 | |
| | | | | |
Assets: | | | | | | | |
Cash and cash equivalents | | $ | 153 | | $ | 257 | |
Accrued interest on finance receivables | | | 833 | | | 694 | |
Finance receivables, net | | | 163,344 | | | 139,194 | |
Inventory | | | 13,532 | | | 13,682 | |
Prepaid expenses and other assets | | | 832 | | | 600 | |
Income tax receivable | | | 3,400 | | | 1,933 | |
Goodwill | | | 355 | | | 355 | |
Property and equipment, net | | | 18,140 | | | 16,883 | |
| | | | | | | |
| | | | | | | |
| | $ | 200,589 | | $ | 173,598 | |
| | | | | | | |
| | | | | | | |
Liabilities and stockholders’ equity: | | | | | | | |
Accounts payable | | $ | 3,871 | | $ | 2,473 | |
Deferred payment protection plan revenue | | | 4,631 | | | — | |
Accrued liabilities | | | 11,063 | | | 6,233 | |
Deferred tax liabilities, net | | | 3,465 | | | 335 | |
Revolving credit facilities and notes payable | | | 40,337 | | | 40,829 | |
| | | | | | | |
Total liabilities | | | 63,367 | | | 49,870 | |
| | | | | | | |
| | | | | | | |
Commitments and contingencies | | | | | | | |
| | | | | | | |
Stockholders’ equity: | | | | | | | |
Preferred stock, par value $.01 per share, 1,000,000 shares authorized; none issued or outstanding | | | — | | | — | |
Common stock, par value $.01 per share, 50,000,000 shares authorized;
12,091,628 and 11,985,958 shares issued at April 30, 2008 and 2007 | | | 121 | | | 120 | |
Additional paid-in capital | | | 37,284 | | | 35,286 | |
Retained earnings | | | 105,307 | | | 90,274 | |
Treasury stock, at cost (403,941 and 111,250 shares at April 30, 2008 and 2007) | | | (5,490 | ) | | (1,952 | ) |
| | | | | | | |
Total stockholders’ equity | | | 137,222 | | | 123,728 | |
| | | | | | | |
| | | | | | | |
| | $ | 200,589 | | $ | 173,598 | |
| | | | | | | |
The accompanying notes are an integral part of these consolidated financial statements.
32
Consolidated Statements of Operations
America’s Car-Mart, Inc.
(Dollars in thousands except per share amounts)
| | | | | | | | | | |
| | Years Ended April 30, | |
| | 2008 | | 2007 | | 2006 | |
| | | | | | | |
Revenues: | | | | | | | | | | |
Sales | | $ | 250,337 | | $ | 216,898 | | $ | 214,482 | |
Interest and other income | | | 24,294 | | | 23,436 | | | 19,725 | |
| | | | | | | | | | |
| | | 274,631 | | | 240,334 | | | 234,207 | |
| | | | | | | | | | |
| | | | | | | | | | |
Costs and expenses: | | | | | | | | | | |
Cost of sales | | | 144,537 | | | 125,073 | | | 119,433 | |
Selling, general and administrative | | | 47,263 | | | 41,778 | | | 39,261 | |
Provision for credit losses | | | 55,046 | | | 63,077 | | | 45,810 | |
Interest expense | | | 2,947 | | | 3,728 | | | 2,458 | |
Depreciation and amortization | | | 1,148 | | | 994 | | | 724 | |
Loss on lot closures | | | 527 | | | — | | | — | |
| | | | | | | | | | |
| | | 251,468 | | | 234,650 | | | 207,686 | |
| | | | | | | | | | |
| | | | | | | | | | |
Income before taxes | | | 23,163 | | | 5,684 | | | 26,521 | |
| | | | | | | | | | |
Provision for income taxes | | | 8,130 | | | 1,452 | | | 9,816 | |
| | | | | | | | | | |
| | | | | | | | | | |
Net income | | $ | 15,033 | | $ | 4,232 | | $ | 16,705 | |
| | | | | | | | | | |
| | | | | | | | | | |
Earnings per share: | | | | | | | | | | |
Basic | | $ | 1.27 | | $ | .36 | | $ | 1.41 | |
Diluted | | $ | 1.26 | | $ | .35 | | $ | 1.39 | |
| | | | | | | | | | |
Weighted average number of shares outstanding: | | | | | | | | | | |
Basic | | | 11,825,657 | | | 11,850,247 | | | 11,852,804 | |
Diluted | | | 11,907,321 | | | 11,953,987 | | | 12,018,541 | |
The accompanying notes are an integral part of these consolidated financial statements.
33
Consolidated Statements of Cash Flows
America’s Car-Mart, Inc.
(In thousands)
| | | | | | | | | | |
| | Years Ended April 30, |
| | | |
| | 2008 | | 2007 | | 2006 | |
| | | | | | | |
Operating activities: | | | | | | | | | | |
Net income | | $ | 15,033 | | $ | 4,232 | | $ | 16,705 | |
Adjustments to reconcile income from operations to net cash provided by (used in) operating activities: | | | | | | | | | | |
Provision for credit losses | | | 55,046 | | | 63,077 | | | 45,810 | |
Claims for payment protection plan | | | 1,871 | | | — | | | — | |
Depreciation and amortization | | | 1,148 | | | 994 | | | 709 | |
Loss (gain) on sale of property and equipment | | | 203 | | | (82 | ) | | 15 | |
Stock based compensation | | | 1,600 | | | 533 | | | — | |
Deferred income taxes | | | 3,130 | | | (754 | ) | | (898 | ) |
Changes in operating assets and liabilities: | | | | | | | | | | |
Finance receivable originations | | | (230,920 | ) | | (196,200 | ) | | (196,190 | ) |
Finance receivable collections | | | 129,232 | | | 124,092 | | | 111,315 | |
Accrued interest on finance receivables | | | (139 | ) | | 124 | | | (294 | ) |
Inventory | | | 20,249 | | | 16,811 | | | 10,692 | |
Prepaid expenses and other assets | | | (232 | ) | | (46 | ) | | (152 | ) |
Accounts payable and accrued liabilities | | | 3,690 | | | (692 | ) | | 1,389 | |
Change in deferred payment protection plan revenue | | | 4,631 | | | — | | | — | |
Income taxes payable | | | (1,390 | ) | | (3,695 | ) | | 1,509 | |
Excess tax benefit from share-based payments | | | (77 | ) | | (85 | ) | | (114 | ) |
| | | | | | | | | | |
Net cash provided by (used in) operating activities | | | 3,075 | | | 8,309 | | | (9,504 | ) |
| | | | | | | | | | |
| | | | | | | | | | |
Investing activities: | | | | | | | | | | |
Purchase of property and equipment | | | (2,559 | ) | | (2,716 | ) | | (5,011 | ) |
Proceeds from sale of property and equipment | | | 112 | | | 357 | | | 157 | |
Proceeds from sale of finance receivables related to lot closure | | | 343 | | | — | | | — | |
Payment for business acquired | | | — | | | (460 | ) | | (1,200 | ) |
| | | | | | | | | | |
Net cash used in investing activities | | | (2,104 | ) | | (2,819 | ) | | (6,054 | ) |
| | | | | | | | | | |
| | | | | | | | | | |
Financing activities: | | | | | | | | | | |
Exercise of stock options and warrants | | | 205 | | | 81 | | | 479 | |
Excess tax benefits from share based compensation | | | 77 | | | 85 | | | 114 | |
Issuance of common stock | | | 117 | | | — | | | — | |
Purchase of common stock | | | (3,538 | ) | | (454 | ) | | (1,312 | ) |
Change in cash overdrafts | | | 2,556 | | | (2,441 | ) | | 1,629 | |
Proceeds from notes payable | | | — | | | 11,200 | | | — | |
Principal payments on notes payable | | | (769 | ) | | (682 | ) | | — | |
Proceeds from revolving credit facilities | | | 78,405 | | | 68,456 | | | 121,025 | |
Payments on revolving credit facilities | | | (78,128 | ) | | (81,733 | ) | | (106,581 | ) |
| | | | | | | | | | |
Net cash provided by (used in) financing activities | | | (1,075 | ) | | (5,488 | ) | | 15,354 | |
| | | | | | | | | | |
| | | | | | | | | | |
Increase (decrease) in cash and cash equivalents | | | (104 | ) | | 2 | | | (204 | ) |
Cash and cash equivalents at: Beginning of period | | | 257 | | | 255 | | | 459 | |
| | | | | | | | | | |
| | | | | | | | | | |
End of period | | $ | 153 | | $ | 257 | | $ | 255 | |
| | | | | | | | | | |
The accompanying notes are an integral part of these consolidated financial statements.
34
Consolidated Statements of Stockholders’ Equity
America’s Car-Mart, Inc.
(Dollars in thousands)
For the Years Ended April 30, 2008, 2007 and 2006
| | | | | | | | | | | | | | | | | | | |
| | | | | | | | Additional
Paid-In
Capital | | Retained
Earnings | | Treasury
Stock | | Total
Stockholders’
Equity | |
| | Common Stock | | | | | |
| | Shares | | Amount | | | | | |
| | | | | | | | | | | | | |
| | | | | | | | | | | | | | | | | | | |
Balance at April 30, 2005 | | | 11,852,188 | | $ | 118 | | $ | 33,996 | | $ | 69,337 | | $ | (186 | ) | $ | 103,265 | |
| | | | | | | | | | | | | | | | | | | |
Stock options/warrants exercised | | | 77,086 | | | 1 | | | 478 | | | — | | | — | | | 479 | |
| | | | | | | | | | | | | | | | | | | |
Purchase of 72,800 treasury shares | | | — | | | — | | | — | | | — | | | (1,312 | ) | | (1,312 | ) |
| | | | | | | | | | | | | | | | | | | |
Tax benefit of options exercised | | | — | | | — | | | 114 | | | — | | | — | | | 114 | |
| | | | | | | | | | | | | | | | | | | |
Net income | | | — | | | — | | | — | | | 16,705 | | | — | | | 16,705 | |
| | | | | | | | | | | | | | | | | | | |
| | | | | | | | | | | | | | | | | | | |
Balance at April 30, 2006 | | | 11,929,274 | | $ | 119 | | $ | 34,588 | | $ | 86,042 | | ($ | 1,498 | ) | $ | 119,251 | |
| | | | | | | | | | | | | | | | | | | |
Stock options/warrants exercised | | | 13,750 | | | — | | | 81 | | | — | | | — | | | 81 | |
| | | | | | | | | | | | | | | | | | | |
Purchase of 30,000 treasury shares | | | — | | | — | | | — | | | — | | | (454 | ) | | (454 | ) |
| | | | | | | | | | | | | | | | | | | |
Tax benefit of options exercised | | | 22,329 | | | — | | | 85 | | | — | | | — | | | 85 | |
| | | | | | | | | | | | | | | | | | | |
Stock based compensation | | | 20,605 | | | 1 | | | 532 | | | — | | | — | | | 533 | |
Net income | | | — | | | — | | | — | | | 4,232 | | | — | | | 4,232 | |
| | | | | | | | | | | | | | | | | | | |
| | | | | | | | | | | | | | | | | | | |
Balance at April 30, 2007 | | | 11,985,958 | | $ | 120 | | $ | 35,286 | | $ | 90,274 | | ($ | 1,952 | ) | $ | 123,728 | |
| | | | | | | | | | | | | | | | | | | |
Issuance of common stock | | | 10,273 | | | — | | | 117 | | | — | | | — | | | 117 | |
| | | | | | | | | | | | | | | | | | | |
Stock options/warrants exercised | | | 55,898 | | | 1 | | | 204 | | | — | | | — | | | 205 | |
| | | | | | | | | | | | | | | | | | | |
Purchase of 292,691 treasury shares | | | — | | | — | | | — | | | — | | | (3,538 | ) | | (3,538 | ) |
| | | | | | | | | | | | | | | | | | | |
Tax benefit of options exercised | | | — | | | — | | | 77 | | | — | | | — | | | 77 | |
| | | | | | | | | | | | | | | | | | | |
Stock based compensation | | | 39,499 | | | — | | | 1,600 | | | — | | | — | | | 1,600 | |
| | | | | | | | | | | | | | | | | | | |
Net income | | | — | | | — | | | — | | | 15,033 | | | — | | | 15,033 | |
| | | | | | | | | | | | | | | | | | | |
| | | | | | | | | | | | | | | | | | | |
Balance at April 30, 2008 | | | 12,091,628 | | $ | 121 | | $ | 37,284 | | $ | 105,307 | | ($ | 5,490 | ) | $ | 137,222 | |
| | | | | | | | | | | | | | | | | | | |
The accompanying notes are an integral part of these consolidated financial statements.
35
Notes to Consolidated Financial Statements
America’s Car-Mart, Inc.
A - Organization and Business
America’s Car-Mart, Inc., a Texas corporation (the “Company”), is the largest publicly held automotive retailer in the United States focused exclusively on the “Buy Here/Pay Here” segment of the used car market. References to the Company typically include the Company’s consolidated subsidiaries. The Company’s operations are principally conducted through its two operating subsidiaries, America’s Car-Mart, Inc., an Arkansas corporation (“Car-Mart of Arkansas”) and Colonial Auto Finance, Inc., an Arkansas corporation (“Colonial”). Collectively, Car-Mart of Arkansas and Colonial are referred to herein as “Car-Mart.” The Company primarily sells older model used vehicles and provides financing for substantially all of its customers. Many of the Company’s customers have limited financial resources and would not qualify for conventional financing as a result of limited credit histories or past credit problems. As of April 30, 2008, the Company operated 91 stores located primarily in small cities throughout the South-Central United States.
B - Summary of Significant Accounting Policies
Principles of Consolidation
The consolidated financial statements include the accounts of America’s Car-Mart, Inc. and its subsidiaries. All intercompany accounts and transactions have been eliminated.
Use of Estimates
The preparation of financial statements in conformity with accounting principles generally accepted in the United States of America requires management to make estimates and assumptions that affect the reported amount of assets and liabilities and disclosure of contingent assets and liabilities at the date of the financial statements, and the reported amounts of revenues and expenses during the period. Actual results could differ from those estimates.
Concentration of Risk
The Company provides financing in connection with the sale of substantially all of its vehicles. These sales are made primarily to customers residing in Arkansas, Oklahoma, Texas, Kentucky and Missouri, with approximately 53% of revenues resulting from sales to Arkansas customers. Periodically, the Company maintains cash in financial institutions in excess of the amounts insured by the federal government. Car-Mart’s revolving credit facilities mature in April 2009. The Company expects that these credit facilities will be renewed or refinanced on or before the scheduled maturity dates.
Restrictions on Subsidiary Distributions/Dividends
Car-Mart’s revolving credit facilities limit distributions from Car-Mart to the Company beyond (i) the repayment of an intercompany loan ($10.0 million at April 30, 2008), and (ii) dividends equal to 75% of Car-Mart of Arkansas’ net income. At April 30, 2008, the Company’s assets (excluding its $126 million equity investment in Car-Mart) consisted of $4,000 in cash, $1.4 million in other net assets and a $10.0 million receivable from Car-Mart. Thus, the Company is limited in the amount of dividends or other distributions it can make to its shareholders without the consent of Car-Mart’s lender.
36
Cash Equivalents
The Company considers all highly liquid instruments purchased with original maturities of three months or less to be cash equivalents.
Finance Receivables, Repossessions and Charge-offs and Allowance for Credit Losses
The Company originates installment sale contracts from the sale of used vehicles at its dealerships. Finance receivables are collateralized by vehicles sold and consist of contractually scheduled payments from installment contracts net of unearned finance charges and an allowance for credit losses. Unearned finance charges represent the balance of interest income remaining from the total interest to be earned over the term of the related installment contract. An account is considered delinquent when a contractually scheduled payment has not been received by the scheduled payment date. At April 30, 2008 and 2007, respectively, 3.1% and 3.4% of the Company’s finance receivable balances were 30 days or more past due.
The Company takes steps to repossess a vehicle when the customer becomes delinquent in his or her payments, and management determines that timely collection of future payments is not probable. Accounts are charged-off after the expiration of a statutory notice period for repossessed accounts, or when management determines that the timely collection of future payments is not probable for accounts where the Company has been unable to repossess the vehicle. For accounts with respect to which the vehicle was repossessed, the fair value of the repossessed vehicle is charged as a reduction of the gross finance receivable balance charged-off. On average, accounts are approximately 53 days past due at the time of charge-off. For previously charged-off accounts that are subsequently recovered, the amount of such recovery is credited to the allowance for credit losses.
The Company maintains an allowance for credit losses on an aggregate basis at a level it considers sufficient to cover estimated losses in the collection of its finance receivables. The allowance for credit losses is based primarily upon historical credit loss experience, with consideration given to recent credit loss trends and changes in loan characteristics (i.e., average amount financed and term), delinquency levels, collateral values, economic conditions and underwriting and collection practices. The allowance for credit losses is periodically reviewed by management with any changes reflected in current operations. Although it is at least reasonably possible that events or circumstances could occur in the future that are not presently foreseen which could cause actual credit losses to be materially different from the recorded allowance for credit losses, the Company believes that it has given appropriate consideration to all relevant factors and has made reasonable assumptions in determining the allowance for credit losses.
At October 31, 2006 (the end of the Company’s 2007 second quarter), management increased the allowance for credit loss percentage from 19.2% to 22% due to recent higher credit loss experience and trends. A change in accounting estimate was recognized to reflect the decision to increase the allowance for credit losses, resulting in a pretax, non-cash charge of $5,271,000 for the Company’s second quarter of fiscal 2007. No such charge was required in the third or fourth quarters of fiscal 2007 or during fiscal 2008.
Inventory
Inventory consists of used vehicles and is valued at the lower of cost or market on a specific identification basis. Vehicle reconditioning costs are capitalized as a component of inventory. Repossessed vehicles are recorded at fair value, which approximates wholesale value. The cost of used vehicles sold is determined using the specific identification method.
37
Goodwill
Goodwill reflects the excess of purchase price over the fair value of specifically identified net assets purchased. In accordance with Statement of Financial Accounting Standards No. 142, “Goodwill and Other Intangibles” (“SFAS 142”), goodwill and intangible assets deemed to have indefinite lives are not amortized but are subject to annual impairment tests. The impairment tests are based on the comparison of the fair value of the reporting unit to the carrying value of such unit. If the fair value of the reporting unit falls below its carrying value, goodwill is deemed to be impaired and a write-down of goodwill would be recognized. There was no impairment of goodwill during fiscal years 2008, 2007 or 2006.
Property and Equipment
Property and equipment are stated at cost. Expenditures for additions, renewals and improvements are capitalized. Costs of repairs and maintenance are expensed as incurred. Leasehold improvements are amortized over the shorter of the estimated life of the improvement or the lease period. The lease period includes the primary lease term plus any extensions that are reasonably assured. Depreciation is computed principally using the straight-line method generally over the following estimated useful lives:
| |
Furniture, fixtures and equipment | 3 to 7 years |
Leasehold improvements | 5 to 15 years |
Buildings and improvements | 18 to 39 years |
Property and equipment are reviewed for impairment whenever events or changes in circumstances indicate the carrying amount of an asset may not be recoverable. Recoverability of assets to be held and used is measured by a comparison of the carrying amount of an asset to future undiscounted net cash flows expected to be generated by the asset. If such assets are considered to be impaired, the impairment to be recognized is measured by the amount by which the carrying values of the impaired assets exceed the fair value of such assets. Assets to be disposed of are reported at the lower of the carrying amount or fair value less costs to sell.
Cash Overdraft
The Company’s primary disbursement bank account is set up to operate with a fixed $50,000 cash balance. As checks are presented for payment, monies are automatically drawn against cash collections for the day and, if necessary, are drawn against one of its revolving credit facilities. The cash overdraft balance principally represents outstanding checks, net of any deposits in transit that as of the balance sheet date had not yet been presented for payment.
Deferred Sales Tax
Deferred sales tax represents a sales tax liability of the Company for vehicles sold on an installment basis in the State of Texas. Under Texas law, for vehicles sold on an installment basis, the related sales tax is due as the payments are collected from the customer, rather than at the time of sale.
Income Taxes
Income taxes are accounted for under the liability method. Under this method, deferred tax assets and liabilities are determined based on differences between financial reporting and tax bases of assets and liabilities and are measured using the enacted tax rates expected to apply in the years in which these temporary differences are expected to be recovered or settled.
38
Occasionally, the Company is audited by taxing authorities. These audits could result in proposed assessments of additional taxes. The Company believes that its tax positions comply in all material respects with applicable tax law. However, tax law is subject to interpretation, and interpretations by taxing authorities could be different from those of the Company, which could result in the imposition of additional taxes.
The Company adopted the provisions of FASB Interpretation 48, “Accounting for Uncertainty in Income Taxes”, on May 1, 2007. Previously, the Company had accounted for tax contingencies in accordance with Statement of Financial Accounting Standards 5, “Accounting for Contingencies.” As required by Interpretation 48, which clarifies Statement 109, “Accounting for Income Taxes”, the Company recognizes the financial statement benefit of a tax position only after determining that the relevant tax authority would more likely than not sustain the position following an audit. For tax positions meeting the more-likely-than-not threshold, the amount recognized in the financial statements is the largest benefit that has a greater than 50 percent likelihood of being realized upon ultimate settlement with the relevant tax authority. At the adoption date, the Company applied Interpretation 48 to all tax positions for which the statute of limitations remained open. The Company had no adjustments or unrecognized tax benefits as a result of the implementation of Interpretation 48.
The Company is subject to income taxes in the U.S. federal jurisdiction and various state jurisdictions. Tax regulations within each jurisdiction are subject to the interpretation of the related tax laws and regulations and require significant judgment to apply. With few exceptions, the Company is no longer subject to U.S. federal, state and local income tax examinations by tax authorities for the years before 2005.
The Company’s policy is to recognize accrued interest related to unrecognized tax benefits in interest expense and penalties in operating expenses. The Company had no accrued penalties and/or interest as of April 30, 2008.
Revenue Recognition
Revenues are generated principally from the sale of used vehicles, which in most cases includes a service contract and a payment protection plan product, and interest income and late fees earned on finance receivables. Revenues are net of taxes collected from customers and remitted to government agencies.
Revenues from the sale of used vehicles are recognized when the sales contract is signed, the customer has taken possession of the vehicle and, if applicable, financing has been approved. Revenues from the sale of service contracts are recognized ratably over the five-month service contract period. Service contract revenues are included in sales and the related expenses are included in cost of sales. Payment protection plan revenues are initially deferred and then recognized to income using the “Rule of 78’s” interest method over the life of the loan so that revenues are recognized in proportion to the amount of cancellation protection provided. Payment protection plan revenues are included in sales and related losses are included in cost of sales. Interest income is recognized on all active finance receivable accounts using the interest method.
Active accounts include all accounts except those that have been paid-off or charged-off. At April 30, 2008 and 2007, finance receivables more than 90 days past due were approximately $241,000 and $115,000, respectively. Late fees are recognized when collected and are included in interest income.
39
Advertising Costs
Advertising costs are expensed as incurred and consist principally of radio, television and print media marketing costs. Advertising costs amounted to $2,888,000, $2,912,000 and $2,326,000 for the years ended April 30, 2008, 2007 and 2006, respectively.
Employee Benefit Plans
The Company has 401(k) plans for all of its employees meeting certain eligibility requirements. The plans provide for voluntary employee contributions and the Company matches 50% of employee contributions up to a maximum of 2% of each employee’s compensation. The Company contributed approximately $153,000, $156,000, and $155,000 to the plans for the years ended April 30, 2008, 2007 and 2006, respectively.
Effective February 1, 2007, the Company began offering employees the right to purchase common shares at a 15% discount from market price under the 2006 Employee Stock Purchase Plan which was approved by shareholders in October 2006. The Company will take a charge to earnings for the 15% discount. Amounts for fiscal years 2008 and 2007 were not material. A total of 200,000 shares were registered and 191,976 remain available for issuance at April 30, 2008.
Earnings per Share
Basic earnings per share are computed by dividing net income by the average number of common shares outstanding during the period. Diluted earnings per share takes into consideration the potentially dilutive effect of common stock equivalents, such as outstanding stock options and warrants, which if exercised or converted into common stock would then share in the earnings of the Company. In computing diluted earnings per share, the Company utilizes the treasury stock method and anti-dilutive securities are excluded.
Stock-based Compensation
On May 1, 2006, the Company adopted the provisions of Statement of Financial Accounting Standards 123R, “Share Based Payment” (“SFAS 123R”), which revises Statement 123, “Accounting for Stock-Based Compensation,” and supersedes APB Opinion 25, “Accounting for Stock Issued to Employees.” SFAS 123R requires the Company to recognize expense related to the fair value of stock-based compensation awards, including employee stock options.
Prior to the adoption of SFAS 123R, the Company accounted for stock-based compensation awards using the intrinsic value method of Opinion 25. Accordingly, the Company did not recognize compensation expense in the statement of operations for options granted that had an exercise price equal to the market value of the underlying common stock on the date of grant. As required by Statement 123, the Company also provided certain pro forma disclosures for stock-based awards as if the fair-value-based approach of Statement 123 had been applied.
The Company has elected to use the modified prospective transition method as permitted by SFAS 123R and therefore has not restated financial results for prior periods. Under this transition method, the Company applied the provisions of SFAS 123R to new awards and to awards modified, repurchased, or cancelled after May 1, 2006. All stock options and warrants outstanding at May 1, 2006 were fully vested.
40
The Company recorded compensation cost for stock-based employee awards of $1.6 million ($1.04 million after-tax) during the year ended April 30, 2008. The pre-tax amounts include $358,000 for restricted shares issued on May 1, 2006, $823,000 for stock options granted during the year ended April 30, 2008, $403,000 for restricted shares issued on December 18, 2007 and $16,000 related to stock issued under the 2006 Employee Stock Purchase Plan. The Company recorded compensation cost for stock-based employee awards of $533,000 ($336,000 after-tax) during the year ended April 30, 2007. The pretax amounts include $397,000 for restricted shares issued on May 1, 2006 and $136,000 for stock options granted in fiscal 2007. Tax benefits were recognized for these costs at the Company’s overall expected effective tax rate.
As a result of the adoption of SFAS 123R, earnings were lower than under the previous accounting method for share-based compensation by the following amounts:
| | | | |
| | | | |
(Dollars in thousands) | | Year
Ended
April 30, 2007 | |
| | | | |
|
Income before taxes | | $ | 136 | |
| | | | |
Net income | | $ | 85 | |
| | | | |
Basic net earnings per common share | | $ | .01 | |
| | | | |
Diluted net earnings per common share | | $ | .01 | |
The following table illustrates the effect on net income after tax and net income per common share as if the Company had applied the fair value recognition provisions of SFAS 123 to stock-based compensation for the year ended April 30, 2006:
| | | | | |
(Dollars in thousands) | | Year
Ended
April 30, 2006 | |
| | | | |
| | | | |
Net income, as reported | | $ | 16,705 | |
Deduct: | Stock-based employee compensation expense determined under fair value-based method for all awards, net of related tax effects | | | (100 | ) |
| | | | | |
Pro forma net income | | $ | 16,605 | |
| | | | |
| | | | | |
Basic earnings per common share: | | | | |
| As reported | | $ | 1.41 | |
| Pro forma | | $ | 1.40 | |
| | | | | |
Diluted earnings per common share: | | | | |
| As reported | | $ | 1.39 | |
| Pro forma | | $ | 1.38 | |
The fair value of options granted is estimated on the date of grant using the Black-Scholes option pricing model based on the weighted average assumptions in the table below.
| | | | | | | | | | |
| | April 30, 2008 | | April 30, 2007 | | April 30, 2006 | |
| | | | | | | |
|
Expected term (years) | | 6.9 | | | 4.8 | | | 5.0 | | |
Risk-free interest rate | | 4.4 | % | | 5.14 | % | | 4.5 | % | |
Volatility | | 80 | % | | 62 | % | | 45 | % | |
Dividend yield | | — | | | — | | | — | | |
41
The expected term of the options is based on evaluations of historical and expected future employee and director exercise behavior. The risk-free interest rate is based on the U.S. Treasury rates at the date of grant with maturity dates approximately equal to the expected life at the grant date. Volatility is based on historical volatility of the Company’s stock. The Company has not historically issued any dividends and does not expect to do so in the foreseeable future.
Stock Options
On October 16, 2007, the shareholders of the Company approved the 2007 Stock Option Plan (the “2007 Plan”). The 2007 Plan provides for the grant of options to purchase up to an aggregate 1,000,000 shares of the Company’s common stock for grants to employees, directors and certain advisors of the Company at a price not less than the fair market value of the stock on the date of grant and for periods not to exceed ten years. The shares of common stock available for issuance under the 2007 Plan may, at the election of the Company’s board of directors, be unissued shares or treasury shares, or shares purchased in the open market or by private purchase.
The stockholders of the Company previously approved three stock option plans, including the 1986 Incentive Stock Option Plan (“1986 Plan”), the 1991 Non-Qualified Stock Option Plan (“1991 Plan”) and the 1997 Stock Option Plan (“1997 Plan”). No additional option grants may be made under the 1986, 1991 or 1997 Plans. The 1997 Plan set aside 1,500,000 shares of the Company’s common stock for grants to employees, directors and certain advisors of the Company at a price not less than the fair market value of the stock on the date of grant and for periods not to exceed ten years. The options vested upon issuance. At April 30, 2007, there were 28,558, shares of common stock available for grant under the 1997 Plan. Options for 15,000 of these shares were granted to the Company’s outside directors on July 2, 2007. The 1997 Plan expired in July 2007. Outstanding options granted under the Company’s stock option plans expire in the calendar years 2008 through 2017.
| | | | | | | |
| | Plan | |
| | | |
|
| | 1997 | | 2007 | |
| | | |
|
Minimum exercise price as a percentage of fair market value at date of grant | | | 100% | | | 100% | |
Last expiration date for outstanding options | | | July 2, 2017 | | | October 16, 2017 | |
Shares available for grant at April 30, 2008 | | | 0 | | | 640,000 | |
The grant-date fair value of options granted during fiscal years 2008 and 2007 was $3,360,000 and $130,000, respectively. The aggregate intrinsic value of outstanding options at April 30, 2008 is $2,098,000. Of the 375,000 options granted during fiscal 2008, 360,000 were granted to executive officers on October 16, 2007 upon the approval by shareholders of the 2007 Plan. The options were granted at fair market value on date of grant. The vesting of these options are set to vest in one third increments and is subject to the attainment of certain profitability goals over the three fiscal years ending April 30, 2010. As of April 30, 2008, the Company has $2,538,000 of total unrecognized compensation cost related to unvested options granted under the 2007 Plan. At each period end, the Company will evaluate and estimate the likelihood of attaining the underlying performance goals and recognize compensation cost accordingly. These outstanding options have a weighted-average remaining vesting period of 2.0 years.
42
The Company received cash from options exercised of $205,000, $81,000 and $479,000 in fiscal years 2008, 2007 and 2006, respectively. The impact of these cash receipts is included in financing activities in the accompanying Consolidated Statements of Cash Flows.
The intrinsic value for options exercised was $495,000, $156,000, and $851,000 in fiscal years 2008, 2007, and 2006, respectively.
Warrants
As of April 30, 2008, the Company had outstanding stock purchase warrants issued in 2004 to purchase 18,750 shares at prices ranging from $11.83 to $18.23 per share (weighted average exercise price of $13.11). All of the warrants are presently exercisable and expire between 2008 and 2009. The warrants have a weighted average remaining contractual life of 3.8 months at April 30, 2008. There were 22,329 shares of stock purchased as the result of warrants exercised during the fiscal year ended April 30, 2007. The intrinsic value of the warrants exercised was $374,000. The outstanding warrants at April 30, 2008 had an aggregate intrinsic value of $38,400.
Stock Incentive Plan
The shareholders of the Company approved an amendment to the Company’s Stock Incentive Plan on October 16, 2007. The amendment increased from 100,000 to 150,000 the number of shares of common stock that may be issued under the Stock Incentive Plan. For shares issued under the Stock Incentive Plan, the associated compensation expense is generally recognized equally over the vesting periods established at the award date and is subject to the employee’s continued employment by the Company. During fiscal 2008, 65,000 restricted shares were granted with a fair value of $11.90 per share, the market price of the Company’s stock on the grant date. During fiscal 2007, 57,500 restricted shares were granted with a fair value of $20.07 per share, the market price of the Company’s stock on the grant date. Restricted shares issued under the Stock Incentive Plan had an initial weighted average vesting period of 2.6 years and began vesting on April 30, 2007. A total of 22,480 shares remained available for award at April 30, 2008.
The Company recorded a pre-tax expense of $761,000 and $397,000 related to the Stock Incentive Plan during fiscal years 2008 and 2007, respectively.
As of April 30, 2008, the Company has $808,000 of total unrecognized compensation cost related to unvested awards granted under the Stock Incentive Plan, which the Company expects to recognize over a weighted-average remaining period of 1.7 years. The fair value at vesting for awards under the stock incentive plan was $655,000 and $229,000 in fiscal 2008 and 2007, respectively.
There were no modifications to any of the Company’s outstanding share-based payment awards during fiscal 2008.
Treasury Stock
The Company purchased 292,691 and 30,000 shares of its common stock to be held as treasury stock for a total cost of $3,537,986 and $454,029 during 2008 and 2007, respectively. Treasury stock may be used for issuances under the Company’s stock option plan or for other general corporate purposes.
43
Recent Accounting Pronouncements
From time to time, new accounting pronouncements are issued by the Financial Accounting Standards Board (“FASB”) or other standard setting bodies which the Company adopts as of the specified effective date. Unless otherwise discussed, the Company believes the impact of recently issued standards which are not yet effective will not have a material impact on our consolidated financial statements upon adoption.
In September 2006, the FASB issued Statement of Financial Accounting Standard No. 157, “Fair Value Measurements” (“SFAS 157”), which defines fair value, establishes a framework for measuring fair value in generally accepted accounting principles, and expands disclosures about fair value measurements. SFAS 157 does not require any new fair value measurements, but provides guidance on how to measure fair value by providing a fair value hierarchy used to classify the source of the information.
In February 2008, the FASB issued FASB Staff Position 157-2, “Effective Date of FASB Statement No. 157,” to provide a one-year deferral of the effective date of Statement 157 for nonfinancial assets and nonfinancial liabilities, except those that are recognized or disclosed in financial statements at fair value on a recurring basis. For nonfinancial assets and nonfinancial liabilities subject to the deferral, the effective date of Statement 157 is postponed to fiscal years beginning after November 15, 2008. The Company does not believe the adoption of Statement 157 will have a material impact on the Company’s financial statements.
In February 2007, the FASB issued Statement 159, “The Fair Value Option for Financial Assets and Financial Liabilities – Including an Amendment of FASB Statement 115”. The statement permits entities to choose to measure certain financial instruments and other items at fair value. The objective is to improve financial reporting by providing entities with the opportunity to mitigate volatility in reported earnings caused by measuring related assets and liabilities differently without having to apply complex hedge accounting provisions. Unrealized gains and losses on any items for which Car-Mart elects the fair value measurement option would be reported in earnings. Statement 159 is effective for fiscal years beginning after November 15, 2007. The Company does not believe the adoption of Statement 159 will have a material impact on the Company’s financial statements.
In March 2008, the FASB issued Statement 161, “Disclosures about Derivative Instruments and Hedging Activities.” Due to the use and complexity of derivative instruments, there were concerns regarding the existing disclosure requirements in FASB 133. Accordingly, this Statement requires enhanced disclosures about an entity’s derivative and hedging activities. Entities will be required to provide enhanced disclosures about (i) how and why an entity uses derivative instruments, (ii) how derivative instruments and related hedging items are accounted for under Statement 133 and its related interpretations, and (iii) how derivative instruments and related hedging items affect an entity’s financial position, financial performance, and cash flows. This Statement is effective for financial statements issued for fiscal years after November 15, 2008. The Company does not believe the adoption of Statement 161 will have a material impact on the Company’s financial statements.
44
C - Finance Receivables, Net
The Company originates installment sale contracts from the sale of used vehicles at its dealerships. These installment sale contracts typically include interest rates ranging from 6% to 19% per annum, are collateralized by the vehicle sold and provide for payments over periods ranging from 12 to 36 months. The components of finance receivables as of April 30, 2008 and 2007 are as follows:
| | | | | | | |
| | April 30, | |
(In thousands) | | 2008 | | 2007 | |
| | | | | | |
| | | | | | | |
Gross contract amount | | $ | 231,069 | | $ | 199,677 | |
Less unearned finance charges | | | (22,916 | ) | | (21,158 | ) |
| | | | | | | |
| | | | | | | |
Principal balance | | | 208,153 | | | 178,519 | |
Less allowance for credit losses | | | (44,809 | ) | | (39,325 | ) |
| | | | | | | |
| | | | | | | |
Finance receivables, net | | $ | 163,344 | | $ | 139,194 | |
| | | | | | | |
Changes in the finance receivables, net balance for the years ended April 30, 2008, 2007 and 2006 are as follows:
| | | | | | | | | | |
| | Years Ended April 30, | |
(In thousands) | | 2008 | | 2007 | | 2006 | |
| | | | | | | | |
| | | | | | | | | | |
Balance at beginning of year | | $ | 139,194 | | $ | 149,379 | | $ | 123,099 | |
Finance receivable originations | | | 230,920 | | | 196,200 | | | 196,190 | |
Finance receivables from acquisition of business | | | — | | | 354 | | | 845 | |
Finance receivable collections | | | (129,232 | ) | | (124,092 | ) | | (111,315 | ) |
Provision for credit losses | | | (55,046 | ) | | (63,077 | ) | | (45,810 | ) |
Lot closure | | | (522 | ) | | — | | | — | |
Payment protection plan claims | | | (1,871 | ) | | — | | | — | |
Inventory acquired in repossessions and payment protection plan claims | | | (20,099 | ) | | (19,570 | ) | | (13,630 | ) |
| | | | | | | | | | |
| | | | | | | | | | |
Balance at end of year | | $ | 163,344 | | $ | 139,194 | | $ | 149,379 | |
| | | | | | | | | | |
Changes in the finance receivables allowance for credit losses for the years ended April 30, 2008, 2007 and 2006 are as follows:
| | | | | | | | | | |
| | Years Ended April 30, | |
(In thousands) | | 2008 | | 2007 | | 2006 | |
| | | | | | | | |
| | | | | | | | | | |
Balance at beginning of year | | $ | 39,325 | | $ | 35,864 | | $ | 29,251 | |
Provision for credit losses | | | 55,046 | | | 63,077 | | | 45,810 | |
Allowance related to acquisition of business, net change | | | (236 | ) | | (366 | ) | | 527 | |
Charge-offs, net of recovered collateral | | | (49,326 | ) | | (59,250 | ) | | (39,724 | ) |
| | | | | | | | | | |
| | | | | | | | | | |
Balance at end of year | | $ | 44,809 | | $ | 39,325 | | $ | 35,864 | |
| | | | | | | | | | |
45
D - Property and Equipment
A summary of property and equipment as of April 30, 2008 and 2007 is as follows:
| | | | | | | |
| | April 30, | |
(In thousands) | | 2008 | | 2007 | |
| | | | | | |
| | | | | |
Land | | $ | 5,740 | | $ | 5,221 | |
Buildings and improvements | | | 6,808 | | | 5,890 | |
Furniture, fixtures and equipment | | | 4,295 | | | 4,000 | |
Leasehold improvements | | | 5,213 | | | 4,588 | |
Less accumulated depreciation and amortization | | | (3,916 | ) | | (2,816 | ) |
| | | | | | | |
| | | | | | | |
| | $ | 18,140 | | $ | 16,883 | |
| | | | | | | |
E - Accrued Liabilities
A summary of accrued liabilities as of April 30, 2008 and 2007 is as follows:
| | | | | | | |
| | April 30, | |
(In thousands) | | 2008 | | 2007 | |
| | | | | | |
| | | | | |
Compensation | | $ | 3,354 | | $ | 1,970 | |
Cash overdraft (see Note B) | | | 2,556 | | | — | |
Deferred service contract revenue (see Note B) | | | 2,295 | | | 1,812 | |
Deferred sales tax (see Note B) | | | 1,035 | | | 928 | |
Subsidiary redeemable preferred stock (see Note H) | | | 500 | | | 500 | |
Interest | | | 177 | | | 286 | |
Other | | | 1,146 | | | 737 | |
| | | | | | | |
| | | | | | | |
| | $ | 11,063 | | $ | 6,233 | |
| | | | | | | |
F – Revolving Credit Facilities
A summary of revolving credit facilities is as follows:
| | | | | | | | | | |
Revolving Credit Facilities |
| |
Primary Lender | | Aggregate
Amount | | Interest
Rate | | | | Balance at |
| Maturity | | April 30, 2008 | | April 30, 2007 |
| | | | | | | | | | | |
|
Bank of Oklahoma | | $50.0 million | | Prime +/- | | Apr 2009 | | $30,587 | | $30,311 |
On April 28, 2006, Car-Mart and its lenders amended the credit facilities. The amended facilities set total borrowings allowed on the revolving credit facilities at $50 million and established a $10 million term loan. The term loan was funded in May 2006 and called for 120 consecutive and substantially equal installments beginning June 1, 2006. The interest rate on the term loan is fixed at 7.33%. The principal balance on the term loan was $8.7 million at April 30, 2008. The combined total for the Company’s credit facilities is $60 million. On March 12, 2007 (effective December 31, 2006) Car-Mart and its lenders again amended the credit facilities. The March 12, 2007 amendments served to change the Company’s financial covenant requirements and to and adjust the Company’s interest rate pricing grid on its revolving credit facilities. The pricing grid is based on funded debt to EBITDA, as defined, and the interest rate on the revolving credit facilities can range from prime minus ..25 or LIBOR plus 2.75 to prime plus 1.00 or LIBOR plus 4.00.
46
The facilities are collateralized by substantially all the assets of Car-Mart including finance receivables and inventory. Interest is payable monthly under the revolving credit facilities at the bank’s prime lending rate minus .25% per annum at April 30, 2008 (4.75%) and at the bank’s prime lending rate plus .75% per annum at April 30, 2007 (9.0%). The interest rate on the revolving credit facilities decreased between years due to decreases in the prime rate and to the Company’s financial performance. The facilities contain various reporting and performance covenants including (i) maintenance of certain financial ratios and tests, (ii) limitations on borrowings from other sources, (iii) restrictions on certain operating activities, and (iv) limitations on the payment of dividends or distributions to the Company. The Company was in compliance with the covenants at April 30, 2008. The amount available to be drawn under the facilities is a function of eligible finance receivables and inventory. Based upon eligible finance receivables and inventory at April 30, 2008, Car-Mart could have drawn an additional $19.4 million under its facilities.
The Company also has a $1.1 million term loan secured by the corporate aircraft. The term loan is payable over fifteen years and has a fixed interest rate of 6.87% at April 30, 2008.
G - Income Taxes
The provision for income taxes for the fiscal years ended April 30, 2008, 2007 and 2006 was as follows:
| | | | | | | | | | |
| | Years Ended April 30, | |
(In thousands) | | 2008 | | 2007 | | 2006 | |
| | | | | | | | |
Provision for income taxes | | | | | | | | | | |
Current | | $ | 5,000 | | $ | 2,206 | | $ | 10,714 | |
Deferred | | | 3,130 | | | (754 | ) | | (898 | ) |
| | | | | | | | | | |
| | $ | 8,130 | | $ | 1,452 | | $ | 9,816 | |
| | | | | | | | | | |
The provision for income taxes is different from the amount computed by applying the statutory federal income tax rate to income before income taxes for the following reasons:
| | | | | | | | | | |
| | Years Ended April 30, | |
(In thousands) | | 2008 | | 2007 | | 2006 | |
| | | | | | | | |
| | | | | | | | | | |
Tax provision at statutory rate | | $ | 8,091 | | $ | 1,938 | | $ | 9,282 | |
State taxes, net of federal benefit | | | 56 | | | 13 | | | 643 | |
Reduction of tax reserves | | | — | | | (500 | ) | | — | |
Other, net | | | (17 | ) | | 1 | | | (109 | ) |
| | | | | | | | | | |
| | $ | 8,130 | | $ | 1,452 | | $ | 9,816 | |
| | | | | | | | | | |
The effective income tax rate in 2007 was 26%. This tax rate resulted primarily from the elimination of $500,000 of tax reserves established in prior years for potential issues from the Internal Revenue Service (“IRS”) examinations of the Company’s 2002 tax returns and certain items in subsequent years. The reserves were eliminated based on a favorable audit determination from the IRS that the Company would not be assessed any additional taxes, penalties or interest related to the examinations. Also, the Company’s state income taxes for 2008 and 2007 were lower due to the distribution of taxable income among the Company’s operating subsidiaries.
47
Deferred income taxes reflect the net tax effects of temporary differences between the carrying amounts of assets and liabilities for financial reporting purposes and the amounts used for income tax purposes. Significant components of the Company’s deferred tax assets and liabilities as of April 30, 2008 and 2007 were as follows:
| | | | | | | |
| | April 30, | |
(In thousands) | | 2008 | | 2007 | |
| | | | | | |
Deferred tax liabilities related to: | | | | | | | |
Finance receivables | | $ | 8,524 | | $ | 1,671 | |
Property and equipment | | | 501 | | | 413 | |
| | | | | | | |
Total | | | 9,025 | | | 2,084 | |
| | | | | | | |
|
Deferred tax assets related to: | | | | | | | |
Accrued liabilities | | | 1,553 | | | 1,112 | |
Inventory | | | 638 | | | 586 | |
Share based compensation | | | 414 | | | 51 | |
Tax Carry-forwards | | | 2,955 | | | | |
| | | | | | | |
Total | | | 5,560 | | | 1,749 | |
| | | | | | | |
Deferred tax liabilities, net | | $ | 3,465 | | $ | 335 | |
| | | | | | | |
At April 30, 2008, the Company has approximately $7.9 million in tax loss carry forwards that expire in 2028.
H - Capital Stock
The Company is authorized to issue up to one million shares of $.01 par value preferred stock in one or more series having such respective terms, rights and preferences as are designated by the Board of Directors. The Company has not issued any preferred stock.
A subsidiary of the Company has issued 500,000 shares of $1.00 par value preferred stock which carries an 8% cumulative dividend. Accumulated but undeclared dividends were $10,000 and $30,000 at April 30, 2008 and 2007, respectively. The Company’s subsidiary can redeem the preferred stock at any time at par value plus any unpaid dividends. After April 30, 2010, a holder of 400,000 shares of the subsidiary preferred stock can require the Company’s subsidiary to redeem such stock for $400,000 plus any unpaid dividends. The subsidiary preferred stock is included in accrued liabilities.
I – Weighted Average Shares Outstanding
Weighted average shares outstanding used in the calculation of basic and diluted earnings per share were as follows for the years ended April 30, 2008, 2007 and 2006:
| | | | | | | | | | |
| | Years Ended April 30, | |
| | 2008 | | 2007 | | 2006 | |
| | | | | | | |
| | | | | | | |
Average shares outstanding – basic | | | 11,825,657 | | | 11,850,247 | | | 11,852,804 | |
Dilutive options and warrants | | | 81,664 | | | 103,740 | | | 165,737 | |
| | | | | | | | | | |
| | | | | | | | | | |
Average shares outstanding – diluted | | | 11,907,321 | | | 11,953,987 | | | 12,018,541 | |
| | | | | | | | | | |
| | | | | | | | | | |
Antidilutive securities not included: | | | | | | | | | | |
Options and warrants | | | 216,209 | | | 88,500 | | | 77,250 | |
Restricted Stock | | | 32,576 | | | 39,667 | | | — | |
48
J - Stock Options and Warrants
Stock Options
Since inception, the shareholders of the Company have approved three stock option plans including the 1986 Incentive Stock Option Plan (“1986 Plan”), the 1991 Non-Qualified Stock Option Plan (“1991 Plan”) and the 1997 Stock Option Plan (“1997 Plan”). While previously granted options remain outstanding, no additional option grants may be made under the 1986 and 1991 Plans. The 1997 Plan sets aside 1,500,000 shares of the Company’s common stock for grants to employees, directors and certain advisors of the Company at a price not less than the fair market value of the stock on the date of grant and for periods not to exceed ten years. At April 30, 2008 and 2007, there were 0 and 28,558 shares of common stock available for grant, respectively, under the 1997 Plan. Options granted under the Company’s stock option plans expire in the calendar years 2008 through 2016. The following is an aggregate summary of the activity in the Company’s stock option plans from April 30, 2005 to April 30, 2008:
| | | | | | | | | | | | | |
| | Number
of
Shares | | Exercise
Price
per Share | | Proceeds
on
Exercise | | Weighted Average
Exercise Price per
Share | |
| | | | | | | | | |
| | | | | | | | | | | | | |
Outstanding at April 30, 2005 | | | 370,220 | | $ | 3.67 to $23.75 | | | 3,584,975 | | $ | 9.68 | |
Granted | | | 15,000 | | | 22.17 | | | 332,550 | | | 22.17 | |
Exercised | | | (72,650 | ) | | 3.67 to 8.77 | | | (479,971 | ) | | 6.61 | |
Canceled | | | (25,275 | ) | | 6.59 to 23.75 | | | (456,715 | ) | | 18.07 | |
| | | | | | | | | | | | | |
| | | | | | | | | | | | | |
Outstanding at April 30, 2006 | | | 287,295 | | $ | 3.67 to $23.75 | | | 2,980,839 | | $ | 10.38 | |
Granted | | | 12,250 | | | 11.62 to 20.47 | | | 241,908 | | | 19.75 | |
Exercised | | | (13,750 | ) | | 3.67 to 11.83 | | | (81,030 | ) | | 5.89 | |
Canceled | | | (11,250 | ) | | 19.83 to 22.17 | | | (234,250 | ) | | 20.82 | |
| | | | | | | | | | | | | |
Outstanding at April 30, 2007 | | | 274,545 | | $ | 3.67 to $23.75 | | | 2,907,467 | | $ | 10.59 | |
| | | | | | | | | | | | | |
Granted | | | 375,000 | | $ | 11.90 to $13.37 | | | 4,484,550 | | $ | 11.96 | |
Exercised | | | (55,898 | ) | $ | 3.67 | | | (204,959 | ) | | 3.67 | |
| | | | | | | | | | | | | |
| | | | | | | | | | | | | |
Outstanding at April 30, 2008 | | | 593,647 | | $ | 3.67 to $23.75 | | $ | 7,187,058 | | $ | 12.11 | |
| | | | | | | | | | | | | |
Options for 360,000 shares were granted to executive officers on October 16, 2007 but were not yet exercisable. The vesting of these options are set to vest in one third increments and are subject to the attainment of certain profitability goals over the three fiscal years ending April 30, 2010. All other options are currently exercisable. A summary of stock options outstanding as of April 30, 2008 is as follows:
| | | | | | | | | | | |
Range of
Exercise Prices | | | Number
of Shares | | Weighted Average
Remaining
Contractual Life | | Weighted
Average
Exercise Price | |
| | | | | | | | | |
| | | | | | | | | | | |
$ 3.67 to $ 8.77 | | | | 129,147 | | | 1.88 | | $ | 5.30 | |
11.62 to 23.75 | | | | 464,500 | �� | | 8.92 | | | 14.00 | |
| | | | | | | | | | | |
| | | | | | | | | | | |
| | | | 593,647 | | | 7.38 | | $ | 12.11 | |
| | | | | | | | | | | |
49
K - Commitments and Contingencies
Facility Leases
The Company leases certain dealership and office facilities under various non-cancelable operating leases. Dealership leases are generally for periods from three to five years and contain multiple renewal options. As of April 30, 2008, the aggregate rentals due under such leases, including renewal options that are reasonably assured, were as follows:
| | | | |
Years Ending
April 30, | | Amount
(In thousands) | |
| | | | |
| | | |
2009 | | $ | 2,342 | |
2010 | | | 2,333 | |
2011 | | | 2,375 | |
2012 | | | 2,331 | |
2013 | | | 2,227 | |
Thereafter | | | 13,607 | |
| | | | |
| | | | |
| | $ | 25,215 | |
| | | | |
The $25.2 million of lease commitments includes $3.4 million of non-cancelable lease commitments under the primary lease terms, and $21.8 million of lease commitments for renewal periods at the Company’s option that are reasonably assured. For the years ended April 30, 2008, 2007 and 2006, rent expense for all operating leases amounted to approximately $2,698,000, $2,757,000 and $2,440,000, respectively.
Litigation
In the ordinary course of business, the Company has become a defendant in various types of other legal proceedings. The Company does not expect the final outcome of any of these actions, individually or in the aggregate, to have a material adverse effect on the Company’s financial position, annual results of operations or cash flows. However, the results of legal proceedings cannot be predicted with certainty, and an unfavorable resolution of one or more of these legal proceedings could have a material adverse effect on the Company’s financial position, annual results of operations or cash flows.
Related Finance Company
Car-Mart of Arkansas and Colonial do not meet the affiliation standard for filing consolidated income tax returns, as such they file separate federal and state income tax returns. Car-Mart of Arkansas routinely sells its finance receivables to Colonial at what the Company believes to be fair market value and is able to take a tax deduction at the time of sale for the difference between the tax basis of the receivables sold and the sales price. These types of transactions, based upon facts and circumstances, have been permissible under the provisions of the Internal Revenue Code (“IRC”) as described in the Treasury Regulations. For financial accounting purposes, these transactions are eliminated in consolidation, and a deferred tax liability has been recorded for this timing difference. The sale of finance receivables from Car-Mart of Arkansas to Colonial provides certain legal protection for the Company’s finance receivables and, principally because of certain state apportionment characteristics of Colonial, also has the effect of reducing the Company’s overall effective state income tax rate by approximately 240 basis points. The actual interpretation of the Regulations is in part a facts and circumstances matter. The Company believes it satisfies the material provisions of the Regulations. Failure to satisfy those provisions could result in the loss of a tax deduction at the time the receivables are sold, and have the effect of increasing the Company’s overall effective income tax rate as well as the timing of required tax payments.
50
In May 2007, the Internal Revenue Service (“IRS”) concluded on the previously disclosed examinations of the Company’s tax returns for fiscal 2002 and certain items in subsequent years. The IRS concluded that the Company would not be assessed any additional taxes, penalties or interest related to the examinations. The examinations focused on whether or not the Company satisfied the provisions of the Treasury Regulations which would entitle Car-Mart of Arkansas to a tax deduction at the time it sells its finance receivables to Colonial. Based upon the favorable IRS conclusion, the Company recognized $500,000 of net income in the fourth quarter of fiscal 2007 for the elimination of associated income tax reserves.
The Company adopted the provisions of FASB Interpretation 48, “Accounting for Uncertainty in Income Taxes”, on May 1, 2007. Previously, the Company had accounted for tax contingencies in accordance with Statement of Financial Accounting Standards 5, “Accounting for Contingencies.” As required by Interpretation 48, which clarifies Statement 109, “Accounting for Income Taxes”, the Company recognizes the financial statement benefit of a tax position only after determining that the relevant tax authority would more likely than not sustain the position following an audit. For tax positions meeting the more-likely-than-not threshold, the amount recognized in the financial statements is the largest benefit that has a greater than 50 percent likelihood of being realized upon ultimate settlement with the relevant tax authority. At the adoption date, the Company applied Interpretation 48 to all tax positions for which the statute of limitations remained open. The Company had no adjustments or unrecognized tax benefits as a result of the implementation of Interpretation 48.
The Company is subject to income taxes in the U.S. federal jurisdiction and various state jurisdictions. Tax regulations within each jurisdiction are subject to the interpretation of the related tax laws and regulations and require significant judgment to apply. With few exceptions, the Company is no longer subject to U.S. federal, state and local income tax examinations by tax authorities for the years before 2005.
The Company’s policy is to recognize accrued interest related to unrecognized tax benefits in interest expense and penalties in operating expenses. The Company had no accrued penalties and/or interest as of April 30, 2008.
L - Fair Value of Financial Instruments
The table below summarizes information about the fair value of financial instruments included in the Company’s financial statements at April 30, 2008 and 2007:
| | | | | | | | | | | | | |
| | April 30, 2008 | | April 30, 2007 | |
| | | | | |
(In thousands) | | Carrying
Value | | Fair
Value | | Carrying
Value | | Fair
Value | |
| | | | | | | | | | |
| | | | | | | | | | | | | |
Cash | | $ | 153 | | $ | 153 | | $ | 257 | | $ | 257 | |
Finance receivables, net | | | 163,344 | | | 131,832 | | | 139,194 | | | 133,840 | |
Accounts payable | | | 3,871 | | | 3,871 | | | 2,473 | | | 2,473 | |
Revolving credit facilities | | | 30,587 | | | 30,587 | | | 30,311 | | | 30,311 | |
Notes payable | | | 9,750 | | | 9,750 | | | 10,518 | | | 10,518 | |
51
Because no market exists for certain of the Company’s financial instruments, fair value estimates are based on judgments and estimates regarding yield expectations of investors, credit risk and other risk characteristics, including interest rate and prepayment risk. These estimates are subjective in nature and involve uncertainties and matters of judgment and therefore cannot be determined with precision. Changes in assumptions could significantly affect these estimates. The methodology and assumptions utilized to estimate the fair value of the Company’s financial instruments are as follows:
| Financial Instrument | | Valuation Methodology |
| | | |
| | | |
| Cash | | The carrying amount is considered to be a reasonable estimate of fair value due to the short-term nature of the financial instrument. |
| | | |
| Finance receivables, net | | The fair value was estimated based upon discussions with third party purchasers of finance receivables and the Company’s own recent experience with purchasing businesses in the industry. |
| | | |
| Accounts payable | | The carrying amount is considered to be a reasonable estimate of fair value due to the short-term nature of the financial instrument. |
| | | |
| Revolving credit facilities | | The fair value approximates carrying value due to the variable interest rates charged on the borrowings. |
| | | |
| Notes payable | | The fair value approximates carrying value due to the nature of the collateral and the fairly recent placement of the debt. |
M - Supplemental Cash Flow Information
Supplemental cash flow disclosures for the years ended April 30, 2008, 2007 and 2006 are as follows:
| | | | | | | | | | |
| | Years Ended April 30, | |
(In thousands) | | 2008 | | 2007 | | 2006 | |
| | | | | | | | |
Supplemental disclosures: | | | | | | | | | | |
Interest paid | | $ | 3,056 | | $ | 3,700 | | $ | 2,336 | |
Income taxes paid, net | | | 6,391 | | | 5,856 | | | 9,204 | |
| | | | | | | | | | |
Non-cash transactions: | | | | | | | | | | |
Inventory acquired in repossessions and payment protection plan claims | | | 20,099 | | | 19,570 | | | 13,630 | |
N - Quarterly Results of Operations (unaudited)
A summary of the Company’s quarterly results of operations for the years ended April 30, 2008 and 2007 is as follows (in thousands, except per share information):
| | | | | | | | | | | | | | | | |
| | Year Ended April 30, 2008 | |
| | First
Quarter | | Second
Quarter | | Third
Quarter | | Fourth
Quarter | | Total | |
| | | | | | | | | | | |
| | | | | | | | | | | |
Revenues | | $ | 58,707 | | $ | 68,243 | | $ | 71,139 | | $ | 76,542 | | $ | 274,631 | |
Net income | | | 2,141 | | | 3,466 | | | 3,378 | | | 6,048 | | | 15,033 | |
Earnings per share: | | | | | | | | | | | | | | | | |
Basic | | | .18 | | | .29 | | | .29 | | | .52 | | | 1.27 | |
Diluted | | | .18 | | | .29 | | | .28 | | | .51 | | | 1.26 | |
52
| | | | | | | | | | | | | | | | |
| | Year Ended April 30, 2007 | |
| | First
Quarter | | Second
Quarter | | Third
Quarter | | Fourth
Quarter | | Total | |
| | | | | | | | | | | |
| | | | | | | | | | | |
Revenues | | $ | 62,191 | | $ | 59,539 | | $ | 59,308 | | $ | 59,296 | | $ | 240,334 | |
Net income (loss) | | | 4,155 | | | (1,928 | ) | | (50 | ) | | 2,055 | | | 4,232 | |
Earnings per share: | | | | | | | | | | | | | | | | |
Basic | | | .35 | | | (.16 | ) | | — | | | .17 | | | .36 | |
Diluted | | | .35 | | | (.16 | ) | | — | | | .16 | | | .35 | |
53
Item 9. Changes in and Disagreements with Accountants on Accounting and Financial Disclosure
Not applicable.
Item 9A. Controls and Procedures
Disclosure Controls and Procedures
We maintain disclosure controls and procedures that are designed to ensure that information required to be disclosed by us in the reports we file or submit under the Exchange Act is recorded, processed, summarized and reported within the time periods specified in the SEC’s rules and forms, and that such information is accumulated and communicated to our management, including our Chief Executive Officer (principal executive officer) and Chief Financial Officer (principal financial officer), to allow timely decisions regarding required disclosure.
Our management, including our Chief Executive Officer and Chief Financial Officer, evaluated the effectiveness of our disclosure controls and procedures (as defined in Rules 13a-15(e) and 15d-15(e) promulgated under the Exchange Act), as of the end of period covered by this report, April 30, 2008. Based on that evaluation, our Chief Executive Officer and Chief Financial Officer concluded that, as of April 30, 2008, our disclosure controls and procedures were effective.
Management’s Report on Internal Control Over Financial Reporting
Management of the Company is responsible for establishing and maintaining adequate internal control over financial reporting as defined in Rules 13a-15(f) and 15d-15(f) under the Securities Exchange Act of 1934. The Company’s internal control over financial reporting is designed to provide reasonable assurance regarding the reliability of financial reporting and the preparation of financial statements for external purposes in accordance with generally accepted accounting principles.
Because of its inherent limitations, internal control over financial reporting may not prevent or detect misstatements. Therefore, even those systems determined to be effective can provide only reasonable assurance with respect to financial statement preparation and presentation. Also, projections of any evaluation of effectiveness to future periods are subject to the risk that controls may become inadequate because of changes in conditions, or that the degree of compliance with the policies or procedures may deteriorate.
Management assessed the effectiveness of the Company’s internal control over financial reporting as of April 30, 2008. In making this assessment, management used the criteria set forth by the Committee of Sponsoring Organizations of the Treadway Commission (COSO) inInternal Control-Integrated Framework.
Based on management’s assessment and those criteria, management believes that the Company maintained effective internal control over financial reporting as of April 30, 2008.
The Company’s independent registered public accounting firm have issued an attestation report on management’s assessment of the Company’s internal control over financial reporting. That report appears below.
54
Report of Independent Registered Public Accounting Firm
|
Stockholders and Board of Directors |
America’s Car-Mart, Inc. |
We have audited America’s Car-Mart, Inc.’s (a Texas corporation) internal control over financial reporting as of April 30, 2008, based on criteria established inInternal Control—Integrated Framework issued by the Committee of Sponsoring Organizations of the Treadway Commission (COSO). America’s Car-Mart, Inc.’s management is responsible for maintaining effective internal control over financial reporting and for its assessment of the effectiveness of internal control over financial reporting, included in the accompanying Management’s Report on Internal Control Over Financial Reporting. Our responsibility is to express an opinion on America’s Car-Mart, Inc.’s internal control over financial reporting based on our audit.
We conducted our audit in accordance with the standards of the Public Company Accounting Oversight Board (United States). Those standards require that we plan and perform the audit to obtain reasonable assurance about whether effective internal control over financial reporting was maintained in all material respects. Our audit included obtaining an understanding of internal control over financial reporting, assessing the risk that a material weakness exists, testing and evaluating the design and operating effectiveness of internal control based on the assessed risk, and performing such other procedures as we considered necessary in the circumstances. We believe that our audit provides a reasonable basis for our opinion.
A company’s internal control over financial reporting is a process designed to provide reasonable assurance regarding the reliability of financial reporting and the preparation of financial statements for external purposes in accordance with generally accepted accounting principles. A company’s internal control over financial reporting includes those policies and procedures that (1) pertain to the maintenance of records that, in reasonable detail, accurately and fairly reflect the transactions and dispositions of the assets of the company; (2) provide reasonable assurance that transactions are recorded as necessary to permit preparation of financial statements in accordance with generally accepted accounting principles, and that receipts and expenditures of the company are being made only in accordance with authorizations of management and directors of the company; and (3) provide reasonable assurance regarding prevention or timely detection of unauthorized acquisition, use, or disposition of the company’s assets that could have a material effect on the financial statements.
Because of its inherent limitations, internal control over financial reporting may not prevent or detect misstatements. Also, projections of any evaluation of effectiveness to future periods are subject to the risk that controls may become inadequate because of changes in conditions, or that the degree of compliance with the policies or procedures may deteriorate. In our opinion, America’s Car-Mart, Inc. maintained, in all material respects, effective internal control over financial reporting as of April 30, 2008, based on criteria established inInternal Control—Integrated Framework issued by COSO.
We also have audited, in accordance with the standards of the Public Company Accounting Oversight Board (United States), the consolidated balance sheets of America’s Car-Mart, Inc. and subsidiaries as of April 30, 2008 and 2007, and the related consolidated statements of operations, cash flows and stockholders’ equity for each of the three years in the period ended April 30, 2008 and our report dated July 3, 2008 expressed an unqualified opinion.
|
/s/ GRANT THORNTON LLP |
|
Tulsa, Oklahoma |
July 3, 2008 |
55
Changesin Internal ControlOver Financial Reporting
There were no changes in the Company’s internal control over financial reporting (as defined in Rule 13a-15(f) under the Exchange Act) that occurred during the Company’s last fiscal quarter that have materially affected or are reasonably likely to materially affect the Company’s internal control over financial reporting.
Item 9A(T). Controls and Procedures
Not Applicable.
Item 9B. Other Information
Not Applicable.
56
PART III
Except as to information with respect to executive officers which is contained in a separate heading under Part I, Item 1 of this Form 10-K, the information required by Items 10 through 14 of this Form 10-K is, pursuant to General Instruction G(3) of Form 10-K, incorporated by reference herein from the Company’s definitive proxy statement to be filed pursuant to Regulation 14A for the Company’s Annual Meeting of Stockholders to be held in October 2007 (the “Proxy Statement”). The Company will, within 120 days of the end of its fiscal year, file with the SEC a definitive proxy statement pursuant to Regulation 14A.
Item 10. Directors, Executive Officers and Corporate Governance
The information required by this item will be contained in the Proxy Statement and such information is incorporated herein by reference. Information regarding the executive officers of the Company is set forth under the heading “Executive Officers” in Part I, Item 1 of this report.
Item 11. Executive Compensation
The information required by this item will be contained in the Proxy Statement and such information is incorporated herein by reference.
Item 12. Security Ownership of Certain Beneficial Owners and Management and Related Stockholder Matters
The information required by this item will be contained in the Proxy Statement and such information is incorporated herein by reference. See also “Equity Compensation Plan Information” in Item 5 of this report in response to this item.
Item 13. Certain Relationships and Related Transactions, and Director Independence
The information required by this item will be contained in the Proxy Statement and such information is incorporated herein by reference.
Item 14. Principal Accountant Fees and Services
The information required by this item is will be contained in the Proxy Statement and such information is incorporated herein by reference.
57
PART IV
Item 15. Exhibits and Financial Statement Schedules
The financial statement schedules are omitted since the required information is not present, or is not present in amounts sufficient to require submission of the schedules, or because the information required is included in the consolidated financial statements and notes thereto.
| | | | | | |
| Exhibit
Number | | | | Description of Exhibit | |
| | | | | | |
| | |
3.1 | | Articles of Incorporation of the Company, as amended. (2) |
| | |
3.2 | | Amended and Restated Bylaws of the Company dated December 4, 2007. (3) |
| | |
4.1 | | Specimen stock certificate. (4) |
| | |
4.2 | | Amended and Restated Agented Revolving Credit Agreement, dated June 23, 2005, among Colonial Auto Finance, Inc., as borrower, Bank of Arkansas, N.A., Great Southern Bank, Arvest Bank, First State Bank, Bank of Oklahoma, N.A., and Liberty Bank of Arkansas and one or more additional lenders to be determined at a later date, Bank of Arkansas, N.A., as agent for the banks and Bank of Oklahoma, N.A., as the paying agent. (5) |
| | |
4.2.1 | | First Amendment to the Amended and Restated Agented Revolving Credit Agreement, dated September 30, 2005, among Colonial Auto Finance, Inc., as borrower, Bank of Arkansas, N.A., Great Southern Bank, Arvest Bank, First State Bank, Bank of Oklahoma, N.A., and Liberty Bank of Arkansas and one or more additional lenders to be determined at a later date, Bank of Arkansas, N.A., as agent for the banks. (6) |
58
| | | | | | |
| Exhibit Number | | | | Description of Exhibit | |
| | | | | | |
4.2.2 | | Third Amendment to the Amended and Restated Agented Revolving Credit Agreement, dated February 24, 2006, among Colonial Auto Finance, Inc., as borrower, Bank of Arkansas, N.A., Great Southern Bank, Arvest Bank, First State Bank, Bank of Oklahoma, N.A., and Liberty Bank of Arkansas and one or more additional lenders to be determined at a later date, Bank of Arkansas, N.A., as agent for the banks. (7) |
| | |
4.2.3 | | Fourth Amendment to the Amended and Restated Agented Revolving Credit Agreement, dated April 28, 2006, among Colonial Auto Finance, Inc., as borrower, Bank of Arkansas, N.A., Great Southern Bank, Arvest Bank, First State Bank, Bank of Oklahoma, N.A., and Liberty Bank of Arkansas and one or more additional lenders to be determined at a later date, Bank of Arkansas, N.A., as agent for the banks. (8) |
| | |
4.2.4 | | Fifth Amendment to Amended and Restated Agented Revolving Credit Agreement, dated March 8, 2007 (effective December 31, 2006), among Colonial Auto Finance, Inc., as borrower, Bank of Arkansas, N.A., Great Southern Bank, First State Bank of Northwest Arkansas, Enterprise Bank and Trust, Sovereign Bank, Commerce Bank, N.A. and First State Bank. (16) |
| | |
4.2.5 | | Sixth Amendment to Amended and Restated Agented Revolving Credit Agreement, dated May 16, 2008, among Colonial Auto Finance, Inc., as borrower, Bank of Arkansas, N.A., Great Southern Bank, First State Bank of Northwest Arkansas, Enterprise Bank and Trust, Sovereign Bank, Commerce Bank, N.A. and First State Bank. (19) |
| | |
4.3 | | Revolving Credit Agreement, dated June 23, 2005, among America’s Car-Mart, Inc., an Arkansas corporation, and Texas Car-Mart, Inc., as borrowers, and Bank of Oklahoma, N.A., as lender. (5) |
| | |
4.3.1 | | Second Amendment to Revolving Credit Agreement, dated September 30, 2005, among America’s Car-Mart, Inc., an Arkansas corporation, and Texas Car-Mart, Inc., as borrowers, and Bank of Oklahoma, N.A., as lender. (6) |
| | |
4.3.2 | | Third Amendment to Revolving Credit Agreement, dated April 28, 2006, among America’s Car-Mart, Inc., an Arkansas corporation, and Texas Car-Mart, Inc., as borrowers, and Bank of Oklahoma, N.A., as lender. (8) |
| | |
4.3.3 | | Fourth Amendment to Revolving Credit Agreement, dated March 8, 2007 (effective December 31, 2006), among America’s Car-Mart, Inc. an Arkansas corporation, and Texas Car-Mart, Inc. as borrowers, and Bank of Arkansas, N.A., as lender. (16) |
| | |
4.3.4 | | Guaranty Agreement dated March 8, 2007 (effective December 31, 2006), among America’s Car-Mart, Inc., an Arkansas corporation, and Bank of Arkansas, N.A., as lender. (16) |
| | |
4.3.5 | | Fifth Amendment to Revolving Credit Agreement, dated May 16, 2008, among America’s CAR-MART, Inc., an Arkansas corporation, and Texas CAR-MART, Inc., as borrowers, and Bank of Arkansas, N.A., as lender. (19) |
| | |
59
| | | | | | |
| Exhibit
Number | | | | Description of Exhibit | |
| | | | | | |
4.4 | | International Swap Dealers Association, Inc. Master Agreement, Schedule to the Master Agreement and Credit Support Annex dated May 15, 2008 among America’s CAR-MART, Inc., Texas CAR-MART, Inc., Colonial Finance, Inc. and Bank of Oklahoma, N.A. (19) |
| | |
10.1 | | 1986 Incentive Stock Option Plan. (9) |
| | |
10.1.1 | | Amendment to 1986 Incentive Stock Option Plan adopted September 27, 1990. (10) |
| | |
10.2 | | 1991 Non-Qualified Stock Option Plan. (11) |
| | |
10.3 | | 1997 Stock Option Plan. (12) |
| | |
10.4 | | 2005 Restricted Stock Plan. (15) |
| | |
10.4.1 | | Amendment to 2005 Restricted Stock Plan (17) |
| | |
10.5 | | Form of Indemnification Agreement between the Company and certain officers and directors of the Company. (13) |
| | |
10.6 | | Employment Agreement, dated May 1, 2006, between the Company and Tilman J. Falgout, III. (18) |
| | |
10.6.1 | | Amendment No. 1 to Employment Agreement, effective as of August 27, 2007, between the Company and Tilman J. Falgout, III. (3) |
| | |
10.7 | | Employment Agreement, dated as of May 1, 2007, between the Company and William H. Henderson. (3) |
| | |
10.8 | | Employment Agreement, dated as of May 1, 2007, between the Company and Eddie L. Hight. (3) |
| | |
10.9 | | Employment Agreement, dated May 1, 2007, between the Company and Jeffrey A. Williams. (3) |
| | |
10.10 | | 2007 Stock Option Plan effective August 27, 2007. (20) |
| | |
10.11 | | Amendment to the Stock Incentive Plan adopted August 27, 2007. (20) |
| | |
10.12 | | Form of Option Agreement for 2007 Stock Option Plan. (3) |
| | |
14.1 | | Code of Business Conduct and Ethics. (14) |
| | |
21.1 | | Subsidiaries of America’s Car-Mart, Inc. (1) |
| | |
23.1 | | Consent of Independent Registered Public Accounting Firm. (1) |
| | |
24.1 | | Power of Attorney of William H. Henderson. (1) |
60
| | | | | | |
| Exhibit
Number | | | | Description of Exhibit | |
| | | | | | |
| | |
24.2 | | Power of Attorney of Tilman J. Falgout, III. (1) |
| | |
24.3 | | Power of Attorney of J. David Simmons. (1) |
| | |
24.4 | | Power of Attorney of William A. Swanston. (1) |
| | |
24.5 | | Power of Attorney of William M. Sams. (1) |
| | |
24.6 | | Power of Attorney of Daniel J. Englander. (1) |
| | |
31.1 | | Rule 13a-14(a) certification. (1) |
| | |
31.2 | | Rule 13a-14(a) certification. (1) |
| | |
32.1 | | Section 1350 certification. (1) |
| | | |
| | |
(1) | | Filed herewith. |
| | |
(2) | | Previously filed as Exhibits 4.1-4.8 to the Company’s Registration Statement on Form S-8 initially filed with the Securities and Exchange Commission on November 16, 2005 (No. 333-129727) and incorporated herein by reference. |
| | |
(3) | | Previously filed as Exhibit 3.2 to the Company’s current report on Form 8-K initially filed with the Securities and Exchange Commission on December 7, 2007 and incorporated herein by reference. |
| | |
(4) | | Previously filed as an Exhibit to the Company’s Annual Report on Form 10-K for the year ended April 30, 1994 and incorporated herein by reference. |
| | |
(5) | | Previously filed as an Exhibit to the Company’s Current Report on Form 8-K initially filed with the Securities and Exchange Commission on June 29, 2005 and incorporated herein by reference. |
| | |
(6) | | Previously filed as an Exhibit to the Company’s Current Report on Form 8-K initially filed with the Securities and Exchange Commission on October 6, 2005 and incorporated herein by reference. |
| | |
(7) | | Previously filed as an Exhibit to the Company’s Current Report on Form 8-K initially filed with the Securities and Exchange Commission on February 27, 2006 and incorporated herein by reference. |
| | |
(8) | | Previously filed as an Exhibit to the Company’s Current Report on Form 8-K initially filed with the Securities and Exchange Commission on May 3, 2006 and incorporated herein by reference. |
| | |
(9) | | Previously filed as an Exhibit to the Company’s Registration Statement on Form 10, as amended, (No. 0-14939) and incorporated herein by reference. |
| | |
(10) | | Previously filed as an Exhibit to the Company’s Annual Report on Form 10-K for the year ended April 30, 1991 and incorporated herein by reference. |
| | |
(11) | | Previously filed as an Exhibit to the Company’s Annual Report on Form 10-K for the year ended April 30, 1992 and incorporated herein by reference. |
| | |
(12) | | Previously filed as an Exhibit to the Company’s Registration Statement on Form S-8, as amended, initially filed with the Securities and Exchange Commission on October 20, 1997 (No. 333-38475) and incorporated herein by reference. |
| | |
(13) | | Previously filed as an Exhibit to the Company’s Quarterly Report on Form 10-Q for the quarter ended July 31, 1993 and incorporated herein by reference. |
| | |
(14) | | Previously filed as an Exhibit to the Company’s Annual Report on Form 10-K for the year ended April 30, 2004 and incorporated herein by reference. |
| | |
(15) | | Previously filed as Appendix B to the Company’s Proxy Statement on Schedule 14A initially filed with the Securities and Exchange Commission on August 29, 2005 and incorporated herein by reference. |
| | |
(16) | | Previously filed as an Exhibit to the Company’s Quarterly Report on Form 10-Q for the quarter ended January 31, 2007 and incorporated herein by reference. |
| | |
(17) | | Previously filed as an Exhibit to the Company’s Quarterly Report on Form 10-Q for the quarter ended October 31, 2006 and incorporated herein by reference. |
61
| | |
(18) | | Previously filed as an Exhibit to the Company’s Annual Report on Form 10-K for the year ended April 30, 2006 and incorporated herein by reference. |
| | |
(19) | | Previously filed as an Exhibit to the Company’s Quarterly Report on Form 10-Q for the quarter ended October 31, 2007 and incorporated herein by reference. |
| | |
(20) | | Previously filed as Appendix to the Company’s Proxy Statement on Schedule 14A initially filed with the Securities and Exchange Commission on August 28, 2007 and incorporated herein by reference. |
| | |
(b) | | The exhibits are listed in Item 15(a)3 above. |
| | |
(c) | | Refer to Item 15(a)2. above. |
62
SIGNATURES
Pursuant to the requirements of Section 13 or 15(d) of the Securities Exchange Act of 1934, the Registrant has duly caused this report to be signed on its behalf by the undersigned, thereunto duly authorized.
| | | | |
| | AMERICA’S CAR-MART, INC. |
| | | |
Dated: July 3, 2008 | | By: | /s/ William H. Henderson |
| | | | |
| | | William H. Henderson |
| | | Chief Executive Officer |
| | | (principal executive officer) |
| | | |
Dated: July 3, 2008 | | By: | /s/ Jeffrey A. Williams |
| | | | |
| | | Jeffrey A. Williams |
| | | Vice President Finance and Chief Financial Officer |
| | | (principal financial and accounting officer) |
Pursuant to the requirements of the Securities Exchange Act of 1934, this report has been signed by the following persons on behalf of the registrant and in the capacities and on the dates indicated.
| | | | | | | | | | |
| Signature | | | | Title | | | | Date | |
| | | | | | | | | | |
| | | | | | |
* | | Chairman of the Board, | | July 3, 2008 |
| | | | | |
Tilman J. Falgout, III | | General Counsel and Director | | |
| | | | |
* | | Vice Chairman of the Board, | | |
| �� | | | | |
William H. Henderson | | Chief Executive Officer
and Director | | July 3, 2008 |
| | | | |
* | | Director | | July 3, 2008 |
| | | | | |
J. David Simmons | | | | |
| | | | |
* | | Director | | July 3, 2008 |
| | | | | |
Daniel J. Englander | | | | |
| | | | |
* | | Director | | July 3, 2008 |
| | | | | |
William M. Sams | | | | |
| | | | |
* | | Director | | July 3, 2008 |
| | | | | |
William A. Swanston | | | | |
| | |
* By /s/ Jeffrey A. Williams | |
| | |
| Jeffrey A. Williams | |
| As Attorney-in-Fact | |
| Pursuant to Powers of | |
| Attorney filed herewith | |
63