Exhibit 4.5
Management’s Discussion and Analysis
For the three months ended March 31, 2013
New Gold Inc.
TABLE OF CONTENTS
| 1 | EXECUTIVE SUMMARY | ||
| 2 | FINANCIAL AND OPERATING HIGHLIGHTS | ||
| 3 | Financial highlights | ||
| 4 | Operating highlights | ||
| 5 | Development and exploration highlights | ||
| 5 | Corporate developments | ||
| 5 | OUTLOOK FOR 2013 | ||
| 6 | KEY PERFORMANCE DRIVERS AND ECONOMIC OUTLOOK | ||
| 6 | Key performance drivers | ||
| 7 | Economic outlook | ||
| 8 | CORPORATE SOCIAL RESPONSIBILITY | ||
| 9 | FINANCIAL AND OPERATING RESULTS | ||
| 9 | Summary of quarterly and year to date financial and operating results | ||
| 12 | Review of operating mines | ||
| 17 | DEVELOPMENT AND EXPLORATION REVIEW | ||
| 20 | FINANCIAL CONDITION REVIEW | ||
| 20 | Balance sheet review | ||
| 22 | Liquidity and cash flow | ||
| 22 | Commitments | ||
| 22 | Contingencies | ||
| 23 | Contractual obligations | ||
| 23 | Related party transactions | ||
| 23 | Off-balance sheet arrangements | ||
| 23 | Outstanding shares | ||
| 23 | NON-GAAP FINANCIAL PERFORMANCE MEASURES | ||
| 26 | ENTERPRISE RISK MANAGEMENT | ||
| 26 | General risks | ||
| 26 | Financial risk management | ||
| 30 | CRITICAL ACCOUNTING POLICIES, ESTIMATES AND ACCOUNTING CHANGES | ||
| 34 | CONTROLS AND PROCEDURES | ||
| 35 | CAUTIONARY NOTES | ||
Management’s Discussion and Analysis
For the three months ended March 31, 2013
The following Management’s Discussion and Analysis (“MD&A”) provides information that management believes is relevant to an assessment and understanding of the consolidated financial condition and results of operations of New Gold Inc. and its subsidiaries (“New Gold” or the “Company”), including its predecessor entities. This MD&A should be read in conjunction with New Gold’s unaudited condensed consolidated financial statements for the three months ended March 31, 2013 and 2012 and related notes which are prepared in accordance with International Financial Reporting Standards (“IFRS”) as issued by the International Accounting Standards Board (“IASB”). This MD&A contains forward-looking statements that are subject to risk factors set out in a cautionary note contained in this MD&A. The reader is cautioned not to place undue reliance on forward-looking statements. All figures are in United States dollars and tabular amounts are in millions, unless otherwise noted. This MD&A has been prepared as at May 1, 2013. Additional information relating to the Company, including the Company’s Annual Information Form, is available on SEDAR at www.sedar.com.
EXECUTIVE SUMMARY
New Gold is an intermediate gold producer with operating mines in Canada, Mexico, the United States and Australia and development projects in Canada and Chile. With a strong liquidity position, simplified balance sheet and an experienced management and board of directors, the Company has a solid platform to continue to execute its growth strategy. During the first quarter of 2013, the New Afton Mine in Canada (“New Afton”), the Cerro San Pedro Mine in Mexico (“Cerro San Pedro”), the Mesquite Mine in the United States (“Mesquite”) and the Peak Mines in Australia (“Peak Mines”) combined to produce 94,695 ounces of gold.
New Gold’s production costs remain very competitive when compared to the broader gold mining industry and provide the Company with strong margins. In the first quarter of 2013, New Gold achieved total cash costs(1) of $485 per ounce of gold sold and an average realized gold price(1) of $1,494 per ounce, resulting in a margin(1) per ounce of $1,009 . This compares to a margin per ounce of $1,032 in the first quarter of 2012. New Gold has been able to maintain its costs well below the industry average as the Company also produces silver and copper as by-product metals, which have historically moved in line with, and acted as an offset to, some of the input cost pressures faced by the mining industry. Consistent with New Gold’s plan, operations are expected to have progressively stronger quarters throughout 2013 leading to increased gold production and operating cash flow, with steadily declining cash costs. New Gold remains in line to meet production and cash cost guidance for 2013.
Subsequent to quarter-end, on April 4, 2013, New Gold announced a Mineral Resource update at its Blackwater Project. This Blackwater resource update, which will be used for the project’s Feasibility Study, has been updated to include 89 additional holes totaling 22,220 metres, including further infill drilling and more refined geologic and geostatistical modeling. Key highlights of the update are:
| · | Measured and Indicated(2) gold resources for direct processing increased to 8.6 million ounces at 0.88 grams per tonne |
| · | Measured gold resources increased by 44% to 3.9 million ounces at 1.04 grams per tonne |
During the quarter, a Mineral Resource update was also announced at New Afton as part of the year-end resource update which resulted in the New Afton mine life being extended by two years from 12 to 14 years. In addition, the C-Zone resource, which lies immediately down plunge of the block of mineralization currently being mined, has been updated at May 1, 2013, to incorporate the drilling that was completed through the end of February 2013. The C-Zone update reflects positive increases to the gold and copper resource at more favourable grades. The objective of the C-Zone exploration drilling is to add to the mine’s life while, at the same time, New Gold continues to evaluate opportunities to increase the throughput rate beyond the nameplate capacity of 11,000 tonnes per day.
New Gold continues to build on its successful portfolio which now consists of four operating mines and two development projects, all located in jurisdictions that are considered favourable to mining activities.
| 1. | We use certain non-GAAP financial performance measures throughout our MD&A. For a detailed description of each of the non-GAAP measures used in this MD&A, please see the discussion under “Non-GAAP Financial Performance Measures” of this MD&A. |
| 2. | Notes to Mineral Resources Estimates are on page 18 of this MD&A. |
1
FINANCIAL AND OPERATING HIGHLIGHTS
| Three months ended March 31 | ||||
| (in millions of U.S. dollars, except where noted) | 2013 | 2012 | ||
| Operating information: | ||||
| Gold (ounces): | ||||
Produced (1) | 94,695 | 99,274 | ||
Sold (1) | 95,181 | 93,676 | ||
| Silver (ounces): | ||||
Produced (1) | 358,905 | 456,584 | ||
Sold (1) | 360,913 | 439,141 | ||
| Copper (thousands of pounds): | ||||
Produced (1) | 15,998 | 3,683 | ||
Sold (1) | 15,867 | 1,780 | ||
Average realized price (2): | ||||
| Gold ($/ounce) | 1,494 | 1,575 | ||
| Silver ($/ounce) | 29.51 | 32.70 | ||
| Copper ($/pound) | 3.44 | 4.14 | ||
Total cash costs per gold ounce sold (2) (3) | 485 | 543 | ||
Average realized margin (2) ($/ounce) | 1,009 | 1,032 | ||
Financial Information: | ||||
| Revenues | 201.8 | 168.8 | ||
| Earnings from mine operations | 57.8 | 77.7 | ||
| Net earnings | 36.3 | 33.5 | ||
Adjusted net earnings (1) | 20.6 | 44.2 | ||
| Cash generated from operations | 68.2 | 66.1 | ||
| Net cash generated from continuing operations | 58.5 | 36.7 | ||
| Capital expenditures | 76.4 | 110.1 | ||
| Total assets | 4,302.2 | 3,293.0 | ||
| Cash and cash equivalents | 672.4 | 235.7 | ||
| Long-term debt | 854.3 | 262.3 | ||
| Share Data: | ||||
| Earnings per share from continuing operations: | ||||
| Basic | 0.08 | 0.07 | ||
| Diluted | 0.08 | 0.07 | ||
Adjusted net earnings per basic share (1) | 0.04 | 0.10 | ||
| Share price as at March 31 (TSX – Canadian dollars) | 9.24 | 9.85 | ||
| Weighted average outstanding shares (basic) (millions) | 476 | 461 | ||
| 1. | Production is shown on a total contained basis while sales are shown on a net payable basis, including final product inventory and smelter payable adjustments, where applicable. |
| 2. | We use certain non-GAAP financial performance measures throughout our MD&A. Total cash costs per gold ounce sold, average realized price, average realized margin, operating margin, adjusted net earnings, adjusted net earnings per share and cash generated from operations, excluding working capital changes and income taxes paid, are non-GAAP financial performance measures with no standard meaning under IFRS. For further information and a detailed reconciliation, please refer to the “Non-GAAP Financial Performance Measures” section of this MD&A. |
| 3. | The calculation of total cash costs per gold ounce sold is net of by-product silver and copper revenues. If silver and copper revenues were treated as co-products, co-product total cash costs for the three months ended March 31, 2013 would be $793 per ounce of gold (2012 - $672), $16.45 per ounce of silver (2012 - $13.97); and $1.96 per pound of copper (2012 - $2.09). |
2
FINANCIAL HIGHLIGHTS
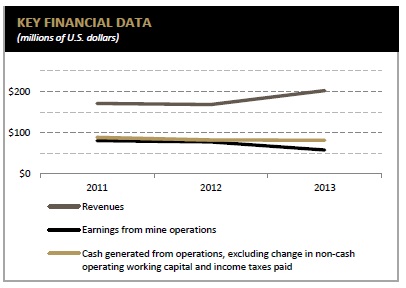
• Revenues were $201.8 million for the first quarter of 2013, an increase of 20% over $168.8 million in the prior year. The increase was driven primarily by higher sales of gold and copper compared to the prior year, positively impacted by a full quarter of commercial production at New Afton. The benefit from increased sales volume was offset by a decrease in the average realized price of gold, silver and copper. The average realized price for gold in the first quarter of 2013 was $1,494 per ounce of gold compared to $1,575 per ounce in the prior year. The average realized price of copper and silver decreased from $4.14 per pound of copper and $32.70 per ounce of silver in 2012 to $3.44 per pound of copper and $29.51 per ounce of silver in 2013.
• Net cash generated from operations in the first quarter of 2013 was $58.5 million, a 59% increase compared to $36.7 million in the prior year. This increase was primarily driven by New Afton now being a meaningful contributor to the Company’s cash flow generation and lower income taxes paid than in the prior year period. In the first quarter of 2012, the New Gold made $7.1 million in income tax payments that related to 2011. There were no similar payments made in 2013.
• Earnings from mine operations were $57.8 million for the first quarter of 2013 compared to $77.7 million in the same prior year period. The benefits of increased earnings from mine operations from New Afton and the Peak Mines were more than offset by decreases at Cerro San Pedro and Mesquite due to planned mining of lower grade ore at the Company’s two open pit operations. Additionally, non-cash depreciation and depletion expense increased to $37.9 million in the first quarter of 2013 from $18.8 million in the first quarter of 2012, reflecting the addition of the New Afton initial capital cost to the depreciable pools of assets.
• Net earnings from continuing operations for the first quarter of 2013 were $36.3 million or $0.08 per basic share, compared to $33.5 million or $0.07 per basic share in the same period in 2012. The increase is primarily due to the impact of non-operating “Other gains and losses”, where a gain of $15.8 million was recorded for the first quarter of 2013 relative to a loss of $12.1 million in 2012. The gain includes a non-cash gain on non-hedged derivatives of $22.6 million which related fully to the mark to market of the share purchase warrant liability. This benefit was offset by lower earnings from mine operations resulting from the planned mining of lower grade ore at Mesquite and Cerro San Pedro.
• Adjusted net earnings for the first quarter of 2013 were $20.6 million or $0.04 per basic share, relative to $44.2 million or $0.10 per basic share in the prior year period. In addition to the planned mining of lower grade ore, adjusted net earnings were impacted by a combination of a $19.1 million increase in non-cash depreciation and depletion expense as well as a $9.4 million increase in interest expense.
• Cash and cash equivalents were $672.4 million at March 31, 2013 compared to $687.8 million at December 31, 2012.
| 3. | We use certain non-GAAP financial performance measures throughout our MD&A. For a detailed description of each of the non-GAAP measures used in this MD&A, please see the discussion under “Non-GAAP Financial Performance Measures” of this MD&A. |
3
OPERATING HIGHLIGHTS
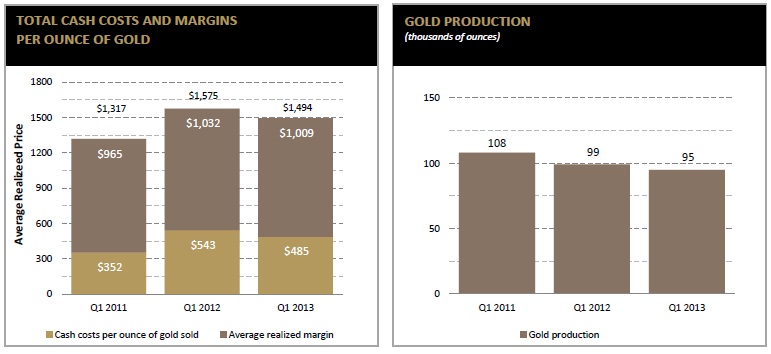
• Total cash costs per ounce sold for the first quarter of 2013, net of by-product sales, were $485 per ounce, a decrease of $58 per ounce compared to $543 per ounce in the same period in 2012. The decrease in the Company’s cash costs was primarily driven by increased copper sales volumes which were partially offset by a combination of lower realized copper prices, lower silver sales volumes and realized prices as well as the scheduled mining of lower grade ore. New Gold’s total cash costs per ounce are expected to steadily decline throughout the remainder of 2013.
• Gold production for the first quarter of 2013 was 94,695 ounces, compared to 99,274 ounces in the same prior year period. Production increases from New Afton now being part of New Gold’s operating portfolio and higher gold grades at the Peak Mines were offset by lower production at Cerro San Pedro and Mesquite due to planned mining of lower grade ore. Per the Company’s plan, gold grades and production are expected to increase during the remainder of the year.
• Copper production for the first quarter of 2013 was 16.0 million pounds, an increase of 332% compared to 3.7 million pounds in the same prior year period. This increase was due to the addition of New Afton in the first quarter of 2013 and a 14% increase in copper production at Peak Mines, reflecting an increase in ore tonnes processed and copper recoveries.
• Gold sales in the first quarter of 2013 were 95,181 ounces, up 2% from 93,676 ounces in the same period in 2012. Though production levels were lower than in the prior year period, gold sales were benefitted through a reduction in inventory in 2013 relative to an increase in 2012.
• The average realized margin for the first quarter of 2013 was $1,009 per ounce, consistent with $1,032 in the same prior year period.
4
DEVELOPMENT AND EXPLORATION HIGHLIGHTS
• Subsequent to quarter-end, New Gold updated its mineral resource estimate for Blackwater which resulted in an increase in the Measured and Indicated gold Mineral Resource to 9.5 million ounces from 8.1 million ounces at the end of 2012. The updated Mineral Resource includes 0.9 million gold ounces of lower grade Measured and Indicated Resources suitable for stockpiling and processing toward the end of the project’s currently envisioned mine life. The Mineral Resource estimate will be incorporated into the feasibility study currently in progress and scheduled for completion in late 2013. Notes to the Mineral Resource Estimates are on page 18 of this MD&A.
• Subsequent to quarter-end, an update to the New Afton C-Zone mineral resource estimate reflects an over 300% increase in gold ounces and copper pounds at improved grade. Measured and Indicated gold and copper Resources increased to 0.3 million ounces and 211 million pounds respectively. Measured and Indicated gold and copper grades increased to 0.77 grams per tonne gold and 0.77% copper from 0.62 grams per tonne and 0.68% copper. The Inferred gold and copper Resources increased by over 30% to 0.4 million ounces and 301 million pounds.
CORPORATE DEVELOPMENTS
The Company continues to pursue disciplined growth both through organic initiatives and potential mergers and acquisitions. The Company came together through two accretive business combinations in mid-2008 and mid-2009. Since the middle of 2009, New Gold has been successful in enhancing the value of its portfolio of assets, while also continuously looking for compelling external growth opportunities. The Company continues to evaluate assets in favourable jurisdictions and where the asset has the potential to provide New Gold shareholders with meaningful gold production, cash flow and exploration potential, while ensuring that any potential acquisition is accretive on key per share metrics. The Company strives to maintain a strong financial position by continually reviewing strategic alternatives with the view to maximizing shareholder value. In short, New Gold strives to pursue corporate development initiatives that will leave the Company and its shareholders in a fundamentally stronger position.
OUTLOOK FOR 2013
New Gold is pleased to reiterate its guidance for 2013 which is scheduled to provide shareholders with increased gold production at lower cost when compared to 2012:
2013 PRODUCTION AND COST GUIDANCE
| Gold | Silver | Copper | Total cash costs | |
| (thousands of ounces) | (millions of ounces) | (millions of pounds) | (per ounce) | |
| Mesquite | 130 - 140 | - | - | $830 - $850 |
| Cerro San Pedro | 140 - 150 | 1.4 - 1.6 | - | $375 - $395 |
| Peak Mines | 95 - 105 | - | 12 - 14 | $670 - $690 |
| New Afton | 75 - 85 | - | 66 - 74 | $(1,410) - $(1,390) |
| Total | 440-480 | 1.4 - 1.6 | 78 - 88 | $265 - $285 |
New Gold’s copper and silver by-product revenue continues to provide an effective natural hedge against the various cost pressures being faced by the broader industry which allows the Company to deliver lower costs.
Assumptions used in the 2013 guidance include gold, silver and copper prices of $1,600 per ounce, $30.00 per ounce and $3.50 per pound and Canadian dollar, Australian dollar and Mexican peso exchange rates of $1.00, $1.00 and $13.00 to the U.S. dollar. The diesel price assumed for 2013 is $3.70 per gallon. Realized commodity prices and average foreign exchange rates were in line with these assumptions during the first quarter, however, prices of gold, silver and copper have declined below the assumed levels in recent weeks. Though the Company’s cash costs would be negatively impacted should copper and silver prices remain below the assumed prices, other cost-related factors, such as declining oil prices, lower explosive and cyanide costs as well as the depreciation of the Canadian dollar, would benefit costs.
5
KEY PERFORMANCE DRIVERS AND ECONOMIC OUTLOOK

KEY PERFORMANCE DRIVERS
There are a range of key performance drivers that are critical to the successful implementation of New Gold’s strategy and the achievement of its goals. The key internal drivers are production volumes and costs. The key external drivers are spot prices of gold, silver and copper, as well as foreign exchange rates.
Production Volumes and Costs
New Gold has demonstrated a history of achieving guidance with respect to production volumes and costs. New Gold’s portfolio of operating mines achieved another solid production quarter, with 94,695 ounces of gold production in the first quarter of 2013.
Total cash costs per ounce sold for the quarter, net of by-products sales, of $485 are below the industry average.
New Gold’s outlook is to increase gold production in 2013 by approximately 12% and total cash costs per ounce sold are forecast to decrease by approximately $145 per ounce compared to the 2012 level at budgeted prices.
Commodity Prices
Gold prices
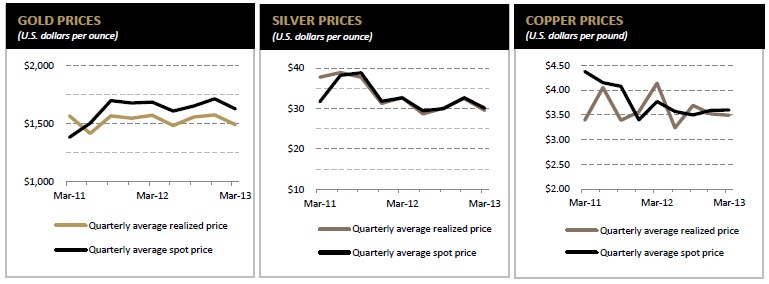
The price of gold is the largest single factor affecting New Gold’s profitability and operating cash flows. As such, the current and future financial performance of the Company will be closely related to the prevailing price of gold.
The gold price ended the quarter almost 5% lower than at the end of 2012. In April 2013 the gold price fell more significantly to a low of $1,322 per ounce on concerns that governments facing economic difficulties may consider selling part of their gold reserves, before recovering to some extent to above $1,400 per ounce as physical demand and renewed investor interest resulted in a rebound. In spite of the recent decline in prices, interest rates continue at historically low rates and are likely to remain so for the foreseeable future in the face of slow-moving economic recovery, and there are numerous political and economic risks on the horizon, all of which are traditionally positive factors for gold.
During the first quarter of 2013, the London PM fix gold price averaged $1,630 per ounce compared to $1,689 per ounce during the first quarter of 2012.
6
Copper and silver prices
Copper declined during the quarter by approximately 5%, and then fell further during the first part of April as part of the commodity sell-off that also affected gold and silver. The copper London Metals Exchange price averaged $3.60 per pound during the quarter compared to $3.77 per pound during the first quarter of 2012.
During the first quarter of 2013, silver had an average London PM fix price of $30.08 per ounce, compared to the first quarter of 2012 during which silver averaged $32.62 per ounce..
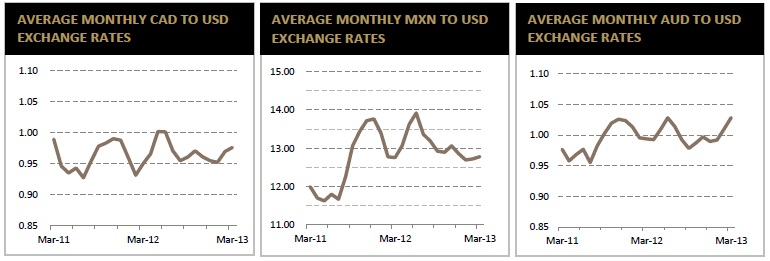
Foreign Exchange Rates
The Company operates in Canada, Mexico, the United States, Australia and Chile. As a result, the Company has foreign currency exposure with respect to items not denominated in U.S. dollars.
New Gold’s operating results and cash flows are influenced by changes in various exchange rates against the U.S. dollar. We have exposure to the Canadian dollar through New Afton and Blackwater, as well as through our corporate administration costs. We also have exposure to the Mexican peso through Cerro San Pedro, and to the Australian dollar through our Peak Mines operations.
The Canadian dollar fell from slightly above parity at the end of 2012 to end the first quarter approximately 2.5% lower. A weaker Canadian dollar reduces costs in U.S. dollar terms at the Company’s Canadian operations.
The Mexican peso increased in strength during the quarter compared with the U.S. dollar. A significant proportion of costs at Cerro San Pedro are incurred in U.S. dollars and, as such, the movement in the Mexican peso exchange rate was not a significant driver of U.S. dollar-denominated costs.
The Australian dollar stayed above parity for the duration of the quarter, initially declining before regaining most of its strength before the end of the period.
For an analysis of the impact of foreign exchange fluctuations on operating costs in 2013 relative to 2012, refer to the ‘Review of Operating Mines’ sections for New Afton, Cerro San Pedro and Peak Mines for details.
ECONOMIC OUTLOOK
In early 2013 equity indices continued to do well for the most part, with the MSCI All-Country World Index climbing by almost 6% and the S&P 500 Index reaching new highs and ending the quarter up by more than 10%. However the global recovery continued to be hampered by uncoordinated policy decisions and by unexpected economic events. Global focus shifted to Cyprus, responsible for approximately 0.2% of Eurozone GDP but sufficient to threaten the destabilization of the rest of the currency union as efforts were made to bail out the country’s overextended banking sector while balancing various creditor interests. Ultimately this led to a sell-off in gold early in the second quarter of 2013 as concerns grew that struggling governments would instruct their central banks to sell gold to generate funds.
However, buying interest has emerged at these new lower gold price levels, and uncertainty, volatility and an ongoing ultra-low interest rate environment should provide positive encouragement for gold investors.
Economic events can have significant effects on the gold price, via currency rate fluctuations, the relative strength of the U.S. dollar, supply of and demand for gold and macroeconomic factors such as the level of interest rates and inflation expectations. Management anticipates that the long term economic environment should remain positive with respect to precious metals and for gold in particular, and believes the prospects for the business are favourable. The Company has not hedged foreign exchange rates and metal prices with the exception of the gold hedge mandated by Mesquite’s 2008 project financing. New Gold’s growth plan is focused on organic and acquisition-led growth, and the Company plans to remain flexible in the current environment to be able to respond to opportunities as they arise.
7
CORPORATE SOCIAL RESPONSIBILITY
New Gold is committed to excellence in corporate social responsibility. We consider our ability to make a lasting and positive contribution toward sustainable development through the protection of the health and well-being of our people and our host communities, environmental stewardship and community engagement and development, a key driver to achieving a productive and profitable business.
As a partner of the United Nations Global Compact, New Gold’s policies and practices are guided by its principles on Human Rights, Labour, Environment and Anti-corruption. As a member of the Mining Association of Canada (“MAC”), our Canadian operations adhere closely to the principles of MAC’s Towards Sustainable Mining program.
New Gold’s corporate social responsibility objectives include promoting and protecting the welfare of our employees through safety-first work practices, upholding fair employment practices and encouraging a diverse workforce, where people are treated with respect and are supported to realize their full potential. At New Gold, we believe that our people are our most valued assets regardless of gender, race, cultural background, age or religion. We strive to create a culture of inclusiveness that begins at the top and which is reflected in our hiring, promotion and overall human resources practices. We encourage tolerance and acceptance in worker-to-worker relationships. In each of our host communities we are recognized as an employer of choice as a result of our competitive wages, competitive benefits and our policies of recognizing and rewarding employee performance and promoting from within.
We are committed to preserving the long-term health and viability of the natural environments affected by our operations. Wherever New Gold operates – in all stages of mining activity, from early exploration and planning, to commercial mining operations through to eventual closure – we are committed to excellence in environmental management. From the earliest site investigations, we carry out comprehensive environmental studies to establish baseline measurements for flora, fauna, land, air and water. During operations we promote the efficient use of resources, work to minimize environmental impacts and maintain robust monitoring programs, including groundwater and air quality. We implement progressive reclamation and re-vegetation activities throughout the life of our operations. After mining activities are complete, our objective is to restore the land to a level of productivity equivalent to its pre-mining capacity. We continually seek new strategies for enhancing our environmental performance including programs to improve energy efficiency, reduce our carbon footprint and minimize our use of water and other resources.
We are committed to establishing relationships based on mutual benefit and active participation with our host communities to contribute to healthy communities and sustainable community development. Wherever our operations interact with indigenous peoples, we endeavor to understand and respect traditional values, customs and culture. We take meaningful action to serve their development needs and priorities through collaborative agreements aimed at creating jobs, training and lasting socio-economic benefits. We foster open communication with local residents and community leaders and strive to be a full partner in the long-term sustainability of the communities and regions in which we operate. We believe that only by thoroughly understanding the people, their histories, and their needs and plans, can we engage in a meaningful development process that will contribute to their cultural and economic health and welfare.
8
FINANCIAL AND OPERATING RESULTS
Production
New Gold’s consolidated gold production during the first quarter of 2013 was 94,695 ounces compared to 99,274 ounces in 2012. Despite the contribution from New Afton, which was still in the development stage throughout the first half of 2012, and increased gold production at the Peak Mines, production increases were largely offset by the decreases at the Mesquite Mine and Cerro San Pedro. Peak Mine’s gold production increased 33% reflecting increases in ore grade and improved mill recoveries. At Cerro San Pedro and Mesquite, planned mine sequencing resulted in below reserve grade ore being placed on the leach pads which led to production being below that of the first quarter of 2012 when grades closer to reserve grade were mined. Per the Company’s plans, gold grades and production are scheduled to increase during the balance of the year. In addition, at Mesquite, the two haul trucks the Company had planned to add to the fleet are now in operation. These trucks should enable Mesquite to increase the mining rate and ore tonnes placed on the leach pad.
New Gold’s consolidated copper production during the first quarter increased to 16.0 million pounds from 3.7 million pounds in the same period of the prior year. The increase was largely attributable to a full quarter of production from New Afton, though Peak Mines also increased copper production during the quarter. The increased production at Peak Mines was due to continued mill recovery improvements, which were partially offset by lower copper grades.
As expected, silver production at Cerro San Pedro decreased during the first quarter with 358,905 ounces in 2013 relative to 456,584 ounces in 2012, due primarily to planned mining of lower silver grades.
Revenues
Revenues were $201.8 million for the first quarter of 2013, an increase of 20% compared to $168.8 million in the same period in 2012. The $33.0 million revenue increase is driven primarily by higher gold and copper sales volumes relative to the same prior year period. Gold sales in the first quarter of 2013 were 95,181 ounces, relative to 93,676 ounces in the first quarter of 2012, as inventory movements impacted the relative periods. Copper sales were 15.9 million pounds, relative to 1.8 million pounds in the same prior year period as New Afton was still in the development stage in the first quarter of 2012. Sales of silver decreased to 360,913 ounces from 439,141 ounces in the same prior year period, in line with production. These increases in sales volumes were partly offset by lower average realized prices across all metals.
Operating expenses
Operating expenses increased from $72.3 million in the first quarter of 2012 to $106.1 million in 2013, impacted largely by New Afton’s full quarter of production. Gross operating costs for New Afton in the first quarter of 2013 were $26.6 million, for which there is no prior year comparative as New Afton was still in the development stage in the first half of 2012.
Depreciation and depletion
Depreciation and depletion for the first quarter of 2013 was $37.9 million compared to $18.8 million for the same prior year period, again primarily as a result of New Afton’s full quarter of commercial production. Depreciation and depletion for New Afton was $18.4 million, for which there is no prior year comparative as New Afton was still in the development stage in the first half of 2012.
9
Earnings from mine operations
For the three months ended March 31, 2013, New Gold had earnings from mine operations of $57.8 million compared with $77.7 million in the same prior year period. The benefits of increased earnings from mine operations from New Afton and the Peak Mines were more than offset by decreases at Cerro San Pedro and Mesquite due to planned mining of lower grade ore. In addition, with New Afton now forming part of the Company’s depreciable asset base, the non-cash depreciation and depletion expense increased by $19.1 million when compared to the same period of the prior year.
Corporate administration costs
Corporate administration costs were $7.3 million in the first quarter of 2013 compared to $6.7 million incurred in the same prior year period.
Share-based compensation costs
Share-based compensation costs were $2.5 million and $2.4 million in the first quarter of 2013 and 2012, respectively.
Exploration and business development
Exploration costs were $4.0 million in the first quarter of 2013 compared with $2.8 million for the same prior year period. New Afton incurred $1.9 million in exploration expense for the quarter, compared to $nil in the prior period, as the C-Zone exploration program continued in the first quarter of 2013, with the objective of adding to the Mineral Resource immediately at the base of the current Reserve block and further delineating the C-Zone which lies immediately down plunge of the current New Afton Reserve.
Hedging
For the quarter ended March 31, 2013, Mesquite had realized losses of $10.8 million within revenues for settlement of gold hedge contracts during the quarter totalling 16,500 ounces. As a result of the decrease in the spot price of gold from $1,658 per ounce to $1,598 per ounce between December 31, 2012 and March 31, 2013, Mesquite recognized $9.1 million of pre-tax unrealized gains in the mark-to-market of remaining contracts within other comprehensive income.
Other gains and losses
The following other gains and losses are all added back for the purposes of adjusted net earnings:
Non-hedged derivatives
For the quarter ended March 31, 2013, the Company recorded a gain of $22.6 million relating to the share purchase warrants. This compares to a loss of $7.6 million in the same prior year quarter. As the share purchase warrants are denominated in Canadian dollars, but the Company’s functional currency is the U.S. dollar, it is a requirement under IFRS to account for them as a liability. The fair value of this liability is assessed at each reporting period. As the traded value of the New Gold share purchase warrants increases or decreases, a related loss or gain on the mark-to-market of the liability is reflected on the financial statements.
In the first quarter of 2012, the Company recorded a gain of $2.7 million relating to the equity conversion option of its previously held Debentures, as well as a loss of $3.7 million relating to the change in fair value of the early redemption option embedded in the Company's previously held Senior Secured Notes. As both the Debentures and Senior Secured Notes were redeemed in 2012, there is no figure for the first quarter of 2013.
Foreign exchange
The Company recognized a foreign exchange loss of $5.6 million for the quarter ended March 31, 2013 compared to a loss of $1.5 million in the same prior year quarter. Foreign exchange gains and losses arise due to the fact that the Company operates in Canada, Australia, Mexico, Chile and the United States and, as a result, has foreign currency exposure with respect to items not denominated in U.S. dollars.
Ineffectiveness of hedge instruments
For the quarter ended March 31, 2013, a loss of $0.5 million was recorded reflecting the ineffective portion of the gold hedge. This compares to a loss of $0.2 million for the same prior year period.
Income tax
Income and mining tax expense in the first quarter of 2013 was $12.4 million compared to $18.3 million in the same prior year period, reflecting an effective tax rate of 25% for the first quarter of 2013 compared to 35% in 2012.
On an adjusted net earnings basis, the adjusted effective tax rate in the first quarter of 2013 was 37% compared to 31% in the same prior year period. The adjusted effective tax rates exclude the impact of changes in the recognition of deferred tax assets, specifically fair value changes in share purchase warrants and convertible debentures, as well as the impact of adjustments to uncertain tax positions. The adjusted effective tax rate has increased compared to the same prior year period due to the geographic mix as a higher proportion of profits earned in the first quarter of 2013 are in higher tax jurisdictions. The profit mix will change as the year progresses and the annual adjusted effective tax rate is expected to be lower than the first quarter rate.
10
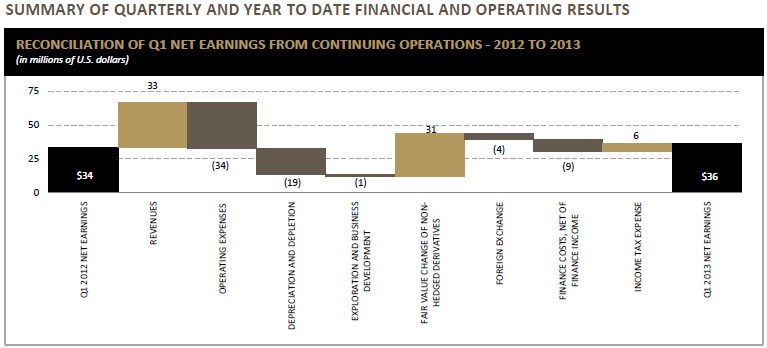
Net earnings from continuing operations
For the quarter ended March 31, 2013, New Gold had net earnings from continuing operations of $36.3 million, or $0.08 per basic share. This compares with net earnings from continuing operations of $33.5 million, or $0.07 per basic share in the same prior year period.
Adjusted net earnings
For the three months ended March 31, 2013, adjusted net earnings from continuing operations were $20.6 million or $0.04 per basic share, a decrease from $44.2 million or $0.10 per basic share in the prior year period.
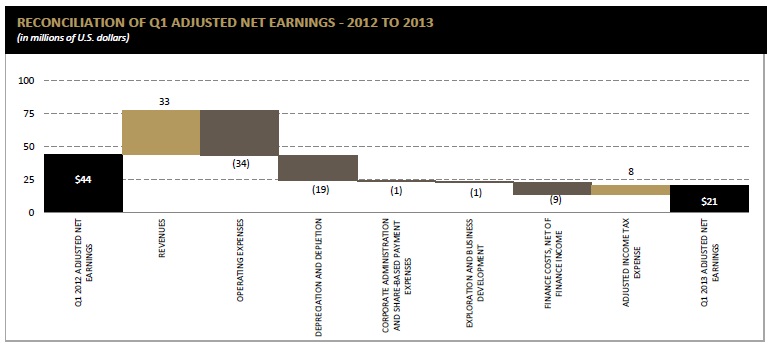
Net earnings have been adjusted, including the associated tax impact, for the group of costs in “Other gains and losses” on the condensed consolidated income statement. Key entries in this grouping are the fair value changes for share purchase warrants and convertible debt. Additionally, foreign exchange gain or loss and other non-recurring items are adjusted. Adjusting for these items provides an additional measure to evaluate the underlying operating performance of the Company as a whole for the reporting periods presented. The prior period tax is also adjusted for the foreign exchange impact of deferred tax on non-monetary assets.
See “Non-GAAP Financial Performance Measures” for reconciliation of net earnings to adjusted net earnings.
Quarterly financial and operating information
Selected financial and operating information for the current and previous quarters is as follows:
QUARTERLY FINANCIAL AND OPERATING INFORMATION
| (in millions of U.S. dollars, except per share amounts and where noted) | |||||||||
| Q1 2013 | Q4 2012 | Q3 2012 | Q2 2012 | Q1 2012 | Q4 2011 | Q3 2011 | Q2 2011 | Q1 2011 | |
| Gold sales (ounces) | 95,181 | 109,766 | 95,166 | 96,928 | 93,676 | 99,612 | 93,028 | 95,039 | 104,211 |
| Revenues | 201.8 | 250.9 | 195.5 | 176.1 | 168.8 | 177.6 | 175.5 | 171.6 | 171.2 |
| Net earnings (loss) from continuing operations | 36.3 | 123.9 | 17.8 | 23.7 | 33.5 | 35.0 | 40.7 | 78.6 | 24.7 |
| Per share: | |||||||||
| Basic | 0.08 | 0.26 | 0.04 | 0.05 | 0.07 | 0.08 | 0.09 | 0.19 | 0.06 |
| Diluted | 0.08 | 0.26 | 0.03 | 0.05 | 0.07 | 0.07 | 0.09 | 0.16 | 0.06 |
| Net earnings (loss) | 36.3 | 123.9 | 17.8 | 23.7 | 33.5 | 35.0 | 40.7 | 78.6 | 24.7 |
| Per share: | |||||||||
| Basic | 0.08 | 0.26 | 0.04 | 0.05 | 0.07 | 0.08 | 0.09 | 0.19 | 0.06 |
| Diluted | 0.08 | 0.26 | 0.03 | 0.05 | 0.07 | 0.07 | 0.09 | 0.16 | 0.06 |
| Adjusted net earnings | 20.6 | 49.7 | 42.6 | 45.8 | 44.2 | 42.2 | 49.5 | 49.8 | 47.9 |
| Per share: | |||||||||
| Basic | 0.04 | 0.11 | 0.09 | 0.10 | 0.10 | 0.09 | 0.11 | 0.12 | 0.12 |
| Diluted | 0.04 | 0.11 | 0.09 | 0.10 | 0.09 | 0.09 | 0.11 | 0.12 | 0.12 |
11
REVIEW OF OPERATING MINES
NEW AFTON MINE, BRITISH COLUMBIA, CANADA
A summary of New Afton’s operating results is provided below:
| Three months ended March 31 | ||||||
| (in millions of U.S. dollars, except where noted) | 2013 | 2012 | ||||
Operating information (1): | ||||||
| Ore mined (thousands of tonnes) | 754 | - | ||||
| Ore processed (thousands of tonnes) | 834 | - | ||||
| Average grade: | ||||||
| Gold (grams/tonne) | 0.67 | - | ||||
| Copper (%) | 0.79 | - | ||||
| Recovery rate (%): | ||||||
| Gold | 83.2 | - | ||||
| Copper | 81.3 | - | ||||
| Gold (ounces) | ||||||
Produced (2) | 14,936 | - | ||||
Sold (2) | 15,577 | - | ||||
| Copper (thousands of pounds) | ||||||
Produced (2) | 11,809 | - | ||||
Sold (2) | 12,069 | - | ||||
Average realized price (3): | ||||||
| Gold ($/ounce) | 1,591 | - | ||||
| Copper ($/pound) | 3.44 | - | ||||
Total cash costs per gold ounce sold (3)(4) | (770) | - | ||||
Financial Information (1): | ||||||
| Revenues | 63.4 | - | ||||
| Earnings from mine operations | 18.4 | - | ||||
| Capital expenditures | 42.0 | 74.4 | ||||
| 1. | There are no comparative figures for the first quarter of 2012 as New Afton reached commercial production on July 31, 2012. |
| 2. | Production is shown on a total contained basis while sales are shown on a net payable basis, including final product inventory and smelter payable adjustments, where applicable. |
| 3. | We use certain non-GAAP financial performance measures throughout our MD&A. Total cash costs per gold ounce sold, average realized price, average realized margin, adjusted net earnings, adjusted net earnings per share and cash generated from operations, excluding working capital changes and income taxes paid are non-GAAP financial performance measures with no standard meaning under IFRS. For further information and a detailed reconciliation, please refer to the “Non-GAAP Financial Performance Measures” section of this MD&A. |
| 4. | The calculation of total cash costs per ounce of gold is net of by-product copper revenue. If copper revenues were treated as a co-product, the average total cash costs at New Afton for the three months ended March 31, 2013 would be $721 per ounce of gold and $1.56 per pound of copper. |
Quarterly and Year to Date Operating Results
Production
In the first quarter of 2013, New Afton produced 14,936 ounces of gold and 11.8 million pounds of copper. There are no prior year comparatives as New Afton was still in the development stage throughout the first half of 2012. New Afton’s production increased in each consecutive month of the first quarter with further increases being seen in April. Production in early 2013 was impacted by the better-than-planned ramp up of the New Afton mill in the second half of 2012. As a result, the vast majority of New Afton’s ore stockpile was milled in 2012. Thus, the Company supplemented underground ore feed in January with remnant lower grade ore from the historical Afton open pit which also reduced the overall mill recoveries for the quarter. As planned, in late January, the installation of the permanent underground crusher was completed. This resulted in the underground mining rate steadily increasing to an average of 11,000 tonnes per day in March which compares to an average mining rate of 7,200 tonnes per day in the fourth quarter of 2012. As the New Afton mine and mill are now running at equivalent throughput rates, consistent with the operation’s 11,000 tonne per day nameplate capacity, and at planned gold and copper grades, the Company anticipates a steady increase in gold and copper production as the year progresses.
Revenue
Revenue in the first quarter of 2013 was $63.4 million compared to $nil in the prior year period. The average realized prices were $1,591 per ounce of gold and $3.44 per pound of copper. This is slightly lower than the average London PM fix gold price of $1,630 for the first quarter of 2013. The average London Metals Exchange copper price was $3.60 for the first quarter of 2013. Average realized prices were impacted by timing of sales.
12
Total cash costs
Total cash costs per ounce of gold sold, net of by-product sales is negative $770 per ounce for the first quarter of 2013. Consistent with planned increases in gold and copper production during the remaining quarters of 2013, New Afton’s cash costs are expected to decline over the balance of the year.
Earnings from mine operations
New Afton contributed $18.4 million to the Company’s earnings from mine operations for the three months ended March 31, 2013.
Capital expenditures
Capital expenditures for the first quarter of 2013 totaled $42.0 million relative to $74.4 million for the first quarter of 2012. Capital expenditures were significantly reduced in 2013 as New Afton entered into commercial production and reduced its development capital expenditure. Capital expenditures in 2013 are in excess of life of mine sustaining capital expenditure annual averages as the east cave is being developed and draw bell development remains accelerated in 2013. New Afton expects to develop an additional 37 draw bells in 2013. Additionally, some final construction expenditures were incurred in the first quarter of 2013, particularly related to the completion of the permanent underground crusher.
Exploration Project Review
In July 2012, New Gold initiated an exploration core drilling program to test the potential to expand the Main B-Zone Reserve currently being mined along strike and to expand the deeper C-Zone Mineral Resource located immediately below the B-Zone Reserve block. Total surface and underground exploration drilling during 2012 amounted to 17,072 metres in 34 holes. Seven of these 34 holes were incorporated into updated Mineral Resource and Reserve estimates completed on December 31, 2012 and reported previously.
Subsequent to quarter-end, the Company completed an updated Mineral Resource estimate for the C-Zone. The new Mineral Resource estimate incorporates the results for drilling which was completed in late 2012 and not included in the December 31, 2012 Mineral Resource estimate, as well as drilling completed through the end of February 2013.. The update reflects an increase by over 300% in gold ounces and copper pounds at improved grade. Measured and Indicated gold and copper Resources increased to 0.3 million ounces and 211 million pounds, respectively. Measured and Indicated gold and copper grades increased to 0.77 grams per tonne gold and 0.77% copper from 0.62 grams per tonne and 0.68% copper. The Inferred gold and copper Resources increased by over 30% to 0.4 million ounces and 301 million pounds.
The Company currently has three drills actively exploring the C-Zone and continues to target the completion of 30,000 metres of drilling in 2013. The Company also recently initiated a 17,000 metre program targeting extensions to the main reserve, with two surface core drills and one underground drill currently active. The objective of the C-Zone exploration drilling is to add to the mine’s life while, at the same time, New Gold continues to evaluate opportunities to increase the throughput rate beyond the nameplate capacity of 11,000 tonnes per day.
New Afton C-Zone Mineral Resource Update – May 1, 2013 | |||||||
| Resource Category | Tonnes & Grade | Contained Metal | |||||
Tonnes 000’s | Gold g/t | Silver g/t | Copper % | Gold Koz | Silver Koz | Copper Mlbs | |
| Measured | 1,282 | 0.75 | 1.35 | 0.79 | 31 | 56 | 22 |
| Indicated | 11,205 | 0.78 | 1.52 | 0.77 | 280 | 548 | 189 |
| Total M&I | 12,486 | 0.77 | 1.50 | 0.77 | 311 | 602 | 211 |
| Inferred | 20,221 | 0.62 | 1.42 | 0.68 | 401 | 923 | 301 |
New Afton C-Zone Mineral Resource – December 31, 2012 | |||||||
| Resource Category | Tonnes & Grade | Contained Metal | |||||
Tonnes 000’s | Gold g/t | Silver g/t | Copper % | Gold Koz | Silver Koz | Copper Mlbs | |
| Measured | 400 | 0.60 | 1.30 | 0.73 | 8 | 20 | 6 |
| Indicated | 2,900 | 0.63 | 1.30 | 0.68 | 58 | 120 | 43 |
| Total M&I | 3,300 | 0.62 | 1.30 | 0.68 | 66 | 140 | 49 |
| Inferred | 13,600 | 0.70 | 1.50 | 0.76 | 307 | 670 | 228 |
| 1. | Mineral resources are reported above a 0.40% copper-equivalent cut-off grade based on metal prices of $1,400/ounce gold, $28.00/ounce silver and $3.25/pound copper, average metallurgical recoveries of 87.7% for gold, 73.5% for silver and 86.4% for copper and related smelter and refining charges. |
| 2. | Total contained metal calculated on the basis of tonnes multiplied by gold or silver grade divided by 31.10348 grams per troy ounce, and tonnes multiplied by copper percent grade and 2.2046 |
| 3. | Additional technical details regarding the New Afton project are available in the NI 43-101 Technical Report dated December 31, 2009 published on SEDAR. |
| 4. | As it is currently defined by exploration drilling, the C-Zone has a sub-vertical dip of 80° and a moderate southwesterly plunge. The zone measures approximately 800 metres along its lateral strike, 550 metres in the vertical dimension, and ranges from 10 to 100 metres in true width, averaging 50 metres in true width overall. |
13
CERRO SAN PEDRO MINE, SAN LUIS POTOSÍ, MEXICO
A summary of Cerro San Pedro’s operating results is provided below:
| Three months ended March 31 | |||||
| (in millions of U.S. dollars, except where noted) | 2013 | 2012 | |||
| Operating information: | |||||
| Ore mined (thousands of tonnes) | 3,434 | 4,016 | |||
| Waste mined (thousands of tonnes) | 3,532 | 4,530 | |||
| Ratio of waste to ore | 1.03 | 1.13 | |||
| Ore to leach pad (thousands of tonnes) | 3,434 | 4,016 | |||
| Average grade: | |||||
| Gold (grams/tonne) | 0.32 | 0.46 | |||
| Silver (grams/tonne) | 18.15 | 26.69 | |||
| Gold (ounces) | |||||
Produced (1) (2) | 26,387 | 33,984 | |||
Sold (1) | 26,468 | 32,771 | |||
| Silver (ounces) | |||||
Produced (1) (2) | 358,905 | 456,584 | |||
Sold (1) | 360,913 | 439,141 | |||
Average realized price (3): | |||||
| Gold ($/ounce) | 1,619 | 1,693 | |||
| Silver ($/ounce) | 29.51 | 32.70 | |||
Total cash costs per gold ounce sold (3)(4) | 495 | 233 | |||
Financial Information: | |||||
| Revenues | 53.5 | 69.9 | |||
| Earnings from mine operations | 22.6 | 40.0 | |||
| Capital expenditures | 3.1 | 2.9 | |||
| 1. | Production is shown on a total contained basis while sales are shown on a net payable basis, including final product inventory adjustments, where applicable. |
| 2. | Tonnes of ore processed each period does not necessarily correspond to ounces produced during the period, as there is a time delay between placing tonnes on the leach pad and pouring ounces of gold. |
| 3. | We use certain non-GAAP financial performance measures throughout our MD&A. Total cash costs per gold ounce sold, average realized price, average realized margin, operating margin, adjusted net earnings, adjusted net earnings per share and cash generated from operations, excluding working capital changes and income taxes paid, are non-GAAP financial performance measures with no standard meaning under IFRS. For further information and a detailed reconciliation, please refer to the “Non-GAAP Performance Measures” section of this MD&A. |
| 4. | The calculation of total cash costs per ounce of gold is net of by-product silver revenue. If the silver revenues were treated as a co-product, the average total cash costs at Cerro San Pedro for the three months ended March 31, 2013, would be $719 per ounce of gold (2012 - $533 ) and $13.10 per ounce of silver (2012 - $10.30 ). |
Quarterly and Year to Date Operating Results
Production
Gold production for the first quarter of 2013 was 26,387 ounces compared to 33,984 ounces produced in the same period in 2012. Silver production for the quarter was 358,905 ounces compared to 456,584 ounces produced in the same period in 2012. The decrease in gold and silver production is due to a combination of lower tonnes processed and planned mining of lower ore grades. The production profile of Cerro San Pedro in 2013 reflects improving gold and silver grades through the remainder of the year.
Revenue
Revenue for the first quarter of 2013 were $53.5 million compared to $69.9 million in the same prior year period due to lower ounces sold and lower average realized prices for both gold and silver. Consistent with production, gold sales for the first quarter of 2013 were 26,468 ounces relative to 32,771 ounces in the same prior year period. Silver sales also decreased, from 439,141 ounces in the first quarter of 2012 to 360,913 ounces in the same period in 2013. The average realized gold price during the first quarter of 2013 and 2012 was $1,619 and $1,693 per ounce, respectively which compares to the average London PM fix gold price of $1,630 and $1,689 per ounce, respectively. The average realized silver price per ounce during the first quarter of 2013 and 2012 were $29.51 and $32.70 per ounce, respectively. This compares to the average London fix silver price of $30.08 and $32.62 per ounce, respectively.
Total cash costs
Total cash costs per ounce of gold sold for the first quarter of 2013 of $495 per ounce were consistent with the Company’s quarterly plans and compared to $233 per ounce in the same prior year quarter. The increase in total cash costs when compared to the same period of 2012 is primarily driven by lower silver sales and prices negatively impacting by-product revenue, as well as the appreciation of the Mexican Peso and planned lower gold production. Per the 2013 mine plan, improving gold and silver ore grades should drive lower cash costs for the remainder of the year.
14
Earnings from mine operations
Cerro San Pedro generated $22.6 million in earnings from mine operations in the first quarter of 2013 compared to $40.0 million in the same period of the prior year.
Capital expenditures
Capital expenditures totalled $3.1 million and $2.9 million for the quarters ended March 31, 2013 and 2012, respectively. The projects in progress during the first quarter of 2013 are primarily targeting accelerated silver leaching.
Impact of Foreign Exchange on Operations
Cerro San Pedro was impacted by changes in the value of the Mexican peso against the U.S. dollar. The value of the Mexican peso increased from an average of 12.97 to the U.S. dollar in the first quarter of 2012 to 12.65 to the U.S. dollar in 2013. This had a positive impact of $15 per ounce of gold sold, which further contributed to the impact of the other factors described above.
MESQUITE MINE, CALIFORNIA, USA
A summary of Mesquite’s operating results is provided below:
| Three months ended March 31 | |||||
| (in millions of U.S. dollars, except where noted) | 2013 | 2012 | |||
| Operating information: | |||||
| Ore mined (thousands of tonnes) | 3,505 | 3,672 | |||
| Waste mined (thousands of tonnes) | 8,890 | 7,228 | |||
| Ratio of waste to ore | 2.54 | 1.97 | |||
| Ore to leach pad (thousands of tonnes) | 3,505 | 3,672 | |||
| Average grade: | |||||
| Gold (grams/tonne) | 0.32 | 0.59 | |||
| Gold (ounces) | |||||
Produced (1) (2) | 25,504 | 44,400 | |||
Sold (1) | 25,708 | 43,617 | |||
Average realized price (3): | |||||
Gold ($/ounce) (4) | 1,201 | 1,423 | |||
Total cash costs per gold ounce sold (3) | 879 | 628 | |||
Financial Information: | |||||
| Revenues | 30.9 | 62.0 | |||
| Earnings from mine operations | 3.1 | 27.5 | |||
| Capital expenditures | 3.4 | 1.6 | |||
| 1. | Production is shown on a total contained basis while sales are shown on a net payable basis, including final product inventory and smelter payable adjustments, where applicable. |
| 2. | Tonnes of ore processed each period does not necessarily correspond to ounces produced during the period, as there is a time delay between placing tonnes on the leach pad and pouring ounces of gold. |
| 3. | We use certain non-GAAP financial performance measures throughout our MD&A. Total cash costs per gold ounce sold, average realized price, average realized margin, operating margin, adjusted net earnings, adjusted net earnings per share and cash generated from operations, excluding working capital changes and income taxes paid, are non-GAAP financial performance measures with no standard meaning under IFRS. For further information and a detailed reconciliation, please refer to the “Non-GAAP Financial Performance Measures” section of this MD&A. |
| 4. | Average realized price per gold ounce for Mesquite includes realized gains and losses from gold hedge settlements. |
Quarterly and Year to Date Operating Results
Production
Gold production for the quarter ended March 31, 2013 was 25,504 ounces compared to 44,400 ounces produced in the same period in 2012. Production was lower in 2013 due to the mine plan moving through a phase of ore that was below reserve grade, or 0.32 grams per tonne. This compares to the first quarter of 2012 when ore grade was considerably higher at 0.59 grams per tonne. Similar to Cerro San Pedro, ore grade is expected to progressively improve through the remainder of 2013 resulting in increased production in later quarters of 2013.
Revenue
Revenue for the quarter ended March 31, 2013 was $30.9 million compared to $62.0 million in the same period last year due to negative variances in both volume and price. Consistent with production, gold ounces sold in the first quarter of 2013 were 25,708 ounces relative to 43,617 ounces in the prior year period, representing a point when Mesquite was mining above reserve grade ore. The average realized gold price during the first quarter of 2013 of $1,201 per ounce, including hedged gold ounce settlements at $801 per ounce, compared to $1,423 per ounce of gold sold in the same prior year period.
15
Total cash costs
Total cash costs per ounce of gold sold for the quarter ended March 31, 2013 were $879 per ounce, compared to $628 per ounce in the same prior year period. Mesquite’s total gross operating costs remained consistent with the prior year period with the mine benefitting from lower fuel and explosive costs. As such, the increase in total cash costs per ounce sold was primarily driven by the planned mining of lower grade ore resulting in costs being spread over a lower production base.
Earnings from mine operations
As a result of a lower average realized gold price and fewer ounces sold, Mesquite generated $3.1 million in earnings from mine operations for the quarter ended March 31, 2013, compared to $27.5 million in the same period in 2012.
Capital expenditures
Capital expenditures totalled $3.4 million and $1.6 million, for the quarters ended March 31, 2013 and 2012, respectively. The increase in 2013 was due to the scheduled component replacements on heavy equipment.
PEAK MINES, NEW SOUTH WALES, AUSTRALIA
A summary of Peak Mines’ operating results is provided below:
| Three months ended March 31 | |||||
| (in millions of U.S. dollars, except where noted) | 2013 | 2012 | |||
| Operating information: | |||||
| Ore mined (thousands of tonnes) | 156 | 172 | |||
| Ore processed (thousands of tonnes) | 201 | 184 | |||
| Average grade: | |||||
| Gold (grams/tonne) | 4.72 | 3.90 | |||
| Copper (%) | 1.03 | 1.10 | |||
| Recovery rate (%): | |||||
| Gold | 91.5 | 91.0 | |||
| Copper | 91.9 | 83.0 | |||
| Gold (ounces) | |||||
Produced (1) | 27,868 | 20,890 | |||
Sold (1) | 27,428 | 17,288 | |||
| Copper (thousands of pounds) | |||||
Produced (1) | 4,189 | 3,683 | |||
Sold (1) | 3,798 | 1,780 | |||
Average realized price (2): | |||||
| Gold ($/ounce) | 1,592 | 1,737 | |||
| Copper ($/pound) | 3.43 | 4.14 | |||
Total cash costs per gold ounce sold (2)(3) | 819 | 915 | |||
Financial Information: | |||||
| Revenues | 54.0 | 36.9 | |||
| Earnings from mine operations | 13.7 | 10.2 | |||
| Capital expenditures | 13.4 | 9.2 | |||
| 1. | Production is shown on a total contained basis while sales are shown on a net payable basis, including final product inventory and smelter payable adjustments, where applicable. |
| 2. | We use certain non-GAAP financial performance measures throughout our MD&A. Total cash costs per gold ounce sold, average realized price, average realized margin, adjusted net earnings, adjusted net earnings per share and cash generated from operations, excluding working capital changes and income taxes paid are non-GAAP financial performance measures with no standard meaning under IFRS. For further information and a detailed reconciliation, please refer to the “Non-GAAP Financial Performance Measures” section of this MD&A. |
| 3. | The calculation of total cash costs per ounce of gold is net of by-product copper revenue. If copper revenues were treated as a co-product, the average total cash costs at Peak Mines for the three months ended March 31, 2013 would be $990 per ounce of gold (2012 - $1,059 ) and $2.27 per pound of copper (2012 - $2.81 ). |
Quarterly and Year to Date Operating Results
Production
Peak Mines produced 27,868 ounces of gold and 4.2 million pounds of copper during first quarter of 2013 compared to 20,890 ounces of gold and 3.7 million pounds of copper for the same prior year period. Gold production benefitted from higher grade and improved recovery rates in the first quarter of 2013 relative to the prior year period, coupled with higher ore tonnes processed.
Revenue
Revenue for the three months ended March 31, 2013 was $54.0 million compared to $36.9 million in the same period in 2012. Although Peak Mines sold more gold ounces and copper pounds, these volume increases was partially offset by a decrease in both gold and copper average realized price relative to 2012. Gold ounces sold increased from 17,288 in 2012 to 27,428 in the current year, however, the average realized gold price was $1,592 per ounce compared to $1,737 per ounce in the same prior year period. This compares to the average London PM fix gold price of $1,630 and $1,689 per ounce for the three months ended March 31, 2013 and 2012, respectively. Copper sales were 3.8 million pounds compared to 1.8 million pounds in the prior year, however, copper prices were $3.43 per pound compared to $4.14 per pound in the prior year. The average London Metals Exchange copper price was $3.60 for three months ended March 31, 2013 and $3.77 for the same period in 2012.
16
Total cash costs
Total cash costs per ounce of gold sold for the first quarter of 2013 were $819 compared to $915 in the same period of 2012. This decrease in total cash costs was attributable to a combination of high copper by-product revenue, the depreciation of the Australian dollar and higher gold production.
Earnings from mine operations
For the first quarter of 2013, the higher sales volume of gold and copper resulted in Peak Mines generating $13.7 million in earnings from operations compared to $10.2 million in the same prior year period.
Capital expenditures
Capital expenditures totalled $13.4 million and $9.2 million for the quarter ended March 31, 2013 and 2012, respectively. Capital expenditures in the first quarter of 2013 were primarily associated with mine development and mobile fleet replacement, with the increase on prior year specifically related to scheduled loader and truck replacements.
Impact of Foreign Exchange on Operations
Peak Mines’ operations continue to be impacted by fluctuations in the valuation of the Australian dollar against the U.S. dollar. The value of the Australian dollar in the first quarter of 2013 averaged 0.96 against the U.S. dollar compared to 0.95 in the first quarter of 2012 resulting in a negative impact on cash costs of $33 per gold ounce sold.
Exploration Project Review
During the first quarter of 2013, the Company conducted 15,246 metres of underground exploration drilling to delineate additional Mineral Resources and Reserves at its Peak Mines operations. Approximately 50% of this total was drilled in the Perseverance deposit, 40% in the New Cobar deposit, and 10% in the Comstock exploration target zone. Additionally, a surface drilling program commenced at the Great Cobar deposit where a total of 1,723 metres of diamond drilling targeting extensions to the main lodes was completed. The Great Cobar mine was a significant historic producer of copper and gold in the region. Exploration to define new drill targets on Peak’s regional claim holdings also continued during the first quarter.
DEVELOPMENT AND EXPLORATION REVIEW
BLACKWATER PROJECT, BRITISH COLUMBIA, CANADA
Blackwater is a bulk-tonnage gold project located approximately 160 kilometres southwest of Prince George, a city of approximately 80,000, in central British Columbia, Canada, where New Gold already has an established presence through New Afton. The project property position covers over 1,000 km2 and is located near infrastructure. As at March 31, 2013, Blackwater had a resource estimate of 9.5 million ounces of Measured and Indicated gold Resources and an additional 0.38 million ounces of Inferred gold Resources. New Gold also owns a 100% interest in the Capoose mineral prospect, located approximately 25 kilometres from the Blackwater deposit. As at December 31, 2012 Mineral Resources at Capoose included 0.2 million ounces of gold at 0.43 grams per tonne and 9.5 million ounces of silver at 20.8 grams per tonne in the Indicated category and 0.6 million ounces gold at 0.29 grams per tonne and 47.8 million ounces silver at 23.2 grams per tonne in the Inferred category.
Project Review
The Blackwater project was further advanced during the first quarter. In addition to completing the previously announced Mineral Resource update, the team focused on progressing the environmental assessment reports, completing required condemnation drilling for proposed infrastructure sites and preparing for the regional exploration program on the Company’s 1,000 square kilometre land package.
Exploration activity at Blackwater during the first quarter of 2013 included the completion of 41 holes totaling 19,434 metres drilled. This total included 7,425 metres in 12 holes to explore potential extensions to the Blackwater resource at depth to further prove and potentially extend the high grade zones in the west and north-central portions of the deposit. Additionally, 2,131 metres in 5 holes were drilled for project engineering studies and 9,878 metres in 24 holes to test the mineral potential of areas selected for future operations facilities and infrastructure. The completion of these drilling campaigns concludes the resource delineation and development drilling work to be incorporated into the project feasibility study scheduled for completion in late 2013.
17
Project spending at Blackwater, including exploration and infrastructure-related expenditures, for the three months ended March 31, 2013 was $15.0 million compared to $27.5 for the prior year period.
Subsequent to quarter-end, the Company completed an updated Mineral Resource estimate for Blackwater (‘March 2013 Resource’) which will serve as the basis for the project’s feasibility study currently in progress. The Mineral Resource incorporates the results of an additional 89 infill holes totaling 21,959 metres completed during the latter half of the fourth quarter of 2012 in combination with more refined geologic and geostatistical modeling. The estimate is based on 1,002 core holes totaling 309,509 metres. Consistent with the Company’s plans to develop the project, the resource statement reflects the segregation of mineralized material that should be processed directly from which the Company plans to stockpile and process toward the end of the project’s currently envisioned mine life. The Company has utilized a dual cut-off strategy to reflect this segregation. All material grading above a gold-equivalent grade of 0.40 grams per tonne is considered for direct processing, while all material grading between a gold-equivalent cut-off of 0.30 and 0.40 grams per tonne is considered for stockpiling.
Highlights of the updated Mineral Resource estimate include:
| · | Measured and Indicated gold resources for direct processing increased to 8.6 million ounces of gold at 0.88 grams per tonne and 57.5 million ounces of silver at 5.8 grams per tonne. | |||||||
| · | Measured gold resources increased by 44% to 3.9 million ounces at 1.04 grams per tonne. | |||||||
Blackwater March 2013 Mineral Resource Statement – March 31, 2013 | ||||||||
| Resource Category | Tonnes & Grade | Contained Metal | ||||||
Tonnes 000’s | Gold g/t | Silver g/t | Gold Moz | Silver Koz | ||||
| Measured & Indicated Resources | ||||||||
Direct processing material Measured | 116,955 | 1.04 | 5.6 | 3.90 | 21.06 | |||
| Indicated | 189,044 | 0.78 | 6.0 | 4.73 | 36.47 | |||
| M&I (direct processing) | 305,999 | 0.88 | 5.8 | 8.62 | 57.52 | |||
| Stockpile material | ||||||||
| Measured | 26,521 | 0.30 | 4.1 | 0.26 | 3.50 | |||
| Indicated | 64,382 | 0.30 | 4.4 | 0.62 | 9.11 | |||
| M&I (stockpile) | 90,904 | 0.30 | 4.3 | 0.87 | 12.60 | |||
| Total M&I | 396,903 | 0.74 | 5.5 | 9.50 | 70.13 | |||
| Inferred resources | ||||||||
| Inferred (direct processing) | 13,815 | 0.76 | 4.1 | 0.34 | 1.82 | |||
| Inferred (stockpile) | 3,785 | 0.31 | 3.6 | 0.04 | 0.44 | |||
| Total Inferred | 17,600 | 0.66 | 4.0 | 0.38 | 2.26 | |||
| 1. | Mineral resources are reported within a conceptual open pit shell based on metal prices of $1,400/oz gold and $28.00/oz silver and average metallurgical recoveries of 88.0% gold and 64.0% silver for oxide mineralization, 85.0% gold and 58.0% silver for transitional oxide/sulfide mineralization and 85.0% gold and 44.0% silver for sulfide mineralization. |
| 2. | Total contained metal calculated on the basis of Tonnes * Grade / 31.10348 grams per troy ounce. |
| 3. | Gold-equivalent cut-off grade estimates are based on $1,400/oz gold and $28.00/oz silver and average metal recoveries as described in Note 1 above |
| 4. | Direct processing material is defined as mineralization above a 0.40 g/t AuEq cut-off and likely to be mined and processed directly. |
| 5. | Stockpile material is defined as mineralization between a 0.30 g/t AuEq and a 0.40 AuEq cut-off that is suitable for stockpiling and future processing based on average metallurgical recoveries as described in Note 1 above. |
Mineral Resources are not Mineral Reserves and as such do not have demonstrated economic viability. This MD&A includes information on Blackwater which was outlined in the Preliminary Economic Assessment (“PEA”) Technical Report filed on October 10, 2012. New Gold has, since the date of the PEA, completed non-material updates of the Mineral Resource estimate for Blackwater. Although the PEA represents useful, accurate and reliable information based on the information available at the time of its publication, and provides an important indicator as to the economic potential of Blackwater, the PEA is based on Mineral Resource estimates with an effective date of July 27, 2012, which do not reflect drilling conducted since their effective date, and the PEA does not reflect the latest Mineral Resource estimate discussed in this MD&A. Certain assumptions used in the PEA, some of which relate to the July 27, 2012, Mineral Resource estimate may have changed from those used for the new Resource estimate, causing a variation of parameters. Moreover, the updated Mineral Resource estimate may impact how New Gold intends to develop the deposit, including pit outlines, production rates and mine life.
18
Feasibility Study Status
The Feasibility Study (“FS”) phase for Blackwater commenced in the first quarter. Highlights during this period include:
| · | Substantially completed the FS geological block model. |
| · | Substantially completed the FS metallurgical testwork program. |
| · | Awarded the FS plant design, project costing and FS Report compilation work to AMEC. |
| · | Completed mining studies for throughput selection and substantially completed study for trolley assisted haulage systems. |
| · | Confirmed the process flowsheet selection as Whole Ore Leach. |
| · | Confirmed plant capacity as 60,000 tonnes per day. |
| · | Completed second phase of geotechnical testing in the Tailings Storage Facility area, to significantly advance the design to minimize seepage. |
Work is ongoing to complete site layout design, finalize equipment sizing and establish the bases of estimate for the project. The feasibility study remains on track for completion in late 2013.
Other Project Highlights
Other highlights for Blackwater in the first quarter of 2013 include:
| · | Receipt of federal Environmental Impact Statement Guidelines and continuation of the provincial and federal environmental process. |
| · | Approval of amended multi-year area based exploration permits for 2013. |
| · | Initiation of discussions on Participation Agreements for construction and operation of the mine with key First Nations. |
| · | Advanced exploration target selection for Capoose and other prospective areas identified for reconnaissance drilling in 2013. |
EL MORRO PROJECT, ATACAMA REGION, CHILE
El Morro is an advanced stage gold-copper development project located in north-central Chile, Atacama Region, approximately 80 kilometres east of the city of Vallenar. El Morro is a world-class project with low expected cash costs and great organic growth potential. As at December 31, 2012, attributable to New Gold’s 30% share of the project are Proven and Probable gold Reserves of 2.9 million ounces and Proven and Probable copper Reserves of 2.1 billion pounds. The El Morro and La Fortuna deposits represent the two principal zones of gold-copper mineralization that have been identified to date. Future exploration efforts will also test the potential bulk-mineable gold and copper production below the bottom of the current La Fortuna open pit.
Under the terms of New Gold's agreement with Goldcorp Inc. ("Goldcorp"), Goldcorp is responsible for funding New Gold's 30% share of capital costs. The carried funding accrues interest at a fixed rate of 4.58%. New Gold will repay its share of capital plus accumulated interest out of 80% of its share of the project's cash flow with New Gold retaining 20% of its share of cash flow from the time production commences. Pursuant to the above agreement, New Gold has drawn down $71.3 million of carried funding at March 31, 2013. New Gold had no cash outlay in 2013. New Gold’s 30% of project spending, excluding interest, for the first quarter of 2013 and 2012 were $5.8 million and $7.2 million, respectively.
Project field work has been temporarily suspended following the April 27, 2012 ruling by the Supreme Court of Chile against approval of El Morro’s environmental permit. Based on the Supreme Court's announcement, El Morro suspended all project field work being executed under the terms of the environmental permit. Activities not subject to the environmental permit, including detailed engineering, design work and architectural planning, continue. Goldcorp is working closely with the Chilean Environmental Permitting Authority, the Servicio de Evalucion Ambiental, to address any perceived deficiencies in respect of the environmental permit. It is anticipated this consultation process could be completed by late 2013 with the expectation that the modified EIA should be approved shortly thereafter. Goldcorp is also focused on obtaining the project permits and optimizing project economics including sourcing of a long-term power supply. See the "Contingencies" section of this MD&A for more details.
19
FINANCIAL CONDITION REVIEW
SUMMARY BALANCE SHEET
| March 31 | December 31 | ||
| (in millions of U.S. dollars, except where noted) | 2013 | 2012 | |
| Cash and cash equivalents | 672.4 | 687.8 | |
| Deferred tax assets | 192.8 | 194.1 | |
| Other assets | 3,437.0 | 3,401.8 | |
| Total assets | 4,302.2 | 4,283.7 | |
| Derivative liabilities | 88.4 | 110.5 | |
| Reclamation and closure cost obligations | 67.0 | 68.5 | |
| Long-term debt | 854.3 | 847.8 | |
| Deferred tax liabilities | 336.4 | 322.9 | |
| Other liabilities | 226.0 | 257.5 | |
| Total liabilities | 1,572.1 | 1,607.2 | |
| Total equity | 2,730.1 | 2,676.5 |
BALANCE SHEET REVIEW
Assets
At March 31, 2013, New Gold held cash and cash equivalents of $672.4 million. This compares to $687.8 million held at December 31, 2012. The Company’s investment policy is to invest its surplus funds in permitted investments consisting of treasury bills, bonds, notes and other evidences of indebtedness of Canada, the U.S. or any of the Canadian Provinces with a minimum credit rating of R-1 mid from the Dominion Bond Rating Service (“DBRS”) or an equivalent rating from Standard & Poor’s and Moody’s and with maturities of twelve months or less at the original date of acquisition. In addition, the Company is permitted to invest in bankers’ acceptances and other evidences of indebtedness of certain financial institutions.
Gold hedge contracts
Under the terms of the term loan facility entered into by Western Mesquite Mines, Inc. (“WMMI”), as a condition precedent to drawdown of the loan, WMMI entered into a gold hedging program required by the banking syndicate. As such, WMMI executed gold forward sales contracts for 429,000 ounces of gold at a price of $801 per ounce. New Gold assumed the liability for the sales contracts on completion of the business combination with Western Goldfields Inc. in mid-2009. As at March 31, 2013, the remaining gold contracts represent a commitment of 5,500 ounces per month for 21 months with the last commitment deliverable in December 2014 for a total of 115,500 ounces.
The remaining contracts were marked to market as at March 31, 2013 using the March 31, 2013 gold forward curve, resulting in a cumulative unrealized pre-tax loss of $88.4 million that has been disclosed as a liability.
Reclamation and Closure Cost Obligations
Reclamation and closure cost obligations are asset retirement obligations that arise from the acquisition, development, construction and normal operation of mining property, plant and equipment, due to government controls and regulations that protect the environment on the closure and reclamation of mining properties. The Company has future obligations to retire its mining assets including dismantling, remediation and ongoing treatment and monitoring of sites. The exact nature of environmental issues and costs, if any, which the Company may encounter in the future are subject to change, primarily because of the changing character of environmental requirements that may be enacted by governmental agencies.
The Company’s asset retirement obligations consist of reclamation and closure costs for New Afton, Cerro San Pedro, Mesquite, Peak Mines, and Blackwater. Significant reclamation and closure activities include land rehabilitation, demolition of buildings and mine facilities, ongoing care and maintenance and other costs.
The long-term portion of the liability at March 31, 2013 is $67.0 million compared to $68.5 million at December 31, 2012. Changes in the liability are due to changes in estimated cash flows related to reclamation activities, amortization or unwinding of the discount, and revisions to the discount and foreign currency rates used in the valuation of the obligations.
Long-Term Debt
The majority of the Company’s contractual obligations consist of long-term debt and interest payable. At March 31, 2013, the Company had $854.3 million in long-term debt compared to $847.8 million at December 31, 2012. In the three months ended March 31, 2013, the Company capitalized interest of $4.0 million to qualifying development projects, all of which has been allocated to Blackwater. This compares to $23.8 million of capitalized interest for the year ended December 31, 2012.
20
On April 5, 2012, the Company issued an initial offering of Senior Unsecured Notes, which mature and become payable on April 15, 2020 and bear interest at a rate of 7% per annum. At March 31, 2013, the face value of these notes, denominated in U.S. dollars totalled $300 million and the carrying amount totalled $292.7 million. Interest is payable in arrears in equal semi-annual installments on April 15 and October 15 each year.
On November 15, 2012, the Company issued a second offering of Senior Unsecured Notes. These notes become payable on November 15, 2022 and bear interest at a rate of 6.25% per annum. At March 31, 2013, the face value of these notes, denominated in U.S. dollars, totalled $500 million and the carrying amount totalled $490.3 million. Interest is payable in arrears in equal semi-annual installments on May 15 and November 15 each year.
On December 14, 2010, the Company entered into an agreement for a $150.0 million revolving credit facility (“Facility”) with a syndicate of banks. The amount of the Facility will be reduced by $50.0 million if Cerro San Pedro is not operational for 45 consecutive days due to any injunction, order, judgment or other determination of an official body in Mexico as a result of any disputes now or hereafter before an official body in Mexico with jurisdiction to settle such a dispute. However, the full $50.0 million of credit will be reinstated if operations at Cerro San Pedro resume in accordance with the mine plan for 45 consecutive days and no similar disruption event occurs during this period. The Facility is for general corporate purposes, including acquisitions and is secured on the Company’s operating assets at Peak Mines, Mesquite and Cerro San Pedro and a pledge of a certain subsidiaries’ shares. The Facility contains various covenants customary for a loan facility of this nature, including limits on indebtedness, asset sales and liens. Significant financial covenants are as follows:
| March 31 | December 31 | ||
| Financial covenant | 2013 | 2012 | |
| Minimum tangible net worth ($1.38 billion + 25% of positive quarterly net income) | > $1.46 billion | $3.1 billion | $3.05 billion |
| Minimum interest coverage ratio (EBITDA to interest) | > 4.0 : 1 | 10.2 : 1 | 13.2 : 1 |
Maximum leverage ratio (debt to EBITDA)1 | < 3.0 : 1 | 0.4 : 1 | 2.0 : 1 |
| 1. | The comparative covenant test presented as at December 31, 2012 was not recalculated using net debt to EBITDA. It was calculated using total debt which was the covenant test at the time. |
On February 28, 2013, New Gold agreed to an extension of the facility to December 14, 2014. Other amendments include a reduction in fees and the use of net debt, rather than total debt, as a measure of leverage for the purpose of covenant tests. As a result of this amendment and extension, the interest margin on drawings under the Facility ranges from 1.25% to 3.50% over LIBOR, the Prime Rate or the Base Rate, based on the Company’s net debt to EBITDA ratio and the currency and type of credit selected by the Company. The standby fees on undrawn amounts under the Facility range between 0.56% and 0.88% depending on the Company’s net debt to EBITDA ratio. Based on the Company’s net debt to EBITDA ratio, the rate is 0.56% as at March 31, 2013.
As at March 31, 2013, the Company has not drawn any funds under the Facility; however the Facility has been used to issue letters of credit of A$10.2 million for Peak Mines’ reclamation bond for the State of New South Wales, C$9.5 million for New Afton’s commitment to B.C. Hydro for power and transmission construction work (the B.C. Hydro letter of credit will be released over time as New Afton consumes and pays for power in the early period of operations), C$9.5 million for New Afton’s reclamation requirements, C$1.2 million for Blackwater’s reclamation requirements and $18.4 million relating to environmental and reclamation requirements at Cerro San Pedro. The annual fees are 1.60% of the value of the outstanding letters of credit whichtotalled $48.9 million as at March 31, 2013.
New Gold’s wholly owned subsidiary Western Goldfields Inc. had a $105.0 million term loan facility with a syndicate of banks under which $86.3 million was borrowed in connection with the development of Mesquite. The remaining loan balance of $27.2 million was fully repaid on February 26, 2010 which allowed the Company the flexibility to monetize the remaining hedges outstanding at its discretion. The related gold hedge extends to the end of 2014 and the related security and covenants were released by the syndicate of banks on December 14, 2010 when New Gold entered into the Facility. The gold hedge is now secured under the Facility and shares in security, on a pari passu basis, with the new lenders. One of the banks under the Facility replaced two of the original banking institutions as the hedge counterparty for a portion of the overall hedge under the same terms. The hedge will remain in place until the hedge is monetized or delivered over this period at 5,500 ounces per month at $801 per ounce.
Current and Deferred Income Taxes
The net deferred income tax liability increased from $128.8 million on December 31, 2012 to $143.6 million on March 31, 2013. The primary reason for the increase in the net deferred tax liability is due to the utilization of the deferred tax assets in respect of BC mining taxes and the mark to market hedges as well as the utilization of the deferred tax assets to account for a full quarter of net income from New Afton.
The current income tax receivable balance decreased from $6.6 million at December 31, 2012 to $6.1 million at March 31, 2013. The outstanding receivable is a 2012 income tax refund due in Mexico.
21
LIQUIDITY AND CASH FLOW
As at March 31, 2013, the Company had cash and cash equivalents held by continuing operations of $672.4 million compared to $687.8 million at December 31, 2012. The Company’s investment policy is to invest its surplus funds in permitted investments consisting of treasury bills, bonds, notes and other evidences of indebtedness of Canada, the U.S. or any of the Canadian Provinces with a minimum credit rating of R-1 mid from the Dominion Bond Rating Service (“DBRS”) or an equivalent rating from Standard & Poor’s and Moody’s and with maturities of twelve months or less at the original date of acquisition. In addition, the Company is permitted to invest in bankers’ acceptances and other evidences of indebtedness of certain financial institutions. Surplus corporate funds are only invested with approved government or bank counterparties.
The change in cash in the quarter ended March 31, 2013 was driven by continuing gold, copper and silver sales from Mesquite, Peak Mines, Cerro San Pedro and New Afton, offset by capital and operating expenditures across the Company.
Liquidity and Capital Resources Outlook
During the three months ended March 31, 2013, the Company had positive net cash generated from continuing operations of $58.5 million and invested a total of $76.4 million in mining interests, including $3.4 million at Mesquite, $3.1 million at Cerro San Pedro, $13.4 million at Peak Mines, $42.0 million at New Afton, and $15.0 million at Blackwater, netted by a credit on other projects. As at March 31, 2013, the Company had working capital of $719.2 million, which includes $672.4 million in cash and cash equivalents.
Internal growth will focus on El Morro and Blackwater; however, there are other potential development properties that may become high priorities as further exploration and assessment is completed. In order to supplement this internal growth, the Company may consider expansion opportunities through mergers and acquisitions.
In the opinion of management, the working capital at March 31, 2013, together with cash flows from operations, are sufficient to support the Company’s normal operating requirements on an ongoing basis. Based on our current cash balance and expected incremental cash flow, it is expected that the Company’s existing cash will be sufficient to fully fund Blackwater and El Morro. New Gold is not required to fund any of the development capital for El Morro, as under the agreement with Goldcorp, the Company’s 30% share is fully funded and both principal and interest will be repaid solely from future cash generated from New Gold’s share of El Morro’s distributable cash flows. The Company also expects it will not need external financing to repay its outstanding debt in 2020 and 2022.
However, the Company’s future profits and cash position are highly dependent on metal prices, including gold, silver and copper. Taking into consideration volatile equity markets, global uncertainty in the capital markets and cost pressures, the Company is continually reviewing expenditures in order to ensure adequate liquidity and flexibility to support its growth strategy while maintaining or increasing production levels at its current operations. However, cash projections may require revision if any further acquisitions or external growth opportunities are realized.
COMMITMENTS
The Company has entered into a number of contractual commitments related to equipment orders to purchase long lead items or critical pieces of mining equipment. At March 31, 2013, these commitments totalled $42.5 million, of which all are expected to fall due over the next 12 months. This compares to a balance of $87.4 million at December 31, 2012.
CONTINGENCIES
In assessing the loss contingencies related to legal proceedings that are pending against the Company or unasserted claims that may result in such proceedings, the Company and its legal counsel evaluate the perceived merits of any legal proceedings or unasserted claims as well as the perceived merits of the amount of relief sought or expected to be sought. If the assessment of a contingency suggests that a loss is probable, and the amount can easily be estimated, then a loss is recorded. When a contingent loss is not probable but is reasonably possible, or is probable but the amount of the loss cannot be reliably estimated, then details of the contingent loss are disclosed. Loss contingencies considered remote are generally not disclosed unless they involve guarantees, in which case the Company discloses the nature of the guarantees. Legal fees incurred in connection with pending legal proceedings are expensed as incurred. If the Company is unable to resolve these disputes favourably, it may have a material adverse impact on our financial condition, cash flow and results of operations.
El Morro Project
The Chilean Environmental Permitting Authority ("Servicio de Evaluación Ambiental" or "SEA") approved the El Morro Project’s environmental permit in March 2011. A constitutional action was filed against the SEA in May 2011 by the Comunidad Agricola Los Huasco Altinos (“CAHA”) seeking annulment of the environmental permit. Sociedad Contractual Mineral El Morro (“El Morro”), the Chilean company jointly held by the Company and Goldcorp, and which owns and operates the El Morro Project, participated in the legal proceedings as an interested party and beneficiary of the environmental permit. In February 2012, the Court of Appeals of Antofagasta ruled against approval of the environmental permit, for the primary reason that the SEA had not adequately consulted or compensated the indigenous people that form the CAHA. SEA and El Morro
22
appealed the ruling; however, the ruling was confirmed by the Supreme Court of Chile on April 27, 2012. Based on the Supreme Court’s announcement, El Morro immediately suspended all project field work being executed under the terms of the environmental permit. On June 22, 2012, SEA initiated the administrative process to address the deficiencies identified by the Chilean Court. It is anticipated the consultation process could be completed by late 2013. During the period of temporary suspension, Goldcorp’s focus is on supporting the advancement of the consultation process, evaluating potential future exploration targets and optimizing project economics including sourcing a long-term power supply.
Cerro San Pedro Mine
In March 2011, the municipality of Cerro de San Pedro approved a new municipal land use plan, after public consultation, which clearly designates the area of the Cerro San Pedro Mine for mining. New Gold believes this plan resolves any ambiguity regarding the land use in the area in which Cerro San Pedro is located, and which has had a history of ongoing legal challenges related to the environmental authorization (“EIS”) for the Mine. In April 2011, a request was filed for a new EIS based on the new Municipal Plan and on August 5, 2011 a new EIS was granted.
CONTRACTUAL OBLIGATIONS
The following is a summary of the Company’s payments due under contractual obligations:
CONTRACTUAL OBLIGATIONS
| Payments due by period | |||||
| (in millions of U.S. dollars) | Less than 1 year | 2 - 3 years | 4 - 5 years | After 5 years | Total |
| Long-term debt | - | - | - | 800.0 | 800.0 |
| Interest payable on long-term debt | 52.3 | 104.5 | 104.5 | 208.8 | 470.1 |
| Operating leases and other commitments | 54.8 | 31.2 | 1.0 | 0.4 | 87.4 |
| Reclamation and closure cost obligations | 3.2 | 3.0 | 5.8 | 78.4 | 90.4 |
| Total contractual obligations | 110.3 | 138.7 | 111.3 | 1,087.6 | 1,447.9 |
The majority of the Company’s contractual obligations consist of long-term debt and interest payable. Long-term debt obligations are comprised of Senior Unsecured Notes issued on April 5, 2012 and November 15, 2012. Refer to the section “Financial Condition Review – Balance Sheet Review – Long-term debt” for further details.
RELATED PARTY TRANSACTIONS
The Company did not enter into any related party transactions during the quarter ended March 31, 2013.
OFF-BALANCE SHEET ARRANGEMENTS
The Company has no off-balance sheet arrangements.
OUTSTANDING SHARES
As at May 1, 2013, there were 476,917,422 common shares of the Company outstanding. The Company had 11,418,753 stock options outstanding under its share option plan, exercisable for 11,418,753 common shares. In addition, the Company had 27,849,865 common share purchase warrants outstanding exercisable for 27,849,865 common shares.
NON-GAAP FINANCIAL PERFORMANCE MEASURES
Total Cash Costs per Gold Ounce
“Total cash costs per gold ounce” is a common financial performance measure in the gold mining industry but with no standard meaning under IFRS. New Gold reports total cash costs on a sales basis. The Company believes that, in addition to conventional measures prepared in accordance with IFRS, certain investors use this information to evaluate the Company’s performance and ability to generate cash flow. The measure, along with sales, is considered to be a key indicator of a Company’s ability to generate operating earnings and cash flow from its mining operations.
Total cash costs figures are calculated in accordance with a standard developed by The Gold Institute, which was a worldwide association of suppliers of gold and gold products and included leading North American gold producers. The Gold Institute ceased operations in 2002, but the standard is the accepted standard of reporting cash costs of production in North America. Adoption of the standard is voluntary and the cost measures presented may not be comparable to other similarly titled measures of other companies. Total cash costs include mine site operating costs such as mining, processing, administration, royalties and production taxes, realized gains and losses on fuel contracts, but is exclusive of amortization, reclamation, capital and exploration costs and net of by-product sales. Total cash costs are then divided by gold ounces sold to arrive at the total cash costs per ounce sold. The calculation of total cash costs per ounce of gold for Cerro San Pedro is net of by-product silver sales revenue, and the calculation of total cash costs per ounce of gold sold for Peak Mines and New Afton is net of by-product copper sales revenue.
23
Total cash costs are intended to provide additional information only and do not have any standardized definition under IFRS; they should not be considered in isolation or as a substitute for measures of performance prepared in accordance with IFRS. Other companies may calculate these measures differently.
TOTAL CASH COSTS PER OUNCE RECONCILIATION
| Three months ended March 31 | ||||
| (in millions of U.S. dollars, except where noted) | 2013 | 2012 | ||
| Operating expenses from continuing operations | 106.1 | 72.3 | ||
| Treatment and refining charges on concentrate sales | 7.3 | 0.9 | ||
| By-product copper and silver sales | (66.9) | (22.1) | ||
| Non-cash adjustments | (0.4) | (0.2) | ||
| Total cash costs | 46.1 | 50.9 | ||
| Ounces of gold sold | 95,181 | 93,676 | ||
| Total cash costs per ounce of gold sold | 485 | 543 | ||
Adjusted Net Earnings and Adjusted Net Earnings per Share
“Adjusted net earnings” and “adjusted net earnings per share” are financial measures with no standard meaning under IFRS which excludes the following from net earnings:
| • | Impairment losses |
| • | Fair value changes of embedded derivative in Senior Secured Notes |
| • | Gains (losses) on Fair Value Through Profit and Loss financial assets |
| • | Ineffectiveness of hedging instruments |
| • | Fair value changes of non-hedged derivatives such as share purchase warrants and the prepayment option on our convertible debt |
| • | Fair value changes of asset backed commercial paper |
| • | Gains (losses) on foreign exchange |
| • | Other non-recurring items |
Net earnings have been adjusted and tax affected for the group of costs in “Other gains and losses” on the condensed consolidated income statement. The adjusted entries are also impacted for tax to the extent that the underlying entries are impacted for tax in the unadjusted net earnings from continuing operations. As the loss on the fair value change of non-hedged derivatives is only minimally tax affected in unadjusted net earnings from continuing operations, the reversal of tax on an adjusted basis is also minimal. The prior period adjusted tax excludes the impact of the increase in the Chilean Category 1 income tax rate which was enacted in the third quarter of 2012, as well as the impact of adjustments to uncertain tax positions. Also, the prior period tax is adjusted for the foreign exchange impact of deferred tax on non-monetary assets.
As noted, the Company uses this measure for its own internal purposes. Management’s internal budgets and forecasts and public guidance do not reflect fair value changes on senior notes and non-hedged derivatives, foreign currency translation and FVTPL financial asset gains/losses. Consequently, the presentation of adjusted net earnings enables investors and analysts to better understand the underlying operating performance of our core mining business through the eyes of management. Management periodically evaluates the components of adjusted net earnings based on an internal assessment of performance measures that are useful for evaluating the operating performance of our business and a review of the non-GAAP measures used by mining industry analysts and other mining companies.
Adjusted net earnings are intended to provide additional information only and do not have any standardized definition under IFRS; they should not be considered in isolation or as a substitute for measures of performance prepared in accordance with IFRS. The measures are not necessarily indicative of operating profit or cash flow from operations as determined under IFRS. Other companies may calculate these measures differently.
The following table reconciles these non-GAAP measures to the most directly comparable IFRS measure. The reconciliation of net earnings to adjusted net earnings is below.
24
ADJUSTED NET EARNINGS RECONCILIATION
| Three months ended March 31 | ||||
| (in millions of U.S. dollars, except where noted) | 2013 | 2012 | ||
| Net earnings before taxes | 48.7 | 51.8 | ||
| Ineffectiveness on hedging instruments | 0.5 | 0.2 | ||
| Realized and unrealized gain on non-hedged derivatives | (22.6) | 8.6 | ||
| Loss (gain) on foreign exchange | 5.6 | 1.5 | ||
| Loss on disposal of assets | 0.5 | 0.3 | ||
| Other | 0.2 | 1.5 | ||
| Adjusted net earnings before tax | 32.9 | 63.9 | ||
| Income tax expense | (12.4) | (18.3) | ||
| Income tax adjustments | 0.1 | (1.4) | ||
| Adjusted income tax expense | (12.3) | (19.7) | ||
| Adjusted net earnings | 20.6 | 44.2 | ||
| Adjusted earnings per share (basic) | 0.04 | 0.10 | ||
| Adjusted effective tax rate | 37% | 31% | ||
Cash generated from operations, excluding working capital changes and income taxes paid
“Cash generated from operations, excluding working capital changes and income taxes paid” is a financial measure with no standard meaning under IFRS, which management uses to further evaluate the Company’s results of operations in each reporting period. Operating margin is calculated as net cash generated from operations excluding the change in non-cash operating working capital and income taxes paid.
Cash generated from operations, excluding working capital changes and income taxes paid, is intended to provide additional information only and does not have any standardized definition under IFRS; it should not be considered in isolation or as a substitute for measures of performance prepared in accordance with IFRS. Other companies may calculate this measure differently.
CASH GENERATED FROM OPERATIONS, EXCLUDING WORKING CAPITAL CHANGES AND INCOME TAXES PAID RECONCILIATION
| Three months ended March 31 | ||||
| (in millions of U.S. dollars, except where noted) | 2013 | 2012 | ||
| Net cash generated from operations | 58.5 | 36.7 | ||
| Add back: Change in non-cash operating working capital | 12.9 | 16.3 | ||
| Add back: Income taxes paid | 9.7 | 29.4 | ||
| Cash generated from operations, excluding working capital changes and income taxes paid | 81.1 | 82.4 | ||
Operating Margin
“Operating margin” is a financial measure with no standard meaning under IFRS, which management uses to further evaluate the Company’s results of operations in each reporting period. Operating margin is calculated as revenues less operating expenses and therefore does not include depreciation and depletion.
Operating margin is intended to provide additional information only and does not have any standardized definition under IFRS; it should not be considered in isolation or as a substitute for measures of performance prepared in accordance with IFRS. Other companies may calculate this measure differently.
OPERATING MARGIN RECONCILIATION
| Three months ended March 31 | ||||
| (in millions of U.S. dollars, except where noted) | 2013 | 2012 | ||
| Revenues | 201.8 | 168.8 | ||
| Less: Operating expenses | (106.1) | (72.3) | ||
| Operating margin | 95.7 | 96.5 | ||
Average Realized Price and Average Realized Margin
“Average realized price” and “average realized margin per ounce of gold sold” are financial measures with no standard meaning under IFRS. Management uses these measures to better understand the price realized in each reporting period for gold, silver, and copper sales. Average realized price excludes from revenues unrealized gains and losses on non-hedged derivative contracts.
Average realized margin represents average realized price per ounce less total cash costs per ounce.
25
Average realized price and average realized margin are intended to provide additional information only and do not have any standardized definition under IFRS; they should not be considered in isolation or as substitutes for measures of performance prepared in accordance with IFRS. Other companies may calculate these measures differently.
AVERAGE REALIZED PRICE AND AVERAGE REALIZED MARGIN RECONCILIATION
| Three months ended March 31 | ||||
| (in millions of U.S. dollars, except where noted) | 2013 | 2012 | ||
| Revenues from gold sales | 142.2 | 147.5 | ||
| Ounces of gold sold | 95,181 | 93,676 | ||
| Average realized price per ounce of gold sold | 1,494 | 1,575 | ||
| Less: Cash costs per ounce of gold sold | (485) | (543) | ||
| Average realized margin per ounce of gold sold | 1,009 | 1,032 | ||
ENTERPRISE RISK MANAGEMENT
Readers of this MD&A should give careful consideration to the information included or incorporated by reference in this document and the Company’s unaudited consolidated financial statements and related notes. Significant risk factors for the Company are metal prices, government regulations, foreign operations, environmental compliance, the ability to obtain additional financing, risk relating to recent acquisitions, dependence on management, title to the Company’s mineral properties, and litigation. For details of risk factors, please refer to the 2012 year-end audited consolidated financial statements and our latest Annual Information Form, dated March 27, 2013 and filed on SEDAR at www.sedar.com.
GENERAL RISKS
Environmental Risk
The Company is and will be subject to environmental regulation in Canada, Mexico, the United States and Australia where it operates, as well as in Canada and Chile where it has development properties. In addition, the Company will be subject to environmental regulation in any other jurisdictions in which the Company may operate or have development properties. These regulations mandate, among other things, the maintenance of air and water quality standards, land use standards and land reclamation. They also set out limitations on the generation, transportation, storage and disposal of solid, liquid and hazardous waste.
Environmental legislation is evolving in a manner which will require, in certain jurisdictions, stricter standards and enforcement, increased fines and penalties for non-compliance, more stringent environmental assessments of proposed projects and a heightened degree of responsibility for companies and their officers, directors and employees. No certainty exists that future changes in environmental regulation, if any, will not adversely affect the Company’s operations or development properties. Environmental hazards may exist on the Company’s properties which are unknown to management at present and which have been caused by previous owners or operators of the properties.
Failure by the Company to comply with applicable laws, regulations and permitting requirements may result in enforcement actions, including orders issued by regulatory or judicial authorities causing operations to cease or be curtailed, and may include corrective measures requiring capital expenditures, installation of additional equipment, or remedial actions. The Company may be required to compensate those suffering loss or damage by reason of its mining operations or its exploration or development of mineral properties and may have civil or criminal fines or penalties imposed for violations of applicable laws or regulations.
FINANCIAL RISK MANAGEMENT
The Company holds a mixture of financial instruments, which are classified and measured as follows. For a discussion of the methods used to value financial instruments, as well as any significant assumptions, refer to Note 2 to our audited consolidated financial statements for the year ended December 31, 2012.
26
| As at March 31, 2013 | |||||
| (in millions of U.S. dollars) | Loans and receivables at amortized cost | Designated as Fair Value Through Profit & Loss | Available for sale at fair value | Financial liabilities at amortized cost | Total |
| Financial assets | |||||
| Cash and cash equivalents | 672.4 | - | - | - | 672.4 |
| Trade and other receivables | 21.2 | - | - | - | 21.2 |
| Copper swap contracts | - | 2.2 | - | - | 2.2 |
| Investments | - | - | 0.7 | - | 0.7 |
| Financial liabilities | |||||
| Trade and other payables | - | - | - | 57.3 | 57.3 |
| Long-term debt | - | - | - | 854.3 | 854.3 |
| Gold contracts | - | 88.4 | - | - | 88.4 |
| Warrants | - | 56.2 | - | - | 56.2 |
| Share award units | - | 5.3 | - | - | 5.3 |
| As at December 31, 2013 | |||||
| (in millions of U.S. dollars) | Loans and receivables at amortized cost | Designated as Fair Value Through Profit & Loss | Available for sale at fair value | Financial liabilities at amortized cost | Total |
| Financial assets | |||||
| Cash and cash equivalents | 687.8 | - | - | - | 687.8 |
| Trade and other receivables | 46.9 | - | - | - | 46.9 |
| Investments | - | - | 1.0 | - | 1.0 |
| Financial liabilities | |||||
| Trade and other payables | - | - | - | 120.7 | 120.7 |
| Long-term debt | - | - | - | 847.8 | 847.8 |
| Gold contracts | - | 110.5 | - | - | 110.5 |
| Copper swap contracts | - | 0.9 | - | - | 0.9 |
| Warrants | - | 80.3 | - | - | 80.3 |
| Share award units | - | 4.0 | - | - | 4.0 |
The Company examines the various financial instrument risks to which it is exposed and assesses the impact and likelihood of those risks. These risks may include credit risk, liquidity risk, market risk and other price risks. Where material, these risks are reviewed and monitored by the Board of Directors.
Credit Risk
Credit risk is the risk of an unexpected loss if a party to its financial instrument fails to meet its contractual obligations. The Company’s financial assets are primarily composed of cash and cash equivalents, investments and trade and other receivables. Credit risk is primarily associated with trade and other receivables and investments; however, it also arises on cash and cash equivalents. To mitigate exposure to credit risk, the Company has established policies to limit the concentration of credit risk, to ensure counterparties demonstrate minimum acceptable credit worthiness, and to ensure liquidity of available funds.
The Company closely monitors its financial assets and does not have any significant concentration of credit risk. The Company sells its gold exclusively to large international organizations with strong credit ratings. The historical level of customer defaults is minimal and, as a result, the credit risk associated with gold and copper concentrate trade receivables at December 31, 2012 is not considered to be high.
The Company’s maximum exposure to credit risk at March 31, 2013 and December 31, 2012 is as follows:
| March 31 | December 31 | |
| (in millions of U.S. dollars) | 2013 | 2012 |
| Cash and cash equivalents | 672.4 | 687.8 |
| Trade receivables | 23.4 | 46.9 |
| Reclamation deposits | - | - |
| Total financial instruments subject to credit risk | 695.8 | 734.7 |
27
The aging of accounts receivable at March 31, 2013 and December 31, 2012 is as follows:
| March 31 | December 31 | ||||||
| (in millions of U.S. dollars) | 0-30 days | 31-60 days | 61-90 days | 91-120 days | Over 120 days | 2013 Total | 2012 Total |
| Mesquite | 0.4 | - | - | - | - | 0.4 | 0.9 |
| Cerro San Pedro | 3.1 | - | 2.2 | - | 2.0 | 7.3 | 4.7 |
| Peak Mines | 6.5 | - | - | - | - | 6.5 | 5.5 |
| New Afton | 2.1 | 2.5 | - | 2.6 | - | 7.2 | 21.5 |
| Blackwater | 1.0 | - | - | - | - | 1.0 | 13.1 |
| Corporate | 1.0 | - | - | - | - | 1.0 | 1.2 |
| Total trade receivables | 14.1 | 2.5 | 2.2 | 2.6 | 2.0 | 23.4 | 46.9 |
A significant portion of the Company’s cash and cash equivalents is held in large Canadian financial institutions. Short-term investments (including those presented as part of cash and cash equivalents) are composed of financial instruments issued by approved banks with high investment-grade ratings and the governments of Canada and the U.S.
The Company employs a restrictive investment policy as detailed in the capital risk management section, which is described in Note 18 to our audited consolidated financial statements for the year ended December 31, 2012.
The Company sells its copper concentrate production from New Afton to four different customers under off-take contracts. The Company sells its copper concentrate production from Peak Mines to one customer under an off-take contract. While there are alternative customers in the market, loss of this customer or unexpected termination of the off-take contract could have a material adverse effect on the Company’s results of operations, financial condition and cash flows.
The Company is not economically dependent on a limited number of customers for the sale of its gold because gold can be sold through numerous commodity market traders worldwide.
Liquidity risk
Liquidity risk is the risk that the Company will not be able to meet its financial obligations as they fall due. The Company manages liquidity risk through the management of its capital structure and financial leverage, as outlined in Note 18 to our audited consolidated financial statements for the year ended December 31, 2012.
The following are the contractual maturities of debt commitments. The amounts presented represent the future undiscounted principal and interest cash flows, and therefore, do not equate to the carrying amounts on the consolidated statements of financial position.
| March 31 | December 31 | |||||
| (in millions of U.S. dollars) | Less than 1 year | 2-3 | 4-5 years | After 5 years | 2013 Total | 2012 Total |
| years | ||||||
| Trade and other payables | 111.8 | - | - | - | 111.8 | 120.7 |
| Long-term debt | - | - | - | 800.0 | 800.0 | 800.0 |
| Interest payable on long-term debt | 52.3 | 104.5 | 104.5 | 208.8 | 470.1 | 470.1 |
| Gold contracts | 57.3 | 35.6 | - | - | 92.9 | 116.7 |
| Copper swap contracts | - | - | - | - | - | 0.9 |
| 221.4 | 140.1 | 104.5 | 1,008.8 | 1,474.8 | 1,508.4 |
Taking into consideration the Company’s current cash position, volatile equity markets, global uncertainty in the capital markets and increasing cost pressures, the Company is continuing to review expenditures in order to ensure adequate liquidity and flexibility to support its growth strategy while maintaining production levels at its current operations. A period of continuous low gold and copper prices may necessitate the deferral of capital expenditures which may impact production from mining operations. These statements are based on the current financial position of the Company and are subject to change if any acquisitions or external growth opportunities are realized.
Currency Risk
The Company operates in Canada, Mexico, the United States, Australia and Chile. As a result, the Company has foreign currency exposure with respect to items not denominated in U.S. dollars. The three main types of foreign exchange risk for the Company can be categorized as follows:
i. Transaction exposure
The Company’s operations sell commodities and incur costs in different currencies. This creates exposure at the operational level, which may affect the Company’s profitability as exchange rates fluctuate. The Company has not hedged its exposure to currency fluctuations.
28
ii. Exposure to currency risk
The Company is exposed to currency risk through the following assets and liabilities denominated in currencies other than the U.S. dollar: cash and cash equivalents; investments; accounts receivable; reclamation deposits; accounts payable and accruals; reclamation and closure cost obligations; and long-term debt. The currencies of the Company’s financial instruments and other foreign currency denominated liabilities, based on notional amounts, were as follows:
| As at March 31, 2013 | ||||
| (in millions of U.S. dollars) | Canadian dollar | Australian dollar | Mexican peso | Chilean peso |
| Cash and cash equivalents | 25.3 | 4.5 | 0.5 | - |
| Trade and other receivables | 10.0 | 1.4 | 7.3 | - |
| Trade and other payables | (60.2) | (18.6) | (14.9) | - |
| Reclamation and closure cost obligations | (17.3) | (20.5) | (19.1) | - |
| Warrants | (56.2) | - | - | - |
| Share award units | (5.3) | - | - | - |
| Gross balance exposure | (103.7) | (33.2) | (26.2) | - |
| As at December 31, 2012 | ||||
| (in millions of U.S. dollars) | Canadian dollar | Australian dollar | Mexican peso | Chilean peso |
| Cash and cash equivalents | 19.6 | 10.2 | 0.3 | - |
| Trade and other receivables | 35.9 | 2.1 | 4.7 | - |
| Trade and other payables | (70.8) | (18.4) | (16.3) | - |
| Reclamation and closure cost obligations | (17.9) | (21.4) | (18.4) | - |
| Warrants | (80.3) | - | - | - |
| Share award units | (4.0) | - | - | - |
| Gross balance exposure | (117.5) | (27.5) | (29.7) | - |
iii. Translation exposure
The Company’s functional and reporting currency is U.S. dollars. The Company’s operations translate their operating results from the host currency to U.S. dollars. Therefore, exchange rate movements in the Canadian dollar, Mexican peso, Australian dollar and Chilean peso can have a significant impact on the Company’s consolidated operating results. A 10% strengthening (weakening) of the U.S. dollar against the following currencies would have decreased (increased) the Company’s net loss from the financial instruments presented by the amounts shown below.
| March 31 | December 31 | |
| (in millions of U.S. dollars) | 2013 | 2012 |
| Canadian dollar | (10.4) | (11.8) |
| Australian dollar | (3.3) | (2.7) |
| Mexican peso | (2.6) | (2.9) |
| Chilean peso | - | - |
| Total translation risk exposure | (16.3) | (17.4) |
Interest Rate Risk
Interest rate risk is the risk that the fair value or the future cash flows of a financial instrument will fluctuate because of changes in market interest rates. All of the Company’s outstanding debt obligations are fixed; therefore, there is no exposure to changes in market interest rates. The Facility interest rate is variable; however, the Facility is undrawn as at March 31, 2013.
The Company is exposed to interest rate risk on its short-term investments which are included in cash and cash equivalents. The short-term investment interest earned is based on prevailing market interest rates which may fluctuate. A 1.0% change in the interest rate would result in an annual difference of approximately $7.0 million in interest earned by the Company. The Company has not entered into any derivative contracts to manage this risk. Where possible and depending on market conditions, the Company follows the policy of issuing fixed interest rate debt to avoid future fluctuations in its debt service costs.
Price Risk
The Company’s earnings and cash flows are subject to price risk due to fluctuations in the market price of gold, silver and copper. World gold prices have historically fluctuated widely and are affected by numerous factors beyond our control, including:
| • | the strength of the U.S. economy and the economies of other industrialized and developing nations |
| • | global or regional political or economic crises |
| • | the relative strength of the U.S. dollar and other currencies |
| • | expectations with respect to the rate of inflation |
29
| • | interest rates |
| • | purchases and sales of gold by central banks and other holders |
| • | demand for jewelry containing gold |
| • | investment activity, including speculation, in gold as a commodity |
The Company acquired gold contracts which mitigate the effects of price changes. The Company designated these contracts as an accounting cash flow hedge effective July 1, 2009 as described in Note 10 (a) to our audited consolidated financial statements. At March 31, 2013, the Company had remaining gold forward sales contracts for 115,500 ounces of gold at a price of $801 per ounce at a remaining commitment of 5,500 ounces per month, for 21 months.
For the three months ended March 31, 2013, the Company’s revenues and cash flows were impacted by gold prices in the range of $1,574 to $1,694 per ounce, and by copper prices in the range of $3.42 to $3.74 per pound. There is a time lag between the shipment of gold and copper and final pricing, and changes in pricing can significantly impact the Company’s revenue and working capital position. As at March 31, 2013, working capital includes unpriced gold and copper concentrate receivables totalling 38,785 ounces of gold and 30.7 million pounds of copper. A $100 change in gold price per ounce would have an impact of $3.9 million on the Company’s working capital. A $0.10 change in copper price per pound would have an impact of $3.1 million on the Company’s working capital position.
The Company is also subject to price risk for fluctuations in the cost of energy, principally electricity and purchased petroleum products. The Company’s production costs are also affected by the prices of commodities it consumes or uses in its operations, such as lime, reagents and explosives. The prices of such commodities are influenced by supply and demand trends affecting the mining industry in general and other factors outside the Company’s control. The Company has no fuel hedge contracts at this time.
The Company is also subject to price risk for changes in the Company’s common stock price per share. The Company has implemented, as part of its long-term incentive plan, a share award unit plan that the Company is required to satisfy in cash upon vesting. The amount of cash the Company will be required to expend is dependent upon the price per common share at the time of vesting. The Company considers this plan a financial liability and is required to fair value the outstanding liability with the resulting changes included in compensation expense each period.
An increase in gold, copper and silver prices would increase the Company’s net earnings whereas an increase in fuel or share unit award prices would decrease the Company’s net earnings. A 10% change in commodity prices would impact the Company’s net earnings before taxes and other comprehensive income before taxes as follows:
| Three months ended March 31 | ||||
| 2013 | 2013 | 2012 | 2012 | |
| (in millions of U.S. dollars) | Net earnings | Other Comprehensive Income | Net earnings | Other Comprehensive Income |
| Gold price | 14.2 | 17.7 | 62.4 | 28.0 |
| Silver price | 5.5 | - | 6.3 | - |
| Copper price | 1.1 | - | 6.6 | - |
| Fuel price | 1.7 | - | 1.2 | - |
| Warrants | 5.6 | - | 15.4 | - |
| Conversion option on convertible debt | - | - | 2.2 | - |
| Share aware units | 0.5 | - | 0.4 | - |
| Total price risk exposure | 28.6 | 17.7 | 94.5 | 28.0 |
CRITICAL ACCOUNTING POLICIES, ESTIMATES AND ACCOUNTING CHANGES
The preparation of the Company’s consolidated financial statements in conformity with IFRS requires the Company’s management to make judgments, estimates and assumptions about the future events that affect the amounts reported in the consolidated financial statements and related notes to the financial statements. Estimates and assumptions are continually evaluated and are based on management’s experience and other facts and circumstances. Revisions to estimates and the resulting effects on the carrying amounts of the Company’s assets and liabilities are accounted for prospectively.
The areas which require management to make significant judgments, estimates and assumptions in determining carrying values include, but are not limited to:
30
CRITICAL JUDGMENTS IN THE APPLICATION OF ACCOUNTING POLICIES
(i) Commencement of commercial production
Prior to the period when a mine has reached management’s intended operating levels, costs incurred as part of the development of the related mining property are capitalized and any mineral sales during the commissioning period are offset against the costs capitalized. The Company defines the commencement of commercial production as the date that a mine has achieved a consistent level of production. Depletion of capitalized costs for mining properties begins when operating levels intended by management have been reached.
There are a number of factors the Company considers when determining if conditions exist for the commencement of commercial production of an operating mine. Management examines the following when making that judgment:
| · | All major capital expenditures to bring the mine to the condition necessary for it to be capable of operating in the manner intended by management have been completed; |
| · | The completion of a reasonable period of testing of the mine plant and equipment; |
| · | The mine or mill has reached a pre-determined percentage of design capacity; and |
| · | The ability to sustain ongoing production of ore. |
| The list is not exhaustive and each specific circumstance is taken into account before making the decision. |
Effective July 31, 2012, management determined that New Afton reached the commercial production levels. The Company defines the point where a development project becomes an operating mine as 60% average mill capacity for a consecutive 30-day period. Upon declaring commercial production at New Afton, the Company transferred the capitalized cost of the mineral property from non-depletable assets to depletable assets, and began depleting the assets on a unit of production method. The Company ceased capitalization of interest to the mine as it was no longer a qualifying asset.
In September 2012, the Company recorded the first concentrate sale of the mine. A portion of the sale related to material produced prior to commercial production and was recorded as a credit to the cost of the project.
(ii) Functional currency
The functional currency for each of the Company’s subsidiaries and equity investments is the currency of the primary economic environment in which the entity operates. The Company has determined the functional currency of each entity as the U.S. dollar. Determination of the functional currency may involve certain judgments to determine the primary economic environment and the Company reconsiders the functional currency of its entities if there is a change in events and conditions which determines the primary economic environment.
As of July 31, 2012 the Company applied the change in functional currency to New Afton and to Blackwater on a prospective basis. The Company translated all items into the new functional currency using the exchange rate as at July 31, 2012. The resulting translated amounts for non-monetary items are treated as their historical cost. Exchange differences arising from the translation of a foreign operation previously recognized in other comprehensive income are not reclassified from equity to net earnings until the disposal of the operation.
New Afton
The Company re-assessed the functional currency at New Afton, as the mine commenced commercial production and moved from a development project to an operating mine on July 31, 2012. The Company defines commercial production as reaching an average of 60% mill capacity for a consecutive 30-day period. New Afton began earning revenue which is denominated in U.S. dollars. The change in circumstance required the Company to change the functional currency of the mine from the Canadian dollar to the U.S. dollar.
Blackwater
The Company re-assessed the functional currency of Blackwater. Blackwater is funded from the net earnings of the Company’s operating mines which are denominated in U.S. dollars, and was amalgamated with Corporate on January 1, 2012 which has a U.S. dollar functional currency as well. The Company changed the functional currency at Blackwater to U.S. dollars, as financing will be denominated in such.
(iii) Determination of economic viability
Management has determined that exploratory drilling, evaluation, development and related costs incurred on Blackwater have future economic benefits and are economically recoverable. In making this judgment, management has assessed various criteria including but not limited to the geologic and metallurgic information, history of conversion of mineral deposits to proven and probable mineral reserves, scoping and feasibility studies, proximity of operating facilities, operating management expertise, existing permits and life of mine plans.
31
(iv) Carrying value of assets and impairment charges
In determining whether the impairment of the carrying value of an asset is necessary, management first determines whether there are external or internal indicators that would signal the need to test for impairment. These indicators consist of but are not limited to the prolonged significant decline in commodity prices, unfavourable changes to the legal environment in which the entity operates and evidence of long term reduced production of the asset. If an impairment indicator is identified, the Company compares the carrying value of the asset against the higher of the recoverable amount or fair value less cost to sell. These determinations and their individual assumptions require that management make a decision based on the best available information at each reporting period. During the year ended December 31, 2012, the Company identified no indicators that led to additional impairment analysis.
(v) Determination of Cash Generating Unit (“CGU”)
In determining a CGU, management had to examine the smallest identifiable group of assets that generates cash inflows that are largely independent on cash inflows from other assets or groups of assets. The Company has determined that each mine site and development project qualifies as an individual CGU. Each of these assets generates cash inflows that are independent of the other assets and therefore qualifies as an individual asset for impairment testing purposes.
KEY SOURCES OF ESTIMATION UNCERTAINTY IN THE APPLICATION OF ACCOUNTING POLICIES
(i) Revenue recognition
Revenue from sales of concentrate is recorded when the rights and rewards of ownership pass to the buyer. Variations between the prices set in the contracts and final settlement prices may be caused by changes in the market prices and result in an embedded derivative in the accounts receivable. The embedded derivative is recorded at fair value each reporting period until final settlement occurs, with changes in the fair value being recorded as revenue. For changes in metal quantities upon receipt of new information and assays, the provisional sales quantities are adjusted as well.
(ii) Inventory valuation
Management values inventory at the average production costs or net realizable value (“NRV”). Average production costs include expenditures incurred and depreciation and depletion of assets used in mining and processing activities that are deferred and accumulated as the cost of ore in stockpiles, ore on leach pad, work-in-process and finished metals inventories. The allocation of costs to ore in stockpiles, ore on leach pads and in-process inventories and the determination of NRV involve the use of estimates. Costs are removed from the leach pad based on the average cost per recoverable ounce of gold on the leach pad as gold is recovered. Estimates of recoverable gold on the leach pads are calculated from the quantities of ore placed on the pads, the grade of ore placed on the leach pads and an estimated percentage of recovery. Timing and ultimate recovery of gold contained on leach pads can vary significantly from the estimates.
(iii) Mineral Reserves
The figures for Mineral Reserves and Mineral Resources are determined in accordance with National Instrument 43-101, “Standards of Disclosure for Mineral Projects”, issued by the Canadian Securities Administrators. There are numerous estimates in determining the Mineral Reserves and estimates. Such estimation is a subjective process, and the accuracy of any Mineral Reserve or Resource estimate is a function of the quantity and quality of available data and of the assumptions made and judgments used in engineering and geological interpretation. Differences between management’s assumptions including economic assumptions such as metal prices and market conditions could have a material effect in the future on the Company’s financial position and results of operations.
(iv) Estimated recoverable ounces
The carrying amounts of the Company’s mining properties are depleted based on recoverable ounces. Changes to estimates of recoverable ounces and depletable costs including changes resulting from revisions to the Company’s mine plans and changes in metal price forecasts can result in a change to future depletion rates.
(v) Deferred income taxes
In assessing the probability of realizing income tax assets recognized, management makes estimates related to expectations of future taxable income, applicable tax planning opportunities, expected timing of reversals of existing temporary differences and the likelihood that tax positions taken will be sustained upon examination by applicable tax authorities. In making its assessments, management gives additional weight to positive and negative evidence that can be objectively verified. Estimates of future taxable income are based on forecasted cash flows from operations and the application of existing tax laws in each jurisdiction. Forecasted cash flows from operations are based on life of mine projections internally developed and reviewed by management. The Company considers tax planning opportunities that are within the Company’s control, are feasible and implementable without significant obstacles. Examination by applicable tax authorities is supported based on individual facts and circumstances of the relevant tax position examined in light of all available evidence. Where applicable tax laws and
32
regulations are either unclear or subject to ongoing varying interpretations, it is reasonably possible that changes in these estimates can occur that materially affect the amounts of income tax asset recognized. At the end of each reporting period, the Company reassesses unrecognized income tax assets.
(vi) Reclamation and closure cost obligations
The Company’s provision for reclamation and closure cost obligations represents management’s best estimate of the present value of the future cash outflows required to settle the liability which reflects estimates of future costs, inflation, movements in foreign exchange rates and assumptions of risks associated with the future cash outflows, and the applicable risk-free interest rates for discounting the future cash outflows. Changes in the above factors can result in a change to the provision recognized by the Company. At December 31, 2012, the carrying amount of the Company’s provision for reclamation and closure cost obligations was $71.8 million (2011 - $55.0 million).
ACCOUNTING STANDARDS AND RECENT ACCOUNTING PRONOUNCEMENTS
Accounting standards effective January 1, 2013
Consolidation
In May 2011, the IASB issued IFRS 10 – Consolidated Financial Statements (“IFRS 10”), which supersedes Standing Interpretations Committee standards (“SIC”) 12 and the requirements relating to consolidated financial statements in IAS 27 – Consolidated and Separate Financial Statements (“IAS 27”). IFRS 10 is effective for annual periods beginning on or after January 1, 2013, with earlier application permitted under certain circumstances. IFRS 10 establishes control as the basis for an investor to consolidate its investees; it defines control as an investor’s power over an investee with exposure, or rights, to variable returns from the investee and the ability to affect the investor’s returns through its power over the investee. In addition, the IASB issued IFRS 12 – Disclosure of Interests in Other Entities (“IFRS 12”), which combines and enhances the disclosure requirements for the Company’s subsidiaries, joint arrangements, associates and unconsolidated structured entities. The requirements of IFRS 12 include reporting on the nature of risks associated with the Company’s interests in other entities, and the effects of those interests on the Company’s consolidated financial statements. Concurrently with the issuance of IFRS 10, IAS 27 and IAS 28 – Investments in Associates (“IAS 28”) were revised and reissued as IAS 27 – Separate Financial Statements and IAS 28 – Investments in Associates and Joint Ventures to align with the new consolidation guidance. The Company has evaluated the above standards and determined that they do not have a material impact on the consolidated financial statements.
Joint arrangements
In May 2011, the IASB issued IFRS 11 – Joint Arrangements (“IFRS 11”), which supersedes IAS 31 – Interests in Joint Ventures and SIC 13 – Jointly Controlled Entities – Non-Monetary Contributions by Venturers. IFRS 11 is effective for annual periods beginning on or after January 1, 2013, with earlier application permitted under certain circumstances. Under IFRS 11, joint arrangements are classified as joint operations or joint ventures based on the rights and obligations of the parties to the joint arrangements. A joint operation is a joint arrangement whereby the parties that have joint control of the arrangement (“joint operators”) have rights to the assets, and obligations for the liabilities, relating to the arrangement. A joint venture is a joint arrangement whereby the parties that have joint control of the arrangement (“joint venturers”) have rights to the net assets of the arrangement. IFRS 11 requires that a joint operator recognize its portion of assets, liabilities, revenues and expenses of a joint arrangement, while a joint venturer recognizes its investment in a joint arrangement using the equity method. The Company has evaluated IFRS 11 and determined that it does not have a material impact on the consolidated financial statements.
Fair value measurement
In May 2011, as a result of the convergence project undertaken by the IASB and the U.S. Financial Accounting Standards Board, to develop common requirements for measuring fair value and for disclosing information about fair value measurements, the IASB issued IFRS 13 – Fair Value Measurement (“IFRS 13”). IFRS 13 is effective for annual periods beginning on or after January 1, 2013, with earlier application permitted. IFRS 13 defines fair value and sets out a single framework for measuring fair value which is applicable to all IFRS that require or permit fair value measurements or disclosures about fair value measurements. IFRS 13 requires that when using a valuation technique to measure fair value, the use of relevant observable inputs should be maximized while unobservable inputs should be minimized. The Company has evaluated IFRS 13 and determined that it does not have a material impact on the consolidated financial statements.
33
Financial statement presentation
In June 2011, the IASB issued amendments to IAS 1 – Presentation of Financial Statements (“IAS 1”) that require an entity to group items presented in the Statement of Comprehensive Income on the basis of whether they may be reclassified to earnings subsequent to initial recognition. For those items presented before taxes, the amendments to IAS 1 also require that the taxes related to the two separate groups be presented separately. The amendments are effective for annual periods beginning on or after July 1, 2012, with earlier adoption permitted. The Company has evaluated the amendments to IAS 1 and determined that they do not have a material impact on the consolidated financial statements.
Stripping costs in the production phase of a mine
In October 2011, the IASB issued IFRIC 20 – Stripping Costs in the Production Phase of a Mine (“IFRIC 20”). IFRIC 20 clarifies the requirements for accounting for the costs of stripping activity in the production phase when two benefits accrue: (i) usable ore that can be used to produce inventory and (ii) improved access to further quantities of material that will be mined in future periods. IFRIC 20 is effective for annual periods beginning on or after January 1, 2013 with earlier application permitted and includes guidance on transition for pre-existing stripping assets. The Company has evaluated IFRIC 20 and the implementation of the standard is consistent with current practice.
Accounting standards anticipated to be effective January 1, 2015
Financial instruments
The IASB intends to replace IAS 39 – Financial Instruments: Recognition and Measurement (“IAS 39”) in its entirety with IFRS 9 – Financial Instruments (“IFRS 9”) in three main phases. IFRS 9 will be the new standard for the financial reporting of financial instruments that is principles-based and less complex than IAS 39. In November 2009 and October 2010, phase 1 of IFRS 9 was issued and amended, respectively, which addressed the classification and measurement of financial assets and financial liabilities. IFRS 9 requires that all financial assets be classified and subsequently measured at amortized cost or at fair value based on the Company’s business model for managing financial assets and the contractual cash flow characteristics of the financial assets. Financial liabilities are classified as subsequently measured at amortized cost except for financial liabilities classified as at FVTPL, financial guarantees and certain other exceptions. On July 22, 2011, the IASB agreed to defer the mandatory effective date of IFRS 9 from annual periods beginning on or after January 1, 2013 (with earlier application permitted) to annual periods beginning on or after January 1, 2015 (with earlier application still permitted). The IASB proposed the deferral of IFRS 9 in an exposure draft with a 60-day comment period which ended on October 21, 2011. The Company is currently evaluating the impact the final standard is expected to have on its consolidated financial statements.
CONTROLS AND PROCEDURES
DISCLOSURE CONTROLS AND PROCEDURES
The Company’s management, with the participation of and under the supervision of its Chief Executive Officer and Chief Financial Officer, has evaluated the effectiveness of the Company’s disclosure controls and procedures. Based on that evaluation, the Company’s Chief Executive Officer and Chief Financial Officer have concluded that, as of the end of the period covered by this MD&A, the Company’s disclosure controls and procedures were effective to provide reasonable assurance that the information required to be disclosed by the Company in reports it files is recorded, processed, summarized and reported, within the appropriate time periods.
MANAGEMENT’S REPORT ON INTERNAL CONTROL OVER FINANCIAL REPORTING
The Company’s management, including the Chief Executive Officer and the Chief Financial Officer, is responsible for establishing and maintaining adequate internal control over financial reporting. Internal control over financial reporting is a process designed by, or under the supervision of, the Company’s principal executive and principal financial officers and effected by the Company’s Board of Directors, management and other personnel, to provide reasonable assurance regarding the reliability of financial reporting and the preparation of financial statements for external purposes in accordance with generally accepted accounting principles. The Company’s internal control over financial reporting includes those policies and procedures that:
| • | Pertain to the maintenance of records that, in reasonable detail, accurately and fairly reflect the transactions and dispositions of the assets of the Company; |
| • | Provide reasonable assurance that transactions are recorded as necessary to permit preparation of financial statements in accordance with generally accepted accounting principles, and that receipts and expenditures of the Company are being made only in accordance with authorizations of management and directors of the Company; and |
| • | Provide reasonable assurance regarding prevention or timely detections of unauthorized acquisition, use or disposition of the Company’s assets that could have a material effect on the financial statements. |
34
The Company’s management, including its Chief Executive Officer and Chief Financial Officer, believes that any internal controls and procedures for financial reporting, no matter how well conceived and operated, can provide only reasonable, not absolute, assurance that the objectives of the control system are met. Furthermore, the design of a control system must reflect the fact that there are resource constraints and the benefits of controls must be considered relative to their costs. Because of the inherent limitations in all control systems, they cannot provide absolute assurance that all control issues and instances of fraud, if any, within the Company have been prevented and/or detected. These inherent limitations include the realities that judgments in decision-making can be faulty and breakdowns can occur because of simple error or mistake. Additionally, controls can be circumvented by the individual acts of some persons, by collusion of two or more people, or by unauthorized override control. The design of any system of controls is also based in part upon certain assumptions about the likelihood of future events, and there can be no assurance that any design will succeed in achieving its stated goals under all potential future conditions. Accordingly, because of the inherent limitations in a cost effective control system, misstatements due to error or fraud may occur and not be detected.
The Company’s management, under the supervision of the Chief Executive Officer and the Chief Financial Officer, assessed the effectiveness of the Company’s internal control over financial reporting as at March 31, 2013. In making this assessment, it used the criteria set forth in the Internal Control-Integrated Framework issued by the Committee of Sponsoring Organizations of the Treadway Commission (COSO). Based on our assessment, management has concluded that, as at March 31, 2013, the Company’s internal control over financial reporting is effective based on those criteria.
The Company’s internal control over financial reporting as at December 31, 2012 has been audited by Deloitte LLP, Independent Registered Chartered Accountants who also audited the Company’s Consolidated Financial Statements for the year ended December 31, 2012. Deloitte LLP as stated in their report that immediately precedes the Company’s audited consolidated financial statements for the year ended December 31, 2012, expressed an unqualified opinion on the effectiveness of the Company’s internal control over financial reporting.
CHANGES IN INTERAL CONTROL OVER FINANCIAL REPORTING
There has been no change in the Company’s design of internal controls and procedures over financial reporting that has materially affected, or is reasonably likely to materially affect, the Company’s internal control over financial reporting during the period covered by this MD&A.
CAUTIONARY NOTES
CAUTIONARY NOTE TO U.S. READERS CONCERNING ESTIMATES OF MEASURED, INDICATED AND INFERRED MINERAL RESOURCES
Information concerning the properties and operations of New Gold has been prepared in accordance with Canadian standards under applicable Canadian securities laws, and may not be comparable to similar information for United States companies. The terms “Mineral Resource”, “Measured Mineral Resource”, “Indicated Mineral Resource” and “Inferred Mineral Resource” used in this MD&A are Canadian mining terms as defined in accordance with National Instrument 43-101 (“NI 43-101”) under guidelines set out in the Canadian Institute of Mining, Metallurgy and Petroleum (“CIM”) Standards on Mineral Resources and Mineral Reserves adopted by the CIM Council on December 11, 2005. While the terms “Mineral Resource”, “Measured Mineral Resource”, “Indicated Mineral Resource” and “Inferred Mineral Resource” are recognized and required by Canadian regulations, they are not defined terms under standards of the United States Securities and Exchange Commission. Under United States standards, mineralization may not be classified as a “Reserve” unless the determination has been made that the mineralization could be economically and legally produced or extracted at the time the Reserve calculation is made. As such, certain information contained in this MD&A concerning descriptions of mineralization and resources under Canadian standards is not comparable to similar information made public by United States companies subject to the reporting and disclosure requirements of the United States Securities and Exchange Commission. An “Inferred Mineral Resource” has a great amount of uncertainty as to its existence and as to its economic and legal feasibility. It cannot be assumed that all or any part of an “Inferred Mineral Resource” will ever be upgraded to a higher category. Under Canadian rules, estimates of Inferred Mineral Resources may not form the basis of feasibility or other pre-feasibility studies. Readers are cautioned not to assume that all or any part of Measured or Indicated Resources will ever be converted into Mineral Reserves. Readers are also cautioned not to assume that all or any part of an “Inferred Mineral Resource” exists, or is economically or legally mineable. In addition, the definitions of “Proven Mineral Reserves” and “Probable Mineral Reserves” under CIM standards differ in certain respects from the standards of the United States Securities and Exchange Commission.
35
CAUTIONARY NOTE REGARDING FORWARD-LOOKING STATEMENTS
Certain information contained in this MD&A, including any information relating to New Gold’s future financial or operating performance may be deemed “forward looking”. All statements in this MD&A, other than statements of historical fact, that address events or developments that New Gold expects to occur are “forward-looking statements”. Forward-looking statements are statements that are not historical facts and are generally, but not always, identified by the use of forward-looking terminology such as “plans”, “expects”, “is expected”, “budget”, “scheduled”, “estimates”, “forecasts”, “intends”, “anticipates”, “projects”, “potential”, “believes” or variations of such words and phrases or statements that certain actions, events or results “may”, “could”, “would”, “should”, “might” or “will be taken”, “occur” or “be achieved” or the negative connotation. All such forward-looking statements are based on the opinions and estimates of management as of the date such statements are made and are subject to important risk factors and uncertainties, many of which are beyond New Gold’s ability to control or predict. Forward-looking statements are necessarily based on estimates and assumptions that are inherently subject to known and unknown risks, uncertainties and other factors that may cause actual results, level of activity, performance or achievements to be materially different from those expressed or implied by such forward-looking statements. Such factors include, without limitation: significant capital requirements; fluctuations in the international currency markets and in the rates of exchange of the currencies of Canada, the United States, Australia, Mexico and Chile; price volatility in the spot and forward markets for commodities; impact of any hedging activities, including margin limits and margin calls; discrepancies between actual and estimated production, between actual and estimated Reserves and Resources and between actual and estimated metallurgical recoveries; changes in national and local government legislation in Canada, the United States, Australia, Mexico and Chile or any other country in which New Gold currently or may in the future carry on business; taxation; controls, regulations and political or economic developments in the countries in which New Gold does or may carry on business; the speculative nature of mineral exploration and development, including the risks of obtaining and maintaining the validity and enforceability of the necessary licenses and permits and complying with the permitting requirements of each jurisdiction in which New Gold operates, including, but not limited to: in Canada, obtaining the necessary permits for Blackwater; in Mexico; where Cerro San Pedro has a history of ongoing legal challenges related to our EIS; and Chile, where the courts have temporarily suspended the approval of the environmental permit for El Morro; the lack of certainty with respect to foreign legal systems, which may not be immune from the influence of political pressure, corruption or other factors that are inconsistent with the rule of law; the uncertainties inherent to current and future legal challenges New Gold is or may become a party to; diminishing quantities or grades of Reserves; competition; loss of key employees; additional funding requirements; actual results of current exploration or reclamation activities; uncertainties inherent to economic studies in respect of the PEA for Blackwater changes in project parameters as plans continue to be refined; accidents; labour disputes; defective title to mineral claims or property or contests over claims to mineral properties. In addition, there are risks and hazards associated with the business of mineral exploration, development and mining, including environmental events and hazards, industrial accidents, unusual or unexpected formations, pressures, cave-ins, flooding and gold bullion losses (and the risk of inadequate insurance or inability to obtain insurance to cover these risks) as well as “Risk Factors” included in New Gold’s disclosure documents filed on and available at www.sedar.com. Forward-looking statements are not guarantees of future performance, and actual results and future events could materially differ from those anticipated in such statements. All of the forward-looking statements contained in this MD&A are qualified by these cautionary statements. New Gold expressly disclaims any intention or obligation to update or revise any forward-looking statements whether as a result of new information, events or otherwise, except in accordance with applicable securities laws.
TECHNICAL INFORMATION
The scientific and technical information contained in this MD&A has been reviewed and approved by Mark Petersen, a Qualified Person under NI 43-101 and an officer of New Gold.
This note regarding the PEA on Blackwater is in addition to cautionary language already included in this MD&A as required under NI 43-101. This MD&A includes information on Blackwater, which was outlined in the PEA Technical Report filed on October 10, 2012. New Gold has, since the date of the PEA, completed non-material updates of the mineral resource estimate for Blackwater. Although the PEA represents useful, accurate and reliable information based on the information available at the time of its publication, and provides an important indicator as to the economic potential of Blackwater, the PEA is based on Mineral Resources estimates with an effective date of July 27, 2012, which do not reflect drilling conducted since their effective date, and the PEA does not reflect the latest Mineral Resource estimate discussed in this MD&A. Certain assumptions used in the PEA, some of which relate to the July 27, 2012 Mineral Resource estimate, may have changed from those used for the new Resource estimate, causing a variation of parametres. Moreover, the updated Mineral Resource estimate may impact how New Gold intends to develop the deposit, including pit outlines, production rates and mine life.
The estimates of Mineral Reserves and Mineral Resources discussed in this MD&A may be materially affected by environmental, permitting, legal, title, taxation, sociopolitical, marketing and other relevant issues. In addition to our February 5, 2013 and April 4, 2013 news releases, further details regarding Mineral Reserve and Resource estimates, classification and reporting parametres for each of New Gold's mineral properties are provided in the respective NI 43-101 Technical Reports, which are available at www.sedar.com.
36