Exhibit 99.2

OPERATIONAL AND FINANCIAL HIGHLIGHTS
OPERATIONAL HIGHLIGHTS
All dollar figures are in United States dollars and tabular dollar amounts are in millions, unless otherwise noted.
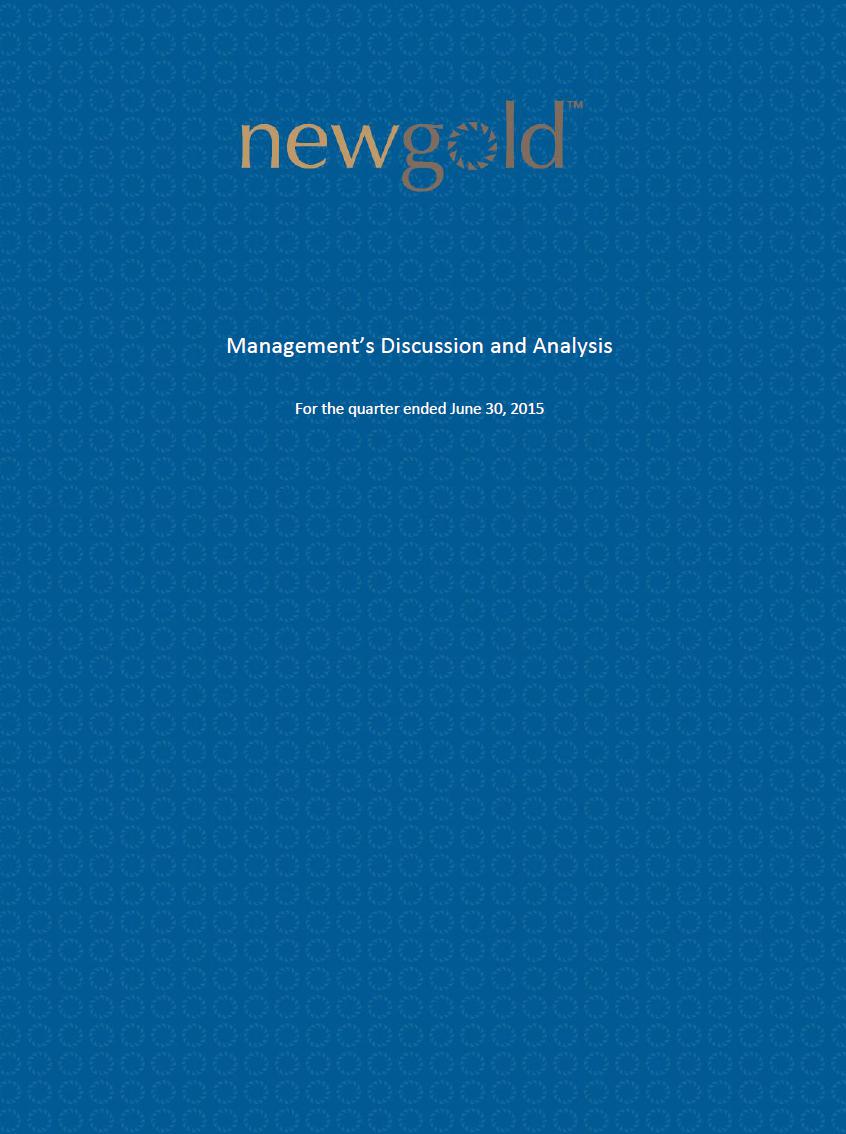
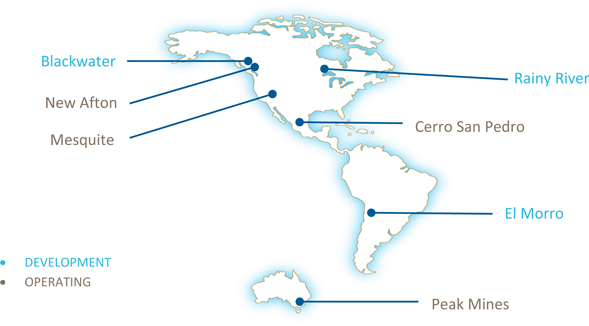
New Gold Inc. (“New Gold” or the “Company”) is an intermediate gold producer with operating mines in Canada, the United States, Australia and Mexico and development projects in Canada and Chile. For the six months ended June 30, 2015, the New Afton Mine in Canada (“New Afton”), the Mesquite Mine in the United States (“Mesquite”), Peak Mines in Australia (“Peak Mines”) and the Cerro San Pedro Mine in Mexico (“Cerro San Pedro”) combined to produce 181,419 gold ounces, 46.6 million pounds of copper and 0.8 million silver ounces, continuing the Company’s solid start to the year. During the second quarter of 2015 the Company’s mine sites produced 86,442 gold ounces, 23.6 million pounds of copper and 0.4 million silver ounces.
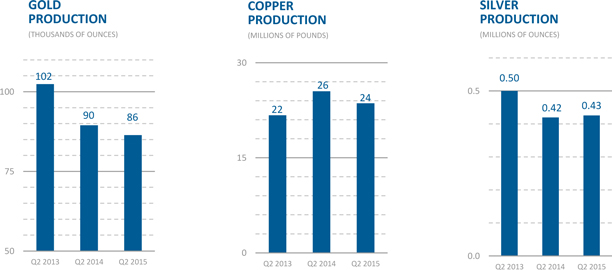
New Gold’s production costs remained competitive compared to the broader gold mining space as New Gold had total cash costs(1) of $410 per gold ounce sold and all-in sustaining costs(1) of $922 per gold ounce sold in the second quarter of 2015.We believe New Gold continues to further establish itself as one of the lowest cost producers in the industry.
| 1 | WWW.NEWGOLD.COM TSX:NGD NYSE MKT:NGD |
 |
FINANCIAL HIGHLIGHTS
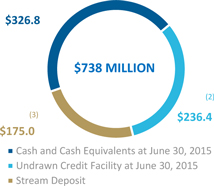
New Gold maintains a strong liquidity position with total liquidity of $563.2 million as of June 30, 2015 comprised of $327 million in cash and cash equivalents and $236 million available for drawdown under the Company’s $300 million revolving credit facility. In addition, on July 20, 2015 New Gold entered into a stream agreement to receive $175 million of proceeds, payable in two installments, which will be used for the ongoing development of the Rainy River project.
|  |
| 1. | The Company uses certain non-GAAP financial performance measures throughout this Management’s Discussion & Analysis (“MD&A”). For a detailed description of each of the non-GAAP measures used in the MD&A and a detailed reconciliation, please refer to the “Non-GAAP Financial Performance Measures” section of the MD&A. |
| 2. | Of the $300 million credit facility, $63.6 million is utilized for letters of credit as at June 30, 2015. |
| 3. | Assumes both installments are paid. The first installment of $100 million was paid to New Gold on July 20th and payment for the second installment is subject to certain conditions. Refer to the “Corporate Development” section of this MD&A for more information. |
| 4. | Net cash from operations and net cash generated from operations before working capital changes in Q2 2013 excludes $65.7 million paid to settle gold hedge contracts. |
| Three months ended June 30 | Six months ended June 30 | |||
| (in millions of U.S. dollars, except where noted) | 2015 | 2014 | 2015 | 2014 |
| Operating information | ||||
| Gold production (ounces) | 86,442 | 89,460 | 181,419 | 180,777 |
| Gold sales (ounces) | 87,754 | 84,736 | 180,152 | 178,788 |
| Average realized price ($/ounce)(1) | $1,191 | $1,304 | $1,210 | $1,306 |
| Total cash costs per gold ounce sold ($/ounce)(1) | $410 | $251 | $449 | $253 |
| All-in sustaining costs per gold ounce sold ($/ounce)(1) | $922 | $745 | $969 | $707 |
| Financial Information | ||||
| Revenues | $167.7 | $178.1 | $336.6 | $368.6 |
| Net earnings (loss) | 9.4 | 16.2 | (34.4) | 14.4 |
| Adjusted net (loss) earnings(1) | (1.3) | 8.2 | (6.4) | 26.4 |
| Net cash generated from operations | 56.9 | 59.3 | 126.7 | 140.7 |
| Net cash generated from operations before changes in non-cash working capital(1) | 62.7 | 71.9 | 130.1 | 162.0 |
| Cash and cash equivalents | 326.8 | 414.0 | 326.8 | 414.0 |
| Capital expenditures | 73.9 | 60.3 | 143.1 | 116.9 |
| Share Data | ||||
| Earnings (loss) per basic share ($) | 0.02 | 0.03 | (0.07) | 0.03 |
| Adjusted net (loss) earnings per basic share(1) ($) | (0.00) | 0.02 | (0.01) | 0.05 |
| 2 | WWW.NEWGOLD.COM TSX:NGD NYSE MKT:NGD |
|
Contents
| OPERATIONAL HIGHLIGHTS | 1 |
| FINANCIAL HIGHLIGHTS | 2 |
| OUR BUSINESS | 4 |
| OPERATING AND FINANCIAL HIGHLIGHTS | 5 |
| CORPORATE DEVELOPMENTS | 9 |
| CORPORATE SOCIAL RESPONSIBILITY | 10 |
| OUTLOOK FOR 2015 | 11 |
| KEY PERFORMANCE DRIVERS | 12 |
| FINANCIAL RESULTS | 15 |
| REVIEW OF OPERATING MINES | 22 |
| DEVELOPMENT AND EXPLORATION REVIEW | 34 |
| FINANCIAL CONDITION REVIEW | 38 |
| NON-GAAP FINANCIAL PERFORMANCE MEASURES | 45 |
| ENTERPRISE RISK MANAGEMENT | 55 |
| CRITICAL JUDGMENTS AND ESTIMATION UNCERTAINTIES | 63 |
| CONTROLS AND PROCEDURES | 67 |
| CAUTIONARY NOTES | 68 |
| 3 | WWW.NEWGOLD.COM TSX:NGD NYSE MKT:NGD |
|
MANAGEMENT’S DISCUSSION AND ANALYSIS
For the three and six months ended June 30, 2015
The following Management’s Discussion and Analysis (“MD&A”) provides information that management believes is relevant to an assessment and understanding of the consolidated financial condition and results of operations of New Gold Inc. and its subsidiaries (“New Gold” or the “Company”). This MD&A should be read in conjunction with New Gold’s unaudited condensed consolidated financial statements for the three and six months ended June 30, 2015 and 2014 and related notes which are prepared in accordance with International Financial Reporting Standards (“IFRS”) as issued by the International Accounting Standards Board (“IASB”). The MD&A should also be read in conjunction with our audited annual financial statements for the year ended December 31, 2014 and the related Management’s Discussion and Analysis. This MD&A contains forward-looking statements that are subject to risks and uncertainties, as discussed in a cautionary note contained in this MD&A. The reader is cautioned not to place undue reliance on forward-looking statements. This MD&A has been prepared as at July 28, 2015. Additional information relating to the Company, including the Company’s Annual Information Form, is available on SEDAR at www.sedar.com.
OUR BUSINESS
New Gold is an intermediate gold producer with operating mines in Canada, the United States, Australia and Mexico and development projects in Canada and Chile. The Company’s principal operating assets consist of the New Afton gold-copper mine in Canada, the Mesquite gold mine in the United States, the Peak Mines gold-copper mine in Australia and the Cerro San Pedro gold-silver mine in Mexico. In addition, New Gold’s principal development projects are its 100% owned Rainy River (“Rainy River”) and Blackwater (“Blackwater”) projects, both in Canada. New Gold also owns 30% of the El Morro (“El Morro”) project in Chile.
New Gold’s operating portfolio is diverse both geographically and in the range of commodities that its operations produce. The assets produce gold with copper and silver by-products at total cash costs and all-in sustaining costs below the industry average. With a strong liquidity position, a simplified balance sheet and an experienced management and Board of Directors, the Company has a solid platform to continue to execute its growth strategy, both organically and through value-enhancing accretive acquisitions, to further establish itself as an industry leading intermediate gold producer.
| 4 | WWW.NEWGOLD.COM TSX:NGD NYSE MKT:NGD |
|
OPERATING AND FINANCIAL HIGHLIGHTS
OPERATING HIGHLIGHTS
| Three months ended June 30 | Six months ended June 30 | |||
| (in millions of U.S. dollars, except where noted) | 2015 | 2014 | 2015 | 2014 |
| Operating information | ||||
| Gold (ounces): | ||||
| Produced(1) | 86,442 | 89,460 | 181,419 | 180,777 |
| Sold(1) | 87,754 | 84,736 | 180,152 | 178,788 |
| Silver (millions of ounces): | ||||
| Produced(1) | 0.4 | 0.4 | 0.8 | 0.8 |
| Sold(1) | 0.4 | 0.4 | 0.8 | 0.8 |
| Copper (millions of pounds): | ||||
| Produced(1) | 23.6 | 25.5 | 46.6 | 51.4 |
| Sold(1) | 23.7 | 24.3 | 45.8 | 49.4 |
| Average realized price(2): | ||||
| Gold ($/ounce) | 1,191 | 1,304 | 1,210 | 1,306 |
| Silver ($/ounce) | 16.23 | 19.53 | 16.41 | 19.97 |
| Copper ($/pound) | 2.72 | 3.09 | 2.66 | 3.03 |
| Total cash costs per gold ounce sold(2)(3) | 410 | 251 | 449 | 253 |
| All-in sustaining costs per gold ounce sold (2)(3) | 922 | 745 | 969 | 707 |
Total cash costs per gold ounce sold on a co-product basis (2)(3) | 704 | 682 | 717 | 670 |
All-in sustaining costs per gold ounce sold on a co-product basis(2)(3) | 1,007 | 974 | 1,038 | 935 |
| 1. | Production is shown on a total contained basis while sales are shown on a net payable basis, including final product inventory and smelter payable adjustments, where applicable. |
| 2. | The Company uses certain non-GAAP financial performance measures throughout this MD&A. Average realized price, total cash costs and all-in sustaining costs per gold ounce sold and total cash costs and all-in sustaining costs on a co-product basis are non-GAAP financial performance measures with no standard meaning under IFRS. For further information and a detailed reconciliation, please refer to the “Non-GAAP Financial Performance Measures” section of this MD&A. |
| 3. | The calculation of total cash costs and all-in sustaining costs per gold ounce sold is net of by-product silver and copper revenues. Total cash costs and all-in sustaining costs on a co-product basis remove the impact of other metal sales that are produced as a by-product of our gold production and apportions the cash costs to each metal produced on a percentage of revenue basis. If silver and copper revenues were treated as co-products, co-product total cash costs for the three months ended June 30, 2015 would be $9.37per silver ounce (2014 – $9.92) and $1.76per pound of copper (2014 -$1.75) and co-product all-in sustaining costs for the three months ended June 30, 2015 would be $13.51per silver ounce (2014 - $14.29) and $2.45per pound of copper (2014 - $2.44). For the six months ended June 30, 2015 co-product total cash costs would be $9.54per silver ounce (2014 - $9.98) and $1.72per pound of copper (2014 - $1.69) and co-product all-in sustaining costs for the six months ended June 30, 2015 would be $13.90per silver ounce (2014 -$14.04) and $2.43per pound of copper (2014 - $2.31). |
| 5 | WWW.NEWGOLD.COM TSX:NGD NYSE MKT:NGD |
|
Gold production for thesecond quarter of 2015 was slightly below that of the prior-year period with 86,442 gold ounces produced compared to 89,460 ounces. The slight decline in quarterly gold production was primarily attributable to lower production from the Peak Mines, the impact of which was partially offset by increased production at both Mesquite and Cerro San Pedro.Production increases at Mesquite were driven by the combination of a 78% increase in ore tonnes mined and placed on the leach pad as well as faster process recoveries resulting from the leach pad expansion being commissioned during the second quarter. Production at Cerro San Pedro benefitted from a significant increase in ore tonnes mined and placed on the leach pad coupled with higher gold grade as Cerro San Pedro is fully in Phase 5 ore. Production at New Afton remained in line with the prior-year period as a planned increase in throughput offset the impact of lower gold grade and recovery. Lower production at Peak Mines was due to the combined impact of lower tonnes processed as well as lower gold grade and recovery, arising from the previously disclosed geotechnical challenges in the main stoping area of the Perseverance ore body.
Despite the challenges at Peak and the focus on waste stripping at Mesquite during the first half of 2015, production for the six months ended June 30, 2015 remained consistent with the prior-year period with 181,419 gold ounces produced compared to production of 180,777 gold ounces in the prior-year period. The second quarter of 2015, production during the first six months ended June 30, 2015 was positively impacted by the increase in ore tonnes mined at Mesquite and Cerro San Pedro. New Afton had a moderate decrease in production for the first six months of 2015 compared to the prior-year period due to the combination of lower gold grade and first quarter recovery which was only partially offset by higher throughput. During the second quarter of 2015, New Afton’s mill expansion project progressed towards full capacity resulting in increased recoveries compared to the first quarter of 2015. Factors contributing to lower production at Peak Mines for the first six months of 2015 were consistent with those during the second quarter of 2015.
Gold sales for the second quarter of 2015 were 87,754 ounces, compared to 84,736 ounces in the prior-year period.In the six months ended June 30, 2015 180,152 ounces of gold were sold compared to 178,788 ounces in the prior-year period.
Copper production for the second quarter of 2015 was 23.6 million pounds compared to 25.5 million pounds in the prior-year period.At New Afton, additional throughput partially offset a decrease in copper grade, while copper recovery remained consistent. Copper recoveries increased as the mill expansion progressed towards full capacity during the second quarter of 2015. At Peak Mines, lower copper production was primarily due to lower throughput. Copper production at Peak Mines for thesix months ended June 30, 2015 was 46.6 million pounds compared to 51.4 million pounds produced in the prior-year period.
Copper sales were 23.7 million pounds for the second quarter of 2015 compared to 24.3 million pounds in the prior-year period. Copper sales volumes were lower than the prior-year period primarily due to lower production. Copper sales were 45.8 million pounds for the six months ended June 30, 2015 compared to 49.4 million pounds in the prior-year period.
Silver production in the second quarter of 2015 was 0.4 million ounces, consistent with the prior-year period production of 0.4 million ounces. Silver production for the six months ended June 30, 2015 was 0.8 million ounces consistent with prior year production of 0.8 million ounces.
Total cash costs per gold ounce sold for the second quarter of 2015, net of by-product sales, were $410 per ounce compared to $251 per ounce in the prior-year period. The increase in cash costs was primarily driven by lower copper by-product revenue from lower average realized copper prices, lower copper sales volumes and rehabilitation costs due to the impacted area of the Perseverance ore body at Peak Mines. These negative impacts to cash costs were partially offset by weakening foreign currency exchange rates in certain jurisdictions where the Company operates, relative to the U.S. dollar.Total cash costs per gold ounce sold, net of by-product sales, were $449 per ounce for the six months ended June 30, 2015, compared to $253 per ounce in the prior-year period.
| 6 | WWW.NEWGOLD.COM TSX:NGD NYSE MKT:NGD |
|
All-in sustaining costs per gold ounce sold for the second quarter of 2015 were $922 per ounce compared to $745 per ounce in the prior-year period.In addition to the increase in total cash costs the increase was primarily due to the planned waste stripping at Mesquite, which was completed during the second quarter of 2015 and will provide improved access to ore in the second half of 2015 through 2016. Partially offsetting the increase was a decrease in corporate administration and exploration expenses. All-in sustaining costs per gold ounce sold were $969 per ounce for the six months ended June 30, 2015, compared to $707 per ounce in the prior-year period.
FINANCIAL HIGHLIGHTS
| Three months ended June 30 | Six months ended June 30 | |||
| (in millions of U.S. dollars, except where noted) | 2015 | 2014 | 2015 | 2014 |
| FINANCIAL INFORMATION | ||||
| Revenues | 167.7 | 178.1 | 336.6 | 368.6 |
| Operating margin(1) | 69.5 | 82.8 | 138.8 | 174.8 |
| Earnings from mine operations | 18.6 | 30.1 | 32.8 | 70.5 |
| Net earnings (loss) | 9.4 | 16.2 | (34.4) | 14.4 |
| Adjusted net (loss) earnings(1) | (1.3) | 8.2 | (6.4) | 26.4 |
| Net cash generated from operations | 56.9 | 59.3 | 126.7 | 140.7 |
| Net cash generated from operations before changes in non-cash operating working capital(1) | 62.7 | 71.9 | 130.1 | 162.0 |
| Sustaining capital expenditures | 35.7 | 26.5 | 73.5 | 54.1 |
| Growth capital expenditures | 38.2 | 33.8 | 69.6 | 62.8 |
| Total assets | 3,910.5 | 4,279.4 | 3,910.5 | 4,279.4 |
| Cash and cash equivalents | 326.8 | 414.0 | 326.8 | 414.0 |
| Long-term debt | 879.3 | 870.5 | 879.3 | 870.5 |
| Share Data | ||||
| Earnings (loss) per share: | ||||
| Basic ($) | 0.02 | 0.03 | (0.07) | 0.03 |
| Diluted ($) | 0.02 | 0.03 | (0.07) | 0.03 |
| Adjusted net (loss) earnings per basic share ($)(1) | (0.00) | 0.02 | (0.01) | 0.05 |
| Share price as at June 30 (TSX – Canadian dollars) | 3.35 | 6.77 | 3.35 | 6.77 |
| Weighted average outstanding shares (basic) (millions) | 509.1 | 503.8 | 508.8 | 503.6 |
| 1. | The Company uses certain non-GAAP financial performance measures throughout this MD&A. Operating margin, adjusted net (loss) earnings, adjusted net (loss) earnings per basic share and net cash generated from operations before changes in non-cash operating working capital are non-GAAP financial performance measures with no standard meaning under IFRS. For further information and a detailed reconciliation, please refer to the “Non-GAAP Financial Performance Measures” section of this MD&A. |
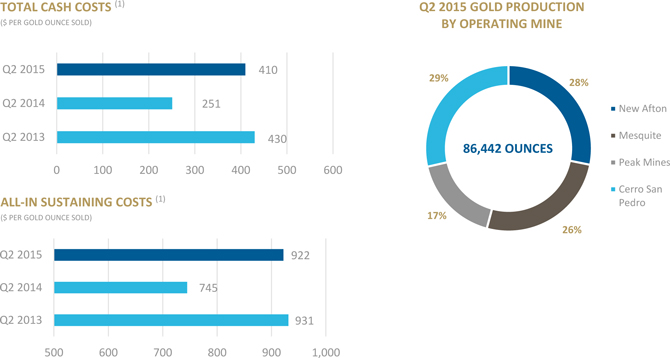
Revenue was $167.7 million for the second quarter of 2015, compared to $178.1 million in the prior-year period. The benefit from increased gold sales was offset by lower copper sales as well as lower average realized commodity prices compared to the prior-year period for all metals. The average realized prices for the second quarter of 2015 were $1,191 per gold ounce, $2.72 per pound of copper and $16.23 per silver ounce, compared to $1,304 per gold ounce, $3.09 per pound of copper and $19.53 per silver ounce in the prior-year period.
Revenue was $336.6 million for the six months ended June 30, 2015, compared to $368.6 million in the prior-year period.Revenues were impacted by the combination of lower realized metal prices and copper sales volumes which was only partially offset by higher gold sales volumes relative to the prior-year period.The average realized prices for the six months ended June 30, 2015 were $1,210 per gold ounce, $2.66 per pound of copper and $16.41 per silver ounce, compared to $1,306 per gold ounce, $3.03 per pound of copper and $19.97 per silver ounce in the prior-year period.
| 7 | WWW.NEWGOLD.COM TSX:NGD NYSE MKT:NGD |
|
Earnings from mine operations were $18.6 million for the second quarter of 2015, compared to $30.1 million in the prior-year period. The decrease in earnings from mine operations was attributed primarily to lower revenues. The Company’s production costs (operating expenses before change in inventory and work-in-progress) have decreased to $107.5 million from $109.2 million in the prior-year period. This decrease is despite a $3.1 million increase in operating leases compared to the prior-year period as stripping costs related to the development of Phase 5 at Cerro San Pedro were capitalized. The increased mining activity at each of New Afton, Mesquite and Peak Mines, were offset by the combined benefit of the depreciation of the Canadian and Australian dollars relative to the U.S. dollar. Depreciation and depletion was in line with the prior-year period.
Earnings from mine operations were $32.8 million for the six months ended June 30, 2015, compared to $70.5 million in the prior-year period and, consistent with the second quarter of 2015, the decrease in earnings from mine operations was attributed primarily to lower revenues. This was partially offset by a reduction in the Company’s production costs (operating expenses before change in inventory and work-in-progress) which have decreased to $202.2 million from $206.7 million in the prior-year period. This decrease is despite a $9.3 million increase in operating leases compared to the prior-year period as stripping costs related to the development of Phase 5 at Cerro San Pedro were capitalized. The increased mining activity at each of New Afton, Mesquite and Peak Mines, were offset by the combined benefit of the depreciation of the Canadian and Australian dollars relative to the U.S. dollar.
Net earnings were $9.4 million or $0.02 per basic share for the second quarter of 2015, compared to $16.2 million or $0.03 per basic share in the prior-year period. Net earnings were impacted by the change in earnings from mine operations as noted above and the impact of items included in non-operating “Other gains and losses”, where a gain of $10.5 million was recorded for the second quarter of 2015, compared to a gain of $8.5 million in the prior-year period.
Other gains and losses include a foreign exchange gain of $4.2 million in the second quarter of 2015 and a foreign exchange loss of $31.8 million in the six months ended June 30, 2015. Additionally, the Company had unrealized gains of $7.0 million and $11.5 million for the three and six months ended June 30, 2015 on the mark-to-market of share purchase warrants. The increase in finance costs in the period was attributable to the reduction in capitalized interest allocated to development projects. These costs were partly offset by lower exploration and corporate administrative costs. The Company’s net loss for the six months ended June 30, 2015 was $34.4 million or $0.07 per basic share, compared to net earnings of $14.4 million or $0.03 per basic share in the prior-year period.
The adjusted loss for the second quarter of 2015 was $1.3 million or $0.00 per basic share, compared to adjusted net earnings of $8.2 million or $0.02 per basic share in the prior-year period. Adjusted net loss was impacted by the change in earnings from mine operations, as noted above, and increased finance costs as capitalized interest is no longer applied to the Blackwater project. These changes were partly offset by decreased corporate administration and exploration costs. Adjusted net loss for the six months ended June 30, 2015 was $6.4 million or $0.01 per basic share, compared to adjusted net earnings of $26.4 million or $0.05 per basic share in the prior-year period.
Net cash generated from operations for the second quarter of 2015 was $56.9 million, consistent with the prior-year period of $59.3 million. The negative impact to cash flow due to lower metal prices was partially offset by a decrease in corporate administration and exploration and business development expenses, a decrease in cash taxes paid and the collection of value-added tax receivables at Cerro San Pedro. Net cash generated from operations for the six months ended June 30, 2015 was $126.7 million compared to $140.7 million in the prior-year period.
| 8 | WWW.NEWGOLD.COM TSX:NGD NYSE MKT:NGD |
|
Cash and cash equivalents were $326.8 million as at June 30, 2015 compared to $370.5 million as at December 31, 2014.Net cash generated from operations in the period of $126.7 million was offset by cash used in investing activities of $141.7 million (which includes $73.4 million of sustaining capital expenditure and $69.7 million of growth capital expenditure), cash used by financing activities of $26.0 million and $2.7 million from the impact of foreign exchange on cash and cash equivalents.
On July 20th, the company announced that it entered into a $175 million streaming transaction with RGLD Gold AG, a wholly-owned subsidiary of Royal Gold Inc. (“Royal Gold”), which provides New Gold with further financial flexibility. Under the terms of the agreement, Royal Gold will provide New Gold with a deposit of $175 million, to be used for the ongoing development of the Company’s Rainy River project, in exchange for a percentage of the annual gold and silver production from the project. Royal Gold paid the first $100 million of the deposit concurrent with the entering into the transaction. The remaining $75 million will be paid when 60% of the estimated Rainy River project development capital has been spent (subject to customary conditions precedent), which is expected to be by mid-2016.
CORPORATE DEVELOPMENTS
New Gold’s strategy is to continue strong operational execution at its current assets while pursuing disciplined growth both through organic initiatives and value-enhancing mergers and acquisitions. Since the middle of 2009, New Gold has successfully enhanced the value of its portfolio of assets, while also continually looking for compelling external growth opportunities. The Company continues to evaluate assets in favourable jurisdictions where the asset has the potential to provide New Gold shareholders with meaningful gold production, cash flow and exploration potential, while ensuring that any potential acquisition is accretive on key per share metrics. The Company strives to maintain a strong financial position while continually reviewing strategic alternatives with the view of maximizing shareholder value. New Gold’s objective is to pursue corporate development initiatives that will leave the Company and its shareholders in a fundamentally stronger position.
On July 20, 2015 New Gold announced that that Company has entered into a $175 million streaming agreement with Royal Gold. Under the terms of the agreement, Royal Gold will provide New Gold with a deposit of $175 million, to be used for the ongoing development of the Company’s Rainy River project, in exchange for a percentage of the annual gold and silver production from the project.
Streaming agreement Highlights Include: Upfront Deposit · Royal Gold to provide New Gold with a $175 million deposit for the development of the company’s o $100 million paid at signing with the remaining $75 million to be paid when 60% of the Project development capital has been spent (subject to customary conditions precedent); expected to be by mid-2016 Gold and Silver Stream Percentage · New Gold to deliver 6.50% of the Project’s gold production up to a total of 230,000 ounces of gold, and 3.25% of the Project’s gold production thereafter · New Gold to deliver 60% of the Project’s silver production up to a total of 3.1 million ounces of silver, and 30% of the Project’s silver production thereafter Ongoing Cash Purchase Price · In addition to the upfront deposit, Royal Gold to pay 25% of the spot gold or silver price at the time each ounce of gold or silver is delivered under the stream |
The gold and silver stream will cover future production from New Gold’s current Rainy River land package, plus an additional two-kilometre area of interest, but excluding any potential future mineralization discovered on New Gold’s Offlake exploration claims located to the northeast of the Rainy River deposit.
| 9 | WWW.NEWGOLD.COM TSX:NGD NYSE MKT:NGD |
|
The completion of the transaction provides New Gold with a further $175 million of financial flexibility which supplements the combined liquidity already available to the company from its current cash balance, future free cash flow generation from its four operations and the amount available under New Gold’s revolving credit facility.
New Gold’s June 30, 2015 cash balance of $326.8 million together with Royal Gold’s full $175.0 million deposit and the amount available for drawdown under New Gold’s revolving credit facility provide the Company with approximately $738 million of liquidity relative to Rainy River’s remaining project development capital of approximately $760 million.
CORPORATE SOCIAL RESPONSIBILITY
New Gold is committed to excellence in corporate social responsibility. The Company considers its ability to make a lasting and positive contribution toward sustainable development a key driver to achieving a productive and profitable business. New Gold aims to achieve these objectives through the protection of the health and well-being of its people and host communities as well as industry leading practices in the areas of environmental stewardship and community engagement and development. The Company is proud to have been listed in the Maclean’s/Sustainalytics – Top 50 Socially Responsible Corporations in Canada and in the “Future 40 Most Responsible Corporate Leaders in Canada” by Corporate Knights for the second consecutive year.
As a participant and supporter of the United Nations Global Compact, New Gold’s policies and practices are guided by its principles with reference to human rights, labour, environmental stewardship and anti-corruption. As a member of the Mining Association of Canada (“MAC”), New Gold’s operations adopt the MAC’s Towards Sustainable Mining protocols.
New Gold’s corporate social responsibility objectives include promoting and protecting the welfare of its employees through safety-first work practices, upholding fair employment practices and encouraging a diverse workforce, where people are treated with respect and are supported to realize their full potential. New Gold believes that its people are its most valued assets. The Company strives to create a culture of inclusiveness that begins at the top and is reflected in its hiring, promotion and overall human resources practices. New Gold encourages tolerance and acceptance in worker-to-worker relationships. In each of its host communities, the Company strives to be an employer of choice through the provision of competitive wages and benefits, and through the implementation of policies of recognizing and rewarding employee performance and promoting from within wherever possible.
The Company is committed to preserving the long-term health and viability of the natural environments that host its operations. Wherever New Gold operates – in all stages of mining activity, from early exploration and planning, to commercial mining operations through to eventual closure – the Company is committed to excellence in environmental management. From the earliest site investigations, New Gold carries out comprehensive environmental studies to establish baseline measurements for flora, fauna, earth, air and water. During operations the Company promotes the efficient use of raw materials and resources, work to minimize environmental impacts and maintain robust monitoring programs. After mining activities are complete, New Gold’s objective is to restore the land to a level of productivity equivalent to its pre-mining capacity or to an alternative land use determined through consultation with local stakeholders.
| 10 | WWW.NEWGOLD.COM TSX:NGD NYSE MKT:NGD |
|
New Gold is committed to establishing relationships based on mutual benefit and active participation with its host communities to contribute to healthy and sustainable communities. Wherever the Company’s operations interact with Indigenous peoples, New Gold promotes understanding of, and respect for traditional values, customs and culture and takes meaningful action to consider their interests through collaborative agreements aimed at creating jobs, training and lasting socio-economic benefits. New Gold aims to foster open communication with local residents and community leaders and strive to partner in the long-term sustainability of those communities. The Company believes that by thoroughly understanding the people, their histories, and their needs and aspirations, we can engage in a meaningful and sustainable development process.
Environmental and community Highlights for Q2 2015
· A peer audit of the New Gold Environmental Standards was carried out at Cerro San Pedro which was found to be in line with its peers. · Cerro San Pedro completed the first cohort of the local economic development program to promote small businesses in partnership with the Monterrey Institute of Technology and Higher Education. The program included 24 weekly sessions for 35 participants from local communities as well as employees of Cerro San Pedro. · As part of the Responsible Closure Program at Cerro San Pedro, employees of the mine undertook computer literacy and automotive mechanics training. · New Afton completed its tree-planting program with youth from Skeetchestn Indian Band. · Mesquite presented three training sessions at San Diego State University’s local campus designed to assist local small business owners to improve business practices, enhance long term business vitality and profitability. · New Gold approved its ESR Strategic Plan 2016-2020. |
OUTLOOK FOR 2015
Consistent with the Company’s February 2015 guidance for the year, production of all metals was planned to be weighted to the second half of 2015. Based on the Company’s solid production through the first six months of the year, led by Mesquite and Cerro San Pedro, full-year gold production has the potential to be towards the high end of the original guidance range of 390,000 to 430,000 ounces. At the same time, consolidated copper production may be at the low end of the guidance range of 100 to 112 million pounds and consolidated silver production is expected to be within the original range of 1.75 to 1.95 million ounces.
New Gold’s 2015 cost guidance was for all-in sustaining costs of $745 to $785 per ounce, including total cash costs of $340 to $380 per ounce. The company’s cost guidance is based on assumptions of $2.75 per pound of copper and $16.00 per ounce of silver and foreign exchange rates for the Canadian dollar, Australian dollar and Mexican peso of $1.25, $1.25 and $15.00 to the U.S. dollar.
Looking forward, the Company’s all-in sustaining costs and total cash costs per ounce are expected to decrease as a result of the higher production in the second half of 2015. Year-to-date, the impact of the decrease in the copper price relative to the company’s guidance assumption of $2.75 per pound has been largely offset by the benefit associated with the continued deprecation of the Canadian and Australian dollars relative to the U.S. dollar. Beyond the continued potential for changes in the relative movements of the copper price and foreign exchange rates in the second half of 2015, New Gold’s full-year all-in sustaining costs and total cash costs per ounce may be impacted by two primary factors.
| 11 | WWW.NEWGOLD.COM TSX:NGD NYSE MKT:NGD |
|
Based on the Company’s guidance assumption of $2.75 per pound, a five million pound change in full-year copper production has the potential to impact costs by approximately $30 to $35 per ounce. At the same time, as a higher percentage of production is expected to be delivered by the Company’s open pit mines, all-in sustaining costs and total cash costs per ounce may be impacted by an additional $15 to $20 per ounce. As a result of these two factors, and despite the Company’s gross operating and sustaining capital expenditures being in line with guidance, the Company’s all-in sustaining costs and total cash costs per ounce may be approximately $50 per ounce above their guidance ranges.
KEY PERFORMANCE DRIVERS
There is a range of key performance drivers that are critical to the successful implementation of New Gold’s strategy and the achievement of its goals. The key internal drivers are production volumes and costs. The key external drivers are spot prices of gold, copper and silver, as well as foreign exchange rates.
Production Volumes and Costs
New Gold’s portfolio of operating mines produced 86,442 gold ounces during the second quarter of 2015 and 181,419 gold ounces for the six months ended June 30, 2015.
Total cash costs and all-in sustaining costs for the second quarter, net of by-product sales, were $410 and $922 per gold ounce sold, respectively. For the six months ended June 30, 2015 total cash costs and all-in sustaining costs, net of by-product sales, were $449 and $969 per gold ounce sold, respectively.
New Gold continues to deliver against guidance with respect to the key internal drivers.
Commodity Prices
Gold Prices
The price of gold is the largest single factor affecting New Gold’s profitability and operating cash flows. As such, the current and future financial performance of the Company is expected to be closely related to the prevailing price of gold.
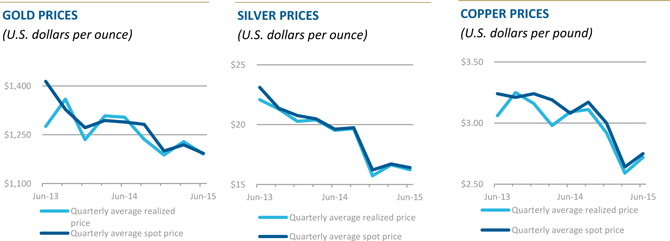
For the second quarter of 2015, New Gold achieved an average realized gold price of $1,191 per ounce compared to the London PM fix average gold price of $1,193 per ounce. For the six months ended June 30, 2015, New Gold achieved an average realized gold price of $1,210 per ounce compared to the London PM fix average gold price of $1,206 per ounce.
| 12 | WWW.NEWGOLD.COM TSX:NGD NYSE MKT:NGD |
|
The gold price has remained in a relatively narrow trading range for several months, but as interest rates remain low and the global economy continues to experience challenges, the fundamentals that support the gold price remain in place. As a lower cost producer, we believe New Gold is in a strong position to operate both in a low gold price environment and to take advantage of higher gold prices through our existing operations and growth projects.
Copper Prices
For the second quarter of 2015, New Gold’s average realized copper price was $2.72 per pound compared to the average London Metals Exchange copper price of $2.75 per pound. For the six months ended June 30, 2015, New Gold achieved an average realized copper price of $2.66 per pound compared to the average London Metals Exchange copper price of $2.69 per pound.
Silver Prices
For the second quarter of 2015, New Gold had an average realized silver price of $16.23 per ounce compared to an average London PM fix price of $16.41 per ounce. For the six months ended June 30, 2015, New Gold had an average realized silver price of $16.41 per ounce compared to an average London PM fix price of $16.56 per ounce.
Foreign Exchange Rates
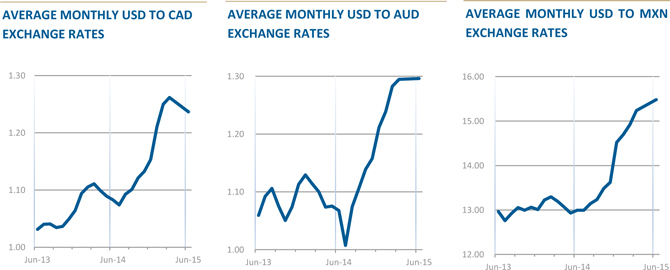
The Company operates in Canada, the United States, Australia, Mexico and Chile, while revenues are predominantly generated in U.S. dollars. As a result, the Company has foreign currency exposure with respect to costs not denominated in U.S. dollars. New Gold’s operating results and cash flows are influenced by changes in various exchange rates against the U.S. dollar. The Company has exposure to the Canadian dollar through New Afton, Rainy River and Blackwater, as well as through corporate administration costs. The Company also has exposure to the Australian dollar through Peak Mines, and to the Mexican peso through Cerro San Pedro.
The Canadian dollar strengthened against the U.S. dollar by approximately 1% in the second quarter of 2015 and weakened by approximately 11% during the six months ended June 30, 2015. A weaker Canadian dollar decreases costs in U.S. dollar terms at the Company’s Canadian operations, as well as capital costs at the Company’s Canadian development properties.
The Australian dollar weakened against the U.S. dollar by approximately 1% in the second quarter of 2015 and weakened by approximately 13% during the six months ended June 30, 2015 and. A weaker Australian dollar decreases costs in U.S. dollar terms at the Company’s Australian operation, Peak Mines.
| 13 | WWW.NEWGOLD.COM TSX:NGD NYSE MKT:NGD |
|
The Mexican peso weakened against the U.S. dollar by approximately 1% in the second quarter of 2015 and weakened by approximately 12% during the six months ended June 30, 2015 and. A significant portion of costs at Cerro San Pedro are incurred in U.S. dollars and, as such, the movement in the Mexican peso exchange rate is not significant driver of U.S.dollar-denominated costs.
For an analysis of the impact of foreign exchange fluctuations on operating costs during second quarter of 2015 and the six months ended June 30, 2015 relative to the prior-year periods, refer to the “Review of Operating Mines” sections for New Afton, Peak Mines and Cerro San Pedro for details.
Economic Outlook
The gold price declined by approximately 2% during the quarter. Economic headlines were dominated by the ongoing Greek crisis, although concerns were not sufficiently elevated to drive significant haven buying of gold. The strong U.S. dollar also acted as a headwind for commodities across the spectrum, and it is likely that gold has also been fulfilling its function as a source of liquidity for certain parties connected to the situation in Greece. Globally, despite continuing tentative signs of a U.S recovery, aggregate global inflation and interest rates are likely to remain low for the foreseeable future. As a low cost producer with a pipeline of development projects, New Gold believes it is particularly well positioned both to operate in a lower gold price environment and to take advantage of higher prices in the gold market.
Economic events can have significant effects on the price of gold, through currency rate fluctuations, the relative strength of the U.S. dollar, supply of and demand for gold, and macroeconomic factors such as interest rates and inflation expectations. Management anticipates that the long-term economic environment should provide support for precious metals and for gold in particular, and believes the prospects for the business are favourable. New Gold’s growth plan is focused on organic and acquisition-led growth, and the Company plans to remain flexible in the current environment to be able to respond to opportunities as they arise.
| 14 | WWW.NEWGOLD.COM TSX:NGD NYSE MKT:NGD |
|
FINANCIAL RESULTS
Summary of Quarterly Financial Results
RECONCILIATON OF SECOND QUARTER NET EARNINGS – 2014 TO 2015
(in millions of U.S. dollars)
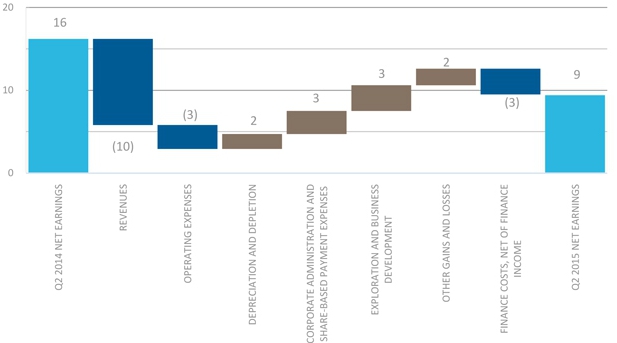
Revenue
Revenue was $167.7 million for the second quarter of 2015, compared to $178.1 million in the prior-year period. The benefit from increased gold sales was offset by lower copper sales as well as lower average realized commodity prices compared to the prior-year period. A detailed discussion of production is included in the “Operating Highlights” section of this MD&A. The average realized prices for the second quarter of 2015 were $1,191 per gold ounce, $2.72 per pound of copper and $16.23 per silver ounce, compared to $1,304 per gold ounce, $3.09 per pound of copper and $19.53 per silver ounce in the prior-year period.
Operating expenses
Operating expenses for the second quarter of 2015 were slightly higher than the the prior-year period at $98.2 million compared to $95.3 million, primarily driven by the reduction in amount credited to operating expenses for change in inventories and work-in-progress. The Company’s production costs (operating expenses before change in inventory and work-in-progress) have decreased to $107.5 million from $109.2 million in the prior-year period. This decrease is despite a $3.1 million increase in operating leases compared to the prior-year period as stripping costs related to the development of Phase 5 at Cerro San Pedro were capitalized. The increased mining activity at New Afton and Mesquite along with the rehabilitation work at Peak Mines, as the main stoping area of the Perseverance ore body experienced geotechnical challenges in March of 2015, were offset by the combined benefit of the depreciation of the Canadian and Australian dollars relative to the U.S. dollar. Rehabilitation at Peak Mines is scheduled to be substantially completed in the third quarter of 2015. Refer to the “Review of Operating Mines” section of this MD&A for more details.
Depreciation and depletion
Depreciation and depletion for the second quarter of 2015 was consistent with the prior-year period at $50.9 million compared to $52.7 million.
| 15 | WWW.NEWGOLD.COM TSX:NGD NYSE MKT:NGD |
|
Earnings from mine operations
Earnings from mine operations for the second quarter of 2015 were $18.6 million compared with $30.1 million in the prior-year period. The decrease in earnings from mine operations is attributed primarily to lower average realized commodity prices.
Corporate administration
Corporate administration costs were $5.5 million in the second quarter of 2015 compared to $7.9 million incurred in the prior-year period. These costs were positively impacted by the weaker Canadian dollar.
Share-based compensation
Share-based compensation costs were $1.9 million in the second quarter of 2015 compared to $2.3 million the prior-year period with the decrease representing a lower fair value for options granted.
Exploration and business development
Exploration and business development expense was $1.2 million in the second quarter of 2015 compared to $4.3 million for the prior-year period. The decrease is due to the Company receiving a refundable tax credit of $0.9 million at Blackwater related to the British Columbia Mining Exploration Tax Credit, reduced exploration activity at Blackwater compared to the prior-year period and timing of the infill drilling program at Mesquite. Expensed exploration in the current period was primarily incurred at Peak Mines and the Blackwater project. The prior-year period included expensed exploration costs at Mesquite, New Afton, Peak Mines and the Blackwater project.
Capitalized exploration costs were of $0.4 million in the second quarter of 2015 compared to $5.1 million in the prior-year period. Capitalized exploration was incurred at Rainy River and Peak Mines in the current period and Rainy River, Peak Mines and New Afton in the prior-year period.
Other gains and losses
The following other gains and losses are all added back for the purposes of adjusted net earnings:
Non-hedged derivatives
In the second quarter of 2015, the Company recorded a gain of $7.0 million related to the mark-to-market of the share purchase warrants. This compares to a loss of $7.1 million in the prior-year period. The Company’s functional currency is the U.S. dollar, however, the share purchase warrants are denominated in Canadian dollars and are therefore treated as a derivative liability under IFRS. As the traded value of the New Gold share purchase warrants increases or decreases, a related loss or gain on the mark-to-market of the liability is reflected in earnings.
Foreign exchange
In the second quarter of 2015, the Company recognized a foreign exchange gain of $4.2 million compared to a gain of $15.8 million in the prior-year period. The foreign exchange gain is primarily due to the Company recognizing a foreign exchange gain in relation to the tax basis of the non-monetary assets and liabilities denominated in currencies other than the U.S. dollar.
Income tax
Income and mining tax expense in the second quarter of 2015 was $0.9 million compared to $0.8 million in the prior-year period, reflecting an effective tax rate of 9% for the second quarter of 2015 compared to 5% in the prior-year period. The primary reason for a higher unadjusted effective tax rate is the impact of foreign exchange movements on the deferred tax related to non-monetary assets and liabilities that have no tax basis. In the second quarter of 2015 the Company recorded a foreign exchange recovery of $5.0 million on the deferred tax related to foreign exchange on non-monetary assets and liabilities as compared to $0.7 million in the same prior-year period with no associated tax impact. The effect on the tax rate is higher in the second quarter of 2015, primarily as a result of changes in foreign exchange rates.
| 16 | WWW.NEWGOLD.COM TSX:NGD NYSE MKT:NGD |
|
On an adjusted net earnings basis, the effective tax rate for the second quarter of 2015 was 68% compared to 47% in the prior-year period. The adjusted effective tax rate excludes the impact of foreign exchange, the hedge settlement in the prior-year period, and any associated changes in the recognition of deferred tax assets. The increased adjusted effective tax rate reflects the greater impact of permanent differences over lower adjusted net loss compared to higher net earnings in the prior period.
Net earnings
For the second quarter of 2015, New Gold had a net earnings of $9.4 million, or $0.02 per basic share compared with $16.2 million, or $0.03 per basic share in the prior-year period.
Adjusted net loss
For the second quarter of 2015, the adjusted net loss was $1.3 million or $0.00 per basic share, compared to adjusted net earnings of $8.2 million or $0.02 per basic share in the prior-year period.
RECONCILIATON OF SECOND QUARTER ADJUSTED NET LOSS – 2014 TO 2015
(in millions of U.S. dollars)
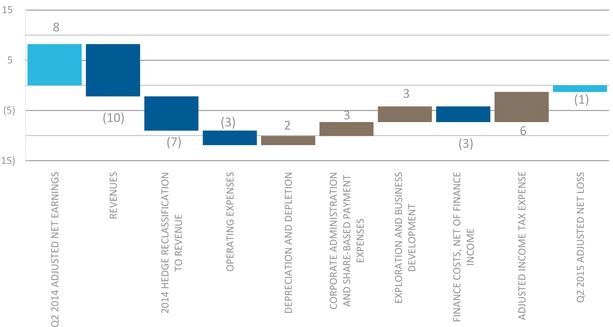
Net earnings have been adjusted, including the associated tax impact, for costs in “Other gains and losses” on the condensed consolidated income statement. Key entries in this grouping are: the fair value changes for share purchase warrants; foreign exchange gain or loss; and other non-recurring items. Net earnings is also adjusted for inventory net realizable value provisions. Other adjustments to net loss in the prior-year period include the non-cash loss incurred on the monetization of the Company’s legacy hedge position as it is realized into income over the original term of the hedge contract, which is included in revenue.
See “Non-GAAP Financial Performance Measures” for reconciliation of the net loss to adjusted net earnings.
| 17 | WWW.NEWGOLD.COM TSX:NGD NYSE MKT:NGD |
|
Key Quarterly Operating and Financial Information
Selected financial and operating information for the current and previous quarters is as follows:
| |||||||||
(in millions of U.S. dollars, except where noted) | Q2 2015 | Q1 2015 | Q4 2014 | Q3 2014 | Q2 2014 | Q1 2014 | Q4 2013 | Q3 2013 | Q2 2013 |
| Operating information | |||||||||
| Gold production (ounces) | 86,442 | 94,977 | 105,992 | 93,367 | 89,460 | 91,317 | 106,520 | 94,038 | 102,435 |
| Gold sales (ounces) | 87,754 | 92,398 | 104,224 | 88,168 | 84,736 | 94,052 | 104,523 | 94,082 | 98,037 |
| Revenues | 167.7 | 168.9 | 188.1 | 169.3 | 178.1 | 190.5 | 198.4 | 196.0 | 183.5 |
| Net earnings (loss) | 9.4 | (43.8) | (431.9) | (59.6) | 16.2 | (1.8) | (254.7) | 12.2 | 15.0 |
| Per share: | |||||||||
| Basic | 0.02 | (0.09) | (0.86) | (0.12) | 0.03 | 0.00 | (0.51) | 0.02 | 0.03 |
| Diluted | 0.02 | (0.09) | (0.86) | (0.12) | 0.03 | 0.00 | (0.51) | 0.02 | 0.03 |
| Adjusted net (loss) earnings | (1.3) | (4.9) | 13.4 | 5.4 | 8.2 | 18.2 | 16.7 | 20.0 | 4.3 |
| Per share: | |||||||||
| Basic | (0.00) | (0.01) | 0.03 | 0.01 | 0.02 | 0.04 | 0.04 | 0.04 | 0.01 |
| Diluted | (0.00) | (0.01) | 0.03 | 0.01 | 0.02 | 0.04 | 0.03 | 0.04 | 0.01 |
A detailed discussion of production is included in the “Operating Highlights” section of this MD&A.
Summary of Year to Date Financial Results
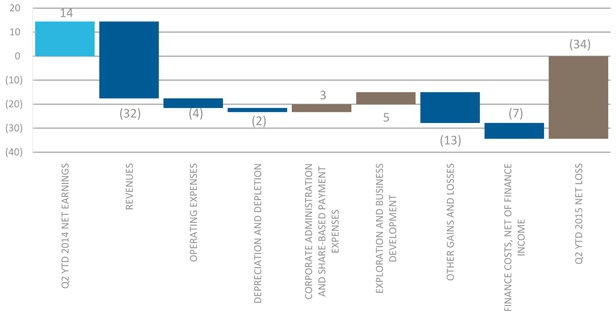
RECONCILIATON OF YEAR TO DATE NET LOSS – 2014 TO 2015
(in millions of U.S. dollars)
| 18 | WWW.NEWGOLD.COM TSX:NGD NYSE MKT:NGD |
|
Revenue
Revenue for the six months ended June 30, 2015 was $336.6 million compared to $368.6 million in the prior-year period. The decrease in revenue was primarily impacted by the decrease in commodity prices of all metals and lower copper sales volume, partially offset by an increase in gold sales volume. A detailed discussion of production is included in the “Operating Highlights” section of this MD&A. The average realized prices for the six months ended June 30, 2015 were $1,210 per gold ounce, $2.66 per pound of copper and $16.41 per silver ounce, compared to $1,306 per gold ounce, $3.03 per pound of copper and $19.97 per silver ounce in the prior-year period. Additionally, revenue in the prior-year period was impacted by the reclassification of the loss on the monetization of the hedge of $13.7 million.
Operating expenses
Operating expenses were $197.8 million in the six months ended June 30, 2015 compared to $193.8 million in the prior-year period. The Company’s operating expenses were slightly higher than the prior-year period, primarily driven by the reduction in amount credited to operating expenses for change in inventories and work-in-progress. The Company’s production costs (operating expenses before change in inventory and work-in-progress) have decreased to $202.2 million from $206.7 million in the prior-year period. This decrease is despite a $3.1 million increase in operating leases compared to the prior-year period as stripping costs related to the development of Phase 5 at Cerro San Pedro were capitalized. In the period the benefit of the weakening Canadian and Australian dollar and Mexican peso relative to the U.S. dollar was partially offset by rehabilitation and remediation work at Peak Mines which is scheduled to be substantially completed in the third quarter of 2015. Refer to the “Review of Operating Mines” section of this MD&A for more details.
Depreciation and depletion
Depreciation and depletion was in line with the prior-year period at $106.0 million in the six months ended June 30, 2015, compared to $104.3 million, as an increase in depletion at Mesquite was offset by a decrease in depletion at Peak Mines.
Earnings from mine operations
Earnings from mine operations were $32.8 million in the six months ended June 30, 2015, compared to $70.5 million in the prior-year period. Earnings from mine operations were primarily impacted by lower average realized commodity prices.
Corporate administration
Corporate administration costs were $11.5 million in the six months ended June 30, 2015, compared to $14.2 million in the prior-year period. These costs were positively impacted by the weaker Canadian dollar.
Share-based compensation
Share-based compensation costs were $4.0 million in the six months ended June 30, 2015, compared to $4.5 million in the prior-year period with the decrease representing a lower fair value for options granted.
Exploration and business development
Exploration and business development expense was $2.3 million in the six months ended June 30, 2015, compared to $7.4 million in the prior-year period. The current period included a refundable tax credit of $0.9 million at Blackwater related to the British Columbia Mining Exploration Tax Credit and was also impacted by reduced exploration activity at Blackwater compared to the prior-year period and timing of the infill drilling program at Mesquite. Exploration expensed in the current period was primarily incurred at Peak Mines and the Blackwater project. The prior-year period included exploration expensed at New Afton, Mesquite, Peak Mines and the Blackwater project. Exploration costs at Rainy River were capitalized to mineral interest in the current and prior-year periods.
| 19 | WWW.NEWGOLD.COM TSX:NGD NYSE MKT:NGD |
|
Capitalized exploration costs were of $3.1 million for the six months ended June 30, 2015 compared to $11.8 million in the prior-year period. Capitalized exploration was incurred at Rainy River and Peak Mines in the current period and Rainy River, Peak Mines and New Afton in the prior-year period.
Other gains and losses
The following other gains and losses are all added back for the purposes of adjusted net earnings:
Non-hedged derivatives
For the six months ended June 30, 2015, the Company recorded a gain of $11.5 million compared to a loss of $4.8 million in the prior-year period relating to share purchase warrants. The Company’s functional currency is the U.S. dollar, however, the share purchase warrants are denominated in Canadian dollars and are therefore treated as a derivative liability. As the traded value of the New Gold share purchase warrants increases or decreases, a related loss or gain on the mark-to-market of the liability is reflected in earnings.
Foreign exchange
For the six months ended June 30, 2015, the Company recognized a foreign exchange loss of $31.8 million compared to a loss of $3.0 million in the prior-year period. Movements in foreign exchange are due to the revaluation of the monetary assets and liabilities at the balance sheet date and the depreciation of both the Canadian and Australian dollars compared to the U.S. dollar in the period.
Income tax
Income and mining tax expense in the six months ended June 30, 2015 was $7.7 million compared to $8.1 million in the prior-year period, reflecting an effective tax rate of 29% for the second quarter of 2015 compared to 36% in the prior-year period. The primary reason for a lower unadjusted effective tax rate is the impact of foreign exchange movements on the deferred tax related to non-monetary assets and liabilities. In the six months ended June 30, 2015 the Company recorded a foreign exchange expense of $31.0 million on the deferred tax related to foreign exchange on non-monetary assets and liabilities as compared to $0.7 million in the same prior-year period with no associated tax impact. The effect on the tax rate is higher in the six months ended June 30, 2015, primarily as a result of the stronger U.S. dollar.
On an adjusted net (loss) earnings basis, the effective tax rate for the six months ended June 30, 2015 was 2% compared to 40% in the prior-year period. The adjusted effective tax rate excludes the impact of foreign exchange, the hedge settlement in the prior-year period, and any associated changes in the recognition of deferred tax assets. The lower adjusted effective tax rate reflects the greater impact of permanent differences over lower adjusted net loss compared to higher net earnings in the prior period.
Net loss
For the six months ended June 30, 2015, New Gold had a net loss of $34.4 million, or $0.07 per basic share. This compares with net earnings of $14.4 million, or $0.03 per basic share in the prior-year period.
| 20 | WWW.NEWGOLD.COM TSX:NGD NYSE MKT:NGD |
|
Adjusted net loss
For the six months ended June 30, 2015, adjusted net loss was $6.4 million or $0.01 per basic share, compared to net earnings of $26.4 million or $0.05 per basic share in the prior-year period.
RECONCILIATON OF YEAR TO DATE ADJUSTED NET LOSS – 2014 TO 2015
(in millions of U.S. dollars)
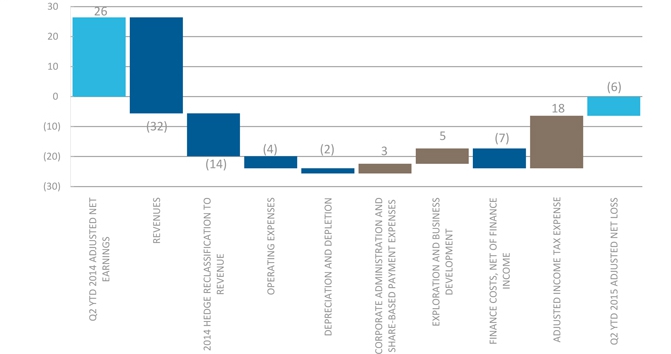
The net loss has been adjusted, including the associated tax impact, for costs in “Other gains and losses” on the condensed consolidated income statement. Key entries in this grouping are: the fair value changes for share purchase warrants; foreign exchange gain or loss; and other non-recurring items. Net loss is also adjusted for inventory net realizable value provisions. Other adjustments to net loss in the prior-year period include the non-cash loss incurred on the monetization of the Company’s legacy hedge position as it is realized into income over the original term of the hedge contract, which is included in revenue.
See “Non-GAAP Financial Performance Measures” for reconciliation of the net loss to adjusted net earnings.
| 21 | WWW.NEWGOLD.COM TSX:NGD NYSE MKT:NGD |
|
REVIEW OF OPERATING MINES
New Afton Mine, British Columbia, Canada The New Afton gold-copper mine is located near Kamloops, British Columbia, Canada. The mine is a large underground gold-copper deposit. New Afton’s property package consists of the nine square kilometre Afton mining lease which centers on the New Afton mine as well as 118 square kilometres of exploration licenses covering multiple mineral prospects within the historic Iron Mask mining district. At December 31, 2014, the mine had 0.8 million ounces of Proven and Probable gold Mineral Reserves and 781 million pounds of Proven and Probable copper Mineral Reserves, with 1.8 million ounces of Measured and Indicated gold Mineral Resources, exclusive of Mineral Reserves, and 1.4 billion pounds of Measured and Indicated copper Mineral Resources, exclusive of Mineral Reserves. A summary of New Afton’s operating results is provided below. |
AT-A-GLANCE 2015 GUIDANCE: Gold:105,000 - 115,000 ounces copper: 85 - 95 million pounds Total cash costs/oz: ($1,070) - ($1,030) ALL-IN SUSTAINING COSTS/OZ: ($560) - ($520)
Q2 YTD 2015 Production: Gold:48,270 Ounces copper: 39.5 million pounds Total cash costs/oz: ($889) ALL-IN SUSTAINING COSTS/OZ: ($295) |
| Three months ended June 30 | Six months ended June 30 | |||
| (in millions of U.S. dollars, except where noted) | 2015 | 2014 | 2015 | 2014 |
| Operating information | ||||
| Ore mined (thousands of tonnes) | 1,155 | 1,161 | 2,364 | 2,328 |
| Ore processed (thousands of tonnes) | 1,202 | 1,161 | 2,417 | 2,321 |
| Average grade: | ||||
| Gold (grams/tonne) | 0.76 | 0.83 | 0.76 | 0.85 |
| Copper (%) | 0.88 | 0.95 | 0.88 | 0.98 |
| Recovery rate (%): | ||||
| Gold | 82.7 | 84.5 | 81.5 | 84.7 |
| Copper | 85.7 | 86.0 | 83.8 | 86.1 |
| Gold (ounces): | ||||
| Produced(1) | 24,358 | 26,312 | 48,270 | 53,676 |
| Sold(1) | 24,245 | 24,713 | 47,124 | 51,557 |
| Copper (millions of pounds): | ||||
| Produced(1) | 19.9 | 21.0 | 39.5 | 43.0 |
| Sold(1) | 20.1 | 20.0 | 39.2 | 41.7 |
| Silver (millions of ounces): | ||||
| Produced(1) | 0.1 | 0.1 | 0.1 | 0.1 |
| Sold(1) | 0.1 | 0.1 | 0.1 | 0.1 |
| Average realized price (1)(2): | ||||
| Gold ($/ounce) | 1,198 | 1,337 | 1,227 | 1,334 |
| Copper ($/pound) | 2.73 | 3.09 | 2.66 | 3.03 |
| Silver ($/ounce) | 16.47 | 18.29 | 16.21 | 19.26 |
| Total cash costs per gold ounce sold ($/ounce)(2)(3) | (940) | (1,262) | (889) | (1,273) |
| All-in sustaining costs per gold ounce sold ($/ounce)(2)(3) | (235) | (678) | (295) | (671) |
| Total cash costs on a co-product basis(2)(3) | ||||
| Gold ($/ounce) | 466 | 442 | 480 | 427 |
| Copper ($/pound) | 1.06 | 1.02 | 1.04 | 0.97 |
| All-in sustaining costs on a co-product basis(2)(3) | ||||
| Gold ($/ounce) | 708 | 643 | 689 | 636 |
| Copper ($/pound) | 1.61 | 1.48 | 1.49 | 1.45 |
| 22 | WWW.NEWGOLD.COM TSX:NGD NYSE MKT:NGD |
|
| Three months ended June 30 | Six months ended June 30 | |||
| (in millions of U.S. dollars, except where noted) | 2015 | 2014 | 2015 | 2014 |
| Financial Information: | ||||
| Revenues | 77.6 | 88.9 | 150.2 | 183.2 |
| Operating margin(2) | 51.7 | 64.2 | 99.6 | 134.4 |
| Earnings from mine operations | 17.7 | 31.9 | 32.3 | 69.0 |
| Capital expenditures (sustaining capital)(2) | 16.7 | 14.1 | 27.4 | 30.4 |
| Capital expenditures (growth capital) (2) | 4.3 | 7.5 | 13.2 | 12.2 |
| 1. | Production is shown on a total contained basis while sales are shown on a net payable basis, including final product inventory and smelter payable adjustments, where applicable. |
| 2. | We use certain non-GAAP financial performance measures throughout our MD&A. Total cash costs and all-in sustaining costs per gold ounce sold, total cash costs and all-in sustaining costs on a co-product basis, average realized price, operating margin, and capital expenditures (sustaining capital and growth capital) are non-GAAP financial performance measures with no standard meaning under IFRS. For further information and a detailed reconciliation, please refer to the “Non-GAAP Financial Performance Measures” section of this MD&A. |
| 3. | The calculation of total cash costs per gold ounce is net of by-product revenue while total cash costs and all-in sustaining costs on a co-product basis removes the impact of other metal sales that are produced as a by-product of our gold production and apportions the cash costs to each metal produced on a percentage of revenue basis. |
Annual and Quarterly Operating Results
Production
In the second quarter of 2015, New Afton produced 24,358 gold ounces compared to 26,312 ounces in the prior-year period. Quarterly production was slightly below the prior-year period as a planned increase in throughput was offset by the combination of lower gold grade and recovery decreases associated with the lower grade. The completion of the mill expansion project during the second quarter yielded positive results. With the benefit of finer grind size resulting from the commissioning of the vertical grinding mill, gold recovery in the second quarter was 83% relative to 80% in the first quarter of 2015.
Copper production in the second quarter of 2015 was 19.9 million pounds compared to 21.0 million pounds in the prior-year period. An increase in throughput offset a decrease in copper grade, while copper recovery remained consistent with the prior-year period. Similar to the benefits for gold recovery associated with the mill expansion, copper recovery in the second quarter averaged 86% relative to 82% in the first quarter of 2015.
For the six months ended June 30, 2015, New Afton produced 48,270 gold ounces compared to 53,676 gold ounces in the prior-year period and produced 39.5 million pounds of copper compared to 43.0 million pounds of copper in the prior-year period. The decrease was due to the combination of lower grade and lower first quarter recoveries, which was only partially offset by a higher throughput rate.
Revenue
In the second quarter of 2015, revenue was $77.6 million compared to $89.0 million in the prior year impacted primarily by lower average realized commodity prices. The average realized gold price for the second quarter of 2015 was $1,198 per gold ounce compared to $1,337 per gold ounce in the prior-period and the London PM fix average of $1,193 per gold ounce. The average realized copper price for the second quarter of 2015 was $2.73 per pound of copper compared to $3.09 per pound of copper in the prior-year period and the London Metals exchange average copper price of $2.75 per pound.
For the six months ended June 30, 2015, revenue was $150.2 million compared to $183.2 million in the prior-year period due primarily to lower average realized commodity prices and lower metal sales. The average realized gold price for the six months ended June 30, 2015 was $1,227 per gold ounce compared to $1,334 per gold ounce in the prior-year period and the London PM fix average of $1,206 per gold ounce. The average realized price in the six months ended June 30, 2015 benefitted from the final settlement of 2014 sales in the first quarter of 2015 which settled at higher prices than they were marked to market at on December 31, 2014. The average realized copper price for the six months ended June 30, 2015 was $2.66 per pound of copper compared to $3.03 per pound of copper in the prior-year period and the London Metals average exchange copper price of $2.69 per pound.
| 23 | WWW.NEWGOLD.COM TSX:NGD NYSE MKT:NGD |
|
At the end of the quarter, New Afton’s exposure to the impact of movements in market metal prices for provisionally priced contracts was 23,976 ounces of gold and 47.6 million pounds of copper. Exposure to these movements in market metal prices is reduced by 18,600 ounces of gold swaps and 46.5 million pounds of copper swaps outstanding at June 30, 2015, with settlement periods ranging from July 2015 to October 2015.
Earnings from mine operations
New Afton contributed $17.7 million to the Company’s earnings from mine operations in the second quarter of 2015, compared to $31.9 million for the prior-year period. For the six months ended June 30, 2015, New Afton generated $32.3 million in earnings from mine operations compared to $69.0 million in the prior-year period. This difference was primarily driven by the impact of lower commodity prices, partially offset by the benefit of the weaker Canadian dollar on operating costs.
Total cash costs and all-in sustaining costs
In the second quarter of 2015, total cash costs per gold ounce sold, net of by-product sales were ($940) per ounce compared to ($1,262) per ounce in the prior-year period. The negative variance was caused by a 12% decrease in the average realized price for copper compared to the prior year period, which was primarily attributable for reducing by-product credits by $286 per ounce. Total cash costs were further affected by the increase in ore tonnes mined and processed, the impact of which was only partially offset by a 12% depreciation of Canadian dollar. All-in sustaining costs per gold ounce sold were ($235) per ounce compared to ($678) per ounce for the prior-year period due to the increase in cash costs and sustaining capital expenditures increased by $2.6 million compared to the prior-year period.
For the six months ended June 30, 2015, total cash costs per gold ounce sold, net of by-product sales, were ($889) per ounce compared to ($1,273) per ounce in the prior-year period. Cash costs were primarily impacted by a 12% decrease in the average realized price for copper and less copper pounds sold, resulting in a $469 per ounce, decrease in copper by-product revenue. Total cash costs in the period were also impacted by 9% decrease in gold ounces sold when compared with the prior-year period. Offsetting these charges was the benefit to operating expenses related to the depreciation of the Canadian dollar. All-in sustaining costs per gold ounce sold were ($295) per ounce in 2014 compared to ($671) per ounce in the prior-year period. All-in sustaining costs were impacted by the increase in cash costs and decrease in gold ounces sold partially offset by a decrease in sustaining capital expenditures of $3.0 million compared to the prior-year period.
Capital expenditures
In the second quarter of 2015, capital expenditures totalled $21.0 million, of which $16.7 million related to sustaining capital and $4.3 million related to growth capital. Growth capital at New Afton relates to completing the mill expansion and advancing of the C-zone project. This compares to $21.6 million in the prior-year period, of which $14.1 million related to sustaining capital and the remainder related to growth capital.
For the six months ended June 30, 2015, capital expenditures totalled $40.6 million, of which $27.4 million related to sustaining capital and $13.2 million related to non-sustaining, or growth capital. This compares to $42.6 million in the prior-year period, of which $30.4 million related to sustaining capital and $12.2 million related to growth capital. In the six months ended June 30, 2015 and the prior-year period, sustaining capital expenditures primarily related to mine development costs and the respective dam raise projects. Growth capital in the six months ended June 30, 2015 related to the completing the mill expansion and advancing of the C-zone project.
| 24 | WWW.NEWGOLD.COM TSX:NGD NYSE MKT:NGD |
|
Impact of Foreign Exchange on Operations
New Afton’s operations continue to be impacted by fluctuations in the valuation of the U.S. dollar against the Canadian dollar. The value of the U.S. dollar for the second quarter of 2015 averaged $1.23 against the Canadian dollar compared to $1.10 in the prior-year period, resulting in a positive impact on cash costs of $172 per gold ounce sold.
The value of the U.S. dollar for the six months ended June 30, 2015 averaged $1.25 against the Canadian dollar compared to $1.07 for the prior-year period, resulting in a positive impact on cash costs of $169 per gold ounce sold.
Exploration Activities
During the six months ended June 30, 2015 New Gold completed a scoping level study to evaluate the potential to develop the C-zone mineral resource which underlies the current block cave reserve. Exploration drilling to further expand and upgrade the C-zone mineral resource to measured and indicated status is expected to resume in 2016 following the completion of an underground decline to access the B3 reserve block and provide sites for new underground drill bay stations. No exploration was conducted at New Afton during the second quarter.
| 25 | WWW.NEWGOLD.COM TSX:NGD NYSE MKT:NGD |
|
Mesquite Mine, California, USA The Company’s Mesquite Mine is located in Imperial County, California, approximately 70 kilometres northwest of Yuma, Arizona and 230 kilometres east of San Diego, California. It is an open pit, run-of-mine heap leach operation. The mine was operated between 1985 and 2001 by Goldfields Mining Corporation, subsequently Santa Fe Minerals Corporation, and finally Newmont Mining Corporation with Western Goldfields Inc. acquiring the mine in 2003. The mine resumed production in 2008. New Gold acquired Mesquite as part of the business combination with Western Goldfields in mid-2009. At December 31, 2014, the mine had 1.7 million ounces of Proven and Probable gold Mineral Reserves and 1.2 million ounces of Measured and Indicated gold Mineral Resources, exclusive of Mineral Reserves. A summary of Mesquite’s operating results is provided below. |
AT-A-GLANCE
2015 GUIDANCE: Gold:110,000 - 120,000 ounces Total cash costs/oz:$925 - $965 ALL-IN SUSTAINING COSTS/OZ:$1,290 - $1,330
Q2 YTD 2015 Production: Gold: 48,188 ounces Total cash costs/oz:$867 ALL-IN SUSTAINING COSTS/OZ:$1,632 |
Three months ended June 30 | Six months ended June 30 | |||
| (in millions of U.S. dollars, except where noted) | 2015 | 2014 | 2015 | 2014 |
| Operating information (1) | ||||
| Ore mined and placed on leach pad (thousands of tonnes) | 4,892 | 2,753 | 6,389 | 4,462 |
| Waste mined (thousands of tonnes) | 13,505 | 10,031 | 27,284 | 19,629 |
| Ratio of waste to ore | 2.76 | 3.64 | 4.27 | 4.40 |
| Average grade: | ||||
| Gold (grams/tonne) | 0.32 | 0.39 | 0.32 | 0.39 |
| Gold (ounces): | ||||
| Produced (1)(2) | 22,501 | 18,439 | 48,188 | 44,171 |
| Sold (1) | 21,391 | 15,347 | 49,225 | 43,329 |
| Average realized price (3)(4): | ||||
| Gold ($/ounce) | 1,190 | 1,283 | 1,204 | 1,290 |
| Total cash costs per gold ounce sold ($/ounce) (3)(4) | 839 | 993 | 867 | 928 |
| All-in sustaining costs per gold ounce sold ($/ounce) (3)(4) | 1,533 | 1,413 | 1,632 | 1,191 |
| Financial Information (1): | ||||
| Revenues | 25.5 | 12.8 | 59.3 | 42.0 |
| Operating margin(3) | 7.6 | (2.3) | 17.1 | 2.2 |
| Earnings (loss) from mine operations | 1.1 | (6.7) | 2.4 | (8.6) |
| Capital expenditures (sustaining capital)(3) | 14.6 | 4.3 | 37.1 | 8.1 |
| 1. | Production is shown on a total contained basis while sales are shown on a net payable basis, including final product inventory, where applicable. |
| 2. | Tonnes of ore processed each period does not necessarily correspond to ounces produced during the period, as there is a time delay between placing tonnes on the leach pad and pouring gold ounces. |
| 3. | We use certain non-GAAP financial performance measures throughout our MD&A. Total cash costs and all-in sustaining costs per gold ounce sold, average realized price, operating margin and capital expenditures (sustaining capital) are non-GAAP financial performance measures with no standard meaning under IFRS. For further information and a detailed reconciliation, please refer to the “Non-GAAP Financial Performance Measures” section of this MD&A. |
| 4. | Average realized price per gold ounce for Mesquite excludes the revenue reduction related to the hedge monetization over the original term of the hedge. |
| 26 | WWW.NEWGOLD.COM TSX:NGD NYSE MKT:NGD |
|
Annual and Quarterly Operating Results
Production
In the second quarter of 2015, Mesquite’s gold production increased by 22% relative to the prior-year period despite the planned focus on waste stripping. Production for the quarter was 22,501 ounces compared to 18,439 ounces in the prior-year period. The increase in production was driven by the combination of a 78% increase in ore tonnes mined and placed on the leach pad and faster process recoveries resulting from the leach pad expansion being commissioned ahead of schedule during the second quarter. Increased operating efficiencies, driven by higher availabilities, equipment productivity and additional loading capacity, allowed the mine to complete its waste stripping activities in April and increase ore tonnes mined in the quarter. Consistent with the Company’s expectations, Mesquite delivered a significant increase in ore tonnes mined and placed relative to the first quarter of 2015 which positions the mine well for a strong second half of 2015. The significant increase in ore tonnes was partially offset as a portion of the tonnes contained lower gold grades relative to the second quarter of 2014.
For the six months ended June 30, 2015, gold production at Mesquite was 48,188 ounces compared to 44,171 ounces in the prior-year period. Production was slightly higher than the prior-year period despite a planned focus on waste stripping during the first half of 2015, benefitting from the large number of recoverable ounces placed on the pad towards the end of 2014, the increase in ore tonnes mined and placed on the leach pad and faster process recoveries resulting from the leach pad expansion, all of which were partially offset by lower gold grade.
Revenue
For the second quarter of 2015, revenue was $25.5 million compared to $12.8 million in the prior-year period due to an increase in gold sales and despite the lower average realized gold price. Revenue in the second quarter of 2014 was impacted by a non-cash charge of $6.9 million related to the monetization of the Company’s legacy hedge position as it was realized over the original term of the hedge contract, with the original term ending on December 31, 2014. The average realized gold price during the second quarter of 2015 was $1,190 per ounce compared to $1,283 per gold ounce sold in the prior-year period and the London PM fix average of $1,193 per gold ounce.
For the six months ended June 30, 2015, revenue was $59.3 million compared to $42.0 million in the prior-year period due to a 14% increase in gold sold, partially offset by lower gold grade and a lower average realized gold price. The average realized gold price for the six months ended June 30, 2015 was $1,204 per ounce compared to $1,290 per gold ounce sold in the prior-year period and the London PM fix average of $1,206 per gold ounce. Revenue in the six months ended June 30, 2014 was impacted by a non-cash charge of $13.7 million related to the monetization of the Company’s legacy hedge position as it was realized into income over the original term of the hedge contract.
Earnings (loss) from mine operations
Mesquite contributed $1.1 million to the Company’s earnings from mine operations for the second quarter of 2015, compared to a $6.7 million loss in the prior-year period. For the six months ended June 30, 2015, Mesquite generated $2.4 million in earnings from mine operations as a result of the increase in gold sales, compared to $8.6 million loss in the prior-year period.
Total cash costs and all-in sustaining costs
Total cash costs per gold ounce sold in the second quarter of 2015 were $839 per ounce, compared to $993 per ounce in the prior-year period, with the $154 per ounce decrease primarily attributable to the higher quarterly production that reduced the per-ounce cost.
| 27 | WWW.NEWGOLD.COM TSX:NGD NYSE MKT:NGD |
|
All-in sustaining costs per gold ounce sold were $1,533 per ounce for the second quarter of 2015 compared to $1,413 per ounce for the prior-year period due to a planned increase in sustaining capital expenditures. Second quarter sustaining capital expenditures of $14.6 million were $10.2 million higher than the prior-year quarter. This resulted in Mesquite’s all-in sustaining costs per ounce temporarily remaining well above normal levels. The increase in sustaining capital expenditures was attributable to costs associated with Mesquite’s leach pad expansion as well as the capitalization of a portion of the mine’s waste stripping costs in April. The capitalization of stripping ended during the second quarter of 2015 as the mine returned to life-of-mine average.
Total cash costs for the six months ended June 30, 2015 were $867 per ounce compared to $928 per ounce in the prior-year period with the decrease primarily attributable to higher production. All-in sustaining costs per gold ounce sold were $1,632 for the six months ended June 30, 2015 compared to $1,191 for the prior-year period, with the increase attributable to the Company’s planned focus on waste stripping as well as the leach pad expansion. As a result of the Company’s planned focus on waste stripping in the first half of 2015 at Mesquite, the ratio of waste to ore during the stripping campaign significantly exceed the life-of-mine average. The planned waste stripping was completed in the second quarter of 2015.
The combination of the planned higher second half production and lower sustaining capital expenditures is expected to result in a significant decrease in all-in sustaining costs in the final two quarters of 2015.
Capital expenditures
For the second quarter of 2015, capital expenditures totalled $14.6 million compared to $4.3 million in the prior-year period. For the six months ended June 30, 2015, capital expenditures totalled $37.1 million, all of which is sustaining capital, compared to $8.1 million in the prior-year period, with the increase relating to spending on the leach pad expansion and capitalized waste stripping. As noted above, the capitalized waste stripping program for 2015 is was completed and ounces were placed on the leach pad expansion during the second quarter of 2015.
Exploration Activities
No exploration activities were conducted at Mesquite during the six months ended June 30, 2015. An infill drilling program to upgrade mineral resources in areas scheduled for mining in 2016 is scheduled to be completed during the third quarter of 2015.
| 28 | WWW.NEWGOLD.COM TSX:NGD NYSE MKT:NGD |
|
Peak Mines, New South Wales, Australia The Company’s Peak Mines gold-copper mining operation is an underground mine/mill operation located in the Cobar Mineral Field near Cobar, New South Wales, Australia. Peak Mines was originally built by Rio Tinto Plc and commenced production in 1992. At December 31, 2014, the mine had 0.4 million ounces of Proven and Probable gold Mineral Reserves and 89 million pounds of Proven and Probable copper Mineral Reserves, with 0.4 million ounces of Measured and Indicated gold Mineral Resources, exclusive of Mineral Reserves, and 75 million pounds of Measured and Indicated copper Mineral Resources, exclusive of Mineral Reserves. A summary of Peak Mines’ operating results is provided below: |
AT-A-GLANCE
2015 GUIDANCE: Gold:85,000 – 95,000 ounces copper:15 – 17 million pounds Total cash costs/oz:$660 - $700 ALL-IN SUSTAINING COSTS/OZ:$1,005 - $1,045
Q2 YTD 2015 Production: Gold: 34,320 ounces copper:7.1 million pounds Total cash costs/oz:$974 ALL-IN SUSTAINING COSTS/OZ:$1,337 |
| Three months ended June 30 | Six months ended June 30 | |||
| (in millions of U.S. dollars, except where noted) | 2015 | 2014 | 2015 | 2014 |
| OPERATING INFORMATION(1) | ||||
| Ore mined (thousands of tonnes) | 171 | 200 | 343 | 397 |
| Ore processed (thousands of tonnes) | 177 | 200 | 354 | 404 |
| Average grade: | ||||
| Gold (grams/tonne) | 3.31 | 4.67 | 3.43 | 4.06 |
| Copper (%) | 1.08 | 1.13 | 1.02 | 1.04 |
| Recovery rate (%): | ||||
| Gold | 90.4 | 92.9 | 91.6 | 92.5 |
| Copper | 88.0 | 90.3 | 88.6 | 90.6 |
| Gold (ounces): | ||||
| Produced(1) | 14,892 | 27,906 | 34,320 | 48,826 |
| Sold(1) | 13,837 | 27,739 | 33,566 | 47,536 |
| Copper (millions of pounds): | ||||
| Produced(1) | 3.7 | 4.5 | 7.1 | 8.4 |
| Sold(1) | 3.6 | 4.3 | 6.6 | 7.7 |
| Silver (millions of ounces): | ||||
| Produced(1) | 0.03 | 0.03 | 0.05 | 0.07 |
| Sold(1) | 0.02 | 0.03 | 0.05 | 0.06 |
| Average realized price (2): | ||||
| Gold ($/ounce) | 1,184 | 1,294 | 1,208 | 1,303 |
| Copper ($/pound) | 2.66 | 3.09 | 2.66 | 3.03 |
| Silver ($/ounce) | 15.54 | 20.10 | 16.83 | 20.43 |
| Total cash costs per gold ounce sold(2)(3) | 1,157 | 627 | 974 | 681 |
| All-in sustaining costs per gold ounce sold(2)(3) | 1,549 | 928 | 1,337 | 1,000 |
| Financial Information: | ||||
| Revenues | 24.9 | 48.2 | 56.4 | 83.4 |
| Operating margin (2) | 1.0 | 18.6 | 8.0 | 29.6 |
| Earnings (loss) from mine operations | (6.6) | 4.8 | (10.6) | 5.5 |
| Capital expenditures (sustaining capital)(3) | 4.2 | 6.8 | 10.0 | 12.8 |
| 1. | Production is shown on a total contained basis while sales are shown on a net payable basis, including final product inventory and smelter payable adjustments, where applicable. | |
| 2. | We use certain non-GAAP financial performance measures throughout our MD&A. Total cash costs and all-in sustaining costs per gold ounce sold, total cash costs and all-in sustaining costs on a co-product basis, average realized price, operating margin and capital expenditures (sustaining capital) are non-GAAP financial performance measures with no standard meaning under IFRS. For further information and a detailed reconciliation, please refer to the “Non-GAAP Financial Performance Measures” section of this MD&A. |
| 3. | The calculation of total cash costs per gold ounce is net of by-product copper revenue. Total cash costs and all-in sustaining costs on a co-product basis removes the impact of other metal sales that are produced as a by-product of our gold production and apportions the cash costs to each metal produced on a percentage of revenue basis. If copper revenue was treated as a co-product, the average total cash costs at Peak Mines for the second quarter of 2015 would be $1,141 per gold ounce (2014 - $799) and $2.72 per pound of copper (2014 - $2.03). All-in sustaining costs on a co-product basis for the second quarter of 2015 would be $1,386 per gold ounce (2014 -$1,016) and $3.27per pound of copper (2014 - $2.55). For the six months ended June 30, 2015, the total cash costs on a co-product basis would be $1,026 per gold ounce (2014 - $841) and $2.41 per pound of copper (2014 - $2.09). All-in sustaining costs on a co-product basis would be $1,276 per gold ounce (2014 -$1,070) and $2.96 per pound of copper (2014 -$2.61). |
| 29 | WWW.NEWGOLD.COM TSX:NGD NYSE MKT:NGD |
|
Annual and Quarterly Operating Results
Production
In the second quarter of 2015, Peak Mines produced 14,892 ounces of gold and 3.7 million pounds of copper compared to 27,906 ounces of gold and 4.5 million pounds of copper for the prior-year period. Lower gold production in the quarter was primarily due to the combined impact of lower tonnes processed as well as lower gold grade and recovery. As previously disclosed, the main stoping area of the Perseverance ore body experienced geotechnical challenges in March of 2015 which led to reduced accessibility and a decrease in tonnes mined and processed from this area during the second quarter of 2015. As a result, ore was primarily sourced from the Peak Mines’ more copper-rich ore bodies, including Chesney and New Cobar. Activity in the Perseverance ore body during the quarter focused primarily on rehabilitation of the impacted area, however, by the end of the quarter, mining activity at Perseverance was operating at 60% to 70% of historical levels. With the benefit of the improved operating performance at Perseverance towards the end of the quarter, ore tonnes mined and processed increased toward run-rate levels which helped drive gold production of 9,112 ounces in June. Lower copper production in the quarter was due to the combination of lower ore tonnes processed and lower recoveries, while copper grade remained consistent. Similar to the strong gold production month in June, copper production in the final month of the quarter was 1.4 million pounds.
For the six months ended June 30, 2015, Peak Mines produced 34,320 gold ounces compared to 48,826 gold ounces in the prior-year period. Lower gold production in the six months ended June 30, 2015 was due to a combination of lower throughput and gold grade primarily related to the geotechnical challenges at the Perseverance ore body. Copper production in the period was 7.1 million pounds of copper compared to 8.4 million pounds of copper in the prior-year period, with the lower copper production primarily due to lower throughput.
Revenue
In the second quarter of 2015, revenue was $24.9 million, compared to $48.2 million in the prior-year period resulting from a decrease in metal production and average realized commodity prices. The average realized gold price was $1,184 per ounce compared to $1,294 per ounce in the prior-year period and the London PM fix average of $1,193 per gold ounce. The average realized copper price was $2.66 per pound compared to $3.09 per pound in the prior-year period and London Metals exchange copper price of $2.75 per pound.
For the six months ended June 30, 2015, revenue was $56.4 million compared to $83.4 million in the prior-year period due to the decrease in metal production and average realized commodity prices. The average realized gold price was $1,208 per ounce for the six months ended June 30, 2015 compared to $1,303 per ounce in the prior-year period and the London PM fix average of $1,206 per gold ounce. The average realized copper price was $2.66 per pound compared to $3.03 per pound in the prior-year period and the London Metals exchange copper price of $2.69 per pound.
At the end of the second quarter of 2015, Peak Mines’ exposure to the impact of movements in market metal prices for provisionally priced contracts was 9,300 ounces of gold and 6.3 million pounds of copper. Exposure to these movements in market metal prices was reduced by 4.4 million pounds of copper swaps outstanding at the end of the quarter, with settlement periods ranging from July 2015 to September 2015.
| 30 | WWW.NEWGOLD.COM TSX:NGD NYSE MKT:NGD |
|
Earnings (loss) from mine operations
For the second quarter of 2015, Peak Mines generated a $6.6 million loss from operations compared to $4.8 million of earnings in the prior-year period. For the six months ended June 30, 2015, Peak Mines generated a $10.6 million loss from operations compared to a $5.5 million gain in the prior-year period. The loss in both the second quarter of 2015 and the six months ended June 30, 2015 was primarily attributable to lower revenues.
Total cash costs and all-in sustaining costs
In the second quarter of 2015, total cash costs per gold ounce sold were $1,157 per ounce compared to $627 per ounce in the prior-year period with the increase primarily due to a 50% decrease in gold sales volumes. Peak Mines’ quarterly operating expenses, net of copper by-product revenue, remained in line with the second quarter of 2014 as the benefit of the 20% depreciation of the Australian dollar relative to the U.S. dollar offset the combination of lower copper by-product revenue and costs associated with the rehabilitation of Perseverance. All-in sustaining costs per gold ounce sold were $1,549 per ounce for the second quarter of 2015 compared to $928 for the prior-year period despite a $2.6 million decrease in sustaining capital expenditures, as they were similarly impacted by the lower gold sales volumes.
For the six months ended June 30, 2015, total cash costs per gold ounce sold, net of by-product sales, were $974 per ounce compared to $681 per ounce in the prior-year period. All-in sustaining costs per gold ounce sold were $1,337 per ounce for the six months ended June 30, 2015 compared to $1,000 for the prior-year period. Consistent with the second quarter of 2015 cash costs and all-in sustaining costs were impacted by lower gold sales volumes as the impact of lowe copper by-product revenue was offset by the depreciation of the Australian dollar relative to the U.S. dollar.
Capital expenditures
In the second quarter of 2015, capital expenditures totalled $4.2 million compared to $6.8 million for the prior-year period.
For the six months ended June 30, 2015, capital expenditures totalled $10.0 million, all of which is sustaining capital compared to $12.8 million in the prior-year period.Capital expenditures related to mine and infrastructure development and capitalized exploration.
Impact of Foreign Exchange on Operations
Peak Mines’ operations continue to be impacted by fluctuations in the valuation of the U.S. dollar against the Australian dollar. The value of the U.S. dollar for the second quarter of 2015 averaged $1.29 against the Australian dollar compared to $1.07 in the prior-year period, resulting in a positive impact on cash costs of $362 per gold ounce sold. The value of the U.S. dollar for the six months ended June 30, 2015 averaged $1.28 against the Australian dollar compared to $1.09 for the prior-year period, resulting in a positive impact on cash costs of $250 per gold ounce sold.
Exploration Activities
Beyond the operational results, the Peak Mines also further solidified its track record of continual exploration success during the second quarter. Results of exploration drilling at the historic Great Cobar mine, located approximately nine kilometres from the Peak Mines mill, continued to extend and delineate a new high-grade copper-gold lode located approximately 200 metres to the south of the historic mine workings. Recent exploration highlights include drill hole GC17 which intercepted two lenses of strong mineralization at a vertical depth ranging from 550 to 625 metres from surface. The first lens included 14 metres (10 metres true thickness) averaging 1.08 grams per tonne gold, 6.11% copper and 47 grams per tonne silver at a down-hole depth of 622 to 636 metres. This intercept was followed by a second lens that included 8 metres (5.8 metres true thickness) averaging 0.46 grams per tonne gold, 0.84% copper, 22 grams per tonne silver, 0.46% lead and 2.64% zinc at a down-hole depth of 693 to 701 metres. Beginning at a depth of less than 100 metres from surface, the southern lode has been delineated over dimensions measuring approximately 800 metres vertically, 250 metres along strike and 10 metres true thickness. Additional exploration drilling to test the limits of the southern lode at Great Cobar is planned for the second half of 2015.
| 31 | WWW.NEWGOLD.COM TSX:NGD NYSE MKT:NGD |
|
AT-A-GLANCE 2015 GUIDANCE: Gold: 90,000 – 100,000 ounces silver: 1.75 – 1.95 million ounces Total cash costs/oz: $955 - $995 ALL-IN SUSTAINING COSTS/OZ: $1,005 - $1,045 Q2 YTD 2015 Production: Gold: 50,641 ounces SILVER: 0.6 MILLION OUNCES Total cash costs/oz: $944 ALL-IN SUSTAINING COSTS/OZ: $955
|
Cerro San Pedro Mine, San Luis Potosi, Mexico
The Cerro San Pedro mine is located in the state of San Luis Potosí in central Mexico, approximately 20 kilometres east of the city of San Luis Potosí. The mine is a gold-silver, open pit, run-of-mine heap leach operation. At December 31, 2014, the mine had 0.2 million ounces of Proven and Probable gold Mineral Reserves and 7.9 million ounces of Proven and Probable silver Mineral Reserves. A summary of Cerro San Pedro’s operating results is provided below:
| Three months ended June 30 | Six months ended June 30 | |||
| (in millions of U.S. dollars, except where noted) | 2015 | 2014 | 2015 | 2014 |
| Operating information (1) | ||||
| Ore mined and placed on leach pad (thousands of tonnes) | 5,323 | 1,720 | 8,497 | 2,990 |
| Waste mined (thousands of tonnes) | 881 | 7,516 | 5,803 | 15,035 |
| Ratio of waste to ore | 0.17 | 4.37 | 0.68 | 5.03 |
| Average grade: | ||||
| Gold (grams/tonne) | 0.71 | 0.18 | 0.59 | 0.23 |
| Silver (grams/tonne) | 26.51 | 14.93 | 24.14 | 14.54 |
| Gold (ounces) | ||||
| Produced (1)(2) | 24,691 | 16,803 | 50,641 | 34,104 |
| Sold (1) | 28,281 | 16,937 | 50,237 | 36,366 |
| Silver (millions of ounces) | ||||
| Produced (1)(2) | 0.3 | 0.3 | 0.6 | 0.6 |
| Sold (1) | 0.4 | 0.3 | 0.6 | 0.7 |
| Average realized price (3): | ||||
| Gold ($/ounce) | 1,189 | 1,289 | 1,202 | 1,290 |
| Silver ($/ounce) | 16.24 | 19.70 | 16.42 | 20.05 |
| Total cash costs per gold ounce sold ($/ounce) (3)(4) | 879 | 1,169 | 944 | 1,051 |
| All-in sustaining costs per gold ounce sold ($/ounce) (3)(4) | 889 | 1,322 | 955 | 1,193 |
| Financial Information (1): | ||||
| Revenues | 39.7 | 28.2 | 70.7 | 60.0 |
| Operating margin (3) | 9.1 | 2.3 | 14.1 | 8.6 |
| Earnings (loss) from mine operations | 6.4 | 0.1 | 8.7 | 4.6 |
| Capital expenditures (sustaining capital)(3) | 0.3 | 2.4 | 0.5 | 4.7 |
| Capital expenditures (growth capital)(3) | - | 7.3 | - | 16.2 |
| 1. | Production is shown on a total contained basis while sales are shown on a net payable basis, including final product inventory adjustments, where applicable. | |
| 2. | Tonnes of ore processed each period does not necessarily correspond to ounces produced during the period, as there is a time delay between placing tonnes on the leach pad and pouring gold ounces. | |
| 3. | We use certain non-GAAP financial performance measures throughout our MD&A. Total cash costs and all-in sustaining costs per gold ounce sold, total cash costs and all-in sustaining costs on a co-product basis, average realized price, operating margin and capital expenditures (sustaining and growth) are non-GAAP financial performance measures with no standard meaning under IFRS. For further information and a detailed reconciliation, please refer to the “Non-GAAP Performance Measures” section of this MD&A. | |
| 4. | The calculation of total cash costs per gold ounce and all-in sustaining costs per gold ounce sold is net of by-product silver revenue. Total cash costs and all-in sustaining costs on a co-product basis removes the impact of other metal sales that are produced as a by-product of our gold production and apportions the cash costs to each metal produced on a percentage of revenue basis. If the silver revenue was treated as a co-product, the average total cash costs at Cerro San Pedro for second quarter of 2015, would be $926 per gold ounce (2014 - $1,196) and $12.65 per silver ounce (2014 - $18.28). All-in sustaining costs on a co-product basis for the second quarter of 2015 would be $934per gold ounce (2014 - $1,315) and $12.76per silver ounce (2014 - $20.09). For the six months ended June 30, 2015, average total cash costs would be $981 per gold ounce (2014 - $1,103) and $13.40 per silver ounce (2014 - $17.15). For the six months ended June 30, 2015, the all-in sustaining costs on a co-product basis would be $991per gold ounce (2014 - $1,214) and $13.54per silver ounce (2014 - $18.88). |
| 32 | WWW.NEWGOLD.COM TSX:NGD NYSE MKT:NGD |
|
Annual and Quarterly Operating Results
Production
In the second quarter of 2015, Cerro San Pedro continued its strong start to the year producing 24,691 ounces of gold compared to 16,803 ounces produced in the prior-year period. The 47% increase in gold production relative to the second quarter of 2014 was driven by a significant increase in ore tonnes mined and placed on the leach pad coupled with higher gold grade. Consistent with the Company’s plans, the focus on waste stripping in the prior-year period has enabled Cerro San Pedro to deliver strong gold production in 2015. Silver production in the second quarter of 2015 was 0.3 million ounces compared to 0.3 million ounces in the prior-year period.
For the six months ended June 30, 2015, Cerro San Pedro’s gold production was 50,641 ounces compared to 34,104 ounces in the prior-year period, an increase of 48%. The increase in production was attributable to a combination of an increase in ore tonnes mined and placed on the leach pad and higher gold grade as Cerro San Pedro is in the heart of the Phase 5 ore body. Silver production was 0.6 million ounces for the six months ended June 30, 2015 compared to 0.6 million ounces in the prior-year period.
Revenue
In the second quarter of 2015, revenue was $39.7 million compared to $28.2 million in the prior-year period, as higher gold sales were partially offset by lower average realized commodity prices. The average realized gold price for the second quarter of 2015 was $1,189 per ounce compared to $1,289 per ounce in the prior-year period and the London PM fix average of $1,193 per gold ounce. The average realized silver price during the second quarter of 2015 was $16.24 per ounce compared to $19.70 per ounce in the prior-year period and the London PM fix average of $16.41 per silver ounce.
For the six months ended June 30, 2015, revenue was $70.7 million compared to $60.0 million in the prior-year period, as higher gold sales were partially offset by lower average realized commodity prices. The average realized gold price for the six months ended June 30, 2015 was $1,202 per ounce compared to $1,290 per ounce in the prior-year period and the London PM fix average of $1,206 per gold ounce. The average realized silver price for the six months ended June 30, 2015 was $16.42 per ounce compared to $20.05 per ounce for the prior-year period and the London PM fix average of $16.56 per silver ounce.
Earnings (loss) from mine operations
In the second quarter of 2015, Cerro San Pedro generated $6.4 million earnings from mine operations compared to $0.1 million in the prior-year period. For the six months ended June 30, 2015, Cerro San Pedro generated $8.7 million earnings from mine operations compared to of $4.6 million in the prior-year period. Earnings from mine operations were positively impacted by the increase in gold revenue when compared to the prior-year period.
Total cash costs and all-in sustaining costs
In the second quarter of 2015, total cash costs per gold ounce sold were $879 per ounce compared to $1,169 per ounce in the prior-year period. All-in sustaining costs per gold ounce sold were $889 per ounce for the second quarter of 2015 compared to $1,322 per ounce for the prior-year period. When compared to the second quarter of 2014, costs benefitted from a combination of the higher gold production base, a depreciation of the Mexican peso relative to the U.S. dollar and lower sustaining capital expenditures. These benefits were only partially offset by a decrease in silver by-product revenue resulting from the lower realized silver price.
| 33 | WWW.NEWGOLD.COM TSX:NGD NYSE MKT:NGD |
|
For the six months ended June 30, 2015, total cash costs per gold ounce sold were $944 per ounce compared to $1,051 per ounce in the prior-year period. All-in sustaining costs per gold ounce sold were $955 per ounce for the six months ended June 30, 2015 compared to $1,193 for the prior-year period. Similar to the second quarter of 2015, cash costs and all-in sustaining costs per gold ounce sold were impacted by a combination of the higher gold production base, a depreciation of the Mexican peso relative to the U.S. dollar and lower sustaining capital expenditures, partially offset by a decrease in the silver by-product revenue resulting from the lower realized silver price.
Capital expenditures
In the second quarter of 2015, capital expenditures totalled $0.3 million, all of which was sustaining capital. This compares to $9.7 million in the prior-year period, which included $2.4 million of sustaining capital and $7.3 million of growth capital. Growth capital in the prior-year period related to Phase 5 stripping costs.
For the six months ended June 30, 2015, capital expenditures totaled $0.5 million, all of which was sustaining capital. This compares to $20.9 million in the prior-year period, which included $4.7 million of sustaining capital and $16.2 million of growth capital. Growth capital in the prior-year period related to the development of Phase 5.
Impact of Foreign Exchange on Operations
Cerro San Pedro was impacted by changes in the value of the Mexican peso against the U.S. dollar. The value of the Mexican peso weakened from an average of 13.00 to the U.S. dollar in the second quarter of 2014 to 15.33 to the U.S. dollar in the second quarter of 2015. This had a positive impact on cash costs of $115 per gold ounce sold.
The value of the Mexican peso weakened from an average of 13.12 to the U.S. dollar for the six months ended June 30, 2014 to 15.15 to the U.S. dollar for the six months ended June 30, 2015. This had a positive impact on cash costs of $104 per gold ounce sold.
DEVELOPMENT AND EXPLORATION REVIEW
AT-A-GLANCE AS AT DECEMBER 31, 2014 PROVEN AND PROBABLE RESERVES GOLD: 3.8 MILLION OUNCES SILVER: 9.4 MILLION OUNCES
MEASURED AND INDICATED RESOURCES (Exclusive of reserves) Gold: 2.9 MILLION OUNCES SILVER: 10.0 MILLION OUNCES
|
Rainy River Project, Ontario, Canada
Rainy River is a gold project located approximately 50 kilometres northwest of Fort Frances, a town of approximately 8,000 people, in northwestern Ontario, Canada. The project property is located near infrastructure and is comprised of approximately 192 square kilometres of patented and unpatented mining and surface rights land claims and leasehold interests. Additionally, on January 1, 2015, New Gold completed the acquisition of Bayfield Ventures Corp., further consolidating its holdings in the district.
Development activity at the project has continued to advance on schedule, with first production remaining on target for mid-2017. Over its first nine years of full production, the 21,000 tonne per day, combined open pit-underground operation is scheduled to produce an average of 325,000 ounces of gold per year at well below industry average costs.
The Rainy River project enhances New Gold’s growth pipeline through its manageable capital costs, significant production scale at below current industry average costs and exciting regional exploration potential in a great mining jurisdiction.
| 34 | WWW.NEWGOLD.COM TSX:NGD NYSE MKT:NGD |
|
Project Advancement
The Rainy River project achieved multiple important milestones during the second quarter of 2015. Most notably, the temporary accommodation facility was completed for initial occupation on schedule and major site earthworks construction commenced in mid-May. In the second quarter of 2015, work progressed on engineering, procurement and construction of the project and the following activities were completed:
Rainy River – Second quarter 2015 Key PROJECT UPDATES · Permits to enable commencement of major earthworks construction received in May · Detailed engineering – on schedule and approximately 95% complete · Construction-related activities progressing on schedule - Temporary accommodation facility – 80% complete - First major earthworks for the process plant site commenced in May; scheduled for completion in the fourth quarter of 2015 - First concrete pour for primary crusher foundation successfully completed on July 20, 2015 - Delivery of initial truck fleet and shovels on schedule for the third quarter of 2015 - Delivery of mills on schedule for the fourth quarter of 2015 · Five prospective areas within five-kilometre radius of mine development area identified for potential drill testing in the second half of 2015 |
Permitting Activities
In January 2015, the Canadian Environmental Assessment Agency granted Federal environmental regulatory approval and the Ontario Ministry of Environment and Climate Change granted Provincial environmental regulatory approval for the Rainy River project.
Key construction related permits have subsequently been issued by the Ministry of Environment & Climate Change as well as the Ministry of Natural Resources & Forestry. Receipt of additional provincial construction and operations phase permits is progressing in line with the project development schedule. New Gold continues to work closely with Environment Canada towards obtaining the required mine waste Schedule 2 authorization expected in early 2016.
Exploration
During the second quarter of 2015, exploration at the Rainy River project continued to focus on identifying new areas of prospective mineralization located within several kilometres of the main mine development area. Exploration activities planned for the second half of 2015 include a possible reconnaissance drilling program during the third or fourth quarter to test the potential for additional gold resources that could further add to reserves and improve future economics and add long term value to the project.
Environmental and Community Activities
New Gold successfully concluded a Participation Agreement with Big Grassy First Nation during the first quarter of 2015. This agreement is in addition to agreements that have already been signed with Rainy River First Nations, Naicatchewenin First Nation, the Métis Nation of Ontario and four communities of the Fort Frances Chiefs Secretariat.
The Participation Agreements provide for how the local Métis and First Nation communities will benefit from the development of Rainy River and throughout the life of the mine. New Gold continues to meet with Aboriginal groups and anticipates completion of additional agreements through the remainder of the year.
| 35 | WWW.NEWGOLD.COM TSX:NGD NYSE MKT:NGD |
|
Project Costs
For the second quarter of 2015, capital expenditures at Rainy River totalled $32.9 million which includes $32.6 million for development capital costs and the remainder primarily for exploration. This compares to $15.3 million in the prior-year period. For the six months ended June 30, 2015 capital expenditures totalled $51.9 million which includes $50.4 million for development capital costs and the remainder primarily for exploration. This compares to $24.1 million in the prior-year period. Through June 30, 2015, the Company has spent 14% of the total development capital estimate of $877 million.
AT-A-GLANCE AS AT DECEMBER 31, 2014 PROVEN AND PROBABLE RESERVES GOLD: 8.2 MILLION OUNCES SILVER: 60.8 MILLION OUNCES
MEASURED AND INDICATED RESOURCES (Exclusive of reserves) Gold: 1.1 MILLION OUNCES SILVER: 7.0 MILLION OUNCES
|
Blackwater Project, British Columbia, Canada
Blackwater is a bulk-tonnage gold and silver project located approximately 160 kilometres southwest of Prince George, a city of approximately 80,000 people, in central British Columbia, Canada. The project property position covers over 1,000 square kilometres and is located near infrastructure.
Exploration
Exploration field activities at Blackwater resumed in May to follow up on the favourable results of the 2014 field program. During last year’s program the Company’s exploration team confirmed the presence a broad area of prospective porphyry and epithermal style geology extending three to five kilometres south and west of the main Blackwater deposit. Detailed surface reconnaissance and geophysical surveys completed in June have identified three target areas scheduled for drill testing during the third quarter of 2015.
Environmental and Permitting Activities
The following related to permitting and environmental activities at Blackwater in during the six months ended June 30, 2015:
| · | Comments from key regulatory agencies and First Nations on the Environmental Assessment report were addressed and a public review is expected to start during the third quarter of 2015 with expected receipt of provincial and federal environmental assessment approvals in early 2016. |
| · | Continued key engineering studies for advancement of post-environmental assessment approval permits. |
| · | Continued discussions with key First Nations on Participation Agreements. |
Project Costs
For the second quarter of 2015, capital expenditures totalled $1.0 million compared to $2.6 million for the prior-year period. For the six months ended June 30, 2015, capital expenditures totalled $3.0 million compared to $8.3 million for the prior-year period. Expenditures in the current year related to the continued advancement of the environmental assessment process and related environmental and engineering studies.
| 36 | WWW.NEWGOLD.COM TSX:NGD NYSE MKT:NGD |
|
AT-A-GLANCE AS AT DECEMBER 31, 2014 MEASURED AND INDICATED RESOURCES (Included in New Afton Measured and Indicated Resources)) Gold: 1.05 MILLION OUnces copper: 814 million pounds
|
New Afton C-zone, British Columbia, Canada
The C-zone is the down plunge extension of the B-zone block cave that is currently being mined at New Afton. Subsequent to the year end, New Gold completed a scoping study for the C-zone to evaluate the potential for the C-zone to extend the mine’s life.
The scoping study highlights include five years of additional mine life, including ramp up period, full-year average production of 107,000 ounces and 77 million pounds of copper and development capital costs of $349 million at an exchange rate assumption of C$1.25/US$, including $40 million of contingency.
The scoping study relates to the economic potential of the C-zone mineral resources at the New Afton property and is not part of, and should be distinguished from, the current mining of the B-zone reserves. Mineral resources that are not mineral reserves do not have demonstrated economic viability. The reader is cautioned that a scoping study is preliminary in nature and accordingly subject to a high degree of uncertainty. A preliminary and/or definitive feasibility study will be required to further evaluate the C-zone project’s economics. As the Company moves towards the completion of a feasibility study, additional studies and testwork will be completed on the plan to stabilize the tailings within the existing facility through a dewatering and consolidation program.
Project advancement and Costs
During the six months ended June 30, 2015 New Afton further evaluated the optimization of mine design, production schedule, project economics, tailings design and stabilization test work programs and continued baseline environmental work. For the second quarter of 2015, project capital expenditures totalled $1.2 million with project capital expenditures totalling $1.7 million for the six months ended June 30, 2015.
AT-A-GLANCE AS AT December 31, 2014 PROVEN AND PROBABLE RESERVES (30%) GOLD: 2.7 MILLION OUNCES copper: 2.0 billion pounds
MEASURED AND INDICATED RESOURCES (Exclusive of reserves) Gold: 0.4 MILLION OUNCES copper: 0.3 billion pounds
|
El Morro Project, Atacama Region, Chile
El Morro is a gold-copper development project located in north-central Chile, Atacama Region, and approximately 80 kilometres east of the city of Vallenar. El Morro is a world-class project with low expected cash costs and great organic growth potential. The El Morro and La Fortuna deposits represent the two principal zones of gold-copper mineralization that have been identified to date. Future exploration efforts will also test the potential bulk-mineable gold and copper production below the bottom of the current La Fortuna open pit.
Under the terms of New Gold's agreement with Goldcorp Inc. ("Goldcorp"), Goldcorp is responsible for funding New Gold's 30% share of capital costs. The carried funding accrues interest at a fixed rate of 4.58%. New Gold will repay its share of capital plus accumulated interest out of 80% of its share of the project's cash flow with New Gold retaining 20% of its share of cash flow from the time commercial production commences. Pursuant to the above agreement, New Gold has drawn down $90.6 million of carried funding at June 30, 2015. For the second quarters of 2015 and 2014, project spending, excluding interest was $0.9 million and $4.2 million, respectively. For the six months ended June 30, 2015 and 2014 project spending, excluding interest was $2.1 million and $5.4 million, respectively. New Gold had no cash outlay in the period.
| 37 | WWW.NEWGOLD.COM TSX:NGD NYSE MKT:NGD |
|
Since 2011, the resolution by the Chilean Environmental Permitting Authority (“Servicio de Evaluación Ambiental” or “SEA”) approving the Environmental Impact Study (“EIS”) for the El Morro project has been the subject of various claims and appeals based on inadequate consultation and constitutional protections. At various times during these proceedings, the El Morro project’s environmental permit has been suspended and reinstated, and as a result activities at the El Morro project have been limited. Most recently, on October 7, 2014, the Chilean Supreme Court invalidated the project’s environmental permit. Sociedad Contractual Minera El Morro subsequently withdrew its environmental permit on November 7, 2014 and has commenced studies to determine the optimal development plan for the project. El Morro remains committed to productive interaction and engagement with the adjacent communities and regional authorities.
El Morro remains one of the highest-grade undeveloped copper-gold porphyry deposits in the world with a substantial base of gold and copper mineral reserves. In addition, the broader El Morro land package totals 417 square kilometres with significant untested exploration potential.
FINANCIAL CONDITION REVIEW
Balance Sheet Review
| As at June 30 | As at December 31 | |
| (in millions of U.S. dollars, except where noted) | 2015 | 2014 |
| balance sheet information | ||
| Cash and cash equivalents | 326.8 | 370.5 |
| Current assets | 238.0 | 264.0 |
| Non-current assets | 3,345.7 | 3,247.3 |
| Total assets | 3,910.5 | 3,881.8 |
| Current liabilities | 99.8 | 104.9 |
| Non-current liabilities excluding long-term debt | 671.4 | 631.4 |
| Long-term debt | 879.3 | 874.3 |
| Total liabilities | 1,650.5 | 1,610.6 |
| Total equity | 2,260.0 | 2,271.2 |
| Total liabilities and equity | 3,910.5 | 3,881.8 |
Assets
Total assets were $3,910.5 million at June 30, 2015 compared to $3,881.8 million at December 31, 2014. The increase in total assets is primarily attributable to growth capital expenditures at New Afton (completing the mill expansion), Rainy River and sustaining capital expenditures at Mesquite.
Cash and cash equivalents
The change in cash and cash equivalents was primarily driven by the increase in growth capital expenditures at Rainy River as $51.9 million was spent during the six months ended June 30, 2015. During the first quarter of 2015 the Company designated $150.0 million for capital expenditures at Rainy River and elected to apply hedge accounting for the amount at an average exchange rate C$1.25/US$.
Net cash generated from operations during the six months ended June 30, 2015 of $126.7 million was offset by cash used in investing activities of $141.7 million (which includes $73.5 million of sustaining capital expenditure and $69.6 million of growth capital expenditure), cash used by financing activities of $26.0 million and $2.9 million from the impact of foreign exchange on cash and cash equivalents.
| 38 | WWW.NEWGOLD.COM TSX:NGD NYSE MKT:NGD |
|
Current assets
The decrease in current assets is primarily due to the income tax and sales tax receipt at Cerro San Pedro during the six months ended June 30, 2015.
Non-current assets
Non-current assets primarily consist of mining interests which include the Company’s mining properties, development projects and property, plant and equipment. For the six months ended June 30, 2015, the Company spent $143.1 million primarily focused on continued project advancement at Rainy River, the completing the mill expansion at New Afton and the leach pad expansion and stripping projects at Mesquite.
Liabilities
Total liabilities were $1,650.5 million at June 30, 2015, compared to $1,610.6 million at December 31, 2014. The increase in liabilities is attributable to deferred tax liabilities and reclamation obligations.
Non-current liabilities
Non-current liabilities consist primarily of reclamation and closure cost obligations, long-term debt and deferred tax liabilities.
Reclamation and Closure Cost Obligations
The Company’s asset retirement obligations consist of reclamation and closure costs for New Afton, Mesquite, Peak Mines, Cerro San Pedro, Blackwater and Rainy River. Significant reclamation and closure activities include land rehabilitation, demolition of buildings and mine facilities, ongoing care and maintenance and other costs.
The long-term discounted portion of the liability at June 30, 2015 is $71.6 million compared to $63.5 million at December 31, 2014. Changes in the liability are primarily due to the recognition of a reclamation liability at Rainy River and decreases in the discount rate used in the fair value calculation of the liability. The Company intends to spend $1.6 million in 2015 on reclamation activities, and the remainder in future periods.
During the three months ended June 30, 2015, a reclamation liability was recognized at Rainy River. The decommissioning liability relates to the reclamation of the plant site, including cleaning and recontouring the site and covering it with vegetation to bring the site back to the original landscape. Also there would be required ongoing monitoring to fulfill the Company’s closure plan approved by the Ministry of Northern Development and Mines requiring to demonstrate stability of the site from a vegetation cover perspective, to meet applicable guidelines for water quality and to create habitat types supportive of species at risk; for restoration of the camp site, shipping items offsite and other reclamation and demobilization activity.
Long-Term Debt
The majority of the Company’s contractual obligations consist of long-term debt and interest payable. At June 30, 2015, the Company had $879.3 million in long-term debt compared to $874.3 million at December 31, 2014. Long-term debt includes Senior Unsecured Notes, the El Morro funding loan and the revolving credit facility.
On April 5, 2012, the Company issued Senior Unsecured Notes denominated in U.S. dollars, which mature and become payable on April 15, 2020 and bear an interest rate of 7% per annum. At March 31, 2015, the face value of these notes totalled $300 million and the carrying amount totalled $294.6 million. Interest is payable in arrears in equal semi-annual instalments on April 15 and October 15 of each year.
On November 15, 2012, the Company issued additional Senior Unsecured Notes denominated in U.S. dollars. These notes mature and become payable on November 15, 2022 and bear interest at a rate of 6.25% per annum. At June 30, 2015, the face value of these notes totalled $500 million and the carrying amount totalled $492.0 million. Interest is payable in arrears in equal semi-annual instalments on May 15 and November 15 of each year.
| 39 | WWW.NEWGOLD.COM TSX:NGD NYSE MKT:NGD |
|
The 2020 and 2022 Unsecured Notes are subject to a minimum interest coverage incurrence covenant (EBITDA to interest) of 2:1. The test is applied on a pro-forma basis prior to the Company incurring additional debt, entering into business combinations or acquiring significant assets, or certain other corporate actions.
On August 14, 2014, the Company entered into a $300.0 million revolving credit facility (the “Facility”) which expires on August 14, 2018. The Facility also provides the Company with the option to draw an additional $50.0 million above and beyond the base $300.0 million, subject to lender participation. Net debt will be used to calculate leverage for the purpose of covenant tests and pricing levels. The Facility contains various covenants customary for a loan facility of this nature, including limits on indebtedness, asset sales and liens. The Facility contains two covenant tests, the minimum interest coverage ratio (EBITDA to interest) and the maximum leverage ratio (net debt to EBITDA). Significant financial covenants are as follows:
Twelve months ended June 30 | Twelve months ended December 31 | ||
| Financial Covenant | 2015 | 2014 | |
| financial covenants | |||
| Minimum interest coverage ratio (EBITDA to interest) | > 3.0 : 1 | 4.7 : 1 | 5.3 : 1 |
| Maximum leverage ratio (net debt to EBITDA) | < 3.5 : 1 | 2.1 : 1 | 1.6 : 1 |
The interest margin on drawings under the Facility ranges from 1.00% to 3.25% over LIBOR, the Prime Rate or the Base Rate, based on the Company’s debt to EBITDA ratio and the currency and type of credit selected by the Company. The standby fees on undrawn amounts under the Facility range from 0.45% to 0.73%, depending on the Company’s net debt to EBITDA ratio. Based on the Company’s net debt to EBITDA ratio, the rate is 0.62% as at June 30, 2015 (2014 – 0.63% under the previous facility).
As atJune 30, 2015,the Company had not drawn any funds under the Facility; however the Facility has been used to issue letters of credit of $63.6 million as at June 30, 2015 (at December 31, 2014 - $42.9 million). Letters of credit relate to reclamation bonds, worker’s compensation security and other government agencies.
Current and Deferred Income Taxes
The net deferred income tax liability increased from $326.6 million at December 31, 2014 to $359.7 million at June 30, 2015. The change is driven by an increase in the deferred tax liabilities associated with the foreign exchange revaluation of non-monetary assets, for which the Company recorded a foreign exchange loss of $31.0 million. This was primarily due to the deferred tax liabilities being denominated in currencies other than the U.S. dollar.
The net current income tax receivable balance was $18.8 million at June 30, 2015 compared to $23.2 million at December 31, 2014 as a result of the receipt of $8.6 million of income tax refunds at Cerro San Pedro during the six months ended June 30, 2015.
Liquidity and Cash Flow
As at June 30, 2015, the Company had cash and cash equivalents of $326.8 million compared to $370.5 million at December 31, 2014. The Company’s investment policy is to invest its surplus funds in permitted investments consisting of treasury bills, bonds, notes and other evidences of indebtedness of Canada, the U.S. or any of the Canadian Provinces with a minimum credit rating of R-1 mid from the DBRS or an equivalent rating from Standard & Poor’s or Moody’s and with maturities of 12 months or less at the original date of acquisition. In addition, the Company is permitted to invest in bankers’ acceptances and other evidences of indebtedness of certain financial institutions. Surplus corporate funds are only invested with approved government or bank counterparties.
| 40 | WWW.NEWGOLD.COM TSX:NGD NYSE MKT:NGD |
|
The Company’s cash flows from operating, investing and financing activities, as presented in the Condensed Consolidated Statements of Cash Flows, are summarized in the following table for the three months and six months ended June 30, 2015:
| Three months ended June 30 | Six months ended June 30 | |||
| (in millions of U.S. dollars, except where noted) | 2015 | 2014 | 2015 | 2014 |
| cash flow information | ||||
| Cash generated (used) in operating activities | 56.9 | 59.3 | 126.7 | 140.7 |
| Cash generated (used) in investing activities (sustaining capital expenditure and other) | (34.7) | (25.9) | (72.0) | (53.3) |
| Cash generated (used) in investing activities (growth capital expenditure) | (38.2) | (34.2) | (69.7) | (62.9) |
| Cash generated (used) in financing activities | (26.1) | (25.7) | (26.0) | (25.1) |
| Effect of exchange rate changes on cash and cash equivalents | 3.1 | 2.4 | (2.7) | 0.2 |
| Change in cash and cash equivalents | (39.0) | (24.1) | (43.7) | (0.4) |
Operating Activities
Net cash generated from operating activities for the six months ended June 30, 2015 was $126.7 million compared to $140.7 million for the prior-year period. Net cash generated from operations has decreased compared to the prior-year period, primarily due to lower average realized prices on all metals and lower copper volumes, partially offset by the benefit of the weakening Canadian and Australian dollar and the Mexican peso relative to the U.S. dollar and income tax and the collection of value-added tax receivables at Cerro San Pedro.
During the six months ended June 30, 2015 the Company received income tax refunds in the amount of $3.8 million compared to income taxes paid of $1.5 million in the prior-year period. Tax refunds were received at Cerro San Pedro while the decrease in cash tax payments is primarily due to the geographical mix of profits.
Investing Activities
Cash used in investing activities is primarily for the continued capital investment in the Company’s operations. Spending was higher than the prior-year period, with the Company spending $141.7 million during the six months ended June 30, 2015 compared to $116.2 million in the prior-year period. Investing activities in the six months ended June 30, 2015 primarily focused on continued project advancement at Rainy River, completing the mill expansion at New Afton and the leach pad expansion and stripping projects at Mesquite. Investing activities in the prior-year period focused on mine development at New Afton, and continued project advancement at Rainy River and Blackwater.
| 41 | WWW.NEWGOLD.COM TSX:NGD NYSE MKT:NGD |
|
The following table summarizes the capital expenditures (Mining Interests per the Condensed Consolidated Statements of Cash Flows) for the three months and six months ended June 30, 2015:
| Three months ended June 30 | Six months ended June 30 | |||
| (in millions of U.S. dollars) | 2015 | 2014 | 2015 | 2014 |
| CAPital EXpenditures by site | ||||
| New Afton | 21.0 | 21.6 | 40.6 | 42.6 |
| Mesquite | 14.6 | 4.3 | 37.1 | 8.1 |
| Peak Mines | 4.2 | 6.8 | 10.0 | 12.8 |
| Cerro San Pedro | 0.3 | 9.7 | 0.5 | 20.9 |
| Rainy River | 32.9 | 15.3 | 51.9 | $24.1 |
| Blackwater | 1.0 | 2.6 | 3.0 | $8.3 |
| Corporate | - | - | - | 0.1 |
| Total Capital Expenditures | 73.9 | 60.3 | 143.1 | 116.9 |
Financing Activities
Cash used in financing activities were primarily related to interest paid on the Senior Unsecured Notes.
In the opinion of management, the working capital at June 30, 2015, together with cash flows from operations, are sufficient to support the Company’s normal operating requirements on an ongoing basis. New Gold is not required to fund any of the development capital for El Morro, as under the agreement with Goldcorp, the Company’s 30% share is fully funded and both principal and interest will be repaid solely from future cash generated from New Gold’s share of El Morro’s distributable cash flows. The company has outstanding notes in the principal amount of $300 million maturing in 2020 and $500 million maturing in 2022. Assuming the continuation of prevailing commodity prices and exchange rates, operations perform in accordance with mine plans, and successful construction of Rainy River on schedule, the Company could choose to repay this indebtedness from internally generated cash, depending on management’s views on the attractiveness of other uses of such cash. The Company will decide whether to repay or refinance some or all of such note indebtedness before the respective stated maturities.
The Company’s future operating cash flow and cash position are highly dependent on metal prices, including gold, silver and copper, as well as other factors. Taking into consideration the Company’s current cash position, volatile equity markets, global uncertainty in the capital markets and increasing cost pressures, the Company is continually reviewing expenditures and assessing business opportunities to enhance liquidity in order to ensure adequate liquidity and flexibility to support its growth strategy, including the development of its projects, while continuing production at its current operations. A period of continuous low gold and copper prices may necessitate the deferral of capital expenditures which may impact the timing of development work and project completion, as well as production from mining operations.
Subsequent to the end of the quarter, on July 20, 2015 the Company entered into a streaming transaction with Royal Gold. Under the terms of the agreement, Royal Gold will provide New Gold with a deposit of $175 million in exchange for the delivery by New Gold of a percentage of the future gold and silver production from the Rainy River project. Royal Gold paid $100 million of the deposit concurrent with entering into the transaction and the remaining $75 million will be paid when 60% of the estimated project development capital has been spent and other customary conditions precedent are met. Based on the currently planned timing of development capital expenditures at Rainy River, it is estimated that 60% of the project development costs will have been spent by mid-2106.
| 42 | WWW.NEWGOLD.COM TSX:NGD NYSE MKT:NGD |
|
Upon the start of production at Rainy River, New Gold will deliver 6.50% of the project’s monthly gold production and 60% of the monthly silver production to Royal Gold until a total of 230,000 ounces of gold and 3.1 million ounces of silver have been delivered (the “Ounce Thresholds”). Once each of the Ounce Thresholds have been satisfied, the stream percentage for that metal will decrease by 50% such that New Gold will be required to deliver 3.25% of the project’s gold production and 30% of the silver production. In addition to the $175 million deposit, Royal Gold will be required to pay New Gold in cash 25% of the average spot gold price and silver price for the prior month at the time the stream ounces are delivered.
The streaming transaction enabled New Gold to secure over 20% of the remaining development capital costs for less than 6% of the project’s estimated future revenues at today’s metal prices. The transaction increases the project’s rate of return for New Gold equity holders and, importantly, was structured to maximize the company’s exposure to both the continued exploration potential of the Rainy River district and long-term gold and silver prices. Refer to the “Corporate Development” section of this MD&A for more information.
New Gold’s June 30, 2015 cash balance of $326.8 million together with Royal Gold’s full $175.0 million deposit and the amount available for drawdown under New Gold’s revolving credit facility provide the Company with approximately $738 million of liquidity relative to Rainy River’s remaining project development capital of approximately $760 million.
Commitments
The Company has entered into a number of contractual commitments for capital items related to operations and development. At June 30, 2015, these commitments totalled $320.1 million, $263.1 of which are expected to fall due over the next 12 months. This compares to commitments of $243.0 million at December 31, 2014, $141.4 million of which were expected to fall due over the next 12 months. The increase is due to Rainy River entering into additional capital purchase commitments. Certain contractual commitments may contain cancellation clauses, however the Company discloses the commitments based on management’s intent to fulfill the contacts.
Contingencies
In assessing the loss contingencies related to legal proceedings that are pending against the Company or unasserted claims that may result in such proceedings, the Company and its legal counsel evaluate the perceived merits of any legal proceedings or unasserted claims as well as the perceived merits of the amount of relief sought or expected to be sought. If the assessment of a contingency suggests that a loss is probable, and the amount can easily be estimated, then a loss is recorded. When a contingent loss is not probable but is reasonably possible, or is probable but the amount of the loss cannot be reliably estimated, then details of the contingent loss are disclosed. Loss contingencies considered remote are generally not disclosed unless they involve guarantees, in which case the Company discloses the nature of the guarantees. Legal fees incurred in connection with pending legal proceedings are expensed as incurred. If the Company is unable to resolve these disputes favourably, it may have a material adverse impact on our financial condition, cash flow and results of operations.
Cerro San Pedro Mine
After public consultation, on March 2011, the municipality of Cerro de San Pedro approved a new municipal land use plan, which clearly designates the area of the Cerro San Pedro Mine for mining. New Gold believes this plan resolves any ambiguity regarding the land use in the area in which Cerro San Pedro is located, and which has had a history of ongoing legal challenges related to the environmental authorization (“EIS”) for the mine. In April 2011, a request was filed for a new EIS based on the new Municipal Plan and on August 5, 2011 a new EIS was granted. The new EIS is subject to a number of ongoing conditions that will need to be fulfilled through the continued operation and eventual closure of the mine. In addition, some authorizations necessary for the operation of the Cerro San Pedro Mine have durations of one year or one quarter, or other periods that are shorter than the remaining mine life. In January 2015 the Municipality of Cerro de San Pedro advised that the issue of MSX’s annual license would be subject to numerous inappropriate conditions. On February 3, 2015 the State Contentious and Administrative Tribunal granted MSX an injunction against the Municipality ensuring the continued operation of the mine pending the Tribunal’s ruling on the inappropriate conditions. Prior to the Tribunal making its ruling, the Municipality and MSX reached a settlement which resulted in the removal of the inappropriate conditions and the granting of MSX’s annual operations license in May 2015. While the outstanding issues regarding the 2015 annual operations license have been resolved it is possible that authorizations required in the future, including the annual operation license, may also be subject to inappropriate conditions. This could result in a suspension or termination of operations at the Cerro San Pedro Mine and/or additional costs, any of which could adversely affect the Company’s production, cash flow and profitability.
| 43 | WWW.NEWGOLD.COM TSX:NGD NYSE MKT:NGD |
|
Contractual Obligations
The following is a summary of the Company’s payments due under contractual obligations:
| As at June 30, 2015 | |||||
| (in millions of U.S. dollars, except where noted) | > 1 year | 2-3 Years | 4-5 Years | After 5 Years | Total | |
| CONTRACTUAL OBLIGATIONS(1) | ||||||
| Long-term debt | - | - | - | 892.7 | 892.7 | |
| Interest payable on long-term debt | 52.3 | 104.5 | 100.1 | 74.2 | 331.1 | |
| Operating Lease commitments | 11.7 | 1.0 | 0.9 | - | 13.6 | |
| Capital expenditure commitments | 263.1 | 57.0 | - | - | 320.1 | |
| Reclamation and closure cost obligations | 2.9 | 2.3 | 6.6 | 81.4 | 93.2 | |
| Total contractual obligations | 330.0 | 164.8 | 107.6 | 1,048.3 | 1,650.7 | |
| 1. | The majority of the Company’s contractual obligations consist of long-term debt and interest payable. Long-term debt obligations are comprised of Senior Unsecured Notes issued on April 5, 2013 and November 15, 2013. Refer to the section “Financial Condition Review – Balance Sheet Review – Long-term debt” for further details. |
Related Party Transactions
The Company did not enter into any related party transactions during the six months ended June 30, 2015.
Off-Balance Sheet Arrangements
The Company has no off-balance sheet arrangements.
Outstanding Shares
As at July 28, 2015, there were 509,087,414 common shares of the Company outstanding. The Company had 14,098,204 stock options outstanding under its share option plan, exercisable for up to 14,098,204 common shares. In addition, there are warrants outstanding exercisable for up to 28,114,398 common shares.
| 44 | WWW.NEWGOLD.COM TSX:NGD NYSE MKT:NGD |
|
NON-GAAP FINANCIAL PERFORMANCE MEASURES
Total Cash Costs per Gold Ounce
“Total cash costs per gold ounce” is a common financial performance measure in the gold mining industry but with no standard meaning under IFRS. New Gold reports total cash costs on a sales basis. The Company believes that, in addition to conventional measures prepared in accordance with IFRS, certain investors use this information to evaluate the Company’s performance and ability to generate liquidity through operating cash flow to fund future capital expenditures and working capital needs. New Gold believes that this measure, along with sales, is a key indicator of a company’s ability to generate operating earnings and cash flow from its mining operations.
Total cash costs figures are calculated in accordance with a standard developed by The Gold Institute, a worldwide association of suppliers of gold and gold products that ceased operations in 2002. Adoption of the standard is voluntary and the cost measures presented may not be comparable to other similarly titled measures of other companies. Total cash costs include mine site operating costs such as mining, processing and administration costs, royalties, production taxes and realized gains and losses on fuel contracts, but are exclusive of amortization, reclamation, capital and exploration costs and net of by-product sales. Total cash costs are then divided by gold ounces sold to arrive at the total cash costs per ounce sold.
The Company produces copper and silver as by-products of its gold production. The calculation of total cash costs per gold ounce for Cerro San Pedro is net of by-product silver sales revenue, and the calculation of total cash costs per gold ounce sold for Peak Mines and New Afton is net of by-product silver and copper sales revenue. New Gold notes that in connection with New Afton, the copper by-product revenue is sufficiently large to result in a negative total cash cost on a single mine basis. Notwithstanding this by-product contribution, as a company focused on gold production, New Gold aims to assess the economic results of its operations in relation to gold, which is the primary driver of New Gold’s business. New Gold believes this metric is of interest to its investors, who invest in the Company primarily as a gold mining company. To determine the relevant costs associated with gold only, New Gold believes it is appropriate to reflect all operating costs, as well as any revenue related to metals other than gold that are extracted in its operations.
To provide additional information to investors, New Gold has also calculated total cash costs on a co-product basis, which removes the impact of other metal sales that are produced as a by-product of gold production and apportions the cash costs to each metal produced on a percentage of revenue basis, and subsequently divides the amount by the total gold ounces, silver ounces or pounds of copper sold, as the case may be, to arrive at per ounce or per pound figures. Unless indicated otherwise, all total cash cost information in this MD&A is net of by-product sales.
Total cash costs are intended to provide additional information only and do not have any standardized meaning under IFRS and may not be comparable to similar measures presented by other mining companies. They should not be considered in isolation or as a substitute for measures of performance prepared in accordance with IFRS. The measure is not necessarily indicative of cash flow from operations under IFRS or operating costs presented under IFRS.
All-in Sustaining Costs per Gold Ounce
“All-in sustaining costs per gold ounce” is a non-GAAP measure based on guidance announced by the World Gold Council (“WGC”) in June 2013. The WGC is a non-profit association of the world’s leading gold mining companies established in 1987 to promote the use of gold to industry, consumers and investors. The WGC is not a regulatory body and does not have the authority to develop accounting standards or disclosure requirements. The WGC has worked with its member companies, including New Gold, to develop a measure that expands on IFRS measures such as operating expenses and non-GAAP measures to provide visibility into the economics of a gold mining company. Current IFRS measures used in the gold industry, such as operating expenses, do not capture all of the expenditures incurred to discover, develop and sustain gold production. New Gold believes the all-in sustaining costs measure provides further transparency into costs associated with producing gold and will assist analysts, investors and other stakeholders of the Company in assessing its operating performance, its ability to generate free cash flow from current operations and its overall value.
| 45 | WWW.NEWGOLD.COM TSX:NGD NYSE MKT:NGD |
|
All-in sustaining costs per gold ounce is intended to provide additional information only and does not have any standardized meaning under IFRS and may not be comparable to similar measures presented by other mining companies. It should not be considered in isolation or as a substitute for measures of performance prepared in accordance with IFRS. The measure is not necessarily indicative of cash flow from operations under IFRS or operating costs presented under IFRS.
New Gold defines all-in sustaining costs per ounce as the sum of total cash costs, capital expenditures that are sustaining in nature, corporate general and administrative costs, capitalized and expensed exploration that is sustaining in nature, and environmental reclamation costs, all divided by the total gold ounces sold to arrive at a per ounce figure. To determine sustaining capital expenditures, New Gold uses cash flow related to mining interests from its statement of cash flows and deducts any expenditures that are non-sustaining. Capital expenditures to develop new operations or capital expenditures related to major projects at existing operations where these projects will materially increase production are classified as non-sustaining and are excluded. The table “Sustaining Capital Expenditure Reconciliation” reconciles New Gold’s sustaining capital to its cash flow statement. The definition of sustaining versus non-sustaining is similarly applied to capitalized and expensed exploration costs. Exploration costs to develop new operations or that relate to major projects at existing operations where these projects are expected to materially increase production are classified as non-sustaining and are excluded.
Costs excluded from all-in sustaining costs are non-sustaining capital expenditures and exploration costs, financing costs, tax expense, transaction costs associated with mergers and acquisitions, and any items that are deducted for the purposes of adjusted earnings.
By including total cash costs as a component of all-in sustaining costs, the measure deducts by-product revenue from gross cash costs. Refer to the discussion above regarding total cash costs per gold ounce for the discussion of deduction of by-product revenue.
| 46 | WWW.NEWGOLD.COM TSX:NGD NYSE MKT:NGD |
|
Cash Costs and All-in Sustaining Costs (“AISC”) per Ounce Reconciliation Tables
The following table reconciles these non-GAAP measures to the most directly comparable IFRS measure on an aggregate and mine by mine basis.
| Three months ended June 30 | Six months ended June 30 | |||
| (in millions of U.S. dollars, except where noted) | 2015 | 2014 | 2015 | 2014 |
| Total cash costs AND AISC reconciliation | ||||
| Operating expenses | 98.2 | 95.3 | 197.8 | 193.8 |
| Treatment and refining charges on concentrate sales | 8.5 | 8.7 | 15.9 | 17.5 |
| Adjustments(1) | 1.0 | 0.5 | 1.7 | 0.4 |
| Total cash costs before by-product revenue | 107.7 | 104.5 | 215.4 | 211.7 |
| By-product copper and silver sales | (71.7) | (83.2) | (134.5) | (166.5) |
| Total cash costs net of by-product revenue | 36.0 | 21.3 | 80.9 | 45.2 |
| Gold ounces sold | 87,754 | 84,736 | 180,152 | 178,788 |
| Total cash costs per gold ounce sold ($/ounce) | 410 | 251 | 449 | 253 |
| Total cash costs per gold ounce sold on a co-product basis(2) ($/ounce) | 704 | 682 | 717 | 670 |
| Total cash costs net of by-product revenue | 36.0 | 21.3 | 80.9 | 45.2 |
| Sustaining capital expenditures(3) | 35.7 | 26.5 | 73.4 | 54.1 |
| Sustaining exploration - expensed and capitalized | 1.2 | 4.2 | 3.2 | 6.3 |
| Corporate G&A including share-based compensation(4) | 7.1 | 9.9 | 15.1 | 18.2 |
| Reclamation expenses | 0.9 | 1.2 | 2.0 | 2.7 |
| Total all-in sustaining costs | 80.9 | 63.1 | 174.6 | 126.5 |
| All-in sustaining costs per gold ounce sold ($/ounce) | 922 | 745 | 969 | 707 |
| All-in sustaining costs per gold ounce sold on a co-product basis(2) ($/ounce) | 1,007 | 974 | 1,038 | 935 |
| 1. | Adjustments include non-cash items related to inventory write-downs. |
| 1. | Amounts presented on a co-product basis remove the impact of other metal sales that are produced as a by-product of our gold production and apportions the cash costs to each metal produced on a percentage of revenue basis. |
| 2. | See “Total Sustaining Capital Expenditure Reconciliation” below to reconcile sustaining capital expenditures to mining interests per the statement of cash flows. |
| 3. | Includes the sum of corporate administration costs and share-based payment expense per the income statement, net of any non-cash depreciation within those figures. |
| 47 | WWW.NEWGOLD.COM TSX:NGD NYSE MKT:NGD |
|
| Three months ended June 30 | Six months ended June 30 | |||
| (in millions of U.S. dollars, except where noted) | 2015 | 2014 | 2015 | 2014 |
| NEW AFTON cash costs and AISC reconciliation | ||||
| Operating expenses | 25.9 | 24.7 | 50.6 | 48.8 |
| Treatment and refining charges on concentrate sales | 7.1 | 7.0 | 13.4 | 14.5 |
| New Afton cash costs before by-product revenue | 33.0 | 31.7 | 63.9 | 63.3 |
| By-product copper and silver sales | (55.8) | (62.9) | (105.8) | (128.9) |
| New Afton cash costs net of by-product revenue | (22.8) | (31.2) | (41.9) | (65.6) |
| Gold ounces sold | 24,245 | 24,713 | 47,124 | 51,557 |
| New Afton cash costs per gold ounce sold ($/ounce) | (940) | (1,262) | (889) | (1,273) |
| New Afton cash costs per gold ounce sold on a co-product basis(1) ($/ounce) | 466 | 442 | 480 | 427 |
| New Afton cash costs net of by-product revenue | (22.8) | (31.2) | (41.9) | (65.6) |
| Sustaining capital expenditures(2) | 16.7 | 14.1 | 27.4 | 30.4 |
| Reclamation expenses | 0.4 | 0.3 | 0.6 | 0.6 |
| New Afton all-in sustaining costs | (5.7) | (16.8) | (13.9) | (34.6) |
| All-in sustaining costs per gold ounce sold ($/ounce) | (235) | (678) | (295) | (671) |
| All-in sustaining costs per gold ounce sold on a co-product basis(1) ($/ounce) | 708 | 643 | 689 | 636 |
| 1. | Amounts presented on a co-product basis remove the impact of other metal sales that are produced as a by-product of our gold production and apportions the cash costs to each metal produced on a percentage of revenue basis. |
| 2. | See “New Afton Sustaining Capital Expenditure Reconciliation” below to reconcile sustaining capital expenditures to capital expenditures per the segmented information note. |
| Three months ended June 30 | Six months ended June 30 | |||
| (in millions of U.S. dollars, except where noted) | 2015 | 2014 | 2015 | 2014 |
| Mesquite cash costs and AISC reconciliation | ||||
| Operating expenses | 17.8 | 15.1 | 42.2 | 39.8 |
| Adjustments | 0.1 | 0.1 | 0.5 | 0.4 |
| Mesquite cash costs | 17.9 | 15.2 | 42.7 | 40.2 |
| Gold ounces sold | 21,391 | 15,347 | 49,225 | 43,329 |
| Mesquite cash costs per gold ounce sold ($/ounce) | 839 | 993 | 867 | 928 |
| Mesquite cash costs | 17.9 | 15.2 | 42.7 | 40.2 |
| Sustaining capital expenditures(1) | 14.6 | 4.3 | 37.1 | 8.1 |
| Sustaining exploration - expensed and capitalized | - | 1.9 | - | 2.9 |
| Reclamation expenses | 0.2 | 0.2 | 0.5 | 0.4 |
| Mesquite all-in sustaining costs | 32.8 | 21.7 | 80.3 | 51.6 |
| All-in sustaining costs per gold ounce sold ($/ounce) | 1,533 | 1,413 | 1,632 | 1,191 |
| 1. | For the periods presented all capital expenditures at Mesquite per the segmented information note were sustaining capital expenditures. |
| 48 | WWW.NEWGOLD.COM TSX:NGD NYSE MKT:NGD |
|
| Three months ended June 30 | Six months ended June 30 | |||
| (in millions of U.S. dollars, except where noted) | 2015 | 2014 | 2015 | 2014 |
| Peak Mines cash costs and AISC reconciliation | ||||
| Operating expenses | 23.9 | 29.6 | 48.4 | 53.8 |
| Treatment and refining charges on concentrate sales | 1.4 | 1.7 | 2.5 | 3.0 |
| Adjustments(1) | 0.7 | - | 0.2 | - |
| Peak Mines cash costs before by-product revenue | 25.9 | 31.3 | 51.1 | 56.8 |
| By-product copper and silver sales | (9.9) | (13.9) | (18.4) | (24.5) |
| Peak Mines cash costs net of by-product revenue | 16.0 | 17.4 | 32.7 | 32.3 |
| Gold ounces sold | 13,837 | 27,739 | 33,566 | 47,536 |
| Peak Mines cash costs per gold ounce sold ($/ounce) | 1,157 | 627 | 974 | 680 |
| Peak Mines cash costs per gold ounce sold on a co-product basis(2) ($/ounce) | 1,141 | 799 | 1,026 | 841 |
| Peak Mines cash costs net of by-product revenue | 16.0 | 17.4 | 32.7 | 32.3 |
| Sustaining Capital Expenditures(3) | 4.0 | 5.6 | 8.4 | 10.9 |
| Sustaining exploration - expensed and capitalized | 1.1 | 2.2 | 3.2 | 3.4 |
| Reclamation expenses | 0.3 | 0.6 | 0.6 | 0.9 |
| Peak Mines all-in sustaining costs | 21.4 | 25.8 | 44.9 | 47.5 |
| All-in sustaining costs per gold ounce sold ($/ounce) | 1,549 | 928 | 1,337 | 1,000 |
| All-in sustaining costs per gold ounce sold on a co-product basis(2) ($/ounce) | 1,386 | 1,016 | 1,276 | 1,070 |
| 1. | Adjustments include non-cash items related to inventory write-downs. |
| 2. | Amounts presented on a co-product basis remove the impact of other metal sales that are produced as a by-product of our gold production and apportions the cash costs to each metal produced on a percentage of revenue basis. |
| 3. | For the periods presented all capital expenditures at Peak Mines per the segmented information note were sustaining capital expenditures. |
| 49 | WWW.NEWGOLD.COM TSX:NGD NYSE MKT:NGD |
|
| Three months ended June 30 | Six months ended June 30 | |||||
| (in millions of U.S. dollars, except where noted) | 2015 | 2014 | 2015 | 2014 | ||
| Cerro San Pedro cash costs and AISC reconciliation | ||||||
| Operating expenses | 30.6 | 25.9 | 56.6 | 51.4 | ||
| Adjustments(1) | 0.2 | 0.4 | 1.0 | - | ||
| Cerro San Pedro cash costs before by-product revenue | 30.9 | 26.3 | 57.6 | 51.4 | ||
| By-product silver sales | (6.0) | (6.5) | (10.2) | (13.2) | ||
| Cerro San Pedro cash costs net of by-product revenue | 24.9 | 19.8 | 47.4 | 38.2 | ||
| Gold ounces sold | 28,281 | 16,937 | 50,237 | 36,366 | ||
| Cerro San Pedro cash costs per gold ounce sold ($/ounce) | 879 | 1,169 | 944 | 1,051 | ||
| Cerro San Pedro cash costs per gold ounce sold on a co-product basis(2) ($/ounce) | 926 | 1,196 | 981 | 1,103 | ||
| Cerro San Pedro cash costs net of by-product revenue | 24.9 | 19.8 | 47.4 | 38.2 | ||
| Sustaining capital expenditures(3) | 0.3 | 2.4 | 0.5 | 4.7 | ||
| Reclamation expenses | 0.0 | 0.2 | 0.1 | 0.5 | ||
| Cerro San Pedro all-in sustaining costs | 25.1 | 22.4 | 48.0 | 43.4 | ||
| All-in sustaining costs per gold ounce sold ($/ounce) | 889 | 1,322 | 955 | 1,193 | ||
| All-in sustaining costs per gold ounce sold on a co-product basis(2) ($/ounce) | 934 | 1,315 | 991 | 1,214 | ||
| 1. | Adjustments include non-cash items related to inventory write-downs. |
| 2. | Amounts presented on a co-product basis remove the impact of other metal sales that are produced as a by-product of our gold production and apportions the cash costs to each metal produced on a percentage of revenue basis. |
| 3. | See “Cerro San Pedro Sustaining Capital Expenditure Reconciliation” below to reconcile sustaining capital expenditures to capital expenditures per the segmented information note. |
Sustaining Capital Expenditure Reconciliation Tables
| Three months ended June 30 | Six months ended June 30 |
| (in millions of U.S. dollars, except where noted) | 2015 | 2014 | 2015 | 2014 |
| Total sustaining capital expenditure | ||||
| Mining Interests per statement of cash flows(1) | 73.9 | 60.3 | 143.1 | 116.9 |
| New Afton growth capital expenditure (2) | (4.3) | (7.5) | (13.2) | (12.2) |
| Cerro San Pedro growth capital expenditure(3) | - | (7.7) | - | (16.2) |
| Rainy River growth capital expenditure | (32.9) | (15.3) | (51.9) | (24.1) |
| Blackwater growth capital expenditure | (1.0) | (2.6) | (3.0) | (8.3) |
| Sustaining capitalized exploration included in mining interests | - | (1.1) | (1.5) | (1.9) |
| Total sustaining capital expenditures | 35.7 | 26.1 | 73.5 | 54.1 |
| 1. | Current year and prior year growth capital expenditures at New Afton relate to the mill expansion and scoping study/preliminary economic assessment and exploration for the C-zone. |
| 2. | Growth capital expenditures at Cerro San Pedro related to capitalized stripping costs for Phase 5 in the prior-year period. |
| Three months ended June 30 | Six months ended June 30 |
| (in millions of U.S. dollars, except where noted) | 2015 | 2014 | 2015 | 2014 |
| New Afton sustaining capital expenditure | ||||
| Capital expenditure per segmented information | 21.0 | 21.6 | 40.6 | 42.6 |
| New Afton growth capital expenditure (1) | (4.3) | (7.5) | (13.2) | (12.2) |
| New Afton sustaining capital expenditures | 16.7 | 14.1 | 27.4 | 30.4 |
| 1. | Current year and prior year growth capital expenditures at New Afton relate to the mill expansion and scoping study/preliminary economic assessment and exploration for the C-zone. |
| 50 | WWW.NEWGOLD.COM TSX:NGD NYSE MKT:NGD |
|
| Three months ended June 30 | Six months ended June 30 |
| (in millions of U.S. dollars, except where noted) | 2015 | 2014 | 2015 | 2014 |
| Cerro San Pedro sustaining capital expenditure | ||||
| Capital expenditure per segmented information | 0.3 | 2.4 | 0.5 | 4.7 |
| Cerro San Pedro growth capital expenditure (1) | - | (7.3) | - | (16.2) |
| Cerro San Pedro sustaining capital expenditures | 0.3 | 9.7 | 0.5 | 20.9 |
| 1. | Growth capital expenditures at Cerro San Pedro related to capitalized stripping costs for Phase 5 in the prior-year period. |
Adjusted Net Earnings and Adjusted Net Earnings per Share
“Adjusted net earnings” and “adjusted net earnings per share” are non-GAAP financial measures with no standard meaning under IFRS which excludes the following from net earnings:
| · | Impairment losses; |
| · | Inventory write-downs; |
| · | Gains (losses) on Fair Value through Profit and Loss financial assets; |
| · | Ineffectiveness of hedging instruments and monetization of the Company’s legacy hedge position; |
| · | Fair value changes on share purchase warrants; |
| · | Gains (losses) on foreign exchange; and |
| · | Other non-recurring items. |
Net earnings have been adjusted, including the associated tax impact, for the group of costs in “Other gains and losses” on the condensed consolidated income statements. Key entries in this grouping are: the fair value changes for share purchase warrants, foreign exchange gain or loss and other non-recurring items. Other adjustments to net earnings also include the non-cash accounting charge as the loss incurred on the monetization of the Company’s legacy hedge position is realized into income over the original term of the hedge contract, which is included in revenue. The adjusted entries are also impacted for tax to the extent that the underlying entries are impacted for tax in the unadjusted net loss. As the loss on the fair value change of non-hedged derivatives is only minimally tax affected in unadjusted net loss, the reversal of tax on an adjusted basis is also minimal.
The Company uses this measure for its own internal purposes. Management’s internal budgets and forecasts and public guidance do not reflect fair value changes on senior notes and non-hedged derivatives, foreign currency translation and fair value through profit or loss and financial asset gains/losses. Consequently, the presentation of adjusted net earnings enables investors and analysts to better understand the underlying operating performance of our core mining business through the eyes of management. Management periodically evaluates the components of adjusted net earnings based on an internal assessment of performance measures that are useful for evaluating the operating performance of our business and a review of the non-GAAP measures used by mining industry analysts and other mining companies.
Adjusted net earnings is intended to provide additional information only and does not have any standardized meaning under IFRS and may not be comparable to similar measures presented by other companies. It should not be considered in isolation or as a substitute for measures of performance prepared in accordance with IFRS. The measure is not necessarily indicative of operating profit or cash flows from operations as determined under IFRS.
| 51 | WWW.NEWGOLD.COM TSX:NGD NYSE MKT:NGD |
|
The following table reconciles this non-GAAP measure to the most directly comparable IFRS measure.
| Three months ended June 30 | Six months ended June 30 |
| (in millions of U.S. dollars, except where noted) | 2015 | 2014 | 2015 | 2014 |
| adjusted net earnings (LOSS) reconciliation | ||||
| Net earnings (loss) before taxes | 10.3 | 17.0 | (26.7) | 22.5 |
| Loss (gain) on disposal of assets | 0.7 | - | 0.6 | (0.3) |
| Realized and unrealized (gain) loss on non-hedged derivatives | (7.0) | 7.1 | (11.5) | 4.8 |
| (Gain) loss on foreign exchange | (4.2) | (15.8) | 31.8 | 3.0 |
| Other (1) | (0.6) | 0.2 | (0.8) | 0.2 |
| Loss on hedge monetization over original term of hedge | - | 6.9 | - | 13.7 |
| Adjusted net earnings (loss) before tax | (0.8) | 15.4 | (6.6) | 43.9 |
| Income tax expense | (0.9) | (0.8) | (7.7) | (8.1) |
| Income tax adjustments | 0.4 | (6.4) | 7.9 | (9.4) |
| Adjusted income tax expense | (0.5) | (7.2) | 0.2 | (17.5) |
| Adjusted net (loss) earnings | (1.3) | 8.2 | (6.4) | 26.4 |
| Adjusted earnings (loss) per share (basic) | (0.00) | 0.02 | (0.01) | 0.05 |
| Adjusted effective tax rate | 68% | (47%) | (2%) | (40%) |
| 1. | Other includes the reversal of net realizable provisions recorded in prior year periods. |
Net Cash Generated from operations, before changes in non-cash working capital
“Net cash generated from operations, before changes in non-cash working capital” is a non-GAAP financial measure with no standard meaning under IFRS, which excludes changes in non-cash operating working capital. Management uses this measure to evaluate the Company’s ability to generate cash from its operations before temporary working capital changes.
Net cash generated from operations, before non-cash changes in working capital is intended to provide additional information only and does not have any standardized meaning under IFRS; it should not be considered in isolation or as a substitute for measures of performance prepared in accordance with IFRS. Other companies may calculate this measure differently and this measure is unlikely to be comparable to similar measures presented by other companies.
| Three months ended June 30 | Six months ended June 30 |
| (in millions of U.S. dollars, except where noted) | 2015 | 2014 | 2015 | 2014 |
| net cash reconciliation | ||||
| Net cash (used) generated from operations | 56.9 | 59.3 | 126.7 | 140.7 |
| Add back (deduct): Change in non-cash operating working capital | 5.8 | 12.6 | 3.4 | 21.3 |
| Net cash generated from operations before changes in non-cash working capital | 62.7 | 71.9 | 130.1 | 162.0 |
Operating Margin
“Operating margin” is a non-GAAP financial measure with no standard meaning under IFRS, which management uses to evaluate the Company’s aggregated and min-by-mine contribution to net earnings before non-cash depreciation and depletion charges. Operating margin is calculated as revenues less operating expenses and therefore does not include depreciation and depletion.
| 52 | WWW.NEWGOLD.COM TSX:NGD NYSE MKT:NGD |
|
Operating margin is intended to provide additional information only and does not have any standardized meaning under IFRS; it should not be considered in isolation or as a substitute for measures of performance prepared in accordance with IFRS. Other companies may calculate this measure differently and this measure is unlikely to be comparable to similar measures presented by other companies. The following tables reconcile this non-GAAP measure to the most directly comparable IFRS measure on an aggregated and mine-by-mine basis.
Operating Margin Reconciliation Tables
| Three months ended June 30 | Six months ended June 30 |
| (in millions of U.S. dollars, except where noted) | 2015 | 2014 | 2015 | 2014 |
| TOTAL OPERATING MARGIN | ||||
| Revenues | 167.7 | 178.1 | 336.6 | 368.6 |
| Less: Operating expenses | (98.2) | (95.3) | (197.8) | (193.8) |
| Total operating margin | 69.5 | 82.8 | 138.8 | 174.8 |
| Three months ended June 30 | Six months ended June 30 |
| (in millions of U.S. dollars, except where noted) | 2015 | 2014 | 2015 | 2014 |
| New Afton OPERATING MARGIN | ||||
| Revenues | 77.6 | 88.9 | 150.2 | 183.2 |
| Less: Operating expenses | (25.9) | (24.7) | (50.6) | (48.8) |
| New Afton operating margin | 51.7 | 64.2 | 99.6 | 134.4 |
| Three months ended June 30 | Six months ended June 30 |
| (in millions of U.S. dollars, except where noted) | 2015 | 2014 | 2015 | 2014 |
| Mesquite OPERATING MARGIN | ||||
| Revenues | 25.5 | 12.8 | 59.3 | 42.0 |
| Less: Operating expenses | (17.8) | (15.1) | (42.2) | (39.8) |
| Mesquite operating margin | 7.6 | (2.3) | 17.1 | 2.2 |
| Three months ended June 30 | Six months ended June 30 |
| (in millions of U.S. dollars, except where noted) | 2015 | 2014 | 2015 | 2014 |
| Peak Mines OPERATING MARGIN | ||||
| Revenues | 24.9 | 48.2 | 56.4 | 83.4 |
| Less: Operating expenses | (23.9) | (29.6) | (48.4) | (53.8) |
| Peak Mines operating margin | 1.0 | 18.6 | 8.0 | 29.6 |
| Three months ended June 30 | Six months ended June 30 |
| (in millions of U.S. dollars, except where noted) | 2015 | 2014 | 2015 | 2014 |
| CERRO San Pedro OPERATING MARGIN | ||||
| Revenues | 39.7 | 28.2 | 70.7 | 60.0 |
| Less: Operating expenses | (30.6) | (25.9) | (56.6) | (51.4) |
| Cerro San Pedro operating margin | 9.1 | 2.3 | 14.1 | 8.6 |
| 53 | WWW.NEWGOLD.COM TSX:NGD NYSE MKT:NGD |
|
Average Realized Price
“Average realized price per ounce of gold sold” is a non-GAAP financial measure with no standard meaning under IFRS. Management uses this measure to better understand the price realized in each reporting period for gold sales. Average realized price excludes from revenues unrealized gains and losses on non-hedged derivative contracts and the revenue reduction related to the non-cash accounting charge as the loss incurred on the monetization of the Company’s legacy hedge position is realized into income over the original term of the hedge contract.
Average realized price is intended to provide additional information only and does not have any standardized meaning under IFRS; it should not be considered in isolation or as a substitute for measures of performance prepared in accordance with IFRS. Other companies may calculate this measure differently and this measure is unlikely to be comparable to similar measures presented by other companies. The following tables reconcile this non-GAAP measure to the most directly comparable IFRS measure on an aggregated and mine-by-mine basis.
Average Realized Price Reconciliation Tables
| Three months ended June 30 | Six months ended June 30 |
| (in millions of U.S. dollars, except where noted) | 2015 | 2014 | 2015 | 2014 |
| Total AVERAGE REALIZED PRICE | ||||
| Revenues from gold sales | 101.4 | 99.9 | 211.7 | 212.4 |
| Treatment and refining charges on gold concentrate sales | 3.3 | 3.7 | 6.5 | 7.4 |
| Loss on hedge monetization over original term of hedge | - | 6.9 | - | 13.7 |
| Gross revenue from gold sales | 104.7 | 110.5 | 218.2 | 233.5 |
| Gold ounces sold | 87,754 | 84,736 | 180,152 | 178,788 |
| Total average realized price per gold ounce sold | 1,191 | 1,304 | 1,210 | 1,306 |
| Three months ended June 30 | Six months ended June 30 |
| (in millions of U.S. dollars, except where noted) | 2015 | 2014 | 2015 | 2014 |
| new afton AVERAGE REALIZED PRICE | ||||
| Revenues from gold sales | 26.6 | 30.6 | 53.1 | 63.8 |
| Treatment and refining charges on gold concentrate sales | 2.4 | 2.4 | 4.7 | 5.1 |
| Gross revenue from gold sales | 29.0 | 33.0 | 57.8 | 68.9 |
| Gold ounces sold | 24,245 | 24,713 | 47,124 | 51,557 |
| New Afton average realized price per gold ounce sold | 1,198 | 1,337 | 1,227 | 1,334 |
| Three months ended June 30 | Six months ended June 30 |
| (in millions of U.S. dollars, except where noted) | 2015 | 2014 | 2015 | 2014 |
| Mesquite AVERAGE REALIZED PRICE | ||||
| Revenues from gold sales | 25.5 | 12.8 | 59.3 | 42.0 |
| Loss on hedge monetization over original term of hedge | - | 6.9 | - | 13.7 |
| Gross revenue from gold sales | 25.5 | 19.7 | 59.3 | 55.7 |
| Gold ounces sold | 21,391 | 15,347 | 49,225 | 43,329 |
| Mesquite average realized price per gold ounce sold | 1,190 | 1,283 | 1,204 | 1,290 |
| 54 | WWW.NEWGOLD.COM TSX:NGD NYSE MKT:NGD |
|
| Three months ended June 30 | Six months ended June 30 |
| (in millions of U.S. dollars, except where noted) | 2015 | 2014 | 2015 | 2014 |
| Peak Mines AVERAGE REALIZED PRICE | ||||
| Revenues from gold sales | 15.9 | 35.1 | 39.5 | 60.5 |
| Treatment and refining charges on gold concentrate sales | 0.5 | 0.8 | 1.0 | 1.4 |
| Gross revenue from gold sales | 16.4 | 35.9 | 40.5 | 61.9 |
| Gold ounces sold | 13,837 | 27,739 | 33,566 | 47,536 |
| Peak Mines average realized price per gold ounce sold | 1,184 | 1,294 | 1,208 | 1,303 |
| Three months ended June 30 | Six months ended June 30 |
| (in millions of U.S. dollars, except where noted) | 2015 | 2014 | 2015 | 2014 |
| Cerro San Pedro AVERAGE REALIZED PRICE | ||||
| Revenues from gold sales | 33.8 | 21.9 | 60.5 | 46.9 |
| Gold ounces sold | 28,281 | 16,937 | 50,237 | 36,366 |
| Cerro San Pedro average realized price per gold ounce sold | 1,189 | 1,289 | 1,202 | 1,290 |
ENTERPRISE RISK MANAGEMENT
Readers of this MD&A should give careful consideration to the information included or incorporated by reference in this document and the Company’s unaudited consolidated financial statements and related notes, as well as other continuous disclosure documents. Significant risk factors for the Company include metal prices, production and cost estimates, government regulations, foreign operations, environmental compliance, the ability to obtain additional financing, risk relating to recent acquisitions, dependence on management, title to the Company’s mineral properties, and litigation. For details of risk factors, please refer to the Company’s audited consolidated financial statements for the year ended December 31, 2014, corresponding management discussion and analysis and our latest Annual Information Form, filed on SEDAR at www.sedar.com.
General Risks
Environmental Risk
The Company is subject to environmental regulation in Canada, the United States, Australia and Mexico, where it operates, as well as in Canada and Chile with respect to its development properties. In addition, the Company will be subject to environmental regulation in any other jurisdictions in which it may operate or have development properties. These regulations address, among other things, endangered and protected species, emissions, noise, air, and water quality standards, land use and reclamation. The regulations also set out limitations on the generation, transportation, storage and disposal of solid, liquid and hazardous waste.
Environmental legislation is evolving in a manner which will require, in certain jurisdictions, stricter standards and enforcement, increased fines and penalties for non-compliance, more stringent environmental assessments of proposed projects and a heightened degree of responsibility for companies and their officers, directors and employees. No certainty exists that future changes in environmental regulation, or the application of such regulations, if any, will not adversely affect the Company’s operations or development properties. The Company cannot give any assurance that, notwithstanding its precautions, breaches of environmental laws (whether inadvertent or not) or environmental pollution will not materially and adversely affect its financial condition and results from operations. Environmental hazards may exist on the Company’s properties which are unknown to management at present and which have been caused by previous owners or operators of the properties.
| 55 | WWW.NEWGOLD.COM TSX:NGD NYSE MKT:NGD |
|
Failure to comply with any applicable laws, regulations or permitting requirements may result in enforcement actions against the Company, including orders issued by regulatory or judicial authorities causing operations to cease or be curtailed, and may include corrective measures requiring capital expenditures, installation of additional equipment or remedial actions. The Company could be forced to compensate those suffering loss or damage by reason of its mining operations or exploration or development activities and could face civil or criminal fines or penalties imposed for violations of applicable laws or regulations. Any such regulatory or judicial action could materially increase the Company’s operating costs and delay or curtail the Company’s operations.
Other Regulatory Risk
The Company is and will also be subject to other government regulations such as tax reforms in the Company’s operating jurisdictions.
A tax reform legislation was enacted by the Chilean government and published on September 29, 2014 in theChilean Official Gazette. The tax reform introduces substantial changes to the Chilean tax system and increased the tax rate in Chile from 20% to 35%.
New Gold continues to monitor the progress of changes in tax reform in the Company’s mining jurisdictions.
Financial Risk Management
The Company holds a mixture of financial instruments, which are classified and measured as follows. For a discussion of the methods used to value financial instruments, as well as any significant assumptions, refer to Note 2 to our audited consolidated financial statements for the year ended December 31, 2014.
| As at June 30, 2015 |
| (in millions of U.S. dollars, except where noted) | Loans and Receivables at amortized cost | Financial Instrument at fair value though Profit and Loss | Financial Instrument at fair value through OCI | Financial liabilities at amortized cost | Total |
| FINANCIAL ASSETS | |||||
| Cash and cash equivalents | 326.8 | - | - | - | 326.8 |
| Trade and other receivables | 25.0 | - | - | - | 25.0 |
| Provisionally priced contracts | - | (6.0) | - | - | (6.0) |
| Copper swap contracts | - | 3.8 | - | - | 3.8 |
| Investments | - | 0.4 | - | - | 0.4 |
| Diesel swap contracts | - | - | 0.3 | - | 0.3 |
| FINANCIAL LIABILITIES | |||||
| Trade and other payables(1) | - | - | - | 94.3 | 94.3 |
| Long-term debt | - | - | - | 879.3 | 879.3 |
| Warrants | - | 4.4 | - | - | 4.4 |
| Restricted share units | - | 1.6 | - | - | 1.6 |
| 1. | Trade and other payables exclude the short term portion of reclamation and closure cost obligations. |
| 56 | WWW.NEWGOLD.COM TSX:NGD NYSE MKT:NGD |
|
| As at December 31, 2014 |
| (in millions of U.S. dollars, except where noted) | Loans and Receivables at amortized cost | Financial Instrument at fair value though Profit and Loss | Financial Instrument at fair value through OCI | Financial liabilities at amortized cost | Total |
| FINANCIAL ASSETS | |||||
| Cash and cash equivalents | 370.5 | - | - | - | 370.5 |
| Trade and other receivables | 35.2 | - | - | - | 35.2 |
| Provisionally priced contracts | - | (8.4) | - | - | (8.4) |
| Copper swap contracts | - | 8.0 | - | - | 8.0 |
| Investments | - | 0.4 | - | - | 0.4 |
| FINANCIAL LIABILITIES | |||||
| Trade and other payables(1) | - | - | - | 95.3 | 95.3 |
| Long-term debt | - | - | - | 874.3 | 874.3 |
| Warrants | - | 16.9 | - | - | 16.9 |
| Restricted share units | - | 1.5 | - | - | 1.5 |
| 1. | Trade and other payables exclude the short term portion of reclamation and closure cost obligations. |
The Company examines the various financial instrument risks to which it is exposed and assesses the impact and likelihood of those risks. These risks may include credit risk, liquidity risk, market risk and other price risks. Where material, these risks are reviewed and monitored by the Board of Directors.
Credit Risk
Credit risk is the risk of an unexpected loss arising if a party to the Company’s financial instruments fails to meet its contractual obligations. The Company’s financial assets are primarily composed of cash and cash equivalents, investments and trade and other receivables. Credit risk is primarily associated with trade and other receivables and investments; however, it also arises on cash and cash equivalents. To mitigate exposure to credit risk, the Company has established policies to limit the concentration of credit risk, to ensure counterparties demonstrate minimum acceptable credit worthiness, and to ensure liquidity of available funds.
The Company closely monitors its financial assets and does not have any significant concentration of credit risk. The Company sells its gold exclusively to large international organizations with strong credit ratings. The historical level of customer defaults is minimal and, as a result, the credit risk associated with gold and copper concentrate trade receivables at June 30, 2015 is not considered to be high.
The Company’s maximum exposure to credit risk at June 30, 2015 and December 31, 2014 is as follows:
As at June 30 | As at December 31 |
| (in millions of U.S. dollars, except where noted) | 2015 | 2014 |
| CREDIT RISK EXPOSURE | ||
| Cash and cash equivalents | 326.8 | 370.5 |
| Trade receivables | 22.8 | 34.8 |
| Total financial instrument exposure to credit risk | 349.6 | 405.3 |
A significant portion of the Company’s cash and cash equivalents is held in large Canadian financial institutions. Short-term investments (including those presented as part of cash and cash equivalents) are composed of financial instruments issued by Canadian banks with high investment-grade ratings and the governments of Canada and the U.S. The Company employs a restrictive investment policy as detailed in the capital risk management section, which is described in Note 19 to our audited consolidated financial statements for the year ended December 31, 2014.
| 57 | WWW.NEWGOLD.COM TSX:NGD NYSE MKT:NGD |
|
The aging of trade and other receivables at June 30, 2015 and December 31, 2014 is as follows:
| As at June 30 | As at December 31 |
| (in millions of U.S. dollars, except where noted) | 0-30 days | 31-60 days | 61-90 days | 91-120 days | Over 120 days | 2015 Total | 2014 Total |
| AGING trade and other RECEIVABLE | |||||||
| New Afton | 1.7 | 4.3 | - | - | - | 6.0 | 3.8 |
| Mesquite | - | - | - | - | - | - | 1.1 |
| Peak Mines | 1.6 | - | - | - | - | 1.6 | 2.9 |
| Cerro San Pedro | 5.7 | 1.7 | 1.9 | 1.8 | - | 11.1 | 25.0 |
| Rainy River | 3.4 | - | - | - | - | 3.4 | 1.7 |
| Blackwater | 0.3 | - | - | - | - | 0.3 | 0.2 |
| Corporate | 0.4 | - | - | - | - | 0.4 | 0.1 |
| Total trade and other receivables | 13.1 | 6.0 | 1.9 | 1.8 | - | 22.8 | 34.8 |
The Company sells its gold and copper concentrate production from New Afton to four different customers under off-take contracts. The Company sells its gold and copper concentrate production from Peak Mines to one customer under an off-take contract. While there are alternative customers in the market, loss of this customer or unexpected termination of the off-take contract could have a material adverse effect on the Company’s results of operations, financial condition and cash flows.
The Company is not economically dependent on a limited number of customers for the sale of its gold because gold can be sold through numerous commodity market traders worldwide.
Liquidity risk
Liquidity risk is the risk that the Company will not be able to meet its financial obligations as they fall due. The Company manages liquidity risk through the management of its capital structure and financial leverage, as outlined in Note 19 to our audited consolidated financial statements for the year ended December 31, 2014.
| 58 | WWW.NEWGOLD.COM TSX:NGD NYSE MKT:NGD |
|
The following are the contractual maturities of debt commitments. The amounts presented represent the future undiscounted principal and interest cash flows, and therefore, do not equate to the carrying amounts on the consolidated statements of financial position.
| As at June 30 | As at December 31 |
| (in millions of U.S. dollars, except where noted) | < 1 | 2-3 | 4-5 | After 5 years | 2015 | 2014 |
| DEBT COMMITMENTS | ||||||
| Trade and other payables | 95.9 | - | - | - | 95.9 | 97.0 |
| Long-term debt | - | - | - | 892.7 | 892.7 | 888.5 |
| Interest payable on long-term debt | 52.3 | 104.5 | 100.1 | 74.2 | 331.1 | 357.1 |
| Provisionally priced contracts net of copper swap contracts | (2.2) | - | - | - | (2.2) | (0.4) |
| Total debt commitments | 146.0 | 104.5 | 100.1 | 966.9 | 1,317.5 | 1,342.2 |
The Company’s future operating cash flow and cash position are highly dependent on metal prices, including gold, silver and copper, as well as other factors. Taking into consideration the Company’s current cash position, volatile equity markets, global uncertainty in the capital markets and increasing cost pressures, the Company is continually reviewing expenditures and assessing business opportunities to enhance liquidity in order to ensure adequate liquidity and flexibility to support its growth strategy, including the development of its projects, while continuing production at its current operations. A period of continuous low gold and copper prices may necessitate the deferral of capital expenditures which may impact the timing of development work and project completion, as well as production from mining operations. In addition, in such a price environment, the Company may be required to adopt one or more alternatives to increase liquidity.
Currency Risk
The Company operates in Canada, the United States, Australia, Mexico and Chile. As a result, the Company has foreign currency exposure with respect to items not denominated in U.S. dollars. The three main types of foreign exchange risk for the Company can be categorized as follows:
Transaction exposure
The Company’s operations sell commodities and incur costs in different currencies. This creates exposure at the operational level, which may affect the Company’s profitability as exchange rates fluctuate. The Company has not hedged its exposure to currency fluctuations.
| 59 | WWW.NEWGOLD.COM TSX:NGD NYSE MKT:NGD |
|
Exposure to currency risk
The Company is exposed to currency risk through the following assets and liabilities denominated in currencies other than the U.S. dollar: cash and cash equivalents, investments, accounts receivable, accounts payable and accruals, reclamation and closure cost obligations, and long-term debt. The currencies of the Company’s financial instruments and other foreign currency denominated liabilities, based on notional amounts, were as follows:
| Six months ended June 30, 2015 | |||
| (in millions of U.S. dollars, except where noted) | CAD | AUD | MXN |
| EXPOSURE TO CURRENCY RISK | |||
| Cash and cash equivalents | 34.5 | 5.3 | 2.1 |
| Trade and other receivables | 4.7 | 0.6 | 11.2 |
| Income tax receivable/(payable) | (1.2) | - | 9.7 |
| Deferred tax asset | 134.8 | 8.3 | 8.5 |
| Trade and other payables | (40.4) | (12.2) | (20.5) |
| Deferred tax liability | (266.6) | (44.0) | (11.9) |
| Reclamation and closure cost obligations | (27.1) | (14.9) | (19.2) |
| Warrants | (4.5) | - | - |
| Employee benefits | - | (7.3) | - |
| Restricted share units | (0.7) | (0.3) | (0.5) |
| Total exposure to currency risk | (166.5) | (64.5) | (20.6) |
| Year ended December 31, 2014 | |||
| (in millions of U.S. dollars, except where noted) | CAD | AUD | MXN |
| EXPOSURE TO CURRENCY RISK | |||
| Cash and cash equivalents | 15.3 | 1.4 | 0.7 |
| Trade and other receivables | 2.7 | 2.9 | 25.0 |
| Income tax receivable/(payable) | (0.5) | (3.7) | 18.7 |
| Deferred tax asset | 124.1 | 8.2 | 8.6 |
| Trade and other payables | (38.4) | (15.0) | (27.0) |
| Deferred tax liability | (219.8) | (46.5) | (10.8) |
| Reclamation and closure cost obligations | (18.1) | (15.9) | (19.1) |
| Warrants | (16.9) | - | - |
| Employee benefits | - | (7.9) | - |
| Restricted share units | (1.7) | - | - |
| Total exposure to currency risk | (153.3) | (76.5) | (3.9) |
Translation exposure
The Company’s functional and reporting currency is U.S. dollars. The Company’s operations translate their operating results from the host currency to U.S. dollars. Therefore, exchange rate movements in the Canadian dollar, Australian dollar, Mexican peso and Chilean peso can have a significant impact on the Company’s consolidated operating results. A 10% strengthening (weakening) of the U.S. dollar against the following currencies would have decreased (increased) the Company’s net loss from the financial instruments presented by the amounts shown below.
| 60 | WWW.NEWGOLD.COM TSX:NGD NYSE MKT:NGD |
|
| Six months ended June 30 | Year ended December 31 | |
| (in millions of U.S. dollars, except where noted) | 2015 | 2014 |
| IMPACT OF 10% CHANGE IN FOREIGN EXCHANGE RATES | ||
| Canadian dollar | 16.7 | 15.3 |
| Australian dollar | 6.5 | 7.7 |
| Mexican peso | 2.1 | 0.4 |
Interest Rate Risk
Interest rate risk is the risk that the fair value or the future cash flows of a financial instrument will fluctuate because of changes in market interest rates. All of the Company’s outstanding debt obligations are fixed and are therefore not exposed to changes in market interest rates. The Facility interest is variable; however, the Facility was undrawn as at June 30, 2015.
The Company is exposed to interest rate risk on its short-term investments which are included in cash and cash equivalents. The short-term investment interest earned is based on prevailing money market and bank account interest rates which may fluctuate. A 1.0% change in the interest rate would result in an annual difference of approximately $3.0 million in interest earned by the Company. The Company has not entered into any derivative contracts to manage this risk.
Price Risk
The Company’s earnings, cash flows and financial condition are subject to price risk due to fluctuations in the market price of gold, silver and copper. World gold prices have historically fluctuated widely. World gold prices are affected by numerous factors beyond the Company’s control, including:
| · | the strength of the U.S. economy and the economies of other industrialized and developing nations; |
| · | global or regional political or economic conditions; |
| · | the relative strength of the U.S. dollar and other currencies; |
| · | expectations with respect to the rate of inflation; |
| · | interest rates; |
| · | purchases and sales of gold by central banks and other large holders, including speculators; |
| · | demand for jewellery containing gold; and |
| · | investment activity, including speculation, in gold as a commodity. |
For the six months ended June 30, 2015, the Company’s revenues and cash flows were impacted by gold prices in the range of $1,147 to $1,296 per ounce, and by copper prices in the range of $2.44 to $2.92 per pound. Metal price declines could cause continued development of, and commercial production from, the Company’s properties to be uneconomic. In addition, there is a time lag between the shipment of gold and copper and final pricing, and changes in pricing can impact the Company’s revenue and working capital position. As at June 30, 2015, working capital includes unpriced gold and copper concentrate receivables totalling 5,400 ounces of gold and 1.1 million pounds of copper not offset by gold or copper swap contracts. The Company’s exposure to change in gold prices has been significantly reduced during the six months ended June 30, 2015 as the Company has entered into gold swap contracts to reduce exposure to changes in gold prices. A $100 change in the gold price per ounce would have an impact of $0.5 million on the Company’s working capital. A $0.10 change in the copper price per pound would have an impact of $0.1 million on the Company’s working capital position.
The Company is also subject to price risk for fluctuations in the cost of energy, principally electricity and purchased petroleum products. The Company’s costs are affected by the prices of commodities and other inputs it consumes or uses in its operations, such as lime, sodium cyanide and explosives. The prices of such commodities and inputs are influenced by supply and demand trends affecting the mining industry in general and other factors outside our control. Increases in the price for materials consumed in the Company’s mining and production activities could materially adversely affect its results of operations and financial condition.
| 61 | WWW.NEWGOLD.COM TSX:NGD NYSE MKT:NGD |
|
The Company is also subject to price risk for changes in the Company’s common stock price per share. The Company has granted, under its long-term incentive plan, restricted share units that the Company is required to satisfy in cash upon vesting. The amount of cash the Company will be required to expend is dependent upon the price per common share at the time of vesting. The Company considers this plan a financial liability and is required to fair value the outstanding liability with the resulting changes included in compensation expense each period.
An increase in gold, copper and silver prices would increase the Company’s net earnings whereas an increase in fuel or share unit vesting prices would decrease the Company’s net earnings. A 10% change in commodity prices would impact the Company’s net earnings before taxes and other comprehensive income before taxes as follows:
| Three months ended June 30 | Three months ended June 30 | |||
| (in millions of U.S. dollars, except where noted) | 2015 Net Earnings | 2015 Other | 2014 Net Earnings | 2014 Other |
| IMPACT OF 10% CHANGE IN COMMODITY PRICES | ||||
| Gold price | 10.5 | - | 12.5 | - |
| Copper price | 6.4 | - | 6.0 | - |
| Silver price | 0.6 | - | 0.9 | - |
| Fuel price | 1.7 | 0.1 | 3.4 | - |
| Warrants | 0.5 | - | 3.4 | - |
| Restricted share units | 0.4 | - | 0.4 | - |
| Six months ended June 30 | Six months ended June 30 | |||
| (in millions of U.S. dollars, except where noted) | 2015 Net Earnings | 2015 Other | 2014 Net Earnings | 2014 Other |
| IMPACT OF 10% CHANGE IN COMMODITY PRICES | ||||
| Gold price | 21.8 | - | 27.3 | - |
| Copper price | 12.2 | - | 2.0 | - |
| Silver price | 1.0 | - | 12.2 | - |
| Fuel price | 2.8 | 0.1 | 5.1 | - |
| Warrants | 0.5 | - | 3.4 | - |
| Restricted share units | 0.8 | - | 0.4 | - |
| 62 | WWW.NEWGOLD.COM TSX:NGD NYSE MKT:NGD |
|
CRITICAL JUDGMENTS AND ESTIMATION UNCERTAINTIES
The preparation of the Company’s consolidated financial statements in conformity with IFRS requires the Company’s management to make judgments, estimates and assumptions about the future events that affect the amounts reported in the consolidated financial statements and related notes to the financial statements. Estimates and assumptions are continually evaluated and are based on management’s experience and other facts and circumstances. Revisions to estimates and the resulting effects on the carrying amounts of the Company’s assets and liabilities are accounted for prospectively.
The areas which require management to make significant judgments, estimates and assumptions in determining carrying values include, but are not limited to:
Critical Judgments in the Application of Accounting Policies
(i) Commencement of commercial production
Prior to the period when a mine has reached management’s intended operating levels, costs incurred as part of the development of the related mining property are capitalized and any mineral sales during the commissioning period are offset against the costs capitalized. The Company defines the commencement of commercial production as the date that a mine has achieved a consistent level of production. Depletion of capitalized costs for mining properties begins when operating levels intended by management have been reached.
There are a number of factors the Company considers when determining if conditions exist for the commencement of commercial production of an operating mine. Management examines the following when making that judgment:
| · | All major capital expenditures to bring the mine to the condition necessary for it to be capable of operating in the manner intended by management have been completed; |
| · | The completion of a reasonable period of testing of the mine plant and equipment; |
| · | The mine or mill has reached a pre-determined percentage of design capacity; and |
| · | The ability to sustain ongoing production of ore. |
The list is not exhaustive and each specific circumstance is taken into account before making the decision.
(ii) Functional currency
The functional currency for each of the Company’s subsidiaries and associates is the currency of the primary economic environment in which the entity operates. The Company has determined the functional currency of each entity as the U.S. dollar. Determination of the functional currency may involve certain judgments to determine the primary economic environment and the Company reconsiders the functional currency of its entities if there is a change in events and conditions which determines the primary economic environment.
(iii) Determination of economic viability
Management has determined that exploratory drilling, evaluation, development and related costs incurred on Blackwater and Rainy River and the New Afton C-zone project have future economic benefits and are economically recoverable. In making this judgment, management has assessed various criteria including but not limited to the geologic and metallurgic information, history of conversion of mineral deposits to Proven and Probable Mineral Reserves, operating management expertise, existing permits, the expectation of receiving additional permits and LOM plans.
| 63 | WWW.NEWGOLD.COM TSX:NGD NYSE MKT:NGD |
|
(iv) Carrying value of long-lived assets and impairment charges
In determining whether the impairment of the carrying value of an asset is necessary, management first determines whether there are external or internal indicators that would signal the need to test for impairment. These indicators consist of but are not limited to the prolonged significant decline in commodity prices, unfavourable changes to the legal environment in which the entity operates and evidence of long-term reduced production of the asset. If an impairment indicator is identified, the Company compares the carrying value of the asset against the recoverable amount. These determinations and their individual assumptions require that management make a decision based on the best available information at each reporting period.
(vi) Determination of CGU
In determining a CGU, management had to examine the smallest identifiable group of assets that generates cash inflows that are largely independent of cash inflows from other assets or groups of assets. The Company has determined that each mine site and development project qualify as an individual CGU. Each of these assets generate or will have the ability to generate cash inflows that are independent of the other assets and therefore qualify as an individual asset for impairment testing purposes.
(vii) Determination of purchase price allocation
Business combinations require the Company to determine the identifiable asset and liability fair values and the allocation of the purchase consideration over the fair value of the assets and liabilities. This requires management to make judgments and estimates to determine the fair value, including the amount of Mineral Reserves and Resources acquired, future metal prices, future operating costs, capital expenditure requirements and discount rates. The Company employs third party independent valuators to assist in this process.
Key Sources of Estimation Uncertainty in the Application of Accounting Policies
(i) Revenue recognition
Revenue from sales of concentrate is recorded when the rights and rewards of ownership pass to the buyer. Variations between the prices set in the contracts and final settlement prices may be caused by changes in the market prices and result in an embedded derivative in the accounts receivable. The embedded derivative is recorded at fair value each reporting period until final settlement occurs, with changes in the fair value being recorded as revenue. For changes in metal quantities upon receipt of new information and assays, the provisional sales quantities are adjusted as well.
(ii) Inventory valuation
Management values inventory at the average production costs or net realizable value (“NRV”). Average production costs include expenditures incurred and depreciation and depletion of assets used in mining and processing activities that are deferred and accumulated as the cost of ore in stockpiles, ore on leach pad, work-in-process and finished metals inventories. The allocation of costs to ore in stockpiles, ore on leach pads and in-process inventories and the determination of NRV involve the use of estimates. Costs are removed from the leach pad based on the average cost per recoverable ounce of gold and silver on the leach pad as gold and silver are recovered. Estimates of recoverable gold and silver on the leach pads are calculated from the quantities of ore placed on the pads, the grade of ore placed on the leach pads and an estimated percentage of recovery. Timing and ultimate recovery of gold and silver contained on leach pads can vary significantly from the estimates.
(iii) Mineral Reserves
The figures for Mineral Reserves and Mineral Resources are determined in accordance with NI 43-101 issued by the Canadian Securities Administrators. There are numerous estimates in determining the Mineral Reserves and estimates. Such estimation is a subjective process, and the accuracy of any Mineral Reserve or Resource estimate is a function of the quantity and quality of available data and of the assumptions made and judgments used in engineering and geological interpretation. Differences between management’s assumptions including economic assumptions, such as metal prices and market conditions, could have a material effect in the future on the Company’s financial position and results of operations.
| 64 | WWW.NEWGOLD.COM TSX:NGD NYSE MKT:NGD |
|
(iv) Estimated recoverable ounces
The carrying amounts of the Company’s mining properties are depleted based on recoverable ounces. Changes to estimates of recoverable ounces and depletable costs including changes resulting from revisions to the Company’s mine plans and changes in metal price forecasts can result in a change to future depletion rates.
(v) Deferred income taxes
In assessing the probability of realizing income tax assets recognized, management makes estimates related to expectations of future taxable income, applicable tax planning opportunities, expected timing of reversals of existing temporary differences and the likelihood that tax positions taken will be sustained upon examination by applicable tax authorities. In making its assessments, management gives additional weight to positive and negative evidence that can be objectively verified. Estimates of future taxable income are based on forecasted cash flows from operations and the application of existing tax laws in each jurisdiction. Forecasted cash flows from operations are based on LOM projections internally developed and reviewed by management. The Company considers tax planning opportunities that are within the Company’s control, are feasible and implementable without significant obstacles. Examination by applicable tax authorities is supported based on individual facts and circumstances of the relevant tax position examined in light of all available evidence. Where applicable tax laws and regulations are either unclear or subject to ongoing varying interpretations, it is possible that changes in these estimates can occur that materially affect the amounts of income tax asset recognized. At the end of each reporting period, the Company reassesses unrecognized income tax assets.
(vi) Reclamation and closure cost obligations
The Company’s provision for reclamation and closure cost obligations represents management’s best estimate of the present value of the future cash outflows required to settle the liability which reflects estimates of future costs, inflation, movements in foreign exchange rates and assumptions of risks associated with the future cash outflows, and the applicable risk-free interest rates for discounting the future cash outflows. Changes in the above factors can result in a change to the provision recognized by the Company.
Future Changes in Accounting Policies
Depreciation
On May 12, 2014, the IASB issued amendments to IAS 16,Property, Plant and Equipment (“IAS 16”), and IAS 38,Intangible Assets (“IAS 38”). In issuing the amendments, the IASB has clarified that the use of revenue-based methods to calculate the depreciation of a tangible asset is not appropriate because revenue generated by an activity that includes the use of a tangible asset generally reflects factors other than the consumption of the economic benefits embodied in the asset. The IASB has also clarified that revenue is generally presumed to be an inappropriate basis for measuring the consumption of the economic benefits embodied in an intangible asset. This presumption for an intangible asset, however, can be rebutted in certain limited circumstances. The standard is to be applied prospectively for reporting periods beginning on or after January 1, 2016 with early application permitted. The Company is currently evaluating the impact of applying the amendments but does not anticipate that there will be any impact on its current method of calculating depreciation or amortization.
Revenue
On May 28, 2014, the IASB issued IFRS 15,Revenue from Contracts with Customers (“IFRS 15”). This standard outlines a single comprehensive model with prescriptive guidance for entities to use in accounting for revenue arising from contacts with its customers. This standard replaces IAS 18Revenue, IAS 11Construction Contracts and related interpretations. The effective date is for reporting periods beginning on or after January 1, 2017 with early application permitted. The Company has not yet determined the effect of adoption of IFRS 15 on its consolidated financial statements.
| 65 | WWW.NEWGOLD.COM TSX:NGD NYSE MKT:NGD |
|
Joint Arrangements
On May 6, 2014 the IASB amended IFRS 11,Joint Arrangements (“IFRS 11”). The amendments add new guidance on how to account for the acquisition of an interest in a joint operation that constitutes a business. The amendments are effective for annual periods beginning on or after January 1, 2016. The adoption of these amendments is not expected to have a material impact on the Company’s consolidated financial statements.
Presentation of Financial Statements
On December 18, 2014, the IASB amended IAS 1,Presentation of Financial Statements (“IAS 1”). The amendments to existing IAS 1 requirements relate to materiality; order of the notes; subtotals; accounting policies; and disaggregation. The amendments are effective for annual periods beginning on or after January 1, 2016. The adoption of these amendments is not expected to have a material impact on the Company’s consolidated financial statements.
Property, Plant and Equipment
On May 12, 2014, the IASB amended IAS 16,Property, Plant, and Equipment (“IAS 16”). The amendments to IAS 16 clarify that the use of revenue-based methods to determine the depreciation of an asset is not appropriate. However, the amendments provide limited circumstances when a revenue-based method can be an appropriate basis for amortization. The amendments are effective for annual periods beginning on or after January 1, 2016. The adoption of these amendments is not expected to have a material impact on the Company’s consolidated financial statements.
Employee Benefits
On November 13, 2013, the IASB amended IAS 19,Employee Benefits (“IAS 19”). The amendments provide additional guidance to IAS 19 on the accounting for contributions from employees or third parties set out in the formal terms of a defined benefit plan. The amendments are effective for annual periods beginning on or after July 1, 2014. IAS 19 was further amended on July 30, 2014. The amendments to IAS 19 clarify the application of the requirements of IAS 19 on determination of the discount rate to a regional market consisting of multiple countries sharing the same currency. The amendments are effective for annual periods beginning on or after January 1, 2016. The adoption of these amendments is not expected to have a material impact on the Company’s consolidated financial statements.
Intangible Assets
On May 12 2014, the IASB amended IAS 38,Intangible Assets (“IAS 38”). The amendments clarify that an amortization method based on revenue is generally presumed to be an inappropriate basis for measuring the consumption of the economic benefits embodied in an intangible asset. However, the amendments provide limited circumstances when a revenue-based method can be an appropriate basis for amortization. The amendments are effective for annual periods beginning on or after January 1, 2016. The adoption of these amendments is not expected to have a material impact on the Company’s consolidated financial statements.
| 66 | WWW.NEWGOLD.COM TSX:NGD NYSE MKT:NGD |
|
CONTROLS AND PROCEDURES
Disclosure Controls and Procedures
The Company’s management, with the participation of and under the supervision of its Chief Executive Officer and Chief Financial Officer, has evaluated the effectiveness of the Company’s disclosure controls and procedures. Based on that evaluation, the Company’s Chief Executive Officer and Chief Financial Officer have concluded that, as at the end of the period covered by this MD&A, the Company’s disclosure controls and procedures were effective to provide reasonable assurance that the information required to be disclosed by the Company in reports it files is recorded, processed, summarized and reported, within the appropriate time periods.
Internal Controls over Financial Reporting
New Gold’s management, with the participation of its Chief Executive Officer and Chief Financial Officer, is responsible for establishing and maintaining adequate internal controls over financial reporting. Internal controls over financial reporting, is a process designed by, or under the supervision of, the Company’s principal executive and principal financial officers and effected by the Company’s Board of Directors, management and other personnel, to provide reasonable assurance regarding the reliability of financial reporting and the preparation of financial statements for external purposes in accordance with International Financial Reporting Standards. New Gold’s management assessed the effectiveness of the Company’s internal controls over financial reporting as at December 31, 2014 based on the 2013 updated Committee of Sponsoring Organization of the Treadway Commission (“COSO”) and has concluded that New Gold’s internal controls over financial reporting are effective as at December 31, 2014.
The Company’s internal controls over financial reporting as at December 31, 2014 have been audited by Deloitte LLP, Independent Registered Public Accounting Firm who also audited the Company’s Consolidated Financial Statements for the six months ended June 30, 2015. Deloitte LLP as stated in their report that immediately precedes the Company’s audited consolidated financial statements for the six months ended June 30, 2015, expressed an unqualified opinion on the effectiveness of the Company’s internal controls over financial reporting.
Limitations of Controls and Procedures
The Company’s management, including its Chief Executive Officer and Chief Financial Officer, believe that any internal controls and procedures for financial reporting, no matter how well conceived and operated, can provide only reasonable, not absolute, assurance that the objectives of the control system are met. Furthermore, the design of a control system must reflect the fact that there are resource constraints and the benefits of controls must be considered relative to their costs. Due to the inherent limitations of all control systems, they cannot provide absolute assurance that all control issues and instances of fraud, if any, within the Company have been prevented and/or detected. These inherent limitations include the realities that judgments in decision-making can be faulty and breakdowns can occur because of simple error or mistake. Additionally, controls can be circumvented by the individual acts of some persons, by collusion of two or more people, or by unauthorized override control. The design of any system of controls is also based in part upon certain assumptions about the likelihood of future events, and there can be no assurance that any design will succeed in achieving its stated goals under all potential future conditions. Accordingly, because of the inherent limitations in a cost effective control system, misstatements due to error or fraud may occur and not be detected.
Changes in Internal Controls over Financial Reporting
There has been no change in the Company’s design of internal controls and procedures over financial reporting that has materially affected, or is reasonably likely to materially affect, the Company’s internal controls over financial reporting during the period covered by this MD&A.
| 67 | WWW.NEWGOLD.COM TSX:NGD NYSE MKT:NGD |
|
CAUTIONARY NOTES
Cautionary Note to U.S. Readers Concerning Estimates of Mineral Reserves and Mineral Resources
Information concerning the properties and operations of New Gold has been prepared in accordance with Canadian standards under applicable Canadian securities laws, and may not be comparable to similar information for United States companies. The terms “Mineral Resource”, “Measured Mineral Resource”, “Indicated Mineral Resource” and “Inferred Mineral Resource” used in this MD&A are Canadian mining terms as defined in the CIM Definition Standards for Mineral Resources and Mineral Reserves adopted by CIM Council on May 10, 2014 and incorporated by reference in National Instrument 43-101 (“NI 43-101”). While the terms “Mineral Resource”, “Measured Mineral Resource”, “Indicated Mineral Resource” and “Inferred Mineral Resource” are recognized and required by Canadian securities regulations, they are not defined terms under standards of the United States Securities and Exchange Commission. As such, certain information contained in this MD&A concerning descriptions of mineralization and resources under Canadian standards is not comparable to similar information made public by United States companies subject to the reporting and disclosure requirements of the United States Securities and Exchange Commission.
An “Inferred Mineral Resource” has a great amount of uncertainty as to its existence and as to its economic and legal feasibility. Under Canadian rules, estimates of Inferred Mineral Resources may not form the basis of feasibility or pre-feasibility studies. It cannot be assumed that all or any part of an “Inferred Mineral Resource” will ever be upgraded to a higher confidence category. Readers are cautioned not to assume that all or any part of an “Inferred Mineral Resource” exists or is economically or legally mineable.
Under United States standards, mineralization may not be classified as a “Reserve” unless the determination has been made that the mineralization could be economically and legally produced or extracted at the time the Reserve estimation is made. Readers are cautioned not to assume that all or any part of the Measured or Indicated Mineral Resources that are not Mineral Reserves will ever be converted into Mineral Reserves. In addition, the definitions of “Proven Mineral Reserves” and “Probable Mineral Reserves” under CIM standards differ in certain respects from the standards of the United States Securities and Exchange Commission.
Cautionary Note Regarding Forward-Looking Statements
Certain information contained in this MD&A, including any information relating to New Gold’s future financial or operating performance are “forward looking”. All statements in this MD&A, other than statements of historical fact, which address events, results, outcomes or developments that New Gold expects to occur are “forward-looking statements”. Forward-looking statements are statements that are not historical facts and are generally, but not always, identified by the use of forward-looking terminology such as “plans”, “expects”, “is expected”, “budget”, “scheduled”, “targeted”, “estimates”, “forecasts”, “intends”, “anticipates”, “projects”, “potential”, “believes” or variations of such words and phrases or statements that certain actions, events or results “may”, “could”, “would”, “should”, “might” or “will be taken”, “occur” or “be achieved” or the negative connotation of such terms. Forward-looking statements in this MD&A include those under the headings “Corporate Developments”, “New Gold’s Investments Thesis”, “Outlook for 2015”, “Key Performance Drivers”, “Economic Outlook”, “Liquidity and Cash Flow”, “Contractual Obligations” and include, among others, statements with respect to: guidance for production; total cash costs and all-in sustaining costs, and the factors contributing to those expected results, as well as expected capital expenditures; mine life; mineral reserve and mineral resource estimates; grades expected to be mined at the Company’s operations; the expected production, costs, economics and operating parameters of the Rainy River project; payment of the remaining $75 million from Royal Gold and the timing of such payment; planned activities for 2015 and beyond at the Company’s operations and projects, as well as planned exploration activities and expenses; the results of the C-zone study, including operating parameters and expected mine life, production, costs, and project economics; plans to advance the C-zone project, including permitting requirements, impact on the historic tailings facility from the historic Afton mine, capital expenditures and potential timelines; expected production for the Blackwater project; targeting timing for commissioning and full production (and other activities) related to the New Afton mill expansion, Rainy River and the sequencing of Blackwater; and cash flow expected from Cerro San Pedro to the end of the residual leach period relative to expected closure costs.
| 68 | WWW.NEWGOLD.COM TSX:NGD NYSE MKT:NGD |
|
All forward-looking statements in this MD&A are based on the opinions and estimates of management as of the date such statements are made and are subject to important risk factors and uncertainties, many of which are beyond New Gold’s ability to control or predict. Certain material assumptions regarding such forward-looking statements are discussed in this MD&A, New Gold’s Annual Information Form and its Technical Reports filed at www.sedar.com. In addition to, and subject to, such assumptions discussed in more detail elsewhere, the forward-looking statements in this MD&A are also subject to the following assumptions: (1) there being no significant disruptions affecting New Gold’s operations; (2) political and legal developments in jurisdictions where New Gold operates, or may in the future operate, being consistent with New Gold’s current expectations; (3) the accuracy of New Gold’s current Mineral Reserve and Resource estimates; (4) the exchange rate between the Canadian dollar, Australian dollar, Mexican peso and U.S. dollar being approximately consistent with current levels; (5) prices for diesel, natural gas, fuel oil, electricity and other key supplies being approximately consistent with current levels; (6) equipment, labour and materials costs increasing on a basis consistent with New Gold’s current expectations; (7) arrangements with First Nations and other Aboriginal groups in respect of the Rainy River and Blackwater projects being consistent with New Gold’s current expectations; (8) all required permits, licenses and authorizations being obtained from the relevant governments and other relevant stakeholders within the expected timelines; (9) the results of the feasibility studies for the Rainy River project and the Blackwater project being realized; and (10) in the case of production, cost and expenditure outlooks at operating mines for 2016 and 2017, and (11) commodity prices and exchange rates being consistent with those estimated for the purposes of 2015 guidance.
Forward-looking statements are necessarily based on estimates and assumptions that are inherently subject to known and unknown risks, uncertainties and other factors that may cause actual results, level of activity, performance or achievements to be materially different from those expressed or implied by such forward-looking statements. Such factors include, without limitation: significant capital requirements and the availability and management of capital resources; additional funding requirements; price volatility in the spot and forward markets for metals and other commodities; fluctuations in the international currency markets and in the rates of exchange of the currencies of Canada, the United States, Australia, Mexico and Chile; discrepancies between actual and estimated production, between actual and estimated Reserves and Resources and between actual and estimated metallurgical recoveries; changes in national and local government legislation in Canada, the United States, Australia, Mexico and Chile or any other country in which New Gold currently or may in the future carry on business; taxation; controls, regulations and political or economic developments in the countries in which New Gold does or may carry on business; the speculative nature of mineral exploration and development, including the risks of obtaining and maintaining the validity and enforceability of the necessary licenses and permits and complying with the permitting requirements of each jurisdiction in which New Gold operates, including, but not limited to: in Canada, obtaining the necessary permits for the Rainy River and Blackwater projects; in Mexico, where Cerro San Pedro has a history of ongoing legal challenges related to our environmental authorization; and in Chile, where certain activities at El Morro have been delayed due to litigation relating to its environmental permit; the lack of certainty with respect to foreign legal systems, which may not be immune from the influence of political pressure, corruption or other factors that are inconsistent with the rule of law; the uncertainties inherent to current and future legal challenges New Gold is or may become a party to; diminishing quantities or grades of Reserves and Resources; competition; loss of key employees; rising costs of labour, supplies, fuel and equipment; actual results of current exploration or reclamation activities; uncertainties inherent to mining economic studies including the feasibility studies for Rainy River and Blackwater and the C-zone study; the uncertainty with respect to prevailing market conditions necessary for a positive development or construction decision at Blackwater; changes in project parameters as plans continue to be refined; accidents; labour disputes; defective title to mineral claims or property or contests over claims to mineral properties; unexpected delays and costs inherent to consulting and accommodating rights of First Nations and other Aboriginal groups; uncertainties and unanticipated delays associated with obtaining and maintaining necessary licenses, permits and authorizations and complying with permitting requirements, including those associated with the environmental assessment process for Blackwater. In addition, there are risks and hazards associated with the business of mineral exploration, development and mining, including environmental events and hazards, industrial accidents, unusual or unexpected formations, pressures, cave-ins, flooding and gold bullion losses (and the risk of inadequate insurance or inability to obtain insurance to cover these risks) as well as “Risk Factors” included in New Gold’s disclosure documents filed on and available at www.sedar.com. Forward-looking statements are not guarantees of future performance, and actual results and future events could materially differ from those anticipated in such statements. All of the forward-looking statements contained in this MD&A are qualified by these cautionary statements. New Gold expressly disclaims any intention or obligation to update or revise any forward-looking statements whether as a result of new information, events or otherwise, except in accordance with applicable securities laws.
| 69 | WWW.NEWGOLD.COM TSX:NGD NYSE MKT:NGD |
|
Technical Information
The scientific and technical information contained in this MD&A has been reviewed and approved by Mark A. Petersen, Vice President, Exploration, New Gold. Mr. Petersen is an AIPG Certified Professional Geologist and a “Qualified Person” under NI 43-101.
The estimates of Mineral Reserves and Mineral Resources discussed in this MD&A may be materially affected by environmental, permitting, legal, title, taxation, sociopolitical, marketing and other relevant issues. New Gold’s February 4, 2015 news release entitled “New Gold Finishes 2014 Further Solidifying its Low-Cost Position; 2015 Scheduled to Deliver Production Growth in Gold, Copper and Silver” and New Gold’s Annual Information Form and the NI 43-101 Technical Reports for its mineral properties, all of which are available at www.sedar.com, contain further details regarding Mineral Reserve and Resource estimates, classification and reporting parameters, key assumptions and associated risks for each of New Gold's mineral properties.
| 70 | WWW.NEWGOLD.COM TSX:NGD NYSE MKT:NGD |