0000801337us-gaap:FairValueMeasurementsRecurringMemberus-gaap:CommercialMortgageBackedSecuritiesMember2023-12-31
UNITED STATES SECURITIES AND EXCHANGE COMMISSION Washington, D.C. 20549
_______________________________________________________________________________
FORM 10-K
_______________________________________________________________________________
☒ Annual Report Pursuant to Section 13 or 15(d) of the Securities Exchange Act of 1934
For the fiscal year ended December 31, 2024
or
☐ Transition Report Pursuant to Section 13 or 15(d) of the Securities Exchange Act of 1934
For the transition period from ____ to ____
Commission File Number: 001-31486
_______________________________________________________________________________________________
WEBSTER FINANCIAL CORPORATION
(Exact name of registrant as specified in its charter)
_______________________________________________________________________________ | | | | | | | | |
| Delaware | | 06-1187536 |
| (State or other jurisdiction of incorporation or organization) | | (I.R.S. Employer Identification No.) |
|
| 200 Elm Street, Stamford, Connecticut 06902 |
| (Address and zip code of principal executive offices) |
Registrant’s telephone number, including area code: (203) 578-2202 |
| | | | | | | | |
| Securities registered pursuant to Section 12(b) of the Act: |
| Title of each class | Trading Symbols | Name of each exchange on which registered |
| Common Stock, par value $0.01 per share | WBS | New York Stock Exchange |
| Depositary Shares, each representing 1/1000th interest in a share | WBS-PrF | New York Stock Exchange |
| of 5.25% Series F Non-Cumulative Perpetual Preferred Stock |
| Depositary Shares, each representing 1/40th interest in a share | WBS-PrG | New York Stock Exchange |
| of 6.50% Series G Non-Cumulative Perpetual Preferred Stock |
| Securities registered pursuant to Section 12(g) of the Act: None |
____________________________________________________________________________________________________Indicate by check mark if the registrant is a well-known seasoned issuer, as defined in Rule 405 of the Securities Act. ☒ Yes ☐ No
Indicate by check mark if the registrant is not required to file reports pursuant to Section 13 or 15(d) of the Act. ☐ Yes ☒ No
Indicate by check mark whether the registrant (1) has filed all reports required to be filed by Section 13 or 15(d) of the Securities Exchange Act of 1934 during the preceding 12 months (or for such shorter period that the registrant was required to file such reports), and (2) has been subject to such filing requirements for the past 90 days. ☒ Yes ☐ No
Indicate by check mark whether the registrant has submitted electronically every Interactive Data File required to be submitted pursuant to Rule 405 of Regulation S-T (§232.405 of this chapter) during the preceding 12 months (or for such shorter period that the registrant was required to submit such files). ☒ Yes ☐ No
Indicate by check mark whether the registrant is a large accelerated filer, an accelerated filer, a non-accelerated filer, a smaller reporting company, or an emerging growth company. See the definitions of “large accelerated filer,” “accelerated filer,” “smaller reporting company,” and “emerging growth company” in Rule 12b-2 of the Exchange Act.
| | | | | | | | | | | | | | | | | | | | | | | | | | | | | | | | |
| Large accelerated filer | ☒ | | Accelerated filer | ☐ | | Non-accelerated filer | ☐ | | Smaller reporting company | ☐ |
| Emerging growth company | ☐ | | | | | | | | | |
If an emerging growth company, indicate by check mark if the registrant has elected not to use the extended transition period for complying with any new or revised financial accounting standards provided pursuant to Section 13(a) of the Exchange Act. ☐
Indicate by check mark whether the registrant has filed a report on and attestation to its management's assessment of the effectiveness of its internal control over financial reporting under Section 404(b) of the Sarbanes-Oxley Act (15 U.S.C. 7262(b)) by the registered public accounting firm that prepared or issued its audit report. ☒
If securities are registered pursuant to Section 12(b) of the Act, indicate by check mark whether the financial statements of the registrant included in the filing reflect the correction of an error to previously issued financial statements. ☐
Indicate by check mark whether any of those error corrections are restatements that required a recovery analysis of incentive-based compensation received by any of the registrant's executive officers during the relevant recovery period pursuant to § 240.10D-1(b). ☐
Indicate by check mark whether the registrant is a shell company (as defined in Rule 12b-2 of the Act). ☐ Yes ☒ No
The aggregate market value of voting common stock held by non-affiliates, computed by reference using the closing price on June 28, 2024, the last business day of the registrant’s most recently completed second fiscal quarter, was approximately $7.4 billion.
The number of shares of common stock, par value $0.01 per share, outstanding as of February 28, 2025 was 171,345,069.
Documents Incorporated by Reference
Part III: Portions of the Proxy Statement for the Annual Meeting of Stockholders to be held on May 21, 2025 (the “Proxy Statement”).
INDEX
| | | | | | | | |
| | | Page No. |
| | |
| Key to Acronyms and Terms | |
| Forward-Looking Statements | |
| | |
| |
| | |
| Item 1. | Business | |
| | |
| Item 1A. | Risk Factors | |
| | |
| Item 1B. | Unresolved Staff Comments | |
| | |
| Item 1C. | Cybersecurity | |
| | |
| Item 2. | Properties | |
| | |
| Item 3. | Legal Proceedings | |
| | |
| Item 4. | Mine Safety Disclosures | |
| |
| |
| | |
| Item 5. | Market for Registrant’s Common Equity, Related Stockholder Matters and Issuer Purchases of Equity Securities | |
| | |
| Item 6. | [Reserved] | |
| | |
| Item 7. | Management’s Discussion and Analysis of Financial Condition and Results of Operations | |
| | |
| Item 7A. | Quantitative and Qualitative Disclosures About Market Risk | |
| | |
| Item 8. | Financial Statements and Supplementary Data | |
| | |
| Item 9. | Changes in and Disagreements With Accountants on Accounting and Financial Disclosure | |
| | |
| Item 9A. | Controls and Procedures | |
| | |
| Item 9B. | Other Information | |
| | |
| Item 9C. | Disclosure Regarding Foreign Jurisdictions that Prevent Inspections | |
| | |
| |
| | |
| Item 10. | Directors, Executive Officers and Corporate Governance | |
| | |
| Item 11. | Executive Compensation | |
| | |
| Item 12. | Security Ownership of Certain Beneficial Owners and Management and Related Stockholder Matters | |
| | |
| Item 13. | Certain Relationships and Related Transactions, and Director Independence | |
| | |
| Item 14. | Principal Accountant Fees and Services | |
| | |
| |
| | |
| Item 15. | Exhibits and Financial Statement Schedules | |
| |
| |
| | |
| Item 16. | Form 10-K Summary | |
| |
| |
| |
KEY TO ACRONYMS AND TERMS | | | | | |
| ACL | Allowance for credit losses |
| ACH | Automated Clearing House |
| Agency | A financial services corporation created by the United States Congress |
| Agency CMBS | Agency commercial mortgage-backed securities |
| Agency CMO | Agency collateralized mortgage obligations |
| Agency MBS | Agency mortgage-backed securities |
| AI | Artificial Intelligence |
| ALCO | Asset Liability Committee |
| Ametros | Ametros Financial Corporation |
| AOCI / AOCL | Accumulated other comprehensive income (loss), net of tax |
| ASC | Accounting Standards Codification |
| ASU or the Update | Accounting Standards Update |
| ATM | Automated teller machine |
| Basel III Capital Rules | Capital rules under a global regulatory framework developed by the Basel Committee on Banking Supervision |
| Bend | Bend Financial, Inc. |
| BHC Act | Bank Holding Company Act of 1956, as amended |
| Board | The Board of Directors of Webster Financial Corporation |
| BSA | The Bank Secrecy Act |
| CAMELS | Capital adequacy, asset quality, management, earnings, liquidity, and sensitivity |
| CARES Act | The Coronavirus Aid, Relief, and Economic Security Act |
| CECL | Current expected credit loss model, defined in ASC 326 “Financial Instruments – Credit Losses” |
| CET1 | Common Equity Tier 1 Capital, defined by the Basel III Capital Rules |
| CET1 Risk-Based Capital | Ratio of CET1 capital to total risk-weighted assets, defined by the Basel III Capital Rules |
| CFPB | Consumer Financial Protection Bureau |
| CIO | Chief Information Officer |
| CISO | Chief Information Security Officer |
| |
| CMBS | Non-agency commercial mortgage-backed securities |
| CNBC | Consumer News and Business Channel |
| CODM | Chief Operating Decision Maker |
| |
| COSO | Committee of Sponsoring Organizations of the Treadway Commission |
| CRA | Community Reinvestment Act of 1977 |
| |
| DTA / DTL | Deferred tax asset / deferred tax liability |
| EAD | Exposure at default |
| |
| |
| FASB | Financial Accounting Standards Board |
| FDIA | Federal Deposit Insurance Act |
| FDIC | Federal Deposit Insurance Corporation |
| FDICIA | The Federal Deposit Insurance Corporation Improvement Act of 1991 |
| FDIF | Federal Deposit Insurance Fund |
| FHLB | Federal Home Loan Bank |
| FICO | Fair Isaac Corporation |
| FRA | Federal Reserve Act |
| FRB | Federal Reserve Bank |
| FTE | Fully tax-equivalent |
| FTP | Funds Transfer Pricing, a matched maturity funding concept |
| GAAP | U.S. Generally Accepted Accounting Principles |
| Holding Company | Webster Financial Corporation |
| HSA | Health savings account |
| HSA Bank | HSA Bank, a division of Webster Bank, National Association |
| |
| interLINK | Interlink Insured Sweep LLC |
| ISACA | Information Systems Audit and Control Association |
| KRX | Keefe, Bruyette & Woods Regional Banking Index |
| LGD | Loss given default |
| |
| LIHTC | Low income housing tax-credit |
| LTV | Loan-to-value |
| Marathon Asset Management | Marathon Asset Management MW Holding, LLC |
| | | | | |
| MBS | Mortgage-backed securities |
| Moody’s | Moody’s Investor Services |
| NAICS | North American Industry Classification System |
| NAV | Net asset value |
| NYSE | New York Stock Exchange |
| OCC | Office of the Comptroller of the Currency |
| OCI / OCL | Other comprehensive income (loss) |
| OFAC | Office of Foreign Assets Control of the U.S. Department of the Treasury |
| OPEB | Other post-employment medical and life insurance benefits |
| OREO | Other real estate owned |
| PCAOB | Public Company Accounting Oversight Board |
| PCD | Purchased credit deteriorated |
| PD | Probability of default |
| PPNR | Pre-tax, pre-provision net revenue |
| ROU | Right-of-use |
| S&P | Standard and Poor’s Rating Services |
| SALT | State and local tax |
| SEC | U.S. Securities and Exchange Commission |
| SERP | Supplemental executive retirement plan |
| SOFR | Secured Overnight Financing Rate |
| SOX | Sarbanes-Oxley Act of 2002 |
| Sterling | Sterling Bancorp, collectively with its consolidated subsidiaries |
| TDR | Troubled debt restructuring, defined in ASC 310-40 “Receivables-Troubled Debt Restructurings by Creditors” |
| Tier 1 Leverage Capital | Ratio of Tier 1 capital to average tangible assets, defined by the Basel III Capital Rules |
| Tier 1 Risk-Based Capital | Ratio of Tier 1 capital to total risk-weighted assets, defined by the Basel III Capital Rules |
| Total Risk-Based Capital | Ratio of total capital to total risk-weighted assets, defined by the Basel III Capital Rules |
| UPB | Unpaid principal balance |
| U.S. | United States of America |
| USA PATRIOT Act | Uniting and Strengthening America by Providing Appropriate Tools Requirement to Intercept and
Obstruct Terrorism Act of 2001 |
| UTB | Unrecognized tax benefit |
| VIE / VOE | Variable interest entity / voting interest entity, defined in ASC 810-10 “Consolidation-Overall” |
| Webster Bank or the Bank | Webster Bank, National Association, a wholly-owned subsidiary of Webster Financial Corporation |
| Webster or the Company | Webster Financial Corporation, collectively with its consolidated subsidiaries |
FORWARD-LOOKING STATEMENTS
This Annual Report on Form 10-K contains “forward-looking statements” within the meaning of the Private Securities Litigation Reform Act of 1995. Forward-looking statements can be identified by words such as “believes,” “anticipates,” “expects,” “intends,” “targeted,” “continue,” “remain,” “will,” “should,” “may,” “plans,” “estimates,” and similar references to future periods. However, these words are not the exclusive means of identifying such forward-looking statements.
Examples of forward-looking statements include, but are not limited to:
•projections of revenues, expenses, income or loss, earnings or loss per share, and other financial items;
•statements of plans, objectives, and expectations of the Company or its management or Board of Directors;
•statements of future economic performance; and
•statements of assumptions underlying such statements.
Forward-looking statements are based on the Company’s current expectations and assumptions regarding its business, the economy, and other future conditions. Because forward-looking statements relate to the future, they are subject to inherent uncertainties, risks, and changes in circumstances that are difficult to predict. The Company’s actual results may differ materially from those contemplated by the forward-looking statements, which are neither statements of historical fact nor guarantees or assurances of future performance. Factors that could cause the Company’s actual results to differ from those discussed in any forward-looking statements include, but are not limited to:
•our ability to successfully execute our business plan and strategic initiatives, and manage any risks or uncertainties;
•continued regulatory changes or other risk mitigation efforts taken by government agencies in response to the risk to safety and soundness in the banking industry;
•volatility in Webster’s stock price due to investor sentiment and perception of the banking industry;
•local, regional, national, and international economic conditions, and the impact they may have on us or our customers;
•volatility and disruption in national and international financial markets, including as a result of geopolitical conflict;
•the impact of unrealized losses in our financial instruments, particularly in our available-for-sale securities portfolio;
•changes in laws and regulations, or existing laws and regulations that we become subject to, including those concerning banking, taxes, dividends, securities, insurance, cybersecurity, and healthcare administration, with which we must comply;
•adverse conditions in the securities markets that could lead to impairment in the value of our securities portfolio;
•inflation, monetary fluctuation, and changes in interest rates, including the impact of such changes on economic conditions, customer behavior, funding costs, and our loans and leases and securities portfolios;
•possible changes in governmental monetary and fiscal policies, including, but not limited to, Federal Reserve policies in connection with continued inflationary pressures;
•the effects of any U.S. federal government shutdown, or closures or significant staff reductions in agencies regulating our business;
•the impact of any new regulatory, policy, or enforcement developments resulting from the change in U.S. presidential administration, including the implementation of tariffs and other protectionist trade policies;
•the timely development and acceptance of new products and services, and the perceived value of those products and services by customers;
•changes in deposit flows, consumer spending, borrowings, and savings habits;
•our ability to implement new technologies and maintain secure and reliable information and technology systems;
•the effects of any cybersecurity threats, attacks or disruptions, fraudulent activity, or other data breaches or security events, including those involving our third-party vendors and service providers;
•performance by our counterparties and third-party vendors;
•our ability to increase market share and control expenses;
•changes in the competitive environment among banks, financial holding companies, and other traditional and non-traditional financial service providers;
•our ability to maintain adequate sources of funding and liquidity;
•our ability to attract, develop, motivate, and retain skilled employees;
•changes in loan demand or real estate values;
•changes in the mix of loan geographies, sectors, or types, and the level of non-performing assets, charge-offs, and delinquencies;
•changes in our estimates of current expected credit losses based upon periodic review under relevant regulatory and accounting requirements;
•the effect of changes in accounting policies and practices applicable to us, including impacts of recently adopted accounting guidance;
•legal and regulatory developments, including any due to judicial decisions, the resolution of legal proceedings or regulatory or other governmental inquiries, the results of regulatory examinations or reviews, disruptions at regulatory agencies, or protracted congressional negotiations regarding government funding and other issues;
•our ability to navigate differing environmental, social, governmental, and sustainability concerns among governmental administrations, our stakeholders, and other activists that may arise from our business activities;
•our ability to assess and monitor the effect of evolving uses of artificial intelligence on our business and operations; and
•the occurrence of natural disasters, severe weather events, and public health crises, and any governmental or societal responses thereto.
Any forward-looking statement in this Annual Report on Form 10-K speaks only as of the date on which it is made. Factors or events that could cause the Company’s actual results to differ may emerge from time to time, and it is not possible for the Company to predict all of them. The Company undertakes no obligation to publicly update any forward-looking statement, whether as a result of new information, future developments, or otherwise, except as may be required by law.
PART I
ITEM 1. BUSINESS
General
Webster Financial Corporation is a bank holding company and financial holding company under the BHC Act, incorporated under the laws of Delaware in 1986, and headquartered in Stamford, Connecticut. As of December 31, 2024, Webster Financial Corporation had more than $79 billion in total consolidated assets.
Webster Bank is a commercial bank with a national bank charter focused on providing financial products and services to businesses, individuals, and families. While its core footprint spans the Northeast from the New York metropolitan area to Rhode Island and Massachusetts, certain businesses operate in extended geographies. Webster Bank offers three differentiated lines of business: Commercial Banking, Healthcare Financial Services, and Consumer Banking.
Acquisitions and Joint Ventures
On January 24, 2024, the Bank acquired all of the equity interest in Ametros from Long Ridge Capital Management. Ametros is a custodian and administrator of medical funds from insurance claim settlements that helps individuals manage their ongoing medical care through its CareGuard service and proprietary technology platform. The acquisition provided the Bank with a fast-growing source of low-cost and long-duration deposits, new sources of non-interest income, and enhanced its employee benefit and healthcare financial services expertise.
On July 19, 2024, the Company, through its subsidiary MW Advisor Holding, LLC, entered into an agreement with Marathon Asset Management and formed MW Advisors, LLC, a private credit joint venture, which will deliver direct lending solutions for sponsor-backed middle market companies across the country. The Company and Marathon Asset Management each own 50 percent of MW Advisors, LLC. The Company expects to begin activities through MW Advisors, LLC in the first half of 2025.
Additional information regarding the acquisition of Ametros and joint venture with Marathon Asset Management can be found within Note 2: Acquisitions and Joint Ventures in the Notes to Consolidated Financial Statements contained in Part II - Item 8. Financial Statements and Supplementary Data.
Subsidiaries and Reportable Segments
The Holding Company’s active consolidated subsidiaries include the Bank and MW Advisor Holding, LLC. As of December 31, 2024, the Bank’s active consolidated subsidiaries included: Webster Licensing, LLC, Webster Wealth Advisors, Inc., Bend Financial, Inc., InterLINK Insured Sweep LLC, Ametros Financial Corporation, Webster Servicing LLC, Webster Public Finance Corporation, Webster Mortgage Investment Corporation, Sterling National Funding Corp., Sterling REIT, Inc., Sterling Business Credit LLC, Webster Preferred Capital Corporation, and Webster Investment Services, Inc.
The Company’s operations are organized into three reportable segments that represent its differentiated lines of business: Commercial Banking, Healthcare Financial Services, and Consumer Banking.
Commercial Banking delivers financial solutions both nationally and regionally to a wide range of companies, investors, government entities, and other public and private institutions. Commercial Banking helps its clients achieve their business and financial goals with expertise in Commercial & Institutional Lending, Commercial Real Estate, Capital Markets, Capital Finance, and Treasury Management. Its Private Banking team also pairs holistic wealth solutions, including tailored lending, with commercial banking services.
Healthcare Financial Services includes HSA Bank and Ametros. HSA Bank is one the country’s largest providers of employee benefits solutions, including being one of the leading bank administrators of HSAs, emergency savings accounts, and flexible spending accounts administration services in 50 states. Ametros, the nation’s largest professional administrator of medical insurance claim settlements, helps individuals manage their ongoing medical care through their CareGuard service and proprietary technology platform.
Consumer Banking delivers customized financial solutions for individuals and families, private clients, and small business owners across 196 banking centers throughout the Northeast. Consumer Banking offers a full suite of deposit, lending, treasury management, and wealth management solutions delivered by experienced relationship managers and financial advisors. Consumer Banking also provides a fully digital banking experience through its mobile banking apps and BrioDirect.
Additional information regarding the Company’s reportable segments can be found in Part II under the section captioned “Segment Reporting” contained in Item 7. Management’s Discussion and Analysis of Financial Condition and Results of Operations, and within Note 21: Segment Reporting in the Notes to Consolidated Financial Statements contained in Item 8. Financial Statements and Supplementary Data.
Available Information
The Company files reports with the SEC, and makes available, free of charge, within the investor relations section of its internet website (http://investors.websterbank.com), its Annual Report on Form 10-K, Quarterly Reports on Form 10-Q, Current Reports on Form 8-K, and amendments to those reports as soon as reasonably practicable after it electronically files such material with, or furnishes it to, the SEC. The SEC website (http://www.sec.gov) makes reports, proxy and information statements, and other information filed electronically with the SEC available to the public free of charge. The Company intends to use its Investor Relations website and its corporate website as a means of disclosing material non-public information and for complying with its disclosure obligations under Regulation FD. Accordingly, investors should monitor these channels in addition to our press releases, SEC filings, and public conference calls and webcasts. Information contained on the Company’s website is not incorporated by reference into this Annual Report on Form 10-K.
Human Capital Resources
As a values-driven organization, our colleagues are the cornerstone of our success. As of December 31, 2024, the Company had 4,297 full-time employees and 110 part-time employees, comprised of 61 percent female and 39 percent male. Our employees are primarily located in our core footprint, which spans the Northeast from the New York metropolitan area to Rhode Island and Massachusetts, including our headquarters in Stamford, Connecticut. The average full-time and part-time employee tenure at the Company is approximately 8.8 years.
Culture and Engagement. We recognize the importance of an engaged workforce, and we support the professional development of our colleagues to help them achieve their career goals. Our 2024 colleague engagement survey results reflected our commitment to establishing a culture of trust and safety by encouraging colleagues to share their opinions and actionable ideas for improvement. Webster provides all colleagues with 24 hours of paid time to volunteer at the organizations of their choice. In 2024, we introduced a volunteer recognition campaign, featuring awards for Volunteer of the Year and Webster’s Top 10 Community Service Stars.
Internal Communication. Our “Webster News” distributions help colleagues stay informed about company news and developments and feel connected to the company’s goals and values. Our “Webster Within” webinars allow colleagues to gain a deeper understanding of our business, which ultimately helps them perform their jobs better. In 2024, we held 12 webinars on a variety of topics. Additionally, we distribute a “Webster Weekly” newsletter.
Inclusion and Belonging. At Webster, we believe that fostering a culture of inclusion and belonging is integral to our long-term success. We are committed to attracting, developing, and retaining a talented workforce that is diverse in perspective, knowledge, and experience, and we are dedicated to providing equal employment opportunities to all individuals, regardless of race, color, religion, sex, national origin, age, disability, or any other characteristic protected by law. We believe this approach increases job satisfaction, reduces turnover, and leads to a more engaged and productive workforce.
Our Business Resource Groups, which are open to all colleagues on a voluntary basis, are strategic partners who provide support for programs and initiatives that drive Webster’s efforts in recruitment and hiring, talent and leadership acquisition and development, employee retention and productivity, market development, and customer attraction and retention. Our Business Resource Groups further align with corporate strategy by leveraging and capitalizing on the benefits of a diverse, well-qualified workforce to achieve advantages that may include increased innovation, improved problem-solving, better understanding of the markets and communities we serve, and enhanced employee engagement and satisfaction.
Compensation. Our compensation program is designed to attract, retain, and reward performance and align incentives with achievement of our strategic plan, and both short- and long-term operating objectives. Our hiring, promotion, and retention practices are based on merit and qualifications, guided by the principles of fairness. Our pay practices have strong governance processes, including reviewing competitive market data from multiple surveys each year. We also offer competitive benefits packages that reflect the needs of our workforce, which include medical, dental, and vision plans, prescription benefits, life insurance and disability benefits, HSAs, wellness incentives, health coaching, telemedicine, paid parental leave, paid time off and paid holidays, a matching 401(k) retirement savings plan, an employee stock purchase plan, an employee assistance program, a student loan repayment program, backup child and elder care, pet insurance, and wellness programs. We continually review and evolve our benefit plans as necessary to remain competitive and meet the needs of our workforce.
Learning and Talent Management. We are focused on investing in our current and future talent by actively supporting the success, growth, and career progression of our employees. Our employees have access to our internal learning resource that offers virtual instructor-led training and on-demand programs. We also provide unlimited access to self-directed e-learning courses taught by industry experts with curated learning paths designed for specific professional interests.
Significant investments in formal development programs are made to build our talent pipeline. Our Internship Program and our Rotational Program for early-career college graduates provide rotating assignments throughout the bank. Further, we offer our RISE Emerging Talent Program for high-potential individuals, and our flagship management development program, Lead with Impact. Our mentoring program, which partners with our Business Resource Group network, is also an important resource to support colleagues with their professional growth based on their self-identified career development goals.
Competition
The Company is subject to strong competition from other commercial banks, savings banks, credit unions, non-bank health savings account trustees, consumer finance companies, investment companies, insurance companies, online lending and savings institutions, and other non-bank financial services companies. Certain of these competitors are larger financial institutions with substantially greater resources, lending limits, larger branch systems, and a wider array of commercial and consumer banking services than the Company. Competition could intensify in the future as a result of industry consolidation, the increasing availability of products and services from non-bank organizations, including financial technology companies, greater technological developments in the industry, and continued bank regulatory changes.
The Company faces substantial competition for deposits and loans throughout its market areas. The primary factors in competing for deposits are interest rates, personalized services, the quality and range of financial services, convenience of office locations and hours, mobile banking, and other automated services. Competition for deposits comes from other commercial banks, savings banks, credit unions, non-bank health savings account trustees, money market mutual funds, financial technology companies, and other non-bank financial services companies. The primary factors in competing for commercial and consumer loans are interest rates, loan origination fees, ease and convenience of loan origination channels, the quality and range of lending services, personalized service, and the ability to close within each customer’s desired time frame. Competition for the origination of loans comes primarily from commercial banks, non-bank lenders, savings institutions, mortgage banking firms, mortgage brokers, online lenders, and insurance companies. Other factors that affect competition include the general and local economic conditions, current interest rate levels, and volatility in the lending markets.
Supervision and Regulation
The Holding Company and its bank and non-bank subsidiaries are subject to extensive regulation under federal and state laws. The regulatory framework applicable to bank holding companies and their depository institutions is intended to protect depositors, the FDIF, consumers, and the U.S. banking system as a whole.
Set forth below is a summary of the significant elements of the laws and regulations applicable to the Holding Company and its bank and non-bank subsidiaries. The description that follows is qualified in its entirety by reference to the full text of the statutes, regulations, and policies that are described. Banking statutes, regulations, and policies are continually under review by Congress, state legislatures, and federal and state regulatory agencies. Changes in the statutes, regulations, or regulatory policies applicable to the Holding Company and its bank and non-bank subsidiaries, including how they are implemented or interpreted, could have a material effect on the results of the Company.
Regulatory Agencies
The Holding Company is a separate and distinct legal entity from the Bank and its other subsidiaries. As a registered bank holding company and a financial holding company, the Holding Company is subject to regulation under the BHC Act and to inspection, examination, and supervision by its primary federal regulator, the Board of Governors of the Federal Reserve System. As a publicly-traded company, the Holding Company is subject to the disclosure and regulatory requirements of the Securities Act of 1933, as amended, and the Securities Exchange Act of 1934, as amended, which are administered by the SEC. As a publicly-traded company with securities listed on the NYSE, the Holding Company is subject to the rules of the NYSE.
The Bank is organized as a national banking association under the National Bank Act, as amended, and is subject to the supervision of and regular examination by the OCC, its primary federal regulator, as well as by the FDIC, its deposit insurer. As a national banking association, the Bank derives its lending, investment, and other bank activity powers from the National Bank Act, as amended, and the regulations of the OCC promulgated thereunder.
The Holding Company’s non-bank subsidiaries are also subject to regulation by the Board of Governors of the Federal Reserve System and other applicable federal and state agencies.
Bank Holding Company Activities
In general, the BHC Act limits the business of bank holding companies to banking, managing, or controlling banks and other activities that the Board of Governors of the Federal Reserve System has determined to be closely related to banking. Bank holding companies that qualify and elect to become financial holding companies, such as the Holding Company, may engage in any activity, or acquire and retain the shares of a company engaged in any activity, that is either financial in nature or incidental to such financial activity (as determined by the Board of Governors of the Federal Reserve System in consultation with the Secretary of the Treasury), or complementary to a financial activity, and that does not pose a substantial risk to the safety and soundness of depository institutions or the financial system (as solely determined by the Board of Governors of the Federal Reserve System). Activities that are financial in nature include securities underwriting, dealing and market making, sponsoring mutual funds and investment companies, insurance underwriting, and merchant banking. Subject to certain exceptions, the BHC Act generally prohibits us from acquiring direct or indirect ownership or control of voting shares of any company engaged in activities that are not permissible for bank holding companies to engage in.
Maintaining our financial holding company status requires that the Company and the Bank remain “well-capitalized” and “well managed” as defined by regulation and that the Bank maintains at least a “satisfactory” rating under the CRA. If the Company or the Bank fail to continue to meet these requirements, we could be subject to restrictions on new activities and acquisitions, and/or be required to cease and possibly divest operations that conduct existing activities that are not permissible for a bank holding company that is not a financial holding company. Additionally, the Board of Governors of the Federal Reserve System could impose corrective capital and managerial requirements and activity restrictions on us if we cease to be “well-capitalized” or “well managed.”
Acquisitions of Ownership
Acquisitions of Webster voting stock above certain thresholds may be subject to prior regulatory notice or approval under applicable federal banking laws. Investors are responsible for ensuring that they do not, directly or indirectly, acquire shares of Webster stock in excess of the amount that can be acquired without regulatory approval or notice under the BHC Act and the Change in Bank Control Act.
Mergers and Acquisitions
Under the BHC Act, prior approval from the Board of Governors of the Federal Reserve System is required in order for any bank holding company to acquire direct or indirect ownership or control of more than 5% of the voting shares of any bank, acquire all or substantially all of the assets of a bank, or merge or consolidate with any other bank holding company. Generally, the Holding Company is not required to obtain prior approval from the Board of Governors of the Federal Reserve System to acquire a non-bank that engages in activities that are financial in nature or incidental to activities that are financial in nature, as long as the Holding Company meets the capital, managerial, and CRA requirements to qualify as a financial holding company. However, the Holding Company is required to receive prior approval from the Board of Governors of the Federal Reserve System for an acquisition in which the total consolidated assets to be acquired exceeds $10 billion.
Pursuant to Section 18(c) of the FDIA, more commonly known as the Bank Merger Act, and for national banks relying on certain other sources of merger authority, prior written approval from a bank’s primary federal regulator is required before any insured depository institution may consummate a merger transaction, which includes a merger, consolidation, assumption of deposit liabilities, and certain asset transfers between or among two or more institutions. Prior written approval of a bank’s primary federal regulator is also required for merger transactions between or among affiliated institutions, as well as for merger transactions between or among non-affiliated institutions. Transactions that do not involve a transfer of deposit liabilities typically do not require prior approval under the Bank Merger Act unless the transaction involves the acquisition of all or substantially all of an institution’s assets. When evaluating and acting on proposed merger transactions, regulators consider the extent of existing competition between and among the merging institutions, other depository institutions, and other providers of similar or equivalent services in the relevant product and geographic markets, the convenience and needs of the community to be served, capital adequacy and earnings prospects, and the effectiveness the merger institutions in combating money-laundering activities, among other factors.
Further, the Change in Bank Control Act of 1978 prohibits the Company from acquiring control of a bank regulated by the FDIC without providing at least 60 days prior written notice to the FDIC or upon receipt of written notice that the FDIC does not disapprove of the acquisition.
Capital Adequacy
The Board of Governors of the Federal Reserve System, the OCC, and the FDIC have adopted the regulatory capital standards in accordance with Basel III, as developed by the Basel Committee on Banking Supervision. The Basel III Capital Rules strengthened international capital adequacy standards by increasing institutions’ minimum capital requirements and holdings of
high-quality liquid assets and decreasing bank leverage.
Under the Basel III Capital Rules, the Company’s assets, exposures, and certain off-balance sheet commitments and obligations are subject to risk weights used to determine risk-weighted assets. Risk weights can range from 0% for U.S. government securities to 1,250% for certain tranches of complex securitization or equity exposures. Risk-weighted assets serve as the base against which regulatory capital is measured, and are used to calculate the Company’s and the Bank’s minimum capital ratios of CET1 Risk-Based Capital, Tier 1 Risk-Based Capital, Total Risk-Based Capital, and Tier 1 Leverage Capital, as defined in the regulations, which the Company is required to maintain. CET1 capital consists of common stockholders’ equity less deductions for goodwill and other intangible assets, and certain deferred tax adjustments. At the time of initial adoption of the Basel III Capital Rules, the Company had elected to opt-out of the requirement to include certain components of AOCI in CET1 capital. Tier 1 capital consists of CET1 capital plus preferred stock. Total capital consists of Tier 1 capital and Tier 2 capital, as defined in the regulations. Tier 2 capital includes qualifying subordinated debt and the permissible portion of the ACL.
In addition, the Basel III Capital Rules mandate that most deductions from or adjustments to regulatory capital be made to CET1 capital, not to the other components. For instance, the deduction of mortgage servicing assets, certain DTAs, and capital investments in unconsolidated financial institutions is required to the extent that any one such category exceeds 10% of CET1 capital or exceeds 15% of CET1 capital in the aggregate.
The Basel III Capital Rules also include a capital conservation buffer comprised entirely of CET1 capital, which is considered in addition to the 4.5% CET1 capital ratio and is equal to 2.5% of risk-weighted assets for both the Company and the Bank. This buffer is designed to absorb losses during periods of economic stress, and is generally required in order to avoid limitations on capital distributions and certain discretionary bonus payments to executive officers.
Our regulatory capital ratios can be found in Part II under the section captioned “Liquidity and Capital Resources” contained in Item 7. Management’s Discussion and Analysis of Financial Condition and Results of Operations, and within Note 14: Regulatory Capital and Restrictions in the Notes to Consolidated Financial Statements contained in Item 8. Financial Statements and Supplementary Data.
Prompt Corrective Action
FDICIA requires the federal bank regulatory agencies to take “prompt corrective action” regarding FDIC-insured depository institutions that do not meet certain capital adequacy standards. A depository institution’s treatment for purposes of the prompt corrective action provisions depends upon its level of capitalization and certain other factors. An institution that fails to remain “well-capitalized” becomes subject to a series of restrictions that increase in severity as its capital condition weakens. Such restrictions may include a prohibition on capital distributions, restrictions on asset growth or restrictions on the ability to receive regulatory approval of applications. FDICIA also provides for enhanced supervisory authority over “under capitalized” institutions, including authority for the appointment of a conservator or receiver for the institution. In certain instances, a bank holding company may be required to guarantee the performance of an “under capitalized” subsidiary bank’s capital restoration plan. As of December 31, 2024, the Bank was categorized as “well-capitalized” under each of its capital ratio categories.
An insured depository institution with a ratio of tangible equity less than or equal to 2% is considered to be critically under capitalized. If an insured depository institution has been determined, after notice and opportunity for a hearing, to be in an unsafe or unsound condition, or if it receives a less-than-satisfactory rating for asset quality, management, earnings, or liquidity in its most recent examination, the appropriate federal banking agency may downgrade a well capitalized, adequately capitalized, or under capitalized insured depository institution to the next lower capital category.
All insured depository institutions, regardless of their capital category, are prohibited from making capital distributions or paying management fees if such distributions or payments would result in the insured depository institution becoming under capitalized, unless it is shown that the capital distribution would improve financial condition, or the management fee is being paid to a person or entity without a controlling interest in the insured depository institution. Restrictions are placed on certain brokered deposit activity and on deposit rates offered as the capital category declines below well capitalized. Further, if an insured depository institution receives notice that it is under capitalized, significantly under capitalized, or critically under capitalized, the insured depository institution generally must file a written capital restoration plan with the appropriate federal banking agency within 45 days of receipt, and the bank holding company must guarantee the performance of that plan.
Enhanced Prudential Standards
The Board of Governors of the Federal Reserve System established enhanced prudential standards for larger bank holding companies based on size and certain risk-based indicators. On October 10, 2019, the Federal Reserve Board, along with other federal bank regulatory agencies, tailored these prudential standards allowing bank holding companies with total consolidated assets of $250 billion or less to be exempt from certain enhanced capital and liquidity prudential standards, including company-run stress testing, capital planning, liquidity coverage ratio, and resolution planning requirements, among others. Although the Holding Company’s total consolidated assets are beneath the $250 billion threshold, the Company performs certain stress tests internally and incorporates the economic models and information developed through its stress testing program into its risk management and capital planning activities, which continue to be subject to the regular supervisory processes of the Federal Reserve System and the OCC.
The transition to heightened supervision under enhanced prudential standards for large banks (e.g., crossing $100 billion of assets, and thus becoming a Category IV institution under the tailoring framework) is a significant regulatory hurdle and involves additional liquidity risk management requirements, more onerous internal liquidity stress testing and liquidity buffer requirements, supervisory stress testing, the stress capital buffer, additional capital planning requirements, additional reporting to the Federal Reserve and more comprehensive resolution plan filings with the FDIC.
Federal Reserve System
Federal Reserve System regulations require depository institutions to maintain reserves against its transaction accounts and non-personal time deposits for the purposes of implementing monetary policy. The reserve requirement must be satisfied in the form of vault cash and, if vault cash is insufficient, by maintaining a balance in an account at a FRB. The FRA authorizes different ranges of reserve requirement ratios depending on the amount of transaction account balances held at each depository institution. Since March 26, 2020, the reserve requirement ratios on all net transaction accounts were reduced to zero percent, thereby eliminating reserve requirements for all depository institutions.
Further, as a national bank and a member of the Federal Reserve System, Webster Bank is required to subscribe to the capital stock of its district FRB in an amount equal to 6% of its capital and surplus, of which 50% is paid. The remaining 50% is subject to call by the Board of Governors of the Federal Reserve System. At December 31, 2024, the Bank held a stock investment in the FRB of New York of $229.6 million.
Federal Home Loan Bank System
The FHLB System provides a central credit facility for its member institutions. The Bank, as a member of the FHLB of Boston, is required to purchase and hold shares of FHLB capital stock for its membership and other activities in an amount equal to 0.05% of total assets as of December 31, 2023, up to a maximum of $5 million, plus an amount that varies from 3.0% to 4.0% depending on the maturities of its FHLB advances, of which there were $2.1 billion outstanding at December 31, 2024. The Bank was in compliance with these requirements at December 31, 2024, and held a FHLB stock investment of $91.7 million.
Source of Strength Doctrine
Bank holding companies are required to serve as a source of financial strength to their subsidiary banks and commit resources to support each of their subsidiary banks. This support may be required at times when the Holding Company is not in a financial position to provide such resources without adversely affecting its ability to meet other obligations. The Federal Reserve System may require a bank holding company to make capital injections into a troubled subsidiary bank and may charge the bank holding company with engaging in unsafe and unsound practices if it fails to commit resources to such a subsidiary bank, or if it undertakes actions that the Federal Reserve System believes might jeopardize the bank holding company’s ability to commit resources to such subsidiary bank. Capital loans by banking holding companies to its subsidiary banks would be subordinate in right of payment to deposits and certain other debts of the subsidiary bank. In the event of bankruptcy, any commitment by a bank holding company to a federal bank regulatory agency to maintain the capital of a subsidiary bank would be assumed by the bankruptcy trustee and entitled to a priority of payment.
In addition, under the National Bank Act, if the Bank’s capital stock is impaired by losses or otherwise, the OCC is authorized to require payment of the deficiency by assessment upon the Holding Company. If the assessment is not paid within three months after receiving notice thereof, the OCC could order a sale of the Bank stock held to cover any deficiency.
Safety and Soundness Standards
The federal banking agencies have adopted the rules and regulations under the Interagency Guidelines Establishing Standards for Safety and Soundness, which are applicable to all insured depository institutions. These guidelines prescribe standards relating to internal controls, information systems, internal audit systems, loan documentation, credit underwriting, interest rate exposure, asset growth, compensation, fees, and benefits, asset quality, earnings, and stock valuation, as determined to be appropriate.
The OCC also has guidelines establishing heightened standards for large national banks, which establish minimum standards for the design and implementation of a risk governance framework. A large bank is defined as a bank with more than $50 billion in average total consolidated assets from its four most recently filed quarterly Call Reports. Because the Bank is a covered bank, it has a risk governance framework designed to meet the OCC heightened standards. Additional information regarding our risk governance framework can be found under the section captioned “Risk Management Framework” contained elsewhere in this Item 1. Business.
If a federal banking agency determines that an institution fails to meet any of the established standards, the agency may require the institution to submit an acceptable plan to achieve compliance with the standard. In the event that an institution fails to submit an acceptable plan within the time allowed, or fails, in any material respect, to implement an accepted plan, the agency must require the institution to correct the deficiency and may take other supervisory and enforcement actions until the deficiency is corrected.
In more serious instances, enforcement actions may include the issuance of directives to increase capital, the issuance of formal and informal agreements, the imposition of civil monetary penalties, the issuance of a cease and desist order that can be judicially enforced, the issuance of removal and prohibition orders against officers, directors, and other institution affiliated parties, the termination of the insured depository institution’s deposit insurance, the appointment of a conservator or receiver for the insured depository institution, and injunctions or restraining orders based upon a judicial determination that the FDIC, as receiver, would be harmed if such equitable relief was not granted.
Resolution Planning
The FDIC requires certain insured depository institutions with more than $50 billion in total assets to periodically submit resolution plans to provide the FDIC with information about the bank that is essential to effective resolution planning and to support the execution of a resolution, if necessary. In June 2024, the FDIC amended its insured depository institution resolution plan rule, which requires the Bank, as a “Group B” insured depository institution with between $50 billion and $100 billion in total assets, to submit informational filings on a three-year cycle and provide limited interim supplements in each of the off-years. The final rule became effective October 1, 2024. The Bank’s initial information filing submission is due on or before April 1, 2026.
Dividends
The Holding Company is dependent upon dividends from the Bank to provide funds for its cash requirements, including the payment of dividends to stockholders. Dividends paid by the Bank are subject to federal and state regulatory limitations. Express approval by the OCC is required if the effect of dividends declared would cause the regulatory capital of the Bank to fall below specified minimum levels or would exceed the net income for that year combined with the undistributed net income for the preceding two years. During the year ended December 31, 2024, the Bank declared and paid $600.0 million in dividends to the Holding Company and had $747.3 million of undistributed net income available for the declaration and payment of dividends at December 31, 2024.
In addition, federal banking regulators have the authority to prohibit the Company from engaging in unsafe or unsound practices in conducting its business. The declaration and payment of dividends, depending on the financial condition of the Bank, could be deemed an unsafe or unsound practice, especially if its capital base is depleted to an inadequate level. The ability of the Bank to pay dividends in the future is currently, and could be further, influenced by bank regulatory policies and capital requirements.
Transactions with Affiliates and Insiders
Transactions between insured depository institutions and their affiliates are governed by Sections 23A and 23B of the FRA and Federal Reserve Regulation W. In a bank holding company context, at a minimum, the parent holding company of a national bank, and any companies that are controlled by such parent holding company, are considered affiliates of the bank. Generally, sections 23A and 23B of the FRA are intended to protect insured depository institutions from losses arising from transactions with non-insured affiliates by (i) limiting the extent to which an institution or its subsidiaries may engage in covered transactions with any one affiliate and with all affiliates in the aggregate, and (ii) requiring that all such transactions be on terms substantially the same, or at least favorable, to the institution or subsidiary as those provided to a non-affiliate. The term covered transaction includes the making of loans, purchase of assets, the issuance of a guarantee, and similar types of transactions. Certain covered transactions must be collateralized according to a schedule set forth in the statue.
In addition, Section 22(h) of the FRA and Federal Reserve Regulation O restricts loans to directors, executive officers, and principal stockholders or insiders. Pursuant to Section 22(h), loans to directors, executive officers, and principal stockholders must be made on terms substantially the same as offered in comparable transactions to other persons, except that such insiders may receive preferential loans made under a benefit or compensation program that is widely available to the institution’s employees and does not give preference to the insider over the employees. Further, loans to insiders and their related interests may not exceed, together with all other outstanding loans to such persons and affiliated entities, the institution’s total capital and surplus. Loans to insiders above specified amounts must receive prior approval from the Company’s Board of Directors. Section 22(g) of the FRA places additional limitations on loans to executive officers.
Consumer Protection and Consumer Financial Protection Bureau Supervision
As an insured depository institution with more than $10 billion in total assets, the Bank is subject to supervision by the CFPB. The CFPB has been responsible for implementing, enforcing, and examining compliance with federal consumer financial protection laws. In early February 2025, employees of the CFPB were instructed to cease all supervision, investigations, enforcement, rulemaking, and stakeholder activities. It is unclear how long these instructions — which are the subject of ongoing litigation — will stay in force, either fully or partially. There are also a number of federal laws, which the Bank has been subject to, that are designed to protect borrowers and promote lending, including, but not limited to, the Equal Credit Opportunity Act, the Fair Credit Reporting Act, the Fair Debt Collection Procedures Act, the Truth in Lending Act, the Home Mortgage Disclosure Act, the Real Estate Settlement Practices Act, the Consumer Financial Protection Act of 2010, and the Gramm Leach Bliley Act regarding Privacy of Consumer Financial Information.
Identity Theft
Certain regulated entities are required to establish programs to address risks of identity theft. In accordance with these rules, financial institutions and creditors are required to develop and implement a written identity theft prevention program designed to detect, prevent, and mitigate identity theft in connection with certain existing accounts or the opening of new accounts. The Company has an Identity Theft Prevention Program in place satisfying its compliance with these requirements.
Financial Privacy and Data Security
The Company is subject to federal and certain state laws and regulations containing consumer privacy and data protection provisions addressing the treatment of nonpublic personal information about consumers by financial institutions. Subject to certain exceptions, financial institutions are prohibited from disclosing nonpublic personal information about a consumer to nonaffiliated third parties, unless the institution satisfies various notice and opt-out requirements, and the consumer has not elected to opt out of the disclosure. Regardless as to whether a financial institution shares nonpublic personal information, the institution must provide notice of its privacy policies and practices to its consumers, and must follow redisclosure and reuse limitations on any nonpublic personal information it receives from a nonaffiliated financial institution.
The federal banking regulatory agencies have adopted guidelines for establishing information security standards and programs to protect such information, with an increased focus on risk management and processes related to information technology, and the use of third parties. The expectation from the federal banking regulatory agencies is that financial institutions have established lines of defense to ensure that their risk management processes address the risks posed by compromised customer credentials, and that the financial institution has sufficient business continuity planning processes to ensure rapid recovery, resumption, and maintenance of operations after a cyber-attack.
Financial institutions are required to notify customers of security breaches that result in unauthorized access to their nonpublic personal information and its primary regulator of certain types of computer security incidents that result in harm to the confidentiality, integrity, or availability of an information system or the information that the system processes, stores, or transmits, as soon as possible and no later than 36 hours after the banking organization determines that a notification incident has occurred.
Community Reinvestment Act and Fair Lending Laws
The Bank has a responsibility under the CRA to help meet the credit needs of its communities, including low and moderate-income neighborhoods. The CRA does not establish specific lending requirements or programs for financial institutions, nor does it limit an institution’s discretion to develop the types of products or services that it believes are best suited to its particular community. In connection with its examination, the OCC assesses the Bank’s record of compliance with the CRA. In addition, the Equal Credit Opportunity Act and the Fair Housing Act prohibit discrimination in lending practices on the basis of characteristics specified in those statutes. The Bank’s failure to comply with the provisions of the CRA could, at a minimum, result in regulatory restrictions on its activities, as well as the activities of the Company. Further, the Bank’s failure to comply with the Equal Credit Opportunity Act and the Fair Housing Act could result in enforcement actions against it by the OCC, as well as other federal regulatory agencies, including the CFPB and the Department of Justice. The Bank received a CRA rating of Outstanding in its most recent examination.
Federal Deposit Insurance
The standard deposit insurance coverage limit is $250,000 per depositor, per FDIC-insured bank, for each account ownership category, although the FDIC may guarantee uninsured deposits above the $250,000 limit under the statutory systemic risk exception, as was done with the Silicon Valley Bank and Signature Bank failures in March 2023. The FDIF is funded mainly through quarterly assessments on insured depository institutions, such as the Bank, and provides insurance coverage for certain deposits up to this maximum amount.
The Bank’s assessment is determined each quarter in accordance with the FDIC’s standardized risk-based methodology by multiplying its assessment rate by its assessment base. The assessment base equals the Bank’s average consolidated total assets less average tangible equity during the assessment period. As a large bank, or generally one with $10 billion or more in assets, the Bank is assigned an individual rate based on a scorecard, which combines CAMELS (capital adequacy, asset quality, management, earnings, liquidity, and sensitivity) component ratings, financial measures used to measure a bank’s ability to withstand asset-related and funding-related stress, and a measure of loss severity that estimates the relative magnitude of potential losses to the FDIC in the event of the bank’s failure, to produce a score that is then converted to an assessment rate.
Assessment rates are subject to adjustment by the FDIC. For instance, assessment rates could (i) decrease for the issuance of long-term unsecured debt, including senior unsecured debt and subordinated debt, (ii) increase for holdings of long-term unsecured or subordinated debt issued by other banks, or (iii) increase for significant holdings of brokered deposits for large banks that are not well rated or not well capitalized. On October 18, 2022, the FDIC increased the initial deposit base deposit insurance assessment rate schedules uniformly by 2 basis points for all insured depository institutions, beginning in the first quarterly assessment period of 2023. The increase in assessment rate schedules is intended to increase the likelihood that the reserve ratio of the FDIF reaches the statutory minimum of 1.35% by the statutory deadline of September 30, 2028.
On November 29, 2023, the FDIC published a final rule implementing a special assessment for certain banks to recover losses incurred by protecting uninsured depositors of Silicon Valley Bank and Signature Bank upon their failure in March 2023. The special assessment is to be collected for an anticipated total of ten quarterly assessment periods, which began with the second quarter of 2024. At December 31, 2024, the Company’s remaining accrual for its estimated special assessment charge was
$39.8 million. The FDIC retains the right to cease collection early, extend the special assessment collection period, and impose a final shortfall special assessment if actual losses exceed the amounts collected.
The FDIC may terminate a depository institution’s deposit insurance upon finding that the institution’s financial condition is unsafe or unsound, or that the institution has engaged in unsafe and unsound practices, or has violated any applicable law, regulation, rule, order, or condition imposed by the FDIC. The Company’s management is not aware of any practice, violation, or condition that might lead to the termination of its deposit insurance.
Depositor Preference
In the event of the liquidation or other resolution of an insured depository institution, including the Bank, the claims of depositors of the institution (including the claims of the FDIC as subrogee of insured depositors) and certain claims for administrative expenses of the FDIC as a receiver will have priority over other general unsecured claims against the institution. If an insured depository institution fails, claims of insured and uninsured depositors, along with claims of the FDIC, would have priority in payment ahead of unsecured, non-deposit creditors, including the Holding Company, with respect to any extensions of credit they have made to such insured depository institution.
Anti-Money Laundering
A major focus of U.S. federal governmental policy as it relates to financial institutions is aimed at combating money laundering and terrorist financing. The failure of a financial institution to maintain and implement adequate programs to combat money laundering and terrorist financing, or to comply with the relevant laws and regulations, could have serious legal and reputational consequences for the financial institution, including causing the applicable bank regulatory authorities to not approve merger or acquisition transactions or to prohibit such transactions even if prior approval is not required.
Financial institutions are required to take certain measures to identify their customers, prevent money laundering, monitor customer transactions, and report suspicious activity to U.S. law enforcement agencies. Financial institutions also are required to respond to requests for information from federal banking agencies and law enforcement agencies. Information sharing among financial institutions for the above purposes is encouraged by an exemption granted to complying financial institutions from the privacy provisions of federal privacy laws. Financial institutions that hold correspondent accounts for foreign banks or provide private banking services to foreign individuals are required to take measures to avoid dealing with certain foreign individuals or entities, including foreign banks with profiles that raise money laundering concerns, and are prohibited from dealing with foreign shell banks and persons from jurisdictions of particular concern.
Financial institutions also are required to establish internal anti-money laundering programs. The effectiveness of a financial institution in combating money laundering activities is a factor to be considered in any application submitted under the Bank Merger Act. The Company has in place a Bank Secrecy Act and USA PATRIOT Act compliance program and engages in very few transactions of any kind with foreign financial institutions or foreign persons. The Company also complies with the sanctions administered by the OFAC of the U.S. Department of the Treasury, which is responsible for administering economic sanctions that affect transactions with designated foreign countries, nations, and others. The OFAC publishes lists of persons, organizations, and countries suspected of aiding, harboring, or engaging in terrorist acts, known as Specially Designated Nationals and Block Persons. Blocked assets (i.e., property and bank deposits) cannot be paid out, withdrawn, set off, or transferred in any manner without a license from the OFAC. Failure to comply with these sanctions could have serious legal and reputational consequences.
Debit Card Interchange Fees
The Board of Governors of the Federal Reserve System requires that the amount of any interchange transaction fee that a debit card issuer may receive or charge with respect to an electronic debit transaction shall be reasonable and proportional to the cost incurred by the debit card issuer with respect to the transaction, and imposes requirements regarding routing and exclusivity of electronic debit transactions and the usability of debit cards across networks. Interchange fees for certain electronic debit transactions are capped at 21 cents plus 0.05% of the transaction value for issuers with over $10 billion in consolidated assets, such as the Bank. The regulation also allows covered debit card issuers to receive 1 cent per transaction for fraud-prevention costs, provided that the debit card issuer meets the fraud-prevention standards established by the FRB. Interchange fees impact revenues of the Consumer Banking and HSA Bank operating segments, however, HSA Bank’s interchange revenue is not subject to these rules.
Incentive Compensation
The federal banking agencies have issued joint guidance on incentive compensation designed to ensure that the incentive compensation policies of banking organizations do not encourage imprudent risk taking and are consistent with the safety and soundness of the organization. We take this guidance into account as part of our compensation practices and enterprise risk management. Additionally, in accordance with federal securities laws and regulations and the continued listed standards for the NYSE, we adopted our Policy for Recoupment of Incentive Compensation for our executive officers as of October 17, 2023, which has been included as Exhibit 97 to this Annual Report on Form 10-K.
Enterprise Risk Management Framework
As a publicly-traded bank holding company with $50 billion or more in total consolidated assets, under federal banking laws, the Company is required to maintain a risk committee, led by an independent director, with at least one risk management expert, that is responsible for the oversight of its enterprise risk management framework and that meets other statutory and regulatory requirements set by the OCC. The Company maintains a standing Risk Committee of the Board of Directors that meets the OCC’s regulatory requirements to oversee its enterprise risk management framework. In addition, the Enterprise Risk Management Committee, which is the highest management-level risk committee, provides oversight of the risks inherent in Webster’s business and serves as an escalation point for risk topics and issues raised by its seven sub-committees.
At Webster, risk is defined as the potential that events, expected or unexpected, may have an adverse effect on the Company’s earnings, capital, and/or enterprise value. Webster’s enterprise risk management framework, which is aligned with the OCC’s Heightened Standards and the Handbook on Large Bank Supervision, reflects a structured and systematic approach to managing risks and controlling risk-taking activities across the organization.
Risk identification is a continuous process and occurs at various levels throughout the organization. The approaches used to identify risk include process and data analysis, risk metrics, and risk assessments. Risks are assessed across all risk categories required by the OCC guidance, and include an assessment of inherent risk and residual risk after taking into account the effectiveness of the control environment.
Risks are mitigated through the establishment of robust controls and documented policies and related procedures. A control is a specific activity, procedure, tool, or technical standard designed to satisfy the control objective and implemented within a business process to mitigate the impact and likelihood of associated inherent risk. For those risks that cannot be controlled, management may decide to accept these risks, reduce the level of business activity, share or transfer the risks, or withdraw from the activity altogether.
Impacts of risk can be both quantitative and qualitative. Webster maintains a Risk Appetite Statement, which provides the organization with guidance regarding the nature and level of residual risk that the Company is willing to accept in pursuit of its business strategy and financial plans. The Risk Appetite Statement establishes a risk appetite across Level 1 risk categories, which represent the top risks that drive the organization’s risk profile, and defines the level of risk appetite using a 5-point rating scale (minimal to critical). Further delineation and detail is provided at Level 2 and Level 3 to enable more precise risk identification, assessment, and response. Management determines whether the risks it assumes are warranted and within the boundaries expressed in the Risk Appetite Statement. A risk is warranted when it can be identified, understood, measured, monitored, and controlled as part of a deliberate risk/reward strategy. The Risk Appetite Statement contains a set of qualitative risk statements and quantitative Board level metrics along with the Board level tolerances, which are approved by the Board annually. Breaches of approved tolerances are required to be escalated and actioned in a timely manner.
The Chief Executive Officer is ultimately responsible for all of Webster’s risk-taking activities and for ensuring that an effective enterprise risk management framework is adopted, operationalized, and executed. The Chief Executive Officer sets the tone at the top and reinforces a strong risk culture that values risk self-identification and for holding executives accountable for their adherence to the enterprise risk management framework, appropriately assessing and effectively managing all of the risks associated with their activities and operating within the established risk appetite.
The Company has adopted the Three Line Model of enterprise risk management, in which the First Line manages risks, ensures compliance, performs control activities, and works in coordination with the Second Line, who provides additional expertise, support, and tools, and challenges risk management to enhance efficiency and effectiveness of the control environment. The Third Line provides an independent and objective assurance to management and the Board and assesses whether the First and Second Line functions are operating effectively. Detailed roles and responsibilities for each line are as follows:
Front Line Units, also referred to as First Line Functions, represent process owners that engage in activities designed to generate revenue and reduce expenses, provide operational and technology services, and provide operational support and servicing in the delivery of products or services. Since Front Line Unit activities inherently create risk, the Front Line Units are responsible for assessing and managing that risk.
Independent Risk Management, also referred to as the Second Line Function, is responsible for identifying, measuring, monitoring, or controlling risks independently from the Front Line Units and providing effective challenge to the Front Line Units. Independent Risk Management includes Enterprise Risk, which reports to the Chief Risk Officer, and Credit Risk Management which, reports to the Chief Credit Officer.
Internal Audit, also referred to as the Third Line Function, independently assesses Webster’s risk management processes and controls using methodology developed from professional auditing standards and regulatory guidance. Internal Audit undertakes these responsibilities through periodic reviews of Webster’s business activities, operations, and systems, and through special or retrospective reviews that may be specifically requested by the Audit Committee or management. Internal Audit is led by the Chief Audit Executive.
Information Risk
Information risk encompasses Information Technology risk and Information Security risk. Informational Technology risk is the risk that systems handling information and process flows may not meet quality and efficiency standards in line with industry, customer, and regulatory expectations, or may fail, causing outages, or that new systems may not be implemented timely. Information Technology risk also includes the risk that data supporting internal/external reporting and business decisions is not complete, accurate or available timely. Information Security risk is the risk of unauthorized access, use, disclosure, disruption, modification, perusal, inspection, recording, or destruction of electronic or physical data.
Webster proactively manages information risk to systems, people, assets, data, and capabilities by identifying systems and platforms included in its infrastructure and identifying potential risks that could adversely impact Webster systems necessary for daily operations and critical organization activities. Webster seeks to prevent unauthorized access to data by maintaining robust data security programs and tools including maintaining a comprehensive asset inventory, managing access and authorization for hardware and software, maintaining effective identity and access management, implementing endpoint and network defenses, protecting data with encryption, integrity protection and data loss prevention mechanisms and tools, continuous vulnerability monitoring, detecting and assessing threats, performing risk assessments and penetration tests, prioritizing and managing security incidents, and maintaining robust operational resiliency, recovery and security awareness programs. Periodic risk assessments are performed over key technology and security processes, and ongoing monitoring through monthly process reviews is established for identified processes to ensure controls are operating effectively and issues are identified proactively, while maintaining and supporting the overall stated appetite for information risk.
The Chief Information Officer is responsible for information risk oversight. Additionally, the Information Risk Committee is responsible for providing oversight and governance of Information risk.
Reputation Risk
Reputation risk is the potential that negative publicity regarding Webster’s conduct, business practices, or associations, whether true or not, will adversely affect its revenues, operations, and customer base, or require costly litigation or other defensive measures. Reputation risk may also impair Webster’s competitiveness by affecting its ability to establish new relationships or continue servicing existing customers. Reputation risk is inherent in all business activities, especially when dealing with stakeholders such as customers, counterparties, investors, regulators, colleagues, and communities.
In addition, reputation risk arises when Webster associates its brand with solutions and services offered through outsourced arrangements, negative publicity regarding matters such as unethical or deceptive business practices, violations of laws or regulations, high profile litigation, poor financial performance, poor execution, or inferior customer service.
Reputation risk is managed through strong corporate governance, risk culture, and a Code of Business Conduct and Ethics. All colleagues, officers, and directors of Webster have the responsibility for protecting its reputation. Setting the tone at the top, the Board and executive leadership actively support risk awareness by mandating accurate and timely management information and communication. Webster maintains strong fair and responsible banking practices, which permeate our interactions with all clients, vendors and counterparties.
Webster’s ethical standards are reinforced through recruiting, training and performance management. Management regularly monitors media coverage of Webster, including social media to monitor for inaccurate or unusual negative media coverage, as well as for negative news and adverse events at our competitors.
The Chief Corporate Responsibility Officer is responsible for reputation risk oversight. Additionally, the Enterprise Risk Management Committee is responsible for providing oversight and governance of Reputation Risk.
Operational Risk
Operational risk is the risk of loss, whether direct or indirect, due to the inadequacy or failure of processes and systems, human error, or from external events. Operational risk at Webster includes Fraud, Third Party, Human Capital, Business Operations, Model, Legal, and Physical Security.
•Fraud risk is the risk of financial or reputational loss arising from internal or external fraud exposing Webster to financial and/or reputational loss.
•Third Party risk is the risk of adverse impact to customers or business operations due to an incident or vulnerability with a service being provided by or on behalf of a third-party provider.
•Human Capital risk is the risk of loss of key personnel, skills shortages and knowledge management which could potentially impact Webster’s ability to execute on its key strategic initiatives, facilitate a desired risk culture, competitive position in the marketplace, and business operations.
•Business Operations risk is the risk that business processes are poorly designed, not clearly defined or aligned with business objectives, do not satisfy customer needs, dilute shareholder value, or expose assets to misappropriation or misuse.
•Model risk is the risk that arises from errors within a model and/or incorrect use of a model, while considering the degree of reliance on model output in decision making.
•Legal risk is the risk of financial or reputational exposure resulting from either Webster or third party-initiated litigation, contract disputes, transactions, or compliance/regulatory failures that could result in fines, penalties, and/or imprisonment. In addition, it includes the risk that the organization’s governance structure is inadequate to facilitate Board oversight of Webster activities to ensure alignment with regulatory guidelines and supervisory expectations.
•Physical Security risk is the risk that arises from the inability to protect Webster’s assets, including infrastructure and people, from natural and/or man-made disasters that would impair its ability to operate in a controlled environment.
Webster mitigates operational risk through an operational risk management framework, which provides for a set of tools to identify, assess, monitor, control, and report on operational risk. The framework enables the lines of business and corporate functions to establish accountability for the timely and effective management of identified risks, control failures, or other related gap/deficiencies that are reinforced through incentive structures. Webster seeks to control operational risk within an acceptable range, which is determined by the types of businesses in which it engages. Control of operational losses depends on identifying the types of transactions and operational risks faced at the enterprise and business level, and ensuring effective internal control processes are in place to mitigate these risks.
The Head of Operational Risk is responsible for operational risk oversight. Additionally, the Operational Risk Management Committee is responsible for providing oversight and governance of operational risk.
Credit Risk
Credit risk is the risk of loss resulting from the failure of a borrower or counterparty to honor its financial or contractual obligations to Webster. Credit risk arises in Webster’s lending operations, and in its funding and investment activities where counterparties have repayment or other obligations to Webster. Credit risk can also arise from other solutions or services that involve customer obligations for the transfer of funds.
The overall focus of credit risk management is to balance returns relative to risk while operating within stated risk tolerances. Webster maintains underwriting standards consistent with our desired risk profile and robust credit processes. Webster’s loan portfolio is balanced to include both commercial and consumer lending activity, while closely managing concentrations in borrowers, counterparties, industries, and solutions to avoid excessive correlated risk.
Diversification of the loan portfolio across commercial and industrial, specialty finance, commercial real estate, and residential lending is important in managing credit risk. Accordingly, management aims to actively measure and manage concentrations by portfolio, industry sector and specific sub-sectors, geography, affiliated obligors, and other guidelines. Webster is primarily a relationship lender. In addition, Webster will only assume credit risk when it can be effectively managed from an infrastructure or operational perspective, and it has industry, product, and market expertise.
The Chief Credit Risk Officer is responsible for credit risk oversight. The Credit Risk Management Committee is also responsible for providing oversight and governance of credit risk for the Bank.
Compliance Risk
Compliance risk is the risk to current or anticipated earnings or capital arising from violations of, or non-compliance with, laws, rules, regulations, prescribed practices, internal policies and procedures, or prudent ethical standards. Compliance risk exposes Webster to fines, civil monetary penalties, payment of damages, and the voiding of contracts.
Webster’s activities with overall compliance, consumer protection, and regulatory risk include deposit account management, lending products and services, privacy protections, investment management, and fiduciary services. Compliance risk is inherently high for banks, given the complexity of implementation and level of regulatory scrutiny, reliance on third party service providers, likelihood of regulatory enforcement actions, and the potential for the assessment of penalties and fines.
Corporate Compliance, a second line function, manages compliance risk through the execution of a comprehensive Compliance Management Program, which is designed to identify and evaluate risks of non-compliance, assess, test, and monitor the effectiveness of internal controls, and report and escalate significant issues.
BSA Compliance, a second line function, monitors and evaluates attempts to launder money, finance terrorism or conduct other illegal activities through Webster that arise from different sources, certain solutions, services, customers, entities, and geographic locations which may be more susceptible to these activities.
The Chief Compliance Officer is responsible for compliance risk oversight. Likewise, the BSA Officer is responsible for BSA, Anti-Money Laundering, and OFAC related risks. Additionally, the Regulatory Compliance Committee is responsible for providing oversight and governance of compliance risk, while the BSA/Fraud Oversight Committee is responsible for providing oversight and governance of BSA and Fraud risk.
Financial Risk
Financial risk is made up of treasury risk and accounting risk. Treasury risk includes the risk of capital levels falling below supervisory expectations or being incommensurate with the level of risk; the risk that the value of a security or investment will decrease or losses may be incurred due to changes in market conditions such as interest rates, exchange rates, and market volatility; the risk that changes in interest rates could contribute to a reduction in earnings and net worth driven by differences in the rate at which Webster earns interest on its assets versus what it pays as interest on its liabilities; and the risk from decreases or changes in funding sources that could impact Webster’s ability to meet its obligations. Accounting risk includes the risks that arise from the inability to comply with GAAP and regulatory laws/guidelines, ensure a high integrity financial reporting process, and disclose appropriate information.
The treasury components of financial risk are managed through interest rate, liquidity, and capital scenario analysis and stress testing. Interest rate exposure is managed in such a way that changes in interest rates would not jeopardize Webster’s “well capitalized” status or ability to execute the strategic plan. Liquidity is monitored by considering the adequacy of liquidity sources and by considering present and future needs under various operating conditions, including extreme stress. Additionally, Webster aims to maintain capital levels that are consistent with supervisory expectations and commensurate with the risk profiles of our portfolios for a range of stress scenarios.
The accounting components of financial risk are mitigated through a combination of internal controls over financial reporting and disclosure controls and procedures. These controls are tested periodically to ensure they are functioning as intended.
The Chief Financial Officer is responsible for financial risk oversight. Additionally, the ALCO is responsible for providing oversight and governance of treasury risk, while the Disclosure and SOX Committees are responsible for providing oversight and governance of accounting risk.
Strategic Risk
Strategic risk is the risk to current or projected financial condition, expected returns and resilience arising from the inability to select and execute strategic choices, suboptimal company positioning, ineffective organizational structures, poor implementation of priorities and initiatives, inadequate risk management infrastructure, or the lack of responsiveness to changes in the financial services ecosystem and operating environment.
Webster seeks to achieve its performance objectives by making management decisions, which include the selection of strategic choices, applying planning assumptions, assessing our internal capabilities and the external environment, ensuring capital and resources are dedicated to strategic priorities, and ensuring effective execution by periodically reviewing specific plans and execution. Strategic risk underscores the need for balance between risk and return, evaluating opportunity against the risk of loss of value.
The long-range strategic planning process ensures that strategic choices and initiatives are viewed within the context of Webster’s strategic management framework and the overarching goal of allocating capital and resources to support strategies that create value for customers and sustainably grow economic profit over time. Changes and updates to the business line strategic choices and supporting initiatives are socialized and reviewed with the Board of Directors along with the priorities of the Company. The impact of strategies on our risk appetite and risk profile is evaluated, working in collaboration with the independent risk management functions, as part of the strategic planning process.
The Corporate Strategy Officer is responsible for strategic risk oversight. Additionally, the Enterprise Risk Management Committee is responsible for providing oversight and governance of strategic risk.
Additional information regarding risks and uncertainties, and relevant risk factors that could impact the Company’s business, results of operations, or financial condition can be found in Part I - Item 1A. Risk Factors and throughout Part II of this report.
ITEM 1A. RISK FACTORS
Investment in Webster stock involves risks and uncertainties, some of which are inherent in the financial services industry and others of which are more specific to our business. The discussion in the paragraphs below addresses the material risks and uncertainties, of which we are currently aware, that could adversely affect our business, results of operations, or financial condition. Before making an investment decision, you should carefully consider the risks and uncertainties together with all of the other information included or incorporated by reference in this report. If any of these events or circumstances actually occurs, our business, results of operations, or financial condition could be significantly impacted.
Information Risk
A failure or breach of our information systems, including as a result of cyber-attacks, could disrupt our businesses, result in the misuse of confidential or proprietary information, damage our reputation, and cause losses.
As a financial institution, we depend on our ability to process, record, and monitor a large number of customer transactions. Accordingly, our operational systems and technology infrastructure must continue to be safeguarded and monitored for potential failures, disruptions, and breakdowns. Our business, financial, accounting, data processing, or other operating systems and facilities, including mobile banking applications and other recently developed technologies, may stop operating properly or become disabled or compromised as a result of a number of factors that may be beyond our control. For example, there could be sudden increases in customer transaction volume, electrical or telecommunications outages, natural disasters, pandemics, events arising from political or social matters, including terrorist acts and cyber-attacks, all of which may contribute to a cybersecurity threat.
Although we have business continuity plans and information security and technology processes and controls in place, we are at risk of cybersecurity threats due to disruptions or failures in the operational systems or technology infrastructures that support our businesses and customers, or cyber-attacks or security breaches of the networks, systems, or devices on which information assets are stored or are used by customers to access our products and services. Any of these incidents could result in customer attrition, regulatory fines, penalties or intervention, reputational damage, reimbursement, or other compensation costs, which could have a material adverse effect on our business strategy, results of operations, or financial condition.
Additionally, third parties with whom we do business or that facilitate our business activities, including exchanges, clearing houses, financial intermediaries, or vendors that provide services or security solutions for our operations, could also be sources of operational risk and information security risk, including breakdowns or failures of their own systems, capacity constraints, and cyber-attacks, each of which could pose a cybersecurity risk.
In recent years, information security risks for financial institutions have risen due to the increased sophistication and activities of organized crime, hackers, terrorists, hostile foreign governments, activists, and other external parties. There have been instances involving financial services and consumer-based companies reporting unauthorized access to, and disclosure of, customer information or the destruction or theft of corporate data. There have also been highly publicized cases where hackers have requested ransom-payments in exchange for allowing access to systems and/or not disclosing customer information.
Our inherent risk and exposure to information security matters remains heightened, and as a result, the continued development and enhancement of our controls, processes, and practices designed to protect operational systems, computers, software, data, and networks from attack, damage, or unauthorized access remains a high priority for us. While we have purchased network and privacy liability insurance coverage, which includes digital asset loss, business interruption loss, network security liability, privacy liability, network extortion, and data breach coverage, such insurance may not cover any and all actual losses. As cybersecurity threats and related regulations continue to evolve, we may be required to expend significant additional resources to modify our protective measures or to investigate and remediate any information security vulnerabilities.
We are subject to complex state and federal laws and regulations regarding data privacy and security, which impact how we conduct our business.
We are subject to complex and evolving data privacy laws, rules and contractual obligations (collectively “data privacy laws”) that relate to the privacy and security of the personal information of our customers and employees, or any other natural persons. These data privacy laws require, among other things, that we make certain privacy disclosures, maintain a robust security program, require disclosures and notifications during a cyber or information security incident, and regulate our collection, use, sharing, retention, and safeguarding of consumer or employee information. State and federal regulators may also hold us responsible for privacy and data protection obligations performed by our third-party service providers while providing services to us, as well as disclosures and notifications during a cyber or information security incident. Consumers also have the option to direct us and other financial institutions not to share information about transactions and experiences with affiliated companies for the purpose of marketing products or services.
State regulators have also been increasingly active in implementing privacy and cybersecurity regulations. Several states have also recently strengthened their data breach notification and data privacy requirements. We expect this trend of state-level activity in those areas to continue and are continually monitoring developments, particularly if the CFPB is no longer enforcing federal financial institution consumer privacy laws and regulations. As the regulatory environment becomes more rigorous, we anticipate that compliance with these requirements will result in additional costs and expenses, and may impact the way we conduct business. Our failure to comply with data privacy laws could result in potentially significant regulatory or governmental investigations, litigation, fines, or sanctions, or cause damage to our reputation, which could have a material adverse effect on our business, financial condition, or results of operations.
We may not be able to successfully implement current or future information technology system enhancements and operational initiatives, which could adversely affect our business operations and profitability.
We continue to invest significant resources in our core information technology systems in order to provide functionality and security at an appropriate level, and to improve our operating efficiency and to streamline our client experience. These initiatives significantly increase the complexity of our relationships with third-party service providers and such relationships may be difficult to unwind. We may not be able to successfully implement and integrate such system enhancements and initiatives, which could adversely impact our ability to comply with certain legal and regulatory requirements. In addition, these projects could have higher than expected costs and/or result in operating inefficiencies, which could increase the costs associated with the implementation as well as ongoing operations. Failure to properly utilize system enhancements that are implemented in the future could result in impairment charges that adversely impact our financial condition and results of operations, could result in significant costs to remediate or replace the defective components, and could impact our ability to compete. In addition, we may incur significant training, licensing, maintenance, consulting, and amortization expense during and after implementation, and any such costs may continue for an extended period of time. As such, we cannot guarantee anticipated long-term benefits from these system enhancements and operational initiatives.
Reputation Risk
Increasing scrutiny and evolving expectations from customers, regulators, investors, and other stakeholders with respect to our corporate responsibility practices may impose additional costs on us or expose us to new or additional risks.
Companies are facing increasing scrutiny from customers, regulators, investors, and other stakeholders related to their corporate responsibility practices and disclosure. Investor advocacy groups, investment funds, and influential investors are also increasingly focused on these practices, especially as they relate to the environment (including with respect to climate change), health and safety, inclusion and belonging, human capital management, labor conditions, and human rights. Due to divergent stakeholder views on these matters, we are at increased risk that any action, or lack thereof, concerning these matters will be perceived negatively by some stakeholders, which could negatively affect our business and reputation. Furthermore, as a result of our diverse base of clients and business partners, we may face potential negative publicity based on the identity of our clients or business partners and the public's (or certain segments of the public’s) view of those entities. Increased corporate responsibility-related compliance costs for us, as well as among our third-party suppliers, vendors, and various other parties within our supply chain, could also result in increases to our overall operational costs. Any failure or perceived failure (whether or not valid) to pursue or fulfill our sustainability goals and aspirations, to comply with evolving regulatory requirements, or to meet investor or stakeholder expectations and standards could negatively impact our reputation, ability to do business with certain partners, access to capital, and the price of our stock.
We are subject to financial and reputational risks from potential liability arising from lawsuits.
The nature of our business ordinarily results in certain legal proceedings and claims. Whether claims or legal actions are founded or unfounded, if such claims and legal actions are not resolved in a manner favorable to us, they may result in significant financial liability and/or adversely affect how the market perceives us, the products and services we offer, as well as customer demand for those products and services. Any financial liability or reputation damage could have a material adverse effect on our business, which could have a material adverse effect on our financial condition and results of operations.
We assess our liabilities and contingencies in connection with outstanding legal proceedings and certain threatened claims and assessments using the latest and most reliable information. For matters identified where it is probable that we will incur a loss and we can reasonably estimate the amount, we will establish an accrual for the loss. Once established, the accrual is then adjusted, as needed, to reflect any relevant developments. However, the actual cost of an outstanding legal proceeding or threatened claim and assessment may be substantially higher than the amount accrued by management.
Operational Risk
We rely on third parties to perform significant operational services for us.
Third parties perform significant operational services on our behalf. For instance, we depend on our vendor-provided core banking processing systems to process a large number of increasingly complex transactions on a daily basis. Accordingly, we are exposed to the risk that vendors and third-party service providers might not perform in accordance with their contracts or service agreements, whether due to changes in their organizational structure, strategic focus, support for existing products, technology, services, financial condition, or for any other reason. Their failure to perform could be disruptive to our operations, which could have a materially adverse impact on our business, results of operations, and financial condition. Although we require third-party service providers to have business continuity and disaster recovery plans that are aligned with our plans, such plans may not operate successfully or in a timely manner so as to prevent any such material adverse impact.
Our business may be adversely affected by fraud.
As a financial institution, we are inherently exposed to risk in the form of theft and other fraudulent activities by employees, customers, or other third parties targeting Webster or Webster’s customers or data. Such activity may take many forms, including check fraud, electronic fraud, wire fraud, phishing, social engineering, and other dishonest acts. Although we devote substantial resources to maintaining effective policies and internal controls to identify and prevent such incidents, given the increasing sophistication of possible perpetrators, we may experience financial losses or reputational harm as a result of fraud.
Our internal controls may be ineffective, circumvented, or fail.
Management regularly reviews and updates our internal controls, disclosure controls and procedures, and corporate governance policies and procedures. Any system of controls, however well designed and operated, is based in part on certain assumptions and can provide only reasonable, not absolute, assurances that the objectives of the system are met. Any failure or circumvention of our controls and procedures, failure to implement any necessary improvement of controls and procedures, or failure to comply with regulations related to controls and procedures could have a material adverse effect on our business, results of operations, and financial condition.
We are exposed to environmental liability risk with respect to properties to which we obtain title.
A significant portion of our loan portfolio is secured by real property. In the normal course of business, we may foreclose on and take title of properties securing certain loans, and there is a risk that hazardous or toxic substances could be found on these properties. If hazardous or toxic substances are found, we may be held liable for remediation costs, including significant investigation and clean-up costs and for personal injury or property damage. In addition, environmental contamination could materially reduce the affected property’s value or limit our ability to use or sell the affected property. Although we have policies and procedures to perform environmental reviews prior to lending against or initiating any foreclosure action on real property, these reviews may not be sufficient to detect all potential environmental hazards. Further, if we are the owner or former owner of a contaminated site, we may be subject to common law claims based on damages and costs incurred by others due to environmental contamination emanating from the property. These remediation costs and liabilities could have a material adverse effect on our financial condition and results of operations.
Climate change manifesting as physical or transition risks could adversely affect our operations, businesses, and customers.
There is an increasing concern over the risks of climate change and related environmental sustainability matters. The physical risks of climate change include discrete events, such as flooding and wildfires, and longer-term shifts in climate patterns, such as extreme heat, sea level rise, and more frequent and prolonged drought. Such events could disrupt our operations, those of our customers, or third parties on which we rely, including through direct damage to assets and indirect impacts from supply chain disruption and market volatility. In addition, transitioning to a low-carbon economy may entail extensive policy, legal, technological, and market initiatives. Transition risks, including changes in consumer preferences and additional regulatory requirements or taxes, could increase our expenses and undermine our strategies.
Our reputation and client relationships may be damaged as a result of our practices related to climate change.
Our reputation and client relationships may be damaged as a result of our practices related to climate change, including our direct or indirect involvement in certain industries or projects associated with causing or exacerbating climate change, as well as any decisions we make to conduct or change our activities in response to managing climate risk. We have developed and continue to enhance processes to assess and monitor the Bank’s exposure to climate risk. However, because the timing and impact of climate change have limited predictability, our risk management strategies may not be effective in mitigating climate risk exposure.
There may be risks resulting from the extensive use of models in our business.
We rely on financial and economic models to measure risks, estimate certain financial values, and inform certain business decisions. Models may be used in processes such as risk management, asset management, valuation, capital and reserve calculations, and financial reporting. Models generally predict or infer certain financial outcomes, leveraging historical data and assumptions as to the future, often with respect to macroeconomic conditions. Development and implementation of some of these models requires us (or third parties) to make difficult, subjective, and complex judgments. Such judgments may not capture or fully incorporate conditions leading to losses, particularly in times of market distress, and the historical correlations on which we rely may no longer be relevant. Additionally, as businesses and markets evolve, the data and assumptions used in these models may not accurately reflect this evolution. If the design, implementation, or incorrect use of our models (or our third parties’ models) is flawed, or a model’s assumptions or limitations are misunderstood or set incorrectly, we could make business, strategic, or tactical decisions based on a model’s output that is incorrect, misleading, or incomplete. In addition, information we provide to the public or to our regulators based on poorly designed, implemented, or incorrectly used models could be misleading or inaccurate. Certain decisions that the regulators make, including those related to requests we may make to pay dividends to our stockholders, could be adversely affected due to a regulator’s negative perception of our risk or business management, including but not limited to, insufficient model quality or incorrect model use.
The development and use of AI presents risks and challenges that may adversely impact our business.
We are in the early stages of incorporating AI into our business activities to increase employee productivity. We have not yet deployed AI-driven systems in critical decision-making or client-facing processes. Our vendors or third parties may develop or incorporate AI technology in certain business processes, services, or products. Any reliance on AI presents a number of risks and challenges to our business. The legal and regulatory environment relating to AI is uncertain and rapidly evolving, both in the U.S. and internationally, and includes regulatory schemes targeted specifically at AI. On January 23, 2025, President Trump issued an Executive Order aimed at reducing barriers to AI innovation in the U.S. economy. The Order requires relevant persons and bodies within the federal government to develop an AI action plan to carry out this objective and revokes prior AI-related Executive Orders, as well as all corresponding policies, regulations, order, directives, and other actions taken in response to such Order. These evolving laws and regulations could require changes in our consideration and implementation of AI technology and increase our compliance costs and the risk of non-compliance. AI models may reflect biases included in the data on which they are trained, that could result in the release of company confidential information, infringe on intellectual property rights, or that is otherwise harmful. Further, the complexity of many AI models makes it difficult to fully evaluate. Thus, the use of an AI model could expose us to liability or adverse legal or regulatory consequences and harm our reputation.
Credit Risk
Our allowance for credit losses on loans and leases may be insufficient.
We maintain an ACL on loans and leases, which is a reserve established through a provision for credit losses charged to expense, that represents management’s best estimate of expected credit losses over the life of the loan or lease within our existing portfolio. The determination of the appropriate level of ACL on loans and leases inherently involves a high degree of subjectivity and requires us to make significant estimates of current credit risks and trends using existing qualitative and quantitative information and reasonable supportable forecasts of future economic conditions, all of which may undergo frequent and material changes. Changes in economic conditions affecting borrowers, the softening of macroeconomic variables that we are more susceptible to, along with new information regarding existing loans, identification of additional problem loans, and other factors, both within and outside our control, may indicate the need for an increase in the ACL on loans and leases.
Bank regulatory agencies also periodically review our ACL and may require an increase in the provision for credit losses or the recognition of additional loan charge-offs, based on judgments different than those of management. In addition, if charge-offs in future periods exceed the ACL, we may need, depending on an analysis of the adequacy of the ACL, an additional provision to increase the ACL. An increase in the ACL would result in a decrease in net income, and could have a material adverse effect on our financial condition, results of operations, and regulatory capital position.
The soundness of other financial institutions could adversely affect our business.
Our ability to engage in routine funding transactions could be adversely affected by the actions and commercial soundness of other financial institutions. Financial services institutions are interrelated as a result of trading, clearing, counterparty, or other relationships. We have exposure to many different industries and counterparties, and we routinely execute transactions with counterparties in the financial services industry, including brokers and dealers, commercial banks, investment banks, mutual and hedge funds, and other institutional clients. As a result, defaults by, or even rumors or questions about one or more financial services companies, or the financial services industry in general, have led, and may further lead to market-wide liquidity problems and could lead to losses or defaults by us or by other institutions. Many of these transactions could expose us to credit risk in the event of default of our counterparty or client. In addition, our credit risk may be impacted if the collateral held by us cannot be realized or is liquidated at prices not sufficient to recover the full amount of our investment in the financial instrument. Any such losses could materially or adversely affect our business, financial condition, or results of operations.
We are subject to the risk of default by our counterparties and clients, particularly with respect to certain types of commercial loans.
Many of our routine transactions expose us to credit risk in the event of default of our counterparties or clients. Our credit risk may be exacerbated when the collateral held cannot be realized or is liquidated at prices insufficient to cover the full amount of the loan or derivative exposure to us. In deciding whether to extend credit or enter into other transactions, we may rely on information furnished by or on behalf of counterparties and clients, including financial statements, credit reports, and other information. We may also rely on representations of those counterparties, clients, or other third parties, such as independent auditors, as to the accuracy and completeness of that information. The inaccuracy of that information or those representations affects our ability to evaluate the default risk of a counterparty or client accurately and could cause us to enter into unfavorable transactions, which could have a material adverse effect on our financial condition and results of operations.
In addition, we consider our commercial real estate loans and commercial and industrial loans to be higher risk categories in our loan portfolio because these loans are particularly sensitive to economic conditions. Commercial real estate loans generally have large balances and can be significantly affected by adverse economic conditions that are outside of the borrower’s control because payments on such loans typically depend on the successful operation and management of the businesses that hold the loans. In recent years, commercial real estate has been impacted by higher interest rates and inflation, which affected the profitability of new commercial real estate developments, the feasibility of some projects, and the volume of commercial real estate investments. The commercial real estate market has experienced increased property vacancies and declining rent growth. In the case of commercial and industrial loans, related collateral often consists of accounts receivable, inventory, and equipment. This type of collateral typically does not yield substantial recovery in the event of foreclosure and may rapidly deteriorate, disappear, or be misdirected in advance of foreclosure. In addition, many of our commercial real estate and commercial and industrial borrowers have more than one loan outstanding with us. Consequently, an adverse development with respect to one loan or one credit relationship may expose us to significantly greater risk of loss. The risks associated with these types of loans could have a significant negative affect on our earnings in any quarter, which could have a material adverse affect on our business, financial condition, and results of operations.
We are subject to commercial lending concentration risks.
At December 31, 2024, approximately 75% of our loan and lease portfolio consisted of commercial non-mortgage, commercial real estate, and multi-family loans, and a large portion of the borrowers or properties associated with these loans are geographically concentrated in New York City and proximate areas. We continue to monitor risks associated with office space, anchor tenants, and the general economic and physical risks (such as severe weather, public health, and personal safety risks), affecting commercial properties and borrowers in the Greater New York City area. Additional information regarding our commercial lending business can be found in Part II under the section captioned “Loans and Leases” contained in Item 7. Management’s Discussion and Analysis of Financial Condition and Results of Operations.
Compliance Risk
We are subject to extensive government regulation and supervision, which may interfere with our ability to conduct our business operations.
We are subject to extensive federal and applicable state regulation and supervision, primarily through Webster Bank and certain non-bank subsidiaries. Banking regulations are primarily intended to protect depositors, the FDIF, and the safety and soundness of the U.S banking system as a whole, not stockholders. These regulations affect our lending practices, capital structure, investment practices, dividend policy, and growth, among other things. Congress and federal regulatory agencies continuously review banking laws, regulations, and policies for possible changes, and proposed changes are to be expected as a result of a change in the office of the President of the U.S. Changes to statutes, regulations, or regulatory policies, including changes in interpretation or implementation thereof, could affect us in substantial and unpredictable ways. We expect the Trump Administration will seek to implement a regulatory agenda that is significantly different than that of the Biden Administration, impacting the rule-making, supervision, examination, and enforcement priorities of the federal banking agencies. Such changes could subject us to additional costs, limit the types of financial services and products we may offer, and restrict what we are able to charge for certain banking services, or lead to regulatory uncertainty. Failure to comply with laws, regulations, or policies could result in sanctions by regulatory agencies, civil penalties, and reputation damage, which could have a material adverse effect on our business, financial condition, and results of operations. While we have policies and procedures designed to prevent these types of violations, there can be no assurance that such violations will not occur.
Significant changes to the size and operations of the federal government agencies may cause economic disruptions that could adversely impact our business, results of operations and financial condition.
The Trump Administration has started to implement significant changes to the size of the federal government. To date, we have seen executive actions to eliminate or modify federal agency and federal program funding, reduce the size of the federal workforce and minimize the oversight of certain federal agencies, and encourage the use of AI and other advanced technologies. Government services and federal program funds and benefits may be disrupted or eliminated which could adversely affect regional and local economies and our customers, and thus our business, results of operations and financial condition. In the absence of comprehensive federal regulation and oversight, we could become increasingly burdened by a patchwork of overlapping by differing state and local laws, rules, and regulations, which would increase uncertainty with respect to certain matters and require us to incur additional costs and expenses in an effort to comply.
We face risks related to the adoption of future legislation and potential changes in federal regulatory agency leadership, policies, and priorities.
Changes in key personnel at the regulatory agencies, including the federal banking regulators, may result in differing interpretations of rules and guidelines, including more stringent enforcement and more severe penalties than previously. Disagreements between, or in, the U.S. Congress on the federal budget and debt ceiling may lead to total or partial government shutdowns, which can create economic instability and negatively affect our business and financial performance. New federal or state laws and regulations regarding lending and funding practices and liquidity standards could negatively impact the Bank’s business operations, increase the cost of compliance, and adversely affect profitability. The failure of banks to follow existing laws and regulations contributes to bank failures, which also adversely affects the banking industry and can lead to special FDIC assessments, such as what we are currently subject to.
Regulatory compliance expense likely will increase substantially when we reach $100 billion in assets, which is the next regulatory tier above us now. Moreover, we expect such costs to increase significantly as we approach that size.
Regulatory restrictions and costs tend to increase based on a bank holding company’s consolidated asset tier. Becoming subject to Category IV enhanced prudential standards will have the most significant impact on us after we cross the $100 billion in assets threshold. As of December 31, 2024, we had more than $79 billion in assets on a consolidated basis. Under such enhanced prudential standards, Category IV bank holding companies are subject to greater regulation and supervision, including, but not limited to: certain capital planning and stress testing and capital buffer requirements; supervisory capital stress testing conducted by the FRB biennially; and certain liquidity risk management and liquidity stress testing and buffer requirements. Our preparations for, and the application of, these enhanced prudential standards and resolution planning requirements for our depository institution could adversely affect our results of operations and financial performance through additional capital and liquidity requirements and increased compliance costs. Compliance costs associated with those and other Category IV regulations are expected to be significant. Moreover, we expect that a significant portion of those compliance costs to be incurred as we approach the $100 billion tier, rather than commence abruptly when we become a Category IV bank, as we upgrade compliance systems, processes, and staffing before they are fully needed.
Changes in federal, state, or local tax laws may negatively impact our financial performance.
We are subject to changes in tax laws that could increase our effective tax rates or cause an increase or decrease in our income tax liabilities. These law changes may be retroactive to previous periods and as a result, could negatively impact our current and future financial performance.
We are subject to examinations and challenges by taxing authorities.
We are subject to federal and applicable state and local income tax regulations. Income tax regulations are often complex and require interpretation. In the normal course of business, we are routinely subject to examinations and challenges from federal and applicable state and local taxing authorities regarding the amount of taxes due in connection with investments we have made and the businesses in which we have engaged. Recently, federal and state and local taxing authorities have been increasingly aggressive in challenging tax positions taken by financial institutions. These tax positions may relate to compliance, sales and use, franchise, gross receipts, payroll, property, and income tax issues such as tax base, apportionment, and tax credit planning. The challenges made by taxing authorities may result in adjustments to the timing or amount of taxable income or deductions, or the allocation of income among tax jurisdictions. If any such challenges are made and are not resolved in our favor, they could have a material adverse effect on our financial condition and results of operations.
Health care reform could adversely affect our Healthcare Financial Services segment.
The enactment of future health care reform affecting HSAs and/or workers compensation at the federal or state level may affect our Healthcare Financial Services segment as a bank custodian of HSAs and insurance claim settlements. We cannot predict if any such reforms will occur, ultimately become law, or if enacted, what the terms or regulations promulgated pursuant to such laws will be. Any health care reform enacted may be phased in over a number of years, but could, with respect to the operations of our Healthcare Financial Services segment, reduce revenues, increase costs, and require us to revise the ways in which we conduct business or put us at risk for loss of business. In addition, our results of operations, financial position, and cash flows could be materially adversely affected by such changes.
Acquisitions may be delayed, impeded, or prohibited due to regulatory scrutiny.
We have expanded our business through past acquisitions and may do so in the future. Our ability to complete acquisitions is in many instances subject to regulatory approval, and we cannot be certain when or if, or on what terms and conditions, any required regulatory approvals would be granted. Regulatory approvals could be delayed, impeded, restrictively conditioned or denied due to existing or new regulatory issues we have, or may have, with regulatory agencies. We may fail to pursue, evaluate or complete strategic and competitively significant acquisition opportunities as a result of industry experience with timely regulatory approvals. The regulatory approvals may contain conditions on the completion of the merger that adversely affect our business following the closing, or which are not anticipated or cannot be met. Difficulties associated with potential acquisitions that may result from these facts could have a material adverse impact on our business and, in turn, our financial condition and results of operations.
Financial Risk
Difficult conditions or volatility in the U.S. economy and financial markets may have a materially adverse effect on our business, financial condition, and results of operations.
As a financial services company, our business and overall financial performance is highly dependent upon the U.S. economy and strength of its financial markets. Difficult economic and market conditions could adversely affect our business, results of operations, and financial condition.
The risks associated with our business become more acute in periods of a slowing economy or slow growth. In particular, we could face some of the following risks in connection with a downturn in the U.S. economic and market environment:
•loss of confidence in the financial services industry and the debt and equity markets by investors, placing pressure on our common share price;
•decreased consumer and business confidence levels may decrease credit usage and investment or increase in delinquencies and default rates;
•decreased household or corporate incomes, which could reduce demand for our products and services;
•decreased value of collateral securing loans to borrowers, causing a decrease in the asset quality of our loan and lease portfolio and/or an increase in charge-offs;
•decreased confidence in the creditworthiness of the U.S. government and agency securities that we hold;
•increased concern over and scrutiny of capital and liquidity levels;
•increased competition or consolidation in the financial services industry; and
•increased limitations on or potential additional regulation of financial service companies.
The U.S. economy and financial markets have experienced volatility in recent years and may continue to do so in the foreseeable future. Robust demand, labor shortages and supply chain constraints has led to persistent inflationary pressures throughout the economy. In response to these inflationary pressures, the FRB has raised benchmark interest rates in the past and may continue to raise interest rates in response to economic conditions, particularly in a continued high rate of inflation. Amidst these uncertainties, financial markets have continued to experience volatility. If financial markets remain volatile or if the aforementioned conditions result in further economic stress or recession, the performance of various segments of our business, including the value of our investment securities portfolio, could be significantly impacted.
Although the rate of inflation lowered in 2024 after rising sharply in 2022 and 2023, certain policy changes or actions during the Trump Administration, such as increased tariffs, may increase the risk that inflation will rise again. Prolonged periods of inflation may further impact our profitability by negatively impacting our fixed costs and expenses, including increasing funding costs and expense related to talent acquisition and retention. If significant inflation continues, our business could be negatively affected by, among other things, increased default rates leading to credit losses which could decrease our appetite for new credit extensions. In addition, a prolonged period of inflation could cause an increase in wages and other costs to the Company. These inflationary pressures could result in missed earnings and budgetary projections causing our stock price to suffer. We continue to closely monitor the pace of inflation and the impacts of inflation on the larger market, including labor and supply chain impacts.
Our profitability depends significantly on local economic conditions in the states in which we conduct business.
The success of our business is dependent on the general economic conditions of the significant markets in which we operate, particularly Connecticut, Massachusetts, Rhode Island, New York, and New Jersey. Difficult economic conditions or adverse changes in such local markets, whether caused by inflation, recession, unemployment, changes in housing or securities markets, or other factors, could reduce demand for our loans and deposits, increase problem loans and charge-offs, cause a decline in the value of collateral securing loans, and otherwise negatively affect our performance and financial condition.
Changes in interest rates and spreads may have a materially adverse effect on our business, financial condition, and results of operations.
Our financial condition and results of operations are significantly affected by changes in market interest rates. Interest rates are highly sensitive to many factors that are beyond our control, including general economic conditions, the competitive environment within our markets, consumer preferences for specific loan and deposit products, and policies of various governmental and regulatory agencies, in particular the FRB. Changes in monetary policy, including changes in interest rates, could influence the amount of interest we receive on loans and securities, the amount of interest we pay on deposits and borrowings, our ability to originate loans and obtain deposits, and the fair market value of our financial assets and liabilities.
Increased interest rates may decrease demand for interest-rate based products and services, including loans and deposits, and make it more difficult for borrowers to meet obligations under variable-rate or adjustable-rate loans and other debt instruments. Decreased interest rates often increase prepayments on loans and securities as borrowers refinance their loans to reduce borrowing costs. Under these circumstances, we are further subject to reinvestment risk to the extent that we cannot reinvest the cash received from such prepayments with interest rates comparable to pre-existing loans and securities.
In a rising interest rate environment, competition for cost-effective deposits increases, making it more costly for the Bank to fund loan growth. Rapid and unexpected volatility in interest rates creates additional uncertainty and potential for adverse financial effects. There can be no assurance that the Bank will not be materially adversely affected by future changes in interest rates.
To a large degree, our consolidated earnings are dependent on net interest income, which is the difference between the interest income earned from our interest-earning assets and the interest expense paid on our interest-bearing liabilities. If the rates paid on interest-bearing liabilities increase at a faster rate than the yields received on interest-earning assets, our net interest income, and therefore earnings, could be adversely affected. Conversely, earnings could also be adversely affected if the yields received on interest-earning assets fall more quickly than the rates paid on interest-bearing liabilities.
Although management believes that it has designed and implemented effective asset and liability management strategies to reduce the potential effects of changes in interest rates on our financial condition and results of operations, interest rates are affected by many factors outside of our control and any unexpected or prolonged period of interest rate changes could have a material adverse effect on our financial condition and results of operations. Further, our interest rate modeling techniques and assumption may not fully predict or capture the impact of actual interest rate changes on net interest income.
Changes in our financial condition or in the general banking industry, or changes in interest rates, could result in a loss of depositor confidence.
Liquidity is the ability to meet cash flow needs on a timely basis at a reasonable cost. The Bank uses its liquidity to extend credit and to repay liabilities as they become due or as demanded by customers. Our primary source of liquidity is our large supply of interest-bearing and non-interest bearing deposits. The continued availability of this supply of deposits depends on customer willingness to maintain deposit balances with banks in general and us in particular, as well as the continued inflow of deposits for new and existing customers. The availability of deposits can also be impacted by regulatory changes (e.g., changes in FDIC insurance, liquidity requirements, healthcare reform etc.), changes in financial condition of the Bank, other banks, or the banking industry in general, changes in the interest rates our competitors pay on their deposits, and other events which can impact the perceived safety or economic benefits of bank deposits. While we make significant efforts to consider and plan for hypothetical disruptions in our deposit funding, market-related, geopolitical, or other events could impact the liquidity derived from deposits.
Realized and unrealized losses in our financial instruments, particularly in our available-for-sale securities portfolio, could negatively impact our business, financial condition, and results of operations.
We have a large portfolio of financial instruments, including loans and leases, loan commitments, available-for-sale and held-to-maturity debt securities, derivative assets and liabilities, and non-marketable equity securities that are subject to valuation and impairment assessments. Certain of these financial instruments are measured at fair value and may be subject to considerable fluctuation resulting from, for example, perceived changes in the value of the asset, the volume of trading of the asset, shifts in investor sentiment, and general market conditions. Due to these kinds of fluctuations, the amount that we realize on a financial instrument in a subsequent period may significantly differ from the last reported value.
As market rates have increased, we have experienced significant unrealized losses on our available-for-sale securities portfolio. Unrealized losses related to available-for-sale securities are reflected in AOCL in our Consolidated Balance Sheets and reduce the level of our tangible common equity. Such unrealized losses do not affect our regulatory capital ratios. We actively monitor our available-for-sale securities portfolio and believe that it is not more likely than not that we will be required to sell securities before the recovery of the amortized cost basis. Nonetheless, our access to liquidity sources, financial condition, and results of operations, could be affected by unrealized losses if securities must be sold at a loss. Additionally, significant unrealized losses could negatively impact market and/or customer perceptions of us, which could lead to a loss of depositor confidence and result in an increase in withdrawals, particularly among those with uninsured deposits.
The proportion of our deposit account balances that exceed the FDIC insurance limits may expose the Bank to enhanced liquidity risk in times of financial distress.
In its assessment of the failures of Silicon Valley Bank and Signature Bank in the first quarter of 2023, the FDIC concluded that a significant contributing factor to the failures of these institutions was the proportion of deposits held by each institution that exceeded FDIC insurance limits. The FDIC similarly concluded that an overreliance on uninsured deposits contributed to the subsequent failure of First Republic Bank in the second quarter of 2023.
In response to the failures of Silicon Valley Bank, Signature Bank, and First Republic Bank, many large depositors across the industry withdrew deposits in excess of the applicable deposit insurance limits and deposited these funds in other financial institutions. If a significant portion of our deposits were to be withdrawn within a short period of time such that additional sources of funding would be required to meet withdrawal demands, the Company may be unable to obtain funding at favorable terms, which may have an adverse effect on our net interest margin. Additionally, obtaining adequate funding to meet our deposit obligations may be more challenging during periods of elevated prevailing interest rates. Further, interest rates paid for borrowings generally exceed interest rates paid on deposits. Our ability to attract and retain depositors during a time of actual or perceived distress of instability in the marketplace may be limited.
Higher mortgage rates and low inventory adversely impact our ability to originate or refinance residential mortgage loans.
The residential mortgage lending business is sensitive to changes in interest rates, especially long-term interest rates. Lower interest rates generally increase the volume of mortgage originations and refinancing, while higher interest rates generally cause that volume to decrease. Therefore, our residential mortgage performance is typically correlated to fluctuations in interest rates. The sustained higher rates experienced throughout 2022 and 2023, and into 2024, have negatively impacted the mortgage market, including our loan origination volume and refinancing activity. Adverse market conditions, including increased volatility, changes in interest rates and mortgage spreads, and reduced market demand could result in greater risk in retaining mortgage loans. A reduction in our residential mortgage origination and refinancing volume could have a materially adverse effect on our financial condition and results of operations.
We may be subject to more stringent capital and liquidity requirements, which could limit our business activities.
The Company and the Bank are subject to capital and liquidity requirements and standards. Regulators have and may implement changes to these standards. If we fail to meet the minimum capital adequacy and liquidity guidelines and other requirements, our business activities, including lending and our ability to expand, either organically or through acquisitions, could be limited. It could also result in us being required to take steps to increase our regulatory capital that may be dilutive to stockholders or limit our ability to pay dividends, or sell or refrain from acquiring assets.
Our ability to grow is contingent upon access to capital, which may not be readily available to us.
Our ability to access the capital markets, if needed, will depend on a number of factors, including the state of the financial markets. Rising interest rates, disruptions in financial markets, negative perceptions of our business or our financial strength, negative perceptions of the overall banking industry or of other regional banks, or other factors may impact our ability to raise additional capital, if needed, on terms acceptable to us. For example, in the event of future turmoil in the banking industry or other idiosyncratic events, there is no guarantee that the U.S. government will invoke the systemic risk exception, create additional liquidity programs, or take any other action to stabilize the banking industry or provide liquidity. Any diminished ability to access short-term funding or capital markets to raise additional capital, if needed, could subject us to liability, restrict our ability to grow, require us to take actions that would affect our earnings negatively or otherwise adversely affect our business and our ability to implement our business plan, capital plan and strategic goals.
A reduction in our credit rating could adversely affect our access to capital and could increase our cost of funds.
The credit rating agencies regularly evaluate the Holding Company and the Bank, and credit ratings are based on a number of factors, including our financial strength and ability to generate earnings, as well as factors not entirely within our control, including conditions affecting the financial services industry, the economy, and changes in rating methodologies. There can be no assurance that we will maintain our current credit ratings. A downgrade of our credit ratings could adversely affect our access to liquidity and capital, and could significantly increase our cost of funds, trigger additional collateral or funding requirements, and decrease the number of investors and counterparties willing to lend to us or purchase our securities. This could affect our growth, profitability, and financial condition, including liquidity.
Our stock price can be volatile.
Stock price volatility may make it more difficult for stockholders to resell their common stock when they want and at prices that they find attractive. Our stock price can fluctuate significantly in response to a variety of factors including, among other things:
•actual or anticipated variations in results of operations;
•recommendations or projections by securities analysts;
•operating and stock price performance of other companies that investors deem comparable to us;
•news reports relating to trends, concerns, and other issues in the financial services and healthcare industries;
•perceptions in the marketplace regarding us and/or our competitors;
•new technology used, or services offered, by competitors;
•significant acquisitions or business combinations, strategic partnerships, joint ventures, or capital commitments by or involving us or our competitors;
•changes in dividends and capital returns;
•issuance of additional shares of Webster common stock;
•changes in government regulations; and
•geopolitical conditions such as acts or threats of terrorism or military conflicts, including any military conflict between Russia and Ukraine, or actions between Israel and its neighbors.
General market fluctuations, including real or anticipated changes in the strength of the economy, industry factors and general economic and political conditions and events, such as economic slowdowns or recessions, interest rate changes, credit loss trends, among other factors, could also cause our stock price to decrease regardless of operating results.
The Holding Company may not pay dividends to stockholders if it is not able to receive dividends from its subsidiary, Webster Bank.
The Holding Company is a separate and distinct legal entity from the Bank and its non-banking subsidiaries. A substantial portion of the Holding Company’s revenues comes from dividends paid by the Bank. These dividends are the principal source of funds to pay dividends to common and preferred stockholders. Whether the Bank is able to pay dividends depends on its ability to generate sufficient net income and meet certain regulatory requirements, and the amount of such dividends may then be limited by federal and state laws. In certain circumstances, we will not be able to make a capital distribution unless the FRB approves such distribution. As a bank holding company, we also are required to consult with the FRB before increasing dividends or redeeming or repurchasing capital instruments. Additionally, the FRB could prohibit or limit our payment of dividends if it determines that payment of the dividend would constitute an unsafe or unsound practice. In the event the Bank is unable to pay the Holding Company dividends, we may not be able to pay dividends to our common and preferred stockholders.
Changes in our accounting policies or in accounting standards could materially impact how we report our financial results.
Our accounting policies and methods are fundamental to understanding how we record and report our results of operations and financial condition. Accordingly, we exercise judgment in selecting and applying these accounting policies and methods so they comply with GAAP. The FASB, SEC, and other regulatory bodies that establish accounting standards periodically change the financial accounting and reporting standards, or the interpretation of those standards, that govern the preparation of our financial statements. These changes are beyond our control, can be hard to predict, and could materially impact how we report our results of operations and financial condition. We could be required to apply a new or revised standard retrospectively, which may result in us having to restate our prior period financial statements by material amounts.
The preparation of our consolidated financial statements requires the use of estimates that may vary from actual results.
The preparation of the Company’s Consolidated Financial Statements, and the accompanying Notes thereto, in conformity with GAAP requires management to make difficult, subjective, or complex judgments about matters that are uncertain, which include assumptions and estimates of current risks and future trends, all of which may undergo material changes. Materially different amounts could be reported under different conditions or using different assumptions and estimates. Because of the inherent uncertainty of estimates involved in preparing our financial statements, we may be required to significantly adjust the financial statements as actual events unfold, which could have a material adverse effect on our financial condition and results of operations. Significant estimates subject to change include, among other items, the allowance for credit losses, the carrying value of goodwill or other intangible assets, the fair value estimates of certain assets and liabilities, and the realization of deferred tax assets and liabilities.
A significant merger or acquisition requires us to make estimates, including the fair values of assets acquired and liabilities assumed.
GAAP requires us to record the assets and liabilities of an acquired business to their fair values at the time of the acquisition. With larger transactions, fair value and other estimations can take up to four quarters to finalize. These estimates, and their revisions, can have a substantial effect on the presentation of our financial condition and operating results after the transaction closes. In addition, the excess of the purchase price over the fair value of the assets acquired, net of liabilities assumed, is recorded as goodwill. If the estimates that we have used at any financial statement date are significantly revised in the future, there could be a material negative impact on our goodwill or other acquisition-related intangibles and our results of operations for the period in which the revisions are made.
If our goodwill were determined to be impaired, it could have a negative impact on our profitability.
GAAP requires that goodwill be tested for impairment at the reporting unit level on at least an annual basis or more frequently upon the occurrence of a triggering event. An impairment loss is to be recognized if the carrying value of the net assets assigned to the reporting unit exceeds the fair value of the reporting unit. A significant decline in our expected future cash flows, a continued period of local and national economic disruption, changes to financial markets, slower growth rates, or other external factors, all of which can be highly unpredictable, may impact fair value calculations and require us to recognize an impairment loss in the future. Such an impairment loss may be significant and have a material adverse effect on our financial condition and results of operations.
Our investments in certain tax-advantaged projects may not generate returns as anticipated, or at all, and may have an adverse impact on our results of operations.
We invest in certain tax-advantaged investments that support qualified affordable housing projects and other community development initiatives. Our investments in these projects rely on the ability of the projects to generate a return primarily through the realization of federal and state income tax credits and other tax benefits. We face the risk that tax credits, which remain subject to recapture by taxing authorities based on compliance with relevant requirements at the project level, may not be able to be realized. The risk of not being able to realize the tax credits and other tax benefits associated with a particular project depends on many factors that are outside of our control. A project’s failure to realize these tax credits and other tax benefits may have a negative impact on our investment, and as a result, on our financial condition and results of operations.
Strategic Risk
New lines of business or new products and services may subject us to additional risk.
On occasion, we may implement new lines of business or offer new products and services within existing lines of business. There are substantial risks and uncertainties associated with these efforts, particularly in instances where markets are not fully developed. In developing and marketing new lines of business and/or new products and services, we may invest significant time and resources. Initial timetables for the introduction and development of new lines of business and/or new products or services may not be achieved, and price and profitability targets may not prove feasible. External factors, such as compliance with regulations, competitive alternatives, and shifting market preferences may also impact the successful implementation of a new line of business and/or a new product or service. Further, any new line of business and/or new product or service could have a significant impact on the effectiveness of our system of internal controls. Failure to successfully manage these risks in the development and implementation of new lines of business and/or new products or services could have a material adverse effect on our business, results of operations, and financial condition.
We may not be able to attract and retain skilled people, and the loss of key employees or the inability to maintain appropriate staffing may disrupt relationships with customers and adversely impact our business.
Our success depends, in large part, on our ability to attract, develop, compensate, motivate, and retain skilled people, including executives, managers, and other key employees with the skills and know-how necessary to run our business. The failure to attract or retain talented executives, managers, and employees with diverse backgrounds and experiences, or the loss of certain executives, managers, and key employees, could have a material adverse impact on our business. These risks may be heightened when U.S. labor markets, or segments of those markets, are especially competitive.
Competition for the best people in most activities in which we engage can be intense, and we may not be able to hire sufficiently skilled people or retain them. The recent transition towards companies offering remote and hybrid work environments, which is expected to endure, as well as our workplace policies (or perceptions of those policies by current and potential employees), including policies with respect to remote and hybrid work, could impact our ability to attract and retain talent with the necessary skills and experience. In addition, the transition to remote and hybrid work environments may exacerbate the challenges of attracting and retaining skilled employees because job markets may be less constrained by physical geography. The unexpected loss of services of our key personnel could have a material adverse impact on the business because of their skills, knowledge of our markets, years of industry experience, and the difficulty of promptly finding qualified replacement personnel.
Further, our business is primarily relationship-driven, in that many of our key employees have extensive customer relationships. The loss of a key employee with such customer relationships may lead to the loss of business if the customers were to follow that employee to a competitor or otherwise choose to transition to another financial services provider. While we believe that our relationships with key personnel are good, we cannot guarantee that all of our key personnel will remain with our organization.
We operate in a highly competitive industry and market area.
We face substantial competition in all areas of our operations from a variety of different competitors, both within and beyond our financial markets, many of which are larger and may have more financial resources than we do. Such traditional competitors primarily include national, regional, community, and internet banks within the various markets in which we operate, including the HSA market. We also face competition from many other types of financial institutions, including savings and loans, credit unions, non-bank health savings account trustees, finance companies, brokerage firms, insurance companies, online lenders, factoring companies, and other financial intermediaries. Some of these organizations are not subject to the same degree of regulation that is imposed on bank holding companies and federally insured depository institutions, which may give them greater flexibility in accessing funding and providing various services. Moreover, organizations that are larger than we are may be able to achieve greater economies of scale or offer a broader range of products and services, or better pricing on products and services, than what we can offer.
The financial services industry could become even more competitive as a result of legislative and regulatory changes, and continued consolidation. In addition, as customer preferences and expectations continue to evolve, technology has lowered barriers to entry and has made it possible for non-banks to offer products and services traditionally provided by banks. The financial services industry also faces increasing competitive pressure from the introduction of disruptive new technologies, such as blockchain and digital payments, often by non-traditional competitors and financial technology companies. Among other things, technology and other changes are allowing customers to complete financial transactions that historically have involved banks at one or both ends of the transaction.
Our ability to compete successfully depends on a number of factors, including, among other things:
•the ability to develop, maintain, and build upon long-term customer relationships based on top quality service, high ethical standards, and safe, sound financial position;
•the ability to expand our market position;
•the scope, relevance, and pricing of products and services offered to meet customer needs and demands, including within the HSA market;
•the rate at which we introduce new products and services relative to our competitors;
•customer satisfaction with our level of service and products; and
•industry and general economic trends.
Failure to perform in any of these areas could significantly weaken our competitive position, which could adversely affect our growth and profitability, and in turn, could have a material adverse effect on our financial condition and results of operations.
Failure to keep pace with and adapt to technological change could adversely impact our business.
The financial services industry is continually undergoing rapid technological change with frequent introductions of new technology-driven products and services and the use of artificial intelligence. These new technologies may be superior to, or render obsolete, the technologies currently used in our products and services. Our future success depends, in part, upon our ability to address the needs of our customers by using technology and information to provide products and services that will satisfy customer demands, as well as to create additional efficiencies in our operations. Many of our competitors have substantially greater resources to invest in technological improvements because of their larger size and available capital. Developing or acquiring new technologies and incorporating them into our products and services may require significant investment, take considerable time, and ultimately may not be successful. We cannot predict which technological developments or innovations will become widely adopted or how those technologies may be regulated. We also may not be able to effectively market new technology-driven products and services to our customers. Failure to successfully keep pace with and adapt to technological change affecting the financial services industry could have a material adverse impact on our business and, in turn, our financial condition and results of operations.
The loss of key partnerships could adversely affect our Healthcare Financial Services segment and interLINK operations.
Our Healthcare Financial Services segment and interLINK operations rely on partnerships to maximize our distribution model. To the extent that we fail to maintain such partnerships, which may be due to mergers and/or acquisitions and may result in changes to their business processes, or our partners choosing to align with competitors or develop their own solutions, our business, financial condition, and results of operations could be adversely affected. In particular, health plan partners who provide high deductible health plan options are a significant source of new and existing HSA holders. If these health plan partners or other partners choose to align with our competitors or develop their own solutions, our business, financial condition, and results of operations could be adversely affected.
There is significant competition for our existing partners, and our failure to retain our existing larger partner relationships upon expiration or the earlier loss of a relationship upon the exercise of a partner’s early termination rights, or the expiration or termination of a substantial number of small partner relationships, could have a material adverse effect on our results of operations (including growth rates) and financial condition to the extent that we do not acquire new partners of similar size and profitability or otherwise grow our business. In addition, existing relationships may be renewed with less favorable terms to the Company in response to increased competition for such relationships. The competition for new partners is also significant, and our failure to attract new partners could adversely affect our ability to grow.
ITEM 1B. UNRESOLVED STAFF COMMENTS
None.
ITEM 1C. CYBERSECURITY
Risk Management and Strategy. The Company has processes for assessing, identifying, and managing material risks from cybersecurity threats, and is committed to the prevention, detection, and timely response to cybersecurity threats that may impact the confidentiality, integrity, and availability of its information systems and information assets.
The Company has a Technology Risk Management Program (First Line), including Cyber and Information Risk Management, and an Information Risk Management Program (Second Line) under its Enterprise Risk Management Framework for the identification, assessment, measurement, mitigation, monitoring, and internal reporting of risks associated with its information systems, information assets, and third parties, including vendors and service providers. The Cyber and Information Security Risk Management Program and Technology Risk Management Program align with the Company’s Third-Party Risk Management Program in regard to protecting information assets.
The Cyber and Information Security Risk Management Program and Technology Risk Management Program are managed by the Company’s Corporate Information Security team, led by the CISO and the CIO. Our CISO has over 25 years of financial services industry experience, with varying positions in information technology, security, and risk management. She has numerous industry certifications, including Certified Information Systems Security Professional and Certified in Risk and Information Systems Controls certifications. She is a member of ISACA’s global Governance of Enterprise Information & Technology Advisory Group and Securing AI Certification Working Group. Our CIO has over 25 years of relevant experience in large scale digital transformation, strategic planning, talent development, global technology delivery, and operational experience. Our CIO has deep expertise across the financial services industry and in leading organizations through change. He is a member of the CNBC Technology Executive Council, where he contributes to ongoing discussions and insights on the latest trends and challenges in technology. In addition, he is a member of the Wall Street Journal CIO Network, a collective community of leading technology experts from the world’s most influential companies. Both our CISO and CIO also participate in various financial services industry committees and cybersecurity advisory boards.
On average, the other Corporate Information Security team members have over a decade of cybersecurity experience and hold over 100 industry-leading certifications in cybersecurity. For most of these certifications, there is a continuing professional education requirement to maintain a consistent level of learning by completing certain professional activities, such as attending conferences and workshops, completing online training courses, and participating in professional association meetings, throughout the certification cycle to maintain an active credential. Further, each employee is responsible for an effective cybersecurity defense which is enforced with mandatory cyber awareness training, periodic newsletters, and security updates.
“Zero trust principles” drive the Company’s information security architecture, and the Company deploys a “defense in-depth” strategy to protect against cybersecurity threats, layering multiple levels of information security and technology controls within business processes for information assets and relationships with third parties based on the National Institute of Standards and Technology Special Publication 800-53 Framework. The Company’s information systems and risk management are also subject to regulatory requirements and examination by federal banking regulators.
The identification of control weaknesses and vulnerabilities affecting information assets and/or relationships with third parties allows the Company to mitigate risk from, and respond to, cybersecurity threats. Initial risk assessments are performed upon the acquisition, or as part of the development of, information assets in order to evaluate the inherent risk associated with network and host environments and assess the adequacy of implemented technology operation processes and controls. Risk and control self-assessments are conducted on an annual basis to identify gaps resulting from any process changes that occurred during the year, and to evaluate whether the levels of cybersecurity risk remain within the tolerance set in the Company’s Risk Appetite Statement or whether a risk needs to be mitigated.
Due diligence is performed prior to onboarding all third parties with access to the Company’s information assets to ensure such parties maintain security controls contractually required by the Company as part of its Third Party Risk Management Program. The Company provides ongoing monitoring, including cybersecurity maturity assessments, of third parties using a risk-based approach to determine the extent and frequency of periodic assessments. Semi-annual cybersecurity maturity assessments are conducted by the Company’s Corporate Information Security team on its information systems using industry-standard guidelines and tools, including the National Institute of Standards Cybersecurity Framework, the Federal Financial Institutions Examination Council Cybersecurity Assessment Tool, and the Center for Internet Security Critical Security Controls.
Because cybersecurity threats continue to evolve, thereby increasing inherent risk, the Company’s Corporate Information Security team is augmented by contracted external managed security service providers, who collectively work 24/7 to monitor cybersecurity threats through processes such as endpoint and network security, email protection, data loss prevention, vulnerability scanning and mitigation, identity and access management, logging and monitoring, and threat hunting. Independent third parties test the Company’s cyber capabilities and audit its cloud security. The Company regularly tests its systems to discover and address any potential vulnerabilities. Senior and Executive management also participate in cybersecurity industry collaboration and information-sharing forums and utilize the information gained to drive protective and detective cybersecurity strategies and tactics.
The Company requires information security education, training at the time of hire, and annually thereafter, by its employees (including contractors and other third parties for training purposes), designed to mitigate accidental information security incidents. Phishing simulation activities are regularly conducted to assess employees’ competency at identifying potential threats. Employees are assigned incremental training requirements should they fail to identify simulated phishing emails through the initial training.
The Company’s Corporate Information Security team members are also responsible for completing additional mandatory annual training to understand the processes, procedures, and technical requirements for securing information assets across the enterprise. The Company also offers ongoing practice and specialized education for Corporate Information Security team members to stay up to date with emerging trends in cybersecurity threat protection, detection, and response.
The Information Security Management Program sets forth enterprise-wide coordinated responses to identified threats, ensuring timely mitigation and remediation, and facilitating awareness and communication. Tabletop exercises are held regularly at the Senior and Executive management levels to validate roles and responsibilities and response protocols respective to cybersecurity threats. The outcomes of these tabletop exercises are reviewed annually at the Board of Directors level.
Employees, contractors, and third parties are required to immediately report any suspected cybersecurity threats to the Corporate Information Security team for triaging. Any threat assessed by the Corporate Information Security team that could impact the safety of customers or personnel, cause damage to, or threaten the confidentiality, integrity, or availability of information assets, or bring about significant business interruption, are escalated for further assessment. In the event that the CISO, in consultation with the Company’s Legal and Compliance teams, determines that a material cybersecurity incident has occurred, a dedicated Crisis Incident Response team comprised of individuals from various departments across the organization is assigned to coordinate all planned cybersecurity incident-related response activities. The Company will engage third party specialists to assist in any cybersecurity incident investigation, as needed.
Cybersecurity threats that are identified and deemed material are escalated and communicated directly to Senior and Executive Management and the Risk Committee of the Board of Directors. Materiality determinations are made under the Company’s Disclosure Controls and Procedures to ensure timely cybersecurity incident disclosure notification in accordance with securities laws and/or regulations.
Material Cybersecurity Threat Risks. Risks from cybersecurity threats have not materially affected the Company, its business strategy, results of operations, or financial condition for the year ended December 31, 2024. However, it is possible that the Company could suffer such losses in the future. Information regarding risks from material cybersecurity threats can be found under the section captioned “Information Risk” contained in Item 1A. Risk Factors.
Governance. Oversight of information security risk and information technology risk is the responsibility of the Information Risk Committee, a management committee, with additional oversight from the Enterprise Risk Management Committee, a management committee, and the Risk and Technology Committees of the Board of Directors. On at least a quarterly basis, the Corporate Information Security team provides reports on updates to the Company’s information risk profile, emerging risks and threats, results of examinations, status of remediation plans and/or results of remediation activities, risk reports and risk assessment results, and risk metric results to the Information Risk Committee, who then provides such information to the Enterprise Risk Management Committee and the Risk Committee of the Board of Directors. In addition, on at least a quarterly basis, this information, along with updates on key cybersecurity initiatives, is shared with the Technology Committee of the Board of Directors, who provides oversight on information security and information technology strategy and governance.
Additional information regarding the Company’s risk management framework, including management-level and Board-level committee experience and expertise, oversight responsibilities, and information risk governance, can be found under the section captioned “Risk Management Framework” contained in Item 1. Business.
ITEM 2. PROPERTIES
The Company’s corporate headquarters is located in Stamford, Connecticut. This leased facility houses the Company’s primary executive and administrative functions and serves as the principal banking headquarters of the Bank. Additional corporate functions are housed in owned facilities in Waterbury, and in leased facilities in Southington, Hartford, and New Haven, Connecticut; Providence, Rhode Island; Boston, Massachusetts; Jericho, White Plains, and New York, New York; and Paramus, New Jersey. The Company considers its properties to be suitable and adequate for its current business needs.
Commercial Banking maintains leased facilities across a geographic footprint that ranges from Massachusetts to California. Offices are located in Boston, Massachusetts; Westerly, Rhode Island; Garden City, New York; Conshohocken, Pennsylvania; Baltimore, Maryland; Atlanta, Georgia; Dallas, Texas; and Ladera Ranch, California.
Healthcare Financial Services includes HSA Bank and Ametros. HSA Bank maintains leased facilities in Milwaukee, and Sheboygan, Wisconsin, and Ametros maintains a leased facility in Wilmington, Massachusetts.
Consumer Banking operates a distribution network that consists of 196 banking centers:
| | | | | | | | | | | |
| Location | Leased | Owned | Total |
| Connecticut | 61 | | 34 | | 95 | |
| Massachusetts | 9 | | 9 | | 18 | |
| Rhode Island | 4 | | 3 | | 7 | |
| New York | 37 | | 39 | | 76 | |
| Total | 111 | | 85 | | 196 | |
Additional information regarding the Company’s owned facilities and leased locations can be found within Note 6: Premises and Equipment and Note 7: Leasing, respectively, in the Notes to Consolidated Financial Statements contained in
Part II - Item 8. Financial Statements and Supplementary Data.
ITEM 3. LEGAL PROCEEDINGS
Information regarding legal proceedings can be found within Note 23: Commitments and Contingencies in the Notes to Consolidated Financial Statements contained in Part II - Item 8. Financial Statements and Supplementary Data, which is incorporated herein by reference.
ITEM 4. MINE SAFETY DISCLOSURES
Not applicable.
PART II
ITEM 5. MARKET FOR REGISTRANT’S COMMON EQUITY, RELATED STOCKHOLDER MATTERS AND ISSUER PURCHASES OF EQUITY SECURITIES
Market Information
The Company’s common stock is traded on the NYSE under the symbol WBS. At February 28, 2025, there were
7,944 holders of record, as determined by Broadridge Corporate Issuer Solutions, Inc., the Company’s transfer agent.
Information regarding dividend restrictions can be found under the section captioned “Supervision and Regulation” in Part I - Item 1. Business and within Note 14: Regulatory Capital and Restrictions in the Notes to Consolidated Financial Statements contained in Part II - Item 8. Financial Statements and Supplementary Data, which are incorporated herein by reference.
Recent Sales of Unregistered Securities
There were no unregistered securities sold by the Company during the year ended December 31, 2024.
Issuer Purchases of Equity Securities
The following table provides information with respect to any purchase of the Company’s common stock made by or on behalf of the Company or any “affiliated purchaser,” as defined in Rule 10b-18(a)(3) under the Securities Exchange Act of 1934, during the three months ended December 31, 2024: | | | | | | | | | | | | | | | | | |
| Period | Total Number of Shares Purchased (1) | Average Price Paid Per Share (2) | Total Number of Shares Purchased as Part of Publicly Announced Plans or Programs | Maximum Dollar Amount Available for Purchase Under the Plans or Programs (3) | | | |
| October 1, 2024 - October 31, 2024 | 1,585 | | $ | 45.92 | | — | | $ | 227,952,190 | | | | |
| November 1, 2024 - November 30, 2024 | 815 | | 60.64 | | — | | 227,952,190 | | | | |
| December 1, 2024 - December 31, 2024 | 3,399 | | 59.16 | | — | | 227,952,190 | | | | |
| Total | 5,799 | | 55.75 | | — | | 227,952,190 | | | | |
(1)All 5,799 of the shares purchased during the three months ended December 31, 2024, were acquired outside of the Company’s common stock repurchase program at market prices and related to employee share-based compensation plan activity.
(2)The average price paid per share is calculated on a trade date basis and excludes commissions and other transaction costs.
(3)The Company maintains a common stock repurchase program, which was approved by the Board of Directors on October 24, 2017, that authorizes management to purchase shares of Webster common stock in open market or privately negotiated transactions, through block trades, and pursuant to any adopted predetermined trading plan, subject to the availability and trading price of stock, general market conditions, alternative uses for capital, regulatory considerations, and the Company’s financial performance. On April 27, 2022, the Board of Directors increased the Company’s authority to repurchase shares of Webster common stock under the repurchase program by $600.0 million in shares. This existing repurchase program will remain in effect until fully utilized or until modified, superseded, or terminated.
Performance Graph
The performance graph compares the yearly percentage change in the Company’s cumulative total stockholder return on its common stock over the last five years to the cumulative total return of (i) the Standard & Poor’s 500 Index (S&P 500 Index) and (ii) the Keefe, Bruyette & Woods Regional Banking Index (KRX Index), assuming the reinvestment of dividends and an initial investment of $100 on December 31, 2019. The KRX Index is a market-capitalization weighted index comprised of 50 regional banks or thrifts located throughout the United States.
Cumulative total stockholder return is measured by dividing the sum of the cumulative amount of dividends for the measurement period, assuming dividend reinvestment, and the difference between the share price at the end and the beginning of the measurement period, by the share price at the beginning of the measurement period. The plotted points represent the cumulative total stockholder return on the last trading day of the year indicated. Historical performance shown on the graph is not necessarily indicative of future performance.
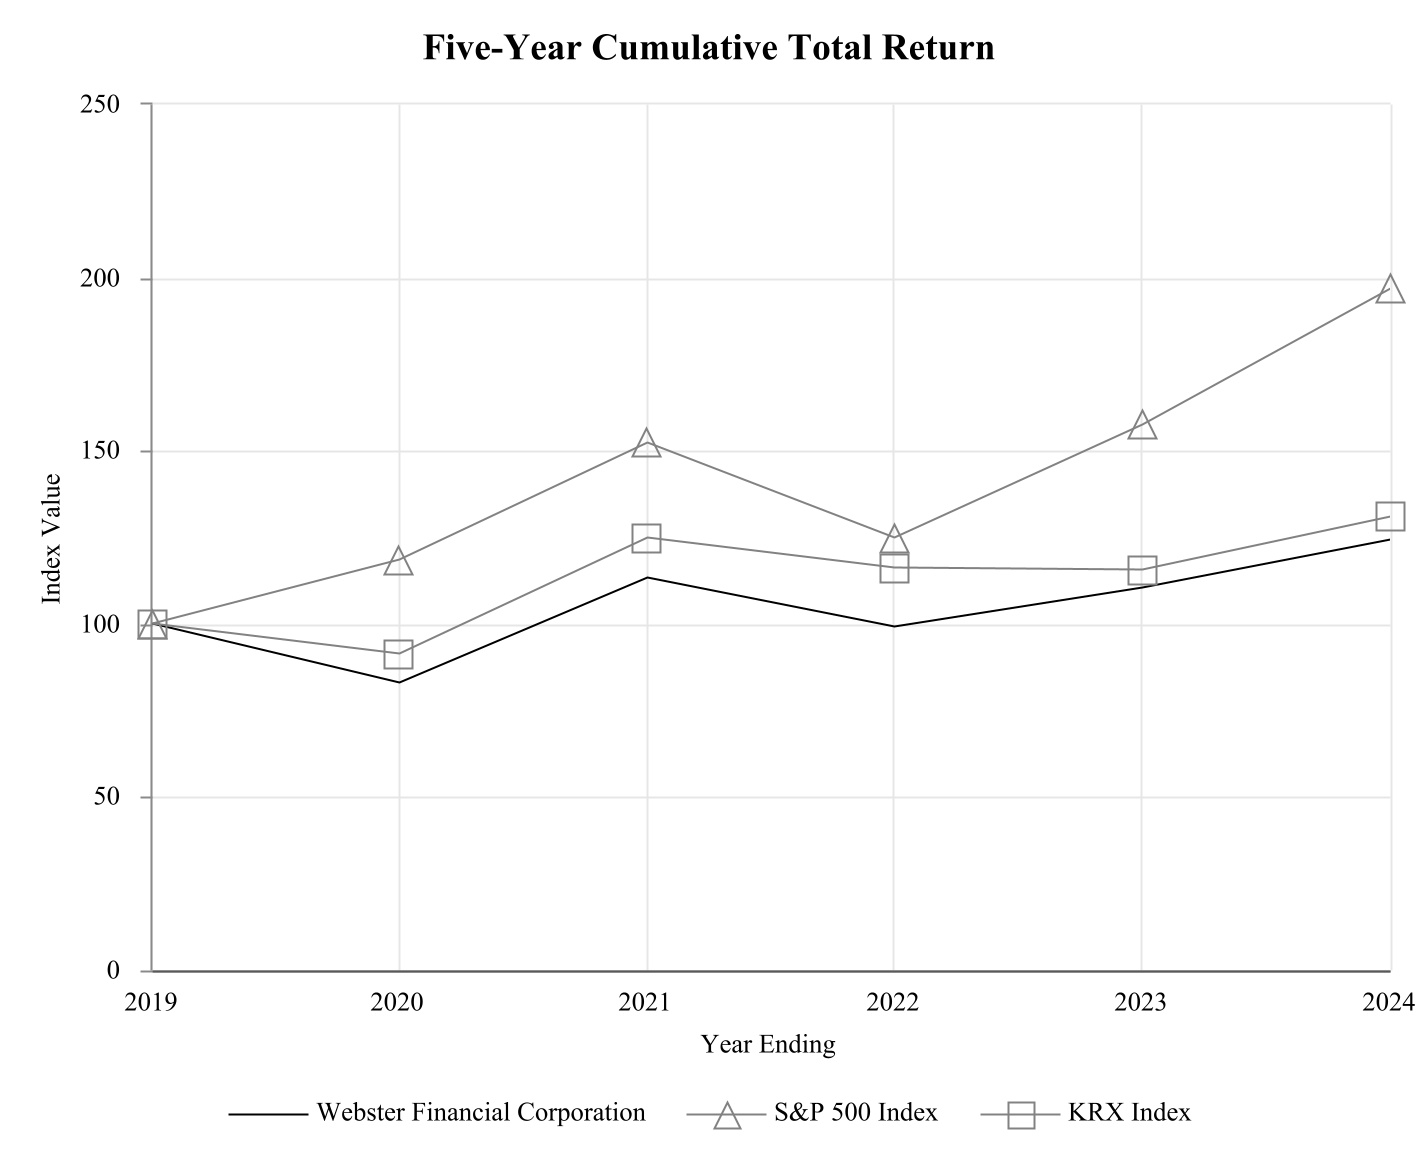
| | | | | | | | | | | | | | | | | | | | |
| Period Ending December 31, |
| 2019 | 2020 | 2021 | 2022 | 2023 | 2024 |
| Webster Financial Corporation | $ | 100 | | $ | 83 | | $ | 113 | | $ | 99 | | $ | 110 | | $ | 124 | |
| KRX Index | $ | 100 | | $ | 91 | | $ | 125 | | $ | 116 | | $ | 116 | | $ | 131 | |
| S&P 500 Index | $ | 100 | | $ | 118 | | $ | 152 | | $ | 125 | | $ | 157 | | $ | 197 | |
ITEM 6. [RESERVED]
ITEM 7. MANAGEMENT’S DISCUSSION AND ANALYSIS OF FINANCIAL CONDITION AND RESULTS OF OPERATIONS
The following discussion and analysis provides information that management believes is necessary to understand the Company’s consolidated financial condition, results of operations, and cash flows for the year ended December 31, 2024, as compared to 2023. This information should be read in conjunction with the Company’s Consolidated Financial Statements, and the accompanying Notes thereto, contained in Part II - Item 8. Financial Statements and Supplementary Data, as well as other information set forth throughout this report. For discussion and analysis of the Company’s 2023 results, as compared to 2022, refer to Part II - Item 7. Management’s Discussion and Analysis of Financial Condition and Results of Operations of the Company’s Annual Report on Form 10-K for the year ended December 31, 2023, which was filed with the SEC on February 27, 2024. The Company’s consolidated financial condition and operating results for the year ended December 31, 2024, are not necessarily indicative of the consolidated financial condition or operating results that may be attained in future periods.
Results of Operations
The following table summarizes selected financial highlights and key performance indicators: | | | | | | | | | | | | | | | | | |
| At or for the years ended December 31, |
| (In thousands, except per share data) | 2024 | | 2023 | | 2022 |
| Income and performance ratios: | | | | | |
| Net income | $ | 768,707 | | | $ | 867,840 | | | $ | 644,283 | |
| Net income available to common stockholders | 752,057 | | | 851,190 | | | 628,364 | |
| Earnings per diluted common share | 4.37 | | | 4.91 | | | 3.72 | |
| Return on average assets | 1.00 | % | | 1.18 | % | | 0.99 | % |
| Return on average tangible common stockholders’ equity (non-GAAP) | 14.35 | | | 16.95 | | | 13.34 | |
| Return on average common stockholders’ equity | 8.71 | | | 10.59 | | | 8.44 | |
| Non-interest income as a percentage of total revenue | 9.72 | | | 11.85 | | | 17.81 | |
| | | | | |
| Asset quality: | | | | | |
| ACL on loans and leases | $ | 689,566 | | | $ | 635,737 | | | $ | 594,741 | |
Non-performing assets (1) | 461,751 | | | 218,600 | | | 206,136 | |
| ACL on loans and leases / total loans and leases | 1.31 | % | | 1.25 | % | | 1.20 | % |
| Net charge-offs / average loans and leases | 0.32 | | | 0.21 | | | 0.15 | |
Non-performing loans and leases / total loans and leases (1) | 0.88 | | | 0.41 | | | 0.41 | |
Non-performing assets / total loans and leases plus OREO and repossessed assets (1) | 0.88 | | | 0.43 | | | 0.41 | |
ACL on loans and leases / non-performing loans and leases (1) | 149.47 | | | 303.39 | | | 291.84 | |
| | | | | |
| Other ratios: | | | | | |
| | | | | |
| Tangible common equity (non-GAAP) | 7.45 | % | | 7.73 | % | | 7.38 | % |
| Tier 1 Risk-Based Capital | 12.06 | | | 11.62 | | | 11.23 | |
| Total Risk-Based Capital | 14.24 | | | 13.72 | | | 13.25 | |
| CET1 Risk-Based Capital | 11.54 | | | 11.11 | | | 10.71 | |
| Stockholders’ equity / total assets | 11.56 | | | 11.60 | | | 11.30 | |
| Net interest margin | 3.42 | | | 3.52 | | | 3.49 | |
| Efficiency ratio (non-GAAP) | 45.43 | | | 42.15 | | | 43.42 | |
| | | | | |
| Equity and share related: | | | | | |
| Common stockholders’ equity | $ | 8,849,235 | | | $ | 8,406,017 | | | $ | 7,772,207 | |
| Book value per common share | 51.63 | | | 48.87 | | | 44.67 | |
| Tangible book value per common share (non-GAAP) | 32.95 | | | 32.39 | | | 29.07 | |
| Common stock closing price | 55.22 | | | 50.76 | | | 47.34 | |
| Dividends and equivalents declared per common share | 1.60 | | | 1.60 | | | 1.60 | |
| Common shares issued and outstanding | 171,391 | | | 172,022 | | | 174,008 | |
| Weighted-average common shares outstanding - basic | 169,820 | | | 171,775 | | | 167,452 | |
| Weighted-average common shares - diluted | 170,192 | | | 171,883 | | | 167,547 | |
(1)Non-performing asset balances and related asset quality ratios exclude the impact of net unamortized (discounts)/premiums and net unamortized deferred (fees)/costs on loans and leases.
Non-GAAP Financial Measures
The non-GAAP financial measures identified in the preceding table provide both management and investors with information useful in understanding the Company’s financial position, results of operations, the strength of its capital position, and overall business performance. These non-GAAP financial measures are used by management for performance measurement purposes, as well as for internal planning and forecasting, and by securities analysts, investors, and other interested parties to assess peer company operating performance. Management believes that this presentation, together with the accompanying reconciliations, provides investors with a more complete understanding of the factors and trends affecting the Company’s business and allows investors to view its performance in a similar manner.
Tangible book value per common share represents stockholders’ equity less preferred stock and goodwill and other intangible assets (tangible common equity) divided by common shares outstanding at the end of the reporting period. The tangible common equity ratio represents tangible common equity divided by total assets less goodwill and other intangible assets (tangible assets). Both of these measures are used by management to evaluate the Company’s capital position. The annualized return on average tangible common stockholders’ equity is calculated using net income available to common stockholders, adjusted for the annualized tax-effected amortization of intangible assets, as a percentage of average tangible common equity. This measure is used by management to assess the Company’s performance against its peer financial institutions. The efficiency ratio, which represents the costs expended to generate a dollar of revenue, is calculated excluding certain non-operational items in order to measure how well the Company is managing its recurring operating expenses.
These non-GAAP financial measures should not be considered a substitute for GAAP basis financial measures. Because
non-GAAP financial measures are not standardized, it may not be possible to compare these with other companies that present financial measures having the same or similar names.
The following tables reconcile non-GAAP financial measures to the most comparable financial measures defined by GAAP:
| | | | | | | | | | | | | | | | | |
| At December 31, |
| (In thousands, except per share data) | 2024 | | 2023 | | 2022 |
| Tangible book value per common share: | | | | | |
| Stockholders’ equity | $ | 9,133,214 | | | $ | 8,689,996 | | | $ | 8,056,186 | |
| Less: Preferred stock | 283,979 | | | 283,979 | | | 283,979 | |
| Goodwill and other intangible assets | 3,202,369 | | | 2,834,600 | | | 2,713,446 | |
| Tangible common stockholders’ equity | $ | 5,646,866 | | | $ | 5,571,417 | | | $ | 5,058,761 | |
| Common shares outstanding | 171,391 | | | 172,022 | | | 174,008 | |
| Tangible book value per common share | $ | 32.95 | | | $ | 32.39 | | | $ | 29.07 | |
| Book value per common share (GAAP) | $ | 51.63 | | | $ | 48.87 | | | $ | 44.67 | |
| | | | | |
| Tangible common equity ratio: | | | | | |
| Tangible common stockholders’ equity | $ | 5,646,866 | | | $ | 5,571,417 | | | $ | 5,058,761 | |
| Total assets | $ | 79,025,073 | | | $ | 74,945,249 | | | $ | 71,277,521 | |
| Less: Goodwill and other intangible assets | 3,202,369 | | | 2,834,600 | | | 2,713,446 | |
| Tangible assets | $ | 75,822,704 | | | $ | 72,110,649 | | | $ | 68,564,075 | |
| Tangible common equity ratio | 7.45 | % | | 7.73 | % | | 7.38 | % |
| Common stockholders’ equity to total assets (GAAP) | 11.20 | % | | 11.22 | % | | 10.90 | % |
| | | | | |
| | | | | | | | | | | | | | | | | |
| For the years ended December 31, |
| (In thousands) | 2024 | | 2023 | | 2022 |
| Return on average tangible common stockholders’ equity: | | | | | |
| Net income | $ | 768,707 | | | $ | 867,840 | | | $ | 644,283 | |
| Less: Preferred stock dividends | 16,650 | | | 16,650 | | | 15,919 | |
| Add: Intangible assets amortization, tax-affected | 28,505 | | | 28,604 | | | 25,233 | |
Net income adjusted for preferred stock dividends and
intangible assets amortization | $ | 780,562 | | | $ | 879,794 | | | $ | 653,597 | |
| Average stockholders’ equity | $ | 8,919,675 | | | $ | 8,323,955 | | | $ | 7,721,488 | |
| Less: Average preferred stock | 283,979 | | | 283,979 | | | 272,179 | |
| Average goodwill and other intangible assets | 3,195,988 | | | 2,848,114 | | | 2,548,254 | |
| Average tangible common stockholders’ equity | $ | 5,439,708 | | | $ | 5,191,862 | | | $ | 4,901,055 | |
| Return on average tangible common stockholders’ equity | 14.35 | % | | 16.95 | % | | 13.34 | % |
| Return on average common stockholders’ equity (GAAP) | 8.71 | % | | 10.59 | % | | 8.44 | % |
| | | | | | | | | | | | | | | | | |
| For the years ended December 31, |
| (In thousands) | 2024 | | 2023 | | 2022 |
| Efficiency ratio: | | | | | |
| Non-interest expense | $ | 1,351,279 | | | $ | 1,416,355 | | | $ | 1,396,473 | |
| Less: Foreclosed property activity | (1,413) | | | (1,282) | | | (906) | |
| Intangible assets amortization | 36,082 | | | 36,207 | | | 31,940 | |
| Operating lease depreciation | 1,541 | | | 5,569 | | | 8,193 | |
Merger-related expenses (1) | 3,139 | | | 162,517 | | | 246,461 | |
| Common stock contribution to charitable foundation | — | | | — | | | 10,500 | |
| FDIC special assessment | 10,318 | | | 47,164 | | | — | |
Strategic restructuring costs and other (2) | 22,169 | | | — | | | (3,032) | |
| Adjusted non-interest expense | $ | 1,279,443 | | | $ | 1,166,180 | | | $ | 1,103,317 | |
| Net interest income | $ | 2,338,387 | | | $ | 2,337,269 | | | $ | 2,034,286 | |
| Add: FTE adjustment | 57,517 | | | 68,939 | | | 47,128 | |
| Non-interest income | 251,899 | | | 314,337 | | | 440,783 | |
Other income (3) | 29,440 | | | 18,059 | | | 22,887 | |
| Less: Operating lease depreciation | 1,541 | | | 5,569 | | | 8,193 | |
| (Loss) on sale of investment securities, net | (136,224) | | | (33,620) | | | (6,751) | |
| Gain on extinguishment of borrowings | — | | | — | | | 2,548 | |
| Net (loss) on sale of factored receivables portfolio | (15,977) | | | — | | | — | |
| Net gain on sale of mortgage servicing rights | 11,655 | | | — | | | — | |
| Adjusted income | $ | 2,816,248 | | | $ | 2,766,655 | | | $ | 2,541,094 | |
| Efficiency ratio | 45.43 | % | | 42.15 | % | | 43.42 | % |
| Non-interest expense as a percentage of total revenue (GAAP) | 52.17 | % | | 53.41 | % | | 56.42 | % |
(1)Merger-related expenses included Ametros acquisition expenses for the year ended December 31, 2024, and primarily Sterling merger expenses for the years ended December 31, 2023, and 2022. Additional information regarding the acquisition of Ametros can be found within Note 2: Acquisitions and Joint Ventures in the Notes to Consolidated Financial Statements contained in Part II - Item 8. Financial Statements and Supplementary Data.
(2)Strategic restructuring costs and other primarily included severance, technology contract termination costs, and the partial impairment of the payroll finance customer relationship intangible asset for the year ended December 31, 2024. For the year ended December 31, 2022, the charge primarily reflects modifications to the Company’s strategic initiatives that were announced in 2020 as a result of the Company re-evaluating its strategic priorities as a combined organization in connection with the Sterling merger.
(3)Other income (non-GAAP) reflects a tax-equivalent adjustment on income generated from low income housing tax-credit investments.
Net Interest Income
Net interest income is the Company’s primary source of revenue, representing 90.3%, and 88.1% of total revenues for the years ended December 31, 2024, and 2023, respectively. Net interest income is the difference between interest income on
interest-earning assets (i.e., loans and leases and investment securities) and interest expense on interest-bearing liabilities
(i.e., deposits and borrowings), which are used to fund interest-earning assets and other activities. Net interest margin is calculated as the ratio of FTE net interest income to average interest-earning assets.
Net interest income, net interest margin, average yields, and ratios on an FTE basis are considered non-GAAP financial measures, and are used by management to evaluate the comparability of the Company’s revenue arising from both taxable and non-taxable sources. FTE adjustments are determined assuming a statutory federal income tax rate of 21%.
Net interest income and net interest margin are influenced by the volume and mix of interest-earning assets and interest-bearing liabilities, changes in interest rate levels, re-pricing frequencies, contractual maturities, prepayment behavior, and the use of interest rate derivative financial instruments. These factors are affected by changes in economic conditions which impacts monetary policies, competition for loans and deposits, as well as the extent of interest lost on non-performing assets.
Net interest income remained relatively flat at $2.3 billion for the years ended December 31, 2024, and 2023. On an FTE basis, net interest income also remained relatively flat. Net interest margin decreased 10 basis points from 3.52% for the year ended December 31, 2023, to 3.42% for the year ended December 31, 2024.
Average total interest-earning assets increased $1.9 billion, or 2.8%, from $68.3 billion for the year ended December 31, 2023, to $70.2 billion for the year ended December 31, 2024, and the average yield on average total interest-earning assets increased 26 basis points from 5.42% for the year ended December 31, 2023, to 5.68% for the year ended December 31, 2024. The change in the average balance and the average yield for total interest-earning assets was primarily due to the following:
Average total investment securities increased $1.8 billion, or 11.1%, from $15.6 billion for the year ended December 31, 2023, to $17.4 billion for the year ended December 31, 2024, primarily due to a higher volume of purchases, partially offset by paydown activities and sales of available-for-sale securities. At December 31, 2024, and 2023, average total investment securities comprised 24.7% and 22.9% of average total interest-earning assets, respectively. The average yield on average total investment securities increased 92 basis points from 3.06% for the year ended December 31, 2023, to 3.98% for the year ended December 31, 2024, primarily due to the reinvestment of proceeds received from sales and maturities of lower yielding securities for securities at higher yields.
Average loans and leases increased $1.0 billion, or 1.9%, from $50.6 billion for the year ended December 31, 2023, to $51.6 billion for the year ended December 31, 2024, primarily due to growth in commercial real estate, commercial non-mortgage, and residential mortgages, partially offset by the run-off of warehouse lending and the transfer of the payroll finance and factored receivables loan portfolios to held for sale in March 2024. At December 31, 2024, and 2023, average loans and leases comprised 73.6% and 74.2% of average total interest-earning assets, respectively. The average yield on average loans and leases increased 10 basis points from 6.15% for the year ended December 31, 2023, to 6.25% for the year ended December 31, 2024, primarily due to higher market rates, partially offset by lower purchase accounting accretion on loans acquired in the Sterling merger.
Average loans held for sale increased $115.1 million, or 400.9%, from $28.7 million for the year ended December 31, 2023, to $143.8 million for the year ended December 31, 2024, primarily due to the payroll finance and factored receivables loan portfolios, which were transferred to held for sale in March 2024. The factored receivables loan portfolio was sold in September 2024, and the payroll finance loan portfolio was transferred back to held for investment in December 2024. At December 31, 2024, and 2023, average loans held for sale comprised 0.2% and a negligible percent of average total interest-earning assets, respectively. The average yield on average loans held for sale increased 711 basis points from 2.56% for the year ended December 31, 2023, to 9.67% for the year ended December 31, 2024, primarily due to higher yields on the payroll finance and factored receivables loan portfolios.
Average interest-bearing deposits decreased $0.9 billion, or 53.7%, from $1.6 billion for the year ended December 31, 2023, to $0.7 billion for the year ended December 31, 2024, which was a direct result of the Company’s risk management approach to hold higher levels of on-balance sheet liquidity in 2023. At December 31, 2024, and 2023, average interest-bearing deposits comprised 1.0% and 2.3% of average total interest-earning assets, respectively. The average yield on average interest-bearing deposits increased 2 basis points from 5.14% for the year ended December 31, 2023, to 5.16% for the year ended December 31, 2024, primarily due to the net impact from changes in market rates throughout 2024.
Average total interest-bearing liabilities increased $1.9 billion, or 3.0%, from $63.9 billion for the year ended December 31, 2023, to $65.8 billion for the year ended December 31, 2024, and the average rate on average total interest-bearing liabilities increased 39 basis points from 2.02% for the year ended December 31, 2023, to 2.41% for the year ended December 31, 2024. The change in the average balance and the average rate for total interest-bearing liabilities was primarily due to the following:
Average total deposits increased $4.2 billion, or 7.2%, from $58.2 billion for the year ended December 31, 2023, to $62.4 billion for the year ended December 31, 2024, reflecting an increase of $5.4 billion in interest-bearing deposits, partially offset by a decrease of $1.2 billion in non-interest-bearing deposits. The increase in average total deposits was primarily due to growth in interLINK, money markets, and certificates of deposit, the acquisition of Ametros, and higher average HSA balances, partially offset by lower average balances in non-interest-bearing demand, savings, and brokered certificates of deposit. At December 31, 2024, and 2023, average total deposits comprised 94.8% and 91.1% of average total interest-bearing liabilities, respectively. The average rate on average total deposits increased 54 basis points from 1.75% for the year ended December 31, 2023, to 2.29% for the year ended December 31, 2024, primarily due to higher market rates and growth in higher costing deposit products, such as money markets and certificates of deposit. Average higher costing time deposits as a percentage of average total interest-bearing deposits moderately increased from 14.0% for the year ended December 31, 2023, to 14.6% for the year ended December 31, 2024, primarily due to the shift in customer preferences from non-interest-bearing demand and savings to higher rate certificates of deposit, partially offset by the impact from growth in other deposit products.
Average FHLB advances decreased $2.0 billion, or 46.3%, from $4.3 billion for the year ended December 31, 2023, to $2.3 billion for the year ended December 31, 2024, primarily due to the paydown of short-term advances and a change in short-term borrowings mix. At December 31, 2024, and 2023, average FHLB advances comprised 3.5% and 6.7% of total average interest-bearing liabilities, respectively. The average rate on average FHLB advances increased 25 basis points from 5.21% for the year ended December 31, 2023, to 5.46% for the year ended December 31, 2024, primarily due to the refinancing of maturities at higher market rates.
Average long-term debt decreased $0.1 billion, or 12.1%, from $1.0 billion for the year ended December 31, 2023, to $0.9 billion for the year ended December 31, 2024, primarily due the maturity of its 4.375% senior notes in February 2024. At December 31, 2024, and 2023, average long-term debt comprised 1.4% and 1.6% of average total interest-bearing liabilities, respectively. The average rate on average long-term debt decreased 12 basis points from 3.69% for the year ended December 31, 2023, to 3.57% for the year ended December 31, 2024, also primarily due to the maturity of its 4.375% senior notes in February 2024.
Average federal funds purchased decreased $113.2 million, or 67.6%, from $167.5 million for the year ended December 31, 2023, to $54.3 million for the year ended December 31, 2024, primarily due to the paydown of overnight funding and change in short-term borrowings mix. At December 31, 2024, and 2023, average federal funds purchased comprised 0.1% and 0.3% of average total interest-bearing liabilities, respectively. The average rate on average federal funds purchased increased 85 basis points from 4.70% for the year ended December 31, 2023, to 5.55% for the year ended December 31, 2024, primarily due to increases in market rates.
The following table summarizes daily average balances, interest, and average yield/rate by major category, and net interest margin on an FTE basis: | | | | | | | | | | | | | | | | | | | | | | | | | | | | | | | | | | | |
| | Years ended December 31, |
| | 2024 | | 2023 | | 2022 |
| (In thousands) | Average
Balance | Interest Income/Expense | Average
Yield/Rate | | Average
Balance | Interest Income/Expense | Average
Yield/Rate | | Average
Balance | Interest Income/Expense | Average
Yield/Rate |
| Assets: | | | | | | | | | | | |
| Interest-earning assets: | | | | | | | | | | | |
Loans and leases (1) | $ | 51,597,443 | | $ | 3,224,653 | | 6.25 | % | | $ | 50,637,569 | | $ | 3,113,709 | | 6.15 | % | | $ | 43,751,112 | | $ | 1,967,761 | | 4.50 | % |
Investment securities: (2) | | | | | | | | | | | |
| Taxable | 15,823,052 | | 651,507 | | 4.12 | | | 13,057,669 | | 423,289 | | 3.22 | | | 12,424,967 | | 295,158 | | 2.36 | |
| Non-taxable | 1,533,701 | | 38,758 | | 2.53 | | | 2,569,015 | | 54,207 | | 2.18 | | | 2,540,540 | | 50,442 | | 2.05 | |
| Total investment securities | 17,356,753 | | 690,265 | | 3.98 | | | 15,626,684 | | 477,496 | | 3.06 | | | 14,965,507 | | 345,600 | | 2.31 | |
| FHLB and FRB stock | 330,418 | | 18,633 | | 5.64 | | | 408,673 | | 24,785 | | 6.06 | | | 289,595 | | 8,775 | | 3.03 | |
Interest-bearing deposits (3) | 723,688 | | 37,341 | | 5.16 | | | 1,564,255 | | 80,475 | | 5.14 | | | 596,912 | | 9,651 | | 1.62 | |
| Loans held for sale | 143,812 | | 13,911 | | 9.67 | | | 28,710 | | 734 | | 2.56 | | | 9,842 | | 78 | | 0.80 | |
| Total interest-earning assets | 70,152,114 | | $ | 3,984,803 | | 5.68 | % | | 68,265,891 | | $ | 3,697,199 | | 5.42 | % | | 59,612,968 | | $ | 2,331,865 | | 3.91 | % |
| | | | | | | | | | | |
Non-interest-earning assets (2) | 6,461,020 | | | | | 5,557,991 | | | | | 5,149,240 | | | |
| Total assets | $ | 76,613,134 | | | | | $ | 73,823,882 | | | | | $ | 64,762,208 | | | |
| Liabilities and Stockholders’ Equity: | | | | | | | | | | | |
| Interest-bearing liabilities: | | | | | | | | | | | |
| Demand deposits | $ | 10,387,807 | | $ | — | | — | % | | $ | 11,596,949 | | $ | — | | — | % | | $ | 12,912,894 | | $ | — | | — | % |
| Health savings accounts | 8,650,485 | | 13,139 | | 0.15 | | | 8,249,332 | | 12,366 | | 0.15 | | | 7,826,576 | | 6,315 | | 0.08 | |
Interest-bearing checking,
money market, and savings | 35,789,961 | | 1,070,949 | | 2.99 | | | 31,874,457 | | 756,521 | | 2.37 | | | 28,266,128 | | 115,271 | | 0.41 | |
| Time deposits | 7,597,612 | | 343,116 | | 4.52 | | | 6,531,610 | | 252,531 | | 3.87 | | | 2,838,502 | | 16,966 | | 0.60 | |
| Total deposits | 62,425,865 | | 1,427,204 | | 2.29 | | | 58,252,348 | | 1,021,418 | | 1.75 | | | 51,844,100 | | 138,552 | | 0.27 | |
| | | | | | | | | | | |
Securities sold under agreements
to repurchase | 142,025 | | 1,098 | | 0.77 | | | 210,676 | | 1,231 | | 0.58 | | | 466,282 | | 3,614 | | 0.78 | |
| Federal funds purchased | 54,303 | | 3,015 | | 5.55 | | | 167,495 | | 7,871 | | 4.70 | | | 598,269 | | 15,444 | | 2.58 | |
| Other borrowings | — | | — | | — | | | — | | — | | — | | | — | | 1 | | — | |
| FHLB advances | 2,296,048 | | 125,329 | | 5.46 | | | 4,275,394 | | 222,537 | | 5.21 | | | 1,965,577 | | 58,557 | | 2.98 | |
Long-term debt (2) | 903,603 | | 32,253 | | 3.57 | | | 1,027,869 | | 37,934 | | 3.69 | | | 995,341 | | 34,283 | | 3.44 | |
| | | | | | | | | | | |
| Total interest-bearing liabilities | 65,821,844 | | $ | 1,588,899 | | 2.41 | % | | 63,933,782 | | $ | 1,290,991 | | 2.02 | % | | 55,869,569 | | $ | 250,451 | | 0.45 | % |
Non-interest-bearing liabilities (2) | 1,871,615 | | | | | 1,566,145 | | | | | 1,171,151 | | | |
| Total liabilities | 67,693,459 | | | | | 65,499,927 | | | | | 57,040,720 | | | |
| | | | | | | | | | | |
| Preferred stock | 283,979 | | | | | 283,979 | | | | | 272,179 | | | |
| Common stockholders’ equity | 8,635,696 | | | | | 8,039,976 | | | | | 7,449,309 | | | |
| Total stockholders’ equity | 8,919,675 | | | | | 8,323,955 | | | | | 7,721,488 | | | |
| Total liabilities and stockholders' equity | $ | 76,613,134 | | | | | $ | 73,823,882 | | | | | $ | 64,762,208 | | | |
| | | | | | | | | | | |
| Net interest income (FTE) | | 2,395,904 | | | | | 2,406,208 | | | | | 2,081,414 | | |
| | | | | | | | | | | |
| Less: FTE adjustment | | (57,517) | | | | | (68,939) | | | | | (47,128) | | |
| Net interest income | | $ | 2,338,387 | | | | | $ | 2,337,269 | | | | | $ | 2,034,286 | | |
| Net interest margin (FTE) | | | 3.42 | % | | | | 3.52 | % | | | | 3.49 | % |
(1)Non-accrual loans have been included in the computation of average balances.
(2)In order to provide the users of the Company’s financial statements with a more transparent view of the actual consolidated average balances that are used in the calculation of net interest margin, the Company has recast, in the above table, certain consolidated average balances for the years ended December 31, 2023, and 2022, to reflect a change in presentation being applied retrospectively. Specifically, adjustments were made to exclude average unsettled trades of $108.9 million and $70.9 million, respectively, and average available-for-sale unrealized losses of $895.8 million and $507.7 million, respectively, from investment securities, and to exclude an average basis adjustment of $30.8 million and $36.1 million, respectively, from long-term debt related to a de-designated fair value hedge. Rather, effective as of December 31, 2024, these average balances are being presented in average non-interest-earning assets and average non-interest-bearing liabilities, respectively. There was no change to the related yields/rates, net interest income, or net interest margin that had been previously disclosed.
(3)Interest-bearing deposits are a component of cash and cash equivalents on the Consolidated Statements of Cash Flows included in Part II - Item 8. Financial Statements and Supplementary Data.
The following table summarizes the change in net interest income attributable to changes in rate and volume, and reflects net interest income on an FTE basis: | | | | | | | | | | | | | | | | | | | | | | | |
| Years ended December 31, |
| 2024 vs. 2023 Increase (decrease) due to | | 2023 vs. 2022 Increase (decrease) due to |
| (In thousands) | Rate (1) | Volume | Total | | Rate (1) | Volume | Total |
| Change in interest on interest-earning assets: | | | | | | | |
| Loans and leases | $ | 78,816 | $ | 32,128 | $ | 110,944 | | $ | 833,430 | $ | 312,518 | $ | 1,145,948 |
Investment securities (2) | 160,500 | 52,269 | 212,769 | | 116,541 | 15,355 | 131,896 |
| FHLB and FRB stock | (1,406) | (4,746) | (6,152) | | 12,402 | 3,608 | 16,010 |
| Interest-bearing deposits | 110 | (43,244) | (43,134) | | 55,184 | 15,640 | 70,824 |
| Loans held for sale | 13,743 | (566) | 13,177 | | 364 | 292 | 656 |
| Total interest income | $ | 251,763 | $ | 35,841 | $ | 287,604 | | $ | 1,017,921 | $ | 347,413 | $ | 1,365,334 |
| Change in interest on interest-bearing liabilities: | | | | | | | |
| | | | | | | |
| Health savings accounts | $ | 172 | $ | 601 | $ | 773 | | $ | 5,710 | $ | 341 | $ | 6,051 |
| Interest-bearing checking, money market, and savings | 177,558 | 136,870 | 314,428 | | 596,023 | 45,227 | 641,250 |
| Time deposits | 60,165 | 30,420 | 90,585 | | 178,262 | 57,303 | 235,565 |
| Securities sold under agreements to repurchase | 268 | (401) | (133) | | (402) | (1,981) | (2,383) |
| Federal funds purchased | 463 | (5,319) | (4,856) | | 3,547 | (11,120) | (7,573) |
| Other borrowings | — | — | — | | (1) | — | (1) |
| FHLB advances | 5,818 | (103,026) | (97,208) | | 95,168 | 68,812 | 163,980 |
Long-term debt (2) | (1,095) | (4,586) | (5,681) | | 2,531 | 1,120 | 3,651 |
| Total interest expense | $ | 243,349 | $ | 54,559 | $ | 297,908 | | $ | 880,838 | $ | 159,702 | $ | 1,040,540 |
| Net change in net interest income | $ | 8,414 | $ | (18,718) | $ | (10,304) | | $ | 137,083 | $ | 187,711 | $ | 324,794 |
(1)The change attributable to mix, a combined impact of rate and volume, is included with the change due to rate.
(2)The increase due to rate and volume for 2023 vs. 2022 for investment securities and long-term debt were recast in connection with the change in presentation of certain consolidated average balances effective in 2024, as discussed on the previous page.
Provision for Credit Losses
The provision for credit losses was $222.0 million and $150.7 million for the year ended December 31, 2024, and 2023, respectively. The balance for the year ended December 31, 2023, included a discrete merger-related charge of $6.8 million, which increased the provision for unfunded loan commitments. Excluding this charge, the provision for credit losses increased $78.1 million, primarily due to the impact of the current macroeconomic environment on credit performance, risk rating migration, loan portfolio mix, and organic loan growth.
Additional information regarding the Company’s provision for credit losses and ACL can be found under the sections captioned “Loans and Leases” through “Allowance for Credit Losses on Loans and Leases” contained elsewhere in this Item 7. Management's Discussion and Analysis of Financial Condition and Results of Operations.
Non-Interest Income | | | | | | | | | | | | | | | | | |
| | Years ended December 31, |
| (In thousands) | 2024 | | 2023 | | 2022 |
| Deposit service fees | $ | 161,144 | | | $ | 169,318 | | | $ | 198,472 | |
| Loan and lease related fees | 76,384 | | | 84,861 | | | 102,987 | |
| Wealth and investment services | 33,234 | | | 28,999 | | | 40,277 | |
| | | | | |
| Cash surrender value of life insurance policies | 27,712 | | | 26,228 | | | 29,237 | |
| (Loss) on sale of investment securities, net | (136,224) | | | (33,620) | | | (6,751) | |
| | | | | |
| Other income | 89,649 | | | 38,551 | | | 76,561 | |
| Total non-interest income | $ | 251,899 | | | $ | 314,337 | | | $ | 440,783 | |
Total non-interest income decreased $62.4 million, or 19.9%, from $314.3 million for the year ended December 31, 2023, to $251.9 million for the year ended December 31, 2024, primarily due to Net losses on sale of investment securities and decreases in Deposit service fees and Loan and lease related fees, partially offset by an increase in Other income.
Deposit service fees decreased $8.2 million, or 4.8%, from $169.3 million for the year ended December 31, 2023, to
$161.1 million for the year ended December 31, 2024, primarily due to a decrease in overdraft and account service fees, partially offset by an increase in cash management fees.
Loan and lease related fees decreased $8.5 million, or 10.0%, from $84.9 million for the year ended December 31, 2023, to $76.4 million for the year ended December 31, 2024, primarily due to a decrease in loan servicing fees, partially offset by increases in amendment and letter of credit fees, and lower mortgage servicing rights amortization.
Net losses on sale of investment securities increased $102.6 million, or 305.2%, from $33.6 million for the year ended December 31, 2023, to $136.2 million for the year ended December 31, 2024. During the year ended December 31, 2024, the Company sold $2.3 billion of Municipal bonds and notes, Agency MBS, Corporate debt securities, Agency CMBS, Government agency debentures, and Agency CMOs classified as available-for-sale for proceeds of $2.1 billion. During the year ended December 31, 2023, the Company sold $827.0 million of Municipal bonds and notes, U.S. Treasury notes, and Corporate debt securities classified as available-for-sale for proceeds of $789.6 million. The amounts included in non-interest income reflect the portion of the losses that were not due to credit related factors.
Other income increased $51.1 million, or 132.5%, from $38.5 million for the year ended December 31, 2023, to $89.6 million for the year ended December 31, 2024, primarily due to $23.0 million of incremental fee income related to the acquired Ametros business, a $11.7 million net gain on sale of mortgage servicing rights, a $4.4 million net gain on sale of multi-family loans (securitization), proceeds from bank-owned life insurance policies, direct investment gains, and customer derivative activities, partially offset by a $16.0 million net loss on sale of the factored receivables portfolio.
Non-Interest Expense | | | | | | | | | | | | | | | | | |
| | Years ended December 31, |
| (In thousands) | 2024 | | 2023 | | 2022 |
| Compensation and benefits | $ | 762,794 | | | $ | 711,752 | | | $ | 723,620 | |
| Occupancy | 72,161 | | | 77,520 | | | 113,899 | |
| Technology and equipment | 195,017 | | | 197,928 | | | 186,384 | |
| Intangible assets amortization | 36,082 | | | 36,207 | | | 31,940 | |
| Marketing | 18,751 | | | 18,622 | | | 16,438 | |
| Professional and outside services | 58,253 | | | 107,497 | | | 117,530 | |
| Deposit insurance | 68,912 | | | 98,081 | | | 26,574 | |
| Other expense | 139,309 | | | 168,748 | | | 180,088 | |
| Total non-interest expense | $ | 1,351,279 | | | $ | 1,416,355 | | | $ | 1,396,473 | |
Total non-interest expense slightly decreased by 4.5% from the year ended December 31, 2023, to the year ended December 31, 2024. Although the financial statement caption as a whole did not change significantly, notable fluctuations were experienced in Compensation and benefits, Occupancy, Professional and outside services, Deposit insurance, and Other expense.
Compensation and benefits increased $51.1 million, or 7.2%, from $711.7 million for the year ended December 31, 2023, to $762.8 million for the year ended December 31, 2024, primarily due to higher compensation, performance-based incentives, and employee benefits, and the impact from the employees acquired in the Ametros acquisition.
Occupancy decreased $5.3 million, or 6.9%, from $77.5 million for the year ended December 31, 2023, to $72.2 million for the year ended December 31, 2024, primarily due a $3.4 million net gain recognized on an early lease termination and lower rent and related property tax expense.
Professional and outside services decreased $49.2 million, or 45.8%, from $107.5 million for the year ended December 31, 2023, to $58.3 million for the year ended December 31, 2024, primarily due to a decrease in technology consulting fees, which were higher in 2023 as a result of the core conversion of the legacy Webster and legacy Sterling platforms.
Deposit insurance decreased $29.2 million, or 29.7%, from $98.1 million for the year ended December 31, 2023, to
$68.9 million for the year ended December 31, 2024, primarily due to the impact of the FDIC special assessment, partially offset by the impact resulting from an increase in the Company’s deposit insurance assessment base.
Other expense decreased $29.4 million, or 17.4%, from $168.7 million for the year ended December 31, 2023, to $139.3 million for the year ended December 31, 2024, primarily due to decreases in contract termination costs, other miscellaneous expenses, check card expense, and operating lease depreciation, partially offset by an increase in franchise taxes, loan workout expense, and a $1.9 million impairment loss on the payroll finance customer relationship intangible asset.
Income Taxes
The Company recognized income tax expense of $248.3 million and $216.7 million for the years ended December 31, 2024, and 2023, respectively, reflecting effective tax rates of 24.4% and 20.0%, respectively.
During the fourth quarter of 2024, the Company recognized a DTA valuation adjustment of $29.4 million resulting from a change in management’s estimate about the realizability of its SALT DTAs applicable to net operating loss carryforwards due to an estimated decrease in future taxable income for SALT purposes. Both the $31.6 million increase in income tax expense and the 4.4% point increase in the effective tax rate, from December 31, 2023, to December 31, 2024, primarily reflect the recognition of the $29.4 million DTA valuation adjustment, and the recognition of $10.9 million of discrete tax expense during the first quarter of 2024, which related to items recognized in prior years. The impact from these effects was partially offset by the lower level of pre-tax income in 2024 as compared to 2023.
At December 31, 2024, and 2023, the Company’s valuation allowance on its DTAs was $64.4 million and $28.7 million, respectively, of which $62.7 million and $28.7 million, respectively, were related to the portion of SALT net operating loss and credit carryforwards that, in management’s judgment, are not more likely than not to be realized. The $62.7 million at December 31, 2024, primarily reflects the $29.4 million DTA valuation adjustment recognized during the fourth quarter of 2024, and $3.1 million related to the Ametros acquisition. At December 31, 2024, and 2023, the Company’s gross DTAs included $67.7 million and $64.2 million, respectively, applicable to SALT net operating loss and credit carryforwards that are available to offset future taxable income.
The ultimate realization of DTAs is dependent on the generation of future taxable income during the periods in which the net operating loss and credit carryforwards are available. In making its assessment, management considers the Company’s forecasted future results of operations, estimates the content and apportionment of its income by legal entity over the near term for SALT purposes, and also applies longer-term growth rate assumptions. Based on its estimates, management believes it is more likely than not that the Company will realize its DTAs, net of the valuation allowance, at December 31, 2024. However, it is possible that some or all of the Company’s net operating loss and credit carryforwards could expire unused, or that more net operating loss and credit carryforwards could be utilized than estimated, either as a result of changes in future forecasted levels of taxable income or if future economic or market conditions or interest rates were to vary significantly from the Company's forecasts and, in turn, impact its future results of operations.
Additional information regarding the Company’s income taxes, including DTAs, can be found within Note 9: Income Taxes in the Notes to Consolidated Financial Statements contained in Part II - Item 8. Financial Statements and Supplementary Data.
Segment Reporting
The Company’s operations are organized into three reportable segments that represent its differentiated lines of business: Commercial Banking, Healthcare Financial Services, and Consumer Banking. The Company’s CODM uses PPNR to allocate resources and assess the performance of each segment. Certain Treasury activities and other functional divisions, such as information technology, human resources, risk management, bank operations, and the operations of interLINK, as well as amounts required to reconcile non-GAAP profitability metrics to those reported in accordance with GAAP, are included in the Corporate and Reconciling category. Additional information regarding the Company’s reportable segments and its segment reporting methodology can be found within Note 21: Segment Reporting in the Notes to Consolidated Financial Statements contained in Part II - Item 8. Financial Statements and Supplementary Data.
Effective January 1, 2024, the Company realigned certain of its Business Banking operations to better serve its customers and deliver operational efficiencies. Under this realignment, $1.5 billion of loans and $2.2 billion of deposits were reassigned, and $77.2 million of goodwill was reallocated on a relative fair value basis, from Commercial Banking to Consumer Banking. There was no goodwill impairment as a result of this realignment. Prior period amounts have been recast accordingly.
With the acquisition of Ametros on January 24, 2024, the Company formed the Healthcare Financial Services reportable segment, which includes the aggregated financial information of the HSA Bank and Ametros operating segments. The financial information presented within Healthcare Financial Services for the years ended December 31, 2023, and 2022, reflects that only of the HSA Bank operating segment.
Commercial Banking
Operating Results: | | | | | | | | | | | | | | | | | |
| Years ended December 31, |
| (In thousands) | 2024 | | 2023 | | 2022 |
| Net interest income | $ | 1,348,346 | | | $ | 1,436,616 | | | $ | 1,252,306 | |
| Non-interest income | 143,104 | | | 125,265 | | | 164,044 | |
| Non-interest expense | 418,467 | | | 394,942 | | | 362,843 | |
| Pre-tax, pre-provision net revenue | $ | 1,072,983 | | | $ | 1,166,939 | | | $ | 1,053,507 | |
Commercial Banking’s PPNR decreased $94.0 million, or 8.1%, for the year ended December 31, 2024, as compared to the year ended December 31, 2023, due to a decrease in net interest income and an increase in non-interest expense, partially offset by an increase in non-interest income. The $88.3 million decrease in net interest income is primarily due to higher deposit costs and a decrease in loan interest rate spread, partially offset by higher average loan and deposit balances. The $17.8 million increase in non-interest income is primarily due to direct investment activities, higher cash management fees, and a $4.4 million net gain on sale of multi-family loans (securitization), partially offset by lower loan servicing fees. The $23.5 million increase in non-interest expense is primarily due to higher compensation and benefits costs, and increases in technology and operational support costs.
Selected Balance Sheet and Off-Balance Sheet Information: | | | | | | | | | | | |
| At December 31, |
| (In thousands) | 2024 | | 2023 |
| Loans and leases | $ | 40,616,156 | | | $ | 39,480,945 | |
| Deposits | 16,251,850 | | | 16,053,850 | |
| Assets under administration / management (off-balance sheet) | 2,965,624 | | | 2,911,293 | |
Loans and leases increased $1.1 billion, or 2.9%, at December 31, 2024, as compared to at December 31, 2023, primarily due to organic growth in commercial non-mortgage and commercial real estate, partially offset by net principal paydowns in asset-based lending and equipment finance loans and leases. Total portfolio originations for the years ended December 31, 2024, and 2023, were $9.7 billion and $9.0 billion, respectively. The $0.7 billion increase was primarily due to increases in commercial non-mortgage and equipment finance originations, partially offset by a decrease in commercial real estate originations.
Deposits increased $198.0 million, or 1.2%, at December 31, 2024, as compared to at December 31, 2023, primarily due to higher account balances in money market and savings, partially offset by lower account balances in non-interest-bearing demand and checking.
Assets under administration and assets under management, in aggregate, increased $54.3 million, or 1.9%, at December 31, 2024, as compared to December 31, 2023, primarily due to an increase in investment account balances as a result of higher valuations in the equity markets, partially offset by net outflows during the year.
Healthcare Financial Services
Operating Results: | | | | | | | | | | | | | | | | | |
| Years ended December 31, |
| (In thousands) | 2024 | | 2023 | | 2022 |
| Net interest income | $ | 366,927 | | | $ | 302,856 | | | $ | 218,149 | |
| Non-interest income | 110,207 | | | 88,113 | | | 104,586 | |
| Non-interest expense | 214,089 | | | 168,160 | | | 151,329 | |
| Pre-tax, pre-provision, net revenue | $ | 263,045 | | | $ | 222,809 | | | $ | 171,406 | |
Healthcare Financial Services’ PPNR increased $40.2 million, or 18.1%, for the year ended December 31, 2024, as compared to the year ended December 31, 2023, due to increases in net interest income and non-interest income, partially offset by an increase in non-interest expense. The $64.0 million increase in net interest income is primarily due to the acquisition of Ametros, and increase in HSA net deposit spread, and HSA deposit growth. The $22.1 million increase in non-interest income is primarily due to incremental fee income related to the acquired Ametros business and higher interchange fee activity in 2024, partially offset by a decrease in customer account and other fees. The $45.9 million increase in non-interest expense is primarily due to incremental expenses related to the acquired Ametros business, higher employee compensation and benefits costs, and an increase in service contract expenses related to account growth, partially offset by a decrease in occupancy expenses.
Selected Balance Sheet and Off-Balance Sheet Information: | | | | | | | | | | | |
| At December 31, |
| (In thousands) | 2024 | | 2023 |
| Deposits | $ | 9,966,773 | | | $ | 8,287,705 | |
| Assets under administration, through linked investment accounts (off-balance sheet) | 5,321,736 | | | 4,641,830 | |
Deposits increased $1.7 billion, or 20.3%, at December 31, 2024, as compared to at December 31, 2023, primarily due to the acquisition of Ametros, additional HSA account holders, HSA deposit growth, and a discrete transfer of cash associated with accounts that were previously held by former investment partners.
Assets under administration, through linked investment accounts, increased $679.9 million, or 14.6%, at December 31, 2024, as compared to at December 31, 2023, primarily due to additional HSA account holders and an increase in investment account balances as a result of higher valuations in the equity markets.
Consumer Banking
Operating Results: | | | | | | | | | | | | | | | | | |
| Years ended December 31, |
| (In thousands) | 2024 | | 2023 | | 2022 |
| Net interest income | $ | 812,743 | | | $ | 898,898 | | | $ | 814,867 | |
| Non-interest income | 113,638 | | | 114,851 | | | 127,084 | |
| Non-interest expense | 471,402 | | | 469,629 | | | 461,390 | |
| Pre-tax, pre-provision net revenue | $ | 454,979 | | | $ | 544,120 | | | $ | 480,561 | |
Consumer Banking’s PPNR decreased $89.1 million, or 16.4%, for the year ended December 31, 2024, as compared to the year ended December 31, 2023, due to decreases in net interest income and non-interest income and an increase in non-interest expense. The $86.1 million decrease in net interest income is primarily due to higher deposit costs, partially offset by an increase in loan interest rate spreads and higher average loan and deposit balances. The $1.2 million decrease in non-interest income is primarily due to lower deposit service fees and loan servicing fees, partially offset by a $11.7 million net gain on sale or mortgage servicing rights and an increase in investment services income. The $1.8 million increase in non-interest expense is primarily due to higher compensation and benefits costs and an increase in operational support costs, partially offset by lower processing costs, occupancy, and professional services.
Selected Balance Sheet Information: | | | | | | | | | | | |
| At December 31, |
| (In thousands) | 2024 | | 2023 |
| Loans | $ | 11,886,095 | | | $ | 11,234,743 | |
| Deposits | 27,332,786 | | | 26,251,722 | |
| Assets under administration (off-balance sheet) | 7,997,114 | | | 7,876,437 | |
Loans increased $0.7 billion, or 5.8%, at December 31, 2024, as compared to at December 31, 2023, primarily due to growth in residential mortgages, small business commercial non-real estate loans, and other consumer loans, partially offset by net principal paydowns in home equities and small business commercial real estate loans. Total portfolio originations for the years ended December 31, 2024, and 2023, were $1.9 billion and $1.5 billion, respectively. The $0.4 billion increase was primarily due an increase in residential mortgage originations, which were lower in prior year as a result of the sharp increase in market rates and low housing inventories.
Deposits increased $1.1 billion, or 4.1%, at December 31, 2024, as compared to at December 31, 2023, primarily due to higher balances in interest-bearing deposit products, particularly money market, savings, and certificates of deposit, which was driven by higher interest rates, partially offset by lower balances in non-interest-bearing demand accounts.
Assets under administration increased $120.7 million, or 1.5%, at December 31, 2024, as compared to December 31, 2023, primarily due to an increase in investment account balances as a result of higher valuations in the equity markets and net inflows during the year.
Financial Condition
Total assets increased $4.1 billion, or 5.4%, from $74.9 billion at December 31, 2023, to $79.0 billion at December 31, 2024. The change in total assets was primarily attributed to the following, which experienced changes greater than $100 million:
•Cash and cash equivalents, which comprises Cash and due from banks and Interest-bearing deposits, increased $358.6 million, primarily due to an increase in interest-bearing deposits held at the FRB;
•Total investment securities, net increased $1.4 billion, primarily reflecting a $1.4 billion increase in the held-to-maturity portfolio, whereas the available-for-sale portfolio remained relatively flat. The increase in held-to-maturity was primarily due to purchases exceeding paydown activities, particularly across the Agency MBS and Agency CMBS categories. Throughout 2024, the Company sold $2.3 billion of available-for-sale Municipal bonds and notes, Agency MBS, Corporate debt securities, Agency CMBS, Government agency debentures, and Agency CMOs as part of its securities repositioning, in which the proceeds received were primarily reinvested in higher yielding Agency MBS and Agency CMBS;
•Loans and leases increased $1.8 billion, primarily due to $11.6 billion of originations during the year ended December 31, 2024, particularly across the commercial non-mortgage, commercial real estate, and residential mortgage categories, partially offset by net principal paydowns, and commercial loan sales, including the sale of the factored receivables portfolio and sale of multi-family loans (securitization);
•Goodwill and other net intangible assets increased, in aggregate, $367.8 million, primarily due to the acquisition of Ametros on January 24, 2024, which resulted in the recognition of $228.2 million in goodwill, a $182.8 million core deposit intangible asset, and a $6.1 million trade name. Offsetting this increase was the $19.7 million customer relationship intangible asset write-off associated with the factored receivables portfolio sale and a $1.9 million impairment loss on the payroll finance customer relationship intangible asset, along with routine amortization expense; and
•Accrued interest receivable and other assets increased $267.4 million. Notable drivers of the change included increases in LIHTC investments, other alternative investments, and prepaid expenses, partially offset by a decrease in treasury derivative assets.
Total liabilities increased $3.6 billion, or 5.5%, from $66.3 billion at December 31, 2023, to $69.9 billion at December 31, 2024. The change in total liabilities was attributed to the following:
•Total deposits increased $4.0 billion, reflecting a $4.4 billion increase in interest-bearing deposits, partially offset by a $0.4 billion decrease in non-interest-bearing deposits. The increase in total deposits was primarily due an increase in interLINK money market sweep deposits, the addition of Ametros, a discrete transfer of cash associated with HSA accounts that were previously held by former investment partners, and balance growth all customer-facing interest-bearing deposit products. Offsetting these increases was a decrease in brokered certificates of deposit due to wholesale funding mix. Throughout 2024, customers continued to shift their deposit preferences from non-interest-bearing demand to higher yielding deposit products, particularly money markets and certificates of deposit;
•Securities sold under agreements to repurchase and federal funds purchased decreased $114.2 million, primarily due to a change in short-term funding mix, which resulted in zero federal funds purchased at December 31, 2024, as compared to $100.0 million at December 31, 2023;
•FHLB advances decreased $249.9 million, primarily due to a change in short-term funding mix;
•Long-term debt decreased $139.6 million, primarily due to the maturity of its 4.375% senior notes in February 2024; and
•Accrued expenses and other liabilities increased $171.6 million. Notable drivers of the change included increases in unfunded commitments for LIHTC investments, accrued compensation, accrued income taxes, and deferred revenue, partially offset by decreases in operating lease liabilities and accrued interest payable.
Total stockholders’ equity increased $0.4 billion, or 5.1%, from $8.7 billion at December 31, 2023, to $9.1 billion at December 31, 2024. The change in stockholders’ equity was attributed to the following:
•Net income recognized of $768.7 million;
•Other comprehensive loss, net of tax, of $5.8 million;
•Dividends paid to common and preferred stockholders of $275.4 million and $16.7 million, respectively;
•Stock-based compensation expense of $55.1 million;
•Stock options exercised of $0.3 million; and
•Repurchases of common stock of $65.8 million under the Company’s common stock repurchase program and $17.2 million related to employee share-based compensation plans.
Investment Securities
Through its Corporate Treasury function, the Company maintains and invests in debt securities that are primarily used to provide a source of liquidity for operating needs, as a means to manage the Company’s interest-rate risk, and to generate interest income. The Company’s investment securities are classified into two major categories: available-for-sale and
held-to-maturity.
The ALCO manages the Company’s investment securities in accordance with regulatory guidelines and corporate policies, which include limitations on aspects such as concentrations in and types of investments, as well as minimum risk ratings per type of security. In addition, the OCC may further establish individual limits on certain types of investments if the concentration in such security presents a safety and soundness concern. Although the Bank held the entirety of the Company’s investment securities portfolio at both December 31, 2024, and 2023, the Holding Company may also directly hold investments.
The following table summarizes the balances and percentage composition of the Company’s investment securities: | | | | | | | | | | | | | | | | | |
| | At December 31, |
| | 2024 | | 2023 |
| (In thousands) | Amount | % | | Amount | % |
| Available-for-sale: | | | | | |
| | | | | |
| Government agency debentures | $ | 186,426 | | 2.1 | % | | $ | 264,633 | | 3.0 | % |
| Municipal bonds and notes | 110,876 | | 1.2 | | | 1,573,233 | | 17.6 | |
| Agency CMO | 29,043 | | 0.3 | | | 48,941 | | 0.5 | |
| Agency MBS | 4,519,785 | | 50.2 | | | 3,347,098 | | 37.4 | |
| Agency CMBS | 3,034,392 | | 33.8 | | | 2,288,071 | | 25.5 | |
| CMBS | 625,388 | | 6.9 | | | 763,749 | | 8.5 | |
| | | | | |
| Corporate debt | 452,266 | | 5.0 | | | 622,155 | | 6.9 | |
| Private label MBS | 39,219 | | 0.4 | | | 42,808 | | 0.5 | |
| Other | 9,205 | | 0.1 | | | 9,041 | | 0.1 | |
| Total available-for-sale | $ | 9,006,600 | | 100.0 | % | | $ | 8,959,729 | | 100.0 | % |
| | | | | |
| Held-to-maturity: | | | | | |
| Agency CMO | $ | 19,847 | | 0.2 | % | | $ | 23,470 | | 0.3 | % |
| Agency MBS | 3,109,411 | | 36.8 | | | 2,409,521 | | 34.1 | |
| Agency CMBS | 4,357,505 | | 51.6 | | | 3,625,627 | | 51.2 | |
Municipal bonds and notes (1) | 891,909 | | 10.6 | | | 916,104 | | 13.0 | |
| CMBS | 65,690 | | 0.8 | | | 100,075 | | 1.4 | |
| Total held-to-maturity | $ | 8,444,362 | | 100.0 | % | | $ | 7,074,797 | | 100.0 | % |
| Total investment securities | $ | 17,450,962 | | | | $ | 16,034,526 | | |
(1)The balances at both December 31, 2024, and 2023, exclude the $0.2 million ACL recorded on held-to-maturity securities.
Available-for-sale securities remained relatively flat at approximately $9.0 billion at both December 31, 2024, and December 31, 2023. During the year ended December 31, 2024, the Company sold $2.3 billion of Municipal bonds and notes, Agency MBS, Corporate debt securities, Agency CMBS, Government agency debentures, and Agency CMOs, as part of its securities repositioning, which resulted in net realized losses of $138.8 million. Because $2.6 million of the realized losses on sale were due to credit related factors, such amount has been included in the Provision for credit losses. Proceeds received from the Company’s securities repositioning were primarily reinvested in higher yielding Agency MBS and Agency CMBS. The average FTE yield on the available-for-sale portfolio was 4.17% for the year ended December 31, 2024, as compared to 3.11% for the year ended December 31, 2023. The 106 basis point increase is primarily due to higher interest rates on recent securities purchases, as compared to interest rates on securities with paydown activities or that were sold.
At December 31, 2024, and 2023, gross unrealized losses on available-for-sale securities were $725.9 million and $759.4 million, respectively. The $33.5 million decrease is primarily due to the net realized losses on sale, partially offset by increases in market rates. On a quarterly basis, each available-for-sale security that is in an unrealized loss position is evaluated to determine whether the decline in fair value below the amortized cost basis is a result of any credit related factors. During the fourth quarter of 2024, a $0.9 million ACL was recorded related to a single available-for-sale Corporate debt security. Each of the Company’s other available-for-sale securities in an unrealized loss position at December 31, 2024, are investment grade, current as to principal and interest, and their price changes are consistent with interest and credit spreads when adjusting for duration, convexity, rating, and industry differences. Based on current market conditions and the Company’s targeted balance sheet composition strategy, the Company intends to hold its available-for-sale securities in unrealized loss positions through the anticipated recovery period. There was no ACL recorded on available-for-sale securities at December 31, 2023.
Held-to-maturity securities increased $1.3 billion, or 19.4%, from $7.1 billion at December 31, 2023, to $8.4 billion at December 31, 2024, primarily due to purchases exceeding paydown activities, particularly across the Agency MBS and Agency CMBS categories. The average FTE yield on the held-to-maturity portfolio was 3.75% for the year ended December 31, 2024, as compared to 2.99% for the year ended December 31, 2023. The 76 basis point increase is primarily due to higher interest rates on recent securities purchases, as compared to interest rates on securities with paydown activities.
At December 31, 2024, and 2023, gross unrealized losses on held-to-maturity securities were $1.0 billion and $0.8 billion, respectively. The $0.2 billion increase is primarily due to increases in market rates. Held-to-maturity securities are evaluated for credit losses on a quarterly basis under the CECL methodology. At both December 31, 2024, and 2023, the ACL on held-to-maturity securities was $0.2 million.
The following table summarizes the maturity distribution of investment securities by the earlier of either contractual maturity or call date, as applicable, along with their respective weighted-average yields: | | | | | | | | | | | | | | | | | | | | | | | | | | | | | | | | |
| At December 31, 2024 |
| 1 Year or Less | 1 - 5 Years | 5 - 10 Years | After 10 Years | Total |
| (In thousands) | Amount | Weighted- Average Yield (1) | Amount | Weighted- Average Yield (1) | Amount | Weighted- Average Yield (1) | Amount | Weighted- Average Yield (1) | Amount | Weighted- Average Yield (1) |
| Available-for-sale: | | | | | | | | | | |
| | | | | | | | | | |
| Government agency debentures | $ | — | | — | % | $ | — | | — | % | $ | 32,576 | | 2.42 | % | $ | 153,851 | | 3.43 | % | $ | 186,427 | | 3.25 | % |
| Municipal bonds and notes | 6,234 | | 2.91 | | 856 | | 4.32 | | 27,521 | | 2.24 | | 76,265 | | 2.17 | | 110,876 | | 2.25 | |
| Agency CMO | 88 | | 2.98 | | — | | — | | 1,904 | | 3.47 | | 27,051 | | 2.87 | | 29,043 | | 2.91 | |
| Agency MBS | — | | — | | 3,926 | | 1.28 | | 880 | | 3.86 | | 4,514,979 | | 4.70 | | 4,519,785 | | 4.70 | |
| Agency CMBS | — | | — | | 102,852 | | 4.72 | | 172,272 | | 4.40 | | 2,759,268 | | 5.01 | | 3,034,392 | | 4.97 | |
| CMBS | — | | — | | 58,206 | | 6.22 | | — | | — | | 567,182 | | 6.03 | | 625,388 | | 6.04 | |
| | | | | | | | | | |
| Corporate debt | — | | — | | 72,432 | | 3.96 | | 337,446 | | 3.36 | | 42,387 | | 3.55 | | 452,265 | | 3.47 | |
| Private label MBS | — | | — | | — | | — | | — | | — | | 39,219 | | 4.01 | | 39,219 | | 4.01 | |
| Other | — | | — | | 4,932 | | 3.80 | | 4,273 | | 2.70 | | — | | — | | 9,205 | | 3.29 | |
| Total available-for-sale | $ | 6,322 | | 2.91 | % | $ | 243,204 | | 4.78 | % | $ | 576,872 | | 3.56 | % | $ | 8,180,202 | | 4.84 | % | $ | 9,006,600 | | 4.75 | % |
| Held-to-maturity: | | | | | | | | | | |
| Agency CMO | $ | — | | — | % | $ | — | | — | % | $ | — | | — | % | $ | 19,847 | | 2.90 | % | $ | 19,847 | | 2.90 | % |
| Agency MBS | 3 | | 2.50 | | 188 | | 2.02 | | 33,035 | | 2.58 | | 3,076,185 | | 3.44 | | 3,109,411 | | 3.44 | |
| Agency CMBS | — | | — | | 113,151 | | 2.67 | | — | | — | | 4,244,354 | | 4.22 | | 4,357,505 | | 4.18 | |
| Municipal bonds and notes | 49,228 | | 2.98 | | 45,439 | | 2.70 | | 208,421 | | 2.84 | | 588,821 | | 3.27 | | 891,909 | | 3.12 | |
| CMBS | — | | — | | — | | — | | — | | — | | 65,690 | | 2.39 | | 65,690 | | 2.39 | |
| Total held-to-maturity | $ | 49,231 | | 2.98 | % | $ | 158,778 | | 2.68 | % | $ | 241,456 | | 2.81 | % | $ | 7,994,897 | | 3.84 | % | $ | 8,444,362 | | 3.78 | % |
Total investment securities (2) | $ | 55,553 | | 2.97 | % | $ | 401,982 | | 3.95 | % | $ | 818,328 | | 3.34 | % | $ | 16,175,099 | | 4.34 | % | $ | 17,450,962 | | 4.28 | % |
(1)Weighted-average yields exclude FTE adjustments and hedge adjustments, and are calculated on a pre-tax basis using the current yield inclusive of premium amortization and discount accretion for each security, major type, and maturity bucket.
(2)Available-for-sale securities are presented at fair value and held-to-maturity securities are presented at amortized cost before any allowance for credit losses.
Additional information regarding the Company’s investment securities’ portfolios can be found within Note 3: Investment Securities in the Notes to Consolidated Financial Statements contained in Part II - Item 8. Financial Statements and Supplementary Data.
Loans and Leases
The following table summarizes the amortized cost and percentage composition of the Company’s loans and leases: | | | | | | | | | | | | | | | | | |
| At December 31, |
| | 2024 | | 2023 |
| (In thousands) | Amount | % | | Amount | % |
| Commercial non-mortgage | $ | 18,037,942 | | 34.4 | % | | $ | 16,885,475 | | 33.3 | % |
| Asset-based | 1,404,007 | | 2.7 | | | 1,557,841 | | 3.1 | |
| Commercial real estate | 14,492,436 | | 27.6 | | | 13,569,762 | | 26.7 | |
| Multi-family | 6,898,600 | | 13.1 | | | 7,587,970 | | 15.0 | |
| Equipment financing | 1,235,016 | | 2.3 | | | 1,328,786 | | 2.6 | |
| | | | | |
| Residential | 8,853,669 | | 16.9 | | | 8,227,923 | | 16.2 | |
| Home equity | 1,427,692 | | 2.7 | | | 1,516,955 | | 3.0 | |
| Other consumer | 155,806 | | 0.3 | | | 51,340 | | 0.1 | |
Total loans and leases (1) | $ | 52,505,168 | | 100.0 | % | | $ | 50,726,052 | | 100.0 | % |
(1)The amortized cost balances at December 31, 2024, and 2023, exclude the ACL recorded on loans and leases of $689.6 million and $635.7 million, respectively.
The following table summarizes loans and leases by contractual maturity, along with the indication of whether interest rates are fixed or variable: | | | | | | | | | | | | | | | | | |
| At December 31, 2024 |
| (In thousands) | 1 Year or Less | 1 - 5 Years | 5 - 15 Years | After 15 Years | Total |
| Fixed rate: | | | | | |
| Commercial non-mortgage | $ | 199,605 | | $ | 1,564,308 | | $ | 2,346,083 | | $ | 1,414,579 | | $ | 5,524,575 | |
| Asset-based | 63,262 | | 495,153 | | — | | — | | 558,415 | |
| Commercial real estate | 914,709 | | 2,294,353 | | 684,444 | | 135,895 | | 4,029,401 | |
| Multi-family | 500,800 | | 3,527,696 | | 863,116 | | 57,820 | | 4,949,432 | |
| Equipment financing | 83,596 | | 864,654 | | 286,766 | | — | | 1,235,016 | |
| | | | | |
| Residential | 2,649 | | 37,188 | | 357,272 | | 5,278,532 | | 5,675,641 | |
| Home equity | 2,457 | | 19,917 | | 159,985 | | 212,291 | | 394,650 | |
| Other consumer | 14,233 | | 99,900 | | 13,395 | | 37 | | 127,565 | |
| Total fixed rate loans and leases | $ | 1,781,311 | | $ | 8,903,169 | | $ | 4,711,061 | | $ | 7,099,154 | | $ | 22,494,695 | |
| Variable rate: | | | | | |
| Commercial non-mortgage | $ | 3,817,361 | | $ | 7,010,505 | | $ | 1,559,738 | | $ | 125,762 | | $ | 12,513,366 | |
| Asset-based | 376,628 | | 468,964 | | — | | — | | 845,592 | |
| Commercial real estate | 2,594,975 | | 5,001,499 | | 2,240,437 | | 626,124 | | 10,463,035 | |
| Multi-family | 276,066 | | 994,692 | | 675,218 | | 3,193 | | 1,949,169 | |
| | | | | |
| | | | | |
| Residential | 1,062 | | 8,060 | | 258,389 | | 2,910,517 | | 3,178,028 | |
| Home equity | 923 | | 6,313 | | 104,910 | | 920,896 | | 1,033,042 | |
| Other consumer | 5,437 | | 21,113 | | 1,691 | | — | | 28,241 | |
Total variable rate loans and leases (1) | $ | 7,072,452 | | $ | 13,511,146 | | $ | 4,840,383 | | $ | 4,586,492 | | $ | 30,010,473 | |
Total loans and leases (2) | $ | 8,853,763 | | $ | 22,414,315 | | $ | 9,551,444 | | $ | 11,685,646 | | $ | 52,505,168 | |
(1)The Company has a back-to-back swap program, whereby it enters into an interest rate swap with a qualified customer and simultaneously enters into an equal and opposite interest-rate swap with a swap counterparty, to hedge interest rate risk. At December 31, 2024, there were 886 customer interest rate swaps arrangements with a total notional amount of $7.3 billion to convert floating-rate loan payments to fixed-rate loan payments, and 43 customer interest rate cap arrangements with a total notional amount of $1.4 billion limiting how high interest rates can rise on variable rate loans and leases in a rising interest rate environment.
(2)Amounts exclude total accrued interest receivable of $265.0 million.
Portfolio Concentrations
The Company actively monitors and manages concentrations of credit risk pertaining to specific industries, geographies, property types, and other characteristics that may exist in its loan and lease portfolio. At December 31, 2024, and 2023, commercial non-mortgage, commercial real estate, and multi-family loans comprised 75.1% and 75.0%, respectively, of the Company’s loan and lease portfolio, with a large portion of the borrowers or properties associated with these loans geographically concentrated in New York City and the proximate areas.
The following table summarizes the percentage composition of commercial non-mortgage loans by industry, as determined using NAICS codes, which are used by the Company to categorize loans based on the borrower’s type of business: | | | | | | | | | | | | | | | | |
| | | At December 31, |
| | | 2024 | | | 2023 |
| Finance | | | 25.7 | % | | | 24.4 | % |
| Services | | | 16.1 | | | | 17.3 | |
| Public Administration | | | 15.8 | | | | 14.0 | |
| Communications | | | 7.7 | | | | 6.9 | |
| Manufacturing | | | 6.4 | | | | 6.9 | |
| Real Estate | | | 5.0 | | | | 4.8 | |
| Retail & Wholesale | | | 4.6 | | | | 5.2 | |
| Healthcare | | | 4.6 | | | | 5.0 | |
| Transportation & Public Utilities | | | 3.0 | | | | 3.3 | |
| Construction | | | 2.3 | | | | 2.8 | |
| Other | | | 8.8 | | | | 9.4 | |
| Total Commercial non-mortgage | | | 100.0 | % | | | 100.0 | % |
As illustrated above, concentrations are generally consistent from period to period. Any change in composition is consistent with the Company’s portfolio growth strategy.
The following tables summarize the percentage composition of commercial real estate and multi-family loans by both geography and property type, and whether the properties are owner occupied or non-owner occupied: | | | | | | | | | | | | | | | | | | | | | | | | | | |
| | At December 31, |
| | 2024 | | 2023 |
| Geography: | | Owner Occupied | Non-Owner Occupied | Total | | Owner Occupied | Non-Owner Occupied | Total |
| New York City | | 2.9 | % | 32.6 | % | 35.5 | % | | 2.0 | % | 33.4 | % | 35.4 | % |
| Other New York Counties | | 2.6 | | 11.7 | | 14.3 | | | 2.3 | | 13.4 | | 15.7 | |
| Connecticut | | 2.4 | | 6.3 | | 8.7 | | | 2.2 | | 6.1 | | 8.3 | |
| New Jersey | | 1.6 | | 6.9 | | 8.5 | | | 0.7 | | 7.5 | | 8.2 | |
| Massachusetts | | 1.4 | | 4.9 | | 6.3 | | | 1.3 | | 5.0 | | 6.3 | |
| Southeast | | 1.0 | | 10.2 | | 11.2 | | | 0.7 | | 10.3 | | 11.0 | |
| Other | | 1.4 | | 14.1 | | 15.5 | | | 1.0 | | 14.1 | | 15.1 | |
| Total Commercial real estate & Multi-family | | 13.3 | % | 86.7 | % | 100.0 | % | | 10.2 | % | 89.8 | % | 100.0 | % |
| | | | | | | | |
| | At December 31, |
| | 2024 | | 2023 |
| Property Type: | | Owner Occupied | Non-Owner Occupied | Total | | Owner Occupied | Non-Owner Occupied | Total |
| Multi-family | | 0.4 | % | 34.3 | % | 34.7 | % | | 0.4 | % | 35.3 | % | 35.7 | % |
| Industrial & Warehouse | | 3.1 | | 14.6 | | 17.7 | | | 2.8 | | 13.6 | | 16.4 | |
| Retail | | 0.5 | | 8.1 | | 8.6 | | | 0.5 | | 7.9 | | 8.4 | |
| Construction | | 0.1 | | 7.7 | | 7.8 | | | 0.2 | | 6.7 | | 6.9 | |
| Healthcare & Senior Living | | 4.3 | | 1.9 | | 6.2 | | | 1.8 | | 5.6 | | 7.4 | |
| Medical Office | | 0.1 | | 4.2 | | 4.3 | | | 0.1 | | 3.1 | | 3.2 | |
| Traditional Office | | — | | 3.8 | | 3.8 | | | — | | 4.9 | | 4.9 | |
| Hotel | | — | | 2.1 | | 2.1 | | | — | | 2.3 | | 2.3 | |
| Other | | 4.8 | | 10.0 | | 14.8 | | | 4.4 | | 10.4 | | 14.8 | |
| Total Commercial real estate & Multi-family | | 13.3 | % | 86.7 | % | 100.0 | % | | 10.2 | % | 89.8 | % | 100.0 | % |
The weighted-average LTV ratio for non-owner occupied commercial real estate and multi-family loans at December 31, 2024, and 2023, was 57% and 56%, respectively. The Company calculates its LTV ratios primarily using appraisals at origination unless a full appraisal is subsequently required based on deal-specific events.
Given the foundational change in office demand driven by the acceptance of remote work options, the commercial real estate market has continued to experience an increase in office property vacancies. As such, commercial real estate performance across the United States related to the traditional office sector continues to be an area of uncertainty. At December 31, 2024, the outstanding principal balance of traditional office commercial real estate loans was approximately $0.8 billion, which had reserves of $43.3 million established against it. While the Company does anticipate ongoing change in the traditional office sector, management believes that its reserve levels reflect the expected credit losses in the portfolio.
Credit Policies and Procedures
The Bank has credit policies and procedures in place designed to support its lending activities within an acceptable level of risk, which are reviewed and approved by management and the Board of Directors on a regular basis. To assist with this process, management inspects reports generated by the Company’s loan reporting systems related to loan production, loan quality, concentrations of credit, loan delinquencies, non-performing loans, and potential problem loans.
Commercial non-mortgage, asset-based, and equipment finance loans are underwritten after evaluating and understanding the borrower’s ability to operate and service its debt. Assessment of the borrower’s management is a critical element of the underwriting process and credit decision. Once it has been determined that the borrower’s management possesses sound ethics and a solid business acumen, current and projected cash flows are examined to determine the ability of the borrower to repay obligations, as contracted. Commercial non-mortgage, asset-based, and equipment finance loans are primarily made based on the identified cash flows of the borrower, and secondarily on the underlying collateral provided by the borrower. However, the cash flows of borrowers may not be as expected, and the collateral securing these loans, as applicable, may fluctuate in value. Most commercial non-mortgage, asset-based, and equipment finance loans are secured by the assets being financed and may incorporate personal guarantees of the principal balance.
Commercial real estate loans, including multi-family, are subject to underwriting standards and processes similar to those for commercial non-mortgage, asset-based, and equipment finance loans. These loans are primarily viewed as cash flow loans, and secondarily as loans secured by real estate. Repayment of commercial real estate loans is largely dependent on the successful operation of the property securing the loan, the market in which the property is located, and the tenants of the property securing the loan. Management monitors and evaluates commercial real estate loans based on collateral, geography, and risk grade criteria. All transactions are appraised to determine market value. Commercial real estate loans may be adversely affected by conditions in the real estate markets or in the general economy. Management periodically utilizes third-party experts to provide insight and guidance about economic conditions and trends affecting its commercial real estate loan portfolio.
The Bank requires a valuation of real estate collateral, which generally includes third-party appraisals, at the time of origination or renewal in accordance with regulatory guidance. On an annual basis, appraisal assumptions and other factors are internally reviewed to determine whether an incremental third-party appraisal is warranted. New appraisals are obtained sooner if a loan becomes adversely classified, substandard, or non-accrual.
Consumer loans are subject to policies and procedures developed to manage the specific risk characteristics of the portfolio. These policies and procedures, coupled with relatively small individual loan amounts and predominately collateralized loan structures, are spread across many different borrowers, minimizing the level of credit risk. Trend and outlook reports are reviewed by management on a regular basis, and policies and procedures are modified or developed, as needed. Underwriting factors for residential mortgage and home equity loans include the borrower’s FICO score, the loan amount relative to property value, and the borrower’s debt-to-income level. The Bank originates both qualified mortgage and non-qualified mortgage loans.
Allowance for Credit Losses on Loans and Leases
The ACL on loans and leases increased $53.9 million, or 8.5%, from $635.7 million at December 31, 2023, to $689.6 million at December 31, 2024, primarily due to the impact of the current macroeconomic environment on credit performance, risk rating migration, loan portfolio mix, and organic loan growth, partially offset by net charge-offs.
The following table summarizes the percentage allocation of the ACL across the loans and leases categories: | | | | | | | | | | | | | | | | | |
| At December 31, |
| 2024 | | 2023 |
| (In thousands) | Amount | % (1) | | Amount | % (1) |
| Commercial non-mortgage | $ | 270,613 | 39.2 | % | | $ | 211,699 | 33.3 | % |
| Asset-based | 30,049 | 4.4 | | | 15,828 | 2.5 | |
| Commercial real estate | 245,124 | 35.5 | | | 248,921 | 39.2 | |
| Multi-family | 70,998 | 10.3 | | | 80,582 | 12.7 | |
| Equipment financing | 19,087 | 2.8 | | | 20,633 | 3.2 | |
| | | | | |
| Residential | 27,354 | 4.0 | | | 29,739 | 4.7 | |
| Home equity | 19,625 | 2.8 | | | 26,154 | 4.1 | |
| Other consumer | 6,716 | 1.0 | | | 2,181 | 0.3 | |
| Total ACL on loans and leases | $ | 689,566 | 100.0 | % | | $ | 635,737 | 100.0 | % |
(1)The ACL allocated to a single loan and lease category does not preclude its availability to absorb losses in other categories.
Methodology
The Company’s ACL on loans and leases is considered to be a critical accounting policy. The ACL on loans and leases is a contra-asset account that offsets the amortized cost basis of loans and leases for the credit losses that are expected to occur over the life of the asset. Executive management reviews and advises on the adequacy of the allowance on a quarterly basis, which is maintained at a level that management deems to be sufficient to cover expected losses within the loan and lease portfolios.
The ACL on loans and leases is determined using the CECL model, whereby an expected lifetime credit loss is recognized at the origination or purchase of an asset, including those acquired through a business combination, which is then reassessed at each reporting date over the contractual life of the asset. The calculation of expected credit losses includes consideration of past events, current conditions, and reasonable and supportable economic forecasts that affect the collectability of the reported amounts. Generally, expected credit losses are determined through a pooled, collective assessment of loans and leases with similar risk characteristics. However, if the risk characteristics of a loan or lease change such that it no longer aligns to that of the collectively assessed pool, it is removed from the population and individually assessed for credit losses. The total ACL on loans and leases recorded by management represents the aggregated estimated credit loss determined through both the collective and individual assessments.
Collectively Assessed Loans and Leases. Collectively assessed loans and leases are segmented based on product type and credit quality, and expected losses are determined using models that follow a PD, LGD, or EAD framework. Under these frameworks, expected credit losses are calculated as the product of the probability of a loan defaulting, expected loss given the occurrence of a default, and the expected exposure of a loan at default. Summing the product across loans over their lives yields the lifetime expected credit losses for a given portfolio. The Company’s PD and LGD calculations are predictive models that measure the current risk profile of the loan pools using forecasts of future macroeconomic conditions, historical loss information, loan-level risk attributes, and credit quality indicators. The calculation of EAD follows an iterative process to determine the expected remaining principal balance of a loan based on historical paydown rates for loans of a similar segment within the same portfolio. The calculation of portfolio exposure in future quarters incorporates expected losses, the loan’s amortization schedule, and prepayment rates.
The Company’s models incorporate a single economic forecast scenario and macroeconomic assumptions over a reasonable
and supportable forecast period. The development of the reasonable and supportable forecast assumes that each portfolio will revert to its long-term loss rate expectation. The reasonable and supportable forecast period is two years after which the reversion period is one year. Models use output reversion and revert to mean historical portfolio loss rates on a straight-line basis in the third year of the forecast.
The Company incorporates forecasts of macroeconomic variables in the determination of expected credit losses. Macroeconomic variables are selected for each class of financing receivable based on relevant factors, such as asset type and the correlation of the variables to credit losses, among others. Data from the forecast scenario of these macroeconomic variables are used as inputs to the modeled loss calculation.
A portion of the collective ACL is comprised of qualitative adjustments for risk characteristics that are not reflected or captured in the quantitative models, but are likely to impact the measurement of estimated credit losses. Qualitative adjustments are based on management’s judgment of the Company, market, industry, or business specific data, may be applied in relation to economic forecasts when relevant facts and circumstances are expected to impact credit losses, particularly in times of significant volatility in economic activity. Qualitative factors used in the Company’s models for all loan and lease portfolios include, but are not limited to, nature and volume of portfolio growth, credit quality trends, underwriting exception levels, quality of internal loan review, credit concentrations, and staffing trends. The qualitative portion of the collective ACL accounted for approximately 39% and 43% of the total ACL on loans and leases at December 31, 2024, and 2023, respectively. The balance of qualitative reserves primarily relates to credit quality trends and credit concentration factors, and overall remained relatively stable from period to period, whereas the lower percentage in the current year was primarily due to an increase in quantitative reserves resulting from commercial risk rating migration.
Individually Assessed Loans and Leases. If the risk characteristics of a loan or lease change such that it no longer matches the risk characteristics of the collectively assessed pool, it is removed from the population and individually assessed for credit losses. Generally, all non-accrual loans and loans with a charge-off are individually assessed. The measurement method used to calculate the expected credit loss on an individually assessed loan or lease is dependent on the type and whether the loan or lease is considered to be collateral dependent. Methods for collateral dependent commercial loans are either based on the fair value of the collateral less estimated cost to sell when the basis of repayment is the sale of collateral, or the present value of the expected cash flows from the operation of the collateral. For non-collateral dependent loans, either a discounted cash flow method or other loss factor method is used. Any individually assessed loan or lease for which no specific allowance is deemed necessary is either the result of sufficient cash flows or sufficient collateral coverage relative to the amortized cost of the asset.
Additional information regarding the Company’s ACL methodology can be found within Note 1: Summary of Significant Accounting Policies in the Notes to Consolidated Financial Statements contained in Part II - Item 8. Financial Statements and Supplementary Data.
Asset Quality Ratios
The Company manages asset quality using risk tolerance levels established through the Company’s underwriting standards, servicing, and management of its loan and lease portfolio. Loans and leases for which a heightened risk of loss has been identified are regularly monitored to mitigate further deterioration and preserve asset quality in future periods. Non-performing assets, credit losses, and net charge-offs are considered by management to be key measures of asset quality.
The following table summarizes key asset quality ratios and their underlying components: | | | | | | | | | | | | | | | | | |
| At or for the years ended December 31, |
| (In thousands) | 2024 | | 2023 | | 2022 |
Non-performing loans and leases (1) (2) | $ | 461,326 | | | $ | 209,544 | | | $ | 203,791 | |
| Total loans and leases | 52,505,168 | | | 50,726,052 | | | 49,764,426 | |
| Non-performing loans and leases as a percentage of loans and leases | 0.88 | % | | 0.41 | % | | 0.41 | % |
| | | | | |
Total non-performing loans and leases (1) | $ | 461,326 | | | $ | 209,544 | | | $ | 203,791 | |
| Add: OREO and repossessed assets | 425 | | | 9,056 | | | 2,345 | |
Total Non-performing assets (1) | $ | 461,751 | | | $ | 218,600 | | | $ | 206,136 | |
| | | | | |
| | | | | |
| Total loans and leases plus OREO and repossessed assets | $ | 52,505,593 | | | $ | 50,735,108 | | | $ | 49,766,771 | |
Non-performing assets as a percentage of loans and leases plus OREO
and repossessed assets | 0.88 | % | | 0.43 | % | | 0.41 | % |
| | | | | |
Non-performing assets (1) | $ | 461,751 | | | $ | 218,600 | | | $ | 206,136 | |
| Total assets | 79,025,073 | | | 74,945,249 | | | 71,277,521 | |
| Non-performing assets as a percentage of total assets | 0.58 | % | | 0.29 | % | | 0.29 | % |
| | | | | |
| ACL on loans and leases | $ | 689,566 | | | $ | 635,737 | | | $ | 594,741 | |
Non-performing loans and leases (1) | 461,326 | | | 209,544 | | | 203,791 | |
| ACL on loans and leases as a percentage of non-performing loans and leases | 149.47 | % | | 303.39 | % | | 291.84 | % |
| | | | | |
| ACL on loans and leases | $ | 689,566 | | | $ | 635,737 | | | $ | 594,741 | |
| Total loans and leases | 52,505,168 | | | 50,726,052 | | | 49,764,426 | |
| ACL on loans and leases as a percentage of loans and leases | 1.31 | % | | 1.25 | % | | 1.20 | % |
| | | | | |
| ACL on loans and leases | $ | 689,566 | | | $ | 635,737 | | | $ | 594,741 | |
| Net charge-offs | 166,914 | | | 108,086 | | | 67,288 | |
| Ratio of ACL on loans and leases to net charge-offs | 4.13x | | 5.88x | | 8.84x |
(1)Non-performing asset balances and related asset quality ratios exclude the impact of net unamortized (discounts)/premiums and net unamortized deferred (fees)/costs on loans and leases.
(2)The increase from 2023 to 2024 is primarily due to non-performing commercial non-mortgage and commercial real estate loans.
The following table summarizes net charge-offs (recoveries) as a percentage of average loans and leases for each category: | | | | | | | | | | | | | | | | | | | | | | | | | | | | | | | | | | | |
| At or for the years ended December 31, |
| 2024 | | 2023 | | 2022 |
| (In thousands) | Net
Charge-offs (Recoveries) | Average Balance | % | | Net
Charge-offs (Recoveries) | Average Balance | % | | Net
Charge-offs (Recoveries) | Average Balance | % |
| Commercial non-mortgage | $ | 88,525 | $ | 17,071,748 | | 0.52 | % | | $ | 13,531 | $ | 16,900,423 | | 0.08 | % | | $ | 44,250 | $ | 13,625,382 | | 0.32 | % |
| Asset-based | 6,090 | 1,474,703 | | 0.41 | | | 17,088 | 1,699,064 | | 1.01 | | | 4,473 | 1,746,888 | | 0.26 | |
| Commercial real estate | 39,776 | 14,222,437 | | 0.28 | | | 62,208 | 13,397,036 | | 0.46 | | | 20,471 | 11,299,259 | | 0.18 | |
| Multi-family | 22,761 | 7,622,410 | | 0.30 | | | 3,447 | 7,072,507 | | 0.05 | | | 1,298 | 6,025,702 | | 0.02 | |
| Equipment financing | 10,239 | 1,258,733 | | 0.81 | | | 4,949 | 1,509,948 | | 0.33 | | | 931 | 1,660,935 | | 0.06 | |
| Warehouse lending | — | — | | — | | | — | 316,729 | | — | | | — | 537,430 | | — | |
| Residential | (953) | 8,403,098 | | (0.01) | | | 3,601 | 8,126,878 | | 0.04 | | | (1,377) | 7,112,890 | | (0.02) | |
| Home equity | (2,890) | 1,464,894 | | (0.20) | | | (123) | 1,560,707 | | (0.01) | | | (4,201) | 1,663,198 | | (0.25) | |
| Other consumer | 3,366 | 79,420 | | 4.24 | | | 3,385 | 54,277 | | 6.24 | | | 1,443 | 79,428 | | 1.82 | |
| Total | $ | 166,914 | $ | 51,597,443 | | 0.32 | % | | $ | 108,086 | $ | 50,637,569 | | 0.21 | % | | $ | 67,288 | $ | 43,751,112 | | 0.15 | % |
Net charge-offs increased $58.8 million, or 54.4%, to $166.9 million for the year ended December 31, 2024, as compared to $108.1 million for the year ended December 31, 2023, primarily due to increases in net charge-offs in the commercial non-mortgage, multi-family, and equipment finance categories, partially offset by decreases in net charge-offs in the commercial real estate and asset-based lending categories.
Liquidity and Capital Resources
The Company manages its cash flow requirements through proactive liquidity measures at both the Holding Company and the Bank. In order to maintain stable, cost-effective funding, and to promote overall balance sheet strength, the liquidity position of the Company is continuously monitored, and adjustments are made to balance sources and uses of funds, as appropriate.
At December 31, 2024, management is not aware of any events that are reasonably likely to have a material adverse effect on the Company’s liquidity position, capital resources, or operating activities. The Company has taken appropriate measures to mitigate the risk that such requirements, if implemented, may have on its business, financial positions, and results of operations.
Cash inflows are provided through a variety of sources, including principal and interest payments on loans and investments, unpledged securities that can be sold or utilized to secure funding, and new deposits. The Company is committed to maintaining a strong base of core deposits, which consist of demand, interest-bearing checking, savings, health savings, and money market accounts, to support growth in its loan portfolios. Management actively monitors the interest rate environment and makes adjustments to its deposit strategy in response to evolving market conditions, funding needs, and client relationship dynamics.
Holding Company Liquidity. The primary source of liquidity at the Holding Company is dividends from the Bank. To a lesser extent, investment income, net proceeds from investment sales, borrowings, and public offerings may provide additional liquidity. The Holding Company generally uses its funds for principal and interest payments on senior notes, subordinated notes, and junior subordinated debt, dividend payments to preferred and common stockholders, repurchases of its common stock, and purchases of investment securities, as applicable.
There are certain restrictions on the Bank’s payment of dividends to the Holding Company, which can be found within the section captioned “Supervision and Regulation” in Part I - Item 1. Business, and within Note 14: Regulatory Capital and Restrictions in the Notes to Consolidated Financial Statements contained in Part II - Item 8. Financial Statements and Supplementary Data. During the year ended December 31, 2024, the Bank paid $600.0 million in dividends to the Holding Company. At December 31, 2024, there was $747.3 million of retained earnings available for the payment of dividends by the Bank to the Holding Company. On January 29, 2025, the Bank was approved to pay the Holding Company $100.0 million in dividends for the first quarter of 2025.
The quarterly cash dividend to common stockholders remained at $0.40 per common share throughout 2024. On January 29, 2025, it was announced that the Holding Company’s Board of Directors had declared a quarterly cash dividend of $0.40 per share on Webster common stock. For the Series F Preferred Stock and Series G Preferred Stock, quarterly cash dividends of $328.125 per share and $16.25 per share were declared, respectively. The Company continues to monitor economic forecasts, anticipated earnings, and its capital position in the determination of its dividend payments.
The Holding Company maintains a common stock repurchase program, which was approved by the Board of Directors, that authorizes management to purchase shares of its common stock in open market or privately negotiated transactions, through block trades, and pursuant to any adopted predetermined trading plan, subject to certain conditions. During the year ended December 31, 2024, the Holding Company repurchased 1,408,426 shares under the repurchase program at a weighted-average price of $46.44 per share, totaling $65.4 million. At December 31, 2024, the Holding Company’s remaining purchase authority was $228.0 million. In addition, the Company will periodically acquire common shares outside of the repurchase program related to employee stock compensation plan activity. During the year ended December 31, 2024, the Company repurchased 361,324 shares at a weighted-average price of $47.64 per share, totaling $17.2 million, for this purpose.
Webster Bank Liquidity. The Bank’s primary source of funding is its core deposits. Including time deposits, the Bank had a loan to total deposit ratio of 81.1% and 83.5% at December 31, 2024, and 2023, respectively.
The Bank is required by OCC regulations to maintain a sufficient level of liquidity to ensure safe and sound operations. The adequacy of liquidity, as assessed by the OCC, depends on factors such as overall asset and liability structure, market conditions, competition, and the nature of the institution’s deposit and loan customers. At December 31, 2024, the Bank exceeded all regulatory liquidity requirements. The Company has designed a detailed contingency plan in order to respond to any liquidity concerns in a prompt and comprehensive manner, including early detection of potential problems and corrective action to address liquidity stress scenarios.
Capital Requirements. The Company and the Bank are subject to various regulatory capital requirements administered by the federal banking agencies. Failure to meet minimum capital requirements can initiate certain mandatory actions by regulators that could have a direct material effect on the Company’s Consolidated Financial Statements. Under capital adequacy guidelines and/or the regulatory framework for prompt corrective action (applies to the Bank only), both the Company and the Bank must meet specific capital guidelines that involve quantitative measures of assets, liabilities, and certain off-balance sheet items calculated pursuant to regulatory directives. Capital amounts and classification are also subject to qualitative judgments by the regulators about components, risk weightings, and other factors.
Quantitative measures established by Basel III to ensure capital adequacy require the Company and the Bank to maintain minimum ratios of CET1 Risk-Based Capital, Tier 1 Risk-Based Capital, Total Risk-Based Capital, and Tier 1 Leverage Capital, as defined in the regulations.
The following table presents the minimum ratios required as of December 31, 2024, and 2023: | | | | | | | | | | | | | | |
| | Adequately Capitalized | | Well Capitalized |
| CET1 Risk-Based Capital | | 4.5 | % | | 6.5 | % |
| Tier 1 Risk-Based Capital | | 6.0 | | | 8.0 | |
| Total Risk-Based Capital | | 8.0 | | | 10.0 | |
| Tier 1 Leverage Capital | | 4.0 | | | 5.0 | |
At December 31, 2024, and 2023, both the Company and the Bank were classified as “well-capitalized.” Management believes that no events or changes have occurred subsequent to year-end and through the date of this Annual Report on Form 10-K that would change this designation.
The Company’s and the Bank’s capital ratios, which exceeded minimum regulatory requirements, were as follows: | | | | | | | | | | | | | | | | | | | | | | | | | | |
| | At December 31, |
| | 2024 (2) | | 2023 (2) |
| (In thousands) | | Capital/Assets | | Ratio | | Capital/Assets | | Ratio |
| Webster Financial Corporation | | | | | | | | |
| CET1 Risk-Based Capital | | $ | 6,318,876 | | | 11.54 | % | | $ | 6,188,433 | | | 11.11 | % |
| Tier 1 Risk-Based Capital | | 6,602,855 | | | 12.06 | | | 6,472,412 | | | 11.62 | % |
| Total Risk-Based Capital | | 7,800,717 | | | 14.24 | | | 7,643,423 | | | 13.72 | % |
| Tier 1 Leverage Capital | | 6,602,855 | | | 8.70 | | | 6,472,412 | | | 9.06 | % |
Risk-weighted assets (1) | | 54,767,609 | | | | | 55,715,341 | | | |
| Webster Bank | | | | | | | | |
| CET1 Risk-Based Capital | | $ | 6,847,474 | | | 12.53 | % | | $ | 6,913,443 | | | 12.43 | % |
| Tier 1 Risk-Based Capital | | 6,847,474 | | | 12.53 | | | 6,913,443 | | | 12.43 | % |
| Total Risk-Based Capital | | 7,512,143 | | | 13.74 | | | 7,494,332 | | | 13.47 | % |
| Tier 1 Leverage Capital | | 6,847,474 | | | 9.04 | | | 6,913,443 | | | 9.69 | % |
Risk-weighted assets (1) | | 54,667,360 | | | | | 55,618,551 | | | |
(1)During the third quarter of 2024, the Company performed a risk-weighted asset optimization analysis of certain of its loan portfolios and off-balance sheet commitments to determine eligibility for reduced risk-weighting. As a result of this analysis, both the Company and the Bank experienced a reduction in risk-weighted assets which, in turn, resulted in increases to their CET1 Risk-Based Capital, Tier 1 Risk-Based Capital, and Total Risk-Based Capital ratios.
(2)In accordance with regulatory capital rules, the Company elected to delay the estimated impact of the adoption of CECL on its regulatory capital over a two-year deferral period, which ended on January 1, 2022, and a subsequent three-year transition period, which ended on December 31, 2024. During the three-year transition period, regulatory capital ratios phased out the aggregate amount of the regulatory capital benefit provided from the delayed CECL adoption in the initial two years. For 2023 and 2024, the Company was allowed 50% and 25%, respectively, of the regulatory capital benefit as of December 31, 2021, with full absorption occurring in 2025.
Additional information regarding the required regulatory capital levels and ratios applicable to the Company and the Bank can be found within Note 14: Regulatory Capital and Restrictions in the Notes to Consolidated Financial Statements contained in Part II - Item 8. Financial Statements and Supplementary Data.
Sources and Uses of Funds
Sources of Funds. Deposits are the primary source of cash flows for the Bank’s lending activities and general operational needs. Loan and securities repayments, proceeds from sales of loans and securities held for sale, and maturities also provide cash flows. While scheduled loan and securities repayments are a relatively stable source of funds, prepayments and other deposit inflows are influenced by economic conditions and prevailing interest rates, the timing of which are inherently uncertain. Additional sources of funds are provided by both short-term and long-term borrowings, and to a lesser extent, dividends received as part of the Bank’s membership with the FHLB and FRB.
Deposits. The Bank offers a wide variety of checking and savings deposit products designed to meet the transactional and investment needs of its consumer and business customers. The Bank’s deposit services include, but are not limited to, ATM and debit card use, direct deposit, ACH payments, mobile banking, internet-based banking, banking by mail, account transfers, and overdraft protection, among others. The Bank manages the flow of funds in its deposit accounts and interest rates consistent with FDIC regulations. The Bank’s Consumer and Digital Pricing Committee and its Commercial and Institutional Liability and Loan Pricing Committee both meet regularly to determine pricing and marketing initiatives. In addition, the Bank may use brokered certificates of deposit as a funding source, which are managed based on established limits set by the ALCO.
Total deposits were $64.8 billion and $60.8 billion at December 31, 2024, and 2023, respectively. The $4.0 billion increase was primarily due an increase in interLINK money market sweep deposits, the addition of Ametros, a discrete transfer of cash associated with HSA accounts that were previously held by former investment partners, and balance growth in all customer- facing interest-bearing deposit products. Offsetting these increases was a decrease in brokered certificates of deposit due to wholesale funding mix. Throughout 2024, customers continued to shift their deposit preferences from non-interest-bearing demand to higher yielding deposit products, particularly money markets and certificates of deposit.
The following table summarizes daily average balances of deposits by type and the weighted-average rates paid thereon: | | | | | | | | | | | | | | | | | | | | | | | | | | |
| Years ended December 31, |
| 2024 | | 2023 | | 2022 |
| (In thousands) | Average
Balance | Average Rate | | Average
Balance | Average Rate | | Average
Balance | Average Rate |
| Non-interest-bearing: | | | | | | | | |
| Demand | $ | 10,387,807 | | — | % | | $ | 11,596,949 | | — | % | | $ | 12,912,894 | | — | % |
| Interest-bearing: | | | | | | | | |
| Checking | 9,555,367 | | 1.89 | | | 8,845,284 | | 1.48 | | | 8,842,792 | | 0.34 | |
| Health savings accounts | 8,650,485 | | 0.15 | | | 8,249,332 | | 0.15 | | | 7,826,576 | | 0.08 | |
| Money market | 19,354,659 | | 4.05 | | | 15,769,533 | | 3.61 | | | 10,797,645 | | 0.66 | |
| Savings | 6,879,935 | | 1.54 | | | 7,259,640 | | 0.78 | | | 8,625,691 | | 0.16 | |
| Certificates of deposit | 5,896,230 | | 4.30 | | | 4,534,008 | | 3.34 | | | 2,519,417 | | 0.27 | |
| Brokered certificates of deposit | 1,701,382 | | 5.25 | | | 1,997,602 | | 5.07 | | | 319,085 | | 3.24 | |
| Total interest-bearing | 52,038,058 | | 2.74 | | | 46,655,399 | | 2.19 | | | 38,931,206 | | 0.36 | |
| Total average deposits | $ | 62,425,865 | | 2.29 | % | | $ | 58,252,348 | | 1.75 | % | | $ | 51,844,100 | | 0.27 | % |
Uninsured deposits represent the portion of deposit accounts in U.S. offices that exceed the FDIC insurance limit or similar state deposit insurance regime, and amounts in any other uninsured investment or deposit accounts that are classified as deposits and not subject to any federal or state deposit insurance regimes. The Company calculates its uninsured deposit balances based on the methodologies and assumptions used for regulatory reporting requirements, which includes an estimated portion and affiliate deposits. At December 31, 2024, and 2023, total uninsured deposits as per regulatory reporting requirements and reported on Schedule RC-O of the Bank’s Call Report were $22.6 billion and $21.0 billion, respectively.
The following table summarizes additional uninsured deposits information after certain exclusions: | | | | | | | | | |
| (In thousands) | At December 31, 2024 | | | | |
| Uninsured deposits, per regulatory reporting requirements | $ | 22,553,081 | | | | | |
| Less: Affiliate deposits | (3,992,862) | | | | | |
| Collateralized deposits | (4,578,438) | | | | | |
| Uninsured deposits, after exclusions | $ | 13,981,781 | | | | | |
| | | | | |
Immediately available liquidity (1) | $ | 23,606,741 | | | | | |
| Uninsured deposits coverage | 168.8 | % | | | | |
(1)Reflects $8.7 billion and $13.3 billion of additional borrowing capacity from the FHLB and the FRB, respectively, and $1.7 billion of interest-bearing deposits held at the FRB.
Uninsured deposits, after adjusting for affiliate deposits and collateralized deposits, represented 21.6% of total deposits at December 31, 2024. Management believes that this presentation provides a more accurate view of deposits at risk given that affiliate deposits are not customer-facing, and therefore are eliminated upon consolidation, and collateralized deposits are secured by other means. As of the date of this Annual Report on Form 10-K, the Company’s uninsured deposits as a percentage of total deposits, adjusted for affiliate deposits and collateralized deposits, is consistent with the percentage reported at December 31, 2024.
The following table summarizes the portion of U.S. time deposits in excess of the FDIC insurance limit and time deposits otherwise uninsured by contractual maturity: | | | | | |
| (In thousands) | At December 31, 2024 |
| Portion of U.S. time deposits in excess of insurance limit | $ | 536,327 |
| Time deposits otherwise uninsured with a maturity of: | |
| 3 months or less | $ | 326,291 |
| Over 3 months through 6 months | 195,162 |
| Over 6 months through 12 months | 14,009 |
| Over 12 months | 865 |
Additional information regarding period-end deposit balances and rates can be found within Note 10: Deposits in the Notes to Consolidated Financial Statements contained in Part II - Item 8. Financial Statements and Supplementary Data.
Borrowings. The Bank’s primary borrowing sources include securities sold under agreements to repurchase, federal funds purchased, FHLB advances, and long-term debt. Total borrowings were $3.4 billion and $3.9 billion at December 31, 2024, and 2023, respectively, and represented 4.3% and 5.2% of total assets, respectively. The $0.5 billion decrease is primarily due to decreases of $0.3 billion, $0.1 billion, and $0.1 billion in FHLB advances, long-term debt, and federal funds purchased, respectively.
Securities sold under agreements to repurchase are generally a form of short-term funding for the Bank in which it sells securities to counterparties with an agreement to buy them back in the future at a fixed price. Securities sold under agreements to repurchase remained relatively flat at $0.3 billion at both December 31, 2024, and 2023, respectively.
The Bank may also purchase term and overnight federal funds to meet its short-term liquidity needs. Due to a change in short-term funding mix, there were no federal funds purchased at December 31, 2024. Federal funds purchased totaled $100.0 million at December 31, 2023.
FHLB advances are not only utilized as a source of funding, but also for interest rate risk management purposes. FHLB advances totaled $2.1 billion and $2.4 billion at December 31, 2024, and 2023, respectively. The $0.3 billion decrease is primarily due to a change in short-term funding mix.
Long-term debt consists of senior notes maturing in 2029, subordinated notes maturing in 2029 and 2030, and junior subordinated notes maturing in 2033. Long-term debt totaled $909.2 million, and $1.0 billion, at December 31, 2024, and 2023, respectively. The $139.6 million decrease is primarily due to the maturity of its 4.375% senior notes in February 2024.
The Bank had additional borrowing capacity from the FHLB of $8.7 billion and $12.5 billion at December 31, 2024, and 2023, respectively. The Bank also had additional borrowing capacity from the FRB of $13.3 billion and $6.6 billion at December 31, 2024, and 2023, respectively. Unencumbered investment securities of $1.0 billion at December 31, 2024, could have been used for collateral on borrowings or to increase borrowing capacity by either $0.8 billion with the FHLB or $0.9 billion with the FRB.
The following table summarizes daily average balances of borrowings by type and the weighted-average rates paid thereon: | | | | | | | | | | | | | | | | | | | | | | | | | | |
| Years ended December 31, |
| 2024 | | 2023 | | 2022 |
| (In thousands) | Average Balance | Average Rate | | Average Balance | Average Rate | | Average Balance | Average Rate |
| Securities sold under agreements to repurchase | $ | 142,025 | | 0.77 | % | | $ | 210,676 | | 0.58 | % | | $ | 466,282 | | 0.78 | % |
| Federal funds purchased | 54,303 | | 5.55 | | | 167,495 | | 4.70 | | | 598,269 | | 2.58 | |
| | | | | | | | |
| FHLB advances | 2,296,048 | | 5.46 | | | 4,275,394 | | 5.21 | | | 1,965,577 | | 2.98 | |
| Long-term debt | 903,603 | | 3.57 | | | 1,027,869 | | 3.69 | | | 995,341 | | 3.44 | |
| Total average borrowings | $ | 3,395,979 | | 4.76 | % | | $ | 5,681,434 | | 4.74 | % | | $ | 4,025,469 | | 2.78 | % |
Additional information regarding period-end borrowings balances and rates can be found within Note 11: Borrowings in the Notes to Consolidated Financial Statements contained in Part II - Item 8. Financial Statements and Supplementary Data.
Federal Home Loan Bank and Federal Reserve Bank Stock. The Bank is a member of the FHLB System, which consists of 11 district FHLBs, each of which is subject to the supervision and regulation of the Federal Housing Finance Agency. An activity-based capital stock investment in the FHLB is required in order for the Bank to maintain its membership and access advances and other extensions of credit for sources of funds and liquidity purposes. The FHLB capital stock investment is restricted as there is no market for it, and it can only be redeemed by the FHLB. The Bank held FHLB capital stock of $91.7 million and $99.0 million at December 31, 2024, and 2023, respectively. During the year ended December 31, 2024, the Bank received $8.7 million in dividends from the FHLB. The most recent FHLB quarterly cash dividend in 2024 was paid on November 4, 2024, in an amount equal to an annual yield of 8.36%.
The Bank is also required to hold FRB stock equal to 6% of its capital and surplus, of which 50% is paid. The remaining 50% is subject to call when deemed necessary by the Federal Reserve System. Similar to FHLB stock, the FRB capital stock investment is restricted as there is no market for it, and it can only be redeemed by the FRB. The Bank held FRB capital stock of $229.6 million and $227.9 million at December 31, 2024, and 2023, respectively. During the year ended December 31, 2024, the Bank received $9.9 million in dividends from the FRB. The most recent FRB semi-annual cash dividend in 2024 was paid on December 31, 2024, in an amount equal to an annual yield of 4.24%.
Uses of Funds. The Company enters into various contractual obligations in the normal course of business that require future cash payments and that could impact its short-term and long-term liquidity and capital resource needs. The following table summarizes significant fixed and determinable contractual obligations at December 31, 2024. The actual timing and amounts of future cash payments may differ from the amounts presented. Based on the Company’s current liquidity position, it is expected that our sources of funds will be sufficient to fulfill these obligations when they come due.
| | | | | | | | | | | | | | | | | | | | | | | |
| Payments Due by Period (1) | |
| (In thousands) | 2025 | 2026 | 2027 | 2028 | 2029 | Thereafter | Total |
| Senior notes | $ | — | | $ | — | | $ | — | | $ | — | | $ | 300,000 | | $ | — | | $ | 300,000 | |
| Subordinated notes | — | | — | | — | | — | | 274,000 | | 225,000 | | 499,000 | |
| Junior subordinated debt | — | | — | | — | | — | | — | | 77,320 | | 77,320 | |
| FHLB advances | 2,100,000 | | — | | 218 | | 215 | | 642 | | 9,033 | | 2,110,108 | |
| Securities sold under agreements to repurchase | 344,168 | | — | | — | | — | | — | | — | | 344,168 | |
| | | | | | | |
| Time deposits | 8,091,695 | | 72,078 | | 32,656 | | 18,766 | | 19,759 | | — | | 8,234,954 | |
| Operating lease liabilities | 33,221 | | 36,103 | | 31,516 | | 27,780 | | 23,408 | | 64,338 | | 216,366 | |
| Contingent consideration | 12,707 | | — | | — | | — | | — | | — | | 12,707 | |
| Royalty liabilities | 1,000 | | 1,000 | | 1,000 | | 1,000 | | 1,000 | | 5,064 | | 10,064 | |
Purchase obligations (2) | 102,998 | | 46,551 | | 20,930 | | 10,361 | | 19,458 | | 10,522 | | 210,820 | |
| Total contractual obligations | $ | 10,685,789 | | $ | 155,732 | | $ | 86,320 | | $ | 58,122 | | $ | 638,267 | | $ | 391,277 | | $ | 12,015,507 | |
(1)Interest payments on borrowings have been excluded.
(2)Purchase obligations represent agreements to purchase goods or services of $1.0 million or more that are enforceable and legally binding and specify all significant terms.
In addition, in the normal course of business, the Company offers financial instruments with off-balance sheet risk to meet the financing needs of its customers. These transactions include commitments to extend credit and commercial and standby letters of credit, which involve, to a varying degree, elements of credit risk. Since many of these commitments are expected to expire unused or be only partially funded, the total commitment amount of $12.2 billion at December 31, 2024, does not necessarily reflect future cash payments.
The Company also enters into commitments to invest in venture capital and private equity funds and tax credit structures to assist the Bank in meeting its responsibilities under the CRA. The total unfunded commitment for these alternative investments was $837.2 million at December 31, 2024. However, the timing of capital calls cannot be reasonably estimated, and depending on the nature of the contract, the entirety of the capital committed by the Company may not be called.
Pension obligations are funded by the Company, as needed, to provide for participant benefit payments as it relates to the Company’s frozen, non-contributory, qualified defined benefit pension plan. Decisions to contribute to the defined benefit pension plan are made based upon pension funding requirements under the Pension Protection Act, the maximum amount deductible under the Internal Revenue Code, the actual performance of plan assets, and trends in the regulatory environment. The Company was not required to contribute to the defined benefit pension plan in 2024, nor does it currently anticipate that it will be required to contribute in 2025. The Company’s non-qualified supplemental executive retirement plans and other post-employment benefit plans are unfunded. Expected future net benefit payments related to the Company’s defined benefit pension and other postretirement benefit plans include $12.8 million in less than one year, $26.6 million in one to three years, $28.0 million in three to five years, and $71.7 million after five years.
At December 31, 2024, the Company’s Consolidated Balance Sheet reflects a liability for uncertain tax positions of $13.8 million and $6.9 million of accrued interest and penalties, respectively. The ultimate timing and amount of any related future cash settlements cannot be predicted with reasonable certainty.
On November 29, 2023, the FDIC published a final rule implementing a special assessment for certain banks to recover losses incurred by protecting uninsured depositors of Silicon Valley Bank and Signature Bank upon their failure in March 2023. At December 31, 2024, the Company’s remaining accrual for its estimated special assessment charge was $39.8 million, which is anticipated to be collected over a remainder of seven quarterly assessment periods. The FDIC retains the right to cease collection early, extend the special assessment collection period, and impose shortfall special assessments if actual losses exceed the amounts collected. The Company continues to monitor the estimated loss attributable to the protection of uninsured depositors at Silicon Valley Bank and Signature Bank, which could impact the amount of its accrued liability.
In connection with the completion of a multi-family securitization during the third quarter of 2024, the Company assumed an obligation to reimburse, or guarantee, losses incurred by the multi-family securitization trusts of up to 12% of the aggregate UPB of the loans at the time of sale. Essentially, this obligation represents a first credit loss enhancement provided by the Company. Based on the credit quality of the multi-family loans, among other factors, the Company estimated the amount of its reimbursement obligation to be $3.3 million at December 31, 2024. The Company was not required to make any guarantee payments to Freddie Mac during the fourth quarter of 2024. However, in the event that value of the assets in the multi-family securitization trusts significantly declined, the Company’s maximum exposure to loss could be $36.4 million.
Additional information regarding credit-related financial instruments and the FDIC special assessment, alternative investments, the multi-family securitization, defined benefit pension and other postretirement benefit plans, and income taxes can be found within Note 23: Commitments and Contingencies, Note 15: Variable Interest Entities, Note 5: Transfers and Servicing of Financial Assets, Note 19: Retirement Benefit Plans, and Note 9: Income Taxes, respectively, in the Notes to Consolidated Financial Statements contained in Part II - Item 8. Financial Statements and Supplementary Data.
Asset/Liability Management and Market Risk
An effective asset/liability management process must balance the risks and rewards from both short-term and long-term interest rate risk when determining the Company’s strategy and action. To facilitate this process, interest rate sensitivity is monitored on an ongoing basis by the Company’s ALCO, whose primary goal is to manage interest rate risk and maximize net income and net economic value over time in changing interest rate environments. Limits for earnings at risk are set for parallel ramps in interest rates over a twelve-month period of up and down 100, 200, and 300 basis points, and for interest rate curve twist shocks of up and down 50 and 100 basis points. Limits for net economic value, referred to as equity at risk, are set for parallel shocks in interest rates of up and down 100, 200, and 300 basis points. The ALCO also regularly reviews earnings at risk scenarios for non-parallel changes in interest rates, as well as longer-term earnings at risk for up to four years in the future.
Management measures interest rate risk using simulation analysis and asset/liability modeling software to calculate the Company’s earnings at risk and equity at risk. Key assumptions relate to the behavior of interest rates and spreads, prepayment speeds, and the run-off of deposits. From these simulations, interest rate risk is quantified, and appropriate strategies are formulated and implemented. The model includes projections of future loan and deposit volume, pricing of each of the products, and deposit beta assumptions, among others. During the third quarter of 2024, other key model assumptions related to loan prepayment speeds, deposit beta, and average lives were updated based on the most recent studies. While these updates partially contributed to a change in asset/liability sensitivities, the overall impact to net interest income was not material.
Deposit beta is defined as the change in deposit rate for interest-bearing and non-interest-bearing deposits due to changes in market rates (increase or decrease). The model assumes a deposit beta by each product. The deposit beta for each product is a function of prior rate cycle, prior deposit beta, current rate cycle expectation, level of competition, and line of business input.
Earnings at risk is defined as the change in net interest income due to changes in interest rates. Essentially, interest rates are assumed to change up or down in a parallel fashion, and the net interest income results in each scenario are compared to a flat rate base scenario. The flat rate base scenario holds the end of period yield curve constant over a twelve-month forecast horizon. The earnings at risk simulation analysis incorporates assumptions about balance sheet changes (i.e., product mix, growth, and loan and deposit pricing). Overall, it is a measure of short-term interest rate risk. At December 31, 2024, and 2023, the flat rate base scenario assumed a federal funds rate of 4.50% and 5.50%, respectively. The federal funds rate target range was 4.25-4.50% at December 31, 2024, and 5.25-5.50% at December 31, 2023.
Equity at risk is defined as the change in the net economic value of financial assets and financial liabilities due to changes in interest rates compared to a base net economic value. Equity at risk analyzes sensitivity in the present value of cash flows over the expected life of existing financial assets, financial liabilities, and off-balance sheet financial instruments. It is a measure of the long-term interest rate risk to future earnings’ streams embedded in the current balance sheet.
The Bank regularly evaluates rate exposure over long-term using equity at risk. The Bank deploys various techniques to a yield curve shocks, static balance sheet, basis risks, and options risks. The level of uncertainty around key assumption increases with time, which may limit its effectiveness.
Asset sensitivity is defined as earnings or net economic value increasing when interest rates rise and decreasing when interest rates fall, as compared to a base scenario. In other words, financial assets are more sensitive to changing interest rates than liabilities, and therefore, re-price faster. Likewise, liability sensitivity is defined as earnings or net economic value decreasing when interest rates rise and increasing when interest rates fall, as compared to a base scenario.
Key assumptions underlying the present value of cash flows include the behavior of interest rates and spreads, asset prepayment speeds, and attrition rates on deposits. Cash flow projections from the model are compared to market expectations for similar collateral types and adjusted based on experience with the Bank’s own portfolio. The model’s valuation results are compared to observable market prices for similar instruments whenever possible. The behavior of deposit and loan customers is studied using historical time series analysis to model future customer behavior under varying interest rate environments.
The equity at risk simulation process uses multiple interest rate paths generated by an arbitrage-free trinomial lattice term structure model. The base case rate scenario, against which all others are compared, currently uses the month-end SOFR/swap yield curve as a starting point to derive forward rates for future months. Using interest rate swap option volatilities as inputs, the model creates multiple rate paths for this scenario with forward rates as the mean. In shock scenarios, the starting yield curve is shocked up or down in a parallel fashion. Future rate paths are then constructed in a similar manner to the base case scenario.
Cash flows for all financial instruments are generated using product specific prepayment models and account specific system data for properties such as maturity date, amortization type, coupon rate, repricing frequency, and repricing date. The asset/liability simulation software is enhanced with a mortgage prepayment model and a collateralized mortgage obligation database. Financial instruments with explicit options (i.e., caps, floors, puts, and calls) and implicit options (i.e., prepayment and early withdrawal abilities) require such modeling approach to quantify value and risk more accurately.
On the asset side, risk is impacted the most by residential mortgage loans and mortgage-backed securities, which can typically prepay at any time without penalty and may have embedded caps and floors. In the loan portfolio, floors are a benefit to interest income in low interest rate environments. Floating-rate loans at floors pay a higher interest rate than a loan at a fully indexed rate without a floor, as with a floor, there is a limit on how low the interest rate can fall. As market rates rise, however, the interest rate paid on these loans does not rise until the fully indexed rate rises through the contractual floor.
On the liability side, there is a large concentration of customers with indeterminate maturity deposits who have options to add or withdraw funds from their accounts at any time. Implicit floors on deposits, based on historical data, are modeled. The Bank also has the option to change the interest rate paid on these deposits at any time.
Four main tools are used for managing interest rate risk:
•the size, duration, and credit risk of the investment portfolio;
•the size and duration of the wholesale funding portfolio;
•interest rate contracts; and
•the pricing and structure of loans and deposits.
The ALCO meets frequently to make decisions on the investment and funding portfolios based on the economic outlook, its interest rate expectations, the risk position, and other factors. The ALCO delegates pricing and product design responsibilities to individuals and sub-committees, but continuously monitors and influences their actions on a regular basis.
Various interest rate contracts, including futures, options, swaps, caps, and floors, can be used to manage interest rate risk. These contracts involve, to varying degrees, levels of credit and interest rate risk. The notional amount of the derivative instrument, or the amount from which interest and other payments are derived, is not exchanged, and therefore, should not be used as a measure of credit risk.
In addition, certain derivative instruments are used by the Bank to manage the risk of loss associated with its mortgage banking activities. Generally, prior to closing and funds disbursement, an interest-rate lock commitment is extended to the borrower. During this time, the Bank is subject to the risk that market interest rates may change, which could impact pricing on loan sales. In an effort to mitigate this risk, the Bank establishes forward delivery sales commitments, thereby setting the sales price.
The Company will also hold futures, options, and forward foreign currency exchange contracts to minimize the price volatility of certain financial assets and financial liabilities. Changes in the market value of these derivative positions are recognized in earnings. Additional information regarding derivatives can be found within Note 17: Derivative Financial Instruments in the Notes to Consolidated Financial Statements contained in Part II - Item 8. Financial Statements and Supplementary Data.
The following table summarizes the estimated impact that gradual parallel changes in interest rates of up and down 100, 200, and 300 basis points might have on the Company’s net interest income over a twelve-month period starting at December 31, 2024, and 2023, as compared to actual net interest income and assuming no changes in interest rates:
| | | | | | | | | | | | | | | | | | | | |
| -300bp | -200bp | -100bp | +100bp | +200bp | +300bp |
| December 31, 2024 | (1.6)% | (0.6)% | —% | 0.4% | 0.6% | 0.8% |
| December 31, 2023 | (7.2)% | (4.5)% | (2.0)% | 1.7% | 3.3% | 5.4% |
Asset sensitivity in terms of net interest income decreased at December 31, 2024, as compared to at December 31, 2023, primarily due to changes in the overall balance sheet composition, which included an increase in fixed-rate investment securities as a result of securities repositioning in 2024, an increase in fixed-rate residential loans, and an increase in higher cost deposit products, such as interLINK money market sweep deposits, certificates of deposit, and online savings, partially offset by a decrease in demand deposit accounts.
The following table summarizes the estimated impact that yield curve twists or immediate non-parallel changes in interest rates of up and down 50 and 100 basis points might have on the Company’s net interest income for the subsequent twelve-month period starting at December 31, 2024, and 2023:
| | | | | | | | | | | | | | | | | | | | | | | | | | | | | |
| Short End of the Yield Curve | | Long End of the Yield Curve |
| -100bp | -50bp | +50bp | +100bp | | -100bp | -50bp | +50bp | +100bp |
| December 31, 2024 | 2.1% | 1.0% | (0.7)% | (1.6)% | | (2.2)% | (1.0)% | 1.0% | 1.9% |
| December 31, 2023 | (1.8)% | (0.8)% | 0.4% | 0.7% | | (2.3)% | (1.1)% | 1.1% | 2.2% |
These non-parallel scenarios are modeled with the short end of the yield curve moving up or down 50 and 100 basis points, while the long end of the yield curve remains unchanged, and vice versa. The short end of the yield curve is defined as terms less than eighteen months, and the long end of the yield curve is defined as terms greater than eighteen months. The results reflect the annualized impact of immediate interest rate changes.
Sensitivity to the short end of the yield curve for net interest income changed from being asset sensitive to liability sensitive at December 31, 2024, as compared to December 31, 2023, primarily due to a change in deposit mix. As discussed above, in 2024, the Company experienced an increase in higher cost deposit products, such as interLINK money market sweep deposits, certificates of deposit, and online savings. In addition, the Company’s 2024 securities repositioning resulted in an increase in fixed-rate investment securities, further contributing to decreased asset sensitivity at the short end of the yield curve. Sensitivity to the long end of the yield curve generally remained unchanged from December 31, 2023, to December 31, 2024.
The following table summarizes the estimated economic value of financial assets, financial liabilities, and off-balance sheet financial instruments and the corresponding estimated change in economic value if interest rates were to instantaneously increase or decrease by 100 basis points at December 31, 2024, and 2023:
| | | | | | | | | | | | | | |
| Book
Value | Estimated
Economic
Value | Estimated Economic Value Change |
| |
| (In thousands) | -100bp | +100bp |
| At December 31, 2024 | | | | |
| Assets | $ | 79,025,073 | $ | 73,921,262 | $ | 2,180,555 | | $ | (2,223,719) | |
| Liabilities | 69,891,859 | 60,952,551 | 2,089,770 | | (1,813,843) | |
| Net | $ | 9,133,214 | $ | 12,968,711 | $ | 90,785 | | $ | (409,876) | |
| Net change as % base net economic value | | | 0.7 | % | (3.2) | % |
| | | | |
| At December 31, 2023 | | | | |
| Assets | $ | 74,945,249 | $ | 70,356,779 | $ | 1,297,870 | $ | (1,350,496) | |
| Liabilities | 66,255,253 | 61,722,480 | 1,960,088 | (1,786,228) | |
| Net | $ | 8,689,996 | $ | 8,634,299 | $ | (662,218) | $ | 435,732 | |
| Net change as % base net economic value | | | (7.7)% | 5.0 | % |
Changes in economic value can best be described through duration, which is a measure of the price sensitivity of financial instruments due to changes in interest rates. For fixed-rate financial instruments, it can be thought of as the weighted-average expected time to receive future cash flows, whereas for floating-rate financial instruments, it can be thought of as the weighted-average expected time until the next rate reset. Overall, the longer the duration, the greater the price sensitivity due to changes in interest rates. Generally, increases in interest rates reduce the economic value of fixed-rate financial assets as future discounted cash flows are worth less at higher interest rates. In a rising interest rate environment, the economic value of financial liabilities decreases for the same reason. A reduction in the economic value of financial liabilities is a benefit to the Company. Floating-rate financial instruments may have durations as short as one day, and therefore, may have very little price sensitivity due to changes in interest rates.
Duration gap represents the difference between the duration of financial assets and financial liabilities. A duration gap at or near zero would imply that the balance sheet is matched, and therefore, would exhibit no change in estimated economic value for changes in interest rates. At December 31, 2024, and 2023, the Company’s duration gap was 0.0 years and negative 1.1 years, respectively. A negative duration gap implies that the duration of financial liabilities is longer than the duration of financial assets, and therefore, liabilities have more price sensitivity than assets and will reset their interest rates at a slower pace. Consequently, the Company’s net estimated economic value would generally be expected to increase when interest rates rise, as the benefit of the decreased value of financial liabilities would more than offset the decreased value of financial assets. The opposite would generally be expected to occur when interest rates fall. Earnings would also generally be expected to increase when interest rates rise, and decrease when interest rates fall over the long-term, absent the effects of any new business booked in the future.
These earnings and net economic value estimates are subject to factors that could cause actual results to differ, and also assume that management does not take any additional action to mitigate any positive or negative effects from changing interest rates. Management believes that the Company’s interest rate risk position at December 31, 2024, represents a reasonable level of risk given the current interest rate outlook. Management continues to monitor interest rates and other relevant factors given recent market volatility and is prepared to take additional action, as necessary.
Critical Accounting Estimates
The preparation of the Company’s Consolidated Financial Statements, and accompanying notes thereto, in accordance with GAAP and practices generally applicable to the financial services industry, requires management to make estimates and assumptions that affect the reported amounts of assets, liabilities, revenues, expenses, and the disclosure of contingent assets and liabilities. While management’s estimates are made based on historical experience, current available information, and other factors that are deemed to be relevant, actual results could significantly differ from those estimates.
Accounting estimates are necessary in the application of certain accounting policies and can be susceptible to significant change in the near term. Critical accounting estimates are those estimates made in accordance with GAAP that involve a significant level of estimation uncertainty and have had, or are reasonably likely to have, a material impact on the Company’s financial condition or results of operations. Management has identified that the Company’s most critical accounting estimates are those related to the ACL on loans and leases and business combinations accounting policies. These accounting policies and their underlying estimates are discussed directly with the Audit Committee of the Board of Directors.
Allowance for Credit Losses on Loans and Leases
The ACL on loans and leases is a reserve established through a provision for credit losses charged to expense, which represents management’s best estimate of expected lifetime credit losses within the Company’s loan and lease portfolios at the balance sheet date. The calculation of expected credit losses is determined using predictive methods and models that follow a PD, LGD, EAD, or loss rate framework, and include consideration of past events, current conditions, macroeconomic variables (i.e., unemployment, gross domestic product, property values, and interest rate spreads), and reasonable and supportable economic forecasts that affect the collectability of the reported amounts. Changes to the ACL on loans and leases, and therefore, to the related provision for credit losses, can materially affect financial results.
The determination of the appropriate level of ACL on loans and leases inherently involves a high degree of subjectivity and requires the Company to make significant estimates of current credit risks and trends using existing qualitative and quantitative information, and reasonable and supportable forecasts of future economic conditions, all of which may undergo frequent and material changes. Changes in economic conditions affecting borrowers and macroeconomic variables that the Company is more susceptible to, unforeseen events such as natural disasters and pandemics, along with new information regarding existing loans, identification of additional problem loans, the fair value of underlying collateral, and other factors, both within and outside the Company’s control, may indicate the need for an increase or decrease in the ACL on loans and leases.
It is difficult to estimate the sensitivity of how potential changes in any one economic factor or input might affect the overall reserve because a wide variety of factors and inputs are considered in estimating the ACL and changes in those factors and inputs considered may not occur at the same rate and may not be consistent across all product types. Further, changes in factors and inputs may also be directionally inconsistent, such that improvement in one factor may offset deterioration in others.
Executive management reviews and advises on the adequacy of the ACL on loans and leases on a quarterly basis. Although the overall balance is determined based on specific portfolio segments and individually assessed assets, the entire balance is available to absorb credit losses for any of the loan and lease portfolios.
Additional information regarding the determination of the ACL on loans and leases, including the Company’s valuation methodology, can be found in Part II under the section captioned “Allowance for Credit Losses on Loans and Leases” contained elsewhere in this Item 7. Management’s Discussion and Analysis of Financial Condition and Results of Operations, and within Note 1: Summary of Significant Accounting Policies in the Notes to Consolidated Financial Statements contained in Item 8. Financial Statements and Supplementary Data.
Business Combinations
The acquisition method of accounting generally requires that the identifiable assets acquired and liabilities assumed in business combinations are recorded at fair value as of the acquisition date. The determination of fair value often involves the use of internal or third-party valuation techniques, such as discounted cash flow analyses. Particularly, the valuation techniques used to estimate the fair value of the core deposit intangible asset acquired in the Ametros acquisition included estimates related to discount rates, client attrition rates, an alternative cost of funds, and other relevant factors, which are inherently subjective. A description of the valuation methodologies used to estimate the fair values of the significant assets acquired and liabilities assumed in the Ametros acquisition can be found within Note 2: Acquisitions and Joint Ventures in the Notes to Consolidated Financial Statements contained in Part II - Item 8. Financial Statements and Supplementary Data.
ITEM 7A. QUANTITATIVE AND QUALITATIVE DISCLOSURES ABOUT MARKET RISK
Information regarding quantitative and qualitative disclosures about market risk can be found in Part II under the section captioned “Asset/Liability Management and Market Risk” contained in Item 7. Management’s Discussion and Analysis of Financial Condition and Results of Operations, and within Note 17: Derivative Financial Instruments in the Notes to Consolidated Financial Statements contained in Item 8. Financial Statements and Supplementary Data, which are incorporated herein by reference.
ITEM 8. FINANCIAL STATEMENTS AND SUPPLEMENTARY DATA
Index to Consolidated Financial Statements | | | | | |
| Page No. |
| Report of Independent Registered Public Accounting Firm | |
| Consolidated Balance Sheets | |
| Consolidated Statements of Income | |
| Consolidated Statements of Comprehensive Income | |
| Consolidated Statements of Stockholders’ Equity | |
| Consolidated Statements of Cash Flows | |
| Notes to Consolidated Financial Statements | |
Report of Independent Registered Public Accounting Firm
To the Stockholders and the Board of Directors
Webster Financial Corporation:
Opinion on the Consolidated Financial Statements
We have audited the accompanying consolidated balance sheets of Webster Financial Corporation and subsidiaries (the Company) as of December 31, 2024 and 2023, the related consolidated statements of income, comprehensive income, stockholders’ equity, and cash flows for each of the years in the three-year period ended December 31, 2024, and the related notes (collectively, the consolidated financial statements). In our opinion, the consolidated financial statements present fairly, in all material respects, the financial position of the Company as of December 31, 2024 and 2023, and the results of its operations and its cash flows for each of the years in the three-year period ended December 31, 2024, in conformity with U.S. generally accepted accounting principles.
We also have audited, in accordance with the standards of the Public Company Accounting Oversight Board (United States) (PCAOB), the Company’s internal control over financial reporting as of December 31, 2024, based on criteria established in Internal Control – Integrated Framework (2013) issued by the Committee of Sponsoring Organizations of the Treadway Commission, and our report dated March 3, 2025 expressed an unqualified opinion on the effectiveness of the Company’s internal control over financial reporting.
Basis for Opinion
These consolidated financial statements are the responsibility of the Company’s management. Our responsibility is to express an opinion on these consolidated financial statements based on our audits. We are a public accounting firm registered with the PCAOB and are required to be independent with respect to the Company in accordance with the U.S. federal securities laws and the applicable rules and regulations of the Securities and Exchange Commission and the PCAOB.
We conducted our audits in accordance with the standards of the PCAOB. Those standards require that we plan and perform the audit to obtain reasonable assurance about whether the consolidated financial statements are free of material misstatement, whether due to error or fraud. Our audits included performing procedures to assess the risks of material misstatement of the consolidated financial statements, whether due to error or fraud, and performing procedures that respond to those risks. Such procedures included examining, on a test basis, evidence regarding the amounts and disclosures in the consolidated financial statements. Our audits also included evaluating the accounting principles used and significant estimates made by management, as well as evaluating the overall presentation of the consolidated financial statements. We believe that our audits provide a reasonable basis for our opinion.
Critical Audit Matter
The critical audit matter communicated below is a matter arising from the current period audit of the consolidated financial statements that was communicated or required to be communicated to the audit committee and that: (1) relates to accounts or disclosures that are material to the consolidated financial statements and (2) involved our especially challenging, subjective, or complex judgments. The communication of a critical audit matter does not alter in any way our opinion on the consolidated financial statements, taken as a whole, and we are not, by communicating the critical audit matter below, providing a separate opinion on the critical audit matter or on the accounts or disclosures to which it relates.
Assessment of the allowance for credit losses for certain commercial loans and leases evaluated on a collective basis
As discussed in Notes 1 and 4 to the consolidated financial statements, the Company’s total allowance for credit losses as of December 31, 2024 was $689.6 million, a portion of which related to the allowance for credit losses for certain commercial loans and leases evaluated on a collective basis (the Commercial Allowance). The Commercial Allowance includes the measure of expected credit losses on a collective (pooled) basis for those loans and leases with similar risk characteristics. The Company’s collectively assessed loans and leases are segmented based on product type and credit quality and expected losses are determined using a model that follows a probability of default (PD), loss given default (LGD), and exposure at default (EAD) framework. The expected credit losses are calculated as the product of the Company’s estimate of PD, LGD, and individual loan level EAD. The Company’s PD and LGD calculations use a predictive model that measures the current risk profile of the loan pools using forecasts of future macroeconomic conditions, historical loss information, loan-level risk attributes and credit quality indicators. The Company’s model incorporates a single economic forecast scenario and macroeconomic variables over a reasonable and supportable forecast period. The development of the reasonable and supportable forecast assumes that each portfolio will revert to its long-term loss rate expectation. The reasonable and supportable forecast period is two years after which the reversion period is one year. The model uses output reversion and reverts to mean historical portfolio loss rates on a straight-line basis in the third year of the forecast. A portion of the Commercial Allowance is comprised of qualitative
adjustments for risk characteristics that are not reflected or captured in the quantitative model but are likely to impact the measurement of expected credit losses.
We identified the assessment of the Commercial Allowance as a critical audit matter. A high degree of audit effort, including specialized skills and knowledge, and subjective and complex auditor judgment was involved in the assessment due to significant measurement uncertainty. Specifically, the assessment encompassed the evaluation of the Commercial Allowance methodology, including the methods and model used to estimate (1) the PD, LGD, and EAD, and their significant assumptions, including the single economic forecast scenario and macroeconomic variables and (2) qualitative adjustments and their significant assumptions not reflected in the PD and LGD model and EAD method. The assessment also included an evaluation of the conceptual soundness and performance of the PD and LGD model and EAD method. In addition, auditor judgment was required to evaluate the sufficiency of audit evidence obtained.
The following are the primary procedures we performed to address this critical audit matter. We evaluated the design and tested the operating effectiveness of certain internal controls related to the Company’s measurement of the Commercial Allowance estimate, including controls over the:
•evaluation of the Commercial Allowance methodology;
•continued use and appropriateness of changes made to certain PD and LGD model and EAD method;
•identification and determination of the significant assumptions used in the PD and LGD model and EAD method;
•procedures performed by the Company to validate the model is fit for use and appropriate to estimate the lifetime loss;
•performance monitoring of PD and LGD model and EAD method;
•evaluation of qualitative adjustments, including the significant assumptions; and
•analysis of the Collective Allowance results, trends, and ratios.
We evaluated the Company’s process to develop the Commercial Allowance estimate by testing certain sources of data, factors, and assumptions that the Company used, and considered the relevance and reliability of such data, factors, and assumptions. In addition, we involved credit risk professionals with specialized skills and knowledge, who assisted in:
•evaluating the Company’s Commercial Allowance methodology for compliance with U.S. generally accepted accounting principles;
•evaluating judgments made by the Company relative to the assessment and performance testing of the PD and LGD model and EAD method by comparing them to relevant Company-specific metrics and trends and the applicable industry practices;
•assessing the conceptual soundness and performance of the PD and LGD model by inspecting the model documentation to determine whether the model is suitable for the intended use;
•evaluating the selection of the economic forecast scenario and underlying macroeconomic variables by comparing them to the Company’s business environment and relevant industry practices; and
•evaluating the methodology and assumptions used to develop the qualitative factors and the effect of those factors on the Commercial Allowance compared with credit trends and identified limitations of the underlying quantitative model.
We also assessed the sufficiency of the audit evidence obtained related to the Commercial Allowance estimate by evaluating the cumulative results of the audit procedures and potential bias in the accounting estimate.
/s/ KPMG LLP (185)
We have served as the Company’s auditor since 2013.
New York, New York
March 3, 2025
WEBSTER FINANCIAL CORPORATION AND SUBSIDIARIES
CONSOLIDATED BALANCE SHEETS | | | | | | | | | | | |
| December 31, |
| (In thousands, except share and par value data) | 2024 | | 2023 |
| Assets: | | | |
| Cash and due from banks | $ | 388,060 | | | $ | 429,323 | |
| Interest-bearing deposits | 1,686,374 | | | 1,286,472 | |
Investment securities available-for-sale, at fair value (1) | 9,006,600 | | | 8,959,729 | |
| | | |
| | | |
Investment securities held-to-maturity, net of allowance for credit losses of $171 and $209 (2) | 8,444,191 | | | 7,074,588 | |
Loans held for sale (3) | 27,634 | | | 6,541 | |
| Loans and leases | 52,505,168 | | | 50,726,052 | |
| Allowance for credit losses on loan and leases | (689,566) | | | (635,737) | |
| Loans and leases, net | 51,815,602 | | | 50,090,315 | |
| Federal Home Loan Bank and Federal Reserve Bank stock | 321,343 | | | 326,882 | |
| Deferred tax assets, net | 316,856 | | | 369,212 | |
| Premises and equipment, net | 406,963 | | | 429,561 | |
| Goodwill | 2,868,068 | | | 2,631,465 | |
| Other intangible assets, net | 334,301 | | | 203,135 | |
| Cash surrender value of life insurance policies | 1,251,622 | | | 1,247,938 | |
| Accrued interest receivable and other assets | 2,157,459 | | | 1,890,088 | |
| Total assets | $ | 79,025,073 | | | $ | 74,945,249 | |
| Liabilities and stockholders’ equity: | | | |
| Deposits: | | | |
| Non-interest-bearing | $ | 10,316,501 | | | $ | 10,732,516 | |
| Interest-bearing | 54,436,579 | | | 50,051,768 | |
| Total deposits | 64,753,080 | | | 60,784,284 | |
| Securities sold under agreements to repurchase and federal funds purchased | 344,168 | | | 458,387 | |
| Federal Home Loan Bank advances | 2,110,108 | | | 2,360,018 | |
| Long-term debt | 909,185 | | | 1,048,820 | |
| Accrued expenses and other liabilities | 1,775,318 | | | 1,603,744 | |
| Total liabilities | 69,891,859 | | | 66,255,253 | |
| Stockholders’ equity: | | | |
| Preferred stock, $0.01 par value: Authorized—3,000,000 shares; | | | |
| Series F issued and outstanding—6,000 shares | 145,037 | | | 145,037 | |
| Series G issued and outstanding—135,000 shares | 138,942 | | | 138,942 | |
| Common stock, $0.01 par value: Authorized—400,000,000 shares; | | | |
| Issued—182,778,045 shares; Outstanding—171,391,125 and 172,021,956 shares | 1,828 | | | 1,828 | |
| Paid-in capital | 6,181,475 | | | 6,179,753 | |
| Retained earnings | 3,759,158 | | | 3,282,530 | |
| Treasury stock, at cost—11,386,920 and 10,756,089 shares | (536,843) | | | (507,523) | |
| Accumulated other comprehensive (loss), net of tax | (556,383) | | | (550,571) | |
| Total stockholders’ equity | 9,133,214 | | | 8,689,996 | |
| Total liabilities and stockholders’ equity | $ | 79,025,073 | | | $ | 74,945,249 | |
(1)Investment securities available-for-sale had an amortized cost basis of $9,720,415 at December 31, 2024, and $9,668,422 at December 31, 2023.
(2)Investment securities held-to-maturity had a fair value of $7,453,123 at December 31, 2024, and $6,264,623 and at December 31, 2023.
(3)Total loans held for sale includes residential mortgage loans valued under the fair value option of $297 at December 31, 2024, and $2,610 at December 31, 2023.
See accompanying Notes to Consolidated Financial Statements.
WEBSTER FINANCIAL CORPORATION AND SUBSIDIARIES
CONSOLIDATED STATEMENTS OF INCOME | | | | | | | | | | | | | | | | | |
| Years ended December 31, |
| (In thousands, except per share data) | 2024 | | 2023 | | 2022 |
| Interest income: | | | | | |
| Interest and fees on loans and leases | $ | 3,182,466 | | | $ | 3,071,378 | | | $ | 1,946,558 | |
| Taxable interest on investment securities | 636,177 | | | 396,681 | | | 269,233 | |
| Non-taxable interest on investment securities | 38,758 | | | 54,207 | | | 50,442 | |
| Loans held for sale | 13,911 | | | 734 | | | 78 | |
| Other interest and dividends | 55,974 | | | 105,260 | | | 18,426 | |
| Total interest income | 3,927,286 | | | 3,628,260 | | | 2,284,737 | |
| Interest expense: | | | | | |
| Deposits | 1,427,204 | | | 1,021,418 | | | 138,552 | |
| Securities sold under agreements to repurchase and federal funds purchased | 4,113 | | | 9,102 | | | 19,059 | |
| Federal Home Loan Bank advances | 125,329 | | | 222,537 | | | 58,557 | |
| Long-term debt | 32,253 | | | 37,934 | | | 34,283 | |
| Total interest expense | 1,588,899 | | | 1,290,991 | | | 250,451 | |
| Net interest income | 2,338,387 | | | 2,337,269 | | | 2,034,286 | |
| Provision for credit losses | 222,000 | | | 150,747 | | | 280,619 | |
| Net interest income after provision for credit losses | 2,116,387 | | | 2,186,522 | | | 1,753,667 | |
| Non-interest income: | | | | | |
| Deposit service fees | 161,144 | | | 169,318 | | | 198,472 | |
| Loan and lease related fees | 76,384 | | | 84,861 | | | 102,987 | |
| Wealth and investment services | 33,234 | | | 28,999 | | | 40,277 | |
| | | | | |
| Cash surrender value of life insurance policies | 27,712 | | | 26,228 | | | 29,237 | |
| (Loss) on sale of investment securities, net | (136,224) | | | (33,620) | | | (6,751) | |
| Other income | 89,649 | | | 38,551 | | | 76,561 | |
| Total non-interest income | 251,899 | | | 314,337 | | | 440,783 | |
| Non-interest expense: | | | | | |
| Compensation and benefits | 762,794 | | | 711,752 | | | 723,620 | |
| Occupancy | 72,161 | | | 77,520 | | | 113,899 | |
| Technology and equipment | 195,017 | | | 197,928 | | | 186,384 | |
| Intangible assets amortization | 36,082 | | | 36,207 | | | 31,940 | |
| Marketing | 18,751 | | | 18,622 | | | 16,438 | |
| Professional and outside services | 58,253 | | | 107,497 | | | 117,530 | |
| Deposit insurance | 68,912 | | | 98,081 | | | 26,574 | |
| Other expense | 139,309 | | | 168,748 | | | 180,088 | |
| Total non-interest expense | 1,351,279 | | | 1,416,355 | | | 1,396,473 | |
| Income before income taxes | 1,017,007 | | | 1,084,504 | | | 797,977 | |
| Income tax expense | 248,300 | | | 216,664 | | | 153,694 | |
| Net income | 768,707 | | | 867,840 | | | 644,283 | |
| Preferred stock dividends | 16,650 | | | 16,650 | | | 15,919 | |
| Net income available to common stockholders | $ | 752,057 | | | $ | 851,190 | | | $ | 628,364 | |
| | | | | |
| Earnings per common share: | | | | | |
| Basic | $ | 4.38 | | | $ | 4.91 | | | $ | 3.72 | |
| Diluted | 4.37 | | | 4.91 | | | 3.72 | |
See accompanying Notes to Consolidated Financial Statements.
WEBSTER FINANCIAL CORPORATION AND SUBSIDIARIES
CONSOLIDATED STATEMENTS OF COMPREHENSIVE INCOME | | | | | | | | | | | | | | | | | |
| | Years ended December 31, |
| (In thousands) | 2024 | | 2023 | | 2022 |
| Net income | $ | 768,707 | | | $ | 867,840 | | | $ | 644,283 | |
| Other comprehensive (loss) income, net of tax: | | | | | |
| Investment securities available-for-sale | (2,868) | | | 113,710 | | | (635,696) | |
| Derivative financial instruments | (6,731) | | | 6,005 | | | (14,944) | |
| Defined benefit pension and other postretirement benefit plans | 3,787 | | | 14,674 | | | (11,740) | |
| Other comprehensive (loss) income, net of tax | (5,812) | | | 134,389 | | | (662,380) | |
| Comprehensive income (loss) | $ | 762,895 | | | $ | 1,002,229 | | | $ | (18,097) | |
See accompanying Notes to Consolidated Financial Statements.
WEBSTER FINANCIAL CORPORATION AND SUBSIDIARIES
CONSOLIDATED STATEMENTS OF STOCKHOLDERS’ EQUITY | | | | | | | | | | | | | | | | | | | | | | | |
| (In thousands, except per share data) | Preferred
Stock | Common
Stock | Paid-In
Capital | Retained
Earnings | Treasury Stock,
at cost | Accumulated
Other Comprehensive (Loss), Net of Tax | Total Stockholders’
Equity |
| Balance at December 31, 2021 | $ | 145,037 | | $ | 937 | | $ | 1,108,594 | | $ | 2,333,288 | | $ | (126,951) | | $ | (22,580) | | $ | 3,438,325 | |
| Net income | — | | — | | — | | 644,283 | | — | | — | | 644,283 | |
| Other comprehensive (loss), net of tax | — | | — | | — | | — | | — | | (662,380) | | (662,380) | |
| Common stock dividends and equivalents—$1.60 per share | — | | — | | — | | (247,791) | | — | | — | | (247,791) | |
| Series F preferred stock dividends—$1,312.50 per share | — | | — | | — | | (7,875) | | — | | — | | (7,875) | |
| Series G preferred stock dividends—$65.00 per share | — | | — | | — | | (8,044) | | — | | — | | (8,044) | |
| Issued in business combination | 138,942 | | 891 | | 5,040,291 | | — | | — | | — | | 5,180,124 | |
| Common stock contribution to charitable foundation | — | | — | | (1,701) | | — | | 12,201 | | — | | 10,500 | |
| Stock-based compensation | — | | — | | 26,748 | | — | | 27,351 | | — | | 54,099 | |
| Exercise of stock options | — | | — | | (692) | | — | | 1,395 | | — | | 703 | |
| Common shares acquired from stock compensation plan activity | — | | — | | — | | — | | (23,655) | | — | | (23,655) | |
| Common stock repurchase program | — | | — | | — | | — | | (322,103) | | — | | (322,103) | |
| Balance at December 31, 2022 | 283,979 | | 1,828 | | 6,173,240 | | 2,713,861 | | (431,762) | | (684,960) | | 8,056,186 | |
| Adoption of ASU No. 2022-02 | — | | — | | — | | (4,245) | | — | | — | | (4,245) | |
| Net income | — | | — | | — | | 867,840 | | — | | — | | 867,840 | |
| Other comprehensive income, net of tax | — | | — | | — | | — | | — | | 134,389 | | 134,389 | |
| Common stock dividends and equivalents—$1.60 per share | — | | — | | — | | (278,276) | | — | | — | | (278,276) | |
| Series F preferred stock dividends—$1,312.50 per share | — | | — | | — | | (7,875) | | — | | — | | (7,875) | |
| Series G preferred stock dividends—$65.00 per share | — | | — | | — | | (8,775) | | — | | — | | (8,775) | |
| Stock-based compensation | — | | — | | 8,539 | | — | | 45,548 | | — | | 54,087 | |
| Exercise of stock options | — | | — | | (2,026) | | — | | 3,749 | | — | | 1,723 | |
| Common shares acquired from stock compensation plan activity | — | | — | | — | | — | | (16,278) | | — | | (16,278) | |
| Common stock repurchase program | — | | — | | — | | — | | (108,780) | | — | | (108,780) | |
| Balance at December 31, 2023 | 283,979 | | 1,828 | | 6,179,753 | | 3,282,530 | | (507,523) | | (550,571) | | 8,689,996 | |
| | | | | | | |
| Net income | — | | — | | — | | 768,707 | | — | | — | | 768,707 | |
| Other comprehensive (loss), net of tax | — | | — | | — | | — | | — | | (5,812) | | (5,812) | |
| Common stock dividends and equivalents—$1.60 per share | — | | — | | — | | (275,429) | | — | | — | | (275,429) | |
| Series F preferred stock dividends—$1,312.50 per share | — | | — | | — | | (7,875) | | — | | — | | (7,875) | |
| Series G preferred stock dividends—$65.00 per share | — | | — | | — | | (8,775) | | — | | — | | (8,775) | |
| | | | | | | |
| Stock-based compensation | — | | — | | 1,886 | | — | | 53,255 | | — | | 55,141 | |
| Exercise of stock options | — | | — | | (164) | | — | | 418 | | — | | 254 | |
| Common shares acquired from stock compensation plan activity | — | | — | | — | | — | | (17,215) | | — | | (17,215) | |
| Common stock repurchase program | — | | — | | — | | — | | (65,778) | | — | | (65,778) | |
| Balance at December 31, 2024 | $ | 283,979 | | $ | 1,828 | | $ | 6,181,475 | | $ | 3,759,158 | | $ | (536,843) | | $ | (556,383) | | $ | 9,133,214 | |
See accompanying Notes to Consolidated Financial Statements.
WEBSTER FINANCIAL CORPORATION AND SUBSIDIARIES
CONSOLIDATED STATEMENTS OF CASH FLOWS | | | | | | | | | | | | | | | | | |
| | Years ended December 31, |
| (In thousands) | 2024 | | 2023 | | 2022 |
| Operating Activities: | | | | | |
| Net income | $ | 768,707 | | | $ | 867,840 | | | $ | 644,283 | |
| Adjustments to reconcile net income to net cash provided by operating activities: | | | | | |
| Provision for credit losses | 222,000 | | | 150,747 | | | 280,619 | |
| Deferred income tax expense (benefit) | 18,183 | | | (53,634) | | | (69,664) | |
| Stock-based compensation | 55,141 | | | 54,087 | | | 54,099 | |
| Common stock contribution to charitable foundation | — | | | — | | | 10,500 | |
| Depreciation and amortization of property and equipment and intangible assets | 71,531 | | | 76,490 | | | 81,800 | |
| Net (accretion) and amortization of interest-earning assets and borrowings | (95,281) | | | (23,267) | | | (26,215) | |
| Amortization of low-income housing tax credit investments | 80,902 | | | 71,775 | | | 44,208 | |
| Reduction of ROU lease assets | 31,275 | | | 30,616 | | | 56,783 | |
| | | | | |
| | | | | |
| Net loss on sale of investment securities | 136,224 | | | 33,620 | | | 6,751 | |
| | | | | |
| Originations of loans held for sale | (6,806) | | | (13,319) | | | (33,107) | |
| Proceeds from sale of loans held for sale | 8,310 | | | 13,882 | | | 36,335 | |
| | | | | |
| Net loss on sale of factored receivables portfolio | 15,977 | | | — | | | — | |
| Net (gain) on sale of mortgage servicing rights | (11,655) | | | — | | | — | |
| | | | | |
| (Increase) in cash surrender value of life insurance policies | (27,712) | | | (26,228) | | | (29,237) | |
| Other operating activities, net | (15,998) | | | 2,760 | | | 4,131 | |
| Net (increase) in loans held for sale | (49,566) | | | — | | | — | |
| (Gain) from life insurance policies | (14,065) | | | (3,566) | | | (6,311) | |
| (Gain) on sale of alternative investments | (14,763) | | | — | | | — | |
| | | | | |
| | | | | |
| | | | | |
| Net decrease (increase) in derivative contract assets and liabilities | 20,526 | | | (73,295) | | | 536,820 | |
| Net decrease (increase) in prepaid expenses and other assets | 246,752 | | | (13,774) | | | (106,740) | |
| Net (decrease) in accrued expenses and other liabilities | (35,382) | | | (116,085) | | | (149,103) | |
| Net cash provided by operating activities | 1,404,300 | | | 978,649 | | | 1,335,952 | |
| Investing Activities: | | | | | |
| Purchases of available-for-sale securities | (3,202,766) | | | (2,372,249) | | | (1,099,810) | |
| Proceeds from principal payments, maturities, and calls of available-for-sale securities | 892,965 | | | 591,207 | | | 754,545 | |
| Proceeds from sale of available-for-sale securities | 2,142,462 | | | 789,603 | | | 172,947 | |
| Purchases of held-to-maturity securities | (1,778,098) | | | (891,761) | | | (1,150,023) | |
| Proceeds from principal payments, maturities, and calls of held-to-maturity securities | 457,433 | | | 390,073 | | | 750,752 | |
| Net decrease (increase) in Federal Home Loan Bank and Federal Reserve Bank stock | 5,539 | | | 119,018 | | | (223,562) | |
| Alternative investments (capital calls), net of returns of capital | (160,062) | | | (27,430) | | | (24,887) | |
| Proceeds from sales of alternative investments | 19,588 | | | — | | | — | |
| Net (increase) in loans | (2,488,796) | | | (1,653,257) | | | (7,501,545) | |
| Proceeds from sale of loans not originated for sale | 569,538 | | | 625,968 | | | 679,693 | |
| Proceeds from sale of mortgage servicing rights | 18,588 | | | — | | | — | |
| Proceeds from sale of foreclosed properties and repossessed assets | 8,526 | | | 4,033 | | | 2,568 | |
| Proceeds from sale of property and equipment | 6,769 | | | 6,894 | | | 300 | |
| Purchases of property and equipment | (35,844) | | | (40,303) | | | (28,762) | |
| Proceeds from life insurance policies | 34,358 | | | 20,098 | | | 21,893 | |
| Net cash paid for acquisition of Ametros | (359,460) | | | — | | | — | |
| Net cash paid for acquisition of interLINK | — | | | (157,646) | | | — | |
| Net cash paid for acquisition of Bend | — | | | — | | | (54,407) | |
| Net cash received in merger with Sterling | — | | | — | | | 513,960 | |
| Net cash (used for) investing activities | (3,869,260) | | | (2,595,752) | | | (7,186,338) | |
See accompanying Notes to Consolidated Financial Statements.
|
| | | | | | | | | | | | | | | | | |
WEBSTER FINANCIAL CORPORATION AND SUBSIDIARIES
CONSOLIDATED STATEMENTS OF CASH FLOWS, continued |
|
| | Years ended December 31, |
| (In thousands) | 2024 | | 2023 | | 2022 |
| Financing Activities: | | | | | |
| Net increase in deposits | 3,697,887 | | | 6,721,028 | | | 936,001 | |
| Net (decrease) increase in Federal Home Loan Bank advances | (249,910) | | | (3,100,534) | | | 5,449,555 | |
| | | | | |
| Proceeds from extinguishment of borrowings | — | | | — | | | 2,548 | |
Net (decrease) increase in securities sold under agreements to repurchase
and federal funds purchased | (114,219) | | | (693,443) | | | 447,202 | |
| Repayment of long-term debt | (132,550) | | | (16,752) | | | — | |
| | | | | |
| | | | | |
| | | | | |
| | | | | |
| Payment of contingent consideration | (4,050) | | | — | | | — | |
| Dividends paid to common stockholders | (274,545) | | | (278,155) | | | (247,767) | |
| Dividends paid to preferred stockholders | (16,650) | | | (16,650) | | | (13,725) | |
| Exercise of stock options | 254 | | | 1,723 | | | 703 | |
| Common stock repurchase program | (65,403) | | | (107,984) | | | (322,103) | |
| Common shares acquired related to stock compensation plan activity | (17,215) | | | (16,278) | | | (23,655) | |
| Net cash provided by financing activities | 2,823,599 | | | 2,492,955 | | | 6,228,759 | |
| Net increase in cash and cash equivalents | 358,639 | | | 875,852 | | | 378,373 | |
| Cash and cash equivalents, beginning of period | 1,715,795 | | | 839,943 | | | 461,570 | |
| Cash and cash equivalents, end of period | $ | 2,074,434 | | | $ | 1,715,795 | | | $ | 839,943 | |
See accompanying Notes to Consolidated Financial Statements.
WEBSTER FINANCIAL CORPORATION AND SUBSIDIARIES
NOTES TO CONSOLIDATED FINANCIAL STATEMENTS
Note 1: Summary of Significant Accounting Policies
Nature of Operations
Webster Financial Corporation is a bank holding company and financial holding company under the BHC Act, incorporated under the laws of Delaware in 1986, and headquartered in Stamford, Connecticut. As of December 31, 2024, Webster Financial Corporation had more than $79 billion in total consolidated assets.
Webster Bank is a commercial bank with a national bank charter focused on providing financial products and services to businesses, individuals, and families. While its core footprint spans the Northeast from the New York metropolitan area to Rhode Island and Massachusetts, certain businesses operate in extended geographies. Webster Bank offers three differentiated lines of business: Commercial Banking, Healthcare Financial Services, and Consumer Banking.
Basis of Presentation
The Consolidated Financial Statements have been prepared in accordance with GAAP, and include the accounts of the Company and all other entities in which the Company has a controlling financial interest. Intercompany transactions and balances have been eliminated in consolidation. Assets under administration or assets under management that the Company holds or manages in a fiduciary or agency capacity for customers are not included on the accompanying Consolidated Balance Sheets. Certain prior period amounts have been reclassified to conform to the current year’s presentation. These reclassifications did not have a significant impact on the Company’s Consolidated Financial Statements.
Principles of Consolidation
The purpose of Consolidated Financial Statements is to present the results of operations and the financial position of the Company and its subsidiaries as if the consolidated group were a single economic entity. In accordance with the applicable accounting guidance for consolidations, the Consolidated Financial Statements include any VOE in which the Company has a controlling financial interest and any VIE for which the Company is deemed to be the primary beneficiary. The Company generally consolidates its VOEs if the Company, directly or indirectly, owns more than 50% of the outstanding voting shares of the entity, and if the non-controlling stockholders do not hold any substantive participating or controlling rights. The Company evaluates VIEs to understand the purpose and design of the entity, and its involvement in the ongoing activities of the VIE, and will consolidate the VIE if it has (i) the power to direct the activities of the VIE that most significantly affect the VIE’s economic performance, and (ii) an obligation to absorb losses of the VIE, or the right to receive benefits from the VIE, that could potentially be significant to the VIE. The Company accounts for unconsolidated partnerships and certain other investments using the equity method of accounting if it has the ability to significantly influence the operating and financial policies of the investee. This is generally presumed to exist when the Company owns between 20% and 50% of a corporation, or when it has greater than 3% to 5% interest in a limited partnership or similarly structured entity. Additional information regarding consolidated and non-consolidated VIEs can be found within Note 15: Variable Interest Entities.
Use of Estimates
The preparation of the Consolidated Financial Statements in accordance with GAAP requires management to make estimates and assumptions that affect the reported amounts of assets and liabilities and the disclosure of contingent assets and liabilities at the date of the Consolidated Financial Statements, and the reported amounts of revenues and expenses during the reporting period. Actual results could differ from those estimates.
Business Combinations
Business combinations are accounted for under the acquisition method, in which the identifiable assets acquired and liabilities assumed are generally measured and recognized at fair value as of the acquisition date, with the excess of the purchase price over the fair value of the net assets acquired recognized as goodwill. Items such as acquired ROU lease assets and operating lease liabilities as lessee, employee benefit plans, and income-tax related balances are recognized in accordance with other applicable GAAP, which may result in measurements that differ from fair value. After the adoption of ASU No. 2021-08—Business Combinations (Topic 805)—Accounting for Contract Assets and Contract Liabilities from Contracts with Customers, contract assets and contract liabilities from contracts with customers discussed below, may result in measurements that differ from fair value as well.
Business combinations are included in the Consolidated Financial Statements from the respective dates of acquisition. Historical reporting periods reflect only the results of legacy Webster operations. Merger-related costs are expensed in the period incurred and presented within the applicable non-interest expense category. Additional information regarding the Company’s mergers and acquisitions can be found within Note 2: Acquisitions and Joint Ventures.
Cash and Cash Equivalents
Cash and cash equivalents is comprised of Cash and due from banks and Interest-bearing deposits. Cash equivalents have an original maturity of three months or less.
Cash and due from banks includes cash on hand, certain deposits at the FRB, and cash due from banks. Restricted cash related to Federal Reserve System requirements and cash collateral received on derivative positions are also included in Cash and due from banks.
Interest-bearing deposits includes deposits at the FRB in excess of reserve requirements and federal funds sold to other financial institutions.
The following table summarizes supplemental disclosures of cash flow information and non-cash investing and financing activities: | | | | | | | | | | | | | | | | | |
| Years ended December 31, |
| (In thousands) | 2024 | | 2023 | | 2022 |
| Supplemental disclosure of cash flow information: | | | | | |
| Interest paid | $ | 1,611,201 | | | $ | 1,248,620 | | | $ | 240,851 | |
| Income taxes paid | 124,817 | | | 268,598 | | | 193,544 | |
| Non-cash investing and financing activities: | | | | | |
| Transfer of loans held for investment to foreclosed properties and repossessed assets | $ | 2,305 | | | $ | 10,485 | | | $ | 774 | |
| Transfer of returned finance lease equipment to assets held for sale | 5,626 | | | 5,139 | | | — | |
| Transfer of loans held for investment to loans held for sale | 680,159 | | | 629,172 | | | 652,855 | |
| Transfer of loans held for sale to loans held for investment | 133,168 | | | — | | | — | |
| Transfer of property and equipment to assets held for sale | 750 | | | — | | | 4,800 | |
| Deposit overdrafts reclassified as loan balances | 7,146 | | | 10,432 | | | 8,721 | |
| ROU lease assets obtained in exchange for operating lease liabilities | 10,444 | | | 22,989 | | | 27,897 | |
| Approved commitments to fund LIHTC investments | 304,269 | | | 334,947 | | | 211,796 | |
| Receipt of Ametros member deposits from other financial institutions | 285,705 | | | — | | | — | |
| Deposits assumed | — | | | — | | | 313 | |
| | | | | |
| | | | | |
| | | | | |
| | | | | |
| | | | | |
| | | | | |
| | | | | |
| | | | | |
| | | | | |
| | | | | |
| | | | | |
Business combinations (1): | | | | | |
| Tangible assets acquired | $ | 256,957 | | | $ | 24,318 | | | $ | 26,937,741 | |
| Goodwill and other intangible assets | 417,085 | | | 157,361 | | | 2,188,831 | |
Liabilities assumed (2) | 299,507 | | | 7,994 | | | 24,406,001 | |
| Forgiveness of long-term debt | 12,875 | | | — | | | — | |
| Pre-existing equity interest | 2,200 | | | — | | | — | |
| Contingent consideration | — | | | 16,039 | | | — | |
| Common stock issued | — | | | — | | | 5,041,182 | |
| Preferred stock exchanged | — | | | — | | | 138,942 | |
(1)Reflects the effects from the acquisition of Ametros during the year ended December 31, 2024, the acquisition of interLINK during the year ended December 31, 2023, and both the acquisition of Bend and merger with Sterling during the year ended December 31, 2022. In addition, the amounts for 2023 include adjustments to fair values of assets acquired and liabilities assumed related to the Bend acquisition and Sterling merger, which were recognized during the one-year measurement period.
(2)For the year ended December 31, 2024, the amount presented reflects the sum of the $293.7 million of liabilities assumed from Ametros and the $5.8 million liability assumed for the Seller’s transaction expenses, which was included as part of the purchase price consideration and paid by the Company at closing.
Investments in Debt Securities
Debt security transactions are recognized on the trade date, which is the date the order to buy or sell the security is executed. Investments in debt securities are classified as available-for-sale or held-to-maturity at the time of purchase. Any classification change subsequent to the trade date is reviewed for compliance with corporate objectives and accounting policies.
Debt securities classified as available-for-sale are recorded at fair value with unrealized gains and losses recorded as a component of AOCL. If a debt security is transferred from available-for-sale to held-to-maturity, it is recorded at fair value at the time of transfer and any respective gain or loss would be recorded as a separate component of AOCL and amortized as an adjustment to interest income over the remaining life of the security. Debt securities classified as available-for-sale are reviewed for credit losses when the fair value of a security falls below the amortized cost basis and the decline is evaluated to determine if any portion is attributable to credit loss. The decline in fair value attributable to credit loss is recorded directly to earnings, with a corresponding allowance for credit loss, limited to the amount that fair value is less than the amortized cost. If the credit quality subsequently improves, previously recorded allowance amounts may be reversed. An available-for-sale debt security will be placed on non-accrual status if collection of principal and interest in accordance with contractual terms is doubtful. When the Company intends to sell an impaired available-for-sale debt security, or if it is more likely than not that the Company will be required to sell the security prior to recovery of the amortized cost basis, the entire fair value adjustment will immediately be recognized in earnings through non-interest income. The gain or loss on sale is calculated using the carrying value plus any related AOCL balance associated with the securities sold.
Debt securities classified as held-to-maturity are those in which the Company has the ability and intent to hold to maturity. Debt securities classified as held-to-maturity are recorded at amortized cost net of unamortized premiums and discounts. Discount accretion income and premium amortization expense are recognized as interest income using the effective interest method, with consideration given to prepayment assumptions on mortgage-backed securities. Premiums are amortized to the earliest call date for debt securities purchased at a premium, with explicit, non-contingent call features and are callable at a fixed price and preset date. Debt securities classified as held-to-maturity are reviewed for credit losses under the CECL model with an allowance recorded on the balance sheet for expected lifetime credit losses. The ACL is calculated on a pooled basis using statistical models which include forecasted scenarios of future economic conditions. Forecasts revert to long-run loss rates implicitly through the economic scenario, generally over three years. If the risk for a particular security no longer matches the collective assessment pool, it is removed and individually assessed for credit deterioration. The non-accrual policy for held-to-maturity debt securities is the same as for available-for-sale debt securities.
A zero credit loss assumption is maintained for U.S. Treasuries and agency-backed securities in both the available-for-sale and held-to-maturity portfolios, as applicable. This assumption is subject to quarterly review to ensure it remains appropriate. Additional information regarding investments in debt securities can be found within Note 3: Investment Securities.
Investments in Equity Securities
The Company’s accounting treatment for non-consolidated equity investments differs for those with and without readily determinable fair values. Equity investments with readily determinable fair values are recorded at fair value with changes in fair value recorded in non-interest income. For equity investments without readily determinable fair values and are not already accounted for under the equity method, the Company elected the measurement alternative, and therefore carries these investments at cost, less impairment, if any, plus or minus changes in observable prices. Certain equity investments that do not have a readily available fair value may qualify for NAV measurement based on specific requirements. The Company’s alternative investments accounted for at NAV consist of investments in non-public entities that generally cannot be redeemed since the Company’s investments are distributed as the underlying equity is liquidated. On a quarterly basis, the Company reviews its equity investments without readily determinable fair values for impairment. If the equity investment is considered impaired, an impairment loss equal to the amount by which the carrying value exceeds its fair value is recorded through a charge to earnings. The impairment loss may be reversed in a subsequent period if there are observable transactions for the identical or similar investment of the same issuer at a higher amount than the carrying amount that was established when the impairment was recognized. Impairments, as well as upward or downward adjustments resulting from observable price changes in orderly transactions for identical or similar investments, are included in non-interest income.
Equity investments in entities that finance affordable housing and other community development projects provide a return primarily through the realization of tax benefits. The Company applies the proportional amortization method to account for its investments in qualified affordable housing projects.
Investment in Federal Home Loan Bank and Federal Reserve Bank Stock
The Bank is a member of the FHLB and the Federal Reserve System, and is required to maintain an investment in capital stock of both the FHLB and FRB. Based on redemption provisions, FHLB and FRB stock has no quoted market value and is carried at cost. Membership stock is reviewed for impairment if economic circumstances would warrant review.
Loans Held for Sale
Loans that are classified as held for sale at the time of origination are accounted for under the fair value option. Loans not originated for sale but subsequently transferred to held for sale are valued at the lower of cost or fair value on an individual asset basis. Any cost amount in excess of fair value is recorded as a valuation allowance and recognized as a reduction of other non-interest income. Interest income on loans held for sale is recognized based on contractual rates and is reflected in Loans held for sale interest income on the accompanying Consolidated Statements of Income. Gains or losses on the sale of loans held for sale are recorded as part of Other income on the accompanying Consolidated Statements of Income. Additional information regarding the sale of loans held for sale can be found within Note 5: Transfers and Servicing of Financial Assets.
For the purpose of presentation in the accompanying Consolidated Statements of Cash Flows, cash flows from loans are classified based on management’s intent to either sell the loan or hold the loan as an investment for the foreseeable future. When management’s intent is to sell the loan, the cash flows of that loan are presented as operating activities. When management’s intent is to hold the loan as an investment for the foreseeable future, the cash flows of that loan are presented as investing activities. Additionally, proceeds from the sale of loans that were originated for sale are presented as operating activities, and proceeds from the sale of loans that were originated for investment and then subsequently transferred to held for sale are presented as investing activities.
Transfers and Servicing of Financial Assets
Transfers of financial assets are accounted for as sales when control over the assets has been surrendered. Control over transferred assets is generally considered to have been surrendered when: (i) the transferred assets are legally isolated from the Company or its consolidated affiliates, even in bankruptcy or other receivership, (ii) the transferee has the right to pledge or exchange the assets with no conditions that constrain the transferee and provide more than a trivial benefit to the Company, and (iii) the Company does not maintain the obligation or unilateral ability to reclaim or repurchase the assets. Transfers of financial assets that do not qualify for sale accounting are reported as collateralized borrowings. Accordingly, the related assets remain on the Company’s consolidated balance sheets and continue to be reported and accounted for as if the transfer had not occurred as discussed within the next policy below.
The Company sells financial assets in the normal course of business, the majority of which are residential mortgage loan sales to government-sponsored enterprises through established programs, as well as commercial loan sales through participation agreements, and other individual or portfolio loan and securities sales. In accordance with the accounting guidance for asset transfers, the Company considers any ongoing involvement with transferred assets in determining whether the assets should be derecognized from the balance sheet. With the exception of servicing, the Company’s continuing involvement with financial assets sold is minimal, and generally is limited to market customary representation and warranty clauses covering certain characteristics of the mortgage loans that were sold, and the Company’s origination process. The gain or loss on sale depends on the previous carrying amount of the transferred financial assets, the consideration received, and the fair value of any other assets obtained or liabilities incurred in exchange for the transferred assets.
When the Company sells financial assets, it may retain servicing rights and/or other interests in the financial assets. Servicing assets and any other interests held by the Company are initially measures at fair value, and subsequently measured using the amortization method. Additional information regarding transfers of financial assets and mortgage servicing assets can be found within Note 5: Transfers and Servicing of Financial Assets.
Securities Sold Under Agreements to Repurchase
These agreements are accounted for as secured financing transactions since the Company maintains effective control over the transferred investment securities and the transfer meets the other criteria for such treatment. Obligations to repurchase the sold investment securities are reflected as a liability on the accompanying Consolidated Balance Sheets. The investment securities sold with agreement to repurchase to wholesale dealers are transferred to a custodial account for the benefit of the dealer or to the bank with whom each transaction is executed. The dealers or banks may sell, loan, or otherwise dispose of such securities to other parties in the normal course of their operations and agree to resell to the Company the same securities at the maturity date of the agreements. The Company also enters into repurchase agreements with Bank customers. The investment securities sold to Bank customers with agreements to repurchase are not transferred, but internally pledged to the repurchase agreement transaction. Additional information regarding securities sold under agreements to repurchase can be found within Note 11: Borrowings.
Loans and Leases
Loans and leases are stated at the principal amount outstanding, net of amounts charged-off, unamortized premiums and discounts, and deferred loan and lease fees or costs, which are recognized as yield adjustments in interest income using the effective interest method. These yield adjustments are amortized over the contractual life of the related loans and leases and are adjusted for prepayments as they occur. Interest on loans and leases is credited to interest income as earned based on the interest rate applied to principal amounts outstanding. The Company has elected to present accrued interest receivable separately from the amortized cost basis of Loans and leases on the accompanying Consolidated Balance Sheets. Amounts of cash receipts and cash payments for loans and leases are presented net within Investing activities on the Consolidated Statements of Cash Flows.
Non-accrual Loans
Loans are placed on non-accrual status when full collection of principal and interest in accordance with contractual terms is not expected based on available information, which generally occurs when principal or interest payments become 90 days delinquent unless the loan is well secured and in the process of collection, or sooner if circumstances indicate that the borrower may be unable to meet contractual principal or interest payments. The Company considers a loan to be “well-secured” when it is secured by collateral in the form of liens on, or pledges of, real or personal property that have a realizable value sufficient to discharge the debt in full, or when it is secured by a contractual guarantee of a financially responsible party. The Company considers a loan “in the process of collection” if collection of the debt is proceeding in due course either through legal action or through collection efforts not involving legal action that are reasonably expected to result in repayment of the debt or in its restoration to a current status in the near future.
When loans and leases are placed on non-accrual status, the accrual of interest income and the amortization or accretion of premiums, discounts, and deferred fees and costs is discontinued, and any previously accrued interest is reversed as a reduction of interest income. For commercial loans and leases, if the Company determines that repayment of non-accrual loans and leases is not expected, any payment received is applied to principal until the unpaid balance has been fully recovered. Any excess is then credited to interest income. For consumer loans, if the Company determines that principal can be repaid, interest payments are taken into income as received on a cash basis.
Loans are generally removed from non-accrual status when they become current as to principal and interest or demonstrate a period of performance under the contractual terms and, in the opinion of management, are fully collectible as to principal and interest. For commercial loans, a sustained period of repayment performance is generally required. Pursuant to regulatory guidance, a loan discharged under Chapter 7 of the U.S. bankruptcy code is removed from non-accrual status when full repayment of the remaining pre-discharged contractual principal and interest is expected, and there have been at least six consecutive months of current payments. Additional information regarding non-accrual loans and leases can be found within Note 4: Loans and Leases.
Allowance for Credit Losses on Loans and Leases
The ACL on loans and leases, which is established through a provision charged to expense, is a contra-asset account that offsets the amortized cost basis of loans and leases for the credit losses that are expected to occur over the life of the asset. Executive management reviews and advises on the adequacy of the allowance on a quarterly basis, which is maintained at a level that management deems to be sufficient to cover expected credit losses within the loan and lease portfolios. An ACL on accrued interest for a loan is not measured since accrued interest income is reversed against interest income for non-accrual loans immediately after their non-accrual classification.
The ACL on loans and leases is determined using the CECL model, whereby an expected lifetime credit loss is recognized at the origination or purchase of an asset, including those acquired through a business combination, which is then reassessed at each reporting date over the contractual life of the asset. The calculation of expected credit losses includes consideration of past events, current conditions, and reasonable and supportable economic forecasts that affect the collectability of the reported amounts. Generally, expected credit losses are determined through a pooled, collective assessment of loans and leases with similar risk characteristics. However, if the risk characteristics of a loan or lease change such that it no longer aligns to that of the collectively assessed pool, it is removed from the population and individually assessed for credit losses. The total ACL on loans and leases recorded by management represents the aggregated estimated credit loss determined through both the collective and individual assessments.
Collectively Assessed Loans and Leases. Collectively assessed loans and leases are segmented based on product type and credit quality, and expected losses are determined using models that follow a PD, LGD, or EAD framework. Under these frameworks, expected credit losses are calculated as the product of the probability of a loan defaulting, expected loss given the occurrence of a default, and the expected exposure of a loan at default. Summing the product across loans over their lives yields the lifetime expected credit losses for a given portfolio. The Company’s PD and LGD calculations are predictive models that measure the current risk profile of the loan pools using forecasts of future macroeconomic conditions, historical loss information, loan-level risk attributes, and credit quality indicators. The calculation of EAD follows an iterative process to determine the expected remaining principal balance of a loan based on historical paydown rates for loans of a similar segment within the same portfolio. The calculation of portfolio exposure in future quarters incorporates expected losses, the loan’s amortization schedule, and prepayment rates.
The Company’s models incorporate a single economic forecast scenario and macroeconomic assumptions over a reasonable and supportable forecast period. The development of the reasonable and supportable forecast assumes that each portfolio will revert to its long-term loss rate expectation. The reasonable and supportable forecast period is two years after which the reversion period is one year. Models use output reversion and revert to mean historical portfolio loss rates on a straight-line basis in the third year of the forecast. Historical portfolio loss rates are based on approximately 15 years of available data and are updated annually.
Macroeconomic variables are used as inputs to the models and are selected for each class of financing receivable. The commercial models use unemployment, gross domestic product, corporate profits, housing starts, and retail sales (for commercial unfunded); the residential models use the Case-Shiller Home Price Index and the Federal Housing Finance Agency Home Price Index. Forecasted economic scenarios are sourced from a third party. Data from the baseline forecast scenario is used as the input to the modeled loss calculation. Changes in forecasts of macroeconomic variables will impact expectations of lifetime credit losses calculated by the loss models. However, the impact of changes in macroeconomic forecasts may be different for each portfolio and will reflect the credit quality and nature of the underlying assets at that time.
A portion of the collective ACL is comprised of qualitative adjustments for risk characteristics that are not reflected or captured in the quantitative models, but are likely to impact the measurement of estimated credit losses. Qualitative adjustments are based on management’s judgment of the Company, market, industry, or business specific data, and may be applied in relation to economic forecasts when relevant facts and circumstances are expected to impact credit losses, particularly in times of significant volatility in economic activity. Qualitative factors used in the Company’s models for all loan and lease portfolios include, but are not limited to, nature and volume of portfolio growth, credit quality trends, underwriting exception levels, quality of internal loan review, credit concentrations, and staffing trends.
In addition to the above considerations, the ACL calculation includes expectations of prepayments and recoveries. Extensions, renewals, and modifications are not included in the collective assessment.
Individually Assessed Loans and Leases. When loans and leases no longer align to the risk characteristics of the collectively assessed pool, they are removed from the collectively assessed population and individually assessed for credit losses. Generally, all non-accrual loans and loans with a charge-off are individually assessed.
Individual assessment for commercial loans that are considered to be collateral dependent is based on the fair value of the collateral less estimated cost to sell, the present value of the expected cash flows from the operation of the collateral, or a probability-weighted scenario approach of both of these methods. If a loan is not collateral dependent, the individual assessment is based on a discounted cash flow approach. For collateral dependent commercial loans and leases, the Company’s process requires the Company to determine the fair value of the collateral by obtaining a third-party appraisal or asset valuation, an interim valuation analysis, blue book reference, or other internal methods. Whenever the Company has a third-party real estate appraisal performed by independent licensed appraisers, a licensed in-house appraisal officer or qualified individual reviews these appraisals for compliance with the Financial Institutions Reform Recovery and Enforcement Act and the Uniform Standards of Professional Appraisal Practice.
Individual assessment for consumer loans are based on the fair value of collateral less the estimated costs to sell or loss factor approach based on historical loss rates. For residential and consumer collateral dependent loans, a third-party appraisal is obtained upon loan default. Fair value of the collateral for residential and consumer collateral dependent loans is reevaluated every six months, by either obtaining a new appraisal or other internal valuation method. Fair value is also reassessed, with any excess amount charged off, for residential and home equity loans that reach 180 days past due per Federal Financial Institutions Examination Council guidelines.
A fair value shortfall relative to the amortized cost balance is reflected as an allowance within the ACL on loans and leases. Subsequent to an appraisal or other fair value estimate, should reliable information come to management’s attention that the value has declined further, an additional allowance may be recorded to reflect the particular situation, thereby increasing the ACL on loans and leases. If the credit quality subsequently improves, the allowance is reversed up to a maximum of the previously recorded credit losses. Any individually assessed loan for which no specific allowance is necessary is the result of either sufficient cash flow or sufficient collateral coverage relative to the amortized cost. Additional information regarding the ACL on loans and leases can be found within Note 4: Loans and Leases.
Charge-off of Uncollectible Loans
If all or a portion of a loan is deemed to be no longer collectible upon the occurrence of a loss-confirming event, a charge-off may be recognized. Charge-offs reduce the amortized cost basis of the loan with a corresponding reduction to the ACL. For commercial loans, loss confirming events usually involve the receipt of specific adverse information about the borrower. The Company will generally recognize charge-offs for commercial loans on a case-by-case basis based on the review of the entire credit relationship and financial condition of the borrower. Loss-confirming events for consumer loans, such as bankruptcy or protracted delinquency, are typically based on established thresholds rather than by specific adverse information about the borrower.
PCD Loans and Leases
PCD loans and leases are defined as those that have experienced a more-than-insignificant deterioration in credit quality since origination. The Company considers a variety of factors to evaluate and identify whether acquired loans are PCD, including but not limited to, nonaccrual status, delinquency, whether the borrower is experiencing financial difficulty, partial charge-offs, decreases in FICO scores, risk rating downgrades, and other factors. Upon acquisition, expected credit losses are added to the fair value of individual PCD loans and leases to determine the amortized cost basis. After initial recognition, any changes to the estimate of expected credit losses, favorable or unfavorable, are recorded as a provision for credit loss during the period of change.
PCD accounting is also applied to loans and leases previously charged-off by the acquiree if the Company has contractual rights to the cash flows at the acquisition date. The Company recognizes an additional ACL for amounts previously charged-off by the acquiree with a corresponding increase to the amortized costs basis of the acquired asset. Balances deemed to be uncollectible are immediately charged-off in accordance with the Company’s charge-off policies, resulting in the establishment of the initial ACL for PCD loans and leases to be recorded net of these uncollectible balances.
Allowance for Credit Losses on Unfunded Loan Commitments
The ACL on unfunded loan commitments provides for potential exposure inherent with funding the unused portion of legal commitments to lend that are not unconditionally cancellable by the Company. Accounting for unfunded loan commitments follows the CECL model. The calculation of the allowance includes the probability of funding to occur and a corresponding estimate of expected lifetime credit losses on amounts assumed to be funded. Loss calculation factors are consistent with the ACL methodology for funded loans using the PD and LGD applied to the underlying borrower risk and facility grades, a draw down factor applied to utilization rates, relevant forecast information, and management’s qualitative factors. The ACL on unfunded credit commitments is included within Accrued expenses and other liabilities on the accompanying Consolidated Balance Sheets. Additional information regarding the ACL on unfunded loan commitments can be found within
Note 23: Commitments and Contingencies.
Troubled Debt Restructurings
Prior to the adoption of ASU No. 2022-02—Financial Instruments—Credit Losses (Topic 326): Troubled Debt Restructurings and Vintage Disclosures, a modified loan was considered a TDR when the following two conditions were met: (i) the borrower was experiencing financial difficulty, and (ii) the modification constituted a concession (i.e., the modified terms of the loan were more attractive to the borrower than standard market terms). The Company’s most common types of TDRs included covenant modifications and forbearance.
The Company’s policy was to place consumer loan TDRs, except those that were performing prior to TDR classification, on non-accrual status for a minimum period of six months. Commercial loan TDRs were evaluated on a case-by-case basis when determining whether or not to place them on non-accrual status. Loans qualified for return-to-accrual status when the borrower had demonstrated performance with the restructured terms of the loan agreement for a minimum period of six months. TDRs were also to be reported as such for the remaining life of the loan and individually assessed for expected credit losses under the Company’s ACL methodology.
Upon adoption of ASU No. 2022-02 on January 1, 2023, the existing measurement and disclosure requirements for TDRs by creditors were eliminated and disclosure requirements for certain loan refinancings and restructurings by creditors when a borrower is experiencing financial difficulty were enhanced. Additional information regarding modifications to borrowers experiencing financial difficulty can be found under the section captioned “Accounting Standards Adopted During the Current Year” and within Note 4: Loans and Leases.
Foreclosed and Repossessed Assets
Real estate acquired through foreclosure or completion of a deed in lieu of foreclosure and other assets acquired through repossession are recorded at fair value less estimated cost to sell at the date of transfer. Subsequent to the acquisition date, the foreclosed and repossessed assets are carried at the lower of cost or fair value less estimated selling costs and are included within Other assets on the accompanying Consolidated Balance Sheets. Independent appraisals generally are obtained to substantiate fair value and may be subject to adjustment based upon historical experience or specific geographic trends impacting the property. Upon transfer to OREO, the excess of the loan balance over fair value less cost to sell is charged off against the ACL. Subsequent write-downs in value, maintenance costs as incurred, and gains or losses upon sale are charged to Other expense on the accompanying Consolidated Statements of Income.
Property and Equipment
Property and equipment is carried at cost, less accumulated depreciation and amortization. Depreciation and amortization is computed on a straight-line basis over the estimated useful lives of the assets, as illustrated in the following table. If shorter, leasehold improvements are amortized over the terms of the respective leases.
| | | | | | | | | | | | | | |
| Minimum | | Maximum | |
| Building and improvements | 5 | - | 40 | years |
| Leasehold improvements | 5 | - | 20 | years |
| Furniture, fixtures, and equipment | 5 | - | 10 | years |
| Data processing equipment and software | 3 | - | 7 | years |
Repairs and maintenance costs are expensed as incurred, while significant improvements are capitalized. Property and equipment that is actively marketed for sale is reclassified to assets held for disposition. The cost and accumulated depreciation and amortization of property and equipment that is sold, retired, or otherwise disposed of, is eliminated from accounts and any resulting gain or loss is included in Other expense on the accompanying Consolidated Statements of Income. Additional information regarding property and equipment can be found within Note 6: Premises and Equipment.
Operating Leases
The Company determines if an arrangement is a lease at inception by assessing whether there is an identified asset and whether the contract conveys the right to control the use of the identified asset for a period of time in exchange for consideration. As lessee, operating leases with a term greater than one year are recognized as lease liabilities and corresponding ROU assets on the lease commencement date. The Company has elected not to recognize lease liabilities and ROU assets on operating leases with terms of one year or less. A ROU asset is measured based on the present value of the future minimum lease payments, adjusted for any initial direct costs, incentives, or other payments prior to the lease commencement date. A lease liability represents a legal obligation to make lease payments and is measured based on the present value of the future minimum lease payments. The Company utilizes the incremental borrowing rate, which is the rate of interest that would be incurred to borrow on a collateralized basis over a similar term on an amount equal to the lease payments in a similar economic environment since the interest rate implicit in the lease contract is typically not readily determinable. Variable lease payments that are dependent on either an index or rate are initially measured using the index or rate at the commencement date and included in the measurement of the lease liability. Renewal options are not included as part of the ROU asset or lease liability unless the renewal option is deemed reasonably certain to be exercised. ROU lease assets and operating lease liabilities are included in Premises and equipment and Accrued expenses and other liabilities, respectively, on the accompanying Consolidated Balance Sheets.
For real estate leases, lease components and non-lease components are accounted for as a single lease component. For equipment leases, lease components and non-lease components are accounted for separately. Operating lease expense, which is comprised of operating lease costs and variable lease costs, net of sublease income, is amortized on a straight-line basis and reflected as a part of Occupancy or Technology and equipment expense on the accompanying Consolidated Statements of Income. Additional information regarding the Company’s lessee arrangements can be found within Note 7: Leasing.
Goodwill
Goodwill represents the excess purchase price of businesses acquired over the fair value of the identifiable net assets acquired and is assigned to specific reporting units. Goodwill is not subject to amortization but rather is evaluated for impairment annually, or more frequently if events occur or circumstances change indicating it would more likely than not result in a reduction of the fair value of the reporting units below their carrying value, including goodwill.
Goodwill may be evaluated for impairment by first performing a qualitative assessment. If the qualitative assessment indicates that it is more likely than not that the fair value of a reporting unit is less than its carrying amount, including goodwill, or, if for any other reason the Company determines it to be appropriate, then a quantitative assessment will be performed. The quantitative assessment process utilizes an income and market approach to arrive at an indicated fair value range for the reporting units. The fair value calculated for each reporting unit is compared to its carrying amount, including goodwill, to ascertain if goodwill impairment exists. If the fair value exceeds the carrying amount, including goodwill for a reporting unit, it is not considered to be impaired. If the fair value is below the carrying amount, including goodwill for a reporting unit, then an impairment charge is recognized for the amount by which the carrying amount exceeds the calculated fair value, up to but not exceeding the amount of goodwill allocated to the reporting unit. The resulting amount is charged to Other expense on the accompanying Consolidated Statements of Income.
The Company completed a quantitative assessment for its reporting units during its most recent annual impairment review. Based on this qualitative assessment, the Company determined that there was no evidence of impairment to the balance of its goodwill. Additional information regarding goodwill can be found within Note 8: Goodwill and Other Intangible Assets.
Other Intangible Assets
Other intangible assets represent purchased assets that lack physical substance but can be distinguished from goodwill because of contractual or other legal rights, or because it is capable of being sold or exchanged either separately or in combination with a related contract, asset, or liability. Other intangible assets with finite useful lives, such as core deposits and customer relationships, are amortized to non-interest expense over their estimated useful lives and are evaluated for impairment whenever events occur or circumstances change indicating that the carrying amount of the asset may not be recoverable. Recognized impairment losses are charged to Other expense on the accompanying Consolidated Statements of Income. Additional information regarding other intangible assets can be found within Note 8: Goodwill and Other Intangible Assets.
Cash Surrender Value of Life Insurance
Bank-owned life insurance represents the cash surrender value of life insurance policies on certain current and former employees of Webster and Sterling. Cash surrender value increases and decreases are recorded in non-interest income. Death benefit proceeds in excess of the cash surrender value are recorded in other non-interest income upon the death of the insured.
Revenue From Contracts With Customers
Revenue from contracts with customers comprises non-interest income earned in exchange for services provided to customers and is recognized either when services are completed or as they are rendered. These revenue streams include Deposit service fees, Wealth and investment services, and non-significant portions of Loan and lease related fees and Other income on the accompanying Consolidated Statements of Income. The Company identifies the performance obligations included in its contracts with customers, determines the transaction price, allocates the transaction price to the performance obligations, as applicable, and recognizes revenue when the performance obligations are satisfied. Services provided over a period of time are generally transferred to customers evenly over the term of the contracts, and revenue is recognized evenly over the period the services are provided. On the accompanying Consolidated Balance Sheets, contract assets and deferred costs are included in Accrued interest receivable and other assets, and deferred revenue is included in Accrued expenses and other liabilities. Payment terms vary by services offered, and generally the time between the completion of performance obligations and receipt of payment is not significant. Additional information regarding contracts with customers can be found within Note 22: Revenue from Contracts with Customers.
Share-Based Compensation
The Company maintains a stock compensation plan that provides for the grant of stock options, stock appreciation rights, restricted stock, performance-based stock, and stock units to employees and directors. Share awards are issued from available treasury shares. Stock compensation expense is recognized over the required service vesting period for each award based on the grant date fair value, and is included within Compensation and benefits expense on the accompanying Consolidated Statements of Income. For time-based restricted stock awards and average return on equity performance-based restricted stock awards, fair value is measured using the closing price of Webster common stock at the grant date. For total stockholder return performance-based restricted stock awards, fair value is measured using the Monte Carlo simulation model. Performance-based restricted stock awards ultimately vest in a range from 0% to 150% of the target number of shares under the grant. Compensation expense may be subject to adjustment based on management’s assessment of the Company’s average return on equity performance relative to the target number of shares condition. Stock option awards use the Black-Scholes Option-Pricing Model to measure fair value at the grant date. Forfeiture of stock awards are accounted for as they occur. Excess tax benefits or tax deficiencies result when tax return deductions differ from recognized compensation cost determined using the grant-date fair value approach for financial statement purposes. Dividends are paid on time-based shares upon grant and are non-forfeitable, while dividends are accrued on performance-based awards and are paid with the vested shares when the performance target is met. Additional information regarding share-based compensation can be found within Note 20: Share-Based Plans.
Income Taxes
Income tax expense (benefit) is comprised of two components, current and deferred. The current component represents income taxes payable or refundable for the current period based on applicable tax laws, while the deferred component represents the tax effects of temporary differences between amounts recognized for financial accounting and tax purposes. DTAs and DTLs reflect the tax effects of such differences that are anticipated to result in taxable or deductible amounts in the future when the temporary differences reverse. DTAs are recognized if it is more likely than not that they will be realized, and may be reduced by a valuation allowance if it is more likely than not that all or some portion will not be realized.
Uncertain tax positions that meet a more likely than not recognition threshold are initially and subsequently measured as the largest amount of tax benefit that has a greater than 50% likelihood of being realized upon settlement with a taxing authority based on knowledge of all relevant information. The determination of whether or not a tax position meets the more likely than not recognition threshold considers the facts, circumstances, and information available at the reporting date and is subject to management judgment. The Company recognizes interest and penalties on uncertain tax positions and interest on refundable income taxes as a component of Income tax expense and Other income, respectively, on the accompanying Consolidated Statements of Income. Additional information regarding income taxes can be found within Note 9: Income Taxes.
Earnings per Common Share
Earnings per common share is calculated under the two-class method. Basic earnings per common share is computed by dividing earnings applicable to common stockholders by the weighted-average number of common shares outstanding, excluding outstanding participating securities, during the pertinent period. Diluted earnings per common share is computed using the weighted-average number of shares determined for the basic earnings per common share computation plus the dilutive effect of shares resulting from stock compensation and warrants for common stock using the treasury stock method. The identification of the Company’s participating securities and a reconciliation between the weighted-average common shares used in calculating basic earnings per common share and the weighted-average common shares used in calculating diluted earnings per common share can be found within Note 16: Earnings Per Common Share.
Comprehensive Income (Loss)
Comprehensive income (loss) includes all changes in equity during the period, except those resulting from transactions with stockholders. Comprehensive income (loss) comprises net income and the after-tax effect changes in the following items: net unrealized gain (loss) on available-for-sale securities, net unrealized gain (loss) on derivative instruments, and net actuarial gain (loss) related to defined benefit pension and other postretirement benefit plans. Comprehensive income (loss) is reported on the accompanying Consolidated Statements of Stockholders’ Equity and the accompanying Consolidated Statements of Comprehensive Income. Income tax effects of these items are released from Comprehensive income (loss) contemporaneously with the related gross pretax amount. Additional information regarding comprehensive income (loss) can be found within
Note 13: Accumulated Other Comprehensive (Loss), Net of Tax.
Derivative Instruments and Hedging Activities
Derivatives are recognized at fair value and are included in Accrued interest receivable and other assets and Accrued expenses and other liabilities, as applicable, on the accompanying Consolidated Balance Sheets. The value of exchange-traded contracts is based on quoted market prices, whereas non-exchange traded contracts are valued based on dealer quotes, pricing models, discounted cash flow methodologies, or similar techniques in which the determination of fair value may require management judgment or estimation. Net cash flows from derivative contract assets and liabilities are presented within Operating activities on the accompanying Consolidated Statements of Cash Flows.
Derivatives Designated in Hedge Relationships. The Company uses derivatives to hedge exposures or to modify interest rate characteristics for certain balance sheet accounts under its interest rate risk management strategy. The Company designates derivatives in qualifying hedge relationships either as fair value or cash flow hedges for accounting purposes. Derivative financial instruments receive hedge accounting treatment if they are qualified and are properly designated as a hedge, and remain highly effective in offsetting changes in the fair value or cash flows attributable to the risk being hedged, both at hedge inception and on an ongoing basis throughout the life of the hedge. Quarterly prospective and retrospective assessments are performed to ensure hedging relationships continue to be highly effective. If a hedge relationship is no longer highly effective, hedge accounting would be discontinued.
The change in fair value on a derivative that is designated and qualifies as a fair value hedge, as well as the offsetting change in fair value on the hedged item attributable to the risk being hedged, is recognized in earnings. The gain or loss on a derivative that is designated and qualifies as a cash flow hedge is initially recorded as a component of AOCL, and either subsequently reclassified to interest income as hedged interest payments are received or to interest expense as hedged interest payments are made during the same period in which the hedged transaction affects earnings.
Derivatives Not Designated in Hedge Relationships. The Company also enters into derivative transactions that are not designated in hedge relationships. Derivative financial instruments not designated in hedge relationships are recorded at fair value with changes in fair value recognized in Other income on the accompanying Consolidated Statements of Income.
Offsetting Assets and Liabilities. Derivative assets and derivative liabilities with the same counterparty are presented on a net basis in Accrued interest receivable and other assets or Accrued expenses and other liabilities on the accompanying Consolidated Balance Sheets when master netting agreements are in place. Cash collateral paid or received for non-exchange cleared transactions are presented net with the associated derivative assets and derivative liabilities. Securities collateral is not offset. Amounts paid to dealers for initial margin are also included in Accrued interest receivable and other assets. Additional information regarding derivatives can be found within Note 17: Derivative Financial Instruments.
Fair Value Measurements
The Company measures many of its assets and liabilities on a fair value basis in accordance with ASC Topic 820, Fair Value Measurement. Fair value is defined as the price that would be received to sell an asset or paid to transfer a liability in an orderly transaction between market participants at the measurement date. Fair value is used to measure certain assets and liabilities on a recurring basis when fair value is the primary basis of accounting, and on a non-recurring basis when evaluating assets or liabilities for impairment. Additional information regarding the Company’s policies and methodologies used to measure fair value can be found within Note 18: Fair Value Measurements.
Employee Retirement Benefit Plans
The Company sponsors defined contribution postretirement benefit plans that are established under Section 401(k) of the Internal Revenue Code. Expenses to maintain the plans, as well as employer contributions, are charged to Compensation and benefits expense on the accompanying Consolidated Statements of Income.
The Bank had offered a qualified noncontributory defined benefit pension plan and a non-qualified SERP to eligible employees and key executives who met certain age and service requirements, both of which were frozen effective December 31, 2007. The Bank also provides for OPEB to certain retired employees. In connection with the merger with Sterling, the Company also assumed the benefit obligations of Sterling’s non-qualified SERP and OPEB plans.
Pension contributions are funded in accordance with the requirements of the Employee Retirement Income Security Act. Net periodic benefit cost (income), which is based upon actuarial computations of current and future benefits for eligible employees, are charged to Other expense on the accompanying Consolidated Statements of Income. The funded status of the plans is recorded as an asset when over-funded or a liability when under-funded. Additional information regarding the defined benefit pension and postretirement benefit plans can be found within Note 19: Retirement Benefit Plans.
Accounting Standards Adopted During the Current Year
ASU No. 2023-02—Investments—Equity Method and Joint Ventures (Topic 323): Accounting for Investments in Tax Credit Structures Using the Proportional Amortization Method (a consensus of the Emerging Issue Task Force)
In March 2023, the FASB issued ASU No. 2023-02—Investments—Equity Method and Joint Ventures (Topic 323): Accounting for Investments in Tax Credit Structures Using the Proportional Amortization Method (a consensus of the Emerging Issues Task Force), which permits reporting entities to elect to account for their tax equity investments, regardless of the program from which the income tax credits are received, using the proportional amortization method if certain conditions are met. A reporting entity may make an accounting policy election to apply the proportional amortization method in accordance with paragraph 323-740-25-4 on a tax-credit-program by tax-credit-program basis rather than electing to apply the proportional amortization method at the reporting entity level or to individual investments.
A reporting entity that applies the proportional amortization method to qualifying tax equity investments must account for the receipt of the investment tax credits using the flow-through method under Topic 740, Income Taxes, even if the entity applies the deferral method for other investment tax credit received. The amendments also remove certain guidance for Qualified Affordable Housing Project Investments, require the application of the delayed equity contribution guidance to all tax equity investments, and require specific disclosures that must be applied to all investments that generate income tax credits and other income tax benefits from a tax credit program for which the entity has elected to apply the proportional amortization method in accordance with Subtopic 323-740.
The Company adopted the Update on January 1, 2024. The adoption of this guidance did not have a material impact on the Company’s Consolidated Financial Statements and disclosures as its investments in tax credit structures are currently limited to LIHTC investments, which are already being accounted for using the proportional amortization method.
ASU No. 2023-01—Leases (Topic 842): Common Control Arrangements
In March 2023, the FASB issued ASU No. 2023-01—Leases (Topic 842): Common Control Arrangements, which requires that leasehold improvements associated with leases between entities under common control be: (i) amortized by the lessee over the useful lives of the leasehold improvements to the common control group (regardless of the lease term) as long as the lessee controls the use of the underlying asset (the leased asset) through a lease; however, if the lessor obtained the right to control the use of the underlying asset through a lease with another entity not within the same common control group, the amortization period may not exceed the amortization period of the common control group; and (ii) accounted for as a transfer between entities under common control through an adjustment to equity, if, and when, the lessee no longer controls the use of the underlying asset. Additionally, those leasehold improvements are subject to the impairment guidance in Topic 360, Property, Plant, and Equipment.
The Company adopted the Update on January 1, 2024. The adoption of this guidance did not have a material impact on the Company’s Consolidated Financial Statements and disclosures as its operating lease arrangements in which it is lessee are currently not between entities under common control.
ASU No. 2022-03—Fair Value Measurement (Topic 820): Fair Value Measurement of Equity Securities Subject to Contractual Sale Restriction
In June 2022, the FASB issued ASU No. 2022-03—Fair Value Measurement (Topic 820): Fair Value Measurement of Equity Securities Subject to Contractual Sale Restrictions, which clarifies that a contractual restriction on the sale of an equity security is not considered part of the unit of account of the equity security, and therefore, is not considered in measuring fair value. The amendments also clarify that an entity cannot, as a separate unit of account, recognize and measure a contractual sale restriction, and requires the following disclosures for equity securities subject to contractual sale restrictions: (i) the fair value of equity securities subject to contractual sale restrictions reflected on the balance sheet; (ii) the nature and remaining duration of the restriction(s); and (iii) the circumstances that could cause a lapse in the restriction(s).
The Company adopted the Update on January 1, 2024. The adoption of this guidance did not have a material impact on the Company’s Consolidated Financial Statements and disclosures. The Company does not currently consider contractual restrictions on the sale of an equity security in measuring fair value.
ASU No. 2023-07—Segment Reporting (Topic 280): Improvements to Reportable Segment Disclosures
In November 2023, the FASB issued ASU No. 2023-07—Segment Reporting (Topic 280): Improvements to Reportable Segment Disclosures, to improve reportable segment disclosure requirements, primarily through enhanced disclosures about significant segment expenses. Specifically, the amendments in this Update require disclosure of: (i) significant segment expenses that are regularly provided to the chief operating decision maker and included within each reported measure of segment profit or loss; (ii) an amount for other segment items by reportable segment and a description of its composition; and (iii) the title and position of the chief operating decision maker and an explanation of how the chief operating decision maker uses each reported measure of segment profit or loss in assessing segment performance and deciding how to allocate resources.
In addition, all annual disclosures about a reportable segment’s profit or loss and assets currently required by Topic 280, will be required in interim periods. Overall, the Update does not change how a public entity identifies its operating segments, aggregates those operating segments, or determines its reportable segments, or applies the quantitative thresholds to determine its reportable segments.
The Company adopted the Update as of December 31, 2024, on a retrospective basis. Refer to Note 21: Segment Reporting for additional disclosure information.
Relevant Accounting Standards Issued But Not Yet Adopted
ASU No. 2023-09—Income Taxes (Topic 740): Improvements to Income Tax Disclosures
In December 2023, the FASB issued ASU No. 2023-09—Income Taxes (Topic 740): Improvements to Income Tax Disclosures, to provide more transparency about income tax information through improvements to income tax disclosures, primarily related to the rate reconciliation and income taxes paid information. Specifically, the amendments in this Update require disclosure of: (i) a tabular reconciliation, using both percentages and reporting currency amounts, with prescribed categories that are required to be disclosed, and the separate disclosure and disaggregation of prescribed reconciling items with an effect equal to 5% or more of the amount determined by multiplying pretax income from continuing operations by the application statutory rate; (ii) a qualitative description of the states and local jurisdictions that make up the majority (greater than 50%) of the effect of the state and local income taxes; and (iii) amount of income taxes paid, net of refunds received, disaggregated by federal, state, and foreign taxes and by individual jurisdictions that comprise 5% or more of total income taxes paid, net of refunds received. The amendments in this Update also include certain other amendments to improve the effectiveness of income tax disclosures.
The Update is effective for annual periods beginning after December 15, 2024, with early adoption permitted. The amendments should be applied on a prospective basis; however, retrospective application is permitted. The Company is currently evaluating this guidance to determine the impact on its income tax disclosures.
ASU No. 2024-03—Income Statement—Reporting Comprehensive Income—Expense Disaggregation Disclosures
(Subtopic 220-40): Disaggregation of Income Statement Expenses
In November 2024, the FASB issued ASU 2024-03, Income Statement—Reporting Comprehensive Income—Expense Disaggregation Disclosures (Subtopic 220-40): Disaggregation of Income Statement Expenses, which requires entities to disclose specified information about certain costs and expenses in the notes to financial statements at each interim and annual reporting period, including the amounts of (a) purchases of inventory, (b) employee compensation, (c) depreciation, (d) intangible asset amortization, and (e) depletion included in each relevant expense caption. For the employee compensation category, bank holding companies may continue to present compensation expense on the face of the income statement in accordance with Regulation S-X Rule 210.9-04. A qualitative description of the amounts remaining in relevant expense captions that are not separately disaggregated quantitatively are also required to be disclosed. In addition, entities must disclose the total amount of selling expenses and, in annual reporting periods, their definition of selling expenses.
The Update is effective for annual periods beginning after December 15, 2026, and interim periods within fiscal years beginning after December 15, 2027, with early adoption permitted. The amendments may be applied on either a prospective or retrospective basis. The Company is currently evaluating this guidance to determine the impact on its non-interest expense disclosures; however, the impact is not expected to be material.
Note 2: Acquisitions and Joint Ventures
Ametros Acquisition
On January 24, 2024, the Bank acquired all of the equity interest in Ametros from Long Ridge Capital Management (the “Seller”). Ametros is a custodian and administrator of medical funds from insurance claim settlements that helps individuals manage their ongoing medical care through its CareGuard service and proprietary technology platform. The acquisition provided the Bank with a fast-growing source of low-cost and long-duration deposits, new sources of non-interest income, and will enhance its employee benefit and healthcare financial services expertise.
The acquisition was accounted for as a business combination. Accordingly, the total purchase price, which included cash paid of $359.7 million, the forgiveness of $12.9 million in long-term debt, and the assumption of a $5.8 million liability for the Seller’s transaction expenses, has been allocated to the identifiable assets acquired and liabilities assumed based on their acquisition-date fair values, as summarized in the following table: | | | | | |
| (In thousands) | Fair Value |
| Purchase price consideration | $ | 378,424 | |
| Assets: | |
| Cash and due from banks | 310 | |
| Premises and equipment | 1,078 | |
| Other intangible assets | 188,900 | |
| Deferred tax assets, net | (35,889) | |
| Other assets: | |
| Funds held in escrow | 288,167 | |
| Accounts receivable | 2,435 | |
| Prepaid expenses | 1,166 | |
| Total other assets | 291,768 | |
| Total assets acquired | $ | 446,167 | |
| Liabilities: | |
Interest-bearing deposits (1) | (20,622) | |
| Other liabilities: | |
| Accounts payable | 684 | |
| Accrued expenses | 4,270 | |
| Deferred revenue | 20,391 | |
| Members’ funds | 288,167 | |
| Operating lease liabilities | $ | 838 | |
| Total other liabilities | $ | 314,350 | |
| Total liabilities assumed | $ | 293,728 | |
| Net assets acquired | 152,439 | |
Pre-existing equity interest (2) | 2,200 | |
| Goodwill | $ | 228,185 | |
(1)The $20.6 million reflects the amount held in Ametros’ operating cash account at the Bank on January 24, 2024. Upon acquisition, such cash and the Bank’s corresponding deposit liability owed to Ametros were eliminated in consolidation, which resulted in a decrease to interest-bearing deposits for the Bank and the Bank’s legal title to the funds being held in such operating cash account.
(2)Prior to the acquisition date, the Company had a 0.6% equity interest in Ametros. The consideration transferred reflects the purchase price for the remaining 99.4% of the business. Upon acquisition, the Company recognized a $1.5 million gain in Other income on the accompanying Consolidated Statement of Income, which represents the difference between the cost basis and estimated acquisition-date fair value of the Company’s pre-existing equity interest in Ametros.
The Company’s valuations of the assets acquired and liabilities assumed in the Ametros acquisition were considered final as of December 31, 2024. There were no adjustments to fair value estimates recognized during the measurement period. The $228.2 million of goodwill represents future economic benefits arising from acquiring Ametros, primarily due to its strong market position and its assembled workforce, and is not deductible for tax purposes. Information regarding the allocation of goodwill to the Company’s reportable segments can be found within Note 21: Segment Reporting.
The Company incurred $3.1 million of professional and outside services expenses related to the acquisition of Ametros during the first quarter of 2024. The revenue and earnings related to the Ametros business since the acquisition date are included in the Company’s Consolidated Statements of Income for the year ended December 31, 2024, and were not material.
The following is a description of the valuation methodologies used to estimate the fair values of the significant assets acquired and liabilities assumed:
Other intangible assets. The Company identified and recognized a $182.8 million core deposit intangible asset and a
$6.1 million trade name intangible asset. A core deposit intangible asset represents the value of relationships with deposit customers. The fair value of the core deposit intangible asset was estimated using a net cost savings method, a form of discounted cash flow methodology, which gave appropriate consideration to expected client attrition rates and other applicable adjustments to the projected deposit balance, the interest cost and net maintenance cost associated with the client deposit base, an alternative cost of funds, and a discount rate that was used to discount the future economic benefits of the core deposit intangible asset to present value. The core deposit intangible asset is being amortized on an accelerated basis over an estimated useful life of 25 years, which is the period over which the estimated economic benefits are estimated to be received. The fair value of the trade name intangible asset for the Ametros brand was estimated using a relief-from-royalty methodology, which models the cost savings from owning the brand rather than licensing it from a third party. The trade name intangible asset is being amortized on a straight-line basis over an estimated useful life of 5 years.
Funds held in escrow and Members’ funds. Funds held in escrow represent amounts held in interest-bearing checking accounts at insured depository institutions other than the Bank for the purpose of providing post-settlement medical administration services on a respective member’s behalf. Members’ funds is the corresponding liability to the Funds held in escrow. Given that these amounts can be withdrawn and/or directed for use on demand, as long as in accordance with the terms of the settlement agreement, their carrying amount is a reasonable estimate of fair value.
Joint Venture with Marathon Asset Management
On July 19, 2024, the Company, through its subsidiary MW Advisor Holding, LLC, entered into an agreement, with Marathon Asset Management and formed MW Advisors, LLC, a private credit joint venture, which will deliver direct lending solutions for sponsor-backed middle market companies across the country. The Company and Marathon Asset Management each own 50 percent of MW Advisors, LLC. Other than its formation, there was no activity related to MW Advisors, LLC, during the year ended December 31, 2024.
interLINK Acquisition
On January 11, 2023, the Bank acquired 100% ownership of interLINK from StoneCastle Partners LLC. InterLINK is a technology-enabled deposit management platform that administers over $9 billion of deposits from FDIC-insured cash sweep programs between banks and broker/dealers and clearing firms. The acquisition provided the Bank with access to a unique source of core deposit funding and scalable liquidity and added another technology-enabled channel to its already differentiated, omnichannel deposit gathering capabilities.
The total purchase price of the acquisition was $174.6 million, which included cash paid of $158.6 million and $16.0 million of contingent consideration measured at fair value. The contingent consideration is payable in cash upon the achievement of discrete customer and deposit growth events within three years of the acquisition date. Additional information regarding the determination of fair value for contingent consideration liabilities can be found within Note 18: Fair Value Measurements.
The transaction was accounted for as a business combination, and resulted in the addition of $31.4 million in net assets measured at fair value, which primarily comprised $36.0 million of broker dealer relationship intangible assets, $6.0 million of developed technology, a $4.0 million non-competition agreement intangible asset, and $15.9 million of royalty liabilities. The $143.2 million of goodwill recognized is deductible for tax purposes.
Merger with Sterling
On January 31, 2022, the Company completed its merger with Sterling. The Company’s operating results for the years ended December 31, 2024, 2023, and 2022, include the operating results of acquired assets and assumed liabilities of Sterling subsequent to the merger on January 31, 2022. Due to the various conversions of Sterling systems, as well as other streamlining and integration of operating activities into those of the Company, historical reporting for the former Sterling operations after the merger effective date, is impracticable, and thus disclosures of Sterling’s revenue and earnings since the merger effective date that are included in the accompanying Consolidated Statements of Income for the reporting period is impracticable.
Supplemental Pro Forma Financial Information (Unaudited)
The following table summarizes supplemental pro forma financial information giving effect to the merger with Sterling as if it had been completed on January 1, 2021:
| | | | | | | | | | | |
| (In thousands) | | | | | Year ended December 31, 2022 | |
| Net interest income | | | | | $ | 1,961,005 | | | |
| Non-interest income | | | | | 440,783 | | | |
| Net income | | | | | 869,639 | | | |
The supplemental pro forma financial information is presented for informational purposes only and does not necessarily reflect the results of operations that would have occurred had the Company merged with Sterling on January 1, 2021. The supplemental pro forma financial information includes the impact of (i) accreting and amortizing the discounts and premiums associated with the estimated fair value adjustments to acquired loans and leases, investment securities, deposits, and long-term debt, (ii) the amortization of recognized intangible assets, (iii) the elimination of Sterling’s historical accretion and amortization of discounts and premiums and deferred origination fees and costs on loans and leases, (iv) the elimination of Sterling’s historical accretion and amortization of discounts and premiums on investment securities, and (v) the related estimated income tax effects. Cost savings and other business synergies related to the merger are not included in the supplemental pro forma financial information.
In addition, the supplemental pro forma financial information was adjusted for merger-related expenses, as follows: | | | | | | | | | | | | |
| (In thousands) | | | | | | Year ended December 31, 2022 | |
Compensation and benefits (1) | | | | | | $ | 79,001 | | | |
Occupancy (2) | | | | | | 36,586 | | | |
Technology and equipment (3) | | | | | | 24,688 | | | |
| Marketing | | | | | | 416 | | | |
Professional and outside services (4) | | | | | | 73,070 | | | |
Other expense (5) | | | | | | 32,700 | | | |
| Total merger-related expenses | | | | | | $ | 246,461 | | | |
(1)Comprised primarily of employee severance and retention costs, and executive restricted stock awards.
(2)Comprised primarily of charges associated with the Company’s 2022 corporate real estate consolidation plan.
(3)Comprised primarily of technology contract termination costs.
(4)Comprised primarily of advisory, legal, accounting, and other professional fees.
(5)Comprised primarily of disposals on property and equipment, contract termination costs, and other miscellaneous expenses.
Note 3: Investment Securities
Available-for-Sale
The following table summarizes the amortized cost and fair value of available-for-sale securities by major type: | | | | | | | | | | | | | | | | | |
| At December 31, 2024 |
| (In thousands) | Amortized Cost (1) | Unrealized
Gains | Unrealized Losses | Allowance for Credit Losses | Fair Value |
| | | | | |
| Government agency debentures | $ | 222,767 | | $ | — | | $ | (36,341) | | $ | — | | $ | 186,426 | |
| Municipal bonds and notes | 123,885 | | 2 | | (13,011) | | — | | 110,876 | |
| Agency CMO | 32,193 | | — | | (3,150) | | — | | 29,043 | |
| Agency MBS | 4,760,541 | | 11,654 | | (252,410) | | — | | 4,519,785 | |
| Agency CMBS | 3,400,021 | | 84 | | (365,713) | | — | | 3,034,392 | |
| CMBS | 630,985 | | 411 | | (6,008) | | — | | 625,388 | |
| | | | | |
| Corporate debt | 496,087 | | 801 | | (43,755) | | (867) | | 452,266 | |
| Private label MBS | 44,081 | | — | | (4,862) | | — | | 39,219 | |
| Other | 9,855 | | — | | (650) | | — | | 9,205 | |
| Total available-for-sale | $ | 9,720,415 | | $ | 12,952 | | $ | (725,900) | | $ | (867) | | $ | 9,006,600 | |
| | | | | |
| At December 31, 2023 |
| (In thousands) | Amortized Cost (1) | Unrealized
Gains | Unrealized Losses | Allowance for Credit Losses | Fair Value |
| | | | | |
| Government agency debentures | $ | 302,212 | | $ | — | | $ | (37,579) | | $ | — | | $ | 264,633 | |
| Municipal bonds and notes | 1,626,126 | | 8 | | (52,901) | | — | | 1,573,233 | |
| Agency CMO | 52,994 | | — | | (4,053) | | — | | 48,941 | |
| Agency MBS | 3,568,140 | | 32,461 | | (253,503) | | — | | 3,347,098 | |
| Agency CMBS | 2,569,438 | | 18,204 | | (299,571) | | — | | 2,288,071 | |
| CMBS | 788,478 | | — | | (24,729) | | — | | 763,749 | |
| | | | | |
| Corporate debt | 704,569 | | — | | (82,414) | | — | | 622,155 | |
| Private label MBS | 46,635 | | — | | (3,827) | | — | | 42,808 | |
| Other | 9,830 | | — | | (789) | | — | | 9,041 | |
| Total available-for-sale | $ | 9,668,422 | | $ | 50,673 | | $ | (759,366) | | $ | — | | $ | 8,959,729 | |
(1)Accrued interest receivable on available-for-sale securities of $35.2 million and $42.5 million at December 31, 2024, and 2023, respectively, is excluded from amortized cost and is included in Accrued interest receivable and other assets on the accompanying Consolidated Balance Sheets.
Unrealized Losses
The following tables summarize the gross unrealized losses and fair value of available-for-sale securities by length of time each major security type has been in a continuous unrealized loss position: | | | | | | | | | | | | | | | | | | | | | | | | | | | | | |
| | At December 31, 2024 |
| | Less Than 12 Months | | 12 Months or More | | Total |
| (Dollars in thousands) | Fair
Value | Unrealized
Losses | | Fair
Value | Unrealized
Losses | | Number of
Holdings | Fair
Value | Unrealized
Losses |
| | | | | | | | | |
| Government agency debentures | $ | — | | $ | — | | | $ | 186,427 | | $ | (36,341) | | | 15 | $ | 186,427 | | $ | (36,341) | |
| Municipal bonds and notes | 859 | | (1) | | | 108,013 | | (13,010) | | | 57 | 108,872 | | (13,011) | |
| Agency CMO | — | | — | | | 29,043 | | (3,150) | | | 28 | 29,043 | | (3,150) | |
| Agency MBS | 2,624,722 | | (31,539) | | | 1,246,818 | | (220,871) | | | 370 | 3,871,540 | | (252,410) | |
| Agency CMBS | 1,468,615 | | (32,528) | | | 1,540,263 | | (333,185) | | | 185 | 3,008,878 | | (365,713) | |
| CMBS | — | | — | | | 457,423 | | (6,008) | | | 32 | 457,423 | | (6,008) | |
| | | | | | | | | |
| Corporate debt | — | | — | | | 426,805 | | (43,755) | | | 59 | 426,805 | | (43,755) | |
| Private label MBS | — | | — | | | 39,219 | | (4,862) | | | 3 | 39,219 | | (4,862) | |
| Other | — | | — | | | 9,205 | | (650) | | | 2 | 9,205 | | (650) | |
| Total | $ | 4,094,196 | | $ | (64,068) | | | $ | 4,043,216 | | $ | (661,832) | | | 751 | $ | 8,137,412 | | $ | (725,900) | |
| | | | | | | | | | | | | | | | | | | | | | | | | | | | | |
| | At December 31, 2023 |
| | Less Than 12 Months | | 12 Months or More | | Total |
| (Dollars in thousands) | Fair
Value | Unrealized
Losses | | Fair
Value | Unrealized
Losses | | Number of
Holdings | Fair
Value | Unrealized
Losses |
| | | | | | | | | |
| Government agency debentures | $ | — | | $ | — | | | $ | 264,633 | | $ | (37,579) | | | 19 | $ | 264,633 | | $ | (37,579) | |
| Municipal bonds and notes | 18,066 | | (124) | | | 1,536,656 | | (52,777) | | | 386 | 1,554,722 | | (52,901) | |
| Agency CMO | — | | — | | | 48,941 | | (4,053) | | | 36 | 48,941 | | (4,053) | |
| Agency MBS | 71,187 | | (272) | | | 1,945,221 | | (253,231) | | | 457 | 2,016,408 | | (253,503) | |
| Agency CMBS | 430,070 | | (16,137) | | | 1,314,681 | | (283,434) | | | 145 | 1,744,751 | | (299,571) | |
| CMBS | 43,844 | | (856) | | | 719,905 | | (23,873) | | | 42 | 763,749 | | (24,729) | |
| | | | | | | | | |
| Corporate debt | 4,278 | | (27) | | | 617,877 | | (82,387) | | | 91 | 622,155 | | (82,414) | |
| Private label MBS | — | | — | | | 42,808 | | (3,827) | | | 3 | 42,808 | | (3,827) | |
| Other | — | | — | | | 9,041 | | (789) | | | 2 | 9,041 | | (789) | |
| Total | $ | 567,445 | | $ | (17,416) | | | $ | 6,499,763 | | $ | (741,950) | | | 1,181 | $ | 7,067,208 | | $ | (759,366) | |
The $33.5 million decrease in gross unrealized losses of available-for-sale securities from December 31, 2023, to
December 31, 2024, is primarily due to net realized losses on sale, partially offset by increases in market rates. The Company assesses each available-for-sale security that is in an unrealized loss position on a quarterly basis to determine whether the decline in fair value below the amortized cost basis is a result of any credit related factors. During the fourth quarter of 2024, a $0.9 million ACL was recorded related to a single available-for-sale Corporate debt security. Each of the Company’s other available-for-sale securities in an unrealized loss position at December 31, 2024, are investment grade, current as to principal and interest, and their price changes are consistent with interest and credit spreads when adjusting for duration, convexity, rating, and industry differences.
Based on current market conditions and the Company’s targeted balance sheet composition strategy, the Company intends to hold its available-for-sale securities with unrealized loss positions through the anticipated recovery period. The issuers of these available-for-sale securities have not, to the Company’s knowledge, established any cause for default. Market prices are expected to approach par as the securities approach maturity. There was no ACL recorded on available-for-sale securities at December 31, 2023.
Contractual Maturities
The following table summarizes the amortized cost and fair value of available-for-sale securities by contractual maturity: | | | | | | | | | | | |
| At December 31, 2024 |
| (In thousands) | Amortized Cost | | Fair Value |
| Maturing within 1 year | $ | 6,343 | | | $ | 6,322 | |
| After 1 year through 5 years | 248,409 | | | 243,204 | |
| After 5 years through 10 years | 626,884 | | | 576,872 | |
| After 10 years | 8,838,779 | | | 8,180,202 | |
| Total available-for-sale | $ | 9,720,415 | | | $ | 9,006,600 | |
Available-for-sale securities that are not due at a single maturity date have been categorized based on the maturity date of the underlying collateral. Actual principal cash flows may differ from this categorization as borrowers have the right to prepay their obligations with or without prepayment penalties.
Sales of Available-for Sale Securities
The following table summarizes information related to sales of available-for-sales securities: | | | | | | | | | | | | | | | | | |
| Years ended December 31, |
| (In thousands) | 2024 | | 2023 | | 2022 |
| Proceeds from sales | $ | 2,142,462 | | | $ | 789,603 | | | $ | 172,947 | |
| | | | | |
| Gross realized gains | $ | 2,240 | | | $ | — | | | $ | — | |
Gross realized losses (1) | (141,034) | | | (37,356) | | | (6,751) | |
| | | | | |
(1)For the years ended December 31, 2024, and 2023, respectively, $2.6 million and $3.8 million of the gross losses realized on sale of available-for-sale securities were due to credit related factors. Accordingly, these amounts have been included in the Provision for credit losses on the accompanying Consolidated Statements of Income. The $136.2 million and $33.6 million included in
non-interest income for the years ended December 31, 2024, and 2023, respectively, reflected the loss amounts, net of any gross realized gains, that were not due to credit related factors. There were no gross losses realized on sale of available-for-sale securities due to credit related factors for the year ended December 31, 2022.
Other Information
The following table summarizes the carrying value of available-for-sale securities pledged for deposits, borrowings, and other purposes: | | | | | | | | | | | |
| At December 31, |
| (In thousands) | 2024 | | 2023 |
| Pledged for deposits | $ | 1,596,378 | | $ | 2,102,115 |
| Pledged for borrowings and other | 6,863,183 | | 6,111,430 |
| Total available-for-sale securities pledged | $ | 8,459,561 | | $ | 8,213,545 |
Held-to-Maturity
The following table summarizes the amortized cost, fair value, and ACL on held-to-maturity securities by major type: | | | | | | | | | | | | | | | | | | | | | | | |
| At December 31, 2024 |
| (In thousands) | Amortized Cost (1) | Unrealized Gains | Unrealized Losses | Fair Value | | Allowance for Credit Losses | Net Carrying Value |
| Agency CMO | $ | 19,847 | | $ | — | | $ | (1,671) | | $ | 18,176 | | | $ | — | | $ | 19,847 | |
| Agency MBS | 3,109,411 | | 771 | | (333,039) | | 2,777,143 | | | — | | 3,109,411 | |
| Agency CMBS | 4,357,505 | | 414 | | (613,914) | | 3,744,005 | | | — | | 4,357,505 | |
| Municipal bonds and notes | 891,909 | | 317 | | (40,266) | | 851,960 | | | 171 | | 891,738 | |
| CMBS | 65,690 | | — | | (3,851) | | 61,839 | | | — | | 65,690 | |
| Total held-to-maturity | $ | 8,444,362 | | $ | 1,502 | | $ | (992,741) | | $ | 7,453,123 | | | $ | 171 | | $ | 8,444,191 | |
| | | | | | | |
| At December 31, 2023 |
| (In thousands) | Amortized Cost (1) | Unrealized Gains | Unrealized Losses | Fair Value | | Allowance for Credit Losses | Net Carrying Value |
| Agency CMO | $ | 23,470 | | $ | — | | $ | (1,728) | | $ | 21,742 | | | $ | — | | $ | 23,470 | |
| Agency MBS | 2,409,521 | | 1,141 | | (284,776) | | 2,125,886 | | | — | | 2,409,521 | |
| Agency CMBS | 3,625,627 | | 18,586 | | (514,534) | | 3,129,679 | | | — | | 3,625,627 | |
| Municipal bonds and notes | 916,104 | | 2,440 | | (24,877) | | 893,667 | | | 209 | | 915,895 | |
| CMBS | 100,075 | | — | | (6,426) | | 93,649 | | | — | | 100,075 | |
| Total held-to-maturity | $ | 7,074,797 | | $ | 22,167 | | $ | (832,341) | | $ | 6,264,623 | | | $ | 209 | | $ | 7,074,588 | |
(1)Accrued interest receivable on held-to-maturity securities of $30.5 million and $24.9 million at December 31, 2024, and 2023, respectively, is excluded from amortized cost and is included in Accrued interest receivable and other assets on the accompanying Consolidated Balance Sheets.
An ACL on held-to-maturity securities is recorded for certain Municipal bonds and notes to account for expected lifetime credit losses. Agency securities represent obligations issued by a U.S. government-sponsored enterprise or other federally related entity and are either explicitly or implicitly guaranteed, and therefore, assumed to be zero loss. Held-to-maturity securities with gross unrealized losses and no ACL are considered to be high credit quality, and therefore, zero credit loss has been recorded.
The following table summarizes the activity in the ACL on held-to-maturity securities: | | | | | | | | | | | | | | | | | |
| Years ended December 31, |
| (In thousands) | 2024 | | 2023 | | 2022 |
| Balance, beginning of period | $ | 209 | | $ | 182 | | $ | 214 |
| | | | | |
| (Benefit) provision for credit losses | (38) | | 27 | | (32) |
| Balance, end of period | $ | 171 | | $ | 209 | | $ | 182 |
Contractual Maturities
The following table summarizes the amortized cost and fair value of held-to-maturity securities by contractual maturity: | | | | | | | | | | | |
| At December 31, 2024 |
| (In thousands) | Amortized Cost | | Fair Value |
| Maturing within 1 year | $ | 49,231 | | | $ | 49,217 | |
| After 1 year through 5 years | 158,778 | | | 149,418 | |
| After 5 years through 10 years | 241,456 | | | 233,792 | |
| After 10 years | 7,994,897 | | | 7,020,696 | |
| Total held-to-maturity | $ | 8,444,362 | | | $ | 7,453,123 | |
Held-to-maturity securities that are not due at a single maturity date have been categorized based on the maturity date of the underlying collateral. Actual principal cash flows may differ from this categorization as borrowers have the right to prepay their obligations with or without prepayment penalties.
Credit Quality Information
The Company monitors the credit quality of held-to-maturity securities through credit ratings provided by Standard & Poor’s Rating Services, Moody’s Investor Services, Fitch Ratings, Inc., Kroll Bond Rating Agency, or DBRS Inc. Credit ratings express opinions about the credit quality of a security and are updated at each quarter end. Investment grade securities are rated BBB- or higher by S&P, or Baa3 or higher by Moody’s, and are generally considered by the rating agencies and market participants to be of low credit risk. Conversely, securities rated below investment grade, which are labeled as speculative grade by the rating agencies, are considered to have distinctively higher credit risk than investment grade securities. At December 31, 2024, and 2023, there were no speculative grade held-to-maturity securities. Held-to-maturity securities that are not rated are collateralized with U.S. Treasury obligations.
The following tables summarize the amortized cost of held-to-maturity securities based on their lowest publicly available credit rating: | | | | | | | | | | | | | | | | | | | | | | | | | | | | |
| At December 31, 2024 |
| Investment Grade | | |
| (In thousands) | Aaa | Aa1 | Aa2 | Aa3 | A1 | | A3 | | | Not Rated |
| Agency CMOs | $ | — | | $ | 19,847 | | $ | — | | $ | — | | $ | — | | | $ | — | | | | $ | — | |
| Agency MBS | — | | 3,109,411 | | — | | — | | — | | | — | | | | — | |
| Agency CMBS | — | | 4,357,505 | | — | | — | | — | | | — | | | | — | |
| Municipal bonds and notes | 341,187 | | 158,327 | | 230,986 | | 128,692 | | 13,761 | | | 4,165 | | | | 14,791 | |
| CMBS | 65,690 | | — | | — | | — | | — | | | — | | | | — | |
| Total held-to-maturity | $ | 406,877 | | $ | 7,645,090 | | $ | 230,986 | | $ | 128,692 | | $ | 13,761 | | | $ | 4,165 | | | | $ | 14,791 | |
| | | | | | | | | | |
| | | | | | | | | | | | | | | | | | | | | | | | | | | | |
| At December 31, 2023 |
| Investment Grade | | |
| (In thousands) | Aaa | Aa1 | Aa2 | Aa3 | A1 | | A3 | | | Not Rated |
| Agency CMOs | $ | — | | $ | 23,470 | | $ | — | | $ | — | | $ | — | | | $ | — | | | | $ | — | |
| Agency MBS | — | | 2,409,521 | | — | | — | | — | | | — | | | | — | |
| Agency CMBS | — | | 3,625,627 | | — | | — | | — | | | — | | | | — | |
| Municipal bonds and notes | 333,479 | | 162,615 | | 253,671 | | 115,404 | | 32,732 | | | 4,165 | | | | 14,038 | |
| CMBS | 100,075 | | — | | — | | — | | — | | | — | | | | — | |
| Total held-to-maturity | $ | 433,554 | | $ | 6,221,233 | | $ | 253,671 | | $ | 115,404 | | $ | 32,732 | | | $ | 4,165 | | | | $ | 14,038 | |
| | | | | | | | | | |
At December 31, 2024, and 2023, there were no held-to-maturity debt securities past due under the terms of their agreements or in non-accrual status.Other Information
The following table summarizes the carrying value of held-to-maturity securities pledged for deposits, borrowings, and other purposes: | | | | | | | | | | | |
| At December 31, |
| (In thousands) | 2024 | | 2023 |
| Pledged for deposits | $ | 1,978,445 | | $ | 1,212,824 |
| Pledged for borrowings and other | 6,258,828 | | 5,582,379 |
| Total held-to-maturity securities pledged | $ | 8,237,273 | | $ | 6,795,203 |
Note 4: Loans and Leases
The following table summarizes loans and leases by portfolio segment and class: | | | | | | | | | | | |
| At December 31, |
| (In thousands) | 2024 | | 2023 |
| Commercial non-mortgage | $ | 18,037,942 | | | $ | 16,885,475 | |
| Asset-based | 1,404,007 | | | 1,557,841 | |
| Commercial real estate | 14,492,436 | | | 13,569,762 | |
| Multi-family | 6,898,600 | | | 7,587,970 | |
| Equipment financing | 1,235,016 | | | 1,328,786 | |
| | | |
| Commercial portfolio | 42,068,001 | | | 40,929,834 | |
| Residential | 8,853,669 | | | 8,227,923 | |
| Home equity | 1,427,692 | | | 1,516,955 | |
| Other consumer | 155,806 | | | 51,340 | |
| Consumer portfolio | 10,437,167 | | | 9,796,218 | |
| Loans and leases | $ | 52,505,168 | | | $ | 50,726,052 | |
The carrying amount of loans and leases at December 31, 2024, and 2023, includes net unamortized (discounts)/premiums and net unamortized deferred (fees)/costs, in aggregate, of $(1.8) million and $(33.8) million, respectively. Accrued interest receivable of $265.0 million and $270.4 million at December 31, 2024, and 2023, respectively, is excluded from the carrying amount of loans and leases and is included in Accrued interest receivable and other assets on the accompanying Consolidated Balance Sheets. At December 31, 2024, the Company had pledged $17.9 billion and $2.9 billion of eligible loans as collateral to support borrowing capacity at the FHLB and FRB, respectively.
Non-Accrual and Past Due Loans and Leases
The following tables summarize the aging of accrual and non-accrual loans and leases by class: | | | | | | | | | | | | | | | | | | | | | | | |
| | At December 31, 2024 |
| (In thousands) | 30-59 Days
Past Due and
Accruing | 60-89 Days
Past Due and
Accruing | 90 or More Days Past Due
and Accruing | Non-accrual | Total
Past Due and
Non-accrual | Current (1) | Total Loans
and Leases |
| Commercial non-mortgage | $ | 3,949 | | $ | 3,318 | | $ | — | | $ | 248,078 | | $ | 255,345 | | $ | 17,782,597 | | $ | 18,037,942 | |
| Asset-based | — | | 21,997 | | — | | 20,787 | | 42,784 | | 1,361,223 | | 1,404,007 | |
| Commercial real estate | 22,115 | | 558 | | — | | 120,151 | | 142,824 | | 14,349,612 | | 14,492,436 | |
| Multi-family | 2,508 | | 26,377 | | — | | 18,043 | | 46,928 | | 6,851,672 | | 6,898,600 | |
| Equipment financing | 6,096 | | 3,300 | | — | | 19,367 | | 28,763 | | 1,206,253 | | 1,235,016 | |
| | | | | | | |
| Commercial portfolio | 34,668 | | 55,550 | | — | | 426,426 | | 516,644 | | 41,551,357 | | 42,068,001 | |
| Residential | 9,595 | | 4,604 | | — | | 12,750 | | 26,949 | | 8,826,720 | | 8,853,669 | |
| Home equity | 6,273 | | 2,381 | | — | | 21,425 | | 30,079 | | 1,397,613 | | 1,427,692 | |
| Other consumer | 349 | | 162 | | — | | 124 | | 635 | | 155,171 | | 155,806 | |
| Consumer portfolio | 16,217 | | 7,147 | | — | | 34,299 | | 57,663 | | 10,379,504 | | 10,437,167 | |
| Total | $ | 50,885 | | $ | 62,697 | | $ | — | | $ | 460,725 | | $ | 574,307 | | $ | 51,930,861 | | $ | 52,505,168 | |
(1)At December 31, 2024, there were $32.7 million commercial loans that had reached their contractual maturity but were actively in the process of being refinanced with the Company. Due to the status of the refinancing, these commercial loans have been reported as current in the table above. In January 2025, all of such commercial loans were approved and refinanced.
| | | | | | | | | | | | | | | | | | | | | | | |
| | At December 31, 2023 |
| (In thousands) | 30-59 Days
Past Due and
Accruing | 60-89 Days
Past Due and
Accruing | 90 or More Days Past Due
and Accruing | Non-accrual | Total
Past Due and
Non-accrual | Current | Total Loans
and Leases |
| Commercial non-mortgage | $ | 2,270 | | $ | 890 | | $ | 94 | | $ | 122,855 | | $ | 126,109 | | $ | 16,759,366 | | $ | 16,885,475 | |
| Asset-based | — | | — | | — | | 35,068 | | 35,068 | | 1,522,773 | | 1,557,841 | |
| Commercial real estate | 1,459 | | — | | 184 | | 11,383 | | 13,026 | | 13,556,736 | | 13,569,762 | |
| Multi-family | 5,198 | | 2,340 | | — | | — | | 7,538 | | 7,580,432 | | 7,587,970 | |
| Equipment financing | 3,966 | | 8 | | — | | 9,828 | | 13,802 | | 1,314,984 | | 1,328,786 | |
| | | | | | | |
| Commercial portfolio | 12,893 | | 3,238 | | 278 | | 179,134 | | 195,543 | | 40,734,291 | | 40,929,834 | |
| Residential | 14,894 | | 6,218 | | — | | 5,704 | | 26,816 | | 8,201,107 | | 8,227,923 | |
| Home equity | 5,676 | | 3,285 | | — | | 23,545 | | 32,506 | | 1,484,449 | | 1,516,955 | |
| Other consumer | 410 | | 94 | | — | | 142 | | 646 | | 50,694 | | 51,340 | |
| Consumer portfolio | 20,980 | | 9,597 | | — | | 29,391 | | 59,968 | | 9,736,250 | | 9,796,218 | |
| Total | $ | 33,873 | | $ | 12,835 | | $ | 278 | | $ | 208,525 | | $ | 255,511 | | $ | 50,470,541 | | $ | 50,726,052 | |
The following table provides additional information on non-accrual loans and leases: | | | | | | | | | | | | | | | | | |
| At December 31, |
| 2024 | | 2023 |
| (In thousands) | Non-accrual | Non-accrual With No Allowance | | Non-accrual | Non-accrual With No Allowance |
| Commercial non-mortgage | $ | 248,078 | | $ | 50,943 | | | $ | 122,855 | | $ | 20,066 | |
| Asset-based | 20,787 | | 1,080 | | | 35,068 | | 1,330 | |
| Commercial real estate | 120,151 | | 26,666 | | | 11,383 | | 2,681 | |
| Multi-family | 18,043 | | 17,953 | | | — | | — | |
| Equipment financing | 19,367 | | 1,809 | | | 9,828 | | 1,584 | |
| | | | | |
| Commercial portfolio | 426,426 | | 98,451 | | | 179,134 | | 25,661 | |
| Residential | 12,750 | | 6,923 | | | 5,704 | | 856 | |
| Home equity | 21,425 | | 12,225 | | | 23,545 | | 12,471 | |
| Other consumer | 124 | | 3 | | | 142 | | 49 | |
| Consumer portfolio | 34,299 | | 19,151 | | | 29,391 | | 13,376 | |
| Total | $ | 460,725 | | $ | 117,602 | | | $ | 208,525 | | $ | 39,037 | |
Additional interest income on non-accrual loans and leases that would have been recognized in the Consolidated Statements of Income had the loans and leases been current in accordance with their contractual terms was $45.4 million, $22.9 million, and $16.9 million for the years ended December 31, 2024, 2023, and 2022, respectively.
Allowance for Credit Losses on Loans and Leases
The following tables summarize the change in the ACL on loans and leases by portfolio segment:
| | | | | | | | | | | | | | | | | | | | | | | | | | | | | | | | | | | |
| | At or for the Years ended December 31, |
| 2024 | | 2023 | | 2022 |
| (In thousands) | Commercial Portfolio | Consumer Portfolio | Total | | Commercial Portfolio | Consumer Portfolio | Total | | Commercial Portfolio | Consumer Portfolio | Total |
| ACL on loans and leases: | | | | | | | | | | | |
| Balance, beginning of period | $ | 577,663 | | $ | 58,074 | | $ | 635,737 | | | $ | 533,125 | | $ | 61,616 | | $ | 594,741 | | | $ | 257,877 | | $ | 43,310 | | $ | 301,187 | |
| Adoption of ASU No. 2022-02 | — | | — | | — | | | 7,704 | | (1,831) | | 5,873 | | | — | | — | | — | |
Initial allowance for PCD loans and leases (1) | — | | — | | — | | | — | | — | | — | | | 78,376 | | 9,669 | | 88,045 | |
| Provision (benefit) | 225,599 | | (4,856) | | 220,743 | | | 138,057 | | 5,152 | | 143,209 | | | 268,295 | | 4,502 | | 272,797 | |
| Charge-offs | (171,460) | | (5,010) | | (176,470) | | | (104,509) | | (12,703) | | (117,212) | | | (82,860) | | (4,662) | | (87,522) | |
| Recoveries | 4,069 | | 5,487 | | 9,556 | | | 3,286 | | 5,840 | | 9,126 | | | 11,437 | | 8,797 | | 20,234 | |
| Balance, end of period | $ | 635,871 | | $ | 53,695 | | $ | 689,566 | | | $ | 577,663 | | $ | 58,074 | | $ | 635,737 | | | $ | 533,125 | | $ | 61,616 | | $ | 594,741 | |
| Individually evaluated for credit losses | 68,013 | | 693 | | 68,706 | | | 43,559 | | 4,635 | | 48,194 | | | 34,793 | | 12,441 | | 47,234 | |
| Collectively evaluated for credit losses | $ | 567,858 | | $ | 53,002 | | $ | 620,860 | | | $ | 534,104 | | $ | 53,439 | | $ | 587,543 | | | $ | 498,332 | | $ | 49,175 | | $ | 547,507 | |
(1)Represents the establishment of the initial reserve for PCD loans and leases, which is reported net of $48.3 million of day one charge-offs recognized at the date of acquisition in accordance with GAAP.
Concentrations of Credit Risk
Concentrations of credit risk may exist when a number of borrowers are engaged in similar activities, or activities in the same geographic region, and have similar economic characteristics that would cause them to be similarly impacted by changes in economic or other conditions. Concentrations of credit risk are controlled and monitored as part of the Company’s credit policies and procedures. The Company is a regional financial services holding company in the Northeast U.S. with a geographic concentration primarily in five geographic markets: New York City, Other New York Counties, Connecticut, New Jersey, and Massachusetts; and secondarily in the Southeast and Other states. At December 31, 2024, and 2023, the Company’s concentration of credit risk associated with commercial real estate and multi-family loans represented 40.7 percent and
41.7 percent of total loans and leases, respectively. At December 31, 2024, and 2023, the Company’s concentration of credit risk associated with commercial non-mortage loans represented 34.4 percent and 33.3 percent of total loans and leases, respectively.
Credit Quality Indicators
To measure credit risk for the commercial portfolio, the Company employs a dual grade credit risk grading system for estimating the PD and LGD. The credit risk grade system assigns a rating to each borrower and to the facility, which together form a Composite Credit Risk Profile. The credit risk grade system categorizes borrowers by common financial characteristics that measure the credit strength of borrowers and facilities by common structural characteristics. The Composite Credit Risk Profile has ten grades, with each grade corresponding to a progressively greater risk of loss. Grades (1) to (6) are considered pass ratings, and grades (7) to (10) are considered criticized, as defined by the regulatory agencies. A (7) “Special Mention” rating has a potential weakness that, if left uncorrected, may result in deterioration of the repayment prospects for the asset. An (8) “Substandard” rating has a well-defined weakness that jeopardizes the full repayment of the debt. A (9) “Doubtful” rating has all of the same weaknesses as a substandard asset with the added characteristic that the weakness makes collection or liquidation in full, given current facts, conditions, and values, improbable. Assets classified as a (10) “Loss” rating are considered uncollectible and charged-off. Risk ratings, which are assigned to differentiate risk within the portfolio, are reviewed on an ongoing basis and revised to reflect changes in a borrower’s current financial position and outlook, risk profile, and the related collateral and structural position. Loan officers review updated financial information or other loan factors on at least an annual basis for all pass rated loans to assess the accuracy of the risk grade. Criticized loans undergo more frequent reviews and enhanced monitoring.
To measure credit risk for the consumer portfolio, the most relevant credit characteristic is the FICO score, which is a widely used credit scoring system that ranges from 300 to 850. A lower FICO score is indicative of higher credit risk and a higher FICO score is indicative of lower credit risk. FICO scores are updated at least quarterly. Factors such as past due status, employment status, collateral, geography, loans discharged in bankruptcy, and the status of first lien position loans on second lien position loans, are also considered to be consumer portfolio credit quality indicators. For portfolio monitoring purposes, the Company estimates the current value of property secured as collateral for home equity and residential first mortgage lending products on an ongoing basis. The estimate is based on home price indices compiled by the S&P/Case-Shiller Home Price Indices. Real estate price data is applied to the loan portfolios taking into account the age of the most recent valuation and geographic area.
The following tables summarize the amortized cost basis of commercial loans and leases by Composite Credit Risk Profile grade and origination year:
| | | | | | | | | | | | | | | | | | | | | | | | | | |
| At December 31, 2024 |
| (In thousands) | 2024 | 2023 | 2022 | 2021 | 2020 | Prior | Revolving Loans Amortized Cost Basis | Total |
| Commercial non-mortgage: | | | | | | | | |
| Risk rating: | | | | | | | | |
| Pass | $ | 2,917,048 | | $ | 1,916,905 | | $ | 2,818,720 | | $ | 1,100,575 | | $ | 562,252 | | $ | 1,211,312 | | $ | 6,325,637 | | $ | 16,852,449 | |
| Special mention | 31,587 | | 66,770 | | 156,555 | | 51,055 | | 30,669 | | 4,203 | | 44,017 | | 384,856 | |
| Substandard | 56,307 | | 125,735 | | 237,362 | | 92,134 | | 16,466 | | 63,998 | | 208,608 | | 800,610 | |
| Doubtful | — | | — | | — | | 1 | | — | | 25 | | 1 | | 27 | |
| Total commercial non-mortgage | 3,004,942 | | 2,109,410 | | 3,212,637 | | 1,243,765 | | 609,387 | | 1,279,538 | | 6,578,263 | | 18,037,942 | |
| Current period gross write-offs | — | | 11,894 | | 45,308 | | 10,668 | | 3,842 | | 3,385 | | 15,169 | | 90,266 | |
| Asset-based: | | | | | | | | |
| Risk rating: | | | | | | | | |
| Pass | 1,250 | | 11,684 | | — | | — | | — | | 20,255 | | 1,132,901 | | 1,166,090 | |
| Special mention | — | | — | | — | | — | | — | | 5,226 | | 90,372 | | 95,598 | |
| Substandard | — | | 2,562 | | — | | — | | — | | 1,239 | | 138,518 | | 142,319 | |
| Total asset-based | 1,250 | | 14,246 | | — | | — | | — | | 26,720 | | 1,361,791 | | 1,404,007 | |
| Current period gross write-offs | — | | — | | — | | — | | — | | — | | 6,091 | | 6,091 | |
| Commercial real estate: | | | | | | | | |
| Risk rating: | | | | | | | | |
| Pass | 1,867,468 | | 2,334,965 | | 3,186,098 | | 1,462,814 | | 944,367 | | 3,465,817 | | 197,998 | | 13,459,527 | |
| Special mention | — | | 12,809 | | 175,252 | | 37,307 | | 37,469 | | 64,483 | | — | | 327,320 | |
| Substandard | — | | 131,108 | | 69,829 | | 121,139 | | 112,582 | | 262,079 | | 8,852 | | 705,589 | |
| | | | | | | | |
| Total commercial real estate | 1,867,468 | | 2,478,882 | | 3,431,179 | | 1,621,260 | | 1,094,418 | | 3,792,379 | | 206,850 | | 14,492,436 | |
| Current period gross write-offs | — | | 854 | | 1,244 | | 1,579 | | 15,477 | | 22,674 | | — | | 41,828 | |
| Multi-family: | | | | | | | | |
| Risk rating: | | | | | | | | |
| Pass | 582,363 | | 1,394,855 | | 1,314,395 | | 862,273 | | 245,802 | | 2,179,207 | | 16,991 | | 6,595,886 | |
| Special mention | — | | 14,365 | | 93,396 | | 18,790 | | 70,908 | | 8,588 | | — | | 206,047 | |
| Substandard | — | | — | | 16,761 | | 27,102 | | 26,720 | | 26,084 | | — | | 96,667 | |
| | | | | | | | |
| | | | | | | | |
| Total multi-family | 582,363 | | 1,409,220 | | 1,424,552 | | 908,165 | | 343,430 | | 2,213,879 | | 16,991 | | 6,898,600 | |
| Current period gross write-offs | — | | — | | — | | 4,955 | | 6,264 | | 11,678 | | — | | 22,897 | |
| Equipment financing: | | | | | | | | |
| Risk rating: | | | | | | | | |
| Pass | 382,783 | | 242,440 | | 207,081 | | 126,399 | | 83,838 | | 124,910 | | — | | 1,167,451 | |
| Special mention | 1,298 | | 231 | | — | | 55 | | — | | — | | — | | 1,584 | |
| Substandard | 572 | | 16,228 | | 18,341 | | 16,970 | | 5,514 | | 8,356 | | — | | 65,981 | |
| Total equipment financing | 384,653 | | 258,899 | | 225,422 | | 143,424 | | 89,352 | | 133,266 | | — | | 1,235,016 | |
| Current period gross write-offs | — | | 5,146 | | 1,705 | | 52 | | — | | 3,475 | | — | | 10,378 | |
| | | | | | | | |
| | | | | | | | |
| | | | | | | | |
| | | | | | | | |
| | | | | | | | |
| Total commercial portfolio | 5,840,676 | | 6,270,657 | | 8,293,790 | | 3,916,614 | | 2,136,587 | | 7,445,782 | | 8,163,895 | | 42,068,001 | |
| Current period gross write-offs | $ | — | | $ | 17,894 | | $ | 48,257 | | $ | 17,254 | | $ | 25,583 | | $ | 41,212 | | $ | 21,260 | | $ | 171,460 | |
| | | | | | | | | | | | | | | | | | | | | | | | | | |
| At December 31, 2023 |
| (In thousands) | 2023 | 2022 | 2021 | 2020 | 2019 | Prior | Revolving Loans Amortized Cost Basis | Total |
| Commercial non-mortgage: | | | | | | | | |
| Pass | $ | 2,602,444 | | $ | 4,089,327 | | $ | 1,371,139 | | $ | 711,362 | | $ | 610,199 | | $ | 952,097 | | $ | 5,970,588 | | $ | 16,307,156 | |
| Special mention | 15,184 | | 60,240 | | 61,235 | | 33,111 | | — | | 720 | | 48,561 | | 219,051 | |
| Substandard | 48,849 | | 104,087 | | 23,258 | | 28,222 | | 44,612 | | 30,426 | | 79,778 | | 359,232 | |
| Doubtful | — | | 8 | | — | | — | | 3 | | 25 | | — | | 36 | |
| Total commercial non-mortgage | 2,666,477 | | 4,253,662 | | 1,455,632 | | 772,695 | | 654,814 | | 983,268 | | 6,098,927 | | 16,885,475 | |
| Current period gross write-offs | 325 | | 7,637 | | 1,775 | | 512 | | 969 | | 4,391 | | — | | 15,609 | |
| Asset-based: | | | | | | | | |
| Pass | 23,007 | | — | | — | | — | | 3,280 | | 34,999 | | 1,333,271 | | 1,394,557 | |
| Special mention | 651 | | 763 | | — | | — | | 3,676 | | — | | 29,610 | | 34,700 | |
| Substandard | — | | — | | — | | — | | 1,330 | | — | | 127,254 | | 128,584 | |
| Total asset-based | 23,658 | | 763 | | — | | — | | 8,286 | | 34,999 | | 1,490,135 | | 1,557,841 | |
| Current period gross write-offs | — | | — | | — | | — | | 13,189 | | 3,900 | | — | | 17,089 | |
| Commercial real estate: | | | | | | | | |
| Pass | 2,265,428 | | 3,502,425 | | 1,831,005 | | 1,195,732 | | 1,193,642 | | 3,112,770 | | 176,668 | | 13,277,670 | |
| Special mention | 850 | | 4,675 | | 14,463 | | 31,405 | | 23,443 | | 37,688 | | 1,210 | | 113,734 | |
| Substandard | 25,802 | | 16,179 | | 9,545 | | 15,418 | | 58,602 | | 52,812 | | — | | 178,358 | |
| | | | | | | | |
| Total commercial real estate | 2,292,080 | | 3,523,279 | | 1,855,013 | | 1,242,555 | | 1,275,687 | | 3,203,270 | | 177,878 | | 13,569,762 | |
| Current period gross write-offs | 4,632 | | — | | 12,617 | | 3,813 | | 2,754 | | 38,569 | | — | | 62,385 | |
| Multi-family: | | | | | | | | |
| Pass | 1,597,599 | | 1,934,100 | | 1,041,416 | | 442,888 | | 595,676 | | 1,920,618 | | — | | 7,532,297 | |
| Special mention | — | | — | | — | | — | | 260 | | 35,942 | | — | | 36,202 | |
| Substandard | — | | — | | — | | 364 | | 11,563 | | 7,544 | | — | | 19,471 | |
| Total multi-family | 1,597,599 | | 1,934,100 | | 1,041,416 | | 443,252 | | 607,499 | | 1,964,104 | | — | | 7,587,970 | |
| Current period gross write-offs | — | | — | | — | | — | | — | | 3,447 | | — | | 3,447 | |
| Equipment financing: | | | | | | | | |
| Pass | 335,874 | | 297,186 | | 232,304 | | 176,061 | | 183,679 | | 69,927 | | — | | 1,295,031 | |
| Special mention | — | | — | | 116 | | — | | 90 | | — | | — | | 206 | |
| Substandard | — | | 9,144 | | 8,064 | | 6,600 | | 4,285 | | 5,456 | | — | | 33,549 | |
| Total equipment financing | 335,874 | | 306,330 | | 240,484 | | 182,661 | | 188,054 | | 75,383 | | — | | 1,328,786 | |
| Current period gross write-offs | — | | — | | — | | 2,633 | | 3,304 | | 42 | | — | | 5,979 | |
| | | | | | | | |
| | | | | | | | |
| | | | | | | | |
| Total commercial portfolio | 6,915,688 | | 10,018,134 | | 4,592,545 | | 2,641,163 | | 2,734,340 | | 6,261,024 | | 7,766,940 | | 40,929,834 | |
| Current period gross write-offs | $ | 4,957 | | $ | 7,637 | | $ | 14,392 | | $ | 6,958 | | $ | 20,216 | | $ | 50,349 | | $ | — | | $ | 104,509 | |
The following tables summarize the amortized cost basis of consumer loans by FICO score and origination year: | | | | | | | | | | | | | | | | | | | | | | | | | | |
| At December 31, 2024 |
| (In thousands) | 2024 | 2023 | 2022 | 2021 | 2020 | Prior | Revolving Loans Amortized Cost Basis | Total |
| Residential: | | | | | | | | |
| Risk rating: | | | | | | | | |
| 800+ | $ | 312,771 | | $ | 299,006 | | $ | 909,109 | | $ | 1,097,807 | | $ | 433,950 | | $ | 956,478 | | $ | — | | $ | 4,009,121 | |
| 740-799 | 649,118 | | 258,699 | | 567,545 | | 656,599 | | 235,749 | | 623,989 | | — | | 2,991,699 | |
| 670-739 | 172,886 | | 123,354 | | 317,373 | | 271,247 | | 80,318 | | 550,252 | | — | | 1,515,430 | |
| 580-669 | 16,643 | | 13,382 | | 55,507 | | 35,292 | | 16,738 | | 109,240 | | — | | 246,802 | |
| 579 and below | 237 | | 2,680 | | 12,617 | | 21,387 | | 3,791 | | 49,905 | | — | | 90,617 | |
| Total residential | 1,151,655 | | 697,121 | | 1,862,151 | | 2,082,332 | | 770,546 | | 2,289,864 | | — | | 8,853,669 | |
| Current period gross write-offs | — | | — | | — | | — | | — | | 147 | | — | | 147 | |
| Home equity: | | | | | | | | |
| Risk rating: | | | | | | | | |
| 800+ | 12,313 | | 25,226 | | 23,512 | | 32,695 | | 22,705 | | 53,844 | | 365,741 | | 536,036 | |
| 740-799 | 12,238 | | 21,831 | | 20,718 | | 23,517 | | 10,861 | | 33,703 | | 330,691 | | 453,559 | |
| 670-739 | 11,416 | | 14,298 | | 12,732 | | 13,074 | | 6,242 | | 28,638 | | 224,449 | | 310,849 | |
| 580-669 | 1,755 | | 2,570 | | 1,685 | | 2,172 | | 754 | | 9,471 | | 67,745 | | 86,152 | |
| 579 and below | 58 | | 799 | | 2,401 | | 726 | | 429 | | 4,254 | | 32,429 | | 41,096 | |
| Total home equity | 37,780 | | 64,724 | | 61,048 | | 72,184 | | 40,991 | | 129,910 | | 1,021,055 | | 1,427,692 | |
| Current period gross write-offs | — | | — | | — | | — | | 2 | | 444 | | 351 | | 797 | |
| Other consumer: | | | | | | | | |
| Risk rating: | | | | | | | | |
| 800+ | 4,920 | | 312 | | 218 | | 1,765 | | 50 | | 284 | | 31,549 | | 39,098 | |
| 740-799 | 45,001 | | 721 | | 301 | | 165 | | 124 | | 266 | | 3,550 | | 50,128 | |
| 670-739 | 57,952 | | 432 | | 372 | | 313 | | 220 | | 188 | | 3,349 | | 62,826 | |
| 580-669 | 1,417 | | 116 | | 105 | | 69 | | 25 | | 81 | | 1,150 | | 2,963 | |
| 579 and below | 29 | | 93 | | 63 | | 28 | | 9 | | — | | 569 | | 791 | |
| Total other consumer | 109,319 | | 1,674 | | 1,059 | | 2,340 | | 428 | | 819 | | 40,167 | | 155,806 | |
| Current period gross write-offs | 3,467 | | 17 | | 34 | | 20 | | 113 | | 193 | | 222 | | 4,066 | |
| Total consumer portfolio | 1,298,754 | | 763,519 | | 1,924,258 | | 2,156,856 | | 811,965 | | 2,420,593 | | 1,061,222 | | 10,437,167 | |
| Current period gross write-offs | $ | 3,467 | | $ | 17 | | $ | 34 | | $ | 20 | | $ | 115 | | $ | 784 | | $ | 573 | | $ | 5,010 | |
| | | | | | | | |
| | | | | | | | |
| | | | | | | | |
| | | | | | | | | | | | | | | | | | | | | | | | | | |
| At December 31, 2023 |
| (In thousands) | 2023 | 2022 | 2021 | 2020 | 2019 | Prior | Revolving Loans Amortized Cost Basis | Total |
| Residential: | | | | | | | | |
| 800+ | $ | 214,446 | | $ | 847,009 | | $ | 1,096,109 | | $ | 451,307 | | $ | 141,919 | | $ | 910,117 | | $ | — | | $ | 3,660,907 | |
| 740-799 | 363,696 | | 703,568 | | 755,750 | | 279,946 | | 112,303 | | 633,578 | | — | | 2,848,841 | |
| 670-739 | 137,460 | | 293,699 | | 292,255 | | 95,838 | | 48,412 | | 346,663 | | — | | 1,214,327 | |
| 580-669 | 20,208 | | 52,962 | | 45,770 | | 14,840 | | 10,492 | | 106,497 | | — | | 250,769 | |
| 579 and below | 6,909 | | 52,690 | | 11,749 | | 1,345 | | 128,714 | | 51,672 | | — | | 253,079 | |
| Total residential | 742,719 | | 1,949,928 | | 2,201,633 | | 843,276 | | 441,840 | | 2,048,527 | | — | | 8,227,923 | |
| Current period gross write-offs | — | | — | | 387 | | — | | 153 | | 4,630 | | — | | 5,170 | |
| Home equity: | | | | | | | | |
| 800+ | 27,047 | | 27,439 | | 35,927 | | 25,586 | | 8,110 | | 56,062 | | 391,616 | | 571,787 | |
| 740-799 | 24,772 | | 20,069 | | 27,147 | | 13,888 | | 5,158 | | 34,190 | | 355,926 | | 481,150 | |
| 670-739 | 15,857 | | 15,655 | | 15,389 | | 5,992 | | 3,189 | | 29,454 | | 242,189 | | 327,725 | |
| 580-669 | 3,080 | | 3,786 | | 1,991 | | 1,658 | | 1,115 | | 9,988 | | 70,102 | | 91,720 | |
| 579 and below | 696 | | 1,109 | | 1,079 | | 576 | | 552 | | 6,319 | | 34,242 | | 44,573 | |
| Total home equity | 71,452 | | 68,058 | | 81,533 | | 47,700 | | 18,124 | | 136,013 | | 1,094,075 | | 1,516,955 | |
| Current period gross write-offs | — | | 4 | | 81 | | — | | 104 | | 3,114 | | — | | 3,303 | |
| Other consumer: | | | | | | | | |
| 800+ | 432 | | 356 | | 1,913 | | 189 | | 255 | | 77 | | 25,699 | | 28,921 | |
| 740-799 | 1,318 | | 586 | | 486 | | 730 | | 690 | | 381 | | 7,180 | | 11,371 | |
| 670-739 | 526 | | 570 | | 358 | | 981 | | 1,210 | | 79 | | 3,549 | | 7,273 | |
| 580-669 | 69 | | 169 | | 129 | | 153 | | 303 | | 56 | | 1,983 | | 2,862 | |
| 579 and below | 125 | | 97 | | 61 | | 11 | | 28 | | 1 | | 590 | | 913 | |
| Total other consumer | 2,470 | | 1,778 | | 2,947 | | 2,064 | | 2,486 | | 594 | | 39,001 | | 51,340 | |
| Current period gross write-offs | 3,263 | | 7 | | 2 | | 218 | | 377 | | 363 | | — | | 4,230 | |
| Total consumer portfolio | 816,641 | | 2,019,764 | | 2,286,113 | | 893,040 | | 462,450 | | 2,185,134 | | 1,133,076 | | 9,796,218 | |
| Current period gross write-offs | $ | 3,263 | | $ | 11 | | $ | 470 | | $ | 218 | | $ | 634 | | $ | 8,107 | | $ | — | | $ | 12,703 | |
| | | | | | | | |
| | | | | | | | |
Collateral Dependent Loans and Leases
A non-accrual loan or lease is considered collateral dependent when the borrower is experiencing financial difficulty and when repayment is substantially expected to be provided through the operation or sale of collateral. Commercial non-mortgage loans,
asset-based loans, and equipment financing loans and leases are generally secured by machinery and equipment, inventory, receivables, or other non-real estate assets, whereas commercial real estate, multi-family, residential, home equity, and other consumer loans are secured by real estate.
At December 31, 2024, and 2023, the carrying amount of collateral dependent loans was $139.5 million and $66.1 million, respectively, for commercial loans and leases, and $29.1 million and $22.7 million, respectively, for consumer loans. The ACL for collateral dependent loans and leases is individually assessed based on the fair value of the collateral less costs to sell at the reporting date. At December 31, 2024, and 2023, the collateral value associated with collateral dependent loans and leases was $200.1 million and $93.7 million, respectively.
Modifications to Borrowers Experiencing Financial Difficulty
On January 1, 2023, the Company adopted ASU 2022-02, which eliminated the accounting guidance for TDRs and enhanced the disclosure requirements for certain loan modifications when a borrower is experiencing financial difficulty. For a description of the Company’s accounting policies related to the accounting and reporting of TDRs, for which certain comparative period information is presented, refer to Note 1: Summary of Significant Accounting Policies.
In certain circumstances, the Company enters into agreements to modify the terms of loans to borrowers experiencing financial difficulty. A variety of solutions are offered to borrowers experiencing financial difficulty, including loan modifications that may result in principal forgiveness, interest rate reductions, payment delays, term extension, or a combination thereof. The following is a description of each of these types of modifications:
•Principal forgiveness – The outstanding principal balance of a loan may be reduced by a specified amount. Principal forgiveness may occur voluntarily as part of a negotiated agreement with a borrower, or involuntarily through a bankruptcy proceeding.
•Interest rate reductions – Includes modifications where the contractual interest rate of the loan has been reduced.
•Payment delays – Deferral arrangements that allow borrowers to delay a scheduled loan payment to a later date. Deferred loan payments do not affect the original contracted maturity terms of the loan. Modifications that result in only an insignificant payment delay are not disclosed. The Company generally considers a payment delay of three months or less to be insignificant.
•Term extensions – Extensions of the original contractual maturity date of the loan.
•Combination – Combination includes loans that have undergone more than one of the above loan modification types.
Significant judgment is required to determine if a borrower is experiencing financial difficulty. These considerations vary by portfolio class. The Company has identified modifications to borrowers experiencing financial difficulty that are included in its disclosures as follows:
•Commercial: The Company evaluates modifications of loans to commercial borrowers that are rated substandard or worse, and includes the modification in its disclosures to the extent that the modification is considered
other-than-insignificant.
•Consumer: The Company generally evaluates all modifications of loans to consumer borrowers subject to its loss mitigation program and includes them in its disclosures to the extent that the modification is considered other-than-insignificant.
The following tables summarize the amortized cost basis at December 31, 2024, and 2023, of loans modified to borrowers experiencing financial difficulty, disaggregated by class and type of concession granted: | | | | | | | | | | | | | | | | | | | | | | | | | | | | | | | | | | | | | | | | | | | |
| For the year ended December 31, 2024 |
| (In thousands) | Interest Rate Reduction | | Term Extension | | Payment Delay | | Combination-Term Extension & Interest Rate Reduction | | | | | | | | | | Total | | % of Total Class (2) |
| Commercial non-mortgage | $ | 9 | | | $ | 189,026 | | | $ | 34,642 | | | $ | 886 | | | | | | | | | | | $ | 224,563 | | | 1.2 | % |
| Asset-based | — | | | 24,112 | | | — | | | — | | | | | | | | | | | 24,112 | | | 1.7 | |
| Commercial real estate | — | | | 122,088 | | | 1,347 | | | 8,112 | | | | | | | | | | | 131,547 | | | 0.9 | |
| | | | | | | | | | | | | | | | | | | |
| Equipment financing | — | | | 289 | | | — | | | — | | | | | | | | | | | 289 | | | — | |
| | | | | | | | | | | | | | | | | | | |
| Residential | 618 | | | 141 | | | — | | | 890 | | | | | | | | | | | 1,649 | | | — | |
| Home equity | 275 | | | 337 | | | — | | | 309 | | | | | | | | | | | 921 | | | 0.1 | |
| | | | | | | | | | | | | | | | | | | |
Total (1) | $ | 902 | | | $ | 335,993 | | | $ | 35,989 | | | $ | 10,197 | | | | | | | | | | | $ | 383,081 | | | 0.7 | % |
| | | | | | | | | | | | | | | | | | | | | | | | | | | | | | | | | | | | | | | | | | | | | | | | | | | | | |
| | | | | | | | | | | | | | | | | |
| For the year ended December 31, 2023 |
| (In thousands) | Interest Rate Reduction | | Term Extension | | Payment Delay | | Combination- Term Extension and Interest Rate Reduction | | Combination- Term Extension & Payment Delay | | Combination- Term
Interest Rate Reduction & Payment Delay | | Combination- Term Extension, Interest Rate Reduction, & Payment Delay | | Total | | % of Total Class (2) |
| Commercial non-mortgage | $ | — | | $ | 96,895 | | $ | 5,858 | | $ | 1,062 | | $ | 28,860 | | $ | 35 | | $ | 425 | | $ | 133,135 | | 0.8 | % |
| Asset-based | — | | 45,042 | | — | | — | | — | | — | | — | | 45,042 | | 2.9 | |
| Commercial real estate | — | | 3,090 | | 174 | | 17,107 | | 511 | | — | | — | | 20,882 | | 0.2 | |
| | | | | | | | | | | | | | | | | |
| Equipment financing | — | | 357 | | 1,284 | | — | | — | | — | | — | | 1,641 | | 0.1 | |
| | | | | | | | | | | | | | | | | |
| Residential | — | | 186 | | 804 | | 136 | | — | | — | | — | | 1,126 | | — | |
| Home equity | 62 | | 76 | | — | | 513 | | — | | — | | — | | 651 | | — | |
| | | | | | | | | | | | | | | | | |
Total (1) | $ | 62 | | $ | 145,646 | | $ | 8,120 | | $ | 18,818 | | $ | 29,371 | | $ | 35 | | $ | 425 | | $ | 202,477 | | 0.4 | % |
(1)The total amortized cost excludes accrued interest receivable of $0.9 million and $0.7 million for the years ended December 31, 2024, and 2023, respectively.
(2)Represents the total amortized cost of the loans modified as a percentage of the total period end loan balance by class.
The following tables describes the financial effect of the modifications made to borrowers experiencing financial difficulty: | | | | | |
| For the year ended December 31, 2024 |
| Financial Effect (1) |
| |
| |
| |
| |
| |
| Term Extension: | |
| Commercial non-mortgage | Extended term by a weighted average of 0.8 years |
| Asset-based | Extended term by a weighted average of 2.9 years |
| Commercial real estate | Extended term by a weighted average of 1.4 years |
| |
| |
| |
| |
| Payment Delay: | |
| Commercial non-mortgage | Provided payment deferrals for a weighted average of 0.5 years |
| Commercial real estate | Provided payment deferrals for a weighted average of 0.3 years to be received at contractual maturity |
| |
| |
| |
| Combination - Term Extension and Interest Rate Reduction: |
| |
| Commercial real estate | Extended term by a weighted average of 0.3 years and reduced weighted average interest rate by 2.0% |
| |
| |
| |
|
| |
| |
|
| |
(1)Certain disclosures related to financial effects of 2024 modifications do not include those deemed to be immaterial.
| | | | | |
| For the year ended December 31, 2023 |
| Financial Effect |
| Interest Rate Reduction: | |
| |
| |
| Home equity | Reduced weighted average interest rate by 0.5% |
| Term Extension: | |
| Commercial non-mortgage | Extended term by a weighted average of 1.3 years |
| Asset-based | Extended term by a weighted average of 0.7 years |
| Commercial real estate | Extended term by a weighted average of 2.2 years |
| Equipment financing | Extended term by a weighted average of 4.5 years |
| Residential | Extended term by a weighted average of 2.8 years |
| Home equity | Extended term by a weighted average of 10.1 years |
| Payment Delay: | |
| Commercial non-mortgage | Provided partial payment deferrals for a weighted average of 0.5 years |
| Commercial real estate | Provided payment deferrals for a weighted average of 0.3 years to be received at contractual maturity |
| Equipment financing | Provided partial payment deferrals for a weighted average of 0.5 years |
| Residential | Provided payment deferrals for a weighted average of 1.0 year |
| |
| Combination - Term Extension & Interest Rate Reduction: |
| Commercial non-mortgage | Extended term by a weighted average of 1.4 years and reduced weighted average interest rate by 1.8% |
| Commercial real estate | Extended term by a weighted average of 3.0 years and reduced weighted average interest rate by 2.4% |
| Residential | Extended term by a weighted average of 17.9 years and reduced weighted average interest rate by 0.3% |
| Home equity | Extended term by a weighted average of 16.8 years and reduced weighted average interest rate by 2.1% |
| Combination - Term Extension & Payment Delay: |
| Commercial non-mortgage | Extended term by a weighted average of 1.1 years and provided partial payment deferrals for a weighted average of 1.0 year |
| Commercial real estate | Extended term by a weighted average of 0.5 years and provided payment deferrals for a weighted average of 0.5 years |
| Combination - Interest Rate Reduction & Payment Delay: |
| Commercial non-mortgage | Reduced weighted average interest rate by 2.0% and provided payment deferrals for a weighted average of 0.5 years |
|
| |
| Combination - Term Extension, Interest Rate Reduction, & Payment Delay: |
| Commercial non-mortgage | Extended term by a weighted average of 0.5 years, reduced weighted average interest rate by 2.0%, and provided payment deferrals for a weighted average of 0.5 years |
The Company closely monitors the performance of the loans that are modified to borrowers experiencing financial difficulty to understand the effectiveness of its modification efforts. The following tables summarize the aging of loans that have been modified in the twelve months preceding December 31, 2024 and 2023:
| | | | | | | | | | | | | | | | | | | | | | | | | | | | | | | | | | | |
| At December 31, 2024 |
| (In thousands) | Current | | 30-59 Days
Past Due | | 60-89 Days
Past Due | | 90+ Days
Past Due | | Non-Accrual | | Total |
| Commercial non-mortgage | $ | 64,081 | | $ | 986 | | $ | — | | $ | — | | $ | 159,498 | | $ | 224,565 |
| Asset-based | 24,112 | | — | | — | | — | | — | | 24,112 |
| Commercial real estate | 100,594 | | — | | — | | — | | 30,953 | | 131,547 |
| | | | | | | | | | | |
| Equipment financing | 313 | | 21 | | — | | — | | — | | 334 |
| | | | | | | | | | | |
| Residential | 1,426 | | — | | — | | — | | 223 | | 1,649 |
| Home equity | 319 | | — | | — | | — | | 602 | | 921 |
| | | | | | | | | | | |
| Total | $ | 190,845 | | $ | 1,007 | | $ | — | | $ | — | | $ | 191,276 | | $ | 383,128 |
| | | | | | | | | | | | | | | | | | | | | | | | | | | | | | | | | | | |
| At December 31, 2023 |
| (In thousands) | Current | | 30-59 Days
Past Due | | 60-89 Days
Past Due | | 90+ Days
Past Due | | Non-Accrual | | Total |
| Commercial non-mortgage | $ | 107,852 | | $ | — | | $ | — | | $ | — | | $ | 25,283 | | $ | 133,135 |
| Asset-based | 45,042 | | — | | — | | — | | — | | 45,042 |
| Commercial real estate | 20,708 | | — | | — | | — | | 174 | | 20,882 |
| | | | | | | | | | | |
| Equipment financing | 1,284 | | — | | — | | — | | 357 | | 1,641 |
| | | | | | | | | | | |
| Residential | 990 | | — | | — | | — | | 136 | | 1,126 |
| Home equity | 547 | | — | | — | | — | | 104 | | 651 |
| | | | | | | | | | | |
| Total | $ | 176,423 | | $ | — | | $ | — | | $ | — | | $ | 26,054 | | $ | 202,477 |
There were $17.8 million of commercial non-mortgage loans made to borrowers experiencing financial difficulty that were modified in the form of term extensions in the preceding twelve months and that had a payment default during the year ended December 31, 2024. These loans were re-modified during the three months ended June 30, 2024, again in the form of term extensions. There were no loans made to borrowers experiencing financial difficulty that were both modified and had a payment default during the year ended December 31, 2024. Loans made to borrowers experiencing financial difficulty that were modified during the year ended December 31, 2023, and that subsequently defaulted were not significant.
For the purposes of this disclosure, a payment default is defined as 90 or more days past due and accruing. Non-accrual loans that are modified to borrowers experiencing financial difficulty remain on non-accrual status until the borrower has demonstrated performance under the modified terms. Commitments to lend additional funds to borrowers experiencing financial difficulty whose loans had been modified were not significant.
Troubled Debt Restructurings Prior to the Adoption of ASU 2022-02
The following table summarizes loans and leases modified as TDRs by class and modification type: | | | | | | | | | | | | | |
| | | Year ended December 31, 2022 |
| | | | Number of
Contracts | Recorded Investment (1) |
| (Dollars in thousands) |
| Commercial non-mortgage: | | | | | |
| Extended maturity | | | | 5 | $ | 291 |
| | | | | |
| Maturity / rate combined | | | | 8 | 765 |
Other (2) | | | | 19 | 52,070 |
| Asset-based: | | | | | |
Other (2) | | | | 1 | 23,298 |
| | | | | |
| | | | | |
| | | | | |
| | | | | |
| Equipment financing: | | | | | |
Other (2) | | | | 3 | 1,692 |
| Residential: | | | | | |
| Extended maturity | | | | 2 | 1,185 |
| Maturity / rate combined | | | | 2 | 133 |
Other (2) | | | | 8 | 3,158 |
| Home equity: | | | | | |
| | | | | |
| Adjusted interest rate | | | | 1 | 74 |
| Maturity / rate combined | | | | 21 | 2,623 |
Other (2) | | | | 37 | 2,134 |
| Total TDRs | | | | 107 | $ | 87,423 |
(1)Post-modification balances approximate pre-modification balances. The aggregate amount of charge-offs due to restructurings was not significant.
(2)Other includes covenant modifications, forbearance, discharges under Chapter 7 bankruptcy, or other concessions.
The portion of TDRs deemed to be uncollectible and charged-off during the year ended December 31, 2022, were $14.7 million for the commercial portfolio, and $0.3 million for the consumer portfolio.
During the year ended December 31, 2022, there were three commercial non-mortgage, two residential mortgages, and two other consumer loans with an aggregate amortized cost of $3.6 million, $0.6 million, and $0.3 million, respectively, that were modified as TDRs within the previous twelve months and for which there was a payment default.
Note 5: Transfers and Servicing of Financial Assets
Gains and losses on sales of loans are included in Other income on the accompanying Consolidated Statements of Income. During the year ended December 31, 2024, the Company recognized net (losses) on sales of loans of $(11.8) million, which included the impact from the write-off of the factored receivables customer relationship intangible asset in connection with the sale of the factored receivables portfolio, as discussed below. Excluding this charge, the Company recognized net gains on sale of loans of $7.9 million during the year ended December 31, 2024. During the years ended December 31, 2023, and 2022, the Company recognized net gains on sales of loans of $2.0 million, and $3.9 million, respectively. Additional information regarding the types of loans sold and the nature of the transactions is discussed in the following paragraphs.
Multi-family Securitization
On September 30, 2024, the Company completed a multi-family securitization, in which it transferred $303.9 million of multi-family loans ($302.5 million carrying amount plus $1.4 million accrued interest receivable) to a third-party depositor, who placed the multi-family loans into a third-party trust, in exchange for net cash proceeds of $311.6 million. Through a two-step process, pass-through certificates were issued, which are secured by the multi-family loans and guaranteed by Freddie Mac. The transfer of the multi-family loans was accounted for as a sale in accordance with ASC 860, Transfers and Servicing. Servicing rights were not retained.
Per the terms of the securitization agreement, the Company assumed an obligation to reimburse Freddie Mac for any payments made under Freddie Mac’s guarantee of the certificates. The reimbursement obligation covers losses up to 12% of the aggregate UPB of the multi-family loans at the time of sale, and is secured in full by an irrevocable letter of credit issued by the FHLB. Essentially, this reimbursement obligation represents a first credit loss enhancement provided by the Company to Freddie Mac. Based on the credit quality of the multi-family loans at the time of sale, among other factors, the Company estimated the fair value of its reimbursement obligation to be $3.3 million. Including the reimbursement obligation, the transaction resulted in a net gain on sale of $4.4 million. The carrying amount of the reimbursement obligation remained at $3.3 million at December 31, 2024, and is included in Accrued expenses and other liabilities on the Consolidated Balance Sheets. The Company was not required to make any guarantee payments to Freddie Mac during the fourth quarter of 2024.
Until the Company’s obligation to reimburse Freddie Mac for the first 12% of losses is reduced to 25% of the initial amount, it may have the option to exercise certain contingent repurchase rights over the transferred multi-family loans, unless it elects to waive or assign those rights. At both the time of sale, and as of December 31, 2024, the Company does not intend to repurchase any of the multi-family loans.
Payroll Finance Portfolio and Sale of Factored Receivables Portfolio
In March 2024, the Company initiated a plan to actively sell its payroll finance and factored receivables loan portfolios, along with the related customer contracts. This decision was a direct result of the Company’s continuous reassessment of its strategic model in an effort to identify opportunities to improve its core financial products and services. Accordingly, the aggregate $220.2 million balance of the payroll finance and factored receivables loans was reclassified and transferred, at March 31, 2024, from held for investment to held for sale on the accompanying Consolidated Balance Sheets. Upon the transfer, the $5.4 million ACL that was previously recorded against the payroll finance and factored receivables loans was reversed into earnings.
On September 27, 2024, the Company sold its factored receivables loan portfolio of $124.1 million, and the related customer contracts, for proceeds of $129.2 million. After the write-off of the factored receivables customer relationship intangible asset, which had a net carrying amount of $19.7 million, less $1.3 million of selling costs, the sale of assets resulted in a $16.0 million net loss on sale. The entire net loss is included in Other income on the Consolidated Statements of Income and in the Corporate and Reconciling category for segment reporting purposes in accordance with the Company’s methodology.
In December 2024, after re-evaluating its strategic priorities as part of its annual budgeting and forecasting process, the Company decided to terminate the plan of sale of its payroll finance portfolio and instead hold the loans as an investment for the foreseeable future. Accordingly, the $133.2 million balance of the payroll finance loans was reclassified and transferred, at December 31, 2024, from held for sale to held for investment on the accompanying Consolidated Balance Sheets. Upon the transfer, a $0.3 million ACL was re-established against the payroll finance loans.
Other Commercial and Consumer Loan Sales
Under certain circumstances, the Company may decide to sell commercial or consumer loans that were not originated or otherwise acquired with the intent to sell. Excluding both the multi-family securitization and the factored receivables sale, during the years ended December 31, 2024, 2023, and 2022, the Company sold loans not originated for sale of $146.5 million, $625.1 million, and $676.4 million, respectively, which resulted in net gains on sale of $0.5 million, $0.9 million, and $3.3 million, respectively.
Residential Mortgage Sales and Servicing
The Company originates and sells residential mortgage loans in the normal course of business, primarily to government-sponsored entities through established programs and securitizations. During the years ended December 31, 2024, 2023, and 2022, the Company sold $9.1 million, $12.8 million, and $35.8 million, respectively, of residential mortgage loans originated for sale, which resulted in net (losses) gains on sale of $(0.7) million, $1.1 million, and $0.6 million, respectively.
The Company may retain servicing rights on its residential mortgage loans sold in the normal course of business. For the years ended December 31, 2024, 2023, and 2022, residential mortgage loans sold with servicing rights retained were $4.4 million, $6.5 million, and $32.1 million, respectively. At December 31, 2024, and 2023, the aggregate UPB of residential mortgage loans serviced for others was $0.4 billion and $1.8 billion, respectively.
The following table summarizes the change in the carrying amount for mortgage servicing rights: | | | | | | | | | | | | | | | | | |
| | Years ended December 31, |
| (In thousands) | 2024 | | 2023 | | 2022 |
| Balance, beginning of period | $ | 8,523 | | | $ | 9,515 | | | $ | 9,237 | |
| Acquired from Sterling | — | | | — | | | 859 | |
| Additions | 36 | | | 71 | | | 289 | |
| Amortization | (670) | | | (1,063) | | | (870) | |
| Sales | (6,655) | | | — | | | — | |
| | | | | |
| Balance, end of period | $ | 1,234 | | | $ | 8,523 | | | $ | 9,515 | |
Mortgage servicing rights, which are included in Accrued interest receivable and other assets on the accompanying Consolidated Balance Sheets, are initially measured at fair value and subsequently measured using the amortization method.
During the fourth quarter of 2023, the Company committed to and initiated a plan to actively market and sell the majority of its mortgage servicing portfolio. Upon making this determination, the Company treated the related mortgage servicing rights as assets held for disposition, and ceased the recognition of any future amortization expense. On February 12, 2024, the Company completed the sale, which comprised 9,184 individual residential mortgage loans with an aggregate UPB of $1.4 billion. In connection with the sale, the Company received net cash proceeds of $18.4 million and derecognized $6.7 million of mortgage servicing rights. The resulting $11.7 million net gain on sale of mortgage servicing rights is included in Other income on the Consolidated Statements of Income and in Consumer Banking for segment reporting purposes.
Residential mortgage loan servicing fees, net of mortgage servicing rights amortization, which are included in Loan and lease related fees on the accompanying Consolidated Statements of Income, was $1.3 million, $4.0 million, and $5.9 million for the years ended December 31, 2024, 2023, and 2022, respectively.
Note 6: Premises and Equipment
The following table summarizes the components of premises and equipment: | | | | | | | | | | | |
| At December 31, |
| (In thousands) | 2024 | | 2023 |
| Land | $ | 73,442 | | | $ | 73,916 | |
| Buildings and improvements | 102,062 | | | 107,794 | |
| Leasehold improvements | 74,288 | | | 88,065 | |
| Furniture, fixtures, and equipment | 64,651 | | | 68,680 | |
| Data processing equipment and software | 103,811 | | | 94,030 | |
| Property and equipment | 418,254 | | | 432,485 | |
| Less: Accumulated depreciation and amortization | (175,118) | | | (186,365) | |
| Property and equipment, net | 243,136 | | | 246,120 | |
| ROU lease assets, net | 163,827 | | | 183,441 | |
| Premises and equipment, net | $ | 406,963 | | | $ | 429,561 | |
Depreciation and amortization of property and equipment was $35.4 million, $34.7 million, and $41.7 million for the years ended December 31, 2024, 2023, and 2022, respectively, and is included in both Occupancy and Technology and equipment expense on the accompanying Consolidated Statements of Income.
The Company recognized $1.7 million, $4.6 million, and $6.3 million in losses on disposals of property and equipment for the years ended December 31, 2024, 2023, and 2022, respectively, which primarily pertained to construction in progress as a result of the Company’s decision to stop further project development and retired internal use software.
Additional information regarding ROU lease assets can be found within Note 7: Leasing.
Property and Equipment Held for Sale
Assets held for disposition are included in Accrued interest receivable and other assets on the accompanying Consolidated Balance Sheets. At December 31, 2024, and 2023, the carrying amount of assets held for disposition, which entirely comprised returned finance lease equipment, was $5.1 million and $3.7 million, respectively
When finance lease equipment is returned to the Company, either at the end of the lease term or through repossession, and management’s intent is to sell the equipment, the asset is reclassified from loans and leases to assets held for disposition and recorded at the lower of cost or fair value, less estimated costs to sell. During the years ended December 31, 2024, and 2023, returned finance lease equipment of $5.6 million and $5.1 million, respectively, was transferred to assets held for disposition and experienced subsequent write-downs of $0.3 million, and $0.1 million, respectively, prior to sale. For sales of such equipment that occurred during the years ended December 31, 2024, and 2023, the Company received cash proceeds of $4.4 million, and $2.7 million, respectively, and recognized gains on sale of $0.4 million and $1.1 million, respectively.
During the second quarter of 2024, the Company arranged and sold its Manchester, Connecticut property, which comprised of land, buildings, and improvements with a net book value of $0.7 million. The Company received cash proceeds of $1.6 million and recognized a gain on sale of $0.9 million.
In addition, during the third quarter of 2024, the Company arranged to sell its Yonkers, New York, property, which comprised of land, buildings, and improvements. Upon making the determination to sell, the Company recognized a $0.4 million write-down and then transferred the property to assets held for disposition at its fair market value of $0.8 million less estimated costs to sell of $0.1 million. The sale of the Yonkers property closed during the fourth quarter of 2024. The Company received cash proceeds of $0.7 million and recognized an insignificant gain on sale.
In 2022, the Company launched and completed a corporate real estate consolidation strategy in which the Company closed 14 locations in order to reduce its corporate real estate facility square footage by approximately 45%. In connection with this corporate real estate consolidation plan, in the third quarter of 2022, the Company arranged to sell its New Britain, Connecticut, property, which comprised of land, buildings, and improvements. Upon making the determination to sell, the Company recognized a $1.8 million write-down and then transferred the property to assets held for disposition at its fair market value of $4.8 million. The sale of the New Britain property closed during the third quarter of 2023. The Company received cash proceeds of $4.1 million and recognized a loss on sale of $0.7 million.
Note 7: Leasing
Lessor Arrangements
The Company leases certain types of machinery and equipment to its customers through sales-type and direct financing leases as part of its equipment financing portfolio. These leases generally have remaining lease terms of one to ten years, some of which include renewal options and/or options for the lessee to purchase the asset near or at the end of the lease term. The Company recognized interest income from its sales-type and direct financing lessor activities of $19.3 million, $18.7 million, and $15.4 million for the years ended December 31, 2024, 2023, and 2022, respectively. The Company does not have any significant operating leases in which it is the lessor. Additional information regarding the Company’s equipment financing portfolio can be found within Note 4: Loans and Leases.
The following table summarizes the components of the Company’s net investment in its sales-type and direct financing leases: | | | | | | | | |
| At December 31, |
| (In thousands) | 2024 | 2023 |
| Lease receivables | $ | 394,489 | $ | 347,827 |
Unguaranteed residual values (1) | 63,014 | 60,747 |
| Total net investment | $ | 457,503 | $ | 408,574 |
(1)The Company performs quarterly reviews of residual values associated with its equipment finance leasing portfolio considering factors such as the subject equipment, structure of the transaction, industry, prior experience with the lessee, and other factors that may impact the residual value to assess for impairment.
The following table reconciles undiscounted future lease payments to the total sales-type and direct financing leases’ net investment: | | | | | |
| (In thousands) | At December 31, 2024 |
| 2025 | $ | 128,790 |
| 2026 | 127,483 |
| 2027 | 80,011 |
| 2028 | 67,809 |
| 2029 | 32,470 |
| Thereafter | 77,070 |
| Total lease payments receivable | 513,633 |
| Present value adjustment | (56,130) |
| Total net investment | $ | 457,503 |
Lessee Arrangements
The Company enters into operating leases in the normal course of business, primarily for office space, banking centers, and other operational activities. These leases generally have remaining lease terms of one to ten years. The Company does not have any finance leases in which it is the lessee, nor any significant sub-lease arrangements.
The following table summarizes the Company’s ROU lease assets and operating lease liabilities: | | | | | | | | | | | | | | |
| | | At December 31, |
| (In thousands) | Consolidated Balance Sheet Line Item | | 2024 | 2023 |
| ROU lease assets | Premises and equipment, net | | $ | 163,827 | $ | 183,441 |
| Operating lease liabilities | Accrued expenses and other liabilities | | 193,188 | 222,439 |
There were no ROU lease asset impairment charges during the years ended December 31, 2024, and 2023. During the year ended December 31, 2022, a $23.1 million ROU asset impairment charge was included in Occupancy on the accompanying Consolidated Statements of Income attributed to the Company’s 2022 corporate real estate consolidation plan. The amount of impairment charge was calculated as the difference between the estimated fair value of the assets, which was determined using a discounted cash flow technique, relative to their book value.
The following table summarizes the components of operating lease expense and other relevant information: | | | | | | | | | | | |
| At or for the Years ended December 31, |
| (In thousands) | 2024 | 2023 | 2022 |
| Lease Cost: | | | |
| Operating lease cost | $ | 36,235 | $ | 33,880 | $ | 38,975 |
| Variable lease cost | 4,880 | 4,617 | 5,679 |
| Sublease income | (909) | (223) | (1,383) |
| Total operating lease expense | $ | 40,206 | $ | 38,274 | $ | 43,271 |
| | | |
| Other Information: | | | |
| Cash paid for amounts included in the measurement of operating lease liabilities | $ | 36,080 | $ | 37,615 | $ | 44,767 |
ROU lease assets obtained in exchange for operating lease liabilities (1) | 10,444 | 22,989 | 27,897 |
| Weighted-average remaining lease term (in years) | 7.08 | 7.46 | 7.72 |
| Weighted-average discount rate | 3.20 | % | 2.96 | % | 2.65 | % |
(1)Excludes $0.5 million of ROU lease assets acquired from Ametros for the year ended December 31, 2024, and $100.0 million of ROU lease assets acquired from Sterling for the year ended December 31, 2022.
The following table reconciles undiscounted future lease payments to total operating lease liabilities: | | | | | | |
| (In thousands) | At December 31, 2024 | |
| 2025 | $ | 33,221 | |
| 2026 | 36,103 | |
| 2027 | 31,516 | |
| 2028 | 27,780 | |
| 2029 | 23,408 | |
| Thereafter | 64,338 | |
| Total operating lease payments | 216,366 | |
| Present value adjustment | (23,178) | |
| Total operating lease liabilities | $ | 193,188 | |
Note 8: Goodwill and Other Intangible Assets
Goodwill
The following table summarizes changes in the carrying amount of goodwill:
| | | | | | | | | | | | | | | |
| | | | | At December 31, |
| (In thousands) | | | 2024 | | 2023 |
| Balance, beginning of period | | | | | $ | 2,631,465 | | | $ | 2,514,104 | |
Ametros acquisition (1) | | | | | 236,603 | | | — | |
| interLINK acquisition | | | | | — | | | 143,216 | |
Bend acquisition (2) | | | | | — | | | (294) | |
Sterling merger (2) | | | | | — | | | (25,561) | |
| Balance, end of period | | | | | $ | 2,868,068 | | | $ | 2,631,465 | |
(1)Reflects the $228.2 million of goodwill recorded in connection with the Ametros acquisition in January 2024, and $8.4 million of other adjustments. The allocation of the purchase price and goodwill calculation for the Ametros acquisition was final as of December 31, 2024.
(2)The 2023 changes reflect adjustments recorded within the one-year measurement period, which were identified as a result of extended information gathering and new information that arose from integration activities. The allocation of the purchase price and goodwill calculations for both the Sterling merger and Bend acquisition were final as of March 31, 2023.
Information regarding goodwill by reportable segment can be found within Note 21: Segment Reporting.
Other Intangible Assets
The following table summarizes other intangible assets: | | | | | | | | | | | | | | | | | | | | | | | |
| | At December 31, |
| 2024 | | 2023 |
| (In thousands) | Gross Carrying
Amount | Accumulated
Amortization | Net Carrying
Amount | | Gross Carrying
Amount | Accumulated
Amortization | Net Carrying
Amount |
Core deposits (1) | $ | 328,837 | | $ | 76,795 | | $ | 252,042 | | | $ | 146,037 | | $ | 53,986 | | $ | 92,051 | |
Customer relationships (2) | 122,063 | | 47,186 | | 74,877 | | | 151,000 | | 43,116 | | 107,884 | |
| Non-competition agreement | 4,000 | | 1,600 | | 2,400 | | | 4,000 | | 800 | | 3,200 | |
Trade name (1) | 6,100 | | 1,118 | | 4,982 | | | — | | — | | — | |
| Other intangible assets | $ | 461,000 | | $ | 126,699 | | $ | 334,301 | | | $ | 301,037 | | $ | 97,902 | | $ | 203,135 | |
(1)The increase in the gross carrying amount is due to the Ametros acquisition in January 2024, which resulted in the identification and recognition of a $182.8 million core deposit intangible asset and a $6.1 million trade name.
(2)The decrease in the net carrying amount is primarily due to the write-off of the factored receivables customer relationship intangible asset, which had a net carrying amount of $19.7 million ($27.0 million gross carrying amount net of $7.3 million in accumulated amortization), in connection with the sale of the factored receivables portfolio in September 2024. The net carrying amount of the factored receivables customer relationship intangible asset was included in Commercial Banking for segment reporting purposes. Further, during the third quarter of 2024, the Company also recognized a $1.9 million impairment loss on its payroll finance customer relationship intangible asset resulting from higher customer attrition and a reduction in forecasted future cash flows. The fair value of the payroll finance customer relationship intangible asset at the revaluation date was estimated to be $28.0 million, which was determined using a discounted cash flow methodology that reflected the estimated future value of the future net earnings, with adjustments for attrition. The net carrying amount of the payroll finance customer relationship intangible asset is included in Commercial Banking for segment reporting purposes.
The remaining estimated aggregate future amortization expense for other intangible assets is as follows: | | | | | |
| (In thousands) | At December 31,
2024 |
| 2025 | $ | 36,051 | |
| 2026 | 34,083 | |
| 2027 | 33,033 | |
| 2028 | 30,162 | |
| 2029 | 28,289 | |
| Thereafter | 172,683 | |
Note 9: Income Taxes
Income tax expense reflects the following expense (benefit) components: | | | | | | | | | | | | | | | | | |
| | Years ended December 31, |
| (In thousands) | 2024 | | 2023 | | 2022 |
| Current: | | | | | |
| Federal | $ | 171,913 | | | $ | 219,548 | | | $ | 170,779 | |
| State and local | 58,204 | | | 50,750 | | | 52,579 | |
| Total current | 230,117 | | | 270,298 | | | 223,358 | |
| Deferred: | | | | | |
| Federal | (14,464) | | | (43,615) | | | (45,421) | |
| State and local | 32,647 | | | (10,019) | | | (24,243) | |
| Total deferred | 18,183 | | | (53,634) | | | (69,664) | |
| | | | | |
| Total federal | 157,449 | | | 175,933 | | | 125,358 | |
| Total state and local | 90,851 | | | 40,731 | | | 28,336 | |
| Income tax expense | $ | 248,300 | | | $ | 216,664 | | | $ | 153,694 | |
Included in the Company’s income tax expense for the years ended December 31, 2024, 2023, and 2022, are net tax benefits related to credits of approximately $19.1 million, $11.9 million, and $14.0 million, respectively. These amounts relate primarily to LIHTC investments and include associated SALT credits and benefits from losses, as well as the related proportional amortization expense of the underlying investments.
The Company’s deferred income tax expense for the year ended December 31, 2024, includes $29.4 million of net tax expense related to an increase in its beginning-of-year valuation allowance for its SALT DTAs attributable to operating loss carryforwards, as discussed further below. The Company’s deferred income tax benefit for the year ended December 31, 2022, includes a net tax benefit of $9.9 million related to a reduction in its beginning-of-year valuation allowance that year for its SALT DTAs attributable to operating loss carryforwards.
The following table reflects a reconciliation of reported income tax expense to the amount that would result from applying the federal statutory rate of 21.0%: | | | | | | | | | | | | | | | | | | | | | | | | | | |
| | Years ended December 31, |
| | 2024 | | 2023 | | 2022 |
| (In thousands) | Amount | Percent | | Amount | Percent | | Amount | Percent |
| Income tax expense at federal statutory rate | $ | 213,572 | | 21.0 | % | | $ | 227,746 | | 21.0 | % | | $ | 167,575 | | 21.0 | % |
| Reconciliation to reported income tax expense: | | | | | | | | |
| SALT expense, net of federal | 42,059 | | 4.1 | | | 32,177 | | 3.0 | | | 32,259 | | 4.1 | |
| Tax-exempt interest, net | (29,272) | | (2.9) | | | (44,473) | | (4.1) | | | (35,371) | | (4.4) | |
| Increase in cash surrender value of life insurance | (5,816) | | (0.6) | | | (5,469) | | (0.5) | | | (6,122) | | (0.8) | |
| | | | | | | | |
| Non-deductible FDIC deposit insurance premiums | 12,305 | | 1.2 | | | 10,693 | | 1.0 | | | 5,581 | | 0.7 | |
| LIHTC and related benefits, net | (13,545) | | (1.3) | | | (3,866) | | (0.4) | | | (7,627) | | (1.0) | |
| Non-deductible compensation expense | 3,680 | | 0.4 | | | 4,167 | | 0.4 | | | 7,948 | | 1.0 | |
| | | | | | | | |
| DTA valuation allowance adjustment, net | 31,091 | | 3.1 | | | (368) | | — | | | (9,874) | | (1.2) | |
| Other, net | (5,774) | | (0.6) | | | (3,943) | | (0.4) | | | (675) | | (0.1) | |
| Income tax expense and effective tax rate | $ | 248,300 | | 24.4 | % | | $ | 216,664 | | 20.0 | % | | $ | 153,694 | | 19.3 | % |
The following table reflects the significant components of DTAs, net: | | | | | | | | | | | |
| | At December 31, |
| (In thousands) | 2024 | | 2023 |
| Deferred tax assets: | | | |
| ACL on loans and leases | $ | 187,348 | | | $ | 171,870 | |
| Net operating loss and credit carry forwards | 74,363 | | | 68,103 | |
| Compensation and employee benefit plans | 50,880 | | | 46,670 | |
| Lease liabilities under operating leases | 52,397 | | | 60,331 | |
| Net unrealized loss on available-for-sale securities | 193,309 | | | 191,922 | |
| Other | 71,008 | | | 72,546 | |
| Gross deferred tax assets | 629,305 | | | 611,442 | |
| Valuation allowance | (64,422) | | | (28,746) | |
| Total deferred tax assets, net of valuation allowance | $ | 564,883 | | | $ | 582,696 | |
| Deferred tax liabilities: | | | |
| | | |
| | | |
| ROU assets under operating leases | $ | 44,434 | | | $ | 49,754 | |
| Equipment financing leases | 54,990 | | | 54,300 | |
| | | |
| Goodwill and other intangible assets | 102,042 | | | 59,817 | |
| Purchase accounting and fair value adjustments | 10,359 | | | 15,527 | |
| Other | 36,202 | | | 34,086 | |
| Gross deferred tax liabilities | 248,027 | | | 213,484 | |
| Deferred tax assets, net | $ | 316,856 | | | $ | 369,212 | |
The Company’s net DTAs decreased by $52.4 million during 2024, reflecting primarily a $35.9 million net DTL recognized as part of purchase accounting adjustments related to the acquisition of Ametros and the $18.2 million deferred tax expense, partially offset by a $2.5 million benefit allocated directly to AOCL.
The valuation allowance of $64.4 million at December 31, 2024, is comprised of $62.7 million attributable to SALT net operating loss and credit carryforwards and $1.7 million of capital loss carryforwards, as compared to $28.7 million at December 31, 2023, primarily attributable to SALT net operating loss carryforwards. The $35.7 million increase in the valuation allowance during 2024 primarily reflects a $29.4 million increase in the beginning-of-year valuation allowance related to a change in management's estimate about the realizability of the Company’s SALT net operating losses, $3.1 million related to the Ametros acquisition, and $1.7 million attributable to capital losses, with the remainder related to current year activity and return true-ups that were largely offset by increases to related DTAs.
SALT net operating loss carryforwards of approximately $1.1 billion, including those related to the Bend and Ametros acquisitions, and SALT credit carryforwards of $1.1 million at December 31, 2024, have varying carryforward periods. The vast majority of the SALT net operating loss and credit carryforwards are scheduled to expire during year years 2025 through 2032. Federal net operating loss carryforwards of approximately $21.5 million and federal credit carryforwards of $0.4 million at December 31, 2024, related to the Bend and Ametros acquisition are subject to annual limitations on utilization, with the net operating losses able to be carried forward indefinitely and the credits scheduled to expire in varying amounts between 2038 and 2042. The valuation allowance reflects approximately $1.1 billion of those SALT net operating loss carryforwards and $0.3 million of the SALT credit carryforwards that are estimated to expire unused.
Management believes it is more likely than not that the results of future operations will generate sufficient taxable income to realize its total DTAs, net of the valuation allowance. Although taxable income in prior years is no longer able to be included as a source of taxable income, due to the general repeal of the carryback of net operating losses under the Tax Cuts and Jobs Act of 2017, significant positive evidence remains in support of management’s conclusion regarding the realizability of the Company’s DTAs, including projected future reversals of existing taxable temporary differences and book-taxable income levels in recent years and projected in future years. There can, however, be no assurance that any specific level of future income will be generated or that the Company’s DTAs will ultimately be realized.
DTLs of $63.2 million at both December 31, 2024, and 2023, have not been recognized for certain thrift bad-debt reserves, established before 1988, that would become taxable upon the occurrence of certain events: distributions by the Bank in excess of certain earnings and profits; the redemption of the Bank’s stock; or liquidation. The Company does not expect any of those events to occur. At both December 31, 2024, and 2023, the cumulative taxable temporary differences applicable to those reserves approximated $233.1 million.
The following table reflects a reconciliation of the beginning and ending balances of UTBs: | | | | | | | | | | | | | | | | | |
| Years ended December 31, |
| (In thousands) | 2024 | | 2023 | | 2022 |
| Beginning balance | $ | 13,836 | | | $ | 9,875 | | | $ | 4,249 | |
| Additions as a result of tax positions taken during the current year | 493 | | | 359 | | | 223 | |
| Additions as a result of tax positions taken during prior years | 7,447 | | | 4,255 | | | 8,807 | |
| Reductions as a result of tax positions taken during prior years | (5,651) | | | — | | | (503) | |
| Reductions relating to settlements with taxing authorities | (1,997) | | | — | | | (2,110) | |
| Reductions as a result of lapse of statute of limitation periods | (362) | | | (653) | | | (791) | |
| Ending balance | $ | 13,766 | | | $ | 13,836 | | | $ | 9,875 | |
At December 31, 2024, 2023, and 2022, there were $11.6 million, $12.4 million, and $9.1 million, respectively, of UTBs that if recognized would affect the effective tax rate.
The Company recognizes interest and penalties related to UTBs, where applicable, in income tax expense. The Company recognized expense of $3.1 million, $1.8 million, and $0.1 million during the years ended December 31, 2024, 2023, and 2022, respectively. At December 31, 2024 and 2023, the Company had accrued interest and penalties related to UTBs of $6.9 million and $3.8 million respectively.
The Company has determined it is reasonably possible that its total UTBs could decrease by between $0.9 million and $8.8 million by the end of 2025 as a result of potential lapses in statute-of-limitation periods and/or potential settlements with taxing authorities, primarily concerning various state and local apportionment and tax-base determinations.
The Company’s federal tax returns for years subsequent to 2020 remain open to examination, except for the carryback of a Sterling 2019 net operating loss under the CARES Act in 2020 to tax years 2014 and 2016, which is currently under audit by the Internal Revenue Service. The Company's tax returns filed in its other principal tax jurisdictions of Connecticut, New York State, New York City, Massachusetts and New Jersey, primarily for years subsequent to 2016 are either under or remain open to examination.
Note 10: Deposits
The following table summarizes deposits by type: | | | | | | | | | | | |
| At December 31, |
| (In thousands) | 2024 | | 2023 |
| Non-interest-bearing: | | | |
| Demand | $ | 10,316,501 | | | $ | 10,732,516 | |
| Interest-bearing: | | | |
| Health savings accounts | 8,951,031 | | | 8,287,889 | |
| Checking | 9,834,790 | | | 8,994,095 | |
| Money market | 20,433,250 | | | 17,662,826 | |
| Savings | 6,982,554 | | | 6,642,499 | |
| Time deposits | 8,234,954 | | | 8,464,459 | |
| Total interest-bearing | 54,436,579 | | | 50,051,768 | |
| Total deposits | $ | 64,753,080 | | | $ | 60,784,284 | |
| | | |
Time deposits, money market, and interest-bearing checking obtained through brokers (1) | $ | 3,181,298 | | | $ | 3,673,733 | |
Aggregate amount of time deposit accounts that exceeded the FDIC limit (2) | 1,407,077 | | | 1,221,887 | |
| Deposit overdrafts reclassified as loan balances | 7,146 | | | 10,432 | |
(1)Excludes $7.3 billion and $5.7 billion of money market sweep deposits received through interLINK at December 31, 2024, and
December 31, 2023, respectively.
(2)Excludes $16.8 million and $39.0 million of time deposit accounts that were at the FDIC limit at December 31, 2024, and December 31, 2023, respectively.
The following table summarizes the scheduled maturities of time deposits: | | | | | |
| (In thousands) | At December 31, 2024 |
| 2025 | $ | 8,091,695 | |
| 2026 | 72,078 | |
| 2027 | 32,656 | |
| 2028 | 18,766 | |
| 2029 | 19,759 | |
| |
| Total time deposits | $ | 8,234,954 | |
Note 11: Borrowings
Securities Sold Under Agreements to Repurchase and Federal Funds Purchased
The following table summarizes securities sold under agreements to repurchase and federal funds purchased: | | | | | | | | | | | | | | | | | |
| At December 31, |
| 2024 | | 2023 |
| (In thousands) | Total Outstanding | Rate | | Total Outstanding | Rate |
| | | | | |
| | | | | |
| | | | | |
Securities sold under agreements to repurchase (1) | $ | 344,168 | | 2.98 | % | | $ | 358,387 | | 3.43 | % |
| Federal funds purchased | — | | — | | | 100,000 | | 5.48 | |
| Securities sold under agreements to repurchase and federal funds purchased | $ | 344,168 | | 2.98 | % | | $ | 458,387 | | 3.88 | % |
(1)At December 31, 2024, and 2023, securities sold under agreements to repurchase had an original maturity of one year or less.
The Company’s repurchase agreement counterparties are limited to primary dealers in government securities and commercial and municipal customers through the Corporate Treasury function. The Company has the right of offset with respect to repurchase agreement assets and liabilities with the same counterparty when master netting agreements are in place. Securities sold under agreements to repurchase are presented as gross transactions at December 31, 2024, and 2023, since only liabilities are outstanding. Agency MBS securities, which had an aggregate market value of $358.4 million and $381.4 million at December 31, 2024, and 2023, respectively, are pledged to secure repurchase agreements. These Agency MBS securities are subject to changes in market value and, therefore, the Company may increase or decrease the level of securities pledged as collateral based upon movements in market value.
The following tables represent the offsetting of repurchase agreements that are subject to master netting agreements: | | | | | | | | | | | | | | | | | | | | | | | | | | | | | | | | | | | |
| At December 31, 2024 |
| Gross Amounts of Recognized Liabilities | | Gross Amounts Offset in the Statement of Financial Position | | Net Amounts of Liabilities Presented in the Statement of Financial Position | | Gross Amounts Not Offset in the Statement of Financial position | | |
| | | | | |
| (In thousands) | | | | Financial Instruments | | Cash Collateral Pledged | | Net Amount |
| Repurchase agreements | $ | 209,961 | | | $ | — | | | $ | 209,961 | | | $ | 220,588 | | | $ | — | | | $ | (10,627) | |
| | | | | | | | | | | |
| At December 31, 2023 |
| Gross Amounts of Recognized Liabilities | | Gross Amounts Offset in the Statement of Financial Position | | Net Amounts of Liabilities Presented in the Statement of Financial Position | | Gross Amounts Not Offset in the Statement of Financial position | | |
| | | | | |
| (In thousands) | | | | Financial Instruments | | Cash Collateral Pledged | | Net Amount |
| Repurchase agreements | $ | 216,251 | | | $ | — | | | $ | 216,251 | | | $ | 232,176 | | | $ | — | | | $ | (15,925) | |
FHLB Advances
The following table summarizes information for FHLB advances: | | | | | | | | | | | | | | | | | |
| At December 31, |
| 2024 | | 2023 |
| (In thousands) | Total
Outstanding | Weighted-Average Contractual Coupon Rate | | Total
Outstanding | Weighted-Average Contractual Coupon Rate |
| Maturing within 1 year | $ | 2,100,000 | | 4.50 | % | | $ | 2,350,000 | | 5.53 | % |
| After 1 but within 2 years | — | | — | | | — | | — | |
| After 2 but within 3 years | 218 | | — | | | — | | — | |
| After 3 but within 4 years | 215 | | 2.75 | | | 235 | | — | |
| After 4 but within 5 years | 642 | | 1.75 | | | 228 | | 2.75 | |
| After 5 years | 9,033 | | 2.02 | | | 9,555 | | 2.07 | |
| FHLB advances | $ | 2,110,108 | | 4.49 | % | | $ | 2,360,018 | | 5.52 | % |
| | | | | |
| Aggregate market value of assets pledged as collateral | $ | 16,581,133 | | | | $ | 20,734,035 | | |
| Remaining borrowing capacity at FHLB | 8,670,348 | | | | 12,535,423 | | |
The Bank may borrow up to a discounted amount of eligible loans and securities that have been pledged as collateral to secure FHLB advances, which includes certain residential, multi-family, and commercial real estate loans, home equity lines of credit, CMBS, Agency MBS, Agency CMO, and MBS. The Bank was in compliance with its FHLB collateral requirements at both December 31, 2024, and 2023.
Long-term Debt
The following table summarizes long-term debt: | | | | | | | | | | | | | | |
| At December 31, |
| (In thousands) | 2024 | | 2023 |
| 2024 senior notes | $ | — | | | $ | 132,550 | |
2029 senior notes (1) | 322,751 | | | 328,104 | |
| 2029 subordinated notes | 274,000 | | | 274,000 | |
| 2030 subordinated notes | 225,000 | | | 225,000 | |
| 2033 junior subordinated notes | 77,320 | | | 77,320 | |
| Total senior and subordinated debt | 899,071 | | | 1,036,974 | |
| Discount on 2029 senior notes | (423) | | | (537) | |
| Debt issuance cost on 2029 senior notes | (1,137) | | | (1,419) | |
| Premium on 2029 subordinated notes and 2030 subordinated notes | 11,674 | | | 13,802 | |
Long-term debt (2) | $ | 909,185 | | | $ | 1,048,820 | |
(1)The Company de-designated its fair value hedging relationship on these senior notes in 2020. A basis adjustment of $22.8 million and $28.1 million at December 31, 2024, and 2023, respectively, is included in the carrying value and is being amortized over the remaining life of the senior fixed-rate notes.
(2)The classification of debt as long-term is based on the initial terms of greater than one year as of the date of issuance.
2024 Senior Notes. On February 11, 2014, the Company issued $150.0 million in aggregate principal amount of 4.375% fixed-rate senior notes due on February 15, 2024 (the 2024 senior notes). The 2024 senior notes were not convertible or exchangeable, and interest was paid semi-annually in arrears on February 15 and August 15 of each year. Prior to January 16, 2024, the 2024 senior notes were redeemable by the Company at any time, in whole or in part, at a price equal to the greater of (i) the total principal amount to be redeemed and (ii) the sum of the present value of the remaining scheduled payments of principal and interest thereon, exclusive of interest accrued to the redemption date, discounted to the redemption date on a semi-annual basis at the Treasury rate plus 30 basis points, plus in any case any accrued and unpaid interest thereon, but excluding the redemption date. On or after January 16, 2024, the 2024 senior notes were redeemable by the Company at any time, in whole or in part, at a redemption price equal to the total principal amount to be redeemed plus any accrued and unpaid interest thereon to, but excluding, the redemption date.
The Company repurchased and retired $17.5 million of the 2024 senior notes at 96 cents on the dollar in May 2023. The resulting $0.7 million gain recognized upon the extinguishment was included in Other income on the accompany Consolidated Statements of Income for the year ended December 31, 2023. On February 15, 2024, the Company repaid the outstanding $132.6 million principal amount of the 2024 senior notes plus any accrued and unpaid interest due thereon to.
2029 Senior Notes. On March 25, 2019, the Company issued $300.0 million in aggregate principal amount of 4.100% fixed-rate senior notes due on March 25, 2029 (the 2029 senior notes). The 2029 senior notes are not convertible or exchangeable, and interest is payable semi-annually in arrears on March 25 and September 25 of each year. Prior to December 25, 2028, the 2029 senior notes may be redeemed by the Company at any time, in whole or in part, at a price equal to the greater of (i) the total principal amount to be redeemed and (ii) the sum of the present value of the remaining scheduled payments of principal and interest thereon, exclusive of interest accrued to the redemption date, discounted to the redemption date on a semi-annual basis at the Treasury rate plus 25 basis points, plus in any case any accrued and unpaid interest thereon, but excluding the redemption date. On or after December 25, 2028, the 2029 senior notes may be redeemed by the Company at any time, in whole or in part, at a redemption price equal to the total principal amount to be redeemed plus any accrued and unpaid interest thereon to, but excluding, the redemption date.
2029 Subordinated Notes. The Company assumed $274.0 million in aggregate principal amount of 4.000% fixed-to-floating rate subordinated notes due on December 30, 2029 (the 2029 subordinated notes), in connection with the Sterling merger in 2022. The 2029 subordinated notes were issued by Sterling on December 16, 2019, and are not convertible or exchangeable. Prior to December 30, 2024, the interest rate was fixed at 4.000% and payable semi-annually in arrears on June 30 and December 30 of each year. On and after December 30, 2024, through the earlier of maturity or redemption, the 2029 subordinated notes will bear interest at a floating rate per annum equal to three-month term SOFR plus 253 basis points, payable quarterly in arrears on March 30, June 30, September 30, and December 30 of each year, commencing on March 30, 2025. On December 31, 2024, the interest rate on the 2029 subordinated notes yielded 6.840%. The 2029 subordinated notes may be redeemed by the Company, in whole or in part, on any interest payment date after December 30, 2024, at a price equal to the total principal amount plus any accrued and unpaid interest thereon to, but excluding the redemption date, or upon the occurrence of certain specified events.
2030 Subordinated Notes. The Company assumed $225.0 million in aggregate principal amount of 3.875% fixed-to-floating rate subordinated notes due on November 1, 2030 (the 2030 subordinated notes), in connection with the Sterling merger in 2022. The 2030 subordinated notes were issued by Sterling on October 30, 2020, and are not convertible or exchangeable. Prior to November 1, 2025, the interest rate is fixed at 3.875% and payable semi-annually in arrears on May 1 and November 1 of each year. On and after November 1, 2025, through the earlier of maturity or redemption, the 2030 subordinated notes will bear interest at a floating rate per annum equal to three-month term SOFR plus 369 basis points, payable quarterly in arrears on February 1, May 1, August 1, and November 1 of each year, commencing on February 1, 2026. The 2030 subordinated notes may be redeemed by the Company, in whole or in part, on November 1, 2025, or any interest payment date thereafter, at a price equal to the total principal amount plus any accrued and unpaid interest thereon to, but excluding the redemption date, or upon the occurrence of certain specified events.
2033 Junior Subordinated Notes. On September 17, 2003, the Company issued $77.3 million in aggregate principal amount of floating rate junior subordinated notes due September 17, 2033 (the 2033 junior subordinates notes). The 2033 junior subordinates notes are held in Webster Statutory Trust I, a statutory business trust which was created for the purpose of issuing trust preferred securities. Additional information regarding the Webster Statutory Trust I can be found in Note 15: Variable Interest Entities. The 2033 junior subordinates notes are not convertible or exchangeable, and interest is payable quarterly in arrears on March 17, June 17, September 17, and December 17 of each year. The interest rate on the 2033 junior subordinates notes varies quarterly based on 3-month SOFR plus a credit spread adjustment plus a market spread of 2.95%, which yielded 7.56% and 8.59% at December 31, 2024, and 2023, respectively. The 2033 junior subordinated notes may be redeemed by the Company quarterly, in whole or in part, at a price equal to the total principal amount to be redeemed plus any accrued and unpaid interest thereon to the redemption date.
Note 12: Stockholders’ Equity
The following table summarizes the changes in shares of preferred and common stock issued and common stock held as treasury shares: | | | | | | | | | | | | | | | | | | |
| | Preferred Stock Series F Issued | Preferred Stock Series G Issued | Common Stock Issued (1) | Treasury Stock Held | Common Stock Outstanding |
| Balance at December 31, 2021 | | 6,000 | | — | | 93,686,311 | | 3,102,690 | | 90,583,621 | |
| Issued in business combination | | — | | 135,000 | | 89,091,734 | | — | | 89,091,734 | |
| Contribution to charitable foundation | | — | | — | | — | | (242,270) | | 242,270 | |
| Employee stock compensation plan activity | | — | | — | | — | | (458,881) | | 458,881 | |
| Stock options exercised | | — | | — | | — | | (30,355) | | 30,355 | |
| Common stock repurchase program | | — | | — | | — | | 6,399,288 | | (6,399,288) | |
| Balance at December 31, 2022 | | 6,000 | | 135,000 | | 182,778,045 | | 8,770,472 | | 174,007,573 | |
| Restricted stock compensation plan activity | | — | | — | | — | | (605,684) | | 605,684 | |
| Stock options exercised | | — | | — | | — | | (75,848) | | 75,848 | |
| Common stock repurchase program | | — | | — | | — | | 2,667,149 | | (2,667,149) | |
| Balance at December 31, 2023 | | 6,000 | | 135,000 | | 182,778,045 | | 10,756,089 | | 172,021,956 | |
| Restricted stock compensation plan activity | | — | | — | | — | | (768,737) | | 768,737 | |
| Stock options exercised | | — | | — | | — | | (8,858) | | 8,858 | |
| Common stock repurchase program | | — | | — | | — | | 1,408,426 | | (1,408,426) | |
| Balance at December 31, 2024 | | 6,000 | | 135,000 | | 182,778,045 | | 11,386,920 | | 171,391,125 | |
(1)In accordance with the Sterling merger agreement, 87,965,239 shares were issued as consideration for outstanding Sterling common stock, and 1,126,495 shares were issued to replace Sterling equity awards.
Repurchases of Common Stock
The Company maintains a common stock repurchase program, which was approved by the Board of Directors on
October 24, 2017, that authorizes management to purchase shares of Webster common stock in open market or privately negotiated transactions, through block trades, and pursuant to any adopted predetermined trading plan subject to the availability and trading price of stock, general market conditions, alternative uses for capital, regulatory considerations, and the Company’s financial performance. On April 27, 2022, the Board of Directors increased the Company’s authority to repurchase shares of Webster common stock under the repurchase program by $600.0 million in shares. During the year ended December 31, 2024, the Company repurchased 1,408,426 shares under the repurchase program at a weighted-average price of $46.44 per share, totaling $65.4 million. At December 31, 2024, the Company’s remaining purchase authority was $228.0 million.
In addition, the Company will periodically acquire Webster common stock outside of the repurchase program related to employee stock compensation plan activity. During the year ended December 31, 2024, the Company repurchased 361,324 shares at a weighted-average price of $47.64 per share, totaling $17.2 million for this purpose.
Series F Preferred Stock
On December 12, 2017, the Company closed on a public offering of 6,000,000 depositary shares, each representing 1/1000th ownership interest in a share of 5.25% Series F Non-Cumulative Preferred Perpetual Stock, par value $0.01 per share, with a liquidation preference equal to $25,000 per share (the Series F Preferred Stock).
Dividends on the Series F Preferred Stock are non-cumulative and are not mandatory. If declared by the Board of Directors, or a duly authorized committee thereof, the Company will pay dividends quarterly in arrears on the fifteenth day of each March, June, September, and December, at a rate equal to 5.25% of the $25,000 per share liquidation amount per annum. If a dividend on the Series F Preferred Stock is not declared in respect of a dividend period, a dividend will not accrue and the Company has no obligation to pay any dividend for that period, regardless as to whether a dividend is declared for a future period on the Series G Preferred Stock or any other series of Webster preferred stock. The terms of the Series F Preferred Stock prohibit the Company from declaring or paying any cash dividends on Webster common stock, and from repurchasing, redeeming, or otherwise acquiring Webster common stock or any other series of Webster preferred stock to which it ranks on parity with, unless dividends have been declared and paid in full on the Series F Preferred Stock for the most recent dividend period.
The Series F Preferred Stock is perpetual and has no maturity date, and is not subject to any mandatory redemption, sinking fund, or other similar provisions. Except with respect to certain non-payment events and certain changes to the terms of the Series F Preferred Stock, holders have no voting rights nor preemptive or conversion rights. The Series F Preferred Stock is not convertible or exchangeable for shares of any other class of Webster stock.
Series G Preferred Stock
On January 31, 2022, in connection with the Sterling merger, the Company registered and issued 5,400,000 depositary shares, each representing 1/40th interest in a share of 6.50% Series G Non-Cumulative Preferred Perpetual Stock, par value $0.01 per share, with a liquidation preference equal to $1,000 per share (the Series G Preferred Stock). The Series G Preferred Stock ranks on parity with the Series F Preferred Stock and senior to Webster common stock, with respect to the payment of dividends and distributions upon the liquidation, dissolution, or winding-up of the Company.
Dividends on the Series G Preferred Stock are non-cumulative and are not mandatory. If declared by the Board of Directors, or a duly authorized committee thereof, the Company will pay dividends quarterly in arrears on the fifteenth day of each
January, April, July, and October, at a rate equal to 6.50% of the $1,000 per share liquidation amount per annum. If a dividend on the Series F Preferred Stock is not declared in respect of a dividend period, a dividend will not accrue and the Company has no obligation to pay any dividend for that period, regardless as to whether a dividend is declared for a future period on the Series G Preferred Stock or any other series of Webster preferred stock. The terms of the Series G Preferred Stock prohibit the Company from declaring or paying any cash dividends on Webster common stock, and from repurchasing, redeeming or otherwise acquiring Webster common stock or any other series of Webster preferred stock to which it ranks on parity with, unless dividends have been declared and paid in full on the Series G Preferred Stock for the most recent dividend period.
The Series G Preferred Stock is perpetual and has no maturity date, and is not subject to any mandatory redemption, sinking fund, or other similar provisions. Except with respect to certain non-payment events and certain changes to the terms of the Series G Preferred Stock, holders have no voting rights, nor preemptive or conversion rights. The Series G Preferred Stock is not convertible or exchangeable for shares of any other class of Webster stock.
Preferred Stock Redemptions
The Company may redeem either the Series F Preferred Stock or the Series G Preferred Stock at its option, in whole or in part, subject to the approval of Federal Reserve Board, on any dividend payment date, or in whole but not in part, upon the occurrence of a regulatory capital treatment event, at a redemption price equal to the liquidation preference plus any declared and unpaid dividends, without accumulation of any undeclared dividends. The Company has no plans to redeem either its Series F Preferred Stock or its Series G Preferred stock, in whole or in part, as of the date of this Annual Report on Form 10-K.
Note 13: Accumulated Other Comprehensive (Loss), Net of Tax
The following table summarizes the changes in each component of accumulated other comprehensive (loss) income, net of the related tax impact: | | | | | | | | | | | | | | |
| (In thousands) | Investment Securities Available-
for-Sale | Derivative Financial Instruments | Defined Benefit Pension and Other Postretirement Benefit Plans | Total |
| Balance at December 31, 2021 | $ | 4,536 | | $ | 6,070 | | $ | (33,186) | | $ | (22,580) | |
| Other comprehensive (loss) before reclassifications | (640,656) | | (17,810) | | (13,350) | | (671,816) | |
Amounts reclassified from accumulated other comprehensive
income (loss) | 4,960 | | 2,866 | | 1,610 | | 9,436 | |
| Other comprehensive (loss), net of tax | (635,696) | | (14,944) | | (11,740) | | (662,380) | |
| Balance at December 31, 2022 | (631,160) | | (8,874) | | (44,926) | | (684,960) | |
| Other comprehensive income before reclassifications | 86,391 | | 4,066 | | 11,794 | | 102,251 | |
| Amounts reclassified from accumulated other comprehensive (loss) | 27,319 | | 1,939 | | 2,880 | | 32,138 | |
| Other comprehensive income, net of tax | 113,710 | | 6,005 | | 14,674 | | 134,389 | |
| Balance at December 31, 2023 | (517,450) | | (2,869) | | (30,252) | | (550,571) | |
| Other comprehensive (loss) income before reclassifications | (104,628) | | (7,223) | | 2,397 | | (109,454) | |
Amounts reclassified from accumulated other comprehensive
(loss) | 101,760 | | 492 | | 1,390 | | 103,642 | |
| Other comprehensive (loss) income, net of tax | (2,868) | | (6,731) | | 3,787 | | (5,812) | |
| Balance at December 31, 2024 | $ | (520,318) | | $ | (9,600) | | $ | (26,465) | | $ | (556,383) | |
The following table further summarizes the amounts reclassified from accumulated other comprehensive (loss) income: | | | | | | | | | | | | | | | | | | | | |
| Years ended December 31, | |
| Accumulated Other Comprehensive (Loss) Income Components | 2024 | | 2023 | | 2022 | Associated Line Item in the Consolidated Statements Of Income |
| (In thousands) | | | | | | |
| Investment securities available-for-sale: | | | | | | |
| Net unrealized (losses) | $ | (138,794) | | | $ | (37,356) | | | $ | (6,751) | | (Loss) on sale of investment securities (1) |
| | | | | | |
| | | | | | |
| Tax benefit | 37,034 | | | 10,037 | | | 1,791 | | Income tax expense |
| Net of tax | $ | (101,760) | | | $ | (27,319) | | | $ | (4,960) | | |
| Derivative financial instruments: | | | | | | |
| Hedge terminations | $ | (34) | | | $ | (310) | | | $ | (306) | | Interest expense |
| Premium amortization | (533) | | | (2,349) | | | (3,626) | | Interest income |
| Tax benefit | 75 | | | 720 | | | 1,066 | | Income tax expense |
| Net of tax | $ | (492) | | | $ | (1,939) | | | $ | (2,866) | | |
| Defined benefit pension and other postretirement benefit plans: | | | | | | |
| Actuarial net loss amortization | $ | (1,907) | | | $ | (2,083) | | | $ | (2,210) | | Other expense |
| Other | — | | | (1,869) | | | — | | Other expense |
| Tax benefit | 517 | | | 1,072 | | | 600 | | Income tax expense |
| Net of tax | $ | (1,390) | | | $ | (2,880) | | | $ | (1,610) | | |
(1)Losses realized on sale of investment securities available-for-sale are generally included as a component of non-interest income on the accompanying Consolidated Statements of Income unless any portion or all of the loss is due to credit related factors, in which the amount is then included in the Provision for credit losses. During the years ended December 31, 2024, and 2023, $2.6 million and $3.8 million, respectively, of the total losses realized on sale of investment securities available-for-sale were included in the Provision for credit losses. There were no losses realized on sale of investment securities available-for-sale included in the Provision for credit losses for the year ended December 31, 2022.
The following tables summarize each component of other comprehensive (loss) income and the related tax effects: | | | | | | | | | | | |
| Year ended December 31, 2024 |
| (In thousands) | Amount
Before Tax | Tax Benefit (Expense) | Amount
Net of Tax |
| Investment securities available-for-sale: | | | |
| Net unrealized (losses) arising during the year | $ | (143,049) | | $ | 38,421 | | $ | (104,628) | |
| Reclassification adjustment for net realized losses included in net income | 138,794 | | (37,034) | | 101,760 | |
| Total investment securities available-for-sale | (4,255) | | 1,387 | | (2,868) | |
| Derivative financial instruments: | | | |
| Net unrealized (losses) arising during the year | (9,911) | | 2,688 | | (7,223) | |
| Reclassification adjustment for net realized losses included in net income | 567 | | (75) | | 492 | |
| Total derivative financial instruments | (9,344) | | 2,613 | | (6,731) | |
| Defined benefit pension and other postretirement benefit plans: | | | |
| Net actuarial gain arising during the year | 3,290 | | (893) | | 2,397 | |
| Reclassification adjustment for actuarial net loss amortization included in net income | 1,907 | | (517) | | 1,390 | |
| Total defined benefit pension and other postretirement benefit plans | 5,197 | | (1,410) | | 3,787 | |
| Other comprehensive (loss), net of tax | $ | (8,402) | | $ | 2,590 | | $ | (5,812) | |
| | | |
| Year ended December 31, 2023 |
| (In thousands) | Amount
Before Tax | Tax Benefit (Expense) | Amount
Net of Tax |
| Investment securities available-for-sale: | | | |
| Net unrealized gains arising during the year | $ | 118,410 | | $ | (32,019) | | $ | 86,391 | |
| Reclassification adjustment for net realized losses included in net income | 37,356 | | (10,037) | | 27,319 | |
| Total investment securities available-for-sale | 155,766 | | (42,056) | | 113,710 | |
| Derivative financial instruments: | | | |
| Net unrealized gains arising during the year | 5,578 | | (1,512) | | 4,066 | |
| Reclassification adjustment for net realized losses included in net income | 2,659 | | (720) | | 1,939 | |
| Total derivative financial instruments | 8,237 | | (2,232) | | 6,005 | |
| Defined benefit pension and other postretirement benefit plans: | | | |
| Net actuarial gain arising during the year | 16,183 | | (4,389) | | 11,794 | |
Reclassification adjustment for actuarial net loss amortization and other
included in net income | 3,952 | | (1,072) | | 2,880 | |
| Total defined benefit pension and other postretirement benefit plans | 20,135 | | (5,461) | | 14,674 | |
| Other comprehensive income, net of tax | $ | 184,138 | | $ | (49,749) | | $ | 134,389 | |
| | | |
| Year ended December 31, 2022 |
| (In thousands) | Amount
Before Tax | Tax Benefit (Expense) | Amount
Net of Tax |
| Investment securities available-for-sale: | | | |
| Net unrealized (losses) arising during the year | $ | (878,366) | | $ | 237,710 | | $ | (640,656) | |
| Reclassification adjustment for net realized losses included in net income | 6,751 | | (1,791) | | 4,960 | |
| Total investment securities available-for-sale | (871,615) | | 235,919 | | (635,696) | |
| Derivative financial instruments: | | | |
| Net unrealized (losses) arising during the year | (24,440) | | 6,630 | | (17,810) | |
| Reclassification adjustment for net realized losses included in net income | 3,932 | | (1,066) | | 2,866 | |
| Total derivative financial instruments | (20,508) | | 5,564 | | (14,944) | |
| Defined benefit pension and other postretirement benefit plans: | | | |
| Net actuarial (loss) arising during the year | (18,319) | | 4,969 | | (13,350) | |
| Reclassification adjustment for net actuarial loss amortization included in net income | 2,210 | | (600) | | 1,610 | |
| Total defined benefit pension and other postretirement benefit plans | (16,109) | | 4,369 | | (11,740) | |
| Other comprehensive (loss), net of tax | $ | (908,232) | | $ | 245,852 | | $ | (662,380) | |
Note 14: Regulatory Capital and Restrictions
Regulatory Capital Requirements
The Company and the Bank are subject to various regulatory capital requirements administered by the federal banking agencies. Failure to meet minimum capital requirements can initiate certain mandatory actions by regulators that could have a direct material effect on the Company’s financial statements. Under capital adequacy guidelines and/or the regulatory framework for prompt corrective action (applies to the Bank only), both the Company and the Bank must meet specific capital guidelines that involve quantitative measures of assets, liabilities, and certain off-balance sheet items calculated pursuant to regulatory directives. Capital amounts and classification are also subject to qualitative judgments by the regulators about components, risk weightings, and other factors.
Quantitative measures established by Basel III to ensure capital adequacy require the Company and the Bank to maintain minimum ratios of CET1 Risk-Based Capital, Tier 1 Risk-Based Capital, Total Risk-Based Capital, and Tier 1 Leverage Capital, as defined in the regulations. CET1 capital consists of common stockholders’ equity less deductions for goodwill and other intangible assets, and certain deferred tax adjustments. At the time of initial adoption of the Basel III Capital Rules, the Company had elected to opt-out of the requirement to include certain components of AOCI in CET1 capital. Tier 1 capital consists of CET1 capital plus preferred stock. Total capital consists of Tier 1 capital and Tier 2 capital, as defined in the regulations. Tier 2 capital includes qualifying subordinated debt and the permissible portion of the ACL.
At December 31, 2024, and 2023, both the Company and the Bank were classified as “well-capitalized.”
The following table provides information on the regulatory capital ratios for the Company and the Bank: | | | | | | | | | | | | | | | | | | | | | | | | | | |
| At December 31, 2024 |
| | Actual (1) | | Minimum Requirement | | Well Capitalized |
| (In thousands) | Amount | Ratio | | Amount | Ratio | | Amount | Ratio |
| Webster Financial Corporation | | | | | | | | |
| CET1 Risk-Based Capital | $ | 6,318,876 | | 11.54 | % | | $ | 2,464,542 | | 4.5 | % | | $ | 3,559,895 | | 6.5 | % |
| Tier 1 Risk-Based Capital | 6,602,855 | | 12.06 | | | 3,286,057 | | 6.0 | | | 4,381,409 | | 8.0 | |
| Total Risk-Based Capital | 7,800,717 | | 14.24 | | | 4,381,409 | | 8.0 | | | 5,476,761 | | 10.0 | |
| Tier 1 Leverage Capital | 6,602,855 | | 8.70 | | | 3,034,369 | | 4.0 | | | 3,792,961 | | 5.0 | |
| Webster Bank | | | | | | | | |
| CET1 Risk-Based Capital | $ | 6,847,474 | | 12.53 | % | | $ | 2,460,031 | | 4.5 | % | | $ | 3,553,378 | | 6.5 | % |
| Tier 1 Risk-Based Capital | 6,847,474 | | 12.53 | | | 3,280,042 | | 6.0 | | | 4,373,389 | | 8.0 | |
| Total Risk-Based Capital | 7,512,143 | | 13.74 | | | 4,373,389 | | 8.0 | | | 5,466,736 | | 10.0 | |
| Tier 1 Leverage Capital | 6,847,474 | | 9.04 | | | 3,031,190 | | 4.0 | | | 3,788,988 | | 5.0 | |
| | | | | | | | |
| At December 31, 2023 |
| Actual (1) | | Minimum Requirement | | Well Capitalized |
| (In thousands) | Amount | Ratio | | Amount | Ratio | | Amount | Ratio |
| Webster Financial Corporation | | | | | | | | |
| CET1 Risk-Based Capital | $ | 6,188,433 | | 11.11 | % | | $ | 2,507,190 | | 4.5 | % | | $ | 3,621,497 | | 6.5 | % |
| Tier 1 Risk-Based Capital | 6,472,412 | | 11.62 | | | 3,342,920 | | 6.0 | | | 4,457,227 | | 8.0 | |
| Total Risk-Based Capital | 7,643,423 | | 13.72 | | | 4,457,227 | | 8.0 | | | 5,571,534 | | 10.0 | |
| Tier 1 Leverage Capital | 6,472,412 | | 9.06 | | | 2,857,890 | | 4.0 | | | 3,572,362 | | 5.0 | |
| Webster Bank | | | | | | | | |
| CET1 Risk-Based Capital | $ | 6,913,443 | | 12.43 | % | | $ | 2,502,835 | | 4.5 | % | | $ | 3,615,206 | | 6.5 | % |
| Tier 1 Risk-Based Capital | 6,913,443 | | 12.43 | | | 3,337,113 | | 6.0 | | | 4,449,484 | | 8.0 | |
| Total Risk-Based Capital | 7,494,332 | | 13.47 | | | 4,449,484 | | 8.0 | | | 5,561,855 | | 10.0 | |
| Tier 1 Leverage Capital | 6,913,443 | | 9.69 | | | 2,855,212 | | 4.0 | | | 3,569,015 | | 5.0 | |
(1)In accordance with regulatory capital rules, the Company elected to delay the estimated impact of the adoption of CECL on its regulatory capital over a two-year deferral period, which ended on January 1, 2022, and a subsequent three-year transition period, which ended on December 31, 2024. During the three-year transition period, regulatory capital ratios phased out the aggregate amount of the regulatory capital benefit provided from the delayed CECL adoption in the initial two years. For 2023 and 2024, the Company was allowed 50% and 25%, respectively, of the regulatory capital benefit as of December 31, 2021, with full absorption occurring in 2025.
Dividend Restrictions
The Holding Company is dependent upon dividends from the Bank to provide funds for the payment of dividends to stockholders and for other cash requirements. Dividends paid by the Bank are subject to various federal and state regulatory limitations. Express approval by the OCC is required if the effect of dividends declared would cause the regulatory capital of the Bank to fall below specified minimum levels or if the amount would exceed net income for that year combined with undistributed net income for the preceding two years. The Bank paid the Holding Company $600.0 million in dividends during the years ended December 31, 2024, and 2023, for which no express approval from the OCC was required.
Cash Restrictions
The Bank is required under Federal Reserve regulations to maintain cash reserve balances in the form of vault cash or deposits held at a FRB to ensure that it is able to meet customer demands. The reserve requirement ratio is subject to adjustment as economic conditions warrant. On March 26, 2020, the Federal Reserve reduced the reserve requirement ratios on all net transaction accounts to zero percent. As a result, the Bank has not been required to hold cash reserve balances since that date.
Note 15: Variable Interest Entities
The Company has an investment interest in the following entities that each meet the definition of a VIE. Information regarding consolidation of VIEs can be found within Note 1: Summary of Significant Accounting Policies.
Consolidated
Rabbi Trusts. The Company established a Rabbi Trust to meet its obligations due under the Webster Bank Deferred Compensation Plan for Directors and Officers. The funding of the Rabbi Trust and the discontinuation of the Webster Bank Deferred Compensation Plan for Directors and Officers occurred during 2012. In connection with the Sterling merger in 2022, the Company acquired assets held in a separate Rabbi Trust that had been previously established to fund obligations due under the Greater New York Savings Bank Directors’ Retirement Plan.
Investments held in these Rabbi Trusts consist primarily of mutual funds that invest in equity and fixed income securities. The Company is considered the primary beneficiary of these Rabbi Trusts as it has the power to direct the activities that most significantly impact their economic performance and it has the obligation to absorb losses and/or the right to receive benefits that could potentially be significant.
The Rabbi Trusts’ assets are included in Accrued interest receivable and other assets on the accompanying Consolidated Balance Sheets. Investment earnings and any changes in fair value are included in Other income on the accompanying Consolidated Statements of Income. Additional information regarding the Rabbi Trusts’ investments can be found within
Note 18: Fair Value Measurements.
Non-Consolidated
Low Income Housing Tax Credit Investments. The Company makes non-marketable equity investments in entities that sponsor affordable housing and other community development projects that qualify for the LIHTC Program pursuant to Section 42 of the Internal Revenue Code. The purpose of these investments is not only to assist the Bank in meeting its responsibilities under the CRA, but also to provide a return, primarily through the realization of tax benefits. While the Company’s investment in an entity may exceed 50% of its outstanding equity interests, the entity is not consolidated as the Company is not the primary beneficiary. The Company has determined that it is not the primary beneficiary due to its inability to direct the activities that most significantly impact economic performance. The Company applies the proportional amortization method to subsequently measure its investments in qualified affordable housing projects.
The following table summarizes the Company’s LIHTC investments and related unfunded commitments: | | | | | | | | | | | |
| At December 31, |
| (In thousands) | 2024 | | 2023 |
| Gross investment in LIHTC investments | $ | 1,439,461 | | | $ | 1,135,192 | |
| Accumulated amortization | (222,101) | | | (141,199) | |
| Net investment in LIHTC investments | $ | 1,217,360 | | | $ | 993,993 | |
| | | |
| Unfunded commitments for LIHTC investments | $ | 720,890 | | | $ | 549,258 | |
The aggregate carrying value of the Company’s LIHTC investments and the related unfunded commitments are included in Accrued interest receivable and other assets and Accrued expenses and other liabilities, respectively, on the accompanying Consolidated Balance Sheets. The Company’s maximum exposure to loss related to its LIHTC investments is generally the aggregate carrying value as of each reporting date. However, income tax credits recognized related to these investments are subject to recapture by taxing authorities for up to a period of 15 years based on compliance provisions that are required to be met at the project level. During the years ended December 31, 2024, and 2023 there were $304.3 million and $334.9 million of net commitments approved to fund LIHTC investments, respectively.
The following table summarizes the amount of income tax credits, other income tax benefits, and investment amortization generated from the Company’s LIHTC investments, which are recognized as a component of income tax expense on the accompanying Consolidated Statements of Income: | | | | | | | | | | | |
| Years ended December 31, |
| (In thousands) | 2024 | | 2023 |
Income tax credits and other income tax benefits from
LIHTC investments | $ | (107,851) | | | $ | (90,093) | |
| Investment amortization from LIHTC investments | 80,902 | | | 71,775 | |
Income tax credits, other income tax benefits, and investment amortization generated from the Company’s LIHTC investments are included as a component of operating activities on the accompanying Consolidated Statements of Cash Flows.
Webster Statutory Trust I. The Company owns all the outstanding common stock of Webster Statutory Trust I, a financial vehicle that has issued, and in the future may issue, trust preferred securities. The Company is not the primary beneficiary of Webster Statutory Trust I. The only assets of the Webster Statutory Trust I are junior subordinated debentures that are issued by the Company, which were acquired using the proceeds from the issuance of trust preferred securities and common stock. The junior subordinated debentures are included in Long-term debt on the accompanying Consolidated Balance Sheets, and the related interest expense is included in Long-term debt on the accompanying Consolidated Statements of Income. Additional information regarding these junior subordinated debentures can be found within Note 11: Borrowings.
Multi-family Securitization Trusts. As previously discussed in Note 5: Transfers and Servicing of Financial Assets, on September 30, 2024, the Company completed a multi-family securitization. The Company has determined that it is not the primary beneficiary of the multi-family securitization trusts since it does not have the power to direct the activities that would have the most significant impact on their economic performance. The Company’s maximum exposure related to the multi-family securitization trusts is $36.4 million, which represents its obligation to Freddie Mac to guarantee losses up to 12% of the aggregate UPB of the loans at the time of sale. The obligation is secured in full by an irrevocable letter of credit issued by the FHLB.
Other Non-Marketable Investments. The Company invests in alternative investments comprising interests in non-public entities that cannot be redeemed since the investment is distributed as the underlying equity is liquidated. The ultimate timing and amount of these distributions cannot be predicted with reasonable certainty. For each of these alternative investments that is classified as a variable interest entity, the Company has determined that it is not the primary beneficiary due to its inability to direct the activities that most significantly impact economic performance. The aggregate carrying value of the Company’s other
non-marketable investments was $216.5 million and $190.1 million at December 31, 2024, and 2023, respectively, which is included in Accrued interest receivable and other assets on the accompanying Consolidated Balance Sheets, and its maximum exposure to loss, including unfunded commitments, was $332.8 million and $307.2 million, respectively. Additional information regarding other non-marketable investments can be found within Note 18: Fair Value Measurements.
Note 16: Earnings Per Common Share
The following table summarizes the calculation of basic and diluted earnings per common share: | | | | | | | | | | | | | | | | | |
| | Years ended December 31, |
| (In thousands, except per share data) | 2024 | | 2023 | | 2022 |
| Net income | $ | 768,707 | | | $ | 867,840 | | | $ | 644,283 | |
| Less: Preferred stock dividends | 16,650 | | | 16,650 | | | 15,919 | |
| Net income available to common stockholders | 752,057 | | | 851,190 | | | 628,364 | |
| Less: Earnings allocated to participating securities | 7,981 | | | 7,922 | | | 5,672 | |
| Earnings applicable to common stockholders | $ | 744,076 | | | $ | 843,268 | | | $ | 622,692 | |
| | | | | |
| Weighted-average common shares outstanding - basic | 169,820 | | | 171,775 | | | 167,452 | |
| Add: Effect of dilutive stock options and restricted stock | 372 | | | 108 | | | 95 | |
| Weighted-average common shares - diluted | 170,192 | | | 171,883 | | | 167,547 | |
| | | | | |
| Basic earnings per common share | $ | 4.38 | | | $ | 4.91 | | | $ | 3.72 | |
| Diluted earnings per common share | 4.37 | | | 4.91 | | | 3.72 | |
Earnings per common share is calculated under the two-class method in which all earnings, distributed and undistributed, are allocated to common stock and participating securities based on their respective rights to receive dividends. The Company may provide for the grant of stock options, restricted stock, performance-based restricted stock, and stock units to eligible employees and directors under its stock incentive plan. Holders of restricted stock are entitled to receive non-forfeitable dividends during the vesting period on a basis equivalent to the dividends paid to holders of common stock. These unvested awards meet the definition of participating securities.
Potential common shares from performance-based restricted stock that were not included in the computation of dilutive earnings per common share, because they were anti-dilutive under the treasury stock method, were zero, 204,945, and 176,177 for the years ended December 31, 2024, 2023, and 2022, respectively. Additional information regarding the issuance of stock awards under the Company’s stock incentive plan can be found within Note 20: Share-Based Plans.
Note 17: Derivative Financial Instruments
Derivative Positions and Offsetting
Derivatives Designated in Hedge Relationships. Interest rate swaps allow the Company to change the fixed or variable nature of an interest rate without the exchange of the underlying notional amount. Certain pay fixed/receive variable interest rate swaps are designated as cash flow hedges to effectively convert variable-rate debt into fixed-rate debt, whereas certain receive fixed/pay variable interest rate swaps are designated as fair value hedges to effectively convert fixed-rate long-term debt into variable-rate debt. Certain purchased options are also designated as cash flow hedges. Purchased options allow the Company to limit the potential adverse impact of variable interest rates by establishing a cap rate or floor rate in exchange for an upfront premium. The purchased options designated as cash flow hedges represent interest rate caps where payment is received from the counterparty if interest rates rise above the cap rate, and interest rate floors where payment is received from the counterparty when interest rates fall below the floor rate.
Derivatives Not Designated in Hedge Relationships. The Company also enters into derivative transactions that are not designated in hedge relationships. The Company has a back-to-back swap program, whereby it enters into an interest rate swap with a qualified customer and simultaneously enters into an equal and opposite interest-rate swap with a swap counterparty, to hedge interest rate risk. Derivative assets and derivative liabilities with the same counterparty are presented on a net basis when master netting agreements are in place.
The following tables present the notional amounts and fair values, including accrued interest, of derivative positions: | | | | | | | | | | | | | | | | | |
| At December 31, 2024 |
| Asset Derivatives | | Liability Derivatives |
| (In thousands) | Notional Amounts | Fair Value | | Notional Amounts | Fair Value |
| Designated as hedging instruments: | | | | | |
Interest rate derivatives (1) | $ | 750,000 | | $ | 719 | | | $ | 4,250,000 | | $ | 13,169 | |
| Not designated as hedging instruments: | | | | | |
Interest rate derivatives (1) | 8,693,493 | | 300,120 | | | 8,728,767 | | 298,296 | |
Mortgage banking derivatives (2) | 584 | | 3 | | | — | | — | |
Other (3) | 337,370 | | 1,300 | | | 833,449 | | 96 | |
| Total not designated as hedging instruments | 9,031,447 | | 301,423 | | | 9,562,216 | | 298,392 | |
| Gross derivative instruments, before netting | $ | 9,781,447 | | 302,142 | | | $ | 13,812,216 | | 311,561 | |
| Less: Master netting agreements | | 31,881 | | | | 31,881 | |
| Cash collateral pledged | | 251,212 | | | | 80 | |
| Total derivative instruments, after netting | | $ | 19,049 | | | | $ | 279,600 | |
| | | | | |
| At December 31, 2023 |
| Asset Derivatives | | Liability Derivatives |
| (In thousands) | Notional Amounts | Fair Value | | Notional Amounts | Fair Value |
| Designated as hedging instruments: | | | | | |
Interest rate derivatives (1) | $ | 2,750,000 | | $ | 11,140 | | | $ | 2,700,000 | | $ | 13,679 | |
| Not designated as hedging instruments: | | | | | |
Interest rate derivatives (1) | 8,284,356 | | 319,122 | | | 8,272,197 | | 321,064 | |
Mortgage banking derivatives (2) | 2,798 | | 37 | | | — | | — | |
Other (3) | 340,553 | | 337 | | | 731,055 | | 1,067 | |
| Total not designated as hedging instruments | 8,627,707 | | 319,496 | | | 9,003,252 | | 322,131 | |
| Gross derivative instruments, before netting | $ | 11,377,707 | | 330,636 | | | $ | 11,703,252 | | 335,810 | |
| Less: Master netting agreements | | 55,949 | | | | 55,949 | |
| Cash collateral pledged | | 232,190 | | | | — | |
| Total derivative instruments, after netting | | $ | 42,497 | | | | $ | 279,861 | |
(1)Balances related to clearing houses are presented as a single unit of account. In accordance with their rule books, clearing houses legally characterize variation margin payments as settlement of derivatives rather than collateral against derivative positions. Notional amounts of interest rate swaps cleared through clearing houses included $71.1 million and $113.8 million for asset derivatives at December 31, 2024, and 2023, respectively. The related fair values approximate zero. There were no interest rate swaps cleared through clearing houses for liability derivatives at both December 31, 2024, and 2023.
(2)Notional amounts related to residential loans exclude approved floating rate commitments of $0.4 million and $1.0 million at December 31, 2024, and 2023, respectively.
(3)Other derivatives include foreign currency forward contracts related to lending arrangements, a Visa equity swap transaction, and risk participation agreements. Notional amounts of risk participation agreements include $294.5 million and $299.2 million for asset derivatives and $796.6 million and $682.9 million for liability derivatives at December 31, 2024, and 2023, respectively, which have insignificant related fair values.
The following tables represent the offsetting of derivative financial instruments that are subject to master netting agreements: | | | | | | | | | | | | | | | | | | | | | | | | | | | | | | | | | | | |
| At December 31, 2024 |
| Gross Amounts of Recognized Assets/Liabilities | | Gross Amounts Offset in the Statement of Financial Position | | Net Amounts of Assets/Liabilities Presented in the Statement of Financial Position | | Gross Amounts Not Offset in the Statement of Financial position | | |
| | | | | |
| (In thousands) | | | | Financial Instruments | | Cash Collateral Pledged | | Net Amount |
| Asset derivatives | $ | 283,185 | | | $ | 31,881 | | | $ | 251,304 | | | $ | — | | | $ | 251,212 | | | $ | 92 | |
| Liability derivatives | 32,218 | | | 31,881 | | | 337 | | | — | | | 80 | | | 257 | |
| | | | | | | | | | | |
| At December 31, 2023 |
| Gross Amounts of Recognized Assets/Liabilities | | Gross Amounts Offset in the Statement of Financial Position | | Net Amounts of Assets/Liabilities Presented in the Statement of Financial Position | | Gross Amounts Not Offset in the Statement of Financial position | | |
| | | | | |
| (In thousands) | | | | Financial Instruments | | Cash Collateral Pledged | | Net Amount |
| Asset derivatives | $ | 289,778 | | | $ | 55,949 | | | $ | 233,829 | | | $ | — | | | $ | 232,190 | | | $ | 1,639 | |
| Liability derivatives | 55,949 | | | 55,949 | | | — | | | — | | | — | | | — | |
Derivative Activity
The following table summarizes the income statement effect of derivatives designated as hedging instruments: | | | | | | | | | | | | | | | | | | | | |
| Recognized In | Years ended December 31, |
| (In thousands) | Net Interest Income | 2024 | | 2023 | | 2022 |
| Fair value hedges: | | | | | | |
| Interest rate derivatives | Deposits interest expense | $ | (1,320) | | | $ | 3,194 | | | $ | — | |
| Hedged item | Deposits interest expense | — | | | (15) | | | — | |
Net recognized on fair value hedges (1) | | $ | 1,320 | | | $ | (3,179) | | | $ | — | |
| Cash flow hedges: | | | | | | |
| Interest rate derivatives | Long-term debt interest expense | $ | 34 | | | $ | 310 | | | $ | 306 | |
| Interest rate derivatives | Interest and fees on loans and leases | (42,005) | | | (14,628) | | | 1,935 | |
| Net recognized on cash flow hedges | | $ | (42,039) | | | $ | (14,938) | | | $ | 1,629 | |
(1)The Company de-designated its fair value hedging relationship on $400.0 million of deposits, which pertained to a portion of Ametros’ member deposits, in 2023. The $1.3 million basis adjustment included in the carrying amount of deposits at
December 31, 2023, was amortized into interest expense in January 2024 upon the acquisition of Ametros.
Time-value premiums are excluded from the assessment of hedge effectiveness for purchased options designated as cash flow hedges. During the years ended December 31, 2024, 2023, and 2022, $0.5 million, $2.3 million, and $3.6 million of time-value premiums, respectively, for which a straight-line amortization approach was applied, were recognized in interest income. There were no remaining unamortized time-value premiums at December 31, 2024. Over the next twelve months, an estimated $5.2 million related to cash flow hedge gain or loss will be reclassified from AOCL, decreasing interest income as hedge interest payments are made. Additional information regarding cash flow hedge activity impacting AOCL and the related amounts reclassified to net income can be found within Note 13: Accumulated Other Comprehensive (Loss), Net of Tax. The maximum length of time over which forecasted transactions are hedged is 2.2 years.
The following table summarizes the income statement effect of derivatives not designated as hedging instruments: | | | | | | | | | | | | | | | | | | | | |
| Recognized In | Years ended December 31, |
| (In thousands) | Non-interest Income | 2024 | | 2023 | | 2022 |
| Interest rate derivatives | Other income | $ | (1,480) | | | $ | (6,159) | | | $ | 25,092 | |
| Mortgage banking derivatives | Mortgage banking activities | (34) | | | 5 | | | (48) | |
| Other | Other income | 4,246 | | | (2,476) | | | 3,249 | |
| Total not designated as hedging instruments | $ | 2,732 | | | $ | (8,630) | | | $ | 28,293 | |
Derivative Exposure. At December 31, 2024, the Company had $256.2 million of cash collateral received and $0.1 million of cash collateral posted included in Cash and due from banks on the accompanying Consolidated Balance Sheets. In addition, the Company had $1.7 million in initial margin posted at clearing houses. The Company regularly evaluates the credit risk of its derivative customers, taking into account the likelihood of default, net exposures, and remaining contractual life, among other related factors. Credit risk exposure is mitigated as transactions with customers are generally secured by the same collateral of the underlying transactions. Current net credit exposure relating to derivatives with the Bank’s customers was $19.0 million at December 31, 2024. In addition, the Company monitors potential future exposure, representing its best estimate of exposure to remaining contractual maturity. The potential future exposure relating to derivatives with the Bank’s customers totaled $109.2 million at December 31, 2024. The Company has incorporated a credit valuation adjustment (contra-liability) to reflect non-performance risk in the fair value measurement of its derivatives, which totaled $7.6 million and $6.2 million at December 31, 2024, and 2023, respectively. Various factors impact changes in the valuation adjustment over time, such as changes in the credit spreads of the contracted parties, and changes in market rates and volatilities, which affect the total expected exposure of the derivative instruments.
Note 18: Fair Value Measurements
Fair value is defined as the price that would be received to sell an asset or paid to transfer a liability in an orderly transaction between market participants at the measurement date. The determination of fair value may require the use of estimates when quoted market prices are not available. Fair value estimates made at a specific point in time are based on management’s judgments regarding future expected losses, current economic conditions, the risk characteristics of each financial instrument, and other subjective factors that cannot be determined with precision.
The framework for measuring fair value provides a fair value hierarchy that prioritizes the inputs to valuation techniques used to measure value. The hierarchy gives the highest priority to unadjusted quoted prices in active markets for identical assets or liabilities and the lowest priority to unobservable inputs. The three levels within the fair value hierarchy are as follows:
•Level 1: Inputs to the valuation methodology are unadjusted quoted prices for identical assets or liabilities in active markets that the Company has the ability to access at the measurement date.
•Level 2: Inputs to the valuation methodology include quoted prices for similar assets or liabilities in active markets, quoted prices for identical or similar assets or liabilities in inactive markets, inputs other than quoted prices that are observable for the asset or liability (i.e., interest rates, rate volatility, prepayment speeds, and credit ratings), or inputs that are derived principally from or corroborated by market data, correlation or other means.
•Level 3: Inputs to the valuation methodology are unobservable and significant to the fair value measurement. This includes certain pricing models or other similar techniques that require significant management judgment or estimation.
Assets and Liabilities Measured at Fair Value on a Recurring Basis
Available-for-Sale Securities. When unadjusted quoted prices are available in an active market, the Company classifies its available-for-sale investment securities within Level 1 of the fair value hierarchy. When quoted market prices are not available, the Company employs an independent pricing service that utilizes matrix pricing to calculate fair value. These fair value measurements consider observable data, such as dealer quotes, market spreads, cash flows, yield curves, live trading levels, trade execution data, market consensus prepayment speeds, credit information, and the respective terms and conditions for debt instruments. Management maintains procedures to monitor the pricing service’s results and has a process in place to challenge their valuations and methodologies. Government agency debentures, Municipal bonds and notes, Agency CMO, Agency MBS, Agency CMBS, CMBS, Corporate debt, Private label MBS, and Other available-for-sale securities are classified within Level 2 of the fair value hierarchy.
Derivative Instruments. The fair values presented for derivative instruments include any accrued interest. Foreign exchange contracts are valued based on unadjusted quoted prices in active markets and accordingly are classified within Level 1 of the fair value hierarchy. Except for mortgage banking derivatives, all other derivative instruments are valued using third-party valuation software, which considers the present value of cash flows discounted using observable forward rate assumptions. The resulting fair value is then validated against valuations performed by dealer counterparties. These derivative instruments are classified within Level 2 of the fair value hierarchy.
Mortgage Banking Derivatives. The Company uses forward sales of mortgage loans and mortgage-backed securities to manage the risk of loss associated with its mortgage loan commitments and mortgage loans held for sale. Prior to closing and funding certain single-family residential mortgage loans, an interest rate lock commitment is generally extended to the borrower. During this in-between time period, the Company is subject to the risk that market interest rates may change. If rates rise, investors generally will pay less to purchase mortgage loans, which would result in a reduction in the gain on sale of the loans, or possibly a loss. In an effort to mitigate this risk, forward delivery sales commitments are established in which the Company agrees to either deliver whole mortgage loans to various investors or issue mortgage-backed securities. The fair value of mortgage banking derivatives is determined based on current market prices for similar assets in the secondary market. Accordingly, mortgage banking derivatives are classified within Level 2 of the fair value hierarchy.
Originated Loans Held For Sale. The Company has elected to measure originated residential mortgage loans held for sale at fair value under the fair value option per ASC Topic 825, Financial Instruments. Electing to measure originated residential mortgage loans held for sale at fair value reduces certain timing differences and better reflects the price the Company would expect to receive from the sale of these loans. The fair value of originated residential mortgage loans held for sale is based on quoted market prices of similar loans sold in conjunction with securitization transactions. Accordingly, originated residential mortgage loans held for sale are classified within Level 2 of the fair value hierarchy.
The following table compares the fair value to the UPB of originated residential mortgage loans held for sale: | | | | | | | | | | | | | | | | | | | | | | | | | | | | | | | | | | | |
| At December 31, |
| 2024 | | 2023 |
| (In thousands) | Fair Value | | UPB | | Difference | | Fair Value | | UPB | | Difference |
| Originated loans held for sale | $ | 297 | | | $ | 283 | | | $ | 14 | | | $ | 2,610 | | | $ | 2,658 | | | $ | (48) | |
Rabbi Trust Investments. Investments held in each of the Company’s Rabbi Trusts consist primarily of mutual funds that invest in equity and fixed income securities. Shares of these mutual funds are valued based on the NAV as reported by the trustee of the funds, which represents quoted prices in active markets. Accordingly, the Rabbi Trusts’ investments are classified within Level 1 of the fair value hierarchy. At both December 31, 2024, and 2023, the total cost basis of the investments held in the Rabbi Trusts was $9.2 million.
Alternative Investments. Equity investments have a readily determinable fair value when unadjusted quoted prices are available in an active market for identical assets. Accordingly, these alternative investments are classified within Level 1 of the fair value hierarchy. At December 31, 2023, equity investments with a readily determinable fair value had a total carrying amount of $0.9 million, with no remaining unfunded commitments. During the second quarter of 2024, the Company sold its equity investments with a readily determinable fair value for proceeds of $1.2 million. Prior to the sale, these alternative investments experienced total write-ups in fair value of $0.3 million.
Equity investments that do not have a readily determinable fair value may qualify for the NAV practical expedient if they meet certain requirements. The Company’s alternative investments measured at NAV consist of investments in non-public entities that cannot be redeemed since investments are distributed as the underlying equity is liquidated. Alternative investments measured at NAV are not classified within the fair value hierarchy. At December 31, 2024, and 2023, these alternative investments had a total carrying amount of $43.4 million and $35.9 million, respectively, and a remaining unfunded commitment of $30.1 million and $29.8 million, respectively. During the year ended December 31, 2024, the change in NAV related to these alternative investments that were still held at the end of the year was $3.5 million.
Contingent Consideration. The Company recorded contingent consideration at fair value related to two earn-out agreements associated with the acquisition of interLINK in January 2023. The terms of the purchase agreement specified that the seller would receive earn-outs based on the ability of the Company to: (i) re-sign the existing broker dealers under contract, and (ii) generate $2.5 billion in new broker dealer deposit programs within three years of the acquisition date. The estimated fair values of the contingent consideration liabilities are measured on a recurring basis and determined using an income approach considering management’s evaluation of the probability of achievement, forecasted achievement date (payment term), and a discount rate equivalent to the cost of debt. These significant inputs, which are the responsibility of management and calculated with the assistance of a third-party valuation specialist, are not observable, and accordingly, are classified within Level 3 of the fair value hierarchy.
The following tables summarize the unobservable inputs used to derive the estimated fair value of the Company’s contingent consideration liabilities (dollars in thousands): | | | | | | | | | | | | | | | | | |
| At December 31, 2024 |
| Agreement | Maximum Amount | Probability of Achievement | Payment Term
(in years) | Discount Rate | Fair Value |
(i) Re-sign broker dealers (1) | $ | 207 | 99.0 % | 0.88 | 6.40 % | $ | 182 |
(ii) Deposit program growth (2) | $ | 12,500 | 100.0 % | 0.50 | 6.40 % | $ | 11,568 |
| | | | | | | | | | | | | | | | | |
| At December 31, 2023 |
| Agreement | Maximum Amount | Probability of Achievement | Payment Term
(in years) | Discount Rate | Fair Value |
| (i) Re-sign broker dealers | $ | 4,826 | 99.0 % | 1.88 | 6.40 % | $ | 4,232 |
| (ii) Deposit program growth | $ | 12,500 | 100.0 % | 1.00 | 6.40 % | $ | 11,568 |
(1)The Company re-signed one of the existing broker dealers under contract in January 2024, which resulted in the cash payment of $4.6 million during the first quarter of 2024 to settle a portion of its contingent consideration obligation with StoneCastle Partners LLC in accordance with the purchase agreement.
(2)During the fourth quarter of 2024, the Company re-evaluated its initial estimate of the forecasted achievement date (payment term) for the deposit program growth event earn-out, which resulted in a revised expected achievement date of June 30, 2025, instead of December 31, 2024. The change in fair value resulting from this change in estimate was not significant.
Contingent consideration liabilities are included within Accrued expenses and other liabilities on the accompanying Consolidated Balance Sheets. Any fair value adjustments to contingent consideration liabilities are included in Other expense on the accompanying Consolidated Statements of Income.
The following table summarizes the fair values of assets and liabilities measured at fair value on a recurring basis:
| | | | | | | | | | | | | | |
| | At December 31, 2024 |
| (In thousands) | Level 1 | Level 2 | Level 3 | Total |
| Financial Assets: | | | | |
| Available-for-sale securities: | | | | |
| | | | |
| Government agency debentures | $ | — | | $ | 186,426 | | $ | — | | $ | 186,426 | |
| Municipal bonds and notes | — | | 110,876 | | — | | 110,876 | |
| Agency CMO | — | | 29,043 | | — | | 29,043 | |
| Agency MBS | — | | 4,519,785 | | — | | 4,519,785 | |
| Agency CMBS | — | | 3,034,392 | | — | | 3,034,392 | |
| CMBS | — | | 625,388 | | — | | 625,388 | |
| | | | |
| Corporate debt | — | | 452,266 | | — | | 452,266 | |
| Private label MBS | — | | 39,219 | | — | | 39,219 | |
| Other | — | | 9,205 | | — | | 9,205 | |
| Total available-for-sale securities | — | | 9,006,600 | | — | | 9,006,600 | |
Gross derivative instruments, before netting (1) | 1,263 | | 300,879 | | — | | 302,142 | |
| Originated loans held for sale | — | | 297 | | — | | 297 | |
| Investments held in Rabbi Trusts | 13,438 | | — | | — | | 13,438 | |
| | | | |
Alternative investments measured at NAV (2) | — | | — | | — | | 43,360 | |
| Total financial assets | $ | 14,701 | | $ | 9,307,776 | | $ | — | | $ | 9,365,837 | |
| Financial Liabilities: | | | | |
Gross derivative instruments, before netting (1) | $ | 43 | | $ | 311,518 | | $ | — | | $ | 311,561 | |
| Contingent consideration | — | | — | | 11,750 | | 11,750 | |
| Total financial liabilities | $ | 43 | | $ | 311,518 | | $ | 11,750 | | $ | 323,311 | |
| | | | | | | | | | | | | | |
| | At December 31, 2023 |
| (In thousands) | Level 1 | Level 2 | Level 3 | Total |
| Financial Assets: | | | | |
| Available-for-sale securities: | | | | |
| | | | |
| Government agency debentures | $ | — | | $ | 264,633 | | $ | — | | $ | 264,633 | |
| Municipal bonds and notes | — | | 1,573,233 | | — | | 1,573,233 | |
| Agency CMO | — | | 48,941 | | — | | 48,941 | |
| Agency MBS | — | | 3,347,098 | | — | | 3,347,098 | |
| Agency CMBS | — | | 2,288,071 | | — | | 2,288,071 | |
| CMBS | — | | 763,749 | | — | | 763,749 | |
| | | | |
| Corporate debt | — | | 622,155 | | — | | 622,155 | |
| Private label MBS | — | | 42,808 | | — | | 42,808 | |
| Other | — | | 9,041 | | — | | 9,041 | |
| Total available-for-sale securities | — | | 8,959,729 | | — | | 8,959,729 | |
Gross derivative instruments, before netting (1) | 217 | | 330,419 | | — | | 330,636 | |
| Originated loans held for sale | — | | 2,610 | | — | | 2,610 | |
| Investments held in Rabbi Trust | 11,900 | | — | | — | | 11,900 | |
| Alternative investments | 959 | | — | | — | | 959 | |
Alternative investments measured at NAV (2) | — | | — | | — | | 35,888 | |
| Total financial assets | $ | 13,076 | | $ | 9,292,758 | | $ | — | | $ | 9,341,722 | |
| Financial Liabilities: | | | | |
Gross derivative instruments, before netting (1) | $ | 970 | | $ | 334,840 | | $ | — | | $ | 335,810 | |
| Contingent consideration | — | | — | | 15,800 | | 15,800 | |
| $ | 970 | | $ | 334,840 | | $ | 15,800 | | $ | 351,610 | |
(1)Additional information regarding the impact of netting derivative assets and derivative liabilities, as well as the impact from offsetting cash collateral paid to the same derivative counterparties, can be found within Note 17: Derivative Financial Instruments.
(2)Certain alternative investments are recorded at NAV. Assets measured at NAV are not classified within the fair value hierarchy.
Assets Measured at Fair Value on a Non-Recurring Basis
The Company measures certain assets at fair value on a non-recurring basis. The following is a description of valuation methodologies used for assets measured at fair value on a non-recurring basis.
Alternative Investments. The measurement alternative has been elected for alternative investments without readily determinable fair values that do not qualify for the NAV practical expedient. The measurement alternative requires investments to be measured at cost minus impairment, if any, plus or minus adjustments resulting from observable price changes in orderly transactions for an identical or similar investment of the same issuer. Accordingly, these alternative investments are classified within Level 2 of the fair value hierarchy. At December 31, 2024, and 2023, the carrying amount of these alternative investments was $61.5 million and $53.1 million, respectively, of which $8.3 million and $7.9 million, respectively, were considered to be measured at fair value. During the year ended December 31, 2024, there were $2.8 million in total write-ups due to observable price changes and $1.3 million of total write-downs due to impairment. Additionally, during the year ended December 31, 2024, the Company sold measurement alternative investments with a carrying amount of $3.5 million for proceeds of $18.4 million, resulting in total gains on sale of $14.9 million.
Loans Transferred to Held for Sale. Once a decision has been made to sell loans not previously classified as held for sale, these loans are transferred into the held for sale category and carried at the lower of cost or fair value, less estimated costs to sell. At the time of transfer and classification as held for sale, any amount by which cost exceeds fair value is accounted for as a valuation allowance. This activity generally pertains to loans with observable inputs, and therefore, are classified within Level 2 of the fair value hierarchy. However, should these loans include adjustments for changes in loan characteristics based on unobservable inputs, the loans would then be classified within Level 3 of the fair value hierarchy. At December 31, 2024, and 2023, there were $27.3 million and $3.9 million loans transferred to held for sale on the accompanying Consolidated Balance Sheets, respectively.
Collateral Dependent Loans and Leases. Loans and leases for which repayment is substantially expected to be provided through the operation or sale of collateral are considered collateral dependent, and are valued based on the estimated fair value of the collateral, less estimated costs to sell at the reporting date, using customized discounting criteria. Accordingly, collateral dependent loans and leases are classified within Level 3 of the fair value hierarchy.
Other Real Estate Owned and Repossessed Assets. OREO and repossessed assets are held at the lower of cost or fair value and are considered to be measured at fair value when recorded below cost. The fair value of OREO is calculated using independent appraisals or internal valuation methods, less estimated selling costs, and may consider available pricing guides, auction results, and price opinions. Certain repossessed assets may also require assumptions about factors that are not observable in an active market when determining fair value. Accordingly, OREO and repossessed assets are classified within Level 3 of the fair value hierarchy. At December 31, 2024, and 2023, the total carrying value of OREO and repossessed assets was $0.4 million and $9.1 million, respectively. In addition, the amortized cost of consumer loans secured by residential real estate property that are in the process of foreclosure at December 31, 2024, was $12.0 million.
Estimated Fair Values of Financial Instruments and Mortgage Servicing Assets
The Company is required to disclose the estimated fair values of certain financial instruments and mortgage servicing rights. The following is a description of the valuation methodologies used to estimate fair value for those assets and liabilities.
Cash and Cash Equivalents. Given the short time frame to maturity, the carrying amount of cash and cash equivalents, which is comprised of Cash and due from banks and Interest-bearing deposits, approximates fair value. Cash and cash equivalents are classified within Level 1 of the fair value hierarchy.
Held-to-Maturity Securities. When quoted market prices are not available, the Company employs an independent pricing service that utilizes matrix pricing to calculate fair value. These fair value measurements consider observable data, such as dealer quotes, market spreads, cash flows, yield curves, live trading levels, trade execution data, market consensus prepayment speeds, credit information, and the respective terms and conditions for debt instruments. Management maintains procedures to monitor the pricing service’s results and has a process in place to challenge their valuations and methodologies. Held-to-maturity securities, which include Agency CMO, Agency MBS, Agency CMBS, Municipal bonds and notes, and CMBS, are classified within Level 2 of the fair value hierarchy.
Loans and Leases, net. Except for collateral dependent loans and leases, the fair value of loans and leases held for investment is estimated using a discounted cash flow methodology, based on future prepayments and market interest rates inclusive of an illiquidity discount for comparable loans and leases. The associated cash flows are then adjusted for associated credit risks and other potential losses, as appropriate. Loans and leases are classified within Level 3 of the fair value hierarchy.
Mortgage Servicing Rights. Mortgage servicing rights are initially measured at fair value and subsequently measured using the amortization method. The Company assesses mortgage servicing rights for impairment each quarter and establishes or adjusts the valuation allowance to the extent that amortized cost exceeds the estimated fair market value. Fair value is calculated as the present value of estimated future net servicing income and relies on market based assumptions for loan prepayment speeds, servicing costs, discount rates, and other economic factors. Accordingly, the primary risk inherent in valuing mortgage servicing rights is the impact of fluctuating interest rates on the related servicing revenue stream. Mortgage servicing rights are classified within Level 3 of the fair value hierarchy.
Deposit Liabilities. The fair value of deposit liabilities, which is comprised of demand deposits, interest-bearing checking, savings, health savings, and money market accounts, reflects the amount payable on demand at the reporting date. Deposit liabilities are classified within Level 2 of the fair value hierarchy.
Time Deposits. The fair value of fixed-maturity certificates of deposit is estimated using rates that are currently offered for deposits with similar remaining maturities. Time deposits are classified within Level 2 of the fair value hierarchy.
Securities Sold Under Agreements to Repurchase and Federal Funds Purchased. The fair value of securities sold under agreements to repurchase and federal funds purchased that mature within 90 days approximates their carrying value. The fair value of securities sold under agreements to repurchase and federal funds purchased that mature after 90 days is estimated using a discounted cash flow methodology based on current market rates and adjusted for associated credit risks, as appropriate. Securities sold under agreements to repurchase and federal funds purchased are classified within Level 2 of the fair value hierarchy.
Federal Home Loan Bank Advances and Long-Term Debt. The fair value of FHLB advances and long-term debt is estimated using a discounted cash flow methodology in which discount rates are matched with the time period of the expected cash flows and adjusted for associated credit risks, as appropriate. FHLB advances and long-term debt are classified within Level 2 of the fair value hierarchy.
The following table summarizes the carrying amounts, estimated fair values, and classifications within the fair value hierarchy of selected financial instruments and mortgage servicing rights: | | | | | | | | | | | | | | | | | | | | | | | |
| At December 31, |
| | 2024 | | 2023 |
| (In thousands) | Carrying
Amount | | Fair
Value | | Carrying
Amount | | Fair
Value |
| Assets: | | | | | | | |
| Level 1 | | | | | | | |
| Cash and cash equivalents | $ | 2,074,434 | | | $ | 2,074,434 | | | $ | 1,715,795 | | | $ | 1,715,795 | |
| Level 2 | | | | | | | |
| Held-to-maturity investment securities, net | 8,444,191 | | | 7,453,123 | | | 7,074,588 | | | 6,264,623 | |
| Level 3 | | | | | | | |
| Loans and leases, net | 51,815,602 | | | 50,245,305 | | | 50,090,315 | | | 48,048,106 | |
| Mortgage servicing rights | 1,234 | | | 3,667 | | | 8,523 | | | 24,495 | |
| Liabilities: | | | | | | | |
| Level 2 | | | | | | | |
| Deposit liabilities | $ | 56,518,126 | | | $ | 56,518,126 | | | $ | 52,319,825 | | | $ | 52,319,825 | |
| Time deposits | 8,234,954 | | | 8,211,582 | | | 8,464,459 | | | 8,426,708 | |
| Securities sold under agreements to repurchase and federal funds purchased | 344,168 | | | 344,166 | | | 458,387 | | | 458,380 | |
| FHLB advances | 2,110,108 | | | 2,107,790 | | | 2,360,018 | | | 2,358,381 | |
Long-term debt (1) | 909,185 | | | 860,200 | | | 1,048,820 | | | 999,918 | |
(1)Any unamortized premiums/discounts, debt issuance costs, or basis adjustments to long-term debt, as applicable, are excluded from the determination of fair value.
Note 19: Retirement Benefit Plans
Defined Benefit Pension and Other Postretirement Benefit Plans
The Bank had offered a qualified noncontributory defined benefit Pension Plan and a non-qualified SERP to eligible employees and key executives who met certain age and service requirements, both of which were frozen effective December 31, 2007. Only those employees who were hired prior to January 1, 2007, and who became participants of the plans prior to January 1, 2008, have accrued benefits under the plans. The Bank also provides an OPEB plan to certain retired employees.
In connection with the Sterling merger in 2022, the Company assumed the benefit obligations of Sterling’s non-qualified SERP and OPEB plans, which includes the Astoria Bank Excess Benefit and Supplemental Benefit Plans, Astoria Bank Directors’ Retirement Plan, Retirement Plan of the Greater New York Savings Bank for Non-Employee Directors, Supplemental Executive Retirement Plan of Provident Bank, Supplemental Executive Retirement Plan of Provident Bank - Other, Sterling Bancorp Supplemental Postretirement Life Insurance Plan, Astoria Bank Postretirement Welfare Benefit Plans, and a Split Dollar Life Insurance Arrangement.
Each of the plan’s measurement dates, including the plans assumed from Sterling in the merger, coincides with the Company’s December 31 year end.
The following table summarizes the changes in the benefit obligation, fair value of plan assets, and funded status of the defined benefit pension and other postretirement benefit plans at December 31: | | | | | | | | | | | | | | | | | | | | | | | | | | |
| Pension | | SERP | | OPEB |
| (In thousands) | 2024 | 2023 | | 2024 | 2023 | | 2024 | 2023 |
| Change in benefit obligation: | | | | | | | | |
| Beginning balance | $ | 189,986 | | $ | 187,836 | | | $ | 4,139 | | $ | 4,245 | | | $ | 22,669 | | $ | 22,822 | |
| | | | | | | | |
| Service cost | — | | — | | | — | | — | | | 17 | | 27 | |
| Interest cost | 8,648 | | 8,782 | | | 178 | | 191 | | | 956 | | 1,042 | |
Actuarial (gain) loss (1) | (13,588) | | 3,333 | | | (260) | | 183 | | | 3,637 | | (382) | |
| | | | | | | | |
| Benefits paid | (10,934) | | (9,965) | | | (459) | | (480) | | | (13,612) | | (840) | |
| Ending balance | 174,112 | | 189,986 | | | 3,598 | | 4,139 | | | 13,667 | | 22,669 | |
| Change in plan assets: | | | | | | | | |
| Beginning balance | 217,167 | | 201,382 | | | — | | — | | | — | | — | |
Actual return on plan assets (2) | 3,106 | | 25,750 | | | — | | — | | | — | | — | |
| Employer contributions | — | | — | | | 459 | | 480 | | | 13,612 | | 840 | |
| | | | | | | | |
| Benefits paid | (10,934) | | (9,965) | | | (459) | | (480) | | | (13,612) | | (840) | |
| Ending balance | 209,339 | | 217,167 | | | — | | — | | | — | | — | |
Funded status (3) | $ | 35,227 | | $ | 27,181 | | | $ | (3,598) | | $ | (4,139) | | | $ | (13,667) | | $ | (22,669) | |
(1)The change in actuarial (gain) loss is primarily due to actuarial gains in 2024 resulting from an increase in discount rates, as compared to actuarial losses in 2023 resulting from a decrease in discount rates.
(2)The decrease in actual return on plan assets for the Pension Plan is primarily due to the performance of fixed income investments, which comprise approximately 65% of the portfolio. In 2024, fixed income investments earned a negative return, as compared to a positive return in 2023.
(3)The overfunded (underfunded) status of each plan is respectively included in Accrued interest receivable and other assets or Accrued expenses and other liabilities on the accompanying Consolidated Balance Sheets, as applicable.
The following table summarizes the weighted-average assumptions used to determine the benefit obligation at December 31: | | | | | | | | | |
| Discount Rate |
| 2024 | 2023 | |
| Pension: | | | |
| Webster Bank Pension Plan | 5.43 | % | 4.76 | % | |
| | | |
| SERP: | | | |
| Webster Bank Supplemental Defined Benefit Plan for Executive Officers | 5.31 | % | 4.68 | % | |
| Astoria Bank Excess Benefit and Supplemental Benefit Plans | 5.14 | | 4.56 | | |
| Astoria Bank Directors’ Retirement Plan | 5.04 | | 4.50 | | |
| Retirement Plan of the Greater New York Savings Bank for Non-Employee Directors | 5.03 | | 4.50 | | |
| Supplemental Executive Retirement Plan of Provident Bank | 5.32 | | 4.83 | | |
| Supplemental Executive Retirement Plan of Provident Bank - Other | 5.09 | | 4.71 | | |
| | | |
| OPEB: | | | |
| Webster Bank Postretirement Medical Benefit Plan | 5.01 | % | 4.54 | % | |
| Sterling Bancorp Supplemental Postretirement Life Insurance Plan | 5.20 | | 4.51 | | |
| Astoria Bank Postretirement Welfare Benefit Plans | 5.39 | | 4.74 | | |
Split Dollar Life Insurance Arrangement (1) | n/a | 4.45 | | |
(1)The year end discount rate at December 31, 2024, is not applicable due to plan cessation during the year.
The following table summarizes the amounts recorded in accumulated other comprehensive (loss) income that have not yet been recognized in net periodic benefit (income) cost at December 31: | | | | | | | | | | | | | | | | | | | | | | | | | | |
| Pension | | SERP | | OPEB |
| (In thousands) | 2024 | 2023 | | 2024 | 2023 | | 2024 | 2023 |
| Net actuarial loss (gain) | $ | 34,440 | | $ | 41,296 | | | $ | (44) | | $ | 312 | | | $ | (1,788) | | $ | (3,231) | |
| Deferred tax (benefit) expense | (6,488) | | (11,201) | | | 8 | | (85) | | | 337 | | 876 | |
| Net amount recorded in (AOCL) | $ | 27,952 | | $ | 30,095 | | | $ | (36) | | $ | 227 | | | $ | (1,451) | | $ | (2,355) | |
The following table summarizes the components of net periodic benefit (income) cost for the years ended December 31: | | | | | | | | | | | | | | | | | | | | | | | | | | | | | | | | | | | |
| Pension | | SERP | | OPEB |
| (In thousands) | 2024 | 2023 | 2022 | | 2024 | 2023 | 2022 | | 2024 | 2023 | 2022 |
| Service cost | $ | — | | $ | — | | $ | — | | | $ | — | | $ | — | | $ | — | | | $ | 17 | | $ | 27 | | $ | 34 | |
| Interest cost | 8,648 | | 8,782 | | 5,565 | | | 178 | | 191 | | 107 | | | 956 | | 1,042 | | 652 | |
| Expected return on plan assets | (12,709) | | (11,778) | | (14,675) | | | — | | — | | — | | | — | | — | | — | |
| Amortization of actuarial loss (gain) | 2,871 | | 4,781 | | 2,224 | | | 12 | | 6 | | 26 | | | (976) | | (2,704) | | (40) | |
Other (1) | — | — | — | | | — | — | — | | | 3,212 | | — | | — | |
Net periodic benefit (income) cost (2) | $ | (1,190) | | $ | 1,785 | | $ | (6,886) | | | $ | 190 | | $ | 197 | | $ | 133 | | | $ | 3,209 | | $ | (1,635) | | $ | 646 | |
(1)Reflects the loss recognized upon cessation of the Split Dollar Life Insurance Arrangement in 2024.
(2)Net periodic benefit (income) cost is included in Other expense on the accompanying Consolidated Statements of Income.
The following table summarizes the weighted-average assumptions used to determine net periodic benefit (income) cost for the years ended December 31: | | | | | | | | | | | |
| | Discount Rate |
| | 2024 | 2023 | 2022 |
| Pension: | | | |
| Webster Bank Pension Plan | 4.76 | % | 4.96 | % | 2.65 | % |
| | | |
| SERP: | | | |
| Webster Bank Supplemental Defined Benefit Plan for Executive Officers | 4.68 | % | 4.88 | % | 2.45 | % |
| Astoria Bank Excess Benefit and Supplemental Benefit Plans | 4.56 | | 4.77 | | 2.58 | |
| Astoria Bank Directors’ Retirement Plan | 4.50 | | 4.70 | | 2.23 | |
| Retirement Plan of the Greater New York Savings Bank for Non-Employee Directors | 4.50 | | 4.70 | | 2.37 | |
| Supplemental Executive Retirement Plan of Provident Bank | 4.83 | | 5.04 | | 2.76 | |
| Supplemental Executive Retirement Plan of Provident Bank - Other | 4.71 | | 4.90 | | 2.38 | |
| | | |
| OPEB: | | | |
| Webster Bank Postretirement Medical Benefit Plan | 4.54 | % | 4.72 | % | 1.99 | % |
| Sterling Bancorp Supplemental Postretirement Life Insurance Plan | 4.51 | | 4.70 | | 2.35 | |
| Astoria Bank Postretirement Welfare Benefit Plans | 4.74 | | 4.94 | | 2.93 | |
| Split Dollar Life Insurance Arrangement | 4.45 | | 4.63 | | 2.20 | |
| | | |
| Expected Long-Term Rate of Return on Plan Assets |
| 2024 | 2023 | 2022 |
| Pension: | | | |
| Webster Bank Pension Plan | 6.00 | % | 6.00 | % | 5.50 | % |
| | | |
| Assumed Health Care Cost Trend Rate (1) |
| 2024 | 2023 | 2022 |
| OPEB: | | | |
| Webster Bank Postretirement Medical Benefit Plan | 6.50 | % | 6.50 | % | 6.25 | % |
| Astoria Bank Postretirement Welfare Benefit Plans | 6.50 | | 6.40 | | 6.60 | |
(1)The rates to which the healthcare cost trend rates are assumed to decline (ultimate trend rates) along with the year that the ultimate trend rates will be reached for the Webster Bank Postretirement Medical Benefit Plan and the Astoria Bank Postretirement Welfare Benefit Plans are 4.40% in 2033, and 4.40% in 2034, respectively.
The discount rates used to determine the benefit obligation and net periodic benefit (income) cost for the Company’s defined benefit pension and other postretirement benefit plans were generally selected by reference to a high-quality bond yield curve, using a full yield curve approach, and matched to the timing and amount of each plan’s expected benefit payments.
The following table summarizes amounts recognized in other comprehensive (loss) income, including reclassification adjustments, for the years ended December 31: | | | | | | | | | | | | | | | | | | | | | | | | | | | | | | | | | | | |
| Pension | | SERP | | OPEB |
| (In thousands) | 2024 | 2023 | 2022 | | 2024 | 2023 | 2022 | | 2024 | 2023 | 2022 |
| Net actuarial (gain) loss | $ | (3,985) | | $ | (10,639) | | $ | 17,148 | | | $ | (260) | | $ | 183 | | $ | (581) | | | $ | 955 | | $ | (382) | | $ | (4,992) | |
Amounts reclassified from
(AOCL) | (2,871) | | (4,781) | | (2,224) | | | (12) | | (6) | | (26) | | | 976 | | 2,704 | | 40 | |
Total (gain) loss recognized in
OCI (OCL) | $ | (6,856) | | $ | (15,420) | | $ | 14,924 | | | $ | (272) | | $ | 177 | | $ | (607) | | | $ | 1,931 | | $ | 2,322 | | $ | (4,952) | |
At December 31, 2024, the expected future benefit payments for the Company’s defined benefit pension and other postretirement benefits plans are as follows: | | | | | | | | | | | |
| (In thousands) | Pension | SERP | OPEB |
| 2025 | $ | 11,052 | | $ | 457 | | $ | 1,262 | |
| 2026 | 11,457 | | 440 | | 1,218 | |
| 2027 | 11,882 | | 420 | | 1,223 | |
| 2028 | 12,270 | | 399 | | 1,183 | |
| 2029 | 12,579 | | 377 | | 1,143 | |
| Thereafter | 65,045 | | 1,492 | | 5,132 | |
Asset Management
The Pension Plan invests primarily in common collective trusts and registered investment companies. However, the Pension Plan’s investment policy guidelines also allow for the investment in cash and cash equivalents, fixed income securities, and equity securities. Common collective trusts and registered investment companies are both benchmarked against the Standard & Poor’s 500 Index. Incremental benchmarks used to assess the common collective trusts include the S&P 400 Mid Cap Index, Russell 200 Index, MSCI ACWI ex U.S. Index, and the Bloomberg U.S. Long Credit Index. The standard deviation should not exceed that of the composite index. The Pension Plan’s investment strategy and asset allocations are monitored by the Company’s Retirement Plans Committee with the assistance of external investment advisors, and the investment portfolio is rebalanced, as appropriate. The target asset allocation percentages for the year ended December 31, 2024, were 64.5%
fixed-income investments and 35.5% equity investments. The actual asset allocation percentages for the year ended
December 31, 2024, were 64.1% fixed-income investments, 35.3% equity investments, and 0.6% cash and cash equivalents.
The overall investment objective of the Pension Plan is to maintain a diversified portfolio with a targeted expected long-term rate of return on plan assets of approximately 6.00%. The expected long-term rate of return on plan assets is the average rate of return expected to be realized on funds invested, or expected to be invested, to provide for the benefits included in the benefit obligation. The expected long-term rate of return on plan assets is generally established as of the beginning of the year based upon historical and projected returns for each asset category, with subsequent remeasurements occurring in interim periods, as appropriate. Depending on market conditions, the expected long-term rate of return on plan assets may exceed or fall short of the targeted percentage.
Fair Value Measurement
The following is a description of the valuation methodologies used for the Pension Plan’s assets measured at fair value:
Common Collective Trusts. Common collective trusts are valued based on the net asset value as reported by the trustee of the funds. The funds’ underlying investments are valued using quoted market prices in active markets or observable inputs for similar assets. Therefore, common collective trusts are classified as Level 2 within the fair value hierarchy.
Registered Investment Companies. Registered investment companies are valued at the daily closing price as reported by the fund. Registered investment companies held by the Plan are quoted in an active market and are classified as Level 1 within the fair value hierarchy.
Cash and Cash Equivalents. Cash and cash equivalents are recorded at cost plus accrued interest and are classified as Level 1 within the fair value hierarchy.
The following table sets forth by level within the fair value hierarchy the Pension Plan’s assets at fair value: | | | | | | | | | | | | | | | | | | | | | | | | | | | | | |
| At December 31, |
| 2024 | | 2023 |
| (In thousands) | Level 1 | Level 2 | Level 3 | Total | | Level 1 | Level 2 | Level 3 | Total |
| Common collective trusts | $ | — | | $ | 187,096 | | $ | — | | $ | 187,096 | | | $ | — | | $ | 195,004 | | $ | — | | $ | 195,004 | |
| Registered investment companies | 20,939 | | — | | — | | 20,939 | | | 20,965 | | — | | — | | 20,965 | |
| Cash and cash equivalents | 1,304 | | — | | — | | 1,304 | | | 1,198 | | — | | — | | 1,198 | |
| Total pension plan assets | $ | 22,243 | | $ | 187,096 | | $ | — | | $ | 209,339 | | | $ | 22,163 | | $ | 195,004 | | $ | — | | $ | 217,167 | |
Multiple-Employer Defined Benefit Pension Plan
The Bank participates in a multi-employer plan that provides pension benefits to former employees of a bank acquired by the Company. Participation in the plan was frozen as of September 1, 2004. The plan maintains a single trust and does not segregate the assets or liabilities of its participating employers. Minimum required employer contributions are determined by an independent actuary and are calculated using a 15-year shortfall amortization factor. There are no collective bargaining agreements or other obligations requiring contributions to the plan, nor has a funding improvement plan been implemented.
The following table summarizes information related to the Bank’s participation in the multi-employer plan: | | | | | | | | | | | | | | | | | | | | | | | | | | | | | | | | | | | | | | | | | |
| (In thousands) | | | | | | | | Contributions
Years Ended December 31, | | Funded Status
At December 31, |
| Plan Name | | Employer Identification Number | | Plan Number | | Surcharge Imposed | | 2024 | 2023 | 2022 | | 2024 | 2023 |
Pentegra Defined Benefit Plan
for Financial Institutions | | 13-5645888 | | 333 | | No | | $482 | $448 | $448 | | At least 80 percent | At least 80 percent |
The Bank’s contributions to the multi-employer plan for the years ended December 31, 2024, 2023, and 2022, did not exceed more than 5% of total plan contributions for the plan years ended June 30, 2023, 2022, and 2021. The plan’s Form 5500 was not available for the plan year ended June 30, 2024, as of the date the Company’s Consolidated Financial Statements were issued. As of July 1, 2024, the date of the most recent actuarial valuation, the plan administrator confirmed that the Bank’s portion of the multi-employer plan was $3.3 million underfunded.
Defined Contribution Postretirement Benefit Plans
The Bank also sponsors the Webster Bank Retirement Savings Plan, which is a defined contribution postretirement benefit plan established under Section 401(k) of the Internal Revenue Code. Under the Webster Bank Retirement Savings Plan, employees who have met a certain age requirement may elect to contribute a percentage of their eligible compensation to the plan on either a pre-tax or post-tax basis. During the years ended December 31, 2024, 2023, and 2022, the Bank made matching employer contributions to their accounts equal to 100% of the first 2% and 50% of the next 6% of participants’ contributions.
The Sterling National Bank 401k and Profit Sharing Plan, which was offered to eligible legacy Sterling employees who became employees of the Company in 2022, was effectively merged with and into the Webster Bank Retirement Savings Plan on December 29, 2023. Prior to the merger of these plans, participants of the Sterling National Bank 401(k) and Profit Sharing Plan could elect to contribute a percentage of their eligible compensation to the plan on either a pre-tax or post-tax basis. During the years ended December 31, 2023, and 2022, the Bank made (i) matching employer contributions equal to 50% of participant contributions up to 4% of eligible compensation for a maximum match of 2%, and (ii) profit sharing contributions equal to 3% of eligible compensation for all eligible legacy Sterling participants, regardless of whether they had contributed to the plan.
Compensation and benefits expense included total employer contributions under the defined contribution postretirement benefit plans of $20.6 million, $20.3 million, and $18.2 million for the years ended December 31, 2024, 2023, and 2022, respectively.
Note 20: Share-Based Plans
The Company maintains a stock compensation plan that provides for the grant of stock options, stock appreciation rights, restricted stock, performance-based stock, and stock units to better align the interests of its employees and directors with those of its stockholders. The total number of shares of Webster common stock authorized for issuance under the plan is 21.4 million shares. At December 31, 2024, there were 3.3 million shares available to be granted. Stock compensation expense is recognized over the required service vesting period for each award based on the grant-date fair value and is included in Compensation and benefits on the accompanying Consolidated Statements of Income.
The following table summarizes stock-based compensation plan activity for the year ended December 31, 2024: | | | | | | | | | | | | | | | | | | | | | | | | | | | | | |
| Non-Vested Restricted Stock Awards Outstanding | | Stock Options Outstanding |
| Time-Based | | | | | Performance-Based | |
| Number of
Shares | Weighted-Average
Grant Date
Fair Value | | | | | Number of
Shares | Weighted-Average
Grant Date
Fair Value | | Number of
Shares | Weighted-Average
Exercise Price |
| Balance, beginning of period | 1,599,419 | | $ | 52.72 | | | | | | 520,003 | | $ | 52.58 | | | 10,972 | | $ | 29.14 | |
| Granted | 1,207,058 | | 47.36 | | | | | | 150,173 | | 48.67 | | | — | | — | |
| | | | | | | | | | | |
| | | | | | | | | | | |
| Vested | (886,923) | | 53.81 | | | | | | (50,926) | | 53.79 | | | — | | — | |
| Forfeited | (127,923) | | 49.54 | | | | | | (10,610) | | 56.05 | | | — | | — | |
| Exercised | — | | — | | | | | | — | | — | | | (8,858) | | 28.57 | |
| Balance, end of period | 1,791,631 | | 49.26 | | | | | | 608,640 | | 53.00 | | | 2,114 | | 31.51 | |
Restricted Stock Awards
Time-based restricted stock awards vest over the applicable service period primarily ranging from one to three years. Under the plan, the number of time-based restricted stock awards that may be granted to an eligible individual per calendar year is limited to 300,000 shares. The fair value of time-based restricted stock awards used to determine compensation expense is measured using the closing price of Webster common stock at the grant date.
Performance-based restricted stock awards generally vest after a three year performance period, with the total share quantity dependent on the Company meeting certain target performance conditions ranging from 0% to 150%. Under the plan, 50% of the share quantity is determined based on three-year total stockholder return as compared to the Company’s compensation peer group, while the other 50% is based on the Company’s average return on equity over the three-year period. The fair value of performance-based restricted stock awards used to determine compensation expense is calculated using the Monte-Carlo simulation model for total stockholder return awards and the closing price of Webster common stock at the grant date for average return on equity awards. Compensation expense for average return on equity awards is subject to adjustment based on the Company’s average return on equity performance relative to the target number of shares condition.
The Company recognized restricted stock compensation expense of $55.1 million, $54.5 million, and $55.1 million, during the years ended December 31, 2024, 2023, and 2022, respectively, in which the related income tax benefit was $12.8 million,
$13.9 million, and $12.0 million, respectively. The fair value of restricted stock awards that had vested during the years ended December 31, 2024, 2023, and 2022, was $49.7 million, $39.9 million, and $51.7 million, respectively. At December 31, 2024, there was $41.1 million of unrecognized restricted stock expense related to non-vested restricted stock awards, which is expected to be recognized over a weighted-average period of 1.8 years.
Stock Options
Stock options, incentive and non-incentive, are granted at an exercise price equal to the market value of Webster common stock on the grant date. Each option grants the holder the right to acquire one share of Webster common stock over a contractual life of ten years. While the Company has not granted stock options since 2013, replacement options were issued in 2022 in order for the Company to satisfy its consideration under the Sterling merger agreement. At December 31, 2024, there were 2,114 incentive stock options outstanding, which have a weighted-average remaining contractual life of 0.9 years, and all of which have vested and are exercisable.
Total pre-tax intrinsic value, or the difference between the Webster common stock closing price on the last trading day of the year and the weighted-average exercise price multiplied by the number of shares, represents the aggregate intrinsic value that would have been received by the option holders had all of their outstanding options been exercised on December 31, 2024. At December 31, 2024, the total pre-tax intrinsic value was $0.1 million. For the years ended December 31, 2024, 2023, and 2022, the total intrinsic value of the options exercised was $0.3 million, $2.2 million, and $1.0 million, respectively. The amount of cash received from the exercise of stock options during the years ended December 31, 2024, 2023, and 2022, was $0.3 million, $1.8 million, and $0.7 million, respectively.
Note 21: Segment Reporting
The Company’s operations are organized into three reportable segments that represent its differentiated lines of business: Commercial Banking, Healthcare Financial Services, and Consumer Banking. The Company’s CODM is the Chairman and Chief Executive Officer. The CODM uses income before income taxes and the provision for credit losses, referred to as PPNR, to allocate resources, including financial and capital resources, employees, and property, for each segment predominantly in the annual budget and forecasting process. The CODM considers budget-to-actual variances on a monthly basis when making decisions about allocating resources to the segments. The CODM also uses PPNR to assess the performance of each segment and in the compensation of certain employees.
Commercial Banking delivers financial solutions both nationally and regionally to a wide range of companies, investors, government entities, and other public and private institutions. Commercial Banking helps its clients achieve their business and financial goals with expertise in Commercial & Institutional Lending, Commercial Real Estate, Capital Markets, Capital Finance, and Treasury Management. Its Private Banking team also pairs holistic wealth solutions, including tailored lending, with commercial banking services.
Healthcare Financial Services includes HSA Bank and Ametros. HSA Bank is one the country’s largest providers of employee benefits solutions, including being one of the leading bank administrators of HSAs, emergency savings accounts, and flexible spending accounts administration services in 50 states. Ametros, the nation’s largest professional administrator of medical insurance claim settlements, helps individuals manage their ongoing medical care through their CareGuard service and proprietary technology platform.
Consumer Banking delivers customized financial solutions for individuals and families, private clients, and small business owners across 196 banking centers throughout the Northeast. Consumer Banking offers a full suite of deposit, lending, treasury management, and wealth management solutions delivered by experienced relationship managers and financial advisors. Consumer Banking also provides a fully digital banking experience through its mobile banking apps and BrioDirect.
Corporate and Reconciling Category
Certain Treasury activities and other corporate and functional divisions, such as information technology, human resources, risk management, bank operations, and the operations of interLINK, and amounts required to reconcile non-GAAP profitability metrics to those reported in accordance with GAAP are included in the Corporate and Reconciling category.
In addition to amounts required to reconcile non-GAAP profitability metrics (i.e., estimates for FTP, allocations of equity capital) to those reported in accordance with GAAP, revenues reported in the Corporate and Reconciling category also include net losses on sale of investment securities and insignificant revenues from contracts with customers attributable to interLINK. Neither the Treasury function nor interLINK operations meet the definition of an operating segment, and therefore, are not considered for determining reportable segments.
Total assets reported in the Corporate and Reconciling category primarily comprises investment securities, other assets, and FHLB and FRB stock. The ACL on loans and leases is also reported in Total assets in the Corporate and Reconciling category. A provision for credit losses is allocated from the Corporate and Reconciling category to Commercial Banking and Consumer Banking based on the expected loss content of their specific loan and lease portfolios over a 3-year period (non-GAAP). There is no provision for credit losses associated with Healthcare Financial Services since that segment does not originate nor acquire loans and leases. Business development expenses, which include merger-related expenses and other strategic initiatives and restructuring costs, are also generally included in the Corporate and Reconciling category.
Change in Reportable Segments
From time to time, the Company may make reclassifications among the reportable segments to more appropriately reflect management’s view of the business and/or based on changes in the Company’s organizational structure or product lines. Accordingly, the results derived are not necessarily comparable with similar financial information published by other financial institutions. Additionally, because of the interrelationships of the segments, the financial information presented is not indicative of how the segments would perform if they operated as independent entities.
Effective January 1, 2024, the Company realigned certain of its Business Banking operations to better serve its customers and deliver operational efficiencies. Under this realignment, $1.5 billion of loans and $2.2 billion of deposits were reassigned, and $77.2 million of goodwill was reallocated on a relative fair value basis, from Commercial Banking to Consumer Banking. There was no goodwill impairment as a result of this realignment. Prior period amounts have been recast accordingly.
With the acquisition of Ametros on January 24, 2024, the Company formed the Healthcare Financial Services reportable segment, which includes the aggregated financial information of the HSA Bank and Ametros operating segments. The financial information presented within Healthcare Financial Services for the years ended December 31, 2023, and 2022, reflects that only of the HSA Bank operating segment.
Segment Reporting Methodology
The Company uses an internal profitability reporting system to generate PPNR by reportable segment, which is comprised of direct revenues, direct expenses, estimates for FTP, and allocations for equity capital, net operating costs and total support costs. Since the majority of each reportable segment’s revenue is interest, each segment’s interest revenue is reported net of its interest expense (net interest income). Estimates for FTP and allocations of equity capital and non-interest expense, certain of which are subjective in nature, are periodically reviewed and refined. Equity capital is allocated using a combination of risk-weighted asset and management assessment methodologies across the differentiated lines of business. Net operating costs and total support costs, which reflect costs for shared services and back-office support areas, are allocated using an activity and driver-based costing process. The full profitability measurement reports, which are prepared for each reportable segment and reviewed by the CODM on a monthly basis, reflect non-GAAP reporting methodologies. The differences between full profitability and GAAP results are reconciled in the Corporate and Reconciling category.
The goal of FTP is to encourage loan and deposit growth consistent with the Company’s overall profitability objectives. The FTP process considers the specific interest rate risk and liquidity risk of financial instruments, other assets, and other liabilities included in each reportable segment. Loans and deposits are assigned FTP rates, and segments are charged a cost to fund loans and are paid a credit for deposit funds provided. Consideration is given to the origination date and the earlier of the maturity date or the repricing date of a financial instrument to assign an FTP rate for loans and deposits originated each day. Overall, the FTP process reflects the transfer of interest rate risk exposure to the Treasury function included within the Corporate and Reconciling category, where such exposures are centrally managed.
Financial Information
The following table presents certain balance sheet financial information for the Company’s reportable segments: | | | | | | | | | | | | | | | | | | | | | |
| | At December 31, 2024 |
| (In thousands) | Commercial
Banking | Healthcare Financial
Services | Consumer
Banking | | | Corporate and
Reconciling | Consolidated
Total |
Goodwill (1) | $ | 1,960,363 | | $ | 285,670 | | $ | 622,035 | | | | $ | — | | $ | 2,868,068 | |
| Total assets | 43,010,580 | | 488,194 | | 12,932,260 | | | | 22,594,039 | | 79,025,073 | |
| | | | | | | |
| At December 31, 2023 |
| (In thousands) | Commercial
Banking | Healthcare Financial
Services | Consumer
Banking | | | Corporate and
Reconciling | Consolidated
Total |
Goodwill (2) | $ | 1,951,945 | | $ | 57,485 | | $ | 622,035 | | | | $ | — | | $ | 2,631,465 | |
| Total assets | 41,843,297 | | 122,421 | | 12,327,403 | | | | 20,652,128 | | 74,945,249 | |
(1)The allocation of the purchase price for the Ametros acquisition was considered final at December 31, 2024. The $228.2 million of goodwill recorded related to Ametros was allocated entirely to Healthcare Financial Services.
(2)The allocation of the purchase price for the interLINK acquisition was considered final at June 30, 2023. The $143.2 million of goodwill recorded related to interLINK was allocated entirely to Commercial Banking.
The following tables present certain income statement information for the Company’s reportable segments: | | | | | | | | | | | | | | | | | | | |
| | Year ended December 31, 2024 |
| (In thousands) | Commercial
Banking | Healthcare Financial
Services | Consumer
Banking | | Totals | | |
| Net interest income | $ | 1,348,346 | | $ | 366,927 | | $ | 812,743 | | | $ | 2,528,016 | | | |
| Non-interest income | 143,104 | | 110,207 | | 113,638 | | | 366,949 | | | |
| Total segment revenues | 1,491,450 | | 477,134 | | 926,381 | | | 2,894,965 | | | |
| Reconciliation of revenue: | | | | | | | |
| Corporate and reconciling | | | | | (304,679) | | | |
| Total consolidated revenues | | | | | 2,590,286 | | | |
| Less: | | | | | | | |
| Compensation and benefits | 199,545 | | 90,166 | | 146,428 | | | | | |
Occupancy (1) | — | | — | | 56,102 | | | | | |
Technology and equipment (1) | 8,153 | | 33,010 | | 11,087 | | | | | |
| Marketing | — | | — | | 7,835 | | | | | |
Other segment items (2) (3) | 210,769 | | 90,913 | | 249,950 | | | | | |
| Segment pre-tax, pre-provision net revenue | 1,072,983 | | 263,045 | | 454,979 | | | 1,791,007 | | | |
| Reconciliation of pre-tax, pre-provision net revenue: | | | | | | | |
| Corporate and reconciling | | | | | (552,000) | | | |
| Total consolidated pre-tax, pre-provision net revenue | | | | | 1,239,007 | | | |
| Total consolidated provision for credit losses | | | | | 222,000 | | | |
| Total consolidated income before income taxes | | | | | 1,017,007 | | | |
| | | | | | | |
| | | | | | | |
(1)Occupancy and Technology and equipment include, in aggregate, depreciation expense of $0.2 million for Commercial Banking, $5.5 million for Healthcare Financial Services, and $9.5 million for Consumer Banking.
(2)Other segment items for each reportable segment includes:
•Commercial Banking--occupancy, marketing, outside professional services, loan workout expense, foreclosed property expense, other non-interest expense, allocated net operating costs, and allocated total support costs.
•Healthcare Financial Services--occupancy, marketing, outside professional services, other non-interest expense, allocated net operating costs, and allocated total support costs.
•Consumer Banking--outside professional services, loan workout expense, foreclosed property expense, other-non interest expense, allocated net operating costs, and allocated total support costs.
(3)Intangible assets amortization, which is a component of other non-interest expense presented in other segment items, was $9.3 million for Commercial Banking, $13.4 million for Healthcare Financial Services, and $8.3 million for Consumer Banking.
| | | | | | | | | | | | | | | | | | | |
| Year ended December 31, 2023 |
| (In thousands) | Commercial
Banking | Healthcare Financial
Services | Consumer
Banking | | Totals | | |
| Net interest income | $ | 1,436,616 | | $ | 302,856 | | $ | 898,898 | | | $ | 2,638,370 | | | |
| Non-interest income | 125,265 | | 88,113 | | 114,851 | | | 328,229 | | | |
| Total segment revenues | 1,561,881 | | 390,969 | | 1,013,749 | | | 2,966,599 | | | |
| Reconciliation of revenue: | | | | | | | |
| Corporate and reconciling | | | | | (314,993) | | | |
| Total consolidated revenues | | | | | 2,651,606 | | | |
| Less: | | | | | | | |
| Compensation and benefits | 178,289 | | 84,072 | | 139,203 | | | | | |
Occupancy (1) | — | | — | | 57,289 | | | | | |
Technology and equipment (1) | 7,944 | | 27,860 | | 9,998 | | | | | |
| Marketing | — | | — | | 6,736 | | | | | |
Other segment items (2) (3) | 208,709 | | 56,228 | | 256,403 | | | | | |
| | | | | | | |
| Segment pre-tax, pre-provision net revenue | 1,166,939 | | 222,809 | | 544,120 | | | 1,933,868 | | | |
| Reconciliation of pre-tax, pre-provision net revenue: | | | | | | | |
| Corporate and reconciling | | | | | (698,617) | | | |
| Total consolidated pre-tax, pre-provision net revenue | | | | | 1,235,251 | | | |
| Total consolidated provision for credit losses | | | | | 150,747 | | | |
| Total consolidated income before income taxes | | | | | 1,084,504 | | | |
| | | | | | | |
| | | | | | | |
(1)Occupancy and Technology and equipment include, in aggregate, depreciation expense of $0.4 million for Commercial Banking, $4.5 million for Healthcare Financial Services, and $8.9 million for Consumer Banking.
(2)Other segment items for each reportable segment includes:
•Commercial Banking--occupancy, marketing, outside professional services, loan workout expense, foreclosed property expense, other non-interest expense, allocated net operating costs, and allocated total support costs.
•Healthcare Financial Services--occupancy, marketing, outside professional services, other non-interest expense, allocated net operating costs, and allocated total support costs.
•Consumer Banking--outside professional services, loan workout expense, foreclosed property expense, other-non interest expense, allocated net operating costs, and allocated total support costs.
(3)Intangible assets amortization, which is a component of other non-interest expense presented in other segment items, was $16.0 million for Commercial Banking, $4.7 million for Healthcare Financial Services, and $9.7 million for Consumer Banking.
| | | | | | | | | | | | | | | | | | | |
| Year ended December 31, 2022 |
| (In thousands) | Commercial
Banking | Healthcare Financial
Services | Consumer
Banking | |
Totals | | |
| Net interest income | $ | 1,252,306 | | $ | 218,149 | | $ | 814,867 | | | $ | 2,285,322 | | | |
| Non-interest income | 164,044 | | 104,586 | | 127,084 | | | 395,714 | | | |
| Total segment revenues | 1,416,350 | | 322,735 | | 941,951 | | | 2,681,036 | | | |
| Reconciliation of revenue: | | | | | | | |
| Corporate and reconciling | | | | | (205,967) | | | |
| Total consolidated revenues | | | | | 2,475,069 | | | |
| Less: | | | | | | | |
| Compensation and benefits | 156,818 | | 73,764 | | 134,284 | | | | | |
Occupancy (1) | — | | — | | 55,393 | | | | | |
Technology and equipment (1) | 6,928 | | 23,463 | | 8,052 | | | | | |
| Marketing | — | | — | | 3,916 | | | | | |
Other segment items (2) (3) | 199,097 | | 54,102 | | 259,745 | | | | | |
| | | | | | | |
| Segment pre-tax, pre-provision net revenue | 1,053,507 | | 171,406 | | 480,561 | | | 1,705,474 | | | |
| Reconciliation of pre-tax, pre-provision net revenue: | | | | | | | |
| Corporate and reconciling | | | | | (626,878) | | | |
| Total consolidated pre-tax, pre-provision net revenue | | | | | 1,078,596 | | | |
| Total consolidated provision for credit losses | | | | | 280,619 | | | |
| Total consolidated income before income taxes | | | | | 797,977 | | | |
| | | | | | | |
| | | | | | | |
(1)Occupancy and Technology and equipment include, in aggregate, depreciation expense of $0.5 million for Commercial Banking, $2.9 million for Healthcare Financial Services, and $7.4 million for Consumer Banking.
(2)Other segment items for each reportable segment includes:
•Commercial Banking--occupancy, marketing, outside professional services, loan workout expense, foreclosed property expense, other non-interest expense, allocated net operating costs, and allocated total support costs.
•Healthcare Financial Services--occupancy, marketing, outside professional services, other non-interest expense, allocated net operating costs, and allocated total support costs.
•Consumer Banking--outside professional services, loan workout expense, foreclosed property expense, other-non interest expense, allocated net operating costs, and allocated total support costs.
(3)Intangible assets amortization, which is a component of other non-interest expense presented in other segment items, was $16.9 million for Commercial Banking, $4.8 million for Healthcare Financial Services, and $10.3 million for Consumer Banking.
Note 22: Revenue from Contracts with Customers
The following tables summarize revenues recognized in accordance with ASC Topic 606, Revenue from Contracts with Customers. These disaggregated amounts, together with sources of other non-interest income that are subject to other GAAP topics, have been reconciled to non-interest income by reportable segment as presented within Note 21: Segment Reporting.
| | | | | | | | | | | | | | | | | | | | | |
| Year ended December 31, 2024 |
| (In thousands) | Commercial
Banking | Healthcare Financial
Services | Consumer
Banking | | | Corporate and
Reconciling | Consolidated
Total |
| Non-interest Income: | | | | | | | |
| Deposit service fees | $ | 19,904 | | $ | 78,211 | | $ | 63,591 | | | | $ | (562) | | $ | 161,144 | |
Loan and lease related fees (1) | 14,170 | | — | | — | | | | — | | 14,170 | |
Wealth and investment services (2) | 13,122 | | — | | 20,133 | | | | (21) | | 33,234 | |
Other (3) (4) | — | | 31,996 | | 1,067 | | | | 4,088 | | 37,151 | |
| Revenue from contracts with customers | 47,196 | | 110,207 | | 84,791 | | | | 3,505 | | 245,699 | |
| Other sources of non-interest income | 95,908 | | — | | 28,847 | | | | (118,555) | | 6,200 | |
| Total non-interest income | $ | 143,104 | | $ | 110,207 | | $ | 113,638 | | | | $ | (115,050) | | $ | 251,899 | |
| | | | | | | | | | | | | | | | | | | | | |
| Year ended December 31, 2023 |
| (In thousands) | Commercial
Banking | Healthcare Financial
Services | Consumer
Banking | | | Corporate and
Reconciling | Consolidated
Total |
| Non-interest Income: | | | | | | | |
| Deposit service fees | $ | 15,987 | | $ | 81,051 | | $ | 71,539 | | | | $ | 741 | | $ | 169,318 | |
Loan and lease related fees (1) | 17,633 | | — | | — | | | | — | | 17,633 | |
Wealth and investment services (2) | 11,544 | | — | | 17,477 | | | | (22) | | 28,999 | |
Other (3) | — | | 7,062 | | 6,199 | | | | 4,193 | | 17,454 | |
| Revenue from contracts with customers | 45,164 | | 88,113 | | 95,215 | | | | 4,912 | | 233,404 | |
| Other sources of non-interest income | 80,101 | | — | | 19,636 | | | | (18,804) | | 80,933 | |
| Total non-interest income | $ | 125,265 | | $ | 88,113 | | $ | 114,851 | | | | $ | (13,892) | | $ | 314,337 | |
| | | | | | | | | | | | | | | | | | | | | |
| Year ended December 31, 2022 |
| (In thousands) | Commercial
Banking | Healthcare Financial
Services | Consumer
Banking | | | Corporate and
Reconciling | Consolidated
Total |
| Non-interest Income: | | | | | | | |
| Deposit service fees | $ | 23,449 | | $ | 97,654 | | $ | 75,567 | | | | $ | 1,802 | | $ | 198,472 | |
Loan and lease related fees (1) | 21,498 | | — | | — | | | | — | | 21,498 | |
| Wealth and investment services | 11,350 | | — | | 28,957 | | | | (30) | | 40,277 | |
| Other | — | | 6,932 | | 1,493 | | | | — | | 8,425 | |
| Revenue from contracts with customers | 56,297 | | 104,586 | | 106,017 | | | | 1,772 | | 268,672 | |
| Other sources of non-interest income | 107,747 | | — | | 21,067 | | | | 43,297 | | 172,111 | |
| Total non-interest income | $ | 164,044 | | $ | 104,586 | | $ | 127,084 | | | | $ | 45,069 | | $ | 440,783 | |
| | | | | | | |
(1)A portion of loan and lease related fees is comprised of income generated from factored receivables and payroll financing activities that is within the scope of ASC Topic 606. These Commercial Banking revenue streams were new to the Company in 2022 due to the businesses acquired in connection with the Sterling merger.
(2)Effective as of the fourth quarter of 2022, the wealth and investment services revenue stream for Consumer Banking was impacted by the restructuring of a process in which the Company offers brokerage, investment advisory, and certain insurance-related services to customers. The staff providing these services, who had previously been employees of the Bank, are now employees of a third-party service provider. As a result, the Company now recognizes income from this program on a net basis, which thereby reduces gross reported wealth and investment services non-interest income and the related compensation and benefits non-interest expense on the accompanying Consolidated Statements of Income.
(3)Other income included in the Corporate and Reconciling category that is in scope of ASC Topic 606 is comprised entirely of insignificant fee revenue from contracts with customers attributable to interLINK. This revenue stream was new to the Company in 2023 due to the operations acquired in connection with the interLINK acquisition.
(4)The increase in other income for Healthcare Financial Services from prior periods is primarily related to the Ametros business, which was acquired in January 2024, and recognized $23.0 million from contracts with customers during the year.
Major Revenue Streams
Deposit Service Fees. The deposit service fees revenue stream consists of fees earned from commercial and consumer customer deposit accounts, such as account maintenance and cash management/analysis fees, as well as other transactional service charges (i.e., insufficient funds, wire transfers, stop payment fees, etc.). Performance obligations for account maintenance services and cash management/analysis fees are satisfied on a monthly basis at a fixed transaction price, whereas performance obligations for other deposit service charges that result from various customer-initiated transactions are satisfied at a point-in-time when the service is rendered. Payment for deposit service fees is generally received immediately or in the following month through a direct charge to the customers’ accounts. Certain commercial customer contracts include credit clauses, whereby the Company will grant credit upon the customer meeting pre-determined conditions, which can be used to offset fees. On occasion, the Company may also waive certain fees. Fee waivers are recognized as a reduction to revenue in the period the waiver is granted to the customer.
The deposit service fees revenue stream also includes interchange fees earned from debit and credit card transactions. The transaction price for interchange services is based on the transaction value and the interchange rate set by the card network. Performance obligations for interchange fees are satisfied at a point-in-time when the cardholders’ transaction is authorized and settled. Payment for interchange fees is generally received immediately or in the following month.
Loan and Lease Related Fees. Factored receivables non-interest income consists of fees earned from accounts receivable management services. As previously discussed in Note 5: Transfers and Servicing of Financial Assets, the Company sold its factored receivables loan portfolio, which included the related customer contracts, in the third quarter of 2024. As a result, the Company will no longer generate income from factored receivables activities. The Company factored accounts receivable, with and without recourse, for customers whereby the Company purchased their accounts receivable at a discount and assumed the risk, as applicable, and ownership of the assets through direct cash receipt from the end consumer. Factoring services were performed in exchange for a non-refundable fee at a transaction price based on a percentage of the gross invoice amount of each receivable purchased, subject to a minimum required amount. The performance obligation for factoring services was generally satisfied at a point-in-time when the receivable was assigned to the Company. However, if the commission earned did not meet or exceed the minimum required annual amount, the difference between that and the actual amount was recognized at the end of the contract term. Other fees associated with factoring receivables included wire transfer and technology fees, field examination fees, and Uniform Commercial Code fees, where the performance obligations were satisfied at a point-in-time when the services were rendered. Payment from the customer for factoring services was generally received immediately or within the following month.
Payroll finance non-interest income consists of fees earned from performing payroll financing and business process outsourcing services, including full back-office technology and tax accounting services, along with payroll preparation, making payroll tax payments, invoice billings, and collections for independently-owned temporary staffing companies nationwide. Performance obligations for payroll finance and business processing activities are either satisfied upon completion of the support services or as payroll remittances are made on behalf of customers to fund their employee payroll, which generally occurs on a weekly basis. The agreed-upon transaction price is based on a fixed-percentage per the terms of the contract, which could be subject to a hold-back reserve to provide for any balances that are assessed to be at risk of collection. When the Company collects on amounts due from end consumers on behalf of its customers and at the time of financing payroll, the Company retains the agreed-upon transaction price payable for the performance of its services and remits an amount to the customer net of any advances and payroll tax withholdings, as applicable.
Wealth and Investment Services. Wealth and investment services consists of fees earned from asset management, trust administration, and investment advisory services, and through facilitating securities transactions. Performance obligations for asset management and trust administration services are satisfied on a monthly or quarterly basis at a transaction price based on a percentage of the period-end market value of the assets under administration. Payment for asset management and trust administration services is generally received a few days after period-end through a direct charge to the customers’ accounts. Performance obligations for investment advisory services are satisfied over the period in which the services are provided through a time-based measurement of progress, and the agreed-upon transaction price with the customer varies depending on the nature of the services performed. Performance obligations for facilitating securities transactions are satisfied at a point-in-time when the securities are sold at a transaction price that is based on a percentage of the contract value. Payment for both investment advisory services and facilitating securities transactions may be received in advance of the service, but generally is received immediately or in the following period, in arrears.
Other Income - Ametros. Other income for the Healthcare Financial Services segment primarily includes revenues recognized in connection with contracts with customers from the acquired Ametros business. The nature of such revenue primarily pertains to income earned from arranging sales of in-network products and services, which is recognized at a point in time. Under the terms of these arrangements, the Company has determined that it acts in the capacity as an agent and, therefore, records revenue on a net basis. Other income related to Ametros also includes revenues earned from providing post-settlement medical management and compliance services, which are recognized over time.
The Company evaluates its contracts with Ametros customers for material rights, or options, to acquire additional goods or services for free or at a discount. The contracts for post-settlement medical management and compliance services contain renewal options that represent a material right, which is recognized as a separate performance obligation at the inception of the arrangement. The Company allocates the transaction price to material rights using the practical alternative, which allocates the transaction price to the services expected to be provided and the corresponding expected consideration. Material rights are recognized at the time the service is transferred or when the option expires.
In addition, a fixed, non-refundable fee that represents an advance payment for access to future services is initially deferred and subsequently amortized into other income ratably over the estimated life expectancy of the member. During the year ended December 31, 2024, $1.6 million of such deferred revenue was recognized in Other income.
Contract Balances and Deferred Costs
Contracts with customers generated accounts receivable, deferred costs, and deferred revenue of $2.7 million, $3.0 million, and $22.8 million, respectively, at December 31, 2024. All of these balances pertain to contracts with customers from the acquired Ametros business. Contract assets, deferred costs, and deferred revenues were not significant at December 31, 2023, and 2022.
Note 23: Commitments and Contingencies
Credit-Related Financial Instruments
In the normal course of business, the Company offers financial instruments with off-balance sheet risk to meet the financing needs of its customers. These transactions include commitments to extend credit, standby letters of credit, and commercial letters of credit, which involve, to varying degrees, elements of credit risk.
The following table summarizes the outstanding amounts of credit-related financial instruments with off-balance sheet risk: | | | | | | | | | | | |
| At December 31, |
| (In thousands) | 2024 | | 2023 |
| Commitments to extend credit | $ | 11,630,765 | | | $ | 12,026,597 | |
| Standby letters of credit | 578,912 | | | 482,462 | |
| Commercial letters of credit | 28,287 | | | 54,382 | |
| Total credit-related financial instruments with off-balance sheet risk | $ | 12,237,964 | | | $ | 12,563,441 | |
The Company enters into contractual commitments to extend credit to its customers (i.e., revolving credit arrangements, term loan commitments, and short-term borrowing agreements), generally with fixed expiration dates or other termination clauses and that require payment of a fee. Substantially all of the Company’s commitments to extend credit are contingent upon its customers maintaining specific credit standards at the time of loan funding, and are often secured by real estate collateral. Since the majority of the Company’s commitments typically expire without being funded, the total contractual amount does not necessarily represent the Company’s future payment requirements.
Standby letters of credit are written conditional commitments issued by the Company to guarantee its customers’ performance to a third party. In the event the customer does not perform in accordance with the terms of its agreement with a third-party, the Company would be required to fund the commitment. The contractual amount of each standby letter of credit represents the maximum amount of potential future payments the Company could be required to make. Historically, the majority of the Company’s standby letters of credit expire without being funded. However, if the commitment were funded, the Company has recourse against the customer. The Company’s standby letter of credit agreements are often secured by cash or other collateral.
Commercial letters of credit are issued to finance either domestic or foreign customer trade arrangements. As a general rule, drafts are committed to be drawn when the goods underlying the transaction are in transit. Similar to standby letters of credit, the Company’s commercial letter of credit agreements are often secured by the underlying goods subject to trade.
Allowance for Credit Losses on Unfunded Loan Commitments
An ACL is recorded under the CECL methodology to provide for the unused portion of commitments to lend that are not unconditionally cancellable by the Company. At December 31, 2024, and 2023, the ACL on unfunded loan commitments was $22.6 million and $24.7 million, respectively.Litigation The Company is subject to certain legal proceedings and unasserted claims and assessments in the ordinary course of business. Legal contingencies are evaluated based on information currently available, including advice of counsel and assessment of available insurance coverage. The Company establishes an accrual for specific legal matters when it determines that the likelihood of an unfavorable outcome is probable and the loss is reasonably estimable. Once established, each accrual is adjusted to reflect any subsequent developments. Legal contingencies are subject to inherent uncertainties, and unfavorable rulings may occur that could cause the Company to either adjust its litigation accrual or incur actual losses that exceed the current estimate, which ultimately could have a material adverse effect, either individually or in the aggregate, on its business, financial condition, or operating results. The Company will consider settlement of cases when it is in the best interests of the Company and its stakeholders. The Company intends to defend itself in all claims asserted against it, and management currently believes that the outcome of these contingencies will not be material, either individually or in the aggregate, to the Company or its consolidated financial position.
Federal Deposit Insurance Corporation Special Assessment
On November 29, 2023, the FDIC published a final rule implementing a special assessment for certain banks to recover losses incurred by protecting uninsured depositors of Silicon Valley Bank and Signature Bank upon their failure in March 2023. The special assessment is to be collected for an anticipated total of ten quarterly assessment periods, which began during the second quarter of 2024. At December 31, 2024, and 2023, the Company’s remaining accrual for its estimated special assessment charge was $39.8 million and $47.2 million, respectively. The FDIC retains the right to cease collection early, extend the special assessment collection period, and impose shortfall special assessments if actual losses exceed the amounts collected. The Company continues to monitor the estimated loss attributable to the protection of uninsured depositors at Silicon Valley Bank and Signature Bank, which could impact the amount of its accrued liability.
Note 24: Parent Company Financial Information
The following tables summarize condensed financial information for the Parent Company only:
| | | | | | | | | | | |
| CONDENSED BALANCE SHEETS | | | |
| December 31, |
| (In thousands) | 2024 | | 2023 |
| Assets: | | | |
| Cash and cash equivalents | $ | 456,166 | | | $ | 406,754 | |
| | | |
| Intercompany debt securities | 150,000 | | | 150,000 | |
| Investment in subsidiaries | 9,377,808 | | | 9,131,026 | |
| | | |
| Alternative investments | 71,959 | | | 59,015 | |
| Other assets | 7,962 | | | 13,314 | |
| Total assets | $ | 10,063,895 | | | $ | 9,760,109 | |
| Liabilities and stockholders’ equity: | | | |
| Senior notes | $ | 321,191 | | | $ | 458,698 | |
| Subordinated notes | 510,674 | | | 512,802 | |
| Junior subordinated debt | 77,320 | | | 77,320 | |
| Accrued interest payable | 5,007 | | | 12,693 | |
| Due to subsidiaries | 10,613 | | | 477 | |
| Other liabilities | 5,876 | | | 8,123 | |
| Total liabilities | 930,681 | | | 1,070,113 | |
| Stockholders’ equity | 9,133,214 | | | 8,689,996 | |
| Total liabilities and stockholders’ equity | $ | 10,063,895 | | | $ | 9,760,109 | |
| | | | | | | | | | | | | | | | | |
| CONDENSED STATEMENTS OF INCOME | | | | | |
| Years ended December 31, |
| (In thousands) | 2024 | | 2023 | | 2022 |
| Income: | | | | | |
| Dividend income from bank subsidiary | $ | 600,000 | | | $ | 600,000 | | | $ | 475,000 | |
| Interest income on securities and interest-bearing deposits | 11,606 | | | 11,259 | | | 5,955 | |
| | | | | |
| Alternative investments income | 7,580 | | | 1,272 | | | 6,416 | |
| Other non-interest income | 198 | | | 908 | | | 112 | |
| Total income | 619,384 | | | 613,439 | | | 487,483 | |
| Expense: | | | | | |
| Interest expense on borrowings | 32,253 | | | 37,933 | | | 34,284 | |
| Merger-related expenses | — | | | 2,111 | | | 40,314 | |
| Other non-interest expense | 24,988 | | | 31,600 | | | 22,592 | |
| Total expense | 57,241 | | | 71,644 | | | 97,190 | |
| Income before income taxes and equity in undistributed earnings of subsidiaries | 562,143 | | | 541,795 | | | 390,293 | |
| Income tax benefit | 10,021 | | | 15,106 | | | 20,799 | |
| Equity in undistributed earnings of subsidiaries | 196,543 | | | 310,939 | | | 233,191 | |
| Net income | $ | 768,707 | | | $ | 867,840 | | | $ | 644,283 | |
| | | | | | | | | | | | | | | | | |
| CONDENSED STATEMENTS OF COMPREHENSIVE INCOME | | | | | |
| Years ended December 31, |
| (In thousands) | 2024 | | 2023 | | 2022 |
| Net income | $ | 768,707 | | | $ | 867,840 | | | $ | 644,283 | |
| Other comprehensive (loss) income, net of tax: | | | | | |
| | | | | |
| Derivative instruments | 25 | | | 229 | | | 226 | |
| Other comprehensive (loss) income of subsidiaries | (5,837) | | | 134,160 | | | (662,606) | |
| Other comprehensive (loss) income, net of tax | (5,812) | | | 134,389 | | | (662,380) | |
| Comprehensive income (loss) | $ | 762,895 | | | $ | 1,002,229 | | | $ | (18,097) | |
| | | | | | | | | | | | | | | | | |
| CONDENSED STATEMENTS OF CASH FLOWS | | | | | |
| | Years ended December 31, |
| (In thousands) | 2024 | | 2023 | | 2022 |
| Operating activities: | | | | | |
| Net income | $ | 768,707 | | | $ | 867,840 | | | $ | 644,283 | |
| Adjustments to reconcile net income to net cash provided by operating activities: | | | | | |
| Equity in undistributed earnings of subsidiaries | (196,543) | | | (310,939) | | | (233,191) | |
| | | | | |
| | | | | |
| Common stock contribution to charitable foundation | — | | | — | | | 10,500 | |
| | | | | |
| Other, net | (8,711) | | | (8,312) | | | (2,853) | |
| Net cash provided by operating activities | 563,453 | | | 548,589 | | | 418,739 | |
| Investing activities: | | | | | |
| Alternative investments (capital call), net of returns of capital | (17,589) | | | (13,070) | | | (16,292) | |
| Proceeds from sales of alternative investments | 9,657 | | | — | | | — | |
| Net cash received in business combination | — | | | — | | | 193,238 | |
| | | | | |
| Net cash (used in) provided by investing activities | (7,932) | | | (13,070) | | | 176,946 | |
| Financing activities: | | | | | |
| | | | | |
| Repayment of long-term debt | (132,550) | | | (16,752) | | | — | |
| | | | | |
| | | | | |
| Dividends paid to common stockholders | (274,545) | | | (278,155) | | | (247,767) | |
| Dividends paid to preferred stockholders | (16,650) | | | (16,650) | | | (13,725) | |
| Exercise of stock options | 254 | | | 1,723 | | | 703 | |
| | | | | |
| Common stock repurchase program | (65,403) | | | (107,984) | | | (322,103) | |
| Common shares acquired related to stock compensation plan activity | (17,215) | | | (16,278) | | | (23,655) | |
| | | | | |
| Net cash (used in) financing activities | (506,109) | | | (434,096) | | | (606,547) | |
| | | | | |
| Net increase (decrease) in cash and cash equivalents | 49,412 | | | 101,423 | | | (10,862) | |
| Cash and cash equivalents, beginning of period | 406,754 | | | 305,331 | | | 316,193 | |
| Cash and cash equivalents, at end of period | $ | 456,166 | | | $ | 406,754 | | | $ | 305,331 | |
Note 25: Subsequent Events
The Company has evaluated subsequent events from the date of the Consolidated Financial Statements, and accompanying Notes thereto, through the date of issuance, and determined that no significant events were identified requiring recognition or disclosure.
ITEM 9. CHANGES IN AND DISAGREEMENTS WITH ACCOUNTANTS ON ACCOUNTING AND FINANCIAL DISCLOSURE
None.
ITEM 9A. CONTROLS AND PROCEDURES
Evaluation of Disclosure Controls and Procedures
Our management, under the supervision and with the participation of the Chief Executive Officer (who is our principal executive officer) and Chief Financial Officer (who is our principal financial officer), evaluated the effectiveness of our disclosure controls and procedures, as defined in Rule 13a-15(e) and 15d-15(e) of the Securities Exchange Act of 1934, as amended (the “Exchange Act”), as of December 31, 2024. The term “disclosure controls and procedures” means controls and other procedures of a company that are designed to ensure that information required to be disclosed by a company in the reports that it files or submits under the Exchange Act is recorded, processed, summarized and reported, within the time periods specified in the SEC’s rules and forms. Disclosure controls and procedures include, without limitation, controls and procedures designed to ensure that information required to be disclosed by a company in the reports that it files or submits under the Exchange Act is accumulated and communicated to the company’s management, including its principal executive officer and principal financial officer, or persons performing similar functions, as appropriate to allow timely decisions regarding required disclosure. Based on that evaluation, our Chief Executive Officer and Chief Financial Officer concluded that as of December 31, 2024, our disclosure controls and procedures were effective.
Management’s Report on Internal Control Over Financial Reporting
Our management is responsible for establishing and maintaining adequate internal control over financial reporting (as defined in Rules 13a-15(f) and 15d-15(f) under the Exchange Act). Internal control over financial reporting is a process designed by, or under the supervision of, a company’s principal executive and principal financial officers, or persons performing similar functions, and effected by a company’s Board of Directors, management and other personnel, to provide reasonable assurance regarding the reliability of financial reporting and the preparation of financial statements for external purposes in accordance with GAAP. It includes those policies and procedures that:
1.pertain to the maintenance of records that in reasonable detail accurately and fairly reflect the transactions and dispositions of the assets of a company;
2.provide reasonable assurance that transactions are recorded as necessary to permit preparation of financial statements in accordance with GAAP, and that receipts and expenditures of a company are being made only in accordance with authorizations of management and directors of the company; and
3.provide reasonable assurance regarding prevention or timely detection of unauthorized acquisition, use or disposition of a company’s assets that could have a material effect on the financial statements.
Our management conducted an assessment, under the supervision and with the participation of our Chief Executive Officer and Chief Financial Officer under the oversight of our Board of Directors, of the effectiveness of our internal control over financial reporting as of December 31, 2024, based on criteria established in Internal Control - Integrated Framework (2013) issued by the Committee of Sponsoring Organizations of the Treadway Commission (COSO). Based on this evaluation, our management concluded that our internal control over financial reporting was effective at December 31, 2024.
Changes in Internal Control Over Financial Reporting
There were no changes in our internal control over financial reporting (as defined in Rules 13a-15(f) and 15d-15(f) under the Exchange Act) during the quarter ended December 31, 2024, that have materially affected, or are reasonably likely to materially affect, our internal control over financial reporting.
Limitations on Effectiveness of Controls and Procedures
Because of its inherent limitations, management does not expect that our disclosure controls and procedures or our internal control over financial reporting will prevent or detect all error and fraud. Any control system, no matter how well designed and operated, is based upon certain assumptions and can provide only reasonable, not absolute, assurance that its objectives will be met. Also, projections of any evaluation of effectiveness to future periods are subject to the risk that controls may become inadequate because of changes in conditions, or that the degree of compliance with the policies or procedures may deteriorate. Further, no evaluation of controls can provide absolute assurance that misstatements due to error or fraud will not occur or that all control issues and instances of fraud, if any, within the Company have been detected.
Attestation Report of Independent Registered Public Accounting Firm
The Company’s independent registered public accounting firm, KPMG LLP, has issued an unqualified opinion on the effectiveness of the Company’s internal control over financial reporting as of December 31, 2024, which appears below under the heading “Report of Independent Registered Public Accounting Firm.”
Report of Independent Registered Public Accounting Firm
To the Stockholders and the Board of Directors
Webster Financial Corporation:
Opinion on Internal Control Over Financial Reporting
We have audited Webster Financial Corporation and subsidiaries’ (the Company) internal control over financial reporting as of December 31, 2024, based on criteria established in Internal Control – Integrated Framework (2013) issued by the Committee of Sponsoring Organizations of the Treadway Commission. In our opinion, the Company maintained, in all material respects, effective internal control over financial reporting as of December 31, 2024, based on criteria established in Internal Control – Integrated Framework (2013) issued by the Committee of Sponsoring Organizations of the Treadway Commission.
We also have audited, in accordance with the standards of the Public Company Accounting Oversight Board (United States) (PCAOB), the consolidated balance sheets of the Company as of December 31, 2024 and 2023, the related consolidated statements of income, comprehensive income, stockholders’ equity, and cash flows for each of the years in the three-year period ended December 31, 2024, and the related notes (collectively, the consolidated financial statements), and our report dated March 3, 2025 expressed an unqualified opinion on those consolidated financial statements.
Basis for Opinion
The Company’s management is responsible for maintaining effective internal control over financial reporting and for its assessment of the effectiveness of internal control over financial reporting, included in the accompanying Management’s Report on Internal Controls Over Financial Reporting. Our responsibility is to express an opinion on the Company’s internal control over financial reporting based on our audit. We are a public accounting firm registered with the PCAOB and are required to be independent with respect to the Company in accordance with the U.S. federal securities laws and the applicable rules and regulations of the Securities and Exchange Commission and the PCAOB.
We conducted our audit in accordance with the standards of the PCAOB. Those standards require that we plan and perform the audit to obtain reasonable assurance about whether effective internal control over financial reporting was maintained in all material respects. Our audit of internal control over financial reporting included obtaining an understanding of internal control over financial reporting, assessing the risk that a material weakness exists, and testing and evaluating the design and operating effectiveness of internal control based on the assessed risk. Our audit also included performing such other procedures as we considered necessary in the circumstances. We believe that our audit provides a reasonable basis for our opinion.
Definition and Limitations of Internal Control Over Financial Reporting
A company’s internal control over financial reporting is a process designed to provide reasonable assurance regarding the reliability of financial reporting and the preparation of financial statements for external purposes in accordance with generally accepted accounting principles. A company’s internal control over financial reporting includes those policies and procedures that (1) pertain to the maintenance of records that, in reasonable detail, accurately and fairly reflect the transactions and dispositions of the assets of the company; (2) provide reasonable assurance that transactions are recorded as necessary to permit preparation of financial statements in accordance with generally accepted accounting principles, and that receipts and expenditures of the company are being made only in accordance with authorizations of management and directors of the company; and (3) provide reasonable assurance regarding prevention or timely detection of unauthorized acquisition, use, or disposition of the company’s assets that could have a material effect on the financial statements.
Because of its inherent limitations, internal control over financial reporting may not prevent or detect misstatements. Also, projections of any evaluation of effectiveness to future periods are subject to the risk that controls may become inadequate because of changes in conditions, or that the degree of compliance with the policies or procedures may deteriorate.
/s/ KPMG LLP
New York, New York
March 3, 2025
ITEM 9B. OTHER INFORMATION
During the three months ended December 31, 2024, no director or officer of the Company adopted or terminated a Rule 10b5-1 trading arrangement or non-Rule 10b5-1 trading arrangement, as each term is defined in Item 408 of Regulation S-K.
ITEM 9C. DISCLOSURE REGARDING FOREIGN JURISDICTIONS THAT PREVENT INSPECTIONS
Not applicable.
PART III
ITEM 10. DIRECTORS, EXECUTIVE OFFICERS AND CORPORATE GOVERNANCE
The Company has adopted a Code of Business Conduct and Ethics that applies to all directors, officers, and employees, including its principal executive officer, principal financial officer, and principal accounting officer. The Company has also adopted a Corporate Governance Policy and has charters for each of the Board’s standing committees, which includes an Audit, Compensation and Human Resources, Nominating and Corporate Governance, Risk, and Technology Committee.
The Company’s Code of Business Conduct and Ethics, Corporate Governance Policy, Insider Trading Policy, Executive Stock Ownership Guidelines, Shareholder Rights Plan Policy, and the charters for the Audit, Compensation and Human Resources, Nominating and Corporate Governance, Risk, and Technology Committees of the Board can be found within the investor relations section of its internet website (http://investors.websterbank.com).
The Company’s Insider Trading Policy governs the purchase, sale, and/or other transactions of our securities by our directors, officers, and employees. A copy of our Insider Trading Policy is also filed as Exhibit 19 to this Annual Report on Form 10-K. In addition, we believe that the Company’s insider trading policies and procedures are reasonably designed to promote compliance with insider trading laws, rules and regulations, and any listing standards applicable to us.
A printed copy of any of these documents can be obtained, without charge, directly from the Company at the following address:
Webster Financial Corporation
200 Elm Street
Stamford, Connecticut 06902
Attn: Investor Relations
Telephone: (203) 578-2202
Information regarding directors and executive officers, and additional information regarding corporate governance, will be set forth in the Proxy Statement, including under the sections captioned “Election of Directors,” “Board Meetings, Committees of the Board and Related Matters,” “Executive Officers,” “Requirements for Stockholder Submission of Candidates for Nomination to be Elected,” and “Delinquent Section 16(a) Reports” (if required to be included), which are incorporated herein by reference. The Proxy Statement is required to be filed with the SEC no later than 120 days after the close of the year ended December 31, 2024.
ITEM 11. EXECUTIVE COMPENSATION
Information regarding executive compensation will be set forth in the Proxy Statement, including under the sections captioned “Compensation of Directors,” “Executive Officers,” “Compensation of Named Executive Officers,” and “Compensation Discussion and Analysis,” which are incorporated herein by reference.
ITEM 12. SECURITY OWNERSHIP OF CERTAIN BENEFICIAL OWNERS AND MANAGEMENT AND RELATED STOCKHOLDER MATTERS
Information regarding security ownership of certain beneficial owners and management and related stockholder matters can be found within Note 20: Share-Based Plans in the Notes to Consolidated Financial Statements contained in Part II - Item 8. Financial Statements and Supplementary Data of this report, and will be set forth in the Proxy Statement, including under the section captioned “Security Ownership of Certain Beneficial Owners and Management,” which is incorporated herein by reference.
ITEM 13. CERTAIN RELATIONSHIPS AND RELATED TRANSACTIONS, AND DIRECTOR INDEPENDENCE
Information regarding certain relationships and related transactions, and director independence will be set forth in the Proxy Statement, including under the sections captioned “Compensation Committee Interlocks and Insider Participation,” “Transactions with Related Persons,” “Policies and Procedures Regarding Transactions with Related Persons,” “Director Independence,” and “Current Board Composition, Experience, and Refreshment,” and “Committees of the Board,” which are incorporated herein by reference.
ITEM 14. PRINCIPAL ACCOUNTANT FEES AND SERVICES
Information regarding principal accountant fees and services will be set forth in the Proxy Statement, including under the section captioned “Auditor Ratification,” which is incorporated herein by reference.
PART IV
ITEM 15. EXHIBITS, FINANCIAL STATEMENT SCHEDULES
Financial Statements
The Company’s Consolidated Financial Statements, and the accompanying Notes thereto, and the Report of Independent Registered Public Accounting Firm thereon, are included in Part II - Item 8. Financial Statements and Supplementary Data.
Financial Statement Schedules
All financial statement schedules for the Company have been included in the Consolidated Financial Statements, and the accompanying Notes thereto, or are either inapplicable or not required, and therefore, have been omitted.
Exhibits
A list of exhibits to this Form 10-K is set forth below.
| | | | | | | | | | | | | | | | | | | | | | | | | | | | | | | | |
| Exhibit Number | | Exhibit Description | | Exhibit Included | | Incorporated by Reference |
| | | Form | | Exhibit | | Filing Date |
2 (1) | | | | | | 8-K | | 2.1 | | 4/23/2021 |
| 3 | | Certificate of Incorporation and Bylaws | | | | | | | | |
| 3.1 | | | | | | 10-Q | | 3.1 | | 8/9/2016 |
| 3.2.1 | | | | | | 8-K | | 3.1 | | 4/28/2023 |
| 3.2.2 | | | | | | 8-K | | 3.2 | | 2/1/2022 |
| 3.3 | | | | | | 8-K | | 3.1 | | 6/11/2008 |
| 3.4 | | | | | | 8-K | | 3.1 | | 11/24/2008 |
| 3.5 | | | | | | 8-K | | 3.1 | | 7/31/2009 |
| 3.6 | | | | | | 8-K | | 3.2 | | 7/31/2009 |
| 3.7 | | | | | | 8-A12B | | 3.3 | | 12/4/2012 |
| 3.8 | | | | | | 8-A12B | | 3.3 | | 12/12/2017 |
| 3.9 | | | | | | 8-A12B | | 3.4 | | 2/1/2022 |
| 3.10 | | | | | | 8-K | | 3.1 | | 3/17/2020 |
| 3.11 | | | | | | 8-K | | 3.5 | | 2/1/2022 |
| 4 | | Instruments Defining the Rights of Security Holders | | | | | | | | |
| 4.1 | | | | | | 10-K | | 4.1 | | 2/25/2022 |
| 4.2 | | | | | | 10-K | | 4.1 | | 3/10/2006 |
| 4.3 | | | | | | 10-K | | 10.41 | | 3/27/1997 |
| 4.4 | | | | | | 8-K | | 4.1 | | 12/12/2017 |
| 4.5.1 | | | | | | 8-K | | 4.1 | | 2/1/2022 |
| 4.5.2 | | | | | | 8-K | | 4.2 | | 2/1/2022 |
| 4.5.3 | | | | | | 8-K | | 4.3 | | 2/1/2022 |
| 4.6 | | | | | | 8-K | | 4.4 | | 2/1/2022 |
| 4.7 | | | | | | 8-K | | 4.1 | | 2/11/2014 |
| 4.8 | | | | | | 8-K | | 4.2 | | 2/11/2014 |
| 4.9 | | | | | | 8-A12B | | 4.3 | | 12/12/2017 |
| 4.10 | | | | | | 8-K | | 4.1 | | 3/25/2019 |
| 4.11 | | | | | | 8-K | | 4.2 | | 3/25/2019 |
| 4.12 | | | | | | 10-Q | | 4 | | 5/6/2021 |
| | | | | | | | | | | | | | | | | | | | | | | | | | | | | | | | |
| Exhibit Number | | Exhibit Description | | Exhibit Included | | Incorporated by Reference |
| | | Form | | Exhibit | | Filing Date |
| 10 | | Material Contracts (2) | | | | | | | | |
| 10.1 | | | | | | 10-K | | 10.1 | | 2/27/2024 |
| 10.2 | | | | | | 8-K | | 10.2 | | 12/21/2007 |
| 10.3 | | | | | | 8-K | | 10.3 | | 12/21/2007 |
| 10.4 | | | | | | 10-K | | 10.4 | | 3/10/2023 |
| 10.5 | | | | | | 8-K | | 10.1 | | 10/26/2007 |
| 10.6 | | | | | | 8-K | | 10.1 | | 12/21/2007 |
| 10.7 | | | | | | 10-Q | | 10.1 | | 5/7/2019 |
| 10.8 | | | | | | 10-K | | 10.10 | | 2/27/2024 |
| 10.9 | | | | | | 10-K | | 10.20 | | 3/1/2017 |
| 10.10 | | | | | | 8-K | | 10.2 | | 2/1/2022 |
| 10.11 | | | | | | 10-Q | | 10.1 | | 5/5/2017 |
| 10.12 | | | | | | 10-K | | 10.13 | | 2/28/2013 |
| 10.13 | | | | | | 10-K | | 10.13 | | 2/28/2014 |
| 10.14 | | | | | | 10-Q | | 10.5 | | 5/5/2017 |
| 10.15 | | | | | | 10-K | | 10.18 | | 3/1/2018 |
| 10.16 | | | | | | 10-Q | | 10.2 | | 5/5/2017 |
| 10.17 | | | | | | 8-K | | 10.1 | | 2/1/2022 |
| 10.18 | | | | | | 10-K | | 10.20 | | 2/27/2024 |
| 10.19 | | | | | | 10-K | | 10.21 | | 2/27/2024 |
| 10.20 | | | | | | 10-Q | | 10.4 | | 5/5/2017 |
| 10.21 | | | | | | 8-K | | 10.3 | | 2/1/2022 |
| 10.22 | | | | | | 8-K | | 10.4 | | 2/1/2022 |
| 10.23 | | | | | | 10-K | | 10.25 | | 2/27/2024 |
| 10.24 | | | | | | 10-K | | 10.26 | | 2/27/2024 |
| 10.25 | | | | | | 10-K | | 10.27 | | 2/27/2024 |
| 10.26 | | | | | | 10-K | | 10.28 | | 2/27/2024 |
| 10.27 | | | | | | 10-K | | 10.29 | | 2/27/2024 |
| 10.28 | | | | | | 10-K | | 10.30 | | 2/27/2024 |
| | | | | | | | | | | | | | | | | | | | | | | | | | | | | | | | |
| Exhibit Number | | Exhibit Description | | Exhibit Included | | Incorporated by Reference |
| | | Form | | Exhibit | | Filing Date |
| 10.29 | | | | | | 10-K | | 10.31 | | 2/27/2024 |
| 10.30 | | | | | | 10-K | | 10.32 | | 2/27/2024 |
| 10.31 | | | | | | 10-K | | 10.33 | | 2/27/2024 |
| 10.32 | | | | | | 10-K | | 10.34 | | 2/27/2024 |
| 10.33 | | | | | | 10-K | | 10.35 | | 2/27/2024 |
| 10.34 | | | | | | 10-K | | 10.36 | | 2/27/2024 |
| 10.35 | | | | | | 10-K | | 10.37 | | 2/27/2024 |
| 10.36 | | | | | | 10-K | | 10.38 | | 2/27/2024 |
| 10.37 | | | | | | 10-K | | 10.39 | | 2/27/2024 |
| 10.38 | | | | | | 10-K | | 10.40 | | 2/27/2024 |
| 10.39 | | | | | | 10-K | | 10.41 | | 2/27/2024 |
| 10.40 | | | | | | 10-K | | 10.42 | | 2/27/2024 |
| 10.41 | | | | | | 8-K | | 10.1 | | 7/15/2024 |
| 10.42 | | | | | | 8-K | | 10.2 | | 7/15/2024 |
| 19 | | | | X | | | | | | |
| 21 | | | | X | | | | | | |
| 23 | | | | X | | | | | | |
| 31.1 | | | | X | | | | | | |
| 31.2 | | | | X | | | | | | |
| 32.1 | | | | X (3) | | | | | | |
| 32.2 | | | | X (3) | | | | | | |
| | | | | | | | | | |
| 97 | | | | | | 10-K | | 97 | | 2/27/2024 |
| | | | | | | | | | |
| 101 | | The following financial information from the Company’s Annual Report on Form 10-K for the year ended December 31, 2024 formatted in Inline Extensible Business Reporting Language (iXBRL) includes: (i) Cover Page, (ii) Consolidated Balance Sheets, (iii) Consolidated Statements of Income, (iv) Consolidated Statements of Comprehensive Income, (v) Consolidated Statements of Stockholders’ Equity, (vi) Consolidated Statements of Cash Flows, and (vii) Notes to Consolidated Financial Statements, tagged in summary and in detail. | | X | | | | | | |
| 104 | | Cover Page Interactive Data File (formatted as iXBRL and contained in Exhibit 101) | | X | | | | | | |
(1)Certain confidential portions of this exhibit were omitted by means of marking such portions with brackets because the confidential portions (i) are not material and (ii) would be competitively harmful if publicly disclosed.
(2)Material contracts are management contracts, or compensatory plans or arrangements, in which directors or executive officers are eligible to participate.
(3)Exhibit is furnished herewith and shall not be deemed filed for purposes of Section 18 of the Securities Exchange Act of 1934, as amended, or otherwise subject to the liability of that section, and shall not be deemed to be incorporated by reference into any filing under the Securities Act of 1933, as amended, or the Securities Exchange Act of 1934, as amended.
ITEM 16. FORM 10-K SUMMARY
Not applicable.
SIGNATURES
Pursuant to the requirements of Section 13 or 15(d) of the Securities Exchange Act of 1934, the registrant has duly caused this report to be signed on its behalf by the undersigned, thereunto duly authorized, on March 3, 2025.
| | | | | | | | |
| | WEBSTER FINANCIAL CORPORATION |
| | |
| By | /s/ John R. Ciulla |
| | John R. Ciulla |
| | Chairman and Chief Executive Officer |
| | |
Pursuant to the requirements of the Securities Exchange Act of 1934, this report has been signed below by the following persons on behalf of the registrant and in the capacities indicated on March 3, 2025. | | | | | | | | |
| Signature: | | Title: |
| |
| /s/ John R. Ciulla | | Chairman and Chief Executive Officer |
| John R. Ciulla | | (Principal Executive Officer) |
| |
| /s/ Neal Holland | | Executive Vice President and Chief Financial Officer |
| Neal Holland | | (Principal Financial Officer) |
| |
| /s/ Albert J. Wang | | Executive Vice President and Chief Accounting Officer |
| Albert J. Wang | | (Principal Accounting Officer) |
| | |
| /s/ Richard O’Toole | | Lead Independent Director |
| Richard O'Toole | | |
| | |
| /s/ Mona Aboelnaga Kanaan | | Director |
| Mona Aboelnaga Kanaan | | |
| | |
| /s/ William L. Atwell | | Director |
| William L. Atwell | | |
| | |
| /s/ John P. Cahill | | Director |
| John P. Cahill | | |
| | |
| /s/ William D. Haas | | Director |
| William D. Haas | | |
| | |
| /s/ E. Carol Hayles | | Director |
| E. Carol Hayles | | |
| | |
| /s/ Maureen B. Mitchell | | Director |
| Maureen B. Mitchell | | |
| | |
| /s/ Laurence C. Morse | | Director |
| Laurence C. Morse | | |
| | | | | | | | |
| |
| /s/ Mark Pettie | | Director |
| Mark Pettie | | |
| |
| /s/ Lauren C. States | | Director |
| Lauren C. States | | |
| |
| /s/ William E. Whiston | | Director |
| William E. Whiston | | |