
Fiscal 2006 4th Quarter Earnings Call
1

All statements in this information other than historical facts are forward-
looking statements which involve risks and uncertainties, and which are subject to
change at any time. Such statements are based on our current expectations. We
undertake no obligation to update such statements to reflect new information, events
or otherwise. In addition to the assumptions and other factors referred to in this
information, cautionary factors set forth in our public filings with the Securities and
Exchange Commission, among others, could cause actual results to differ materially
from those currently contemplated.
Non-GAAP Measures: The company from time to time refers to various
non-GAAP financial measures. We believe that this information is useful to
understanding the operating results and ongoing performance of our underlying
businesses. See our public filings with the SEC or the investor relations section of
our website www.joyglobal.com for reconciliations of material non-GAAP financial
measures to their related GAAP measures.
Forward-Looking Statements & Non-
GAAP Measures
2

Solid Growth in Fiscal 2006
($ in millions)
FY2006
FY2005
% CHANGE
New Orders
$2,589
$2,291
13.0%
Net Sales
$2,402
$1,927
24.6%
Gross Profit Margin
31.4%
29.2%
Operating Income
$442
$267
65.5%
EBITDA
$484
$307
57.7%
Diluted EPS
$2.50
$1.20
108.3%
Free Cash Flow
$287
$187
53.5%
3
2.
Note 1. Excluding reversal effects of U.S. Federal Tax Valuation Reserve, or $0.88 per share
Note 2. EBITDA, less cash taxes, CAPEX, interest expense and changes in non-cash working capital
1.
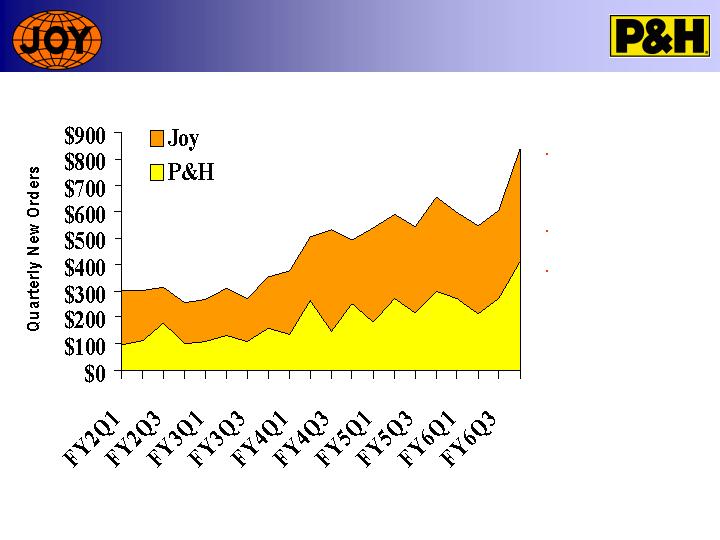
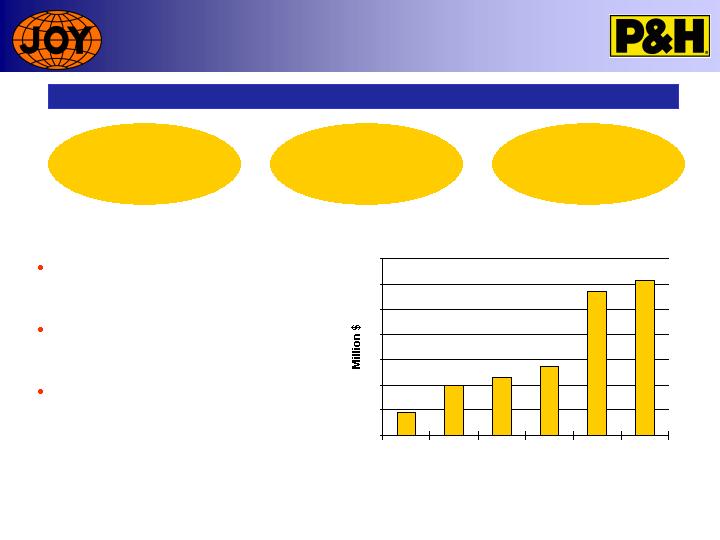
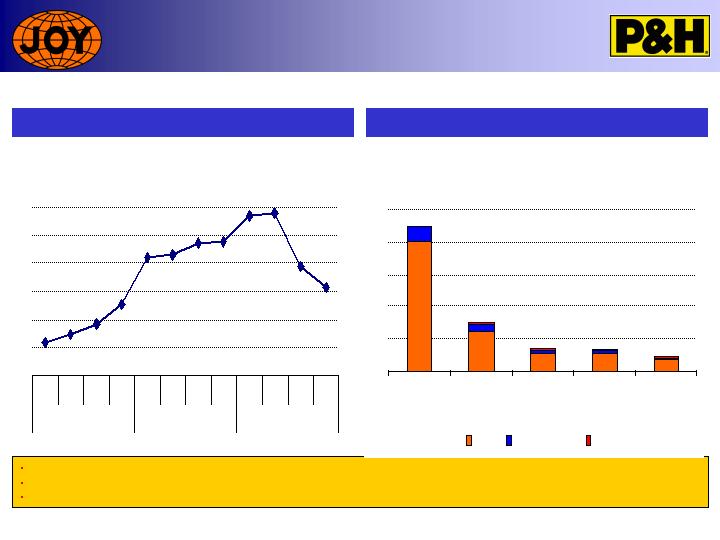
Cycle Continuing to Develop
Q4 new orders very
strong, but
“lumpiness” will
continue
$836 million of total
orders in Q4
Aftermarket remains
strong with 15%
increase in bookings –
14 th consecutive
quarter of double-
digit growth.
Million $
4
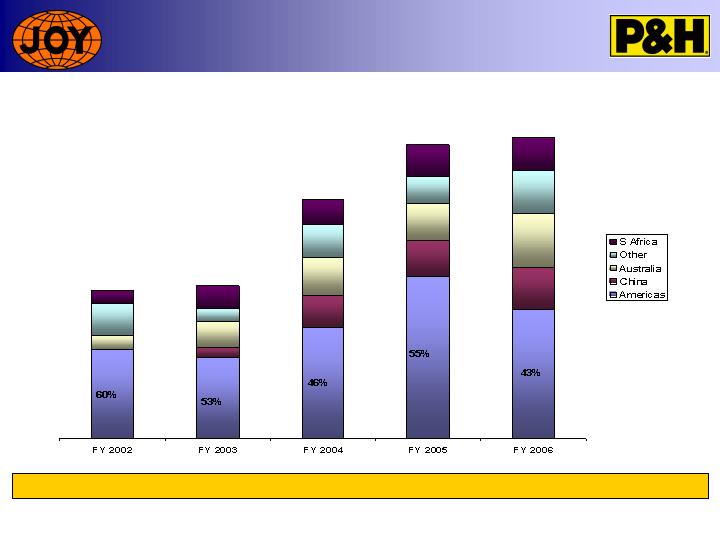
Joy Mining Booking Trends
By Geography
Current softness in U.S. underground coal more than offset by new order growth in other markets
5

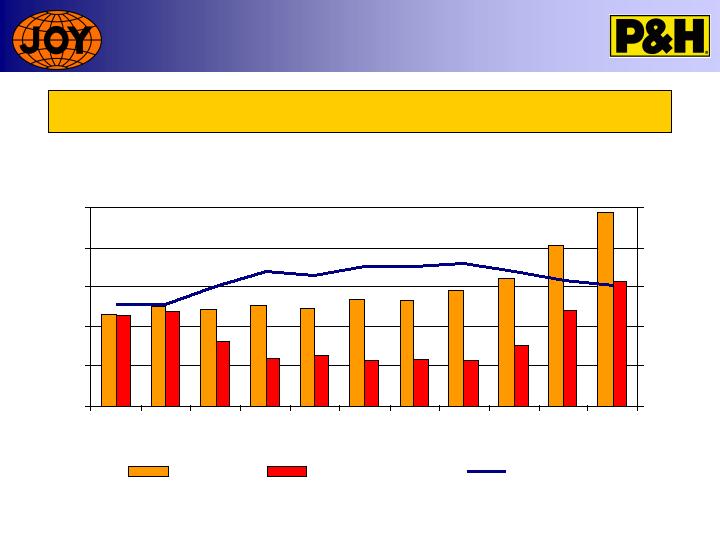
Surface Commodity Diversification
Strength
4th Qtr. Unit Shovel Orders
Fiscal 2006 Unit Shovel Orders
Near-term softness in U.S. coal markets having no noticeable effect on strong original
equipment order rates at P&H Mining Equipment!
6
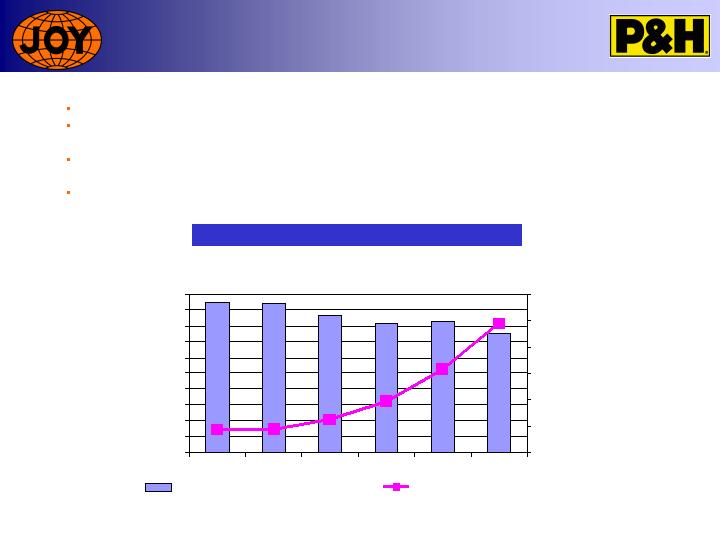
Our aftermarket business has grown rapidly again in fiscal 2006, increasing by more than
20% for the second consecutive year!
Aftermarket Growth Continues
Sales in
Million $
AM Sales
%
7
$0
$300
$600
$900
$1,200
$1,500
1996
1997
1998
1999
2000
2001
2002
2003
2004
2005
2006
0%
20%
40%
60%
80%
100%
Aftermarket
Original Equipment
AM Sales %
International 50%
U.S. 50%
Aftermarket 2/3
O.E. 1/3
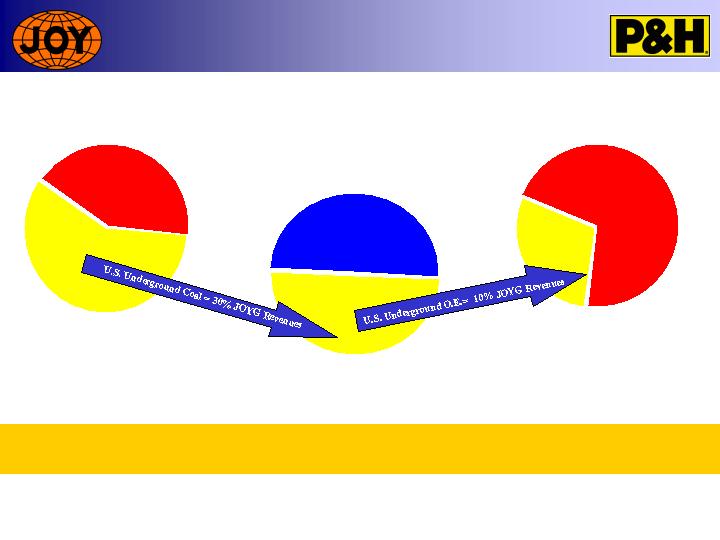
Representative Effects of Slowdown in
U.S. Coal
Revenue Mix
Geographic Mix
% Contribution to Revenues
P&H Mining 40%
Joy Mining 60%
Overall, U.S. underground original equipment business represents only 10% of
“normalized” JOYG revenues
8
0
50
100
150
200
250
300
350
2001
2002
2003
2004
2005
2006
9
Emerging Markets Strategy
Develop
Local
Resources
Build
Aftermarket
Revenues
Foundation
Customers
Emerging markets sales totaled $307
mm in fiscal 2006, or 13% of JOYG total
revenues.
Continue to expect $500MM in annual
revenues from China alone by fiscal
2010
Expansion of Baotou facility,
development of Tianjin, China facility and
Polish service center underway -
Russian service center being upgraded
% of Total 4% 9% 10% 10% 15% 13%
Emerging Markets Growth Opportunity
Joy Global’s Emerging Market Sales
Capacity Continues to Increase
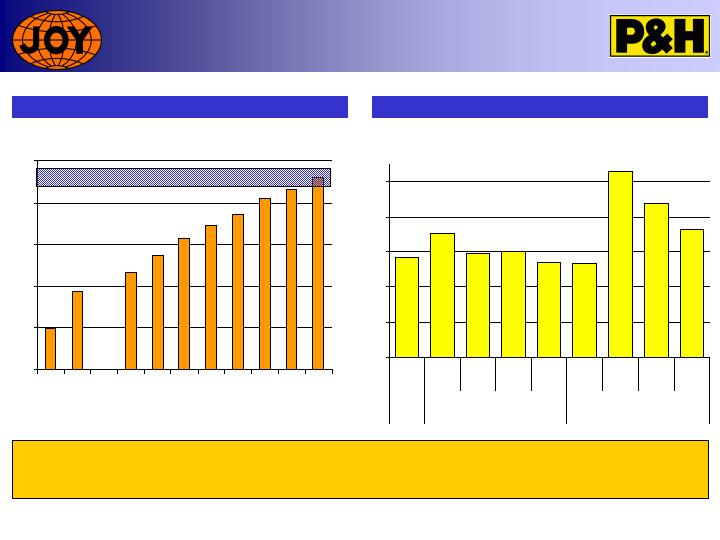
Overall OE production levels will continue to increase (Milwaukee & Tianjin)
Commitment to high level of aftermarket support continues to limit growth in OE
shipping levels
De-bottlenecking approach to capacity expansion minimizes roofline additions and
fixed cost base
Next 12 month JOYG revenue growth forecasted at 13-25% overall
Revenue Per Square Foot
Thousand Square
Feet
-
500
1,000
1,500
2,000
2,500
3,000
3,500
4,000
4,500
5,000
2001
2002
2003
2004
2005
2006
150
250
350
450
550
650
750
Manufacturing Capacity - Square Foot
Revenue Per Square Foot
10
EBIT Performance Marches Higher and
Incremental Profitability Remains Strong
LTM EBIT %
Quarterly Incremental Profitability
EBIT performance is in target range. Outstanding incremental performance again in Q4. Fiscal 2007
results anticipated to be at low end of incremental target range with more challenging comparables,
acquisition related non-cash charges and revenue mix contributing to this anticipation.
0%
4%
8%
12%
16%
20%
FY03
FY04
F5Q1
F5Q2
F5Q3
FY05
F6Q1
F6Q2
F6Q3
FY06
11
Target Range
0%
10%
20%
30%
40%
50%
Q1
Q2
Q3
Q4
Q1
Q2
Q3
Q4
FY04
FY05
FY06
Target Range
Strong ROIC and W.C. Velocity
Performance
ROIC
W.C. Velocity
Although working capital velocity performance slipped slightly in fiscal 2006, overall strength in
this metric contributes to cash flow generation which contributes to high ROIC performance due to
commitment of returning excess cash to shareholders
1.
Note 1. Excluding reversal effects of U.S. Federal Tax Valuation Reserves
12
(million)
FY2005
FY2006
OUTLOOK
COMMENTS
OP plus deprec/amort
$306.8
$483.7
$570-635
Current 12-month guidance
(-) Net Cash Interest
(16.5)
(4.6)
(20) – (25)
Effect of bond placement
(-) Cash Taxes
(14.4)
(37.9)
(50) – (75)
10-15% cash tax rate
(-) Change in Working Capital
(50.6)
(104.7)
(60) – (120)
Solid W/C control required
(-) Capital Expenditures
(38.8)
(49.1)
(55) – (70)
Expect CAPEX at 2-2.5%+ of sales
Free Cash Flow
$186.5
$287.4
$280-450
Shares Outstanding
121.8
117.5
110
13
Current 12-month guidance continues to provide for free cash flow in the range of 10-
15% of the increased revenue forecast – key remains the control of working capital!
Maintaining Attractive
Free Cash Flow

Return of Cash to Shareholders
Increased Dramatically in FY06
Quarterly Dividends
Quarterly Share Repurchase - FY 2006
$/sh.
Million
$
Note: As of December 15th ,
$210 million additional
buybacks in FY07Q1
14
0
0.02
0.04
0.06
0.08
0.1
0.12
0.14
0.16
Q1
04
Q2
04
Q3
04
Q4
04
Q1
05
Q2
05
Q3
05
Q4
05
Q1
06
Q2
06
Q3
06
Q4
06
Q1
07
-
5
10
15
20
Dividend Payout
Dividend Per Share
$197M
Q3
$27M
Q2
$10M
Q1
$61M
Q4
Reduced Outstanding Shares and
Equity Grants
Actual O/S Shares
Equity Grants
Million
Shares
112
114
116
118
120
122
124
Q1
Q2
Q3
Q4
Q1
Q2
Q3
Q4
Q1
Q2
Q3
Q4
FY04
FY05
FY06
15
Creditor’s Committee allocated 10% equity pool (11.25M shares) which were distributed by FY03
Each annual equity grant in last 3 years approximating 1% of outstanding
Less than 113 million shares outstanding on December 15th
0
2
4
6
8
10
FY2001-02
FY03
FY04
FY05
FY06
Options
Performance Units
Others
Million
Shares

Notes:
Uncertainly of effects from near-term softness in U.S. coal influencing overall
revenue guidance range
Stamler impact of 5% percentage points of revenue growth, and $11M
amortization costs
Strong operating performance continues to drive EBIT sales percent in the
“high teens” targeted range
EPS affected by higher interest costs offset by lower total outstanding shares
Tax rate assumed in FY07 of 33%
FY06 EPS excludes discreet tax credits
Summary of Forward Guidance
($ in millions)
FY2007
FY2006
CHANGE
Net Sales
$2,700-3,000
2,402
$
12.5-25.0%
Operating Income
$510-570
442
$
15-30%
Gross Profit Margin
31.7%
31.4%
Diluted EPS
$2.85-3.25
2.50
$
14-31%
16
Increased Q4 Earnings Guidance
A
A – EPS excludes discrete tax adjustments
17
------ Guidance Given ------
------- Actual Results -------
Sales(B)
Oper E(M)
EPS
Sales(B)
Oper E(M)
EPS
FY02 - Total Year
1.20-1.35
---
---
1.15
(15)
(0.25)
FY03 - Total Year
1.10-1.20
---
---
1.22
48
0.17
FY04 - Total Year
1.25-1.40
72-97
.27-.40
1.43
108
0.46
FY04 Q2 - FY05 Q1
1.30-1.50
80-105
.29-.47
1.53
142
0.63
FY04 Q3 - FY05 Q2
1.45-1.65
105-130
.45-.60
1.68
185
0.79
FY04 Q4 - FY05 Q3
1.60-1.80
137-165
.60-.75
1.82
229
0.92
FY05 - Total Year
1.70-1.90
165-195
.75-.91
1.93
267
1.20
FY05 Q2 - FY06 Q1
1.90-2.10
228-258
1.10-1.27
2.11
315
1.50
FY05 Q3 - FY06 Q2
2.00-2.20
265-295
1.33-1.50
2.20
361
1.80
FY05 Q4 - FY06 Q3
2.15-2.35
315-365
1.60-1.87
2.29
398
2.18
FY06 - Total Year
2.25-2.45
360-410
1.85-2.15
2.40
442
2.50
FY06 Q2 - FY07 Q1
2.35-2.55
385-435
2.05-2.35
---
---
---
FY06 Q3 - FY07 Q2
2.50-2.70
440-490
2.40-2.70
---
---
---
FY06 Q4 - FY07 Q3
2.65-2.95
470-550
2.60-2.95
---
---
---
FY07 - Total Year
2.70-3.00
510-575
2.85-3.25
---
---
---
14th straight quarter of increased guidance – specific issues considered this quarter in addition to normal guidance
deliberations included; a) effects of near-term softness in U.S. coal versus continued strength in overall markets, b)
Stamler adjustments and estimated effects, and c) forecasted effects of stock buyback program in fiscal 2007

Fiscal 2006 4th Quarter Earnings Call
18