UNITED STATES
SECURITIES AND EXCHANGE COMMISSION
Washington, D.C. 20549
Form N-CSR
CERTIFIED SHAREHOLDER REPORT OF REGISTERED MANAGEMENT
INVESTMENT COMPANIES
Investment Company Act File Number 811-04847
ECLIPSE FUNDS
(Exact name of Registrant as specified in charter)
51 Madison Avenue, New York, NY 10010
(Address of principal executive offices) (Zip code)
J. Kevin Gao, Esq.
169 Lackawanna Avenue
Parsippany, New Jersey 07054
(Name and address of agent for service)
Registrant’s telephone number, including area code: (212) 576-7000
Date of fiscal year end: October 31
Date of reporting period: October 31, 2011
Form N-CSR
Item 1. Reports to Stockholders.
MainStay Balanced Fund
Message from the President and Annual Report
October 31, 2011
This page intentionally left blank
Message from the President
Volatility was the keynote of the 12 months ended October 31, 2011. U.S. stocks generally advanced, but a variety of domestic and international forces influenced the market.
Early in November 2010, the Federal Open Market Committee (FOMC) announced its intention to extend quantitative easing by purchasing additional longer-term Treasury securities. The stock market reacted positively to this news—and to the midterm elections—and stocks generally advanced through mid-February.
Beginning in December 2010, a wave of protests and civil unrest across North Africa and the Middle East led to a substantial rise in the price of oil. By mid-February, stock prices started to decline. In March, a major earthquake and tsunami in Japan caused manufacturing supply-line interruptions and further setbacks for equity investors. After a sharp decline and a rapid recovery, stocks reached their high point for the 12-month period at the end of April 2011.
Pressed by a weak economy, lackluster employment and widespread concerns about European sovereign debt, the stock market faced wide fluctuations in the coming months. The volatility included a precipitous decline at the end of July into early August. Shortly thereafter, the FOMC expressed its expectation that economic conditions were “likely to warrant exceptionally low levels for the federal funds rate at least through mid-2013.”
After several unsuccessful attempts to recover from their dramatic drop, U.S. stocks reached their low point for the reporting period in early October. Then, buoyed by positive economic data and progress in the European debt situation, the U.S. stock market advanced rapidly in October, to close the reporting period with its best monthly performance in nearly a decade.
International stocks suffered from the turmoil in the Middle East and North Africa, the natural disasters in Japan, the sovereign debt concerns in Europe and the added threat of an economic slowdown in China. For the 12-month period, international stocks declined overall, with particular weakness in Europe.
The bond markets felt the impact of the European debt crisis, and several European nations suffered downgrades. In July, the United States faced a congressional deadlock on raising the debt ceiling and reducing deficit spending. In early August, Standard & Poor’s downgraded the debt of the United States of America to AA+.
Slow progress in resolving the European debt situation led to a flight to quality (or a movement toward securities perceived to carry lower risk). Amid strong demand, U.S. Treasury securities saw prices rise and yields decline, despite the downgrade by Standard & Poor’s. High-grade corporate
bonds also benefited; and among high-yield credits, higher-rated issues advanced relative to lower-rated issues, which generally carry higher levels of risk. Toward the end of the reporting period, the high-yield market as a whole recovered as the stock market rose.
Throughout the 12-month reporting period, our portfolio managers took note of shifting market forces. But their primary focus was on the investment objectives of their respective Funds and the long-term strategies they were pursuing to achieve them. Some may have sought to capitalize on day-to-day market inefficiencies, but all remained focused on the long-term interests of our shareholders. They sought to apply time-tested investment principles consistently throughout the reporting period.
The information that follows provides specifics about the securities, decisions and market forces that affected your MainStay Fund(s) during the 12 months ended October 31, 2011. Behind the details, we hope you’ll recognize the professionalism and discipline that guided our portfolio managers during this volatile period.
We thank you for investing with MainStay and look forward to serving you for many years to come.
Sincerely,
Stephen P. Fisher
President
Not part of the Annual Report
Table of Contents
| | | |
| Annual Report | | |
| |
| |
| Investment and Performance Comparison | | 5 |
| |
| |
| Portfolio Management Discussion and Analysis | | 9 |
| |
| |
| Portfolio of Investments | | 12 |
| |
| |
| Financial Statements | | 24 |
| |
| |
| Notes to Financial Statements | | 31 |
| |
| |
| Report of Independent Registered Public Accounting Firm | | 39 |
| |
| |
| Federal Income Tax Information | | 40 |
| |
| |
| Proxy Voting Policies and Procedures and Proxy Voting Record | | 40 |
| |
| |
| Shareholder Reports and Quarterly Portfolio Disclosure | | 40 |
| |
| |
| Board Members and Officers | | 41 |
| |
| |
Investors should refer to the Fund’s Summary Prospectus and/or Prospectus and consider the Fund’s investment objectives, strategies, risks, charges and expenses carefully before investing. The Summary Prospectus and/or Prospectus contain this and other information about the Fund. You may obtain copies of the Fund’s Summary Prospectus, Prospectus and Statement of Additional Information free of charge, upon request, by calling toll-free 800-MAINSTAY (624-6782), by writing to NYLIFE Distributors LLC, Attn: MainStay Marketing Department, 169 Lackawanna Avenue, Parsippany, New Jersey 07054 or by sending an e-mail to MainStayShareholderServices@nylim.com. These documents are also available via the MainStay Funds’ website at mainstayinvestments.com/documents. Please read the Summary Prospectus and/or Prospectus carefully before investing.
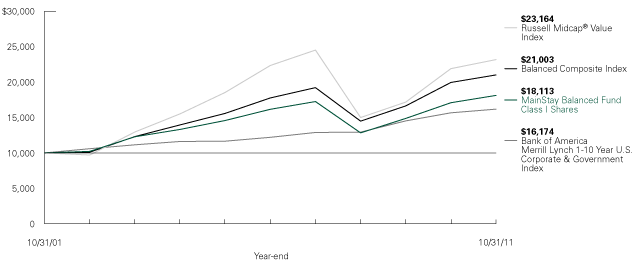
Investment and Performance Comparison1 (Unaudited)
Performance data quoted represents past performance. Past performance is no guarantee of future results. Because of market volatility, current performance may be lower or higher than the figures shown. Investment return and principal value will fluctuate, and as a result, when shares are redeemed, they may be worth more or less than their original cost. The graph below depicts the historical performance of Class I shares of the Fund. Performance will vary from class to class based on differences in class-specific expenses and sales charges. For performance information current to the most recent month-end, please call 800-MAINSTAY (624-6782) or visit mainstayinvestments.com.
Average Annual Total Returns for the Year Ended October 31, 2011
| | | | | | | | | | | | | | | | | | | | | |
| | | | | | | | | | | | | Gross
|
| | | | | | | | | | | | | Expense
|
| Class | | Sales Charge | | | | One Year | | Five Years | | Ten Years | | Ratio2 |
| |
| |
Investor Class Shares3 | | Maximum 5.5% Initial Sales Charge | | With sales charges | | | –0 | .19% | | | 0 | .73% | | | 5 | .11% | | | 1 | .45% |
| | | | | Excluding sales charges | | | 5 | .62 | | | 1 | .88 | | | 5 | .70 | | | 1 | .45 |
| |
| |
Class A Shares4 | | Maximum 5.5% Initial Sales Charge | | With sales charges | | | –0 | .03 | | | 0 | .85 | | | 5 | .17 | | | 1 | .26 |
| | | | | Excluding sales charges | | | 5 | .79 | | | 2 | .00 | | | 5 | .76 | | | 1 | .26 |
| |
| |
Class B Shares4 | | Maximum 5% CDSC | | With sales charges | | | –0 | .17 | | | 0 | .75 | | | 4 | .92 | | | 2 | .20 |
| | | if Redeemed Within the First Six Years of Purchase | | Excluding sales charges | | | 4 | .83 | | | 1 | .11 | | | 4 | .92 | | | 2 | .20 |
| |
| |
Class C Shares5 | | Maximum 1% CDSC | | With sales charges | | | 3 | .83 | | | 1 | .11 | | | 4 | .92 | | | 2 | .20 |
| | | if Redeemed Within One Year of Purchase | | Excluding sales charges | | | 4 | .83 | | | 1 | .11 | | | 4 | .92 | | | 2 | .20 |
| |
| |
| Class I Shares | | No Sales Charge | | | | | 6 | .04 | | | 2 | .32 | | | 6 | .12 | | | 1 | .01 |
| |
| |
Class R1 Shares4 | | No Sales Charge | | | | | 5 | .94 | | | 2 | .21 | | | 6 | .01 | | | 1 | .11 |
| |
| |
Class R2 Shares4 | | No Sales Charge | | | | | 5 | .68 | | | 1 | .96 | | | 5 | .74 | | | 1 | .36 |
| |
| |
Class R3 Shares6 | | No Sales Charge | | | | | 5 | .47 | | | 1 | .71 | | | 5 | .49 | | | 1 | .60 |
| |
| |
| |
| 1. | The performance table and graph do not reflect the deduction of taxes that a shareholder would pay on distributions or Fund-share redemptions. Total returns reflect maximum applicable sales charges as indicated in the table above, change in share price, and reinvestment of dividend and capital gain distributions. The graph assumes the initial investment amount shown above and reflects the deduction of all sales charges that would have applied for the period of investment. Performance figures reflect certain fee waivers and/or expense limitations, without which total returns may have been lower. For more information on share classes and current fee waivers and/or expense limitations, please refer to the notes to the financial statements. |
| |
| 2. | The gross expense ratios presented reflect the Fund’s “Total Annual Fund Operating Expenses” from the most recent Prospectus and may differ from other expense ratios disclosed in this report. |
| 3. | Performance figures for Investor Class shares, first offered on February 28, 2008, include the historical performance of Class A shares through February 27, 2008, adjusted for differences in certain expenses and fees. Unadjusted, the performance shown for Investor Class shares might have been lower. |
| 4. | Performance figures for Class A, B, R1 and R2 shares, first offered on January 2, 2004, include the historical performance of Class I shares through January 1, 2004, adjusted for differences in certain expenses and fees. Unadjusted, the performance shown for Class A, B, R1 and R2 shares might have been lower. |
| 5. | Performance figures for Class C shares, first offered on January 2, 2004, include the historical performance of L Class shares (which were redesignated as Class C shares on January 2, 2004) through January 1, 2004, and the historical performance of Class I shares through December 29, 2002, adjusted for differences in certain expenses and fees. Unadjusted, the performance shown for Class C shares might have been lower. |
| 6. | Performance figures for Class R3 shares, first offered on April 28, 2006, include the historical performance of Class I shares through April 27, 2006, |
The footnotes on the next page are an integral part of the table and graph and should be carefully read in conjunction with them.
mainstayinvestments.com 5
| | | | | | | | | | | | | |
| | | One
| | Five
| | Ten
|
Benchmark Performance
| | Year | | Years | | Years |
| |
Russell Midcap® Value Index7 | | | 5 | .83% | | | 0 | .73% | | | 8 | .76% |
| |
| |
Balanced Composite Index8 | | | 5 | .34 | | | 3 | .42 | | | 7 | .70 |
| |
| |
Bank of America Merrill Lynch 1-10 Year U.S. Corporate & Government Index9 | | | 3 | .30 | | | 5 | .80 | | | 4 | .93 |
| |
| |
Average Lipper Mixed-Asset Target Allocation Growth Fund10 | | | 3 | .51 | | | 1 | .44 | | | 4 | .39 |
| |
| |
| |
| adjusted for differences in certain expenses and fees. Unadjusted, the performance shown for Class R3 shares might have been lower. |
| |
| 7. | The Russell Midcap® Value Index measures the performance of the mid-cap value segment of the U.S. equity universe. It includes those Russell Midcap® Index companies with lower price-to-book ratios and lower forecasted growth values. The Russell Midcap® Value Index is the Fund’s broad-based securities market index for comparison purposes. Total returns assume reinvestment of all dividends and capital gains. An investment cannot be made directly in an index. |
| 8. | The Balanced Composite Index is comprised of the Russell Midcap® Value Index and the Bank of America Merrill Lynch 1-10 Year U.S. Corporate & Government Index weighted 60%/40%, respectively. The Balanced Composite Index is the Fund’s secondary benchmark. Total returns assume reinvestment of all income and capital gains. An investment cannot be made directly in an index. |
| 9. | The Bank of America Merrill Lynch 1-10 Year U.S. Corporate & Government Index is a market capitalization-weighted index including U.S. government and fixed coupon domestic investment grade corporate bonds with at least $100 million par amount outstanding. Total returns assume reinvestment of all income and capital gains. An investment cannot be made directly in an index. |
| 10. | The average Lipper mixed-asset target allocation growth fund is representative of funds that, by portfolio practice, maintain a mix of between 60%-80% equity securities, with the remainder invested in bonds, cash, and cash equivalents. This benchmark is a product of Lipper Inc. Lipper Inc. is an independent monitor of fund performance. Results are based on average total returns of similar funds with all dividend and capital gain distributions reinvested. |
The footnotes on the preceding page are an integral part of the table and graph and should be carefully read in conjunction with them.
6 MainStay Balanced Fund
Cost in Dollars of a $1,000 Investment in MainStay Balanced Fund (Unaudited)
The example below is intended to describe the fees and expenses borne by shareholders during the six-month period from May 1, 2011, to October 31, 2011, and the impact of those costs on your investment.
Example
As a shareholder of the Fund, you incur two types of costs: (1) transaction costs, including exchange fees and sales charges (loads) on purchases (as applicable), and (2) ongoing costs, including management fees, distribution and/or service (12b-1) fees, and other Fund expenses (as applicable). This example is intended to help you understand your ongoing costs (in dollars) of investing in the Fund and to compare these costs with the ongoing costs of investing in other mutual funds. The example is based on an investment of $1,000 made at the beginning of the six-month period and held for the entire period from May 1, 2011, to October 31, 2011.
This example illustrates your Fund’s ongoing costs in two ways:
Actual Expenses
The second and third data columns in the table below provide information about actual account values and actual expenses. You may use the information in these columns, together with the amount you invested, to estimate the expenses that you paid during the six months ended October 31, 2011. Simply divide your account value by $1,000 (for example, an $8,600 account value divided by $1,000 = 8.6), then multiply the result by the number under the heading entitled “Expenses Paid During Period” to estimate the expenses you paid on your account during this period.
Hypothetical Example for Comparison Purposes
The fourth and fifth data columns in the table below provide information about hypothetical account values and hypothetical expenses based on the Fund’s actual expense ratio and an assumed rate of return of 5% per year before expenses, which is not the Fund’s actual return. The hypothetical account values and expenses may not be used to estimate the actual ending account balances or expenses you paid for the six-month period shown. You may use this information to compare the ongoing costs of investing in the Fund with the ongoing costs of investing in other Funds. To do so, compare this 5% hypothetical example with the 5% hypothetical examples that appear in the shareholder reports of the other Funds.
Please note that the expenses shown in the table are meant to highlight your ongoing costs only and do not reflect any transactional costs, such as exchange fees or sales charges (loads). Therefore, the fourth and fifth data columns of the table are useful in comparing ongoing costs only and will not help you determine the relative total costs of owning different funds. In addition, if these transactional costs were included, your costs would have been higher.
| | | | | | | | | | | | | | | | | | | | | | | |
| | |
| | | | | | | | | | | | | | Ending Account
| | | | |
| | | | | | | Ending Account
| | | | | | | Value (Based
| | | | |
| | | | | | | Value (Based
| | | | | | | on Hypothetical
| | | | |
| | | Beginning
| | | | on Actual
| | | Expenses
| | | | 5% Annualized
| | | Expenses
| |
| | | Account
| | | | Returns and
| | | Paid
| | | | Return and
| | | Paid
| |
| | | Value
| | | | Expenses)
| | | During
| | | | Actual Expenses)
| | | During
| |
| Share Class | | 5/1/11 | | | | 10/31/11 | | | Period1 | | | | 10/31/11 | | | Period1 | |
Investor Class Shares | | $ | 1,000.00 | | | | $ | 953.90 | | | $ | 6.65 | | | | $ | 1,018.40 | | | $ | 6.87 | |
| | | | | | | | | | | | | | | | | | | | | | | |
Class A Shares | | $ | 1,000.00 | | | | $ | 954.50 | | | $ | 5.76 | | | | $ | 1,019.30 | | | $ | 5.95 | |
| | | | | | | | | | | | | | | | | | | | | | | |
Class B Shares | | $ | 1,000.00 | | | | $ | 950.00 | | | $ | 10.32 | | | | $ | 1,014.60 | | | $ | 10.66 | |
| | | | | | | | | | | | | | | | | | | | | | | |
Class C Shares | | $ | 1,000.00 | | | | $ | 950.00 | | | $ | 10.32 | | | | $ | 1,014.60 | | | $ | 10.66 | |
| | | | | | | | | | | | | | | | | | | | | | | |
Class I Shares | | $ | 1,000.00 | | | | $ | 955.80 | | | $ | 4.54 | | | | $ | 1,020.60 | | | $ | 4.69 | |
| | | | | | | | | | | | | | | | | | | | | | | |
Class R1 Shares | | $ | 1,000.00 | | | | $ | 955.30 | | | $ | 5.03 | | | | $ | 1,020.10 | | | $ | 5.19 | |
| | | | | | | | | | | | | | | | | | | | | | | |
Class R2 Shares | | $ | 1,000.00 | | | | $ | 954.00 | | | $ | 6.25 | | | | $ | 1,018.80 | | | $ | 6.46 | |
| | | | | | | | | | | | | | | | | | | | | | | |
Class R3 Shares | | $ | 1,000.00 | | | | $ | 953.10 | | | $ | 7.48 | | | | $ | 1,017.50 | | | $ | 7.73 | |
| | | | | | | | | | | | | | | | | | | | | | | |
| |
| 1. | Expenses are equal to the Fund’s annualized expense ratio of each class (1.35% for Investor Class, 1.17% for Class A, 2.10% for Class B and Class C, 0.92% for Class I, 1.02% for Class R1, 1.27% for Class R2 and 1.52% for Class R3) multiplied by the average account value over the period, divided by 365 and multiplied by 184 (to reflect the one-half year period). The table above represents the actual expenses incurred during the one-half year period. |
mainstayinvestments.com 7
Portfolio Composition as of October 31, 2011 (Unaudited)
| | | | | |
Common Stocks | | 61.5 | |
| U.S. Government & Federal Agencies | | | 24.90 | |
| Corporate Bonds | | | 9.30 | |
| Yankee Bonds | | | 2.90 | |
| Short-Term Investments | | | 1.10 | |
| Exchange Traded Fund | | | 0.40 | |
| Foreign Government Bonds | | | 0.20 | |
| Asset-Backed Security | | | 0.10 | |
| Medium Term Note | | | 0.10 | |
| Convertible Bond | | | 0.00 | |
| Other Assets, Less Liabilities | | | (0.50 | ) |
See Portfolio of Investments beginning on page 12 for specific holdings within these categories.
| |
| ‡ | Less than one-tenth of a percent. |
Top Ten Holdings or Issuers Held as of October 31, 2011 (excluding short-term investments)
| | | |
| 1. | | United States Treasury Notes, 0.125%–2.25%,
due 5/31/13–8/15/21 |
| 2. | | Federal National Mortgage Association, 0.50%–2.75%,
due 8/9/13–11/15/16 |
| 3. | | Federal Home Loan Mortgage Corp., 0.375%–2.00%, due 10/30/13–8/25/16 |
| 4. | | Verizon Communications, Inc. |
| | | |
| 5. | | Federal Home Loan Bank, 1.375%–5.50%,
due 5/28/14–8/13/14 |
| 6. | | Consolidated Edison, Inc. |
| 7. | | AT&T, Inc. |
| 8. | | Annaly Capital Management, Inc. |
| 9. | | Bank of America Corp. |
| 10. | | Lorillard, Inc. |
8 MainStay Balanced Fund
Portfolio Management Discussion and Analysis (Unaudited)
Questions answered by portfolio managers Jae S. Yoon, CFA, and Thomas J. Girard of New York Life Investments,1 the Fund’s Manager, and Harvey J. Fram of Madison Square Investors LLC, the Fund’s Subadvisor.
How did MainStay Balanced Fund perform relative to its peers and its benchmark during the 12 months ended October 31, 2011?
Excluding all sales charges, MainStay Balanced Fund returned 5.62% for Investor Class shares, 5.79% for Class A shares and 4.83% for both Class B and Class C shares for the 12 months ended October 31, 2011. Over the same period, Class I shares returned 6.04%, Class R1 shares returned 5.94%, Class R2 shares returned 5.68% and Class R3 shares returned 5.47%. All share classes outperformed the 3.51% return of the average Lipper2 mixed-asset target allocation growth fund. ClassI and Class R1 shares outperformed—and all other share classes underperformed—the 5.83% return of the Russell Midcap® Value Index3 for the 12 months ended October 31, 2011. The Russell Midcap® Value Index is the Fund’s broad-based securities-market index. All share classes outperformed the 3.30% return of the Bank of America Merrill Lynch 1–10 Year U.S. Corporate & Government Index.4 The Bank of America Merrill Lynch 1–10 Year U.S. Corporate & Government Index is an additional benchmark of the Fund. See page 5 for Fund returns with sales charges.
Were any changes made to the Fund’s day-to-day management during the reporting period?
Madison Square Investors continued to manage the equity portion of the Fund. However, effective January 1, 2011, Harvey Fram replaced Tony Elavia as portfolio manager for the equity portion of the Fund. New York Life Investments continued to serve as the Fund’s Manager overseeing the Fund’s investment portfolio, and effective January 1, 2011, Jae Yoon became an additional portfolio manager. Thomas Girard continues to serve as a portfolio manager of the fixed-income portion of the Fund.
What factors affected the Fund’s relative performance during the reporting period?
The Fund invests in a mix of stocks and bonds, while the Russell Midcap® Value Index consists entirely of mid-cap value stocks. The Fund had a sizable allocation to bonds, which underperformed the Russell Midcap® Value Index during the reporting period. It is not surprising, therefore, that most share classes of the Fund trailed the benchmark.
The equity portion of the Fund outperformed the Russell Midcap® Value Index from January 1, 2011, through October 31, 2011, primarily because of asset allocation to large-cap and mid-cap stocks and effective stock selection.
The fixed-income portion of the Fund underperformed the 3.30% return of the Bank of America Merrill Lynch 1–10 Year U.S. Corporate & Government Index during the 12 months ended October 31, 2011. The fixed-income portion of the Fund held overweight positions in investment-grade corporate bonds and commercial mortgage-backed securities (CMBS) for the majority of the first half of the reporting period. These sectors performed well during that portion of the reporting period, helping the fixed-income portion of the Fund outperform its benchmark from November 2010 through April 2011. The CMBS sector was the best-performing sector during this portion of the reporting period, followed by investment-grade corporate bonds. During the second half of the reporting period, however, investment-grade corporate bonds and CMBS performed poorly. The Fund was overweight those sectors at the start of the third quarter of 2011. Although the overweight positions in these sectors were reduced during the third quarter, the fixed-income portion of the Fund underperformed its benchmark during the second half of the reporting period because of poor performance in those sectors.
During the reporting period, which equity sectors were the strongest contributors to the Fund’s relative performance and which equity sectors were particularly weak?
The health care, information technology and industrials sectors were the leading contributors to the relative performance of the equity portion of the Fund. (Contributions take weightings and total returns into account.) In health care, many stocks—especially those in the managed care industry—had, in our view, performed poorly in the wake of health care reform legislation. We believed that those stocks had become extremely undervalued, and they rallied strongly during the reporting period. On the other hand, in the information technology and industrials sectors, underweight positions in stocks that performed poorly, such as First Solar and Ingersoll-Rand, helped relative performance.
The consumer discretionary, financials and energy sectors all detracted from relative performance in the equity portion of the Fund. In the consumer discretionary sector, underweight positions in stocks such as specialty retailer Limited Brands and restaurant company Chipotle Mexican Grill hurt performance, as those companies experienced strong earnings growth. Within financials, many of the large-cap stocks that were included in the equity portion of the Fund for risk control purposes, such as Bank of America, performed poorly. In energy, the equity portion of the Fund was hurt by not having positions in two companies for which pending acquisitions were announced: El Paso and Petrohawk Energy. Both stocks rose dramatically on the announcements.
1. New York Life Investments is a service mark used by New York Life Investment Management LLC.
2. See footnote on page 6 for more information on Lipper Inc.
3. See footnote on page 6 for more information on the Russell Midcap® Value Index.
4. See footnote on page 6 for more information on the Bank of America Merrill Lynch 1–10 Year U.S. Corporate & Government Index.
mainstayinvestments.com 9
During the reporting period, which individual stocks made the strongest contributions to absolute performance in the equity portion of the Fund and which stocks detracted the most?
In the equity portion of the Fund, the strongest individual contributions to absolute performance came from health maintenance organization (HMO) Humana, tobacco company Loril-lard and cell phone manufacturer Motorola Mobility Holdings. Humana’s stock had previously fallen on concerns about the impact of the 2010 health care legislation and showed a strong recovery. Lorillard benefited from market share gains. Motorola Mobility Holdings had been spun-off from the old Motorola, and Google later announced that it was purchasing the company.
The stocks that detracted the most from absolute performance in the equity portion of the Fund included semiconductor manufacturer Micron Technology, financial services company Bank of America and cell phone carrier Sprint Nextel. Micron suffered from falling prices and weakening demand for its commodity products. Bank of America was hurt by continued fallout from the mortgage crisis and by the sovereign debt crisis in Europe. Sprint Nextel faced competitive setbacks from its larger rivals.
Did the equity portion of the Fund make any significant purchases or sales during the reporting period?
The equity portion of the Fund purchased stocks in consumer staples company Conagra Foods and utility company Centerpoint Energy. Both of these companies are regarded as defensive, and both have higher-than-average dividend yields. Among the stocks the equity portion of the Fund sold during the reporting period were banking institution CIT Group and coal producer BTU Energy. CIT Group was sold because, in our view, the prospects for banks becoming profitable in the United States remained bleak. BTU Energy, which was purchased in January, was sold in April because we believed that the stock was expensive relative to other coal producers at a time when China’s appetite for coal appeared to be slowing.
How did the Fund’s equity sector weightings change during the reporting period?
During the reporting period, the equity portion of the Fund increased its overweight position relative to the Russell Midcap® Value Index in the consumer staples sector. We also increased the Fund’s equity exposure in the information technology sector as we found a number of undervalued stocks in the sector. Nevertheless, the Fund remained underweight relative to the benchmark in the sector. Over the same period, the Fund moved from an overweight to a benchmark-neutral weight in the health care sector as we cut back on a number of stocks that had risen dramatically. Similarly, we reduced the Fund’s overweight position in energy as that sector is susceptible to global economic weakness.
How was the equity portion of the Fund positioned at the end of the reporting period?
As of October 31, 2011, the equity portion of the Fund was moderately overweight relative to the Russell Midcap® Value Index in the financials and utilities sectors. As of the same date, the equity portion of the Fund was underweight relative to the benchmark in the information technology and materials sectors.
What was the duration strategy of the fixed-income portion of the Fund during the reporting period?
The duration of the fixed-income portion of the Fund varied over time but remained close to the duration of the Bank of America Merrill Lynch 1–10 Year U.S. Corporate & Government Index during the majority of the reporting period. The exception was during the second quarter of 2011, when the Fund held a shorter duration relative to the Fund’s fixed-income benchmark. Our view was that interest rates would rise during the second quarter. However, worse-than-anticipated economic data suggested that second quarter economic growth would be lower than the first quarter’s disappointing 0.4% growth rate. This shift in expectations, along with rising concerns over the European sovereign debt crisis, moved U.S. Treasury rates lower during the second quarter. As a result, the Fund’s shorter duration had a negative impact on returns of the fixed-income portion of the Fund during the quarter.
What specific factors, risks or market forces prompted significant decisions for the fixed-income portion of the Fund during the reporting period?
There were two periods where specific factors, risks and mar-ket forces prompted adjustments to the duration—and asset-allocation decisions—in the fixed-income portion of the Fund during the reporting period. During the second quarter of 2011, overweight positions in spread5 assets were reduced as U.S. economic activity slowed markedly and concerns over the European sovereign debt crisis grew more acute. The Fund’s shorter duration relative to the Bank of America Merrill Lynch 1–10 Year U.S. Corporate & Government Index was also returned to a more neutral position during the second quarter.
During the third quarter of 2011, we further reduced the Fund’s allocation to spread assets to an underweight position relative to the Bank of America Merrill Lynch 1–10 Year U.S. Corporate & Government Index. This resulted in an overweight position relative to the benchmark in U.S. Treasurys. The move reflected our assessment of the increasing systemic risk and concerns that potential tail events in the funding markets would cause further deterioration in the performance of spread assets.
5. The terms “spread” and “yield spread” may refer to the difference in yield between a security or type of security and comparable U.S. Treasury issues. The terms may also refer to the difference in yield between two specific securities or types of securities at a given time.
10 MainStay Balanced Fund
During the reporting period, which fixed-income market segments were the strongest contributors to the Fund’s performance and which market segments were particularly weak?
During the first half of the reporting period, our overweight positions in investment-grade corporate bonds and CMBS made the strongest positive contributions to the performance of the fixed-income portion of the Fund. (Contributions take weightings and total returns into account.) A shorter duration had the most adverse impact on the performance of the fixed-income portion of the Fund during this portion of the reporting period. During the second half of the reporting period, spread assets—specifically investment-grade corporate bonds and CMBS—had the most adverse impact on the fixed-income portion of the Fund.
Did the fixed-income portion of the Fund make any significant purchases or sales during the reporting period?
We made significant purchases and sales during the second and third quarters of 2011, when we modified the asset allocation of the fixed-income portion of the Fund. The purpose of these sales and purchases, in the aggregate, was to reduce overweight positions in spread assets and to increase the allocation to U.S. Treasury securities in the fixed-income portion of the Fund.
How did industry weightings change in the fixed-income portion of the Fund during the reporting period?
The Fund held overweight allocations in the financial and industrial subsectors of the corporate sector. These overweight allocations were maintained during the first half of the reporting period. During the second quarter of 2011—and predominantly within the third quarter—these subsector weightings were decreased from overweight positions to positions that were more in line with benchmark allocations.
How was the fixed-income portion of the Fund positioned at the end of the reporting period?
As of October 31, 2011, the fixed-income portion of the Fund was modestly underweight in the corporate and U.S. agency sectors relative to the Bank of America Merrill Lynch 1–10 Year U.S. Corporate & Government Index. As of the same date, the fixed-income portion of the Fund was modestly overweight in U.S. mortgage-backed securities and cash equivalents relative to this Index. The overall duration of the fixed-income portion of the Fund was neutral to the benchmark.
The opinions expressed are those of the portfolio managers as of the date of this report and are subject to change. There is no guarantee that any forecast made will come to pass. This material does not constitute investment advice and is not intended as an endorsement of any specific investment.
mainstayinvestments.com 11
Portfolio of Investments††† October 31, 2011
| | | | | | | | | |
| | | Principal
| | | | |
| | | Amount | | | Value | |
Long-Term Bonds 37.5%†
Asset-Backed Security 0.1% |
| |
Automobile 0.1% |
| Mercedes-Benz Auto Receivables Trust | | | | | | | | |
Series 2009-1, Class A3
1.67%, due 1/15/14 | | $ | 762,781 | | | $ | 767,669 | |
| | | | | | | | | |
Total Asset-Backed Security
(Cost $762,771) | | | | | | | 767,669 | |
| | | | | | | | | |
| Convertible Bond 0.0%‡ |
| |
Internet 0.0%‡ |
At Home Corp.
4.75%, due 12/31/49 (a)(b)(c)(d) | | | 177,810 | | | | 18 | |
| | | | | | | | | |
Total Convertible Bond
(Cost $13,325) | | | | | | | 18 | |
| | | | | | | | | |
| Corporate Bonds 9.3% |
| |
Aerospace & Defense 0.1% |
BAE Systems PLC
3.50%, due 10/11/16 (e) | | | 350,000 | | | | 350,625 | |
General Dynamics Corp.
2.25%, due 7/15/16 | | | 400,000 | | | | 409,893 | |
| | | | | | | | | |
| | | | | | | | 760,518 | |
| | | | | | | | | |
Banks 1.6% |
American Express Bank FSB
6.00%, due 9/13/17 | | | 625,000 | | | | 711,021 | |
X Bank of America Corp.
4.50%, due 4/1/15 | | | 325,000 | | | | 320,849 | |
| 5.65%, due 5/1/18 | | | 1,200,000 | | | | 1,201,608 | |
Citigroup, Inc.
4.587%, due 12/15/15 | | | 340,000 | | | | 355,238 | |
| 6.00%, due 8/15/17 | | | 550,000 | | | | 598,558 | |
Goldman Sachs Group, Inc. (The)
5.375%, due 3/15/20 | | | 550,000 | | | | 557,730 | |
| 6.00%, due 6/15/20 | | | 125,000 | | | | 131,644 | |
JPMorgan Chase & Co.
4.35%, due 8/15/21 | | | 500,000 | | | | 500,165 | |
| 5.25%, due 5/1/15 | | | 400,000 | | | | 424,594 | |
KeyCorp
6.50%, due 5/14/13 | | | 950,000 | | | | 1,016,025 | |
Morgan Stanley
5.625%, due 9/23/19 | | | 850,000 | | | | 839,310 | |
Wachovia Bank NA
4.80%, due 11/1/14 | | | 1,165,000 | | | | 1,239,865 | |
Wells Fargo & Co.
3.75%, due 10/1/14 | | | 1,210,000 | | | | 1,290,217 | |
| | | | | | | | | |
| | | | | | | | 9,186,824 | |
| | | | | | | | | |
Beverages 0.4% |
Anheuser-Busch InBev Worldwide, Inc.
4.125%, due 1/15/15 | | | 1,450,000 | | | | 1,579,869 | |
| 4.375%, due 2/15/21 | | | 350,000 | | | | 392,799 | |
PepsiCo, Inc.
3.00%, due 8/25/21 | | | 375,000 | | | | 382,844 | |
| | | | | | | | | |
| | | | | | | | 2,355,512 | |
| | | | | | | | | |
Biotechnology 0.0%‡ |
Amgen, Inc.
4.10%, due 6/15/21 | | | 225,000 | | | | 242,127 | |
| | | | | | | | | |
Building Materials 0.3% |
CRH America, Inc.
4.125%, due 1/15/16 | | | 250,000 | | | | 250,131 | |
Masco Corp.
4.80%, due 6/15/15 | | | 1,200,000 | | | | 1,159,005 | |
| | | | | | | | | |
| | | | | | | | 1,409,136 | |
| | | | | | | | | |
Chemicals 0.1% |
Dow Chemical Co. (The)
5.70%, due 5/15/18 | | | 400,000 | | | | 445,434 | |
| | | | | | | | | |
Computers 0.2% |
Hewlett-Packard Co.
2.35%, due 3/15/15 | | | 350,000 | | | | 356,719 | |
International Business Machines Corp.
1.95%, due 7/22/16 | | | 400,000 | | | | 409,825 | |
| 2.90%, due 11/1/21 | | | 610,000 | | | | 616,615 | |
| | | | | | | | | |
| | | | | | | | 1,383,159 | |
| | | | | | | | | |
Cosmetics & Personal Care 0.0%‡ |
Procter & Gamble Co. (The)
1.45%, due 8/15/16 | | | 150,000 | | | | 150,276 | |
| | | | | | | | | |
Diversified Financial Services 0.2% |
General Electric Capital Corp.
1.875%, due 9/16/13 | | | 350,000 | | | | 353,625 | |
| 4.65%, due 10/17/21 | | | 300,000 | | | | 309,038 | |
| 6.00%, due 8/7/19 | | | 500,000 | | | | 568,085 | |
| | | | | | | | | |
| | | | | | | | 1,230,748 | |
| | | | | | | | | |
Electric 1.3% |
CenterPoint Energy Houston Electric LLC
7.00%, due 3/1/14 | | | 1,075,000 | | | | 1,215,899 | |
| |
| † | Percentages indicated are based on Fund net assets. |
| |
| X | Among the Fund’s 10 largest holdings or issuers held, as of October 31, 2011, excluding short-term investments. May be subject to change daily. |
The notes to the financial statements are an integral part of,
| |
| 12 MainStay Balanced Fund | and should be read in conjunction with, the financial statements. |
| | | | | | | | | |
| | | Principal
| | | | |
| | | Amount | | | Value | |
Corporate Bonds (continued) |
|
Electric (continued) |
| | | | | | | | | |
Commonwealth Edison Co.
1.95%, due 9/1/16 | | $ | 900,000 | | | $ | 897,520 | |
Duke Energy Corp.
3.35%, due 4/1/15 | | | 1,125,000 | | | | 1,184,339 | |
Duquesne Light Holdings, Inc.
5.90%, due 12/1/21 (e) | | | 240,000 | | | | 236,855 | |
Florida Power Corp.
4.55%, due 4/1/20 | | | 700,000 | | | | 787,034 | |
Great Plains Energy, Inc.
2.75%, due 8/15/13 | | | 1,100,000 | | | | 1,116,069 | |
| 4.85%, due 6/1/21 | | | 400,000 | | | | 419,510 | |
Kansas City Power & Light Co.
7.15%, due 4/1/19 | | | 1,000,000 | | | | 1,245,661 | |
Pepco Holdings, Inc.
2.70%, due 10/1/15 | | | 500,000 | | | | 506,310 | |
| | | | | | | | | |
| | | | | | | | 7,609,197 | |
| | | | | | | | | |
Environmental Controls 0.1% |
Republic Services, Inc.
3.80%, due 5/15/18 | | | 500,000 | | | | 522,812 | |
| | | | | | | | | |
Finance—Auto Loans 0.2% |
American Honda Finance Corp.
1.85%, due 9/19/14 (e) | | | 600,000 | | | | 607,127 | |
Toyota Motor Credit Corp.
3.40%, due 9/15/21 | | | 300,000 | | | | 308,236 | |
| | | | | | | | | |
| | | | | | | | 915,363 | |
| | | | | | | | | |
Finance—Commercial 0.1% |
Caterpillar Financial Services Corp.
2.05%, due 8/1/16 | | | 775,000 | | | | 784,117 | |
| | | | | | | | | |
Finance—Consumer Loans 0.2% |
HSBC Finance Corp.
6.375%, due 11/27/12 | | | 1,000,000 | | | | 1,039,187 | |
John Deere Capital Corp.
5.75%, due 9/10/18 | | | 150,000 | | | | 179,530 | |
| | | | | | | | | |
| | | | | | | | 1,218,717 | |
| | | | | | | | | |
Finance—Credit Card 0.1% |
Capital One Bank USA N.A.
8.80%, due 7/15/19 | | | 500,000 | | | | 593,906 | |
| | | | | | | | | |
| | | | | | | | | |
Finance—Investment Banker/Broker 0.2% |
Bear Stearns Cos., Inc. (The)
5.30%, due 10/30/15 | | | 1,000,000 | | | | 1,080,831 | |
| | | | | | | | | |
Finance—Leasing Companies 0.0%‡ |
Boeing Capital Corp.
2.90%, due 8/15/18 | | | 200,000 | | | | 206,214 | |
| | | | | | | | | |
Finance—Other Services 0.1% |
National Rural Utilities Cooperative
Finance Corp.
5.45%, due 4/10/17 | | | 300,000 | | | | 342,914 | |
| | | | | | | | | |
Food 0.3% |
Kellogg Co.
3.25%, due 5/21/18 | | | 300,000 | | | | 310,299 | |
Kraft Foods, Inc.
4.125%, due 2/9/16 | | | 1,475,000 | | | | 1,599,391 | |
| | | | | | | | | |
| | | | | | | | 1,909,690 | |
| | | | | | | | | |
Health Care—Products 0.0%‡ |
Baxter International, Inc.
5.375%, due 6/1/18 | | | 175,000 | | | | 206,793 | |
| | | | | | | | | |
Health Care—Services 0.2% |
Roche Holdings, Inc.
5.00%, due 3/1/14 (e) | | | 955,000 | | | | 1,047,962 | |
| | | | | | | | | |
Insurance 0.5% |
AON Corp.
3.125%, due 5/27/16 | | | 300,000 | | | | 304,664 | |
Lincoln National Corp.
4.85%, due 6/24/21 | | | 125,000 | | | | 123,337 | |
Metropolitan Life Global Funding I
5.125%, due 6/10/14 (e) | | | 1,500,000 | | | | 1,621,575 | |
Principal Financial Group, Inc.
8.875%, due 5/15/19 | | | 450,000 | | | | 570,151 | |
| | | | | | | | | |
| | | | | | | | 2,619,727 | |
| | | | | | | | | |
Lodging 0.3% |
Marriott International, Inc.
5.625%, due 2/15/13 | | | 450,000 | | | | 466,693 | |
Wyndham Worldwide Corp.
6.00%, due 12/1/16 | | | 1,400,000 | | | | 1,480,659 | |
| | | | | | | | | |
| | | | | | | | 1,947,352 | |
| | | | | | | | | |
Media 0.3% |
DIRECTV Holdings LLC/DIRECTV Financing Co., Inc.
3.50%, due 3/1/16 | | | 300,000 | | | | 312,226 | |
NBC Universal Media LLC
4.375%, due 4/1/21 | | | 725,000 | | | | 770,985 | |
| 5.15%, due 4/30/20 | | | 225,000 | | | | 252,859 | |
The notes to the financial statements are an integral part of,
| |
| and should be read in conjunction with, the financial statements. | mainstayinvestments.com 13 |
Portfolio of Investments††† October 31, 2011 (continued)
| | | | | | | | | |
| | | Principal
| | | | |
| | | Amount | | | Value | |
Corporate Bonds (continued) |
|
Media (continued) |
| | | | | | | | | |
Time Warner Cable, Inc.
4.00%, due 9/1/21 | | $ | 175,000 | | | $ | 179,216 | |
| 6.75%, due 7/1/18 | | | 250,000 | | | | 297,807 | |
| | | | | | | | | |
| | | | | | | | 1,813,093 | |
| | | | | | | | | |
Mining 0.1% |
Rio Tinto Finance USA, Ltd.
3.50%, due 11/2/20 | | | 375,000 | | | | 383,587 | |
| | | | | | | | | |
Miscellaneous—Manufacturing 0.0%‡ |
Illinois Tool Works, Inc.
3.375%, due 9/15/21 (e) | | | 100,000 | | | | 103,917 | |
| | | | | | | | | |
Oil & Gas 0.1% |
Occidental Petroleum Corp.
1.75%, due 2/15/17 | | | 475,000 | | | | 477,630 | |
| | | | | | | | | |
Packaging & Containers 0.2% |
Bemis Co., Inc.
5.65%, due 8/1/14 | | | 775,000 | | | | 842,192 | |
| | | | | | | | | |
Pipelines 0.2% |
Enterprise Products Operating LLC
4.05%, due 2/15/22 | | | 300,000 | | | | 310,332 | |
Plains All American Pipeline, L.P.
8.75%, due 5/1/19 | | | 800,000 | | | | 1,024,546 | |
| | | | | | | | | |
| | | | | | | | 1,334,878 | |
| | | | | | | | | |
Real Estate Investment Trusts 0.7% |
Brandywine Operating Partnership, L.P.
5.70%, due 5/1/17 | | | 1,275,000 | | | | 1,310,639 | |
DDR Corp.
4.75%, due 4/15/18 | | | 800,000 | | | | 752,845 | |
Hospitality Properties Trust
6.30%, due 6/15/16 | | | 600,000 | | | | 635,307 | |
ProLogis, L.P.
6.625%, due 5/15/18 | | | 1,300,000 | | | | 1,415,726 | |
| | | | | | | | | |
| | | | | | | | 4,114,517 | |
| | | | | | | | | |
Retail 0.2% |
Home Depot, Inc.
4.40%, due 4/1/21 | | | 400,000 | | | | 437,199 | |
| 5.25%, due 12/16/13 | | | 500,000 | | | | 544,095 | |
Kohl’s Corp.
4.00%, due 11/1/21 | | | 325,000 | | | | 332,783 | |
| | | | | | | | | |
| | | | | | | | 1,314,077 | |
| | | | | | | | | |
Telecommunications 0.9% |
America Movil SAB de C.V.
2.375%, due 9/8/16 | | | 325,000 | | | | 324,478 | |
X AT&T, Inc.
2.40%, due 8/15/16 | | | 475,000 | | | | 485,585 | |
| 2.95%, due 5/15/16 | | | 975,000 | | | | 1,018,829 | |
Cellco Partnership/Verizon Wireless
Capital LLC
5.55%, due 2/1/14 | | | 900,000 | | | | 988,173 | |
CenturyLink, Inc.
6.45%, due 6/15/21 | | | 300,000 | | | | 300,505 | |
X Verizon Communications, Inc.
3.50%, due 11/1/21 | | | 725,000 | | | | 731,408 | |
| 4.60%, due 4/1/21 | | | 1,100,000 | | | | 1,207,846 | |
| | | | | | | | | |
| | | | | | | | 5,056,824 | |
| | | | | | | | | |
Transportation 0.1% |
Burlington Northern Santa Fe LLC
4.70%, due 10/1/19 | | | 400,000 | | | | 440,897 | |
| | | | | | | | | |
Total Corporate Bonds
(Cost $51,194,025) | | | | | | | 54,050,941 | |
| | | | | | | | | |
| Foreign Government Bonds 0.2% |
| |
Regional (State & Province) 0.2% |
Province of Manitoba Canada
2.625%, due 7/15/15 | | | 200,000 | | | | 209,958 | |
Province of Ontario
2.30%, due 5/10/16 | | | 1,000,000 | | | | 1,023,359 | |
| | | | | | | | | |
| | | | | | | | 1,233,317 | |
| | | | | | | | | |
Sovereign 0.0%‡ |
Poland Government International Bond
5.00%, due 3/23/22 | | | 150,000 | | | | 148,125 | |
| | | | | | | | | |
Total Foreign Government Bonds
(Cost $1,378,466) | | | | | | | 1,381,442 | |
| | | | | | | | | |
| Medium Term Note 0.1% |
| |
Insurance 0.1% |
Prudential Financial, Inc.
3.00%, due 5/12/16 | | | 550,000 | | | | 557,920 | |
| | | | | | | | | |
Total Medium Term Note
(Cost $549,629) | | | | | | | 557,920 | |
| | | | | | | | | |
| U.S. Government & Federal Agencies 24.9% |
| |
X Federal Home Loan Bank 0.6% | | | | | | | | |
| 1.375%, due 5/28/14 | | | 1,000,000 | | | | 1,019,574 | |
| 5.50%, due 8/13/14 | | | 2,000,000 | | | | 2,266,614 | |
| | | | | | | | | |
| | | | | | | | 3,286,188 | |
| | | | | | | | | |
The notes to the financial statements are an integral part of,
| |
| 14 MainStay Balanced Fund | and should be read in conjunction with, the financial statements. |
| | | | | | | | | |
| | | Principal
| | | | |
| | | Amount | | | Value | |
U.S. Government & Federal Agencies (continued) |
|
X Federal Home Loan Mortgage Corp. 0.8% | | | | | | | | |
| 0.375%, due 10/30/13 | | $ | 1,000,000 | | | $ | 998,714 | |
| 0.75%, due 11/25/14 | | | 2,200,000 | | | | 2,199,377 | |
| 2.00%, due 8/25/16 | | | 1,600,000 | | | | 1,655,765 | |
| | | | | | | | | |
| | | | | | | | 4,853,856 | |
| | | | | | | | | |
Federal Home Loan Mortgage Corporation
(Mortgage Pass-Through Security) 0.2% |
| 4.00%, due 1/1/40 TBA (f) | | | 1,100,000 | | | | 1,140,906 | |
| | | | | | | | | |
X Federal National Mortgage Association 1.3% | | | | |
| 0.50%, due 8/9/13 | | | 2,200,000 | | | | 2,205,071 | |
| 0.60%, due 10/25/13 | | | 1,100,000 | | | | 1,099,787 | |
| 0.85%, due 10/24/14 | | | 1,100,000 | | | | 1,100,675 | |
| 1.375%, due 11/15/16 | | | 1,100,000 | | | | 1,100,135 | |
| 2.75%, due 3/13/14 | | | 2,100,000 | | | | 2,212,058 | |
| | | | | | | | | |
| | | | | | | | 7,717,726 | |
| | | | | | | | | |
Federal National Mortgage Association
(Mortgage Pass-Through Security) 0.1% |
| 3.50%, due 9/1/40 TBA (f) | | | 500,000 | | | | 506,797 | |
| | | | | | | | | |
X United States Treasury Notes 21.9% | | | | | | | | |
| 0.125%, due 8/31/13 | | | 7,515,000 | | | | 7,497,971 | |
| 0.125%, due 9/30/13 | | | 300,000 | | | | 299,238 | |
| 0.25%, due 10/31/13 | | | 13,000,000 | | | | 12,997,010 | |
| 0.375%, due 7/31/13 | | | 3,730,000 | | | | 3,738,307 | |
| 0.50%, due 5/31/13 | | | 7,225,500 | | | | 7,256,548 | |
| 0.50%, due 10/15/14 | | | 4,815,000 | | | | 4,826,652 | |
| 0.75%, due 6/15/14 | | | 11,900,000 | | | | 12,019,928 | |
| 1.00%, due 1/15/14 | | | 12,233,000 | | | | 12,420,312 | |
| 1.00%, due 9/30/16 | | | 2,220,000 | | | | 2,221,554 | |
| 1.00%, due 10/31/16 | | | 28,270,000 | | | | 28,256,713 | |
| 1.25%, due 9/30/15 | | | 4,000,000 | | | | 4,090,000 | |
| 1.375%, due 9/30/18 | | | 1,000,000 | | | | 985,625 | |
| 1.50%, due 8/31/18 | | | 8,300,000 | | | | 8,262,393 | |
| 2.125%, due 8/15/21 | | | 7,470,000 | | | | 7,437,356 | |
| 2.25%, due 7/31/18 | | | 13,755,000 | | | | 14,382,572 | |
| | | | | | | | | |
| | | | | | | | 126,692,179 | |
| | | | | | | | | |
Total U.S. Government & Federal Agencies
(Cost $143,398,358) | | | | | | | 144,197,652 | |
| | | | | | | | | |
| Yankee Bonds 2.9% (g) |
| |
Banks 1.6% |
Abbey National Treasury Services PLC
4.00%, due 4/27/16 | | | 175,000 | | | | 166,965 | |
Bank of Montreal
1.30%, due 10/31/14 (e) | | | 600,000 | | | | 601,459 | |
Bank of Nova Scotia
1.65%, due 10/29/15 (e) | | | 725,000 | | | | 725,139 | |
Credit Suisse/New York NY
5.30%, due 8/13/19 | | | 600,000 | | | | 644,809 | |
Deutsche Bank A.G.
4.875%, due 5/20/13 | | | 1,000,000 | | | | 1,035,627 | |
European Investment Bank
0.875%, due 12/15/14 | | | 900,000 | | | | 900,494 | |
HSBC Bank PLC
3.50%, due 6/28/15 (e) | | | 900,000 | | | | 928,666 | |
Korea Development Bank
3.875%, due 5/4/17 | | | 400,000 | | | | 399,663 | |
Landwirtschaftliche Rentenbank
2.50%, due 2/15/16 | | | 350,000 | | | | 367,141 | |
National Bank of Canada
2.20%, due 10/19/16 (e) | | | 250,000 | | | | 252,816 | |
Nordea Bank Sweden AB
5.25%, due 11/30/12 (e) | | | 1,400,000 | | | | 1,451,769 | |
Svenska Handelsbanken AB
4.875%, due 6/10/14 (e) | | | 600,000 | | | | 636,973 | |
UBS AG/Stamford CT
2.25%, due 1/28/14 | | | 1,150,000 | | | | 1,145,949 | |
| | | | | | | | | |
| | | | | | | | 9,257,470 | |
| | | | | | | | | |
Chemicals 0.1% |
Potash Corp. of Saskatchewan, Inc.
3.25%, due 12/1/17 | | | 350,000 | | | | 364,511 | |
| | | | | | | | | |
Electric 0.1% |
Hydro Quebec
2.00%, due 6/30/16 | | | 550,000 | | | | 558,840 | |
| | | | | | | | | |
Finance—Investment Banker/Broker 0.1% |
BNP Paribas Home Loan Covered Bonds S.A.
2.20%, due 11/2/15 (e) | | | 400,000 | | | | 384,786 | |
| | | | | | | | | |
Iron & Steel 0.0%‡ |
ArcelorMittal
3.75%, due 3/1/16 | | | 225,000 | | | | 221,633 | |
| | | | | | | | | |
Media 0.0%‡ |
Thomson Corp. (The)
5.70%, due 10/1/14 | | | 200,000 | | | | 222,703 | |
| | | | | | | | | |
Mining 0.1% |
Barrick Gold Corp.
1.75%, due 5/30/14 | | | 200,000 | | | | 202,949 | |
Rio Tinto Finance USA, Ltd.
2.25%, due 9/20/16 | | | 450,000 | | | | 458,993 | |
The notes to the financial statements are an integral part of,
| |
| and should be read in conjunction with, the financial statements. | mainstayinvestments.com 15 |
Portfolio of Investments††† October 31, 2011 (continued)
| | | | | | | | | |
| | | Principal
| | | | |
| | | Amount | | | Value | |
Yankee Bonds (continued) |
|
Mining (continued) |
| | | | | | | | | |
Teck Resources, Ltd.
3.15%, due 1/15/17 | | $ | 200,000 | | | $ | 203,068 | |
| | | | | | | | | |
| | | | | | | | 865,010 | |
| | | | | | | | | |
Oil & Gas 0.5% |
BP Capital Markets PLC
3.561%, due 11/1/21 | | | 425,000 | | | | 430,936 | |
| 4.50%, due 10/1/20 | | | 850,000 | | | | 933,336 | |
Petroleos Mexicanos
4.875%, due 3/15/15 | | | 800,000 | | | | 847,200 | |
Total Capital S.A.
2.30%, due 3/15/16 | | | 800,000 | | | | 824,889 | |
| | | | | | | | | |
| | | | | | | | 3,036,361 | |
| | | | | | | | | |
Pharmaceuticals 0.2% |
Novartis Securities Investment, Ltd.
5.125%, due 2/10/19 | | | 350,000 | | | | 411,347 | |
Sanofi S.A.
2.625%, due 3/29/16 | | | 250,000 | | | | 260,748 | |
| 4.00%, due 3/29/21 | | | 300,000 | | | | 328,931 | |
| | | | | | | | | |
| | | | | | | | 1,001,026 | |
| | | | | | | | | |
Telecommunications 0.2% |
British Telecommunications PLC
5.15%, due 1/15/13 | | | 175,000 | | | | 182,860 | |
France Telecom S.A.
2.75%, due 9/14/16 | | | 325,000 | | | | 331,839 | |
Telefonica Emisiones SAU
5.134%, due 4/27/20 | | | 175,000 | | | | 173,918 | |
Vodafone Group PLC
5.625%, due 2/27/17 | | | 350,000 | | | | 411,170 | |
| | | | | | | | | |
| | | | | | | | 1,099,787 | |
| | | | | | | | | |
Total Yankee Bonds
(Cost $16,595,521) | | | | | | | 17,012,127 | |
| | | | | | | | | |
Total Long-Term Bonds
(Cost $213,892,095) | | | | | | | 217,967,769 | |
| | | | | | | | | |
| | | Shares | | | | |
| Common Stocks 61.5% |
| |
Aerospace & Defense 1.6% |
| Boeing Co. (The) | | | 16,317 | | | | 1,073,495 | |
| General Dynamics Corp. | | | 21,714 | | | | 1,393,822 | |
| Goodrich Corp. | | | 3,776 | | | | 463,051 | |
| L-3 Communications Holdings, Inc. | | | 19,706 | | | | 1,335,673 | |
| Lockheed Martin Corp. | | | 15,809 | | | | 1,199,903 | |
| Northrop Grumman Corp. | | | 21,755 | | | | 1,256,351 | |
| Raytheon Co. | | | 24,624 | | | | 1,088,134 | |
| United Technologies Corp. | | | 16,212 | | | | 1,264,212 | |
| | | | | | | | | |
| | | | | | | | 9,074,641 | |
| | | | | | | | | |
Agriculture 1.3% |
| Altria Group, Inc. | | | 37,791 | | | | 1,041,142 | |
| Archer-Daniels-Midland Co. | | | 38,754 | | | | 1,121,541 | |
X Lorillard, Inc. | | | 23,596 | | | | 2,611,133 | |
| Philip Morris International, Inc. | | | 20,473 | | | | 1,430,448 | |
| Reynolds American, Inc. | | | 31,026 | | | | 1,200,086 | |
| | | | | | | | | |
| | | | | | | | 7,404,350 | |
| | | | | | | | | |
Airlines 0.3% |
| Southwest Airlines Co. | | | 126,069 | | | | 1,077,890 | |
| United Continental Holdings, Inc. (h) | | | 29,165 | | | | 563,468 | |
| | | | | | | | | |
| | | | | | | | 1,641,358 | |
| | | | | | | | | |
Apparel 0.3% |
| VF Corp. | | | 10,908 | | | | 1,507,704 | |
| | | | | | | | | |
Auto Manufacturers 0.4% |
| Ford Motor Co. (h) | | | 105,758 | | | | 1,235,253 | |
| General Motors Co. (h) | | | 51,410 | | | | 1,328,949 | |
| | | | | | | | | |
| | | | | | | | 2,564,202 | |
| | | | | | | | | |
Auto Parts & Equipment 0.2% |
| Autoliv, Inc. | | | 424 | | | | 24,495 | |
| Johnson Controls, Inc. | | | 33,085 | | | | 1,089,489 | |
| Lear Corp. | | | 710 | | | | 33,306 | |
| TRW Automotive Holdings Corp. (h) | | | 1,802 | | | | 75,864 | |
| | | | | | | | | |
| | | | | | | | 1,223,154 | |
| | | | | | | | | |
Banks 4.5% |
| Associated Banc-Corp. | | | 13,671 | | | | 152,432 | |
X Bank of America Corp. | | | 159,497 | | | | 1,089,365 | |
| Bank of New York Mellon Corp. (The) | | | 70,233 | | | | 1,494,558 | |
| BB&T Corp. | | | 46,029 | | | | 1,074,317 | |
| Capital One Financial Corp. | | | 24,160 | | | | 1,103,146 | |
| Citigroup, Inc. | | | 35,941 | | | | 1,135,376 | |
| East West Bancorp, Inc. | | | 55,845 | | | | 1,087,302 | |
| Fifth Third Bancorp | | | 22,670 | | | | 272,267 | |
| First Citizens BancShares, Inc. Class A | | | 4,208 | | | | 686,114 | |
| Goldman Sachs Group, Inc. (The) | | | 10,589 | | | | 1,160,025 | |
| Huntington Bancshares, Inc. | | | 279,308 | | | | 1,446,816 | |
| JPMorgan Chase & Co. | | | 40,890 | | | | 1,421,336 | |
| KeyCorp | | | 203,648 | | | | 1,437,755 | |
| Morgan Stanley | | | 66,256 | | | | 1,168,756 | |
| Northern Trust Corp. | | | 40,736 | | | | 1,648,586 | |
| PNC Financial Services Group, Inc. | | | 23,158 | | | | 1,243,816 | |
| Popular, Inc. (h) | | | 548,104 | | | | 1,019,473 | |
| Regions Financial Corp. | | | 310,080 | | | | 1,218,614 | |
| State Street Corp. | | | 40,165 | | | | 1,622,264 | |
| SunTrust Banks, Inc. | | | 11,194 | | | | 220,858 | |
The notes to the financial statements are an integral part of,
| |
| 16 MainStay Balanced Fund | and should be read in conjunction with, the financial statements. |
| | | | | | | | | |
| | | Shares | | | Value | |
Common Stocks (continued) |
|
Banks (continued) |
| | | | | | | | | |
| TCF Financial Corp. | | | 107,719 | | | $ | 1,146,130 | |
| U.S. Bancorp | | | 42,402 | | | | 1,085,067 | |
| Wells Fargo & Co. | | | 44,658 | | | | 1,157,089 | |
| Zions Bancorp. | | | 59,781 | | | | 1,037,798 | |
| | | | | | | | | |
| | | | | | | | 26,129,260 | |
| | | | | | | | | |
Beverages 0.4% |
Coca-Cola Enterprises, Inc. | | | 44,248 | | | | 1,186,731 | |
| Constellation Brands, Inc. Class A (h) | | | 71,119 | | | | 1,438,026 | |
| | | | | | | | | |
| | | | | | | | 2,624,757 | |
| | | | | | | | | |
Biotechnology 0.2% |
| Amgen, Inc. | | | 23,969 | | | | 1,372,705 | |
| Bio-Rad Laboratories, Inc. Class A (h) | | | 157 | | | | 15,629 | |
| | | | | | | | | |
| | | | | | | | 1,388,334 | |
| | | | | | | | | |
Building Materials 0.1% |
| Fortune Brands Home & Security, Inc. (h) | | | 48,554 | | | | 705,490 | |
| | | | | | | | | |
Chemicals 0.9% |
| Camden Property Trust | | | 18,036 | | | | 1,093,703 | |
| CF Industries Holdings, Inc. | | | 7,999 | | | | 1,297,998 | |
| Dow Chemical Co. (The) | | | 38,457 | | | | 1,072,181 | |
| LyondellBasell Industries, N.V., Class A | | | 41,935 | | | | 1,377,984 | |
| Rockwood Holdings, Inc. (h) | | | 2,998 | | | | 138,028 | |
| W.R. Grace & Co. (h) | | | 85 | | | | 3,552 | |
| | | | | | | | | |
| | | | | | | | 4,983,446 | |
| | | | | | | | | |
Commercial Services 1.4% |
| Aaron’s, Inc. | | | 33,212 | | | | 888,753 | |
| Booz Allen Hamilton Holding Corp. (h) | | | 11,002 | | | | 173,942 | |
| Career Education Corp. (h) | | | 51,401 | | | | 829,098 | |
| DeVry, Inc. | | | 6,063 | | | | 228,454 | |
| Education Management Corp. (h) | | | 461 | | | | 9,156 | |
| H&R Block, Inc. | | | 82,493 | | | | 1,261,318 | |
| KAR Auction Services, Inc. (h) | | | 9,981 | | | | 137,239 | |
| Monster Worldwide, Inc. (h) | | | 235 | | | | 2,169 | |
| R.R. Donnelley & Sons Co. | | | 2,898 | | | | 47,237 | |
| SAIC, Inc. (h) | | | 59,710 | | | | 742,195 | |
| Total System Services, Inc. | | | 57,874 | | | | 1,151,114 | |
| Towers Watson & Co. Class A | | | 20,986 | | | | 1,378,780 | |
| Visa, Inc. Class A | | | 11,512 | | | | 1,073,609 | |
| | | | | | | | | |
| | | | | | | | 7,923,064 | |
| | | | | | | | | |
Computers 1.6% |
| Computer Sciences Corp. | | | 36,850 | | | | 1,159,301 | |
| Dell, Inc. (h) | | | 83,595 | | | | 1,321,637 | |
| DST Systems, Inc. | | | 25,128 | | | | 1,261,174 | |
| Hewlett-Packard Co. | | | 52,477 | | | | 1,396,413 | |
| Lexmark International, Inc. Class A (h) | | | 28,937 | | | | 917,303 | |
| SanDisk Corp. (h) | | | 670 | | | | 33,949 | |
| Synopsys, Inc. (h) | | | 54,117 | | | | 1,450,877 | |
| Western Digital Corp. (h) | | | 60,134 | | | | 1,601,970 | |
| | | | | | | | | |
| | | | | | | | 9,142,624 | |
| | | | | | | | | |
Cosmetics & Personal Care 0.4% |
| Colgate-Palmolive Co. | | | 13,193 | | | | 1,192,252 | |
| Procter & Gamble Co. (The) | | | 16,173 | | | | 1,034,910 | |
| | | | | | | | | |
| | | | | | | | 2,227,162 | |
| | | | | | | | | |
Electric 5.5% |
| AES Corp. (The) (h) | | | 57,489 | | | | 645,027 | |
| Alliant Energy Corp. | | | 37,047 | | | | 1,510,777 | |
| Ameren Corp. | | | 58,101 | | | | 1,852,260 | |
| American Electric Power Co., Inc. | | | 31,498 | | | | 1,237,241 | |
| CMS Energy Corp. | | | 12,973 | | | | 270,098 | |
X Consolidated Edison, Inc. | | | 47,645 | | | | 2,757,216 | |
| Constellation Energy Group, Inc. | | | 35,273 | | | | 1,400,338 | |
| Dominion Resources, Inc. | | | 20,918 | | | | 1,079,160 | |
| DPL, Inc. | | | 22,940 | | | | 696,229 | |
| DTE Energy Co. | | | 37,610 | | | | 1,959,857 | |
| Duke Energy Corp. | | | 57,223 | | | | 1,168,494 | |
| Edison International | | | 19,199 | | | | 779,479 | |
| Entergy Corp. | | | 1,341 | | | | 92,757 | |
| Exelon Corp. | | | 25,233 | | | | 1,120,093 | |
| FirstEnergy Corp. | | | 26,721 | | | | 1,201,376 | |
| Integrys Energy Group, Inc. | | | 1,780 | | | | 94,180 | |
| MDU Resources Group, Inc. | | | 17,487 | | | | 360,407 | |
| N.V. Energy, Inc. | | | 91,051 | | | | 1,460,458 | |
| NextEra Energy, Inc. | | | 22,010 | | | | 1,241,364 | |
| Northeast Utilities | | | 46,756 | | | | 1,616,355 | |
| NRG Energy, Inc. (h) | | | 68 | | | | 1,457 | |
| NSTAR | | | 25,260 | | | | 1,138,973 | |
| OGE Energy Corp. | | | 3,562 | | | | 184,298 | |
| Pepco Holdings, Inc. | | | 11,921 | | | | 236,036 | |
| PG&E Corp. | | | 28,779 | | | | 1,234,619 | |
| Pinnacle West Capital Corp. | | | 22,918 | | | | 1,044,602 | |
| PPL Corp. | | | 11,438 | | | | 335,934 | |
| Progress Energy, Inc. | | | 8,458 | | | | 440,662 | |
| Public Service Enterprise Group, Inc. | | | 36,884 | | | | 1,242,991 | |
| Southern Co. | | | 28,179 | | | | 1,217,333 | |
| TECO Energy, Inc. | | | 42,839 | | | | 795,520 | |
| Xcel Energy, Inc. | | | 62,330 | | | | 1,611,230 | |
| | | | | | | | | |
| | | | | | | | 32,026,821 | |
| | | | | | | | | |
Electrical Components & Equipment 0.0%‡ |
| Energizer Holdings, Inc. (h) | | | 3,312 | | | | 244,392 | |
| | | | | | | | | |
Electronics 0.9% |
| Garmin, Ltd. | | | 41,048 | | | | 1,411,641 | |
| Jabil Circuit, Inc. | | | 38,830 | | | | 798,345 | |
| Tech Data Corp. (h) | | | 25,932 | | | | 1,275,336 | |
The notes to the financial statements are an integral part of,
| |
| and should be read in conjunction with, the financial statements. | mainstayinvestments.com 17 |
Portfolio of Investments††† October 31, 2011 (continued)
| | | | | | | | | |
| | | Shares | | | Value | |
Common Stocks (continued) |
|
Electronics (continued) |
| | | | | | | | | |
| Thermo Fisher Scientific, Inc. (h) | | | 22,023 | | | $ | 1,107,096 | |
| Vishay Intertechnology, Inc. (h) | | | 73,487 | | | | 789,985 | |
| | | | | | | | | |
| | | | | | | | 5,382,403 | |
| | | | | | | | | |
Engineering & Construction 0.4% |
| KBR, Inc. | | | 46,858 | | | | 1,307,807 | |
| URS Corp. (h) | | | 29,669 | | | | 1,059,183 | |
| | | | | | | | | |
| | | | | | | | 2,366,990 | |
| | | | | | | | | |
Entertainment 0.4% |
| International Game Technology | | | 80,554 | | | | 1,416,945 | |
| Penn National Gaming, Inc. (h) | | | 33,424 | | | | 1,203,264 | |
| | | | | | | | | |
| | | | | | | | 2,620,209 | |
| | | | | | | | | |
Environmental Controls 0.3% |
| Republic Services, Inc. | | | 18,000 | | | | 512,280 | |
| Waste Connections, Inc. | | | 115 | | | | 3,916 | |
| Waste Management, Inc. | | | 41,026 | | | | 1,350,986 | |
| | | | | | | | | |
| | | | | | | | 1,867,182 | |
| | | | | | | | | |
Finance—Credit Card 0.6% |
| American Express Co. | | | 25,591 | | | | 1,295,416 | |
| Discover Financial Services | | | 81,174 | | | | 1,912,460 | |
| | | | | | | | | |
| | | | | | | | 3,207,876 | |
| | | | | | | | | |
Finance—Investment Banker/Broker 0.3% |
| Interactive Brokers Group, Inc. | | | 38,462 | | | | 591,546 | |
| Raymond James Financial, Inc. | | | 41,315 | | | | 1,254,736 | |
| | | | | | | | | |
| | | | | | | | 1,846,282 | |
| | | | | | | | | |
Finance—Other Services 0.5% |
| CME Group, Inc. | | | 4,043 | | | | 1,114,089 | |
| NASDAQ OMX Group, Inc. (The) (h) | | | 51,037 | | | | 1,278,477 | |
| NYSE Euronext | | | 25,991 | | | | 690,581 | |
| | | | | | | | | |
| | | | | | | | 3,083,147 | |
| | | | | | | | | |
Food 2.4% |
| ConAgra Foods, Inc. | | | 77,005 | | | | 1,950,537 | |
| Dean Foods Co. (h) | | | 126,143 | | | | 1,226,110 | |
| General Mills, Inc. | | | 26,382 | | | | 1,016,498 | |
| H.J. Heinz Co. | | | 162 | | | | 8,657 | |
| Hormel Foods Corp. | | | 19,540 | | | | 575,844 | |
| Kellogg Co. | | | 19,277 | | | | 1,045,006 | |
| Kraft Foods, Inc. Class A | | | 34,783 | | | | 1,223,666 | |
| Kroger Co. (The) | | | 59,806 | | | | 1,386,303 | |
| Ralcorp Holdings, Inc. (h) | | | 75 | | | | 6,063 | |
| Safeway, Inc. | | | 86,521 | | | | 1,675,912 | |
| Smithfield Foods, Inc. (h) | | | 37,628 | | | | 860,176 | |
| SUPERVALU, Inc. | | | 82,016 | | | | 657,768 | |
| Tyson Foods, Inc. Class A | | | 87,875 | | | | 1,695,988 | |
| Whole Foods Market, Inc. | | | 4,715 | | | | 340,046 | |
| | | | | | | | | |
| | | | | | | | 13,668,574 | |
| | | | | | | | | |
Forest Products & Paper 0.3% |
| Domtar Corp. | | | 17,856 | | | | 1,462,585 | |
| MeadWestvaco Corp. | | | 1,689 | | | | 47,140 | |
| Plum Creek Timber Co., Inc. | | | 4,552 | | | | 171,428 | |
| | | | | | | | | |
| | | | | | | | 1,681,153 | |
| | | | | | | | | |
Gas 0.8% |
| Atmos Energy Corp. | | | 40,422 | | | | 1,387,283 | |
| CenterPoint Energy, Inc. | | | 94,953 | | | | 1,978,821 | |
| NiSource, Inc. | | | 12,836 | | | | 283,547 | |
| Questar Corp. | | | 23,952 | | | | 461,555 | |
| Sempra Energy | | | 2,268 | | | | 121,860 | |
| Southern Union Co. | | | 2,948 | | | | 123,905 | |
| UGI Corp. | | | 10,129 | | | | 290,398 | |
| Vectren Corp. | | | 2,314 | | | | 65,671 | |
| | | | | | | | | |
| | | | | | | | 4,713,040 | |
| | | | | | | | | |
Health Care—Products 1.4% |
| Baxter International, Inc. | | | 22,124 | | | | 1,216,378 | |
| Cooper Cos., Inc. (The) | | | 12,343 | | | | 855,370 | |
| Covidien PLC | | | 29,628 | | | | 1,393,701 | |
| Hill-Rom Holdings, Inc. | | | 9,105 | | | | 306,565 | |
| Hologic, Inc. (h) | | | 4,885 | | | | 78,746 | |
| Johnson & Johnson | | | 18,708 | | | | 1,204,608 | |
| Kinetic Concepts, Inc. (h) | | | 701 | | | | 47,942 | |
| Medtronic, Inc. | | | 36,592 | | | | 1,271,206 | |
| Zimmer Holdings, Inc. (h) | | | 31,199 | | | | 1,642,003 | |
| | | | | | | | | |
| | | | | | | | 8,016,519 | |
| | | | | | | | | |
Health Care—Services 2.2% |
| Aetna, Inc. | | | 36,231 | | | | 1,440,545 | |
| AMERIGROUP Corp. (h) | | | 15,406 | | | | 857,036 | |
| CIGNA Corp. | | | 50,586 | | | | 2,242,983 | |
| Coventry Health Care, Inc. (h) | | | 48,987 | | | | 1,558,276 | |
| HCA Holdings, Inc. (h) | | | 59,230 | | | | 1,388,943 | |
| Humana, Inc. | | | 25,746 | | | | 2,185,578 | |
| LifePoint Hospitals, Inc. (h) | | | 8,319 | | | | 321,613 | |
| UnitedHealth Group, Inc. | | | 29,270 | | | | 1,404,667 | |
| WellPoint, Inc. | | | 20,263 | | | | 1,396,121 | |
| | | | | | | | | |
| | | | | | | | 12,795,762 | |
| | | | | | | | | |
Home Furnishing 0.1% |
| Harman International Industries, Inc. | | | 14,688 | | | | 633,934 | |
| | | | | | | | | |
Household Products & Wares 0.6% |
| Church & Dwight Co., Inc. | | | 17,857 | | | | 788,922 | |
| Clorox Co. (The) | | | 21,021 | | | | 1,407,146 | |
| Kimberly-Clark Corp. | | | 16,718 | | | | 1,165,412 | |
| | | | | | | | | |
| | | | | | | | 3,361,480 | |
| | | | | | | | | |
Insurance 5.0% |
| ACE, Ltd. | | | 19,167 | | | | 1,382,899 | |
| Aflac, Inc. | | | 25,836 | | | | 1,164,945 | |
| Allied World Assurance Co. Holdings, Ltd. | | | 16,398 | | | | 952,724 | |
The notes to the financial statements are an integral part of,
| |
| 18 MainStay Balanced Fund | and should be read in conjunction with, the financial statements. |
| | | | | | | | | |
| | | Shares | | | Value | |
Common Stocks (continued) |
|
Insurance (continued) |
| | | | | | | | | |
| Allstate Corp. (The) | | | 41,745 | | | $ | 1,099,563 | |
| American Financial Group, Inc. | | | 29,314 | | | | 1,050,321 | |
| American International Group, Inc. (h) | | | 44,170 | | | | 1,090,557 | |
| American National Insurance Co. | | | 2,053 | | | | 146,707 | |
| AON Corp. | | | 5,499 | | | | 256,363 | |
| Arch Capital Group, Ltd. (h) | | | 44,512 | | | | 1,601,097 | |
| Berkshire Hathaway, Inc. Class B (h) | | | 14,048 | | | | 1,093,777 | |
| Chubb Corp. (The) | | | 19,431 | | | | 1,302,849 | |
| CNA Financial Corp. | | | 2,750 | | | | 73,150 | |
| Endurance Specialty Holdings, Ltd. | | | 23,872 | | | | 888,038 | |
| Fidelity National Financial, Inc. Class A | | | 87,322 | | | | 1,348,252 | |
| Hartford Financial Services Group, Inc. (The) | | | 84,520 | | | | 1,627,010 | |
| Kemper Corp. | | | 22,161 | | | | 595,909 | |
| Lincoln National Corp. | | | 34,845 | | | | 663,797 | |
| Loews Corp. | | | 29,087 | | | | 1,154,754 | |
| Marsh & McLennan Cos., Inc. | | | 12,486 | | | | 382,321 | |
| Mercury General Corp. | | | 1,233 | | | | 53,389 | |
| MetLife, Inc. | | | 33,054 | | | | 1,162,179 | |
| Principal Financial Group, Inc. | | | 57,284 | | | | 1,476,781 | |
| Progressive Corp. (The) | | | 11,712 | | | | 222,645 | |
| Protective Life Corp. | | | 19,608 | | | | 364,709 | |
| Prudential Financial, Inc. | | | 20,578 | | | | 1,115,328 | |
| Reinsurance Group of America, Inc. | | | 28,246 | | | | 1,475,289 | |
| StanCorp Financial Group, Inc. | | | 30,978 | | | | 1,051,393 | |
| Torchmark Corp. | | | 705 | | | | 28,856 | |
| Transatlantic Holdings, Inc. | | | 1,824 | | | | 94,921 | |
| Travelers Cos., Inc. (The) | | | 26,391 | | | | 1,539,915 | |
| Unum Group | | | 24,869 | | | | 592,877 | |
| Validus Holdings, Ltd. | | | 47,021 | | | | 1,286,495 | |
| W.R. Berkley Corp. | | | 6,936 | | | | 241,442 | |
| XL Group PLC | | | 6,535 | | | | 142,071 | |
| | | | | | | | | |
| | | | | | | | 28,723,323 | |
| | | | | | | | | |
Internet 1.2% |
| AOL, Inc. (h) | | | 33,218 | | | | 469,038 | |
| eBay, Inc. (h) | | | 41,453 | | | | 1,319,449 | |
| Expedia, Inc. | | | 43,764 | | | | 1,149,243 | |
| IAC/InterActiveCorp (h) | | | 32,602 | | | | 1,331,140 | |
| Liberty Interactive Corp. (h) | | | 87,338 | | | | 1,434,963 | |
| Yahoo!, Inc. (h) | | | 66,550 | | | | 1,040,842 | |
| | | | | | | | | |
| | | | | | | | 6,744,675 | |
| | | | | | | | | |
Investment Company 0.1% |
| American Capital Ltd. (h) | | | 66,198 | | | | 514,358 | |
| | | | | | | | | |
Investment Management/Advisory Services 0.3% |
| Ameriprise Financial, Inc. | | | 2,911 | | | | 135,886 | |
| BlackRock, Inc. | | | 6,728 | | | | 1,061,611 | |
| Janus Capital Group, Inc. | | | 47,256 | | | | 309,999 | |
| | | | | | | | | |
| | | | | | | | 1,507,496 | |
| | | | | | | | | |
Leisure Time 0.2% |
| Carnival Corp. | | | 31,403 | | | | 1,105,699 | |
| WMS Industries, Inc. (h) | | | 5,159 | | | | 113,034 | |
| | | | | | | | | |
| | | | | | | | 1,218,733 | |
| | | | | | | | | |
Machinery—Diversified 0.1% |
| AGCO Corp. (h) | | | 16,411 | | | | 719,294 | |
| | | | | | | | | |
Media 1.7% |
| CBS Corp. Class B | | | 57,917 | | | | 1,494,838 | |
| Comcast Corp. Class A | | | 57,525 | | | | 1,348,961 | |
| DISH Network Corp. Class A (h) | | | 41,562 | | | | 1,004,554 | |
| Gannett Co., Inc. | | | 4,084 | | | | 47,742 | |
| Interpublic Group of Cos., Inc. (The) | | | 4,464 | | | | 42,319 | |
| McGraw-Hill Cos., Inc. (The) | | | 12,066 | | | | 512,805 | |
| News Corp. Class A | | | 70,424 | | | | 1,233,828 | |
| Thomson Reuters Corp. | | | 41,775 | | | | 1,239,464 | |
| Time Warner, Inc. | | | 31,890 | | | | 1,115,831 | |
| Walt Disney Co. (The) | | | 35,649 | | | | 1,243,437 | |
| Washington Post Co. Class B | | | 2,525 | | | | 858,904 | |
| | | | | | | | | |
| | | | | | | | 10,142,683 | |
| | | | | | | | | |
Mining 0.6% |
| Alcoa, Inc. | | | 104,425 | | | | 1,123,613 | |
| Newmont Mining Corp. | | | 16,380 | | | | 1,094,675 | |
| Nucor Corp. | | | 31,037 | | | | 1,172,578 | |
| | | | | | | | | |
| | | | | | | | 3,390,866 | |
| | | | | | | | | |
Miscellaneous—Manufacturing 1.4% |
| 3M Co. | | | 15,359 | | | | 1,213,668 | |
| Dover Corp. | | | 456 | | | | 25,322 | |
| General Electric Co. | | | 63,994 | | | | 1,069,340 | |
| Harsco Corp. | | | 54,622 | | | | 1,259,037 | |
| Illinois Tool Works, Inc. | | | 22,805 | | | | 1,109,007 | |
| ITT Corp. | | | 35,511 | | | | 1,619,301 | |
| Leggett & Platt, Inc. | | | 6,763 | | | | 148,110 | |
| Parker Hannifin Corp. | | | 818 | | | | 66,708 | |
| Textron, Inc. | | | 13,080 | | | | 254,014 | |
| Tyco International, Ltd. | | | 30,631 | | | | 1,395,242 | |
| | | | | | | | | |
| | | | | | | | 8,159,749 | |
| | | | | | | | | |
Office Equipment/Supplies 0.0%‡ |
| Pitney Bowes, Inc. | | | 1,798 | | | | 36,643 | |
| Xerox Corp. | | | 3,237 | | | | 26,479 | |
| | | | | | | | | |
| | | | | | | | 63,122 | |
| | | | | | | | | |
The notes to the financial statements are an integral part of,
| |
| and should be read in conjunction with, the financial statements. | mainstayinvestments.com 19 |
Portfolio of Investments††† October 31, 2011 (continued)
| | | | | | | | | |
| | | Shares | | | Value | |
Common Stocks (continued) |
|
Oil & Gas 4.5% |
| Anadarko Petroleum Corp. | | | 15,592 | | | $ | 1,223,972 | |
| Apache Corp. | | | 13,687 | | | | 1,363,636 | |
| Chesapeake Energy Corp. | | | 39,233 | | | | 1,103,232 | |
| Chevron Corp. | | | 13,884 | | | | 1,458,514 | |
| ConocoPhillips | | | 20,008 | | | | 1,393,557 | |
| Devon Energy Corp. | | | 19,985 | | | | 1,298,026 | |
| Diamond Offshore Drilling, Inc. | | | 15,483 | | | | 1,014,756 | |
| ExxonMobil Corp. | | | 17,594 | | | | 1,373,915 | |
| Helmerich & Payne, Inc. | | | 3,648 | | | | 194,001 | |
| Hess Corp. | | | 21,453 | | | | 1,342,100 | |
| Marathon Oil Corp. | | | 57,795 | | | | 1,504,404 | |
| Marathon Petroleum Corp. | | | 40,440 | | | | 1,451,796 | |
| Murphy Oil Corp. | | | 31,925 | | | | 1,767,687 | |
| Nabors Industries, Ltd. (h) | | | 78,047 | | | | 1,430,601 | |
| Noble Energy, Inc. | | | 8,384 | | | | 749,026 | |
| Occidental Petroleum Corp. | | | 14,857 | | | | 1,380,809 | |
| Patterson-UTI Energy, Inc. | | | 65,130 | | | | 1,323,442 | |
| Tesoro Corp. (h) | | | 60,021 | | | | 1,556,945 | |
| Unit Corp. (h) | | | 24,118 | | | | 1,183,229 | |
| Valero Energy Corp. | | | 91,586 | | | | 2,253,016 | |
| | | | | | | | | |
| | | | | | | | 26,366,664 | |
| | | | | | | | | |
Oil & Gas Services 0.7% |
| Baker Hughes, Inc. | | | 19,623 | | | | 1,137,938 | |
| National-Oilwell Varco, Inc. | | | 21,600 | | | | 1,540,728 | |
| SEACOR Holdings, Inc. | | | 13,777 | | | | 1,173,111 | |
| | | | | | | | | |
| | | | | | | | 3,851,777 | |
| | | | | | | | | |
Packaging & Containers 0.3% |
| Packaging Corp. of America | | | 12,983 | | | | 338,597 | |
| Sealed Air Corp. | | | 73,009 | | | | 1,299,560 | |
| Temple-Inland, Inc. | | | 4,102 | | | | 130,484 | |
| | | | | | | | | |
| | | | | | | | 1,768,641 | |
| | | | | | | | | |
Pharmaceuticals 2.0% |
| Abbott Laboratories | | | 22,999 | | | | 1,238,956 | |
| Bristol-Myers Squibb Co. | | | 31,968 | | | | 1,009,869 | |
| Cardinal Health, Inc. | | | 32,704 | | | | 1,447,806 | |
| Eli Lilly & Co. | | | 36,096 | | | | 1,341,328 | |
| Forest Laboratories, Inc. (h) | | | 51,962 | | | | 1,626,411 | |
| Mead Johnson Nutrition Co. | | | 1,412 | | | | 101,452 | |
| Merck & Co., Inc. | | | 36,952 | | | | 1,274,844 | |
| Omnicare, Inc. | | | 48,443 | | | | 1,444,570 | |
| Pfizer, Inc. | | | 72,135 | | | | 1,389,320 | |
| Warner Chilcott PLC Class A (h) | | | 22,856 | | | | 414,151 | |
| Watson Pharmaceuticals, Inc. (h) | | | 1,357 | | | | 91,136 | |
| | | | | | | | | |
| | | | | | | | 11,379,843 | |
| | | | | | | | | |
Pipelines 0.6% |
| Kinder Morgan, Inc./Delaware | | | 44,741 | | | | 1,279,593 | |
| ONEOK, Inc. | | | 4,342 | | | | 330,209 | |
| Spectra Energy Corp. | | | 13,431 | | | | 384,529 | |
| Williams Cos., Inc. | | | 45,025 | | | | 1,355,703 | |
| | | | | | | | | |
| | | | | | | | 3,350,034 | |
| | | | | | | | | |
Real Estate Investment Trusts 3.5% |
| American Capital Agency Corp. | | | 1,881 | | | | 51,746 | |
X Annaly Capital Management, Inc. | | | 157,969 | | | | 2,661,778 | |
| Apartment Investment & Management Co. Class A | | | 47,219 | | | | 1,164,893 | |
| AvalonBay Communities, Inc. | | | 9,490 | | | | 1,268,718 | |
| Brandywine Realty Trust | | | 83 | | | | 756 | |
| CommonWealth REIT | | | 7,183 | | | | 138,991 | |
| Douglas Emmett, Inc. | | | 46,653 | | | | 909,733 | |
| Duke Realty Corp. | | | 100,390 | | | | 1,232,789 | |
| Equity Residential | | | 41,169 | | | | 2,415,797 | |
| Essex Property Trust, Inc. | | | 6,827 | | | | 974,623 | |
| HCP, Inc. | | | 6,738 | | | | 268,509 | |
| Hospitality Properties Trust | | | 57,619 | | | | 1,384,585 | |
| Host Hotels & Resorts, Inc. | | | 1,716 | | | | 24,487 | |
| Jones Lang LaSalle, Inc. | | | 11,290 | | | | 729,560 | |
| Liberty Property Trust | | | 10,828 | | | | 346,496 | |
| ProLogis, Inc. | | | 2,882 | | | | 85,768 | |
| Public Storage | | | 9,177 | | | | 1,184,292 | |
| Realty Income Corp. | | | 8,489 | | | | 283,617 | |
| Regency Centers Corp. | | | 1,768 | | | | 72,417 | |
| Simon Property Group, Inc. | | | 9,108 | | | | 1,169,832 | |
| Taubman Centers, Inc. | | | 24,797 | | | | 1,518,320 | |
| UDR, Inc. | | | 55,649 | | | | 1,387,330 | |
| Vornado Realty Trust | | | 1,513 | | | | 125,292 | |
| Weingarten Realty Investors | | | 51,326 | | | | 1,191,276 | |
| | | | | | | | | |
| | | | | | | | 20,591,605 | |
| | | | | | | | | |
Retail 3.6% |
| American Eagle Outfitters, Inc. | | | 2,709 | | | | 35,569 | |
| Best Buy Co., Inc. | | | 28,538 | | | | 748,552 | |
| Brinker International, Inc. | | | 10,113 | | | | 231,588 | |
| Chico’s FAS, Inc. | | | 87,323 | | | | 1,079,312 | |
| CVS Caremark Corp. | | | 34,714 | | | | 1,260,118 | |
| Dillard’s, Inc. Class A | | | 24,461 | | | | 1,260,475 | |
| DSW, Inc. Class A | | | 2,407 | | | | 125,982 | |
| Foot Locker, Inc. | | | 62,366 | | | | 1,363,321 | |
| GameStop Corp. Class A (h) | | | 49,436 | | | | 1,264,079 | |
| Gap, Inc. (The) | | | 81,733 | | | | 1,544,754 | |
| Home Depot, Inc. (The) | | | 39,101 | | | | 1,399,816 | |
| J.C. Penney Co., Inc. | | | 14,525 | | | | 465,962 | |
| Kohl’s Corp. | | | 27,032 | | | | 1,432,966 | |
| Lowe’s Cos., Inc. | | | 65,838 | | | | 1,383,915 | |
| Macy’s, Inc. | | | 21,636 | | | | 660,547 | |
| PVH Corp. | | | 2,342 | | | | 174,268 | |
| RadioShack Corp. | | | 38,299 | | | | 456,141 | |
| Staples, Inc. | | | 1,887 | | | | 28,230 | |
The notes to the financial statements are an integral part of,
| |
| 20 MainStay Balanced Fund | and should be read in conjunction with, the financial statements. |
| | | | | | | | | |
| | | Shares | | | Value | |
Common Stocks (continued) |
|
Retail (continued) |
| | | | | | | | | |
| Target Corp. | | | 25,736 | | | $ | 1,409,046 | |
| Wal-Mart Stores, Inc. | | | 21,803 | | | | 1,236,666 | |
| Walgreen Co. | | | 40,952 | | | | 1,359,606 | |
| Wendy’s Co. (The) | | | 195,023 | | | | 986,816 | |
| Williams-Sonoma, Inc. | | | 32,640 | | | | 1,225,306 | |
| | | | | | | | | |
| | | | | | | | 21,133,035 | |
| | | | | | | | | |
Savings & Loans 0.0%‡ |
| New York Community Bancorp, Inc. | | | 5,507 | | | | 73,298 | |
| Washington Federal, Inc. | | | 8,113 | | | | 110,743 | |
| | | | | | | | | |
| | | | | | | | 184,041 | |
| | | | | | | | | |
Semiconductors 1.5% |
| Applied Materials, Inc. | | | 120,141 | | | | 1,480,137 | |
| Fairchild Semiconductor International, Inc. (h) | | | 55,827 | | | | 835,730 | |
| Intel Corp. | | | 58,720 | | | | 1,440,989 | |
| LSI Corp. (h) | | | 200,689 | | | | 1,254,306 | |
| Micron Technology, Inc. (h) | | | 229,533 | | | | 1,283,090 | |
| Teradyne, Inc. (h) | | | 75,500 | | | | 1,081,160 | |
| Texas Instruments, Inc. | | | 40,523 | | | | 1,245,272 | |
| | | | | | | | | |
| | | | | | | | 8,620,684 | |
| | | | | | | | | |
Software 0.3% |
| Activision Blizzard, Inc. | | | 123,336 | | | | 1,651,469 | |
| Emdeon, Inc. Class A (h) | | | 1,426 | | | | 27,051 | |
| | | | | | | | | |
| | | | | | | | 1,678,520 | |
| | | | | | | | | |
Telecommunications 2.2% |
| Amdocs, Ltd. (h) | | | 15,413 | | | | 462,698 | |
X AT&T, Inc. | | | 41,515 | | | | 1,216,805 | |
| CenturyLink, Inc. | | | 30,526 | | | | 1,076,347 | |
| Cisco Systems, Inc. | | | 78,700 | | | | 1,458,311 | |
| Corning, Inc. | | | 88,756 | | | | 1,268,323 | |
| EchoStar Corp. Class A (h) | | | 31,255 | | | | 823,882 | |
| Motorola Mobility Holdings, Inc. (h) | | | 13,344 | | | | 518,815 | |
| Motorola Solutions, Inc. | | | 30,195 | | | | 1,416,447 | |
| Sprint Nextel Corp. (h) | | | 528,247 | | | | 1,357,595 | |
| T.W. telecom, Inc. (h) | | | 33,466 | | | | 619,121 | |
| Telephone and Data Systems, Inc. | | | 44,965 | | | | 1,042,289 | |
X Verizon Communications, Inc. | | | 37,022 | | | | 1,369,073 | |
| | | | | | | | | |
| | | | | | | | 12,629,706 | |
| | | | | | | | | |
Textiles 0.1% |
| Cintas Corp. | | | 9,998 | | | | 298,840 | |
| | | | | | | | | |
Transportation 1.3% |
| Con-way, Inc. | | | 39,646 | | | | 1,168,368 | |
| FedEx Corp. | | | 18,057 | | | | 1,477,604 | |
| Kirby Corp. (h) | | | 10,498 | | | | 646,047 | |
| Norfolk Southern Corp. | | | 20,130 | | | | 1,489,419 | |
| Ryder System, Inc. | | | 29,649 | | | | 1,510,320 | |
| Union Pacific Corp. | | | 13,111 | | | | 1,305,462 | |
| | | | | | | | | |
| | | | | | | | 7,597,220 | |
| | | | | | | | | |
Total Common Stocks
(Cost $342,799,111) | | | | | | | 356,690,219 | |
| | | | | | | | | |
| Exchange Traded Fund 0.4% (i) |
| |
| S&P MidCap 400 Index—MidCap SPDR Trust Series 1 | | | 12,311 | | | | 1,986,995 | |
| | | | | | | | | |
Total Exchange Traded Fund
(Cost $1,873,514) | | | | | | | 1,986,995 | |
| | | | | | | | | |
| | | Principal
| | | | |
| | | Amount | | | | |
| Short-Term Investments 1.1% |
| |
Other Commercial Paper 1.1% |
McCormick & Co.
(zero coupon), due 11/1/11 (e) | | $ | 5,000,000 | | | | 5,000,000 | |
Wisconsin Gas Co.
(zero coupon), due 11/1/11 | | | 1,288,000 | | | | 1,288,000 | |
| | | | | | | | | |
Total Other Commercial Paper
(Cost $6,288,000) | | | | | | | 6,288,000 | |
| | | | | | | | | |
Repurchase Agreement 0.0%‡ |
State Street Bank and Trust Co.
0.01%, dated 10/31/11
due 11/1/11
Proceeds at Maturity $72,421 (Collateralized by a United States Treasury Bond with a rate of 4.625% and a maturity date of 2/15/40, with a Principal Amount of $60,000 and a Market Value of $76,274) | | | 72,421 | | | | 72,421 | |
| | | | | | | | | |
Total Repurchase Agreement
(Cost $72,421) | | | | | | | 72,421 | |
| | | | | | | | | |
Total Short-Term Investments
(Cost $6,360,421) | | | | | | | 6,360,421 | |
| | | | | | | | | |
Total Investments
(Cost $564,925,141) (j) | | | 100.5 | % | | | 583,005,404 | |
| Other Assets, Less Liabilities | | | (0.5 | ) | | | (3,089,199 | ) |
| | | | | | | | | |
| | | | | | | | | |
| Net Assets | | | 100.0 | % | | $ | 579,916,205 | |
| | | | | | | | | |
| | | | | | | | | |
| | | |
| ††† | | On a daily basis New York Life Investments confirms that the value of the Fund’s liquid assets (liquid portfolio securities and cash) is sufficient to cover its potential senior securities (e.g., futures, swaps, options). |
| ‡ | | Less than one-tenth of a percent. |
| (a) | | Issue in default. |
The notes to the financial statements are an integral part of,
| |
| and should be read in conjunction with, the financial statements. | mainstayinvestments.com 21 |
Portfolio of Investments††† October 31, 2011 (continued)
| | | |
| (b) | | Restricted security. |
| (c) | | Illiquid security—The total market value of this security at October 31, 2011 is $18, which represents less than one-tenth of a percent of the Fund’s net assets. |
| (d) | | Fair valued security—The total market value of this security at October 31, 2011 is $18, which represents less than one-tenth of a percent of the Fund’s net assets. |
| (e) | | May be sold to institutional investors only under Rule 144A or securities offered pursuant to Section 4(2) of the Securities Act of 1933, as amended. |
| (f) | | TBA—Securities purchased on a forward commitment basis with an approximate principal amount and maturity date. The actual principal amount and maturity date will be determined upon settlement. The market value of these securities at October 31, 2011 is $1,647,703, which represents 0.3% of the Fund’s net assets. All or a portion of these securities were acquired under a mortgage dollar roll agreement. |
| (g) | | Yankee Bond—dollar-denominated bond issued in the United States by a foreign bank or corporation. |
| (h) | | Non-income producing security. |
| (i) | | Exchange Traded Fund—An investment vehicle that represents a basket of securities that is traded on an exchange. |
| (j) | | At October 31, 2011, cost is $571,100,938 for federal income tax purposes and net unrealized appreciation is as follows: |
| | | | | |
| Gross unrealized appreciation | | $ | 27,499,636 | |
| Gross unrealized depreciation | | | (15,595,170 | ) |
| | | | | |
| Net unrealized appreciation | | $ | 11,904,466 | |
| | | | | |
The following is a summary of the fair valuations according to the inputs used as of October 31, 2011, for valuing the Fund’s assets.
Asset Valuation Inputs
| | | | | | | | | | | | | | | | | |
| | | Quoted
| | | | | | | | | | |
| | | Prices in
| | | | | | | | | | |
| | | Active
| | | Significant
| | | | | | | |
| | | Markets for
| | | Other
| | | Significant
| | | | |
| | | Identical
| | | Observable
| | | Unobservable
| | | | |
| | | Assets
| | | Inputs
| | | Inputs
| | | | |
| Description | | (Level 1) | | | (Level 2) | | | (Level 3) | | | Total | |
| Investments in Securities (a) | | | | | | | | | | | | | | | | |
| Long-Term Bonds | | | | | | | | | | | | | | | | |
| Asset-Backed Security | | $ | — | | | $ | 767,669 | | | $ | — | | | $ | 767,669 | |
| Convertible Bond (b) | | | — | | | | — | | | | 18 | | | | 18 | |
| Corporate Bonds | | | — | | | | 54,050,941 | | | | — | | | | 54,050,941 | |
| Foreign Government Bonds | | | — | | | | 1,381,442 | | | | — | | | | 1,381,442 | |
| Medium Term Note | | | — | | | | 557,920 | | | | — | | | | 557,920 | |
| U.S. Government & Federal Agencies | | | — | | | | 144,197,652 | | | | — | | | | 144,197,652 | |
| Yankee Bonds | | | — | | | | 17,012,127 | | | | — | | | | 17,012,127 | |
| | | | | | | | | | | | | | | | | |
| Total Long-Term Bonds | | | — | | | | 217,967,751 | | | | 18 | | | | 217,967,769 | |
| | | | | | | | | | | | | | | | | |
| Common Stocks | | | 356,690,219 | | | | — | | | | — | | | | 356,690,219 | |
| Exchange Traded Fund | | | 1,986,995 | | | | — | | | | — | | | | 1,986,995 | |
| Short-Term Investments | | | | | | | | | | | | | | | | |
| Other Commercial Paper | | | — | | | | 6,288,000 | | | | — | | | | 6,288,000 | |
| Repurchase Agreement | | | — | | | | 72,421 | | | | — | | | | 72,421 | |
| | | | | | | | | | | | | | | | | |
| Total Short-Term Investments | | | — | | | | 6,360,421 | | | | — | | | | 6,360,421 | |
| | | | | | | | | | | | | | | | | |
| Total Investments in Securities | | $ | 358,677,214 | | | $ | 224,328,172 | | | $ | 18 | | | $ | 583,005,404 | |
| | | | | | | | | | | | | | | | | |
| |
| (a) | For a complete listing of investments and their industries, see the Portfolio of Investments. |
| |
| (b) | The Level 3 security valued at $18 is held in Internet within the Convertible Bond section of the Portfolio of Investments. |
The Fund recognizes transfers between the levels as of the beginning of the period.
For the year ended October 31, 2011, the Fund did not have any transfers between Level 1 and Level 2 fair value measurements. (See Note 2)
The notes to the financial statements are an integral part of,
| |
| 22 MainStay Balanced Fund | and should be read in conjunction with, the financial statements. |
The following is a reconciliation of investments in which significant unobservable inputs (Level 3) were used in determining value:
| | | | | | | | | | | | | | | | | | | | | | | | | | | | | | | | | | | | | | | | | |
| | | | | | | | | | | | | | | | | | | | | | | | | | | | | | Change in
| |
| | | | | | | | | | | | | | | | | | | | | | | | | | | | | | Unrealized
| |
| | | | | | | | | | | | | | | | | | | | | | | | | | | | | | Appreciation
| |
| | | | | | | | | | | | | | | | | | | | | | | | | | | | | | (Depreciation)
| |
| | | | | | | | | | | | | | | | | | | | | | | | | | | | | | from
| |
| | | Balance
| | | | | | | | | Change in
| | | | | | | | | | | | | | | Balance
| | | Investments
| |
| | | as of
| | | Accrued
| | | Realized
| | | Unrealized
| | | | | | | | | Transfers
| | | Transfers
| | | as of
| | | Still Held at
| |
| | | October 31,
| | | Discounts
| | | Gain
| | | Appreciation
| | | | | | | | | in to
| | | out of
| | | October 31,
| | | October 31,
| |
| Investments in Securities | | 2010 | | | (Premiums) | | | (Loss) | | | (Depreciation) | | | Purchases | | | Sales | | | Level 3 | | | Level 3 | | | 2011 | | | 2011 (a) | |
| Convertible Bond | | | | | | | | | | | | | | | | | | | | | | | | | | | | | | | | | | | | | | | | |
| Internet | | $ | 18 | | | $ | — | | | $ | — | | | $ | — | | | $ | — | | | $ | — | | | $ | — | | | $ | — | | | $ | 18 | | | $ | — | |
| | | | | | | | | | | | | | | | | | | | | | | | | | | | | | | | | | | | | | | | | |
| Total | | $ | 18 | | | $ | — | | | $ | — | | | $ | — | | | $ | — | | | $ | — | | | $ | — | | | $ | — | | | $ | 18 | | | $ | — | |
| | | | | | | | | | | | | | | | | | | | | | | | | | | | | | | | | | | | | | | | | |
| |
| (a) | Included in “Net change in unrealized appreciation (depreciation) on investments” in the Statement of Operations. |
The notes to the financial statements are an integral part of,
| |
| and should be read in conjunction with, the financial statements. | mainstayinvestments.com 23 |
Statement of Assets and Liabilities as of October 31, 2011
| | | | | |
Assets
|
Investment in securities, at value
(identified cost $564,925,141) | | $ | 583,005,404 | |
| Cash | | | 6,178 | |
| Receivables: | | | | |
| Investment securities sold | | | 47,936,320 | |
| Dividends and interest | | | 1,489,676 | |
| Fund shares sold | | | 532,401 | |
| Other assets | | | 45,544 | |
| | | | | |
| Total assets | | | 633,015,523 | |
| | | | | |
| | | | | |
| | | | | |
Liabilities
|
| Payables: | | | | |
| Investment securities purchased | | | 51,152,551 | |
| Fund shares redeemed | | | 1,130,768 | |
| Manager (See Note 3) | | | 341,558 | |
| Transfer agent (See Note 3) | | | 226,635 | |
| NYLIFE Distributors (See Note 3) | | | 146,217 | |
| Shareholder communication | | | 52,354 | |
| Professional fees | | | 35,036 | |
| Custodian | | | 6,142 | |
| Trustees | | | 2,326 | |
| Accrued expenses | | | 5,731 | |
| | | | | |
| Total liabilities | | | 53,099,318 | |
| | | | | |
| Net assets | | $ | 579,916,205 | |
| | | | | |
| | | | | |
| | | | | |
Composition of Net Assets
|
| Shares of beneficial interest outstanding (par value of $.01 per share) unlimited number of shares authorized | | $ | 222,722 | |
| Additional paid-in capital | | | 611,760,679 | |
| | | | | |
| | | | 611,983,401 | |
| Accumulated net realized gain (loss) on investments and futures transactions | | | (50,147,459 | ) |
| Net unrealized appreciation (depreciation) on investments | | | 18,080,263 | |
| | | | | |
| Net assets | | $ | 579,916,205 | |
| | | | | |
Investor Class | | | | |
| Net assets applicable to outstanding shares | | $ | 58,345,336 | |
| | | | | |
| Shares of beneficial interest outstanding | | | 2,240,092 | |
| | | | | |
| Net asset value per share outstanding | | $ | 26.05 | |
| Maximum sales charge (5.50% of offering price) | | | 1.52 | |
| | | | | |
| Maximum offering price per share outstanding | | $ | 27.57 | |
| | | | | |
Class A | | | | |
| Net assets applicable to outstanding shares | | $ | 133,436,150 | |
| | | | | |
| Shares of beneficial interest outstanding | | | 5,125,532 | |
| | | | | |
| Net asset value per share outstanding | | $ | 26.03 | |
| Maximum sales charge (5.50% of offering price) | | | 1.52 | |
| | | | | |
| Maximum offering price per share outstanding | | $ | 27.55 | |
| | | | | |
Class B | | | | |
| Net assets applicable to outstanding shares | | $ | 61,438,445 | |
| | | | | |
| Shares of beneficial interest outstanding | | | 2,366,011 | |
| | | | | |
| Net asset value and offering price per share outstanding | | $ | 25.97 | |
| | | | | |
Class C | | | | |
| Net assets applicable to outstanding shares | | $ | 56,010,031 | |
| | | | | |
| Shares of beneficial interest outstanding | | | 2,157,755 | |
| | | | | |
| Net asset value and offering price per share outstanding | | $ | 25.96 | |
| | | | | |
Class I | | | | |
| Net assets applicable to outstanding shares | | $ | 208,771,587 | |
| | | | | |
| Shares of beneficial interest outstanding | | | 8,004,750 | |
| | | | | |
| Net asset value and offering price per share outstanding | | $ | 26.08 | |
| | | | | |
Class R1 | | | | |
| Net assets applicable to outstanding shares | | $ | 20,336,833 | |
| | | | | |
| Shares of beneficial interest outstanding | | | 780,666 | |
| | | | | |
| Net asset value and offering price per share outstanding | | $ | 26.05 | |
| | | | | |
Class R2 | | | | |
| Net assets applicable to outstanding shares | | $ | 41,343,645 | |
| | | | | |
| Shares of beneficial interest outstanding | | | 1,588,442 | |
| | | | | |
| Net asset value and offering price per share outstanding | | $ | 26.03 | |
| | | | | |
Class R3 | | | | |
| Net assets applicable to outstanding shares | | $ | 234,178 | |
| | | | | |
| Shares of beneficial interest outstanding | | | 8,998 | |
| | | | | |
| Net asset value and offering price per share outstanding | | $ | 26.03 | |
| | | | | |
The notes to the financial statements are an integral part of,
| |
| 24 MainStay Balanced Fund | and should be read in conjunction with, the financial statements. |
Statement of Operations for the year ended October 31, 2011
| | | | | |
Investment Income (Loss)
|
Income | | | | |
| Dividends (a) | | $ | 9,036,718 | |
| Interest (b) | | | 6,558,358 | |
| | | | | |
| Total income | | | 15,595,076 | |
| | | | | |
Expenses | | | | |
| Manager (See Note 3) | | | 4,366,082 | |
| Distribution/Service—Investor Class (See Note 3) | | | 147,927 | |
| Distribution/Service—Class A (See Note 3) | | | 384,451 | |
| Distribution/Service—Class B (See Note 3) | | | 677,496 | |
| Distribution/Service—Class C (See Note 3) | | | 607,819 | |
| Distribution/Service—Class R2 (See Note 3) | | | 107,613 | |
| Distribution/Service—Class R3 (See Note 3) | | | 1,032 | |
| Transfer agent (See Note 3) | | | 1,387,058 | |
| Registration | | | 128,162 | |
| Shareholder communication | | | 124,396 | |
| Professional fees | | | 82,631 | |
| Shareholder service (See Note 3) | | | 63,871 | |
| Custodian | | | 55,919 | |
| Trustees | | | 16,902 | |
| Miscellaneous | | | 53,715 | |
| | | | | |
| Total expenses | | | 8,205,074 | |
| | | | | |
| Net investment income (loss) | | | 7,390,002 | |
| | | | | |
| | | | | |
| | | | | |
Realized and Unrealized Gain (Loss) on Investments
|
| Net realized gain (loss) on: | | | | |
| Security transactions | | | 71,427,646 | |
| Futures transactions | | | (249,263 | ) |
| | | | | |
| Net realized gain (loss) on investments and futures transactions | | | 71,178,383 | |
| | | | | |
| Net change in unrealized appreciation (depreciation) on investments | | | (43,928,717 | ) |
| | | | | |
| Net realized and unrealized gain (loss) on investments and futures transactions | | | 27,249,666 | |
| | | | | |
| Net increase (decrease) in net assets resulting from operations | | $ | 34,639,668 | |
| | | | | |
| |
| (a) | Dividends recorded net of foreign withholding taxes in the amount of $7,110. |
| |
| (b) | Interest recorded net of foreign withholding taxes in the amount of $3,391. |
The notes to the financial statements are an integral part of,
| |
| and should be read in conjunction with, the financial statements. | mainstayinvestments.com 25 |
Statements of Changes in Net Assets
for the years ended October 31, 2011 and October 31, 2010
| | | | | | | | | |
| | | 2011 | | | 2010 | |
Increase (Decrease) in Net Assets
|
| Operations: | | | | | | | | |
| Net investment income (loss) | | $ | 7,390,002 | | | $ | 8,613,284 | |
| Net realized gain (loss) on investments and futures transactions | | | 71,178,383 | | | | 40,906,947 | |
| Net change in unrealized appreciation (depreciation) on investments | | | (43,928,717 | ) | | | 36,658,585 | |
| | | |
| | | |
| Net increase (decrease) in net assets resulting from operations | | | 34,639,668 | | | | 86,178,816 | |
| | | |
| | | |
| Dividends to shareholders: | | | | | | | | |
| From net investment income: | | | | | | | | |
| Investor Class | | | (683,012 | ) | | | (723,530 | ) |
| Class A | | | (2,073,143 | ) | | | (2,224,284 | ) |
| Class B | | | (264,606 | ) | | | (359,769 | ) |
| Class C | | | (237,044 | ) | | | (319,986 | ) |
| Class I | | | (3,463,288 | ) | | | (3,626,888 | ) |
| Class R1 | | | (307,786 | ) | | | (350,029 | ) |
| Class R2 | | | (537,872 | ) | | | (738,497 | ) |
| Class R3 | | | (2,035 | ) | | | (1,480 | ) |
| | | |
| | | |
| Total dividends to shareholders | | | (7,568,786 | ) | | | (8,344,463 | ) |
| | | |
| | | |
| Capital share transactions: | | | | | | | | |
| Net proceeds from sale of shares | | | 85,444,760 | | | | 89,582,782 | |
| Net asset value of shares issued to shareholders in reinvestment of dividends | | | 7,227,009 | | | | 7,945,264 | |
| Cost of shares redeemed | | | (166,592,270 | ) | | | (199,563,577 | ) |
| | | |
| | | |
| Increase (decrease) in net assets derived from capital share transactions | | | (73,920,501 | ) | | | (102,035,531 | ) |
| | | |
| | | |
| Net increase (decrease) in net assets | | | (46,849,619 | ) | | | (24,201,178 | ) |
| | | | | | | | | |
| | | | | | | | | |
Net Assets
|
| Beginning of year | | | 626,765,824 | | | | 650,967,002 | |
| | | |
| | | |
| End of year | | $ | 579,916,205 | | | $ | 626,765,824 | |
| | | |
| | | |
| Undistributed net investment income at end of year | | $ | — | | | $ | 414,167 | |
| | | |
| | | |
The notes to the financial statements are an integral part of,
| |
| 26 MainStay Balanced Fund | and should be read in conjunction with, the financial statements. |
Financial Highlights selected per share data and ratios
| | | | | | | | | | | | | | | | | |
| | | Investor Class | |
| | | | | | February 28,
| |
| | | | | | 2008**
| |
| | | | | | | | | | | | through
| |
| | | Year ended October 31, | | | October 31, | |
| | | 2011 | | | 2010 | | | 2009 | | | 2008 | |
| Net asset value at beginning of period | | $ | 24.95 | | | $ | 22.09 | | | $ | 19.41 | | | $ | 25.29 | |
| | | | | | | | | | | | | �� | | | | |
| Net investment income (loss) (a) | | | 0.29 | | | | 0.30 | | | | 0.22 | | | | 0.29 | |
| Net realized and unrealized gain (loss) on investments | | | 1.11 | | | | 2.86 | | | | 2.71 | | | | (5.82 | ) |
| | | | | | | | | | | | | | | | | |
| Total from investment operations | | | 1.40 | | | | 3.16 | | | | 2.93 | | | | (5.53 | ) |
| | | | | | | | | | | | | | | | | |
| Less dividends: | | | | | | | | | | | | | | | | |
| From net investment income | | | (0.30 | ) | | | (0.30 | ) | | | (0.25 | ) | | | (0.35 | ) |
| | | | | | | | | | | | | | | | | |
| Net asset value at end of period | | $ | 26.05 | | | $ | 24.95 | | | $ | 22.09 | | | $ | 19.41 | |
| | | | | | | | | | | | | | | | | |
| Total investment return (b) | | | 5.62 | % | | | 14.37 | % | | | 15.30 | % | | | (22.12 | %)(c) |
| Ratios (to average net assets)/Supplemental Data: | | | | | | | | | | | | | | | | |
| Net investment income (loss) | | | 1.12 | % | | | 1.28 | % | | | 1.11 | % | | | 1.81 | % †† |
| Net expenses | | | 1.38 | % | | | 1.44 | % | | | 1.48 | % | | | 1.38 | % †† |
| Expenses (before waiver/reimbursement) | | | 1.38 | % | | | 1.44 | % | | | 1.53 | % | | | 1.38 | % †† |
| Portfolio turnover rate | | | 221 | % (d) | | | 123 | % | | | 162 | % | | | 69 | % |
| Net assets at end of period (in 000’s) | | $ | 58,345 | | | $ | 59,469 | | | $ | 54,956 | | | $ | 49,971 | |
| | | |
| ** | | Commencement of operations. |
| †† | | Annualized. |
| (a) | | Per share data based on average shares outstanding during the period. |
| (b) | | Total investment return is calculated exclusive of sales charges and assumes the reinvestment of dividends and distributions. |
| (c) | | Total investment return is not annualized. |
| (d) | | The portfolio turnover rate not including mortgage dollar rolls was 218% for the year ended October 31, 2011. |
| | | | | | | | | | | | | | | | | | | | | |
| | | Class A | |
| | | Year ended October 31, | |
| | | | | | | | | | | | | |
| | | 2011 | | | 2010 | | | 2009 | | | 2008 | | | 2007 | |
| Net asset value at beginning of year | | $ | 24.94 | | | $ | 22.09 | | | $ | 19.41 | | | $ | 28.42 | | | $ | 27.92 | |
| | | | | | | | | | | | | | | | | | | | | |
| Net investment income (loss) (a) | | | 0.34 | | | | 0.35 | | | | 0.27 | | | | 0.46 | | | | 0.49 | |
| Net realized and unrealized gain (loss) on investments | | | 1.10 | | | | 2.84 | | | | 2.70 | | | | (7.26 | ) | | | 1.25 | |
| | | | | | | | | | | | | | | | | | | | | |
| Total from investment operations | | | 1.44 | | | | 3.19 | | | | 2.97 | | | | (6.80 | ) | | | 1.74 | |
| | | | | | | | | | | | | | | | | | | | | |
| Less dividends and distributions: | | | | | | | | | | | | | | | | | | | | |
| From net investment income | | | (0.35 | ) | | | (0.34 | ) | | | (0.29 | ) | | | (0.46 | ) | | | (0.51 | ) |
| From net realized gain on investments | | | — | | | | — | | | | — | | | | (1.75 | ) | | | (0.73 | ) |
| | | | | | | | | | | | | | | | | | | | | |
| Total dividends and distributions | | | (0.35 | ) | | | (0.34 | ) | | | (0.29 | ) | | | (2.21 | ) | | | (1.24 | ) |
| | | | | | | | | | | | | | | | | | | | | |
| Net asset value at end of year | | $ | 26.03 | | | $ | 24.94 | | | $ | 22.09 | | | $ | 19.41 | | | $ | 28.42 | |
| | | | | | | | | | | | | | | | | | | | | |
| Total investment return (b) | | | 5.79 | % | | | 14.54 | % | | | 15.52 | % | | | (25.84 | %) | | | 6.34 | % |
| Ratios (to average net assets)/Supplemental Data: | | | | | | | | | | | | | | | | | | | | |
| Net investment income (loss) | | | 1.31 | % | | | 1.47 | % | | | 1.36 | % | | | 1.87 | % | | | 1.74 | % |
| Net expenses | | | 1.19 | % | | | 1.25 | % | | | 1.27 | % | | | 1.29 | % | | | 1.28 | % |
| Expenses (before waiver/reimbursement) | | | 1.19 | % | | | 1.25 | % | | | 1.31 | % | | | 1.29 | % | | | 1.28 | % |
| Portfolio turnover rate | | | 221 | % (c) | | | 123 | % | | | 162 | % | | | 69 | % | | | 68 | % |
| Net assets at end of year (in 000’s) | | $ | 133,436 | | | $ | 152,963 | | | $ | 154,728 | | | $ | 173,834 | | | $ | 405,912 | |
| | | |
| (a) | | Per share data based on average shares outstanding during the year. |
| (b) | | Total investment return is calculated exclusive of sales charges and assumes the reinvestment of dividends and distributions. |
| (c) | | The portfolio turnover rate not including mortgage dollar rolls was 218% for the year ended October 31, 2011. |
The notes to the financial statements are an integral part of,
| |
| and should be read in conjunction with, the financial statements. | mainstayinvestments.com 27 |
Financial Highlights selected per share data and ratios
| | | | | | | | | | | | | | | | | | | | | |
| | | Class B | |
| | | Year ended October 31, | |
| | | 2011 | | | 2010 | | | 2009 | | | 2008 | | | 2007 | |
| Net asset value at beginning of year | | $ | 24.87 | | | $ | 22.02 | | | $ | 19.35 | | | $ | 28.34 | | | $ | 27.84 | |
| | | | | | | | | | | | | | | | | | | | | |
| Net investment income (loss) (a) | | | 0.10 | | | | 0.13 | | | | 0.08 | | | | 0.26 | | | | 0.28 | |
| Net realized and unrealized gain (loss) on investments | | | 1.10 | | | | 2.84 | | | | 2.69 | | | | (7.25 | ) | | | 1.24 | |
| | | | | | | | | | | | | | | | | | | | | |
| Total from investment operations | | | 1.20 | | | | 2.97 | | | | 2.77 | | | | (6.99 | ) | | | 1.52 | |
| | | | | | | | | | | | | | | | | | | | | |
| Less dividends and distributions: | | | | | | | | | | | | | | | | | | | | |
| From net investment income | | | (0.10 | ) | | | (0.12 | ) | | | (0.10 | ) | | | (0.25 | ) | | | (0.29 | ) |
| From net realized gain on investments | | | — | | | | — | | | | — | | | | (1.75 | ) | | | (0.73 | ) |
| | | | | | | | | | | | | | | | | | | | | |
| Total dividends and distributions | | | (0.10 | ) | | | (0.12 | ) | | | (0.10 | ) | | | (2.00 | ) | | | (1.02 | ) |
| | | | | | | | | | | | | | | | | | | | | |
| Net asset value at end of year | | $ | 25.97 | | | $ | 24.87 | | | $ | 22.02 | | | $ | 19.35 | | | $ | 28.34 | |
| | | | | | | | | | | | | | | | | | | | | |
| Total investment return (b) | | | 4.83 | % | | | 13.50 | % | | | 14.42 | % | | | (26.47 | %) | | | 5.56 | % |
| Ratios (to average net assets)/Supplemental Data: | | | | | | | | | | | | | | | | | | | | |
| Net investment income (loss) | | | 0.37 | % | | | 0.53 | % | | | 0.39 | % | | | 1.06 | % | | | 0.99 | % |
| Net expenses | | | 2.13 | % | | | 2.19 | % | | | 2.23 | % | | | 2.10 | % | | | 2.03 | % |
| Expenses (before waiver/reimbursement) | | | 2.13 | % | | | 2.19 | % | | | 2.28 | % | | | 2.10 | % | | | 2.03 | % |
| Portfolio turnover rate | | | 221 | % (c) | | | 123 | % | | | 162 | % | | | 69 | % | | | 68 | % |
| Net assets at end of year (in 000’s) | | $ | 61,438 | | | $ | 70,778 | | | $ | 74,932 | | | $ | 81,144 | | | $ | 145,919 | |
| | | |
| (a) | | Per share data based on average shares outstanding during the year. |
| (b) | | Total investment return is calculated exclusive of sales charges and assumes the reinvestment of dividends and distributions. |
| (c) | | The portfolio turnover rate not including mortgage dollar rolls was 218% for the year ended October 31, 2011. |
| | | | | | | | | | | | | | | | | | | | | |
| | | Class C | |
| | | Year ended October 31, | |
| | | 2011 | | | 2010 | | | 2009 | | | 2008 | | | 2007 | |
| Net asset value at beginning of year | | $ | 24.86 | | | $ | 22.01 | | | $ | 19.34 | | | $ | 28.33 | | | $ | 27.83 | |
| | | | | | | | | | | | | | | | | | | | | |
| Net investment income (loss) (a) | | | 0.10 | | | | 0.13 | | | | 0.08 | | | | 0.26 | | | | 0.28 | |
| Net realized and unrealized gain (loss) on investments | | | 1.10 | | | | 2.84 | | | | 2.69 | | | | (7.25 | ) | | | 1.24 | |
| | | | | | | | | | | | | | | | | | | | | |
| Total from investment operations | | | 1.20 | | | | 2.97 | | | | 2.77 | | | | (6.99 | ) | | | 1.52 | |
| | | | | | | | | | | | | | | | | | | | | |
| Less dividends and distributions: | | | | | | | | | | | | | | | | | | | | |
| From net investment income | | | (0.10 | ) | | | (0.12 | ) | | | (0.10 | ) | | | (0.25 | ) | | | (0.29 | ) |
| From net realized gain on investments | | | — | | | | — | | | | — | | | | (1.75 | ) | | | (0.73 | ) |
| | | | | | | | | | | | | | | | | | | | | |
| Total dividends and distributions | | | (0.10 | ) | | | (0.12 | ) | | | (0.10 | ) | | | (2.00 | ) | | | (1.02 | ) |
| | | | | | | | | | | | | | | | | | | | | |
| Net asset value at end of year | | $ | 25.96 | | | $ | 24.86 | | | $ | 22.01 | | | $ | 19.34 | | | $ | 28.33 | |
| | | | | | | | | | | | | | | | | | | | | |
| Total investment return (b) | | | 4.83 | % | | | 13.51 | % | | | 14.43 | % | | | (26.48 | %) | | | 5.56 | % |
| Ratios (to average net assets)/Supplemental Data: | | | | | | | | | | | | | | | | | | | | |
| Net investment income (loss) | | | 0.37 | % | | | 0.53 | % | | | 0.40 | % | | | 1.06 | % | | | 0.99 | % |
| Net expenses | | | 2.13 | % | | | 2.19 | % | | | 2.23 | % | | | 2.10 | % | | | 2.03 | % |
| Expenses (before waiver/reimbursement) | | | 2.13 | % | | | 2.19 | % | | | 2.28 | % | | | 2.10 | % | | | 2.03 | % |
| Portfolio turnover rate | | | 221 | % (c) | | | 123 | % | | | 162 | % | | | 69 | % | | | 68 | % |
| Net assets at end of year (in 000’s) | | $ | 56,010 | | | $ | 62,892 | | | $ | 66,407 | | | $ | 79,423 | | | $ | 161,163 | |
| | | |
| (a) | | Per share data based on average shares outstanding during the year. |
| (b) | | Total investment return is calculated exclusive of sales charges and assumes the reinvestment of dividends and distributions. |
| (c) | | The portfolio turnover rate not including mortgage dollar rolls was 218% for the year ended October 31, 2011. |
The notes to the financial statements are an integral part of,
| |
| 28 MainStay Balanced Fund | and should be read in conjunction with, the financial statements. |
Financial Highlights selected per share data and ratios
| | | | | | | | | | | | | | | | | | | | | |
| | | Class I | |
| | | Year ended October 31, | |
| | | 2011 | | | 2010 | | | 2009 | | | 2008 | | | 2007 | |
| Net asset value at beginning of year | | $ | 24.99 | | | $ | 22.12 | | | $ | 19.44 | | | $ | 28.47 | | | $ | 27.96 | |
| | | | | | | | | | | | | | | | | | | | | |
| Net investment income (loss) (a) | | | 0.41 | | | | 0.41 | | | | 0.33 | | | | 0.55 | | | | 0.60 | |
| Net realized and unrealized gain (loss) on investments | | | 1.10 | | | | 2.86 | | | | 2.71 | | | | (7.28 | ) | | | 1.25 | |
| | | | | | | | | | | | | | | | | | | | | |
| Total from investment operations | | | 1.51 | | | | 3.27 | | | | 3.04 | | | | (6.73 | ) | | | 1.85 | |
| | | | | | | | | | | | | | | | | | | | | |
| Less dividends and distributions: | | | | | | | | | | | | | | | | | | | | |
| From net investment income | | | (0.42 | ) | | | (0.40 | ) | | | (0.36 | ) | | | (0.55 | ) | | | (0.61 | ) |
| From net realized gain on investments | | | — | | | | — | | | | — | | | | (1.75 | ) | | | (0.73 | ) |
| | | | | | | | | | | | | | | | | | | | | |
| Total dividends and distributions | | | (0.42 | ) | | | (0.40 | ) | | | (0.36 | ) | | | (2.30 | ) | | | (1.34 | ) |
| | | | | | | | | | | | | | | | | | | | | |
| Net asset value at end of year | | $ | 26.08 | | | $ | 24.99 | | | $ | 22.12 | | | $ | 19.44 | | | $ | 28.47 | |
| | | | | | | | | | | | | | | | | | | | | |
| Total investment return (b) | | | 6.04 | % | | | 14.90 | % | | | 15.89 | % | | | (25.62 | %) | | | 6.77 | % |
| Ratios (to average net assets)/Supplemental Data: | | | | | | | | | | | | | | | | | | | | |
| Net investment income (loss) | | | 1.56 | % | | | 1.73 | % | | | 1.65 | % | | | 2.22 | % | | | 2.10 | % |
| Net expenses | | | 0.94 | % | | | 1.00 | % | | | 0.96 | % | | | 0.94 | % | | | 0.91 | % |
| Expenses (before reimbursement/waiver) | | | 0.94 | % | | | 1.00 | % | | | 1.06 | % | | | 1.01 | % | | | 0.95 | % |
| Portfolio turnover rate | | | 221 | % (c) | | | 123 | % | | | 162 | % | | | 69 | % | | | 68 | % |
| Net assets at end of year (in 000’s) | | $ | 208,772 | | | $ | 219,406 | | | $ | 208,393 | | | $ | 199,126 | | | $ | 410,355 | |
| | | |
| (a) | | Per share data based on average shares outstanding during the year. |
| (b) | | Total investment return is calculated exclusive of sales charges and assumes the reinvestment of dividends and distributions. Class I shares are not subject to sales charges. |
| (c) | | The portfolio turnover rate not including mortgage dollar rolls was 218% for the year ended October 31, 2011. |
| | | | | | | | | | | | | | | | | | | | | |
| | | Class R1 | |
| | | Year ended October 31, | |
| | | 2011 | | | 2010 | | | 2009 | | | 2008 | | | 2007 | |
| Net asset value at beginning of year | | $ | 24.96 | | | $ | 22.10 | | | $ | 19.42 | | | $ | 28.44 | | | $ | 27.94 | |
| | | | | | | | | | | | | | | | | | | | | |
| Net investment income (loss) (a) | | | 0.38 | | | | 0.39 | | | | 0.30 | | | | 0.53 | | | | 0.57 | |
| Net realized and unrealized gain (loss) on investments | | | 1.10 | | | | 2.85 | | | | 2.72 | | | | (7.28 | ) | | | 1.25 | |
| | | | | | | | | | | | | | | | | | | | | |
| Total from investment operations | | | 1.48 | | | | 3.24 | | | | 3.02 | | | | (6.75 | ) | | | 1.82 | |
| | | | | | | | | | | | | | | | | | | | | |
| Less dividends and distributions: | | | | | | | | | | | | | | | | | | | | |
| From net investment income | | | (0.39 | ) | | | (0.38 | ) | | | (0.34 | ) | | | (0.52 | ) | | | (0.59 | ) |
| From net realized gain on investments | | | — | | | | — | | | | — | | | | (1.75 | ) | | | (0.73 | ) |
| | | | | | | | | | | | | | | | | | | | | |
| Total dividends and distributions | | | (0.39 | ) | | | (0.38 | ) | | | (0.34 | ) | | | (2.27 | ) | | | (1.32 | ) |
| | | | | | | | | | | | | | | | | | | | | |
| Net asset value at end of year | | $ | 26.05 | | | $ | 24.96 | | | $ | 22.10 | | | $ | 19.42 | | | $ | 28.44 | |
| | | | | | | | | | | | | | | | | | | | | |
| Total investment return (b) | | | 5.94 | % | | | 14.75 | % | | | 15.80 | % | | | (25.69 | %) | | | 6.64 | % |
| Ratios (to average net assets)/Supplemental Data: | | | | | | | | | | | | | | | | | | | | |
| Net investment income (loss) | | | 1.46 | % | | | 1.64 | % | | | 1.53 | % | | | 2.13 | % | | | 2.02 | % |
| Net expenses | | | 1.04 | % | | | 1.10 | % | | | 1.06 | % | | | 1.04 | % | | | 1.01 | % |
| Expenses (before waiver/reimbursement) | | | 1.04 | % | | | 1.10 | % | | | 1.16 | % | | | 1.11 | % | | | 1.05 | % |
| Portfolio turnover rate | | | 221 | % (c) | | | 123 | % | | | 162 | % | | | 69 | % | | | 68 | % |
| Net assets at end of year (in 000’s) | | $ | 20,337 | | | $ | 19,660 | | | $ | 31,039 | | | $ | 25,038 | | | $ | 69,474 | |
| | | |
| (a) | | Per share data based on average shares outstanding during the year. |
| (b) | | Total investment return is calculated exclusive of sales charges and assumes the reinvestment of dividends and distributions. Class R1 shares are not subject to sales charges. |
| (c) | | The portfolio turnover rate not including mortgage dollar rolls was 218% for the year ended October 31, 2011. |
The notes to the financial statements are an integral part of,
| |
| and should be read in conjunction with, the financial statements. | mainstayinvestments.com 29 |
Financial Highlights selected per share data and ratios
| | | | | | | | | | | | | | | | | | | | | |
| | | Class R2 | |
| | | Year ended October 31, | |
| | | 2011 | | | 2010 | | | 2009 | | | 2008 | | | 2007 | |
| Net asset value at beginning of year | | $ | 24.94 | | | $ | 22.08 | | | $ | 19.41 | | | $ | 28.42 | | | $ | 27.91 | |
| | | | | | | | | | | | | | | | | | | | | |
| Net investment income (loss) (a) | | | 0.31 | | | | 0.33 | | | | 0.26 | | | | 0.46 | | | | 0.50 | |
| Net realized and unrealized gain (loss) on investments | | | 1.10 | | | | 2.85 | | | | 2.70 | | | | (7.26 | ) | | | 1.25 | |
| | | | | | | | | | | | | | | | | | | | | |
| Total from investment operations | | | 1.41 | | | | 3.18 | | | | 2.96 | | | | (6.80 | ) | | | 1.75 | |
| | | | | | | | | | | | | | | | | | | | | |
| Less dividends and distributions: | | | | | | | | | | | | | | | | | | | | |
| From net investment income | | | (0.32 | ) | | | (0.32 | ) | | | (0.29 | ) | | | (0.46 | ) | | | (0.51 | ) |
| From net realized gain on investments | | | — | | | | — | | | | — | | | | (1.75 | ) | | | (0.73 | ) |
| | | | | | | | | | | | | | | | | | | | | |
| Total dividends and distributions | | | (0.32 | ) | | | (0.32 | ) | | | (0.29 | ) | | | (2.21 | ) | | | (1.24 | ) |
| | | | | | | | | | | | | | | | | | | | | |
| Net asset value at end of year | | $ | 26.03 | | | $ | 24.94 | | | $ | 22.08 | | | $ | 19.41 | | | $ | 28.42 | |
| | | | | | | | | | | | | | | | | | | | | |
| Total investment return (b) | | | 5.68 | % | | | 14.47 | % | | | 15.45 | % | | | (25.86 | %) | | | 6.40 | % |
| Ratios (to average net assets)/Supplemental Data: | | | | | | | | | | | | | | | | | | | | |
| Net investment income (loss) | | | 1.21 | % | | | 1.38 | % | | | 1.30 | % | | | 1.87 | % | | | 1.76 | % |
| Net expenses | | | 1.29 | % | | | 1.35 | % | | | 1.31 | % | | | 1.29 | % | | | 1.26 | % |
| Expenses (before waiver/reimbursement) | | | 1.29 | % | | | 1.35 | % | | | 1.41 | % | | | 1.36 | % | | | 1.30 | % |
| Portfolio turnover rate | | | 221 | % (c) | | | 123 | % | | | 162 | % | | | 69 | % | | | 68 | % |
| Net assets at end of year (in 000’s) | | $ | 41,344 | | | $ | 41,429 | | | $ | 60,425 | | | $ | 54,849 | | | $ | 105,100 | |
| | | |
| (a) | | Per share data based on average shares outstanding during the year. |
| (b) | | Total investment return is calculated exclusive of sales charges and assumes the reinvestment of dividends and distributions. Class R2 shares are not subject to sales charges. |
| (c) | | The portfolio turnover rate not including mortgage dollar rolls was 218% for the year ended October 31, 2011. |
| | | | | | | | | | | | | | | | | | | | | |
| | | Class R3 | |
| | | Year ended October 31, | |
| | | 2011 | | | 2010 | | | 2009 | | | 2008 | | | 2007 | |
| Net asset value at beginning of year | | $ | 24.93 | | | $ | 22.08 | | | $ | 19.41 | | | $ | 28.41 | | | $ | 27.91 | |
| | | | | | | | | | | | | | | | | | | | | |
| Net investment income (loss) (a) | | | 0.24 | | | | 0.27 | | | | 0.20 | | | | 0.40 | | | | 0.41 | |
| Net realized and unrealized gain (loss) on investments | | | 1.12 | | | | 2.84 | | | | 2.71 | | | | (7.26 | ) | | | 1.26 | |
| | | | | | | | | | | | | | | | | | | | | |
| Total from investment operations | | | 1.36 | | | | 3.11 | | | | 2.91 | | | | (6.86 | ) | | | 1.67 | |
| | | | | | | | | | | | | | | | | | | | | |
| Less dividends and distributions: | | | | | | | | | | | | | | | | | | | | |
| From net investment income | | | (0.26 | ) | | | (0.26 | ) | | | (0.24 | ) | | | (0.39 | ) | | | (0.44 | ) |
| From net realized gain on investments | | | — | | | | — | | | | — | | | | (1.75 | ) | | | (0.73 | ) |
| | | | | | | | | | | | | | | | | | | | | |
| Total dividends and distributions | | | (0.26 | ) | | | (0.26 | ) | | | (0.24 | ) | | | (2.14 | ) | | | (1.17 | ) |
| | | | | | | | | | | | | | | | | | | | | |
| Net asset value at end of year | | $ | 26.03 | | | $ | 24.93 | | | $ | 22.08 | | | $ | 19.41 | | | $ | 28.41 | |
| | | | | | | | | | | | | | | | | | | | | |
| Total investment return (b) | | | 5.47 | % | | | 14.16 | % | | | 15.17 | % | | | (26.02 | %) | | | 6.10 | % |
| Ratios (to average net assets)/Supplemental Data: | | | | | | | | | | | | | | | | | | | | |
| Net investment income (loss) | | | 0.92 | % | | | 1.12 | % | | | 0.98 | % | | | 1.62 | % | | | 1.46 | % |
| Net expenses | | | 1.54 | % | | | 1.59 | % | | | 1.56 | % | | | 1.54 | % | | | 1.52 | % |
| Expenses (before waiver/reimbursement) | | | 1.54 | % | | | 1.59 | % | | | 1.65 | % | | | 1.61 | % | | | 1.56 | % |
| Portfolio turnover rate | | | 221 | % (c) | | | 123 | % | | | 162 | % | | | 69 | % | | | 68 | % |
| Net assets at end of year (in 000’s) | | $ | 234 | | | $ | 168 | | | $ | 88 | | | $ | 45 | | | $ | 37 | |
| | | |
| (a) | | Per share data based on average shares outstanding during the year. |
| (b) | | Total investment return is calculated exclusive of sales charges and assumes the reinvestment of dividends and distributions. Class R3 shares are not subject to sales charges. |
| (c) | | The portfolio turnover rate not including mortgage dollar rolls was 218% for the year ended October 31, 2011. |
The notes to the financial statements are an integral part of,
| |
| 30 MainStay Balanced Fund | and should be read in conjunction with, the financial statements. |
Notes to Financial Statements
Note 1–Organization and Business
Eclipse Funds (the “Trust”) was organized on July 30, 1986, as a Massachusetts business trust. The Trust is registered under the Investment Company Act of 1940, as amended (the “1940 Act”), as an open-end management investment company, and is comprised of two funds (collectively referred to as the “Funds”). These financial statements and notes relate only to the MainStay Balanced Fund (the “Fund”), a diversified fund.
The Fund currently offers eight classes of shares. Class I shares commenced operations on May 1, 1989. Class C shares commenced operations on December 30, 2002. Class A, Class B, Class R1 and Class R2 shares commenced operations on January 2, 2004. Class R3 shares commenced operations on April 28, 2006. Investor Class shares commenced operations on February 28, 2008. Investor Class and Class A shares are offered at net asset value (“NAV”) per share plus an initial sales charge. No sales charge applies on investments of $1 million or more (and certain other qualified purchases) in Investor Class and Class A shares, but a contingent deferred sales charge (“CDSC”) is imposed on certain redemptions made within one year of the date of purchase. Class B and Class C shares are offered at NAV without an initial sales charge, although a declining CDSC may be imposed on redemptions made within six years of the date of purchase of Class B shares and a 1.00% CDSC may be imposed on redemptions made within one year of the date of purchase of Class C shares. Class I, Class R1, Class R2 and Class R3 shares are offered at NAV and are not subject to a sales charge. Depending upon eligibility, Class B shares convert to either Investor Class or Class A shares at the end of the calendar quarter eight years after the date they were purchased. Additionally, depending upon eligibility, Investor Class shares may convert to Class A shares and Class A shares may convert to Investor Class shares. The eight classes of shares have the same voting (except for issues that relate solely to one class), dividend, liquidation and other rights, and the same terms and conditions, except that Class B and Class C shares are subject to higher distribution and/or service fee rates than Investor Class, Class A, Class R2 and Class R3 shares under a distribution plan pursuant to Rule 12b-1 under the 1940 Act. Class I and Class R1 shares are not subject to a distribution and/or service fee. Class R1, Class R2 and Class R3 shares are subject to a shareholder service fee. This is in addition to any fees paid under a distribution plan, where applicable.
The Fund’s investment objective is to seek high total return.
Note 2–Significant Accounting Policies
The Fund prepares its financial statements in accordance with generally accepted accounting principles (“GAAP”) in the United States of America and follows the significant accounting policies described below.
(A) Securities Valuation. Investments are valued as of the close of regular trading on the New York Stock Exchange (“Exchange”) (usually 4:00 p.m. Eastern time) on each day the Fund is open for business (“valuation date”).
“Fair value” is defined as the price that the Fund would receive upon selling an investment in an orderly transaction to an independent buyer in the principal or most advantageous market of the investment. Fair value measurements are determined within a framework that has established a three-tier hierarchy which maximizes the use of observable market data and minimizes the use of unobservable inputs to establish classification of fair value measurements for disclosure purposes. “Inputs” refer broadly to the assumptions that market participants would use in pricing the asset or liability, including assumptions about risk, such as the risk inherent in a particular valuation technique used to measure fair value using a pricing model and/or the risk inherent in the inputs for the valuation technique. Inputs may be observable or unobservable. Observable inputs reflect the assumptions market participants would use in pricing the asset or liability based on market data obtained from sources independent of the Fund. Unobservable inputs reflect the Fund’s own assumptions about the assumptions market participants would use in pricing the asset or liability developed based on the information available in the circumstances. The inputs or methodology used for valuing securities may not be an indication of the risks associated with investing in those securities. The three-tier hierarchy of inputs is summarized in the three broad Levels listed below.
| |
| • | Level 1—quoted prices in active markets for identical investments |
| |
| • | Level 2—other significant observable inputs (including quoted prices for similar investments in active markets, interest rates and yield curves, prepayment speeds, credit risks, etc.) |
| |
| • | Level 3—significant unobservable inputs (including the Fund’s own assumptions about the assumptions that market participants would use in determining the fair value of investments) |
The valuation techniques used by the Fund to measure fair value maximize the use of observable inputs and minimize the use of unobservable inputs. The Fund may utilize some of the following fair value techniques: multi-dimensional relational pricing models, option adjusted spread pricing and estimating the price that would have prevailed in a liquid market for an international equity security given information available at the time of evaluation, when there are significant events after the close of local foreign markets.
The Fund has procedures to determine the fair value of securities and other financial instruments for which market prices are not readily available or which may not be reliably priced. Under these procedures, the Fund primarily employs a market-based approach which may use related or comparable assets or liabilities, recent transactions, market multiples, book values, and other relevant information. The Fund may also use an income-based valuation approach in which the anticipated future cash flows of the investment are discounted to calculate fair value. Discounts may also be applied due to the nature or duration of any restrictions on the disposition of the investments. Due to the inherent uncertainty of valuations of such investments, the fair values may differ significantly from the values that would have been used had an active market existed. For the year ended October 31, 2011, there have been no changes to the fair value methodologies.
The aggregate value by input level, as of October 31, 2011, for the Fund’s investments is included at the end of the Fund’s Portfolio of Investments.
Equity securities and Exchange Traded Funds are valued at the latest quoted sales prices as of the close of regular trading on the Exchange
mainstayinvestments.com 31
Notes to Financial Statements (continued)
on each valuation date. Securities that are not traded on the valuation date are valued at the mean of the latest quoted bid and asked prices. Prices normally are taken from the principal market in which each security trades. Futures contracts are valued at the last posted settlement price on the market where such futures are primarily traded. These securities are generally categorized as Level 1 in the hierarchy. Investments in other mutual funds are valued at their NAVs as of the close of the Exchange on the valuation date.
Debt securities are valued at the evaluated bid prices supplied by a pricing agent or brokers selected by the Fund’s Manager (as defined in Note 3(A)) in consultation with the Fund’s Subadvisor (as defined in Note 3(A)) whose prices reflect broker/dealer supplied valuations and electronic data processing techniques, if such prices are deemed by the Fund’s Manager, in consultation with the Fund’s Subadvisor, to be representative of market values, at the regular close of trading of the Exchange on each valuation date. Debt securities, including corporate bonds, U.S. government & federal agency bonds, municipal bonds, foreign bonds, Yankee bonds, convertible bonds, asset-backed securities, and mortgage-backed securities, are generally categorized as Level 2 in the hierarchy.
Temporary cash investments acquired over 60 days prior to maturity are valued using the latest bid prices or using valuations based on a matrix system (which considers such factors as security prices, yields, maturities, and ratings), both as furnished by independent pricing services. Other temporary cash investments which mature in 60 days or less (“Short-Term Investments”) are valued at amortized cost. The amortized cost method involves valuing a security at its cost on the date of purchase and thereafter assuming a constant amortization to maturity of the difference between such cost and the value on maturity date. Amortized cost approximates the current fair value of a security. Securities valued at amortized cost are not obtained from a quoted price in an active market. These securities are all generally categorized as Level 2 in the hierarchy.
Securities for which market quotations are not readily available are valued by methods deemed in good faith by the Fund’s Board to represent fair value. Equity and non-equity securities which may be valued in this manner include, but are not limited to: (i) a security the trading for which has been halted or suspended; (ii) a debt security that has recently gone into default and for which there is not a current market quotation; (iii) a security of an issuer that has entered into a restructuring; (iv) a security that has been de-listed from a national exchange; (v) a security the market price of which is not available from an independent pricing source or, if so provided, does not, in the opinion of the Fund’s Manager or Subadvisor reflect the security’s market value; and (vi) a security where the trading on that security’s principal market is temporarily closed at a time when, under normal conditions, it would be open. These securities are generally categorized as Level 3 in the hierarchy. At October 31, 2011, the Fund held securities with a value of $18 that were fair valued in such a manner.
Certain events may occur between the time that foreign markets close, on which securities held by the Fund principally trade, and the time at which the Fund’s NAV is calculated. These events may include, but are not limited to, situations relating to a single issuer in a market sector, significant fluctuations in U.S. or foreign markets, natural disasters, armed conflicts, governmental actions or other developments not tied directly to the securities markets. Should the Manager or Subadvisor conclude that such events may have affected the accuracy of the last price reported on the local foreign market, the Manager or Subadvisor may, pursuant to procedures adopted by the Fund’s Board, adjust the value of the local price to reflect the impact on the price of such securities as a result of such events. In this instance, securities are generally categorized as Level 3 in the hierarchy. Additionally, foreign equity securities are also fair valued whenever the movement of a particular index exceeds certain thresholds. In such cases, the securities are fair valued by applying factors provided by a third party vendor in accordance with the Fund’s policies and procedures and are generally categorized as Level 2 in the hierarchy. As of October 31, 2011, the Fund did not hold any foreign equity securities.
Generally, a security is considered illiquid if it cannot be sold or disposed of in the ordinary course of business at approximately the price at which it is valued. Its illiquidity might prevent the sale of such security at a time when the Manager or Subadvisor might wish to sell, and these securities could have the effect of decreasing the overall level of a Fund’s liquidity. Further, the lack of an established secondary market may make it more difficult to value illiquid securities, requiring the Fund to rely on judgments that may be somewhat subjective in determining value, which could vary from the amount that the Fund could realize upon disposition. Difficulty in selling illiquid securities may result in a loss or may be costly to the Fund. Under the supervision of the Board, the Manager or Subadvisor determines the liquidity of the Fund’s investments; in doing so, the Manager or Subadvisor may consider various factors, including (i) the frequency of trades and quotations, (ii) the number of dealers and prospective purchasers, (iii) dealer undertakings to make a market, and (iv) the nature of the security and the market in which it trades (e.g., the time needed to dispose of the security, the method of soliciting offers and the mechanics of transfer). Illiquid securities generally will be valued in such manner as the Board in good faith deems appropriate to reflect their fair market value.
(B) Income Taxes. The Fund’s policy is to comply with the requirements of the Internal Revenue Code of 1986, as amended (the “Internal Revenue Code”) applicable to regulated investment companies and to distribute all of the taxable income to the shareholders of the Fund within the allowable time limits. Therefore, no federal, state and local income tax provision is required.
Management evaluates its tax positions to determine if the tax positions taken meet the minimum recognition threshold in connection with accounting for uncertainties in income tax positions taken or expected to be taken for the purposes of measuring and recognizing tax liabilities in the financial statements. Recognition of tax benefits of an uncertain tax position is required only when the position is “more likely than not” to be sustained assuming examination by taxing authorities. Management has analyzed the Fund’s tax positions taken on federal, state and local income tax returns for all open tax years (for up to three tax years), and has concluded that no provision for federal, state and local income tax are required in the Fund’s financial statements. The Fund’s federal, state and local income and federal excise tax returns for tax years for which the applicable statutes of limitations have not expired are subject to examination by the Internal Revenue Service and state and local departments of revenue.
32 MainStay Balanced Fund
(C) Dividends and Distributions to Shareholders. Dividends and distributions are recorded on the ex-dividend date. The Fund intends to declare and pay dividends of net investment income, if any, quarterly and distributions of net realized capital and currency gains, if any, annually. Unless the shareholder elects otherwise, all dividends and distributions are reinvested in the same class of shares of the Fund, at NAV. Dividends and distributions to shareholders are determined in accordance with federal income tax regulations and may differ from GAAP.
(D) Security Transactions and Investment Income. The Fund records security transactions on the trade date. Realized gains and losses on security transactions are determined using the identified cost method and include gains and losses from repayments of principal on mortgage-backed securities. Dividend income is recognized on the ex-dividend date and interest income is accrued as earned using the effective interest rate method. Discounts and premiums on securities purchased, other than Short-Term Investments, for the Fund are accreted and amortized, respectively, on the effective interest rate method over the life of the respective securities or, in the case of a callable security, over the period to the first date of call. Discounts and premiums on Short-Term Investments are accreted and amortized, respectively, on the straight-line method.
Investment income and realized and unrealized gains and losses on investments of the Fund are allocated to separate classes of shares pro rata based upon their relative net assets on the date the income is earned or realized and unrealized gains and losses are incurred.
(E) Expenses. Expenses of the Trust are allocated to the individual Funds in proportion to the net assets of the respective Funds when the expenses are incurred, except where direct allocations of expenses can be made. Expenses (other than transfer agent expenses and fees incurred under the shareholder services plans and the distribution plans further discussed in Note 3(B)) are allocated to separate classes of shares pro rata based upon their relative net assets on the date the expenses are incurred. The expenses borne by the Fund, including those of related parties to the Fund, are shown in the Statement of Operations.
(F) Use of Estimates. In preparing financial statements in conformity with GAAP, management makes estimates and assumptions that affect the reported amounts and disclosures in the financial statements. Actual results could differ from those estimates.
(G) Repurchase Agreements. The Fund may enter into repurchase agreements to earn income. The Fund may enter into repurchase agreements only with financial institutions that are deemed by the Manager or Subadvisor to be creditworthy, pursuant to guidelines established by the Fund’s Board. Repurchase agreements are considered under the 1940 Act to be collateralized loans by a Fund to the seller secured by the securities transferred to the Fund.
When the Fund invests in repurchase agreements, the Fund’s custodian takes possession of the collateral pledged for investments in such repurchase agreements. The underlying collateral is valued daily on a mark-to-market basis to determine that the value, including accrued interest, exceeds the repurchase price. In the event of the seller’s default of the obligation to repurchase, the Fund has the right to liquidate the collateral and apply the proceeds in satisfaction of the obligation. Under certain circumstances, in the event of default or bankruptcy by the other party to the agreement, realization and/or retention of the collateral may be subject to legal proceedings and possible realized loss to the Fund.
(H) Futures Contracts. A futures contract is an agreement to purchase or sell a specified quantity of an underlying instrument at a specified future date and price, or to make or receive a cash payment based on the value of a financial instrument (e.g., foreign currency, interest rate, security, or securities index). The Fund is subject to equity price risk and interest rate risk in the normal course of investing in these transactions. During the period the futures contract is open, changes in the value of the contract are recognized as unrealized gains or losses by “marking to market” such contract on a daily basis to reflect the market value of the contract at the end of each day’s trading. The Fund agrees to receive from or pay to the broker an amount of cash equal to the daily fluctuation in the value of the contract. Such receipts or payments are known as “variation margin.” When the futures contract is closed, the Fund records a realized gain or loss equal to the difference between the proceeds from (or cost of) the closing transaction and the Fund’s basis in the contract.
The use of futures contracts involves, to varying degrees, elements of market risk in excess of the amount recognized in the Statement of Assets and Liabilities. The contract or notional amounts and variation margin reflect the extent of the Fund’s involvement in open futures positions. Risks arise from the possible imperfect correlation in movements in the price of futures contracts, interest rates and the underlying hedged assets, and the possible inability of counterparties to meet the terms of their contracts. However, the Fund’s activities in futures contracts have minimal counterparty risk as they are conducted through regulated exchanges that guarantee the futures against default by the counterparty. In the event of a bankruptcy or insolvency of a broker that holds margin on behalf of the Fund, the Fund may not be entitled to the return of all of the margin owed to the Fund, potentially resulting in a loss. The Fund may also invest in futures contracts to help manage the duration and yield curve of the portfolio while minimizing the exposure to wider bid/ask spreads in traditional bonds. The Fund’s investment in futures contracts and other derivatives may increase the volatility of the Fund’s NAV and may result in a loss to the Fund. As of October 31, 2011, the Fund did not hold any futures contracts.
(I) Securities Lending. In order to realize additional income, the Fund may engage in securities lending, subject to the limitations set forth in the 1940 Act, and relevant guidance by the staff of the Securities and Exchange Commission. In the event the Fund does engage in securities lending, the Fund will lend through its custodian, State Street Bank and Trust Company (“State Street”). State Street will manage the Fund’s cash collateral in accordance with the Lending Agreement between the Fund and State Street, and indemnify the Fund’s portfolio against counterparty risk. The loans will be collateralized by cash or securities at least equal at all times to the market value of the securities loaned. Collateral will consist of U.S. government securities, cash equivalents or irrevocable letters of credit. The Fund may bear the risk of delay in recovery of, or loss of rights in, the securities loaned should the borrower of the securities experience financial difficulty. The Fund may also record realized gain or loss on
mainstayinvestments.com 33
Notes to Financial Statements (continued)
securities deemed sold due to a borrower’s inability to return securities on loan. The Fund will receive compensation for lending its securities in the form of fees or the retention of a portion of the interest on the investment of any cash received as collateral. The Fund also will continue to receive interest and dividends on the securities loaned and any gain or loss in the market price of the securities loaned that may occur during the term of the loan will be for the account of the Fund.
Although the Fund and New York Life Investments (as defined in Note 3(A)) have temporarily suspended securities lending, the Fund and New York Life Investments reserve the right to reinstitute lending when deemed appropriate. The Fund had no portfolio securities on loan as of October 31, 2011.
(J) Restricted Securities. A restricted security is a security which has been purchased through a private offering and cannot be resold to the general public without prior registration under the Securities Act of 1933, as amended. The Fund may not have the right to demand that such securities be registered. Disposal of these securities may involve time-consuming negotiations and expenses and it may be difficult to obtain a prompt sale at an acceptable price. (See Note 5)
(K) Concentration of Risk. The ability of issuers of debt securities held by the Fund to meet their obligations may be affected by economic or political developments in a specific country, industry or region.
(L) Indemnifications. Under the Trust’s organizational documents, its officers and trustees are indemnified against certain liabilities that may arise out of performance of their duties to the Trust. Additionally, in the normal course of business, the Fund enters into contracts with third-party service providers that contain a variety of representations and warranties and which may provide general indemnifications. The Fund’s maximum exposure under these arrangements is unknown, as this would involve future claims that may be made against the Fund that have not yet occurred. Based on experience, management is of the view that the risk of loss in connection with these potential indemnification obligations is remote. However, there can be no assurance that material liabilities related to such obligations will not arise in the future, which could adversely impact the Fund.
(M) Quantitative Disclosure of Derivative Holdings. The following tables show additional disclosures about the Fund’s derivative and hedging activities, including how such activities are accounted for and their effect on the Fund’s financial positions, performance and cash flows. These derivatives are not accounted for as hedging instruments.
The effect of derivative instruments on the Statement of Operations for the year ended October 31, 2011:
Realized Gain (Loss)
| | | | | | | | | | | |
| | | Statement of
| | Interest Rate
| | | | |
| | | Operations
| | Contracts
| | | | |
| | | Location | | Risk | | | Total | |
| |
| Futures Contracts | | Net realized gain
(loss) on futures
transactions | | $ | (249,263 | ) | | $ | (249,263 | ) |
| | | | | |
| | | | | |
| Total Realized Gain (Loss) | | | | $ | (249,263 | ) | | $ | (249,263 | ) |
| | | | | |
| | | | | |
Number of Contracts, Notional Amounts or Shares/Units (1)
| | | | | | | | | | | |
| | | | | Interest Rate
| | | | |
| | | | | Contracts
| | | | |
| | | | | Risk | | | Total | |
| |
| Futures Contracts Long (2) | | | | | 29 | | | | 29 | |
| Futures Contracts Short (2) | | | | | (39 | ) | | | (39 | ) |
| | | | | |
| | | | | |
| |
| (1) | Amount disclosed represents the weighted average held during the year ended October 31, 2011. |
| |
| (2) | Amount(s) represent(s) number of contracts. |
Note 3–Fees and Related Party Transactions
(A) Manager and Subadvisor. New York Life Investment Management LLC (“New York Life Investments” or the “Manager”), a registered investment adviser and an indirect, wholly-owned subsidiary of New York Life Insurance Company (“New York Life”), serves as the Fund’s Manager, pursuant to an Amended and Restated Management Agreement (“Management Agreement”). The Manager provides offices, conducts clerical, recordkeeping and bookkeeping services, and keeps most of the financial and accounting records required to be maintained by the Fund. Except for the portion of salaries and expenses that are the responsibility of the Fund, including a portion of the total compensation of the Chief Compliance Officer (“CCO”) of the Fund which is the responsibility of all investment companies for which the CCO serves, the Manager pays the salaries and expenses of all personnel affiliated with the Fund and certain operational expenses of the Fund. New York Life Investments is also responsible for the day-to-day portfolio management of the fixed-income portion of the fund. Madison Square Investors LLC (“MSI” or “Subadvisor”), a registered investment adviser and an indirect, wholly-owned subsidiary of New York Life, serves as Subadvisor to the equity portion of the Fund and is responsible for the day-to-day portfolio management of the equity portion of the Fund. Pursuant to the terms of a Subadvisory Agreement (“Subadvisory Agreement”) between New York Life Investments and the MSI, New York Life Investments pays for the services of the Subadvisor.
The Fund pays the Manager a monthly fee for services performed and facilities furnished at an annual rate of the Fund’s average daily net assets as follows: 0.70% up to $1 billion; 0.65% from $1 billion to $2 billion; and 0.60% in excess of $2 billion. The effective management fee rate (exclusive of any applicable waivers/reimbursements) was 0.70% for the year ended October 31, 2011.
The Manager has contractually agreed to waive fees and/or reimburse expenses so that Total Annual Fund Operating Expenses for Class A shares do not exceed 1.24% of its average net assets. New York Life Investments will apply an equivalent waiver or reimbursement, in an equal number of basis points, to the other share classes of the Fund. This agreement expires on February 28, 2012 and may only be amended or terminated prior to that date by action of the Board. Total Annual Fund Operating Expenses excludes taxes, interest, litigation, extraordinary expenses, brokerage and other transaction expenses relating to the purchase or sale of portfolio investments, and acquired (underlying) fund fees and expenses.
For the year ended October 31, 2011, New York Life Investments earned fees from the Fund in the amount of $4,366,082.
34 MainStay Balanced Fund
State Street, 1 Lincoln Street, Boston, Massachusetts 02111, provides sub-administration and sub-accounting services to the Fund pursuant to an agreement with New York Life Investments. These services include calculating the daily NAVs of the Fund, maintaining the general ledger and sub-ledger accounts for the calculation of the Fund’s respective NAVs, and assisting New York Life Investments in conducting various aspects of the Fund’s administrative operations. For providing these services to the Fund, State Street is compensated by New York Life Investments.
(B) Distribution, Service and Shareholder Service Fees. The Trust, on behalf of the Fund, has entered into a Distribution Agreement with NYLIFE Distributors LLC (the “Distributor”), an indirect, wholly-owned subsidiary of New York Life. The Fund has adopted distribution plans (the “Plans”) in accordance with the provisions of Rule 12b-1 under the 1940 Act.
Pursuant to the Investor Class, Class A and Class R2 Plans, the Distributor receives a monthly distribution fee from the Investor Class, Class A and Class R2 shares, at an annual rate of 0.25% of the average daily net assets of the Investor Class, Class A and Class R2 shares for distribution or service activities as designated by the Distributor. Pursuant to the Class B and Class C Plans, Class B and Class C shares pay the Distributor a monthly distribution fee at an annual rate of 0.75% of the average daily net assets of the Class B and Class C shares, along with a service fee at an annual rate of 0.25% of the average daily net assets of the Class B and Class C shares, for a total 12b-1 fee of 1.00%. Pursuant to the Class R3 Plan, the Distributor receives a monthly distribution and shareholder service fee from the Class R3 shares at an annual rate of 0.50% of the average daily net assets of the Class R3 shares. Class I and Class R1 shares are not subject to a distribution or service fee.
The Plans provide that the distribution and service fees are payable to the Distributor regardless of the amounts actually expended by the Distributor for distribution of the Fund’s shares and service activities.
In accordance with the Shareholder Services Plans for the Class R1, Class R2 and Class R3 shares, the Manager has agreed to provide, through its affiliates or independent third parties, various shareholder and administrative support services to shareholders of the Class R1, Class R2 and Class R3 shares. For its services, the Manager is entitled to a Shareholder Service Fee accrued daily and paid monthly at an annual rate of 0.10% of the average daily net assets attributable to the Class R1, Class R2 and Class R3 shares. This is in addition to any fees paid under a distribution plan, where applicable.
Shareholder Service Fees incurred by the Fund for the year ended October 31, 2011, were as follows:
| | | | | |
| Class R1 | | $ | 20,620 | |
| |
| |
| Class R2 | | | 43,045 | |
| |
| |
| Class R3 | | | 206 | |
| |
| |
(C) Sales Charges. The Fund was advised by the Distributor that the amount of sales charges retained on sales of Investor Class and Class A shares were $25,605 and $18,055, respectively, for the year ended October 31, 2011. The Fund was also advised that the Distributor retained CDSCs on redemptions of Class A, Class B and Class C shares of $805, $75,738 and $1,948, respectively, for the year ended October 31, 2011.
(D) Transfer, Dividend Disbursing and Shareholder Servicing Agent. NYLIM Service Company LLC, an affiliate of New York Life Investments, is the Fund’s transfer, dividend disbursing and shareholder servicing agent pursuant to an agreement between NYLIM Service Company LLC and the Trust. NYLIM Service Company LLC has entered into an agreement with Boston Financial Data Services, Inc. (“BFDS”) pursuant to which BFDS performs certain transfer agent services on behalf of NYLIM Service Company LLC. Transfer agent expenses incurred by the Fund for the year ended October 31, 2011, were as follows:
| | | | | |
| Investor Class | | $ | 208,473 | |
| |
| |
| Class A | | | 255,837 | |
| |
| |
| Class B | | | 238,966 | |
| |
| |
| Class C | | | 214,323 | |
| |
| |
| Class I | | | 363,337 | |
| |
| |
| Class R1 | | | 34,267 | |
| |
| |
| Class R2 | | | 71,513 | |
| |
| |
| Class R3 | | | 342 | |
| |
| |
(E) Small Account Fee. Shareholders with small accounts adversely impact the cost of providing transfer agency services. In an effort to reduce total transfer agency expenses, the Fund has implemented a small account fee on certain types of accounts. Certain shareholders with an account balance of less than $1,000 are charged an annual per account fee of $20 (assessed semi-annually), the proceeds from which offset transfer agent fees as reflected in the Statement of Operations.
(F) Capital. At October 31, 2011, New York Life and its affiliates beneficially held shares of the Fund with the following values and percentages of net assets as follows:
| | | | | | | | | |
| Class A | | $ | 1,666 | | | | 0.0 | %‡ |
| |
| |
| Class B | | | 1,300 | | | | 0.0 | ‡ |
| |
| |
| Class C | | | 1,749 | | | | 0.0 | ‡ |
| |
| |
| Class R1 | | | 1,408 | | | | 0.0 | ‡ |
| |
| |
| Class R2 | | | 1,382 | | | | 0.0 | ‡ |
| |
| |
| Class R3 | | | 11,229 | | | | 4.8 | |
| |
| |
| |
| ‡ | Less than one-tenth of a percent. |
(G) Other. Pursuant to a Legal Services Agreement, a portion of the cost of legal services provided to the Fund by the Office of the General Counsel of New York Life Investments was payable directly by the Fund through March 17, 2011. For the year ended October 31, 2011, these fees, which are included in professional fees shown on the Statement of Operations, were $9,683. Effective March 18, 2011, the Legal Services Agreement expired and was not renewed. Therefore, the Fund is no longer directly responsible for any portion of the cost of legal services.
mainstayinvestments.com 35
Notes to Financial Statements (continued)
Note 4–Federal Income Tax
As of October 31, 2011, the components of accumulated gain (loss) on a tax basis were as follows:
| | | | | | | | | | | | | | | | | | | |
| | | | Accumulated
| | | | | | | | | | |
| | | | Capital and
| | | Other
| | | Unrealized
| | | Total
| |
Ordinary
| | | Other
| | | Temporary
| | | Appreciation
| | | Accumulated
| |
| Income | | | Gain (Loss) | | | Differences | | | (Depreciation) | | | Gain (Loss) | |
| |
| $ | — | | | $ | (43,971,662 | ) | | $ | — | | | $ | 11,904,466 | | | $ | (32,067,196 | ) |
| |
| |
The difference between book-basis and tax basis unrealized depreciation is primarily due to wash sales deferrals, real estate investment trusts (“REITs”) basis adjustments, dividends payable, basis adjustment due to class action payments and return of capital distributions from non-REIT securities.
The following table discloses the current year reclassifications between undistributed net investment income, accumulated net realized income (loss) on investments, and additional paid-in capital arising from permanent differences; net assets at October 31, 2011 were not affected.
| | | | | | | | | | | |
| | | | Accumulated Net
| | | | |
Undistributed Net
| | | Realized
| | | | |
Investment Income
| | | Gain (Loss) on
| | | Additional
| |
| (Loss) | | | Investments | | | Paid-In Capital | |
| |
| $ | (235,383 | ) | | $ | 546,733 | | | $ | (311,350 | ) |
| |
| |
The reclassifications for the Fund are primarily due to paydown gain (loss), return of capital and capital gain distributions from REITs, distributions in excess of current earnings, return of capital distributions from non-REIT securities, reclassification of mortgage dollar roll income and reclassification of consent fee.
Under the Regulated Investment Company Modernization Act of 2010, the Fund will be permitted to carry forward capital losses incurred in taxable years beginning after December 22, 2010, for an unlimited period. However, any losses incurred during those future years will be required to be utilized prior to the losses incurred in pre-enactment tax years. As a result of this ordering rule, pre-enactment capital loss carryforwards may be more likely to expire unused. Additionally, post-enactment capital losses that are carried forward will retain their character as either short-term or long-term capital losses rather than being considered all short-term as under previous law.
At October 31, 2011, for federal income tax purposes, capital loss carryforwards of $43,971,662 were available as shown in the table below, to the extent provided by the regulations to offset future realized gains of the Fund through the years indicated. To the extent that these capital loss carryforwards are used to offset future capital gains, it is probable that the capital gains so offset will not be distributed to shareholders. No capital gain distributions shall be made until any capital loss carryforwards have been fully utilized or expired.
| | | | | | | |
Capital Loss
| | Capital Loss
|
| Available Through | | Amounts (000’s) |
| |
| | 2017 | | | $ | 43,972 | |
| |
| |
The Fund utilized $77,140,788 of capital loss carryforwards during the year ended October 31, 2011.
The tax character of distributions paid during the years ended October 31, 2011 and October 31, 2010 shown in the Statements of Changes in Net Assets was as follows:
| | | | | | | | | |
| | | 2011 | | | 2010 | |
| |
| Distributions paid from: | | | | | | | | |
| Ordinary Income | | $ | 7,568,786 | | | $ | 8,344,463 | |
| |
| |
Note 5–Restricted Securities
As of October 31, 2011, the Fund held the following restricted security:
| | | | | | | | | | | | | | | | | | | | | |
| | | Date of
| | | Principal
| | | | | | 10/31/11
| | | Percentage of
| |
| Security | | Acquisition | | | Amount | | | Cost | | | Value | | | Net Assets | |
| |
| At Home Corp. Convertible Bond 4.75%, due 12/31/49 | | | 7/25/01 | | | $ | 177,810 | | | $ | 13,325 | | | $ | 18 | | | | 0.0 | %‡ |
| |
| |
| |
| ‡ | Less than one-tenth of a percent. |
Note 6–Custodian
State Street is the custodian of the cash and the securities of the Fund. Custodial fees are charged to the Fund based on the market value of securities in the Fund and the number of certain cash transactions incurred by the Fund.
Note 7–Line of Credit
The Fund and certain affiliated funds maintain a line of credit with a syndicate of banks in order to secure a source of funds for temporary purposes to meet unanticipated or excessive redemption requests.
Effective August 31, 2011, under an amended credit agreement, the aggregate commitment amount is $125,000,000 with an optional maximum amount of $175,000,000. The commitment rate is an annual rate of 0.08% of the average commitment amount, payable quarterly, regardless of usage, to The Bank of New York Mellon, which serves as the agent to the syndicate. The commitment fee is allocated among certain MainStay Funds based upon net assets and other factors. Interest on any revolving credit loan is charged based upon the Federal Funds Advances rate or the one month London InterBank Offered Rate, whichever is higher. The amended credit agreement expires on August 29, 2012, although the MainStay Funds and the syndicate of banks may renew the amended credit agreement for an additional year on the same or different terms. Prior to August 31, 2011, the commitment rate was an annual rate of 0.10% of the average commitment amount, plus a 0.02% up-front payment. There were no borrowings made or outstanding with respect to the Fund on the amended credit agreement during the year ended October 31, 2011.
36 MainStay Balanced Fund
Note 8–Purchases and Sales of Securities (in 000’s)
During the year ended October 31, 2011, purchases and sales of U.S. government securities were $522,321 and $485,009, respectively. Purchases and sales of securities, other than U.S. government securities and short-term securities, were $846,581 and $944,487, respectively.
Note 9–Capital Share Transactions
| | | | | | | | | |
| Investor Class | | Shares | | | Amount | |
| |
| Year ended October 31, 2011: | | | | | | | | |
| Shares sold | | | 198,301 | | | $ | 5,196,068 | |
| Shares issued to shareholders in reinvestment of dividends | | | 26,145 | | | | 678,351 | |
| Shares redeemed | | | (363,956 | ) | | | (9,506,808 | ) |
| | | |
| | | |
| Net increase (decrease) in shares outstanding before conversion | | | (139,510 | ) | | | (3,632,389 | ) |
Shares converted into Investor Class
(See Note 1) | | | 157,345 | | | | 4,023,493 | |
Shares converted from Investor Class
(See Note 1) | | | (161,431 | ) | | | (4,211,528 | ) |
| | | |
| | | |
| Net increase (decrease) | | | (143,596 | ) | | $ | (3,820,424 | ) |
| | | |
| | | |
| Year ended October 31, 2010: | | | | | | | | |
| Shares sold | | | 204,490 | | | $ | 4,876,415 | |
| Shares issued to shareholders in reinvestment of dividends | | | 30,184 | | | | 718,203 | |
| Shares redeemed | | | (359,637 | ) | | | (8,539,807 | ) |
| | | |
| | | |
| Net increase (decrease) in shares outstanding before conversion | | | (124,963 | ) | | | (2,945,189 | ) |
Shares converted into Investor Class
(See Note 1) | | | 140,203 | | | | 3,343,928 | |
Shares converted from Investor Class
(See Note 1) | | | (119,199 | ) | | | (2,841,265 | ) |
| | | |
| | | |
| Net increase (decrease) | | | (103,959 | ) | | $ | (2,442,526 | ) |
| | | |
| | | |
| Class A | | Shares | | | Amount | |
| |
| Year ended October 31, 2011: | | | | | | | | |
| Shares sold | | | 533,530 | | | $ | 13,940,483 | |
| Shares issued to shareholders in reinvestment of dividends | | | 72,032 | | | | 1,868,749 | |
| Shares redeemed | | | (1,774,953 | ) | | | (45,637,934 | ) |
| | | |
| | | |
| Net increase (decrease) in shares outstanding before conversion | | | (1,169,391 | ) | | | (29,828,702 | ) |
| Shares converted into Class A (See Note 1) | | | 223,846 | | | | 5,836,542 | |
| Shares converted from Class A (See Note 1) | | | (61,876 | ) | | | (1,543,429 | ) |
| | | |
| | | |
| Net increase (decrease) | | | (1,007,421 | ) | | $ | (25,535,589 | ) |
| | | |
| | | |
| Year ended October 31, 2010: | | | | | | | | |
| Shares sold | | | 430,521 | | | $ | 10,240,316 | |
| Shares issued to shareholders in reinvestment of dividends | | | 83,747 | | | | 1,990,202 | |
| Shares redeemed | | | (1,511,721 | ) | | | (35,837,153 | ) |
| | | |
| | | |
| Net increase (decrease) in shares outstanding before conversion | | | (997,453 | ) | | | (23,606,635 | ) |
| Shares converted into Class A (See Note 1) | | | 196,436 | | | | 4,680,636 | |
| Shares converted from Class A (See Note 1) | | | (34,747 | ) | | | (846,621 | ) |
| Shares converted from Class A (a) | | | (37,263 | ) | | | (871,593 | ) |
| | | |
| | | |
| Net increase (decrease) | | | (873,027 | ) | | $ | (20,644,213 | ) |
| | | |
| | | |
| Class B | | Shares | | | Amount | |
| |
| Year ended October 31, 2011: | | | | | | | | |
| Shares sold | | | 153,041 | | | $ | 3,983,098 | |
| Shares issued to shareholders in reinvestment of dividends | | | 9,328 | | | | 241,665 | |
| Shares redeemed | | | (483,794 | ) | | | (12,596,216 | ) |
| | | |
| | | |
| Net increase (decrease) in shares outstanding before conversion | | | (321,425 | ) | | | (8,371,453 | ) |
| Shares converted from Class B (See Note 1) | | | (158,474 | ) | | | (4,105,078 | ) |
| | | |
| | | |
| Net increase (decrease) | | | (479,899 | ) | | $ | (12,476,531 | ) |
| | | |
| | | |
| Year ended October 31, 2010: | | | | | | | | |
| Shares sold | | | 197,249 | | | $ | 4,675,263 | |
| Shares issued to shareholders in reinvestment of dividends | | | 13,588 | | | | 324,735 | |
| Shares redeemed | | | (584,228 | ) | | | (13,816,972 | ) |
| | | |
| | | |
| Net increase (decrease) in shares outstanding before conversion | | | (373,391 | ) | | | (8,816,974 | ) |
| Shares converted from Class B (See Note 1) | | | (183,433 | ) | | | (4,336,678 | ) |
| | | |
| | | |
| Net increase (decrease) | | | (556,824 | ) | | $ | (13,153,652 | ) |
| | | |
| | | |
| Class C | | Shares | | | Amount | |
| |
| Year ended October 31, 2011: | | | | | | | | |
| Shares sold | | | 119,329 | | | $ | 3,113,001 | |
| Shares issued to shareholders in reinvestment of dividends | | | 6,621 | | | | 171,473 | |
| Shares redeemed | | | (497,942 | ) | | | (12,887,112 | ) |
| | | |
| | | |
| Net increase (decrease) | | | (371,992 | ) | | $ | (9,602,638 | ) |
| | | |
| | | |
| Year ended October 31, 2010: | | | | | | | | |
| Shares sold | | | 165,215 | | | $ | 3,918,928 | |
| Shares issued to shareholders in reinvestment of dividends | | | 9,802 | | | | 234,159 | |
| Shares redeemed | | | (661,972 | ) | | | (15,608,746 | ) |
| | | |
| | | |
| Net increase (decrease) | | | (486,955 | ) | | $ | (11,455,659 | ) |
| | | |
| | | |
| Class I | | Shares | | | Amount | |
| |
| Year ended October 31, 2011: | | | | | | | | |
| Shares sold | | | 1,744,108 | | | $ | 45,636,328 | |
| Shares issued to shareholders in reinvestment of dividends | | | 131,615 | | | | 3,419,034 | |
| Shares redeemed | | | (2,652,200 | ) | | | (69,515,472 | ) |
| | | |
| | | |
| Net increase (decrease) | | | (776,477 | ) | | $ | (20,460,110 | ) |
| | | |
| | | |
| Year ended October 31, 2010: | | | | | | | | |
| Shares sold | | | 1,887,081 | | | $ | 44,810,235 | |
| Shares issued to shareholders in reinvestment of dividends | | | 150,853 | | | | 3,588,206 | |
| Shares redeemed | | | (2,713,200 | ) | | | (64,655,595 | ) |
| | | |
| | | |
| Net increase (decrease) in shares outstanding before conversion | | | (675,266 | ) | | | (16,257,154 | ) |
| Shares converted into Class I (a) | | | 37,184 | | | | 871,593 | |
| | | |
| | | |
| Net increase (decrease) | | | (638,082 | ) | | $ | (15,385,561 | ) |
| | | |
| | | |
mainstayinvestments.com 37
Notes to Financial Statements (continued)
| | | | | | | | | |
| Class R1 | | Shares | | | Amount | |
| |
| Year ended October 31, 2011: | | | | | | | | |
| Shares sold | | | 97,096 | | | $ | 2,529,675 | |
| Shares issued to shareholders in reinvestment of dividends | | | 11,862 | | | | 307,786 | |
| Shares redeemed | | | (116,056 | ) | | | (3,036,689 | ) |
| | | |
| | | |
| Net increase (decrease) | | | (7,098 | ) | | $ | (199,228 | ) |
| | | |
| | | |
| Year ended October 31, 2010: | | | | | | | | |
| Shares sold | | | 124,464 | | | $ | 2,958,628 | |
| Shares issued to shareholders in reinvestment of dividends | | | 14,742 | | | | 350,029 | |
| Shares redeemed | | | (755,942 | ) | | | (17,615,068 | ) |
| | | |
| | | |
| Net increase (decrease) | | | (616,736 | ) | | $ | (14,306,411 | ) |
| | | |
| | | |
| Class R2 | | Shares | | | Amount | |
| |
| Year ended October 31, 2011: | | | | | | | | |
| Shares sold | | | 419,653 | | | $ | 10,970,648 | |
| Shares issued to shareholders in reinvestment of dividends | | | 20,731 | | | | 537,915 | |
| Shares redeemed | | | (513,303 | ) | | | (13,393,419 | ) |
| | | |
| | | |
| Net increase (decrease) | | | (72,919 | ) | | $ | (1,884,856 | ) |
| | | |
| | | |
| Year ended October 31, 2010: | | | | | | | | |
| Shares sold | | | 762,834 | | | $ | 18,013,377 | |
| Shares issued to shareholders in reinvestment of dividends | | | 31,146 | | | | 738,250 | |
| Shares redeemed | | | (1,869,166 | ) | | | (43,465,598 | ) |
| | | |
| | | |
| Net increase (decrease) | | | (1,075,186 | ) | | $ | (24,713,971 | ) |
| | | |
| | | |
| Class R3 | | Shares | | | Amount | |
| |
| Year ended October 31, 2011: | | | | | | | | |
| Shares sold | | | 2,891 | | | $ | 75,459 | |
| Shares issued to shareholders in reinvestment of dividends | | | 78 | | | | 2,036 | |
| Shares redeemed | | | (719 | ) | | | (18,620 | ) |
| | | |
| | | |
| Net increase (decrease) | | | 2,250 | | | $ | 58,875 | |
| | | |
| | | |
| Year ended October 31, 2010: | | | | | | | | |
| Shares sold | | | 3,750 | | | $ | 89,620 | |
| Shares issued to shareholders in reinvestment of dividends | | | 62 | | | | 1,480 | |
| Shares redeemed | | | (1,046 | ) | | | (24,638 | ) |
| | | |
| | | |
| Net increase (decrease) | | | 2,766 | | | $ | 66,462 | |
| | | |
| | | |
| |
| (a) | In addition to any automatic conversion features described above in Note 1 with respect to Investor Class, Class A and Class B shares, investors generally may also elect to convert their shares on a voluntary basis into another share class of the same MainStay Fund subject to satisfying the eligibility requirements of the new share class, if any. However, the following limitations apply: |
| | |
| | • | Investor Class, Class A and Class C shares that remain subject to a CDSC are ineligible for a voluntary conversion; and |
| |
| | • | All Class B shares are ineligible for a voluntary conversion. |
These limitations do not impact any automatic conversion features described elsewhere in Note 1 with respect to Investor Class, Class A and Class B shares.
An investor or an investor’s financial intermediary may contact the MainStay Funds to request a voluntary conversion between share classes of the same MainStay Fund. Investors may be required to provide sufficient information to establish eligibility to convert to the new share class. All permissible conversions will be made on the basis of the relevant NAVs of the two classes without the imposition of any sales load, fee or other charge. If an investor fails to remain eligible for the new share class, they may be converted automatically back to their original share class, or into another share class, if appropriate. Although the MainStay Funds expect that a conversion between share classes of the same MainStay Fund should not result in the recognition of a gain or loss for tax purposes, shareholders should consult with their own tax adviser with respect to the tax treatment of their investment in a MainStay Fund. The MainStay Funds may change, suspend or terminate this conversion feature at any time.
Note 10–Subsequent Events
In connection with the preparation of the financial statements of the Fund as of and for the year ended October 31, 2011, events and transactions subsequent to October 31, 2011 through the date the financial statements were issued have been evaluated by the Fund’s management for possible adjustment and/or disclosure. No subsequent events requiring financial statement adjustment or disclosure have been identified.
38 MainStay Balanced Fund
Report of Independent Registered Public Accounting Firm
The Board of Trustees and Shareholders of
Eclipse Funds:
We have audited the accompanying statement of assets and liabilities, including the portfolio of investments, of the MainStay Balanced Fund (“the Fund”), one of the funds constituting Eclipse Funds as of October 31, 2011, and the related statement of operations for the year then ended, the statements of changes in net assets for each of the years in the two-year period then ended, and the financial highlights for each of the years in the five-year period then ended. These financial statements and financial highlights are the responsibility of the Fund’s management. Our responsibility is to express an opinion on these financial statements and financial highlights based on our audits.
We conducted our audits in accordance with the standards of the Public Company Accounting Oversight Board (United States). Those standards require that we plan and perform the audit to obtain reasonable assurance about whether the financial statements and financial highlights are free of material misstatement. An audit includes examining, on a test basis, evidence supporting the amounts and disclosures in the financial statements. Our procedures included confirmation of securities owned as of October 31, 2011, by correspondence with the custodian and brokers or by other appropriate auditing procedures where replies from brokers were not received. An audit also includes assessing the accounting principles used and significant estimates made by management, as well as evaluating the overall financial statement presentation. We believe that our audits provide a reasonable basis for our opinion.
In our opinion, the financial statements and financial highlights referred to above present fairly, in all material respects, the financial position of the MainStay Balanced Fund of Eclipse Funds as of October 31, 2011, the results of its operations for the year then ended, the changes in its net assets for each of the years in the two-year period then ended, and the financial highlights for each of the years in the five-year period then ended, in conformity with U.S. generally accepted accounting principles.
-s- KPMG LLP
Philadelphia, Pennsylvania
December 22, 2011
mainstayinvestments.com 39
Federal Income Tax Information (Unaudited)
The Fund is required under the Internal Revenue Code to advise shareholders within 60 days of the Fund’s fiscal year end (October 31, 2011) as to the federal tax status of dividends paid by the Fund during such fiscal years.
For the fiscal year ended October 31, 2011, the Fund designated approximately $4,737,711 under the Internal Revenue Code as qualified dividend income eligible for reduced tax rates.
The dividends paid by the Fund during the fiscal year ended October 31, 2011, should be multiplied by 67.7% to arrive at the amount eligible for the corporate dividends received deduction.
In February 2012, shareholders will receive an IRS Form 1099-DIV or substitute Form 1099 which will show the federal tax status of the distributions received by shareholders in calendar year 2011. The amounts that will be reported on such 1099-DIV or substitute Form 1099 will be the amounts you are to use on your federal income tax return and will differ from the amounts which we must report for the Fund’s fiscal year ended October 31, 2011.
Proxy Voting Policies and Procedures and Proxy Voting Record
A description of the policies and procedures that New York Life Investments uses to vote proxies related to the Fund’s securities is available without charge, upon request, (i) by visiting the Fund’s website at mainstayinvestments.com; and (ii) on the Securities and Exchange Commission’s (“SEC”) website at www.sec.gov.
The Fund is required to file with the SEC its proxy voting record for the 12-month period ending June 30 on Form N-PX. The Fund’s most recent Form N-PX is available free of charge upon request by calling 800-MAINSTAY (624-6782); visiting the Fund’s website at mainstayinvestments.com; or on the SEC’s website at www.sec.gov.
Shareholder Reports and Quarterly Portfolio Disclosure
The Fund is required to file its complete schedule of portfolio holdings with the SEC for its first and third fiscal quarters on Form N-Q. The Fund’s Form N-Q is available without charge, on the SEC’s website at www.sec.gov or by calling MainStay Investments at 800-MAINSTAY (624-6782). You also can obtain and review copies of Form N-Q by visiting the SEC’s Public Reference Room in Washington, DC (information on the operation of the Public Reference Room may be obtained by calling 1-800-SEC-0330).
40 MainStay Balanced Fund
Board Members and Officers (Unaudited)
The Board Members oversee the MainStay Group of Funds (which is comprised of Funds that are series of The MainStay Funds, Eclipse Funds, Eclipse Funds Inc., MainStay Funds Trust, and MainStay VP Funds Trust) (collectively, the “Fund Complex”), the Manager and, when applicable, the Subadvisor(s). Each Board Member serves until his or her successor is elected and qualified or until his or her resignation, death or removal. The Retirement Policy provides that a Board Member shall tender his or her resignation upon reaching age 72. A Board Member reaching the age of 72 may continue for additional one-year periods with the approval of the Board’s Nominating and Governance Committee.
Officers serve a term of one year and are elected annually by the Board Members. The business address of each Board Member and officer listed below is 51 Madison Avenue, New York, New York 10010.
The Statement of Additional Information applicable to the Fund includes additional information about the Board Members and is available without charge, upon request, by calling 800-MAINSTAY (624-6782) or by going online to mainstayinvestments.com.
| | | | | | | | | |
| | | Term of Office,
| | | | Number of
| | |
| | | Position(s) Held
| | | | Funds in Fund
| | Other
|
| | | with the Fund
| | | | Complex
| | Directorships
|
Name and
| | Complex and
| | Principal Occupation(s)
| | Overseen by
| | Held by
|
| Date of Birth | | Length of Service | | During Past Five Years | | Board Member | | Board Member |
| |
| Interested Board Member* |
| |
John Y. Kim
9/24/60 | | Indefinite;
Eclipse Funds: Trustee since 2008 (2 funds);
Eclipse Funds Inc.: Director since 2008 (1 fund);
The MainStay Funds: Trustee since 2008 (14 funds);
MainStay Funds Trust: Trustee since 2009 (28 funds); and
MainStay VP Funds Trust:
Director since 2011 and its predecessor, MainStay VP Series Fund, Inc. since 2008 (21 portfolios). | | Member of the Board of Managers (since 2011) of New York Life Enterprises LLC; Chairman (since 2011), Member of the Board of Managers, Chief Executive Officer and President (since 2008) of New York Life Investment Management LLC and New York Life Investment Management Holdings LLC; Executive Vice President (since 2011) of New York Life Foundation; Member of the Board of Managers and Chairman of the Board of Private Advisors, L.L.C. (since 2010); Executive Vice President, New York Life Insurance Company (since 2008); Chairman of the Board (2008-2010) and Member of the Boards of Managers (since 2008) of MacKay Shields LLC, Institutional Capital LLC, Madison Capital Funding LLC, Madison Square Investors LLC, NYLCAP Manager LLC and McMorgan & Company LLC; Chairman of the Board and Chief Executive Officer, NYLIFE Distributors LLC (2008-2010); Executive Vice President of NYLIFE Insurance Company of Arizona and New York Life Insurance and Annuity Corporation (since 2008); President, Prudential Retirement, a business unit of Prudential Financial, Inc. (2002 to 2007) | | 66 | | None |
| |
| |
| | |
| | * | This Board Member is considered to be an “interested person” of the MainStay Group of Funds within the meaning of the 1940 Act because of his affiliation with New York Life Insurance Company, New York Life Investment Management LLC, Madison Square Investors LLC, MacKay Shields LLC, Institutional Capital LLC, Epoch Investment Partners, Inc., Markston International, LLC, Winslow Capital Management, Inc., NYLIFE Securities LLC and/or NYLIFE Distributors LLC, as described in detail above in the column entitled “Principal Occupation(s) During the Past Five Years.” |
mainstayinvestments.com 41
| | | | | | | | | |
| | | Term of Office,
| | | | Number of
| | |
| | | Position(s) Held
| | | | Funds in Fund
| | Other
|
| | | with the Fund
| | | | Complex
| | Directorships
|
Name and
| | Complex and
| | Principal Occupation(s)
| | Overseen by
| | Held by
|
| Date of Birth | | Length of Service | | During Past Five Years | | Board Member | | Board Member |
| |
| Non-Interested Board Members |
| |
Susan B. Kerley
8/12/51 | | Indefinite;
Eclipse Funds: Chairman since 2005, and Trustee since 2000 (2 funds);
Eclipse Funds Inc.: Chairman since 2005 and Director since 1990
(1 fund);
The MainStay Funds: Chairman and Board Member since 2007
(14 funds);
MainStay Funds Trust: Chairman and Trustee since 2009 (28 funds); and
MainStay VP Funds Trust: Chairman and Director since 2011 and its predecessor, MainStay VP Series Fund, Inc., since 2007 (21 portfolios). | | President, Strategic Management Advisors LLC (since 1990) | | 66 | | Trustee, Legg Mason Partners Funds, since 1991 (58 portfolios) |
| |
| |
Alan R. Latshaw
3/27/51 | | Indefinite;
Eclipse Funds: Trustee and Audit Committee Financial Expert since 2007 (2 funds);
Eclipse Funds Inc.: Director and Audit Committee Financial Expert since 2007 (1 fund);
The MainStay Funds: Trustee and Audit Committee Financial Expert since 2006 (14 funds);
MainStay Funds Trust: Trustee and Audit Committee Financial Expert since 2009 (28 funds); and
MainStay VP Funds Trust: Director and Audit Committee Financial Expert since 2011 and its predecessor, MainStay VP Series Fund, Inc., since 2007 (21 portfolios). | | Retired; Partner, Ernst & Young LLP (2002 to 2003); Partner, Arthur Andersen LLP (1989 to 2002); Consultant to the MainStay Funds Audit and Compliance Committee (2004 to 2006) | | 66 | | Trustee, State Farm Associates Funds Trusts since 2005 (4 portfolios); Trustee, State Farm Mutual Fund Trust since 2005 (15 portfolios); Trustee, State Farm Variable Product Trust since 2005 (9 portfolios) |
| |
| |
42 MainStay Balanced Fund
| | | | | | | | | |
| | | Term of Office,
| | | | Number of
| | |
| | | Position(s) Held
| | | | Funds in Fund
| | Other
|
| | | with the Fund
| | | | Complex
| | Directorships
|
Name and
| | Complex and
| | Principal Occupation(s)
| | Overseen by
| | Held by
|
| Date of Birth | | Length of Service | | During Past Five Years | | Board Member | | Board Member |
| |
| Non-Interested Board Members |
| |
Peter Meenan
12/5/41 | | Indefinite;
Eclipse Funds: Trustee since 2002 (2 funds);
Eclipse Funds Inc.: Director since 2002 (1 fund);
The MainStay Funds: Trustee since 2007 (14 funds);
MainStay Funds Trust: Trustee since 2009 (28 funds); and
MainStay VP Funds Trust: Director since 2011 and its predecessor, MainStay VP Series Fund, Inc., since 2007 (21 portfolios). | | Independent Consultant; President and Chief Executive Officer, Babson—United, Inc. (financial services firm) (2000 to 2004); Independent Consultant (1999 to 2000); Head of Global Funds, Citicorp (1995 to 1999) | | 66 | | None |
| |
| |
Richard H. Nolan, Jr.
11/16/46 | | Indefinite;
Eclipse Funds: Trustee since 2007 (2 funds);
Eclipse Funds Inc.: Director since 2007 (1 fund);
The MainStay Funds: Trustee since 2007 (14 funds);
MainStay Funds Trust: Trustee since 2009 (28 funds); and
MainStay VP Funds Trust: Director since 2011 and its predecessor, MainStay VP Series Fund, Inc., since 2006 (21 portfolios). | | Managing Director, ICC Capital Management; President—Shields/Alliance, Alliance Capital Management (1994 to 2004) | | 66 | | None |
| |
| |
Richard S. Trutanic
2/13/52 | | Indefinite;
Eclipse Funds: Trustee since 2007 (2 funds);
Eclipse Funds Inc.: Director since 2007 (1 fund);
The MainStay Funds: Trustee since 1994 (14 funds);
MainStay Funds Trust: Trustee since 2009 (28 funds); and
MainStay VP Funds Trust: Director since 2011 and its predecessor, MainStay VP Series Fund, Inc., since 2007 (21 portfolios). | | Chairman and Chief Executive Officer, Somerset & Company (financial advisory firm) (since 2004); Managing Director, The Carlyle Group (private investment firm) (2002 to 2004); Senior Managing Director, Partner and Board Member, Groupe Arnault S.A. (private investment firm) (1999 to 2002) | | 66 | | None |
| |
| |
mainstayinvestments.com 43
| | | | | | | | | |
| | | Term of Office,
| | | | Number of
| | |
| | | Position(s) Held
| | | | Funds in Fund
| | Other
|
| | | with the Fund
| | | | Complex
| | Directorships
|
Name and
| | Complex and
| | Principal Occupation(s)
| | Overseen by
| | Held by
|
| Date of Birth | | Length of Service | | During Past Five Years | | Board Member | | Board Member |
| |
| Non-Interested Board Members |
| |
Roman L. Weil
5/22/40 | | Indefinite;
Eclipse Funds:
Trustee and Audit Committee Financial Expert since 2007 (2 funds);
Eclipse Funds Inc.: Director and Audit Committee Financial Expert since 2007 (1 fund);
The MainStay Funds: Trustee and Audit Committee Financial Expert since 2007 (14 funds);
MainStay Funds Trust: Trustee since 2009 (28 funds); and
MainStay VP Funds Trust: Director and Audit Committee Financial Expert since 2011 and its predecessor, MainStay VP Series Fund, Inc., since 1994 and Audit Committee Financial Expert since 2003 (21 portfolios). | | Visiting Professor, NYU Stem School of Business, New York University (since 2011); President, Roman L. Weil Associates, Inc. (consulting firm) (since 1981); V. Duane Rath Professor Emeritus of Accounting, Chicago Booth School of Business, University of Chicago (1965-2008) | | 66 | | None |
| |
| |
John A. Weisser
10/22/41 | | Indefinite;
Eclipse Funds:
Trustee since 2007 (2 funds);
Eclipse Funds Inc.: Director since 2007 (1 fund);
The MainStay Funds: Trustee since 2007 (14 funds);
MainStay Funds Trust: Trustee since 2009 (28 funds); and
MainStay VP Funds Trust: Director since 2011 and its predecessor, MainStay VP Series Fund, Inc., since 1997 (21 portfolios). | | Retired. Managing Director of Salomon Brothers, Inc. (1971 to 1995) | | 66 | | Trustee, Direxion Funds since 2007 (27 portfolios); Direxion Insurance Trust since 2007 (1 portfolio); Trustee, Direxion Shares ETF Trust, since 2008 (50 portfolios) |
| |
| |
44 MainStay Balanced Fund
The following individuals have been appointed by the Board Members to serve as Officers of the MainStay Group of Funds.
| | | | | |
| | | Positions(s) Held
| | |
Name and
| | with the Funds
| | Principal Occupation(s)
|
| Date of Birth | | and Length of Service | | During Past Five Years |
| |
| Officers |
| |
Jack R. Benintende
5/12/64 | | Treasurer and Principal Financial and Accounting Officer, Eclipse Funds, Eclipse Funds, Inc. and The MainStay Funds (since 2007), MainStay Funds Trust (since 2009) | | Assistant Treasurer, New York Life Investment Management Holdings LLC (since 2008); Managing Director, New York Life Investment Management LLC (since 2007); Treasurer and Principal Financial and Accounting Officer, MainStay VP Funds Trust and its predecessor, MainStay VP Series Fund, Inc. (since 2007); Vice President, Prudential Investments (2000 to 2007); Assistant Treasurer, JennisonDryden Family of Funds, Target Portfolio Trust, The Prudential Series Fund and American Skandia Trust (2006 to 2007); Treasurer and Principal Financial Officer, The Greater China Fund (2007) |
| |
| |
Jeffrey A. Engelsman
9/28/67 | | Vice President and Chief Compliance Officer, Eclipse Funds, Eclipse Funds, Inc., The MainStay Funds and MainStay Funds Trust (since 2009) | | Managing Director, Compliance (since 2009), Director and Associate General Counsel, New York Life Investment Management LLC (2005 to 2008); Assistant Secretary, NYLIFE Distributors LLC (2006 to 2008); Assistant Secretary NYLIFE Distributors LLC (2006 to 2008); Vice President and Chief Compliance Officer, MainStay VP Funds Trust and its predecessor, MainStay VP Series Fund, Inc. (since 2009); Assistant Secretary, The MainStay Funds and ICAP Funds, Inc. (2006 to 2008); Assistant Secretary, Eclipse Funds, Eclipse Funds, Inc. and MainStay VP Series Fund, Inc. (2005 to 2008) |
| |
| |
Stephen P. Fisher
2/22/59 | | President, Eclipse Funds, Eclipse Funds, Inc. and The MainStay Funds (since 2007), MainStay Funds Trust (since 2009) | | Director, Senior Vice President, New York Life Insurance and Annuity Corporation (since 2011); Manager, President and Chief Operating Officer, NYLIFE Distributors LLC (since 2007); Chairman of the Board, NYLIM Service Company LLC (since 2008); Senior Managing Director and Chief Marketing Officer, New York Life Investment Management LLC (since 2005); President, MainStay VP Funds Trust and its predecessor, MainStay VP Series Fund, Inc. (since 2007) |
| |
| |
| J. Kevin Gao 10/13/67 | | Secretary and Chief Legal Officer, Eclipse Funds, Eclipse Funds, Inc., The MainStay Funds and MainStay Funds Trust (since 2010) | | Managing Director and Associate General Counsel, New York Life Investment Management LLC (since 2010); Secretary and Chief Legal Officer, MainStay VP Funds Trust and its predecessor, MainStay VP Series Fund, Inc. (since 2010); Director and Counsel of Credit Suisse, Chief Legal Officer and Secretary of Credit Suisse Asset Management, LLC and Credit Suisse Funds (2003 to 2010) |
| |
| |
Scott T. Harrington
2/8/59 | | Vice President — Administration, Eclipse Funds, Eclipse Funds, Inc. and The MainStay Funds (since 2005), MainStay Funds Trust (since 2009) | | Director, New York Life Investment Management LLC (including predecessor advisory organizations) (since 2000); Director (since 2009), New York Life Trust Company FSB; Vice President—Administration, MainStay VP Funds Trust and its predecessor, MainStay VP Series Fund, Inc. (since 2005) |
| |
| |
| | |
| | * | The Officers listed above are considered to be “interested persons” of the MainStay Group of Funds within the meaning of the 1940 Act because of their affiliation with New York Life Insurance Company, New York Life Investment Management LLC, Madison Square Investors LLC, MacKay Shields LLC, Institutional Capital LLC, Epoch Investment Partners, Inc., Markston International, LLC, Winslow Capital Management, Inc., NYLIFE Securities LLC and/or NYLIFE Distributors LLC, as described in detail above in the column captioned “Principal Occupation(s) During Past Five Years.” Officers are elected annually by the Board to serve a one-year term. |
mainstayinvestments.com 45
This page intentionally left blank
MainStay Funds
MainStay offers a wide range of Funds for virtually any investment need. The full array of MainStay offerings is listed here, with information about the manager, subadvisors, legal counsel, and independent registered public accounting firm.
Equity Funds
MainStay 130/30 Core Fund
MainStay Common Stock Fund
MainStay Epoch U.S. All Cap Fund
MainStay Epoch U.S. Equity Fund
MainStay Equity Index Fund1
MainStay Growth Equity Fund
MainStay ICAP Equity Fund
MainStay ICAP Select Equity Fund
MainStay Large Cap Growth Fund
MainStay MAP Fund
MainStay S&P 500 Index Fund
MainStay U.S. Small Cap Fund
Income Funds
MainStay Flexible Bond Opportunities Fund
MainStay Floating Rate Fund
MainStay Government Fund
MainStay High Yield Corporate Bond Fund
MainStay High Yield Municipal Bond Fund
MainStay High Yield Opportunities Fund
MainStay Indexed Bond Fund
MainStay Intermediate Term Bond Fund
MainStay Money Market Fund
MainStay Principal Preservation Fund
MainStay Short Term Bond Fund
MainStay Tax Free Bond Fund
Blended Funds
MainStay Balanced Fund
MainStay Convertible Fund
MainStay Income Builder Fund
International Funds
MainStay 130/30 International Fund
MainStay Epoch Global Choice Fund
MainStay Epoch Global Equity Yield Fund
MainStay Epoch International Small Cap Fund
MainStay Global High Income Fund
MainStay ICAP Global Fund
MainStay ICAP International Fund
MainStay International Equity Fund
Asset Allocation Funds
MainStay Conservative Allocation Fund
MainStay Growth Allocation Fund
MainStay Moderate Allocation Fund
MainStay Moderate Growth Allocation Fund
Retirement Funds
MainStay Retirement 2010 Fund
MainStay Retirement 2020 Fund
MainStay Retirement 2030 Fund
MainStay Retirement 2040 Fund
MainStay Retirement 2050 Fund
Manager
New York Life Investment Management LLC
New York, New York
Subadvisors
Epoch Investment Partners, Inc.
New York, New York
Institutional Capital LLC2
Chicago, Illinois
MacKay Shields LLC2
New York, New York
Madison Square Investors LLC2
New York, New York
Markston International LLC
White Plains, New York
Winslow Capital Management, Inc.
Minneapolis, Minnesota
Legal Counsel
Dechert LLP
Independent Registered Public Accounting Firm
KPMG LLP
| |
| 1. | Closed to new investors and new purchases as of January 1, 2002. |
| 2. | An affiliate of New York Life Investment Management LLC. |
Not part of the Annual Report
mainstayinvestments.com
The MainStay Funds are managed by New York Life Investment Management LLC and distributed through NYLIFE Distributors LLC,
169 Lackawanna Avenue, Parsippany, NJ 07054, a wholly owned subsidiary of New York Life Insurance Company.
NYLIFE Distributors is a Member FINRA/SIPC.
MainStay Investments is a registered service mark and name under which New York Life Investment Management LLC does business.
MainStay Investments, an indirect subsidiary of New York Life Insurance Company, New York, NY 10010, provides investment
advisory products and services.
This report may be distributed only when preceded or accompanied by a current Fund prospectus.
© 2012 by NYLIFE Distributors LLC. All rights reserved.
| | | | | | | | | | | | | |
| |
| Not FDIC/NCUA Insured | | | Not a Deposit | | | May Lose Value | | | No Bank Guarantee | | | Not Insured by Any Government Agency |
| |
| |
| NYLIM-25019 MS284-11 | MSBL11-12/11 |
NB7
MainStay U.S. Small Cap Fund
Message from the President and Annual Report
October 31, 2011
This page intentionally left blank
Message from the President
Volatility was the keynote of the 12 months ended October 31, 2011. U.S. stocks generally advanced, but a variety of domestic and international forces influenced the market.
Early in November 2010, the Federal Open Market Committee (FOMC) announced its intention to extend quantitative easing by purchasing additional longer-term Treasury securities. The stock market reacted positively to this news—and to the midterm elections—and stocks generally advanced through mid-February.
Beginning in December 2010, a wave of protests and civil unrest across North Africa and the Middle East led to a substantial rise in the price of oil. By mid-February, stock prices started to decline. In March, a major earthquake and tsunami in Japan caused manufacturing supply-line interruptions and further setbacks for equity investors. After a sharp decline and a rapid recovery, stocks reached their high point for the 12-month period at the end of April 2011.
Pressed by a weak economy, lackluster employment and widespread concerns about European sovereign debt, the stock market faced wide fluctuations in the coming months. The volatility included a precipitous decline at the end of July into early August. Shortly thereafter, the FOMC expressed its expectation that economic conditions were “likely to warrant exceptionally low levels for the federal funds rate at least through mid-2013.”
After several unsuccessful attempts to recover from their dramatic drop, U.S. stocks reached their low point for the reporting period in early October. Then, buoyed by positive economic data and progress in the European debt situation, the U.S. stock market advanced rapidly in October, to close the reporting period with its best monthly performance in nearly a decade.
International stocks suffered from the turmoil in the Middle East and North Africa, the natural disasters in Japan, the sovereign debt concerns in Europe and the added threat of an economic slowdown in China. For the 12-month period, international stocks declined overall, with particular weakness in Europe.
The bond markets felt the impact of the European debt crisis, and several European nations suffered downgrades. In July, the United States faced a congressional deadlock on raising the debt ceiling and reducing deficit spending. In early August, Standard & Poor’s downgraded the debt of the United States of America to AA+.
Slow progress in resolving the European debt situation led to a flight to quality (or a movement toward securities perceived to carry lower risk). Amid strong demand, U.S. Treasury securities saw prices rise and yields decline, despite the downgrade by Standard & Poor’s. High-grade corporate
bonds also benefited; and among high-yield credits, higher-rated issues advanced relative to lower-rated issues, which generally carry higher levels of risk. Toward the end of the reporting period, the high-yield market as a whole recovered as the stock market rose.
Throughout the 12-month reporting period, our portfolio managers took note of shifting market forces. But their primary focus was on the investment objectives of their respective Funds and the long-term strategies they were pursuing to achieve them. Some may have sought to capitalize on day-to-day market inefficiencies, but all remained focused on the long-term interests of our shareholders. They sought to apply time-tested investment principles consistently throughout the reporting period.
The information that follows provides specifics about the securities, decisions and market forces that affected your MainStay Fund(s) during the 12 months ended October 31, 2011. Behind the details, we hope you’ll recognize the professionalism and discipline that guided our portfolio managers during this volatile period.
We thank you for investing with MainStay and look forward to serving you for many years to come.
Sincerely,
Stephen P. Fisher
President
Not part of the Annual Report
Table of Contents
| | | |
| Annual Report |
| |
| Investment and Performance Comparison | | 5 |
| |
| |
| Portfolio Management Discussion and Analysis | | 9 |
| |
| |
| Portfolio of Investments | | 11 |
| |
| |
| Financial Statements | | 14 |
| |
| |
| Notes to Financial Statements | | 20 |
| |
| |
| Report of Independent Registered Public Accounting Firm | | 27 |
| |
| |
| Federal Income Tax Information | | 28 |
| |
| |
| Proxy Voting Policies and Procedures and Proxy Voting Record | | 28 |
| |
| |
| Shareholder Reports and Quarterly Portfolio Disclosure | | 28 |
| |
| |
| Board Members and Officers | | 29 |
| |
| |
Investors should refer to the Fund’s Summary Prospectus and/or Prospectus and consider the Fund’s investment objectives, strategies, risks, charges and expenses carefully before investing. The Summary Prospectus and/or Prospectus contain this and other information about the Fund. You may obtain copies of the Fund’s Summary Prospectus, Prospectus and Statement of Additional Information free of charge, upon request, by calling toll-free 800-MAINSTAY (624-6782), by writing to NYLIFE Distributors LLC, Attn: MainStay Marketing Department, 169 Lackawanna Avenue, Parsippany, New Jersey 07054 or by sending an e-mail to MainStayShareholderServices@nylim.com. These documents are also available via the MainStay Funds’ website at mainstayinvestments.com/documents. Please read the Summary Prospectus and/or Prospectus carefully before investing.
Investment and Performance Comparison1 (Unaudited)
Performance data quoted represents past performance. Past performance is no guarantee of future results. Because of market volatility, current performance may be lower or higher than the figures shown. Investment return and principal value will fluctuate, and as a result, when shares are redeemed, they may be worth more or less than their original cost. The graph below depicts the historical performance of Class I shares of the Fund. Performance will vary from class to class based on differences in class-specific expenses and sales charges. For performance information current to the most recent month-end, please call 800-MAINSTAY (624-6782) or visit mainstayinvestments.com.
Average Annual Total Returns for the Year Ended October 31, 2011
| | | | | | | | | | | | | | | | | | | | | |
| | | | | | | | | | | | | | Gross
|
| | | | | | | | | | | | | | Expense
|
| Class | | Sales Charge | | | | One Year | | | Five Years | | Ten Years | | Ratio2 |
| |
| |
Investor Class Shares3 | | Maximum 5.5% Initial Sales Charge | | With sales charges | | | –0.26 | % | | | –2 | .06% | | | 8 | .26% | | | 1 | .81% |
| | | | | Excluding sales charges | | | 5.55 | | | | –0 | .94 | | | 8 | .88 | | | 1 | .81 |
| |
| |
Class A Shares4 | | Maximum 5.5% Initial Sales Charge | | With sales charges | | | 0.04 | | | | –1 | .93 | | | 8 | .33 | | | 1 | .48 |
| | | | | Excluding sales charges | | | 5.86 | | | | –0 | .81 | | | 8 | .95 | | | 1 | .48 |
| |
| |
Class B Shares4 | | Maximum 5% CDSC | | With sales charges | | | –0.19 | | | | –2 | .00 | | | 8 | .07 | | | 2 | .56 |
| | | if Redeemed Within the First Six Years of Purchase | | Excluding sales charges | | | 4.81 | | | | –1 | .66 | | | 8 | .07 | | | 2 | .56 |
| |
| |
Class C Shares5 | | Maximum 1% CDSC | | With sales charges | | | 3.74 | | | | –1 | .67 | | | 8 | .09 | | | 2 | .56 |
| | | if Redeemed Within One Year of Purchase | | Excluding sales charges | | | 4.74 | | | | –1 | .67 | | | 8 | .09 | | | 2 | .56 |
| |
| |
| Class I Shares | | No Sales Charges | | | | | 6.11 | | | | –0 | .44 | | | 9 | .34 | | | 1 | .23 |
| |
| |
| |
| 1. | The performance table and graph do not reflect the deduction of taxes that a shareholder would pay on distributions or Fund-share redemptions. Total returns reflect maximum applicable sales charges as indicated in the table above, change in share price, and reinvestment of dividend and capital gain distributions. The graph assumes the initial investment amount shown above and reflects the deduction of all sales charges that would have applied for the period of investment. Performance figures reflect certain fee waivers and/or expense limitations, without which total returns may have been lower. For more information on share classes and current fee waivers and/or expense limitations, please refer to the notes to the financial statements. |
| |
| 2. | The gross expense ratios presented reflect the Fund’s “Total Annual Fund Operating Expenses” from the most recent Prospectus and may differ from other expense ratios disclosed in this report. |
| 3. | Performance figures for Investor Class shares, first offered on February 28, 2008, include the historical performance of Class A shares through February 27, 2008, adjusted for differences in certain expenses and fees. Unadjusted, the performance shown for Investor Class shares might have been lower. |
| 4. | Performance figures for Class A and B shares, first offered on January 2, 2004, include the historical performance of Class I shares through January 1, 2004, adjusted for differences in certain expenses and fees. Unadjusted, the performance shown for Class A and Class B shares might have been lower. |
| 5. | Performance figures for Class C shares, first offered on January 2, 2004, include the historical performance of L Class shares (which were redesignated as Class C shares on January 2, 2004) from December 30, 2002, through January 1, 2004, and the historical performance of Class I |
The footnotes on the next page are an integral part of the table and graph and should be carefully read in conjunction with them.
mainstayinvestments.com 5
| | | | | | | | | | | | | |
| | | One
| | Five
| | Ten
|
Benchmark Performance
| | Year | | Years | | Years |
| |
Russell 2500tm Index6 | | | 7 | .97% | | | 2 | .01% | | | 8 | .01% |
| |
| |
Average Lipper Small-Cap Core Fund7 | | | 7 | .31 | | | 1 | .13 | | | 7 | .31 |
| |
| |
| |
| shares through December 29, 2002, adjusted for differences in certain expenses and fees. Unadjusted, the performance shown for Class C shares might have been lower. |
| |
| 6. | The Russell 2500tm Index measures the performance of the small to mid-cap segment of the U.S. equity universe, commonly referred to as “smid” cap. The Russell 2500tm Index is subset of the Russell 3000® Index. It includes approximately 2,500 of the smallest securities based on a combination of their market cap and current index membership. The Russell 2500tm Index is the Fund’s broad-based securities market index for comparison purposes. Total returns assume reinvestment of all dividends and capital gains. An investment cannot be made directly in an index. |
| 7. | The average Lipper small-cap core fund is representative of funds that, by portfolio practice, invest at least 75% of their equity assets in companies with market capitalizations (on a three-year weighted basis) below Lipper’s U.S. Diversified Equity small-cap ceiling. Small-cap core funds have more latitude in the companies in which they invest. These funds typically have a below-average price-to-earnings ratio, price-to-book ratio, and three-year sales-per-share growth value, compared to the S&P SmallCap 600 Index. This average is a product of Lipper Inc. Lipper Inc. is an independent monitor of fund performance. Results are based on average total returns of similar funds with all dividend and capital gain distributions reinvested. |
The footnotes on the preceding page are an integral part of the table and graph and should be carefully read in conjunction with them.
6 MainStay U.S. Small Cap Fund
Cost in Dollars of a $1,000 Investment in MainStay U.S. Small Cap Fund (Unaudited)
The example below is intended to describe the fees and expenses borne by shareholders during the six-month period from May 1, 2011, to October 31, 2011, and the impact of those costs on your investment.
Example
As a shareholder of the Fund, you incur two types of costs: (1) transaction costs, including exchange fees and sales charges (loads) on purchases (as applicable), and (2) ongoing costs, including management fees, distribution and/or service (12b-1) fees, and other Fund expenses (as applicable). This example is intended to help you understand your ongoing costs (in dollars) of investing in the Fund and to compare these costs with the ongoing costs of investing in other mutual funds. The example is based on an investment of $1,000 made at the beginning of the six-month period and held for the entire period from May 1, 2011, to October 31, 2011.
This example illustrates your Fund’s ongoing costs in two ways:
Actual Expenses
The second and third data columns in the table below provide information about actual account values and actual expenses. You may use the information in these columns, together with the amount you invested, to estimate the expenses that you paid during the six months ended October 31, 2011. Simply divide your account value by $1,000 (for example, an $8,600 account value divided by $1,000 = 8.6), then multiply the result by the number under the heading entitled ”Expenses Paid During Period” to estimate the expenses you paid on your account during this period.
Hypothetical Example for Comparison Purposes
The fourth and fifth data columns in the table below provide information about hypothetical account values and hypothetical expenses based on the Fund’s actual expense ratio and an assumed rate of return of 5% per year before expenses, which is not the Fund’s actual return. The hypothetical account values and expenses may not be used to estimate the actual ending account balances or expenses you paid for the six-month period shown. You may use this information to compare the ongoing costs of investing in the Fund with the ongoing costs of investing in other Funds. To do so, compare this 5% hypothetical example with the 5% hypothetical examples that appear in the shareholder reports of the other Funds.
Please note that the expenses shown in the table are meant to highlight your ongoing costs only and do not reflect any transactional costs, such as exchange fees or sales charges (loads). Therefore, the fourth and fifth data columns of the table are useful in comparing ongoing costs only and will not help you determine the relative total costs of owning different funds. In addition, if these transactional costs were included, your costs would have been higher.
| | | | | | | | | | | | | | | | | | | | | | | |
| | |
| | | | | | | | | | | | | | Ending Account
| | | | |
| | | | | | | Ending Account
| | | | | | | Value (Based
| | | | |
| | | | | | | Value (Based
| | | | | | | on Hypothetical
| | | | |
| | | Beginning
| | | | on Actual
| | | Expenses
| | | | 5% Annualized
| | | Expenses
| |
| | | Account
| | | | Returns and
| | | Paid
| | | | Return and
| | | Paid
| |
| | | Value
| | | | Expenses)
| | | During
| | | | Actual Expenses)
| | | During
| |
| Share Class | | 5/1/11 | | | | 10/31/11 | | | Period1 | | | | 10/31/11 | | | Period1 | |
Investor Class Shares | | $ | 1,000.00 | | | | $ | 896.80 | | | $ | 7.84 | | | | $ | 1,016.90 | | | $ | 8.34 | |
| | | | | | | | | | | | | | | | | | | | | | | |
Class A Shares | | $ | 1,000.00 | | | | $ | 898.60 | | | $ | 6.32 | | | | $ | 1,018.60 | | | $ | 6.72 | |
| | | | | | | | | | | | | | | | | | | | | | | |
Class B Shares | | $ | 1,000.00 | | | | $ | 893.80 | | | $ | 11.41 | | | | $ | 1,013.20 | | | $ | 12.13 | |
| | | | | | | | | | | | | | | | | | | | | | | |
Class C Shares | | $ | 1,000.00 | | | | $ | 893.20 | | | $ | 11.40 | | | | $ | 1,013.20 | | | $ | 12.13 | |
| | | | | | | | | | | | | | | | | | | | | | | |
Class I Shares | | $ | 1,000.00 | | | | $ | 899.30 | | | $ | 5.12 | | | | $ | 1,019.80 | | | $ | 5.45 | |
| | | | | | | | | | | | | | | | | | | | | | | |
| |
| 1. | Expenses are equal to the Fund’s annualized expense ratio of each class (1.64% for Investor Class, 1.32% for Class A, 2.39% for Class B and Class C and 1.07% for Class I) multiplied by the average account value over the period, divided by 365 and multiplied by 184 (to reflect the one-half year period). The table above represents the actual expenses incurred during the one-half year period. |
mainstayinvestments.com 7
Industry Composition as of October 31, 2011 (Unaudited)
| | | | | |
| Machinery | | | 8.1 | % |
| Specialty Retail | | | 6.0 | |
| Health Care Equipment & Supplies | | | 5.1 | |
| Textiles, Apparel & Luxury Goods | | | 5.0 | |
| Commercial Banks | | | 4.5 | |
| Aerospace & Defense | | | 4.4 | |
| Chemicals | | | 3.9 | |
| Auto Components | | | 3.6 | |
| Electric Utilities | | | 3.5 | |
| Exchange Traded Funds | | | 3.3 | |
| IT Services | | | 3.3 | |
| Multi-Utilities | | | 3.3 | |
| Building Products | | | 3.2 | |
| Biotechnology | | | 2.3 | |
| Health Care Providers & Services | | | 2.2 | |
| Road & Rail | | | 2.2 | |
| Electrical Equipment | | | 2.1 | |
| Food Products | | | 2.1 | |
| Pharmaceuticals | | | 2.1 | |
| Thrifts & Mortgage Finance | | | 2.1 | |
| Electronic Equipment & Instruments | | | 2.0 | |
| Wireless Telecommunication Services | | | 2.0 | |
| Hotels, Restaurants & Leisure | | | 1.9 | |
| Semiconductors & Semiconductor Equipment | | | 1.8 | |
| Insurance | | | 1.6 | |
| Communications Equipment | | | 1.5 | |
| Computers & Peripherals | | | 1.5 | |
| Diversified Consumer Services | | | 1.5 | |
| Energy Equipment & Services | | | 1.5 | |
| Diversified Financial Services | | | 1.4 | |
| Software | | | 1.2 | |
| Real Estate Investment Trusts | | | 1.1 | |
| Containers & Packaging | | | 1.0 | |
| Capital Markets | | | 0.9 | |
| Professional Services | | | 0.7 | |
| Household Durables | | | 0.6 | |
| Short-Term Investment | | | 5.0 | |
| Other Assets, Less Liabilities | | | 0.5 | |
| | | | | |
| | | | 100.0 | % |
| | | | | |
See Portfolio of Investments beginning on page 11 for specific holdings within these categories.
Top Ten Holdings as of October 31, 2011 (excluding short-term investment)
| | | |
| 1. | | Alkermes PLC |
| 2. | | iShares Russell 2000 Index Fund |
| 3. | | NeuStar, Inc. Class A |
| 4. | | Endo Pharmaceuticals Holdings, Inc. |
| 5. | | Corn Products International, Inc. |
| 6. | | Woodward Governor Co. |
| 7. | | Mueller Industries, Inc. |
| 8. | | NTELOS Holdings Corp. |
| 9. | | Westar Energy, Inc. |
| 10. | | Vectren Corp. |
8 MainStay U.S. Small Cap Fund
Portfolio Management Discussion and Analysis (Unaudited)
Questions answered by portfolio managers David Pearl, Michael Welhoelter, CFA, William Priest, CFA, and Janet K. Navon of Epoch Investment Partners, Inc., the Fund’s Subadvisor.
How did MainStay U.S. Small Cap Fund perform relative to its peers and its benchmark during the 12 months ended October 31, 2011?
Excluding all sales charges, MainStay U.S. Small Cap Fund returned 5.55% for Investor Class shares, 5.86% for Class A shares, 4.81% for Class B shares and 4.74% for Class C shares for the 12 months ended October 31, 2011. Over the same period, Class I shares returned 6.11%. All share classes underperformed the 7.31% return of the average Lipper1 small-cap core fund and the 7.97% return of the Russell 2500tm Index2 for the 12 months ended October 31, 2011. The Russell 2500tm Index is the Fund’s broad-based securities-market index. See page 5 for Fund returns with sales charges.
Were there any changes to the Fund’s day-to-day management during the reporting period?
Effective August 1, 2011, Janet K. Navon became an additional portfolio manager for the Fund. For more information about this adjustment, see the Prospectus Supplement dated August 1, 2011.
What factors affected the Fund’s relative performance during the reporting period?
Oil prices spent most of the reporting period above where they were on November 1, 2010. Having an underweight exposure to the energy sector—the second-best-performing sector in the Russell 2500tm Index during the reporting period—detracted from the Fund’s relative returns. Specific energy holdings also hindered the Fund’s results in relation to the benchmark.
During the reporting period, which sectors were the strongest contributors to the Fund’s relative performance and which sectors were particularly weak?
During the reporting period, the strongest positive sector contributions to the Fund’s performance relative to the Russell 2500tm Index came from the industrials, consumer discretionary and information technology sectors. (Contributions take weightings and total returns into account.) These positive contributions were largely due to stock selection.
During the reporting period, the sector that made the weakest contribution to the Fund’s relative performance was energy. Stock selection and an underweight position relative to the Russell 2500tm Index detracted from relative performance. Stock selection in the health care and materials sectors also hurt the Fund’s relative performance.
During the reporting period, which individual stocks made the strongest contributions to the Fund’s absolute performance, and which stocks detracted the most?
The strongest contributions to the Fund’s absolute performance came from Irish biotechnology company Alkermes; kitchen, home and beauty product company Tupperware Brands; and semiconductor equipment company Varian Semiconductor Equipment Associates. Alkermes posted strong results and, in May, announced the purchase of Elan Drug Technologies. This accretive acquisition will add royalty streams from two newly approved drugs that we believe will grow and diversify Alkermes’ product line-up. Tupperware Brands reported brisk sales in emerging markets. Varian Semiconductor Equipment Associates’ stock price jumped in May when the company agreed to be acquired by Applied Materials at a 41% premium.
The Fund’s three weakest contributions to absolute performance came from energy equipment & services company Cal Dive International, specialty chemical company Chemtura and pharmaceuticals company Endo Pharmaceuticals. Cal Dive International suffered from the slow return of activity in the Gulf of Mexico. This led to concerns that the company’s debt covenants would be breached, despite a growing backlog of work. The covenants have been modified, and permitting in the Gulf of Mexico continues to pick up. Shares of Chemtura declined during the reporting period as investors shied away from companies that were more cyclical. There was also skepticism that Chemtura would meet its earnings estimates. We continue to believe that the company is well positioned because it has reduced costs by 30%, it has a diversified business mix, and it has a strong management team. Endo Pharmaceuticals, which specializes in pain medications, declined as investors worried about the strength of its product pipeline in the face of upcoming patent expirations. We believed the company would continue to be extremely profitable and, on a cash-flow basis, appears undervalued compared to its peers.
Did the Fund make any significant purchases or sales during the reporting period?
During the reporting period, we initiated several new positions, including apparel retailer Express, which targets the 20- to 30-year-old demographic. We believe the company is on a renewed growth trajectory after having closed unprofitable stores. No longer partially owned by Limited Brands, Express can expand into competing offerings. We also added Diebold, a global manufacturer of automated teller machines. The company is experiencing double-digit revenue growth as banks replace their old equipment.
We sold the Fund’s position in telecommunication services company Syniverse when the company agreed to be acquired by private equity fund Carlyle Group at a significant premium. Tupperware Brands had good share price performance, and we sold the Fund’s position in the stock as it reached our price target.
1. See footnote on page 6 for more information on Lipper Inc.
2. See footnote on page 6 for more information on the Russell 2500tm Index.
mainstayinvestments.com 9
How did the Fund’s sector weightings change during the reporting period?
We increased the Fund’s weightings in the consumer discretionary and industrials sectors, adding to positions that were already overweight relative to the Russell 2500tm Index. We reduced the Fund’s weighting in financials, increasing the degree to which the Fund was underweight relative to the benchmark in that sector. We also reduced the Fund’s exposure in the materials and telecommunication services sectors during the reporting period.
How was the Fund positioned at the end of October 2011?
As of October 31, 2011, the Fund’s most substantially overweight sectors relative to the Russell 2500tm Index were in industrials and consumer discretionary. As of the same date, the Fund’s most substantially underweight sector position relative to the Russell 2500tm Index was in financials. The Fund also held underweight sector positions in energy and information technology.
The opinions expressed are those of the portfolio managers as of the date of this report and are subject to change. There is no guarantee that any forecast made will come to pass. This material does not constitute investment advice and is not intended as an endorsement of any specific investment.
10 MainStay U.S. Small Cap Fund
Portfolio of Investments October 31, 2011
| | | | | | | | | |
| | | Shares | | | Value | |
| Common Stocks 91.2%† |
| |
Aerospace & Defense 4.4% |
| Curtiss-Wright Corp. | | | 174,100 | | | $ | 5,706,998 | |
| Esterline Technologies Corp. (a) | | | 98,550 | | | | 5,508,945 | |
| Hexcel Corp. (a) | | | 230,250 | | | | 5,689,477 | |
| | | | | | | | | |
| | | | | | | | 16,905,420 | |
| | | | | | | | | |
Auto Components 3.6% |
| Dana Holding Corp. (a) | | | 335,700 | | | | 4,746,798 | |
| Tenneco, Inc. (a) | | | 149,650 | | | | 4,896,548 | |
| Visteon Corp. (a) | | | 75,500 | | | | 4,199,310 | |
| | | | | | | | | |
| | | | | | | | 13,842,656 | |
| | | | | | | | | |
Biotechnology 2.3% |
X Alkermes PLC (a) | | | 511,685 | | | | 8,949,371 | |
| | | | | | | | | |
Building Products 3.2% |
| Armstrong World Industries, Inc. | | | 116,700 | | | | 4,970,253 | |
| Masco Corp. | | | 195,750 | | | | 1,879,200 | |
| Simpson Manufacturing Co., Inc. | | | 179,750 | | | | 5,511,135 | |
| | | | | | | | | |
| | | | | | | | 12,360,588 | |
| | | | | | | | | |
Capital Markets 0.9% |
| Waddell & Reed Financial, Inc. Class A | | | 120,150 | | | | 3,331,760 | |
| | | | | | | | | |
Chemicals 3.9% |
| Chemtura Corp. (a) | | | 349,150 | | | | 4,238,681 | |
| Methanex Corp. | | | 212,350 | | | | 5,487,124 | |
| Nalco Holding Co. | | | 146,500 | | | | 5,524,515 | |
| | | | | | | | | |
| | | | | | | | 15,250,320 | |
| | | | | | | | | |
Commercial Banks 4.5% |
| Bank of Hawaii Corp. | | | 141,800 | | | | 5,988,214 | |
| Investors Bancorp, Inc. (a) | | | 417,252 | | | | 5,791,458 | |
| Texas Capital Bancshares, Inc. (a) | | | 203,900 | | | | 5,709,200 | |
| | | | | | | | | |
| | | | | | | | 17,488,872 | |
| | | | | | | | | |
Communications Equipment 1.5% |
| Harmonic, Inc. (a) | | | 1,035,435 | | | | 5,694,893 | |
| | | | | | | | | |
Computers & Peripherals 1.5% |
| Diebold, Inc. | | | 185,100 | | | | 5,975,028 | |
| | | | | | | | | |
Containers & Packaging 1.0% |
| Silgan Holdings, Inc. | | | 98,750 | | | | 3,707,075 | |
| | | | | | | | | |
Diversified Consumer Services 1.5% |
| Service Corp. International | | | 565,350 | | | | 5,653,500 | |
| | | | | | | | | |
Diversified Financial Services 1.4% |
| CBOE Holdings, Inc. | | | 213,300 | | | | 5,573,529 | |
| | | | | | | | | |
Electric Utilities 3.5% |
| Great Plains Energy, Inc. | | | 305,450 | | | | 6,335,033 | |
X Westar Energy, Inc. | | | 267,000 | | | | 7,278,420 | |
| | | | | | | | | |
| | | | | | | | 13,613,453 | |
| | | | | | | | | |
Electrical Equipment 2.1% |
X Woodward Governor Co. | | | 237,150 | | | | 8,034,642 | |
| | | | | | | | | |
Electronic Equipment & Instruments 2.0% |
| DTS, Inc. (a) | | | 131,416 | | | | 3,691,475 | |
| MTS Systems Corp. | | | 108,550 | | | | 3,980,529 | |
| | | | | | | | | |
| | | | | | | | 7,672,004 | |
| | | | | | | | | |
Energy Equipment & Services 1.5% |
| Cal Dive International, Inc. (a) | | | 784,250 | | | | 1,756,720 | |
| Dril-Quip, Inc. (a) | | | 61,200 | | | | 3,984,120 | |
| | | | | | | | | |
| | | | | | | | 5,740,840 | |
| | | | | | | | | |
Food Products 2.1% |
X Corn Products International, Inc. | | | 166,600 | | | | 8,080,100 | |
| Flowers Foods, Inc. | | | 7,350 | | | | 148,396 | |
| | | | | | | | | |
| | | | | | | | 8,228,496 | |
| | | | | | | | | |
Health Care Equipment & Supplies 5.1% |
| Alere, Inc. (a) | | | 105,750 | | | | 2,755,845 | |
| Haemonetics Corp. (a) | | | 86,300 | | | | 5,259,985 | |
| SonoSite, Inc. (a) | | | 182,900 | | | | 5,668,071 | |
| Teleflex, Inc. | | | 97,900 | | | | 5,860,294 | |
| | | | | | | | | |
| | | | | | | | 19,544,195 | |
| | | | | | | | | |
Health Care Providers & Services 2.2% |
| Bio-Reference Laboratories, Inc. (a) | | | 250,325 | | | | 5,016,513 | |
| PSS World Medical, Inc. (a) | | | 151,250 | | | | 3,365,312 | |
| | | | | | | | | |
| | | | | | | | 8,381,825 | |
| | | | | | | | | |
Hotels, Restaurants & Leisure 1.9% |
| Multimedia Games, Inc. (a) | | | 448,923 | | | | 2,967,381 | |
| Shuffle Master, Inc. (a) | | | 418,500 | | | | 4,440,285 | |
| | | | | | | | | |
| | | | | | | | 7,407,666 | |
| | | | | | | | | |
Household Durables 0.6% |
| Ryland Group, Inc. (The) | | | 179,750 | | | | 2,426,625 | |
| | | | | | | | | |
Insurance 1.6% |
| Arthur J. Gallagher & Co. | | | 194,700 | | | | 6,016,230 | |
| | | | | | | | | |
IT Services 3.3% |
| Forrester Research, Inc. | | | 131,562 | | | | 4,711,235 | |
X NeuStar, Inc. Class A (a) | | | 255,400 | | | | 8,119,166 | |
| | | | | | | | | |
| | | | | | | | 12,830,401 | |
| | | | | | | | | |
| |
| † | Percentages indicated are based on Fund net assets. |
| |
| X | Among the Fund’s 10 largest holdings, as of October 31, 2011, excluding short-term investment. May be subject to change daily. |
The notes to the financial statements are an integral part of,
| |
| and should be read in conjunction with, the financial statements. | mainstayinvestments.com 11 |
Portfolio of Investments October 31, 2011 (continued)
| | | | | | | | | |
| | | Shares | | | Value | |
Common Stocks (continued) |
|
Machinery 8.1% |
| Actuant Corp. Class A | | | 77,600 | | | $ | 1,746,000 | |
| Harsco Corp. | | | 166,800 | | | | 3,844,740 | |
| Kaydon Corp. | | | 107,600 | | | | 3,385,096 | |
| Kennametal, Inc. | | | 180,989 | | | | 7,038,662 | |
X Mueller Industries, Inc. | | | 197,300 | | | | 7,980,785 | |
| Wabtec Corp. | | | 107,281 | | | | 7,207,138 | |
| | | | | | | | | |
| | | | | | | | 31,202,421 | |
| | | | | | | | | |
Multi-Utilities 3.3% |
| NSTAR | | | 126,774 | | | | 5,716,240 | |
X Vectren Corp. | | | 254,450 | | | | 7,221,291 | |
| | | | | | | | | |
| | | | | | | | 12,937,531 | |
| | | | | | | | | |
Pharmaceuticals 2.1% |
X Endo Pharmaceuticals Holdings, Inc. (a) | | | 250,650 | | | | 8,098,501 | |
| | | | | | | | | |
Professional Services 0.7% |
| Resources Connection, Inc. | | | 262,600 | | | | 2,912,234 | |
| | | | | | | | | |
Real Estate Investment Trusts 1.1% |
| Tanger Factory Outlet Centers, Inc. | | | 147,900 | | | | 4,164,864 | |
| | | | | | | | | |
Road & Rail 2.2% |
| Con-way, Inc. | | | 142,750 | | | | 4,206,843 | |
| Genesee & Wyoming, Inc. Class A (a) | | | 72,040 | | | | 4,265,488 | |
| | | | | | | | | |
| | | | | | | | 8,472,331 | |
| | �� | | | | | | | |
Semiconductors & Semiconductor Equipment 1.8% |
| MEMC Electronic Materials, Inc. (a) | | | 436,900 | | | | 2,617,031 | |
| Teradyne, Inc. (a) | | | 301,250 | | | | 4,313,900 | |
| | | | | | | | | |
| | | | | | | | 6,930,931 | |
| | | | | | | | | |
Software 1.2% |
| Solera Holdings, Inc. | | | 59,600 | | | | 3,255,948 | |
| THQ, Inc. (a) | | | 665,377 | | | | 1,417,253 | |
| | | | | | | | | |
| | | | | | | | 4,673,201 | |
| | | | | | | | | |
Specialty Retail 6.0% |
| Express, Inc. | | | 315,600 | | | | 7,129,404 | |
| JoS. A. Bank Clothiers, Inc. (a) | | | 98,525 | | | | 5,265,176 | |
| Monro Muffler Brake, Inc. | | | 115,770 | | | | 4,293,909 | |
| Sonic Automotive, Inc. | | | 309,300 | | | | 4,537,431 | |
| Stage Stores, Inc. | | | 117,317 | | | | 1,833,665 | |
| | | | | | | | | |
| | | | | | | | 23,059,585 | |
| | | | | | | | | |
Textiles, Apparel & Luxury Goods 5.0% |
| G-III Apparel Group, Ltd. (a) | | | 177,250 | | | | 4,996,677 | |
| Iconix Brand Group, Inc. (a) | | | 248,450 | | | | 4,459,678 | |
| Perry Ellis International, Inc. (a) | | | 190,450 | | | | 4,780,295 | |
| Warnaco Group, Inc. (The) (a) | | | 100,050 | | | | 4,912,455 | |
| | | | | | | | | |
| | | | | | | | 19,149,105 | |
| | | | | | | | | |
Thrifts & Mortgage Finance 2.1% |
| BankUnited, Inc. | | | 137,400 | | | | 2,993,946 | |
| Brookline Bancorp, Inc. | | | 599,200 | | | | 5,009,312 | |
| | | | | | | | | |
| | | | | | | | 8,003,258 | |
| | | | | | | | | |
Wireless Telecommunication Services 2.0% |
X NTELOS Holdings Corp. | | | 396,850 | | | | 7,548,087 | |
| | | | | | | | | |
Total Common Stocks
(Cost $314,492,084) | | | | | | | 351,781,438 | |
| | | | | | | | | |
| Exchange Traded Funds 3.3% (b) |
| |
X iShares Russell 2000 Index Fund | | | 118,450 | | | | 8,761,746 | |
| iShares Russell 2000 Value Index Fund | | | 58,650 | | | | 3,828,672 | |
| | | | | | | | | |
Total Exchange Traded Funds
(Cost $11,916,352) | | | | | | | 12,590,418 | |
| | | | | | | | | |
| | | Principal
| | | | |
| | | Amount | | | | |
| Short-Term Investment 5.0% |
| |
Repurchase Agreement 5.0% |
State Street Bank and Trust Co.
0.01%, dated 10/31/11
due 11/1/11
Proceeds at Maturity $19,491,454
(Collateralized by a United States Treasury Bond with a rate of 4.625% and a maturity date of 2/15/40, with a Principal Amount of $15,640,000 and a Market Value of $19,882,194) | | $ | 19,491,449 | | | | 19,491,449 | |
| | | | | | | | | |
Total Short-Term Investment
(Cost $19,491,449) | | | | | | | 19,491,449 | |
| | | | | | | | | |
Total Investments
(Cost $345,899,885) (c) | | | 99.5 | % | | | 383,863,305 | |
| Other Assets, Less Liabilities | | | 0.5 | | | | 1,757,433 | |
| | | | | | | | | |
| | | | | | | | | |
| Net Assets | | | 100.0 | % | | $ | 385,620,738 | |
| | | | | | | | | |
| | | | | | | | | |
| | | |
| (a) | | Non-income producing security. |
| (b) | | Exchange Traded Fund—An investment vehicle that represents a basket of securities that is traded on an exchange. |
| (c) | | At October 31, 2011, cost is $347,139,194 for federal income tax purposes and net unrealized appreciation is as follows: |
| | | | | |
| Gross unrealized appreciation | | $ | 61,094,228 | |
| Gross unrealized depreciation | | | (24,370,117 | ) |
| | | | | |
| Net unrealized appreciation | | $ | 36,724,111 | |
| | | | | |
The notes to the financial statements are an integral part of,
| |
| 12 MainStay U.S. Small Cap Fund | and should be read in conjunction with, the financial statements. |
The following is a summary of the fair valuations according to the inputs used as of October 31, 2011, for valuing the Fund’s assets.
Asset Valuation Inputs
| | | | | | | | | | | | | | | | | |
| | | Quoted
| | | | | | | | | | |
| | | Prices in
| | | | | | | | | | |
| | | Active
| | | Significant
| | | | | | | |
| | | Markets for
| | | Other
| | | Significant
| | | | |
| | | Identical
| | | Observable
| | | Unobservable
| | | | |
| | | Assets
| | | Inputs
| | | Inputs
| | | | |
| Description | | (Level 1) | | | (Level 2) | | | (Level 3) | | | Total | |
| Investments in Securities (a) | | | | | | | | | | | | | | | | |
| Common Stocks | | $ | 351,781,438 | | | $ | — | | | $ | — | | | $ | 351,781,438 | |
| Exchange Traded Funds | | | 12,590,418 | | | | — | | | | — | | | | 12,590,418 | |
| Short-Term Investment | | | | | | | | | | | | | | | | |
| Repurchase Agreement | | | — | | | | 19,491,449 | | | | — | | | | 19,491,449 | |
| | | | | | | | | | | | | | | | | |
| Total Investments in Securities | | $ | 364,371,856 | | | $ | 19,491,449 | | | $ | — | | | $ | 383,863,305 | |
| | | | | | | | | | | | | | | | | |
| |
| (a) | For a complete listing of investments and their industries, see the Portfolio of Investments. |
The Fund recognizes transfers between the levels as of the beginning of the period.
For the year ended October 31, 2011, the Fund did not have any transfers between Level 1 and Level 2 fair value measurements. (See Note 2)
At October 31, 2011, the Fund did not hold any investments with significant unobservable inputs (Level 3). (See Note 2)
The notes to the financial statements are an integral part of,
| |
| and should be read in conjunction with, the financial statements. | mainstayinvestments.com 13 |
Statement of Assets and Liabilities as of October 31, 2011
| | | | | |
Assets
|
| Investment in securities, at value (identified cost $345,899,885) | | $ | 383,863,305 | |
| Receivables: | | | | |
| Investment securities sold | | | 2,393,931 | |
| Dividends and interest | | | 157,274 | |
| Fund shares sold | | | 121,500 | |
| Other assets | | | 30,779 | |
| | | | | |
| Total assets | | | 386,566,789 | |
| | | | | |
| | | | | |
| | | | | |
Liabilities
|
| Payables: | | | | |
| Fund shares redeemed | | | 330,713 | |
| Manager (See Note 3) | | | 262,902 | |
| Transfer agent (See Note 3) | | | 191,234 | |
| NYLIFE Distributors (See Note 3) | | | 75,680 | |
| Shareholder communication | | | 51,244 | |
| Professional fees | | | 24,971 | |
| Trustees | | | 1,419 | |
| Custodian | | | 1,091 | |
| Accrued expenses | | | 6,797 | |
| | | | | |
| Total liabilities | | | 946,051 | |
| | | | | |
| Net assets | | $ | 385,620,738 | |
| | | | | |
| | | | | |
| | | | | |
Composition of Net Assets
|
| Shares of beneficial interest outstanding (par value of $.01 per share) unlimited number of shares authorized | | $ | 237,880 | |
| Additional paid-in capital | | | 585,906,602 | |
| | | | | |
| | | | 586,144,482 | |
| Accumulated net realized gain (loss) on investments | | | (238,487,164 | ) |
| Net unrealized appreciation (depreciation) on investments | | | 37,963,420 | |
| | | | | |
| Net assets | | $ | 385,620,738 | |
| | | | | |
Investor Class | | | | |
| Net assets applicable to outstanding shares | | $ | 68,151,896 | |
| | | | | |
| Shares of beneficial interest outstanding | | | 4,213,746 | |
| | | | | |
| Net asset value per share outstanding | | $ | 16.17 | |
| Maximum sales charge (5.50% of offering price) | | | 0.94 | |
| | | | | |
| Maximum offering price per share outstanding | | $ | 17.11 | |
| | | | | |
Class A | | | | |
| Net assets applicable to outstanding shares | | $ | 89,114,661 | |
| | | | | |
| Shares of beneficial interest outstanding | | | 5,497,167 | |
| | | | | |
| Net asset value per share outstanding | | $ | 16.21 | |
| Maximum sales charge (5.50% of offering price) | | | 0.94 | |
| | | | | |
| Maximum offering price per share outstanding | | $ | 17.15 | |
| | | | | |
Class B | | | | |
| Net assets applicable to outstanding shares | | $ | 37,309,250 | |
| | | | | |
| Shares of beneficial interest outstanding | | | 2,435,781 | |
| | | | | |
| Net asset value and offering price per share outstanding | | $ | 15.32 | |
| | | | | |
Class C | | | | |
| Net assets applicable to outstanding shares | | $ | 17,589,289 | |
| | | | | |
| Shares of beneficial interest outstanding | | | 1,148,758 | |
| | | | | |
| Net asset value and offering price per share outstanding | | $ | 15.31 | |
| | | | | |
Class I | | | | |
| Net assets applicable to outstanding shares | | $ | 173,455,642 | |
| | | | | |
| Shares of beneficial interest outstanding | | | 10,492,574 | |
| | | | | |
| Net asset value and offering price per share outstanding | | $ | 16.53 | |
| | | | | |
The notes to the financial statements are an integral part of,
| |
| 14 MainStay U.S. Small Cap Fund | and should be read in conjunction with, the financial statements. |
Statement of Operations for the year ended October 31, 2011
| | | | | |
Investment Income (Loss)
|
Income | | | | |
| Dividends (a) | | $ | 7,204,560 | |
| Interest | | | 1,396 | |
| | | | | |
| Total income | | | 7,205,956 | |
| | | | | |
Expenses | | | | |
| Manager (See Note 3) | | | 3,480,552 | |
| Transfer agent (See Note 3) | | | 1,124,230 | |
| Distribution/Service—Investor Class (See Note 3) | | | 173,353 | |
| Distribution/Service—Class A (See Note 3) | | | 253,777 | |
| Distribution/Service—Class B (See Note 3) | | | 429,229 | |
| Distribution/Service—Class C (See Note 3) | | | 199,963 | |
| Shareholder communication | | | 111,156 | |
| Registration | | | 79,305 | |
| Professional fees | | | 67,004 | |
| Custodian | | | 13,038 | |
| Trustees | | | 11,170 | |
| Miscellaneous | | | 37,155 | |
| | | | | |
| Total expenses before waiver/reimbursement | | | 5,979,932 | |
| Expense waiver/reimbursement from Manager (See Note 3) | | | (29,276 | ) |
| | | | | |
| Net expenses | | | 5,950,656 | |
| | | | | |
| Net investment income (loss) | | | 1,255,300 | |
| | | | | |
| | | | | |
| | | | | |
Realized and Unrealized Gain (Loss) on Investments
|
| Net realized gain (loss) on investments | | | 29,793,225 | |
| Net change in unrealized appreciation (depreciation) on investments | | | (9,139,667 | ) |
| | | | | |
| Net realized and unrealized gain (loss) on investments | | | 20,653,558 | |
| | | | | |
| Net increase (decrease) in net assets resulting from operations | | $ | 21,908,858 | |
| | | | | |
| |
| (a) | Dividends recorded net of foreign withholding taxes in the amount of $21,857. |
The notes to the financial statements are an integral part of,
| |
| and should be read in conjunction with, the financial statements. | mainstayinvestments.com 15 |
Statements of Changes in Net Assets
for the years ended October 31, 2011 and October 31, 2010
| | | | | | | | | |
| | | 2011 | | | 2010 | |
Increase (Decrease) in Net Assets
|
| Operations: | | | | | | | | |
| Net investment income (loss) | | $ | 1,255,300 | | | $ | (245,031 | ) |
| Net realized gain (loss) on investments | | | 29,793,225 | | | | 32,704,447 | |
| Net change in unrealized appreciation (depreciation) on investments | | | (9,139,667 | ) | | | 39,020,459 | |
| | | |
| | | |
| Net increase (decrease) in net assets resulting from operations | | | 21,908,858 | | | | 71,479,875 | |
| | | |
| | | |
| Dividends to shareholders: | | | | | | | | |
| From net investment income: | | | | | | | | |
| Investor Class | | | (140,608 | ) | | | — | |
| Class A | | | (321,902 | ) | | | — | |
| Class B | | | (9,989 | ) | | | — | |
| Class C | | | (4,655 | ) | | | — | |
| Class I | | | (895,961 | ) | | | — | |
| | | |
| | | |
| Total dividends to shareholders | | | (1,373,115 | ) | | | — | |
| | | |
| | | |
| Capital share transactions: | | | | | | | | |
| Net proceeds from sale of shares | | | 91,582,126 | | | | 86,608,870 | |
| Net asset value of shares issued in connection with the acquisition of MainStay Small Cap Growth Fund (See Note 9) | | | — | | | | 88,818,376 | |
| Net asset value of shares issued to shareholders in reinvestment of dividends | | | 1,317,787 | | | | — | |
| Cost of shares redeemed | | | (108,653,803 | ) | | | (154,632,021 | ) |
| | | |
| | | |
| Increase (decrease) in net assets derived from capital share transactions | | | (15,753,890 | ) | | | 20,795,225 | |
| | | |
| | | |
| Net increase (decrease) in net assets | | | 4,781,853 | | | | 92,275,100 | |
| | | | | | | | | |
| | | | | | | | | |
Net Assets
|
| Beginning of year | | | 380,838,885 | | | | 288,563,785 | |
| | | |
| | | |
| End of year | | $ | 385,620,738 | | | $ | 380,838,885 | |
| | | |
| | | |
The notes to the financial statements are an integral part of,
| |
| 16 MainStay U.S. Small Cap Fund | and should be read in conjunction with, the financial statements. |
Financial Highlights selected per share data and ratios
| | | | | | | | | | | | | | | | | | | |
| | | Investor Class |
| | | | | | February 28,
| | | |
| | | | | | 2008**
| | | |
| | | | | | | | | | | | through
| | | |
| | | Year ended October 31, | | | October 31, | | | |
| | | 2011 | | | 2010 | | | 2009 | | | 2008 | | | |
| Net asset value at beginning of period | | $ | 15.35 | | | $ | 12.52 | | | $ | 10.14 | | | $ | 13.86 | | | |
| | | | | | | | | | | | | | | | | | | |
| Net investment income (loss) (a) | | | 0.03 | | | | (0.03 | ) | | | (0.03 | ) | | | 0.10 | | | |
| Net realized and unrealized gain (loss) on investments | | | 0.82 | | | | 2.86 | | | | 2.63 | | | | (3.82 | ) | | |
| | | | | | | | | | | | | | | | | | | |
| Total from investment operations | | | 0.85 | | | | 2.83 | | | | 2.60 | | | | (3.72 | ) | | |
| | | | | | | | | | | | | | | | | | | |
| Less dividends: | | | | | | | | | | | | | | | | | | |
| From net investment income | | | (0.03 | ) | | | — | | | | (0.22 | ) | | | — | | | |
| | | | | | | | | | | | | | | | | | | |
| Net asset value at end of period | | $ | 16.17 | | | $ | 15.35 | | | $ | 12.52 | | | $ | 10.14 | | | |
| | | | | | | | | | | | | | | | | | | |
| Total investment return (b) | | | 5.55 | % | | | 22.60 | % | | | 26.91 | % | | | (26.91 | %)(c) | | |
| Ratios (to average net assets)/Supplemental Data: | | | | | | | | | | | | | | | | | | |
| Net investment income (loss) | | | 0.17 | % | | | (0.20 | %) | | | (0.28 | %) | | | 1.10 | % †† | | |
| Net expenses | | | 1.63 | % | | | 1.63 | % | | | 1.66 | % | | | 1.80 | % †† | | |
| Expenses (before waiver/reimbursement) | | | 1.66 | % | | | 1.81 | % | | | 2.02 | % | | | 1.83 | % †† | | |
| Portfolio turnover rate | | | 45 | % | | | 49 | % | | | 218 | % | | | 158 | % | | |
| Net assets at end of period (in 000’s) | | $ | 68,152 | | | $ | 67,217 | | | $ | 25,832 | | | $ | 11,480 | | | |
| | | |
| ** | | Commencement of operations. |
| †† | | Annualized. |
| (a) | | Per share data based on average shares outstanding during the period. |
| (b) | | Total investment return is calculated exclusive of sales charges and assumes the reinvestment of dividends and distributions. |
| (c) | | Total investment return is not annualized. |
| | | | | | | | | | | | | | | | | | | | | | | |
| | | Class A |
| | | Year ended October 31, |
| | | 2011 | | | 2010 | | | 2009 | | | 2008 | | | 2007 | | | |
| Net asset value at beginning of year | | $ | 15.36 | | | $ | 12.51 | | | $ | 10.14 | | | $ | 18.65 | | | $ | 19.87 | | | |
| | | | | | | | | | | | | | | | | | | | | | | |
| Net investment income (loss) (a) | | | 0.07 | | | | (0.00 | )‡ | | | 0.00 | ‡ | | | 0.17 | | | | 0.07 | | | |
| Net realized and unrealized gain (loss) on investments | | | 0.83 | | | | 2.85 | | | | 2.61 | | | | (6.55 | ) | | | (1.29 | ) | | |
| | | | | | | | | | | | | | | | | | | | | | | |
| Total from investment operations | | | 0.90 | | | | 2.85 | | | | 2.61 | | | | (6.38 | ) | | | (1.22 | ) | | |
| | | | | | | | | | | | | | | | | | | | | | | |
| Less dividends and distributions: | | | | | | | | | | | | | | | | | | | | | | |
| From net investment income | | | (0.05 | ) | | | — | | | | (0.24 | ) | | | (0.12 | ) | | | — | | | |
| From net realized gain on investments | | | — | | | | — | | | | — | | | | (2.01 | ) | | | — | | | |
| | | | | | | | | | | | | | | | | | | | | | | |
| Total dividends and distributions | | | (0.05 | ) | | | — | | | | (0.24 | ) | | | (2.13 | ) | | | — | | | |
| | | | | | | | | | | | | | | | | | | | | | | |
| Net asset value at end of year | | $ | 16.21 | | | $ | 15.36 | | | $ | 12.51 | | | $ | 10.14 | | | $ | 18.65 | | | |
| | | | | | | | | | | | | | | | | | | | | | | |
| Total investment return (b) | | | 5.86 | % | | | 22.78 | % | | | 27.05 | % | | | (38.10 | %) | | | (6.09 | %) | | |
| Ratios (to average net assets)/Supplemental Data: | | | | | | | | | | | | | | | | | | | | | | |
| Net investment income (loss) | | | 0.43 | % | | | (0.02 | %) | | | 0.01 | % | | | 1.24 | % | | | 0.33 | % | | |
| Net expenses | | | 1.36 | % | | | 1.48 | % | | | 1.54 | % | | | 1.65 | % | | | 1.66 | % | | |
| Expenses (before waiver/reimbursement) | | | 1.36 | % | | | 1.48 | % | | | 1.92 | % | | | 1.84 | % | | | 1.66 | % | | |
| Portfolio turnover rate | | | 45 | % | | | 49 | % | | | 218 | % | | | 158 | % | | | 134 | % | | |
| Net assets at end of year (in 000’s) | | $ | 89,115 | | | $ | 97,707 | | | $ | 66,905 | | | $ | 64,527 | | | $ | 301,031 | | | |
| | | |
| ‡ | | Less than one cent per share. |
| (a) | | Per share data based on average shares outstanding during the year. |
| (b) | | Total investment return is calculated exclusive of sales charges and assumes the reinvestment of dividends and distributions. |
The notes to the financial statements are an integral part of,
| |
| and should be read in conjunction with, the financial statements. | mainstayinvestments.com 17 |
Financial Highlights selected per share data and ratios
| | | | | | | | | | | | | | | | | | | | | | | |
| | | Class B |
| | | Year ended October 31, |
| | | 2011 | | | 2010 | | | 2009 | | | 2008 | | | 2007 | | | |
| Net asset value at beginning of year | | $ | 14.62 | | | $ | 12.02 | | | $ | 9.70 | | | $ | 17.94 | | | $ | 19.25 | | | |
| | | | | | | | | | | | | | | | | | | | | | | |
| Net investment income (loss) (a) | | | (0.09 | ) | | | (0.12 | ) | | | (0.09 | ) | | | 0.06 | | | | (0.08 | ) | | |
| Net realized and unrealized gain (loss) on investments | | | 0.79 | | | | 2.72 | | | | 2.54 | | | | (6.29 | ) | | | (1.23 | ) | | |
| | | | | | | | | | | | | | | | | | | | | | | |
| Total from investment operations | | | 0.70 | | | | 2.60 | | | | 2.45 | | | | (6.23 | ) | | | (1.31 | ) | | |
| | | | | | | | | | | | | | | | | | | | | | | |
| Less dividends and distributions: | | | | | | | | | | | | | | | | | | | | | | |
| From net investment income | | | (0.00 | )‡ | | | — | | | | (0.13 | ) | | | — | | | | — | | | |
| From net realized gain on investments | | | — | | | | — | | | | — | | | | (2.01 | ) | | | — | | | |
| | | | | | | | | | | | | | | | | | | | | | | |
| Total dividends and distributions | | | (0.00 | )‡ | | | — | | | | (0.13 | ) | | | (2.01 | ) | | | — | | | |
| | | | | | | | | | | | | | | | | | | | | | | |
| Net asset value at end of year | | $ | 15.32 | | | $ | 14.62 | | | $ | 12.02 | | | $ | 9.70 | | | $ | 17.94 | | | |
| | | | | | | | | | | | | | | | | | | | | | | |
| Total investment return (b) | | | 4.81 | % | | | 21.63 | % | | | 25.99 | % | | | (38.56 | %) | | | (6.81 | %) | | |
| Ratios (to average net assets)/Supplemental Data: | | | | | | | | | | | | | | | | | | | | | | |
| Net investment income (loss) | | | (0.57 | %) | | | (0.93 | %) | | | (0.95 | %) | | | 0.47 | % | | | (0.41 | %) | | |
| Net expenses | | | 2.38 | % | | | 2.38 | % | | | 2.38 | % | | | 2.44 | % | | | 2.41 | % | | |
| Expenses (before waiver/reimbursement) | | | 2.41 | % | | | 2.56 | % | | | 2.78 | % | | | 2.66 | % | | | 2.41 | % | | |
| Portfolio turnover rate | | | 45 | % | | | 49 | % | | | 218 | % | | | 158 | % | | | 134 | % | | |
| Net assets at end of year (in 000’s) | | $ | 37,309 | | | $ | 43,744 | | | $ | 23,354 | | | $ | 13,305 | | | $ | 32,502 | | | |
| | | |
| ‡ | | Less than one cent per share. |
| (a) | | Per share data based on average shares outstanding during the year. |
| (b) | | Total investment return is calculated exclusive of sales charges and assumes the reinvestment of dividends and distributions. |
| | | | | | | | | | | | | | | | | | | | | | | |
| | | Class C |
| | | Year ended October 31, |
| | | 2011 | | | 2010 | | | 2009 | | | 2008 | | | 2007 | | | |
| Net asset value at beginning of year | | $ | 14.62 | | | $ | 12.01 | | | $ | 9.70 | | | $ | 17.94 | | | $ | 19.26 | | | |
| | | | | | | | | | | | | | | | | | | | | | | |
| Net investment income (loss) (a) | | | (0.09 | ) | | | (0.12 | ) | | | (0.08 | ) | | | 0.06 | | | | (0.09 | ) | | |
| Net realized and unrealized gain (loss) on investments | | | 0.78 | | | | 2.73 | | | | 2.53 | | | | (6.29 | ) | | | (1.23 | ) | | |
| | | | | | | | | | | | | | | | | | | | | | | |
| Total from investment operations | | | 0.69 | | | | 2.61 | | | | 2.45 | | | | (6.23 | ) | | | (1.32 | ) | | |
| | | | | | | | | | | | | | | | | | | | | | | |
| Less dividends and distributions: | | | | | | | | | | | | | | | | | | | | | | |
| From net investment income | | | (0.00 | )‡ | | | — | | | | (0.14 | ) | | | — | | | | — | | | |
| From net realized gain on investments | | | — | | | | — | | | | — | | | | (2.01 | ) | | | — | | | |
| | | | | | | | | | | | | | | | | | | | | | | |
| Total dividends and distributions | | | (0.00 | )‡ | | | — | | | | (0.14 | ) | | | (2.01 | ) | | | — | | | |
| | | | | | | | | | | | | | | | | | | | | | | |
| Net asset value at end of year | | $ | 15.31 | | | $ | 14.62 | | | $ | 12.01 | | | $ | 9.70 | | | $ | 17.94 | | | |
| | | | | | | | | | | | | | | | | | | | | | | |
| Total investment return (b) | | | 4.74 | % | | | 21.73 | % | | | 26.00 | % | | | (38.60 | %) | | | (6.80 | %) | | |
| Ratios (to average net assets)/Supplemental Data: | | | | | | | | | | | | | | | | | | | | | | |
| Net investment income (loss) | | | (0.57 | %) | | | (0.91 | %) | | | (0.83 | %) | | | 0.45 | % | | | (0.44 | %) | | |
| Net expenses | | | 2.38 | % | | | 2.38 | % | | | 2.39 | % | | | 2.45 | % | | | 2.41 | % | | |
| Expenses (before waiver/reimbursement) | | | 2.41 | % | | | 2.56 | % | | | 2.81 | % | | | 2.67 | % | | | 2.41 | % | | |
| Portfolio turnover rate | | | 45 | % | | | 49 | % | | | 218 | % | | | 158 | % | | | 134 | % | | |
| Net assets at end of year (in 000’s) | | $ | 17,589 | | | $ | 19,944 | | | $ | 17,048 | | | $ | 15,123 | | | $ | 54,264 | | | |
| | | |
| ‡ | | Less than one cent per share. |
| (a) | | Per share data based on average shares outstanding during the year. |
| (b) | | Total investment return is calculated exclusive of sales charges and assumes the reinvestment of dividends and distributions. |
The notes to the financial statements are an integral part of,
| |
| 18 MainStay U.S. Small Cap Fund | and should be read in conjunction with, the financial statements. |
Financial Highlights selected per share data and ratios
| | | | | | | | | | | | | | | | | | | | | | | |
| | | Class I |
| | | Year ended October 31, |
| | | 2011 | | | 2010 | | | 2009 | | | 2008 | | | 2007 | | | |
| Net asset value at beginning of year | | $ | 15.67 | | | $ | 12.72 | | | $ | 10.34 | | | $ | 19.03 | | | $ | 20.18 | | | |
| | | | | | | | | | | | | | | | | | | | | | | |
| Net investment income (loss) (a) | | | 0.10 | | | | 0.04 | | | | 0.04 | | | | 0.24 | | | | 0.17 | | | |
| Net realized and unrealized gain (loss) on investments | | | 0.86 | | | | 2.91 | | | | 2.65 | | | | (6.69 | ) | | | (1.32 | ) | | |
| | | | | | | | | | | | | | | | | | | | | | | |
| Total from investment operations | | | 0.96 | | | | 2.95 | | | | 2.69 | | | | (6.45 | ) | | | (1.15 | ) | | |
| | | | | | | | | | | | | | | | | | | | | | | |
| Less dividends and distributions: | | | | | | | | | | | | | | | | | | | | | | |
| From net investment income | | | (0.10 | ) | | | — | | | | (0.31 | ) | | | (0.23 | ) | | | (0.00 | )‡ | | |
| From net realized gain on investments | | | — | | | | — | | | | — | | | | (2.01 | ) | | | — | | | |
| | | | | | | | | | | | | | | | | | | | | | | |
| Total dividends and distributions | | | (0.10 | ) | | | — | | | | (0.31 | ) | | | (2.24 | ) | | | (0.00 | )‡ | | |
| | | | | | | | | | | | | | | | | | | | | | | |
| Net asset value at end of year | | $ | 16.53 | | | $ | 15.67 | | | $ | 12.72 | | | $ | 10.34 | | | $ | 19.03 | | | |
| | | | | | | | | | | | | | | | | | | | | | | |
| Total investment return (b) | | | 6.11 | % | | | 23.19 | % | | | 27.57 | % | | | (37.81 | %) | | | (5.69 | %) | | |
| Ratios (to average net assets)/Supplemental Data: | | | | | | | | | | | | | | | | | | | | | | |
| Net investment income (loss) | | | 0.60 | % | | | 0.30 | % | | | 0.39 | % | | | 1.69 | % | | | 0.81 | % | | |
| Net expenses | | | 1.10 | % | | | 1.17 | % | | | 1.18 | % | | | 1.20 | % | | | 1.19 | % | | |
| Expenses (before reimbursement/waiver) | | | 1.10 | % | | | 1.23 | % | | | 1.68 | % | | | 1.48 | % | | | 1.35 | % | | |
| Portfolio turnover rate | | | 45 | % | | | 49 | % | | | 218 | % | | | 158 | % | | | 134 | % | | |
| Net assets at end of year (in 000’s) | | $ | 173,456 | | | $ | 152,227 | | | $ | 155,425 | | | $ | 116,390 | | | $ | 631,108 | | | |
| | | |
| ‡ | | Less than one cent per share. |
| (a) | | Per share data based on average shares outstanding during the year. |
| (b) | | Total investment return is calculated exclusive of sales charges and assumes the reinvestment of dividends and distributions. Class I shares are not subject to sales charges. |
The notes to the financial statements are an integral part of,
| |
| and should be read in conjunction with, the financial statements. | mainstayinvestments.com 19 |
Notes to Financial Statements
Note 1–Organization and Business
Eclipse Funds (the “Trust”) was organized on July 30, 1986, as a Massachusetts business trust. The Trust is registered under the Investment Company Act of 1940, as amended (the “1940 Act”), as an open-end management investment company, and is comprised of two funds (collectively referred to as the “Funds”). These financial statements and notes relate only to the MainStay U.S. Small Cap Fund (the “Fund”), a diversified fund.
The Fund currently offers five classes of shares. Class I shares commenced operations on January 12, 1987. Class A and Class B shares commenced operations on January 2, 2004. Class C shares commenced operations on December 30, 2002. Investor Class shares commenced operations on February 28, 2008. Investor Class and Class A shares are offered at net asset value (“NAV”) per share plus an initial sales charge. No sales charge applies on investments of $1 million or more (and certain other qualified purchases) in Investor Class and Class A shares, but a contingent deferred sales charge (“CDSC”) is imposed on certain redemptions made within one year of the date of purchase. Class B and Class C shares are offered at NAV without an initial sales charge, although a declining CDSC may be imposed on redemptions made within six years of the date of purchase of Class B shares and a 1.00% CDSC may be imposed on redemptions made within one year of the date of purchase of Class C shares. Class I shares are offered at NAV and are not subject to a sales charge. Depending upon eligibility, Class B shares convert to either Investor Class or Class A shares at the end of the calendar quarter eight years after the date they were purchased. Additionally, depending upon eligibility, Investor Class shares may convert to Class A shares and Class A shares may convert to Investor Class shares. The five classes of shares have the same voting (except for issues that relate solely to one class), dividend, liquidation and other rights, and the same terms and conditions, except that Class B and Class C shares are subject to higher distribution and/or service fee rates than Investor Class and Class A shares under a distribution plan pursuant to Rule 12b-1 under the 1940 Act. Class I shares are not subject to a distribution and/or service fee.
The Fund’s investment objective is to seek long-term capital appreciation by investing primarily in securities of small-cap companies.
Note 2–Significant Accounting Policies
The Fund prepares its financial statements in accordance with generally accepted accounting principles (“GAAP”) in the United States of America and follows the significant accounting policies described below.
(A) Securities Valuation. Investments are valued as of the close of regular trading on the New York Stock Exchange (“Exchange”) (usually 4:00 p.m. Eastern time) on each day the Fund is open for business (“valuation date”).
“Fair value” is defined as the price that the Fund would receive upon selling an investment in an orderly transaction to an independent buyer in the principal or most advantageous market of the investment. Fair value measurements are determined within a framework that has established a three-tier hierarchy which maximizes the use of observable market data and minimizes the use of unobservable inputs to establish classification of fair value measurements for disclosure purposes. “Inputs” refer broadly to the assumptions that market participants would use in pricing the asset or liability, including assumptions about risk, such as the risk inherent in a particular valuation technique used to measure fair value using a pricing model and/or the risk inherent in the inputs for the valuation technique. Inputs may be observable or unobservable. Observable inputs reflect the assumptions market participants would use in pricing the asset or liability based on market data obtained from sources independent of the Fund. Unobservable inputs reflect the Fund’s own assumptions about the assumptions market participants would use in pricing the asset or liability developed based on the information available in the circumstances. The inputs or methodology used for valuing securities may not be an indication of the risks associated with investing in those securities. The three-tier hierarchy of inputs is summarized in the three broad Levels listed below.
| |
| • | Level 1—quoted prices in active markets for identical investments |
| |
| • | Level 2—other significant observable inputs (including quoted prices for similar investments in active markets, interest rates and yield curves, prepayment speeds, credit risks, etc.) |
| |
| • | Level 3—significant unobservable inputs (including the Fund’s own assumptions about the assumptions that market participants would use in determining the fair value of investments) |
The valuation techniques used by the Fund to measure fair value maximize the use of observable inputs and minimize the use of unobservable inputs. The Fund may utilize some of the following fair value techniques: multi-dimensional relational pricing models, option adjusted spread pricing and estimating the price that would have prevailed in a liquid market for an international equity security given information available at the time of evaluation, when there are significant events after the close of local foreign markets.
The Fund has procedures to determine the fair value of securities and other financial instruments for which market prices are not readily available or which may not be reliably priced. Under these procedures, the Fund primarily employs a market-based approach which may use related or comparable assets or liabilities, recent transactions, market multiples, book values, and other relevant information. The Fund may also use an income-based valuation approach in which the anticipated future cash flows of the investment are discounted to calculate fair value. Discounts may also be applied due to the nature or duration of any restrictions on the disposition of the investments. Due to the inherent uncertainty of valuations of such investments, the fair values may differ significantly from the values that would have been used had an active market existed. For the year ended October 31, 2011, there have been no changes to the fair value methodologies.
The aggregate value by input level, as of October 31, 2011, for the Fund’s investments is included at the end of the Fund’s Portfolio of Investments.
Equity securities and Exchange Traded Funds are valued at the latest quoted sales prices as of the close of regular trading on the Exchange on each valuation date. Securities that are not traded on the valuation date are valued at the mean of the latest quoted bid and asked prices. Prices normally are taken from the principal market in which each
20 MainStay U.S. Small Cap Fund
security trades. Futures contracts are valued at the last posted settlement price on the market where such futures are primarily traded. Investments in other mutual funds are valued at their NAVs as of the close of the Exchange on the valuation date. These securities are generally categorized as Level 1 in the hierarchy.
Temporary cash investments acquired over 60 days prior to maturity are valued using the latest bid prices or using valuations based on a matrix system (which considers such factors as security prices, yields, maturities, and ratings), both as furnished by independent pricing services. Other temporary cash investments which mature in 60 days or less (“Short-Term Investments”) are valued at amortized cost. The amortized cost method involves valuing a security at its cost on the date of purchase and thereafter assuming a constant amortization to maturity of the difference between such cost and the value on maturity date. Amortized cost approximates the current fair value of a security. Securities valued at amortized cost are not obtained from a quoted price in an active market. These securities are all generally categorized as Level 2 in the hierarchy.
Securities for which market quotations are not readily available are valued by methods deemed in good faith by the Fund’s Board to represent fair value. Equity and non-equity securities which may be valued in this manner include, but are not limited to: (i) a security the trading for which has been halted or suspended; (ii) a debt security that has recently gone into default and for which there is not a current market quotation; (iii) a security of an issuer that has entered into a restructuring; (iv) a security that has been de-listed from a national exchange; (v) a security the market price of which is not available from an independent pricing source or, if so provided, does not, in the opinion of the Fund’s Manager or Subadvisor (as defined in Note 3(A)) reflect the security’s market value; and (vi) a security where the trading on that security’s principal market is temporarily closed at a time when, under normal conditions, it would be open. These securities are generally categorized as Level 3 in the hierarchy. At October 31, 2011, the Fund did not hold any securities that were fair valued in such a manner.
Certain events may occur between the time that foreign markets close, on which securities held by the Fund principally trade, and the time at which the Fund’s NAV is calculated. These events may include, but are not limited to, situations relating to a single issuer in a market sector, significant fluctuations in U.S. or foreign markets, natural disasters, armed conflicts, governmental actions or other developments not tied directly to the securities markets. Should the Manager or Subadvisor conclude that such events may have affected the accuracy of the last price reported on the local foreign market, the Manager or Subadvisor may, pursuant to procedures adopted by the Fund’s Board, adjust the value of the local price to reflect the impact on the price of such securities as a result of such events. In this instance, securities are generally categorized as Level 3 in the hierarchy. Additionally, foreign equity securities are also fair valued whenever the movement of a particular index exceeds certain thresholds. In such cases, the securities are fair valued by applying factors provided by a third party vendor in accordance with the Fund’s policies and procedures and are generally categorized as Level 2 in the hierarchy. As of October 31, 2011, the Fund did not hold any foreign equity securities.
(B) Income Taxes. The Fund’s policy is to comply with the requirements of the Internal Revenue Code of 1986, as amended (the “Internal Revenue Code”) applicable to regulated investment companies and to distribute all of the taxable income to the shareholders of the Fund within the allowable time limits. Therefore, no federal, state and local income tax provision is required.
Management evaluates its tax positions to determine if the tax positions taken meet the minimum recognition threshold in connection with accounting for uncertainties in income tax positions taken or expected to be taken for the purposes of measuring and recognizing tax liabilities in the financial statements. Recognition of tax benefits of an uncertain tax position is required only when the position is “more likely than not” to be sustained assuming examination by taxing authorities. Management has analyzed the Fund’s tax positions taken on federal, state and local income tax returns for all open tax years (for up to three tax years), and has concluded that no provision for federal, state and local income tax are required in the Fund’s financial statements. The Fund’s federal, state and local income and federal excise tax returns for tax years for which the applicable statutes of limitations have not expired are subject to examination by the Internal Revenue Service and state and local departments of revenue.
(C) Dividends and Distributions to Shareholders. Dividends and distributions are recorded on the ex-dividend date. The Fund intends to declare and pay dividends of net investment income and distributions of net realized capital and currency gains, if any, annually. Unless the shareholder elects otherwise, all dividends and distributions are reinvested in the same class of shares of the Fund, at NAV. Dividends and distributions to shareholders are determined in accordance with federal income tax regulations and may differ from GAAP.
(D) Security Transactions and Investment Income. The Fund records security transactions on the trade date. Realized gains and losses on security transactions are determined using the identified cost method. Dividend income is recognized on the ex-dividend date and interest income is accrued as earned using the effective interest rate method. Discounts and premiums on Short-Term Investments are accreted and amortized, respectively, on the straight-line method.
Investment income and realized and unrealized gains and losses on investments of the Fund are allocated to separate classes of shares pro rata based upon their relative net assets on the date the income is earned or realized and unrealized gains and losses are incurred.
(E) Expenses. Expenses of the Trust are allocated to the individual Funds in proportion to the net assets of the respective Funds when the expenses are incurred, except where direct allocations of expenses can be made. Expenses (other than transfer agent expenses and fees incurred under the shareholder services plans and the distribution plans further discussed in Note 3(B)) are allocated to separate classes of shares pro rata based upon their relative net assets on the date the expenses are incurred. The expenses borne by the Fund, including those of related parties to the Fund, are shown in the Statement of Operations.
(F) Use of Estimates. In preparing financial statements in conformity with GAAP, management makes estimates and assumptions that affect the reported amounts and disclosures in the financial statements. Actual results could differ from those estimates.
mainstayinvestments.com 21
Notes to Financial Statements (continued)
(G) Repurchase Agreements. The Fund may enter into repurchase agreements to earn income. The Fund may enter into repurchase agreements only with financial institutions that are deemed by the Manager or Subadvisor to be creditworthy, pursuant to guidelines established by the Fund’s Board. Repurchase agreements are considered under the 1940 Act to be collateralized loans by a Fund to the seller secured by the securities transferred to the Fund.
When the Fund invests in repurchase agreements, the Fund’s custodian takes possession of the collateral pledged for investments in such repurchase agreements. The underlying collateral is valued daily on a mark-to-market basis to determine that the value, including accrued interest, exceeds the repurchase price. In the event of the seller’s default of the obligation to repurchase, the Fund has the right to liquidate the collateral and apply the proceeds in satisfaction of the obligation. Under certain circumstances, in the event of default or bankruptcy by the other party to the agreement, realization and/or retention of the collateral may be subject to legal proceedings and possible realized loss to the Fund.
(H) Futures Contracts. A futures contract is an agreement to purchase or sell a specified quantity of an underlying instrument at a specified future date and price, or to make or receive a cash payment based on the value of a financial instrument (e.g., foreign currency, interest rate, security, or securities index). The Fund is subject to equity price risk and interest rate risk in the normal course of investing in these transactions. During the period the futures contract is open, changes in the value of the contract are recognized as unrealized gains or losses by “marking to market” such contract on a daily basis to reflect the market value of the contract at the end of each day’s trading. The Fund agrees to receive from or pay to the broker an amount of cash equal to the daily fluctuation in the value of the contract. Such receipts or payments are known as “variation margin.” When the futures contract is closed, the Fund records a realized gain or loss equal to the difference between the proceeds from (or cost of) the closing transaction and the Fund’s basis in the contract.
The use of futures contracts involves, to varying degrees, elements of market risk in excess of the amount recognized in the Statement of Assets and Liabilities. The contract or notional amounts and variation margin reflect the extent of the Fund’s involvement in open futures positions. Risks arise from the possible imperfect correlation in movements in the price of futures contracts, interest rates and the underlying hedged assets, and the possible inability of counterparties to meet the terms of their contracts. However, the Fund’s activities in futures contracts have minimal counterparty risk as they are conducted through regulated exchanges that guarantee the futures against default by the counterparty. In the event of a bankruptcy or insolvency of a broker that holds margin on behalf of the Fund, the Fund may not be entitled to the return of all of the margin owed to the Fund, potentially resulting in a loss. The Fund invests in futures contracts to provide an efficient means of maintaining liquidity while being fully invested in the market. The Fund’s investment in futures contracts and other derivatives may increase the volatility of the Fund’s NAV and may result in a loss to the Fund. As of October 31, 2011, the Fund did not hold any futures contracts.
(I) Securities Lending. In order to realize additional income, the Fund may engage in securities lending, subject to the limitations set forth in the 1940 Act, and relevant guidance by the staff of the Securities and Exchange Commission. In the event the Fund does engage in securities lending, the Fund will lend through its custodian, State Street Bank and Trust Company (“State Street”). State Street will manage the Fund’s cash collateral in accordance with the Lending Agreement between the Fund and State Street, and indemnify the Fund’s portfolio against counterparty risk. The loans will be collateralized by cash or securities at least equal at all times to the market value of the securities loaned. Collateral will consist of U.S. government securities, cash equivalents or irrevocable letters of credit. The Fund may bear the risk of delay in recovery of, or loss of rights in, the securities loaned should the borrower of the securities experience financial difficulty. The Fund may also record realized gain or loss on securities deemed sold due to a borrower’s inability to return securities on loan. The Fund will receive compensation for lending its securities in the form of fees or the retention of a portion of the interest on the investment of any cash received as collateral. The Fund also will continue to receive interest and dividends on the securities loaned and any gain or loss in the market price of the securities loaned that may occur during the term of the loan will be for the account of the Fund.
Although the Fund and New York Life Investments (as defined in Note 3(A)) have temporarily suspended securities lending, the Fund and New York Life Investments reserve the right to reinstitute lending when deemed appropriate. The Fund had no portfolio securities on loan as of October 31, 2011.
(J) Indemnifications. Under the Trust’s organizational documents, its officers and trustees are indemnified against certain liabilities that may arise out of performance of their duties to the Trust. Additionally, in the normal course of business, the Fund enters into contracts with third-party service providers that contain a variety of representations and warranties and which may provide general indemnifications. The Fund’s maximum exposure under these arrangements is unknown, as this would involve future claims that may be made against the Fund that have not yet occurred. Based on experience, management is of the view that the risk of loss in connection with these potential indemnification obligations is remote. However, there can be no assurance that material liabilities related to such obligations will not arise in the future, which could adversely impact the Fund.
Note 3–Fees and Related Party Transactions
(A) Manager and Subadvisor. New York Life Investment Management LLC (“New York Life Investments” or the “Manager”), a registered investment adviser and an indirect, wholly-owned subsidiary of New York Life Insurance Company (“New York Life”), serves as the Fund’s Manager, pursuant to an Amended and Restated Management Agreement (“Management Agreement”). The Manager provides offices, conducts clerical, recordkeeping and bookkeeping services, and keeps most of the financial and accounting records required to be maintained by the Fund. Except for the portion of salaries and expenses that are the responsibility of the Fund, including a portion of the total compensation of the Chief Compliance Officer (“CCO”) of the Fund which is the responsibility of all investment companies for which the CCO serves, the Manager pays the salaries and expenses of all personnel affiliated with the Fund and certain operational expenses of the Fund. Epoch Investment Partners, Inc. (“Epoch” or “Subadvisor”), a registered investment adviser, is responsible for the day-to-day portfolio
22 MainStay U.S. Small Cap Fund
management of the Fund. Pursuant to the terms of a Subadvisory Agreement (“Subadvisory Agreement”) between New York Life Investments and Epoch, New York Life Investments pays for the services of the Subadvisor.
The Fund pays the Manager a monthly fee for services performed and facilities furnished at an annual rate of the Fund’s average daily net assets as follows: 0.85% up to $1 billion and 0.80% in excess of $1 billion. The effective management fee rate (exclusive of any applicable waivers/reimbursements) was 0.85% for the year ended October 31, 2011.
The Manager has contractually agreed to waive fees and/or reimburse expenses so that Total Annual Fund Operating Expenses for Class A shares do not exceed 1.53% of its average daily net assets. New York Life Investments will apply an equivalent waiver or reimbursement in an equal number of basis points to the other share classes. This agreement expires on February 28, 2012 and may only be amended or terminated prior to that date by action of the Board. Total Annual Fund Operating Expenses excludes taxes, interest, litigation, extraordinary expenses, brokerage and other transaction expenses relating to the purchase or sale of portfolio investments, and acquired (underlying) fund fees and expenses.
Additionally, the Manager also agreed to voluntarily waive fees and/or reimburse expenses so that Total Annual Fund Operating Expenses do not exceed the following percentage of average daily net assets: Investor Class, 1.70%; Class B, 2.45%; and Class C, 2.45%. These voluntary waivers or reimbursements may be discontinued at any time without notice.
For the period August 1, 2009 through February 27, 2011, the Manager had contractually agreed to waive fees and/or reimburse expenses so that Total Annual Fund Operating Expenses of a class did not exceed the following percentage of average daily net assets: Investor Class, 1.63%; Class A, 1.53%; Class B, 2.38%; Class C, 2.38%; and Class I, 1.17%.
For the year ended October 31, 2011, New York Life Investments earned fees from the Fund in the amount of $3,480,552 and waived its fees and/or reimbursed expenses in the amount of $29,276.
State Street, 1 Lincoln Street, Boston, Massachusetts 02111, provides sub-administration and sub-accounting services to the Fund pursuant to an agreement with New York Life Investments. These services include calculating the daily NAVs of the Fund, maintaining the general ledger and sub-ledger accounts for the calculation of the Fund’s respective NAVs, and assisting New York Life Investments in conducting various aspects of the Fund’s administrative operations. For providing these services to the Fund, State Street is compensated by New York Life Investments.
(B) Distribution and Service Fees. The Trust, on behalf of the Fund, has entered into a Distribution Agreement with NYLIFE Distributors LLC (the “Distributor”), an indirect, wholly-owned subsidiary of New York Life. The Fund has adopted distribution plans (the “Plans”) in accordance with the provisions of Rule 12b-1 under the 1940 Act.
Pursuant to the Investor Class and Class A Plans, the Distributor receives a monthly distribution fee from the Investor Class and Class A shares at an annual rate of 0.25% of the average daily net assets of the Investor Class and Class A shares for distribution or service activities as designated by the Distributor. Pursuant to the Class B and Class C Plans, Class B and Class C shares pay the Distributor a monthly distribution fee at an annual rate of 0.75% of the average daily net assets of the Class B and Class C shares along with a service fee at an annual rate of 0.25% of the average daily net assets of the Class B and Class C shares, for a total 12b-1 fee of 1.00%. Class I shares are not subject to a distribution or service fee.
The Plans provide that the distribution and service fees are payable to the Distributor regardless of the amounts actually expended by the Distributor for distribution of the Fund’s shares and service activities.
(C) Sales Charges. The Fund was advised by the Distributor that the amount of sales charges retained on sales of Investor Class and Class A shares were $22,356 and $15,335, respectively, for the year ended October 31, 2011. The Fund was also advised that the Distributor retained CDSCs on redemptions of Investor Class, Class A, Class B and Class C shares of $39, $894, $55,552 and $969, respectively, for the year ended October 31, 2011.
(D) Transfer, Dividend Disbursing and Shareholder Servicing Agent. NYLIM Service Company LLC, an affiliate of New York Life Investments, is the Fund’s transfer, dividend disbursing and shareholder servicing agent pursuant to an agreement between NYLIM Service Company LLC and the Trust. NYLIM Service Company LLC has entered into an agreement with Boston Financial Data Services, Inc. (“BFDS”) pursuant to which BFDS performs certain transfer agent services on behalf of NYLIM Service Company LLC. Transfer agent expenses incurred by the Fund for the year ended October 31, 2011, were as follows:
| | | | | |
| Investor Class | | $ | 331,206 | |
| |
| |
| Class A | | | 181,557 | |
| |
| |
| Class B | | | 205,139 | |
| |
| |
| Class C | | | 95,539 | |
| |
| |
| Class I | | | 310,789 | |
| |
| |
(E) Small Account Fee. Shareholders with small accounts adversely impact the cost of providing transfer agency services. In an effort to reduce total transfer agency expenses, the Fund has implemented a small account fee on certain types of accounts. Certain shareholders with an account balance of less than $1,000 are charged an annual per account fee of $20 (assessed semi-annually), the proceeds from which offset transfer agent fees as reflected in the Statement of Operations.
(F) Capital. At October 31, 2011, New York Life and its affiliates beneficially held shares of the Fund with the following values and percentages of net assets as follows:
| | | | | | | | | |
| |
| |
| Class A | | $ | 2,085 | | | | 0.0 | %‡ |
| |
| |
| Class B | | | 1,357 | | | | 0.0 | ‡ |
| |
| |
| Class C | | | 2,438 | | | | 0.0 | ‡ |
| |
| |
| Class I | | | 47,268,685 | | | | 27.3 | |
| |
| |
| |
| ‡ | Less than one-tenth of a percent. |
mainstayinvestments.com 23
Notes to Financial Statements (continued)
(G) Other. Pursuant to a Legal Services Agreement, a portion of the cost of legal services provided to the Fund by the Office of the General Counsel of New York Life Investments was payable directly by the Fund through March 17, 2011. For the year ended October 31, 2011, these fees, which are included in professional fees shown on the Statement of Operations, were $6,540. Effective March 18, 2011, the Legal Services Agreement expired and was not renewed. Therefore, the Fund is no longer directly responsible for any portion of the cost of legal services.
Note 4–Federal Income Tax
As of October 31, 2011, the components of accumulated gain (loss) on a tax basis were as follows:
| | | | | | | | | | | | | | | | | | | |
| | | | Accumulated
| | | | | | | | | | |
| | | | Capital
| | | Other
| | | Unrealized
| | | Total
| |
Ordinary
| | | and Other
| | | Temporary
| | | Appreciation
| | | Accumulated
| |
| Income | | | Gain (Loss) | | | Differences | | | (Depreciation) | | | Gain (Loss) | |
| |
| $ | — | | | $ | (237,247,855 | ) | | $ | — | | | $ | 36,724,111 | | | $ | (200,523,744 | ) |
| |
| |
The difference between book-basis and tax basis unrealized appreciation (depreciation) is primarily due to wash sale deferrals and basis adjustment due to class action payments.
The following table discloses the current year reclassifications between undistributed net investment income, accumulated net realized income (loss) on investments, and additional paid-in capital arising from permanent differences; net assets at October 31, 2011 were not affected.
| | | | | | | | | | | |
| | | | Accumulated
| | | | |
Undistributed
| | | Net Realized
| | | | |
Net Investment
| | | Gain (Loss) on
| | | Additional
| |
| Income (Loss) | | | Investments | | | Paid-In Capital | |
| |
| $ | 117,815 | | | $ | 253,749 | | | $ | (371,564 | ) |
| |
| |
The reclassifications for the Fund are primarily due to distributions in excess of current earnings, return of capital distributions from non-real estate investment trust (“REIT”) securities and wash sale deferrals from fund acquisition.
Under the Regulated Investment Company Modernization Act of 2010, the Fund will be permitted to carry forward capital losses incurred in taxable years beginning after December 22, 2010, for an unlimited period. However, any losses incurred during those future years will be required to be utilized prior to the losses incurred in pre-enactment tax years. As a result of this ordering rule, pre-enactment capital loss carryforwards may be more likely to expire unused. Additionally, post-enactment capital losses that are carried forward will retain their character as either short-term or long-term capital losses rather than being considered all short-term as under previous law.
At October 31, 2011, for federal income tax purposes, capital loss carryforwards of $237,247,855 were available as shown in the table below, to the extent provided by the regulations to offset future realized gains of the Fund through the years indicated. To the extent that these capital loss carryforwards are used to offset future capital gains, it is probable that the capital gains so offset will not be distributed to shareholders. No capital gain distributions shall be made until any capital loss carryforwards have been fully utilized or expired.
| | | | | | | |
Capital Loss
| | Capital Loss
|
| Available Through | | Amounts (000’s) |
| |
| | 2015 | | | $ | 30,052 | |
| | 2016 | | | | 159,543 | |
| | 2017 | | | | 47,653 | |
| |
| |
| | Total | | | $ | 237,248 | |
| |
| |
The Fund utilized $30,321,059 of capital loss carryforwards during the year ended October 31, 2011.
The tax character of distributions paid during the years ended October 31, 2011 and October 31, 2010 shown in the Statements of Changes in Net Assets was as follows:
| | | | | | | | | |
| | | 2011 | | | 2010 | |
| |
| Distributions paid from: | | | | | | | | |
| Ordinary Income | | $ | 1,373,115 | | | $ | — | |
| |
| |
Note 5–Custodian
State Street is the custodian of the cash and the securities of the Fund. Custodial fees are charged to the Fund based on the market value of securities in the Fund and the number of certain cash transactions incurred by the Fund.
Note 6–Line of Credit
The Fund and certain affiliated funds maintain a line of credit with a syndicate of banks in order to secure a source of funds for temporary purposes to meet unanticipated or excessive redemption requests.
Effective August 31, 2011, under an amended credit agreement, the aggregate commitment amount is $125,000,000 with an optional maximum amount of $175,000,000. The commitment rate is an annual rate of 0.08% of the average commitment amount, payable quarterly, regardless of usage, to The Bank of New York Mellon, which serves as the agent to the syndicate. The commitment fee is allocated among certain MainStay Funds based upon net assets and other factors. Interest on any revolving credit loan is charged based upon the Federal Funds Advances rate or the one month London InterBank Offered Rate, whichever is higher. The amended credit agreement expires on August 29, 2012, although the MainStay Funds and the syndicate of banks may renew the amended credit agreement for an additional year on the same or different terms. Prior to August 31, 2011, the commitment rate was an annual rate of 0.10% of the average commitment amount, plus a 0.02% up-front payment. There were no borrowings made or outstanding with respect to the Fund on the amended credit agreement during the year ended October 31, 2011.
Note 7–Purchases and Sales of Securities (in 000’s)
During the year ended October 31, 2011, purchases and sales of securities, other than short-term securities, were $180,585 and $198,589, respectively.
24 MainStay U.S. Small Cap Fund
Note 8–Capital Share Transactions
| | | | | | | | | |
| Investor Class | | Shares | | | Amount | |
| |
| Year ended October 31, 2011: | | | | | | | | |
| Shares sold | | | 312,418 | | | $ | 5,183,415 | |
| Shares issued to shareholders in reinvestment of dividends | | | 8,483 | | | | 139,868 | |
| Shares redeemed | | | (661,780 | ) | | | (10,972,497 | ) |
| | | |
| | | |
| Net increase (decrease) in shares outstanding before conversion | | | (340,879 | ) | | | (5,649,214 | ) |
| Shares converted into Investor Class (See Note 1) | | | 400,763 | | | | 6,292,987 | |
| Shares converted from Investor Class (See Note 1) | | | (225,653 | ) | | | (3,819,280 | ) |
| | | |
| | | |
| Net increase (decrease) | | | (165,769 | ) | | $ | (3,175,507 | ) |
| | | |
| | | |
| Year ended October 31, 2010: | | | | | | | | |
| Shares sold | | | 325,788 | | | $ | 4,592,151 | |
| Shares issued in connection with the acquisition of MainStay Small Cap Growth Fund (See Note 9) | | | 2,525,783 | | | | 32,916,559 | |
| Shares redeemed | | | (657,082 | ) | | | (9,210,751 | ) |
| | | |
| | | |
| Net increase (decrease) in shares outstanding before conversion | | | 2,194,489 | | | | 28,297,959 | |
| Shares converted into Investor Class (See Note 1) | | | 366,776 | | | | 5,085,295 | |
| Shares converted from Investor Class (See Note 1) | | | (245,008 | ) | | | (3,442,846 | ) |
| | | |
| | | |
| Net increase (decrease) | | | 2,316,257 | | | $ | 29,940,408 | |
| | | |
| | | |
| Class A | | Shares | | | Amount | |
| |
| Year ended October 31, 2011: | | | | | | | | |
| Shares sold | | | 777,712 | | | $ | 12,990,082 | |
| Shares issued to shareholders in reinvestment of dividends | | | 17,403 | | | | 286,727 | |
| Shares redeemed | | | (1,812,938 | ) | | | (29,971,297 | ) |
| | | |
| | | |
| Net increase (decrease) in shares outstanding before conversion | | | (1,017,823 | ) | | | (16,694,488 | ) |
| Shares converted into Class A (See Note 1) | | | 304,014 | | | | 5,101,892 | |
| Shares converted from Class A (See Note 1) | | | (151,514 | ) | | | (2,212,300 | ) |
| | | |
| | | |
| Net increase (decrease) | | | (865,323 | ) | | $ | (13,804,896 | ) |
| | | |
| | | |
| Year ended October 31, 2010: | | | | | | | | |
| Shares sold | | | 989,521 | | | $ | 13,891,292 | |
| Shares issued in connection with the acquisition of MainStay Small Cap Growth Fund (See Note 9) | | | 2,011,365 | | | | 26,187,437 | |
| Shares redeemed | | | (2,212,628 | ) | | | (30,648,207 | ) |
| | | |
| | | |
| Net increase (decrease) in shares outstanding before conversion | | | 788,258 | | | | 9,430,522 | |
| Shares converted into Class A (See Note 1) | | | 420,666 | | | | 5,838,512 | |
| Shares converted from Class A (See Note 1) | | | (38,176 | ) | | | (561,498 | ) |
| Shares converted from Class A (a) | | | (157,445 | ) | | | (2,153,851 | ) |
| | | |
| | | |
| Net increase (decrease) | | | 1,013,303 | | | $ | 12,553,685 | |
| | | |
| | | |
| Class B | | Shares | | | Amount | |
| |
| Year ended October 31, 2011: | | | | | | | | |
| Shares sold | | | 258,521 | | | $ | 4,078,316 | |
| Shares issued to shareholders in reinvestment of dividends | | | 599 | | | | 9,601 | |
| Shares redeemed | | | (471,558 | ) | | | (7,421,489 | ) |
| | | |
| | | |
| Net increase (decrease) in shares outstanding before conversion | | | (212,438 | ) | | | (3,333,572 | ) |
| Shares converted from Class B (See Note 1) | | | (344,220 | ) | | | (5,363,299 | ) |
| | | |
| | | |
| Net increase (decrease) | | | (556,658 | ) | | $ | (8,696,871 | ) |
| | | |
| | | |
| Year ended October 31, 2010: | | | | | | | | |
| Shares sold | | | 295,585 | | | $ | 3,977,211 | |
| Shares issued in connection with the acquisition of MainStay Small Cap Growth Fund (See Note 9) | | | 1,845,463 | | | | 23,069,427 | |
| Shares redeemed | | | (565,245 | ) | | | (7,522,226 | ) |
| | | |
| | | |
| Net increase (decrease) in shares outstanding before conversion | | | 1,575,803 | | | | 19,524,412 | |
| Shares converted from Class B (See Note 1) | | | (526,988 | ) | | | (6,919,463 | ) |
| | | |
| | | |
| Net increase (decrease) | | | 1,048,815 | | | $ | 12,604,949 | |
| | | |
| | | |
| Class C | | Shares | | | Amount | |
| |
| Year ended October 31, 2011: | | | | | | | | |
| Shares sold | | | 83,990 | | | $ | 1,320,577 | |
| Shares issued to shareholders in reinvestment of dividends | | | 223 | | | | 3,579 | |
| Shares redeemed | | | (300,096 | ) | | | (4,736,653 | ) |
| | | |
| | | |
| Net increase (decrease) | | | (215,883 | ) | | $ | (3,412,497 | ) |
| | | |
| | | |
| Year ended October 31, 2010: | | | | | | | | |
| Shares sold | | | 154,519 | | | $ | 2,045,011 | |
| Shares issued in connection with the acquisition of MainStay Small Cap Value Fund (See Note 9) | | | 181,461 | | | | 2,267,000 | |
| Shares redeemed | | | (391,014 | ) | | | (5,205,198 | ) |
| | | |
| | | |
| Net increase (decrease) | | | (55,034 | ) | | $ | (893,187 | ) |
| | | |
| | | |
| Class I | | Shares | | | Amount | |
| |
| Year ended October 31, 2011: | | | | | | | | |
| Shares sold | | | 3,999,347 | | | $ | 68,009,736 | |
| Shares issued to shareholders in reinvestment of dividends | | | 52,408 | | | | 878,012 | |
| Shares redeemed | | | (3,276,594 | ) | | | (55,551,867 | ) |
| | | |
| | | |
| Net increase (decrease) | | | 775,161 | | | $ | 13,335,881 | |
| | | |
| | | |
| Year ended October 31, 2010: | | | | | | | | |
| Shares sold | | | 4,231,109 | | | $ | 62,103,205 | |
| Shares issued in connection with the acquisition of MainStay Small Cap Value Fund (See Note 9) | | | 330,642 | | | | 4,377,953 | |
| Shares redeemed | | | (7,220,991 | ) | | | (102,045,639 | ) |
| | | |
| | | |
| Net increase (decrease) in shares outstanding before conversion | | | (2,659,240 | ) | | | (35,564,481 | ) |
| Shares converted into Class I (a) | | | 154,730 | | | | 2,153,851 | |
| | | |
| | | |
| Net increase (decrease) | | | (2,504,510 | ) | | $ | (33,410,630 | ) |
| | | |
| | | |
| |
| (a) | In addition to any automatic conversion features described above in Note 1 with respect to Investor Class, Class A and Class B shares, investors generally may also elect to convert their shares on a voluntary basis into another share class of the same MainStay Fund subject to satisfying the |
mainstayinvestments.com 25
Notes to Financial Statements (continued)
eligibility requirements of the new share class, if any. However, the following limitations apply:
| | |
| | • | Investor Class, Class A and Class C shares that remain subject to a CDSC are ineligible for a voluntary conversion; and |
| |
| | • | All Class B shares are ineligible for a voluntary conversion. |
| |
| | These limitations do not impact any automatic conversion features described elsewhere in Note 1 with respect to Investor Class, Class A and Class B shares. |
| |
| | An investor or an investor’s financial intermediary may contact the MainStay Funds to request a voluntary conversion between share classes of the same MainStay Fund. Investors may be required to provide sufficient information to establish eligibility to convert to the new share class. All permissible conversions will be made on the basis of the relevant NAVs of the two classes without the imposition of any sales load, fee or other charge. If an investor fails to remain eligible for the new share class, they may be converted automatically back to their original share class, or into another share class, if appropriate. Although the MainStay Funds expect that a conversion between share classes of the same MainStay Fund should not result in the recognition of a gain or loss for tax purposes, shareholders should consult with their own tax adviser with respect to the tax treatment of their investment in a MainStay Fund. The MainStay Funds may change, suspend or terminate this conversion feature at any time. |
Note 9–Fund Acquisitions
At a meeting held on June 23, 2009, the Board approved a plan of reorganization whereby the Fund would acquire the assets, including the investments, and assume the liabilities of MainStay Small Cap Growth Fund, a series of The MainStay Funds. Shareholders of the MainStay Small Cap Growth Fund approved this reorganization on November 16, 2009, which was then completed on November 24, 2009. The aggregate net assets of the Fund immediately before the acquisition were $293,161,292 and the combined net assets after the acquisition were $381,979,668.
The acquisition was accomplished by a tax-free exchange of the following:
| | | | | | | | | |
| MainStay Small Cap Growth Fund | | Shares | | | Value | |
| |
| Investor Class | | | 2,862,295 | | | $ | 32,916,559 | |
| |
| |
| Class A | | | 2,275,595 | | | | 26,187,437 | |
| |
| |
| Class B | | | 2,190,085 | | | | 23,069,427 | |
| |
| |
| Class C | | | 215,221 | | | | 2,267,000 | |
| |
| |
| Class I | | | 374,503 | | | | 4,377,953 | |
| |
| |
In exchange for the MainStay Small Cap Growth Fund shares and net assets, the Fund issued 2,525,783 Investor Class Shares; 2,011,365 Class A shares; 1,845,463 Class B shares; 181,461 Class C shares; and 330,642 Class I shares.
MainStay Small Cap Growth Fund’s net assets after adjustments for any permanent book-to-tax differences at the acquisition date were as follows, which include the following amounts of capital stock, unrealized appreciation and accumulated net realized loss:
| | | | | | | | | | | | | | | | | | | | | |
| | | | | | | | | | | | Accumulated
| | | Undistributed
| |
| | | Total Net
| | | Capital
| | | Unrealized
| | | Net Realized
| | | Net Investment
| |
| | | Assets | | | Stock | | | Appreciation | | | Loss | | | Loss | |
| |
| MainStay Small Cap Growth Fund | | $ | 88,818,376 | | | $ | 172,773,002 | | | $ | 1,479,126 | | | $ | (85,422,964 | ) | | $ | (10,788 | ) |
| |
| |
For financial reporting purposes, assets received and shares issued by the Fund were recorded at fair value; however, the cost basis of the investments received from MainStay Small Cap Growth Fund was carried forward to align ongoing reporting of the Fund’s realized and unrealized gains and losses with amounts distributable to shareholders for tax purposes.
Note 10–Subsequent Events
In connection with the preparation of the financial statements of the Fund as of and for the year ended October 31, 2011, events and transactions subsequent to October 31, 2011 through the date the financial statements were issued have been evaluated by the Fund’s management for possible adjustment and/or disclosure. No subsequent events requiring financial statement adjustment or disclosure have been identified.
26 MainStay U.S. Small Cap Fund
Report of Independent Registered Public Accounting Firm
The Board of Trustees and Shareholders of
Eclipse Funds:
We have audited the accompanying statement of assets and liabilities, including the portfolio of investments, of the MainStay U.S. Small Cap Fund (“the Fund”), one of the funds constituting Eclipse Funds as of October 31, 2011, and the related statement of operations for the year then ended, the statements of changes in net assets for each of the years in the two-year period then ended, and the financial highlights for each of the years in the five-year period then ended. These financial statements and financial highlights are the responsibility of the Fund’s management. Our responsibility is to express an opinion on these financial statements and financial highlights based on our audits.
We conducted our audits in accordance with the standards of the Public Company Accounting Oversight Board (United States). Those standards require that we plan and perform the audit to obtain reasonable assurance about whether the financial statements and financial highlights are free of material misstatement. An audit includes examining, on a test basis, evidence supporting the amounts and disclosures in the financial statements. Our procedures included confirmation of securities owned as of October 31, 2011, by correspondence with the custodian and brokers or by other appropriate procedures where replies from brokers were not received. An audit also includes assessing the accounting principles used and significant estimates made by management, as well as evaluating the overall financial statement presentation. We believe that our audits provide a reasonable basis for our opinion.
In our opinion, the financial statements and financial highlights referred to above present fairly, in all material respects, the financial position of the MainStay U.S. Small Cap Fund of Eclipse Funds as of October 31, 2011, the results of its operations for the year then ended, the changes in its net assets for each of the years in the two-year period then ended, and the financial highlights for each of the years in the five-year period then ended, in conformity with U.S. generally accepted accounting principles.
Philadelphia, Pennsylvania
December 22, 2011
mainstayinvestments.com 27
Federal Income Tax Information (Unaudited)
The Fund is required under the Internal Revenue Code to advise shareholders within 60 days of the Fund’s fiscal year end (October 31, 2011) as to the federal tax status of dividends paid by the Fund during such fiscal years.
For the fiscal year ended October 31, 2011, the Fund designated approximately $7,054,101 under the Internal Revenue Code as qualified dividend income eligible for reduced tax rates.
The dividends paid by the Fund during the fiscal year ended October 31, 2011, should be multiplied by 100% to arrive at the amount eligible for the corporate dividends received deduction.
In February 2012, shareholders will receive an IRS Form 1099-DIV or substitute Form 1099 which will show the federal tax status of the distributions received by shareholders in calendar year 2011. The amounts that will be reported on such 1099-DIV or substitute Form 1099 will be the amounts you are to use on your federal income tax return and will differ from the amounts which we must report for the Funds’ fiscal year ended October 31, 2011.
Proxy Voting Policies and Procedures and Proxy Voting Record
A description of the policies and procedures that New York Life Investments uses to vote proxies related to the Fund’s securities is available without charge, upon request, (i) by visiting the Fund’s website at mainstayinvestments.com; or (ii) on the Securities and Exchange Commission’s (“SEC”) website at www.sec.gov.
The Fund is required to file with the SEC its proxy voting record for the 12-month period ending June��30 on Form N-PX. The Fund’s most recent Form N-PX is available free of charge upon request (i) by calling 800-MAINSTAY (624-6782); (ii) by visiting the Fund’s website at mainstayinvestments.com; or (iii) on the SEC’s website at www.sec.gov.
Shareholder Reports and Quarterly Portfolio Disclosure
The Fund is required to file its complete schedule of portfolio holdings with the SEC for its first and third fiscal quarters on Form N-Q. The Fund’s Form N-Q is available without charge on the SEC’s website at www.sec.gov or by calling MainStay Investments at 800-MAINSTAY (624-6782). You also can obtain and review copies of Form N-Q by visiting the SEC’s Public Reference Room in Washington, DC (information on the operation of the Public Reference Room may be obtained by calling 1-800-SEC-0330).
28 MainStay U.S. Small Cap Fund
Board Members and Officers (Unaudited)
The Board Members oversee the MainStay Group of Funds (which is comprised of Funds that are series of The MainStay Funds, Eclipse Funds, Eclipse Funds Inc., MainStay Funds Trust, and MainStay VP Funds Trust) (collectively, the “Fund Complex”), the Manager and, when applicable, the Subadvisor(s). Each Board Member serves until his or her successor is elected and qualified or until his or her resignation, death or removal. The Retirement Policy provides that a Board Member shall tender his or her resignation upon reaching age 72. A Board Member reaching the age of 72 may continue for additional one-year periods with the approval of the Board’s Nominating and Governance Committee.
Officers serve a term of one year and are elected annually by the Board Members. The business address of each Board Member and officer listed below is 51 Madison Avenue, New York, New York 10010.
The Statement of Additional Information applicable to the Fund includes additional information about the Board Members and is available without charge, upon request, by calling 800-MAINSTAY (624-6782) or by going online to mainstayinvestments.com.
| | | | | | | | | |
| | | Term of Office,
| | | | Number of
| | |
| | | Position(s) Held
| | | | Funds in Fund
| | Other
|
| | | with the Fund
| | | | Complex
| | Directorships
|
Name and
| | Complex and
| | Principal Occupation(s)
| | Overseen by
| | Held by
|
| Date of Birth | | Length of Service | | During Past Five Years | | Board Member | | Board Member |
| |
| Interested Board Member* |
| |
John Y. Kim
9/24/60 | | Indefinite;
Eclipse Funds: Trustee since 2008 (2 funds);
Eclipse Funds Inc.: Director since 2008 (1 fund);
The MainStay Funds: Trustee since 2008 (14 funds);
MainStay Funds Trust: Trustee since 2009 (28 funds); and
MainStay VP Funds Trust:
Director since 2011 and its predecessor, MainStay VP Series Fund, Inc. since 2008 (21 portfolios). | | Member of the Board of Managers (since 2011) of New York Life Enterprises LLC; Chairman (since 2011), Member of the Board of Managers, Chief Executive Officer and President (since 2008) of New York Life Investment Management LLC and New York Life Investment Management Holdings LLC; Executive Vice President (since 2011) of New York Life Foundation; Member of the Board of Managers and Chairman of the Board of Private Advisors, L.L.C. (since 2010); Executive Vice President, New York Life Insurance Company (since 2008); Chairman of the Board (2008-2010) and Member of the Boards of Managers (since 2008) of MacKay Shields LLC, Institutional Capital LLC, Madison Capital Funding LLC, Madison Square Investors LLC, NYLCAP Manager LLC and McMorgan & Company LLC; Chairman of the Board and Chief Executive Officer, NYLIFE Distributors LLC (2008-2010); Executive Vice President of NYLIFE Insurance Company of Arizona and New York Life Insurance and Annuity Corporation (since 2008); President, Prudential Retirement, a business unit of Prudential Financial, Inc. (2002 to 2007) | | 66 | | None |
| |
| |
| | |
| | * | This Board Member is considered to be an “interested person” of the MainStay Group of Funds within the meaning of the 1940 Act because of his affiliation with New York Life Insurance Company, New York Life Investment Management LLC, Madison Square Investors LLC, MacKay Shields LLC, Institutional Capital LLC, Epoch Investment Partners, Inc., Markston International, LLC, Winslow Capital Management, Inc., NYLIFE Securities LLC and/or NYLIFE Distributors LLC, as described in detail above in the column entitled “Principal Occupation(s) During the Past Five Years.” |
mainstayinvestments.com 29
| | | | | | | | | |
| | | Term of Office,
| | | | Number of
| | |
| | | Position(s) Held
| | | | Funds in Fund
| | Other
|
| | | with the Fund
| | | | Complex
| | Directorships
|
Name and
| | Complex and
| | Principal Occupation(s)
| | Overseen by
| | Held by
|
| Date of Birth | | Length of Service | | During Past Five Years | | Board Member | | Board Member |
| |
| Non-Interested Board Members |
| |
Susan B. Kerley
8/12/51 | | Indefinite;
Eclipse Funds: Chairman since 2005, and Trustee since 2000 (2 funds);
Eclipse Funds Inc.: Chairman since 2005 and Director since 1990
(1 fund);
The MainStay Funds: Chairman and Board Member since 2007
(14 funds);
MainStay Funds Trust: Chairman and Trustee since 2009 (28 funds); and
MainStay VP Funds Trust: Chairman and Director since 2011 and its predecessor, MainStay VP Series Fund, Inc., since 2007 (21 portfolios). | | President, Strategic Management Advisors LLC (since 1990) | | 66 | | Trustee, Legg Mason Partners Funds, since 1991 (58 portfolios) |
| |
| |
Alan R. Latshaw
3/27/51 | | Indefinite;
Eclipse Funds: Trustee and Audit Committee Financial Expert since 2007 (2 funds);
Eclipse Funds Inc.: Director and Audit Committee Financial Expert since 2007 (1 fund);
The MainStay Funds: Trustee and Audit Committee Financial Expert since 2006 (14 funds);
MainStay Funds Trust: Trustee and Audit Committee Financial Expert since 2009 (28 funds); and
MainStay VP Funds Trust: Director and Audit Committee Financial Expert since 2011 and its predecessor, MainStay VP Series Fund, Inc., since 2007 (21 portfolios). | | Retired; Partner, Ernst & Young LLP (2002 to 2003); Partner, Arthur Andersen LLP (1989 to 2002); Consultant to the MainStay Funds Audit and Compliance Committee (2004 to 2006) | | 66 | | Trustee, State Farm Associates Funds Trusts since 2005 (4 portfolios); Trustee, State Farm Mutual Fund Trust since 2005 (15 portfolios); Trustee, State Farm Variable Product Trust since 2005 (9 portfolios) |
| |
| |
30 MainStay U.S. Small Cap Fund
| | | | | | | | | |
| | | Term of Office,
| | | | Number of
| | |
| | | Position(s) Held
| | | | Funds in Fund
| | Other
|
| | | with the Fund
| | | | Complex
| | Directorships
|
Name and
| | Complex and
| | Principal Occupation(s)
| | Overseen by
| | Held by
|
| Date of Birth | | Length of Service | | During Past Five Years | | Board Member | | Board Member |
| |
| Non-Interested Board Members |
| |
Peter Meenan
12/5/41 | | Indefinite;
Eclipse Funds: Trustee since 2002 (2 funds);
Eclipse Funds Inc.: Director since 2002 (1 fund);
The MainStay Funds: Trustee since 2007 (14 funds);
MainStay Funds Trust: Trustee since 2009 (28 funds); and
MainStay VP Funds Trust: Director since 2011 and its predecessor, MainStay VP Series Fund, Inc., since 2007 (21 portfolios). | | Independent Consultant; President and Chief Executive Officer, Babson—United, Inc. (financial services firm) (2000 to 2004); Independent Consultant (1999 to 2000); Head of Global Funds, Citicorp (1995 to 1999) | | 66 | | None |
| |
| |
Richard H. Nolan, Jr.
11/16/46 | | Indefinite;
Eclipse Funds: Trustee since 2007 (2 funds);
Eclipse Funds Inc.: Director since 2007 (1 fund);
The MainStay Funds: Trustee since 2007 (14 funds);
MainStay Funds Trust: Trustee since 2009 (28 funds); and
MainStay VP Funds Trust: Director since 2011 and its predecessor, MainStay VP Series Fund, Inc., since 2006 (21 portfolios). | | Managing Director, ICC Capital Management; President—Shields/Alliance, Alliance Capital Management (1994 to 2004) | | 66 | | None |
| |
| |
Richard S. Trutanic
2/13/52 | | Indefinite;
Eclipse Funds: Trustee since 2007 (2 funds);
Eclipse Funds Inc.: Director since 2007 (1 fund);
The MainStay Funds: Trustee since 1994 (14 funds);
MainStay Funds Trust: Trustee since 2009 (28 funds); and
MainStay VP Funds Trust: Director since 2011 and its predecessor, MainStay VP Series Fund, Inc., since 2007 (21 portfolios). | | Chairman and Chief Executive Officer, Somerset & Company (financial advisory firm) (since 2004); Managing Director, The Carlyle Group (private investment firm) (2002 to 2004); Senior Managing Director, Partner and Board Member, Groupe Arnault S.A. (private investment firm) (1999 to 2002) | | 66 | | None |
| |
| |
mainstayinvestments.com 31
| | | | | | | | | |
| | | Term of Office,
| | | | Number of
| | |
| | | Position(s) Held
| | | | Funds in Fund
| | Other
|
| | | with the Fund
| | | | Complex
| | Directorships
|
Name and
| | Complex and
| | Principal Occupation(s)
| | Overseen by
| | Held by
|
| Date of Birth | | Length of Service | | During Past Five Years | | Board Member | | Board Member |
| |
| Non-Interested Board Members |
| |
Roman L. Weil
5/22/40 | | Indefinite;
Eclipse Funds:
Trustee and Audit Committee Financial Expert since 2007 (2 funds);
Eclipse Funds Inc.: Director and Audit Committee Financial Expert since 2007 (1 fund);
The MainStay Funds: Trustee and Audit Committee Financial Expert since 2007 (14 funds);
MainStay Funds Trust: Trustee since 2009 (28 funds); and
MainStay VP Funds Trust: Director and Audit Committee Financial Expert since 2011 and its predecessor, MainStay VP Series Fund, Inc., since 1994 and Audit Committee Financial Expert since 2003 (21 portfolios). | | Visiting Professor, NYU Stem School of Business, New York University (since 2011); President, Roman L. Weil Associates, Inc. (consulting firm) (since 1981); V. Duane Rath Professor Emeritus of Accounting, Chicago Booth School of Business, University of Chicago (1965-2008) | | 66 | | None |
| |
| |
John A. Weisser
10/22/41 | | Indefinite;
Eclipse Funds:
Trustee since 2007 (2 funds);
Eclipse Funds Inc.: Director since 2007 (1 fund);
The MainStay Funds: Trustee since 2007 (14 funds);
MainStay Funds Trust: Trustee since 2009 (28 funds); and
MainStay VP Funds Trust: Director since 2011 and its predecessor, MainStay VP Series Fund, Inc., since 1997 (21 portfolios). | | Retired. Managing Director of Salomon Brothers, Inc. (1971 to 1995) | | 66 | | Trustee, Direxion Funds since 2007 (27 portfolios); Direxion Insurance Trust since 2007 (1 portfolio); Trustee, Direxion Shares ETF Trust, since 2008 (50 portfolios) |
| |
| |
32 MainStay U.S. Small Cap Fund
The following individuals have been appointed by the Board Members to serve as Officers of the MainStay Group of Funds.
| | | | | |
| | | Positions(s) Held
| | |
Name and
| | with the Funds
| | Principal Occupation(s)
|
| Date of Birth | | and Length of Service | | During Past Five Years |
| |
| Officers |
| |
Jack R. Benintende
5/12/64 | | Treasurer and Principal Financial and Accounting Officer, Eclipse Funds, Eclipse Funds, Inc. and The MainStay Funds (since 2007), MainStay Funds Trust (since 2009) | | Assistant Treasurer, New York Life Investment Management Holdings LLC (since 2008); Managing Director, New York Life Investment Management LLC (since 2007); Treasurer and Principal Financial and Accounting Officer, MainStay VP Funds Trust and its predecessor, MainStay VP Series Fund, Inc. (since 2007); Vice President, Prudential Investments (2000 to 2007); Assistant Treasurer, JennisonDryden Family of Funds, Target Portfolio Trust, The Prudential Series Fund and American Skandia Trust (2006 to 2007); Treasurer and Principal Financial Officer, The Greater China Fund (2007) |
| |
| |
Jeffrey A. Engelsman
9/28/67 | | Vice President and Chief Compliance Officer, Eclipse Funds, Eclipse Funds, Inc., The MainStay Funds and MainStay Funds Trust (since 2009) | | Managing Director, Compliance (since 2009), Director and Associate General Counsel, New York Life Investment Management LLC (2005 to 2008); Assistant Secretary, NYLIFE Distributors LLC (2006 to 2008); Assistant Secretary NYLIFE Distributors LLC (2006 to 2008); Vice President and Chief Compliance Officer, MainStay VP Funds Trust and its predecessor, MainStay VP Series Fund, Inc. (since 2009); Assistant Secretary, The MainStay Funds and ICAP Funds, Inc. (2006 to 2008); Assistant Secretary, Eclipse Funds, Eclipse Funds, Inc. and MainStay VP Series Fund, Inc. (2005 to 2008) |
| |
| |
Stephen P. Fisher
2/22/59 | | President, Eclipse Funds, Eclipse Funds, Inc. and The MainStay Funds (since 2007), MainStay Funds Trust (since 2009) | | Director, Senior Vice President, New York Life Insurance and Annuity Corporation (since 2011); Manager, President and Chief Operating Officer, NYLIFE Distributors LLC (since 2007); Chairman of the Board, NYLIM Service Company LLC (since 2008); Senior Managing Director and Chief Marketing Officer, New York Life Investment Management LLC (since 2005); President, MainStay VP Funds Trust and its predecessor, MainStay VP Series Fund, Inc. (since 2007) |
| |
| |
| J. Kevin Gao 10/13/67 | | Secretary and Chief Legal Officer, Eclipse Funds, Eclipse Funds, Inc., The MainStay Funds and MainStay Funds Trust (since 2010) | | Managing Director and Associate General Counsel, New York Life Investment Management LLC (since 2010); Secretary and Chief Legal Officer, MainStay VP Funds Trust and its predecessor, MainStay VP Series Fund, Inc. (since 2010); Director and Counsel of Credit Suisse, Chief Legal Officer and Secretary of Credit Suisse Asset Management, LLC and Credit Suisse Funds (2003 to 2010) |
| |
| |
Scott T. Harrington
2/8/59 | | Vice President — Administration, Eclipse Funds, Eclipse Funds, Inc. and The MainStay Funds (since 2005), MainStay Funds Trust (since 2009) | | Director, New York Life Investment Management LLC (including predecessor advisory organizations) (since 2000); Director (since 2009), New York Life Trust Company FSB; Vice President—Administration, MainStay VP Funds Trust and its predecessor, MainStay VP Series Fund, Inc. (since 2005) |
| |
| |
| | |
| | * | The Officers listed above are considered to be “interested persons” of the MainStay Group of Funds within the meaning of the 1940 Act because of their affiliation with New York Life Insurance Company, New York Life Investment Management LLC, Madison Square Investors LLC, MacKay Shields LLC, Institutional Capital LLC, Epoch Investment Partners, Inc., Markston International, LLC, Winslow Capital Management, Inc., NYLIFE Securities LLC and/or NYLIFE Distributors LLC, as described in detail above in the column captioned “Principal Occupation(s) During Past Five Years.” Officers are elected annually by the Board to serve a one-year term. |
mainstayinvestments.com 33
This page intentionally left blank
MainStay Funds
MainStay offers a wide range of Funds for virtually any investment need. The full array of MainStay offerings is listed here, with information about the manager, subadvisors, legal counsel, and independent registered public accounting firm.
Equity Funds
MainStay 130/30 Core Fund
MainStay Common Stock Fund
MainStay Epoch U.S. All Cap Fund
MainStay Epoch U.S. Equity Fund
MainStay Equity Index Fund1
MainStay Growth Equity Fund
MainStay ICAP Equity Fund
MainStay ICAP Select Equity Fund
MainStay Large Cap Growth Fund
MainStay MAP Fund
MainStay S&P 500 Index Fund
MainStay U.S. Small Cap Fund
Income Funds
MainStay Flexible Bond Opportunities Fund
MainStay Floating Rate Fund
MainStay Government Fund
MainStay High Yield Corporate Bond Fund
MainStay High Yield Municipal Bond Fund
MainStay High Yield Opportunities Fund
MainStay Indexed Bond Fund
MainStay Intermediate Term Bond Fund
MainStay Money Market Fund
MainStay Principal Preservation Fund
MainStay Short Term Bond Fund
MainStay Tax Free Bond Fund
Blended Funds
MainStay Balanced Fund
MainStay Convertible Fund
MainStay Income Builder Fund
International Funds
MainStay 130/30 International Fund
MainStay Epoch Global Choice Fund
MainStay Epoch Global Equity Yield Fund
MainStay Epoch International Small Cap Fund
MainStay Global High Income Fund
MainStay ICAP Global Fund
MainStay ICAP International Fund
MainStay International Equity Fund
Asset Allocation Funds
MainStay Conservative Allocation Fund
MainStay Growth Allocation Fund
MainStay Moderate Allocation Fund
MainStay Moderate Growth Allocation Fund
Retirement Funds
MainStay Retirement 2010 Fund
MainStay Retirement 2020 Fund
MainStay Retirement 2030 Fund
MainStay Retirement 2040 Fund
MainStay Retirement 2050 Fund
Manager
New York Life Investment Management LLC
New York, New York
Subadvisors
Epoch Investment Partners, Inc.
New York, New York
Institutional Capital LLC2
Chicago, Illinois
MacKay Shields LLC2
New York, New York
Madison Square Investors LLC2
New York, New York
Markston International LLC
White Plains, New York
Winslow Capital Management, Inc.
Minneapolis, Minnesota
Legal Counsel
Dechert LLP
Independent Registered Public Accounting Firm
KPMG LLP
| |
| 1. | Closed to new investors and new purchases as of January 1, 2002. |
| 2. | An affiliate of New York Life Investment Management LLC. |
Not part of the Annual Report
mainstayinvestments.com
The MainStay Funds are managed by New York Life Investment Management LLC and distributed through NYLIFE Distributors LLC,
169 Lackawanna Avenue, Parsippany, NJ 07054, a wholly owned subsidiary of New York Life Insurance Company.
NYLIFE Distributors is a Member FINRA/SIPC.
MainStay Investments is a registered service mark and name under which New York Life Investment Management LLC does business.
MainStay Investments, an indirect subsidiary of New York Life Insurance Company, New York, NY 10010, provides investment
advisory products and services.
This report may be distributed only when preceded or accompanied by a current Fund prospectus.
© 2012 by NYLIFE Distributors LLC. All rights reserved.
| | | | | | | | | | | | | |
| |
| Not FDIC/NCUA Insured | | | Not a Deposit | | | May Lose Value | | | No Bank Guarantee | | | Not Insured by Any Government Agency |
| |
| |
| NYLIM-25002 MS284-11 | MSUSC11-12/11 |
NB1
Item 2. Code of Ethics.
As of the end of the period covered by this report, the Registrant has adopted a code of ethics (the “Code”) that applies to the Registrant’s principal executive officer (“PEO”) and principal financial officer (“PFO”). A copy of the Code is filed herewith. The Registrant did not grant any waivers, including implicit waivers, from any provisions of the Code to the PEO or PFO during the period covered by this report.
Item 3. Audit Committee Financial Expert.
The Board of Trustees has determined that the Registrant has two audit committee financial experts serving on its Audit Committee. The Audit Committee financial experts are Alan R. Latshaw and Roman L. Weil. Messrs. Latshaw and Weil are “independent” within the meaning of that term under the Investment Company Act of 1940.
Item 4. Principal Accountant Fees and Services.
(a) Audit Fees
The aggregate fees billed for the fiscal year ended October 31, 2011 for professional services rendered by KPMG LLP (“KPMG”) for the audit of the Registrant’s annual financial statements or services that are normally provided by KPMG in connection with statutory and regulatory filings or engagements for that fiscal year were $74,380.
The aggregate fees billed for the fiscal year ended October 31, 2010 for professional services rendered by KPMG for the audit of the Registrant’s annual financial statements or services that were normally provided by the KPMG in connection with the statutory and regulatory filings or engagements for that fiscal year were $69,580.
(b) Audit Related Fees
The aggregate fees billed for the fiscal year ended October 31, 2011 for assurance and related services by KPMG that are reasonably related to the performance of the audit of the Registrant’s financial statements and are not reported under paragraph (a) of this Item were $0.
The aggregate fees billed for the fiscal year ended October 31, 2010 for assurance and related services by KPMG that are reasonably related to the performance of the audit of the Registrant’s financial statements and are not reported under paragraph (a) of this Item were $0. These audit-related services include review of financial highlights for the Registrant’s registration statements and issuance of consents to use KPMG’s reports.
(c) Tax Fees
The aggregate fees billed for professional services rendered by KPMG for tax compliance, tax advice, and tax planning were (i) $8,595 during the fiscal year ended October 31, 2011, and (ii) $21,525 during the fiscal year ended October 31, 2010. These services included preparation of and advice relating to federal, state and local income tax returns and excise tax returns, as well as services relating to excise tax distribution requirements.
(d) All Other Fees
The aggregate fees billed for the fiscal year ended October 31, 2011 for products and services provided by KPMG, other than the services reported in paragraphs (a) through (c) of this Item were $0. The aggregate fees billed for the fiscal year ended October 31, 2010 for products and services provided by KPMG, other than the services reported in paragraphs (a) through (c) of this Item were $0.
(e) Pre-Approval Policies and Procedures
| | (1) | | The Registrant’s Audit Committee has adopted pre-approval policies and procedures (the “Procedures”) to govern the Committee’s pre-approval of (i) all audit services and permissible non-audit services to be provided to the Registrant by its independent accountant, and (ii) all permissible non-audit services to be provided by such independent accountant to the Registrant’s investment adviser and to any entity controlling, controlled by or under common control with the investment adviser that provides ongoing services to the Registrant (collectively, the “Service Affiliates”) if the services directly relate to the Registrant’s operations and financial reporting. In accordance with the Procedures, the Audit Committee is responsible for the engagement of the independent accountant to certify the Registrant’s financial statements for each fiscal year. With respect to the pre-approval of non-audit services provided to the Registrant and its Service Affiliates, the Procedures provide that the Audit Committee may annually pre-approve a list of the types of services that may be provided to the Registrant or its Service Affiliates, or the Audit Committee may pre-approve such services on a project-by-project basis as they arise. Unless a type of service has received general pre-approval, it will require specific pre-approval by the Audit Committee if it is to be provided by the independent accountant. The Procedures also permit the Audit Committee to delegate authority to one or more of its members to pre-approve any proposed non-audit services that have not been previously pre-approved by the Audit Committee, subject to the ratification by the full Audit Committee no later than its next scheduled meeting. To date, the Audit Committee has not delegated such authority. |
| |
| | (2) | | With respect to the services described in paragraphs (b) through (d) of this Item 4, no amount was approved by the Audit Committee pursuant to paragraph (c)(7)(i)(C) of Rule 2-01 of Regulation S-X. |
| | (f) | | There were no hours expended on KPMG’s engagement to audit the Registrant’s financial statements for the most recent fiscal year that were attributed to work performed by persons other than KPMG’s full-time, permanent employees. |
| |
| | (g) | | All non-audit fees billed by KPMG for services rendered to the Registrant for the fiscal years ended October 31, 2011 and October 31, 2010 are disclosed in 4(b)-(d) above. |
| |
| | The aggregate non-audit fees billed by KPMG for services rendered to the Registrant’s investment adviser (not including any sub-adviser whose role is primarily portfolio management and is subcontracted with or overseen by another investment adviser), and any entity controlling, controlled by, or under common control with the adviser that provides ongoing services to the Registrant were approximately: (i) $0 for the fiscal year ended October 31, 2011 and (ii) $0 for the fiscal year ended October 31, 2010. |
| |
| | (h) | | The Registrant’s Audit Committee of the Board of Trustees has considered whether the provision of non-audit services that were rendered to the Registrant’s investment adviser (not including any sub-adviser whose role is primarily portfolio management and is subcontracted with or overseen by another investment adviser), and any entity controlling, controlled by, or under common control with the investment adviser that provides ongoing services to the Registrant that were |
| | | | not pre-approved pursuant to paragraph (c)(7)(ii) of Rule 2-01 of Regulation S-X is compatible with maintaining KPMG’s independence. |
Item 5. Audit Committee of Listed Registrants
Not applicable.
Item 6. Schedule of Investments
The Schedule of Investments is included as part of Item 1 of this report.
Item 7. Disclosure of Proxy Voting Policies and Procedures for Closed-End Management Investment Companies.
Not applicable.
Item 8. Portfolio Managers of Closed-End Management Investment Companies.
Not applicable.
Item 9. Purchases of Equity Securities by Closed-End Management Investment Company and Affiliated Purchasers.
Not applicable.
Item 10. Submission of Matters to a Vote of Security Holders.
Since the Registrant’s last response to this Item, there have been no material changes to the procedures by which shareholders may recommend nominees to the Registrant’s Board of Trustees.
Item 11. Controls and Procedures.
| | (a) | | Based on an evaluation of the Registrant’s disclosure controls and procedures (as defined in Rule 30a-3(c) under the Investment Company Act of 1940, the “Disclosure Controls”) as of a date within 90 days prior to the filing date (the “Filing Date”) of this Form N-CSR (the “Report”), the Registrant’s principal executive officer and principal financial officer have concluded that the Disclosure Controls are reasonably designed to ensure that information required to be disclosed by the Registrant in the Report is recorded, processed, summarized and reported by the Filing Date, including ensuring that information required to be disclosed in the Report is accumulated and communicated to the Registrant’s management, including the Registrant’s principal executive officer and principal financial officer, as appropriate to allow timely decisions regarding required disclosure. |
| |
| | (b) | | There were no changes in the Registrant’s internal control over financial reporting (as defined in Rule 30a-3(d)) under the Investment Company Act of 1940 that occurred during the second fiscal quarter of the period covered by this report that has materially affected, or is reasonably likely to materially affect, the Registrant’s internal control over financial reporting. |
ITEM 12. Exhibits.
(a)(1) Code of Ethics
(a)(2) Certifications of principal executive officer and principal financial officer as required by Rule 30a-2 under the Investment Company Act of 1940.
(b) Certifications of principal executive officer and principal financial officer as required by Section 906 of the Sarbanes-Oxley Act of 2002.
SIGNATURES
Pursuant to the requirements of the Securities Exchange Act of 1934 and the Investment Company Act of 1940, the Registrant has duly caused this Report to be signed on its behalf by the undersigned, thereunto duly authorized.
ECLIPSE FUNDS
| | | | | |
|
| By: | | /s/ Stephen P. Fisher Stephen P. Fisher
President and Principal Executive Officer
| | |
Date: January 9, 2012
Pursuant to the requirements of the Securities Exchange Act of 1934 and the Investment Company Act of 1940, this Report has been signed below by the following persons on behalf of the Registrant and in the capacities and on the dates indicated.
| | | | | |
|
| By: | | /s/ Stephen P. Fisher Stephen P. Fisher
President and Principal Executive Officer
| | |
Date: January 9, 2012
| | | | | |
| By: | | /s/ Jack R. Benintende Jack R. Benintende
Treasurer and Principal Financial
and Accounting Officer | | |
Date: January 9, 2012
EXHIBIT INDEX
(a)(1) Code of Ethics
(a)(2) Certifications of principal executive officer and principal financial officer as required by Rule 30a-2 under the Investment Company Act of 1940.
(b) Certification of principal executive officer and principal financial officer as required by Section 906 of the Sarbanes-Oxley Act of 2002.