Item 1: Report to Shareholders| New Horizons Fund | December 31, 2007 |
The views and opinions in this report were current as of December 31, 2007. They are not guarantees of performance or investment results and should not be taken as investment advice. Investment decisions reflect a variety of factors, and the managers reserve the right to change their views about individual stocks, sectors, and the markets at any time. As a result, the views expressed should not be relied upon as a forecast of the fund’s future investment intent. The report is certified under the Sarbanes-Oxley Act, which requires mutual funds and other public companies to affirm that, to the best of their knowledge, the information in their financial reports is fairly and accurately stated in all material respects.
REPORTS ON THE WEB
Sign up for our E-mail Program, and you can begin to receive updated fund reports and prospectuses online rather than through the mail. Log in to your account at troweprice.com for more information.
Manager’s Letter
Fellow Shareholders
Major U.S. stock market indexes rose throughout much of 2007, peaking in October before correcting sharply in the final months of the year. Until late in the year, investors shrugged off the long-running weakness in the housing sector and other related consumer spending softness. They believed that strength elsewhere in the economy—healthy industrial activity, business capital spending, exports, and continued strong overall corporate profit growth—would offset the pockets of weakness. As we approached the year’s end, massive, multi-billion dollar write-offs related to rising defaults from risky subprime mortgages roiled many major financial institutions. Investors changed their view from “the glass is half full” to “the glass is half empty,” after belatedly realizing that the housing downturn and mortgage-related credit problems were likely to result in a sharp slowdown in U.S. economic growth as well as in many other countries around the world.
HIGHLIGHTS
• Stock markets were strong for much of 2007, but they corrected sharply in the year’s final months.
• Weakness among our consumer discretionary, technology, and telecommunications holdings resulted in the fund lagging its Lipper peer group.
• At this point in the cycle, large-cap earnings growth is more robust than small-cap earnings growth, as large-cap companies have greater overseas exposure, benefiting from stronger growth outside the U.S. and weakness in the dollar.
• The near-term outlook for the market and small stocks appears to be challenging. In this difficult environment, investors will seek out companies with above-market earnings, which are the focus of this fund.
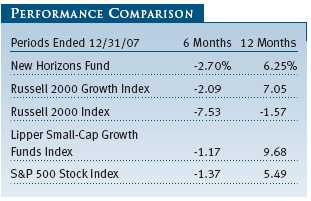
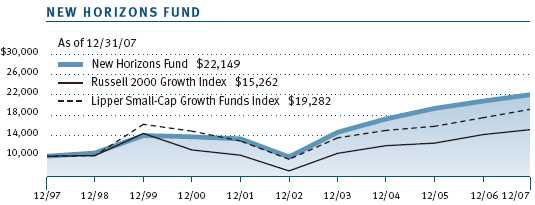
Against this backdrop, your fund fell 2.70% in the last six months but rose 6.25% for the full year, outperforming the broad small-cap Russell 2000 Index but slightly underperforming the more relevant Russell 2000 Growth Index. Stock prices fell in the fourth quarter, and the S&P 500 suffered its first fourth-quarter decline since 2000. For the full year, however, the major market indices still delivered moderate, mid-single digit gains with the S&P 500 up 5.49% on a total return basis.
As noted in the accompanying Performance Comparison table, the Russell 2000 small-cap stock index fell 1.57% for the year on a total return basis. We have been concerned for some time that small-cap stocks, which had led the market since early 1999, were facing headwinds to continued outperformance. As we feared, this outperformance streak decisively ended in 2007.
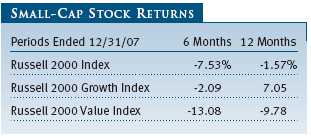
As indicated in the Small-Cap Stock Returns table, the small-cap growth sector outperformed the small-cap value sector of the Russell 2000 by a wide margin in 2007. This marked a sharp turnaround in relative performance for small-cap growth stocks, which consistently lagged small-cap value from 2000 to 2006. The New Horizons Fund focuses its investments on small-cap growth companies, which outperformed the overall small-cap market in 2007. As shown in the Performance Comparison table, your fund also lagged its peer group in 2007 as measured by the Lipper Small-Cap Growth Funds Index. Weakness among our consumer discretionary holdings—retailing, restaurants, and housing related—and poor performance among our technology and telecommunications stocks led to this underperformance.
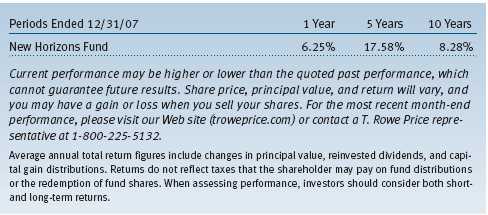
Your fund’s longer-term performance record, however, remains more favorable on both an absolute and relative basis. The fund’s annualized return for the past three years was 8.49% compared with 8.53% for the Lipper Small-Cap Growth Funds Index; the five-year return was 17.58% vs. 15.44% for the Lipper peer group; and for the 10-year period, the annualized return was 8.28% vs. 6.79%. (Based on cumulative total return, Lipper ranked the New Horizons Fund 362 out of 592, 220 out of 478, 86 out of 395, and 72 out of 180 small-cap growth funds for the 1-, 3-, 5-, and 10-year periods ended December 31, 2007, respectively. Past performance cannot guarantee future results.)
MARKET ENVIRONMENT
As we move into 2008, the stock market faces a conundrum as to whether the economy is going through a midcycle slowdown or whether we are entering or already in a recession. The third quarter 2007 data on the nation’s gross domestic product showed a surprisingly strong economy—healthy employment, continued strength outside the consumer sector, strong exports, and robust corporate profits. However, most of the stock market’s strong underpinnings (which led to the record highs in a number of market indices in October) began to crumble by the end of the year.
The housing market, which many investors thought was close to stabilizing, weakened further, and home prices fell sharply in many markets around the country. Mortgage delinquencies and defaults accelerated as subprime borrowers found themselves unable to cope with new terms when their adjustable-rate mortgages moved from low teaser to market rates. Commercial and investment banks, which had made billions of dollars in recent years packaging and selling pools of mortgages in the secondary market, were caught holding the bag as housing fundamentals deteriorated and risk premiums widened sharply in the credit markets. The subsequent multi-billion dollar write-offs shocked investors and led to sharp stock declines among many financial institutions.
The widening housing-related problems led to a deterioration in overall consumer confidence and to the weakest holiday retail sales in many years. With consumer spending accounting for close to two-thirds of overall domestic economic activity, not surprisingly, this weakness—and the overall bank tightening of credit availability—is leading to weakness throughout the U.S. economy and beyond. Nonresidential construction is showing early signs of weakness, and the outlook for continued strength in business capital spending has been brought into question. Signs of a spreading slowdown outside the U.S., particularly in Europe, are beginning to show. Employment statistics weakened unexpectedly around year-end. And record high oil prices as well as all-time high prices for food and other commodities has the Fed and others concerned about the inflation outlook. Investors are reining in earnings growth expectations for 2008.
The deteriorating economic fundamentals are undermining investor confidence as we write this letter. By mid-January, most stock market indices had declined by close to 15% from their 2007 peaks, surpassing the conventional definition of a “correction.” Whether this weakness continues into a full-blown cyclical bear market is the question with which investors must grapple.
While it is clear that near-term economic statistics will confirm the economic slowdown, there are some reasons to believe that the U.S. economy will not tumble into an extended, full-fledged recession. The Fed has already sprung into action, lowering the fed funds rate several times and injecting billions of dollars of liquidity into the banking system in an effort to encourage banks to resume lending. Long-term interest rates have declined and are at favorable levels for consumers and businesses alike. In addition, Washington is debating a one-time fiscal stimulus program to help consumers and businesses. Many economies outside the U.S. and Europe remain very strong, particularly China and other parts of Asia. The weakness in the dollar makes U.S. exports more competitive than they have been in years. While corporate profit growth will undoubtedly slow in 2008, corporate balance sheets and cash flow remain strong. And, most importantly, unlike the market peak in 2000, stock market valuations are reasonable, making a sharp decline from current levels unlikely.
Over the past year, we have commented in these letters about the increase in merger, acquisitions, and private-equity-sponsored takeover activity. Many of these buyouts have been focused on small-cap and mid-cap companies, the sweet spot of your fund’s investments. As noted in our midyear letter, the New Horizons Fund had a record number of holdings acquired in the first half of the year. Despite the drying up of credit availability for private-equity buyouts in the second half, the fund ended the year with a record total of 25 portfolio companies receiving takeover offers. We have been pleased to see the continuation of “strategic” takeovers (where one company offers to take over another for strategic reasons) as opposed to “financial” takeovers (usually led by private-equity firms often in conjunction with company management). We have found that strategic takeovers typically result in a higher premium and fairer price for investors than the financial takeovers. Private-equity firms try to buy out their targets more opportunistically at lower premiums. When management is a party to the takeover attempt, it often has a conflict of interest and does not fight for the higher price for all shareholders. We believe that takeover activity in the market will remain strong in 2008 and beyond and will provide some support in the event of further declines in the stock market. The majority of large corporations remain cash rich, and private-equity firms are likely to reenter the buyout foray again once credit markets loosen up. We would expect future buyouts to continue in the small- and mid-cap sectors, which should help your fund along with other small- and mid-cap funds.
PORTFOLIO REVIEW
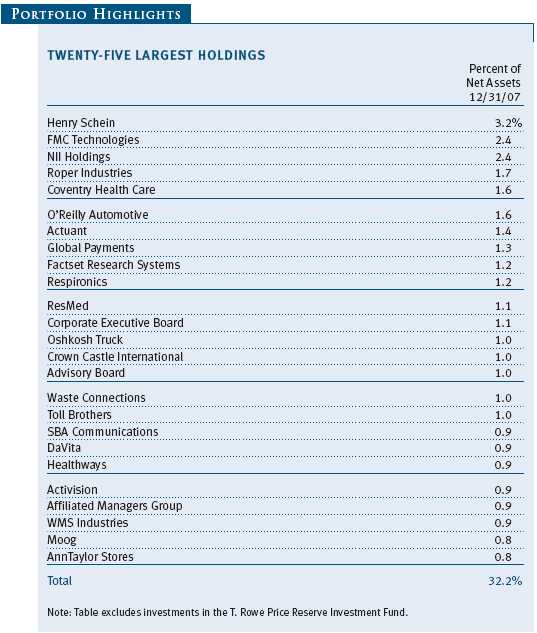
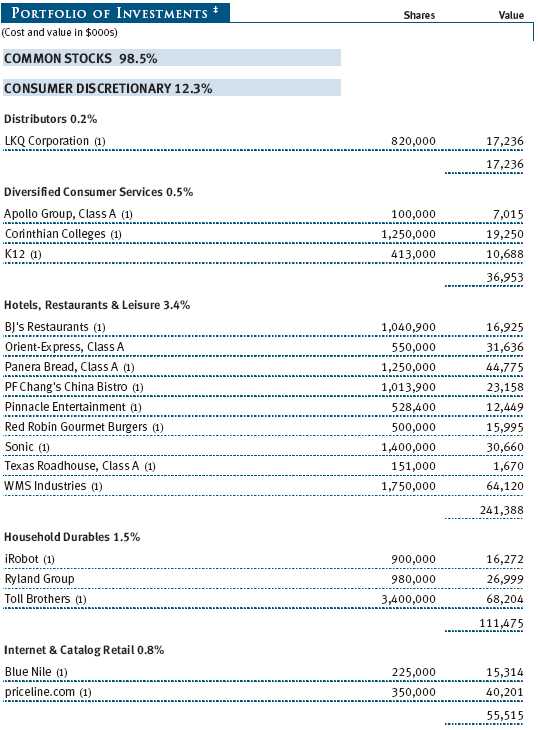
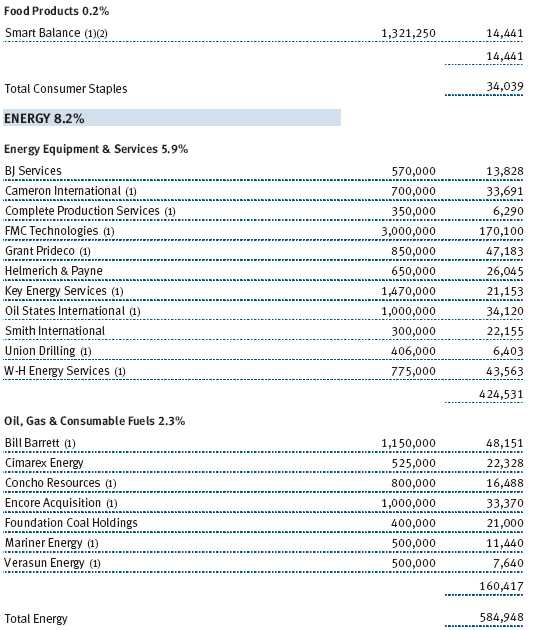
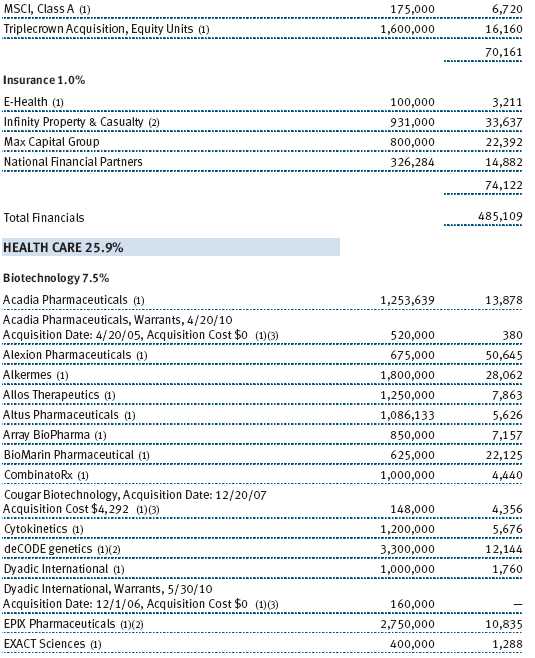
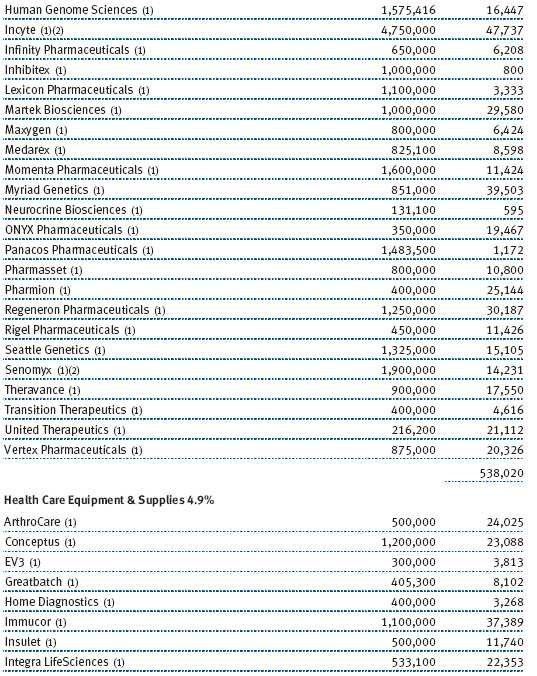
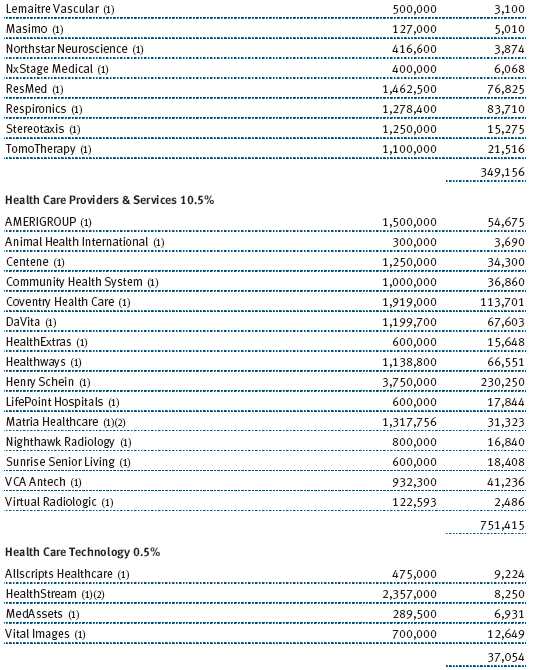
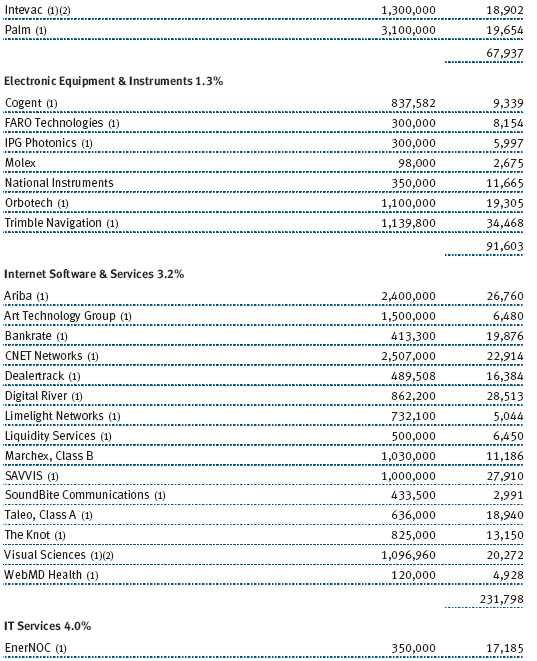
For the six-month period ending December 31, 2007, the fund’s health care and energy holdings were positive contributors to fund performance. All other sectors experienced declines. Not only did health care and energy stocks register gains, but our picks in those sectors performed particularly well. Six of the top 10 contributors in the last six months were health care stocks. Two of these, Respironics and Pharmion, received takeover offers. Respironics is a leader in providing medical devices to individuals with sleep and respiratory disorders, and Pharmion is an innovative biotechnology company with products serving hematology and oncology patients. Another standout was Henry Schein, the fund’s largest health care holding and a leading distributor of supplies and equipment to dentists, office-based doctors, and veterinarians. Overall, our biotechnology holdings were particularly strong performers, led by Pharmion, Alexion Pharmaceuticals, and Incyte. In the energy area, the fund’s second-largest holding, FMC Technologies, an energy services company that provides products to facilitate deep-water drilling, was our top performer. Other strong energy services performers included Cameron International and Smith International. (Please refer to our Portfolio of Investments for the complete listing of holdings and the amount each represents in the portfolio.)
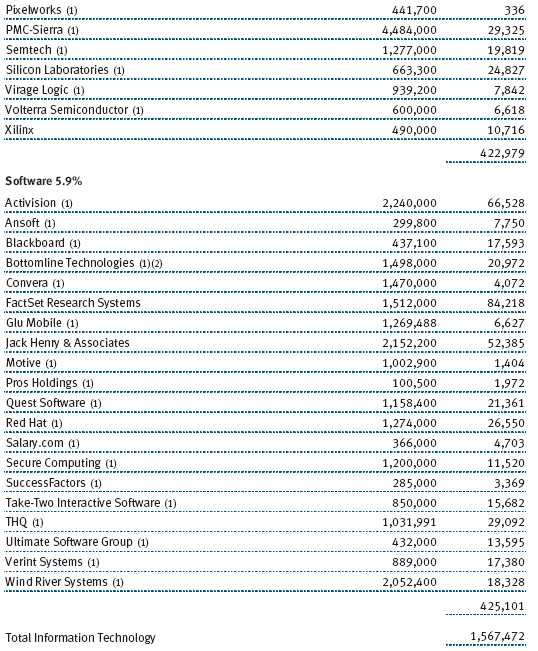
Elsewhere in the portfolio, several technology companies were strong performers. Leading video game software maker Activision rose strongly throughout the year, first due to its industry-leading game sales but then due to its late-year announcement of a merger with Vivendi’s strong game development business. When the merger is consummated later in 2008, it will create an industry leader. NAVTEQ, a leading provider of digital mapping software for use in automobile and portable navigation devices, rose sharply as well when it agreed to a merger with Nokia in October. Priceline.com, the online travel provider, also was a strong performer as its bookings surged over the course of the year.
The fund’s worst contributor for the six months and full year was former top holding NII Holdings, a major provider of cellular telephone service in Mexico, Brazil, and several other Latin American markets. NII offers the Nextel push-to-talk technology in these markets primarily to higher end business customers. The stock fell 40% in the second half due to fears of a slowdown in new subscriber growth and stepped up competition. These fears seem overblown, and the company continues to generate approximately 40% annual growth in cash flow.
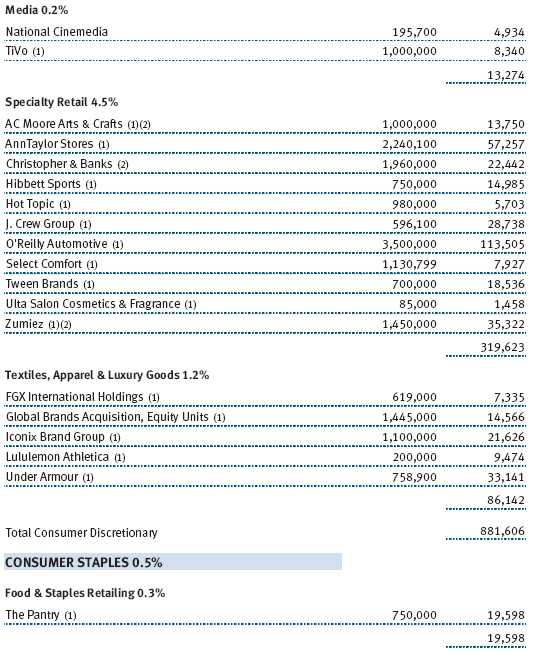
Specialty retailers, restaurant companies, and housing-related companies were weak across the board and detracted from performance throughout the year. Fund holdings in this area that fell sharply included specialty retailers Ann Taylor, Zumiez, and Tween Brands; restaurant chains P.F. Chang’s China Bistro and Panera Bread; and homebuilders Toll Brothers and Ryland Group.
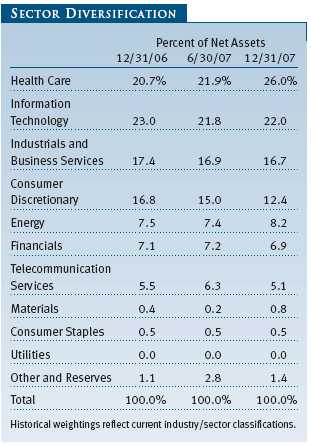
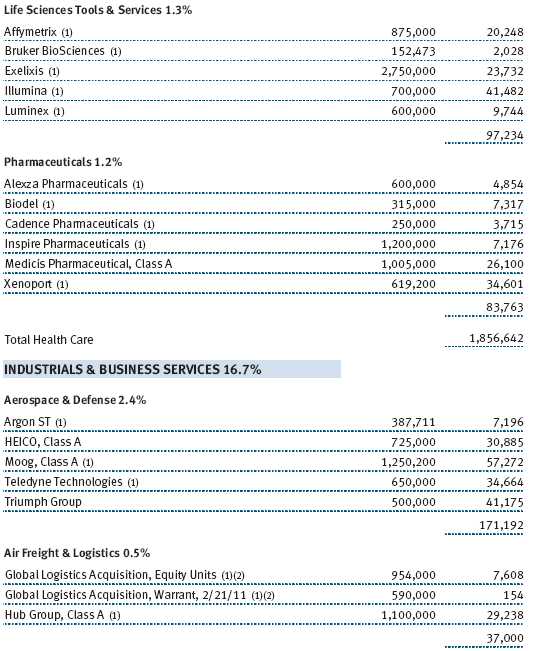
Looking at the fund’s sector diversification, the major change was a boost in our health care holdings—at 26.0% of the portfolio, it is now our largest sector weighting. New holdings over the course of 2007 in health care include pharmaceutical company Xenoport, biotechnology company Regeneron Pharmaceuticals, and disease management specialist Matria Healthcare. Suppliers of unique medical equipment and devices that we added include Tomotherapy, Arthrocare, and Conceptus.
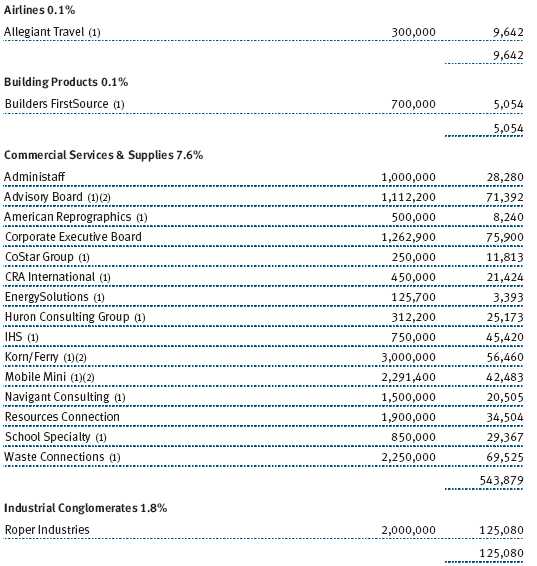
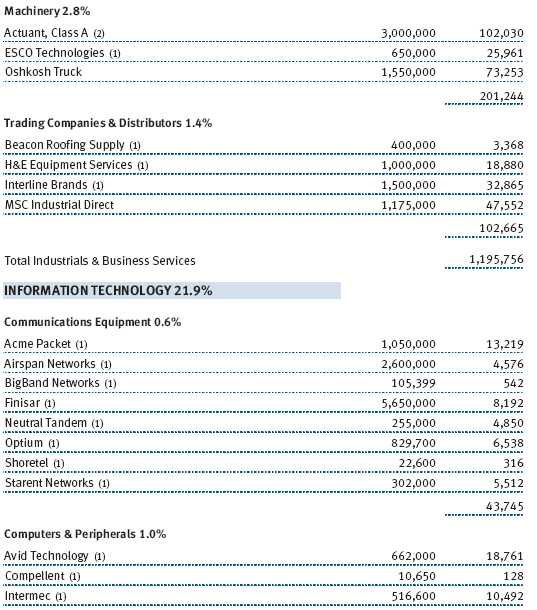
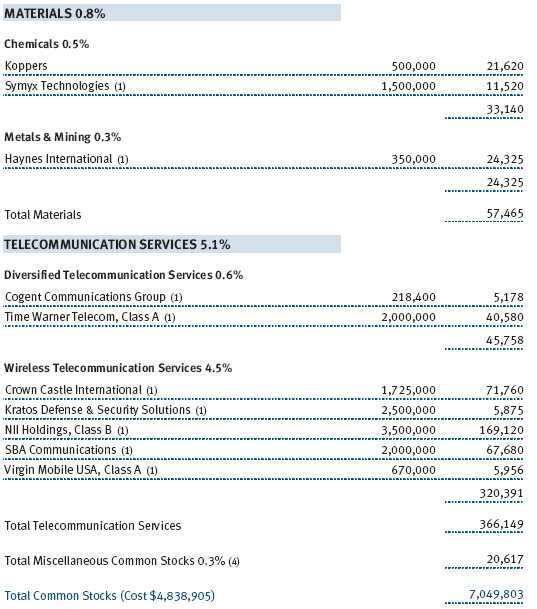
We maintained our technology weighting at 22.0% of the portfolio. Important new purchases included Ariba and Blackboard in software and SAVVIS and Neustar in IT services. Consumer discretionary holdings showed the biggest decline—to 12.4% of the portfolio due to the sector’s underperformance and the elimination of several holdings. Elsewhere in the portfolio, other significant new holdings in the last six months included Hub Group, a freight transportation management company; Huron Consulting Group, a rapidly growing provider of financial and operating consulting services to businesses; Corinthian Colleges, a post-secondary education company providing associate, bachelor, and masters degrees; and Koppers Holdings, a global provider of carbon compounds and wood treatment products.
OUTLOOK
The economic outlook for 2008 is more uncertain than at any time in the last five years. The problems and weakness in the housing area have spread into the broader consumer sector, where spending has weakened, and into the financial sector, where write-offs and credit problems abound. A tightening of credit availability generally threatens to contribute to a slowdown in other sectors of the economy as well. Unemployment rates rose unexpectedly late in the year. Corporate profit growth is likely to slow significantly, although analysts still expect most nonfinancial companies to deliver modest earnings gains for the year. The upcoming presidential election adds additional uncertainty to the policy outlook beyond 2008. In a recent poll of economists, almost half expect the U.S. to fall into a recession in 2008.
In response to these challenges, the Fed has sprung into action. The Fed cut rates three times in 2007 and made an extraordinary three-quarters percentage point cut on January 22. The Fed is expected to continue on this course until the credit markets stabilize and there is enough stimulus to generate economic growth. Due to the expected economic weakness, long-term Treasury rates have fallen as well. Inflation concerns are likely to diminish even though commodity prices remain stubbornly high. In Washington, fiscal stimulus is a bipartisan front-burner issue.
There is some light amid this gloom. Many economies outside of North America and Europe continue to show strong growth. U.S. corporate balance sheets and cash flow remain historically strong. Stock market valuation levels are reasonable and in line with historical averages. With low interest rates, a continued high level of strategic and private-equity takeover activity is likely once banks again increase their willingness to lend.
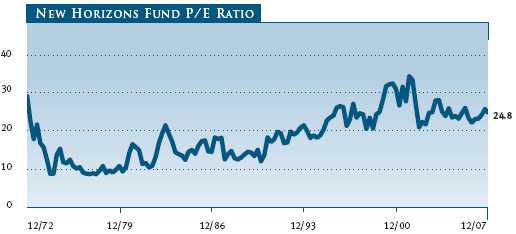
Small-cap stocks underperformed large-caps in 2007 by a meaningful margin, and this trend is likely to continue in 2008. Small-cap earnings have been weaker than large, as small-caps are more sensitive to the U.S. economy and do not have as high exposure as the large-caps to faster-growing overseas economies. The past year’s dollar weakness only exacerbates this problem. Small-cap price/earnings (P/E) levels remain somewhat above large-cap P/Es, which historically has not been the case for an extended period. The average New Horizons Fund portfolio P/E, however, is in line with its level of the last 10 to 15 years as shown on the accompanying chart. The New Horizons Fund’s relative P/E compared with the S&P 500, on the other hand, was 1.62x at year-end, very near its highest level in the past 25 years.

The near-term outlook for the market in general—and for small stocks in particular—appears challenging. We do believe that small-cap growth stocks, which outperformed the small-cap value sector decisively in 2007, are likely to continue to outperform the overall small-cap market again in 2008. In a weaker economy, investors will seek out those companies that can continue to generate strong earnings gains, and these are exactly the type of companies in which your fund invests. We believe that T. Rowe Price’s large staff of research analysts will continue to identify small-cap companies with outstanding growth potential and that the fund will continue to deliver strong relative performance in 2008 and beyond.
Respectfully submitted,

John H. Laporte
President of the fund and chairman of its Investment Advisory Committee
January 24, 2008
The committee chairman has day-to-day responsibility for managing the portfolio and works with committee members in developing and executing the fund’s investment program.
RISKS OF STOCK INVESTING
As with all stock and bond mutual funds, each fund’s share price can fall because of weakness in the stock or bond markets, a particular industry, or specific holdings. Stock markets can decline for many reasons, including adverse political or economic developments, changes in investor psychology, or heavy institutional selling. The prospects for an industry or company may deteriorate because of a variety of factors, including disappointing earnings or changes in the competitive environment. In addition, the investment manager’s assessment of companies held in a fund may prove incorrect, resulting in losses or poor performance even in rising markets.
Investing in small companies involves greater risk than is customarily associated with larger companies. Stocks of small companies are subject to more abrupt or erratic price movements than larger-company stocks. Small companies often have limited product lines, markets, or financial resources, and their managements may lack depth and experience. Such companies seldom pay significant dividends that could cushion returns in a falling market.
GLOSSARY
Lipper indexes: Fund benchmarks that consist of a small number (10 to 30) of the largest mutual funds in a particular category as tracked by Lipper Inc.
Price/earnings ratio (P/E): A valuation measure calculated by dividing the price of a stock by its current or projected earnings per share. This ratio gives investors an idea of how much they are paying for current or future earnings power.
Russell 2000 Index: Consists of the smallest 2,000 companies in the Russell 3000 Index, representing approximately 7% of the Russell 3000’s total market capitalization. Performance is reported on a total return basis.
Russell 2000 Value Index: Market-weighted total return index that measures the performance of companies within the Russell 2000 Index having lower price/book value ratios and lower forecasted growth rates.
Russell 2000 Growth Index: Market-weighted total return index that measures the performance of companies within the Russell 2000 Index having higher price/book value ratios and higher forecasted growth rates.
S&P 500 Stock Index: An unmanaged index that tracks the stocks of 500 primarily large-cap U.S. companies.

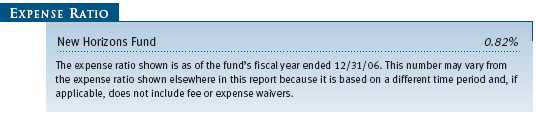
Performance and Expenses
This chart shows the value of a hypothetical $10,000 investment in the fund over the past 10 fiscal year periods or since inception (for funds lacking 10-year records). The result is compared with benchmarks, which may include a broad-based market index and a peer group average or index. Market indexes do not include expenses, which are deducted from fund returns as well as mutual fund averages and indexes.
| AVERAGE ANNUAL COMPOUND TOTAL RETURN |
This table shows how the fund would have performed each year if its actual (or cumulative) returns for the periods shown had been earned at a constant rate.
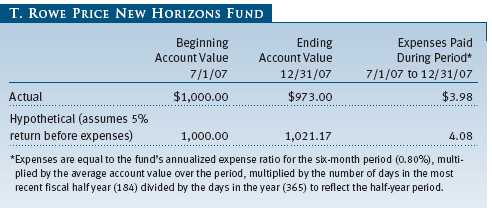
As a mutual fund shareholder, you may incur two types of costs: (1) transaction costs, such as redemption fees or sales loads, and (2) ongoing costs, including management fees, distribution and service (12b-1) fees, and other fund expenses. The following example is intended to help you understand your ongoing costs (in dollars) of investing in the fund and to compare these costs with the ongoing costs of investing in other mutual funds. The example is based on an investment of $1,000 invested at the beginning of the most recent six-month period and held for the entire period.
Actual Expenses
The first line of the following table (“Actual”) provides information about actual account values and expenses based on the fund’s actual returns. You may use the information in this line, together with your account balance, to estimate the expenses that you paid over the period. Simply divide your account value by $1,000 (for example, an $8,600 account value divided by $1,000 = 8.6), then multiply the result by the number in the first line under the heading “Expenses Paid During Period” to estimate the expenses you paid on your account during this period.
Hypothetical Example for Comparison Purposes
The information on the second line of the table (“Hypothetical”) is based on hypothetical account values and expenses derived from the fund’s actual expense ratio and an assumed 5% per year rate of return before expenses (not the fund’s actual return). You may compare the ongoing costs of investing in the fund with other funds by contrasting this 5% hypothetical example and the 5% hypothetical examples that appear in the shareholder reports of the other funds. The hypothetical account values and expenses may not be used to estimate the actual ending account balance or expenses you paid for the period.
Note: T. Rowe Price charges an annual small-account maintenance fee of $10, generally for accounts with less than $2,000 ($500 for UGMA/UTMA). The fee is waived for any investor whose T. Rowe Price mutual fund accounts total $25,000 or more, accounts employing automatic investing, and IRAs and other retirement plan accounts that utilize a prototype plan sponsored by T. Rowe Price (although a separate custodial or administrative fee may apply to such accounts). This fee is not included in the accompanying table. If you are subject to the fee, keep it in mind when you are estimating the ongoing expenses of investing in the fund and when comparing the expenses of this fund with other funds.
You should also be aware that the expenses shown in the table highlight only your ongoing costs and do not reflect any transaction costs, such as redemption fees or sales loads. Therefore, the second line of the table is useful in comparing ongoing costs only and will not help you determine the relative total costs of owning different funds. To the extent a fund charges transaction costs, however, the total cost of owning that fund is higher.
The accompanying notes are an integral part of these financial statements.


The accompanying notes are an integral part of these financial statements.
The accompanying notes are an integral part of these financial statements.
The accompanying notes are an integral part of these financial statements.
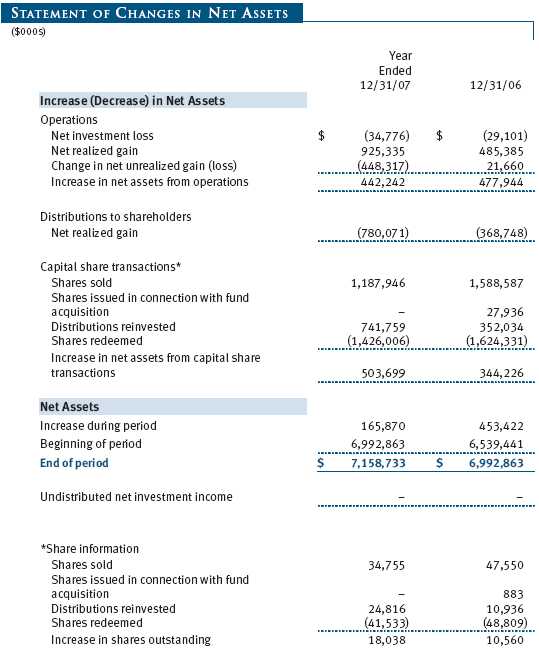
The accompanying notes are an integral part of these financial statements.
| NOTES TO FINANCIAL STATEMENTS |
NOTE 1 - SIGNIFICANT ACCOUNTING POLICIES
T. Rowe Price New Horizons Fund, Inc. (the fund), is registered under the Investment Company Act of 1940 (the 1940 Act) as a diversified, open-end management investment company. The fund commenced operations on June 30, 1960. The fund seeks long-term capital growth by investing primarily in common stocks of small, rapidly growing companies.
The accompanying financial statements were prepared in accordance with accounting principles generally accepted in the United States of America, which require the use of estimates made by fund management. Fund management believes that estimates and security valuations are appropriate; however, actual results may differ from those estimates, and the security valuations reflected in the financial statements may differ from the value the fund ultimately realizes upon sale of the securities.
Valuation The fund values its investments and computes its net asset value per share at the close of the New York Stock Exchange (NYSE), normally 4 p.m. ET, each day that the NYSE is open for business. Equity securities listed or regularly traded on a securities exchange or in the over-the-counter (OTC) market are valued at the last quoted sale price or, for certain markets, the official closing price at the time the valuations are made, except for OTC Bulletin Board securities, which are valued at the mean of the latest bid and asked prices. A security that is listed or traded on more than one exchange is valued at the quotation on the exchange determined to be the primary market for such security. Listed securities not traded on a particular day are valued at the mean of the latest bid and asked prices for domestic securities and the last quoted sale price for international securities.
Investments in mutual funds are valued at the mutual fund’s closing net asset value per share on the day of valuation.
Other investments, including restricted securities, and those for which the above valuation procedures are inappropriate or are deemed not to reflect fair value are stated at fair value as determined in good faith by the T. Rowe Price Valuation Committee, established by the fund’s Board of Directors.
Rebates and Credits Subject to best execution, the fund may direct certain security trades to brokers who have agreed to rebate a portion of the related brokerage commission to the fund in cash. Commission rebates are reflected as realized gain on securities in the accompanying financial statements and totaled $150,000 for the year ended December 31, 2007. Additionally, the fund earns credits on temporarily uninvested cash balances at the custodian that reduce the fund’s custody charges. Custody expense in the accompanying financial statements is presented before reduction for credits, which are reflected as expenses paid indirectly.
Investment Transactions, Investment Income, and Distributions Income and expenses are recorded on the accrual basis. Dividends received from mutual fund investments are reflected as dividend income; capital gain distributions are reflected as realized gain/loss. Dividend income and capital gain distributions are recorded on the ex-dividend date. Income tax-related interest and penalties, if incurred, would be recorded as income tax expense. Investment transactions are accounted for on the trade date. Realized gains and losses are reported on the identified cost basis. Distributions to shareholders are recorded on the ex-dividend date. Income distributions are declared and paid on an annual basis. Capital gain distributions, if any, are declared and paid by the fund, typically on an annual basis.
New Accounting Pronouncements Effective June 29, 2007, the fund adopted Financial Accounting Standards Board (FASB) Interpretation No. 48 (FIN 48), Accounting for Uncertainty in Income Taxes, a clarification of FASB Statement No. 109, Accounting for Income Taxes. FIN 48 establishes financial accounting and disclosure requirements for recognition and measurement of tax positions taken or expected to be taken on an income tax return. The adoption of FIN 48 had no impact on the fund’s net assets or results of operations.
In September 2006, the FASB released the Statement of Financial Accounting Standard No. 157 (FAS 157), Fair Value Measurements. FAS 157 clarifies the definition of fair value and establishes the framework for measuring fair value, as well as proper disclosure of this methodology in the financial statements. It will be effective for the fund’s fiscal year beginning January 1, 2008. Management is evaluating the effects of FAS 157; however, it is not expected to have a material impact on the fund’s net assets or results of operations.
NOTE 2 - INVESTMENT TRANSACTIONS
Consistent with its investment objective, the fund engages in the following practices to manage exposure to certain risks or to enhance performance. The investment objective, policies, program, and risk factors of the fund are described more fully in the fund’s prospectus and Statement of Additional Information.
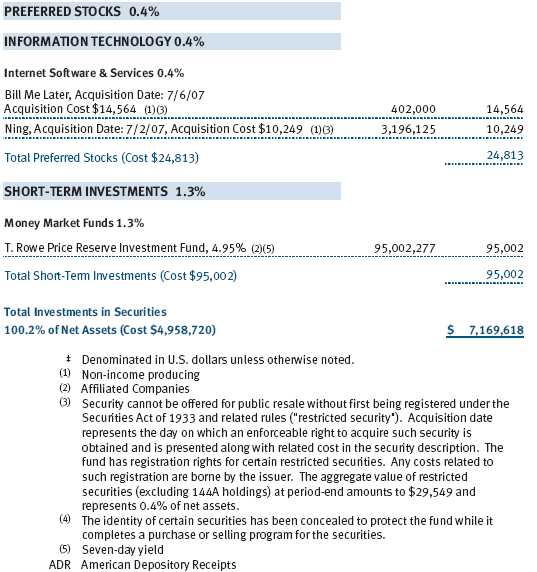
Restricted Securities The fund may invest in securities that are subject to legal or contractual restrictions on resale. Prompt sale of such securities at an acceptable price may be difficult due to substantial delays and additional costs related to their restrictions.
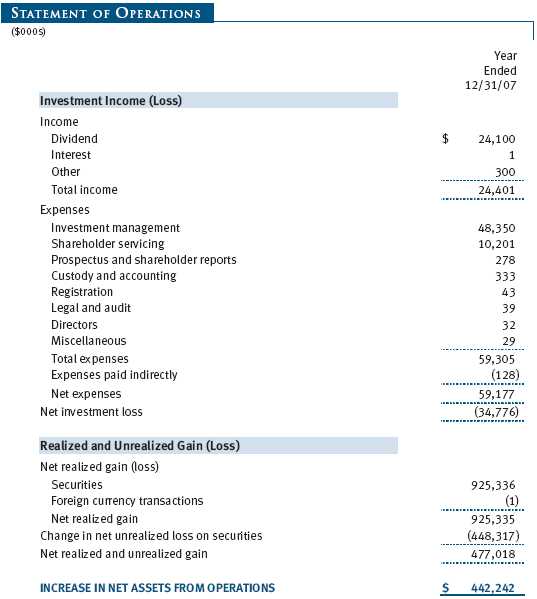
Other Purchases and sales of portfolio securities, other than short-term securities, aggregated $2,005,265,000 and $2,300,151,000, respectively, for the year ended December 31, 2007.
NOTE 3 - FEDERAL INCOME TAXES
No provision for federal income taxes is required since the fund intends to continue to qualify as a regulated investment company under Subchapter M of the Internal Revenue Code and distribute to shareholders all of its taxable income and gains. Federal income tax regulations differ from generally accepted accounting principles; therefore, distributions determined in accordance with tax regulations may differ significantly in amount or character from net investment income and realized gains for financial reporting purposes. Financial reporting records are adjusted for permanent book/tax differences to reflect tax character. Financial records are not adjusted for temporary differences.
Distributions during the year ended December 31, 2007 were characterized as follows for tax purposes:
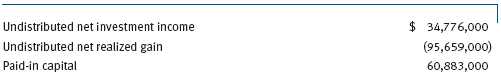
At December 31, 2007, the tax-basis components of net assets were as follows:
The fund intends to retain realized gains to the extent of available capital loss carryforwards. During the year ended December 31, 2007, the fund utilized $1,219,000 of capital loss carryforwards. As of December 31, 2007, the fund had $3,656,000 of capital loss carryforwards that expire in 2010. Further, $3,656,000 of the fund’s unused capital loss carryforwards may be subject to certain limitations on amount and/or timing of use, related to being acquired through tax-free reorganizations.
For the year ended December 31, 2007, the fund recorded the following permanent reclassifications to reflect tax character. Reclassifications to paid-in capital relate primarily to a tax practice that treats a portion of the proceeds from each redemption of capital shares as a distribution of taxable net investment income and/or realized capital gain. Reclassifications between income and gain relate primarily to the offset of the current net operating loss against realized gains. Results of operations and net assets were not affected by these reclassifications.
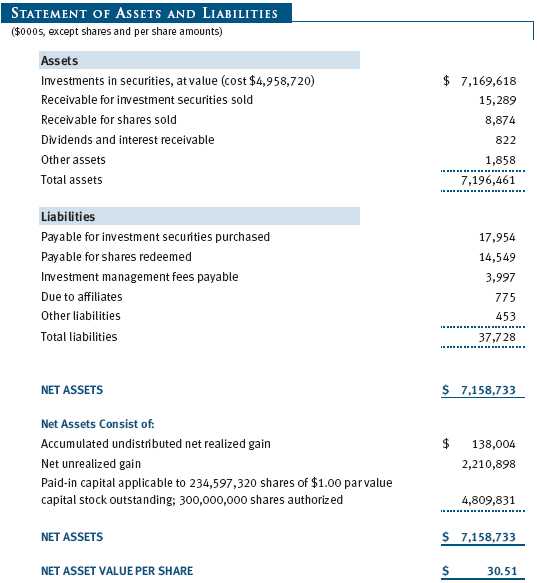
At December 31, 2007, the cost of investments for federal income tax purposes was $4,958,720,000.
NOTE 4 - ACQUISITION
On June 19, 2006, the fund acquired substantially all of the assets of the Preferred Small-Cap Growth Fund (the acquired fund), pursuant to the Agreement and Plan of Reorganization dated February 15, 2006, and approved by shareholders of the acquired fund on June 9, 2006. The acquisition was accomplished by a tax-free exchange of 882,932 shares of the fund (with a value of $27,936,000) for all 2,907,270 shares of the acquired fund outstanding on June 16, 2006 with the same value. The net assets of the acquired fund at that date included $1,309,000 of unrealized depreciation and $5,526,000 of net realized losses carried forward for tax purposes to offset distributable gains realized by the fund in the future. Net assets of the acquired fund were combined with those of the fund, resulting in aggregate net assets of $6,611,967,000 immediately after the acquisition.
NOTE 5 - RELATED PARTY TRANSACTIONS
The fund is managed by T. Rowe Price Associates, Inc. (the manager or Price Associates), a wholly owned subsidiary of T. Rowe Price Group, Inc. The investment management agreement between the fund and the manager provides for an annual investment management fee, which is computed daily and paid monthly. The fee consists of an individual fund fee, equal to 0.35% of the fund’s average daily net assets, and a group fee. The group fee rate is calculated based on the combined net assets of certain mutual funds sponsored by Price Associates (the group) applied to a graduated fee schedule, with rates ranging from 0.48% for the first $1 billion of assets to 0.285% for assets in excess of $220 billion. The fund’s group fee is determined by applying the group fee rate to the fund’s average daily net assets. At December 31, 2007, the effective annual group fee rate was 0.30%.
In addition, the fund has entered into service agreements with Price Associates and two wholly owned subsidiaries of Price Associates (collectively, Price). Price Associates computes the daily share price and provides certain other administrative services to the fund. T. Rowe Price Services, Inc., provides shareholder and administrative services in its capacity as the fund’s transfer and dividend disbursing agent. T. Rowe Price Retirement Plan Services, Inc., provides subaccounting and recordkeeping services for certain retirement accounts invested in the fund. For the year ended December 31, 2007, expenses incurred pursuant to these service agreements were $124,000 for Price Associates, $2,044,000 for T. Rowe Price Services, Inc., and $4,505,000 for T. Rowe Price Retirement Plan Services, Inc. The total amount payable at period-end pursuant to these service agreements is reflected as Due to Affiliates in the accompanying financial statements.
Additionally, the fund is one of several mutual funds in which certain college savings plans managed by Price Associates may invest. As approved by the fund’s Board of Directors, shareholder servicing costs associated with each college savings plan are borne by the fund in proportion to the average daily value of its shares owned by the college savings plan. For the year ended December 31, 2007, the fund was charged $219,000 for shareholder servicing costs related to the college savings plans, of which $161,000 was for services provided by Price. The amount payable at period-end pursuant to this agreement is reflected as Due to Affiliates in the accompanying financial statements. At December 31, 2007, approximately 2% of the outstanding shares of the fund were held by college savings plans.
The fund is also one of several mutual funds sponsored by Price Associates (underlying Price funds) in which the T. Rowe Price Spectrum Funds (Spectrum Funds) and T. Rowe Price Retirement Funds (Retirement Funds) may invest. Neither the Spectrum Funds nor the Retirement Funds invest in the underlying Price funds for the purpose of exercising management or control. Pursuant to separate special servicing agreements, expenses associated with the operation of the Spectrum and Retirement Funds are borne by each underlying Price fund to the extent of estimated savings to it and in proportion to the average daily value of its shares owned by the Spectrum and Retirement Funds, respectively. Expenses allocated under these agreements are reflected as shareholder servicing expenses in the accompanying financial statements. For the year ended December 31, 2007, the fund was allocated $615,000 of Spectrum Funds’ expenses and $950,000 of Retirement Funds’ expenses. Of these amounts, $1,130,000 related to services provided by Price. The amount payable at period-end pursuant to this agreement is reflected as Due to Affiliates in the accompanying financial statements. At December 31, 2007, approximately 6% of the outstanding shares of the fund were held by the Spectrum Funds and 7% were held by the Retirement Funds.
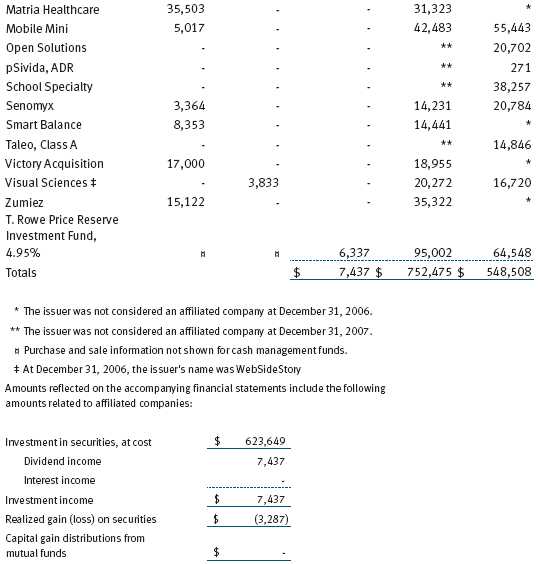
The fund may invest in the T. Rowe Price Reserve Investment Fund and the T. Rowe Price Government Reserve Investment Fund (collectively, the T. Rowe Price Reserve Investment Funds), open-end management investment companies managed by Price Associates and affiliates of the fund. The T. Rowe Price Reserve Investment Funds are offered as cash management options to mutual funds, trusts, and other accounts managed by Price Associates and/or its affiliates, and are not available for direct purchase by members of the public. The T. Rowe Price Reserve Investment Funds pay no investment management fees.
As of December 31, 2007, T. Rowe Price Group, Inc. and/or its wholly owned subsidiaries owned 156,889 shares of the fund, representing less than 1% of the fund’s net assets.
| REPORT OF INDEPENDENT REGISTERED PUBLIC ACCOUNTING FIRM |
To the Board of Directors and Shareholders of T. Rowe Price New Horizons Fund, Inc.
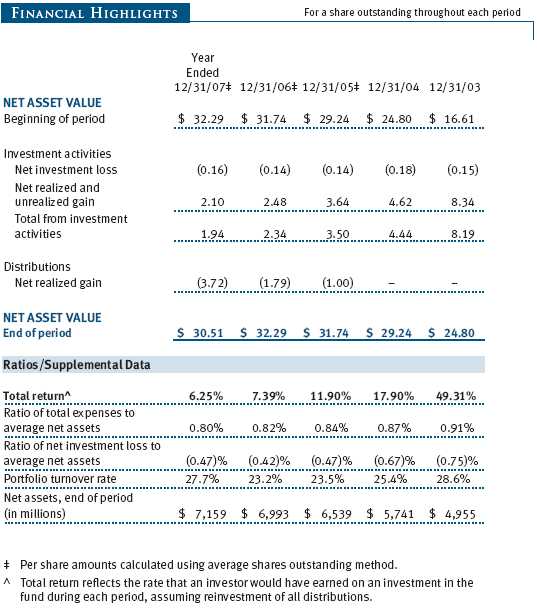
In our opinion, the accompanying statement of assets and liabilities, including the portfolio of investments, and the related statements of operations and of changes in net assets and the financial highlights present fairly, in all material respects, the financial position of T. Rowe Price New Horizons Fund, Inc. (the “Fund”) at December 31, 2007, the results of its operations for the year then ended, the changes in its net assets for each of the two years in the period then ended and the financial highlights for each of the five years in the period then ended, in conformity with accounting principles generally accepted in the United States of America. These financial statements and financial highlights (hereafter referred to as “financial statements”) are the responsibility of the Fund’s management; our responsibility is to express an opinion on these financial statements based on our audits. We conducted our audits of these financial statements in accordance with the auditing standards of the Public Company Accounting Oversight Board (United States). Those standards require that we plan and perform the audit to obtain reasonable assurance about whether the financial statements are free of material misstatement. An audit includes examining, on a test basis, evidence supporting the amounts and disclosures in the financial statements, assessing the accounting principles used and significant estimates made by management, and evaluating the overall financial statement presentation. We believe that our audits, which included confirmation of securities at December 31, 2007 by correspondence with the custodian and by agreement to the underlying ownership records for T. Rowe Price Reserve Investment Fund, provide a reasonable basis for our opinion.
PricewaterhouseCoopers LLP
Baltimore, Maryland
February 12, 2008
| TAX INFORMATION (UNAUDITED) FOR THE TAX YEAR ENDED 12/31/07 |
We are providing this information as required by the Internal Revenue Code. The amounts shown may differ from those elsewhere in this report because of differences between tax and financial reporting requirements.
The fund’s distributions to shareholders included:
• $48,583,000 from short-term capital gains,
• $792,371,000 from long-term capital gains, subject to the 15% rate gains category
For taxable non-corporate shareholders, $18,121,000 of the fund’s income represents qualified dividend income subject to the 15% rate category.
For corporate shareholders, $17,783,000 of the fund’s income qualifies for the dividends-received deduction.
| INFORMATION ON PROXY VOTING POLICIES, PROCEDURES, AND RECORDS |
A description of the policies and procedures used by T. Rowe Price funds and portfolios to determine how to vote proxies relating to portfolio securities is available in each fund’s Statement of Additional Information, which you may request by calling 1-800-225-5132 or by accessing the SEC’s Web site, www.sec.gov. The description of our proxy voting policies and procedures is also available on our Web site, www.troweprice.com. To access it, click on the words “Company Info” at the top of our homepage for individual investors. Then, in the window that appears, click on the “Proxy Voting Policy” navigation button in the top left corner.
Each fund’s most recent annual proxy voting record is available on our Web site and through the SEC’s Web site. To access it through our Web site, follow the directions above, then click on the words “Proxy Voting Record” at the bottom of the Proxy Voting Policy page.
| HOW TO OBTAIN QUARTERLY PORTFOLIO HOLDINGS |
The fund files a complete schedule of portfolio holdings with the Securities and Exchange Commission for the first and third quarters of each fiscal year on Form N-Q. The fund’s Form N-Q is available electronically on the SEC’s Web site (www.sec.gov); hard copies may be reviewed and copied at the SEC’s Public Reference Room, 450 Fifth St. N.W., Washington, DC 20549. For more information on the Public Reference Room, call 1-800-SEC-0330.
| ABOUT THE FUND’S DIRECTORS AND OFFICERS |
Your fund is governed by a Board of Directors (Board) that meets regularly to review a wide variety of matters affecting the fund, including performance, investment programs, compliance matters, advisory fees and expenses, service providers, and other business affairs. The Board elects the fund’s officers, who are listed in the final table. At least 75% of Board members are independent of T. Rowe Price Associates, Inc. (T. Rowe Price), and T. Rowe Price International, Inc. (T. Rowe Price International); “inside” or “interested” directors are employees or officers of T. Rowe Price. The business address of each director and officer is 100 East Pratt Street, Baltimore, Maryland 21202. The Statement of Additional Information includes additional information about the directors and is available without charge by calling a T. Rowe Price representative at 1-800-225-5132.
| Independent Directors | |
| |
| Name | |
| (Year of Birth) | Principal Occupation(s) During Past 5 Years and Directorships of |
| Year Elected* | Other Public Companies |
| |
| Jeremiah E. Casey | Director, National Life Insurance (2001 to 2005); Director, The Rouse |
| (1940) | Company, real estate developers (1990 to 2004); Director, Allfirst |
| 2005 | Financial Inc. (previously First Maryland Bancorp) (1983 to 2002) |
| |
| Anthony W. Deering | Chairman, Exeter Capital, LLC, a private investment firm (2004 to pres- |
| (1945) | ent); Director, Vornado Real Estate Investment Trust (3/04 to present); |
| 2001 | Member, Advisory Board, Deutsche Bank North America (2004 to pres- |
| | ent); Director, Chairman of the Board, and Chief Executive Officer, The |
| | Rouse Company, real estate developers (1997 to 2004) |
| |
| Donald W. Dick, Jr. | Principal, EuroCapital Advisors, LLC, an acquisition and management |
| (1943) | advisory firm; Chairman, The Haven Group, a custom manufacturer of |
| 1994 | modular homes (1/04 to present) |
| |
| David K. Fagin | Chairman and President, Nye Corporation (6/88 to present); Chairman, |
| (1938) | Canyon Resources Corp. (8/07 to present); Director, Golden Star |
| 1998 | Resources Ltd. (5/92 to present); Director, Pacific Rim Mining Corp. |
| | (2/02 to present) |
| |
| Karen N. Horn | Director, Federal National Mortgage Association (9/06 to present); |
| (1943) | Managing Director and President, Global Private Client Services, |
| 2003 | Marsh Inc. (1999 to 2003); Director, Georgia Pacific (5/04 to 12/05), |
| | Eli Lilly and Company, and Simon Property Group |
| |
| Theo C. Rodgers | President, A&R Development Corporation (1977 to present) |
| (1941) | |
| 2005 | |
| John G. Schreiber | Owner/President, Centaur Capital Partners, Inc., a real estate invest- |
| (1946) | ment company; Partner, Blackstone Real Estate Advisors, L.P. |
| 2001 | |
| |
| *Each independent director oversees 121 T. Rowe Price portfolios and serves until retirement, resignation, or |
| election of a successor. | |
| Inside Directors | |
| |
| Name | |
| (Year of Birth) | |
| Year Elected* | |
| [Number of T. Rowe Price | Principal Occupation(s) During Past 5 Years and Directorships of |
| Portfolios Overseen] | Other Public Companies |
| |
| Edward C. Bernard | Director and Vice President, T. Rowe Price; Vice Chairman of the Board, |
| (1956) | Director, and Vice President, T. Rowe Price Group, Inc.; Chairman of the |
| 2006 | Board, Director, and President, T. Rowe Price Investment Services, Inc.; |
| [121] | Chairman of the Board and Director, T. Rowe Price Global Asset |
| | Management Limited, T. Rowe Price Global Investment Services Limited, |
| | T. Rowe Price Retirement Plan Services, Inc., T. Rowe Price Savings |
| | Bank, and T. Rowe Price Services, Inc.; Director, T. Rowe Price |
| | International, Inc.; Chief Executive Officer, Chairman of the Board, |
| | Director, and President, T. Rowe Price Trust Company; Chairman of |
| | the Board, all funds |
| |
| John H. Laporte, CFA | Vice President, T. Rowe Price, T. Rowe Price Group, Inc., and T. Rowe |
| (1945) | Price Trust Company; President, New Horizons Fund |
| 1988 | |
| [16] | |
| |
| *Each inside director serves until retirement, resignation, or election of a successor. |
| Officers | |
| |
| Name (Year of Birth) | |
| Title and Fund(s) Served | Principal Occupation(s) |
| |
| Kennard W. Allen (1977) | Vice President, T. Rowe Price and T. Rowe Price |
| Vice President, New Horizons Fund | Group, Inc. |
| |
| Francisco Alonso (1978) | Vice President, T. Rowe Price and T. Rowe Price |
| Vice President, New Horizons Fund | Group, Inc. |
| |
| P. Robert Bartolo, CPA (1972) | Vice President, T. Rowe Price and T. Rowe Price |
| Vice President, New Horizons Fund | Group, Inc. |
| |
| R. Scott Berg (1972) | Vice President, T. Rowe Price and T. Rowe Price |
| Vice President, New Horizons Fund | Group, Inc. |
| |
| Brian W.H. Berghuis, CFA (1958) | Vice President, T. Rowe Price and T. Rowe Price |
| Vice President, New Horizons Fund | Group, Inc. |
| |
| G. Mark Bussard (1972) | Vice President, T. Rowe Price; formerly |
| Vice President, New Horizons Fund | Cofounder and Chief Operating Officer, Rivanna |
| | Pharmaceuticals (to 2006); student, Darden |
| | Graduate School of Business and University |
| | of Virginia (to 2004); Research Assistant |
| | Professor, University of Virginia (to 2002) |
| |
| Christopher W. Carlson (1967) | Vice President, T. Rowe Price and T. Rowe Price |
| Vice President, New Horizons Fund | Group, Inc. |
| |
| Joseph A. Carrier, CPA (1960) | Vice President, T. Rowe Price, T. Rowe Price |
| Treasurer, New Horizons Fund | Group, Inc., T. Rowe Price Investment Services, |
| | Inc., and T. Rowe Price Trust Company |
| |
| Hugh M. Evans III, CFA (1966) | Vice President, T. Rowe Price and T. Rowe Price |
| Vice President, New Horizons Fund | Group, Inc. |
| |
| Joseph B. Fath, CPA (1971) | Vice President, T. Rowe Price and T. Rowe Price |
| Vice President, New Horizons Fund | Group, Inc. |
| |
| Roger L. Fiery III, CPA (1959) | Vice President, T. Rowe Price, T. Rowe Price |
| Vice President, New Horizons Fund | Group, Inc., T. Rowe Price International, Inc., |
| | and T. Rowe Price Trust Company |
| |
| John R. Gilner (1961) | Chief Compliance Officer and Vice President, |
| Chief Compliance Officer, New Horizons Fund | T. Rowe Price; Vice President, T. Rowe Price |
| | Group, Inc., and T. Rowe Price Investment |
| | Services, Inc. |
| Gregory S. Golczewski (1966) | Vice President, T. Rowe Price and T. Rowe Price |
| Vice President, New Horizons Fund | Trust Company |
| |
| Francies W. Hawks (1944) | Assistant Vice President, T. Rowe Price |
| Assistant Vice President, New Horizons Fund | |
| |
| Henry H. Hopkins (1942) | Director and Vice President, T. Rowe Price |
| Vice President, New Horizons Fund | Investment Services, Inc., T. Rowe Price Services, |
| | Inc., and T. Rowe Price Trust Company; Vice |
| | President, T. Rowe Price, T. Rowe Price Group, |
| | Inc., T. Rowe Price International, Inc., and |
| | T. Rowe Price Retirement Plan Services, Inc. |
| |
| Kris H. Jenner, M.D., D. Phil. (1962) | Vice President, T. Rowe Price and T. Rowe Price |
| Vice President, New Horizons Fund | Group, Inc. |
| |
| Patricia B. Lippert (1953) | Assistant Vice President, T. Rowe Price and |
| Secretary, New Horizons Fund | T. Rowe Price Investment Services, Inc. |
| |
| Jay S. Markowitz, M.D. (1962) | Vice President, T. Rowe Price and T. Rowe Price |
| Vice President, New Horizons Fund | Group, Inc. |
| |
| Jason Nogueira, CFA (1974) | Vice President, T. Rowe Price and T. Rowe Price |
| Vice President, New Horizons Fund | Group, Inc.; formerly Healthcare Equity Analyst, |
| | Putnam Investments (to 2004); student, |
| | Harvard Business School (to 2003) |
| |
| Timothy E. Parker (1974) | Vice President, T. Rowe Price and T. Rowe Price |
| Vice President, New Horizons Fund | Group, Inc. |
| |
| Jeffrey Rottinghaus, CPA (1970) | Vice President, T. Rowe Price and T. Rowe Price |
| Vice President, New Horizons Fund | Group, Inc. |
| |
| Michael F. Sola, CFA (1969) | Vice President, T. Rowe Price and T. Rowe Price |
| Vice President, New Horizons Fund | Group, Inc. |
| |
| Taymour R. Tamaddon (1976) | Vice President, T. Rowe Price and T. Rowe Price |
| Vice President, New Horizons Fund | Group, Inc.; formerly intern, T. Rowe Price (to |
| | 2004) |
| |
| Julie L. Waples (1970) | Vice President, T. Rowe Price |
| Vice President, New Horizons Fund | |
| |
| Wenhua Zhang, CFA, CPA (1970) | Vice President, T. Rowe Price and T. Rowe Price |
| Vice President, New Horizons Fund | Group, Inc. |
| |
| Unless otherwise noted, officers have been employees of T. Rowe Price or T. Rowe Price International for at least |
| five years. | |
Item 2. Code of Ethics.
The registrant has adopted a code of ethics, as defined in Item 2 of Form N-CSR, applicable to its principal executive officer, principal financial officer, principal accounting officer or controller, or persons performing similar functions. A copy of this code of ethics is filed as an exhibit to this Form N-CSR. No substantive amendments were approved or waivers were granted to this code of ethics during the period covered by this report.
Item 3. Audit Committee Financial Expert.
The registrant’s Board of Directors/Trustees has determined that Ms. Karen N. Horn qualifies as an audit committee financial expert, as defined in Item 3 of Form N-CSR. Ms. Horn is considered independent for purposes of Item 3 of Form N-CSR.
Item 4. Principal Accountant Fees and Services.
(a) – (d) Aggregate fees billed to the registrant for the last two fiscal years for professional services rendered by the registrant’s principal accountant were as follows:
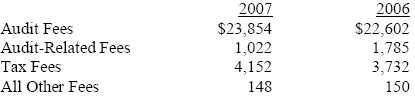
Audit fees include amounts related to the audit of the registrant’s annual financial statements and services normally provided by the accountant in connection with statutory and regulatory filings. Audit-related fees include amounts reasonably related to the performance of the audit of the registrant’s financial statements and specifically include the issuance of a report on internal controls and, if applicable, agreed-upon procedures related to fund acquisitions. Tax fees include amounts related to services for tax compliance, tax planning, and tax advice. The nature of these services specifically includes the review of distribution calculations and the preparation of Federal, state, and excise tax returns. All other fees include the registrant’s pro-rata share of amounts for agreed-upon procedures in conjunction with service contract approvals by the registrant’s Board of Directors/Trustees.
(e)(1) The registrant’s audit committee has adopted a policy whereby audit and non-audit services performed by the registrant’s principal accountant for the registrant, its investment adviser, and any entity controlling, controlled by, or under common control with the investment adviser that provides ongoing services to the registrant require pre-approval in advance at regularly scheduled audit committee meetings. If such a service is required between regularly scheduled audit committee meetings, pre-approval may be authorized by one audit committee member with ratification at the next scheduled audit committee meeting. Waiver of pre-approval for audit or non-audit services requiring fees of a de minimis amount is not permitted.
(2) No services included in (b) – (d) above were approved pursuant to paragraph (c)(7)(i)(C) of Rule 2-01 of Regulation S-X.
(f) Less than 50 percent of the hours expended on the principal accountant’s engagement to audit the registrant’s financial statements for the most recent fiscal year were attributed to work performed by persons other than the principal accountant’s full-time, permanent employees.
(g) The aggregate fees billed for the most recent fiscal year and the preceding fiscal year by the registrant’s principal accountant for non-audit services rendered to the registrant, its investment adviser, and any entity controlling, controlled by, or under common control with the investment adviser that provides ongoing services to the registrant were $1,486,000 and $1,401,000, respectively, and were less than the aggregate fees billed for those same periods by the registrant’s principal accountant for audit services rendered to the T. Rowe Price Funds.
(h) All non-audit services rendered in (g) above were pre-approved by the registrant’s audit committee. Accordingly, these services were considered by the registrant’s audit committee in maintaining the principal accountant’s independence.
Item 5. Audit Committee of Listed Registrants.
Not applicable.
Item 6. Schedule of Investments.
Not applicable. The complete schedule of investments is included in Item 1 of this Form N-CSR.
Item 7. Disclosure of Proxy Voting Policies and Procedures for Closed-End Management Investment Companies.
Not applicable.
Item 8. Portfolio Managers of Closed-End Management Investment Companies.
Not applicable.
Item 9. Purchases of Equity Securities by Closed-End Management Investment Company and Affiliated Purchasers.
Not applicable.
Item 10. Submission of Matters to a Vote of Security Holders.
Not applicable.
Item 11. Controls and Procedures.
(a) The registrant’s principal executive officer and principal financial officer have evaluated the registrant’s disclosure controls and procedures within 90 days of this filing and have concluded that the registrant’s disclosure controls and procedures were effective, as of that date, in ensuring that information required to be disclosed by the registrant in this Form N-CSR was recorded, processed, summarized, and reported timely.
(b) The registrant’s principal executive officer and principal financial officer are aware of no change in the registrant’s internal control over financial reporting that occurred during the registrant’s second fiscal quarter covered by this report that has materially affected, or is reasonably likely to materially affect, the registrant’s internal control over financial reporting.
Item 12. Exhibits.
(a)(1) The registrant’s code of ethics pursuant to Item 2 of Form N-CSR is attached.
(2) Separate certifications by the registrant's principal executive officer and principal financial officer, pursuant to Section 302 of the Sarbanes-Oxley Act of 2002 and required by Rule 30a-2(a) under the Investment Company Act of 1940, are attached.
(3) Written solicitation to repurchase securities issued by closed-end companies: not applicable.
(b) A certification by the registrant's principal executive officer and principal financial officer, pursuant to Section 906 of the Sarbanes-Oxley Act of 2002 and required by Rule 30a-2(b) under the Investment Company Act of 1940, is attached.
| | |
SIGNATURES |
| |
| | Pursuant to the requirements of the Securities Exchange Act of 1934 and the Investment |
| Company Act of 1940, the registrant has duly caused this report to be signed on its behalf by the |
| undersigned, thereunto duly authorized. |
| |
| T. Rowe Price New Horizons Fund, Inc. |
| |
| |
| By | /s/ Edward C. Bernard |
| | Edward C. Bernard |
| | Principal Executive Officer |
| |
| Date | February 19, 2008 |
| |
| |
| |
| | Pursuant to the requirements of the Securities Exchange Act of 1934 and the Investment |
| Company Act of 1940, this report has been signed below by the following persons on behalf of |
| the registrant and in the capacities and on the dates indicated. |
| |
| |
| By | /s/ Edward C. Bernard |
| | Edward C. Bernard |
| | Principal Executive Officer |
| |
| Date | February 19, 2008 |
| |
| |
| |
| By | /s/ Joseph A. Carrier |
| | Joseph A. Carrier |
| | Principal Financial Officer |
| |
| Date | February 19, 2008 |