| UNITED STATES |
| SECURITIES AND EXCHANGE COMMISSION |
| Washington, D.C. 20549 |
| |
FORM N-CSR |
| |
CERTIFIED SHAREHOLDER REPORT OF REGISTERED |
MANAGEMENT INVESTMENT COMPANIES |
| |
| |
| |
| Investment Company Act File Number: 811-958 |
|
| |
| T. Rowe Price New Horizons Fund, Inc. |
|
| (Exact name of registrant as specified in charter) |
| |
| 100 East Pratt Street, Baltimore, MD 21202 |
|
| (Address of principal executive offices) |
| |
| David Oestreicher |
| 100 East Pratt Street, Baltimore, MD 21202 |
|
| (Name and address of agent for service) |
| |
| |
| Registrant’s telephone number, including area code: (410) 345-2000 |
| |
| |
| Date of fiscal year end: December 31 |
| |
| |
| Date of reporting period: June 30, 2011 |
Item 1: Report to Shareholders| New Horizons Fund | June 30, 2011 |

The views and opinions in this report were current as of June 30, 2011. They are not guarantees of performance or investment results and should not be taken as investment advice. Investment decisions reflect a variety of factors, and the managers reserve the right to change their views about individual stocks, sectors, and the markets at any time. As a result, the views expressed should not be relied upon as a forecast of the fund’s future investment intent. The report is certified under the Sarbanes-Oxley Act, which requires mutual funds and other public companies to affirm that, to the best of their knowledge, the information in their financial reports is fairly and accurately stated in all material respects.
REPORTS ON THE WEB
Sign up for our E-mail Program, and you can begin to receive updated fund reports and prospectuses online rather than through the mail. Log in to your account at troweprice.com for more information.
Manager’s Letter
Fellow Shareholders
Healthy earnings, fortified balance sheets, and renewed merger activity helped U.S. equities rally in the first half of 2011. Manufacturing continued to point to a broad economic recovery, and private sector job growth, though disappointing late in the period, accelerated. The Federal Reserve’s continued easy monetary policy also prompted investors to seek higher returns in stocks. The economy hit a soft patch in the spring due to weaker consumer demand and further erosion in the housing market. Despite these pressures, small-cap growth stocks benefited from an improving economy, and your fund posted a solid gain.
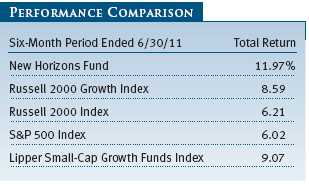
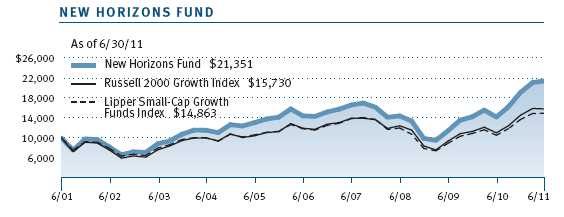
As shown in the accompanying Performance Comparison table, the New Horizons Fund returned 11.97% for the six months ended June 30, 2011, outpacing the small-cap Russell 2000 Index and the more relevant Russell 2000 Growth Index. In the first half of our fiscal year, small-cap indices generated better returns than large-caps but trailed mid-cap shares. Small-cap growth stocks posted larger gains than small-cap value stocks. During the last six months, the New Horizons Fund outpaced its peer group of similarly managed funds, the Lipper Small-Cap Growth Funds Index. The fund’s long-term relative performance also continued to be strong. Lipper ranked the New Horizons Fund 73 of 505, 33 of 451, 46 of 393, and 18 of 246 small-cap growth funds for the 1-, 3-, 5-, and 10-year periods ended June 30, 2011. (Results will vary for other time periods. Past performance cannot guarantee future results).
We are gratified by our solid performance in the last six months and believe it demonstrates that our investment approach continues to perform well. We would like to reiterate that the fund invests in three major groups of small-cap growth companies—potential long-term winners, durable niche growth companies, and out-of-favor durable brand companies.

Since the last reporting period, we have added corporate technology as an area of innovation focus for the fund while scaling back our concentration on alternative energy. This reflects our view that the rapid expansion of mobile computing from the consumer to the enterprise domain is a trend that offers greater opportunities. We continue to seek growth opportunities in the alternative energy industry but believe it could be hampered by developed countries’ transition away from producer subsidies. In addition to corporate technology, the fund continues to focus on opportunities in media and technology convergence, health care information technology, genomics, value-added distribution, financial payments technology, and collaborative and aggregate data businesses.
MARKET ENVIRONMENT
U.S. stocks produced solid gains in the first half of 2011 despite mixed economic conditions. Manufacturing showed signs of momentum, and consumer spending inched up as private sector hiring gained traction. Export growth also continued to help the economy recover, aided by a weaker dollar relative to other major currencies. The Federal Reserve’s second round of quantitative easing through the purchase of $600 billion in Treasury securities prompted investors to seek higher returns in stocks. But the economy appeared to hit a soft patch amid higher gas prices set off by unrest in the Middle East and North Africa, and further weakening in the housing market due to rising foreclosures and far more supply than demand. The European sovereign debt crisis and slower growth in emerging markets also contributed to prospects for weaker growth. Gross domestic product growth, which accelerated throughout 2010, began to stumble.
Despite the economic soft patch, corporations appeared to be on more solid ground as companies used technological advances to produce more goods with fewer workers. Corporate balance sheets and profits also continued to improve, mergers and acquisitions (M&A) picked up, and the pipeline of initial public offerings grew. Indeed, business capital spending has been rising and exports are growing, an environment that suggests that the economic recovery remains intact.
PORTFOLIO REVIEW
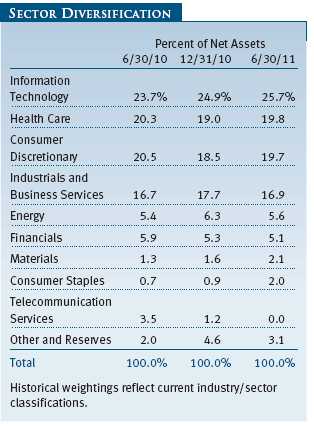
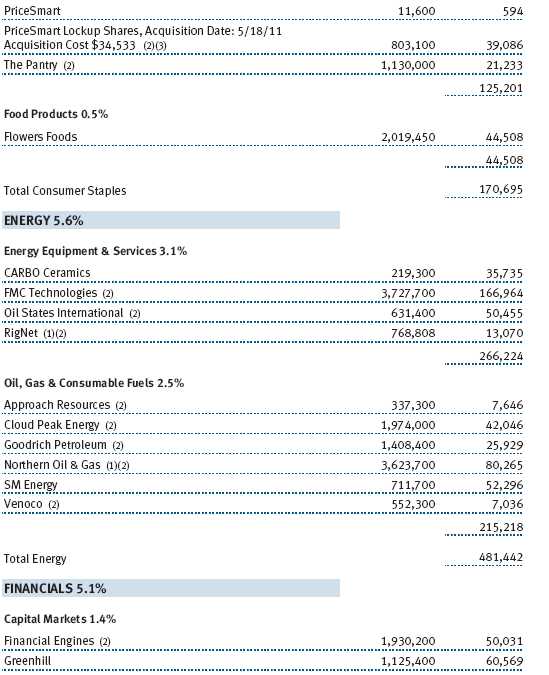
In the last six months, our health care and information technology holdings generated strong gains due to the performance of many biotechnology and software industry innovators. We see many exciting technology-related developments across these two sectors that are engaged in driving business efficiencies, better medical outcomes, and health care delivery improvements. Our financials weighed on performance due to regulatory concerns and the sluggish capital markets environment. The energy sector slid in May and June on weakness in the oil, gas, and consumable fuels industry.
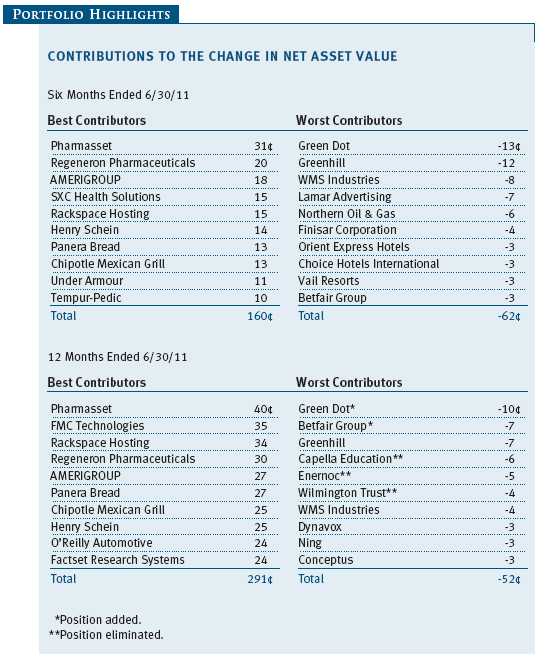
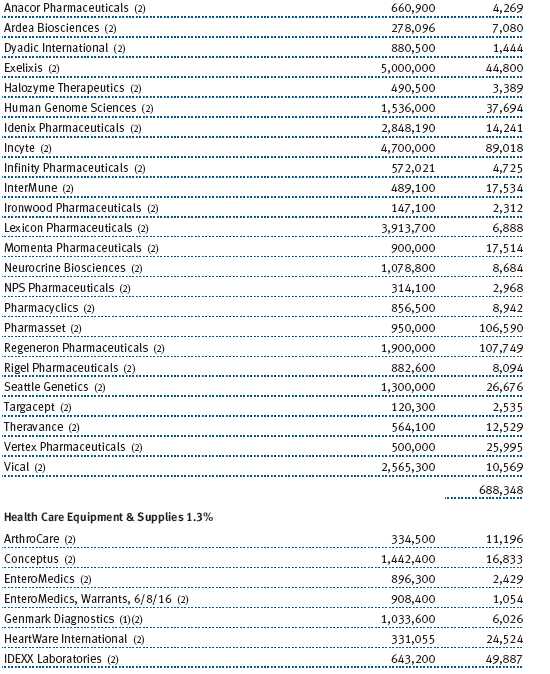
Biotechnology holdings such as Pharmasset, Regeneron Pharmaceuticals, and Vertex Pharmaceuticals generated strong results. Pharmasset and Vertex benefited from favorable news in hepatitis C drug development programs. Early prescription data show that the Vertex drug—Incivek—has taken significant share in its first month in this potentially multibillion dollar market. Regeneron develops drugs for cancer, macular degeneration, and auto-inflammatory diseases. We believe the company has a strong pipeline of drugs in development and solid partnerships with large-cap pharmaceutical companies. Shares have been buoyed by favorable phase 3 data for the company’s drug to treat age-related macular degeneration (AMD), a disease associated with aging that gradually destroys central vision. Other innovators in this space that performed well include Alexion Pharmaceuticals and Incyte. Alexion’s therapies for a rare genetic acquired disease may prove helpful in other disorders, while Incyte is preparing to launch its first Food and Drug Administration-approved drug to treat myelofibrosis, a disorder of the bone marrow. (Please refer to the portfolio of investments for a complete list of holdings and the amount each represents in the portfolio.)
Information technology shares performed well, and we continue to see tantalizing opportunities in software, technology services, and Internet software and services. Global consulting firm Sapient advanced on strong earnings results due to increased demand and pricing improvements. We believe Sapient’s unique combination of digital market and technology consulting will position it well for the continuing shift to online marketing. Solera is a leading global provider of automobile claims processing software and services. The company leverages a proprietary database localized for multiple regions. It integrates data into client workflows and has increased its scope through opportunistic acquisitions. Shares gained due largely to continued strong operating performance. QLIK Technologies provides business intelligence software. Its intuitive interface combined with powerful in-memory technology enables real-time analysis to be performed outside the company’s core information technology function. Shares advanced as the recent public offering continued to demonstrate strong product adoption.
In the consumer discretionary sector, Under Armour advanced on strong quarterly results. This founder-led business continues to leverage its brand value and drive further adoption of its products via both the domestic wholesale and retail channels. In addition, the consumer reception of its recent product line—Charged Cotton®—has been strong. The continued popularity of casual restaurants also benefited fund performance. Chipotle Mexican Grill and Panera Bread benefited from their strong consumer value proposition and efficient operations, which help them to generate high returns that allow them to open units and fund development of new products and concepts.
The industrials and business services sector was a source of strength and features a number of durable-growth companies. Clean Harbors fills this bill. It is a leading operator of hazardous waste services, including incineration, disposal, and on-site clean-up services. The company has a dominant position in this specialty waste market because it controls a majority of the noncaptive incineration capacity in North America. Advisory Board provides research and analysis, business intelligence, and software tools to the health care and education industries. The firm has strong contract value growth and high client retention. Hexcel provides carbon fiber composite materials to the aerospace, defense, industrial, and wind industries. The company’s solid earnings results were driven by strong growth in the commercial aerospace division, particularly sales from new platforms and to regional and business jets.
Despite the generally upbeat market environment, a few of our holdings struggled. Northern Oil & Gas, which we added in 2010, faltered amid concerns about commodity volatility and weaker-than-expected production growth given difficult weather conditions in the Dakotas and eastern Montana.
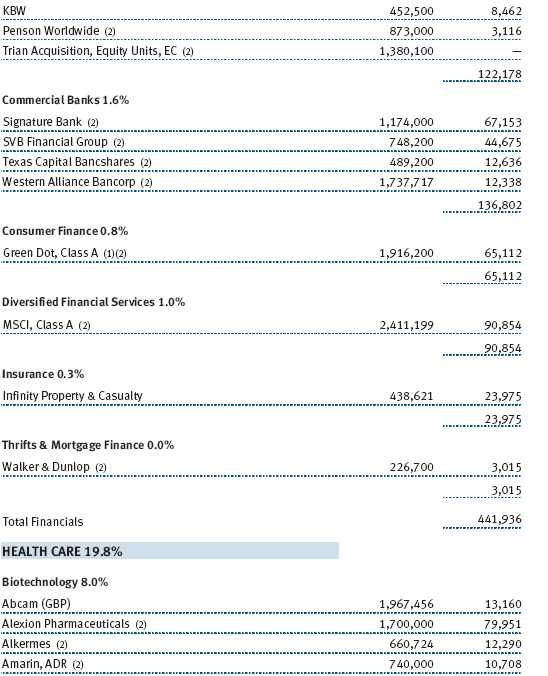
Several financials positions fell amid the sluggish credit environment and uncertainty about the outcome of the final rule-writing and implementation of the Dodd-Frank financial services reform law. Green Dot is the leading provider of reloadable prepaid credit cards. It targets the 60 million adults (25% of U.S. households) considered underserved. Its product provides an alternative for cash or debit card transactions for individuals lacking a banking relationship. We believe the company has a scalable model and, given its large distribution network, is positioned to take advantage of a significant market opportunity. Market share and productivity concerns also weighted on Greenhill, a boutique investment bank focusing on providing financial advice on M&A. The company has high margins, low capital intensity, and a unique performance-driven culture that places it in a position to take market share over the long term. We continue to monitor our investment thesis in these holdings, as with all of our holdings.
STRATEGY REVIEW
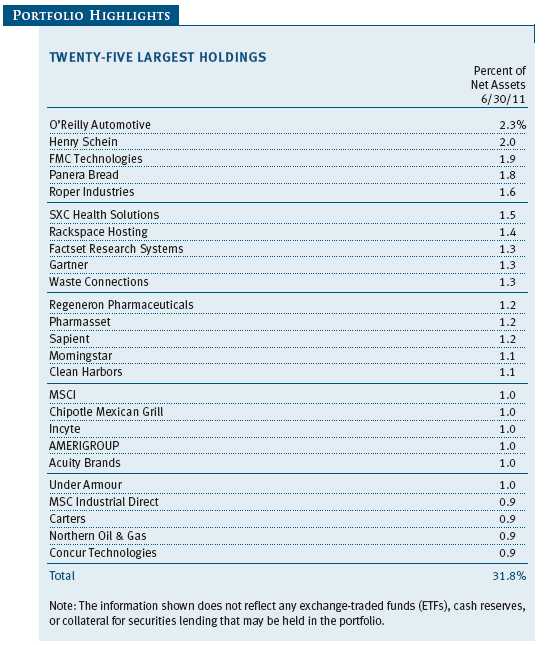
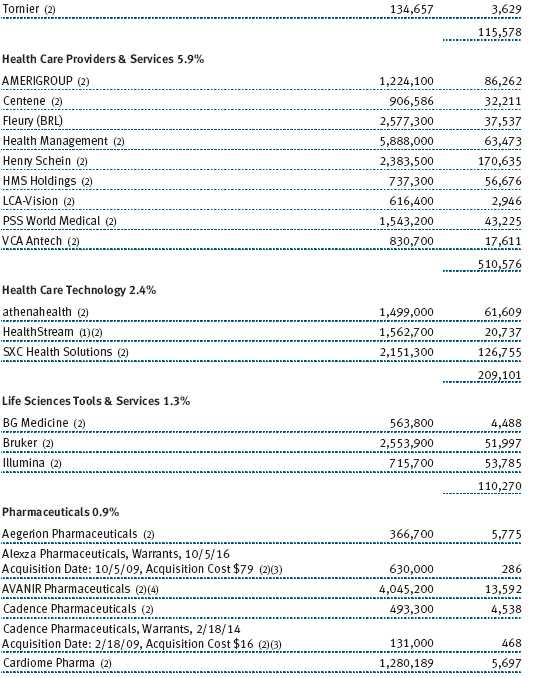
As many of our long-term shareholders know, the mission of our small-cap growth strategy is to buy small companies that can become larger over time and compound returns. Letting our best performers run has been a vitally important contributor to our success. Indeed, much of the fund’s outperformance versus the Russell 2000 Growth Index has come from investing in leading companies that we have allowed to compound significant wealth over time. We feel that selling these strong performers at an arbitrary market capitalization cutoff would have been detrimental to returns. Our experience shows that holding unique franchises while they are growing and dynamic adds value. Further, we believe that prematurely replacing many of these franchise companies would lead to substituting them with inferior companies and result in a shift away from a proven approach that has worked so well. Nonetheless, we trim the size of holdings periodically to ensure that another pillar of our strategy—diversification—is fulfilled. We have occasionally reduced position sizes in longtime holdings Henry Schein and FMC Technologies, among other companies, and will continue to be prudent about position size.
Many of the well-known names of today were early innovators in their respective fields years ago. Consistent with our goal of focusing on innovation, we spend significant time examining the entire ecosystem of industries that can produce value over time. We seek out entrepreneurs, venture capitalists, and innovators to fulfill our mission and best serve shareholders. In that spirit, we occasionally invest in privately held companies that possess an ethos of innovation, strong management teams, and business models that can be executed. We also prefer companies that have the ability to become public companies within 12 to 18 months of our investment. One such holding is Youku.com, an Internet software and services company that successfully went public last December. We held positions in the company before it went public and continue to hold shares. The stock has been well received by the markets for many of the reasons we initially invested in the company—large market opportunity, product leadership position, strong management, and promising financial model. We will keep you apprised of its performance in subsequent shareholder letters.
OUTLOOK
In the long term, we face considerable challenges, including a growing federal deficit and continued consumer retrenchment. We see encouraging signs, however, such as slowly rising employment and improving consumer sentiment. The U.S. economy is expanding, and growth in emerging markets is creating new markets for our global goods and services.
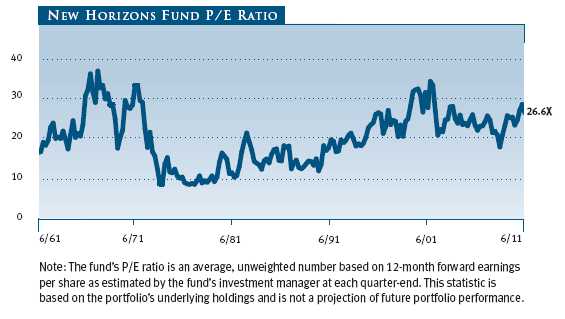

Small-caps have had better earnings growth than large-caps, as domestically focused companies have benefited from the huge fiscal and monetary stimulus following the financial crisis of 2008. However, in the beginning of 2011, small-cap earnings growth, while still solid, trailed larger-cap growth rates. The current economic soft patch could induce a transition in market leadership to large-caps as the U.S. economy slows and the prospect of further stimulus dims. Nonetheless, the New Horizons Fund’s price/earnings (P/E) ratio (stock price compared with per share earnings) stood at 26.6 at the end of June 2011, near its highest levels since the dot-com bubble of the late 1990s. The New Horizons Fund’s P/E ratio relative to the S&P 500 on expected 12-month forward earnings is 2.03, near its highest level in decades. With regard to other metrics, such as price/book and price/cash flow, the ratios are closer to relative highs.
Our team of research analysts is focused less on the macroeconomic picture and more on identifying individual companies that can sustain high long-term earnings and cash flow growth regardless of the economic environment.
Given current small-cap valuations and the number of uncertainties we face, we realize that our margin for error is narrower. Yet, we are confident that T. Rowe Price’s team of research analysts will continue to identify high-quality, well-managed, innovative small-cap companies with strong earnings potential. We also believe our diversified portfolio of high-growth, small-cap companies can deliver attractive returns to shareholders over time.
Respectfully submitted,

Henry Ellenbogen
President of the fund and chairman of its Investment Advisory Committee
July 15, 2011
The committee chairman has day-to-day responsibility for managing the portfolio and works with committee members in developing and executing the fund’s investment program.
RISKS OF STOCK INVESTING
As with all stock and bond mutual funds, each fund’s share price can fall because of weakness in the stock or bond markets, a particular industry, or specific holdings. Stock markets can decline for many reasons, including adverse political or economic developments, changes in investor psychology, or heavy institutional selling. The prospects for an industry or company may deteriorate because of a variety of factors, including disappointing earnings or changes in the competitive environment. In addition, the investment manager’s assessment of companies held in a fund may prove incorrect, resulting in losses or poor performance even in rising markets.
Investing in small companies involves greater risk than is customarily associated with larger companies. Stocks of small companies are subject to more abrupt or erratic price movements than larger-company stocks. Small companies often have limited product lines, markets, or financial resources, and their managements may lack depth and experience. Such companies seldom pay significant dividends that could cushion returns in a falling market.
GLOSSARY
Lipper indexes: Fund benchmarks that consist of a small number (10 to 30) of the largest mutual funds in a particular category as tracked by Lipper Inc.
Price/book ratio: A valuation measure that compares a stock’s market price with its book value, i.e., the company’s net worth divided by the number of outstanding shares.
Price/cash flow ratio: A valuation measure calculated by dividing the price of a stock by its current cash flow per share. This ratio gives investors an idea of the market’s expectation of a firm’s future financial health by removing the effects of depreciation and other non-cash factors.
Price/earnings (P/E) ratio: A valuation measure calculated by dividing the price of a stock by its current or projected earnings per share. This ratio gives investors an idea of how much they are paying for current or future earnings power.
Russell 2000 Index: Consists of the smallest 2,000 companies in the Russell 3000 Index, representing approximately 7% of the Russell 3000’s total market capitalization. Performance is reported on a total return basis.
Russell 2000 Growth Index: Market-weighted total return index that measures the performance of companies within the Russell 2000 Index having higher price/book value ratios and higher forecasted growth rates.
Russell 2000 Value Index: Market-weighted total return index that measures the performance of companies within the Russell 2000 Index having lower price/book value ratios and lower forecasted growth rates.
S&P 500 Index: An unmanaged index that tracks the stocks of 500 primarily large-cap U.S. companies.
Performance and Expenses
This chart shows the value of a hypothetical $10,000 investment in the fund over the past 10 fiscal year periods or since inception (for funds lacking 10-year records). The result is compared with benchmarks, which may include a broad-based market index and a peer group average or index. Market indexes do not include expenses, which are deducted from fund returns as well as mutual fund averages and indexes.

As a mutual fund shareholder, you may incur two types of costs: (1) transaction costs, such as redemption fees or sales loads, and (2) ongoing costs, including management fees, distribution and service (12b-1) fees, and other fund expenses. The following example is intended to help you understand your ongoing costs (in dollars) of investing in the fund and to compare these costs with the ongoing costs of investing in other mutual funds. The example is based on an investment of $1,000 invested at the beginning of the most recent six-month period and held for the entire period.
Actual Expenses
The first line of the following table (“Actual”) provides information about actual account values and expenses based on the fund’s actual returns. You may use the information on this line, together with your account balance, to estimate the expenses that you paid over the period. Simply divide your account value by $1,000 (for example, an $8,600 account value divided by $1,000 = 8.6), then multiply the result by the number on the first line under the heading “Expenses Paid During Period” to estimate the expenses you paid on your account during this period.
Hypothetical Example for Comparison Purposes
The information on the second line of the table (“Hypothetical”) is based on hypothetical account values and expenses derived from the fund’s actual expense ratio and an assumed 5% per year rate of return before expenses (not the fund’s actual return). You may compare the ongoing costs of investing in the fund with other funds by contrasting this 5% hypothetical example and the 5% hypothetical examples that appear in the shareholder reports of the other funds. The hypothetical account values and expenses may not be used to estimate the actual ending account balance or expenses you paid for the period.
Note: T. Rowe Price charges an annual account service fee of $20, generally for accounts with less than $10,000 ($1,000 for UGMA/UTMA). The fee is waived for any investor whose T. Rowe Price mutual fund accounts total $50,000 or more; accounts employing automatic investing; accounts electing to receive electronic delivery of account statements, transaction confirmations, and prospectuses and shareholder reports; accounts of an investor who is a T. Rowe Price Preferred Services, Personal Services, or Enhanced Personal Services client (enrollment in these programs generally requires T. Rowe Price assets of at least $100,000); and IRAs and other retirement plan accounts that utilize a prototype plan sponsored by T. Rowe Price (although a separate custodial or administrative fee may apply to such accounts). This fee is not included in the accompanying table. If you are subject to the fee, keep it in mind when you are estimating the ongoing expenses of investing in the fund and when comparing the expenses of this fund with other funds.
You should also be aware that the expenses shown in the table highlight only your ongoing costs and do not reflect any transaction costs, such as redemption fees or sales loads. Therefore, the second line of the table is useful in comparing ongoing costs only and will not help you determine the relative total costs of owning different funds. To the extent a fund charges transaction costs, however, the total cost of owning that fund is higher.

Unaudited

The accompanying notes are an integral part of these financial statements.
Unaudited


The accompanying notes are an integral part of these financial statements.
Unaudited

The accompanying notes are an integral part of these financial statements.
Unaudited
The accompanying notes are an integral part of these financial statements.
Unaudited
The accompanying notes are an integral part of these financial statements.
Unaudited
| NOTES TO PORTFOLIO OF INVESTMENTS |
T. Rowe Price New Horizons Fund, Inc. (the fund), is registered under the Investment Company Act of 1940 (the 1940 Act) as a diversified, open-end management investment company. The fund commenced operations on June 3, 1960. The fund seeks long-term capital growth by investing primarily in common stocks of small, rapidly growing companies.
NOTE 1 - SIGNIFICANT ACCOUNTING POLICIES
Basis of Preparation The accompanying financial statements were prepared in accordance with accounting principles generally accepted in the United States of America (GAAP), which require the use of estimates made by management. Management believes that estimates and valuations are appropriate; however, actual results may differ from those estimates, and the valuations reflected in the accompanying financial statements may differ from the value ultimately realized upon sale or maturity.
Investment Transactions, Investment Income, and Distributions Income and expenses are recorded on the accrual basis. Premiums and discounts on debt securities are amortized for financial reporting purposes. Dividends received from mutual fund investments are reflected as dividend income; capital gain distributions are reflected as realized gain/loss. Dividend income and capital gain distributions are recorded on the ex-dividend date. Income tax-related interest and penalties, if incurred, would be recorded as income tax expense. Investment transactions are accounted for on the trade date. Realized gains and losses are reported on the identified cost basis. Distributions to shareholders are recorded on the ex-dividend date. Income distributions are declared and paid annually. Capital gain distributions, if any, are generally declared and paid by the fund annually.
Currency Translation Assets, including investments, and liabilities denominated in foreign currencies are translated into U.S. dollar values each day at the prevailing exchange rate, using the mean of the bid and asked prices of such currencies against U.S. dollars as quoted by a major bank. Purchases and sales of securities, income, and expenses are translated into U.S. dollars at the prevailing exchange rate on the date of the transaction. The effect of changes in foreign currency exchange rates on realized and unrealized security gains and losses is reflected as a component of security gains and losses.
Rebates and Credits Subject to best execution, the fund may direct certain security trades to brokers who have agreed to rebate a portion of the related brokerage commission to the fund in cash. Commission rebates are reflected as realized gain on securities in the accompanying financial statements and totaled $111,000 for the six months ended June 30, 2011. Additionally, the fund earns credits on temporarily uninvested cash balances held at the custodian, which reduce the fund’s custody charges. Custody expense in the accompanying financial statements is presented before reduction for credits, which are reflected as expenses paid indirectly.
In-Kind Redemptions In accordance with guidelines described in the fund’s prospectus, the fund may distribute portfolio securities rather than cash as payment for a redemption of fund shares (in-kind redemption). For financial reporting purposes, the fund recognizes a gain on in-kind redemptions to the extent the value of the distributed securities on the date of redemption exceeds the cost of those securities. Gains and losses realized on in-kind redemptions are not recognized for tax purposes and are reclassified from undistributed realized gain (loss) to paid-in capital. During the six months ended June 30, 2011, the fund realized $54,386,000 of net gain on $105,329,000 of in-kind redemptions.
NOTE 2 - VALUATION
The fund’s financial instruments are reported at fair value as defined by GAAP. The fund determines the values of its assets and liabilities and computes its net asset value per share at the close of the New York Stock Exchange (NYSE), normally 4 p.m. ET, each day that the NYSE is open for business.
Valuation Methods Equity securities listed or regularly traded on a securities exchange or in the over-the-counter (OTC) market are valued at the last quoted sale price or, for certain markets, the official closing price at the time the valuations are made, except for OTC Bulletin Board securities, which are valued at the mean of the latest bid and asked prices. A security that is listed or traded on more than one exchange is valued at the quotation on the exchange determined to be the primary market for such security. Listed securities not traded on a particular day are valued at the mean of the latest bid and asked prices for domestic securities and the last quoted sale price for international securities.
Debt securities are generally traded in the OTC market. Securities with remaining maturities of one year or more at the time of acquisition are valued at prices furnished by dealers who make markets in such securities or by an independent pricing service, which considers the yield or price of bonds of comparable quality, coupon, maturity, and type, as well as prices quoted by dealers who make markets in such securities. Securities with remaining maturities of less than one year at the time of acquisition generally use amortized cost in local currency to approximate fair value. However, if amortized cost is deemed not to reflect fair value or the fund holds a significant amount of such securities with remaining maturities of more than 60 days, the securities are valued at prices furnished by dealers who make markets in such securities or by an independent pricing service.
Investments in mutual funds are valued at the mutual fund’s closing net asset value per share on the day of valuation.
Other investments, including restricted securities, and those financial instruments for which the above valuation procedures are inappropriate or are deemed not to reflect fair value are stated at fair value as determined in good faith by the T. Rowe Price Valuation Committee, established by the fund’s Board of Directors.
For valuation purposes, the last quoted prices of non-U.S. equity securities may be adjusted under the circumstances described below. If the fund determines that developments between the close of a foreign market and the close of the NYSE will, in its judgment, materially affect the value of some or all of its portfolio securities, the fund will adjust the previous closing prices to reflect what it believes to be the fair value of the securities as of the close of the NYSE. In deciding whether it is necessary to adjust closing prices to reflect fair value, the fund reviews a variety of factors, including developments in foreign markets, the performance of U.S. securities markets, and the performance of instruments trading in U.S. markets that represent foreign securities and baskets of foreign securities. A fund may also fair value securities in other situations, such as when a particular foreign market is closed but the fund is open. The fund uses outside pricing services to provide it with closing prices and information to evaluate and/or adjust those prices. The fund cannot predict how often it will use closing prices and how often it will determine it necessary to adjust those prices to reflect fair value. As a means of evaluating its security valuation process, the fund routinely compares closing prices, the next day’s opening prices in the same markets, and adjusted prices.
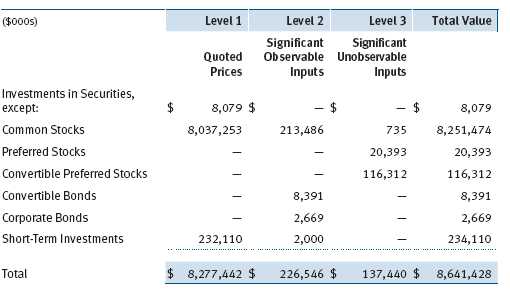
Valuation Inputs Various inputs are used to determine the value of the fund’s financial instruments. These inputs are summarized in the three broad levels listed below:
Level 1 – quoted prices in active markets for identical financial instruments
Level 2 – observable inputs other than Level 1 quoted prices (including, but not limited to, quoted prices for similar financial instruments, interest rates, prepayment speeds, and credit risk)
Level 3 – unobservable inputs
Observable inputs are those based on market data obtained from sources independent of the fund, and unobservable inputs reflect the fund’s own assumptions based on the best information available. The input levels are not necessarily an indication of the risk or liquidity associated with financial instruments at that level. For example, non-U.S. equity securities actively traded in foreign markets generally are reflected in Level 2 despite the availability of closing prices because the fund evaluates and determines whether those closing prices reflect fair value at the close of the NYSE or require adjustment, as described above. The following table summarizes the fund’s financial instruments, based on the inputs used to determine their values on June 30, 2011:
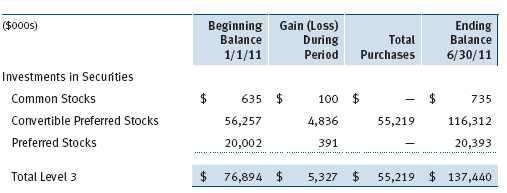
Following is a reconciliation of the fund’s Level 3 holdings for the six months ended June 30, 2011. Gain (loss) reflects both realized and change in unrealized gain (loss) on Level 3 holdings during the period, if any, and is included on the accompanying Statement of Operations. The change in unrealized gain (loss) on Level 3 instruments held at June 30, 2011, totaled $5,327,000 for the six months ended June 30, 2011.
NOTE 3 - DERIVATIVE INSTRUMENTS
During the six months ended June 30, 2011, the fund invested in derivative instruments. As defined by GAAP, a derivative is a financial instrument whose value is derived from an underlying security price, foreign exchange rate, interest rate, index of prices or rates, or other variable; it requires little or no initial investment and permits or requires net settlement. The fund invests in derivatives only if the expected risks and rewards are consistent with its investment objectives, policies, and overall risk profile, as described in its prospectus and Statement of Additional Information. The fund may use derivatives for a variety of purposes, such as seeking to hedge against declines in principal value, increase yield, invest in an asset with greater efficiency and at a lower cost than is possible through direct investment, or to adjust credit exposure. The risks associated with the use of derivatives are different from, and potentially much greater than, the risks associated with investing directly in the instruments on which the derivatives are based. Investments in derivatives can magnify returns positively or negatively; however, the fund at all times maintains sufficient cash reserves, liquid assets, or other SEC-permitted asset types to cover the settlement obligations under its open derivative contracts.
The fund values its derivatives at fair value, as described below and in Note 2, and recognizes changes in fair value currently in its results of operations. Accordingly, the fund does not follow hedge accounting, even for derivatives employed as economic hedges. The fund does not offset the fair value of derivative instruments against the right to reclaim or obligation to return collateral. As of June 30, 2011, the fund held no derivative instruments.
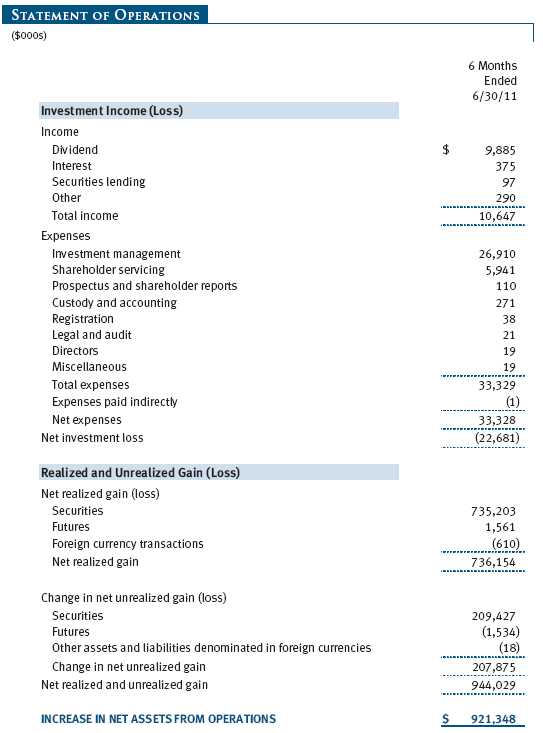
Additionally, during the six months ended June 30, 2011 the fund recognized $1,561,000 of realized gain on Futures and a $1,534,000 change in unrealized loss on Futures related to its investments in equity derivatives; such amounts are included on the accompanying Statement of Operations.
Counterparty risk related to exchange-traded derivatives, including futures and options contracts, is minimal because the exchange’s clearinghouse provides protection against defaults. Additionally, for exchange-traded derivatives, each broker, in its sole discretion, may change margin requirements applicable to the fund.
Futures Contracts The fund is subject to equity price risk in the normal course of pursuing its investment objectives and uses futures contracts to help manage such risk. The fund may enter into futures contracts to manage exposure to interest rates, security prices, foreign currencies, and credit quality; as an efficient means of adjusting exposure to all or part of a target market; to enhance income; as a cash management tool; and/or to adjust credit exposure. A futures contract provides for the future sale by one party and purchase by another of a specified amount of a particular underlying financial instrument at an agreed-upon price, date, time, and place. The fund currently invests only in exchange-traded futures, which generally are standardized as to maturity date, underlying financial instrument, and other contract terms. Upon entering into a futures contract, the fund is required to deposit with the broker cash or securities in an amount equal to a certain percentage of the contract value (initial margin deposit); the margin deposit must then be maintained at the established level over the life of the contract. Subsequent payments are made or received by the fund each day to settle daily fluctuations in the value of the contract (variation margin), which reflect changes in the value of the underlying financial instrument. Variation margin is recorded as unrealized gain or loss until the contract is closed. The value of a futures contract included in net assets is the amount of unsettled variation margin; net variation margin receivable is reflected as an asset, and net variation margin payable is reflected as a liability on the accompanying Statement of Assets and Liabilities. Risks related to the use of futures contracts include possible illiquidity of the futures markets, contract prices that can be highly volatile and imperfectly correlated to movements in hedged security values, and potential losses in excess of the fund’s initial investment. During the six months ended June 30, 2011, the fund’s exposure to futures, based on underlying notional amounts, was generally less than 1% of net assets.
NOTE 4 - OTHER INVESTMENT TRANSACTIONS
Consistent with its investment objective, the fund engages in the following practices to manage exposure to certain risks and/or to enhance performance. The investment objective, policies, program, and risk factors of the fund are described more fully in the fund’s prospectus and Statement of Additional Information.
Restricted Securities The fund may invest in securities that are subject to legal or contractual restrictions on resale. Prompt sale of such securities at an acceptable price may be difficult and may involve substantial delays and additional costs.
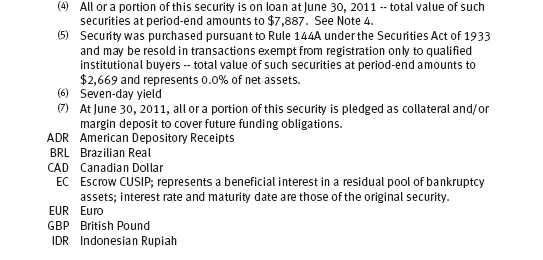
Securities Lending The fund lends its securities to approved brokers to earn additional income. It receives as collateral cash and U.S. government securities valued at 102% to 105% of the value of the securities on loan. Cash collateral is invested by the fund’s lending agent(s) in accordance with investment guidelines approved by management. Although risk is mitigated by the collateral, the fund could experience a delay in recovering its securities and a possible loss of income or value if the borrower fails to return the securities or if collateral investments decline in value. Securities lending revenue recognized by the fund consists of earnings on invested collateral and borrowing fees, net of any rebates to the borrower and compensation to the lending agent. In accordance with GAAP, investments made with cash collateral are reflected in the accompanying financial statements, but collateral received in the form of securities are not. On June 30, 2011, the value of loaned securities was $7,887,000 and cash collateral investments totaled $8,079,000.
American and Global Depository Receipts The fund may invest in American Depository Receipts (ADRs) and/or Global Depository Receipts (GDRs), certificates issued by U.S. and international banks that represent ownership of foreign securities held by the issuing bank. ADRs and GDRs are transferable, trade on established markets, and entitle the holder to all dividends and capital gains paid by the underlying foreign security. Issuing banks generally charge a security administration fee. Such fees are included in custody and accounting expense in the accompanying Statement of Operations and totaled $93,000 for the six months ended June 30, 2011.
Other Purchases and sales of portfolio securities other than short-term securities aggregated $1,919,103,000 and $1,878,948,000, respectively, for the six months ended June 30, 2011.
NOTE 5 - FEDERAL INCOME TAXES
No provision for federal income taxes is required since the fund intends to continue to qualify as a regulated investment company under Subchapter M of the Internal Revenue Code and distribute to shareholders all of its taxable income and gains. Distributions determined in accordance with federal income tax regulations may differ in amount or character from net investment income and realized gains for financial reporting purposes. Financial reporting records are adjusted for permanent book/tax differences to reflect tax character but are not adjusted for temporary differences. The amount and character of tax-basis distributions and composition of net assets are finalized at fiscal year-end; accordingly, tax-basis balances have not been determined as of the date of this report.
In accordance with federal tax regulations, the fund recognized capital losses in the current period for tax purposes that had been recognized in the prior fiscal year for financial reporting purposes. Such deferrals relate to net capital losses realized between November 1, 2010 and December 31, 2010, and totaled $448,000.
At June 30, 2011, the cost of investments for federal income tax purposes was $5,627,532,000. Net unrealized gain aggregated $3,013,897,000 at period-end, of which $3,252,668,000 related to appreciated investments and $238,771,000 related to depreciated investments.
NOTE 6 - RELATED PARTY TRANSACTIONS
The fund is managed by T. Rowe Price Associates, Inc. (Price Associates), a wholly owned subsidiary of T. Rowe Price Group, Inc. (Price Group). The investment management agreement between the fund and Price Associates provides for an annual investment management fee, which is computed daily and paid monthly. The fee consists of an individual fund fee, equal to 0.35% of the fund’s average daily net assets, and a group fee. The group fee rate is calculated based on the combined net assets of certain mutual funds sponsored by Price Associates (the group) applied to a graduated fee schedule, with rates ranging from 0.48% for the first $1 billion of assets to 0.28% for assets in excess of $300 billion. The fund’s group fee is determined by applying the group fee rate to the fund’s average daily net assets. At June 30, 2011, the effective annual group fee rate was 0.30%.
In addition, the fund has entered into service agreements with Price Associates and two wholly owned subsidiaries of Price Associates (collectively, Price). Price Associates computes the daily share price and provides certain other administrative services to the fund. T. Rowe Price Services, Inc., provides shareholder and administrative services in its capacity as the fund’s transfer and dividend disbursing agent. T. Rowe Price Retirement Plan Services, Inc., provides subaccounting and recordkeeping services for certain retirement accounts invested in the fund. For the six months ended June 30, 2011, expenses incurred pursuant to these service agreements were $61,000 for Price Associates; $941,000 for T. Rowe Price Services, Inc.; and $1,824,000 for T. Rowe Price Retirement Plan Services, Inc. The total amount payable at period-end pursuant to these service agreements is reflected as Due to Affiliates in the accompanying financial statements.
Additionally, the fund is one of several mutual funds in which certain college savings plans managed by Price Associates may invest. As approved by the fund’s Board of Directors, shareholder servicing costs associated with each college savings plan are borne by the fund in proportion to the average daily value of its shares owned by the college savings plan. For the six months ended June 30, 2011, the fund was charged $106,000 for shareholder servicing costs related to the college savings plans, of which $72,000 was for services provided by Price. The amount payable at period-end pursuant to this agreement is reflected as Due to Affiliates in the accompanying financial statements. At June 30, 2011, approximately 1% of the outstanding shares of the fund were held by college savings plans.
The fund is also one of several mutual funds sponsored by Price Associates (underlying Price funds) in which the T. Rowe Price Spectrum Funds (Spectrum Funds) and T. Rowe Price Retirement Funds (Retirement Funds) may invest. Neither the Spectrum Funds nor the Retirement Funds invest in the underlying Price funds for the purpose of exercising management or control. Pursuant to separate special servicing agreements, expenses associated with the operation of the Spectrum and Retirement Funds are borne by each underlying Price fund to the extent of estimated savings to it and in proportion to the average daily value of its shares owned by the Spectrum and Retirement Funds, respectively. Expenses allocated under these agreements are reflected as shareholder servicing expenses in the accompanying financial statements. For the six months ended June 30, 2011, the fund was allocated $61,000 of Spectrum Funds’ expenses and $893,000 of Retirement Funds’ expenses. Of these amounts, $552,000 related to services provided by Price. The amount payable at period-end pursuant to this agreement is reflected as Due to Affiliates in the accompanying financial statements. At June 30, 2011, approximately 1% of the outstanding shares of the fund were held by the Spectrum Funds and 10% were held by the Retirement Funds.
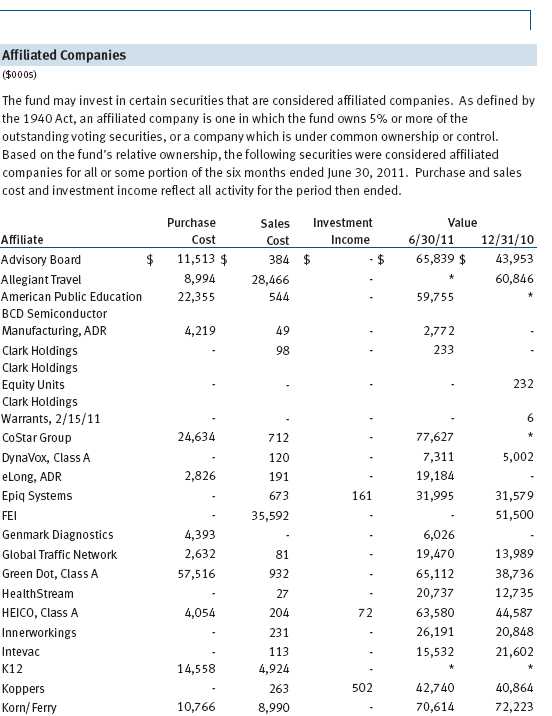
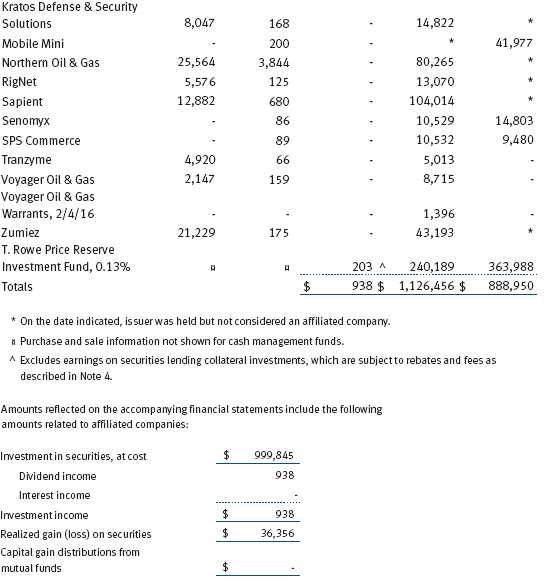
The fund may invest in the T. Rowe Price Reserve Investment Fund and the T. Rowe Price Government Reserve Investment Fund (collectively, the T. Rowe Price Reserve Investment Funds), open-end management investment companies managed by Price Associates and considered affiliates of the fund. The T. Rowe Price Reserve Investment Funds are offered as cash management options to mutual funds, trusts, and other accounts managed by Price Associates and/or its affiliates and are not available for direct purchase by members of the public. The T. Rowe Price Reserve Investment Funds pay no investment management fees.
| INFORMATION ON PROXY VOTING POLICIES, PROCEDURES, AND RECORDS |
A description of the policies and procedures used by T. Rowe Price funds and portfolios to determine how to vote proxies relating to portfolio securities is available in each fund’s Statement of Additional Information, which you may request by calling 1-800-225-5132 or by accessing the SEC’s website, sec.gov. The description of our proxy voting policies and procedures is also available on our website, troweprice.com. To access it, click on the words “Our Company” at the top of our corporate homepage. Then, when the next page appears, click on the words “Proxy Voting Policies” on the left side of the page.
Each fund’s most recent annual proxy voting record is available on our website and through the SEC’s website. To access it through our website, follow the directions above, then click on the words “Proxy Voting Records” on the right side of the Proxy Voting Policies page.
| HOW TO OBTAIN QUARTERLY PORTFOLIO HOLDINGS |
The fund files a complete schedule of portfolio holdings with the Securities and Exchange Commission for the first and third quarters of each fiscal year on Form N-Q. The fund’s Form N-Q is available electronically on the SEC’s website (sec.gov); hard copies may be reviewed and copied at the SEC’s Public Reference Room, 450 Fifth St. N.W., Washington, DC 20549. For more information on the Public Reference Room, call 1-800-SEC-0330.
| APPROVAL OF INVESTMENT MANAGEMENT AGREEMENT |
On March 9, 2011, the fund’s Board of Directors (Board) unanimously approved the continuation of the investment advisory contract (Contract) between the fund and its investment advisor, T. Rowe Price Associates, Inc. (Advisor). The Board considered a variety of factors in connection with its review of the Contract, also taking into account information provided by the Advisor during the course of the year, as discussed below:
Services Provided by the Advisor
The Board considered the nature, quality, and extent of the services provided to the fund by the Advisor. These services included, but were not limited to, management of the fund’s portfolio and a variety of related activities, as well as financial and administrative services, reporting, and communications. The Board also reviewed the background and experience of the Advisor’s senior management team and investment personnel involved in the management of the fund. The Board concluded that it was satisfied with the nature, quality, and extent of the services provided by the Advisor.
Investment Performance of the Fund
The Board reviewed the fund’s average annual total returns over the 1-, 3-, 5-, and 10-year periods, as well as the fund’s year-by-year returns, and compared these returns with a wide variety of previously agreed upon comparable performance measures and market data, including those supplied by Lipper and Morningstar, which are independent providers of mutual fund data. On the basis of this evaluation and the Board’s ongoing review of investment results, and factoring in the relative market conditions during certain of the performance periods, the Board concluded that the fund’s performance was satisfactory.
Costs, Benefits, Profits, and Economies of Scale
The Board reviewed detailed information regarding the revenues received by the Advisor under the Contract and other benefits that the Advisor (and its affiliates) may have realized from its relationship with the fund, including research received under “soft dollar” agreements and commission-sharing arrangements with broker-dealers. The Board considered that the Advisor may receive some benefit from soft-dollar arrangements pursuant to which research is received from broker-dealers that execute the applicable fund’s portfolio transactions. The Board also received information on the estimated costs incurred and profits realized by the Advisor and its affiliates from advising T. Rowe Price mutual funds, as well as estimates of the gross profits realized from managing the fund in particular. The Board concluded that the Advisor’s profits were reasonable in light of the services provided to the fund. The Board also considered whether the fund or other funds benefit under the fee levels set forth in the Contract from any economies of scale realized by the Advisor. Under the Contract, the fund pays a fee to the Advisor composed of two components—a group fee rate based on the aggregate assets of certain T. Rowe Price mutual funds (including the fund) that declines at certain asset levels and an individual fund fee rate that is assessed on the assets of the fund. The Board determined that it would be appropriate to introduce another breakpoint into the group fee rate, effective May 1, 2011, to allow fund shareholders to participate in additional economies of scale. The Board concluded that the advisory fee structure for the fund continued to provide for a reasonable sharing of benefits from any economies of scale with the fund’s investors.
Fees
The Board reviewed the fund’s management fee rate, operating expenses, and total expense ratio and compared them with fees and expenses of other comparable funds based on information and data supplied by Lipper. The information provided to the Board indicated that the fund’s management fee rate was at or below the median for comparable funds and the fund’s total expense ratio was below the median for comparable funds. The Board also reviewed the fee schedules for institutional accounts of the Advisor and its affiliates with similar mandates. Management provided the Board with information about the Advisor’s responsibilities and services provided to institutional account clients, which are more limited than its responsibilities for the fund and other T. Rowe Price mutual funds that it advises, and showing that the Advisor performs significant additional services and assumes greater risk for the fund and other T. Rowe Price mutual funds that it advises than it does for institutional account clients. On the basis of the information provided, the Board concluded that the fees paid by the fund under the Contract were reasonable.
Approval of the Contract
As noted, the Board approved the continuation of the Contract. No single factor was considered in isolation or to be determinative to the decision. Rather, the Board was assisted by the advice of independent legal counsel and concluded, in light of a weighting and balancing of all factors considered, that it was in the best interests of the fund to approve the continuation of the Contract (including the fees to be charged for services thereunder).
Item 2. Code of Ethics.
A code of ethics, as defined in Item 2 of Form N-CSR, applicable to its principal executive officer, principal financial officer, principal accounting officer or controller, or persons performing similar functions is filed as an exhibit to the registrant’s annual Form N-CSR. No substantive amendments were approved or waivers were granted to this code of ethics during the registrant’s most recent fiscal half-year.
Item 3. Audit Committee Financial Expert.
Disclosure required in registrant’s annual Form N-CSR.
Item 4. Principal Accountant Fees and Services.
Disclosure required in registrant’s annual Form N-CSR.
Item 5. Audit Committee of Listed Registrants.
Not applicable.
Item 6. Investments.
(a) Not applicable. The complete schedule of investments is included in Item 1 of this Form N-CSR.
(b) Not applicable.
Item 7. Disclosure of Proxy Voting Policies and Procedures for Closed-End Management Investment Companies.
Not applicable.
Item 8. Portfolio Managers of Closed-End Management Investment Companies.
Not applicable.
Item 9. Purchases of Equity Securities by Closed-End Management Investment Company and Affiliated Purchasers.
Not applicable.
Item 10. Submission of Matters to a Vote of Security Holders.
Not applicable.
Item 11. Controls and Procedures.
(a) The registrant’s principal executive officer and principal financial officer have evaluated the registrant’s disclosure controls and procedures within 90 days of this filing and have concluded that the registrant’s disclosure controls and procedures were effective, as of that date, in ensuring that information required to be disclosed by the registrant in this Form N-CSR was recorded, processed, summarized, and reported timely.
(b) The registrant’s principal executive officer and principal financial officer are aware of no change in the registrant’s internal control over financial reporting that occurred during the registrant’s second fiscal quarter covered by this report that has materially affected, or is reasonably likely to materially affect, the registrant’s internal control over financial reporting.
Item 12. Exhibits.
(a)(1) The registrant’s code of ethics pursuant to Item 2 of Form N-CSR is filed with the registrant’s annual Form N-CSR.
(2) Separate certifications by the registrant's principal executive officer and principal financial officer, pursuant to Section 302 of the Sarbanes-Oxley Act of 2002 and required by Rule 30a-2(a) under the Investment Company Act of 1940, are attached.
(3) Written solicitation to repurchase securities issued by closed-end companies: not applicable.
(b) A certification by the registrant's principal executive officer and principal financial officer, pursuant to Section 906 of the Sarbanes-Oxley Act of 2002 and required by Rule 30a-2(b) under the Investment Company Act of 1940, is attached.
| | |
SIGNATURES |
| |
| | Pursuant to the requirements of the Securities Exchange Act of 1934 and the Investment |
| Company Act of 1940, the registrant has duly caused this report to be signed on its behalf by the |
| undersigned, thereunto duly authorized. |
| |
| T. Rowe Price New Horizons Fund, Inc. |
| |
| |
| |
| By | /s/ Edward C. Bernard |
| | Edward C. Bernard |
| | Principal Executive Officer |
| |
| Date | August 17, 2011 |
| |
| |
| |
| | Pursuant to the requirements of the Securities Exchange Act of 1934 and the Investment |
| Company Act of 1940, this report has been signed below by the following persons on behalf of |
| the registrant and in the capacities and on the dates indicated. |
| |
| |
| By | /s/ Edward C. Bernard |
| | Edward C. Bernard |
| | Principal Executive Officer |
| |
| Date | August 17, 2011 |
| |
| |
| |
| By | /s/ Gregory K. Hinkle |
| | Gregory K. Hinkle |
| | Principal Financial Officer |
| |
| Date | August 17, 2011 |