UNITED STATES
SECURITIES AND EXCHANGE COMMISSION
Washington, D.C. 20549
FORM N-CSR
CERTIFIED SHAREHOLDER REPORT OF REGISTERED
MANAGEMENT INVESTMENT COMPANIES
Investment Company Act File Number: 811-00958
| T. Rowe Price New Horizons Fund, Inc. |
|
| (Exact name of registrant as specified in charter) |
| |
| 100 East Pratt Street, Baltimore, MD 21202 |
|
| (Address of principal executive offices) |
| |
| David Oestreicher |
| 100 East Pratt Street, Baltimore, MD 21202 |
|
| (Name and address of agent for service) |
Registrant’s telephone number, including area code: (410) 345-2000
Date of fiscal year end: December 31
Date of reporting period: June 30, 2016
Item 1. Report to Shareholders
| New Horizons Fund | June 30, 2016 |

The views and opinions in this report were current as of June 30, 2016. They are not guarantees of performance or investment results and should not be taken as investment advice. Investment decisions reflect a variety of factors, and the managers reserve the right to change their views about individual stocks, sectors, and the markets at any time. As a result, the views expressed should not be relied upon as a forecast of the fund’s future investment intent. The report is certified under the Sarbanes-Oxley Act, which requires mutual funds and other public companies to affirm that, to the best of their knowledge, the information in their financial reports is fairly and accurately stated in all material respects.
REPORTS ON THE WEB
Sign up for our Email Program, and you can begin to receive updated fund reports and prospectuses online rather than through the mail. Log in to your account at troweprice.com for more information.
Manager’s Letter
Fellow Shareholders
The first half of 2016 was challenging for small-cap investors as small-cap stocks corrected sharply through late February before rebounding. Investors seeking safety drove up prices in defensive sectors, such as utilities and consumer staples. Value shares significantly outperformed growth over the period, which came to a volatile end as investors reacted to the unexpected UK Brexit vote. We were pleased that the New Horizons Fund outperformed during the period, and as we look to the second half of the year, we will proceed with caution in the small-cap space given what we believe to be its elevated valuation levels. At this time, I would also like to take the opportunity to reconfirm the fund’s philosophy, goals, and investment selection process, updating both our business plan and mission statement.
PERFORMANCE REVIEW
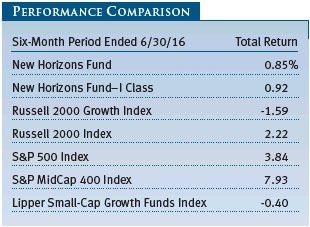
The New Horizons Fund returned 0.85% for the six-month period ended June 30, 2016, outperforming the -1.59% return of its benchmark, the Russell 2000 Growth Index, as a result of stock selection. (Results for I Class shares varied, reflecting their different fee structures, cash flows, and other factors.) The fund also outpaced the Lipper Small-Cap Growth Funds Index’s -0.40% return. The New Horizons Fund was in the top 2% of its Lipper small-cap growth funds peer group for the trailing 3-, 5-, and 10-year periods ended June 30, 2016. Based on cumulative total return, Lipper ranked the fund 65 of 556, 6 of 491, 1 of 440, and 5 of 311 funds for the 1-, 3-, 5-, and 10-year periods ended June 30, 2016, respectively. (Past performance cannot guarantee future results.)
MARKET ENVIRONMENT
Most major U.S. stock indexes rose in the first half of 2016, a period of significant global market volatility. World markets started the year with deep losses as oil prices collapsed to 13-year lows amid concerns about weakening Chinese and global economic growth. In fact, by mid-February, U.S. small-caps and some non-U.S. markets had fallen into a bear market, commonly defined as a drop of at least 20% from recent highs. However, equities and other risk assets rallied through late June, as the Bank of Japan and the European Central Bank unveiled new stimulus efforts. Also, the dollar weakened amid diminishing expectations for U.S. interest rate increases in 2016, and commodity prices rebounded sharply amid speculation about global production cuts and, to a lesser extent, supply disruptions. As the period ended, global markets fluctuated wildly in response to a referendum in which UK citizens voted in favor of leaving the European Union—the so-called Brexit.

In the U.S., mid-cap shares decisively outperformed their larger and smaller counterparts. The S&P MidCap 400 Index returned 7.93% versus 3.84% for the large-cap S&P 500 Index and 2.22% for the small-cap Russell 2000 Index. As measured by various Russell indexes, value stocks strongly outperformed growth stocks across all market capitalizations.
STRATEGY REVIEW
In her book, Different: Escaping the Competitive Herd, Professor Youngme Moon of the Harvard Business School encapsulates how exceptional companies can define a superior value proposition. According to Prof. Moon, average companies engage in a sort of “marketing myopia” where they obsess over industry research. While this activity is intended to help companies win, competitive vigilance often just enforces mediocrity. In many cases, competition leads companies to model their products after similar businesses instead of fostering original thinking. For instance, brands within the car industry have become more homogenous over time. Twenty years ago, Jeep was known for its rugged four-wheel-drive transportation, while Nissan or Toyota offered reliability. Jeep has focused more on reliability since that time while Nissan and Toyota made ruggedness a standard metric for SUVs, and now the brands are more interchangeable to the average consumer. As a thought experiment, launching a campaign about family-friendliness would probably harm either Ferrari’s appeal as a sleek sports car or Hummer’s image of toughness. Indeed, when companies start to micromanage their competitive positioning, consumers are left with “a growing profusion of alternatives, none of which is meaningful” (See page 63 of Professor Moon’s book).
Remarkable companies, on the other hand, operate from imagination. Prof. Moon provides three categories of differentiated brands—not as a hard-and-fast framework, but as a basis for further thought. “Reverse Brands” win through simplification rather than excessive augmentation. In its early years, Google outpaced Yahoo by limiting itself to a search bar. “Breakaway Brands,” in contrast, are so different that they don’t fit into their own category. Cirque Du Soleil dismantled the common tropes of a three-ring circus and injected modern dance, ballet, and gymnastics into it, providing a whole new experience. Finally, “Hostile Brands” attract customers by establishing that their consumers are unlike other people—a form of “anti-marketing.” Red Bull, for instance, predicated itself on being too intense for most people to drink. Whatever its methodology, a differentiated company will clarify its own independent strategies and principles. Many successful companies will develop a message that every employee can understand and articulate. In the case of Apple, for example, “think different” was not just a marketing ploy—it was a call to innovation that employees throughout the organization could appreciate. Indeed, identifying its vision and ideals helps a business achieve superior performance over time.
Among our long-running top-performing companies, O’Reilly Automotive stands out as a prime example of how a company can build a sustainable competitive advantage. O’Reilly’s core principles have been remarkably consistent over time. The company has always sought to offer excellent service to both “Do-It-Yourself” (DIY) and “Do-It-For-Me” (DIFM) customers within the aftermarket auto parts industry. In doing so, O’Reilly developed a culture that was focused on expertise, hospitality, and customer service. The company’s storefront model has elements of a Reverse Brand or a Breakaway Brand. Its store presentation is simpler and more curated than that of many competitors, and its employees make the customer almost feel like they are interacting with a local retailer rather than a chain store representative. O’Reilly also executed on a plan to build an exceptional supply chain. The company has established far greater density in its distribution centers and hubs than competitors, which has allowed it to deliver a wider variety of auto parts to its customers in significantly less time. The sum total of its differentiation is what we internally refer to as “business model innovation.” When it is well executed, this phenomenon can compound significant wealth for shareholders. (Please refer to our portfolio of investments for a complete list of holdings and the amount each represents in the portfolio.)
Prof. Moon provides another great insight into innovative companies: Rather than dwelling on their weaknesses, they focus on continuously improving and leveraging their strengths. She uses an example from her class in which she graded students on several core discussion skills, such as creativity or theoretical contributions. The result was that the quality of classroom discussions deteriorated because each student was busily working on their weaknesses rather than refining their strengths. Class discussions were actually better when Prof. Moon incentivized the students to leverage their best skills. This idea of strength-based management certainly applies to a company like O’Reilly. While O’Reilly has benefited from a culture of continuous improvement, the culture focuses on reinforcing its predefined strengths—customer service and a powerful supply chain—not on simulating aspects of the other companies in its industry.
Our experience suggests that, like O’Reilly, the best companies can articulate their differentiation and continuously seek to further distance themselves from their peers. For example, they might offer a better level of customer service, develop new products more effectively, or manage their supply chain with greater efficiency than competitors. While it’s not always easy to predict the success of a business, we can usually tell if it has business model innovation by examining its competitive positioning and its execution over the years.
In the world of professional investing, we think about our investment process and team in similar terms. Since investing is a competitive arena, we endeavor to operate according to a differentiated business plan. At any given time, stock prices represent the collective perceptions of investors at large. Acting like every other investor would deliver the same result, so we understand that generating outperformance requires us to make differentiated analysis. In order to succeed as investors, we need to identify our essential strengths and focus our energy on continuously improving those skills.
This year, we decided to update our business plan and mission statement for the New Horizons Fund. When I took over as portfolio manager, I used my first shareholder letter in July 2010 to detail our vision and plan for the fund. We felt that it was appropriate to go through this process again. Instead of trying to copy whatever investment strategy happens to be temporarily popular, we strive to operate according to our own independent vision and values. Our mission statement represents how we think about the fund’s philosophy, goals, and investment selection process at the most fundamental level. We believe that the document encapsulates our core principles and serves as a road map for achieving long-term results.
New Horizons Fund Mission Statement
We invest in small companies that become large and compound wealth for shareholders.
Key Attributes
| ● | Build wealth through compounding. We exercise patience and invest in high-quality businesses run by honest, effective people.
|
| ● | Keep a long-term focus. The New Horizons Fund encourages company management teams to strive to improve their competitive advantage every day and to focus on sustainability and durability.
|
| ● | Favor sustainable business practices. Our companies should maintain a reasonable balance among customers, employees, and shareholders. We prefer products that add value to customers rather than extracting it. Corporate cultures should encourage high performance and promote fairness.
|
| ● | Maintain a strong internal process. We research our investments thoroughly, track them diligently, think about potential scenarios, and seek different perspectives. We value intellectual honesty and adapt to new information.
|
| ● | Serve as a positive influence on our companies. Where possible, we strive to make the businesses we invest in better through our ownership. |
Activities We Do Not Engage In
| ● | We are neither activists nor control investors. The New Horizons Fund outsources value creation to company management teams and Boards.
|
| ● | We are not growth momentum investors. We only invest in early-stage growth companies that have the opportunity to transition to being durable growth companies.
|
| ● | There are no artificial limits to our time horizon. Unlike limited life-cycle funds (e.g., certain venture capital or private-equity strategies), we seek companies that can compound wealth in the long run. For example, we do not invest in private companies with a goal of benefiting from private-to-public market arbitrage.
|
| ● | Profit maximization for shareholders is not the only goal. We do not support questionable business practices in the name of shareholder returns—neither for our fund nor for our companies. |
To help refine our mission statement, we sought the advice of the New Horizons Fund Investment Advisory Committee, which comprises T. Rowe Price analysts and portfolio managers who represent a breadth of investment styles and industry expertise. The committee helped us appreciate how our investment process differs from that of many of our peers. In past shareholder letters, we have often discussed our strategy of investing in entrepreneurs who want to build sustainable enterprises over time—not just maximize their own short-term gains. We see this preference for sustainability reflected in our own broader strategy as a fund. For example, we do not invest in private companies merely to guide them to an initial public offering or benefit from private-public arbitrage. Rather, we want to serve as a stable partner that encourages businesses to compound wealth in the long run through durability and sustainability. For our successful investments, we seek to buy more at higher prices over time. Our mission statement also reinforces our key strengths—a longer time horizon than most competitors and a focus on compounding wealth—to help us drive performance.
Small-cap growth companies are characterized by change. Whether we are studying an industry transition or a groundbreaking new business model, our success as investors depends on our ability to learn continuously. We are always refining our investment process as we gather new information and reflect on our mistakes. Accordingly, the fund’s mission statement is meant to be a living document; we will update it as our investment philosophy progresses. Input from our shareholders is important to us, and we would appreciate your feedback on the mission statement. Please email your thoughts to info@troweprice.com with the subject line: NHF Feedback.
PORTFOLIO REVIEW
Zillow was our top performer during the first half of 2016. The company began to cycle out of its integration issues with Trulia—the industry’s second-largest brand—and realize the merits of the merger. We believe that Zillow can maintain a leading position in online real estate while expanding into new verticals. The company is investing heavily in its products, data, and advertising capabilities in order to deliver more power to the consumer. Although Zillow’s integration of Trulia has taken longer than expected, we believe that Zillow will ultimately realize most of the benefits that it predicted in acquiring the company. In the future, Zillow can create further value by transitioning to an auction-based pricing model and adding more features for real estate agents related to customer relationship management (CRM), recruiting, training, and transaction processing.

West Pharmaceutical Services, which provides packaging solutions for delivering injectable drugs, also generated significant returns during the reporting period. The company’s solutions are highly differentiated, and regulatory requirements deter customers from switching away from its products. West also benefits from growing end markets in specialty medicine, and the company has an enhanced management team that is focused on maximizing operational excellence. While West could have some revenue volatility in the future because of uncertainty in customer inventories or delays in new FDA approvals, we expect that the company’s core value proposition will be reliable for years to come.
In the first half of the year, longtime holding Waste Connections also contributed to our outperformance. As one of the largest waste collection and disposal companies in North America, Waste Connections benefits from a stable business model that generates consistent cash flow. We believe that the company’s management team has demonstrated its ability to redeploy capital into high-return opportunities. In January, the company announced that it will merge with Progressive Waste Solutions, an undermanaged U.S. and Canadian collection and disposal firm of similar size. Over time, we expect this move to provide significant cost improvements through operational synergies and asset rationalization.
Biotechnology stocks have suffered so far in 2016, with Regeneron Pharmaceuticals, Incyte, Alexion Pharmaceuticals, Neurocrine Biosciences, Prothena, and Ultragenyx Pharmaceutical all detracting from our performance. We see this as an industrywide problem more than a stock-specific phenomenon after many years of strong sector performance. Some investors are afraid that the government could decide to write harsher rules on drug pricing. This fear could last through the presidential election and possibly longer. Price increases have been a significant value driver within the sector and have contributed to multiple years of outperformance. However, we feel that price increases are becoming a strain for customers and need to be more muted going forward. When paired with some high-profile disappointments in new drug development by large companies, these challenges have caused a significant trade-off in biotechnology stocks. One notable exception in our portfolio has been TESARO, which had strong results in a phase 3 clinical trial for niraparib, a protein-inhibiting drug for ovarian cancer. This event allowed it to break out of the malaise in the sector and contribute to our outperformance.
Restoration Hardware Holdings was our largest detractor in the first half of the year. The company experienced a slowdown in order volumes because of weakness in the high-end consumer. To this point, Restoration Hardware’s unique ability to source supply from niche vendors and curate its products resulted in a differentiated offering. However, building out its supply chain has been more challenging than expected, and customers have experienced elongated delivery times. After launching its new “RH Modern” line last year, the company has struggled with additional operational complexity. In addition, it has decided to change its promotional cadence. These issues have created a business transition year, which has concerned the market. We still own a stake because of the company’s visionary leadership team and strong product culture. As with all our holdings, we continue to track our thesis carefully.
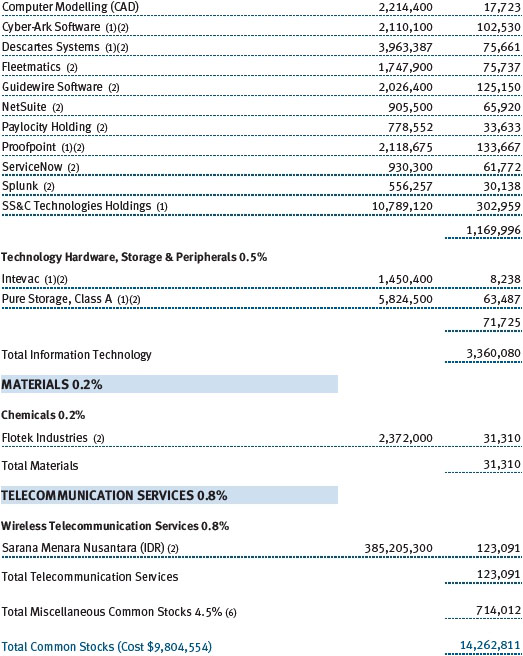
SS&C Technologies Holdings was also a significant underperformer in the reporting period. The company sells software solutions to the financial industry that include fund administration, wealth management, trade orders, and compliance. Over many years, SS&C has demonstrated a superior ability to acquire other software companies at reasonable prices and maximize efficiency on the cost side. However, SS&C’s shares were hurt so far in 2016 by the sell-off in the stock market. The organic growth rate of the business has slowed, prompting questions about its customer trends. Over the long term, we still like the durability of the company’s software solutions and believe that its acquisition strategy can continue to drive shareholder value.
OUTLOOK
We expect markets are likely to remain volatile in the wake of the Brexit vote. However, the turbulence could also create opportunities for bottom-up fundamentals investors. Overall, we expect modest growth in the second half of the year. Small-cap stocks have now underperformed large-cap companies since 2014, bringing valuations down and close to longer-term averages. The price-to-earnings (P/E) ratio of the fund’s holdings at the end of June was 31.1X, which was down slightly from 31.6X on December 31, 2015. Small-cap growth valuations are still modestly elevated relative to large-caps, however. For example, the fund’s P/E ratio relative to the same measure for the S&P 500 Index on expected 12-month forward earnings was 1.88X at the end of June, down from 1.95X at the end of 2015.


Heightened market volatility has historically been a negative factor for the relative performance of small-cap stocks versus large-caps. However, we remain confident in our ability to find smaller companies that are poised to grow rapidly and to hold them for the long term, even through the downturns and valuation adjustments that are part of every market cycle.
Thank you for investing with T. Rowe Price.
Respectfully submitted,

Henry Ellenbogen
President of the fund and chairman of its Investment Advisory Committee
July 22, 2016
The committee chairman has day-to-day responsibility for managing the portfolio and works with committee members in developing and executing the fund’s investment program.
References in this letter to Professor Youngme Moon’s book, Different: Escaping the Competitive Herd, are printed with permission.
RISKS OF INVESTING
As with all stock and bond mutual funds, each fund’s share price can fall because of weakness in the stock or bond markets, a particular industry, or specific holdings. Stock markets can decline for many reasons, including adverse political or economic developments, changes in investor psychology, or heavy institutional selling. The prospects for an industry or company may deteriorate because of a variety of factors, including disappointing earnings or changes in the competitive environment. In addition, the investment manager’s assessment of companies held in a fund may prove incorrect, resulting in losses or poor performance even in rising markets.
Investing in small companies involves greater risk than is customarily associated with larger companies. Stocks of small companies are subject to more abrupt or erratic price movements than larger-company stocks. Small companies often have limited product lines, markets, or financial resources, and their managements may lack depth and experience. Such companies seldom pay significant dividends that could cushion returns in a falling market.
GLOSSARY
Initial public offering: The first sale of stock to the public by a formerly private company.
Lipper indexes: Fund benchmarks that consist of a small number (10 to 30) of the largest mutual funds in a particular category as tracked by Lipper Inc.
Price/book ratio: A valuation measure that compares a stock’s market price with its book value; i.e., the company’s net worth divided by the number of outstanding shares.
Price/earnings (P/E) ratio: A valuation measure calculated by dividing the price of a stock by its current or projected earnings per share. The ratio is a measure of how much investors are willing to pay for the company’s earnings.
Russell 2000 Growth Index: An index that tracks the performance of small-cap stocks with higher price-to-book ratios and higher forecast growth values.
Russell 2000 Index: An unmanaged index that tracks the stocks of 2,000 small U.S. companies.
Russell 2000 Value Index: An index that tracks the performance of small-cap stocks with lower price-to-book ratios and lower forecast growth values.
S&P 500 Index: An unmanaged index that tracks the stocks of 500 primarily large-cap U.S. companies.
Note: Russell Investment Group is the source and owner of the trademarks, service marks, and copyrights related to the Russell indexes. Russell® is a trademark of Russell Investment Group.


Performance and Expenses
This chart shows the value of a hypothetical $10,000 investment in the fund over the past 10 fiscal year periods or since inception (for funds lacking 10-year records). The result is compared with benchmarks, which may include a broad-based market index and a peer group average or index. Market indexes do not include expenses, which are deducted from fund returns as well as mutual fund averages and indexes.


As a mutual fund shareholder, you may incur two types of costs: (1) transaction costs, such as redemption fees or sales loads, and (2) ongoing costs, including management fees, distribution and service (12b-1) fees, and other fund expenses. The following example is intended to help you understand your ongoing costs (in dollars) of investing in the fund and to compare these costs with the ongoing costs of investing in other mutual funds. The example is based on an investment of $1,000 invested at the beginning of the most recent six-month period and held for the entire period.
Please note that the fund has two share classes: The original share class (Investor Class) charges no distribution and service (12b-1) fee, and the I Class shares are also available to institutionally oriented clients and impose no 12b-1 or administrative fee payment. Each share class is presented separately in the table.
Actual Expenses
The first line of the following table (Actual) provides information about actual account values and expenses based on the fund’s actual returns. You may use the information on this line, together with your account balance, to estimate the expenses that you paid over the period. Simply divide your account value by $1,000 (for example, an $8,600 account value divided by $1,000 = 8.6), then multiply the result by the number on the first line under the heading “Expenses Paid During Period” to estimate the expenses you paid on your account during this period.
Hypothetical Example for Comparison Purposes
The information on the second line of the table (Hypothetical) is based on hypothetical account values and expenses derived from the fund’s actual expense ratio and an assumed 5% per year rate of return before expenses (not the fund’s actual return). You may compare the ongoing costs of investing in the fund with other funds by contrasting this 5% hypothetical example and the 5% hypothetical examples that appear in the shareholder reports of the other funds. The hypothetical account values and expenses may not be used to estimate the actual ending account balance or expenses you paid for the period.
Note: T. Rowe Price charges an annual account service fee of $20, generally for accounts with less than $10,000. The fee is waived for any investor whose T. Rowe Price mutual fund accounts total $50,000 or more; accounts electing to receive electronic delivery of account statements, transaction confirmations, prospectuses, and shareholder reports; or accounts of an investor who is a T. Rowe Price Preferred Services, Personal Services, or Enhanced Personal Services client (enrollment in these programs generally requires T. Rowe Price assets of at least $100,000). This fee is not included in the accompanying table. If you are subject to the fee, keep it in mind when you are estimating the ongoing expenses of investing in the fund and when comparing the expenses of this fund with other funds.
You should also be aware that the expenses shown in the table highlight only your ongoing costs and do not reflect any transaction costs, such as redemption fees or sales loads. Therefore, the second line of the table is useful in comparing ongoing costs only and will not help you determine the relative total costs of owning different funds. To the extent a fund charges transaction costs, however, the total cost of owning that fund is higher.

Unaudited

The accompanying notes are an integral part of these financial statements.
Unaudited

The accompanying notes are an integral part of these financial statements.
Unaudited


The accompanying notes are an integral part of these financial statements.
Unaudited


The accompanying notes are an integral part of these financial statements.
Unaudited

The accompanying notes are an integral part of these financial statements.
Unaudited


The accompanying notes are an integral part of these financial statements.
Unaudited
| Notes to Financial Statements |
T. Rowe Price New Horizons Fund, Inc. (the fund), is registered under the Investment Company Act of 1940 (the 1940 Act) as a diversified, open-end management investment company. The fund seeks long-term capital growth by investing primarily in common stocks of small, rapidly growing companies. The fund has two classes of shares: the New Horizons Fund original share class, referred to in this report as the Investor Class, incepted on June 3, 1960, and the New Horizons Fund–I Class (I Class), incepted on August 28, 2015. I Class shares generally are available only to investors meeting a $1,000,000 minimum investment or certain other criteria. Each class has exclusive voting rights on matters related solely to that class; separate voting rights on matters that relate to both classes; and, in all other respects, the same rights and obligations as the other class.
NOTE 1 - SIGNIFICANT ACCOUNTING POLICIES
Basis of Preparation The fund is an investment company and follows accounting and reporting guidance in the Financial Accounting Standards Board (FASB) Accounting Standards Codification Topic 946 (ASC 946). The accompanying financial statements were prepared in accordance with accounting principles generally accepted in the United States of America (GAAP), including, but not limited to, ASC 946. GAAP requires the use of estimates made by management. Management believes that estimates and valuations are appropriate; however, actual results may differ from those estimates, and the valuations reflected in the accompanying financial statements may differ from the value ultimately realized upon sale or maturity.
Investment Transactions, Investment Income, and Distributions Income and expenses are recorded on the accrual basis. Premiums and discounts on debt securities are amortized for financial reporting purposes. Dividends received from mutual fund investments are reflected as dividend income; capital gain distributions, if any, are reflected as realized gain/loss. Earnings on investments recognized as partnerships for federal income tax purposes reflect the tax character of such earnings. Dividend income and capital gain distributions are recorded on the ex-dividend date. Income tax-related interest and penalties, if incurred, would be recorded as income tax expense. Investment transactions are accounted for on the trade date. Realized gains and losses are reported on the identified cost basis. Income distributions are declared and paid by each class annually. Distributions to shareholders are recorded on the ex-dividend date. Capital gain distributions, if any, are generally declared and paid by the fund annually.
Currency Translation Assets, including investments, and liabilities denominated in foreign currencies are translated into U.S. dollar values each day at the prevailing exchange rate, using the mean of the bid and asked prices of such currencies against U.S. dollars as quoted by a major bank. Purchases and sales of securities, income, and expenses are translated into U.S. dollars at the prevailing exchange rate on the date of the transaction. The effect of changes in foreign currency exchange rates on realized and unrealized security gains and losses is reflected as a component of security gains and losses.
Class Accounting Shareholder servicing, prospectus, and shareholder report expenses incurred by each class are charged directly to the class to which they relate. Expenses common to both classes, investment income, and realized and unrealized gains and losses are allocated to the classes based upon the relative daily net assets of each class.
Rebates Subject to best execution, the fund may direct certain security trades to brokers who have agreed to rebate a portion of the related brokerage commission to the fund in cash. Commission rebates are reflected as realized gain on securities in the accompanying financial statements and totaled $83,000 for the six months ended June 30, 2016.
In-Kind Redemptions In accordance with guidelines described in the fund’s prospectus, and when considered to be in the best interest of all shareholders, the fund may distribute portfolio securities rather than cash as payment for a redemption of fund shares (in-kind redemption). Gains and losses realized on in-kind redemptions are not recognized for tax purposes and are reclassified from undistributed realized gain (loss) to paid-in capital. During the six months ended June 30, 2016, the fund realized $16,130,000 of net gain on $31,297,000 of in-kind redemptions.
In-Kind Subscriptions Under certain circumstances, and when considered to be in the best interest of all shareholders, the fund may accept portfolio securities rather than cash as payment for the purchase of fund shares (in-kind subscription). For financial reporting and tax purposes, the cost basis of contributed securities is equal to the market value of the securities on the date of contribution. In-kind subscriptions result in no gain or loss and no tax consequences for the fund. During the six months ended June 30, 2016, the fund accepted $186,767,000 of in-kind subscriptions, all of which were from other T. Rowe Price funds.
NOTE 2 - VALUATION
The fund’s financial instruments are valued and each class’s net asset value (NAV) per share is computed at the close of the New York Stock Exchange (NYSE), normally 4 p.m. ET, each day the NYSE is open for business.
Fair Value The fund’s financial instruments are reported at fair value, which GAAP defines as the price that would be received to sell an asset or paid to transfer a liability in an orderly transaction between market participants at the measurement date. The T. Rowe Price Valuation Committee (the Valuation Committee) has been established by the fund’s Board of Directors (the Board) to ensure that financial instruments are appropriately priced at fair value in accordance with GAAP and the 1940 Act. Subject to oversight by the Board, the Valuation Committee develops and oversees pricing-related policies and procedures and approves all fair value determinations. Specifically, the Valuation Committee establishes procedures to value securities; determines pricing techniques, sources, and persons eligible to effect fair value pricing actions; oversees the selection, services, and performance of pricing vendors; oversees valuation-related business continuity practices; and provides guidance on internal controls and valuation-related matters. The Valuation Committee reports to the Board and has representation from legal, portfolio management and trading, operations, risk management, and the fund’s treasurer.
Various valuation techniques and inputs are used to determine the fair value of financial instruments. GAAP establishes the following fair value hierarchy that categorizes the inputs used to measure fair value:
Level 1 – quoted prices (unadjusted) in active markets for identical financial instruments that the fund can access at the reporting date
Level 2 – inputs other than Level 1 quoted prices that are observable, either directly or indirectly (including, but not limited to, quoted prices for similar financial instruments in active markets, quoted prices for identical or similar financial instruments in inactive markets, interest rates and yield curves, implied volatilities, and credit spreads)
Level 3 – unobservable inputs
Observable inputs are developed using market data, such as publicly available information about actual events or transactions, and reflect the assumptions that market participants would use to price the financial instrument. Unobservable inputs are those for which market data are not available and are developed using the best information available about the assumptions that market participants would use to price the financial instrument. GAAP requires valuation techniques to maximize the use of relevant observable inputs and minimize the use of unobservable inputs. When multiple inputs are used to derive fair value, the financial instrument is assigned to the level within the fair value hierarchy based on the lowest-level input that is significant to the fair value of the financial instrument. Input levels are not necessarily an indication of the risk or liquidity associated with financial instruments at that level but rather the degree of judgment used in determining those values.
Valuation Techniques Equity securities listed or regularly traded on a securities exchange or in the over-the-counter (OTC) market are valued at the last quoted sale price or, for certain markets, the official closing price at the time the valuations are made. OTC Bulletin Board securities are valued at the mean of the closing bid and asked prices. A security that is listed or traded on more than one exchange is valued at the quotation on the exchange determined to be the primary market for such security. Listed securities not traded on a particular day are valued at the mean of the closing bid and asked prices for domestic securities and the last quoted sale or closing price for international securities.
For valuation purposes, the last quoted prices of non-U.S. equity securities may be adjusted to reflect the fair value of such securities at the close of the NYSE. If the fund determines that developments between the close of a foreign market and the close of the NYSE will, in its judgment, materially affect the value of some or all of its portfolio securities, the fund will adjust the previous quoted prices to reflect what it believes to be the fair value of the securities as of the close of the NYSE. In deciding whether it is necessary to adjust quoted prices to reflect fair value, the fund reviews a variety of factors, including developments in foreign markets, the performance of U.S. securities markets, and the performance of instruments trading in U.S. markets that represent foreign securities and baskets of foreign securities. The fund may also fair value securities in other situations, such as when a particular foreign market is closed but the fund is open. The fund uses outside pricing services to provide it with quoted prices and information to evaluate or adjust those prices. The fund cannot predict how often it will use quoted prices and how often it will determine it necessary to adjust those prices to reflect fair value. As a means of evaluating its security valuation process, the fund routinely compares quoted prices, the next day’s opening prices in the same markets, and adjusted prices.
Actively traded equity securities listed on a domestic exchange generally are categorized in Level 1 of the fair value hierarchy. Non-U.S. equity securities generally are categorized in Level 2 of the fair value hierarchy despite the availability of quoted prices because, as described above, the fund evaluates and determines whether those quoted prices reflect fair value at the close of the NYSE or require adjustment. OTC Bulletin Board securities, certain preferred securities, and equity securities traded in inactive markets generally are categorized in Level 2 of the fair value hierarchy.
Debt securities generally are traded in the OTC market. Securities with remaining maturities of one year or more at the time of acquisition are valued at prices furnished by dealers who make markets in such securities or by an independent pricing service, which considers the yield or price of bonds of comparable quality, coupon, maturity, and type, as well as prices quoted by dealers who make markets in such securities. Generally, debt securities are categorized in Level 2 of the fair value hierarchy; however, to the extent the valuations include significant unobservable inputs, the securities would be categorized in Level 3.
Investments in mutual funds are valued at the mutual fund’s closing NAV per share on the day of valuation and are categorized in Level 1 of the fair value hierarchy. Financial futures contracts are valued at closing settlement prices and are categorized in Level 1 of the fair value hierarchy. Assets and liabilities other than financial instruments, including short-term receivables and payables, are carried at cost, or estimated realizable value, if less, which approximates fair value.
Thinly traded financial instruments and those for which the above valuation procedures are inappropriate or are deemed not to reflect fair value are stated at fair value as determined in good faith by the Valuation Committee. The objective of any fair value pricing determination is to arrive at a price that could reasonably be expected from a current sale. Financial instruments fair valued by the Valuation Committee are primarily private placements, restricted securities, warrants, rights, and other securities that are not publicly traded.
Subject to oversight by the Board, the Valuation Committee regularly makes good faith judgments to establish and adjust the fair valuations of certain securities as events occur and circumstances warrant. For instance, in determining the fair value of an equity investment with limited market activity, such as a private placement or a thinly traded public company stock, the Valuation Committee considers a variety of factors, which may include, but are not limited to, the issuer’s business prospects, its financial standing and performance, recent investment transactions in the issuer, new rounds of financing, negotiated transactions of significant size between other investors in the company, relevant market valuations of peer companies, strategic events affecting the company, market liquidity for the issuer, and general economic conditions and events. In consultation with the investment and pricing teams, the Valuation Committee will determine an appropriate valuation technique based on available information, which may include both observable and unobservable inputs. The Valuation Committee typically will afford greatest weight to actual prices in arm’s length transactions, to the extent they represent orderly transactions between market participants, transaction information can be reliably obtained, and prices are deemed representative of fair value. However, the Valuation Committee may also consider other valuation methods such as market-based valuation multiples; a discount or premium from market value of a similar, freely traded security of the same issuer; or some combination. Fair value determinations are reviewed on a regular basis and updated as information becomes available, including actual purchase and sale transactions of the issue. Because any fair value determination involves a significant amount of judgment, there is a degree of subjectivity inherent in such pricing decisions, and fair value prices determined by the Valuation Committee could differ from those of other market participants. Depending on the relative significance of unobservable inputs, including the valuation technique(s) used, fair valued securities may be categorized in Level 2 or 3 of the fair value hierarchy.
Valuation Inputs The following table summarizes the fund’s financial instruments, based on the inputs used to determine their fair values on June 30, 2016:
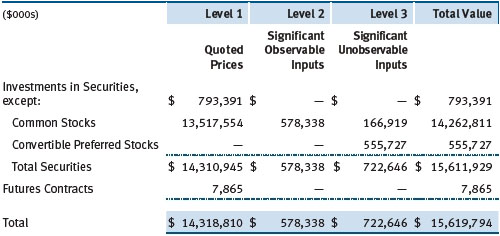
There were no material transfers between Levels 1 and 2 during the six months ended June 30, 2016.
Following is a reconciliation of the fund’s Level 3 holdings for the six months ended June 30, 2016. Gain (loss) reflects both realized and change in unrealized gain/loss on Level 3 holdings during the period, if any, and is included on the accompanying Statement of Operations. The change in unrealized gain/loss on Level 3 instruments held at June 30, 2016, totaled $29,131,000 for the six months ended June 30, 2016. During the period, transfers into Level 3 generally resulted from a lack of observable market data for the security and transfers out of Level 3 were generally because observable market data became available for the security. Additionally, during the period, transfers into and out of Level 3 include the impact of a holding that converted from a convertible preferred stock to common stock as part of an acquisition.

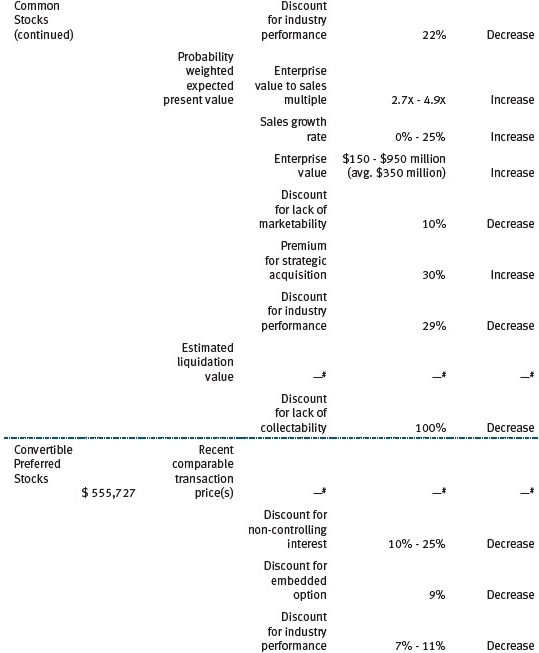
In accordance with GAAP, the following table provides quantitative information about significant unobservable inputs used to determine the fair valuations of the fund’s Level 3 assets, by class of financial instrument; it also indicates the sensitivity of the Level 3 valuations to changes in those significant unobservable inputs. Because the Valuation Committee considers a wide variety of factors and inputs, both observable and unobservable, in determining fair values, the unobservable inputs presented do not reflect all inputs significant to the fair value determination.


NOTE 3 - DERIVATIVE INSTRUMENTS
During the six months ended June 30, 2016, the fund invested in derivative instruments. As defined by GAAP, a derivative is a financial instrument whose value is derived from an underlying security price, foreign exchange rate, interest rate, index of prices or rates, or other variable; it requires little or no initial investment and permits or requires net settlement. The fund invests in derivatives only if the expected risks and rewards are consistent with its investment objectives, policies, and overall risk profile, as described in its prospectus and Statement of Additional Information. The fund may use derivatives for a variety of purposes, such as seeking to hedge against declines in principal value, increase yield, invest in an asset with greater efficiency and at a lower cost than is possible through direct investment, or to adjust credit exposure. The risks associated with the use of derivatives are different from, and potentially much greater than, the risks associated with investing directly in the instruments on which the derivatives are based. The fund at all times maintains sufficient cash reserves, liquid assets, or other SEC-permitted asset types to cover its settlement obligations under open derivative contracts.
The fund values its derivatives at fair value and recognizes changes in fair value currently in its results of operations. Accordingly, the fund does not follow hedge accounting, even for derivatives employed as economic hedges. Generally, the fund accounts for its derivatives on a gross basis. It does not offset the fair value of derivative liabilities against the fair value of derivative assets on its financial statements, nor does it offset the fair value of derivative instruments against the right to reclaim or obligation to return collateral. As of June 30, 2016, the fund held equity futures with cumulative unrealized loss of $923,000; the value reflected on the accompanying Statement of Assets and Liabilities is the related unsettled variation margin.
Additionally, during the six months ended June 30, 2016, the fund recognized $61,840,000 of realized gain on Futures and a $(923,000) change in unrealized gain/loss on Futures related to its investments in equity derivatives; such amounts are included on the accompanying Statement of Operations.
Counterparty Risk and Collateral The fund invests in exchange-traded or centrally cleared derivative contracts, such as futures, exchange-traded options, and centrally cleared swaps. Counterparty risk on such derivatives is minimal because the clearinghouse provides protection against counterparty defaults. For futures and centrally cleared swaps, the fund is required to deposit collateral in an amount equal to a certain percentage of the contract value (margin requirement), and the margin requirement must be maintained over the life of the contract. Each clearing broker, in its sole discretion, may adjust the margin requirements applicable to the fund.
Collateral may be in the form of cash or debt securities issued by the U.S. government or related agencies. Cash and currencies posted by the fund are reflected as cash deposits in the accompanying financial statements and generally are restricted from withdrawal by the fund; securities posted by the fund are so noted in the accompanying Portfolio of Investments; both remain in the fund’s assets. As of June 30, 2016, cash of $23,210,000 had been posted by the fund for exchange-traded and/or centrally cleared derivatives.
Futures Contracts The fund is subject to equity price risk in the normal course of pursuing its investment objectives and uses futures contracts to help manage such risk. The fund may enter into futures contracts to manage exposure to interest rates, security prices, foreign currencies, and credit quality; as an efficient means of adjusting exposure to all or part of a target market; to enhance income; as a cash management tool; or to adjust credit exposure. A futures contract provides for the future sale by one party and purchase by another of a specified amount of a specific underlying financial instrument at an agreed-upon price, date, time, and place. The fund currently invests only in exchange-traded futures, which generally are standardized as to maturity date, underlying financial instrument, and other contract terms. Payments are made or received by the fund each day to settle daily fluctuations in the value of the contract (variation margin), which reflect changes in the value of the underlying financial instrument. Variation margin is recorded as unrealized gain or loss until the contract is closed. The value of a futures contract included in net assets is the amount of unsettled variation margin; net variation margin receivable is reflected as an asset, and net variation margin payable is reflected as a liability on the accompanying Statement of Assets and Liabilities. Risks related to the use of futures contracts include possible illiquidity of the futures markets, contract prices that can be highly volatile and imperfectly correlated to movements in hedged security values, and potential losses in excess of the fund’s initial investment. During the six months ended June 30, 2016, the volume of the fund’s activity in futures, based on underlying notional amounts, was generally between 0% and 4% of net assets.
NOTE 4 - OTHER INVESTMENT TRANSACTIONS
Consistent with its investment objective, the fund engages in the following practices to manage exposure to certain risks and/or to enhance performance. The investment objective, policies, program, and risk factors of the fund are described more fully in the fund’s prospectus and Statement of Additional Information.
Restricted Securities The fund may invest in securities that are subject to legal or contractual restrictions on resale. Prompt sale of such securities at an acceptable price may be difficult and may involve substantial delays and additional costs.
Bank Loans The fund may invest in bank loans, which represent an interest in amounts owed by a borrower to a syndication of lenders. Bank loans are generally noninvestment grade and often involve borrowers whose financial condition is troubled or highly leveraged. Bank loans may be in the form of either assignments or participations. A loan assignment transfers all legal, beneficial, and economic rights to the buyer, and transfer typically requires consent of both the borrower and agent. In contrast, a loan participation generally entitles the buyer to receive the cash flows from principal, interest, and any fee payments; however, the seller continues to hold legal title to the loan. As a result, the buyer of a loan participation generally has no direct rights against the borrower and is exposed to credit risk of both the borrower and seller of the participation. Bank loans often have extended settlement periods, usually may be repaid at any time at the option of the borrower, and may require additional principal to be funded at the borrowers’ discretion at a later date (unfunded commitments). Until settlement, the fund maintains liquid assets sufficient to settle its unfunded loan commitments. The fund reflects both the funded portion of a bank loan as well as its unfunded commitment in the Portfolio of Investments. However, to the extent a credit agreement provides no initial funding of a tranche and funding of the full commitment at a future date(s) is at the borrower’s discretion and considered uncertain, no loan is reflected in the Portfolio of Investments until paid.
Securities Lending The fund may lend its securities to approved brokers to earn additional income. Its securities lending activities are administered by a lending agent in accordance with a securities lending agreement. Security loans generally do not have stated maturity dates, and the fund may recall a security at any time. The fund receives collateral in the form of cash or U.S. government securities, valued at 102% to 105% of the value of the securities on loan. Collateral is maintained over the life of the loan in an amount not less than the value of loaned securities; any additional collateral required due to changes in security values is delivered to the fund the next business day. Cash collateral is invested by the lending agent(s) in accordance with investment guidelines approved by fund management. Additionally, the lending agent indemnifies the fund against losses resulting from borrower default. Although risk is mitigated by the collateral and indemnification, the fund could experience a delay in recovering its securities and a possible loss of income or value if the borrower fails to return the securities, collateral investments decline in value, and the lending agent fails to perform. Securities lending revenue consists of earnings on invested collateral and borrowing fees, net of any rebates to the borrower, compensation to the lending agent, and other administrative costs. In accordance with GAAP, investments made with cash collateral are reflected in the accompanying financial statements, but collateral received in the form of securities is not. At June 30, 2016, there were no securities on loan.
Other Purchases and sales of portfolio securities other than short-term securities aggregated $2,814,214,000 and $2,767,972,000, respectively, for the six months ended June 30, 2016.
NOTE 5 - FEDERAL INCOME TAXES
No provision for federal income taxes is required since the fund intends to continue to qualify as a regulated investment company under Subchapter M of the Internal Revenue Code and distribute to shareholders all of its taxable income and gains. Distributions determined in accordance with federal income tax regulations may differ in amount or character from net investment income and realized gains for financial reporting purposes. Financial reporting records are adjusted for permanent book/tax differences to reflect tax character but are not adjusted for temporary differences. The amount and character of tax-basis distributions and composition of net assets are finalized at fiscal year-end; accordingly, tax-basis balances have not been determined as of the date of this report.
At June 30, 2016, the cost of investments for federal income tax purposes was $11,181,302,000. Net unrealized gain aggregated $4,428,852,000 at period-end, of which $5,018,043,000 related to appreciated investments and $589,191,000 related to depreciated investments.
NOTE 6 - RELATED PARTY TRANSACTIONS
The fund is managed by T. Rowe Price Associates, Inc. (Price Associates), a wholly owned subsidiary of T. Rowe Price Group, Inc. (Price Group). The investment management agreement between the fund and Price Associates provides for an annual investment management fee, which is computed daily and paid monthly. The fee consists of an individual fund fee, equal to 0.35% of the fund’s average daily net assets, and a group fee. The group fee rate is calculated based on the combined net assets of certain mutual funds sponsored by Price Associates (the group) applied to a graduated fee schedule, with rates ranging from 0.48% for the first $1 billion of assets to 0.270% for assets in excess of $500 billion. The fund’s group fee is determined by applying the group fee rate to the fund’s average daily net assets. At June 30, 2016, the effective annual group fee rate was 0.29%.
The I Class is subject to an operating expense limitation (I Class limit) pursuant to which Price Associates is contractually required to pay all operating expenses of the I Class, excluding management fees, interest, borrowing-related expenses, taxes, brokerage commissions, and extraordinary expenses, to the extent such operating expenses, on an annualized basis, exceed 0.05% of average net assets. This agreement will continue until April 30, 2018, and may be renewed, revised or revoked only with approval of the fund’s Board. The I Class is required to repay Price Associates for expenses previously paid to the extent the class’s net assets grow or expenses decline sufficiently to allow repayment without causing the class’s operating expenses to exceed the I Class limit. However, no repayment will be made more than three years after the date of a payment or waiver.
In addition, the fund has entered into service agreements with Price Associates and two wholly owned subsidiaries of Price Associates (collectively, Price). Price Associates provides certain accounting and administrative services to the fund. T. Rowe Price Services, Inc., provides shareholder and administrative services in its capacity as the fund’s transfer and dividend-disbursing agent. T. Rowe Price Retirement Plan Services, Inc., provides subaccounting and recordkeeping services for certain retirement accounts invested in the Investor Class and I Class. For the six months ended June 30, 2016, expenses incurred pursuant to these service agreements were $23,000 for Price Associates; $1,490,000 for T. Rowe Price Services, Inc.; and $2,406,000 for T. Rowe Price Retirement Plan Services, Inc. The total amount payable at period-end pursuant to these service agreements is reflected as Due to Affiliates in the accompanying financial statements, if any.
Additionally, the fund is one of several mutual funds in which certain college savings plans managed by Price Associates may invest. As approved by the fund’s Board of Directors, shareholder servicing costs associated with each college savings plan are borne by the fund in proportion to the average daily value of its shares owned by the college savings plan. For the six months ended June 30, 2016, the fund was charged $119,000 for shareholder servicing costs related to the college savings plans, of which $65,000 was for services provided by Price. The amount payable at period-end pursuant to this agreement is reflected as Due to Affiliates in the accompanying financial statements. At June 30, 2016, approximately 1% of the outstanding shares of the Investor Class were held by college savings plans.
The fund is also one of several mutual funds sponsored by Price Associates (underlying Price funds) in which the T. Rowe Price Spectrum Funds (Spectrum Funds), as well as the T. Rowe Price Retirement Funds (Retirement Funds) and T. Rowe Price Target Funds (Target Funds) may invest. Neither the Spectrum Funds, the Retirement Funds, nor the Target Funds invest in the underlying Price funds for the purpose of exercising management or control. Pursuant to separate special servicing agreements, expenses associated with the operation of the Spectrum Funds and Retirement Funds are borne by each underlying Price fund to the extent of estimated savings to it and in proportion to the average daily value of its shares owned by the Spectrum Funds and Retirement Funds, respectively. Prior to February 1, 2016, the Target Funds were subject to the same special servicing arrangement; thus expenses associated with the operation of the Target Funds prior to that date were borne by the underlying Price Funds. Effective February 1, 2016, expenses associated with the operation of the Target Funds are borne by the Target Funds.
Expenses allocated under these special servicing agreements are reflected as shareholder servicing expenses in the accompanying financial statements. For the six months ended June 30, 2016, the fund was allocated $34,000 of Spectrum Funds’ expenses, $1,178,000 of Retirement Funds’ expenses, and $2,000 of Target Funds’ expenses. Of these amounts, $507,000 related to services provided by Price. At period-end, the amount payable to Price pursuant to this agreement is reflected as Due to Affiliates in the accompanying financial statements. At June 30, 2016, less than 1% of the outstanding shares of the Investor Class were held by the Spectrum Funds, 11% of the outstanding shares of the Investor Class were held by Retirement Funds, and less than 1% of the outstanding shares of the I Class were held by Target Funds.
In addition, other mutual funds, trusts, and other accounts managed by Price Associates or its affiliates (collectively, Price funds and accounts) may invest in the fund; however, no Price fund or account may invest for the purpose of exercising management or control over the fund. At June 30, 2016, approximately 3% of the I Class’s outstanding shares were held by Price funds and accounts.
The fund may invest in the T. Rowe Price Reserve Investment Fund, the T. Rowe Price Government Reserve Investment Fund, or the T. Rowe Price Short-Term Reserve Fund (collectively, the Price Reserve Investment Funds), open-end management investment companies managed by Price Associates and considered affiliates of the fund. The Price Reserve Investment Funds are offered as short-term investment options to mutual funds, trusts, and other accounts managed by Price Associates or its affiliates and are not available for direct purchase by members of the public. The Price Reserve Investment Funds pay no investment management fees.
The fund may participate in securities purchase and sale transactions with other funds or accounts advised by Price Associates (cross trades), in accordance with procedures adopted by the fund’s Board and Securities and Exchange Commission rules, which require, among other things, that such purchase and sale cross trades be effected at the independent current market price of the security. During the six months ended June 30, 2016, the aggregate value of purchases and sales cross trades with other funds or accounts advised by Price Associates was less than 1% of the fund’s net assets as of June 30, 2016.
| Information on Proxy Voting Policies, Procedures, and Records |
A description of the policies and procedures used by T. Rowe Price funds and portfolios to determine how to vote proxies relating to portfolio securities is available in each fund’s Statement of Additional Information. You may request this document by calling 1-800-225-5132 or by accessing the SEC’s website, sec.gov.
The description of our proxy voting policies and procedures is also available on our corporate website. To access it, please visit the following Web page
https://www3.troweprice.com/usis/corporate/en/utility/policies.html
and scroll down to the section near the bottom of the page that says, “Proxy Voting Policies.” Click on the Proxy Voting Policies link in the shaded box.
Each fund’s most recent annual proxy voting record is available on our website and through the SEC’s website. To access it through T. Rowe Price, visit the website location shown above, and scroll down to the section near the bottom of the page that says, “Proxy Voting Records.” Click on the Proxy Voting Records link in the shaded box.
| How to Obtain Quarterly Portfolio Holdings |
The fund files a complete schedule of portfolio holdings with the Securities and Exchange Commission for the first and third quarters of each fiscal year on Form N-Q. The fund’s Form N-Q is available electronically on the SEC’s website (sec.gov); hard copies may be reviewed and copied at the SEC’s Public Reference Room, 100 F St. N.E., Washington, DC 20549. For more information on the Public Reference Room, call 1-800-SEC-0330.
| Approval of Investment Management Agreement |
On March 11, 2016, the fund’s Board of Directors (Board), including a majority of the fund’s independent directors, approved the continuation of the investment management agreement (Advisory Contract) between the fund and its investment advisor, T. Rowe Price Associates, Inc. (Advisor). In connection with its deliberations, the Board requested, and the Advisor provided, such information as the Board (with advice from independent legal counsel) deemed reasonably necessary. The Board considered a variety of factors in connection with its review of the Advisory Contract, also taking into account information provided by the Advisor during the course of the year, as discussed below:
Services Provided by the Advisor
The Board considered the nature, quality, and extent of the services provided to the fund by the Advisor. These services included, but were not limited to, directing the fund’s investments in accordance with its investment program and the overall management of the fund’s portfolio, as well as a variety of related activities such as financial, investment operations, and administrative services; compliance; maintaining the fund’s records and registrations; and shareholder communications. The Board also reviewed the background and experience of the Advisor’s senior management team and investment personnel involved in the management of the fund, as well as the Advisor’s compliance record. The Board concluded that it was satisfied with the nature, quality, and extent of the services provided by the Advisor.
Investment Performance of the Fund
The Board reviewed the fund’s three-month, one-year, and year-by-year returns, as well as the fund’s average annualized total returns over the 3-, 5-, and 10-year periods, and compared these returns with a wide variety of comparable performance measures and market data, including those supplied by Lipper and Morningstar, which are independent providers of mutual fund data.
On the basis of this evaluation and the Board’s ongoing review of investment results, and factoring in the relative market conditions during certain of the performance periods, the Board concluded that the fund’s performance was satisfactory.
Costs, Benefits, Profits, and Economies of Scale
The Board reviewed detailed information regarding the revenues received by the Advisor under the Advisory Contract and other benefits that the Advisor (and its affiliates) may have realized from its relationship with the fund, including any research received under “soft dollar” agreements and commission-sharing arrangements with broker-dealers. The Board considered that the Advisor may receive some benefit from soft-dollar arrangements pursuant to which research is received from broker-dealers that execute the applicable fund’s portfolio transactions. The Board received information on the estimated costs incurred and profits realized by the Advisor from managing T. Rowe Price mutual funds. The Board also reviewed estimates of the profits realized from managing the fund in particular, and the Board concluded that the Advisor’s profits were reasonable in light of the services provided to the fund.
The Board also considered whether the fund benefits under the fee levels set forth in the Advisory Contract from any economies of scale realized by the Advisor. Under the Advisory Contract, the fund pays a fee to the Advisor for investment management services composed of two components—a group fee rate based on the combined average net assets of most of the T. Rowe Price mutual funds (including the fund) that declines at certain asset levels and an individual fund fee rate based on the fund’s average daily net assets—and the fund pays its own expenses of operations (subject to an expense limitation on operating expenses with respect to the I Class). The Board concluded that the advisory fee structure for the fund continued to provide for a reasonable sharing of benefits from any economies of scale with the fund’s investors.
Fees
The Board was provided with information regarding industry trends in management fees and expenses, and the Board reviewed the fund’s management fee rate, operating expenses, and total expense ratio (for the Investor Class and I Class) in comparison with fees and expenses of other comparable funds based on information and data supplied by Lipper. The information provided to the Board indicated that the fund’s management fee rate and total expense ratio for both classes was at or below the median for comparable funds.
The Board also reviewed the fee schedules for institutional accounts (including subadvised mutual funds) and private accounts with similar mandates that are advised or subadvised by the Advisor and its affiliates. Management provided the Board with information about the Advisor’s responsibilities and services provided to subadvisory and other institutional account clients, including information about how the requirements and economics of the institutional business differ from those of the Advisor’s proprietary mutual fund business. The Board considered information showing that the Advisor’s proprietary mutual fund business is generally more complex from a business and compliance perspective than its institutional account business and considered various other relevant factors, including the broader scope of operations and oversight, more extensive shareholder communication infrastructure, greater asset flows, heightened business risks, and differences in applicable laws and regulations associated with the Advisor’s proprietary mutual fund business. In assessing the reasonableness of the fund’s management fee rate, the Board considered the differences in the nature of the services required for the Advisor to manage its proprietary mutual fund business versus managing a discrete pool of assets as a subadvisor to another institution’s mutual fund or for another institutional account and the degree to which the Advisor performs significant additional services and assumes greater risk in managing the fund and other T. Rowe Price mutual funds than it does for institutional account clients.
On the basis of the information provided and the factors considered, the Board concluded that the fees paid by the fund under the Advisory Contract are reasonable.
Approval of the Advisory Contract
As noted, the Board approved the continuation of the Advisory Contract. No single factor was considered in isolation or to be determinative to the decision. Rather, the Board concluded, in light of a weighting and balancing of all factors considered, that it was in the best interests of the fund and its shareholders for the Board to approve the continuation of the Advisory Contract (including the fees to be charged for services thereunder). The independent directors were advised throughout the process by independent legal counsel.
Item 2. Code of Ethics.
A code of ethics, as defined in Item 2 of Form N-CSR, applicable to its principal executive officer, principal financial officer, principal accounting officer or controller, or persons performing similar functions is filed as an exhibit to the registrant’s annual Form N-CSR. No substantive amendments were approved or waivers were granted to this code of ethics during the registrant’s most recent fiscal half-year.
Item 3. Audit Committee Financial Expert.
Disclosure required in registrant’s annual Form N-CSR.
Item 4. Principal Accountant Fees and Services.
Disclosure required in registrant’s annual Form N-CSR.
Item 5. Audit Committee of Listed Registrants.
Not applicable.
Item 6. Investments.
(a) Not applicable. The complete schedule of investments is included in Item 1 of this Form N-CSR.
(b) Not applicable.
Item 7. Disclosure of Proxy Voting Policies and Procedures for Closed-End Management Investment Companies.
Not applicable.
Item 8. Portfolio Managers of Closed-End Management Investment Companies.
Not applicable.
Item 9. Purchases of Equity Securities by Closed-End Management Investment Company and Affiliated Purchasers.
Not applicable.
Item 10. Submission of Matters to a Vote of Security Holders.
Not applicable.
Item 11. Controls and Procedures.
(a) The registrant’s principal executive officer and principal financial officer have evaluated the registrant’s disclosure controls and procedures within 90 days of this filing and have concluded that the registrant’s disclosure controls and procedures were effective, as of that date, in ensuring that information required to be disclosed by the registrant in this Form N-CSR was recorded, processed, summarized, and reported timely.
(b) The registrant’s principal executive officer and principal financial officer are aware of no change in the registrant’s internal control over financial reporting that occurred during the registrant’s second fiscal quarter covered by this report that has materially affected, or is reasonably likely to materially affect, the registrant’s internal control over financial reporting.
Item 12. Exhibits.
(a)(1) The registrant’s code of ethics pursuant to Item 2 of Form N-CSR is filed with the registrant’s annual Form N-CSR.
(2) Separate certifications by the registrant's principal executive officer and principal financial officer, pursuant to Section 302 of the Sarbanes-Oxley Act of 2002 and required by Rule 30a-2(a) under the Investment Company Act of 1940, are attached.
(3) Written solicitation to repurchase securities issued by closed-end companies: not applicable.
(b) A certification by the registrant's principal executive officer and principal financial officer, pursuant to Section 906 of the Sarbanes-Oxley Act of 2002 and required by Rule 30a-2(b) under the Investment Company Act of 1940, is attached.
SIGNATURES
Pursuant to the requirements of the Securities Exchange Act of 1934 and the Investment Company Act of 1940, the registrant has duly caused this report to be signed on its behalf by the undersigned, thereunto duly authorized.
T. Rowe Price New Horizons Fund, Inc.
| | By | /s/ Edward C. Bernard |
| | Edward C. Bernard |
| | Principal Executive Officer |
| |
| Date August 17, 2016 | | |
Pursuant to the requirements of the Securities Exchange Act of 1934 and the Investment Company Act of 1940, this report has been signed below by the following persons on behalf of the registrant and in the capacities and on the dates indicated.
| | By | /s/ Edward C. Bernard |
| | Edward C. Bernard |
| | Principal Executive Officer |
| |
| Date August 17, 2016 | | |
| |
| |
| By | /s/ Catherine D. Mathews |
| | Catherine D. Mathews |
| | Principal Financial Officer |
| |
| Date August 17, 2016 | | |