
Pilgrim’s Acquires Tulip UK August 28, 2019 Pilgrim’s Pride Corporation (NASDAQ: PPC)
PRELIMINARY DRAFT Cautionary Notes and Forward-Looking Statements Statements contained in this presentation that share our intentions, beliefs, expectations or predictions for the future, denoted by the words “anticipate,” “believe,” “estimate,” “should,” “expect,” “project,” “plan,” “imply,” “intend,” “foresee” and similar expressions, are forward-looking statements that reflect our current views about future events and are subject to risks, uncertainties and assumptions. Such risks, uncertainties and assumptions include the following matters affecting the chicken industry generally, including fluctuations in the commodity prices of feed ingredients and chicken; actions and decisions of our creditors; our ability to obtain and maintain commercially reasonable terms with vendors and service providers; our ability to maintain contracts that are critical to our operations; our ability to retain management and other key individuals; certain of our reorganization and exit or disposal activities, including selling assets, idling facilities, reducing production and reducing workforce, resulted in reduced capacities and sales volumes and may have a disproportionate impact on our income relative to the cost savings; risk that the amounts of cash from operations together with amounts available under our exit credit facility will not be sufficient to fund our operations; management of our cash resources, particularly in light of our substantial leverage; restrictions imposed by, and as a result of, our substantial leverage; additional outbreaks of avian influenza or other diseases, either in our own flocks or elsewhere, affecting our ability to conduct our operations and/or demand for our poultry products; contamination of our products, which has previously and can in the future lead to product liability claims and product recalls; exposure to risks related to product liability, product recalls, property damage and injuries to persons, for which insurance coverage is expensive, limited and potentially inadequate; changes in laws or regulations affecting our operations or the application thereof; new immigration legislation or increased enforcement efforts in connection with existing immigration legislation that cause our costs of business to increase, cause us to change the way in which we do business or otherwise disrupt our operations; competitive factors and pricing pressures or the loss of one or more of our largest customers; currency exchange rate fluctuations, trade barriers, exchange controls, expropriation and other risks associated with foreign operations; disruptions in international markets and distribution channels; and the impact of uncertainties of litigation as well as other risks described herein and under “Risk Factors” in the Company’s Annual Report on Form 10-K filed with the Securities and Exchange Commission (the “SEC”). Actual results could differ materially from those projected in these forward-looking statements as a result of these factors, among others, many of which are beyond our control. In making these statements, we are not undertaking, and specifically decline to undertake, any obligation to address or update each or any factor in future filings or communications regarding our business or results, and we are not undertaking to address how any of these factors may have caused changes to information contained in previous filings or communications. Although we have attempted to list comprehensively these important cautionary risk factors, we must caution investors and others that other factors may in the future prove to be important and affecting our business or results of operations. This presentation may include information that may be considered non-GAAP financial information as contemplated by SEC Regulation G, Rule 100, including EBITDA, Adjusted EBITDA, LTM EBITDA, Net Debt, Free Cash Flow, Adjusted EBITDA Margin and others. Accordingly, we have provided tables in the accompanying appendix and in our previous filings with the SEC that reconcile these measures to their corresponding GAAP-based measures and explain why these measures are useful to investors, which can be obtained from the Consolidated Statements of Income provided with our previous filings with the SEC. Our method of computation may or may not be comparable to other similarly titled measures used in filings with the SEC by other companies. See the consolidated statements of income and consolidated statements of cash flows included in our financial statements. 1

PRELIMINARY DRAFT Presenters Jayson Penn Chief Executive Officer, Pilgrim’s Pride Fabio Sandri Chief Financial Officer, Pilgrim’s Pride 2
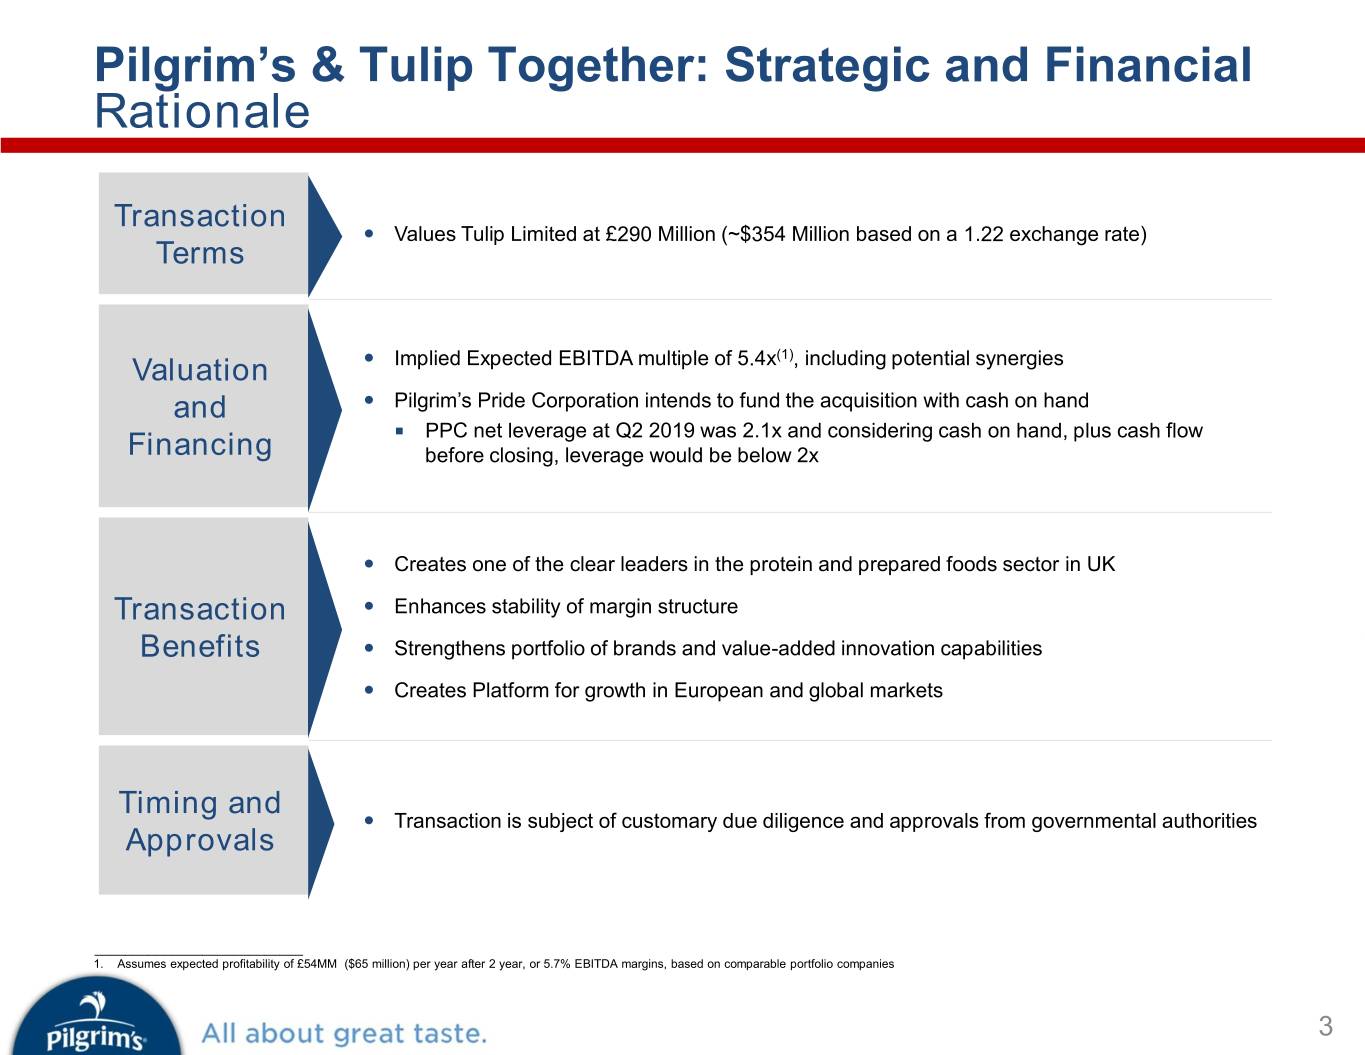
PRELIMINARY DRAFT Pilgrim’s & Tulip Together: Strategic and Financial Rationale Transaction Values Tulip Limited at £290 Million (~$354 Million based on a 1.22 exchange rate) Terms (1) Valuation Implied Expected EBITDA multiple of 5.4x , including potential synergies and Pilgrim’s Pride Corporation intends to fund the acquisition with cash on hand PPC net leverage at Q2 2019 was 2.1x and considering cash on hand, plus cash flow Financing before closing, leverage would be below 2x Creates one of the clear leaders in the protein and prepared foods sector in UK Transaction Enhances stability of margin structure Benefits Strengthens portfolio of brands and value-added innovation capabilities Creates Platform for growth in European and global markets Timing and Transaction is subject of customary due diligence and approvals from governmental authorities Approvals ___________________________ 1. Assumes expected profitability of £54MM ($65 million) per year after 2 year, or 5.7% EBITDA margins, based on comparable portfolio companies 3
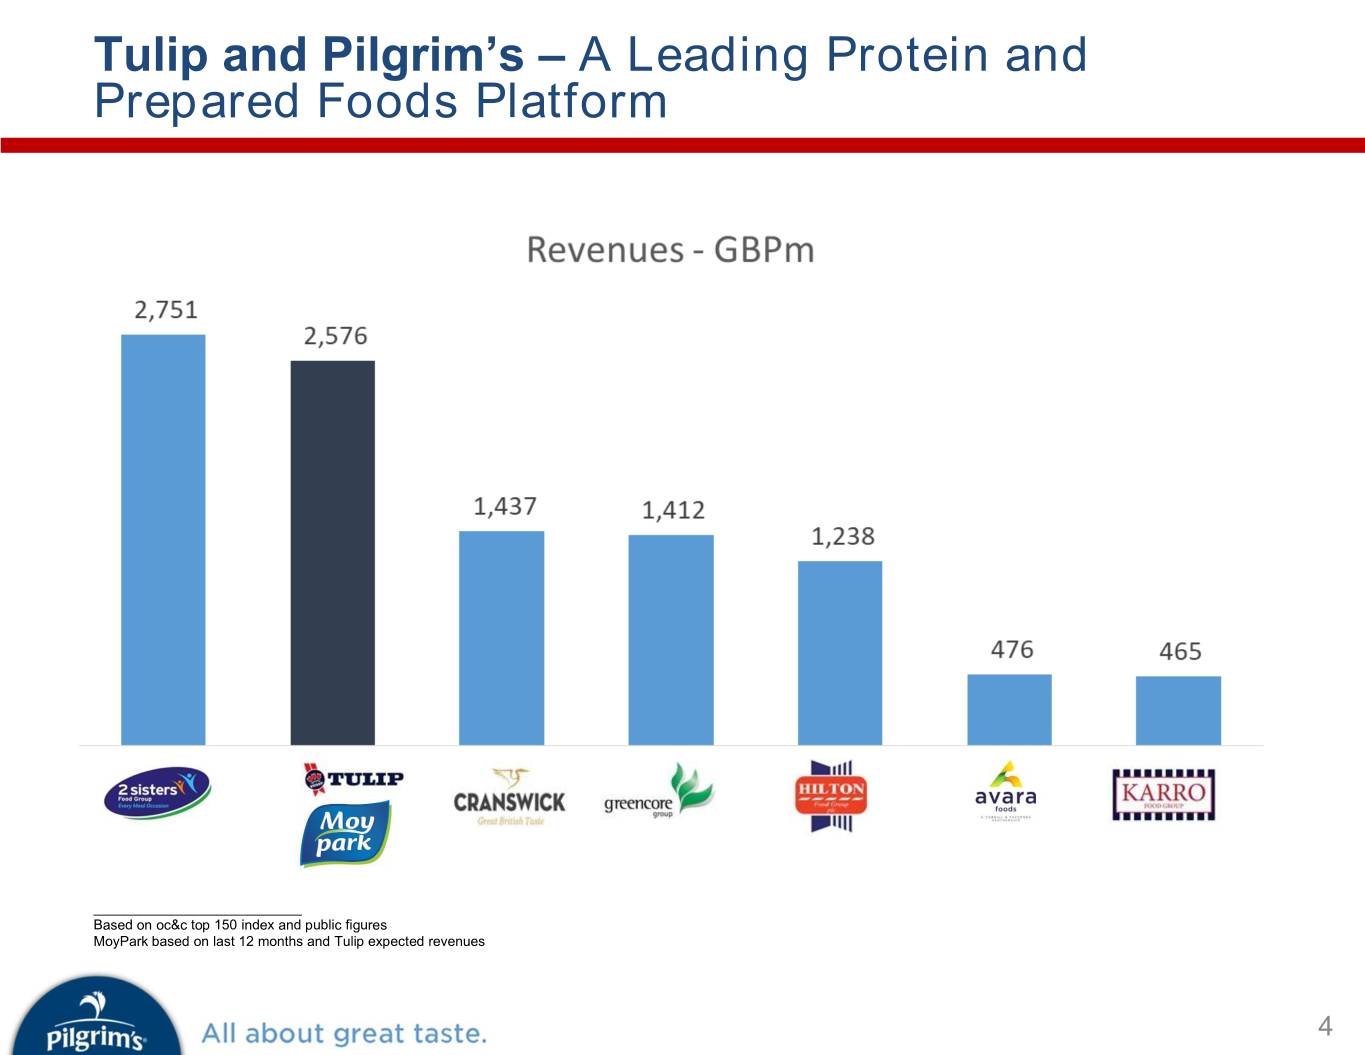
PRELIMINARY DRAFT Tulip and Pilgrim’s – A Leading Protein and Prepared Foods Platform ___________________________ Based on oc&c top 150 index and public figures MoyPark based on last 12 months and Tulip expected revenues 4
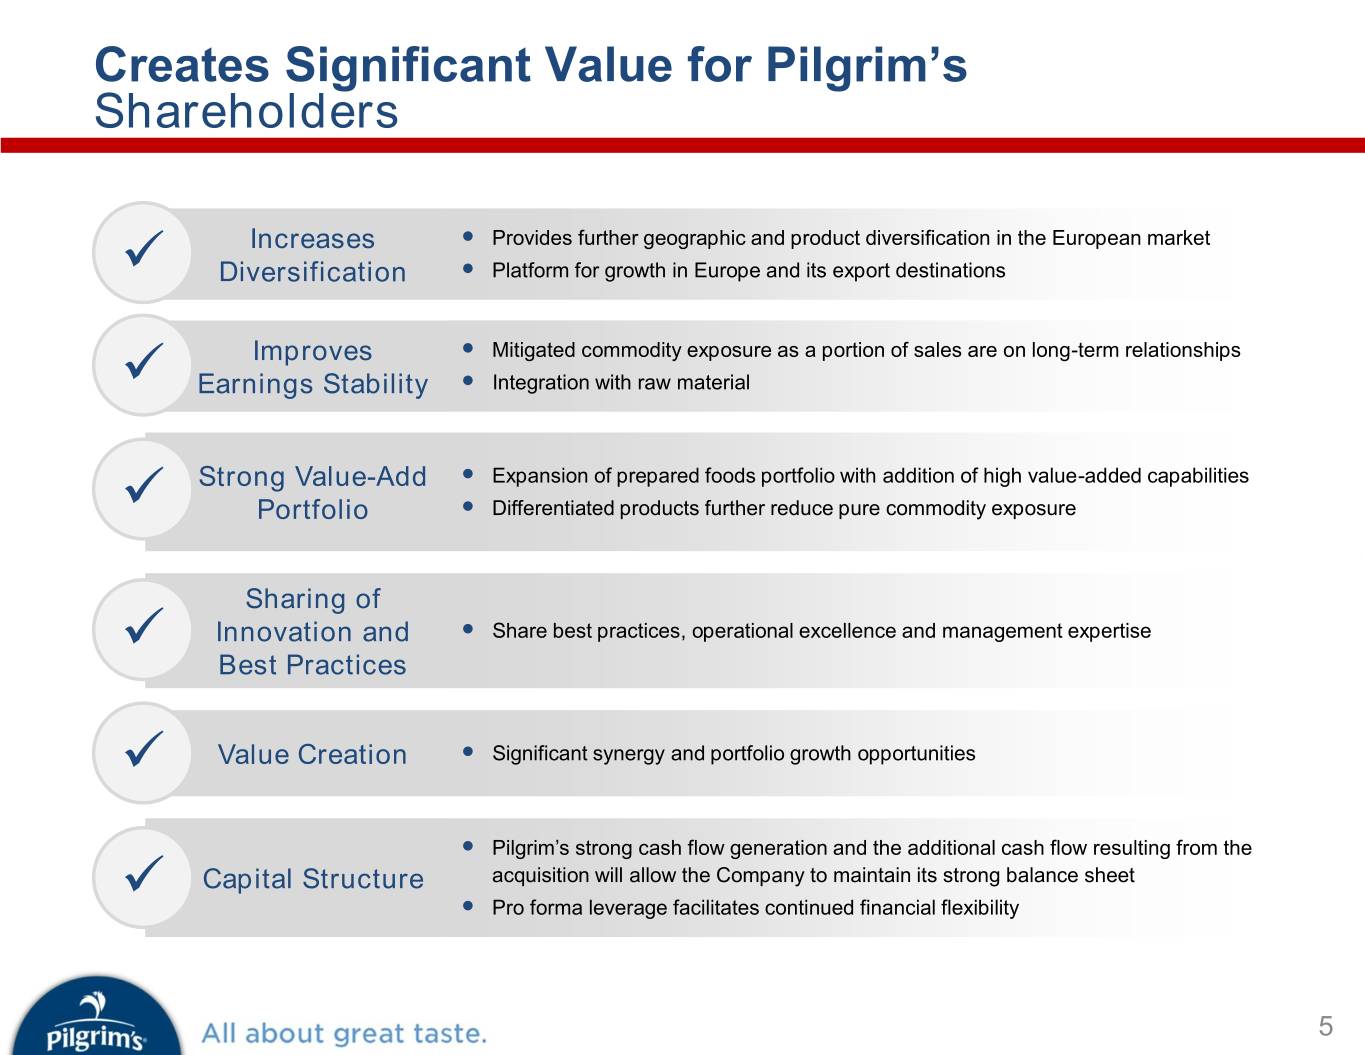
PRELIMINARY DRAFT Creates Significant Value for Pilgrim’s Shareholders Increases Provides further geographic and product diversification in the European market Diversification Platform for growth in Europe and its export destinations Improves Mitigated commodity exposure as a portion of sales are on long-term relationships Earnings Stability Integration with raw material Strong Value-Add Expansion of prepared foods portfolio with addition of high value-added capabilities Portfolio Differentiated products further reduce pure commodity exposure Sharing of Innovation and Share best practices, operational excellence and management expertise Best Practices Value Creation Significant synergy and portfolio growth opportunities Pilgrim’s strong cash flow generation and the additional cash flow resulting from the Capital Structure acquisition will allow the Company to maintain its strong balance sheet Pro forma leverage facilitates continued financial flexibility 5
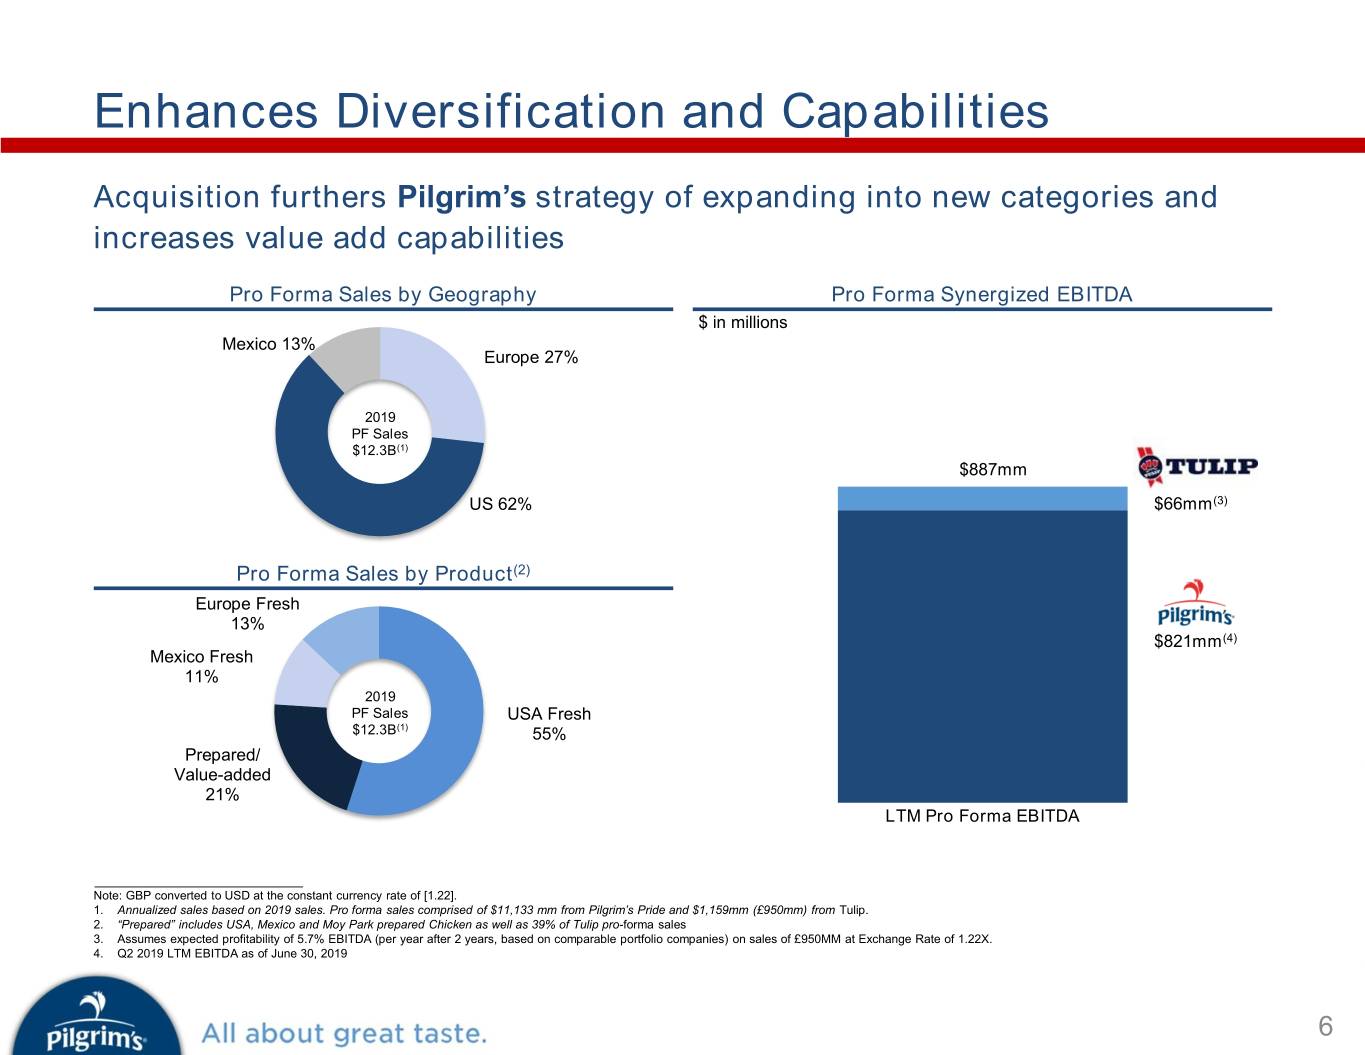
PRELIMINARY DRAFT Enhances Diversification and Capabilities Acquisition furthers Pilgrim’s strategy of expanding into new categories and increases value add capabilities Pro Forma Sales by Geography Pro Forma Synergized EBITDA $ in millions Mexico 13% Europe 27% 2019 PF Sales $12.3B(1) $887mm$889 US 62% $66mm(3) Pro Forma Sales by Product(2) Europe Fresh 13% $821mm(4) Mexico Fresh 11% 2019 PF Sales USA Fresh $12.3B(1) 55% Prepared/ Value-added 21% LTM Pro Forma EBITDA ___________________________ Note: GBP converted to USD at the constant currency rate of [1.22]. 1. Annualized sales based on 2019 sales. Pro forma sales comprised of $11,133 mm from Pilgrim’s Pride and $1,159mm (£950mm) from Tulip. 2. “Prepared” includes USA, Mexico and Moy Park prepared Chicken as well as 39% of Tulip pro-forma sales 3. Assumes expected profitability of 5.7% EBITDA (per year after 2 years, based on comparable portfolio companies) on sales of £950MM at Exchange Rate of 1.22X. 4. Q2 2019 LTM EBITDA as of June 30, 2019 6
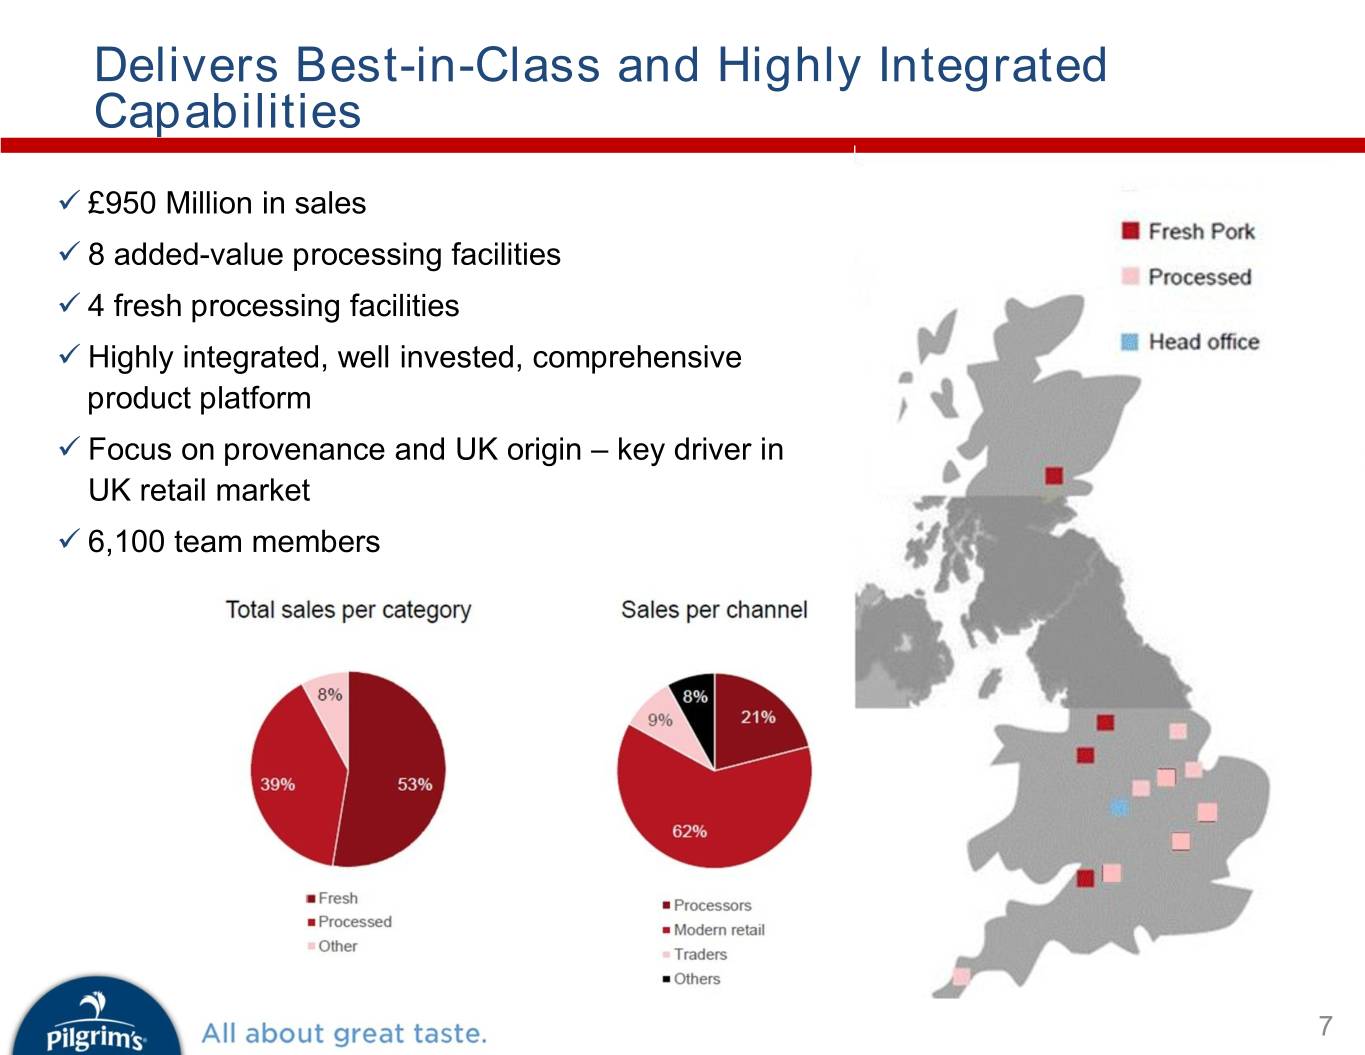
PRELIMINARY DRAFT Delivers Best-in-Class and Highly Integrated Capabilities £950 Million in sales 8 added-value processing facilities 4 fresh processing facilities Highly integrated, well invested, comprehensive product platform Focus on provenance and UK origin – key driver in UK retail market 6,100 team members 7

PRELIMINARY DRAFT Adds Attractive Portfolio with a Broad Product and Customer Mix 8
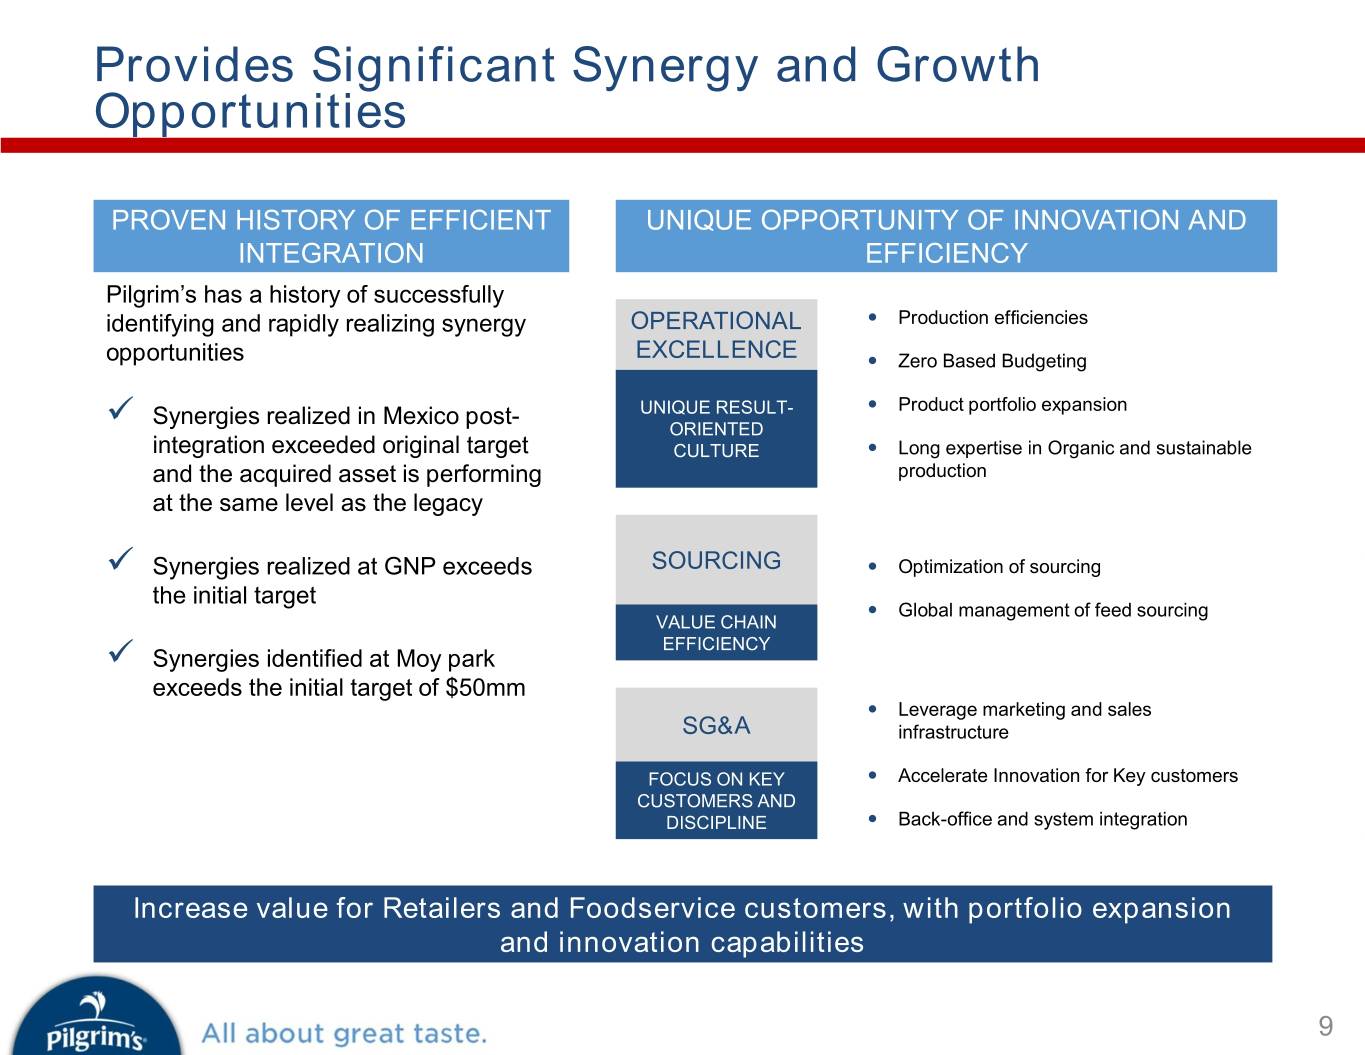
PRELIMINARY DRAFT Provides Significant Synergy and Growth Opportunities PROVEN HISTORY OF EFFICIENT UNIQUE OPPORTUNITY OF INNOVATION AND INTEGRATION EFFICIENCY Pilgrim’s has a history of successfully identifying and rapidly realizing synergy OPERATIONAL Production efficiencies opportunities EXCELLENCE Zero Based Budgeting Synergies realized in Mexico post- UNIQUE RESULT- Product portfolio expansion ORIENTED integration exceeded original target CULTURE Long expertise in Organic and sustainable and the acquired asset is performing production at the same level as the legacy Synergies realized at GNP exceeds SOURCING Optimization of sourcing the initial target Global management of feed sourcing VALUE CHAIN EFFICIENCY Synergies identified at Moy park exceeds the initial target of $50mm Leverage marketing and sales SG&A infrastructure FOCUS ON KEY Accelerate Innovation for Key customers CUSTOMERS AND DISCIPLINE Back-office and system integration Increase value for Retailers and Foodservice customers, with portfolio expansion and innovation capabilities 9
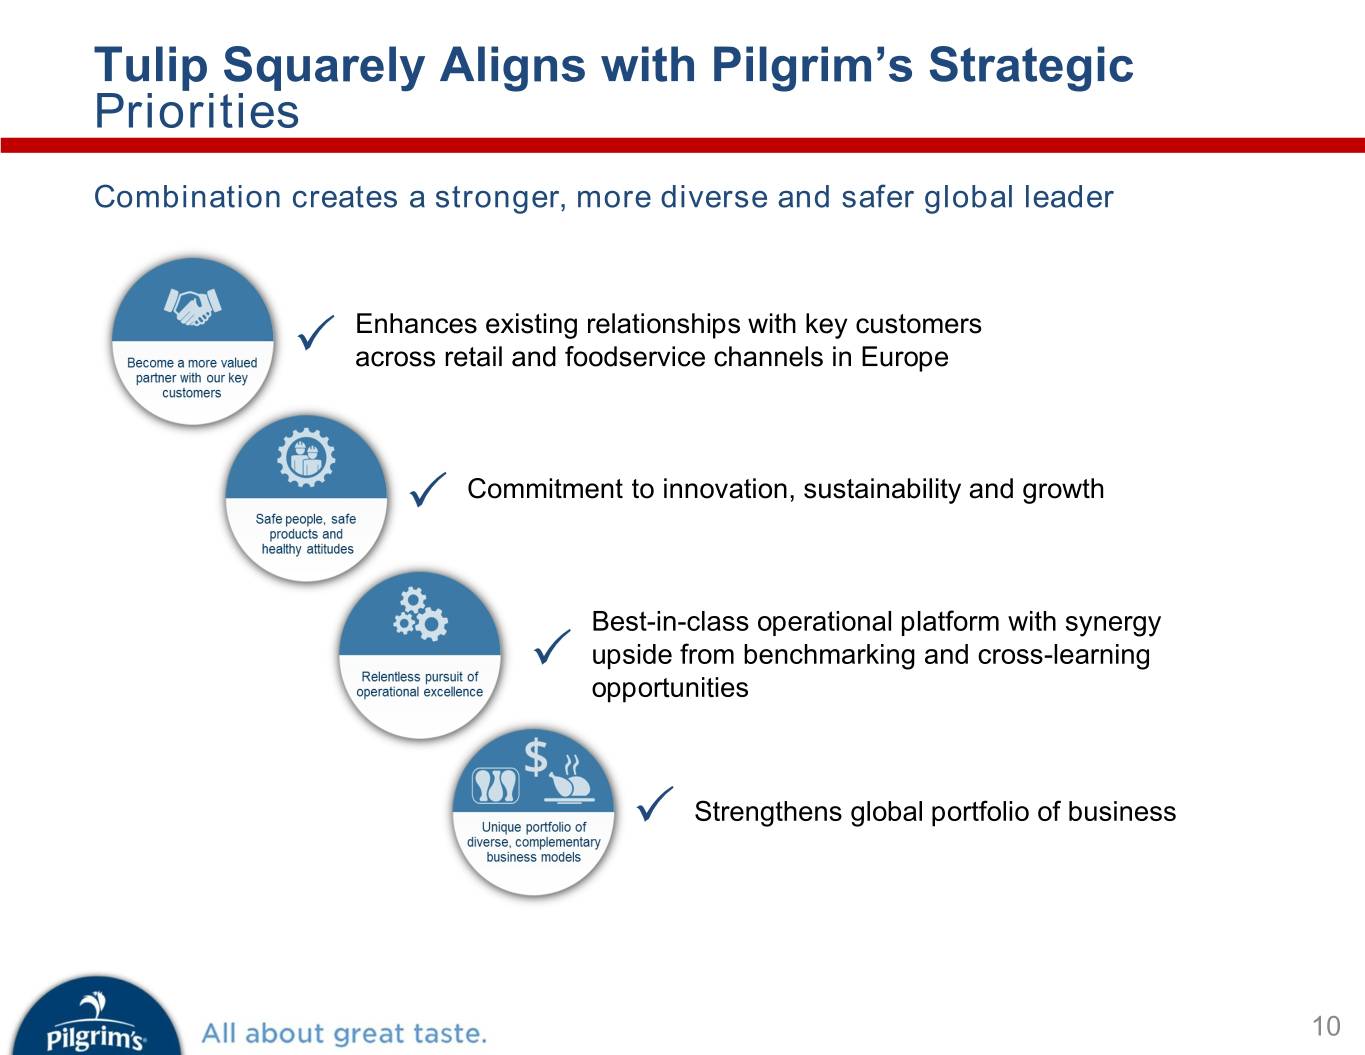
PRELIMINARY DRAFT Tulip Squarely Aligns with Pilgrim’s Strategic Priorities Combination creates a stronger, more diverse and safer global leader Enhances existing relationships with key customers across retail and foodservice channels in Europe Commitment to innovation, sustainability and growth Best-in-class operational platform with synergy upside from benchmarking and cross-learning opportunities Strengthens global portfolio of business 10
PRELIMINARY DRAFT Q&A 11

PRELIMINARY DRAFT Appendix: Reconciliation of LTM EBITDA The summary unaudited consolidated income statement data for the twelve months ended June 30, 2019 (the LTM Period) have been calculated by subtracting the applicable unaudited consolidated income statement data for the six months ended July 1, 2018 from the sum of (1) the applicable audited consolidated income statement data for the year ended December 30, 2018 and (2) the applicable audited consolidated income statement data for the six months ended June 30, 2019. PILGRIM'S PRIDE CORPORATION Reconciliation of LTM Adjusted EBITDA Thirteen Weeks Thirteen Weeks Thirteen Weeks Thirteen Weeks LTM Ended (Unaudited) Ended Ended Ended Ended September 30, December 30, March 31, June 30, June 30, 2018 2018 2019 2019 2019 (In thousands) Net income $ 29,463 $ (8,227) $ 84,125 $ 170,080 $ 275,441 Add: Interest expense, net 31,093 33,765 30,222 30,150 125,230 Income tax expense 30,848 (20,944) 20,416 75,547 105,867 Depreciation and amortization 71,027 66,975 67,182 71,348 276,532 EBITDA 162,431 71,569 201,945 347,125 783,070 Add: Foreign currency transaction losses (gains) (6,711) 19,962 2,636 2,260 18,147 Acquisition charges 16 — — — 16 Restructuring activities 257 2,584 (27) (43) 2,771 Other nonrecurring losses and expenses 164 16,023 — — 16,187 Minus: Net income (loss) attributable to noncontrolling interest 153 (903) 114 12 (624) Adjusted EBITDA $ 156,004 $ 111,041 $ 204,440 $ 349,330 $ 820,815 Source: PPC. Source: PPC 12
PRELIMINARY DRAFT 13


