 Pilgrim's Pride Corporation's Acquisition of Gold Kist Inc. Creating the World’s Leading Chicken Producer December 12, 2006 The following presentation was posted on Pilgrim’s Pride’s Corporation’s external web site: Exhibit (a)(48) |
 |
 2 Proposed Transaction – Pilgrim’s Pride (NYSE:PPC) publicly announced on December 4, 2006 that it had entered into a definitive merger agreement to acquire Gold Kist Inc. (NasdaqGS:GKIS) for $21 per share • Represents a 62% premium to the August 18, 2006 closing price of $12.93 • Initially approached Gold Kist in 2004 prior to its IPO • Recent offer proposals began in February 2006 – We maintain our strong desire to close this transaction with Gold Kist to create the world’s largest chicken company • Powerful strategic and financial rationale – Anticipated close: early CY2007 |
 3 Attractive Proposal… – Value creation expected for all shareholders Offer Summary (amounts in millions except per share amounts) Price Per Share (8/18/06) $12.93 Offer Price Per Share $21.00 Fully-Diluted Share Count (1)(2) 51.4 Purchase Price of Gold Kist equity $1,079 Assumed Gold Kist Debt (3) $144 Cash on Gold Kist Balance Sheet (3)(4) 93 Total Enterprise Value of Offer (5) $1,130 Offer Price as a Percent of Gold Kist's: Close Price (8/18/06) 162% Prior 90-Day Average (8/18/06) 154% 52-Week High (8/18/06) 100% (1) Reflects repurchase of shares from option proceeds. (2) As of 12/2/06. (3) As of 9/30/06. (4) Includes $15.9 million in Investments. (5) Does not include fees and deal-related expenses. |
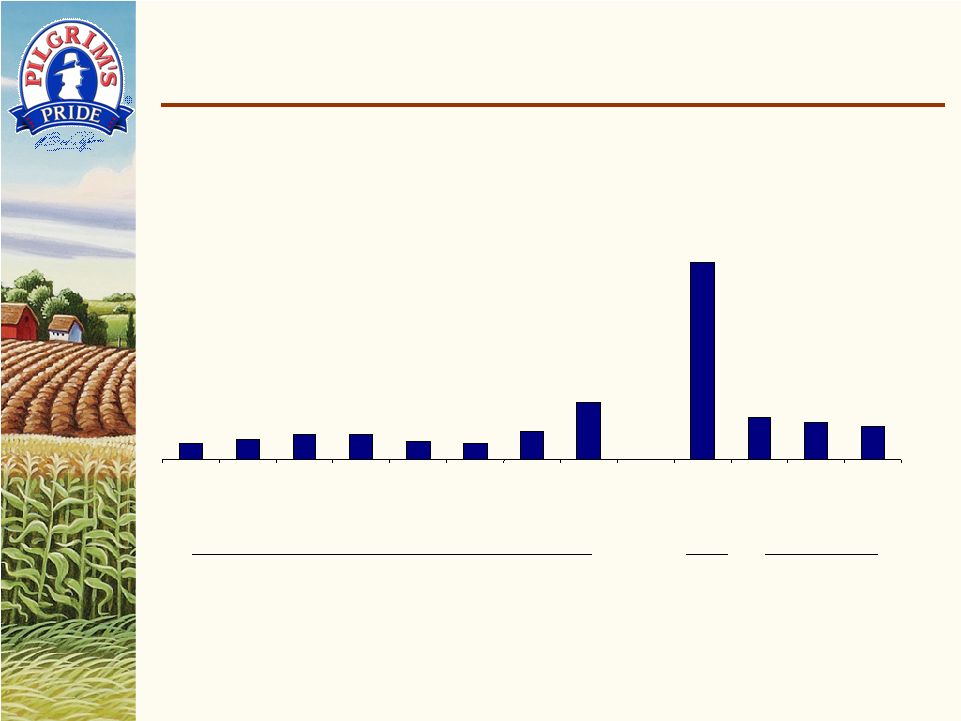 4 …Relative to Historical Multiples Gold Kist Enterprise Value/EBITDA Multiples $21.00 Offer as Multiples of EBITDA Assuming Normalized Operating Margins (5) Historical Trailing EBITDA Multiples (1)(2) – Our proposal represents full value for Gold Kist (1) Historical trailing multiples calculated as follows: The numerator is the enterprise value derived from the prior quarter’s balance sheet and the final close price at the end of the current quarter. The denominator is the LTM EBITDA as of the prior quarter. (2) Data per Capital IQ. (3) Please see Appendix A for calculation. (4) Per Gold Kist’s public filings. (5) Please see Appendix B for calculation. $21.00 Offer as a Multiple of LTM Adjusted EBITDA (3) 2.8x 3.3x 4.3x 4.3x 3.0x 2.7x 4.8x 9.8x 34.1x 7.2x 6.3x 5.7x 12/31/04 3/31/05 6/30/05 9/30/05 12/31/05 3/31/06 6/30/06 Multiple as of 8/18/06 based on LTM Adjusted EBITDA (1%) LTM Operating Margin 5% 6% 7% (3) (4) |
 5 U.S. Chicken Industry Leaders Market Share by Production (1) Source: WATT Poultry USA, January 2006. (1) Ready-To-Cook million pounds per week. (2) As used in this presentation, PF = Pro Forma. Creates the Number One Chicken Company in North America (2) 2.5% 4.0% 4.3% 4.3% 7.3% 8.8% 16.0% 21.4% PF 24.8% Foster Farms Mountaire Farms Wayne Farms Sanderson Farms Perdue Farms Gold Kist Pilgrim's Pride Tyson Foods Pilgrim's Pride & Gold Kist |
 6 – Combined company would be the #3 U.S. protein company by revenue – Largest pure-play dedicated to chicken LTM Revenues ($ in millions) Note: LTM results through the most recent twelve-month reporting period for each public entity. (1) Does not include pro forma results from pending acquisition of Premium Standard Farms. Formidable Protein Industry Player Pilgrim’s Pride Gold Kist Sanderson Farms Chicken Hormel Foods Pilgrim’s Pride & Gold Kist Smithfield Foods Tyson Foods Pork Beef $1,048 $2,127 $5,236 $5,746 $11,183 $25,559 PF $7,363 Sanderson Farms Gold Kist Pilgrim's Pride Hormel Foods Pilgrim's Pride & Gold Kist Smithfield Foods Tyson Foods (1) |
 7 Powerful Combination – Delivers compelling economics to shareholders of both companies • Balanced portfolio of fresh chicken and value-added products • Further economies of scale • Estimated synergies of $50 million – Production – Purchasing – Distribution – Logistics – Selling, General & Administrative – No anticipated plant closings or production headcount reductions – Better serve existing customers and expand customer base – Consolidation of a still fragmented industry |
 8 Capitalize on significant scale with leading industry position and brand recognition Capitalize on attractive U.S. prepared foods market Enhance U.S. fresh chicken profitability through value- added, branded products Improve operating efficiencies and increase capacity on a cost-effective basis Continue to seek strategic acquisitions Capitalize on export opportunities Consistent With Pilgrim’s Pride Long- Standing Business Strategy |
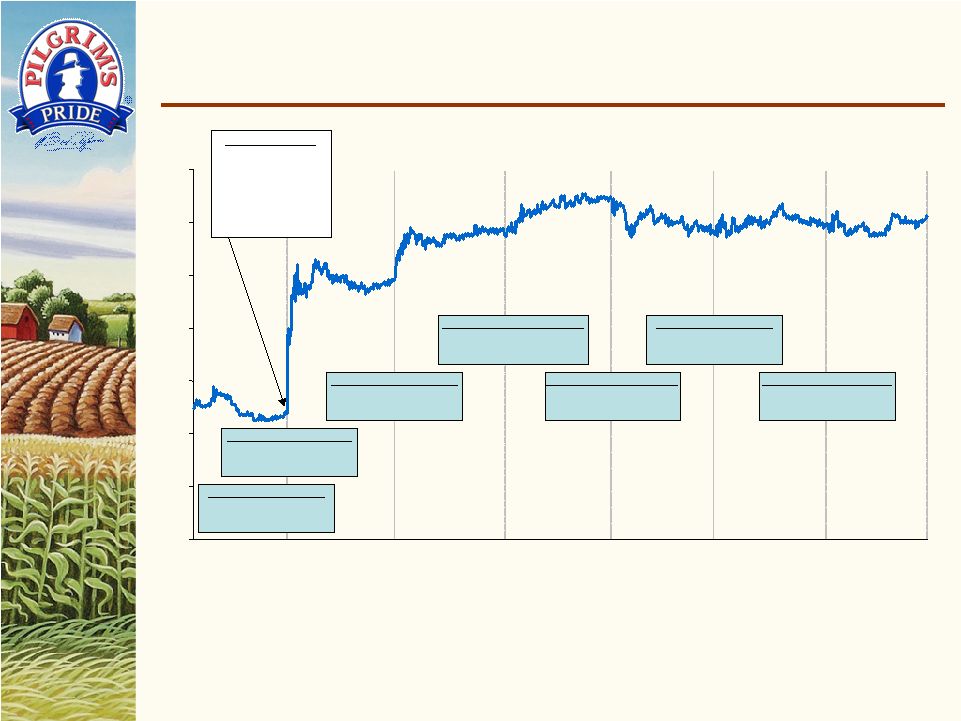 9 Pilgrim’s Pride Stock Since Deal Announcement Friday, December 1, 2006 Close: $25.38 Change: -0.14 (-0.5%) Monday, December 4, 2006 Close: $27.90 Change: 2.52 (9.9%) December 4, 2006 Announcement of merger agreement between Pilgrim’s Pride and Gold Kist prior to market open – Pilgrim’s Pride’s stock price has risen 15% since announcement $23.00 $24.00 $25.00 $26.00 $27.00 $28.00 $29.00 $30.00 12/1/06 12/4/06 12/5/06 12/6/06 12/7/06 12/8/06 12/11/06 12/11/06 close Tuesday, December 5, 2006 Close: $28.75 Change: 0.85 (3.0%) Wednesday, December 6, 2006 Close: $29.44 Change: 0.69 (2.4%) Thursday, December 7, 2006 Close: $28.79 Change: -0.65 (-2.2%) Friday, December 8, 2006 Close: $28.98 Change: 0.19 (0.7%) Monday, December 11, 2006 Close: $29.09 Change: 0.11 (0.4%) |
 10 Expanded Geographic Footprint… – Gold Kist acquisition expands Southeast presence Pilgrim's Pride’s Chicken Processing Pilgrim's Pride's Turkey Processing Pilgrim's Pride's Prepared Foods Pilgrim's Pride's Distribution Centers Gold Kist Chicken Processing Gold Kist Distribution Centers Gold Kist Prepared Food Plant |
 11 …With More Diversified End Markets 64% 20% 16% Pilgrim’s Pride Gold Kist Combined 38% 19% 43% 57% 20% 24% Foodservice Retail Export/Other FY 2005 Net Sales: $5.7 BN FY 2005 Net Sales: $2.3 BN FY 2005 Net Sales: $8.0 BN – Enhances retail prepared foods opportunities Source: WATT Poultry USA, January 2006. |
 |
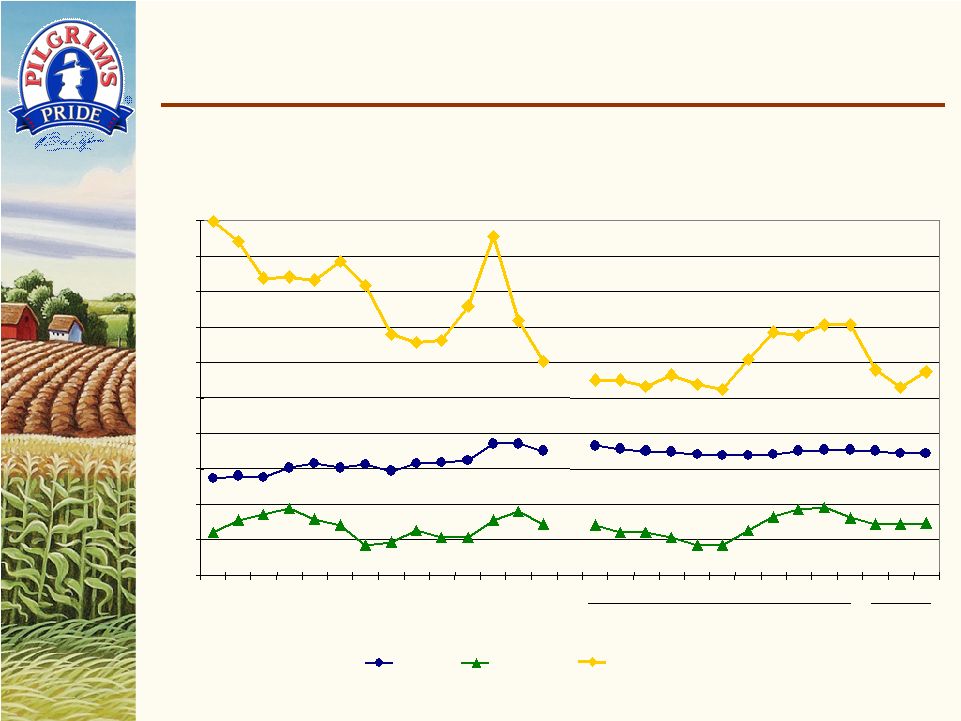 13 Source: UrnerBarry Publications, Inc. (1) Month to date through December 8, 2006. …Leading to Stabilized Pricing Outlook Average Prices Over Periods Represented Fiscal Years FY 2006 (1) FY 2007 $0.00 $0.20 $0.40 $0.60 $0.80 $1.00 $1.20 $1.40 $1.60 $1.80 $2.00 '93 '94 '95 '96 '97 '98 '99 '00 '01 '02 '03 '04 '05 '06 N D J F M A M J J A S O N D GA Dock Leg Quarters Boneless Skinless Breast |
 14 Combined Company ($ in millions) FYE 9/30/06 Net Sales Pilgrim's Pride $5,236 Gold Kist 2,127 Combined Net Sales $7,363 EBITDA (1) Pilgrim's Pride - Adjusted EBITDA $143 Gold Kist - Adjusted EBITDA 33 Combined Adjusted EBITDA $176 Capital Expenditures (2) Pilgrim's Pride $144 Gold Kist 90 Combined Capital Expenditures $234 (1) See Appendix A for reconciliation. (2) CapEx data per FY2006 Q4 earnings release conference calls for Pilgrim's Pride and Gold Kist. |
 15 339 91 430 Term Loans 450 – 450 Bridge Loan $2,025 $125 795 $225 – $ – Facility Amount $125 $ – Receivables purchase agreement 795 – Revolving/term facility $1,836 $166 Total Available From Debt Facilities $127 $75 Revolving credit facilities Debt Facilities: 137 – Investments in available for sale securities $156 $ – Cash and cash equivalents Net Available Amount Outstanding Source of Liquidity As of September 30, 2006 ($ in millions) Liquidity and Financial Capacity (1) (2) (2) (3) (1) At September 30, 2006, the Company had $23.4 million in letters of credit outstanding relating to normal business transactions. (2) The amount available at September 30, 2006 under these facilities was $535.3 million. If the transaction is successful, the amount of borrowings available will increase by up to $486 million and, with the pledging of additional identified collateral to secure this facility; the full amount of the commitment under this facility will be available. The amounts reflected above contemplate that both of these events will occur. (3) Reflects a bridge loan agreement obtained by the Company from certain investment banks, pursuant to which, subject to specified conditions, the investment banks have agreed to make available to the Company a $450 million senior unsecured bridge loan for the purchase of shares of common stock of Gold Kist. |
 Appendix |
 17 Appendix A: EBITDA Reconciliation ($ in millions) As of 8/18/06 Present LTM LTM 6/30/06 9/30/06 Adjusted EBITDA Reconciliation Net Income Pilgrim's Pride $48 ($34) Gold Kist $4 ($18) Combined Net Income $52 ($52) Adjustments: Pilgrim's Pride - Add: Income Tax Expense $13 ($2) Net Interest Expense 40 41 Depreciation & Amortization (1) 138 133 Pilgrim's Pride - Adjustments: Accounting Adjustment - Benefit Plans $0 6 Gold Kist - Add: Income Tax Expense (Benefit) ($3) ($15) Net Interest Expense 11 10 Depreciation & Amortization (1) 50 51 Gold Kist - Adjustments: Benefit Plan and Pension Settlement Loss 1 - Loss on Investment 3 - Debt Prepayment Penalties 6 - Antitrust Settlement (Benefit) - (1) Unsolicited Offer Expenses - 6 Adjusted EBITDA Pilgrim's Pride $239 $143 Gold Kist 72 33 Combined Adjusted EBITDA $311 $176 (1) Excludes amortization of capitalized finance costs and includes amortization of share-based compensation. |
 18 Appendix B: Implied Normalized Gold Kist Operating Margins Implied Normalized Financial Information – Gold Kist ($ in millions) Fiscal Year Ending September 30, FY2006 Sales $2,127 $2,127 $2,127 Assumed Normalized EBIT Margin 5% 6% 7% Implied Normalized EBIT $106 $128 $149 Plus: Depreciation & Amortization (1) 51 51 51 Implied Normalized EBITDA $157 $178 $200 Actual FY2006 Adjusted EBITDA $33 $33 $33 Enterprise Value at $21 per share $1,130 $1,130 $1,130 EV/Sales 0.53x 0.53x 0.53x EV/Normalized EBITDA 7.2x 6.3x 5.7x (1) Depreciation assumed to be equivalent to LTM as of 9/30/06. |