Item 1: Report to Shareholders| Growth Stock Fund | June 30, 2005 |
The views and opinions in this report were current as of June 30, 2005. They are not guarantees of performance or investment results and should not be taken as investment advice. Investment decisions reflect a variety of factors, and the managers reserve the right to change their views about individual stocks, sectors, and the markets at any time. As a result, the views expressed should not be relied upon as a forecast of the fund’s future investment intent. The report is certified under the Sarbanes-Oxley Act of 2002, which requires mutual funds and other public companies to affirm that, to the best of their knowledge, the information in their financial reports is fairly and accurately stated in all material respects.
REPORTS ON THE WEB
Sign up for our E-mail Program, and you can begin to receive updated fund reports and prospectuses online rather than through the mail. Log in to your account at troweprice.com for more information.
Fellow Shareholders
Growth stocks struggled in the first half of 2005 as second-quarter gains fell short of first-quarter losses. Investors continued to ignore high-quality, large-cap growth stocks even though corporate earnings remained strong, the U.S. economy expanded at close to a 4% rate, and interest rates and inflation remained at levels that we think are conducive to favorable investment performance.
| PERFORMANCE COMPARISON |
| Periods Ended 6/30/05 | 6 Months | 12 Months |
| Growth Stock Fund | -1.16% | 6.25% |
| Growth Stock Fund–Advisor Class | -1.24 | 6.08 |
| Growth Stock Fund–R Class | -1.36 | 5.78 |
| S&P 500 Index | -0.81 | 6.32 |
| Russell 1000 Growth Index | -1.72 | 1.68 |
| Lipper Large-Cap Growth | | |
| Funds Index | -1.28 | 3.82 |
For the six-month period, the Growth Stock Fund posted minor losses, trailing the unmanaged S&P 500 Index, but marginally outperforming the Lipper Large-Cap Growth Funds Index and the style-specific Russell 1000 Growth Index. (Results for Advisor and R Class shares were slightly lower, reflecting their higher expense ratios.) Value sectors outperformed growth in the first half, and our underweight in energy and utilities and overweight in the growth-oriented technology sector hurt the portfolio’s relative returns. The portfolio’s results were in line with the S&P 500 and outpaced the Lipper and Russell yardsticks for the past 12 months.
There is always a struggle when I write shareholder letters regarding the mix of fact and opinion, broad views or specifics, and the past or the future. While attempting to paint a little of each, I always try to dip my brush in the colors deemed most pertinent. I appreciate that you allow me this liberty. In addition, I attempt to cover what occurred, why it occurred, how it might have changed our views, and how this may have affected the portfolio during and at the end of the period under review. Additionally, I will usually remind you about the fund’s investment philosophy, if for no other reason than to affirm it has not changed.
Our philosophy is as follows: We believe that over time earnings growth drives stock prices and owning companies that grow significantly faster than the market yields much better returns for shareholders. While that sounds easy, the trick is in finding those companies that actually grow much faster, and then paying a fair price for that growth.
Before discussing the underlying components of performance, let me offer the following thoughts. Over the past five years, most of the companies we own performed well from an earnings perspective, but most of the stocks performed poorly. Dell is a good example, its earnings have risen around 20% a year, and the stock trades at the same price it was five years ago. If the assumption in our investment philosophy is correct—over time, stocks move with earnings—the divergence in earnings and stock appreciation cannot persist. While many large-cap growth stocks were too richly valued five years ago, I feel very good about their valuations and continued growth prospects today. (Please refer to the portfolio of investments for a complete listing of holdings and the amount each represents of the portfolio.)
Despite its recent travails, the Growth Stock Fund’s long-term performance continues to compare extremely well relative to its competitors. Lipper ranked the fund in the top 9% of its large-cap growth funds universe for the 3-, 5-, and 10-year periods ended June 30, 2005. (Based on total return, Lipper ranked the Growth Stock Fund 105 out of 663, 45 out of 545, 12 out of 432, and 5 out of 140 funds for the 1-, 3-, 5-, and 10-year periods ended June 30, 2005, respectively. Results will vary for other periods. Past performance cannot guarantee future results.)
MARKET ENVIRONMENT
After growing at a torrid 4.4% rate in 2004, the U.S. economy slowed to a more moderate pace in the first half of 2005. The Federal Reserve continued its series of short-term interest rate increases, raising rates by a quarter-point four times in the past six months after five similar rate hikes in the prior six months. Large-cap U.S. stocks declined sharply in the March quarter amid fears of slower economic growth accompanied by higher inflation. However, the generally tame inflation environment and a surge in corporate merger-and-acquisition activity helped stocks regain lost ground in the second quarter.
In the first half, the market’s two best-performing sectors were energy, which benefited from surging oil prices, and utilities, which drew attention from income-oriented investors in search of higher yields in the low-rate environment. Other than a modest gain in health care stocks, the remaining sectors all declined. The two most economically sensitive sectors—materials and information technology—posted the largest losses. The value style continued its market leadership, outpacing growth-oriented shares across all market capitalizations.
PORTFOLIO REVIEW
The portfolio benefited from double-digit returns in the energy sector, although our substantial underweight—energy stocks typically lack the growth characteristics we seek—hampered our results versus the S&P 500. Energy services stocks Baker Hughes and Schlumberger were strong contributors. These companies possess substantial international presence and have benefited from increased producer spending worldwide. Major integrated oil and gas producer ExxonMobil also generated a strong performance contribution. It benefited from higher oil and gas prices and posted record profits.
Over the long haul, we think oil services companies offer better growth potential than the actual providers of oil. This prompted us to eliminate our position in Chevron shortly after it announced plans to acquire Unocal, an independent oil and gas exploration and production company. We believe this deal provides little strategic upside for Chevron, adds some doubt regarding Chevron’s ability to meet its long-term growth targets, and raises questions as to whether recent exploration efforts were as successful as we were led to believe.
Our health care service companies have performed very well for several years, and UnitedHealth Group and WellPoint were again among our best contributors for the past six months. Two major positives have been their ability to increase prices by 7% to 8% per year, and although they have not added a lot of new members, they benefited from significant improvements in technology. For example, UnitedHealth has effectively utilized state-of-the-art technology to estimate new-business costs. Actual costs are now very close to projections, eliminating much of the quarter-to-quarter earnings variability, which is pleasing the investment community. The market ignored the strength of these two franchises for a long time, but today’s valuations fully reflect their strength, prompting us to reduce our exposure.
Our biotech industry holdings were a negative for the year, but Genentech and Gilead Sciences were among the top contributors for the past six months. Genentech is firing on all cylinders. The stock staged a powerful first-half advance in large part because of its cancer drug Avastin, which demonstrated the ability to fight advanced cases of breast cancer, expanding the drug’s potential usefulness to a third major type of cancer. Gilead’s business momentum is accelerating, both in the U.S. and Europe, and there are strong indications that Truvada, its new combination HIV drug, is superior to the leading competitor.
Irish pharmaceutical company Elan and biotech leader Biogen Idec were among our largest first-half detractors both on an absolute and relative performance basis. We initiated positions in both stocks in the fourth quarter of 2004 as increasing evidence indicated their combined new multiple sclerosis drug Tysabri was going to be a blockbuster sales success. However, we were blindsided by their announcement of a voluntary suspension of Tysabri after it was linked to potentially fatal side effects.
| PORTFOLIO CHARACTERISTICS |
| |
| | Growth Stock | S&P 500 |
| | Domestic | Stock |
| As of 6/30/05 | Portfolio | Index |
| Earnings Growth Rate | | |
| Past 5 Years | 10.9% | 10.8% |
| Projected 5 Years * | 14.9 | 11.2 |
| |
| Return on Equity | | |
| Past 5 Years | 16.9 | 18.7 |
| |
| Long-Term Debt as | | |
| Percent of Capital | 23.2 | 28.6 |
| |
| P/E Ratio (12-month forward | | |
| projected earnings) * | 17.5X | 15.4X |
| |
| * Source data: IBES. Forecasts are in no way indicative of future |
| * investment returns. | | |
It was a surprise because the drug had been granted accelerated approval by the FDA in an unprecedented one-year trial and it demonstrated long-term efficacy consistent with its strong one-year data. We eliminated Elan from the portfolio shortly after the announcement because the loss of Tysabri would have a material impact on earnings. However, we pared, rather than eliminated, our Biogen position because of its solid track record and the strength of its other leading drugs, including Rituxan for B-cell non-Hodgkin’s lymphoma. We believe the strength of Biogen’s entire portfolio makes it a position worth holding.
Information technology, the portfolio’s largest sector (24.6% of net assets) and its largest overweight versus the S&P 500, was a moderate detractor for the past six months. During the period, despite a modicum of skepticism, we significantly increased our exposure as general business conditions improved and valuations fell. We are believers in the axiom, “In the short term the market is a voting machine and in the long term it is a weighing machine.” In our estimation, the best time to buy is when the vote is depressed and the weight is increasing. While we feel good about the additions, in the short term they crimped performance. However, the sector produced several of the portfolio’s top contributors. Corning, the dominant producer of the glass used for flat-screen televisions and monitors, was our best first-half contributor. It is one of the few companies where we see exceptional growth potential for the next two or three years, largely due to the increasing demand for flat-screen televisions.
Google and Intel were also 10-best performers. Google continued to be a darling among Internet services stocks, and we’ve booked tremendous profits. However, we are mindful of its rich valuation. Google’s market cap has eclipsed $85 billion, making its paid search business one of the highest-valued products in the world. We added to our position in Intel because of increasing demand for higher-priced chips, the company’s attractive valuation, and improving growth prospects.
The IT services and software industries represented the “dark side” of the technology sector. Our positions in management consulting firm Accenture, outsourcing provider Affiliated Computers, and software developer Microsoft were significant detractors. Sluggish business conditions and fierce competition weighed on tech services stocks. We increased our Accenture position on weakness, believing it is well-positioned to benefit from a rebound in consulting services, which generally pick up in the latter stages of an economic cycle, and because of its attractive valuation after the recent period of underperformance. Investor concerns about Microsoft’s competitive stance in its Internet services business and the success of its new Longhorn operating system contributed to a modest share price decline over the past six months. Microsoft is an example of the market’s lack of interest in large-cap stocks. Over the next 18 months, Microsoft will launch important new products in all of its business segments, and no one seems to care. We care, and bought more!
There were precious few stocks to cheer about in the financials, industrials and business services, and consumer discretionary sectors—the portfolio’s worst performers. Rising short-term interest rates and a flattening yield curve were negatives for financials and hurt our holdings in insurance and capital markets. Property and casualty insurer American International Group declined on allegations of improper accounting practices. Although we were disappointed with the recently ousted CEO, we still believe in the strength of its franchise. In our view, the company is well-positioned in the property and casualty business and can continue to grow earnings at a double-digit clip for several years.
Industrial conglomerates Tyco International and GE were responsible for the bulk of the losses in the industrials and business services sector. The group benefited from a strengthening economy in 2004 but struggled in the first half of 2005 as investors became concerned about economic growth. Rising commodity prices and weak European auto sales significantly hurt Tyco’s first-quarter earnings results. As we became concerned about the company’s longer-term growth prospects, we cut our position back. GE’s weakness resulted in attractive valuation, allowing us to significantly increase our position in the latter part of the period. We are confident that GE’s largest businesses, power and aerospace, are positioned to generate double-digit earnings growth over the next two years.
| SECTOR DIVERSIFICATION |
| | Percent of Net Assets |
| 12/31/04 | 6/30/05 |
| Information Technology | 21.2% | 24.6% |
| Financials | 20.5 | 18.6 |
| Consumer Discretionary | 19.1 | 18.2 |
| Health Care | 13.3 | 13.1 |
| Industrials and Business Services | 9.0 | 7.9 |
| Consumer Staples | 5.3 | 5.8 |
| Energy | 4.2 | 4.9 |
| Telecommunication Services | 3.3 | 3.4 |
| Materials | 1.9 | 1.1 |
| Utilities | 0.0 | 0.0 |
| Other and Reserves | 2.2 | 2.4 |
| Total | 100.0% | 100.0% |
| Historical weightings reflect current industry/sector classifications. |
Consumer discretionary was the largest detractor among all sectors. Slot-machine provider International Game Technology (IGT) and Internet auctioneer eBay were especially weak. IGT stumbled on delays in the start-up of several new jurisdictions, a slowdown in replacement sales, and concerns over increasing competition. Near-term earnings could remain pressured but IGT is well positioned in an area that should have relatively strong earnings and cash flow growth for the next few years. We significantly cut our position in eBay at the end of last year as the valuation became rich.
Our most significant purchase in the consumer discretionary sector over the past six months was Wynn Resorts. The casino operator focuses on upper-end projects and opened its first property, Wynn Las Vegas, during the second quarter of 2004. The company should have four properties in operation by 2008, which could generate $1 billion of free cash flow. Recent weakness makes the stock an even more attractive long-term investment. Longer term the company is expected to benefit from Far East markets such as Singapore. We think the return dynamics for Wynn are compelling and have confidence that it can be an excellent long-term investment. The caveat is that in the short run—two or three years—the stock could be volatile. We intend to buy more on dips.
OUTLOOK
The economy and corporate profits should continue to grow but at a more moderate pace than in the past 12 months. We think the Fed will likely stop raising short-term interest rates in the second half of the year, which would be a positive for large-cap growth stocks. In our view, oil prices should ease from current levels but could be volatile, and supply could remain tight for the next few years. Any moderation in oil prices from current levels is a net positive for both economic growth and corporate profits. A decline in commodity prices, which may have peaked in the first half of the year, would also benefit growth stocks.
We believe that high-quality growth stocks offer solid risk/reward comparisons and have the potential to outperform most other asset classes over the near and longer term. As always, we will work diligently on your behalf in our search for these companies, both here and abroad.
Respectfully submitted,

Robert W. Smith
Chairman of the fund’s Investment Advisory Committee
July 13, 2005
The committee chairman has day-to-day responsibility for managing the portfolio and works with committee members in developing and executing the fund’s investment program.
RISKS OF STOCK INVESTING
The fund’s share price can fall because of weakness in the stock markets, a particular industry, or specific holdings. Stock markets can decline for many reasons, including adverse political or economic developments, changes in investor psychology, or heavy institutional selling. The prospects for an industry or company may deteriorate because of a variety of factors, including disappointing earnings or changes in the competitive environment. In addition, the investment manager’s assessment of companies held in a fund may prove incorrect, resulting in losses or poor performance even in rising markets.
GLOSSARY
Dividend yield: The annual dividend of a stock divided by the stock’s price.
Free cash flow: The excess cash a company is generating from its operations that can be taken out of the business for the benefit of shareholders, such as dividends, share repurchases, investments, and acquisitions.
Lipper indexes: Fund benchmarks that consist of a small number (10 to 30) of the largest mutual funds in a particular category as tracked by Lipper Inc.
Price/book ratio: A valuation measure that compares a stock’s market price to its book value, i.e., the company’s net worth divided by the number of outstanding shares.
Price/earnings ratio (P/E): A valuation measure calculated by dividing the price of a stock by its current or projected earnings per share. This ratio gives investors an idea of how much they are paying for current or future earnings power.
S&P 500 Index: An unmanaged index that tracks the stocks of 500 primarily large-cap U.S. companies.
| PORTFOLIO HIGHLIGHTS |
| |
| TWENTY-FIVE LARGEST HOLDINGS | |
| | Percent of |
| | Net Assets |
| | 6/30/05 |
| |
| Citigroup | 3.0% |
| Microsoft | 2.8 |
| GE | 2.8 |
| UnitedHealth Group | 2.3 |
| Wal-Mart | 2.3 |
| American International Group | 2.2 |
| Dell | 2.0 |
| WellPoint | 1.8 |
| Danaher | 1.7 |
| Intel | 1.6 |
| State Street | 1.6 |
| UBS | 1.5 |
| Accenture | 1.5 |
| Corning | 1.5 |
| Target | 1.4 |
| Tyco International | 1.4 |
| Liberty Media | 1.4 |
| Schlumberger | 1.4 |
| Total | 1.4 |
| Kohl’s | 1.3 |
| Carnival | 1.3 |
| American Express | 1.3 |
| Amgen | 1.2 |
| Apollo Group | 1.2 |
| News Corp | 1.2 |
| Total | 43.1% |
| |
| Note: Table excludes investments in the T. Rowe Price Reserve Investment Fund. | |
| PORTFOLIO HIGHLIGHTS |
| |
| MAJOR PORTFOLIO CHANGES | |
| Listed in descending order of size | |
| |
| 6 Months Ended 6/30/05 | |
| |
| Largest Purchases | Largest Sales |
| |
| Total * | Chevron ** |
| Gillette * | Rio Tinto ** |
| Automatic Data Processing * | Credit Suisse Group ** |
| GE | Mellon Financial ** |
| Wal-Mart | Adobe Systems ** |
| PETsMART * | UPS |
| Nokia * | Altria Group ** |
| EMC * | Compass Group ** |
| Accenture | Boston Scientific ** |
| Apollo Group | Clear Channel Communications ** |
| |
| ** Position added | |
| ** Position eliminated | |
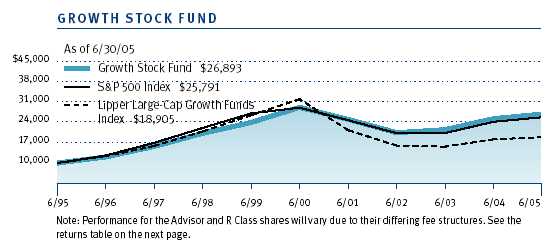
This chart shows the value of a hypothetical $10,000 investment in the fund over the past 10 fiscal year periods or since inception (for funds lacking 10-year records). The result is compared with benchmarks, which may include a broad-based market index and a peer group average or index. Market indexes do not include expenses, which are deducted from fund returns as well as mutual fund averages and indexes.
| AVERAGE ANNUAL COMPOUND TOTAL RETURN | | | |
| |
| This table shows how each class and its benchmarks would have performed each year if their |
| actual (or cumulative) returns for the periods shown had been earned at a constant rate. |
| |
| |
| | | | | Since | Inception |
| Periods Ended 6/30/05 | 1 Year | 5 Years | 10 Years | Inception | Date |
| Growth Stock Fund | 6.25% | -1.63% | 10.40% | – | – |
| S&P 500 Index | 6.32 | -2.37 | 9.94 | – | – |
| Lipper Large-Cap Growth | | | | | |
| Funds Index | 3.82 | -9.99 | 6.58 | – | – |
| Growth Stock Fund–Advisor Class | 6.08 | – | – | 2.59% | 12/31/01 |
| S&P 500 Index | 6.32 | – | – | 2.83 | – |
| Lipper Large-Cap Growth | | | | | |
| Funds Index | 3.82 | – | – | -0.92 | – |
| Growth Stock Fund–R Class | 5.78 | – | – | 16.68 | 9/30/02 |
| S&P 500 Index | 6.32 | – | – | 16.86 | – |
| Lipper Large-Cap Growth | | | | | |
| Funds Index | 3.82 | – | – | 13.17 | – |
| |
| Current performance may be higher or lower than the quoted past performance, which can- |
| not guarantee future results. Share price, principal value, and return will vary, and you may |
| have a gain or loss when you sell your shares. For the most recent month-end performance |
| information, please visit our Web site (troweprice.com) or contact a T. Rowe Price represen- |
| tative at 1-800-225-5132. | | | | | |
| Average annual total return figures include changes in principal value, reinvested dividends, and capital |
| gain distributions. Returns do not reflect taxes that the shareholder may pay on fund distributions or the |
| redemption of fund shares. When assessing performance, investors should consider both short- and |
| long-term returns. | | | | | |
As a mutual fund shareholder, you may incur two types of costs: (1) transaction costs such as redemption fees or sales loads and (2) ongoing costs, including management fees, distribution and service (12b-1) fees, and other fund expenses. The following example is intended to help you understand your ongoing costs (in dollars) of investing in the fund and to compare these costs with the ongoing costs of investing in other mutual funds. The example is based on an investment of $1,000 invested at the beginning of the most recent six-month period and held for the entire period.
Please note that the fund has three share classes: The original share class (“investor class”) charges no distribution and service (12b-1) fee; Advisor Class shares are offered only through unaffiliated brokers and other financial intermediaries and charge a 0.25% 12b-1 fee; R Class shares are available to retirement plans serviced by intermediaries and charge a 0.50% 12b-1 fee. Each share class is presented separately in the table.
Actual Expenses
The first line of the following table (“Actual”) provides information about actual account values and expenses based on the fund’s actual returns. You may use the information in this line, together with your account balance, to estimate the expenses that you paid over the period. Simply divide your account value by $1,000 (for example, an $8,600 account value divided by $1,000 = 8.6), then multiply the result by the number in the first line under the heading “Expenses Paid During Period” to estimate the expenses you paid on your account during this period.
Hypothetical Example for Comparison Purposes
The information on the second line of the table (“Hypothetical”) is based on hypothetical account values and expenses derived from the fund’s actual expense ratio and an assumed 5% per year rate of return before expenses (not the fund’s actual return). You may compare the ongoing costs of investing in the fund with other funds by contrasting this 5% hypothetical example and the 5% hypothetical examples that appear in the shareholder reports of the other funds. The hypothetical account values and expenses may not be used to estimate the actual ending account balance or expenses you paid for the period.
Note: T. Rowe Price charges an annual small-account maintenance fee of $10, generally for accounts with less than $2,000 ($500 for UGMA/UTMA). The fee is waived for any investor whose T. Rowe Price mutual fund accounts total $25,000 or more, accounts employing automatic investing, and IRAs and other retirement plan accounts that utilize a prototype plan sponsored by T. Rowe Price (although a separate custodial or administrative fee may apply to such accounts). This fee is not included in the accompanying table. If you are subject to the fee, keep it in mind when you are estimating the ongoing expenses of investing in the fund and when comparing the expenses of this fund with other funds.
You should also be aware that the expenses shown in the table highlight only your ongoing costs and do not reflect any transaction costs, such as redemption fees or sales loads. Therefore, the second line of the table is useful in comparing ongoing costs only and will not help you determine the relative total costs of owning different funds. To the extent a fund charges transaction costs, however, the total cost of owning that fund is higher.
| T. ROWE PRICE GROWTH STOCK FUND | |
| |
| | Beginning | Ending | Expenses Paid |
| | Account Value | Account Value | During Period* |
| | 1/1/05 | 6/30/05 | 1/1/05 to 6/30/05 |
| Investor Class | | | |
| Actual | $1,000.00 | $988.40 | $3.60 |
| Hypothetical (assumes 5% | | | |
| return before expenses) | 1,000.00 | 1,021.17 | 3.66 |
| Advisor Class | | | |
| Actual | 1,000.00 | 987.60 | 4.63 |
| Hypothetical (assumes 5% | | | |
| return before expenses) | 1,000.00 | 1,020.13 | 4.71 |
| R Class | | | |
| Actual | 1,000.00 | 986.40 | 5.81 |
| Hypothetical (assumes 5% | | | |
| return before expenses) | 1,000.00 | 1,018.94 | 5.91 |
| | | | |
| * Expenses are equal to the fund’s annualized expense ratio for the six-month period, multiplied by the |
| * average account value over the period, multiplied by the number of days in the most recent fiscal half |
| * year (181) divided by the days in the year (365) to reflect the half-year period. The annualized expense |
| * ratio of the Investor Class was 0.73%, the Advisor Class was 0.94%, and the R Class was 1.18%. |
Unaudited
| FINANCIAL HIGHLIGHTS | | | | For a share outstanding throughout each period |
| |
| Investor Class | | | | | | | | | | | | |
| | | 6 Months | | Year | | | | | | | | |
| | | Ended | | Ended | | | | | | | | |
| | | 6/30/05** | | 12/31/04 | | 12/31/03 | | 12/31/02 | | 12/31/01 | | 12/31/00 |
| NET ASSET VALUE | | | | | | | | | | | | |
| Beginning of period | $ | 26.67 | $ | 24.33 | $ | 18.58 | $ | 24.18 | $ | 27.20 | $ | 33.27 |
|
|
| |
| Investment activities | | | | | | | | | | | | |
| Net investment | | | | | | | | | | | | |
| income (loss) | | 0.06 | | 0.15 | | 0.06 | | 0.05 | | 0.09 | | 0.07 |
| Net realized and | | | | | | | | | | | | |
| unrealized gain (loss) | | (0.37) | | 2.34 | | 5.74 | | (5.61) | | (2.76) | | 0.21 |
|
|
| Total from | | | | | | | | | | | | |
| investment activities | | (0.31) | | 2.49 | | 5.80 | | (5.56) | | (2.67) | | 0.28 |
|
|
| |
| Distributions | | | | | | | | | | | | |
| Net investment income | | – | | (0.15) | | (0.05) | | (0.04) | | (0.08) | | (0.07) |
| Net realized gain | | – | | – | | – | | – | | (0.27) | | (6.28) |
|
|
| Total distributions | | – | | (0.15) | | (0.05) | | (0.04) | | (0.35) | | (6.35) |
|
|
| |
| NET ASSET VALUE | | | | | | | | | | | | |
| End of period | $ | 26.36 | $ | 26.67 | $ | 24.33 | $ | 18.58 | $ | 24.18 | $ | 27.20 |
|
|
| |
| |
| Ratios/Supplemental Data | | | | | | | | | | | | |
| Total return^ | | (1.16)% | | 10.24% | | 31.23% | | (23.00)% | | (9.79)% | | 0.27% |
| Ratio of total expenses to | | | | | | | | | | | | |
| average net assets | | 0.73%† | | 0.74% | | 0.76% | | 0.77% | | 0.77% | | 0.73% |
| Ratio of net investment | | | | | | | | | | | | |
| income (loss) to average | | | | | | | | | | | | |
| net assets | | 0.48%† | | 0.72%+ | | 0.29% | | 0.23% | | 0.34% | | 0.20% |
| Portfolio turnover rate | | 32.2%† | | 30.7% | | 35.0% | | 46.9% | | 64.1% | | 74.3% |
| Net assets, end of period | | | | | | | | | | | | |
| (in millions) | $ | 9,468 | $ | 8,238 | $ | 5,651 | $ | 3,728 | $ | 4,685 | $ | 5,428 |
| ** Per share amounts calculated using average shares outstanding method. |
| ^ | Total return reflects the rate that an investor would have earned on an investment in the fund during each period, |
| | assuming reinvestment of all distributions. |
| † | Annualized |
| + | Includes the effect of a one-time special dividend (0.42% of average net assets) that is not expected to recur. |
| |
| The accompanying notes are an integral part of these financial statements. |
Unaudited
| FINANCIAL HIGHLIGHTS | | | | For a share outstanding throughout each period |
| |
| Advisor Class | | | | | | | | |
| | | 6 Months | | Year | | | | |
| | | Ended | | Ended | | | | |
| | | 6/30/05** | | 12/31/04 | | 12/31/03 | | 12/31/02 |
| NET ASSET VALUE | | | | | | | | |
| Beginning of period | $ | 26.52 | $ | 24.23 | $ | 18.54 | $ | 24.18 |
|
|
| |
| Investment activities | | | | | | | | |
| Net investment income | | 0.04 | | 0.14 | | 0.05 | | 0.01* |
| Net realized and | | | | | | | | |
| unrealized gain (loss) | | (0.37) | | 2.29 | | 5.69 | | (5.61) |
|
|
| Total from investment activities | | (0.33) | | 2.43 | | 5.74 | | (5.60) |
|
|
| |
| Distributions | | | | | | | | |
| Net investment income | | – | | (0.14) | | (0.05) | | (0.04) |
|
|
| |
| NET ASSET VALUE | | | | | | | | |
| End of period | $ | 26.19 | $ | 26.52 | $ | 24.23 | $ | 18.54 |
|
|
| |
| |
| Ratios/Supplemental Data | | | | | | | | |
| Total return^ | | (1.24)% | | 10.04% | | 30.97% | | (23.16)%* |
| Ratio of total expenses to | | | | | | | | |
| average net assets | | 0.94%† | | 0.93% | | 0.92% | | 1.10%* |
| Ratio of net investment | | | | | | | | |
| income (loss) to average | | | | | | | | |
| net assets | | 0.30%† | | 0.72%+ | | 0.15% | | 0.00%* |
| Portfolio turnover rate | | 32.2%† | | 30.7% | | 35.0% | | 46.9% |
| Net assets, end of period | | | | | | | | |
| (in thousands) | $ | 831,669 | $ | 451,206 | $ | 90,856 | $ | 541 |
| ** Per share amounts calculated using average shares outstanding method. |
| * | Excludes expenses in excess of a 1.10% contractual expense limitation in effect through 4/30/06. |
| ^ | Total return reflects the rate that an investor would have earned on an investment in the fund during each period, |
| | assuming reinvestment of all distributions. |
| † | Annualized |
| + | Includes the effect of a one-time special dividend (0.59% of average net assets) that is not expected to recur. |
| |
| The accompanying notes are an integral part of these financial statements. |
Unaudited
| FINANCIAL HIGHLIGHTS | | | | For a share outstanding throughout each period |
| |
| R Class | | | | | | | | |
| | | 6 Months | | Year | | | | 9/30/02 |
| | | Ended | | Ended | | | | Through |
| | | 6/30/05** | | 12/31/04 | | 12/31/03 | | 12/31/02 |
| NET ASSET VALUE | | | | | | | | |
| Beginning of period | $ | 26.44 | $ | 24.19 | $ | 18.56 | $ | 17.20 |
|
|
| |
| Investment activities | | | | | | | | |
| Net investment income | | 0.01 | | 0.11 | | 0.05 | | (0.01) |
| Net realized and | | | | | | | | |
| unrealized gain (loss) | | (0.37) | | 2.24 | | 5.62 | | 1.41++ |
|
|
| Total from investment activities | | (0.36) | | 2.35 | | 5.67 | | 1.40 |
|
|
| |
| Distributions | | | | | | | | |
| Net investment income | | – | | (0.10) | | (0.04) | | (0.04) |
|
|
| |
| NET ASSET VALUE | | | | | | | | |
| End of period | $ | 26.08 | $ | 26.44 | $ | 24.19 | $ | 18.56 |
|
|
| |
| |
| Ratios/Supplemental Data | | | | | | | | |
| Total return^ | | (1.36)% | | 9.72% | | 30.56% | | 8.14% |
| Ratio of total expenses to | | | | | | | | |
| average net assets | | 1.18%† | | 1.21% | | 1.21% | | 1.26%† |
| Ratio of net investment | | | | | | | | |
| income (loss) to average | | | | | | | | |
| net assets | | 0.07%† | | 0.46%+ | | (0.14)% | | (0.17)%† |
| Portfolio turnover rate | | 32.2%† | | 30.7% | | 35.0% | | 46.9% |
| Net assets, end of period | | | | | | | | |
| (in thousands) | $ | 227,344 | $ | 98,348 | $ | 12,778 | $ | 108 |
| ** | Per share amounts calculated using average shares outstanding method. |
| ++ | The amount presented is calculated pursuant to a methodology prescribed by the Securities and Exchange Commission |
| | for a share outstanding throughout the period. This amount is inconsistent with the fund’s aggregate gains and |
| | losses because of the timing of sales and redemptions of fund shares in relation to fluctuating market values for |
| | the investment portfolio. |
| ^ | Total return reflects the rate that an investor would have earned on an investment in the fund during each period, |
| | assuming reinvestment of all distributions. |
| † | Annualized |
| + | Includes the effect of a one-time special dividend (0.60% of average net assets) that is not expected to recur. |
| |
| The accompanying notes are an integral part of these financial statements. |
Unaudited
| PORTFOLIO OF INVESTMENTS (1) | Shares | Value |
| (Cost and value in $ 000s) | | |
| COMMON STOCKS 97.6% | | |
| |
| CONSUMER DISCRETIONARY 18.2% | | |
| Diversified Consumer Services 1.2% | | |
| Apollo Group, Class A * | 1,572,000 | 122,962 |
| | | 122,962 |
| Hotels, Restaurants & Leisure 2.9% | | |
| Carnival | 2,556,900 | 139,479 |
| International Game Technology | 2,965,000 | 83,465 |
| MGM Mirage * | 548,146 | 21,696 |
| Wynn Resorts * | 1,260,000 | 59,560 |
| | | 304,200 |
| Household Durables 0.4% | | |
| Harman International | 545,000 | 44,341 |
| | | 44,341 |
| Internet & Catalog Retail 0.3% | | |
| eBay * | 1,003,400 | 33,122 |
| | | 33,122 |
| Media 7.3% | | |
| Comcast, Special Class A * | 3,740,000 | 112,013 |
| EchoStar Communications, Class A | 1,170,000 | 35,275 |
| Liberty Media, Class A * | 14,167,400 | 144,366 |
| News Corp., Class A | 7,543,000 | 122,046 |
| Rogers Communications, Class B | 1,490,000 | 48,991 |
| Scripps, Class A | 1,065,000 | 51,972 |
| Time Warner * | 6,140,000 | 102,599 |
| Univision Communications, Class A * | 3,371,800 | 92,893 |
| Viacom, Class B | 1,668,724 | 53,433 |
| | | 763,588 |
| Multiline Retail 3.0% | | |
| Family Dollar Stores | 1,125,000 | 29,363 |
| Kohl's * | 2,508,000 | 140,222 |
| Target | 2,730,000 | 148,539 |
| | | 318,124 |
| Specialty Retail 3.1% | | |
| Best Buy | 1,483,500 | 101,694 |
| Home Depot | 3,008,900 | 117,046 |
| Inditex (EUR) | 1,340,000 | 34,405 |
| PETsMART | 2,435,000 | 73,903 |
| | | 327,048 |
| Total Consumer Discretionary | | 1,913,385 |
| |
| CONSUMER STAPLES 5.8% | | |
| Beverages 0.7% | | |
| Coca-Cola | 910,900 | 38,030 |
| PepsiCo | 713,100 | 38,458 |
| | | 76,488 |
| Food & Staples Retailing 4.1% | | |
| Sysco | 1,913,000 | 69,231 |
| Wal-Mart | 5,059,600 | 243,873 |
| Wal-Mart de Mexico, Series V (MXN) | 3,925,000 | 15,915 |
| Wal-Mart de Mexico ADR | 590,000 | 23,916 |
| Walgreen | 1,789,000 | 82,276 |
| | | 435,211 |
| Personal Products 1.0% | | |
| Gillette | 2,000,000 | 101,260 |
| | | 101,260 |
| Total Consumer Staples | | 612,959 |
| |
| ENERGY 4.9% | | |
| Energy Equipment & Services 2.5% | | |
| Baker Hughes | 2,310,000 | 118,180 |
| Schlumberger | 1,890,000 | 143,526 |
| | | 261,706 |
| Oil, Gas & Consumable Fuels 2.4% | | |
| ExxonMobil | 2,014,374 | 115,766 |
| Total (EUR) | 613,000 | 143,518 |
| | | 259,284 |
| Total Energy | | 520,990 |
| | | |
| FINANCIALS 18.6% | | |
| Capital Markets 7.1% | | |
| AmeriTrade * | 2,563,000 | 47,646 |
| Charles Schwab | 6,379,400 | 71,960 |
| Franklin Resources | 775,000 | 59,660 |
| Goldman Sachs | 423,100 | 43,165 |
| Merrill Lynch | 1,625,000 | 89,391 |
| Northern Trust | 2,215,000 | 100,982 |
| State Street | 3,502,000 | 168,971 |
| UBS (CHF) | 2,075,000 | 161,333 |
| | | 743,108 |
| Commercial Banks 1.4% | | |
| Anglo Irish Bank (EUR) | 5,512,000 | 68,328 |
| U.S. Bancorp | 2,573,400 | 75,143 |
| | | 143,471 |
| Consumer Finance 2.4% | | |
| American Express | 2,584,300 | 137,562 |
| SLM Corporation | 2,295,000 | 116,586 |
| | | 254,148 |
| Diversified Financial Services 3.0% | | |
| Citigroup | 6,754,800 | 312,274 |
| | | 312,274 |
| Insurance 4.3% | | |
| ACE Limited | 950,000 | 42,607 |
| American International Group | 4,059,200 | 235,840 |
| Genworth Financial, Class A | 1,500,000 | 45,345 |
| Hartford Financial Services | 1,406,100 | 105,148 |
| Marsh & McLennan | 1,050,000 | 29,085 |
| | | 458,025 |
| Thrifts & Mortgage Finance 0.4% | | |
| Countrywide Credit | 1,115,000 | 43,050 |
| | | 43,050 |
| Total Financials | | 1,954,076 |
| | | |
| HEALTH CARE 13.1% | | |
| Biotechnology 3.2% | | |
| Amgen * | 2,087,400 | 126,204 |
| Biogen Idec * | 750,000 | 25,838 |
| Genentech * | 1,200,400 | 96,368 |
| Gilead Sciences * | 2,059,400 | 90,593 |
| | | 339,003 |
| Health Care Equipment & Supplies 2.6% | | |
| Biomet | 1,935,000 | 67,028 |
| Medtronic | 1,764,600 | 91,389 |
| St. Jude Medical * | 510,000 | 22,241 |
| Stryker | 1,457,000 | 69,295 |
| Zimmer Holdings * | 275,000 | 20,947 |
| | | 270,900 |
| Health Care Providers & Services 4.6% | | |
| Caremark RX * | 1,100,000 | 48,972 |
| UnitedHealth Group | 4,710,000 | 245,580 |
| WellPoint * | 2,710,000 | 188,724 |
| | | 483,276 |
| Pharmaceuticals 2.7% | | |
| Johnson & Johnson | 1,418,500 | 92,202 |
| Pfizer | 3,070,300 | 84,679 |
| Teva Pharmaceutical ADR | 1,880,000 | 58,543 |
| Wyeth | 1,182,900 | 52,639 |
| | | 288,063 |
| Total Health Care | | 1,381,242 |
| |
| INDUSTRIALS & BUSINESS SERVICES 7.9% | | |
| Air Freight & Logistics 0.3% | | |
| UPS, Class B | 420,000 | 29,047 |
| | | 29,047 |
| Commercial Services & Supplies 1.2% | | |
| Cendant | 5,451,000 | 121,939 |
| | | 121,939 |
| Industrial Conglomerates 4.2% | | |
| GE | 8,575,600 | 297,144 |
| Tyco International | 5,013,000 | 146,380 |
| | | 443,524 |
| Machinery 2.2% | | |
| Danaher | 3,387,000 | 177,276 |
| Deere | 920,000 | 60,251 |
| | | 237,527 |
| Total Industrials & Business Services | | 832,037 |
| |
| INFORMATION TECHNOLOGY 24.6% | | |
| Communications Equipment 4.0% | | |
| Cisco Systems * | 2,225,900 | 42,537 |
| Corning * | 9,475,000 | 157,475 |
| Juniper Networks * | 1,515,700 | 38,165 |
| Nokia OYJ (EUR) | 4,500,000 | 74,869 |
| QUALCOMM | 1,676,600 | 55,345 |
| Research In Motion * | 675,000 | 49,781 |
| | | 418,172 |
| Computers & Peripherals 2.7% | | |
| Dell * | 5,438,100 | 214,859 |
| EMC * | 5,105,000 | 69,990 |
| | | 284,849 |
| Internet Software & Services 2.3% | | |
| Google, Class A * | 220,000 | 64,713 |
| IAC/InterActiveCorp * | 1,619,200 | 38,942 |
| VeriSign * | 1,000,000 | 28,760 |
| Yahoo! * | 3,124,700 | 108,271 |
| | | 240,686 |
| IT Services 4.9% | | |
| Accenture, Class A * | 6,960,000 | 157,783 |
| Affiliated Computer Services, Class A * | 1,796,400 | 91,796 |
| Automatic Data Processing | 2,135,000 | 89,606 |
| First Data | 2,173,700 | 87,252 |
| Fiserv * | 1,710,000 | 73,445 |
| Infosys Technologies (INR) | 400,000 | 21,534 |
| | | 521,416 |
| Semiconductor & Semiconductor Equipment 5.5% | | |
| Analog Devices | 3,044,600 | 113,594 |
| ASM Lithography (EUR) * | 3,625,000 | 56,652 |
| Intel | 6,521,300 | 169,945 |
| Marvell Technology Group * | 1,685,000 | 64,097 |
| Maxim Integrated Products | 1,293,600 | 49,429 |
| Samsung Electronics (KRW) | 98,400 | 46,666 |
| Xilinx | 2,936,300 | 74,876 |
| | | 575,259 |
| Software 5.2% | | |
| Electronic Arts * | 440,000 | 24,909 |
| Intuit * | 500,000 | 22,555 |
| Mercury Interactive * | 880,000 | 33,757 |
| Microsoft | 12,048,000 | 299,272 |
| Oracle * | 7,118,700 | 93,967 |
| Red Hat * | 1,722,700 | 22,567 |
| Symantec * | 2,450,000 | 53,263 |
| | | 550,290 |
| Total Information Technology | | 2,590,672 |
| |
| MATERIALS 1.1% | | |
| Chemicals 0.5% | | |
| Monsanto | 750,000 | 47,152 |
| | | 47,152 |
| Metals & Mining 0.6% | | |
| BHP Billiton (AUD) | 4,895,000 | 66,976 |
| | | 66,976 |
| Total Materials | | 114,128 |
| |
| TELECOMMUNICATION SERVICES 3.4% | | |
| Diversified Telecommunication Services 1.0% | | |
| Sprint | 1,935,000 | 48,549 |
| Telus (CAD) | 592,900 | 20,829 |
| Telus (Non-voting shares) | 1,020,000 | 34,690 |
| | | 104,068 |
| Wireless Telecommunication Services 2.4% | | |
| America Movil ADR, Series L | 1,200,000 | 71,532 |
| Crown Castle International * | 3,000,000 | 60,960 |
| Nextel Communications, Class A * | 2,415,300 | 78,038 |
| Vodafone (GBP) | 18,050,000 | 43,886 |
| | | 254,416 |
| Total Telecommunication Services | | 358,484 |
| Total Common Stocks (Cost $8,476,518) | | 10,277,973 |
| |
| SHORT-TERM INVESTMENTS 2.5% | | |
| Money Market Fund 2.5% | | |
| T. Rowe Price Reserve Investment Fund, 3.14% #† | 264,580,317 | 264,580 |
| Total Short-Term Investments (Cost $264,580) | | 264,580 |
| |
| Total Investments in Securities | | |
| 100.1% of Net Assets (Cost $8,741,098) | $ | 10,542,553 |
| (1) | Denominated in U.S. dollars unless other- | CAD | Canadian dollar |
| | wise noted | CHF | Swiss franc |
| # | Seven-day yield | EUR | EUR Euro |
| * | Non-income producing | GBP | GBP British pound |
| † | Affiliated company – See Note 5 | INR | Indian rupee |
| ADR | American Depository Receipts | KRW | South Korean won |
| AUD | Australian dollar | MXN | Mexican peso |
| |
| The accompanying notes are an integral part of these financial statements. |
Unaudited
| STATEMENT OF ASSETS AND LIABILITIES | | |
| (In thousands except shares and per share amounts) | | |
| Assets | | |
| Investments in securities, at value | | |
| Affiliated companies (cost $264,580) | $ | 264,580 |
| Non-affiliated companies (cost $8,476,518) | | 10,277,973 |
|
|
| Total investments in securities | | 10,542,553 |
| Foreign currency (cost $3) | | 3 |
| Dividends and interest receivable | | 9,539 |
| Receivable for investment securities sold | | 14,459 |
| Receivable for shares sold | | 53,745 |
| Other assets | | 5,090 |
|
|
| Total assets | | 10,625,389 |
|
|
| |
| Liabilities | | |
| Investment management fees payable | | 4,822 |
| Payable for investment securities purchased | | 78,845 |
| Payable for shares redeemed | | 8,692 |
| Due to affiliates | | 989 |
| Other liabilities | | 4,811 |
|
|
| Total liabilities | | 98,159 |
|
|
| |
| NET ASSETS | $ | 10,527,230 |
|
|
Unaudited
| STATEMENT OF ASSETS AND LIABILITIES | | |
| (In thousands except shares and per share amounts) | | |
| Net Assets Consist of: | | |
| Undistributed net investment income (loss) | $ | 22,609 |
| Undistributed net realized gain (loss) | | (262,015) |
| Net unrealized gain (loss) | | 1,801,361 |
| Paid-in-capital applicable to 399,614,551 shares of | | |
| $1.00 par value capital stock outstanding; | | |
| 1,000,000,000 shares authorized | | 8,965,275 |
|
|
| |
| NET ASSETS | $ 10,527,230 |
|
|
| |
| NET ASSET VALUE PER SHARE | | |
| Investor Class | | |
| ($9,468,217,856/359,138,795 shares outstanding) | $ | 26.36 |
|
|
| Advisor Class | | |
| ($831,668,741/31,756,937 shares outstanding) | $ | 26.19 |
|
|
| R Class | | |
| ($227,343,544/8,718,819 shares outstanding) | $ | 26.08 |
|
|
The accompanying notes are an integral part of these financial statements.
Unaudited
| STATEMENT OF OPERATIONS | | |
| ($ 000s) | | |
| | | 6 Months |
| | | Ended |
| | | 6/30/05 |
| Investment Income (Loss) | | |
| Income | | |
| Dividend | $ | 57,442 |
| Interest | | 1 |
|
|
| Total income | | 57,443 |
|
|
| Expenses | | |
| Investment management | | 26,488 |
| Shareholder servicing | | |
| Investor Class | | 6,630 |
| Advisor Class | | 346 |
| R Class | | 99 |
| Rule 12b-1 fees | | |
| Advisor Class | | 824 |
| R Class | | 420 |
| Custody and accounting | | 310 |
| Registration | | 295 |
| Prospectus and shareholder reports | | |
| Investor Class | | 212 |
| Advisor Class | | 45 |
| R Class | | 3 |
| Proxy and annual meeting | | 33 |
| Legal and audit | | 15 |
| Directors | | 11 |
| Miscellaneous | | 7 |
|
|
| Total expenses | | 35,738 |
| Expenses paid indirectly | | (5) |
|
|
| Net expenses | | 35,733 |
|
|
| Net investment income (loss) | | 21,710 |
|
|
| |
| Realized and Unrealized Gain (Loss) | | |
| Net realized gain (loss) | | |
| Securities | | 134,568 |
| Foreign currency transactions | | (679) |
|
|
| Net realized gain (loss) | | 133,889 |
|
|
Unaudited
| STATEMENT OF OPERATIONS | | |
| ($ 000s) | | |
| | | 6 Months |
| | | Ended |
| | | 6/30/05 |
| Change in net unrealized gain (loss) | | |
| Securities | | (216,185) |
| Other assets and liabilities | | |
| denominated in foreign currencies | | (139) |
|
|
| Change in net unrealized gain (loss) | | (216,324) |
|
|
| Net realized and unrealized gain (loss) | | (82,435) |
|
|
| |
| INCREASE (DECREASE) IN NET | | |
| ASSETS FROM OPERATIONS | $ | (60,725) |
|
|
The accompanying notes are an integral part of these financial statements.
Unaudited
| STATEMENT OF CHANGES IN NET ASSETS | | | | |
| ($ 000s) | | | | |
| | | 6 Months | | Year |
| | | Ended | | Ended |
| | | 6/30/05 | | 12/31/04 |
| |
| Increase (Decrease) in Net Assets | | | | |
| Operations | | | | |
| Net investment income (loss) | $ | 21,710 | $ | 49,119 |
| Net realized gain (loss) | | 133,889 | | 202,797 |
| Change in net unrealized gain (loss) | | (216,324) | | 526,825 |
|
|
| Increase (decrease) in net assets from operations | | (60,725) | | 778,741 |
|
|
| |
| Distributions to shareholders | | | | |
| Net investment income | | | | |
| Investor Class | | – | | (45,245) |
| Advisor Class | | – | | (2,065) |
| R Class | | – | | (358) |
|
|
| Decrease in net assets from distributions | | – | | (47,668) |
|
|
| |
| Capital share transactions * | | | | |
| Shares sold | | | | |
| Investor Class | | 1,936,251 | | 2,875,480 |
| Advisor Class | | 450,977 | | 392,142 |
| R Class | | 147,840 | | 90,815 |
| Distributions reinvested | | | | |
| Investor Class | | – | | 41,786 |
| Advisor Class | | – | | 1,623 |
| R Class | | – | | 358 |
| Shares redeemed | | | | |
| Investor Class | | (643,792) | | (1,021,877) |
| Advisor Class | | (71,625) | | (65,793) |
| R Class | | (19,311) | | (12,903) |
|
|
| Increase (decrease) in net assets from | | | | |
| capital share transactions | | 1,800,340 | | 2,301,631 |
|
|
| |
| Net Assets | | | | |
| Increase (decrease) during period | | 1,739,615 | | 3,032,704 |
| Beginning of period | | 8,787,615 | | 5,754,911 |
|
|
| |
| End of period | $ | 10,527,230 | $ | 8,787,615 |
|
|
| (Including undistributed net investment income of | | | | |
| $22,609 at 6/30/05 and $899 at 12/31/04) | | | | |
Unaudited
| STATEMENT OF CHANGES IN NET ASSETS | | |
| ($ 000s) | | |
| | 6 Months | Year |
| | Ended | Ended |
| | 6/30/05 | 12/31/04 |
| *Share information | | |
| Shares sold | | |
| Investor Class | 75,090 | 116,202 |
| Advisor Class | 17,535 | 15,877 |
| R Class | 5,752 | 3,703 |
| Distributions reinvested | | |
| Investor Class | – | 1,583 |
| Advisor Class | – | 62 |
| R Class | – | 13 |
| Shares redeemed | | |
| Investor Class | (24,886) | (41,171) |
| Advisor Class | (2,794) | (2,673) |
| R Class | (753) | (524) |
|
|
| Increase (decrease) in shares outstanding | 69,944 | 93,072 |
The accompanying notes are an integral part of these financial statements.
Unaudited
| NOTES TO FINANCIAL STATEMENTS |
NOTE 1 - SIGNIFICANT ACCOUNTING POLICIES
T. Rowe Price Growth Stock Fund, Inc. (the fund) is registered under the Investment Company Act of 1940 (the 1940 Act) as a diversified, open-end management investment company. The fund seeks to provide long-term capital growth and, secondarily, increasing dividend income through investments in the common stocks of well-established growth companies. The fund has three classes of shares: the Growth Stock Fund original share class, referred to in this report as the Investor Class, offered since April 11, 1950, Growth Stock Fund—Advisor Class (Advisor Class), offered since December 31, 2001, and Growth Stock Fund—R Class (R Class), offered since September 30, 2002. Advisor Class shares are sold only through unaffiliated brokers and other unaffiliated financial intermediaries, and R Class shares are available to retirement plans serviced by intermediaries. The Advisor Class and R Class each operate under separate Board-approved Rule 12b-1 plans, pursuant to which each class compensates financial intermediaries for distribution, shareholder servicing, and/or certain administrative services. Each class has exclusive voting rights on matters related solely to that class, separate voting rights on matters that relate to all classes, and, in all other respects, the same rights and obligations as the other classes.
The accompanying financial statements were prepared in accordance with accounting principles generally accepted in the United States of America, which require the use of estimates made by fund management. Fund management believes that estimates and security valuations are appropriate; however actual results may differ from those estimates, and the security valuations reflected in the financial statements may differ from the value the fund receives upon sale of the securities.
Valuation The fund values its investments and computes its net asset value per share at the close of the New York Stock Exchange (NYSE), normally 4 p.m. ET, each day that the NYSE is open for business. Equity securities listed or regularly traded on a securities exchange or in the over-the-counter market are valued at the last quoted sale price or, for certain markets, the official closing price at the time the valuations are made, except for OTC Bulletin Board securities, which are valued at the mean of the latest bid and asked prices. A security that is listed or traded on more than one exchange is valued at the quotation on the exchange determined to be the primary market for such security. Listed securities not traded on a particular day are valued at the mean of the latest bid and asked prices for domestic securities and the last quoted sale price for international securities.
Investments in mutual funds are valued at the mutual fund’s closing net asset value per share on the day of valuation.
Other investments, including restricted securities, and those for which the above valuation procedures are inappropriate or are deemed not to reflect fair value are stated at fair value as determined in good faith by the T. Rowe Price Valuation Committee, established by the fund’s Board of Directors.
Most foreign markets close before the close of trading on the NYSE. If the fund determines that developments between the close of a foreign market and the close of the NYSE will, in its judgment, materially affect the value of some or all of its portfolio securities, which in turn will affect the fund’s share price, the fund will adjust the previous closing prices to reflect the fair value of the securities as of the close of the NYSE, as determined in good faith by the T. Rowe Price Valuation Committee, established by the fund’s Board of Directors. A fund may also fair value securities in other situations, such as when a particular foreign market is closed but the fund is open. In deciding whether to make fair value adjustments, the fund reviews a variety of factors, including developments in foreign markets, the performance of U.S. securities markets, and the performance of instruments trading in U. S. markets that represent foreign securities and baskets of foreign securities. The fund uses outside pricing services to provide it with closing market prices and information used for adjusting those prices. The fund cannot predict when and how often it will use closing prices and when it will adjust those prices to reflect fair value. As a means of evaluating its fair value process, the fund routinely compares closing market prices, the next day’s opening prices in the same markets, and adjusted prices.
Currency Translation Assets, including investments, and liabilities denominated in foreign currencies are translated into U.S. dollar values each day at the prevailing exchange rate, using the mean of the bid and asked prices of such currencies against U.S. dollars as quoted by a major bank. Purchases and sales of securities, income, and expenses are translated into U.S. dollars at the prevailing exchange rate on the date of the transaction. The effect of changes in foreign currency exchange rates on realized and unrealized security gains and losses is reflected as a component of security gains and losses.
Class Accounting The Advisor Class and R Class each pay distribution, shareholder servicing, and/or certain administrative expenses in the form of Rule 12b-1 fees, in an amount not exceeding 0.25% and 0.50%, respectively, of the class’s average daily net assets. Shareholder servicing, prospectus, and shareholder report expenses incurred by each class are charged directly to the class to which they relate. Expenses common to all classes, investment income, and realized and unrealized gains and losses are allocated to the classes based upon the relative daily net assets of each class.
Rebates and Credits Subject to best execution, the fund may direct certain security trades to brokers who have agreed to rebate a portion of the related brokerage commission to the fund in cash. Commission rebates are included in realized gain on securities in the accompanying financial statements and totaled $311,000 for the six months ended June 30, 2005. Additionally, the fund earns credits on temporarily uninvested cash balances at the custodian that reduce the fund’s custody charges. Custody expense in the accompanying financial statements is presented before reduction for credits, which are reflected as expenses paid indirectly.
Investment Transactions, Investment Income, and Distributions Income and expenses are recorded on the accrual basis. Dividends received from mutual fund investments are reflected as dividend income; capital gain distributions are reflected as realized gain/loss. Dividend income and capital gain distributions are recorded on the ex-dividend date. Investment transactions are accounted for on the trade date. Realized gains and losses are reported on the identified cost basis. Distributions to shareholders are recorded on the ex-dividend date. Income distributions are declared and paid by each class on an annual basis. Capital gain distributions, if any, are declared and paid by the fund, typically on an annual basis.
NOTE 2 - INVESTMENT TRANSACTIONS
Purchases and sales of portfolio securities, other than short-term securities, aggregated $3,266,103,000 and $1,499,155,000, respectively, for the six months ended June 30, 2005.
NOTE 3 - FEDERAL INCOME TAXES
No provision for federal income taxes is required since the fund intends to continue to qualify as a regulated investment company under Subchapter M of the Internal Revenue Code and distribute to shareholders all of its taxable income and gains. Federal income tax regulations differ from generally accepted accounting principles; therefore, distributions determined in accordance with tax regulations may differ in amount or character from net investment income and realized gains for financial reporting purposes. Financial reporting records are adjusted for permanent book/tax differences to reflect tax character. Financial records are not adjusted for temporary differences. The amount and character of tax-basis distributions and composition of net assets are finalized at fiscal year-end; accordingly, tax-basis balances have not been determined as of June 30, 2005.
The fund intends to retain realized gains to the extent of available capital loss carryforwards. As of December 31, 2004, the fund had $395,435,000 of unused capital loss carryforwards, of which $147,708,000 expire in 2009, $236,038,000 expire in 2010, and $11,689,000 expire in 2011.
At June 30, 2005, the cost of investments for federal income tax purposes was $8,741,098,000. Net unrealized gain aggregated $1,801,361,000 at period-end, of which $1,916,946,000 related to appreciated investments and $115,585,000 related to depreciated investments.
NOTE 4 - FOREIGN TAXES
Gains realized upon disposition of certain Indian securities held by the fund are subject to capital gains tax in India, payable prior to repatriation of sale proceeds. The tax is computed on net realized gains, and realized losses in excess of gains may be carried forward eight years to offset future gains. In addition, the fund accrues a deferred tax liability for net unrealized gains on Indian securities when applicable. At June 30, 2005, the fund had no deferred tax liability, and $9,390,000 of capital loss carryforwards that expire in 2013.
NOTE 5 - RELATED PARTY TRANSACTIONS
The fund is managed by T. Rowe Price Associates, Inc. (the manager or Price Associates), a wholly owned subsidiary of T. Rowe Price Group, Inc. The investment management agreement between the fund and the manager provides for an annual investment management fee, which is computed daily and paid monthly. The fee consists of an individual fund fee and a group fee. The individual fund fee is equal to 0.25% of the fund’s average daily net assets up to $15 billion, and 0.21% of the fund’s average daily net assets in excess of $15 billion; previously, through April 30, 2005, the individual fund fee had been a flat rate of 0.25% of the fund’s average daily net assets. The group fee rate is calculated based on the combined net assets of certain mutual funds sponsored by Price Associates (the group) applied to a graduated fee schedule, with rates ranging from 0.48% for the first $1 billion of assets to 0.29% for assets in excess of $160 billion. Prior to May 1, 2005, the maximum group fee rate in the graduated fee schedule had been 0.295% for assets in excess of $120 billion. The fund’s group fee is determined by applying the group fee rate to the fund’s average daily net assets. At June 30, 2005, the effective annual group fee rate was 0.31% .
The Advisor Class and R Class are also subject to a contractual expense limitation through the limitation dates indicated in the table below. During the limitation period, the manager is required to waive its management fee and reimburse a class for any expenses, excluding interest, taxes, brokerage commissions, and extraordinary expenses, that would otherwise cause the class’s ratio of total expenses to average net assets (expense ratio) to exceed its expense limitation. For a period of three years after the date of any reimbursement or waiver, each class is required to repay the manager for expenses previously reimbursed and management fees waived to the extent the class’s net assets have grown or expenses have declined sufficiently to allow repayment without causing the class’s expense ratio to exceed its expense limitation.
| | Advisor Class | R Class |
| Expense Limitation | 1.10% | 1.35% |
| Limitation Date | 4/30/06 | 4/30/06 |
Pursuant to this agreement, at June 30, 2005, there were no amounts subject to repayment. For the six months ended June 30, 2005, each class operated below its expense limitation.
In addition, the fund has entered into service agreements with Price Associates and two wholly owned subsidiaries of Price Associates (collectively, Price). Price Associates computes the daily share prices and maintains the financial records of the fund. T. Rowe Price Services, Inc., provides shareholder and administrative services in its capacity as the fund’s transfer and dividend disbursing agent. T. Rowe Price Retirement Plan Services, Inc., provides subaccounting and recordkeeping services for certain retirement accounts invested in the Investor Class and R Class. For the six months ended June 30, 2005, expenses incurred pursuant to these service agreements were $51,000 for Price Associates, $1,335,000 for T. Rowe Price Services, Inc., and $2,397,000 for T. Rowe Price Retirement Plan Services, Inc. The total amount payable at period end pursuant to these service agreements is reflected as Due to Affiliates in the accompanying financial statements.
The fund is also one of several mutual funds sponsored by Price Associates (underlying Price funds) in which the T. Rowe Price Spectrum Funds (Spectrum Funds) and T. Rowe Price Retirement Funds (Retirement Funds) may invest. Neither the Spectrum Funds nor the Retirement Funds invest in the underlying Price funds for the purpose of exercising management or control. Pursuant to separate, special servicing agreements, expenses associated with the operation of the Spectrum and Retirement Funds are borne by each underlying Price fund to the extent of estimated savings to it and in proportion to the average daily value of its shares owned by the Spectrum and Retirement Funds, respectively. Expenses allocated under these agreements are reflected as shareholder servicing expenses in the accompanying financial statements. For the six months ended June 30, 2005, the fund was allocated $390,000 of Spectrum Funds’ expenses and $1,146,000 of Retirement Funds’ expenses. Of these amounts, $1,165,000 related to services provided by Price. The amount payable at period end pursuant to this agreement is included in Due to Affiliates in the accompanying financial statements. At June 30, 2005, approximately 4.8% of the outstanding shares of the Investor Class were held by the Spectrum Funds and 8.8% were held by the Retirement Funds.
The fund may invest in the T. Rowe Price Reserve Investment Fund and the T. Rowe Price Government Reserve Investment Fund (collectively, the T. Rowe Price Reserve Funds), open-end management investment companies managed by Price Associates and affiliates of the fund. The T. Rowe Price Reserve Funds are offered as cash management options to mutual funds, trusts, and other accounts managed by Price Associates and/or its affiliates, and are not available for direct purchase by members of the public. The T. Rowe Price Reserve Funds pay no investment management fees. During the six months ended June 30, 2005, dividend income from the T. Rowe Price Reserve Funds totaled $3,333,000, and the value of shares of the T. Rowe Price Reserve Funds held at June 30, 2005 and December 31, 2004 was $264,580,000 and $233,431,000, respectively.
As of June 30, 2005, T. Rowe Price Group, Inc. and/or its wholly owned subsidiaries owned 370,581 shares of the Investor Class, aggregating less than 1% of the fund’s net assets.
| INFORMATION ON PROXY VOTING POLICIES, PROCEDURES, AND RECORDS |
A description of the policies and procedures used by T. Rowe Price funds and portfolios to determine how to vote proxies relating to portfolio securities is available in each fund’s Statement of Additional Information, which you may request by calling 1-800-225-5132 or by accessing the SEC’s Web site, www.sec.gov. The description of our proxy voting policies and procedures is also available on our Web site, www.troweprice.com. To access it, click on the words “Company Info” at the top of our homepage for individual investors. Then, in the window that appears, click on the “Proxy Voting Policy” navigation button in the top left corner.
Each fund’s most recent annual proxy voting record is available on our Web site and through the SEC’s Web site. To access it through our Web site, follow the directions above, then click on the words “Proxy Voting Record” at the bottom of the Proxy Voting Policy page.
| HOW TO OBTAIN QUARTERLY PORTFOLIO HOLDINGS |
The fund files a complete schedule of portfolio holdings with the Securities and Exchange Commission for the first and third quarters of each fiscal year on Form N-Q. The fund’s Form N-Q is available electronically on the SEC’s Web site (www.sec.gov); hard copies may be reviewed and copied at the SEC’s Public Reference Room, 450 Fifth St. N.W., Washington, DC 20549. For more information on the Public Reference Room, call 1-800-SEC-0330.
| APPROVAL OF INVESTMENT MANAGEMENT AGREEMENT |
On March 2, 2005, the fund’s Board of Directors unanimously approved the investment advisory contract (“Contract”) between the fund and its investment manager, T. Rowe Price Associates, Inc. (“Manager”). The Board considered a variety of factors in connection with its review of the Contract, also taking into account information provided by the Manager during the course of the year, as discussed below:
Services Provided by the Manager
The Board considered the nature, quality, and extent of the services provided to the fund by the Manager. These services included, but were not limited to, management of the fund’s portfolio and a variety of activities related to portfolio management. The Board also reviewed the background and experience of the Manager’s senior management team and investment personnel involved in the management of the fund. The Board concluded that it was satisfied with the nature, quality, and extent of the services provided by the Manager.
Investment Performance of the Fund
The Board reviewed the fund’s average annual total return over the 1-, 3-, 5-, and 10-year periods as well as the fund’s year-by-year returns and compared these returns to previously agreed upon comparable performance measures and market data, including those supplied by Lipper and Morningstar, which are independent providers of mutual fund data. On the basis of this evaluation and the Board’s ongoing review of investment results, the Board concluded that the fund’s performance was satisfactory.
Costs, Benefits, Profits, and Economies of Scale
The Board reviewed detailed information regarding the revenues received by the Manager under the Contract and other benefits that the Manager (and its affiliates) may have realized from its relationship with the fund, including research received under “soft dollar” agreements. The Board also received information on the estimated costs incurred and profits realized by the Manager and its affiliates from advising T. Rowe Price mutual funds, as well as estimates of the gross profits realized from managing the fund in particular. The Board concluded that the Manager’s profits were reasonable in light of the services provided to the fund. The Board also considered whether the fund or other funds benefit under the fee levels set forth in the Contract from any economies of scale realized by the Manager. Under the Contract, the fund pays a fee to the Manager composed of two components—a group fee rate based on the aggregate assets of certain T. Rowe Price mutual funds (including the fund) that declines at certain asset levels, and an individual fund fee rate that is assessed on the assets of the fund. The Board concluded that an additional breakpoint should be added to the group fee component of the fees paid by the fund under the Contract at a level of $160 billion. The Board further concluded that, with this change, the advisory fee structure for the fund continued to provide for a reasonable sharing of benefits from any economies of scale with the fund’s investors.
Fees
The Board reviewed the fund’s management fee rate, operating expenses, and total expense ratio (for the Investor Class, Advisor Class, and R Class) and compared them to fees and expenses of other comparable funds based on information and data supplied by Lipper. The information provided to the Board indicated that the fund’s management fee rate and expense ratio (for all three classes) were generally at or below the median for comparable funds. The Board also reviewed the fee schedules for comparable privately managed accounts of the Manager and its affiliates. Management informed the Board that the Manager’s responsibilities for privately managed accounts are more limited than its responsibilities for the fund and other T. Rowe Price mutual funds that it or its affiliates advise. On the basis of the information provided, the Board concluded that the fees paid by the fund under the Contract were reasonable.
Approval of the Contract
As noted, the Board approved the continuation of the Contract as amended to add an additional breakpoint to the group fee rate. No single factor was considered in isolation or to be determinative to the decision. Rather, the Board concluded, in light of a weighting and balancing of all factors considered, that it was in the best interests of the fund to approve the continuation of the Contract, including the fees to be charged for services thereunder.
Item 2. Code of Ethics.
A code of ethics, as defined in Item 2 of Form N-CSR, applicable to its principal executive officer, principal financial officer, principal accounting officer or controller, or persons performing similar functions is filed as an exhibit to the registrant’s annual Form N-CSR. No substantive amendments were approved or waivers were granted to this code of ethics during the registrant’s most recent fiscal half-year.
Item 3. Audit Committee Financial Expert.
Disclosure required in registrant’s annual Form N-CSR.
Item 4. Principal Accountant Fees and Services.
Disclosure required in registrant’s annual Form N-CSR.
Item 5. Audit Committee of Listed Registrants.
Not applicable.
Item 6. Schedule of Investments.
Not applicable. The complete schedule of investments is included in Item 1 of this Form N-CSR.
Item 7. Disclosure of Proxy Voting Policies and Procedures for Closed-End Management Investment Companies.
Not applicable.
Item 8. Portfolio Managers of Closed-End Management Investment Companies.
Not applicable.
Item 9. Purchases of Equity Securities by Closed-End Management Investment Company and Affiliated Purchasers.
Not applicable.
Item 10. Submission of Matters to a Vote of Security Holders.
Not applicable.
Item 11. Controls and Procedures.
(a) The registrant’s principal executive officer and principal financial officer have evaluated the registrant’s disclosure controls and procedures within 90 days of this filing and have concluded that the registrant’s disclosure controls and procedures were effective, as of that date, in ensuring that information required to be disclosed by the registrant in this Form N-CSR was recorded, processed, summarized, and reported timely.
(b) The registrant’s principal executive officer and principal financial officer are aware of no change in the registrant’s internal control over financial reporting that occurred during the registrant’s second fiscal quarter covered by this report that has materially affected, or is reasonably likely to materially affect, the registrant’s internal control over financial reporting.
Item 12. Exhibits.
(a)(1) The registrant’s code of ethics pursuant to Item 2 of Form N-CSR is filed with the registrant’s annual Form N-CSR.
(2) Separate certifications by the registrant's principal executive officer and principal financial officer, pursuant to Section 302 of the Sarbanes-Oxley Act of 2002 and required by Rule 30a-2(a) under the Investment Company Act of 1940, are attached.
(3) Written solicitation to repurchase securities issued by closed-end companies: not applicable.
(b) A certification by the registrant's principal executive officer and principal financial officer, pursuant to Section 906 of the Sarbanes-Oxley Act of 2002 and required by Rule 30a-2(b) under the Investment Company Act of 1940, is attached.
| | |
SIGNATURES |
| |
| | Pursuant to the requirements of the Securities Exchange Act of 1934 and the Investment |
| Company Act of 1940, the registrant has duly caused this report to be signed on its behalf by the |
| undersigned, thereunto duly authorized. |
| |
| T. Rowe Price Growth Stock Fund, Inc. |
| |
| By | /s/ James S. Riepe |
| | James S. Riepe |
| | Principal Executive Officer |
| |
| Date | August 18, 2005 |
| |
| |
| | Pursuant to the requirements of the Securities Exchange Act of 1934 and the Investment |
| Company Act of 1940, this report has been signed below by the following persons on behalf of |
| the registrant and in the capacities and on the dates indicated. |
| |
| |
| By | /s/ James S. Riepe |
| | James S. Riepe |
| | Principal Executive Officer |
| |
| Date | August 18, 2005 |
| |
| |
| |
| By | /s/ Joseph A. Carrier |
| | Joseph A. Carrier |
| | Principal Financial Officer |
| |
| Date | August 18, 2005 |