Item 1: Report to Shareholders| Growth Stock Fund | June 30, 2006 |
The views and opinions in this report were current as of June 30, 2006. They are not guarantees of performance or investment results and should not be taken as investment advice. Investment decisions reflect a variety of factors, and the managers reserve the right to change their views about individual stocks, sectors, and the markets at any time. As a result, the views expressed should not be relied upon as a forecast of the fund’s future investment intent. The report is certified under the Sarbanes-Oxley Act of 2002, which requires mutual funds and other public companies to affirm that, to the best of their knowledge, the information in their financial reports is fairly and accurately stated in all material respects.
REPORTS ON THE WEB
Sign up for our E-mail Program, and you can begin to receive updated fund reports and prospectuses online rather than through the mail. Log in to your account at troweprice.com for more information.
Fellow Shareholders
Large-cap growth stocks struggled in the first half of 2006. After a strong first four months of the year, traditional growth sectors, including technology and health care, declined sharply in May and June. Data pointing to economic strength and persistently high inflation raised concerns that the Federal Reserve would continue raising short-term interest rates, which could choke off profits and economic growth. We believe that concerns about higher interest rates and an economic slowdown are more than factored into stock prices and that large-cap growth stocks can produce good second-half performance.
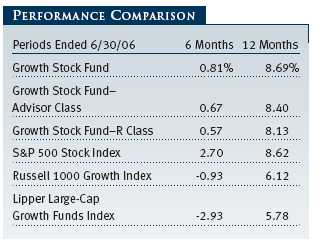
For the six-month period, the Growth Stock Fund posted modest gains, trailing the S&P 500 Stock Index, but outperforming the Lipper Large-Cap Growth Funds Index and the Russell 1000 Growth Index. (Results for Advisor and R Class shares were slightly lower, reflecting their higher expense ratios.) Value sectors outperformed growth in the first half, and our underweight in energy and utilities and overweight in the technology sector hurt the portfolio’s returns relative to the S&P 500. Our results were in line with the S&P 500 and outpaced the Lipper and Russell benchmarks for the past 12 months.
We have commented in our last several reports about the disparate performance between large- and small-caps, and how significantly growth has trailed value. Unfortunately for our shareholders, this pattern emerged again in the first half of the year. Value stocks in the large-cap Russell 1000 Index, and generally across all market capitalizations, significantly outperformed their growth counterparts. Nevertheless, the Growth Stock Fund’s performance compares extremely well relative to its competitors. Lipper ranked the fund in the top 3% of its large-cap growth funds universe for the 10-year period, and in the top 6% for the five years ended June 30, 2006. (Based on cumulative total return, Lipper ranked the Growth Stock Fund 116 out of 705, 70 out of 594, 26 out of 482, and 4 out of 167 large-cap growth funds for the 1-, 3-, 5-, and 10-year periods ended June 30, 2006, respectively. Past performance cannot guarantee future results.)
MARKET ENVIRONMENT
Over the past six months, large-cap growth stocks lagged the overall market as sectors typically favored by value investors, including energy, materials, and utilities, outperformed traditional growth favorites such as information technology and health care. Investors took note of rising inflation and interest rates, persistently high oil prices, and the continuing war in Iraq and other global hot spots. In the first half, the Federal Open Market Committee (FOMC) raised short-term interest rates in four quarter-point increments to 5.25% as part of its continuing effort to prevent inflation from accelerating. Recent trends suggest that inflation has persisted above the Fed’s comfort zone. The core consumer price index (which excludes food and energy), for example, posted three consecutive monthly increases and recently registered a 3.5% annual rise.
Although the U.S. economy slowed somewhat in the second quarter, as the housing market weakened and gasoline prices remained at high levels, overall demand and company earnings remained relatively strong. In our view, the sharp second-quarter correction in global stock prices was driven primarily by fears that rising core inflation could result in much higher interest rates, which would slow growth and hurt corporate earnings. Foreign and small-cap stocks corrected the most because they are generally more volatile and had been extremely strong performers. As investors sought the relative safety of more defensive sectors—utilities with their attractive yields in a falling market, energy stocks benefiting from higher resources prices, and telecommunication shares reflecting high-profile merger and acquisition activity—emerged as top performers in the first half.
It seems to me that the stock market is worried about two things, inflation and recession, and I don’t think they will happen at the same time. I believe that if investors start to feel better about one or the other, then the stock market will start to perform better. In the last two decades, we haven’t had gross domestic product growth moderate without a concurrent decline in commodity prices. So, I believe that if the U.S. economy moderates then inflation will moderate, too. In that type of economic environment, I expect price/earnings ratios to go up.
Since the Fed is more worried about inflation than economic growth, it will raise rates until the economy slows. Therefore, betting against an economic slowdown is not a bright thing to do. The market may slaughter all economically sensitive consumer stocks; if it does, we will opportunistically add to positions, as we think the slowdown will not be severe. Regardless, it should be a good environment for your portfolio because our companies tend to have more durable and global earnings than the broader market.
PORTFOLIO REVIEW
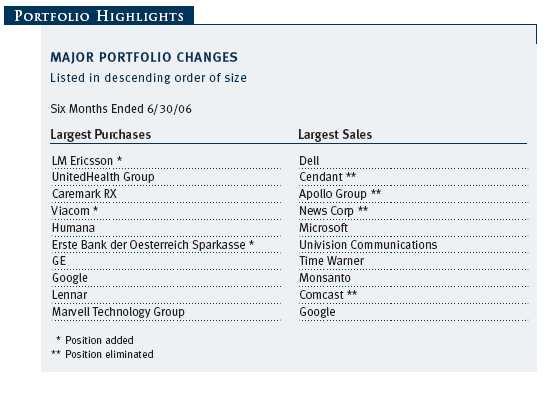
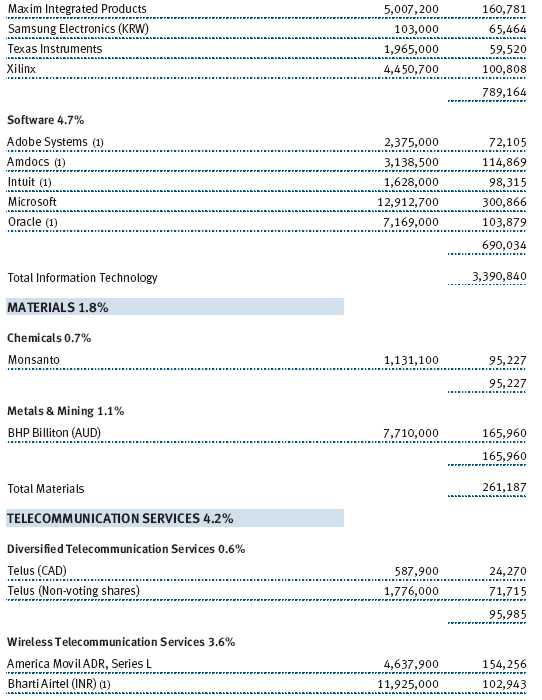
The portfolio’s best performance came from the energy sector. Despite our substantial underweight compared with the benchmark, we maintained our heavier exposure to the energy equipment and services industry, which helped our performance. Energy stocks typically lack the growth characteristics we seek, but we have maintained substantial positions in Schlumberger and Baker Hughes, which were two of the fund’s best six-month contributors. These oil services companies possess substantial international presence, have benefited from increased producer spending worldwide, and are less affected by oil price volatility. Growth in the sector is being driven by increased spending by energy producers on infrastructure, equipment, and technology, as well as higher demand for specialized services. Major integrated oil and gas producer ExxonMobil benefited from higher oil and gas prices and generated a strong performance contribution. (Please refer to the portfolio of investments for a complete listing of holdings and the amount each represents of the portfolio.)
We were also underweight in the materials sector, the fund’s second-best contributor. The portfolio benefited from strong stock selection. Metals and mining company BHP Billiton was one of the fund’s top contributors due to strong earnings growth, record production, and high commodities prices. Monsanto also posted solid gains, and appears well positioned to continue generating strong growth based upon its leadership in genomic seeds and agricultural productivity.
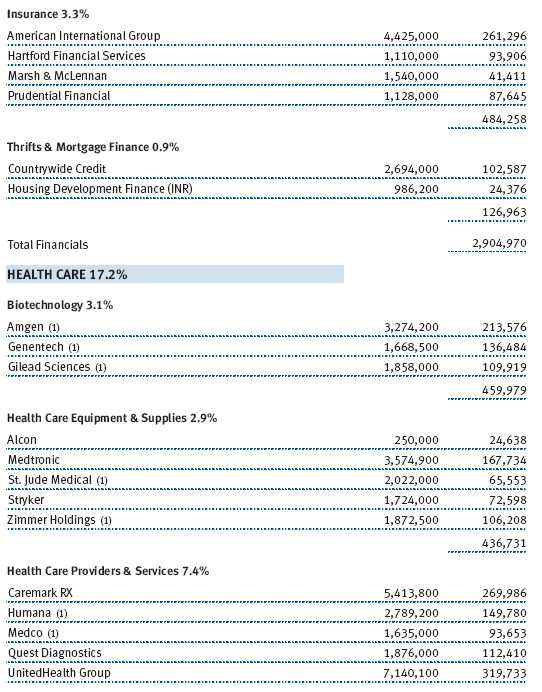
The health care sector was the largest absolute and relative performance detractor. Until the last six months, health care providers and services companies had performed very well for several years. The portfolio’s best performer for all of 2005, UnitedHealth Group, was our largest first-half detractor. The stock declined on concerns about cost pressures relating to Medicare and slowing enrollment growth. UnitedHealth was also embroiled in allegations of backdating executives’ stock options. The company announced in mid-May that controversial option-granting practices could force the company to restate its reported net income for the past three years. The health insurance giant received a subpoena from the U.S. Attorney for the Southern District of New York seeking documents relating to stock options grants. Though the outcome of these investigations is uncertain, we are monitoring the situation extremely closely. The company’s fundamentals appear to be quite strong and, for now, UnitedHealth Group remains a top holding.
When Aetna missed its first-quarter earnings estimate, the entire health care sector headed lower. During the second quarter, fears arose that managed care company pricing was weakening. We do not believe there is widespread deterioration in pricing; the second-quarter sell-off seems to have been an overreaction. Managed care remains a significant position in the fund. We took advantage of the first-half weakness in the health care sector and made substantial additions to existing holdings of UnitedHealth Group, WellPoint, and Humana.
Another area where we viewed the short-term weakness as a long-term opportunity was in pharmaceutical benefits managers (PBMs) Caremark Rx and Medco. Both are leading PBMs that should benefit from market share gains, new and soon-to-be available generic drugs, and the Medicare drug plan. These stocks sold off sharply in the first quarter, but we believe their enrollment growth will result in stronger earnings and better profit margins later in 2006 and in 2007. We took advantage of the depressed prices to add substantial positions in these stocks.
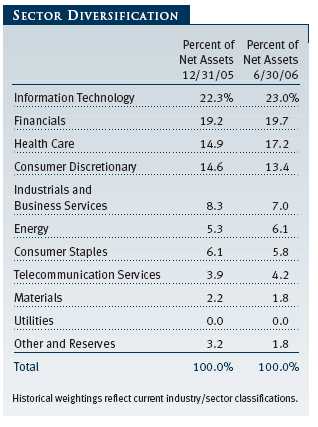
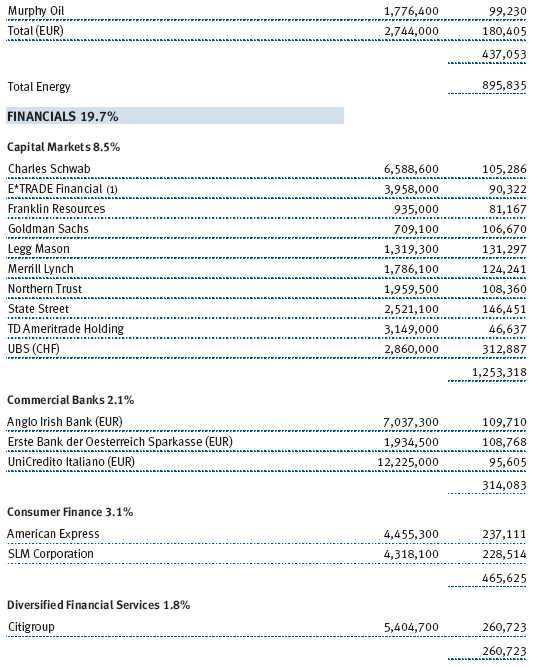
Information technology, the portfolio’s largest sector (23.0% of net assets) and its largest overweight versus the S&P 500, was the second-largest detractor for the past six months. Our technology overweight was primarily a result of larger exposures in information technology services and software. We maintain a favorable view on the sector as technology spending has remained at relatively low levels, and we continue to believe businesses will need to increase technology spending to sustain historically high profit margins. We added new positions in Apple Computer, Intuit, and Adobe Systems.
Several of our largest sales late in the reporting period were information technology sector holdings. Dell has been a disappointing performer that we have addressed in previous shareholder letters. The company is under pressure from its competition and has had some execution problems with its key strategies, so we trimmed the position significantly. Although it is no longer a top-25 holding, we still believe the company possesses an outstanding business model and has strong growth prospects. Microsoft, on the other hand, is still among our five largest holdings. We reduced the position due to delays to the Windows Vista operating system and the company’s plans to spend significantly above initial projections to become competitive online. We believe earnings may be stymied in the near term. We increased our weighting in Google early in the year, and then we trimmed shares of the Internet giant in the second quarter on strength because the company has yet to demonstrate that it can extend its dominance outside the search arena.
OUTLOOK
As we noted earlier in this letter, there were several reasons for investors to become fearful of the stock market over the past six months. However, we think that strength in the U.S. and global economies and the resilience of corporate earnings and free cash flow growth are underappreciated by the market. While higher interest rates and commodity prices could slow economic growth in the second half, we’re optimistic that investors will start to take a longer-term view toward equity ownership and believe that companies producing stable earnings growth will be afforded higher prices. We feel our portfolio of high-quality growth stocks has the potential to outperform in this environment.
In this slowing economy, we will need to be more focused on our efforts to find growth companies. As always, we will work diligently on your behalf.
Respectfully submitted,

Robert W. Smith
Chairman of the fund’s Investment Advisory Committee
July 21, 2006
The committee chairman has day-to-day responsibility for managing the portfolio and works with committee members in developing and executing the fund’s investment program.
RISKS OF STOCK INVESTING
The fund’s share price can fall because of weakness in the stock markets, a particular industry, or specific holdings. Stock markets can decline for many reasons, including adverse political or economic developments, changes in investor psychology, or heavy institutional selling. The prospects for an industry or company may deteriorate because of a variety of factors, including disappointing earnings or changes in the competitive environment. In addition, the investment manager’s assessment of companies held in a fund may prove incorrect, resulting in losses or poor performance even in rising markets.
GLOSSARY
Dividend yield: The annual dividend of a stock divided by the stock’s price.
Free cash flow: The excess cash a company is generating from its operations that can be taken out of the business for the benefit of shareholders, such as dividends, share repurchases, investments, and acquisitions.
Lipper indexes: Fund benchmarks that consist of a small number (10 to 30) of the largest mutual funds in a particular category as tracked by Lipper Inc.
Price/book ratio: A valuation measure that compares a stock’s market price with its book value, i.e., the company’s net worth divided by the number of outstanding shares.
Price/earnings ratio (P/E): A valuation measure calculated by dividing the price of a stock by its current or projected earnings per share. This ratio gives investors an idea of how much they are paying for current or future earnings power.
Russell 1000 Growth Index: A market capitalization-weighted index of those firms in the Russell 1000 with higher price-to-book ratios and higher forecasted growth values.
S&P 500 Stock Index: An unmanaged index that tracks the stocks of 500 primarily large-cap U.S. companies.

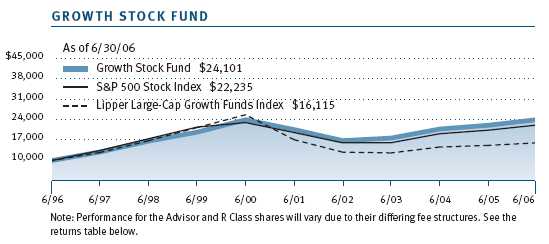
This chart shows the value of a hypothetical $10,000 investment in the fund over the past 10 fiscal year periods or since inception (for funds lacking 10-year records). The result is compared with benchmarks, which may include a broad-based market index and a peer group average or index. Market indexes do not include expenses, which are deducted from fund returns as well as mutual fund averages and indexes.
| AVERAGE ANNUAL COMPOUND TOTAL RETURN |
This table shows how the fund would have performed each year if its actual (or cumulative) returns had been earned at a constant rate.
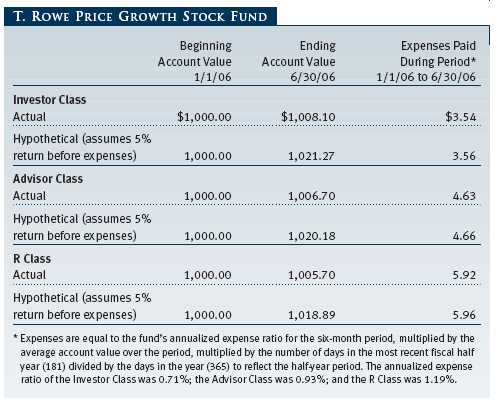
As a mutual fund shareholder, you may incur two types of costs: (1) transaction costs, such as redemption fees or sales loads, and (2) ongoing costs, including management fees, distribution and service (12b-1) fees, and other fund expenses. The following example is intended to help you understand your ongoing costs (in dollars) of investing in the fund and to compare these costs with the ongoing costs of investing in other mutual funds. The example is based on an investment of $1,000 invested at the beginning of the most recent six-month period and held for the entire period.
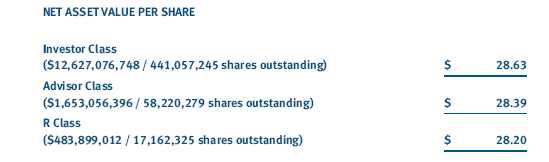
Please note that the fund has three share classes: The original share class (“investor class”) charges no distribution and service (12b-1) fee; Advisor Class shares are offered only through unaffiliated brokers and other financial intermediaries and charge a 0.25% 12b-1 fee; R Class shares are available to retirement plans serviced by intermediaries and charge a 0.50% 12b-1 fee. Each share class is presented separately in the table.
Actual Expenses
The first line of the following table (“Actual”) provides information about actual account values and expenses based on the fund’s actual returns. You may use the information in this line, together with your account balance, to estimate the expenses that you paid over the period. Simply divide your account value by $1,000 (for example, an $8,600 account value divided by $1,000 = 8.6), then multiply the result by the number in the first line under the heading “Expenses Paid During Period” to estimate the expenses you paid on your account during this period.
Hypothetical Example for Comparison Purposes
The information on the second line of the table (“Hypothetical”) is based on hypothetical account values and expenses derived from the fund’s actual expense ratio and an assumed 5% per year rate of return before expenses (not the fund’s actual return). You may compare the ongoing costs of investing in the fund with other funds by contrasting this 5% hypothetical example and the 5% hypothetical examples that appear in the shareholder reports of the other funds. The hypothetical account values and expenses may not be used to estimate the actual ending account balance or expenses you paid for the period.
Note: T. Rowe Price charges an annual small-account maintenance fee of $10, generally for accounts with less than $2,000 ($500 for UGMA/UTMA). The fee is waived for any investor whose T. Rowe Price mutual fund accounts total $25,000 or more, accounts employing automatic investing, and IRAs and other retirement plan accounts that utilize a prototype plan sponsored by T. Rowe Price (although a separate custodial or administrative fee may apply to such accounts). This fee is not included in the accompanying table. If you are subject to the fee, keep it in mind when you are estimating the ongoing expenses of investing in the fund and when comparing the expenses of this fund with other funds.
You should also be aware that the expenses shown in the table highlight only your ongoing costs and do not reflect any transaction costs, such as redemption fees or sales loads. Therefore, the second line of the table is useful in comparing ongoing costs only and will not help you determine the relative total costs of owning different funds. To the extent a fund charges transaction costs, however, the total cost of owning that fund is higher.
Unaudited
The accompanying notes are an integral part of these financial statements.
Unaudited
The accompanying notes are an integral part of these financial statements.
Unaudited
The accompanying notes are an integral part of these financial statements.
Unaudited


The accompanying notes are an integral part of these financial statements.
Unaudited
The accompanying notes are an integral part of these financial statements.
Unaudited

The accompanying notes are an integral part of these financial statements.
Unaudited
The accompanying notes are an integral part of these financial statements.
Unaudited
| NOTES TO FINANCIAL STATEMENTS |
NOTE 1 - SIGNIFICANT ACCOUNTING POLICIES
T. Rowe Price Growth Stock Fund, Inc. (the fund), is registered under the Investment Company Act of 1940 (the 1940 Act) as a diversified, open-end management investment company. The fund seeks to provide long-term capital growth and, secondarily, increasing dividend income through investments in the common stocks of well-established growth companies. The fund has three classes of shares: the Growth Stock Fund original share class, referred to in this report as the Investor Class, offered since April 11, 1950; the Growth Stock Fund—Advisor Class (Advisor Class), offered since December 31, 2001; and the Growth Stock Fund—R Class (R Class), offered since September 30, 2002. Advisor Class shares are sold only through unaffiliated brokers and other unaffiliated financial intermediaries, and R Class shares are available to retirement plans serviced by intermediaries. The Advisor Class and R Class each operate under separate Board-approved Rule 12b-1 plans, pursuant to which each class compensates financial intermediaries for distribution, shareholder servicing, and/or certain administrative services. Each class has exclusive voting rights on matters related solely to that class, separate voting rights on matters that relate to all classes, and, in all other respects, the same rights and obligations as the other classes.
The accompanying financial statements were prepared in accordance with accounting principles generally accepted in the United States of America, which require the use of estimates made by fund management. Fund management believes that estimates and security valuations are appropriate; however, actual results may differ from those estimates, and the security valuations reflected in the financial statements may differ from the value the fund ultimately realizes upon sale of the securities.
Valuation The fund values its investments and computes its net asset value per share at the close of the New York Stock Exchange (NYSE), normally 4 p.m. ET, each day that the NYSE is open for business. Equity securities listed or regularly traded on a securities exchange or in the over-the-counter (OTC) market are valued at the last quoted sale price or, for certain markets, the official closing price at the time the valuations are made, except for OTC Bulletin Board securities, which are valued at the mean of the latest bid and asked prices. A security that is listed or traded on more than one exchange is valued at the quotation on the exchange determined to be the primary market for such security. Listed securities not traded on a particular day are valued at the mean of the latest bid and asked prices for domestic securities and the last quoted sale price for international securities.
Investments in mutual funds are valued at the mutual fund’s closing net asset value per share on the day of valuation. Purchased and written options are valued at the mean of the closing bid and asked prices.
Other investments, including restricted securities, and those for which the above valuation procedures are inappropriate or are deemed not to reflect fair value are stated at fair value as determined in good faith by the T. Rowe Price Valuation Committee, established by the fund’s Board of Directors.
Most foreign markets close before the close of trading on the NYSE. If the fund determines that developments between the close of a foreign market and the close of the NYSE will, in its judgment, materially affect the value of some or all of its portfolio securities, which in turn will affect the fund’s share price, the fund will adjust the previous closing prices to reflect the fair value of the securities as of the close of the NYSE, as determined in good faith by the T. Rowe Price Valuation Committee, established by the fund’s Board of Directors. A fund may also fair value securities in other situations, such as when a particular foreign market is closed but the fund is open. In deciding whether to make fair value adjustments, the fund reviews a variety of factors, including developments in foreign markets, the performance of U.S. securities markets, and the performance of instruments trading in U.S. markets that represent foreign securities and baskets of foreign securities. The fund uses outside pricing services to provide it with closing market prices and information used for adjusting those prices. The fund cannot predict when and how often it will use closing prices and when it will adjust those prices to reflect fair value. As a means of evaluating its fair value process, the fund routinely compares closing market prices, the next day’s opening prices in the same markets, and adjusted prices.
Currency Translation Assets, including investments, and liabilities denominated in foreign currencies are translated into U.S. dollar values each day at the prevailing exchange rate, using the mean of the bid and asked prices of such currencies against U.S. dollars as quoted by a major bank. Purchases and sales of securities, income, and expenses are translated into U.S. dollars at the prevailing exchange rate on the date of the transaction. The effect of changes in foreign currency exchange rates on realized and unrealized security gains and losses is reflected as a component of security gains and losses.
Class Accounting The Advisor Class and R Class each pay distribution, shareholder servicing, and/or certain administrative expenses in the form of Rule 12b-1 fees, in an amount not exceeding 0.25% and 0.50%, respectively, of the class’s average daily net assets. Shareholder servicing, prospectus, and shareholder report expenses incurred by each class are charged directly to the class to which they relate. Expenses common to all classes, investment income, and realized and unrealized gains and losses are allocated to the classes based upon the relative daily net assets of each class.
Rebates and Credits Subject to best execution, the fund may direct certain security trades to brokers who have agreed to rebate a portion of the related brokerage commission to the fund in cash. Commission rebates are reflected as realized gain on securities in the accompanying financial statements and totaled $503,000 for the six months ended June 30, 2006. Additionally, the fund earns credits on temporarily uninvested cash balances at the custodian that reduce the fund’s custody charges. Custody expense in the accompanying financial statements is presented before reduction for credits, which are reflected as expenses paid indirectly.
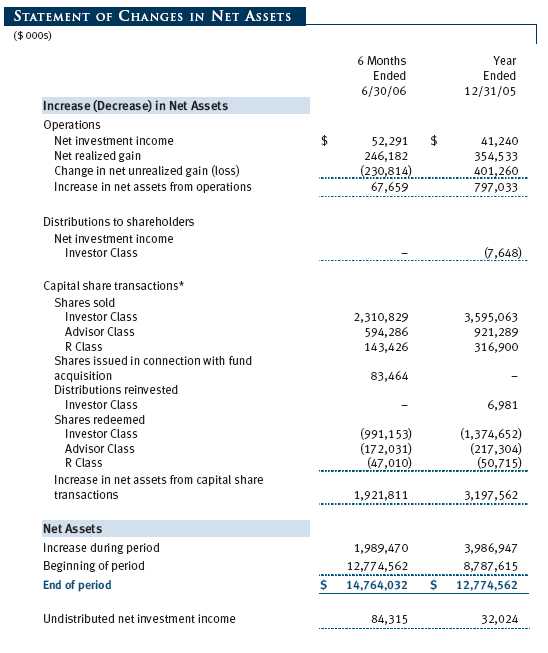
In-Kind Redemptions In accordance with guidelines described in the fund’s prospectus, the fund may distribute portfolio securities rather than cash as payment for a redemption of fund shares (in-kind redemption). For financial reporting purposes, the fund recognizes a gain on in-kind redemptions to the extent the value of the distributed securities on the date of redemption exceeds the cost of those securities. Gains and losses realized on in-kind redemptions are not recognized for tax purposes and are reclassified from undistributed realized gain (loss) to paid-in capital. During the six months ended June 30, 2006, the fund realized $46,082,000 of net gain on $105,045,000 of in-kind redemptions.
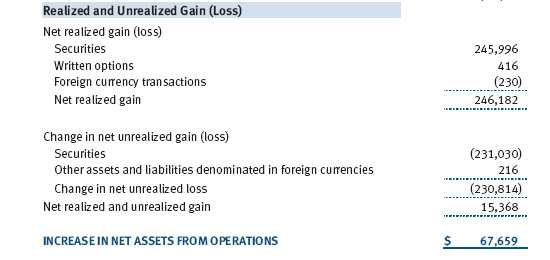
Investment Transactions, Investment Income, and Distributions Income and expenses are recorded on the accrual basis. Dividends received from mutual fund investments are reflected as dividend income; capital gain distributions are reflected as realized gain/loss. Dividend income and capital gain distributions are recorded on the ex-dividend date. Investment transactions are accounted for on the trade date. Realized gains and losses are reported on the identified cost basis. Distributions to shareholders are recorded on the ex-dividend date. Income distributions are declared and paid by each class on an annual basis. Capital gain distributions, if any, are declared and paid by the fund, typically on an annual basis.
NOTE 2 - INVESTMENT TRANSACTIONS
Consistent with its investment objective, the fund engages in the following practices to manage exposure to certain risks or to enhance performance. The investment objective, policies, program, and risk factors of the fund are described more fully in the fund’s prospectus and Statement of Additional Information.
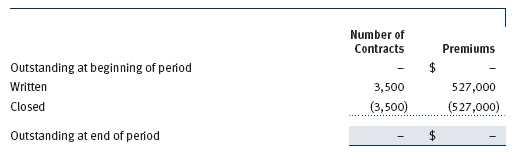
Options Call and put options give the holder the right to purchase or sell, respectively, a security at a specified price on a certain date. Risks arise from possible illiquidity of the options market and from movements in security values. Transactions in options written and related premiums received during the six months ended June 30, 2006, were as follows:
Securities Lending The fund lends its securities to approved brokers to earn additional income. It receives as collateral cash and U.S. government securities valued at 102% to 105% of the value of the securities on loan. Cash collateral is invested in a money market pooled trust managed by the fund’s lending agent in accordance with investment guidelines approved by fund management. Collateral is maintained over the life of the loan in an amount not less than the value of loaned securities, as determined at the close of fund business each day; any additional collateral required due to changes in security values is delivered to the fund the next business day. Although risk is mitigated by the collateral, the fund could experience a delay in recovering its securities and a possible loss of income or value if the borrower fails to return the securities. Securities lending revenue recognized by the fund consists of earnings on invested collateral and borrowing fees, net of any rebates to the borrower and compensation to the lending agent. At June 30, 2006, there were no securities on loan.
Other Purchases and sales of portfolio securities, other than short-term securities, aggregated $4,719,564,000 and $2,688,379,000, respectively, for the six months ended June 30, 2006.
NOTE 3 - FEDERAL INCOME TAXES
No provision for federal income taxes is required since the fund intends to continue to qualify as a regulated investment company under Subchapter M of the Internal Revenue Code and distribute to shareholders all of its taxable income and gains. Federal income tax regulations differ from generally accepted accounting principles; therefore, distributions determined in accordance with tax regulations may differ in amount or character from net investment income and realized gains for financial reporting purposes. Financial reporting records are adjusted for permanent book/tax differences to reflect tax character. Financial records are not adjusted for temporary differences. The amount and character of tax-basis distributions and composition of net assets are finalized at fiscal year-end; accordingly, tax-basis balances have not been determined as of June 30, 2006.
The fund intends to retain realized gains to the extent of available capital loss carryforwards. As of December 31, 2005, the fund had $39,627,000 of unused capital loss carryforwards, of which $27,939,000 expire in 2010 and $11,688,000 expire in 2011.
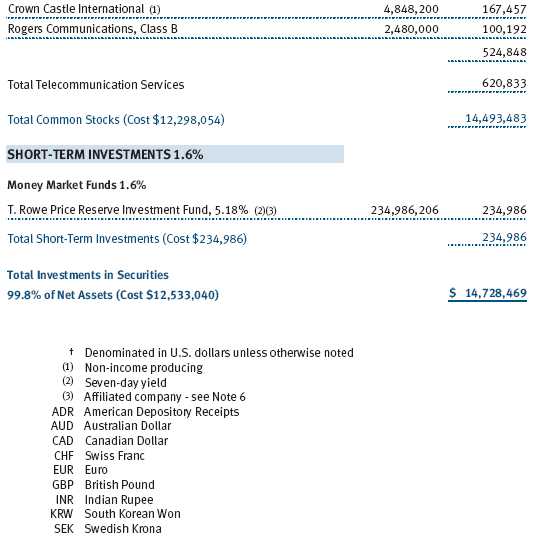
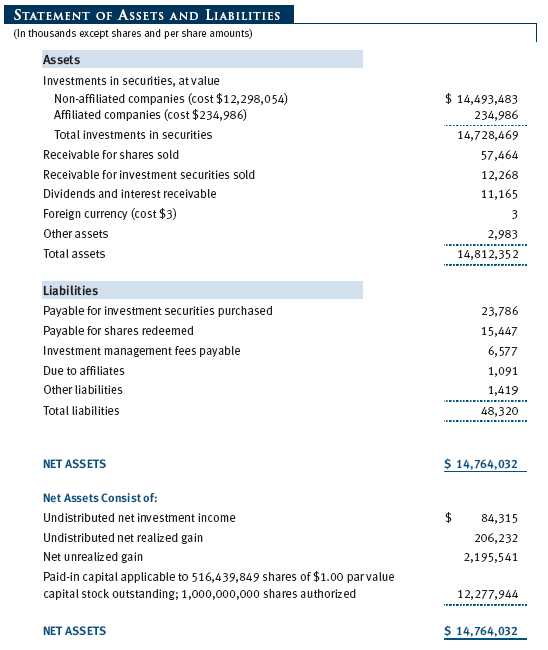
At June 30, 2006, the cost of investments for federal income tax purposes was $12,533,040,000. Net unrealized gain aggregated $2,195,541,000 at period-end, of which $2,538,800,000 related to appreciated investments and $343,259,000 related to depreciated investments.
NOTE 4 - FOREIGN TAXES
The fund is subject to foreign income taxes imposed by certain countries in which it invests. Additionally, capital gains realized by the fund upon disposition of securities issued in or by certain foreign countries are subject to capital gains tax imposed by those countries, which is payable prior to repatriation of sale proceeds. Similarly, a tax on net profits, including interest income and realized and unrealized capital gains, is imposed by certain other countries. All taxes are computed in accordance with the applicable foreign tax law, and, to the extent permitted, capital losses are used to offset capital gains. Tax expense attributable to income is accrued by the fund as a reduction of income. Current and deferred tax expense attributable to net capital gains is reflected as a component of realized and/or change in unrealized gain/loss on securities in the accompanying financial statements.
At June 30, 2006, the fund had no taxes payable attributable to foreign securities, no deferred tax liability attributable to foreign securities, and $8,906,000 of foreign capital loss carryforwards that expire in 2013.
NOTE 5 - ACQUISITION
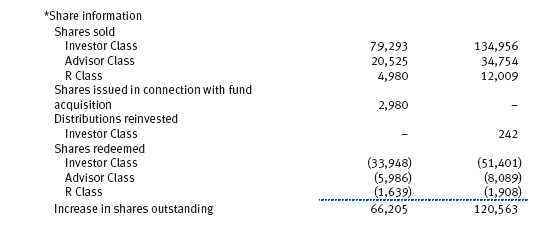
On June 19, 2006, the fund acquired substantially all of the assets of Preferred Large-Cap Growth Fund (the acquired fund), pursuant to the Agreement and Plan of Reorganization dated February 15, 2006, and approved by the acquired fund’s shareholders on June 9, 2006. The acquisition was accomplished by a tax-free exchange of 2,979,781 shares of the fund, having a value of $83,464,000, for the 7,056,568 shares of the acquired fund outstanding at the merger date. The net assets of the acquired fund at that date included $7,410,000 of unrealized appreciation. Upon merger, the net assets of the acquired fund were combined with those of the fund, resulting in aggregate net assets of $12,226,750,000.
NOTE 6 - RELATED PARTY TRANSACTIONS
The fund is managed by T. Rowe Price Associates, Inc. (the manager or Price Associates), a wholly owned subsidiary of T. Rowe Price Group, Inc. The investment management agreement between the fund and the manager provides for an annual investment management fee, which is computed daily and paid monthly. The fee consists of an individual fund fee and a group fee. The individual fund fee is equal to 0.25% of the fund’s average daily net assets up to $15 billion and 0.21% of the fund’s average daily net assets in excess of $15 billion. The group fee rate is calculated based on the combined net assets of certain mutual funds sponsored by Price Associates (the group) applied to a graduated fee schedule, with rates ranging from 0.48% for the first $1 billion of assets to 0.29% for assets in excess of $160 billion. The fund’s group fee is determined by applying the group fee rate to the fund’s average daily net assets. At June 30, 2006, the effective annual group fee rate was 0. 31%.
In addition, the fund has entered into service agreements with Price Associates and two wholly owned subsidiaries of Price Associates (collectively, Price). Price Associates computes the daily share prices and provides certain other administrative services to the fund. T. Rowe Price Services, Inc., provides shareholder and administrative services in its capacity as the fund’s transfer and dividend disbursing agent. T. Rowe Price Retirement Plan Services, Inc., provides subaccounting and recordkeeping services for certain retirement accounts invested in the Investor Class and R Class. For the six months ended June 30, 2006, expenses incurred pursuant to these service agreements were $52,000 for Price Associates, $1,421,000 for T. Rowe Price Services, Inc., and $2,435,000 for T. Rowe Price Retirement Plan Services, Inc. The total amount payable at period-end pursuant to these service agreements is reflected as Due to Affiliates in the accompanying fi nancial statements.
The fund is also one of several mutual funds sponsored by Price Associates (underlying Price funds) in which the T. Rowe Price Spectrum Funds (Spectrum Funds) and T. Rowe Price Retirement Funds (Retirement Funds) may invest. Neither the Spectrum Funds nor the Retirement Funds invest in the underlying Price funds for the purpose of exercising management or control. Pursuant to separate, special servicing agreements, expenses associated with the operation of the Spectrum and Retirement Funds are borne by each underlying Price fund to the extent of estimated savings to it and in proportion to the average daily value of its shares owned by the Spectrum and Retirement Funds, respectively. Expenses allocated under these agreements are reflected as shareholder servicing expenses in the accompanying financial statements. For the six months ended June 30, 2006, the fund was allocated $423,000 of Spectrum Funds’ expenses and $2,398,000 of Retirement Funds’ expenses. Of these amounts, $2,161,000 related to services provided by Price. The amount payable at period-end pursuant to this agreement is reflected as Due to Affiliates in the accompanying financial statements. At June 30, 2006, approximately 4% of the outstanding shares of the Investor Class were held by the Spectrum Funds and 16% were held by the Retirement Funds.
The fund may invest in the T. Rowe Price Reserve Investment Fund and the T. Rowe Price Government Reserve Investment Fund (collectively, the T. Rowe Price Reserve Funds), open-end management investment companies managed by Price Associates and affiliates of the fund. The T. Rowe Price Reserve Funds are offered as cash management options to mutual funds, trusts, and other accounts managed by Price Associates and/or its affiliates, and are not available for direct purchase by members of the public. The T. Rowe Price Reserve Funds pay no investment management fees. During the six months ended June 30, 2006, dividend income from the T. Rowe Price Reserve Funds totaled $10,267,000, and the value of shares of the T. Rowe Price Reserve Funds held at June 30, 2006, and December 31, 2005, was $234,986,000 and $450,829,000, respectively.
As of June 30, 2006, T. Rowe Price Group, Inc. and/or its wholly owned subsidiaries owned 895,424 shares of the Investor Class, representing less than 1% of the fund’s net assets.
| INFORMATION ON PROXY VOTING POLICIES, PROCEDURES, AND RECORDS |
A description of the policies and procedures used by T. Rowe Price funds and portfolios to determine how to vote proxies relating to portfolio securities is available in each fund’s Statement of Additional Information, which you may request by calling 1-800-225-5132 or by accessing the SEC’s Web site, www.sec.gov. The description of our proxy voting policies and procedures is also available on our Web site, www.troweprice.com. To access it, click on the words “Company Info” at the top of our homepage for individual investors. Then, in the window that appears, click on the “Proxy Voting Policy” navigation button in the top left corner.
Each fund’s most recent annual proxy voting record is available on our Web site and through the SEC’s Web site. To access it through our Web site, follow the directions above, then click on the words “Proxy Voting Record” at the bottom of the Proxy Voting Policy page.
| HOW TO OBTAIN QUARTERLY PORTFOLIO HOLDINGS |
The fund files a complete schedule of portfolio holdings with the Securities and Exchange Commission for the first and third quarters of each fiscal year on Form N-Q. The fund’s Form N-Q is available electronically on the SEC’s Web site (www.sec.gov); hard copies may be reviewed and copied at the SEC’s Public Reference Room, 450 Fifth St. N.W., Washington, DC 20549. For more information on the Public Reference Room, call 1-800-SEC-0330.
| APPROVAL OF INVESTMENT MANAGEMENT AGREEMENT |
On March 8, 2006, the fund’s Board of Directors unanimously approved the investment advisory contract (Contract) between the fund and its investment manager, T. Rowe Price Associates, Inc. (Manager). The Board considered a variety of factors in connection with its review of the Contract, also taking into account information provided by the Manager during the course of the year, as discussed below:
Services Provided by the Manager
The Board considered the nature, quality, and extent of the services provided to the fund by the Manager. These services included, but were not limited to, management of the fund’s portfolio and a variety of activities related to portfolio management. The Board also reviewed the background and experience of the Manager’s senior management team and investment personnel involved in the management of the fund. The Board concluded that it was satisfied with the nature, quality, and extent of the services provided by the Manager.
Investment Performance of the Fund
The Board reviewed the fund’s average annual total return over the 1-, 3-, 5-, and 10-year periods as well as the fund’s year-by-year returns and compared these returns with previously agreed upon comparable performance measures and market data, including those supplied by Lipper and Morningstar, which are independent providers of mutual fund data. On the basis of this evaluation and the Board’s ongoing review of investment results, the Board concluded that the fund’s performance was satisfactory.
Costs, Benefits, Profits, and Economies of Scale
The Board reviewed detailed information regarding the revenues received by the Manager under the Contract and other benefits that the Manager (and its affiliates) may have realized from its relationship with the fund, including research received under “soft dollar” agreements. The Board noted that the use of soft dollars as a means of paying for third-party, non-broker research had been eliminated. The Board also received information on the estimated costs incurred and profits realized by the Manager and its affiliates from advising T. Rowe Price mutual funds, as well as estimates of the gross profits realized from managing the fund in particular. The Board concluded that the Manager’s profits were reasonable in light of the services provided to the fund. The Board also considered whether the fund or other funds benefit under the fee levels set forth in the Contract from any economies of scale realized by the Manager. Under the Contract, the fund pays a fee to the Manager composed of two components—a group fee rate based on the aggregate assets of certain T. Rowe Price mutual funds (including the fund) that declines at certain asset levels and an individual fund fee rate that is assessed on the assets of the fund. The Board concluded that the advisory fee structure for the fund continued to provide for a reasonable sharing of benefits from any economies of scale with the fund’s investors.
Fees
The Board reviewed the fund’s management fee rate, operating expenses, and total expense ratio (for the Investor Class, Advisor Class, and R Class) and compared them with fees and expenses of other comparable funds based on information and data supplied by Lipper. The information provided to the Board indicated that the fund’s management fee rate for all three classes and expense ratio for the Investor Class and Advisor Class were generally at or below the median for comparable funds. The information also indicated that the fund’s expense ratio for the R Class was generally above the median for comparable funds. The Board also reviewed the fee schedules for comparable privately managed accounts of the Manager and its affiliates. Management informed the Board that the Manager’s responsibilities for privately managed accounts are more limited than its responsibilities for the fund and other T. Rowe Price mutual funds that it or its affiliates advise. On the basis of the information provided, the Board concluded that the fees paid by the fund under the Contract were reasonable.
Approval of the Contract
As noted, the Board approved the continuation of the Contract. No single factor was considered in isolation or to be determinative to the decision. Rather, the Board concluded, in light of a weighting and balancing of all factors considered, that it was in the best interests of the fund to approve the continuation of the Contract, including the fees to be charged for services thereunder.
 Item 2. Code of Ethics.
A code of ethics, as defined in Item 2 of Form N-CSR, applicable to its principal executive officer, principal financial officer, principal accounting officer or controller, or persons performing similar functions is filed as an exhibit to the registrant’s annual Form N-CSR. No substantive amendments were approved or waivers were granted to this code of ethics during the registrant’s most recent fiscal half-year.
Item 3. Audit Committee Financial Expert.
Disclosure required in registrant’s annual Form N-CSR.
Item 4. Principal Accountant Fees and Services.
Disclosure required in registrant’s annual Form N-CSR.
Item 5. Audit Committee of Listed Registrants.
Not applicable.
Item 6. Schedule of Investments.
Not applicable. The complete schedule of investments is included in Item 1 of this Form N-CSR.
Item 7. Disclosure of Proxy Voting Policies and Procedures for Closed-End Management Investment Companies.
Not applicable.
Item 8. Portfolio Managers of Closed-End Management Investment Companies.
Not applicable.
Item 9. Purchases of Equity Securities by Closed-End Management Investment Company and Affiliated Purchasers.
Not applicable.
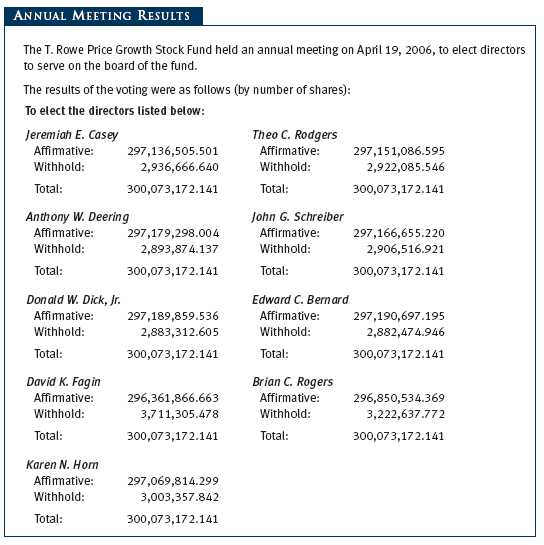
Item 10. Submission of Matters to a Vote of Security Holders.
Not applicable.
Item 11. Controls and Procedures.
(a) The registrant’s principal executive officer and principal financial officer have evaluated the registrant’s disclosure controls and procedures within 90 days of this filing and have concluded that the registrant’s disclosure controls and procedures were effective, as of that date, in ensuring that information required to be disclosed by the registrant in this Form N-CSR was recorded, processed, summarized, and reported timely.
(b) The registrant’s principal executive officer and principal financial officer are aware of no change in the registrant’s internal control over financial reporting that occurred during the registrant’s second fiscal quarter covered by this report that has materially affected, or is reasonably likely to materially affect, the registrant’s internal control over financial reporting.
Item 12. Exhibits.(a)(1) The registrant’s code of ethics pursuant to Item 2 of Form N-CSR is filed with the registrant’s annual Form N-CSR.
(2) Separate certifications by the registrant's principal executive officer and principal financial officer, pursuant to Section 302 of the Sarbanes-Oxley Act of 2002 and required by Rule 30a-2(a) under the Investment Company Act of 1940, are attached.
(3) Written solicitation to repurchase securities issued by closed-end companies: not applicable.
(b) A certification by the registrant's principal executive officer and principal financial officer, pursuant to Section 906 of the Sarbanes-Oxley Act of 2002 and required by Rule 30a-2(b) under the Investment Company Act of 1940, is attached.
| | |
SIGNATURES |
| |
| | Pursuant to the requirements of the Securities Exchange Act of 1934 and the Investment |
| Company Act of 1940, the registrant has duly caused this report to be signed on its behalf by the |
| undersigned, thereunto duly authorized. |
| |
| T. Rowe Price Growth Stock Fund, Inc. |
| |
| |
| By | /s/ Edward C. Bernard |
| | Edward C. Bernard |
| | Principal Executive Officer |
| |
| Date | August 18, 2006 |
| |
| |
| | Pursuant to the requirements of the Securities Exchange Act of 1934 and the Investment |
| Company Act of 1940, this report has been signed below by the following persons on behalf of |
| the registrant and in the capacities and on the dates indicated. |
| |
| |
| By | /s/ Edward C. Bernard |
| | Edward C. Bernard |
| | Principal Executive Officer |
| |
| Date | August 18, 2006 |
| |
| |
| By | /s/ Joseph A. Carrier |
| | Joseph A. Carrier |
| | Principal Financial Officer |
| |
| Date | August 18, 2006 |