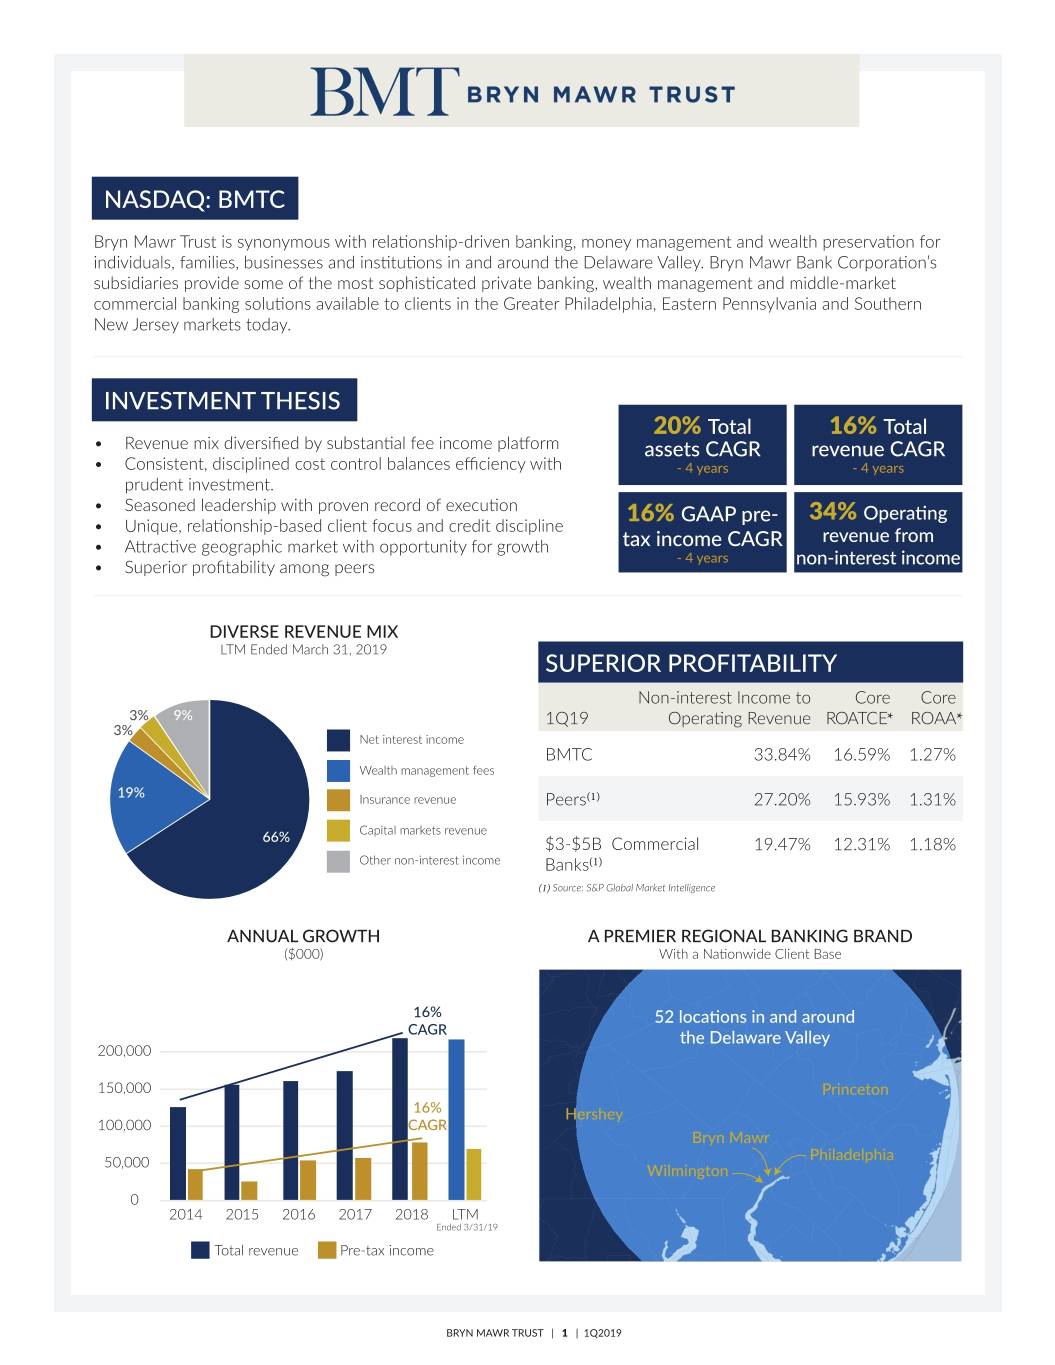
NASDAQ: BMTC Bryn Mawr Trust is synonymous with relationship-driven banking, money management and wealth preservation for individuals, families, businesses and institutions in and around the Delaware Valley. Bryn Mawr Bank Corporation’s subsidiaries provide some of the most sophisticated private banking, wealth management and middle-market commercial banking solutions available to clients in the Greater Philadelphia, Eastern Pennsylvania and Southern New Jersey markets today. INVESTMENT THESIS 20% Total 16% Total • Revenue mix diversified by substantial fee income platform assets CAGR revenue CAGR • Consistent, disciplined cost control balances efficiency with - 4 years - 4 years prudent investment. • Seasoned leadership with proven record of execution GAAP pre- 34% Operating • Unique, relationship-based client focus and credit discipline 16% revenue from • Attractive geographic market with opportunity for growth tax income CAGR - 4 years • Superior profitability among peers non-interest income DIVERSE REVENUE MIX LTM Ended March 31, 2019 SUPERIOR PROFITABILITY Non-interest Income to Core Core 3� 9� 1Q19 Operating Revenue ROATCE* ROAA* 3� ��� �������� ������ BMTC 33.84% 16.59% 1.27% ������ ���������� ���� 19� ��������� ������� Peers(1) 27.20% 15.93% 1.31% ������� ������� ������� ��� $3-$5B Commercial 19.47% 12.31% 1.18% O���� ������������ ������ Banks(1) (1) Source: S&P Global Market Intelligence ANNUAL GROWTH A PREMIER REGIONAL BANKING BRAND ($000) With a Nationwide Client Base 1�� 52 locations in and around CAGR the Delaware Valley ������� 1������ Princeton 1�� Hershey 1������ CAGR Bryn Mawr ������ Phila�elphia Wilmin�ton � ��1� ��1� ��16 ��1� ��1� �TM ����� 3�31�19 T���� ������� ������� ������ BRYN MAWR TRUST | 1 | 1Q2019
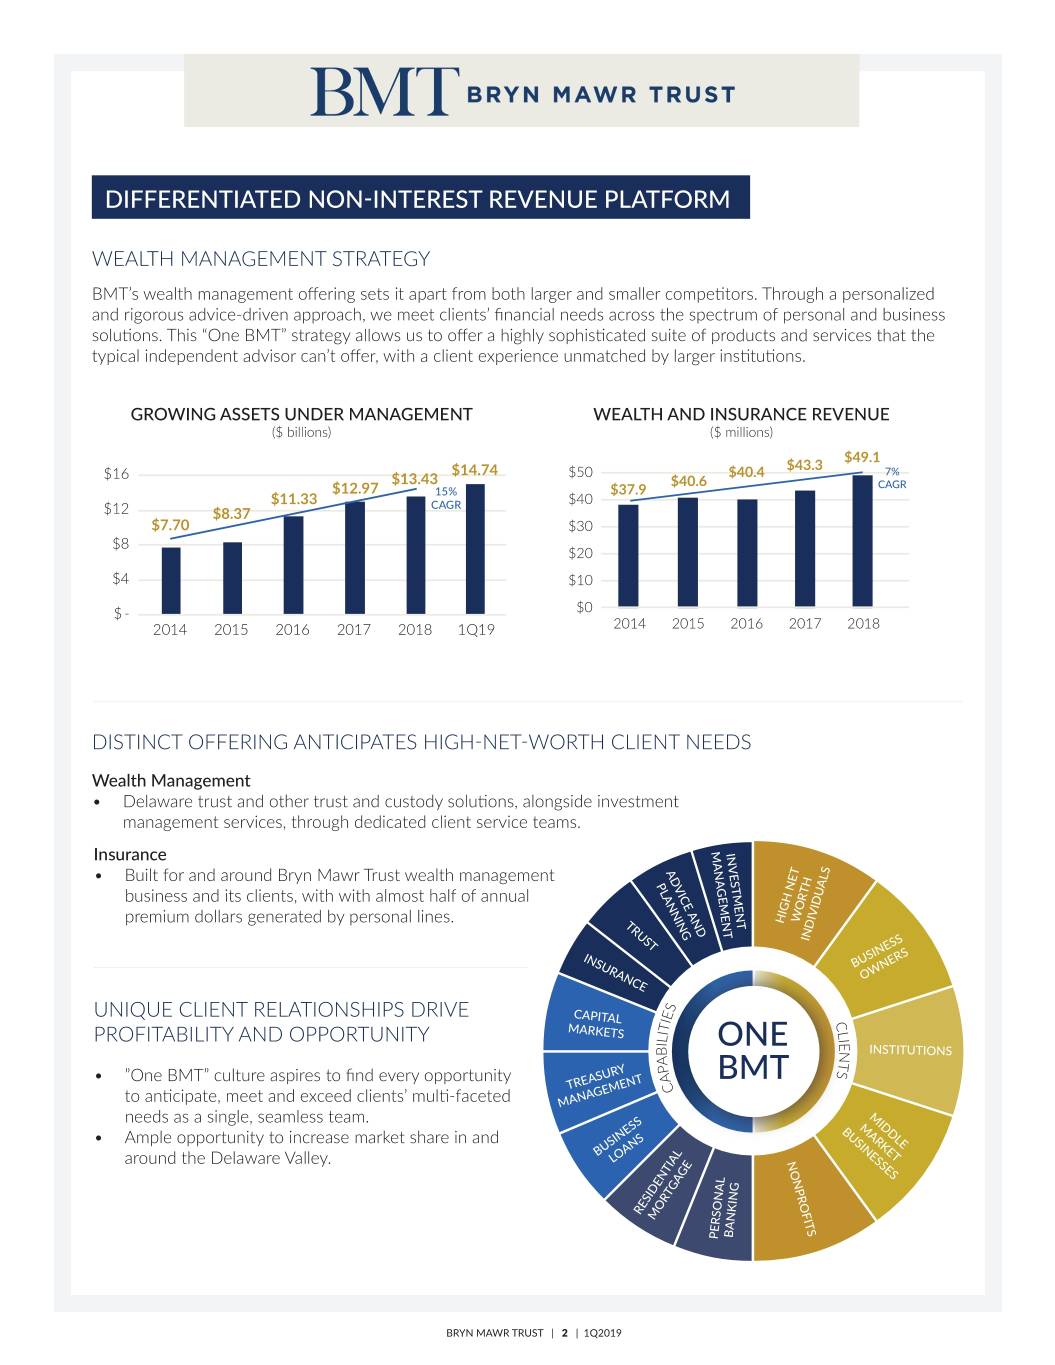
DIFFERENTIATED NON-INTEREST REVENUE PLATFORM WEALTH MANAGEMENT STRATEGY BMT’s wealth management offering sets it apart from both larger and smaller competitors. Through a personalized and rigorous advice-driven approach, we meet clients’ financial needs across the spectrum of personal and business solutions. This “One BMT” strategy allows us to offer a highly sophisticated suite of products and services that the typical independent advisor can’t offer, with a client experience unmatched by larger institutions. GROWING ASSETS UNDER MANAGEMENT WEALTH AND INSURANCE REVENUE ($ billions) ($ millions) $49.1 $49.2 $43.3 �16 $14.74 ��� $40.4 �� $13.43 $40.6 CAGR $12.97 1�� $37.9 $11.33 CAGR ��� �1� $8.37 $7.70 �3� �� ��� �� �1� � � �� ��1� ��1� ��16 ��1� ��1� �TM ��1� ��1� ��16 ��1� ��1� 1Q19 ����� 3�31�19 DISTINCT OFFERING ANTICIPATES HIGH-NET-WORTH CLIENT NEEDS Wealth Management • Delaware trust and other trust and custody solutions, alongside investment management services, through dedicated client service teams. MANAGEMENT Insurance INVESTMENT ADVICE AND • Built for and around Bryn Mawr Trust wealth management PLANNING business and its clients, with with almost half of annual premium dollars generated by personal lines. TRUST HIGH NETWORTH INDIVIDUALS INSURANCE BUSINESS OWNERS � UNIQUE CLIENT RELATIONSHIPS DRIVE CAPITAL � � � MARKETS T � � � PROFITABILITY AND OPPORTUNITY � � � ONE � B INSTITUTIONS T A � � • ”One BMT” culture aspires to find every opportunity A BMT TREASURY � to anticipate, meet and exceed clients’ multi-faceted MANAGEMENT needs as a single, seamless team. MIDDLE MARKET • Ample opportunity to increase market share in and BUSINESSES BUSINESS around the Delaware Valley. LOANS NONPROFITS RESIDENTIAL MORTGAGE BANKING PERSONAL BRYN MAWR TRUST | 2 | 1Q2019
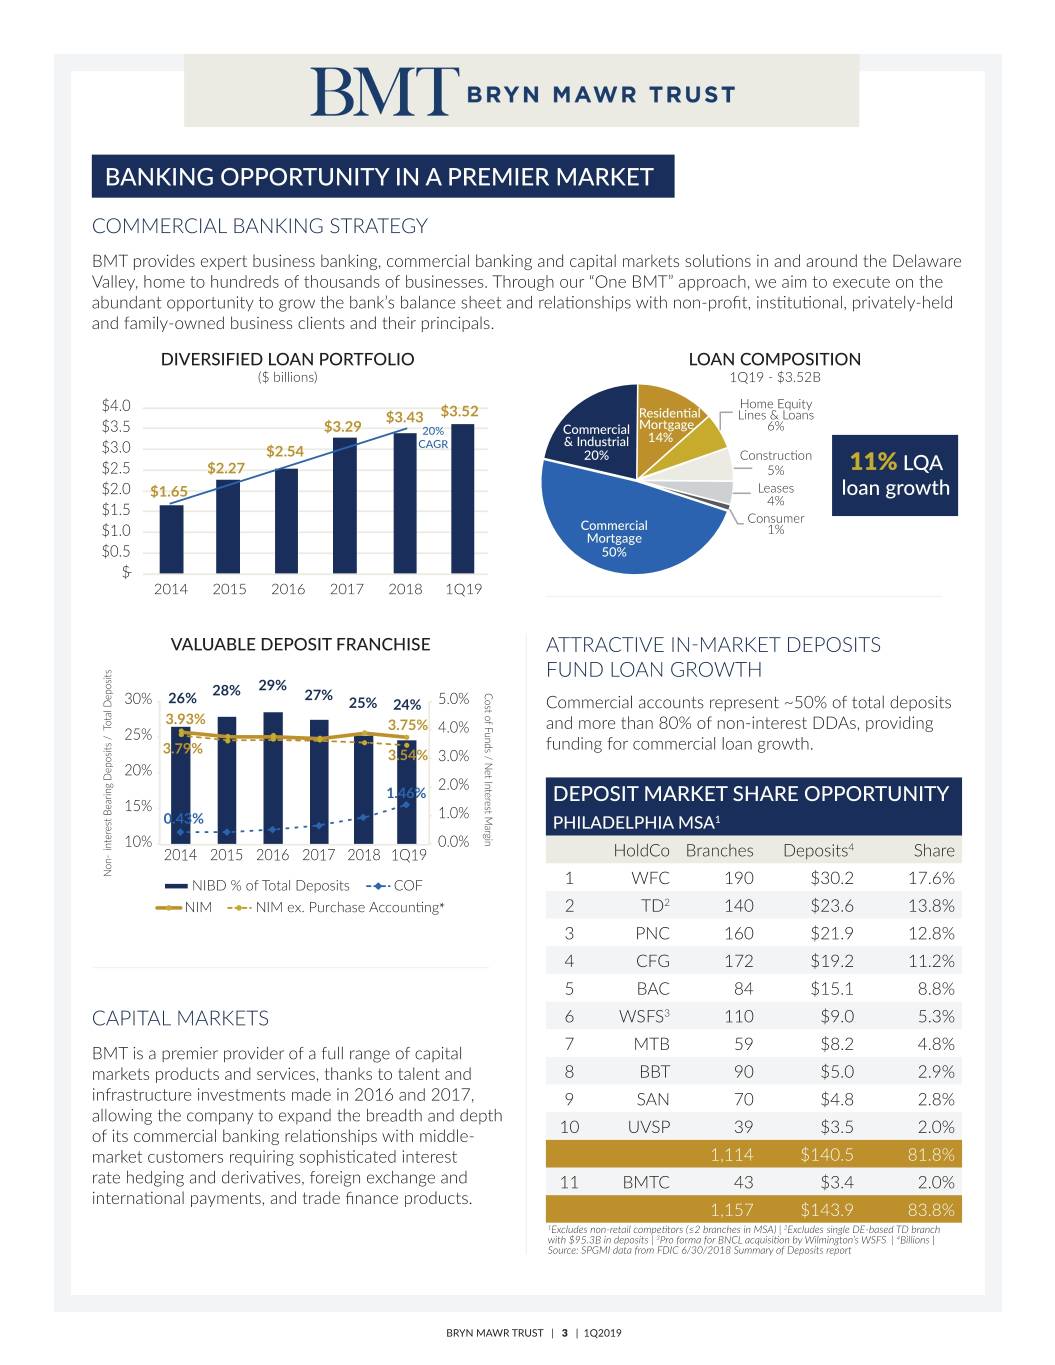
BANKING OPPORTUNITY IN A PREMIER MARKET COMMERCIAL BANKING STRATEGY BMT provides expert business banking, commercial banking and capital markets solutions in and around the Delaware Valley, home to hundreds of thousands of businesses. Through our “One BMT” approach, we aim to execute on the abundant opportunity to grow the bank’s balance sheet and relationships with non-profit, institutional, privately-held and family-owned business clients and their principals. DIVERSIFIED LOAN PORTFOLIO LOAN COMPOSITION ($ billions) 1Q19 - $3.52B ���� ���� ������ $3.43 $3.52 Residential ����� � ����� �3�� $3.29 ��� Commercial Mort�a�e 6� 14� �3�� CAGR � In�ustrial $2.54 ��� Construction ���� $2.27 �� 11% LQA ���� $1.65 ������ loan growth �� �1�� �������� Commercial 1� �1�� Mort�a�e ���� ��� �� ��1� ��1� ��16 ��1� ��1� 1Q19 VALUABLE DEPOSIT FRANCHISE ATTRACTIVE IN-MARKET DEPOSITS FUND LOAN GROWTH 29% ������ ����� � ��� �������� M����� 28% 27% 3�� 26% 25% 24% ���� Commercial accounts represent ~50% of total deposits 3.93% 3.75% and more than 80% of non-interest DDAs, providing ��� ���� funding for commercial loan growth. 3.79% 3.54% 3��� ��� ���� 1.46% DEPOSIT MARKET SHARE OPPORTUNITY 1�� 1��� 0.43% PHILADELPHIA MSA1 1�� ���� 4 � �������� T���� � �������� B������ �������� ��1� ��1� ��16 ��1� ��1� 1Q19 HoldCo Branches Deposits Share ��� ��B� � �� T���� �������� �O� 1 WFC 190 $30.2 17.6% ��M NIM ex. Purchase Accounting* 2 TD2 140 $23.6 13.8% 3 PNC 160 $21.9 12.8% 4 CFG 172 $19.2 11.2% 5 BAC 84 $15.1 8.8% CAPITAL MARKETS 6 WSFS3 110 $9.0 5.3% 7 MTB 59 $8.2 4.8% BMT is a premier provider of a full range of capital markets products and services, thanks to talent and 8 BBT 90 $5.0 2.9% infrastructure investments made in 2016 and 2017, 9 SAN 70 $4.8 2.8% allowing the company to expand the breadth and depth 10 UVSP 39 $3.5 2.0% of its commercial banking relationships with middle- market customers requiring sophisticated interest 1,114 $140.5 81.8% rate hedging and derivatives, foreign exchange and 11 BMTC 43 $3.4 2.0% international payments, and trade finance products. 1,157 $143.9 83.8% 1Excludes non-retail competitors (≤2 branches in MSA) | 2Excludes single DE-based TD branch with $95.3B in deposits | 3Pro forma for BNCL acquisition by Wilmington’s WSFS | 4Billions | Source: SPGMI data from FDIC 6/30/2018 Summary of Deposits report BRYN MAWR TRUST | 3 | 1Q2019
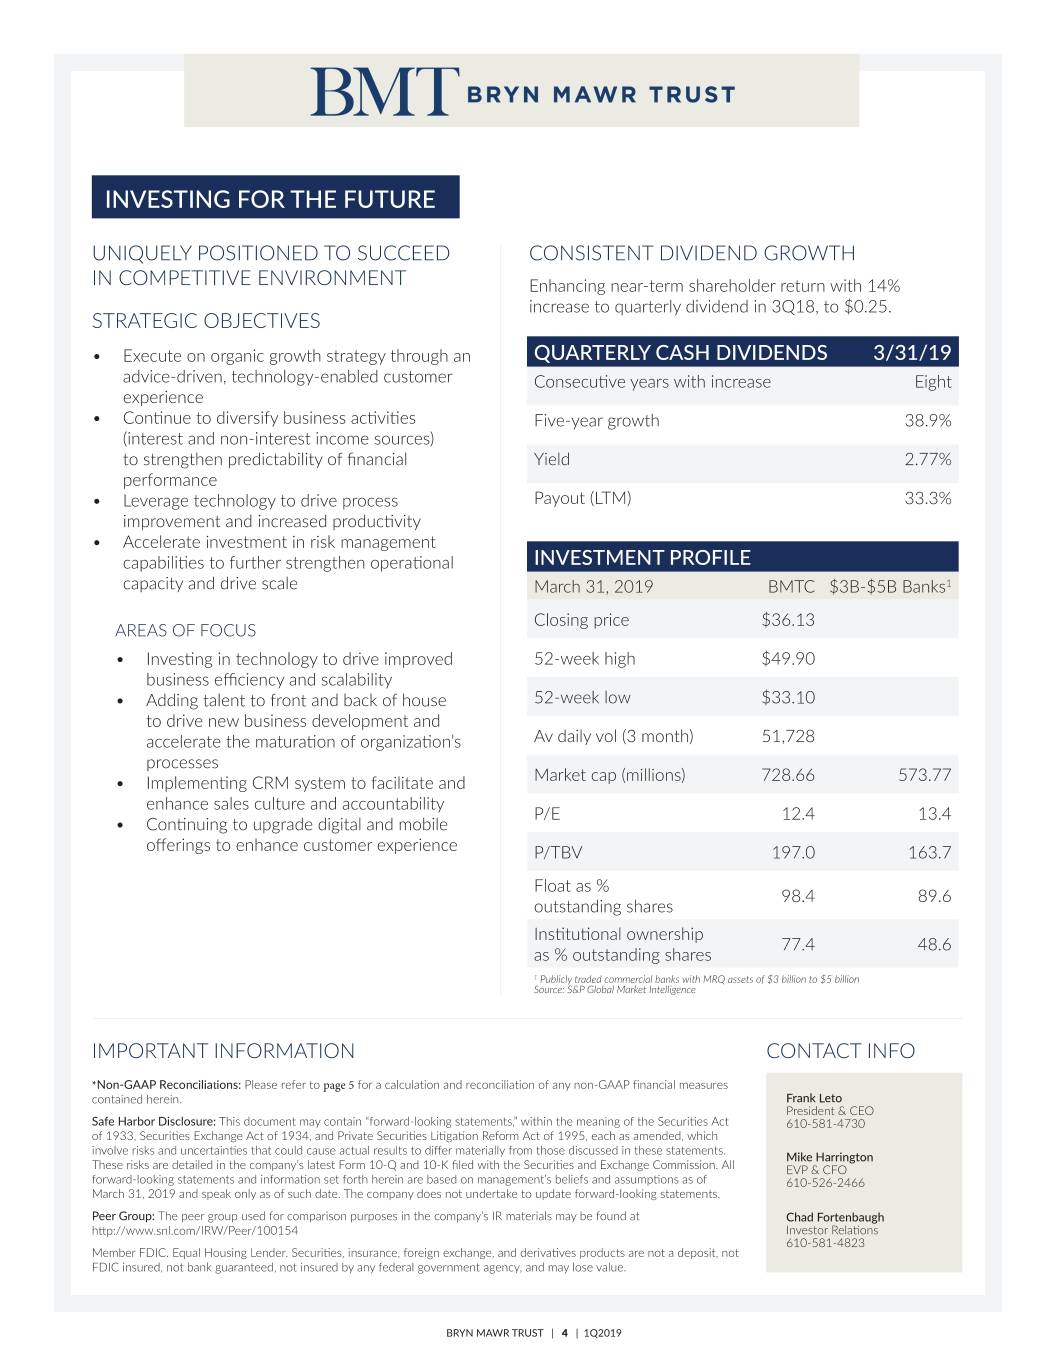
INVESTING FOR THE FUTURE UNIQUELY POSITIONED TO SUCCEED CONSISTENT DIVIDEND GROWTH IN COMPETITIVE ENVIRONMENT Enhancing near-term shareholder return with 14% increase to quarterly dividend in 3Q18, to $0.25. STRATEGIC OBJECTIVES • Execute on organic growth strategy through an QUARTERLY CASH DIVIDENDS 3/31/19 advice-driven, technology-enabled customer Consecutive years with increase Eight experience • Continue to diversify business activities Five-year growth 38.9% (interest and non-interest income sources) to strengthen predictability of financial Yield 2.77% performance • Leverage technology to drive process Payout (LTM) 33.3% improvement and increased productivity • Accelerate investment in risk management capabilities to further strengthen operational INVESTMENT PROFILE capacity and drive scale March 31, 2019 BMTC $3B-$5B Banks1 Closing price $36.13 AREAS OF FOCUS • Investing in technology to drive improved 52-week high $49.90 business efficiency and scalability • Adding talent to front and back of house 52-week low $33.10 to drive new business development and accelerate the maturation of organization’s Av daily vol (3 month) 51,728 processes • Implementing CRM system to facilitate and Market cap (millions) 728.66 573.77 enhance sales culture and accountability P/E 12.4 13.4 • Continuing to upgrade digital and mobile offerings to enhance customer experience P/TBV 197.0 163.7 Float as % 98.4 89.6 outstanding shares Institutional ownership 77.4 48.6 as % outstanding shares 1 Publicly traded commercial banks with MRQ assets of $3 billion to $5 billion Source: S&P Global Market Intelligence IMPORTANT INFORMATION CONTACT INFO *Non-GAAP Reconciliations: Please refer to page 5 for a calculation and reconciliation of any non-GAAP financial measures contained herein. Frank Leto President & CEO Safe Harbor Disclosure: This document may contain “forward-looking statements,” within the meaning of the Securities ctA 610-581-4730 of 1933, Securities Exchange Act of 1934, and Private Securities Litigation ormRef Act of 1995, each as amended, which involve risks and uncertainties that could cause actual results to differ materially from those discussed in these statements. Mike Harrington These risks are detailed in the company’s latest Form 10-Q and 10-K filed with the Securities and Exchangeommission. C All EVP & CFO forward-looking statements and information set forth herein are based on management’s beliefs and assumptions as of 610-526-2466 March 31, 2019 and speak only as of such date. The company does not undertake to update forward-looking statements. Peer Group: The peer group used for comparison purposes in the company’s IR materials may be found at Chad Fortenbaugh http://www.snl.com/IRW/Peer/100154 Investor Relations 610-581-4823 Member FDIC. Equal Housing Lender. Securities, insurance, foreign exchange, and derivatives products are tno a deposit, not FDIC insured, not bank guaranteed, not insured by any federal government agency, and may lose value. BRYN MAWR TRUST | 4 | 1Q2019
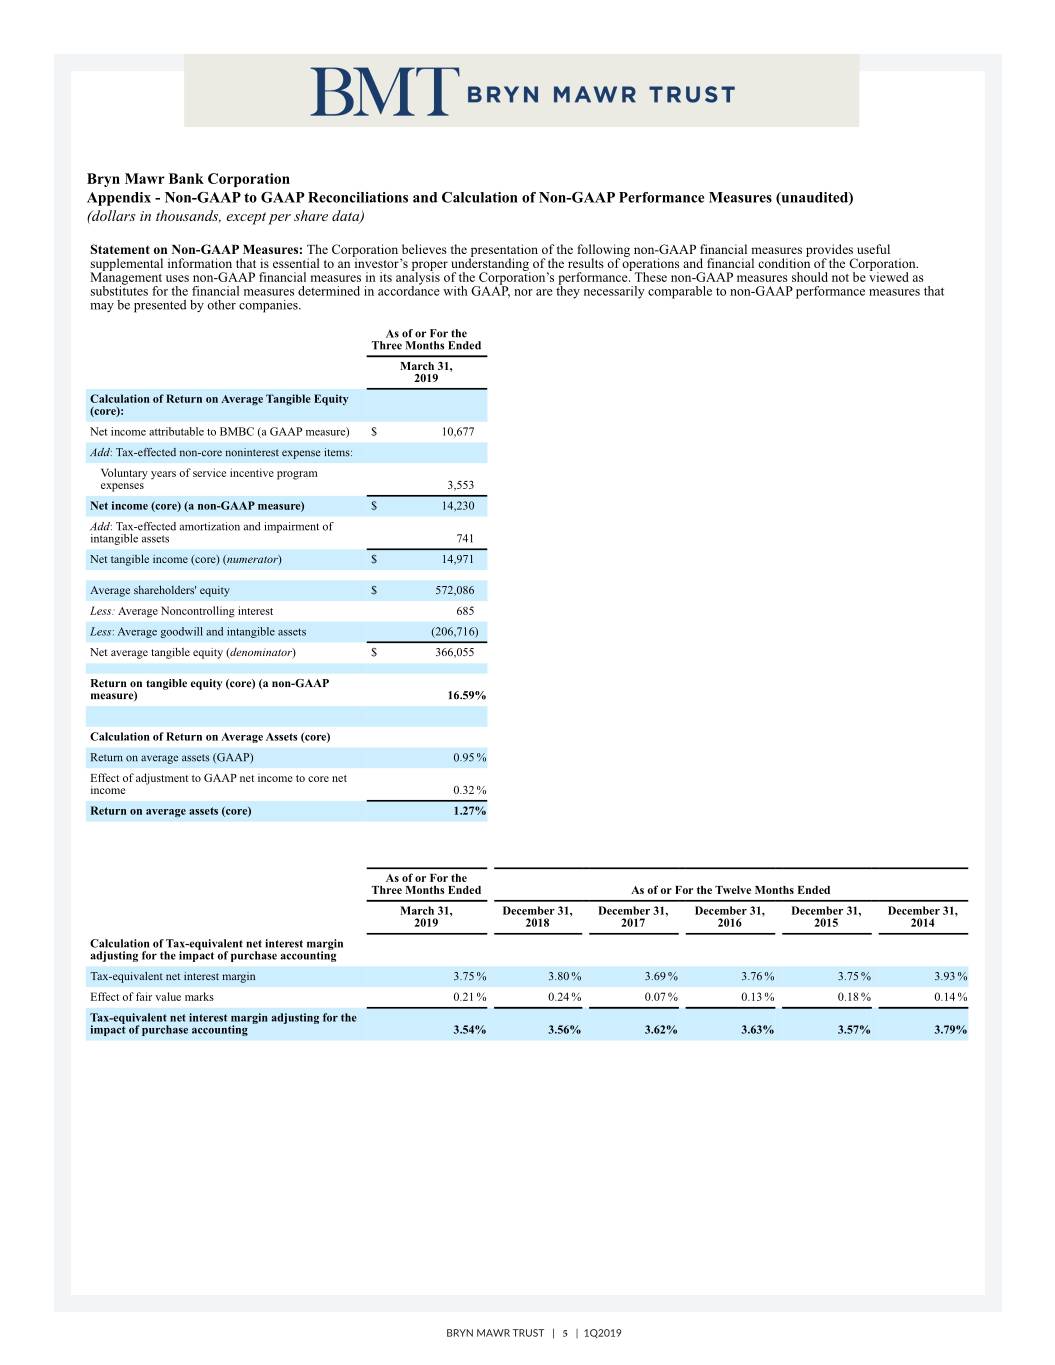
Bryn Mawr Bank Corporation Appendix - Non-GAAP to GAAP Reconciliations and Calculation of Non-GAAP Performance Measures (unaudited) (dollars in thousands, except per share data) Statement on Non-GAAP Measures: The Corporation believes the presentation of the following non-GAAP financial measures provides useful supplemental information that is essential to an investor’s proper understanding of the results of operations and financial condition of the Corporation. Management uses non-GAAP financial measures in its analysis of the Corporation’s performance. These non-GAAP measures should not be viewed as substitutes for the financial measures determined in accordance with GAAP, nor are they necessarily comparable to non-GAAP performance measures that may be presented by other companies. As of or For the Three Months Ended March 31, 2019 Calculation of Return on Average Tangible Equity (core): Net income attributable to BMBC (a GAAP measure) $ 10,677 Add: Tax-effected non-core noninterest expense items: Voluntary years of service incentive program expenses 3,553 Net income (core) (a non-GAAP measure) $ 14,230 Add: Tax-effected amortization and impairment of intangible assets 741 Net tangible income (core) (numerator) $ 14,971 Average shareholders' equity $ 572,086 Less: Average Noncontrolling interest 685 Less: Average goodwill and intangible assets (206,716) Net average tangible equity (denominator) $ 366,055 Return on tangible equity (core) (a non-GAAP measure) 16.59% Calculation of Return on Average Assets (core) Return on average assets (GAAP) 0.95 % Effect of adjustment to GAAP net income to core net income 0.32 % Return on average assets (core) 1.27% As of or For the Three Months Ended As of or For the Twelve Months Ended March 31, December 31, December 31, December 31, December 31, December 31, 2019 2018 2017 2016 2015 2014 Calculation of Tax-equivalent net interest margin adjusting for the impact of purchase accounting Tax-equivalent net interest margin 3.75 % 3.80 % 3.69 % 3.76 % 3.75 % 3.93 % Effect of fair value marks 0.21 % 0.24 % 0.07 % 0.13 % 0.18 % 0.14 % Tax-equivalent net interest margin adjusting for the impact of purchase accounting 3.54% 3.56% 3.62% 3.63% 3.57% 3.79% BRYN MAWR TRUST | 5 | 1Q2019


