Exhibit 13
LETTERfrom theCHAIRMAN
The CHALLENGESof 2004 —Our SUCCESSESand Our DISAPPOINTMENTS
Let’s start with our successes.
| | • | | Our new branch in Newtown Square, Pennsylvania, which opened in January 2004, far exceeded expectations and finished the year with over $21 million of deposits. Credit goes to our manager, Barb Newcomer, and her caring staff. |
| | • | | Our eighth full-service office is scheduled to open in March 2005 in Exton, Pennsylvania. We have an excellent site at the corner of Route 100 and Swedesford Road, which affords us superb visibility, access and egress, all of which are crucial for a successful branch office. |
| | • | | We are close to finalizing a re-location of our Wynnewood office to a nearby, but far superior, site. This new location should enable us to grow that office at a much faster pace. |
| | • | | In 2004, the Bank had a strong increase in loans (+12%) deposits (+14%), and total Corporation assets (+13%). This was a result of an active sales culture as well as a client retention rate far above industry averages. |
| | • | | Our Wealth Management Division had another solid year with revenues up 6% and profitability up 9%. This follows 2003 where the figures were 11% and 21% respectively. In addition, we were able to recruit John Pickering to head up this area. Before joining Bryn Mawr Trust, John had been a top executive with the prestigious private bank, Brown Brothers Harriman. |
| | • | | Our new Small Business Package was well received in the marketplace, with checking accounts and loans for this important constituency increasing sharply. Our low-cost, and in many cases free, package including a checking account, a line of credit, a credit card, a debit card, and computer banking, is the best offering of any bank in the entire Philadelphia area. |
| | • | | Our stock price held up relatively well during 2004 despite our earnings results. Over the past four years we have seen the Corporation’s stock rise from $10.56 per share (adjusted for stock-splits) to $21.99 at year-end 2004, an appreciation of 108%. |
Now, for the disappointments.
Our net income and earnings per share were below our normal levels of profitability. The confluence of three factors caused this to happen.
First, the low level of short-term interest rates throughout the year greatly impacted our net interest income. We began to get some relief towards the end of the year as the Federal Reserve started to increase interest rates. We should see the full benefit, however, in 2005.
Second, the residential refinancing boom ended and our mortgage division processed far fewer loans for resale into the secondary marketplace. If you look at the line “gain on sale of loans” on our income statement, you will see the large variance over the prior year.
PAGE 2
BRYN MAWR BANK CORPORATION

Third, provisions of the Sarbanes-Oxley legislation mandated certain actions by all public companies, including the Bank’s parent company, Bryn Mawr Bank Corporation. Our compliance costs for Sarbanes-Oxley alone were over $470,000 in actual cash and over 8,000 hours of our staff’s time. Fortunately, the burden of complying with this legislation going forward will be less onerous.
While some banks might have been satisfied with our results, we certainly were not. I anticipate a sharp improvement in our financial performance in 2005 as short-term interest rates rise, as our Wealth Management Division maintains its growth pattern, and as we continue our close control on overhead expenses.
As always, I would like to thank the Corporation’s Directors for their dedication and hard work. With the recent changes in corporate governance and regulatory oversight, their participation and contributions are more important than ever.
Thank you for your support and for being a shareholder of the Corporation.
Sincerely,
|
|
| /s/ TED PETERS |
| Ted Peters |
| Chairman and Chief Executive Officer |
PAGE 3
2004 CORPORATE HIGHLIGHTS
Consolidated FINANCIAL HIGHLIGHTS
(Dollars in thousands, except per share amounts)
| | | | | | | | | | | |
| | | 2004
| | | 2003
| | | Change
| |
FORTHEYEAR | | | | | | | | | | | |
Net interest income | | $ | 26,828 | | | $ | 24,931 | | | 8 | % |
Other income | | | 19,794 | | | | 26,577 | | | -26 | |
Other expenses | | | 31,625 | | | | 33,437 | | | -5 | |
Income from continuing operations | | | 9,345 | | | | 11,272 | | | -17 | |
Net income | | | 9,345 | | | | 9,356 | | | 0 | |
| | | |
ATYEAR-END | | | | | | | | | | | |
Total assets | | $ | 682,946 | | | $ | 604,848 | | | 13 | % |
Total net loans | | | 557,670 | | | | 495,746 | | | 12 | |
Total deposits | | | 600,965 | | | | 527,139 | | | 14 | |
Shareholders’ equity | | | 71,238 | | | | 67,382 | | | 6 | |
| | | |
PERCOMMONSHARE | | | | | | | | | | | |
Basic earnings per common share from continuing operation | | $ | 1.09 | | | $ | 1.30 | | | -16 | % |
Diluted earnings per common share from continuing operation | | | 1.06 | | | | 1.28 | | | -17 | |
Basic earnings per common share | | | 1.09 | | | | 1.08 | | | 1 | |
Diluted earnings per common share | | | 1.06 | | | | 1.06 | | | 0 | |
Dividends declared | | | .40 | | | | .40 | | | 0 | |
Book value | | | 8.29 | | | | 7.77 | | | 7 | |
Closing price | | | 21.99 | | | | 24.10 | | | -9 | |
| | | |
SELECTEDRATIOS* | | | | | | | | | | | |
Return on average assets | | | 1.45 | % | | | 1.98 | % | | | |
Return on average shareholders’ equity | | | 13.67 | | | | 17.76 | | | | |
| * | Selected ratios are based on income from continuing operations. |
Significant CORPORATE HIGHLIGHTS
| | • | | Expanding our footprint |
| | • | | Special focus on small business initiative |
| | • | | Strong growth in loans and deposits |
| | • | | New residential mortgage strategies |
| | • | | Media recognition of expertise of BMT wealth professionals |
PAGE 4
BRYN MAWR BANK CORPORATION
| | | | | | |
SHAREHOLDERS’
EQUITY (Dollars in millions) | | EARNINGS PER
COMMON SHAREFROM CONTINUING OPERATIONS (Dollars) | | COMMON STOCK
MARKET VALUE (Dollars per share) | | COMMON STOCK
BOOK VALUE (Dollars per share) |
| | | |
 | |  | |  | |  |
| | | |
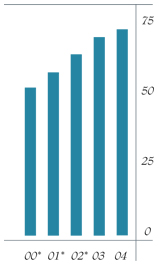
TOTAL ASSETS (Dollars in millions) | | TOTAL NET LOANS (Dollars in millions) | | TOTAL DEPOSITS (Dollars in millions) | | NET INCOMEFROM CONTINUING OPERATIONS (Dollars in millions) |
| | | |
 | | 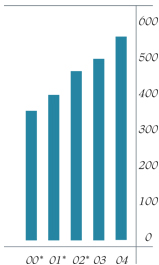 | |  | |  |
| * | Reclassified for comparative purposes |
PAGE 5
THE YEARinREVIEW 2004
EXPANDINGOur FOOTPRINT
During 2004, we focused on expanding and upgrading our branch office network and already we are seeing positive results.
As the year 2004 began, we were in the final construction phase of the handsome edifice that now serves as our Newtown Square office. As 2004 drew to a close, the finishing touches to the major renovation project were being accomplished at our newest facility in Exton.
The opening of our Newtown Square office was extremely successful on all counts. First year business volume has far exceeded expectations. This is a testament to the continued importance of convenient neighborhood banking and to the dedication and diligence of the branch office staff. The award-winning building itself has been hailed as a definite enhancement to the Newtown Square business area. The commissioning of the painting “Newtown Square Station” by local artist Nick Santoleri heightened for the local residents their appreciation of their heritage and drew attention from the public at large to the historical significance of this area.
The acquisition of an office site in Exton and its complete renovation is also becoming an exciting project. A rather pedestrian functional building has been transformed into a striking landmark similar in style to the Newtown Square building. The office is expected to open for business in March and grand opening festivities will be scheduled throughout the spring.
As in Newtown Square, groundwork is already underway to weave Bryn Mawr Trust into the entire fabric of the community: the large corporate presence, the ever-expanding small business community, and the rapidly expanding residential community. Our goal is to ensure the fiscal soundness of businesses, individuals and future generations. Negotiations are also in progress to acquire a better strategic location for the community now served by our office in Wynnewood.

PAGE 6
BRYN MAWR BANK CORPORATION
Our efforts have not been limited to enhancing our physical environment. Building for the future encompasses an element even more important than our physical plant.
Our OBSESSIONis
to PROVIDE
SUPERB PERSONAL
SERVICEto
ourCLIENTS
Strategies have been put in place to enable Bryn Mawr Trust to continue to be a high-performing financial institution.
Our intention is to continue to concentrate on our four core competencies — wealth management services, business banking, value-added retail banking and residential mortgage banking. Above all, we will maintain our commitment to high values, integrity, teamwork and respect for our clients, our fellow workers and the community at large.

Retail Banking Executive Vice President Robert J. Ricciardi and Exton Branch Manager Vice President Annette C. McNee check the progress of renovations at the Exton office site.
PAGE 7
THE YEARinREVIEW 2004
SMALL BUSINESS INITIATIVEGains MOMENTUM

Group Vice President Regina F. Kemery is dedicated to alerting the small business community to our excellent package of services tailor-made to meet their financial needs.
Our all-inclusive platform of services is extremely well received.
Our small business banking team, which includes all of our branch managers and is headed up by seasoned banking professional Regina Kemery, has initiated a massive calling effort to acquaint small businesses with our small business package — a platform of services first introduced in the spring of 2003. The team members have become intricately involved with the business community, actively participating in local business organizations and establishing themselves as the definitive resource for business financial information. Their efforts have been extremely successful.
To complement the services included in the small business package, and to enable our small business client to respond quickly to customer needs and effectively manage the bottom line, Bryn Mawr Trust recently introduced the Bryn Mawr Trust Productivity Card for Business.
At year-end 2004, Bryn Mawr Trust made arrangements to introduce a forum of educational programs on topics of interest to the small business owner. The first program, which was held in January of 2005, addressed the retirement planning issues that will impact financial support of senior business members in retirement. It also addressed financial support of the managing generation, as well as the successful operation of the business.
PAGE 8
BRYN MAWR BANK CORPORATION
CONSISTENT EFFORT PAYS OFF
The Bank enjoyed strong growth in total outstanding loans and a healthy increase in deposits.
Advances in business must be sustained by the solid dependable effort of dedicated staff members consistently providing the backbone upon which a strong financial footing is based. This is best exemplified by the untiring efforts of our commercial lenders, commercial real estate lenders and the consumer lending team. The fruits of their outreach and attention to the client have produced a healthy increase in loans as well as deposits and a firm roster of dedicated and loyal clients. We get to know our clients, their financial goals and pride ourselves on helping them attain these goals.
REACHING OUTto really
GET TO KNOW
ourCLIENTS
To reinforce the importance of focusing on the needs of the client, a company-wide referral program was instituted in 2001. Our staff seeks to cultivate expanded relationships with existing clients by learning as much as possible about each individual’s financial situation. A discussion of the many services that the bank has to offer is encouraged. In 2004, a total of 2,222 referrals were generated through this program.

Commercial Banking Group Vice President George M. Teplica serves on the planning committee for expanding our commercial business in the Newtown Square and Exton communities.
PAGE 9
THE YEARin REVIEW 2004
RESIDENTIAL MORTGAGE MARKET CHALLENGE

Recently appointed Bryn Mawr Trust Vice President Susan S. Shute, a real estate veteran, and BMT Mortgage President Myron H. Headen, a long-term Bryn Mawr Trust staff member.
New strategies, new dimensions and new faces are being brought into play.
In 2004, there were two major challenges facing our Residential Mortgage team. One was the unexpected departure of BMT Mortgage’s three senior officers. Even more dramatic was the collapse of the residential refinancing boom.
Myron Headen, an 18-year Bryn Mawr Trust veteran, was appointed President of BMT Mortgage Company. Assisted by senior staff members, he has expertly led the residential mortgage lending team throughout this troubled time. Our advertising effort in this area has been greatly beefed up, and a 30-year real estate industry veteran has come on board.
We’reKNOWNfor our
SOLID EXPERIENCE
and SUPERIOR
SERVICE
An innovative new strategy for attracting new mortgage business is in the process of being implemented. Negotiations were started for the formation of a new BMBC subsidiary, whereby BMT Mortgage would handle the mortgage financing needs of a major agency, Keller Williams Main Line Realty.
PAGE 10
BRYN MAWR BANK CORPORATION
WEALTH MANAGEMENTStrengthens LEADERSHIP
Technology is providing a firm foundation for future growth.
A key administrative enhancement in 2004 was the implementation of a new Wealth Management accounting system. The conversion to the new system was a major effort for the entire Wealth Management Division and Trust Operations staff. Clients now reap the benefit of an easy-to-understand statement and a secure on-line internet system that allows access to real-time account information. Also, they now have the ability to monitor unrealized gains and losses on-line.
In recognition of the importance of wealth management and trust services as a key ingredient for sustained business growth, John Pickering was chosen to head up the Wealth Management Division. Mr. Pickering comes to Bryn Mawr Trust after a long and successful tenure at Brown Brothers Harriman in Philadelphia, Pa.
In August of 2004, Karen A. Fahrner, Esquire joined the Wealth Management Division as Senior Vice President and head of Trust Administration. She has over 30 years experience in the trust and estate field. She was a partner at the law firm, Pelino & Lentz, P.C. in Philadelphia. A member of the Pennsylvania and Florida Bars, she is the author of a highly regarded treatise on Pennsylvania trust and estate law.
During 2004, the Employee Benefit Department of the Wealth Management Division was renamed the “Retirement

Executive Vice President John Pickering has overseen Wealth Management’s continued growth and increased revenue.
PAGE 11
THE YEARin REVIEW 2004
A TRUSTED SOURCEof FINANCIAL INFORMATION

Senior Vice President Karen A. Fahrner brings 30 years of experience in the trust and estate field to her position as head of Trust Administration.
Services Department” to more accurately reflect the services this group offers to clients. Bryn Mawr Trust’s Retirement Services Department offers a complete range of services for group retirement plans. The Retirement Services Department is also responsible for Bryn Mawr Bank Corporation’s Thrift & Savings Plan, Defined Benefit Pension Plan, Deferred Bonus Plan for executives, and the Deferred Payment Plan for directors.
Our CLIENTS
EXPECTthe most
DISCERNING ADVICE &
GUIDANCE.
And THEY GET IT.
The Wealth Management Division continued its series of informational and educational programs for the legal community, CPAs, clients and the public at large. One of the most well received programs was held in October 2004 on the subject of Managing an Inheritance. Two distinguished guest speakers offered their perspectives on the financial and emotional issues involved with the inter-generational transfer of wealth.
PAGE 12
BRYN MAWR BANK CORPORATION
MAKING NATIONAL NEWS
Our Portfolio Managers and Wealth Consultants have become a much-sought-after source for their financial commentary, perspective and expert advice.
On April 15, 2004, Bryn Mawr Bank Corporation celebrated its 20th consecutive year on the NASDAQ Exchange, and 115 years of Bryn Mawr Trust’s dedication and service to the Philadelphia region with Ted Peters presiding over the NASDAQ opening bell ceremonies. The Bryn Mawr Trust Company, which opened for business in 1889, was accepted as a member of the NASDAQ National Market in 1985. Effective January 2, 1987, Bryn Mawr Bank Corporation was formed as a bank holding company with The Bryn Mawr Trust Company as a wholly owned subsidiary. CNN, CNBC, CNNfn, Fox News, CNN Headline News and BLOOMBERG USA, among others, aired the opening ceremonies.
REGULARLY
FEATURED
on TELEVISION, RADIO
& FINANCIALMEDIA

Bryn Mawr Bank Corporation dominates Times Square during NASDAQ Opening Ceremony. Bryn Mawr Trust’s portfolio managers and wealth consultants have become nationally recognized for their expertise and valued opinions.
PAGE 13
THE YEARinREVIEW 2004
CORPORATE INFORMATION
CORPORATE HEADQUARTERS
801 Lancaster Avenue
Bryn Mawr, Pennsylvania 19010-3396
610-525-1700
www.bmtc.com
DIRECTORS
Warren W. Deakins
Self-employed, Insurance Sales
Andrea F. Gilbert
President, Bryn Mawr Hospital
William Harral, III
Chairman, C&D Technologies, Inc.; President, the Barra Foundation
Wendell F. Holland
Chairman, Pennsylvania Public Utilities Commission
Francis J. Leto
Partner, Celli and Leto, LLP, Attorneys at Law; President, The Brandywine Abstract Companies
Frederick C.“Ted” Peters II
Chairman, President and Chief Executive Officer, Bryn Mawr Bank Corporation and The Bryn Mawr Trust Company
James J. Smart
Managing Partner, Smart and Associates, LLP, a certified public accounting firm
B. Loyall Taylor, Jr.
President, Taylor Gifts, Inc.
Nancy J. Vickers
President, Bryn Mawr College
Thomas A. Williams
Retired, formerly Vice President, Secretary/Treasurer, Houghton International, Inc.
MARKET MAKERS
Boenning & Scattergood
Citigroup Global Markets
FTN Midwest Securities Corp.
Goldman, Sachs & Co.
Hill, Thompson, Magid & Coe
Janney Montgomery LLC
Keefe, Bruyette & Woods Inc.
Knight Equity Markets, L.P.
McConnell Budd & Downes
Merrill Lynch, Pierce Fenner & Smith
Moors & Cabot, Inc.
Morgan Stanley & Co., Inc.
Ryan Beck & Co., Inc.
Susquehanna Capital Group
UBS Capital Markets L.P.
PRINCIPAL SUBSIDIARY
The Bryn Mawr Trust Company
A Subsidiary of Bryn Mawr Bank Corporation
EXECUTIVE MANAGEMENT
Frederick C. “Ted” Peters II*
Chairman, President and Chief Executive Officer
Alison E. Gers
Executive Vice President, Support Division, Administration and Operations
Joseph G. Keefer
Executive Vice President, Credit Division, and Chief Lending Officer
John Pickering
Executive Vice President, Wealth Management Division
Joseph W. Rebl*
Executive Vice President, Finance Division, Corporate Treasurer, and Chief Financial Officer
Robert J. Ricciardi*
Executive Vice President, Retail Banking, Chief Credit Policy Officer and Corporate Secretary
| * | Also officer of the Corporation |
BRANCH OFFICES
801 Lancaster Avenue
Bryn Mawr, Pennsylvania 19010
237 North Pottstown Pike
Exton, Pennsylvania 19341
18 West Eagle Road
Havertown, Pennsylvania 19083
3601 West Chester Pike
Newtown Square, PA 19073
39 West Lancaster Avenue
Paoli, Pennsylvania 19301
330 East Lancaster Avenue
Wayne, Pennsylvania 19087
One Tower Bridge
West Conshohocken,
Pennsylvania 19428
312 East Lancaster Avenue
Wynnewood, Pennsylvania 19096
WEALTH MANAGEMENT DIVISION
10 South Bryn Mawr Avenue
Bryn Mawr, Pennsylvania 19010
LIMITED SERVICE OFFICES
Beaumont at Bryn Mawr Retirement Community
Bryn Mawr, Pennsylvania
Bellingham Retirement Living
West Chester, Pennsylvania
Martins Run Life Care Community
Media, Pennsylvania
Rosemont Presbyterian Village
Rosemont, Pennsylvania
The Quadrangle
Haverford, Pennsylvania
Waverly Heights
Gladwyne, Pennsylvania
White Horse Village
Newtown Square, Pennsylvania
OTHER SUBSIDIARIES AND FINANCIAL SERVICES
BMT Mortgage Company
A Division of The Bryn Mawr Trust Company
Bryn Mawr, Pennsylvania
Myron H. Headon, President
BMT Settlement Services, Inc.
A Subsidiary of The Bryn Mawr Trust Company
Bryn Mawr, Pennsylvania
Joseph G. Keefer, Chairman
Myron H. Headon, President
Insurance Counsellors of Bryn Mawr, Inc.
A Subsidiary of The Bryn Mawr Trust Company
Bryn Mawr, Pennsylvania
Thomas F. Drennan, President
PAGE 14
BRYN MAWR BANK CORPORATION
ANNUAL MEETING
The Annual Meeting of Shareholders of Bryn Mawr Bank Corporation will be held in The Gregg Conference Center at The American College, Bryn Mawr, Pennsylvania, on Tuesday, April 19, 2005, at 2:00 p.m.
AUDITORS
KPMG LLP
1601 Market Street
Philadelphia, Pennsylvania 19103-2499
LEGAL COUNSEL
Monteverde, McAlee & Hurd, P.C.
One Penn Center at Suburban Station
1617 John F. Kennedy Boulevard
Suite 1500
Philadelphia, Pennsylvania 19103-1815
STOCK LISTING
Bryn Mawr Bank Corporation common stock is traded over-the-counter and is listed on the NASDAQ National Market System under the symbol BMTC.
FORM 10-K
A copy of the Corporation’s Form 10-K, including financial statement schedules as filed with the Securities and Exchange Commission, is available without charge to shareholders upon written request to Robert J. Ricciardi, Secretary, Bryn Mawr Bank Corporation, 801 Lancaster Avenue, Bryn Mawr, Pennsylvania 19010-3396, or via e-mail to bricciardi@bmtc.com.
EQUAL EMPLOYMENT OPPORTUNITY
The Corporation continues its commitment to equal opportunity employment and does not discriminate against minorities or women with respect to recruitment, hiring, training, or promotion. It is the policy of the Corporation to comply voluntarily with the practices of Affirmative Action.
REGISTRAR& TRANSFER AGENT
Mellon Investor Services L.L.C.
P.O. Box 3315
South Hackensack, NJ 07606
www. mellon-investor.com
PRICE RANGEof SHARES
| | | | | | | | | |
| | | High
Bid
| | Low
Bid
| | Dividend
Declared
|
2004 HIGH-LOW QUOTATIONS | | | | | | | | | |
First quarter | | $ | 24.26 | | $ | 21.50 | | $ | 0.10 |
Second quarter | | | 23.73 | | | 19.30 | | | 0.10 |
Third quarter | | | 22.82 | | | 19.67 | | | 0.10 |
Fourth quarter | | | 22.55 | | | 19.10 | | | 0.10 |
2003 HIGH-LOW QUOTATIONS | | | | | | | | | |
First quarter | | $ | 19.19 | | $ | 17.08 | | $ | 0.10 |
Second quarter | | | 20.50 | | | 17.39 | | | 0.10 |
Third quarter | | | 21.81 | | | 18.50 | | | 0.10 |
Fourth quarter | | | 25.07 | | | 20.00 | | | 0.10 |
The approximate number of registered holders of record of common stock as of December 31, 2004 was 370.
The shares are traded on the over-the-counter market, and the price information was obtained from The National Association of Securities Dealers (NASD).
PAGE 15

Selected Financial Data
| | | | | | | | | | | | | | | | | | | | |
| | | (in thousands, except for share and per share data) | |
| For the years ended December 31, | | 2004
| | | 2003*
| | | 2002*
| | | 2001*
| | | 2000*
| |
Interest income | | $ | 31,381 | | | $ | 29,261 | | | $ | 29,412 | | | $ | 30,311 | | | $ | 31,985 | |
Interest expense | | | 4,553 | | | | 4,330 | | | | 4,484 | | | | 6,302 | | | | 7,072 | |
| | |
|
|
| |
|
|
| |
|
|
| |
|
|
| |
|
|
|
Net interest income | | | 26,828 | | | | 24,931 | | | | 24,928 | | | | 24,009 | | | | 24,913 | |
Loan loss provision | | | 900 | | | | 750 | | | | 1,000 | | | | 1,200 | | | | 250 | |
| | |
|
|
| |
|
|
| |
|
|
| |
|
|
| |
|
|
|
Net interest income after loan loss provision | | | 25,928 | | | | 24,181 | | | | 23,928 | | | | 22,809 | | | | 24,663 | |
Other income | | | 19,794 | | | | 26,577 | | | | 23,899 | | | | 18,846 | | | | 15,322 | |
Other expenses | | | 31,625 | | | | 33,437 | | | | 31,642 | | | | 28,199 | | | | 27,854 | |
| | |
|
|
| |
|
|
| |
|
|
| |
|
|
| |
|
|
|
Income before income taxes and discontinued operations | | | 14,097 | | | | 17,321 | | | | 16,185 | | | | 13,456 | | | | 12,131 | |
Applicable income taxes | | | 4,752 | | | | 6,049 | | | | 5,543 | | | | 4,524 | | | | 4,137 | |
| | |
|
|
| |
|
|
| |
|
|
| |
|
|
| |
|
|
|
Income from continuing operations | | | 9,345 | | | | 11,272 | | | | 10,642 | | | | 8,932 | | | | 7,994 | |
(Loss) income from discontinued operations | | | — | | | | (1,916 | ) | | | (435 | ) | | | 194 | | | | 267 | |
| | |
|
|
| |
|
|
| |
|
|
| |
|
|
| |
|
|
|
Net Income | | $ | 9,345 | | | $ | 9,356 | | | $ | 10,207 | | | $ | 9,126 | | | $ | 8,261 | |
| | |
|
|
| |
|
|
| |
|
|
| |
|
|
| |
|
|
|
Per share data | | | | | | | | | | | | | | | | | | | | |
Earnings per common share from continuing operations: | | | | | | | | | | | | | | | | | | | | |
Basic | | $ | 1.09 | | | $ | 1.30 | | | $ | 1.22 | | | $ | 1.03 | | | $ | 0.93 | |
Diluted | | $ | 1.06 | | | $ | 1.28 | | | $ | 1.20 | | | $ | 1.00 | | | $ | 0.90 | |
Earnings per common share | | | | | | | | | | | | | | | | | | | | |
Basic | | $ | 1.09 | | | $ | 1.08 | | | $ | 1.17 | | | $ | 1.05 | | | $ | 0.96 | |
Diluted | | $ | 1.06 | | | $ | 1.06 | | | $ | 1.15 | | | $ | 1.02 | | | $ | 0.93 | |
Dividends declared | | $ | 0.40 | | | $ | 0.40 | | | $ | 0.38 | | | $ | 0.36 | | | $ | 0.34 | |
Weighted-average shares outstanding | | | 8,610,171 | | | | 8,657,527 | | | | 8,706,390 | | | | 8,651,040 | | | | 8,585,676 | |
Dilutive potential common shares | | | 170,545 | | | | 158,543 | | | | 130,020 | | | | 254,180 | | | | 322,816 | |
| | |
|
|
| |
|
|
| |
|
|
| |
|
|
| |
|
|
|
Adjusted weighted-average shares | | | 8,780,716 | | | | 8,816,070 | | | | 8,836,410 | | | | 8,905,220 | | | | 8,908,492 | |
| |
| | | (in thousands) | |
| At December 31, | | 2004
| | | 2003
| | | 2002*
| | | 2001*
| | | 2000*
| |
Total assets | | $ | 682,946 | | | $ | 604,848 | | | $ | 577,242 | | | $ | 476,823 | | | $ | 444,424 | |
Earning assets | | | 628,754 | | | | 547,637 | | | | 520,562 | | | | 427,805 | | | | 389,053 | |
Deposits | | | 600,965 | | | | 527,139 | | | | 483,620 | | | | 391,059 | | | | 386,966 | |
Shareholders’ equity | | | 71,238 | | | | 67,382 | | | | 62,607 | | | | 57,307 | | | | 50,970 | |
Ratio of equity to assets | | | 10.43 | % | | | 11.14 | % | | | 10.85 | % | | | 12.02 | % | | | 11.47 | % |
Loans serviced for others | | | 507,421 | | | | 797,326 | | | | 631,105 | | | | 442,373 | | | | 325,040 | |
| | | | | |
| For the years ended December 31, | | 2004
| | | 2003
| | | 2002*
| | | 2001*
| | | 2000*
| |
Selected financial ratios: | | | | | | | | | | | | | | | | | | | | |
Net interest margin | | | 4.46 | % | | | 4.70 | % | | | 5.34 | % | | | 5.85 | % | | | 6.33 | % |
Income from continuing operations to: | | | | | | | | | | | | | | | | | | | | |
Average total assets | | | 1.45 | % | | | 1.98 | % | | | 2.01 | % | | | 2.05 | % | | | 1.94 | % |
Average shareholders’ equity | | | 13.67 | % | | | 17.76 | % | | | 17.26 | % | | | 16.95 | % | | | 17.20 | % |
Average shareholders’ equity to average total assets | | | 10.64 | % | | | 11.13 | % | | | 11.67 | % | | | 12.09 | % | | | 11.28 | % |
Dividends declared per share to net income per basic common share | | | 36.85 | % | | | 37.01 | % | | | 32.41 | % | | | 34.13 | % | | | 35.34 | % |
| * | Reclassified for comparative purposes |
1
Management’s Discussion and Analysis
The following is a discussion of the consolidated results of operations of Bryn Mawr Bank Corporation and its subsidiaries (the “Corporation”) for each of the three years ended December 31, 2004, as well as the financial condition of the Corporation as of December 31, 2004 and 2003. The Bryn Mawr Trust Company (the “Bank”), and Joseph W. Roskos & Co. (“JWR & Co.”) are wholly-owned subsidiaries of the Corporation. Insurance Counsellors of Bryn Mawr, Inc. (“ICBM”) and BMT Settlement Services, Inc. (“BMTSS”) are wholly owned subsidiaries of the Bank. This discussion should be read in conjunction with the Corporation’s consolidated financial statements beginning on page 26.
SPECIAL CAUTIONARY NOTICE REGARDING FORWARD LOOKING STATEMENTS
Certain of the statements contained in this Report may constitute forward-looking statements for the purposes of the Securities Act of 1933, as amended and the Securities Exchange Act of 1934, as amended, and may involve known and unknown risks, uncertainties and other factors which may cause actual results, performance or achievements of the Corporation to be materially different from future results, performance or achievements expressed or implied by such forward-looking statements. These forward-looking statements include statements with respect to the Corporation’s financial goals, business plans, business prospects, credit quality, credit risk, reserve adequacy, liquidity, origination and sale of residential mortgage loans, impairment of goodwill, the effect of changes in accounting standards, and market and pricing trends. The words “expect,” “anticipate,” “intended,” “plan,” “believe,” “seek,” “estimate,” and similar expressions are intended to identify such forward-looking statements. The Corporation’s actual results may differ materially from the results anticipated by the forward-looking statements due to a variety of factors, including without limitation:
| | • | | the effect of future economic conditions on the Corporation and its customers, including economic factors which affect consumer confidence in the securities markets, wealth creation, investment and savings patterns, and the Corporation’s interest rate risk exposure and credit risk; |
| | • | | changes in the securities markets with respect to the market values of financial assets and the stability of particular securities markets; |
| | • | | governmental monetary and fiscal policies, as well as legislation and regulatory changes; |
| | • | | changes in accounting requirements or interpretations; |
| | • | | the risks of changes in interest rates on the level and composition of deposits, loan demand, and the value of loan collateral and securities, as well as interest rate risk; |
| | • | | the effects of competition from other commercial banks, thrifts, mortgage companies, consumer finance companies, credit unions, securities brokerage firms, insurance companies, money-market and mutual funds and other institutions operating in the Corporation’s trade market area and elsewhere including institutions operating locally, regionally, nationally and internationally and such competitors offering banking products and services by mail, telephone, computer and the Internet; |
| | • | | any extraordinary events (such as the September 11, 2001 events, the war on terrorism and the U.S. Government’s response to those events, including the war in Iraq); |
| | • | | the Corporation’s success in continuing to generate new business in its existing markets, as well as its success in identifying and penetrating targeted markets and generating a profit in those markets in a reasonable time; |
| | • | | the Corporation’s ability to continue to generate satisfactory investment results for customers and the ability to continue to develop investment products in a manner that meets customers needs; |
| | • | | the Corporation’s timely development of competitive new products and services in a changing environment and the acceptance of such products and services by customers; |
| | • | | the Corporation’s ability to originate and sell residential mortgage loans; |
| | • | | the accuracy of assumptions underlying the establishment of reserves for loan losses and estimates in the value of collateral, and various financial assets and liabilities and technological changes being more difficult or expensive than anticipated; and |
| | • | | the Corporation’s success in managing the risks involved in the foregoing. |
All written or oral forward-looking statements attributed to the Corporation are expressly qualified in their entirety by the foregoing cautionary statements. All forward-looking statements included in this Report are based upon information presently available, and the Corporation assumes no obligation to update any forward-looking statements.
2
Introduction
The Corporation derives the vast majority of its income from its primary subsidiary, the Bank. The Bank is a state chartered member bank of the Federal Reserve System and was chartered in 1889. Located in an affluent western suburb of Philadelphia, Pennsylvania, the Bank provides commercial banking, trust and fiduciary services to its customer base. In 1986, the Corporation was formed and on January 2, 1987, the Bank became a wholly-owned subsidiary of the Corporation. The Corporation’s profitability is primarily derived from a number of segments or lines of business within the Bank. The traditional Banking segment includes the generation of net interest income from the gathering of deposits and funding of commercial, real estate and consumer loans, and the ability to purchase and sell investment securities. Due primarily to the structure of its deposit base, providing a source of low cost funding, the Bank was able to maintain a net interest margin of 4.46% for 2004.
In addition to its traditional banking activities of deposit gathering and lending, the Bank’s Wealth Management segment provides a stream of revenue, primarily related to its ability to grow its assets under management, which amounted to $1,887,000,000 as of December 31, 2004. In addition to the assets stated above the Bank acts as an investment advisor for $51,000,000 of assets for Community Banks located in Harrisburg, Pennsylvania.
Executive Summary
In prior years, the Bank’s Mortgage Banking segment had grown significantly. This growth was due to the increased demand for mortgage loans and the Mortgage Banking segment’s ability to meet the demands of its customers to originate and to then sell those mortgages to the secondary residential mortgage market. This demand slowed sharply beginning in the third quarter 2003 through December 31, 2004. While the Mortgage Banking segment had expanded its volume of residential loan originations and sales in prior years, recent volume decreases indicate that the demand for mortgage loans is likely to remain at a reduced level causing a reduction in the Bank’s mortgage loan originations and sales compared to the years prior to 2003. This decrease in residential mortgage loan origination and sale activity was primarily responsible for the Corporation’s lack luster 2004 income from continuing operations, which was 17% below 2003.
In addition to these three business segments, the Bank presently offers through ICBM insurance products which include commercial, personal lines, life and benefits insurance products.
Both the Corporation’s and Bank’s capital levels remain above those capital levels necessary to be considered “Well Capitalized” by their respective regulators. “Well Capitalized” is the highest rating available from the regulators. The Corporation’s annualized return on equity was 13.67% and its annualized return on assets was 1.45% as of December 31, 2004. The Uniform Bank Performance Report Peer Group Data as of September 30, 2004, the most recent data available, for banks with assets between $300 million and $1 billion had an annualized return on equity of 13.32% and an annualized return on assets of 1.21%.
The $3,224,000 decrease in income before income taxes and discontinued operations for 2004, over the same period in 2003, is primarily due to the decrease in residential mortgage originations and sales, as well as expenses associated with the implementation of the requirements of section 404 of the Sarbanes Oxley Act of 2002 (“SOX-404”). The gains on the sale of residential mortgage loans declined $7,751,000 and the related title insurance income from BMTSS declined $342,000. Partially offsetting the decline in income, due to the reduction in mortgage loan sale activity, was a decrease of $1,975,000 in the amortization of mortgage servicing rights (“MSRs”). During the first quarter of 2004, the Bank sold MSRs, generating a net gain, after the accelerated amortization of the sold MSRs, of $1,145,000. No such sales or gains were reported for 2003. In order to become compliant with SOX-404, the Corporation incurred an expense of $470,000 for consulting and accounting fees for 2004. No such fee expense was incurred in 2003. It is anticipated that fees for SOX-404 related activity will be less in 2005 and thereafter.
Also partially offsetting the decline in gains on mortgage loan sales was an increase in net interest income of $1,897,000 for 2004 compared to 2003 due primarily to strong growth in the Bank’s earning assets. The Bank’s balance sheet is asset interest rate sensitive, meaning that an increase in interest rates should cause an increase in the net interest margin and related net interest income. Recent prime rate increases have, and should continue to have, a positive effect on net interest income. The fees for trust services also increased in 2004 compared to 2003, up by $603,000 or 6%. In addition to the reduction in amortization of MSRs, discussed previously, the Corporation’s other operating expenses decreased by $947,000 or 20%. The decrease in residential loan sale activity is directly responsible for a $1,202,000 or 59% decrease in other operating expenses in the Mortgage Banking segment. There was an increase in the provision for loan loss of $150,000, due to an increase in net charge-offs in the second half of 2004. These net changes, from 2003 to 2004, account for $2,983,000 in year-to-year changes in income before income taxes and discontinued operations, compared to the net change reported of $3,224,000.
Critical Accounting Policies
The Corporation’s most critical accounting policy is the allowance for loan loss. The allowance for loan loss represents management’s estimate of the loan losses that may occur. The allowance is continually monitored to determine its adequacy. Ongoing review of credit standards, the level of delinquencies on loan products and loan segments, and the current state of the economy are included in this review. Actual losses may differ from management’s estimates. This is explained in more detail on pages 11 - 12.
3
In December 2001, the Corporation adopted Statement of Financial Accounting Standard No. 142 “Goodwill and Other Intangible Assets” (“SFAS No. 142”). In compliance with SFAS No. 142, the Corporation ceased amortizing the goodwill related to JWR & Co. During 2003, Corporation management determined that JWR & Co. was not attaining its strategic goals and that it would be in the best interest of the Corporation to discontinue offering family office services through JWR & Co. Therefore, the Corporation sold substantially all of the assets of JWR & Co. to Private Family Office, Inc. (“PFO”), which is owned by the former president of JWR & Co. (the “Asset Sale”). The Asset Sale was accomplished on August 1, 2003, effective as of June 30, 2003. The Asset Sale resulted in the charge-off of the balance of goodwill on the books of the Corporation, amounting to $1,005,000. As of December 31, 2003 and 2004, there was no goodwill on the books of the Corporation.
Since the assets which were sold in the Asset Sale met all the requirements of Statement of Financial Accounting Standard No. 144 “Accounting for the Impairment or Disposal of Long-Lived Assets” (“SFAS No. 144”), other revenue and expenses, the write-down of goodwill and other related disposal expenses have been classified as a loss from discontinued operations, net of taxes in the respective statements of income, to reflect the accounting for discontinued operations under SFAS No. 144. There are no longer any assets of JWR & Co. associated with the family office operation on the books of JWR & Co. at December 31, 2004 or 2003.
As a part of its Mortgage Banking segment’s loan servicing business, the Bank records the value of MSRs as an asset when the mortgage loans are sold and the servicing is retained by the Bank. MSRs represent the right to receive cash flows from servicing mortgage loans. The servicing rights are capitalized based on the fair value of the servicing right and the mortgage loan on the date the mortgage loan is sold. MSRs are amortized in proportion to and over the period of the estimated net servicing income. MSRs are carried at the lower of cost or estimated fair value. The Corporation obtains an independent appraisal of the fair value of its MSRs quarterly, which approximates the fair value expected in a sale between a willing buyer and seller.
MSRs are assessed quarterly for impairment based on the estimated fair value of those rights. For purposes of performing the impairment valuation, the MSR portfolio is stratified on the basis of certain predominant risk characteristics, including loan type and note rate. To the extent that the carrying value of the servicing rights exceeds estimated fair value for any stratum, a valuation allowance is established; this allowance may be adjusted in the future as the estimated fair value of the MSRs increase or decrease. This valuation allowance is included in the consolidated balance sheet and the valuation allowance is recognized in the consolidated statement of operation during the period in which the change occurs.
The following summarizes the Corporation’s activity related to MSRs for the twelve months ended December 31, 2004 and 2003:
| | | | | | | | |
| (In thousands) | | 2004
| | | 2003
| |
Balance, January 1 | | $ | 4,391 | | | $ | 3,956 | |
Additions | | | 1,019 | | | | 3,249 | |
Amortization | | | (839 | ) | | | (2,814 | ) |
Impairment | | | — | | | | — | |
Sales | | | (1,399 | ) | | | — | |
| | |
|
|
| |
|
|
|
Balance, December 31 | | $ | 3,172 | | | $ | 4,391 | |
| | |
|
|
| |
|
|
|
Fair Value | | $ | 4,132 | | | $ | 6,828 | |
There has been no impairment of the MSR portfolio or any change in the valuation allowance for MSRs for the twelve months ended December 31, 2004 or 2003.
At December 31, 2004, key economic assumptions and the sensitivity of the current fair value of MSRs to immediate 10 and 20 percent adverse changes in those assumptions are as follows:
| | | | |
| | | December 31,
2004
| |
Fair value amount of MSRs | | $ | 4,132 | |
Weighted average life (in years) | | | 3.7 | |
| |
Prepayment speeds (constant prepayment rate) (1): | | | 19.92 | % |
Impact on fair value: | | | | |
10% adverse change | | | (293 | ) |
20% adverse change | | | (558 | ) |
| |
Discount rate: | | | 10.05 | % |
Impact on fair value: | | | | |
10% adverse change | | | (128 | ) |
20% adverse change | | | (248 | ) |
| (1) | Represents the weighted average prepayment rate for the life of the MSR asset |
These assumptions and sensitivities are hypothetical and should be used with caution. As the figures indicate, changes in fair value based on a 10% variation in assumptions generally cannot be extrapolated because the relationship of the change in assumptions to the change in fair value may not be linear. Also, the effect of a variation in a particular assumption on the fair value of the MSRs is calculated without changing any other assumption. In realty, changes in one factor may result in changes in another, which could magnify or counteract the sensitivities.
New Accounting Pronouncements
During 2004, the Financial Accounting Standards Board issued one accounting standard applicable to banks, revised Financial Interpretation No. 46 (FIN 46R) and the Emerging Issues Task Force issued EITF 03-1. These pronouncements are discussed in detail in Note 2 to the Consolidated Financial Statements – Summary of Significant Accounting Policies, which are a part of this Report.
4
SIGNIFICANT ITEMSFOR 2004
Opening of New Full Service Branch Office in Newtown Square
During the first quarter of 2004, the Bank established a new full service branch office in Newtown Square, Pennsylvania, thereby enabling the Bank to both broaden and strengthen its footprint in Delaware County. By December 2004, the branch reported total deposits of $21 million.
Sale of Servicing for $245 million in Loans Serviced for Others
Effective March 31, 2004, the Bank sold MSRs associated with $245 million in mortgage loans serviced for others to EVERBANK, a federal savings bank located in Jacksonville FL. The transaction generated a net gain on the sale of $1,145,000. This gain on the sale of the MSRs helped to mitigate the negative impact on earnings caused by the decline in gains on the sale of residential mortgage loans in the Mortgage Banking segment, compared to gains in 2003 and 2002. The primary reason for the decline in gains on loan sales was a decrease in the amount of residential mortgage loan refinances sold to the secondary mortgage market in 2004, compared to 2003 and 2002.
Continuation of the Stock Repurchase Program
Corporation management continues to believe that the repurchase of the Corporation’s stock is a very beneficial use of Corporation capital. In October 2002, management was authorized to repurchase up to 4% of the outstanding shares as of October 2002 or 348,094 shares, effective January 2003, while not spending more than $7,500,000. Under that program, from January 2004 through December 2004, the Corporation repurchased 114,600 shares of Corporation stock, at a cost of $2,574,000, for an average cost of $22.46 per share. To date the shares repurchased under this program total 213,600 at a cost of $4,401,000. This stock repurchase program is authorized to extend for a five-year period, with annual reviews by the Corporation’s Board of Directors. The Corporation’s stock repurchasing activity, from 1997 through December 31, 2004, resulted in the repurchase of a total of 1,407,252 shares of the Corporation’s common stock, at a cost of $20,797,000 for an average purchase price of $14.78 per share. The use of the Corporation’s capital to repurchase stock increases the Corporation’s return on equity, as well as offsetting the dilutive effect on earnings per share of issuing stock options.
Compliance with Section 404 of the Sarbanes Oxley Act of 2002
As required by SOX-404, during 2004, the Corporation undertook a project to determine (1) what internal controls for public financial reporting were in place and (2) what additional internal controls needed to be implemented in order to gain assurance that the Corporation properly presents its financial statements and related footnotes, under generally accepted accounting principles of the United States (“GAAP”). To accomplish this task, the Corporation hired an independent consultant, experienced in complying with SOX-404, to assist management in completing the project and thereby enabling the chief executive officer and chief financial officer to certify whether or not there were any significant deficiencies or material weaknesses in the internal controls established to assure that the Corporation’s financial statements were prepared under GAAP.
KPMG LLP (“KPMG”), the Corporation’s Independent Registered Public Accounting Firm, has issued an attestation report that management’s assessment that the Corporation maintained effective internal control over financial reporting as of December 31, 2004 is fairly stated, in all material respects, based on criteria established in Internal Control—Integrated Framework issued by the Committee of Sponsoring Organizations of the Treadway Commission (“COSO”). Also in their opinion, KPMG stated that the Corporation maintained, in all material respects, effective internal control over financial reporting as of December 31, 2004, based on COSO.
DISCONTINUED OPERATIONS
As a result of Corporation management’s decision to accomplish the JWR & Co Asset Sale, the Corporation had long-lived assets meeting the criterion of SFAS No. 144 for being classified as available for sale on its balance sheet. Therefore, the revenues and expenses, the write-down of goodwill and other related disposal expenses have been classified as a loss from discontinued operations, net of taxes in the respective statements of income. Following is a table outlining (1) the amounts of revenue, expenses and after-tax losses reported in the results from discontinued operations and (2) the non-recurring transactions’ impact, that are a result of the Asset Sale:
| | | | | | | | | | | |
| | | For the twelve months ended
| |
| | | 2004
| | 2003
| | | 2002
| |
| | | (000) omitted | |
Revenues of JWR & Co.* | | $ | — | | $ | 773 | | | $ | 2,228 | |
Expenses of JWR & Co.* | | | — | | | (1,091 | ) | | | (2,207 | ) |
| | |
|
| |
|
|
| |
|
|
|
Pre-tax (loss) income | | | — | | | (318 | ) | | | 21 | |
Applicable income (tax) benefit | | | — | | | 108 | | | | (7 | ) |
| | |
|
| |
|
|
| |
|
|
|
(Loss) income | | | — | | | (210 | ) | | | 14 | |
Non-recurring transactions | | | | | | | | | | | |
Write-down of Goodwill | | | — | | | (1,005 | ) | | | (400 | ) |
Accounts receivable charge-off | | | — | | | (148 | ) | | | — | |
Other | | | — | | | (245 | ) | | | (74 | ) |
Income (tax ) benefit | | | — | | | (308 | )** | | | 25 | |
| | |
|
| |
|
|
| |
|
|
|
Total of non-recurring transactions | | | | | | (1,706 | ) | | | (449 | ) |
| | |
|
| |
|
|
| |
|
|
|
Loss from discontinued operations | | $ | — | | $ | (1,916 | ) | | $ | (435 | ) |
| | |
|
| |
|
|
| |
|
|
|
| * | Revenues and expenses of JWR & Co not specifically related to discontinued operations are excluded from the respective categories in this chart. |
| ** | Includes $444,000 of income tax expense on the sale of JWR & Co.’s assets. |
5
While there was no (loss) income from discontinued operations in 2004, the Corporation reported net income of $9,345,000 for the twelve months ended December 31, 2004, an $11,000 decrease from $9,356,000 reported for the same period in 2003 which was an $851,000 or an 8% decrease from $10,207,000 reported in 2002. Basic earnings per common share on net income amounted to $1.09, a 1% increase from $1.08 reported for 2003, which was an 8% decrease from $1.17 reported in 2002. Diluted earnings per common share on net income were even at $1.06 for both 2004 and 2003, which was an 8% decrease from $1.15 reported in 2002.
While there was no (loss) income from discontinued operations for 2004, for both basic or diluted earnings per share, the basic and diluted loss per common share from discontinued operations amounted to $.22 for year end 2003, compared to a loss of $.05 for the same period in 2002. The loss per common share from discontinued operations assuming dilution also amounted to $.22 for 2003, compared to a loss of $.05 in 2002.
SELECTIONOF NEW AUDITORS
On December 19, 2003 the Corporation retained KPMG LLP (“KPMG”) as its new independent registered public accounting firm to audit the financial statements for the fiscal year ended December 31, 2004. PricewaterhouseCoopers LLP (“PwC”) served as the independent registered public accounting firm for the fiscal year ended December 31, 2003. The decision to change independent registered public accounting firms was made by the Audit Committee of the Board of Directors of the Corporation.
During each of the fiscal years ended December 31, 2003 and 2002 and subsequent interim period through March 15, 2004, there were no disagreements between the Corporation and PwC on any matter of accounting principles or practices, financial statement disclosure, or auditing scope or procedure, which disagreements, if not resolved to the satisfaction of PwC would have caused it to make reference to the subject matter of the disagreements in connection with its reports; and there were no “reportable events” as that term is defined in Item 304 (a)(1)(v) of Regulation S-K occurring within the Corporation’s two most recent fiscal years and the subsequent interim period through March 15, 2004.
The reports of PwC on the financial statement for the past two years contained no adverse opinions or disclaimer of opinion and were not qualified or modified as to their uncertainty, audit scope or accounting principle.
The Corporation provided PwC and KPMG with a copy of the foregoing disclosures regarding the change of independent registered public accounting firms pursuant to Item 304 of the SEC’s Regulation S-K giving them the opportunity to provide a statement for inclusion herein, if either of them disagrees with the accuracy or completeness of these disclosures. After their review, neither PwC nor KPMG expressed any disagreement with these disclosures. A copy of PWC’s letter response to such request was attached to the Corporation’s 8-K/A filed with the SEC on March 15, 2004.
RESULTSOF CONTINUING OPERATIONS
Overview
The Corporation reported a 17% decrease in income from continuing operations for 2004 to $9,345,000 from $11,272,000 for 2003.
Basic earnings per common share from continuing operations amounted to $1.09 in 2004, a 16% decrease from $1.30 for 2003. Diluted earnings per common share from continuing operations decreased by 17% to $1.06 for 2004 from $1.28 for 2003. The dilutive potential common shares added to the weighted-average shares outstanding were 170,545, 158,543 and 130,020 for 2004, 2003 and 2002, respectively.
The decline in earnings for 2004 was primarily due to a decrease in the origination and subsequent sale of residential mortgage loans in the Mortgage Banking segment, causing a decline in the respective gains on the sale of residential mortgage loans in 2004. As presented on Table 1 – Line of Business Segment Analysis, the Mortgage Banking segment’s profitability declined 71% or $4,232,000 to $1,756,000 for 2004, compared to $5,988,000 for 2003. The primary reason for this decline was a $7,751,000 decrease in net gains on the sale of loans, a direct result of declines in the level of residential mortgage loan refinancing activity in 2004, compared to 2003 and 2002. This decline in net gains on loan sales was partially offset by a $3,177,000 decrease in other operating expenses, due primarily to a decline in the amortization of MSRs, as well as expenses related to the Mortgage Banking business segment. Partially offsetting the decline in the Mortgage Banking segment’s profitability was a 5% or $404,000 increase in the Banking segment’s profitability. Short term interest rates began rising in the second half of 2004, which was beneficial to the Bank’s net interest income in the final two quarters of 2004, compared to 2003. However, this increase in short term interest rates in 2004 was not sufficient to increase the Bank’s net interest margin ahead of 2003. The net interest margin decreased 24 basis points in 2004, compared to 2003. However, a 14% increase in average outstanding earning assets in 2004, compared to 2003, offset the decreased net interest margin and is primarily responsible for the Banking segment’s net interest income increasing 7% over 2003 levels. The Banking segment also reported net gains on the sale of mortgage servicing rights of $1,145,000. No such sales were reported for 2003 or 2002. Due to larger net charge-offs in the second half of 2004, the loan loss provision was increased by $150,000 to $900,000. The Banking segment also incurred expenses related to the requirements of SOX-404. Accounting and consulting expenses for SOX-404 amounted to $470,000 for 2004. No such expenses were incurred in 2003 or 2002.
6
A 6% increase in fees for investment management and trust services, combined with holding the wealth management expenses to 3% growth, are primarily responsible for a 12% increase in Wealth Management segment profits for 2004, compared to 2003.
Return on average assets (“ROA”) for the year was 1.45%, compared to 1.98% in 2003, while return on average equity (“ROE”) for 2004 was 13.67% compared to 17.76% in 2003.
EARNINGS PERFORMANCE
Lines of Business
The Corporation continues to have four significant business segments or lines from which it derives its earnings, one of which is the Banking line of business. Additional earnings streams are obtained from its Wealth Management line of business and its Mortgage Banking line of business - the origination, servicing and sale of mortgage loans to the secondary mortgage market. The fourth segment, included in “All Other” in the following segmentation analysis, derives net revenues from insurance services and products, offered through the Bank’s subsidiary, ICBM and interest income on notes in JWR & Co.
Following is a segmentation analysis of the results of operations for those lines of business for 2004 and 2003:
TABLE 1 - Line of Business Segment Analysis
| | | | | | | | | | | | | | | | | | | | |
| | | 2004
| |
| (dollars in thousands) | | Banking
| | | Wealth
Management
| | | Mortgage
Banking**
| | | All
Other*
| | | Consolidated
| |
Net interest income | | $ | 26,487 | | | $ | — | | | $ | 255 | | | $ | 86 | | | $ | 26,828 | |
Less loan loss provision | | | 900 | | | | — | | | | — | | | | — | | | | 900 | |
| | |
|
|
| |
|
|
| |
|
|
| |
|
|
| |
|
|
|
Net interest income after loan loss provision | | | 25,587 | | | | — | | | | 255 | | | | 86 | | | | 25,928 | |
Other income: | | | | | | | | | | | | | | | | | | | | |
Fees for investment management and trust services | | | — | | | | 10,087 | | | | — | | | | — | | | | 10,087 | |
Service charges on deposit accounts | | | 1,827 | | | | — | | | | — | | | | — | | | | 1,827 | |
Other fees and service charges | | | 209 | | | | — | | | | 1,670 | | | | — | | | | 1,879 | |
Net gain on sale of loans | | | 34 | | | | — | | | | 2,886 | | | | — | | | | 2,920 | |
Net gain on sale of mortgage servicing rights | | | 1,145 | | | | | | | | — | | | | | | | | 1,145 | |
Other operating income | | | 1,547 | | | | — | | | | 112 | | | | 667 | | | | 2,326 | |
| | |
|
|
| |
|
|
| |
|
|
| |
|
|
| |
|
|
|
Total other income | | | 4,762 | | | | 10,087 | | | | 4,668 | | | | 667 | | | | 20,184 | |
Other expenses: | | | | | | | | | | | | | | | | | | | | |
Salaries-regular | | | 8,789 | | | | 3,674 | | | | 904 | | | | 200 | | | | 13,567 | |
Salaries-other | | | 942 | | | | 322 | | | | 171 | | | | 11 | | | | 1,446 | |
Fringe benefits | | | 3,260 | | | | 820 | | | | 165 | | | | 52 | | | | 4,297 | |
Occupancy | | | 3,246 | | | | 572 | | | | 249 | | | | 131 | | | | 4,198 | |
Other operating expenses | | | 5,343 | | | | 1,046 | | | | 1,678 | | | | 440 | | | | 8,507 | |
| | |
|
|
| |
|
|
| |
|
|
| |
|
|
| |
|
|
|
Total other expenses | | | 21,580 | | | | 6,434 | | | | 3,167 | | | | 834 | | | | 32,015 | |
| | |
|
|
| |
|
|
| |
|
|
| |
|
|
| |
|
|
|
Segment profit (loss) | | $ | 8,769 | | | $ | 3,653 | | | $ | 1,756 | | | $ | (81 | ) | | $ | 14,097 | |
| | |
|
|
| |
|
|
| |
|
|
| |
|
|
| |
|
|
|
% of segment profit (loss) | | | 62 | % | | | 26 | % | | | 13 | % | | | (1 | )% | | | 100 | % |
| | | | | | | | | | | | | | | | | | | | |
| | | 2003***
| |
| (dollars in thousands) | | Banking
| | | Wealth
Management
| | | Mortgage
Banking**
| | | All
Other*
| | | Consolidated
| |
Net interest income | | $ | 24,707 | | | $ | — | | | $ | 160 | | | $ | 64 | | | $ | 24,931 | |
Loan loss provision | | | 750 | | | | — | | | | — | | | | — | | | | 750 | |
| | |
|
|
| |
|
|
| |
|
|
| |
|
|
| |
|
|
|
Net interest income after loan loss provision | | | 23,957 | | | | — | | | | 160 | | | | 64 | | | | 24,181 | |
Other income: | | | | | | | | | | | | | | | | | | | | |
Fees for investment management and trust services | | | — | | | | 9,484 | | | | — | | | | — | | | | 9,484 | |
Service charges on deposit accounts | | | 1,896 | | | | — | | | | — | | | | — | | | | 1,896 | |
Other fees and service charges | | | 199 | | | | — | | | | 2,221 | | | | — | | | | 2,420 | |
Net gain on sale of loans | | | 13 | | | | — | | | | 10,637 | | | | — | | | | 10,650 | |
Other operating income | | | 1,496 | | | | — | | | | 454 | | | | 637 | | | | 2,587 | |
| | |
|
|
| |
|
|
| |
|
|
| |
|
|
| |
|
|
|
Total other income | | | 3,604 | | | | 9,484 | | | | 13,312 | | | | 637 | | | | 27,037 | |
Other expenses: | | | | | | | | | | | | | | | | | | | | |
Salaries-regular | | | 8,274 | | | | 3,665 | | | | 1,343 | | | | 314 | | | | 13,596 | |
Salaries-other | | | 479 | | | | 113 | | | | 833 | | | | 13 | | | | 1,438 | |
Fringe benefits | | | 3,267 | | | | 839 | | | | 195 | | | | 52 | | | | 4,353 | |
Occupancy | | | 2,994 | | | | 617 | | | | 258 | | | | 216 | | | | 4,085 | |
Other operating expenses | | | 4,182 | | | | 1,002 | | | | 4,855 | | | | 386 | | | | 10,425 | |
| | |
|
|
| |
|
|
| |
|
|
| |
|
|
| |
|
|
|
Total other expenses | | | 19,196 | | | | 6,236 | | | | 7,484 | | | | 981 | | | | 33,897 | |
Segment profit (loss) | | $ | 8,365 | | | $ | 3,248 | | | $ | 5,988 | | | $ | (280 | ) | | $ | 17,321 | |
| | |
|
|
| |
|
|
| |
|
|
| |
|
|
| |
|
|
|
% of segment profit (loss) | | | 48 | % | | | 19 | % | | | 35 | % | | | (2 | )% | | | 100 | % |
| * | Bryn Mawr Bank Corporation, Insurance Counsellors of Bryn Mawr, Inc., and Joseph W. Roskos & Co. have all been aggregated in All Other. |
| ** | BMT Mortgage Company, a division of the Bank and BMT Settlement Services, Inc. have been aggregated in Mortgage Banking. |
| *** | Reclassified for comparative purposes. |
The table reflects operating profits or losses of each corporate line of business before income taxes and excluding inter-company interest income and expense, related to inter-company borrowings and excludes loss from discontinued operations.
The Banking segment’s percentage of operating profits stood at 62% for 2004, compared to 48% for 2003. The Wealth Management segment’s percentage of operating profit was 26%, up from 19% for 2003. The Mortgage Banking segment’s share of operating profits decreased from 35% in 2003 to 13% in 2004, while the “All Other” segment, including the Corporation and all non-banking subsidiaries, went from (2%) in 2003 to (1%) in 2004.
Banking Line of Business
The Bank’s average outstanding earning assets for 2004 of $587,150,000 increased 14% from $516,358,000 for 2003. Average outstanding loans also grew by 13% in 2004. The largest dollar increase in average outstanding loans occurred in the consumer line of credit loans, up $30,740,000 or 43% over 2003 average balances. Average commercial mortgage loan balances grew by $17,622,000 or 16%, compared to 2003 levels and, average construction loan balances increased $2,835,000 or 9% in 2004, compared to the same period in 2003. Due to some commercial loan prepayments in 2004, average commercial loan balances remained level with 2003, decreasing $698,000 or less than 1%, compared to similar average outstanding balances in 2003.
Reflecting the Bank’s strategy to hold some shorter term residential mortgage loans in its loan portfolio, the average
7
balance of residential mortgage loans increased $15,827,000 or 25% from 2003 average balances. The average outstanding balances of the Bank’s consumer small business loan product increased by $6,263,000 or 50% from 2003’s average outstanding balances. This growth is attributed to the superior package of small business services designed to provide small business customers with high quality, competitively-priced loan, deposit and investment services. The average balance of the consumer loan portfolio decreased by $13,031,000 or 62%. This reflects the planned run-off of the Bank’s indirect automobile dealer paper portfolio, as well as a decline in fixed rate home equity loan balances.
The average outstanding balances of federal funds sold increased by $2,414,000 or 23% in 2004 compared to 2003 levels. Average outstanding investments increased by $8,658,000 or 37% for 2004 compared to 2003.
Average outstanding total deposits increased $67,700,000 or 14% in 2004 compared to 2003. The largest dollar increase occurred in the Bank’s money market account average balances. The Bank increased its money market account interest rate structure, making the interest rates competitive with interest rates paid on off-balance sheet money market sweep accounts. This competitive rate structure offered by the Bank resulted in the movement of off-balance sheet sweep balances, as well as other money market mutual funds, into the Bank’s money market accounts. The money market account balances grew by $37,668,000 or 44% over 2003 average balances. Average outstanding NOW account balances increased by $21,130,000 or 17%, while average non-interest bearing demand deposit account balances increased by $2,001,000 or 2%. Average outstanding savings accounts increased 3% or $1,527,000, while the average balances of certificates of deposit (“CDs”) grew by $5,373,000 or 6%. As a result of the strong growth in the Bank’s average deposit base in 2004 the Bank was not reliant on short-term borrowings, having average outstanding balances of short-term borrowings and federal funds purchased of $850,000, compared to $496,000 for 2003. The increases in the average balances of lower costing money market accounts, NOW account and non-interest bearing demand deposit accounts are the primary reasons for the cost of funds decreasing 10 basis points. However, a continued low prime rate for much of 2004, partially offset by increases in earning assets, is primarily responsible for a decrease in the net interest margin to 4.46% in 2004 from 4.70% for 2003. An expanded discussion of the Bank’s net interest income follows in the section below entitled“Net Interest Income.”
Total other income from the Banking segment increased by 32% in 2004 compared to 2003. The Bank sold MSRs associated with the servicing of $245 million of residential mortgage loans serviced for others. This sale generated a net gain on the sale of $1,145,000. There was no such sale or gain in 2003. Exclusive of this gain, total other income increased less than 1%. The largest increase in other income was on other operating income, up $51,000 or 3%, due primarily to increases in sweep fees. Service charges on deposit accounts decreased $69,000 or 4%.
Total other expenses of the Banking business segment increased by 12% in 2004 compared to 2003 levels. While regular salaries increased by 6%, other salaries, primarily incentives and a corporate-wide bonus pool of $275,000 increased by $463,000 or 97%, compared to similar corporate-wide incentives incurred in 2003. A corporate-wide bonus pool of $275,000 was accrued for 2004. No such bonus pool was accrued in 2003. Fringe benefits remained level with 2003. Occupancy expenses increased by $252,000 or 8%, due primarily to expenses related to the new Newtown Square branch, put into service in January 2004. Other operating expenses increased by 28% which included a decrease in advertising expenses of 35%. The increase in other operating expenses in 2004 was mainly due to accounting and consulting expenses related to implementing the requirements of SOX-404 of $470,000. No such expenses were incurred in 2003. Included in other operating expense in 2003 was a $250,000 elimination of a prior accrual for potential litigation that was deemed unnecessary as of December 31, 2003. Exclusive of the above mentioned items, other operating expenses increased by 10% over 2003.
Strong growth in the Bank’s average earning assets, over 2003, is primarily responsible for a $1,780,000 or 7% increase in net interest income. The Bank also increased its loan loss provision by $150,000. The result was a $404,000 or 5% increase in the Banking segment profit for 2004, over 2003.
Wealth Management Line of Business
The Wealth Management business segment reported a 12% increase in operating profit for 2004 compared to 2003 levels. A $603,000 or 6% increase in fees for investment management and trust services is primarily responsible for this increase. An overall increase in asset values combined with the growth in new business was the primary cause for the increase in trust fees. The market value of assets managed increased by 11% from $1,752,000,000 at December 31, 2003, to $1,938,000,000 as of December 31, 2004.
Total other expenses of the Wealth Management line of business increased by $198,000 or 3% in 2004 over 2003 levels.
The primary reason for this increase was an increase in the salary - other expense of $209,000 or 185%, due primarily to increased incentive payments in 2004 related to the growth in new business, compared to 2003. Occupancy expenses declined $45,000 or 7% and other operating expenses increased by $44,000 or 4%.
Mortgage Banking Line of Business
The operating profit of the Bank’s Mortgage Banking line of business decreased 71% in 2004 compared to 2003 due to a significant decline in the volume of residential refinancing
8
activity in 2004 compared to 2003. The sale of residential mortgage loans decreased by 77% and the respective gains declined by 73% or $7,751,000. Other fees and service charges decreased 25% primarily due to decreased fees associated with the decline in residential mortgage originations, as well as a decline in loan servicing fees caused by the sale of MSRs in the first quarter of 2004. Other operating income, consisting of fees earned by BMTSS, decreased 75%. This decrease is directly related to the 77% decrease in the sale of residential loans in 2004, compared to 2003.
Regular salaries declined 33% due to a decrease in overtime, as well as not replacing three Mortgage Banking segment officers, who resigned in the first quarter of 2004. Salaries – other decreased 79% due to lower incentives related to the lower volume of respective loan sales. Fringe benefits declined 15%, related to lower salary expense in 2004, while other operating expenses decreased 65%. Of this decrease $1,975,000 was due to lower amortization of MSRs, due to the decline in refinancing activity previously discussed, and other expenses, directly related to the volume of loan sales, such as appraisal fees, loan pair off fees and credit reports, decreased by $1,228,000. The total decrease in other operating expense amounted to $3,177,000.
Following is a table showing the volume of residential mortgage loans originated and sold to the secondary mortgage market, the total net gains realized, and the yield on these loan sales:
TABLE 2: Summary of Residential Loan Sale Activity
| | | | | | | | |
| (dollars in thousands) | | 2004
| | | 2003
| |
Volume of loans sold | | $ | 144,916 | | | $ | 628,052 | |
Loan fees and net gains on sales | | | 2,886 | | | | 10,637 | |
Yield on sales | | | 1.99 | % | | | 1.69 | % |
As of December 31, 2004, the Bank serviced $480,494,000 in residential mortgage loans for others, compared to $755,132,000 in loans serviced for others at year-end 2003. This decrease reflects the sale of MSRs in 2004 associated with $245,000,000 in residential mortgage loans serviced for others.
Bryn Mawr Bank Corporation
The Corporation is a one-bank holding company, generating intercompany revenues from the rental of Corporation owned properties to the Bank. The Corporation’s expenses are primarily of an administrative nature.
Insurance Counsellors of Bryn Mawr, Inc.
In January 1998, the Bank established a wholly owned subsidiary, ICBM (a full-service insurance agency), to enable the Bank to offer insurance products and related services to its customer base. ICBM offers a full line of life, property and casualty and commercial lines to its customer base. ICBM reported net income of $44,000 for 2004, compared to a loss of $28,000 in 2003. While insurance commissions grew by $26,000 or 6%, expenses decreased by $90,000 or 20%. This decrease is primarily related to the elimination of one senior position in ICBM at year-end 2003.
BMT Settlement Services, Inc.
In January 2002, the Bank formed BMTSS, a Pennsylvania Corporation, to be a limited partner in a limited partnership, established to provide title search and abstract services to Bank customers either refinancing their existing residential mortgage loans or obtaining new residential mortgage loans. BMTSS entered into an agreement (the “Partnership Agreement”) with Commonwealth Land Transfer Company, whereby BMTSS would receive 70% of the profits, after expenses, from the partnership. Due to the significant decrease in the volume of mortgage loan refinancing in 2004, compared to 2003, as described in the Mortgage Banking segment, BMTSS earned $82,000 in net income for 2004, a 68% decrease from $258,000 reported for 2003.
Joseph W. Roskos & Co.
On August 1, 2003, effective June 30, 2003, the Corporation concluded the Asset Sale and, as a result of that transaction, JWR & Co. took back notes from PFO, the purchaser. Income from continuing operations for 2004, representing the interest on the notes totaling $1,287,000 at December 31, 2004 was $81,000 compared to $47,000 for 2003.
Net Interest Income
During 2003 and for the first seven months of 2004, the Bank’s prime rate remained at 4.25%. From August to December 2004, the bank increased its prime rate by 100 basis points, ending 2004 at 5.25%. The continued low prime rate for much of 2004 and all of 2003, compared to 2002, reduced the Bank’s net interest margin. In 2004, the compressed net interest margin was offset by a 14% increase in average outstanding earning assets and resulted in a $2,120,000 or 7% increase in total interest income. Strong growth in the Bank’s low cost deposits, partially offset by a decline in interest rates paid on deposits during 2004, compared to 2003 deposit rates, was primarily responsible for a $223,000 or 5% increase in total interest expense for the year ended December 31, 2004. This resulted in net interest income for 2004 of $26,828,000 being 8% ahead of $24,931,000 in net interest income reported for 2003. In an effort to increase interest income the Bank grew the investment portfolios, average outstanding investments balances by 37%. This growth, being partially offset by a 50 basis point decrease in the yield on investments, is primarily responsible for an 18% increase in interest on investments. Primarily the result of strong average deposit growth in 2004, average outstanding balances of federal funds sold increased by 23%. The yield on earning assets decreased by 40 basis points, from 5.7% for 2003 to 5.3% for 2004.
Total average deposits increased 14%. The largest increases occurred in the Bank’s lower costing deposits. The largest dollar increase occurred in the Bank’s money market account average balances, up $37,668,000 or 44%. This is due to the
9
change in the pricing of the money market account to be more competitive which resulted in the movement of off-balance sheet sweep funds back into the Bank’s money market accounts and funds from other money market mutual funds being deposited. Average NOW account balances increased by $21,130,000 or 17%. Average non-interest-bearing demand deposits increased by $2,001,000 or 1%. Statement savings average balances grew by $1,527,000 or 3% and CD balances grew by $5,373,000 or 6%. Average outstanding short-term borrowings and federal funds purchased were less than $1,000,000 for each period, increasing by 71% from $496,000 for 2003 to $850,000 for 2004. The low levels of borrowings are due primarily to the increased liquidity provided by the growth in average deposits in both 2004 and 2003. A combination of the ability to lower overall interest rates paid for interest-bearing deposits and short-term borrowings and strong growth in the low and no cost deposit balances was primarily responsible for a 10 basis point decrease in the average cost of funds for 2004, compared to 2003. The decrease in the yield on earning assets, partially offset by the decreased cost of funds was directly responsible for the Bank’s net interest margin, defined as net interest income, inclusive of loan fees, as a percentage of average earning assets, decreasing from 4.70% for 2003 to 4.46% for 2004.
TABLE 3 - Analyses of Interest Rates and Interest Differential
The following table shows an analysis of the composition of net interest income for each of the last three years. Interest income on loans includes fees on loans of $645,000, $677,000 and $620,000 in 2004, 2003 and 2002 respectively. The average loan balances include nonaccrual loans. All average balances are calculated on a daily basis. Yields on investment securities are not calculated on a tax-equivalent basis.
| | | | | | | | | | | | | | | | | | | | | | | | | | | | | | |
| | | 2004
| | | 2003**
| | | 2002
| |
| (dollars in thousands) | | Average
Balance
| | | Interest
Income/
Expense
| | Average
Rates
Earned/Paid
| | | Average/
Balance
| | | Interest
Income/
Expense
| | Average
Rates
Earned/
Paid
| | | Average
Balance
| | | Interest
Income/
Expense
| | Average
Rates
Earned/
Paid
| |
Assets: | | | | | | | | | | | | | | | | | | | | | | | | | | | | | | |
Cash and due from banks | | $ | 32,774 | | | $ | — | | — | % | | $ | 33,005 | | | $ | — | | — | % | | $ | 29,934 | | | $ | — | | — | % |
Interest-bearing deposits with other banks* | | | 3,079 | | | | 48 | | 1.6 | | | | 3,737 | | | | 37 | | 1.0 | | | | 3,651 | | | | 54 | | 1.5 | |
Federal funds sold* | | | 13,052 | | | | 191 | | 1.5 | | | | 10,638 | | | | 110 | | 1.0 | | | | 7,275 | | | | 112 | | 1.5 | |
Investment securities available for sale: | | | | | | | | | | | | | | | | | | | | | | | | | | | | | | |
Taxable* | | | 27,173 | | | | 854 | | 3.1 | | | | 21,087 | | | | 780 | | 3.7 | | | | 21,373 | | | | 1,024 | | 4.8 | |
Tax-exempt* | | | 5,071 | | | | 165 | | 3.3 | | | | 2,499 | | | | 86 | | 3.4 | | | | 939 | | | | 39 | | 4.2 | |
| | |
|
|
| |
|
| |
|
| |
|
|
| |
|
| |
|
| |
|
|
| |
|
| |
|
|
Total investment securities | | | 32,244 | | | | 1,019 | | 3.2 | | | | 23,586 | | | | 866 | | 3.7 | | | | 22,312 | | | | 1,063 | | 4.8 | |
| | |
|
|
| |
|
| |
|
| |
|
|
| |
|
| |
|
| |
|
|
| |
|
| |
|
|
Loans* | | | 538,775 | | | | 30,123 | | 5.6 | | | | 478,397 | | | | 28,248 | | 5.9 | | | | 421,904 | | | | 28,183 | | 6.7 | |
Less allowance for loan losses | | | (6,957 | ) | | | — | | — | | | | (6,519 | ) | | | — | | — | | | | (5,459 | ) | | | — | | — | |
| | |
|
|
| |
|
| |
|
| |
|
|
| |
|
| |
|
| |
|
|
| |
|
| |
|
|
Net loans | | | 531,818 | | | | 30,123 | | 5.7 | | | | 471,878 | | | | 28,248 | | 6.0 | | | | 416,445 | | | | 28,183 | | 6.8 | |
Other assets | | | 29,827 | | | | — | | — | | | | 27,557 | | | | — | | — | | | | 27,365 | | | | — | | — | |
| | |
|
|
| |
|
| |
|
| |
|
|
| |
|
| |
|
| |
|
|
| |
|
| |
|
|
Total assets | | $ | 642,794 | | | $ | 31,381 | | — | | | $ | 570,401 | | | $ | 29,261 | | — | | | $ | 506,982 | | | $ | 29,412 | | — | |
| | |
|
|
| |
|
| |
|
| |
|
|
| |
|
| |
|
| |
|
|
| |
|
| |
|
|
Liabilities: | | | | | | | | | | | | | | | | | | | | | | | | | | | | | | |
Demand deposits, noninterest-bearing | | $ | 137,336 | | | $ | — | | — | % | | $ | 135,335 | | | $ | — | | — | % | | $ | 117,949 | | | $ | — | | — | % |
Savings deposits | | | 323,972 | | | | 1,999 | | 0.6 | | | | 263,646 | | | | 1,658 | | 0.6 | | | | 221,725 | | | | 1,556 | | 0.7 | |
Time deposits | | | 102,369 | | | | 2,544 | | 2.5 | | | | 96,996 | | | | 2,664 | | 2.7 | | | | 79,332 | | | | 2,509 | | 3.2 | |
Short term borrowings | | | 96 | | | | 1 | | 1.0 | | | | 438 | | | | 7 | | 1.6 | | | | 18,609 | | | | 386 | | 2.1 | |
Federal funds purchased | | | 754 | | | | 9 | | 1.2 | | | | 58 | | | | 1 | | 1.7 | | | | 1,665 | | | | 33 | | 2.0 | |
Other liabilities | | | 9,900 | | | | — | | — | | | | 10,454 | | | | — | | — | | | | 8,551 | | | | — | | — | |
| | |
|
|
| |
|
| |
|
| |
|
|
| |
|
| |
|
| |
|
|
| |
|
| |
|
|
Total liabilities | | | 574,427 | | | | 4,553 | | — | | | | 506,927 | | | | 4,330 | | — | | | | 447,831 | | | | 4,484 | | — | |
Shareholders’ equity | | | 68,367 | | | | — | | — | | | | 63,474 | | | | — | | — | | | | 59,151 | | | | — | | — | |
| | |
|
|
| |
|
| |
|
| |
|
|
| |
|
| |
|
| |
|
|
| |
|
| |
|
|
Total liabilities and shareholders’ equity | | $ | 642,794 | | | $ | 4,553 | | — | | | $ | 570,401 | | | $ | 4,330 | | — | | | $ | 506,982 | | | $ | 4,484 | | — | |
| | |
|
|
| |
|
| |
|
| |
|
|
| |
|
| |
|
| |
|
|
| |
|
| |
|
|
Total earning assets | | $ | 587,150 | | | | — | | — | | | $ | 516,358 | | | | — | | — | | | $ | 455,142 | | | | — | | — | |
Interest income to earning assets | | | — | | | | — | | 5.3 | | | | — | | | | — | | 5.7 | | | | — | | | | — | | 6.5 | |
Interest expense to earning assets | | | — | | | | — | | 0.8 | | | | — | | | | — | | 0.8 | | | | — | | | | — | | 1.0 | |
Net yield on interest-earning assets | | | — | | | | — | | 4.5 | | | | — | | | | — | | 4.9 | | | | — | | | | — | | 5.5 | |
Average effective rate paid on interest-bearing liabilities | | | — | | | | — | | 1.1 | | | | — | | | | — | | 1.2 | | | | — | | | | — | | 1.4 | |
Average effective cost on total deposits and short term borrowings | | | — | | | | — | | 0.8 | | | | — | | | | — | | 0.9 | | | | — | | | | — | | 1.0 | |
Net interest margin | | | — | | | | — | | 4.46 | | | | — | | | | — | | 4.70 | | | | — | | | | — | | 5.34 | |
Earning assets to interest-bearing liabilities | | | — | | | | — | | 1.37 | | | | — | | | | — | | 1.43 | | | | — | | | | — | | 1.42 | |
| * | Indicates earning assets. |
| ** | Reclassified for comparative purposes. |
10
TABLE 4 - Rate/Volume Analyses
The following table shows the effect of changes in volumes and rates on interest income and interest expense. Variances which were not specifically attributable to volume or rate were allocated proportionately between volume and rate. Interest income on loans included (decreases) increases in fees on loans of ($32,000) in 2004, $57,000 in 2003, and $46,000 in 2002.
| | | | | | | | | | | | | | | | | | | | | | | | |
(in thousands) Increase/(decrease) | | 2004 vs. 2003
| | | 2003 vs. 2002
| |
| | Volume
| | | Rate
| | | Total
| | | Volume
| | | Rate
| | | Total
| |
Interest Income: | | | | | | | | | | | | | | | | | | | | | | | | |
Interest-bearing deposits with other banks | | $ | (8 | ) | | $ | 19 | | | $ | 11 | | | $ | 1 | | | $ | (18 | ) | | $ | (17 | ) |
Federal funds sold | | | 25 | | | | 56 | | | | 81 | | | | 41 | | | | (43 | ) | | | (2 | ) |
Investment securities available for sale: | | | | | | | | | | | | | | | | | | | | | | | | |
Taxable | | | 209 | | | | (135 | ) | | | 74 | | | | (13 | ) | | | (268 | ) | | | (281 | ) |
Tax-exempt | | | 82 | | | | (3 | ) | | | 79 | | | | 56 | | | | (9 | ) | | | 47 | |
Loans | | | 3,383 | | | | (1,508 | )* | | | 1,875 | | | | 3,622 | | | | (3,520 | )* | | | 102 | |
| | |
|
|
| |
|
|
| |
|
|
| |
|
|
| |
|
|
| |
|
|
|
Total interest income | | | 3,691 | | | | (1,571 | ) | | | 2,120 | | | | 3,707 | | | | (3,858 | ) | | | (151 | ) |
| | |
|
|
| |
|
|
| |
|
|
| |
|
|
| |
|
|
| |
|
|
|
Interest expense: | | | | | | | | | | | | | | | | | | | | | | | | |
Savings deposits | | | 341 | | | | 0 | | | | 341 | | | | 311 | | | | (209 | ) | | | 102 | |
Time deposits | | | 115 | | | | (235 | ) | | | (120 | ) | | | 557 | | | | (402 | ) | | | 155 | |
Short term borrowings | | | (4 | ) | | | (2 | ) | | | (6 | ) | | | (305 | ) | | | (74 | ) | | | (379 | ) |
Fed funds purchased | | | 8 | | | | (0 | ) | | | 8 | | | | (28 | ) | | | (4 | ) | | | (32 | ) |
| | |
|
|
| |
|
|
| |
|
|
| |
|
|
| |
|
|
| |
|
|
|
Total interest expense | | | 460 | | | | (237 | ) | | | 223 | | | | 535 | | | | (689 | ) | | | (154 | ) |
| | |
|
|
| |
|
|
| |
|
|
| |
|
|
| |
|
|
| |
|
|
|
Interest differential | | $ | 3,231 | | | $ | (1,334 | ) | | $ | 1,897 | | | $ | 3,172 | | | $ | (3,169 | ) | | $ | 3 | |
| | |
|
|
| |
|
|
| |
|
|
| |
|
|
| |
|
|
| |
|
|
|
| * | Included in the loan rate variance was a (decrease) increase in interest income related to non-performing loans of $(61,000) and $(10,000) in 2004 and 2003, respectively. The variances due to rate include the effect of nonaccrual loans because no interest is earned on such loans. |
The 7% increase in interest income for 2004 was primarily attributable to a 14% increase in average earning assets, partially offset by a 40 basis point decline in the average yield on earning assets, from 5.7% in 2003 to 5.3% for 2004. Interest income related to the rate variance decreased by $1,571,000. A $3,691,000 increase in interest income, attributable to volume growth, was the result of a 14% increase in average outstanding earning assets, including a 13% increase in average outstanding loans. The average yield on loans decreased 30 Basis points from 5.9% in 2003 to 5.6% in 2004. The average yield on federal funds sold increased 50 basis points to 1.5% for 2004, compared to 1.0% for 2003. The yield on the investment portfolio decreased by 50 basis points from 3.7% in 2003 to 3.2% in 2004, as higher yielding maturing or called investments were replaced by investments at lower market interest rates.
While an increase in interest expense due mainly to increased average deposits caused an increase in interest expense of $460,000, the payment of lower rates on deposits caused a decrease in interest expense of $237,000. The net result was an increase in interest expense of $223,000. Because of declining average yields on both the loan and investment portfolios, as indicated in Table 4 – Rate/Volume Analyses on page 12 of this Report, net interest income, related to interest rates, decreased by $1,335,000 from 2003 to 2004. However, continued growth in earning assets, primarily in the loan portfolio, was responsible for a $3,232,000 increase in net interest income, offsetting the decline in the rate variance and increasing net interest income by $1,897,000 or 8% over 2003.
As of December 31, 2004, average outstanding loan balances increased 13% over December 31, 2003. The largest increase in average loans occurred in the consumer lines of credit, up $30,740,000 or 43%, as borrowers took advantage of lower interest rates associated with the floating rate home equity credit lines. Average outstanding commercial mortgage loans increased by $17,622,000 or 16%. In response to a strategy to hold some of the shorter-term residential mortgage loans, primarily 7-year and 15-year maturity loans, in the Bank’s loan portfolio, compared to selling them as done in prior periods, average outstanding residential mortgage loans increased by $15,827,000, or 25%. Average outstanding small business loans, a new loan product recently established by the Bank, increased by $5,963,000 or 46% over 2003 average outstanding balances. Average outstanding construction loan balances increased by $2,835,000 or 9%. Due primarily to unanticipated pay downs during 2004, average outstanding commercial and industrial loans remained flat, decreasing by $698,000 or less than 1%. A $13,031,000 or 62% decrease in outstanding consumer loans is due primarily to continued run-off of indirect automobile loans, which was planned by the Bank, as well as repayments by fixed rate home equity loan borrowers. The yield on average earning assets decreased by 40 basis points from 5.7% in 2003 to 5.3% in 2004.
Average outstanding deposits increased $67,700,000 or 14% during 2004. The majority of this growth occurred in average outstanding money market accounts, and NOW accounts increased $37,668,000 or 44% and $21,130,000 or 17%, respectively. The growth in money market accounts is due to the competitive pricing of these accounts. Average outstanding CD balances increased by $5,373,000 or 6%. Average outstanding non-interest-bearing demand deposits were up by $2,001,000 or 2%, while average outstanding savings account balances grew by $1,527,000 or 3%. Average outstanding short-term borrowings and federal funds purchased increased by $354,000 or 71%, with average outstanding balances remaining under $1,000,000 for both 2004 and 2003. The total cost of funds for the Bank averaged .8% for 2004 compared to .9% for 2003, a 10 basis point decrease.
Loan Loss Provision
Primarily in response to increased charge-offs in the second half of 2004, the Bank increased its annual loan loss provision from $750,000 for 2003 to $900,000 for 2004. The allowance for loan losses was $6,927,000 and $6,670,000 as of December 31, 2004 and 2003, respectively. Delinquencies, as a percentage of outstanding loans, amounted to 41 basis points and 27 basis points as of December 31, 2004 and 2003, respectively. Nonperforming loans amounted to $1,109,000 at December 31, 2004, compared to $286,000 at December 31, 2003. The allowance for loan losses, as a percentage of outstanding loans, was 1.23% as of December 31, 2004, compared to 1.33% as of December 31, 2003. Bank management has determined that the 2004 loan loss provision
11
was sufficient to maintain an adequate level of the allowance for loan losses during 2004.
TABLE 5 - Allowance for Loan Losses
A summary of the changes in the allowance for loan losses and a breakdown of loan loss experience by major loan category for each of the past five years follows:
| | | | | | | | | | | | | | | | | | | | |
| | | December 31,
| |
| (dollars in thousands) | | 2004
| | | 2003
| | | 2002
| | | 2001
| | | 2000
| |
Allowance for loan losses: | | | | | | | | | | | | | | | | | | | | |
Balance, January 1 | | $ | 6,670 | | | $ | 6,114 | | | $ | 4,928 | | | $ | 4,320 | | | $ | 4,400 | |
| | |
|
|
| |
|
|
| |
|
|
| |
|
|
| |
|
|
|
Charge-offs: | | | | | | | | | | | | | | | | | | | | |
Commercial and industrial | | | (167 | ) | | | (112 | ) | | | — | | | | (940 | ) | | | 0 | |
Real estate—construction | | | — | | | | — | | | | — | | | | — | | | | — | |
Real estate—mortgage | | | (431 | ) | | | (13 | ) | | | — | | | | (51 | ) | | | (44 | ) |
Consumer | | | (94 | ) | | | (102 | ) | | | (68 | ) | | | (178 | ) | | | (355 | ) |
| | |
|
|
| |
|
|
| |
|
|
| |
|
|
| |
|
|
|
Total charge-off | | | (692 | ) | | | (227 | ) | | | (68 | ) | | | (1169 | ) | | | (399 | ) |
Recoveries: | | | | | | | | | | | | | | | | | | | | |
Commercial and industrial | | | 2 | | | | — | | | | 220 | | | | 63 | | | | 3 | |
Real estate—construction | | | — | | | | — | | | | — | | | | 476 | | | | — | |
Real estate—mortgage | | | — | | | | 1 | | | | 10 | | | | — | | | | — | |
Consumer | | | 47 | | | | 32 | | | | 24 | | | | 38 | | | | 66 | |
| | |
|
|
| |
|
|
| |
|
|
| |
|
|
| |
|
|
|
Total recoveries | | | 49 | | | | 33 | | | | 254 | | | | 577 | | | | 69 | |
| | |
|
|
| |
|
|
| |
|
|
| |
|
|
| |
|
|
|
Net recoveries / (charge-offs) | | | (643 | ) | | | (194 | ) | | | 186 | | | | (592 | ) | | | (330 | ) |
Provision for loan losses | | | 900 | | | | 750 | | | | 1,000 | | | | 1,200 | | | | 250 | |
| | |
|
|
| |
|
|
| |
|
|
| |
|
|
| |
|
|
|
Balance, December 31 | | $ | 6,927 | | | $ | 6,670 | | | $ | 6,114 | | | $ | 4,928 | | | $ | 4,320 | |
| | |
|
|
| |
|
|
| |
|
|
| |
|
|
| |
|
|
|
Net recoveries / (charge-offs) to average loans | | | (0.12 | )% | | | (0.04 | )% | | | 0.04 | % | | | (0.16 | )% | | | (0.10 | )% |
TABLE 6 - Allocation of Allowance for Loan Losses
The table below allocates the balance of the allowance for loan losses by loan category and the corresponding percentage of loans to total loans for each loan category for the last five years:
| | | | | | | | | | | | | | | | | | | | | | | | | | | | | | |
| | | December 31,
| |
| | | 2004
| | | 2003
| | | 2002
| | | 2001
| | | 2001
| |
| (dollars in thousands) | | % Loans to
Total Loans
| | | % Loans to
Total Loans
| | | % Loans to
Total Loans
| | | % Loans to
Total Loans
| | | % Loans to
Total Loans
| |
Balance at end of period applicable to: | | | | | | | | | | | | | | | | | | | | | | | | | | | | | | |
Commercial and industrial | | $ | 3,575 | | 33.1 | % | | $ | 3,656 | | 35.7 | % | | $ | 2,940 | | 36.4 | % | | $ | 2,729 | | 39.1 | % | | $ | 1,193 | | 41.5 | % |
Real estate—construction | | | 741 | | 6.6 | | | | 558 | | 7.2 | | | | 494 | | 5.9 | | | | 214 | | 5.1 | | | | 7 | | 3.0 | |
Real estate—mortgage | | | 806 | | 58.5 | | | | 1,089 | | 53.4 | | | | 1,107 | | 52.4 | | | | 1,019 | | 45.0 | | | | 56 | | 38.3 | |
Consumer | | | 1,174 | | 1.8 | | | | 906 | | 3.7 | | | | 907 | | 5.3 | | | | 316 | | 10.8 | | | | 248 | | 17.2 | |
Unallocated | | | 631 | | — | | | | 461 | | — | | | | 666 | | — | | | | 650 | | — | | | | 2,816 | | — | |
| | |
|
| |
|
| |
|
| |
|
| |
|
| |
|
| |
|
| |
|
| |
|
| |
|
|
Total | | $ | 6,927 | | 100 | % | | $ | 6,670 | | 100 | % | | $ | 6,114 | | 100 | % | | $ | 4,928 | | 100 | % | | $ | 4,320 | | 100 | % |
| | |
|
| |
|
| |
|
| |
|
| |
|
| |
|
| |
|
| |
|
| |
|
| |
|
|
The loan loss reserve allocation reflects a reserve based on specific loan loss reserve allocations on loans reviewed individually as well as an average historical loan write-off percentage for loans in each specific loan category not individually reviewed and is also adjusted by an additional percentage to reflect current market conditions.
Refer to pages 30 - 31 for further discussion of the Corporation’s loan review process.
12
Other Real Estate Owned
During 2004 the Bank obtained a property in foreclosure, adding $357,000 in Other Real Estate Owned (“OREO”). There was no OREO recorded on the Bank’s books as of December 31, 2003.
Other Income
The following table details other income for the years ended December 31, 2004 and 2003, and the percent change from year to year:
TABLE 7 - Other Income
| | | | | | | | | |
| | | 2004
| | 2003
| | %
Change
| |
Fees for investment management and trust services | | $ | 10,087 | | $ | 9,484 | | 6 | % |
Service charges on deposit accounts | | | 1,827 | | | 1,896 | | (4 | )% |
Other fees and service charges | | | 1,879 | | | 2,420 | | (22 | )% |
Net gain on sale of loans | | | 2,920 | | | 10,650 | | (73 | )% |
Net gain on sale of mortgage servicing rights | | | 1,145 | | | — | | 100 | % |
Investment advisory and brokerage fees | | | 216 | | | 248 | | (13 | )% |
Insurance commission income | | | 299 | | | 268 | | 12 | % |
Other operating income | | | 1,421 | | | 1,611 | | (12 | )% |
| | |
|
| |
|
| |
|
|
Total other income | | $ | 19,794 | | $ | 26,577 | | (26 | )% |
| | |
|
| |
|
| |
|
|
In addition to net interest income, the Bank’s three operating segments, as well as ICBM generate various streams of fee-based income, including investment management and trust income, insurance commissions, service charges on deposit accounts, loan servicing income and gains/losses on loan sales, and in 2004 a gain on the sale of MSRs.
Fees for investment management and trust services increased $603,000 or 6% from $9,484,000 in 2003 to $10,087,000 in 2004. Refer to the discussion under the heading “Wealth Management Line of Business” on page 8 of this Report.
Service charges on deposit accounts decreased $69,000 or 4%, from $1,896,000 in 2003 to $1,827,000 in 2004. Increased average outstanding deposit balances, partially offset by low earnings credit rates, which produce an earnings credit to offset service charges, were sufficient to produce this reduction in service charges on deposit accounts in 2004, compared to 2003.
Other fees and service charges decreased $541,000 or 22%, from $2,420,000 for 2003 to $1,879,000 for 2004. The primary reasons for this decrease was a reduction in residential refinancing activity, discussed in the Mortgage Banking segment, and the sale of MSRs in the first quarter of 2004. The MSR sale accounted for a $245,000,000 reduction in loans serviced for others, thereby lowering loan servicing fees in 2004, compared to similar fees earned in 2003.
As discussed in the “Mortgage Banking Line of Business” section, the $7,730,000 or 73% decrease in gains on the sale of residential mortgage loans was directly attributable to a $483,136,000 or 77% decrease in the volume of residential mortgage loans sold, compared to 2003.
Other operating income decreased $190,000 or 12%, from $1,611,000 for 2003, compared to $1,421,000 for 2004. Included in other operating income are fees earned by BMTSS, from its partnership with a title insurance company. These fees decreased by $342,000 or 75% from $454,000 for 2003, to $112,000 reported for 2004. The reduction in fees earned by BMTSS from year to year is directly attributable to the 77% decrease in the volume of residential loan sales, discussed previously. This decrease in BMTSS fees is the primary reason for the 12% decline in other operating income in 2004, compared to 2003. Partially offsetting this decrease in other operating income was a $40,000 reimbursement from a loan agreement in 2004, related to a prior year and an increase in rental income of $26,000 from a property leased by the Bank, as well as a $24,000 increase in sweep fees earned by the Bank. Brokerage fees decreased by $32,000 or 13%, while insurance commission income rose by $31,000 or 12%.
Other Expenses
The following table details other expenses for the years ended December 31, 2004 and 2003, and the percent change from year to year:
TABLE 8 - Other Expenses
| | | | | | | | | |
| | | 2004
| | 2003*
| | % Change
| |
Salaries-regular | | $ | 13,567 | | $ | 13,596 | | 0 | % |
Salaries-other | | | 1,446 | | | 1,438 | | 1 | % |
Employee benefits | | | 4,297 | | | 4,353 | | (1 | )% |
Occupancy expense | | | 2,161 | | | 1,961 | | 10 | % |
Furniture, fixtures, and equipment | | | 1,785 | | | 1,806 | | (1 | )% |
Advertising | | | 879 | | | 674 | | 30 | % |
Professional fees | | | 1,799 | | | 937 | | 92 | % |
Computer processing | | | 587 | | | 607 | | (3 | )% |
Stationery and supplies | | | 282 | | | 316 | | (11 | )% |
Insurance | | | 151 | | | 156 | | (3 | )% |
Amortization of MSRs | | | 839 | | | 2,814 | | (70 | )% |
Other operating expenses | | | 3,832 | | | 4,779 | | (20 | )% |
| | |
|
| |
|
| |
|
|
Total other expenses | | $ | 31,625 | | $ | 33,437 | | (5 | )% |
| | |
|
| |
|
| |
|
|
| * | Reclassified for comparative purposes. |
Total other expenses decreased for the year ended December 31, 2004, by $1,812,000 or 5%. Regular salaries, consisting of regular, part time and overtime salary expense, the largest component of other expenses, decreased $29,000 or less than 1%. Staffing turnover and the Bank’s ability to replace necessary vacant positions from within the Bank are the primary reasons for regular salaries being even with 2003 levels not withstanding a 3% salary increase. As of December 31, 2004, the Corporation’s consolidated full-time equivalent staffing level was 237.5 compared to 247.5 as of December 31, 2003.
13
Other salaries increased $8,000 or 1% from 2003 to 2004. Primarily reflecting the decrease in mortgage banking activity in the Mortgage Banking business segment, incentive-based salaries in the Bank’s credit division decreased $780,000 or 65%. Offsetting this decrease were increases in incentive based salaries incurred in the Wealth Management business segment, related to new business development, increasing $187,000 or 165%, the accrual of a corporate wide bonus pool of $275,000 for 2004, compared to no corporate wide bonus pool in 2003, a $77,000 incentive pool related to the sale of MSRs in 2004, compared to no such pool in 2003, and an overall increase in other incentives related to new business acquisition within the Bank of $130,000 or 41%. Also related to the decrease in residential mortgage loan sales was a $119,000 or 56% decrease compared to 2003 in the deferred expenses related to mortgage originations as required by GAAP. All of these changes in 2004 from 2003 accounted for $7,000 of the $8,000 net change in other salaries from year to year.
Employee benefit costs decreased $56,000 or 1% in 2004 from 2003 levels. There was a decrease of $181,000 in the expense associated with the Corporation’s pension plan, which produced an expense of $935,000 in 2004 compared to $1,116,000 in 2003. Increasing pension asset values are primarily responsible for this decrease in pension expenses. Partially offsetting this decrease was an increase in fringe benefits; other fringe benefits were up $98,000 or 22%, primarily driven by an increase in the Corporation’s postretirement benefits expense up $91,000 or 95% from 2003.
Occupancy expenses increased $200,000 or 10% from 2003. This is mainly related to the new branch office in Newtown Square, Pennsylvania, which opened during the first quarter of 2004. This expense did not exist in 2003.
Advertising expenses increased by $205,000 or 30%, due primarily to an increase in the cost of radio advertising. Professional fees increased by $862,000 or 92%. The largest increase was related to accounting and consulting fees incurred to comply with the requirements of SOX-404 of $220,000 and $250,000, respectively. Exclusive of the SOX-404 related expense, consulting expenses grew by $218,000 or 55%, due primarily to consulting expenses associated with enhancing the Corporation’s public image, as well as consulting fees paid to the retired CEO of ICBM for managing the Corporation’s insurance policies.
The amortization of MSRs decreased $1,975,000 or 70% from 2003 to 2004. This decrease is associated with the 77% decrease in the volume of residential refinancing activity and the sale MSRs discussed above in the Mortgage Banking segment.
Other operating expenses decreased $947,000 or 20% from $4,779,000 in 2003 to $3,832,000 in 2004. The decrease in residential mortgage loan sale activity in 2004 was primarily responsible for a $1,176,000 decrease in other operating expenses of the Mortgage Banking segment. Included in other operating expense in 2003 was a $250,000 elimination of a prior accrual for potential litigation that was deemed unnecessary as of December 31, 2003. The decreased Mortgage Banking segment related expenses in 2004 and the elimination of the $250,000 accrual reversal, effectively increasing expenses in 2004, accounts for $926,000 of the decrease in other operating expenses for 2004, compared to a total decrease of $947,000 in 2004, compared to 2003.
Income Taxes
The income taxes for 2004 were $4,752,000, compared to $6,049,000 for 2003. This represents an effective tax rate of 33.7% and 34.4% for 2004 and 2003, respectively. Income taxes for financial reporting purposes differ from the amount computed by applying the statutory rate to income before taxes, due primarily to tax-exempt income from certain loans and investment securities.
FINANCIAL CONDITION
Investment Securities
Management has elected to classify 100% of the investment portfolio as held for sale. Therefore, the investment portfolio was carried at its estimated market value of $35,441,000 and $31,397,000 as of December 31, 2004 and 2003, respectively. The amortized cost of the portfolio as of December 31, 2004 was $35,654,000, resulting in net unrealized losses of $213,000. The amortized cost of the portfolio at December 31, 2003 was $31,411,000, resulting in net unrealized losses of $14,000.
TABLE 9 - Investment Portfolio
| | | | | | | | | | | | | | | | | | | | |
| (dollars in thousands) | | Maturing
during
2005
| | | Maturing
from
2006
through
2009
| | | Maturing
from
2010
through
2014
| | | Maturing
after
2014
| | | Total
| |
Obligations of the U.S. | | | | | | | | | | | | | | | | | | | | |
Government and agencies: | | | | | | | | | | | | | | | | | | | | |
Book value | | $ | 3,475 | | | $ | 21,351 | | | $ | 3,967 | | | | — | | | $ | 28,793 | |
Weighted average yield | | | 2.4 | % | | | 3.1 | % | | | 3.5 | % | | | — | | | | 3.3 | % |
State and political subdivisions: | | | | | | | | | | | | | | | | | | | | |
Book value | | | — | | | | — | | | | 5,098 | | | | — | | | | 5,098 | |
Weighted average yield | | | — | | | | — | | | | 3.2 | % | | | — | | | | 3.2 | % |
Other investment securities: | | | | | | | | | | | | | | | | | | | | |
Book value | | | 54 | | | | — | | | | 306 | | | | 1,190 | | | | 1,550 | |
Weighted average yield | | | — | | | | — | | | | — | | | | — | | | | — | |
| | |
|
|
| |
|
|
| |
|
|
| |
|
|
| |
|
|
|
Total book value | | $ | 3,529 | | | $ | 21,351 | | | $ | 9,371 | | | $ | 1,190 | | | $ | 35,441 | |
Weighted average yield | | | 2.4 | % | | | 3.1 | % | | | 3.2 | % | | | 0.0 | % | | | 3.0 | % |
During 2004, $13,147,000 in investments were called and $204,000 of Federal Home Loan Bank of Pittsburgh (the “FHLB”) stock was redeemed. During 2004, purchases of investment securities amounted to $17,568,000. Those transactions were primarily responsible for the $4,044,000 or 13% increase in the investment portfolio from December 31, 2003, to December 31, 2004. At December 31, 2004, approximately 81% of the investment portfolio consisted of fixed rate U.S. Government Agency securities. The Corporation
14
does not own any derivative investments and at the current time, does not plan to purchase any such investments in the foreseeable future.
Loans
For financial reporting purposes, both fixed and floating rate home equity loans, collateralized by mortgages, are included in other permanent mortgage loans. Floating rate personal lines of credit loans are included in consumer loans.
Table 10 - Loan Portfolio
A breakdown of the loan portfolio by major categories at December 31 for each of the last five years is as follows:
| | | | | | | | | | | | | | | |
| | | December 31
|
| (in thousands) | | 2004
| | 2003
| | 2002
| | 2001
| | 2000
|
Real estate loans: | | | | | | | | | | | | | | | |
Permanent mortgage loans | | $ | 330,442 | | $ | 269,220 | | $ | 244,638 | | $ | 177,479 | | $ | 135,777 |
Construction loans | | | 36,941 | | | 36,235 | | | 27,514 | | | 20,416 | | | 10,642 |
Commercial and industrial loans | | | 186,923 | | | 178,381 | | | 170,286 | | | 167,452 | | | 147,398 |
Consumer loans | | | 10,291 | | | 18,580 | | | 24,537 | | | 35,521 | | | 61,189 |
| | |
|
| |
|
| |
|
| |
|
| |
|
|
Total | | $ | 564,597 | | $ | 502,416 | | $ | 466,975 | | $ | 400,868 | | $ | 355,006 |
| | |
|
| |
|
| |
|
| |
|
| |
|
|
The maturity distribution of the loan portfolio, excluding loans secured by one to four family residential property and consumer loans, at December 31, 2004, is shown below.
| | | | | | | | | | | | |
| (in thousands) | | Maturing
during
2005
| | Maturing
from 2006
through
2009
| | Maturing
after 2009
| | Total
|
Commercial, financial, and agricultural | | $ | 100,227 | | $ | 62,869 | | $ | 23,827 | | $ | 186,923 |
Real estate—construction | | | 15,420 | | | 15,757 | | | 5,764 | | | 36,941 |
Real estate—other | | | 710 | | | 19,368 | | | 117,063 | | | 137,141 |
| | |
|
| |
|
| |
|
| |
|
|
Total | | $ | 116,357 | | $ | 97,994 | | $ | 146,654 | | $ | 361,005 |
| | |
|
| |
|
| |
|
| |
|
|
Interest sensitivity on the above loans: | | | | | | | | | | | | |
Loans with predetermined rates | | $ | 9,915 | | $ | 46,474 | | $ | 16,876 | | $ | 73,265 |
Loans with adjustable or floating rates | | | 191,207 | | | 88,167 | | | 8,366 | | | 287,740 |
| | |
|
| |
|
| |
|
| |
|
|
Total | | $ | 201,122 | | $ | 134,641 | | $ | 25,242 | | $ | 361,005 |
| | |
|
| |
|
| |
|
| |
|
|
There are no scheduled prepayments on the loans included in the maturity distributions.
15
Table 11 - Loan Portfolio and Nonperforming Asset Analysis
| | | | | | | | | | | | | | | | | | | | | | | | |
| | | Loan Portfolio
| | Nonperforming Assets
| | Loan Loss
Reserve
|
At December 31, 2004 (in thousands) | | Current
| | Past Due
30 to 89
Days
| | Past Due
90 Days
or More
| | Total
Loans
| | Non- Performing
Loans *
| | Other Real Estate
Owned
| | Total Non-
Performing
Assets
| | Reserve for
Loan Loss
Allocation
|
Real estate loans: | | | | | | | | | | | | | | | | | | | | | | | | |
Permanent mortgage loans: | | | | | | | | | | | | | | | | | | | | | | | | |
Residential | | $ | 81,725 | | $ | 984 | | $ | 1,080 | | $ | 83,789 | | $ | 1,080 | | $ | 357 | | $ | 1,437 | | $ | 204 |
Commercial | | | 137,071 | | | 63 | | | 7 | | | 137,141 | | | 7 | | | — | | | 7 | | | 335 |
Home equity | | | 109,482 | | | 24 | | | 6 | | | 109,512 | | | 6 | | | — | | | 6 | | | 267 |
| | |
|
| |
|
| |
|
| |
|
| |
|
| |
|
| |
|
| |
|
|
Total permanent mortgage loans | | | 328,278 | | | 1,071 | | | 1,093 | | | 330,442 | | | 1093 | | | 357 | | | 1450 | | | 806 |
Construction mortgage loans: | | | | | | | | | | | | | | | | | | | | | | | | |
Residential | | | 32,059 | | | — | | | — | | | 32,059 | | | — | | | — | | | — | | | 643 |
Commercial | | | 4,882 | | | — | | | — | | | 4,882 | | | — | | | — | | | — | | | 98 |
| | |
|
| |
|
| |
|
| |
|
| |
|
| |
|
| |
|
| |
|
|
Total construction mortgage loans | | | 36,941 | | | — | | | — | | | 36,941 | | | — | | | — | | | — | | | 741 |
| | |
|
| |
|
| |
|
| |
|
| |
|
| |
|
| |
|
| |
|
|
Total real estate loans | | | 365,219 | | | 1,071 | | | 1,093 | | | 367,383 | | | 1093 | | | 357 | | | 1450 | | | 1,547 |
Commercial and industrial loans | | | 186,844 | | | 79 | | | — | | | 186,923 | | | — | | | — | | | — | | | 3,575 |
| | |
|
| |
|
| |
|
| |
|
| |
|
| |
|
| |
|
| |
|
|
Total commercial and industrial loans | | | 186,844 | | | 79 | | | — | | | 186,923 | | | — | | | — | | | — | | | 3,575 |
| | |
|
| |
|
| |
|
| |
|
| |
|
| |
|
| |
|
| |
|
|
Consumer loans: | | | | | | | | | | | | | | | | | | | | | | | | |
Direct | | | 888 | | | 19 | | | — | | | 907 | | | — | | | — | | | — | | | 103 |
Indirect | | | 590 | | | 4 | | | 10 | | | 604 | | | 10 | | | — | | | 10 | | | 69 |
CreditLine | | | 8,758 | | | 16 | | | 6 | | | 8,780 | | | 6 | | | — | | | 6 | | | 1,002 |
| | |
|
| |
|
| |
|
| |
|
| |
|
| |
|
| |
|
| |
|
|
Total consumer loans | | | 10,236 | | | 39 | | | 16 | | | 10,291 | | | 16 | | | — | | | 16 | | | 1,174 |
Unallocated reserve for loan loss | | | — | | | — | | | — | | | — | | | — | | | — | | | — | | | 631 |
| | |
|
| |
|
| |
|
| |
|
| |
|
| |
|
| |
|
| |
|
|
Total | | $ | 562,299 | | $ | 1,189 | | $ | 1,109 | | $ | 564,597 | | $ | 1,109 | | $ | 357 | | $ | 1,466 | | $ | 6,927 |
| | |
|
| |
|
| |
|
| |
|
| |
|
| |
|
| |
|
| |
|
|
| * | Nonperforming loans are loans on which scheduled principal and/or interest is past due 90 days or more and loans less than 90 days past due which are deemed to be problem loans by management. Total nonperforming loans of $1,109,000 includes the $1,109,000 in loans past due 90 days or more, on which certain borrowers have paid interest regularly. There are no loans less than 90 days delinquent included in nonperforming loans. |
16
The Bank’s lending function is its principal income generating activity, and it is the Bank’s policy to continue to serve the credit needs of its market area. Total loans at December 31, 2004 increased 12% to $564,597,000 from $502,416,000 as of December 31, 2003.
The largest growth in outstanding balances occurred in residential loans secured by real estate, which increased by $44,358,000 or 39%, from $114,677,000 at December 31, 2003 to $159,035,000 at December 31, 2004. In an effort to enhance current net interest income, the decision was made in the fourth quarter of 2003, to hold some shorter-term residential mortgage loans in the Bank’s loan portfolio. This is the primary reason for this increase in outstanding residential mortgage loans. Available for sale mortgage loans increased by $5,017,000 or 136%, from $3,691,000 at December 31, 2003 to $8,708,000 at year-end 2004.
Commercial mortgage loan balances increased by $17,293,000 or 14%, from $120,188,000 at December 31, 2003 to $137,481,000 as of December 31, 2004.
Second mortgage loans, originated as a function of the Mortgage Banking segment, decreased 18% or $5,542,000, from $31,203,000 at December 31, 2003 to $25,661,000 at year end 2004.
As of December 31, 2004, the construction loan portfolio increased by $706,000 or 2%, from $36,235,000 at December 31, 2003, to $36,941,000 at December 31, 2004. The construction lending function continues to maintain banking relationships with builders who are primarily located within the Bank’s marketing area. As of December 31, 2004 and 2003, the construction lending portfolio had neither any nonperforming loans nor any loans delinquent 30 days or more.
Commercial and industrial loan balances grew $8,542,000 or 5% from $178,381,000 at December 31, 2003 to $186,923,000 at December 31, 2004. This net increase is inclusive of early pay downs by two borrowers totaling $14,240,000 in commercial and industrial loan balances in 2004. Continued increased business development in the Bank’s commercial lending market area is the primary reason for this growth.
Consumer loans, consisting of loans to individuals for household, automobile, family, and other consumer needs, as well as purchased indirect automobile paper from automobile dealers in the Bank’s market area, decreased $8,289,000 or 45%, from $18,580,000 at December 31, 2003, to $10,291,000 at December 31, 2004. Continued pay downs of dealer automobile paper, as well as pay downs of fixed rate home equity loans are primarily responsible for this decrease.
Mortgage Servicing Rights
As a part of its sale of residential mortgage loans to the secondary market, for those loans sold with the loan servicing retained by the Bank, the Bank records MSRs as an asset. During 2004, the Bank has significantly decreased its residential mortgage origination and sale activity, thereby decreasing the balances of MSRs being recorded on its books. As of December 31, 2004, MSRs recorded on the Bank’s balance sheet amounted to $3,172,000, a 28% decrease from $4,391,000 in MSRs as of December 31, 2003. MSRs are recorded on the Bank’s balance sheet at values determined by reviewing the current value of MSRs in the mortgage servicing market. The current value of new MSRs being recorded, as loans are sold with servicing retained, is reviewed periodically and any adjustment to the initial basis point values being recorded is done in a timely manner. Partially because of the sale of MSRs for $245,000,000 in loans serviced for others in the first quarter of 2004 and a decline in the amount of new loans generated in 2004, compared to prior periods, the balance of residential mortgage loans serviced for others amounted to $480,494,000 and $755,132,000 as of December 31, 2004 and December 31, 2003, respectively.
Quarterly, the book value of the MSRs is tested for impairment by an independent valuation firm. Should any impairment occur, the MSR balances are written down against the Bank’s current income. In an increasing residential interest rate environment, prepayment speeds associated with related MSRs should slow, and prepayments of the MSRs will be less likely. However, in a lower residential mortgage loan interest rate environment, it is more likely that mortgage loans that were sold by the Bank with the servicing retained will be refinanced and the balance of the MSRs would be subject to accelerated amortization, thus reducing the Bank’s income. Should the Bank refinance the loans, the accelerated amortization of the MSRs may be offset by the recording of new MSRs, increasing the gain on the loans sold, thereby reducing or eliminating the negative effect of the accelerated amortization of the MSRs. Should the Bank not refinance or replace the loans being paid off, the Bank’s net income would be reduced to the extent of the aggregate accelerated amortization as the respective mortgage loans are paid off.
Deposits
The Bank attracts deposits from within its market area by offering various deposit instruments, including savings accounts, NOW accounts, money market accounts, certificates of deposit and non-interest bearing demand deposit accounts.
Total deposits increased 14% to $600,965,000 at December 31, 2004, from $527,139,000 at year-end 2003. Due primarily to continued strong deposit growth in 2003 and 2004, there were no short-term borrowings at either December 31, 2004 or 2003. A more meaningful measure of the change in deposits and short-term borrowings is average daily balances. As illustrated in Table 12, average daily deposit balances increased 14%. Strong growth in low costing money market and NOW account average balances, combined with the ability to lower overall interest rates paid for interest-bearing deposits and short-term borrowings was primarily responsible for a 10 basis point
17
decrease in the average cost of funds for 2004, compared to 2003. The average cost of funds for 2004 was .8% compared to .9% for 2003.
The following table presents the average daily balances of deposits and the percentage change for the years indicated:
TABLE 12 - Average Daily Balances of Deposits
| | | | | | | | | | | | | | | |
| (dollars in thousands) | | 2004
| | 2003
| | % Change 2004 vs. 2003
| | | 2002
| | % Change 2003 vs. 2002
| |
Demand deposits, non- interest-bearing | | $ | 137,336 | | $ | 135,335 | | 1.5 | % | | $ | 117,949 | | 14.7 | % |
| | |
|
| |
|
| |
|
| |
|
| |
|
|
Market rate accounts | | | 123,651 | | | 85,984 | | 43.8 | % | | | 61,105 | | 40.7 | % |
NOW accounts | | | 149,058 | | | 127,927 | | 16.5 | % | | | 117,864 | | 8.5 | % |
Regular savings | | | 51,263 | | | 49,736 | | 3.1 | % | | | 42,756 | | 16.3 | % |
| | |
|
| |
|
| |
|
| |
|
| |
|
|
Savings deposits | | | 323,972 | | | 263,647 | | 22.9 | % | | | 221,725 | | 18.9 | % |
| | |
|
| |
|
| |
|
| |
|
| |
|
|
Time deposits | | | 102,369 | | | 96,996 | | 5.5 | % | | | 79,332 | | 22.3 | % |
| | |
|
| |
|
| |
|
| |
|
| |
|
|
Total | | $ | 563,677 | | $ | 495,978 | | 13.6 | % | | $ | 419,006 | | 18.4 | % |
| | |
|
| |
|
| |
|
| |
|
| |
|
|
The following table shows the maturity of certificates of deposit of $100,000 or greater as of December 31, 2004:
TABLE 13 - Maturity of Certificates of Deposit of $100,000 or Greater
| | | |
| (in thousands) | | |
Three months or less | | $ | 19,546 |
Three to six months | | | 5,344 |
Six to twelve months | | | 9,026 |
Greater than twelve months | | | 5,734 |
| | |
|
|
Total | | $ | 39,650 |
| | |
|
|
Capital Adequacy
At December 31, 2004, total shareholders’ equity of the Corporation was $71,238,000, a $3,856,000 or 6% increase over $67,382,000 at December 31, 2003. Increasing the capital was the addition of earnings, after the payment of the dividends for the year, capital from the exercise of stock options, less shares repurchased in the Corporation’s stock repurchase program, offset by the reduced market value of the investment securities year to year. As of December 31, 2004, shareholders’ equity included accumulated other comprehensive loss on investment securities and the supplemental pension, net of deferred taxes, of $288,000 compared to accumulated other comprehensive loss on investment securities and the supplemental pension, net of deferred taxes, of $126,000 at December 31, 2003. This change caused a $162,000 decrease to shareholders’ equity from December 31, 2003 to December 31, 2004.
The Corporation and the Bank are required to meet certain regulatory capital adequacy guidelines. Under these guidelines risk-based capital ratios measure capital as a percentage of risk-adjusted assets. Risk-adjusted assets are determined by assigning various weights to all assets and off-balance sheet arrangements, such as letters of credit and loan commitments, based on the associated risk.
The Bank’s risk-based capital ratios at December 31, 2004 and 2003 are listed below. These ratios are all in excess of the minimum required capital ratios, also listed below.
TABLE 14 - Risk-Based Capital Ratios
| | | | | | | | | | | | |
| | | 2004
| | | 2003
| |
| | | Actual
| | | Minimum
Required
| | | Actual
| | | Minimum
Required
| |
Tier I capital ratio | | 9.99 | % | | 4.00 | % | | 10.12 | % | | 4.00 | % |
| | |
|
| |
|
| |
|
| |
|
|
Total capital ratio | | 11.09 | | | 8.00 | | | 11.30 | | | 8.00 | |
| | |
|
| |
|
| |
|
| |
|
|
The FDIC has created a statutory framework for capital requirements that established five categories of capital strength, ranging from a high of “well-capitalized” to a low of “critically under capitalized”. As of December 31, 2004 and 2003, the Bank exceeded the levels required to meet the definition of a “well-capitalized” bank. Management anticipates that the Corporation and the Bank will continue to be in compliance with all capital requirements and continue to be classified as “well-capitalized.”
The Corporation’s ability to declare dividends in the future is dependent on future earnings.
Risk Elements
Risk elements, as defined by the Securities and Exchange Commission in its Exchange Act Industry Guide 3, Statistical Disclosures by Bank Holding Companies, are composed of four specific categories: (1) nonaccrual, past due, and restructured loans, (2) problem loans, loans not included in the first category, but where information known by Bank management indicates that the borrower may not be able to comply with present payment terms, (3) foreign loans outstanding, and (4) loan concentrations. Table 11 presents a summary, by loan type, of the Bank’s nonaccrual and past due loans as of December 31, 2004. It is the Bank’s policy to promptly place nonperforming loans on nonaccrual status. Bank management knows of no outstanding loans that presently would meet the criteria for inclusion in the problem loan category, as indicated under specific category (2) referred to above. The Bank has no foreign loans, and loan concentrations are presented in Table 6 – Allocation of Allowance for Loan Losses. Table 6 presents the percentage of outstanding loans, by loan type, compared to total loans outstanding as of December 31, 2004.
Asset Quality
The Bank is committed to maintaining and developing quality assets. Loan growth is generated primarily within the Bank’s market area, which includes Montgomery, Delaware, Chester and Philadelphia Counties in Pennsylvania. Loan and deposit growth is also generated in portions of Bucks County in Pennsylvania. The development of quality loan growth is controlled through a uniform lending policy that defines the lending functions and goals, loan approval process, lending limits, and loan review.
Nonperforming loans were $1,109,000 at December 31, 2004, a 297% increase from $279,000 at December 31, 2003. This
18
increase is primarily the result of one large residential mortgage loan that moved to non-performing status. The Bank had $357,000 in OREO balances as of December 31, 2004. There were no OREO properties on the Bank’s books as of December 31, 2003.
TABLE 15 - Nonperforming Assets
| | | | | | | | | | | | | | | |
| | | December 31
|
| (in thousands) | | 2004
| | 2003
| | 2002
| | 2001
| | 2000
|
Loans past due 90 days or more not on nonaccrual status: | | | | | | | | | | | | | | | |
Real estate—mortgage | | $ | 6 | | $ | 15 | | $ | 19 | | $ | 15 | | $ | 18 |
Consumer | | | 16 | | | 40 | | | 26 | | | 28 | | | 63 |
Loans on which the accrual of interest has been discontinued: | | | | | | | | | | | | | | | |
Commercial and industrial | | | — | | | — | | | — | | | — | | | — |
Real estate—mortgage | | | 1,087 | | | 205 | | | — | | | — | | | — |
Real estate—construction | | | — | | | 19 | | | — | | | — | | | — |
| | |
|
| |
|
| |
|
| |
|
| |
|
|
Total nonperforming loans | | | 1,109 | | | 279 | | | 45 | | | 43 | | | 81 |
Other real estate owned and in-substance foreclosed properties * | | | 357 | | | — | | | — | | | — | | | — |
| | |
|
| |
|
| |
|
| |
|
| |
|
|
Total nonperforming assets | | $ | 1,466 | | $ | 279 | | $ | 45 | | $ | 43 | | $ | 81 |
| | |
|
| |
|
| |
|
| |
|
| |
|
|
All loans past due 90 days or more, except consumer loans and home equity mortgage loans, are placed on nonaccrual status and any accrued interest income is reversed from current interest income. Such factors as the type and size of the loan, the quality of the collateral, and historical creditworthiness of the borrower and/or guarantors are considered by management in assessing the collectibility of such loans. Interest foregone on nonaccrual status loans was $88,000 for the year ended December 31, 2004. Interest earned and included in interest income on these loans prior to their nonperforming status amounted to $44,000 in 2004.
| * | Refer to Note 2 to the consolidated financial statements. |
The Bank maintains a Loan Review Committee (the “Committee”) that periodically reviews the status of all non-accrual, impaired loans, and loans criticized by the Bank’s regulators. An independent consultant is retained to review both the loan portfolio as well as the overall adequacy of the loan loss reserve. The methodology used to arrive at an appropriate allowance for loan loss involves a high degree of management judgment. It is the goal of this loan loss reserve adequacy process to provide a loan loss reserve sufficient to address the Bank’s risk of loan losses, in the existing loan portfolio, during various economic cycles. During the review of the loan loss reserve, the Committee considers allocations of the loan loss reserve to those specific loans reviewed by the Committee on a loan-by-loan basis. Also considered is an inherent loan loss in specific pools of similar loans, based on prior historical loss activity and the impact of the current economic environment. The sum of all analyzed loan components is compared to the loan loss reserve balance, and any adjustments deemed necessary to the loan loss reserve balance are made on a timely basis.
The Bank is a Pennsylvania banking institution subject to the jurisdiction of the Pennsylvania Department of Banking, and is a state member bank of the Federal Reserve System. The Bank is regulated and periodically examined by both those entities. There are no recommendations by the regulators, which would have a material effect on the Corporation’s or Bank’s asset quality, liquidity, capital resources, or results of operations.
Off-Balance Sheet Commitments and Contractual Cash Obligations
The Bank has financial instruments with off-balance sheet risk that are used to help our customers meet their financing needs. These instruments have elements of credit risk that exceed the amount recognized in the consolidated statements of financial condition. The commitments to extend credit totaled $277,839,000 at December 31, 2004 and $222,389,000 at December 31, 2003. Unfunded mortgage commitments totaled $3,103,000 at December 31, 2004 and $13,134,000 at December 31, 2003. Total loan commitments to extend credit were $269,036,000 at December 31, 2004 and $213,207,000 at December 31, 2003. The increase in commitments to extend credit is primarily concentrated in the commercial and home equity lines of credit secured by real estate. Standby letters of credit, which are conditional commitments issued by the Bank to a customer for a third party to support a private borrowing arrangement, were $8,803,000 and $9,182,000 as of December 31, 2004 and December 31, 2003, respectively. These commitments generally have fixed expiration dates or other termination clauses and may require payment of a fee. Please refer to Note 15 to the accompanying Consolidated Financial Statements for expanded discussion of off-balance sheet commitments.
The following chart presents the off-balance sheet commitments of the Bank as of December 31, 2004, listed by dates of funding or payment:
| | | | | | | | | | | | | | | |
| (In thousands) | | Total
| | Within 1
year
| | 2 - 3
years
| | 4 - 5
years
| | After 5
years
|
Unfunded loan commitments | | $ | 269,036 | | $ | 155,127 | | $ | 40,608 | | $ | 60,683 | | $ | 12,618 |
Standby letters of credit | | | 8,803 | | | 8,803 | | | — | | | — | | | — |
| | |
|
| |
|
| |
|
| |
|
| |
|
|
Total | | $ | 277,839 | | $ | 163,930 | | $ | 40,608 | | $ | 60,683 | | $ | 12,618 |
| | |
|
| |
|
| |
|
| |
|
| |
|
|
While unfunded loan commitments and standby letters of credit could potentially be funded within a one (1) year timeframe from date of issuance, funding of these unfunded amounts will not necessarily be required within the one (1) year timeframe and funding requirements could be partially funded by repayments of existing loan balances.
19
The Bank has entered into a number of contractual obligations to support the ongoing activities of the Bank. The following chart presents the contractual cash obligations of the Bank as of December 31, 2004, listed by dates of required payments:
| | | | | | | | | | | | | | | |
| (In thousands) | | Total
| | Within 1
year
| | 2 - 3
years
| | 4 - 5
years
| | After 5
years
|
Deposits without a stated maturity (a) | | $ | 569,795 | | $ | 569,795 | | $ | — | | $ | — | | $ | — |
Consumer CD’s (b) | | | 110,470 | | | 89,449 | | | 20,433 | | | 489 | | | 99 |
Operating leases | | | 11,516 | | | 787 | | | 1,246 | | | 1,172 | | | 8,311 |
Purchase obligations | | | 3,372 | | | 1,810 | | | 1,047 | | | 465 | | | 50 |
Non-discretionary pension contributions | | | 131 | | | 131 | | | — | | | — | | | — |
| | |
|
| |
|
| |
|
| |
|
| |
|
|
Total | | $ | 695,284 | | $ | 661,972 | | $ | 22,726 | | $ | 2,126 | | $ | 8,460 |
| | |
|
| |
|
| |
|
| |
|
| |
|
|
The Bank’s operating lease obligations represent rental payments for facilities and data processing equipment. Purchase obligations represent obligations under agreements to purchase goods and services that are enforceable and legally binding on the Bank. The purchase obligations are primarily related to contractual payments for the outsourcing of certain operational activities and informational technology. The amount of non-discretionary pension contributions for future periods cannot be readily determined. The non-discretionary pension payment included in the chart represents the required payments to participants in the Corporation’s Supplemental Employee Retirement Plan (“SERP”).
Asset and Liability Management
Through its Asset/Liability Committee (“ALCO”) and the application of its risk management policies and procedures, the Bank seeks to minimize its exposure to interest rate risk as well as to maintain sufficient liquidity and capital compliance.
Interest Rate Sensitivity
The difference between interest sensitive assets and interest sensitive deposits, stated in dollars, is referred to as the interest rate sensitivity gap. A positive gap is created when interest rate sensitive assets exceed interest rate sensitive deposits. A positive interest rate sensitive gap will result in a greater portion of assets compared to deposits repricing with changes in interest rates within specified time periods. The opposite effect results from a negative gap. In practice, however, there may be a lag in repricing some products in comparison to others. A positive gap in the short-term, 30 days or less, in a rising interest rate environment should produce an increase in net interest income. The converse is true of a negative gap in a rising interest rate environment.
As shown in the following table, the Bank is presently asset interest rate sensitive in the short-term, 30 days or less category.
TABLE 16 - Interest Rate Sensitivity Analysis as of December 31, 2004
| | | | | | | | | | | | | | | | | | | | | | | | | | | |
| | | Repricing Periods
|
| (dollars in thousands) | | 0 to 30
Days
| | | 31 to 90
Days
| | | 91 to 180
Days
| | | 181 to 365
Days
| | | Over 1
Year
| | | Non-Rate
Sensitive
| | | Total
|
Assets: | | | | | | | | | | | | | | | | | | | | | | | | | | | |
Interest-bearing deposits with other banks | | $ | 15,293 | | | $ | — | | | $ | — | | | $ | — | | | $ | — | | | $ | — | | | $ | 15,293 |
Federal funds sold | | | 13,423 | | | | — | | | | — | | | | — | | | | — | | | | — | | | | 13,423 |
Investment securities | | | 3,053 | | | | 3,012 | | | | 3,466 | | | | 7,047 | | | | 18,846 | | | | 17 | | | | 35,441 |
Loans | | | 299,666 | | | | 11,465 | | | | 12,614 | | | | 17,363 | | | | 223,489 | �� | | | (6,927 | ) | | | 557,670 |
Cash and due from banks | | | — | | | | — | | | | — | | | | — | | | | — | | | | 26,526 | | | | 26,526 |
Other assets | | | — | | | | — | | | | — | | | | — | | | | — | | | | 34,593 | | | | 34,593 |
| | |
|
|
| |
|
|
| |
|
|
| |
|
|
| |
|
|
| |
|
|
| |
|
|
Total assets | | $ | 331,435 | | | $ | 14,477 | | | $ | 16,081 | | | $ | 24,410 | | | $ | 242,334 | | | $ | 54,209 | | | $ | 682,946 |
| | |
|
|
| |
|
|
| |
|
|
| |
|
|
| |
|
|
| |
|
|
| |
|
|
Liabilities and shareholders’ equity: | | | | | | | | | | | | | | | | | | | | | | | | | | | |
Demand, noninterest-bearing | | $ | 30,486 | | | $ | — | | | $ | — | | | $ | — | | | $ | — | | | $ | 116,750 | | | $ | 147,236 |
Savings deposits | | | 18,847 | | | | 37,692 | | | | 15,911 | | | | 31,821 | | | | 238,988 | | | | | | | | 343,259 |
Time deposits | | | 19,591 | | | | 23,782 | | | | 15,528 | | | | 30,548 | | | | 21,021 | | | | | | | | 110,470 |
Other liabilities | | | 26 | | | | — | | | | — | | | | | | | | — | | | | 10,717 | | | | 10,743 |
Shareholders’ equity | | | — | | | | — | | | | — | | | | — | | | | — | | | | 71,238 | | | | 71,238 |
| | |
|
|
| |
|
|
| |
|
|
| |
|
|
| |
|
|
| |
|
|
| |
|
|
Total liabilities and shareholders’ equity | | $ | 68,950 | | | $ | 61,474 | | | $ | 31,439 | | | $ | 62,369 | | | $ | 260,009 | | | $ | 198,705 | | | $ | 682,946 |
| | |
|
|
| |
|
|
| |
|
|
| |
|
|
| |
|
|
| |
|
|
| |
|
|
Gap | | | 262,485 | | | | (46,997 | ) | | | (15,358 | ) | | | (37,959 | ) | | | (17,675 | ) | | | (144,496 | ) | | | — |
Cumulative gap | | | 262,485 | | | | 215,488 | | | | 200,130 | | | | 162,171 | | | | 144,496 | | | | — | | | | — |
Cumulative earning assets as a ratio of interest bearing liabilities | | | 862 | % | | | 346 | % | | | 276 | % | | | 199 | % | | | 139 | % | | | 151 | % | | | — |
20
The Corporation measures its interest rate risk as it effects its market value of portfolio equity using a discounted cash flow analysis to determine the net present value (“NPV”) of its net assets (assets minus liabilities). NPV is calculated based on the net present value of estimated cash flows utilizing various assumptions. The Corporation’s interest rate risk is measured as the change to its NPV as a result of a hypothetical immediate 100 and 200 basis point change in market interest rates. Based on this analysis at December 31, 2004 the Corporation would experience a 64 basis point decrease in its NPV as a percent of assets if interest rates decrease by 100 basis points in comparison to a flat rate scenario. Due to the abnormally low interest rate environment, decreases of 200 basis points have been omitted.
| | | | | | | | | | | | | |
| Changes in Market Interest Rates Basis Points | | Market Value of Portfolio Equity
| |
| | $ Amount
| | $ Change
| | | % Change
| | | NPV Ratio(a)
| |
+200 | | $ | 63,883 | | $ | 1,068 | | | 1.70 | % | | 9.67 | % |
+100 | | | 63,889 | | | 1,074 | | | 1.71 | % | | 12.53 | % |
0 | | | 62,815 | | | — | | | — | | | — | |
-100 | | | 59,182 | | | (3,633 | ) | | (5.78 | )% | | 8.62 | % |
| (a) | Calculated as the estimated NPV divided by the present value of total assets. |
The Bank uses income simulation models to measure its interest rate risk and to manage its interest rate sensitivity. The simulation models consider not only the impact of changes in interest rates on forecasted net interest income, but also such factors as yield curve relationships, loan prepayments, and deposit withdrawals. As of year-end 2004, based on an analysis of the results from the simulation models, the Bank’s interest rate risk was within the acceptable range as established by the Bank’s Asset/Liability Policy.
While future interest rate movements and their effect on Bank revenue cannot be predicted, there are no trends, events, or uncertainties of which the Corporation’s management is currently aware that will have, or are reasonably likely to have, a material effect on the Corporation’s liquidity, capital resources, or results of operations in the future. In future periods, should interest rates begin to rise, the Corporation would benefit from its asset interest rate sensitivity, increasing its net interest margins, while continuing to decrease its revenues obtained from residential refinancing.
Liquidity
The Bank’s liquidity is maintained by managing its core deposits, purchasing federal funds, selling loans to the secondary market, and borrowing from the FHLB.
The Bank’s liquid assets include cash and cash equivalents as well as certain unpledged investment securities. Bank management has developed a liquidity measure, incorporating its ability to borrow from the FHLB to meet liquidity needs and goals. Monthly, ALCO reviews the Bank’s liquidity needs, incorporating the ability to borrow from the FHLB and reports these findings to the Risk Management Committee of the Bank’s Board of Directors.
As presented in the Consolidated Statement of Cash Flows on page 28 of this Report, during 2004, cash provided by operations amounted to $9,311,000. This was a $26,672,000 decrease from $35,983,000 of income from continuing operations in 2003. This decrease was due primarily to a $30,960,000 net decrease in proceeds from loan sales, net of loans originated for sale from $35,025,000 in 2003 to $4,065,000 in 2004. Gains on the sale of loans also provided $4,065,000 in positive cash flow from operations.
Cash used for investing activities amounted to $68,756,000. Investment activity used $4,217,000 in cash, as the balance in the investment portfolio increased by 13% at December 31, 2004, compared to December 31, 2003. The net funding of loans used $63,258,000 in funding. The cost of premises improvements and the purchase of equipment used $1,716,000 and the pay downs of the notes receivable from PFO, associated with the Asset Sale, increased cash flows by $435,000.
Offsetting the decrease in funds from investing activities was an increase in funds from the Bank’s financing activities, which provided $68,392,000 in net cash, primarily the result of a $73,826,000 increase in deposits. The Corporation received $597,000 in proceeds from the issuance of common stock, related to stock option exercises and used $2,574,000 to repurchase common stock, pursuant to the Stock Repurchase Program and $3,446,000 to pay dividends in 2004. The Corporation’s cash and cash equivalents increased from December 31, 2003, to December 31, 2004, by $8,947,000, from $46,295,000 at December 31, 2003 to $55,242,000 at December 31, 2004.
QUANTITATIVEAND QUALITATIVE DISCLOSURESABOUT MARKET RISK
The Quantitative and Qualitative Disclosures About Market Risk are included in the Management Discussion and Analysis under the headings of Off-Balance Sheet Commitments and Contractual Cash Obligations, Asset and Liability Management, Interest Rate Sensitivity and Liquidity.
Developments for 2005
Effective February 1, 2005, the Bank started a subsidiary, BMT Mortgage Services, Inc. (“BMTMS”) to enter into an agreement with MIGC Financial LLC and MIGC Financial Agent Investment LLC, d/b/a Keller Williams, Main Line Realty (“K/W”), to form Bryn Mawr Mortgage Company, LLC (the “LLC”), a limited liability company, whereby K/W will refer their clients to the LLC. Mortgage loan applications taken by the LLC will be submitted to BMT Mortgage Company, a division of the Bank. Fees and gains on the sale of loans generated under this agreement will be credited to the LLC. Both BMTMS and K/W will share in the net profits or losses of the LLC.
21
The Bank anticipates opening its next branch, located in Exton, Pennsylvania, during the first quarter of 2005. This branch will service the western area of the Main Line and parts of Chester County.
2003VS. 2002 RESULTSOF OPERATIONS
Income from continuing operations
Income from continuing operations was $11,272,000 in 2003 a 6% increase over $10,642,000 reported for 2002. Basic earnings per share for 2003 were $1.30, a 7% increase over $1.22, reported for 2002. Diluted earnings per share for 2003 were $1.28, a 7% increase over $1.20 reported for 2002.
Loss from discontinued operations
The Corporation reported a loss from discontinued operations of ($1,916,000) for 2003, compared to a loss of ($435,000) in 2002. During 2003, Corporation management determined that JWR & Co. was not meeting its strategic goals and, therefore, it was in the best interest of the Corporation to sell JWR & Co. As a result of the Corporation’s decision to sell JWR & Co.’s assets, the revenues and expenses of JWR & Co., the related write-down of goodwill and other related disposal expenses were classified as losses from discontinued operations in 2003. The primary reason for the loss in 2002 was the write-down of $400,000 in goodwill in 2002, related to JWR & Co. Both basic and diluted earnings per share from discontinued operations amounted to ($0.22) in 2003, compared to ($0.05) in 2002.
Net Income
Net income for the year ended December 31, 2003, was $9,356,000, an 8% decrease from net income of $10,207,000 for the year ended December 31, 2002. Basic earnings per share decreased 8% from $1.17 in 2002 to $1.08 in 2003. Diluted earnings per share decreased 8% from $1.15 for 2002 compared to $1.06 in 2003. In 2002, the Corporation paid dividends of $0.38 per share. In 2003, the Corporation paid dividends of $0.40 per share.
Return on average assets was 2.01% for 2002 compared to 1.98% in 2003. Return on average equity was 17.26% in 2002 versus 17.76% in 2003.
Net Interest Income
Average earning assets grew 13%, primarily in higher yielding average loans, which also grew by 13%. The growth in higher yielding earning assets was offset by an 80 basis point decline in the average yield on earning assets during 2003, which was primarily responsible for a $151,000 or 1% decrease in interest income.
Average outstanding deposits, short-term borrowing and federal funds purchased also increased by 13%, with non-interest bearing checking accounts growing by 15%, while other savings deposits increased by 19%. Average outstanding CDs increased by 22%, while average short-term borrowings decreased by 98%, reflecting the large increases in average deposits during 2003, compared to 2002. The cost of funds for the Bank averaged .9% for 2003 compared to 1.0% for 2002, a 10 basis point decrease.
Net interest income increased by $3,000 from 2002 to 2003, and the net interest margin decreased from 5.34% for 2002 to 4.70% for 2003.
Loan Loss Provision
The provision for loan losses amounted to $750,000 for 2003 compared to $1,000,000 in 2002. The ratio of the allowance for loan losses to total outstanding loans was 1.33% and 1.31% at December 31, 2003 and 2002, respectively.
Other Income
Other income increased $2,678,000 or 11% in 2003 from 2002 levels. The largest increases occurred in three specific categories. Net gains on the sale of loans were up $997,000 or 10% from $9,653,000 at December 31, 2002, compared to $10,650,000 as of December 31, 2003, reflecting the results of a 13% increase in the sale or residential mortgage loans in 2003, compared to 2002. Fees for investment management and trust services were up $864,000 or 10% from $8,620,000 for 2002 to $9,484,000 for 2003, due primarily to a 13% increase in the market value of assets managed in the Wealth Management business segment. Other fees and service charges grew by $673,000 or 39% from $1,747,000 for 2002, compared to $2,420,000 for 2003, reflecting the increase in residential mortgage loan sale activity in 2003, compared to 2002.
Other Expenses
Other expenses increased by $1,795,000 or 6%, from $31,642,000 for 2002 to $33,437,000 for 2003. Regular salaries increased $889,000 or 7%, from $12,707,000 for 2002 to $13,596,000 for 2003. Salaries-other, primarily incentive based, decreased $1,540,000 or 52%, from $2,978,000 for 2002 to $1,438,000 for 2003. The decrease was directly related to lower incentive-based compensation, which is directly related to corporate profitability.
Employee benefits cost increased by $1,058,000 or 32% from $3,295,000 for 2002 to $4,353,000 for 2003. Of this increase, $802,000 relates to increases in the cost of the Corporation’s pension plan, due primarily to reductions in the value of plan assets, as well as the lower projected returns on plan assets.
Advertising expenses decreased $391,000 or 37%, from $1,065,000 for 2002 to $674,000 for 2003, reflecting decreases in the Corporation’s advertising campaign in 2003, compared to 2002.
The amortization of MSRs increased $1,197,000 or 74% from 2002 to 2003. This increase is associated with the increase in the residential refinancing activity in 2003, compared to 2002, discussed in the Mortgage Banking segment.
Other operating expenses increased $587,000 or 14% from 2002 to 2003. Increased residential mortgage loan sale activity
22
in 2003 also generated increased related expenses, such as appraisal fees and loan pair off fees. Other operating expenses associated with the increased residential mortgage lending activity increased by $769,000. Included in other operating expense in 2003 was a $250,000 elimination of a prior accrual for potential litigation that was deemed unnecessary as of December 31, 2003. Exclusive of the increased residential mortgage lending related expenses in 2003 and the elimination of the $250,000 accrual reversal, other operating expenses increased by $142,000 or 3% in 2003, compared to 2002.
Income Taxes
The income tax provision for 2003 was $6,049,000, or a 34.4% effective rate, compared to $5,543,000, or a 34.2% effective rate, for 2002.
Management’s Report on Internal Control over Financial Reporting
Corporation management is responsible for both establishing and maintaining adequate internal control over financial reporting. As of December 31, 2004, management conducted an assessment of the effectiveness of the Corporation’s internal control over financial reporting and concluded that such internal control is effective and found no material weaknesses. The assessment was accomplished using the criteria set forth by the Committee of Sponsoring Organizations of the Treadway Commission (“COSO”) in Internal Control – Integrated Framework. Management has concluded that, as of December 31, 2004, the Corporation’s internal control over financial reporting is effective, based on the COSO criteria.
Management’s assessment of the effectiveness of the Corporation’s internal control over financial reporting as of December 31, 2004 has been audited by KPMG LLP, the Corporation’s independent registered public accounting firm, having responsibility for auditing the Corporation’s financial statements (“KPMG”). KPMG has expressed unqualified opinions on management’s assessment and on the effectiveness of the Corporation’s internal control over financial reporting as of December 31, 2004 and has issued an attestation report on the Corporation’s management’s assessment of the Corporation’s internal control over financial reporting as of December 31, 2004.
23
Report of Independent Registered Public Accounting Firm
The Board of Directors and Shareholders Bryn Mawr Bank Corporation:
We have audited management’s assessment, included in the accompanying Management’s Report on Internal Control Over Financial Reporting appearing under Item 9A,that Bryn Mawr Bank Corporation and subsidiaries (the “Company”) maintained effective internal control over financial reporting as of December 31, 2004, based on criteria established in Internal Control – Integrated Framework issued by the Committee of Sponsoring Organizations of the Treadway Commission (COSO). Company management is responsible for maintaining effective internal control over financial reporting and for its assessment of the effectiveness of internal control over financial reporting. Our responsibility is to express an opinion on management’s assessment and an opinion on the effectiveness of the Company’s internal control over financial reporting based on our audit.
We conducted our audit in accordance with the standards of the Public Company Accounting Oversight Board (United States). Those standards require that we plan and perform the audit to obtain reasonable assurance about whether effective internal control over financial reporting was maintained in all material respects. Our audit included obtaining an understanding of internal control over financial reporting, evaluating management’s assessment, testing and evaluating the design and operating effectiveness of internal control, and performing such other procedures as we considered necessary in the circumstances. We believe that our audit provides a reasonable basis for our opinion.
A company’s internal control over financial reporting is a process designed to provide reasonable assurance regarding the reliability of financial reporting and the preparation of financial statements for external purposes in accordance with generally accepted accounting principles. A company’s internal control over financial reporting includes those policies and procedures that (1) pertain to the maintenance of records that, in reasonable detail, accurately and fairly reflect the transactions and dispositions of the assets of the company; (2) provide reasonable assurance that transactions are recorded as necessary to permit preparation of financial statements in accordance with generally accepted accounting principles, and that receipts and expenditures of the company are being made only in accordance with authorizations of management and directors of the company; and (3) provide reasonable assurance regarding prevention or timely detection of unauthorized acquisition, use, or disposition of the company’s assets that could have a material effect on the financial statements.
Because of its inherent limitations, internal control over financial reporting may not prevent or detect misstatements. Also, projections of any evaluation of effectiveness to future periods are subject to the risk that controls may become inadequate because of changes in conditions, or that the degree of compliance with the policies or procedures may deteriorate.
In our opinion, management’s assessment that the Company maintained effective internal control over financial reporting as of December 31, 2004, is fairly stated, in all material respects, based on criteria established in Internal Control – Integrated Framework issued by the Committee of Sponsoring Organizations of the Treadway Commission (COSO). Also, in our opinion, the Company maintained, in all material respects, effective internal control over financial reporting as of December 31, 2004, based on criteria established in Internal Control – Integrated Framework issued by the Committee of Sponsoring Organizations of the Treadway Commission (COSO).
We also have audited, in accordance with the standards of the Public Company Accounting Oversight Board (United States), the consolidated balance sheet of Bryn Mawr Bank Corporation and subsidiaries as of December 31, 2004, and the related consolidated statements of income, shareholders’ equity, comprehensive income and cash flows for the year ended December 31, 2004, and our report dated March 2, 2005 expressed an unqualified opinion on those consolidated financial statements. The accompanying consolidated financial statements of the Company as of December 31, 2003 and for the years ended December 31, 2003 and 2002, were audited by other auditors whose report thereon dated February 27, 2004, expressed an unqualified opinion on those statements.
KPMG LLP
Philadelphia, Pennsylvania
March 2, 2005
24
Report of Independent Registered Public Accounting Firm
The Board of Directors Bryn Mawr Bank Corporation:
We have audited the accompanying consolidated balance sheet of Bryn Mawr Bank Corporation and subsidiaries (the “Company”) as of December 31, 2004, and the related consolidated statements of income, changes in shareholders’ equity, comprehensive income, and cash flows for the year then ended. These consolidated financial statements are the responsibility of the Company’s management. Our responsibility is to express an opinion on these consolidated financial statements based on our audit. The accompanying consolidated financial statements of the Company as of December 31, 2003 and for the years ended December 31, 2003 and 2002, were audited by other auditors whose report thereon dated February 27, 2004, expressed an unqualified opinion on those statements.
We conducted our audit in accordance with the auditing standards of the Public Company Accounting Oversight Board (United States). Those standards require that we plan and perform the audit to obtain reasonable assurance about whether the financial statements are free of material misstatement. An audit includes examining, on a test basis, evidence supporting the amounts and disclosures in the financial statements. An audit also includes assessing the accounting principles used and significant estimates made by management, as well as evaluating the overall financial statement presentation. We believe that our audit provides a reasonable basis for our opinion.
In our opinion, the consolidated financial statements referred to above present fairly, in all material respects, the financial position of the Company as of December 31, 2004, and the results of their operations and their cash flows for the year then ended in conformity with accounting principles generally accepted in the United States of America.
We also have audited, in accordance with the standards of the Public Company Accounting Oversight Board (United States), the effectiveness of the Company’s internal control over financial reporting as of December 31, 2004, based on criteria established in Internal Control – Integrated Framework issued by the Committee of Sponsoring Organizations of the Treadway Commission (COSO), and our report dated March 2, 2005 expressed an unqualified opinion on management’s assessment of, and the effective operation of, internal control over financial reporting.
KPMG LLP
March 2, 2005
Philadelphia, Pennsylvania
25
Consolidated Balance Sheets
| | | | | | | | |
| | | 2004
| | | 2003*
| |
| As of December 31, | | (In thousands) | |
Assets | | | | | | | | |
Cash and due from banks | | $ | 26,526 | | | $ | 32,471 | |
Interest-bearing deposits with other banks | | | 15,293 | | | | 10,524 | |
Federal funds sold | | | 13,423 | | | | 3,300 | |
Investment securities available for sale, at market value (amortized cost of $35,654 and $31,411 at December 31, 2004 and 2003, respectively) | | | 35,441 | | | | 31,397 | |
Portfolio loans | | | 555,889 | | | | 498,725 | |
Loans held for sale, at fair market value | | | 8,708 | | | | 3,691 | |
Less: Allowance for loan losses | | | (6,927 | ) | | | (6,670 | ) |
| | |
|
|
| |
|
|
|
Net loans | | | 557,670 | | | | 495,746 | |
| | |
|
|
| |
|
|
|
Premises and equipment, net | | | 14,162 | | | | 13,756 | |
Accrued interest receivable | | | 2,579 | | | | 2,274 | |
Mortgage servicing rights | | | 3,172 | | | | 4,391 | |
Other assets | | | 14,680 | | | | 10,989 | |
| | |
|
|
| |
|
|
|
Total assets | | $ | 682,946 | | | $ | 604,848 | |
| | |
|
|
| |
|
|
|
Liabilities | | | | | | | | |
Deposits: | | | | | | | | |
Demand, noninterest-bearing | | $ | 147,236 | | | $ | 144,579 | |
Savings | | | 343,259 | | | | 285,369 | |
Time | | | 110,470 | | | | 97,191 | |
| | |
|
|
| |
|
|
|
Total deposits | | | 600,965 | | | | 527,139 | |
| | |
|
|
| |
|
|
|
Other liabilities | | | 10,743 | | | | 10,327 | |
| | |
|
|
| |
|
|
|
Total liabilities | | | 611,708 | | | | 537,466 | |
| | |
|
|
| |
|
|
|
Commitments and contingencies (Note 15) | | | | | | | | |
Shareholders’ equity | | | | | | | | |
Common stock, par value $1, authorized, 25,000,000 shares, issued 11,172,582 shares and 11,135,232 shares as of December 31, 2004 and 2003, respectively, and outstanding 8,597,958 shares and 8,670,974 shares as of December 31, 2004 and 2003, respectively | | | 11,172 | | | | 11,135 | |
Paid-in capital in excess of par value | | | 7,112 | | | | 6,487 | |
Accumulated other comprehensive (loss) income, net of deferred income taxes | | | (288 | ) | | | (126 | ) |
Retained earnings | | | 75,179 | | | | 69,280 | |
| | |
|
|
| |
|
|
|
| | | | 93,175 | | | | 86,776 | |
| | |
|
|
| |
|
|
|
Less: Common stock in treasury, at cost — 2,574,624 and 2,464,258 shares at December 31, 2004 and 2003, respectively | | | (21,937 | ) | | | (19,394 | ) |
Total shareholders’ equity | | | 71,238 | | | | 67,382 | |
| | |
|
|
| |
|
|
|
Total liabilities and shareholders’ equity | | $ | 682,946 | | | $ | 604,848 | |
| | |
|
|
| |
|
|
|
| * | Reclassified for comparative purposes. |
The accompanying notes are an integral part of the consolidated financial statements.
26
Consolidated Statements of Income
| | | | | | | | | | | |
| | | 2004
| | 2003*
| | | 2002*
| |
| For the years ended December 31, | | (in thousands, except per share data) | |
Net interest income: | | | | | | | | | | | |
Interest income: | | | | | | | | | | | |
Interest and fees on loans | | $ | 30,123 | | $ | 28,248 | | | $ | 28,129 | |
Interest on federal funds sold | | | 191 | | | 110 | | | | 112 | |
Interest on deposits with other banks | | | 48 | | | 37 | | | | 54 | |
Interest and dividends on investment securities: | | | | | | | | | | | |
Taxable interest income | | | 820 | | | 747 | | | | 1,013 | |
Tax-exempt interest income | | | 165 | | | 86 | | | | 39 | |
Dividend income | | | 34 | | | 33 | | | | 65 | |
| | |
|
| |
|
|
| |
|
|
|
Total interest income | | | 31,381 | | | 29,261 | | | | 29,412 | |
| | | |
Interest expense on deposits | | | 4,543 | | | 4,322 | | | | 4,065 | |
Interest expense on federal funds purchased | | | 9 | | | 1 | | | | 33 | |
Interest expense on other borrowings | | | 1 | | | 7 | | | | 386 | |
| | |
|
| |
|
|
| |
|
|
|
Total interest expense | | | 4,553 | | | 4,330 | | | | 4,484 | |
| | |
|
| |
|
|
| |
|
|
|
Net interest income | | | 26,828 | | | 24,931 | | | | 24,928 | |
Loan loss provision | | | 900 | | | 750 | | | | 1,000 | |
| | |
|
| |
|
|
| |
|
|
|
Net interest income after loan loss provision | | | 25,928 | | | 24,181 | | | | 23,928 | |
| | |
|
| |
|
|
| |
|
|
|
Other income: | | | | | | | | | | | |
Fees for investment management and trust services | | | 10,087 | | | 9,484 | | | | 8,620 | |
Service charges on deposit accounts | | | 1,827 | | | 1,896 | | | | 1,822 | |
Other fees and service charges | | | 1,879 | | | 2,420 | | | | 1,747 | |
Net gain on sale of loans | | | 2,920 | | | 10,650 | | | | 9,653 | |
Net gain on sale of mortgage servicing rights | | | 1,145 | | | — | | | | — | |
Investment advisory and brokerage fees | | | 216 | | | 248 | | | | 216 | |
Insurance commission income | | | 299 | | | 268 | | | | 275 | |
Other operating income | | | 1,421 | | | 1,611 | | | | 1,566 | |
| | |
|
| |
|
|
| |
|
|
|
Total other income | | | 19,794 | | | 26,577 | | | | 23,899 | |
| | |
|
| |
|
|
| |
|
|
|
Other expenses: | | | | | | | | | | | |
Salaries-regular | | | 13,567 | | | 13,596 | | | | 12,707 | |
Salaries-other | | | 1,446 | | | 1,438 | | | | 2,978 | |
Employee benefits | | | 4,297 | | | 4,353 | | | | 3,295 | |
Occupancy expense | | | 2,161 | | | 1,961 | | | | 1,942 | |
Furniture, fixtures, and equipment | | | 1,785 | | | 1,806 | | | | 1,819 | |
Advertising | | | 879 | | | 674 | | | | 1,065 | |
Professional fees | | | 1,799 | | | 937 | | | | 990 | |
Computer processing | | | 587 | | | 607 | | | | 595 | |
Stationery and supplies | | | 282 | | | 316 | | | | 309 | |
Insurance | | | 151 | | | 156 | | | | 133 | |
Amortization of MSRs | | | 839 | | | 2,814 | | | | 1,617 | |
Other operating expenses | | | 3,832 | | | 4,779 | | | | 4,192 | |
| | |
|
| |
|
|
| |
|
|
|
Total other expenses | | | 31,625 | | | 33,437 | | | | 31,642 | |
| | |
|
| |
|
|
| |
|
|
|
Income before income taxes and discontinued operations | | | 14,097 | | | 17,321 | | | | 16,185 | |
Applicable income taxes: | | | | | | | | | | | |
Federal | | | 4,741 | | | 6,005 | | | | 5,500 | |
State | | | 11 | | | 44 | | | | 43 | |
| | |
|
| |
|
|
| |
|
|
|
Income from continuing operations | | | 9,345 | | | 11,272 | | | | 10,642 | |
Loss from discontinued operations, net of income tax benefit of $ - , ( $200,000) and ($ 18,000) | | | — | | | (1,916 | ) | | | (435 | ) |
| | |
|
| |
|
|
| |
|
|
|
Net income | | $ | 9,345 | | $ | 9,356 | | | $ | 10,207 | |
| | |
|
| |
|
|
| |
|
|
|
Basic earnings per common share: | | | | | | | | | | | |
Income from continuing operations | | $ | 1.09 | | $ | 1.30 | | | $ | 1.22 | |
Loss from discontinued operations | | $ | 0.00 | | $ | (0.22 | ) | | $ | (0.05 | ) |
| | |
|
| |
|
|
| |
|
|
|
Total basic earnings per common share | | $ | 1.09 | | $ | 1.08 | | | $ | 1.17 | |
| | |
|
| |
|
|
| |
|
|
|
Diluted earnings per common share: | | | | | | | | | | | |
Income from continuing operations | | $ | 1.06 | | $ | 1.28 | | | $ | 1.20 | |
Loss from discontinued operations | | $ | 0.00 | | $ | (0.22 | ) | | $ | (0.05 | ) |
| | |
|
| |
|
|
| |
|
|
|
Total diluted earnings per common share | | $ | 1.06 | | $ | 1.06 | | | $ | 1.15 | |
| | |
|
| �� |
|
|
| |
|
|
|
Dividends per share | | $ | 0.40 | | $ | 0.40 | | | $ | 0.38 | |
Weighted-average shares outstanding | | | 8,610,171 | | | 8,657,527 | | | | 8,706,390 | |
Dilutive potential common shares | | | 170,545 | | | 158,543 | | | | 130,020 | |
| | |
|
| |
|
|
| |
|
|
|
Adjusted weighted-average shares | | | 8,780,716 | | | 8,816,070 | | | | 8,836,410 | |
| * | Reclassified for comparative purposes. |
The accompanying notes are an integral part of the consolidated financial statements.
27
Consolidated Statements of Cash Flows
| | | | | | | | | | | | |
| For the years ended December 31, | | 2004
| | | 2003
| | | 2002
| |
| | | (in thousands) | |
Operating activities: | | | | | | | | | | | | |
Income from continuing operations | | $ | 9,345 | | | $ | 11,272 | | | $ | 10,642 | |
Adjustments to reconcile income from continuing operations | | | | | | | | | | | | |
net cash provided by operating activities: | | | | | | | | | | | | |
Provision for loan losses | | | 900 | | | | 750 | | | | 1,000 | |
Provision for depreciation and amortization | | | 1,310 | | | | 1,290 | | | | 1,477 | |
Loans originated for resale | | | (144,916 | ) | | | (603,678 | ) | | | (566,757 | ) |
Proceeds from sale of loans | | | 148,981 | | | | 638,703 | | | | 560,576 | |
Net gain on sale of loans | | | (2,920 | ) | | | (10,650 | ) | | | (9,653 | ) |
Net gain on sale of mortgage servicing rights | | | (1,145 | ) | | | — | | | | — | |
Provision for deferred income taxes | | | 38 | | | | 811 | | | | (349 | ) |
Change in income taxes payable/refundable | | | (511 | ) | | | (1,189 | ) | | | 2,629 | |
Change in accrued interest receivable | | | (305 | ) | | | (156 | ) | | | 104 | |
Change in accrued interest payable | | | 550 | | | | 889 | | | | (378 | ) |
Change in mortgage servicing rights | | | 1,219 | | | | (435 | ) | | | (1,750 | ) |
Other | | | (3,235 | ) | | | (1,624 | ) | | | 404 | |
| | |
|
|
| |
|
|
| |
|
|
|
Net cash provided (used) by operating activities | | | 9,311 | | | | 35,983 | | | | (2,055 | ) |
| | |
|
|
| |
|
|
| |
|
|
|
Investing activities: | | | | | | | | | | | | |
Purchases of investment securities | | | (17,568 | ) | | | (31,984 | ) | | | (14,431 | ) |
Proceeds from maturities of investment securities | | | — | | | | 1,000 | | | | 3,004 | |
Proceeds from sales of investment securities available for sale | | | 204 | | | | 1,039 | | | | 336 | |
Proceeds from calls of investment securities | | | 13,147 | | | | 20,440 | | | | 15,000 | |
Net repayments (originations) of notes receivable | | | 435 | | | | (1,603 | ) | | | — | |
Net loan originations | | | (63,258 | ) | | | (59,815 | ) | | | (49,677 | ) |
Purchase of automobile retail installment contracts | | | — | | | | — | | | | (211 | ) |
Purchases of premises and equipment. | | | (1,716 | ) | | | (2,963 | ) | | | (1,034 | ) |
| | |
|
|
| |
|
|
| |
|
|
|
Net cash used in investing activities | | | (68,756 | ) | | | (73,886 | ) | | | (47,013 | ) |
| | |
|
|
| |
|
|
| |
|
|
|
Financing activities: | | | | | | | | | | | | |
Change in demand and savings deposits | | | 60,547 | | | | 42,197 | | | | 72,334 | |
Change in time deposits | | | 13,279 | | | | 1,322 | | | | 20,226 | |
Dividends paid | | | (3,446 | ) | | | (3,465 | ) | | | (3,317 | ) |
Repayment of mortgage debt | | | — | | | | (513 | ) | | | (46 | ) |
Proceeds from issuance of common stock | | | 597 | | | | 838 | | | | 3,181 | |
Change in borrowed funds | | | — | | | | (20,000 | ) | | | — | |
Purchase of treasury stock | | | (2,585 | ) | | | (1,787 | ) | | | (6,135 | ) |
| | |
|
|
| |
|
|
| |
|
|
|
Net cash provided by financing activities | | | 68,392 | | | | 18,592 | | | | 86,243 | |
| | |
|
|
| |
|
|
| |
|
|
|
Net cash provided (used) by continued operations | | | 8,947 | | | | (19,311 | ) | | | 37,175 | |
| | | |
Net cash used by discontinued operations | | | — | | | | (195 | ) | | | (47 | ) |
| | | |
Change in cash and cash equivalents | | | 8,947 | | | | (19,506 | ) | | | 37,128 | |
Cash and cash equivalents at beginning of year | | | 46,295 | | | | 65,801 | | | | 28,673 | |
| | |
|
|
| |
|
|
| |
|
|
|
Cash and cash equivalents at end of year | | $ | 55,242 | | | $ | 46,295 | | | $ | 65,801 | |
| | |
|
|
| |
|
|
| |
|
|
|
Supplemental cash flow information: | | | | | | | | | | | | |
Cash paid during the year for: | | | | | | | | | | | | |
Income taxes | | $ | 5,476 | | | $ | 6,595 | | | $ | 3,250 | |
Interest | | | 4,003 | | | | 3,454 | | | | 5,025 | |
Non-cash transactions during the year: | | | | | | | | | | | | |
From discontinued operations-Charge-off of goodwill | | | — | | | | 1,105 | | | | 400 | |
The accompanying notes are an integral part of the consolidated financial statements.
28
Consolidated Statements of Changes in Shareholders’ Equity
| | | | | | | | | | | | | | | | | | | | | | | |
| | | Shares of
Common
Stock Issued
| | | Common
Stock
| | | Paid-in
Capital
| | | Retained
Earnings
| | | Accumulated
Other
Comprehensive
Income (Loss)
| | | Treasury
Stock
| |
| For the years ended December 31, 2004, 2003 and 2002 | | (in thousands, except for shares of common stock) | |
Balance, December 31, 2001 | | 5,329,675 | | | $ | 5,330 | | | $ | 6,676 | | | $ | 56,499 | | | $ | 274 | | | $ | (11,472 | ) |
Net income | | | | | | | | | | | | | | 10,207 | | | | | | | | | |
Dividends declared, $ 0.76 per share | | | | | | | | | | | | | | (3,317 | ) | | | | | | | | |
Accumulated other comprehensive (loss) income, net of income taxes of ($119,000) | | | | | | | | | | | | | | | | | | (233 | ) | | | | |
Tax benefit from gains on stock option exercise | | | | | | | | | | 1,597 | | | | | | | | | | | | | |
Purchase of treasury stock | | | | | | | | | | | | | | | | | | | | | | (6,183 | ) |
Retirement of treasury stock | | (2,456 | ) | | | (2 | ) | | | (45 | ) | | | | | | | 48 | | | | | |
Common stock issued | | 213,889 | | | | 213 | | | | 3,015 | | | | | | | | | | | | | |
| | |
|
| |
|
|
| |
|
|
| |
|
|
| |
|
|
| |
|
|
|
Balance, December 31, 2002 | | 5,541,108 | | | $ | 5,541 | | | $ | 11,243 | | | $ | 63,389 | | | $ | 41 | | | $ | (17,607 | ) |
Net income | | | | | | | | | | | | | | 9,356 | | | | | | | | | |
Dividends declared, $ 0.40 per share | | | | | | | | | | | | | | (3,465 | ) | | | | | | | | |
Accumulated other comprehensive (loss) income, net of income taxes of ($90,000) | | | | | | | | | | | | | | | | | | (167 | ) | | | | |
2-for-1 stock split | | 5,563,816 | | | | 5,564 | | | | (5,564 | ) | | | | | | | | | | | | |
Tax benefit from gains on stock option exercise | | | | | | | | | | 168 | | | | | | | | | | | | | |
Purchase of treasury stock | | | | | | | | | | | | | | | | | | | | | | (1,826 | ) |
Retirement of treasury stock | | (2,005 | ) | | | (2 | ) | | | (37 | ) | | | | | | | | | | | 39 | |
Common stock issued | | 32,313 | | | | 32 | | | | 677 | | | | | | | | | | | | | |
| | |
|
| |
|
|
| |
|
|
| |
|
|
| |
|
|
| |
|
|
|
Balance, December 31, 2003 | | 11,135,232 | | | $ | 11,135 | | | $ | 6,487 | | | $ | 69,280 | | | $ | (126 | ) | | $ | (19,394 | ) |
Net income | | | | | | | | | | | | | | 9,345 | | | | | | | | | |
Dividends declared, $ 0.40 per share | | | | | | | | | | | | | | (3,446 | ) | | | | | | | | |
Accumulated other comprehensive (loss) income, net of income taxes of ($88,000) | | | | | | | | | | | | | | | | | | (162 | ) | | | | |
Tax benefit from gains on stock option exercise | | | | | | | | | | 107 | | | | | | | | | | | | | |
Purchase of treasury stock | | | | | | | | | | | | | | | | | | | | | | (2,574 | ) |
Retirement of treasury stock | | (4,234 | ) | | | (4 | ) | | | (38 | ) | | | | | | | | | | | 31 | |
Common stock issued | | 41,584 | | | | 41 | | | | 556 | | | | | | | | | | | | | |
| | |
|
| |
|
|
| |
|
|
| |
|
|
| |
|
|
| |
|
|
|
Balance, December 31, 2004 | | 11,172,582 | | | $ | 11,172 | | | $ | 7,112 | | | $ | 75,179 | | | $ | (288 | ) | | $ | (21,937 | ) |
| | |
|
| |
|
|
| |
|
|
| |
|
|
| |
|
|
| |
|
|
|
Consolidated Statement of Comprehensive Income
| | | | | | | | | | | | |
| | | 2004
| | | 2003
| | | 2002
| |
| For the years ended December 31, | | (in thousands) | |
Net income | | $ | 9,345 | | | $ | 9,356 | | | $ | 10,207 | |
Other comprehensive income: | | | | | | | | | | | | |
Unrealized holding (losses) gains arising during the period | | | (199 | ) | | | (362 | ) | | | (67 | ) |
Change in unfunded pension liability, net of tax | | | (33 | ) | | | 68 | | | | (185 | ) |
Deferred income tax benefit (expense) on unrealized holding gains (losses) arising during the period | | | 70 | | | | 127 | | | | 19 | |
| | |
|
|
| |
|
|
| |
|
|
|
Comprehensive net income | | $ | 9,183 | | | $ | 9,189 | | | $ | 9,974 | |
| | |
|
|
| |
|
|
| |
|
|
|
The accompanying notes are an integral part of the consolidated financial statements.
29
Notes to Consolidated Financial Statements
1. Basis of Presentation:
The consolidated financial statements include the accounts of Bryn Mawr Bank Corporation (the “Corporation”), The Bryn Mawr Trust Company (the “Bank”), Insurance Counsellors of Bryn Mawr, Inc. (“ICBM”), BMT Settlement Services, Inc. (“BMTSS”) and Joseph W. Roskos & Co. (“JWR & Co.”). For all years presented, all adjusting entries required for the fair presentation of the financial statements were made. All such adjustments were of a normal recurring nature. All significant intercompany transactions and accounts have been eliminated upon consolidation.
2. Summary of Significant Accounting Policies:
The accounting policies of the Corporation conform to Generally Accepted Accounting Principles (“GAAP”) and to general practices of the banking industry. The significant accounting policies are as follows:
Cash and cash equivalents:
Cash and cash equivalents include cash and due from banks, federal funds sold, and interest-bearing deposits with other banks with original maturities of three months or less. Cash balances reserved to meet regulatory requirements of the Federal Reserve Board amounted to $8,407,000 and $9,453,000 at December 31, 2004 and 2003, respectively.
Investment securities:
Management categorized all of its investment securities as available for sale as part of its asset/liability management strategy since they may be sold in response to changes in interest rates, prepayments, and similar factors. Investments in this classification are reported at the current market value with net unrealized gains or losses, net of the applicable deferred tax effect, being added to or deducted from the Corporation’s total shareholders’ equity on the balance sheet. As of December 31, 2004, shareholders’ equity decreased by $139,000 due to unrealized losses (net of $75,000 in deferred income tax benefit) of $213,000 in the investment securities portfolio. As of December 31, 2003, shareholders’ equity was decreased by $9,000 due to unrealized losses (net of $5,000 in deferred income taxes) of $14,000 in the investment securities portfolio.
Loans:
Loans are generally reported at principal amount outstanding, net of unearned income. Loans held for sale or securitization are valued on an aggregate basis at the lower of carrying amount or fair value.
Interest income on loans performing satisfactorily is recognized on the accrual method of accounting. Non-performing loans are loans on which scheduled principal and/or interest is past due 90 days or more or loans less than 90 days past due which are deemed to be problem loans by management. All non-performing loans, except consumer loans, are placed on non-accrual status, and any outstanding interest receivable at the time the loan is deemed non-performing is deducted from interest income. Consumer loan principal and interest balances deemed uncollectable are charged off on a timely basis against the loan loss reserve. The charge-off policy for all loans, including non-performing and impaired loans, considers such factors as the type and size of the loan, the quality of the collateral, and historical creditworthiness of the borrower.
As a part of its internal loan review process, management, when considering making a loan an impaired loan, considers a number of factors, such as a borrower’s current financial strength, the value of related collateral and the ability to continue to meet the original contractual terms of a loan. Major risk classifications, used to aggregate loans include both credit risk and the risk of failure to repay a loan and concentration risk. A loan is not considered impaired if there is merely an insignificant delay or shortfall in the amounts of payments. An insignificant delay or shortfall is a temporary delay in the payment process of a loan. However, under these circumstances, the Bank expects to collect all amounts due, including interest accrued at the contractual interest rate for the period of the delay.
When a borrower is deemed to be unable to meet the original terms of a loan, the loan is considered impaired. While all impaired loans are not necessarily considered non-performing loans, if a loan is delinquent for 90 days or more, it is considered both a non-performing and impaired loan. All of the Corporation’s impaired loans, which amounted to $1,353,000 and $371,000 at December 31, 2004 and 2003, respectively, were put on a non-accrual basis and any outstanding accrued interest receivable on such loans, at the time they were put on a non-accrual status, was reversed from income.
Impaired loans are required to be measured based upon the present value of expected future cash flows, discounted at the loan’s initial effective interest rate, or at the loan’s market price or fair value of the collateral, if the loan is collateral dependent. As of December 31, 2004 and 2003, no impaired loans were measured using the present value of expected future cash flows or at the loan’s market price. Impaired loans measured by the fair value of the loan’s collateral amounted to $1,353,000 and $371,000, respectively.
If the loan valuation is less than the recorded value of the loan, an impairment reserve is established for the difference. The impairment reserve is established by an allocation of the reserve for loan losses depending on the adequacy of the reserve for loan losses. All impairment reserves established in either 2004 or 2003 were allocated from the existing reserve for loan losses. As of December 31, 2004 there was $1,353,000 of impaired
30
loans for which there is no related allowance for loan losses. There was no related allowance for loan loss on impaired loans, which totaled $371,000 as of December 31, 2003. Average impaired loans during both 2004 and 2003 amounted to $798,000 and $170,000, respectively.
When a loan is classified as impaired, it is put on non-accrual status and any income subsequently collected is credited to the outstanding principal balance. Therefore, no interest income was reported on outstanding loans while considered impaired in either 2004 or 2003. Loans may be removed from impaired status and returned to accrual status when all principal and interest amounts contractually due are reasonably assured of repayment within an acceptable period of time and there is a sustained period of repayment performance by the borrower, with a minimum repayment of at least six months, in accordance with the contractual terms of interest and principal. Subsequent income recognition would be recorded under the existing terms of the loan. Based on the above criteria, $62,000 and $31,000 of loan balances were removed from impaired status and returned to accrual status during 2004 and 2003, respectively.
Smaller balance, homogeneous loans, exclusively consumer loans, when included in non-performing loans, for practical consideration, are not put on a non-accrual status nor is the current accrued interest receivable reversed from income. Once deemed uncollectable, the outstanding loan is charged off through the loan loss reserve, on a timely basis.
Loan loss provision:
The loan loss provision charged to operating expense is driven by a systematic formula and those factors which, in management’s judgment, deserve current recognition in estimating loan losses including the continuing evaluation of the loan portfolio and the Bank’s past loan loss experience. The allowance for loan losses is an amount that management believes will be adequate to absorb known and inherent losses in existing loans. Additionally, the Bank’s regulators, as a routine part of their examination process, review our loan portfolio and may, at their discretion, require the Bank to add to the allowance for loan losses.
Other real estate owned:
Other real estate owned (“OREO”) consists of properties acquired by foreclosure. These assets are carried at the lower of cost or estimated fair value at the time the loan is foreclosed less estimated cost to sell. The amounts recoverable from OREO could differ materially from the amounts used in arriving at the net carrying value of the assets because of future market factors beyond the control of the Bank. Costs to improve and hold the property are capitalized as long as the carrying value is less than the appraised value otherwise these cost are charged to expense.
Deferred loan fees:
On loans where the expected life is readily determinable, the Bank defers loan fees and related direct loan origination costs. Loan fees related to loans with no stated maturity are recognized as income when received. Deferred loan fees and costs are capitalized and amortized as a yield adjustment over the life of the loan using the interest method.
Premises and equipment:
Premises and equipment are stated at cost, less accumulated depreciation. The provision for depreciation is computed on a straight-line basis over the estimated useful lives, as follows: premises—10 to 50 years, and equipment—3 to 20 years. Leasehold improvements are amortized over the shorter of the estimated useful life or the term of the lease. Maintenance and repairs are charged to expense; major renewals and betterments are capitalized. Gains and losses on dispositions are reflected in current operations.
Accounting for Stock-Based Compensation:
As permitted in Statement of Financial Accounting Standard No. 123 “Accounting for Stock Based Compensation”, the Corporation has elected to use the intrinsic value method of accounting for stock-based employee compensation. Following is a summary presentation for the previous 5-year period of net income and basic and diluted earnings per share, as reported, the stock-based employee compensation cost, net of related tax effects, that would have been included in the determination of net income, if the fair value method of accounting for stock-based employee compensation had been applied to all awards and proforma net income and basic and diluted earnings per share, had the fair value method of accounting for stock-based employee compensation been applied to all awards.
| | | | | | | | | | | | | | | |
| | | 2004
| | 2003
| | 2002
| | 2001
| | 2000
|
Net income – as reported | | $ | 9,345 | | $ | 9,356 | | $ | 10,207 | | $ | 9,126 | | $ | 8,261 |
Stock-based compensation cost, net of related taxes | | | 94 | | | 79 | | | 158 | | | 140 | | | 224 |
| | |
|
| |
|
| |
|
| |
|
| |
|
|
Net income – proforma | | $ | 9,251 | | $ | 9,277 | | $ | 10,049 | | $ | 8,986 | | $ | 8,037 |
Basic earnings per share – as reported | | $ | 1.09 | | $ | 1.08 | | $ | 1.17 | | $ | 1.05 | | $ | 0.96 |
Diluted earnings per share – as reported | | $ | 1.06 | | $ | 1.06 | | $ | 1.15 | | $ | 1.02 | | $ | 0.93 |
Basic earnings per share – proforma | | $ | 1.07 | | $ | 1.07 | | $ | 1.15 | | $ | 1.04 | | $ | 0.94 |
Diluted earnings per share – proforma | | $ | 1.05 | | $ | 1.05 | | $ | 1.14 | | $ | 1.01 | | $ | 0.90 |
Income taxes:
The Corporation files a consolidated Federal income tax return with its subsidiaries. Certain items of income and expense (primarily pension and post retirement benefits, provision for loan loss and other reserves) are reported in different periods for tax purposes. Deferred taxes are provided on such temporary differences existing between financial and income tax reporting, subject to the deferred tax asset realization criteria required
31
under Statement of Financial Accounting Standards No. 109, “Accounting for Income Taxes” (“SFAS No. 109”).
Trust income:
Trust income is recognized on the accrual basis of accounting.
Goodwill:
The excess of cost over fair market value of net assets acquired through the purchase method of accounting (Goodwill) was being amortized on a straight-line basis over the period of the expected benefit, which ranges from 10 to 20 years. Under the provisions of Statement of Financial Accounting standard No. 142 “Goodwill and Other Intangible Assets” (“SFAS No. 142”), in years subsequent to 2002, goodwill would no longer be amortized but rather, would be periodically measured for impairment and if any expected benefit from an acquisition becomes impaired, the respective amount of impaired goodwill would be charged-off in the period of impairment. As of December 31, 2004 and 2003, there was no goodwill on the books of the Corporation.
Mortgage Servicing Rights:
Mortgage servicing rights (“MSRs”) are recorded when residential mortgage loans are sold with servicing retained by the Bank. A quarterly independent valuation of MSRs is completed to determine (1) the market value of the MSR portfolio at that quarter end and (2) the projected cash flows from the MSR portfolio for the subsequent quarter (the “MSR Valuation”). The subsequent cash flow projections, which measures a number of factors, including the projected pre-payment speeds of the respective mortgage loans, is the basis for the amortization of the MSRs in the subsequent quarter. The amount of quarterly amortization is measured each quarter, from the results of the quarterly MSR Valuation and any changes to the amount of amortization are made on a quarterly basis. When loans are paid off, any unamortized balances of the respective MSRs are written off against current Bank net income. Should any impairment of the MSRs be determined by the quarterly MSR Valuation, the balance of the MSRs would be written down by the amount of the impairment.
Recently issued accounting standards:
In December 2004, the Financial Accounting Standards Board (“FASB”) issued Statement of Financial Accounting Standard No. 123 (revised 2004) “Share Based Payment” (“SFAS No. 123 (R)”). SFAS No. 123 (R) establishes standards for the accounting for the transactions in which an entity exchanges its equity instruments for goods and services. SFAS No. 123 (R) requires a public entity to measure the cost of employee services received in exchange for an award of equity instruments based on the grant-date fair value of the award (with limited exceptions). That cost will be recognized over the period during which an employee is required to provide service in exchange for the award-the requisite service period (usually the vesting period). SFAS No. 123 (R) eliminates the alternative to use APB Opinion No. 25’s intrinsic value method of accounting that was provided in SFAS No. 123, as originally issued. Under Opinion No. 25, issuing stock options to employees generally resulted in recognition of no compensation cost. SFAS No. 123 (R) requires entities to recognize the cost of employee services received in exchange for awards of equity instruments based on the grant-date fair value of those awards. SFAS No. 123 is effective for fiscal years and interim periods beginning after June 15, 2005. Previously, the Corporation chose to follow the intrinsic methodology allowed under the original SFAS No. 123. The Corporation will adopt SFAS No. 123 (R) for interim periods beginning after June 15, 2005 and, therefore, anticipates recording additional expense associated with the issuance of stock options to employees. Beginning in the third quarter of 2005, the adoption of SFAS No. 123 (R) will have a material impact on the financial condition or results of operations of the Corporation, reducing net income in 2005 by approximately $130,000.
In December 2003, FASB revised Interpretation No. 46 (FIN 46R), “Consolidation of Variable Interest Entities, an interpretation of Accounting Research Bulletin No. 51” (the “Interpretation”). The Interpretation requires the consolidation of entities in which an enterprise absorbs a majority of the entity’s expected losses, receives a majority of the entity’s expected residual returns, or both, as a result of ownership, contractual or other financial interests in the entity. Currently, entities are generally consolidated by an enterprise when it has a controlling financial interest through ownership of a majority voting interest in the entity. Application of this Interpretation is required in financial statements of public entities that have interests in variable interest entities or potential variable interest entities commonly referred to as special purpose entities for periods ending after December 15, 2003. Application by public entities for all other types of entities is required in financial statements for periods ending after March 15, 2004. The adoption of FIN 46R did not have a material impact on the financial condition or results of operations of the Corporation.
In December 2003, the Emerging Issues Task Force issued EITF 03-1, “The Meaning of Other-Than-Temporary Impairment and Its Application to Certain Investments.”The EIFT addresses disclosure requirements regarding information about temporarily impaired investments. The requirements are effective for fiscal years ending after December 15, 2003 for all entities that have debt or marketable equity securities with market values below carrying values. The requirements apply to investments in debt and marketable equity securities that are accounted for under SFAS 115, “Accounting for Certain Investments in Debt and Equity Securities.”The requirements apply only to annual financial statements. As of December 31, 2004, the Company has included the required disclosures in footnote 3 to the financial statements.
32
3. Investment Securities
The amortized cost and estimated market value of investments, all of which were classified as available for sale, are as follows:
As of December 31, 2004:
| | | | | | | | | | | | | |
| (in thousands) | | Amortized
Cost
| | Gross
Unrealized
Gains
| | Gross
Unrealized
Losses
| | | Estimated
Market
Value
|
Obligations of the U.S. Government and agencies | | $ | 28,939 | | $ | 8 | | $ | (156 | ) | | $ | 28,791 |
State & political subdivisions | | | 5,181 | | | 18 | | | (100 | ) | | | 5,099 |
Other securities | | | 1,534 | | | 17 | | | — | | | | 1,551 |
| | |
|
| |
|
| |
|
|
| |
|
|
Total | | $ | 35,654 | | $ | 43 | | $ | (256 | ) | | $ | 35,441 |
| | |
|
| |
|
| |
|
|
| |
|
|
| | | | |
As of December 31, 2003: | | | | | | | | | | | | | |
| (in thousands) | | Amortized
Cost
| | Gross
Unrealized
Gains
| | Gross
Unrealized
Losses
| | | Estimated
Market
Value
|
Obligations of the U.S. Government and agencies | | $ | 25,081 | | $ | 111 | | $ | (79 | ) | | $ | 25,113 |
State & political subdivisions | | | 5,177 | | | 25 | | | (89 | ) | | | 5,113 |
Other securities | | | 1,153 | | | 18 | | | — | | | | 1,171 |
| | |
|
| |
|
| |
|
|
| |
|
|
Total | | $ | 31,411 | | $ | 154 | | $ | (168 | ) | | $ | 31,397 |
| | |
|
| |
|
| |
|
|
| |
|
|
The following table shows the amount of securities that were in an unrealized loss position at December 31, 2004:
| | | | | | | | | | | | | | | | | | | | | |
| | | Less than 12 Months
| | | 12 Months or Longer
| | | Total
| |
| | | Fair
Value
| | Unrealized
Losses
| | | Fair
Value
| | Unrealized
Losses
| | | Fair
Value
| | Unrealized
Losses
| |
US Treasury obligations and direct obligations of US Government Agencies | | $ | 19,306 | | $ | (134 | ) | | $ | 1,979 | | $ | (22 | ) | | $ | 21,285 | | $ | (156 | ) |
State and political subdivisions | | | 1,913 | | | (39 | ) | | | 1,671 | | | (61 | ) | | | 3,584 | | | (100 | ) |
Federal agency mortgage-backed securities | | | — | | | — | | | | — | | | — | | | | — | | | — | |
Other | | | — | | | — | | | | — | | | — | | | | — | | | — | |
| | |
|
| |
|
|
| |
|
| |
|
|
| |
|
| |
|
|
|
Subtotal, Debt Securities | | | 21,219 | | | (173 | ) | | | 3,650 | | | (83 | ) | | | 24,869 | | | (256 | ) |
| | | | | | |
Common Stock | | | — | | | — | | | | — | | | — | | | | — | | | — | |
| | |
|
| |
|
|
| |
|
| |
|
|
| |
|
| |
|
|
|
Total temporarily impaired securities | | $ | 21,219 | | $ | (173 | ) | | $ | 3,650 | | $ | (83 | ) | | $ | 24,869 | | $ | (256 | ) |
| | |
|
| |
|
|
| |
|
| |
|
|
| |
|
| |
|
|
|
As of December 31, 2004, the amount of unrealized losses, for less than twelve months, in debt and equity securities classified as either available-for-sale or held-to-maturity was $173,000 and had a fair value of $21,219,000. The amount of unrealized losses, for twelve months or longer, in debt and equity securities classified as either available-for-sale or held-to-maturity was $83,000 and had a fair value of $3,650,000. As of December 31, 2004 the Corporation has concluded that the unrealized losses are temporary in nature since they are primarily related too market interest rates and are not related to the underlying credit quality of the issuers of the investment portfolio. None of the investments are believed to be other-than-temporarily impaired. The Corporation has the ability and intent to hold the securities until maturity to recover the entire value.
At December 31, 2004, securities having a book value of $15,960,000 were pledged as collateral for public funds, trust deposits, and other purposes.
The amortized cost and estimated market value of investment securities at December 31, 2004, by contractual maturity, are shown below. Expected maturities will differ from contractual maturities because borrowers may have the right to call or prepay obligations with or without call or prepayment penalties.
| | | | | | |
| | | 2004
|
| (in thousands) | | Amortized
Cost
| | Estimated
Market
Value
|
Due in one year or less | | $ | 3,555 | | $ | 3,529 |
Due after one year through five years | | | 21,439 | | | 21,351 |
Due after five years through ten years | | | 9,487 | | | 9,371 |
Due after ten years | | | — | | | — |
Other securities | | | 1,173 | | | 1,190 |
| | |
|
| |
|
|
Total | | $ | 35,654$ | | | 35,441 |
| | |
|
| |
|
|
There were no sales of debt securities during 2004, 2003 or 2002.
4. Loans:
Loans outstanding at December 31 are detailed by category as follows:
| | | | | | | | |
| (in thousands) | | 2004
| | | 2003
| |
Real estate loans: | | | | | | | | |
Permanent | | | | | | | | |
commercial mortgage loans | | $ | 137,481 | | | $ | 120,188 | |
second mortgage loans | | | 25,661 | | | | 31,203 | |
mortgage loans available for sale | | | 8,708 | | | | 3,691 | |
mortgage loans | | | 159,035 | | | | 114,677 | |
Construction loans | | | 37,000 | | | | 36,358 | |
Commercial and industrial loans | | | 186,923 | | | | 178,381 | |
Loans to individuals for household, family, and other consumer expenditures | | | 10,291 | | | | 18,580 | |
| | |
|
|
| |
|
|
|
Subtotal | | | 565,099 | | | | 503,078 | |
Less: Allowance for loan losses | | | (6,927 | ) | | | (6,670 | ) |
Net deferred loan fees | | | (502 | ) | | | (662 | ) |
| | |
|
|
| |
|
|
|
Loans, net | | $ | 557,670 | | | $ | 495,746 | |
| | |
|
|
| |
|
|
|
Unadvanced loan funds | | $ | 269,036 | | | $ | 222,389 | |
| | |
|
|
| |
|
|
|
Loans with predetermined rates | | | 265,543 | | | | 131,829 | |
Loans with adjustable or floating rates | | | 299,556 | | | | 371,249 | |
| | |
|
|
| |
|
|
|
Total | | $ | 565,099 | | | $ | 503,078 | |
| | |
|
|
| |
|
|
|
All loans past due 90 days or more, except consumer loans, are placed on nonaccrual status. Nonperforming loans amounted to $1,109,000 and $279,000 at December 31, 2004 and 2003, respectively. Forgone interest on nonaccrual loans was $88,000,
33
$1,000, and $11,000 in 2004, 2003, and 2002, respectively. There were 19 impaired loans at December 31, 2004, amounting to $1,353,000.
5. Allowance for Loan Losses:
The summary of the changes in the allowance for loan losses is as follows:
| | | | | | | | | | | | |
| (in thousands) | | 2004
| | | 2003
| | | 2002
| |
Balance, January 1 | | $ | 6,670 | | | $ | 6,114 | | | $ | 4,928 | |
Charge-offs | | | (692 | ) | | | (227 | ) | | | (68 | ) |
Recoveries | | | 49 | | | | 33 | | | | 254 | |
| | |
|
|
| |
|
|
| |
|
|
|
Net recoveries / (charge-offs) | | | (643 | ) | | | (194 | ) | | | 186 | |
Loan loss provision | | | 900 | | | | 750 | | | | 1,000 | |
| | |
|
|
| |
|
|
| |
|
|
|
Balance, December 31 | | $ | 6,927 | | | $ | 6,670 | | | $ | 6,114 | |
| | |
|
|
| |
|
|
| |
|
|
|
6. Premises and Equipment:
A summary of premises and equipment at December 31 is as follows:
| | | | | | | | |
| (in thousands) | | 2004
| | | 2003
| |
Land | | $ | 2,974 | | | $ | 2,973 | |
Buildings | | | 15,226 | | | | 14,877 | |
Furniture and equipment | | | 14,996 | | | | 14,519 | |
Leasehold improvements | | | 1,552 | | | | 818 | |
Less accumulated depreciation | | | (20,586 | ) | | | (19,431 | ) |
| | |
|
|
| |
|
|
|
Total | | $ | 14,162 | | | $ | 13,756 | |
| | |
|
|
| |
|
|
|
Depreciation expense for the years ended December 31, 2004, 2003 and 2002 amounted to $1,310,000, $1,291,000 and $1,368,000, respectively. Future minimum rent commitments under various operating leases are as follows:
| | | |
2005 | | $ | 787,501 |
2006 | | $ | 653,353 |
2007 | | $ | 592,881 |
2008 | | $ | 592,381 |
2009 | | $ | 579,852 |
Thereafter | | $ | 8,311,000 |
7. Mortgage Servicing Rights:
The Bank records the value of mortgage servicing rights (“MSRs”) as an asset when the mortgage loans are sold and the servicing is retained by the Bank. MSRs represent the right to receive cash flows from servicing mortgage loans. The servicing rights are capitalized based on the relative fair value of the servicing right and the mortgage loan on the date the mortgage loan is sold. MSRs are amortized in proportion to, and over the period of, the estimated net servicing income. MSRs are carried at the lower of cost or estimated fair value. The Corporation obtains an independent appraisal of the fair value of its MSRs quarterly, which approximates the fair value expected in a sale between a willing buyer and seller.
MSRs are assessed quarterly for impairment based on the estimated fair value of those rights. For purposes of performing the impairment valuation, the MSR portfolio is stratified on the basis of certain predominant risk characteristics, including loan type and note rate. To the extent that the carrying value of the servicing rights exceeds estimated fair value for any stratum, a valuation allowance is established, which may be adjusted in the future as the estimated fair value of the MSRs increase or decrease. This valuation allowance is recognized in the consolidated statements of operations during the period in which impairment occurs.
The following summarizes the Corporation’s activity related to MSRs for the years ended December 31, 2004 and 2003:
| | | | | | | | |
| (In thousands) | | 2004
| | | 2003
| |
Balance, January 1 | | $ | 4,391 | | | $ | 3,956 | |
Additions | | | 1,019 | | | | 3,249 | |
Amortization | | | (839 | ) | | | (2,814 | ) |
Impairment | | | — | | | | — | |
Sales | | | (1,399 | ) | | | — | |
| | |
|
|
| |
|
|
|
Balance, December 31 | | $ | 3,172 | | | $ | 4,391 | |
| | |
|
|
| |
|
|
|
Fair Value | | | 4,132 | | | | 6,828 | |
The following summarizes the Corporation’s activity related to changes in the valuation allowance impairment of MSRs for the years ended December 31, 2004 and 2003:
| | | | | | | |
| | | 2004
| | 2003
| |
Balance, January 1 | | $ | — | | $ | — | |
Impairment | | | — | | | 350 | |
Recovery | | | — | | | (350 | ) |
| | |
|
| |
|
|
|
Balance, December 31 | | $ | — | | $ | — | |
| | |
|
| |
|
|
|
At December 31, 2004, key economic assumptions and the sensitivity of the current fair value of MSRs to immediate 10 and 20 percent adverse changes in those assumptions are as follows:
| | | | |
| | | December 31, 2004
| |
Fair value amount of MSRs | | $ | 4,132 | |
Weighted average life (in years) | | | 3.7 | |
Prepayment speeds (constant Prepayment rate) (1): | | | 19.92 | % |
Impact on fair value: | | | | |
10% adverse change | | | (293 | ) |
20% adverse change | | | (558 | ) |
Discount rate: | | | 10.05 | % |
Impact on fair value: | | | | |
10% adverse change | | | (128 | ) |
20% adverse change | | | (248 | ) |
| (1) | represents the weighted average prepayment rate for the life of the MSR asset. |
34
These assumptions and sensitivities are hypothetical and should be used with caution. As the figures indicate, changes in fair value based on a 10% variation in assumptions generally cannot be extrapolated because the relationship of the change in assumptions to the change in fair value may not be linear. Also, the effect of a variation in a particular assumption on the fair value of the MSRs is calculated without changing any other assumption. In realty, changes in one factor may result in changes in another, which could magnify or counteract the sensitivities.
8. Deposits:
Following is a summary of deposits as of December 31,
| | | | | | |
| (in thousands) | | 2004
| | 2003
|
Regular Savings | | $ | 50,300 | | $ | 52,396 |
NOW Accounts | | | 166,901 | | | 134,995 |
Market rate accounts | | | 126,058 | | | 97,978 |
Time deposits (less than $100,000) | | | 70,820 | | | 65,037 |
Time deposits, $100,000 or more | | | 39,650 | | | 32,154 |
| | |
|
| |
|
|
Total interest-bearing deposits | | | 453,729 | | | 382,560 |
Non-interest-bearing deposits | | | 147,236 | | | 144,579 |
| | |
|
| |
|
|
Total deposits | | $ | 600,965 | | $ | 527,139 |
| | |
|
| |
|
|
The aggregate amount of deposit overdrafts included as loans as of December 31, 2004 and 2003 were $393,000 and $518,000, respectively.
Maturity of certificates of deposit:
| | | | | | |
| (in thousands) | | $100,000
or more
| | Less than
$100,000
|
Maturing during: | | | | | | |
2005 | | $ | 33,916 | | $ | 55,533 |
2006 | | | 5,090 | | | 12,416 |
2007 | | | 644 | | | 2,283 |
2008 | | | — | | | 460 |
2009 and thereafter | | | — | | | 128 |
| | |
|
| |
|
|
Total | | $ | 39,650 | | $ | 70,820 |
| | |
|
| |
|
|
9. Short Term Borrowings:
The Bank had no outstanding borrowings as of December 31, 2004 or 2003.
10. Disclosure about Fair Value of Financial Instruments:
Statement of Financial Accounting Standards No. 107, “Disclosures about Fair Value of Financial Instruments” (“SFAS No. 107”), requires disclosure of the fair value information about financial instruments, whether or not recognized in the balance sheet, for which it is practicable to estimate such value. In cases where quoted market prices are not available, fair values are based on estimates using present value or other market value techniques. Those techniques are significantly affected by the assumptions used, including the discount rate and estimates of future cash flows. In that regard the derived fair value estimates cannot be substantiated by comparison to independent markets and, in many cases, could not be realized in immediate settlement of the instrument. SFAS No. 107 excludes certain financial instruments and all non-financial instruments from its disclosure requirements. Accordingly, the aggregate fair value amounts presented do not represent the underlying value of the Corporation.
The following methods and assumptions were used to estimate the fair value of each class of financial instruments for which it is practicable to estimate that value:
Cash and cash equivalents:
The carrying amounts reported in the balance sheet for cash and cash equivalents approximate their fair values.
Investment securities:
Estimated fair values for investment securities are based on quoted market price, where available.
Loans:
For variable rate loans that reprice frequently and which have no significant change in credit risk, estimated fair values are based on carrying values. Fair values of certain mortgage loans and consumer loans are estimated using discounted cash flow analyses, using interest rates currently being offered for loans with similar terms to borrowers of similar credit quality. The estimated fair value of nonperforming loans is based on discounted estimated cash flows as determined by the internal loan review of the Bank or the appraised market value of the underlying collateral, as determined by independent third party appraisers.
Deposits:
The estimated fair values disclosed for noninterest-bearing demand deposits, NOW accounts, and Market Rate accounts are, by definition, equal to the amounts payable on demand at the reporting date (i.e., their carrying amounts). Fair values for certificates of deposit are estimated using a discounted cash flow calculation that applies interest rates currently being offered on certificates to a schedule of expected monthly maturities on the certificate of deposit. SFAS No. 107 defines the fair value of demand deposits as the amount payable on demand and prohibits adjusting estimated fair value from any value derived from retaining those deposits for an expected future period of time.
Short Term Borrowings:
Due to the short term nature of the maturities the carrying amount of the borrowings approximates the fair value.
Other liabilities:
Estimated fair values accrued interest payable, accrued taxes payable and other accrued payables.
Off-balance sheet instruments:
Estimated fair values of the Corporation’s off-balance sheet instruments (standby letters of credit and loan commitments)
35
are based on fees and rates currently charged to enter into similar loan agreements, taking into account the remaining terms of the agreements and the counterparties’ credit standing. Since fees and rates charged for off-balance sheet items are at market levels when set, there is no material difference between the stated amount and estimated fair values of off-balance sheet instruments.
The carrying amount and estimated fair value of the Corporation’s financial instruments at December 31 are as follows:
| | | | | | | | | | | | |
| | | 2004
| | 2003
|
| (in thousands) | | Carrying
Amount
| | Estimated
Fair Value
| | Carrying
Amount
| | Estimated
Fair Value
|
Financial assets: | | | | | | | | | | | | |
Cash and due from banks | | $ | 26,526 | | $ | 26,526 | | $ | 32,471 | | $ | 32,471 |
Interest-bearing deposits with other banks | | | 15,293 | | | 15,293 | | | 10,524 | | | 10,524 |
Federal funds sold | | | 13,423 | | | 13,423 | | | 3,300 | | | 3,300 |
Investment securities | | | 35,441 | | | 35,441 | | | 31,397 | | | 31,397 |
Mortgage servicing rights | | | 3,172 | | | 4,132 | | | 4,391 | | | 6,828 |
Net loans | | | 557,670 | | | 554,515 | | | 495,746 | | | 497,786 |
| | |
|
| |
|
| |
|
| |
|
|
Total financial assets | | $ | 651,525 | | $ | 649,330 | | $ | 577,829 | | $ | 582,306 |
| | |
|
| |
|
| |
|
| |
|
|
Financial liabilities: | | | | | | | | | | | | |
Deposits | | $ | 600,965 | | $ | 601,109 | | $ | 527,139 | | $ | 527,835 |
Other liabilities | | | 2,878 | | | 2,878 | | | 2,328 | | | 2,328 |
| | |
|
| |
|
| |
|
| |
|
|
Total financial liabilities | | $ | 603,843 | | $ | 603,987 | | $ | 529,467 | | $ | 530,163 |
| | |
|
| |
|
| |
|
| |
|
|
Off-balance sheet instruments | | $ | 277,839 | | $ | 277,839 | | $ | 231,571 | | $ | 231,571 |
| | |
|
| |
|
| |
|
| |
|
|
11. Applicable Income Taxes:
The components of the net deferred tax asset (liabilities) as of December 31 are as follows:
| | | | | | | | |
| (in thousands) | | 2004
| | | 2003
| |
Deferred tax assets: | | | | | | | | |
Loan loss reserve | | $ | 2,270 | | | $ | 2,064 | |
Other reserves | | | 699 | | | | 525 | |
Unrealized depreciation on investment securities | | | 155 | | | | 68 | |
| | |
|
|
| |
|
|
|
Total deferred tax asset | | | 3,124 | | | | 2,657 | |
Deferred tax liabilities: | | | | | | | | |
Depreciation | | | (261 | ) | | | (323 | ) |
Installment sale and other | | | (339 | ) | | | — | |
Pension and other postretirement benefits | | | (1,417 | ) | | | (849 | ) |
Originated mortgage servicing rights | | | (1,110 | ) | | | (1,537 | ) |
| | |
|
|
| |
|
|
|
Total deferred tax liability | | | (3,127 | ) | | | (2,709 | ) |
| | |
|
|
| |
|
|
|
Total net deferred tax assets (liabilities) | | $ | (3 | ) | | $ | (52 | ) |
| | |
|
|
| |
|
|
|
No valuation allowance was recorded as of December 31, 2004 and 2003; since management believes that it is more likely than not that the net deferred tax asset will be realized.
The provision for income taxes consist of the following:
| | | | | | | | | | |
| (in thousands) | | 2004
| | 2003
| | 2002
| |
Currently payable | | $ | 4,714 | | $ | 5,245 | | $ | 5,755 | |
Deferred | | | 38 | | | 1,004 | | | (230 | ) |
| | |
|
| |
|
| |
|
|
|
Total | | $ | 4,752 | | $ | 6,249 | | $ | 5,525 | |
| | |
|
| |
|
| |
|
|
|
Applicable income taxes differed from the amount derived by applying the statutory federal tax rate of 35% to income as follows:
| | | | | | | | | | | | |
| (in thousands) | | 2004
| | | 2003
| | | 2002
| |
Computed | | | | | | | | | | | | |
Tax expense statutory federal rate | | $ | 4,934 | | | $ | 6,062 | | | $ | 5,665 | |
Tax-exempt income | | | (140 | ) | | | (103 | ) | | | (72 | ) |
Other, net | | | (42 | ) | | | 90 | | | | (50 | ) |
Tax expense from continuing operations | | | 4,752 | | | | 6,049 | | | | 5,543 | |
Tax expense (benefit) from discontinued operations | | | — | | | | 200 | | | | (18 | ) |
| | |
|
|
| |
|
|
| |
|
|
|
Total income tax expense | | $ | 4,752 | | | $ | 6,249 | | | $ | 5,525 | |
| | |
|
|
| |
|
|
| |
|
|
|
| * | Reclassified for comparative purposes. |
12. Pension and Other Postretirement Benefits
The Corporation sponsors two pension plans and a postretirement benefit plan for certain of its employees. The following tables provide a reconciliation of the changes in the plans’ benefits obligation and fair value of assets over the two-year period ending December 31, 2004, and a statement of funded status as of December 31 of both years:
| | | | | | | | | | | | | | | | |
| | | Pension Benefits
| | | Postretirement
Benefits
| |
| (Dollars in thousands) | | 2004
| | | 2003
| | | 2004
| | | 2003
| |
Reconciliation of Benefit Obligation and Plan Assets | | | | | | | | | | | | | | | | |
Change in benefit obligation | | | | | | | | | | | | | | | | |
Benefit obligation at January 1 | | $ | 25,149 | | | $ | 21,890 | | | $ | 2,375 | | | $ | 2,561 | |
Service cost | | | 1,134 | | | | 922 | | | | 21 | | | | 16 | |
Interest cost | | | 1,573 | | | | 1,455 | | | | 188 | | | | 151 | |
Amendments | | | | | | | | | | | | | | | | |
Actuarial (gain) loss | | | 1,517 | | | | 1,780 | | | | 793 | | | | (149 | ) |
Benefits paid | | | (967 | ) | | | (898 | ) | | | (225 | ) | | | (204 | ) |
| | |
|
|
| |
|
|
| |
|
|
| |
|
|
|
Benefit obligation at December 31 | | $ | 28,406 | | | $ | 25,149 | | | $ | 3,152 | | | $ | 2,375 | |
| | |
|
|
| |
|
|
| |
|
|
| |
|
|
|
Change in plan assets | | | | | | | | | | | | | | | | |
Fair value of plan assets at January 1 | | $ | 22,615 | | | $ | 17,534 | | | $ | — | | | $ | — | |
Actual return on plan assets | | | 1,441 | | | | 3,041 | | | | — | | | | — | |
Employer contribution | | | 2,807 | | | | 2,938 | | | | 225 | | | | 183 | |
Plan participants’ contribution | | | | | | | | | | | — | | | | 21 | |
Administrative expense | | | (58 | ) | | | | | | | | | | | | |
Benefits paid | | | (967 | ) | | | (898 | ) | | | (225 | ) | | | (204 | ) |
| | |
|
|
| |
|
|
| |
|
|
| |
|
|
|
Fair value of plan assets at December 31 | | $ | 25,838 | | | $ | 22,615 | | | $ | — | | | $ | — | |
| | |
|
|
| |
|
|
| |
|
|
| |
|
|
|
36
Funded Status Reconciliation and Key Assumptions
| | | | | | | | | | | | | | | | |
| | | Pension Benefits
| | | Postretirement
Benefits
| |
| | | 2004
| | | 2003
| | | 2004
| | | 2003
| |
Reconciliation of funded status | | | | | | | | | | | | | | | | |
Funded Status | | $ | (2,568 | ) | | $ | (2,533 | ) | | $ | (3,152 | ) | | $ | (2,374 | ) |
Unrecognized net actuarial (gain) loss | | | 6,112 | | | | 4,345 | | | | 1,737 | | | | 1,128 | |
Unrecognized prior service cost | | | 499 | | | | 609 | | | | — | | | | — | |
Unrecognized transition obligation (asset) | | | — | | | | — | | | | 207 | | | | 233 | |
| | |
|
|
| |
|
|
| |
|
|
| |
|
|
|
Prepaid accrued (benefit) cost | | $ | 4,043 | | | $ | 2,421 | | | $ | (1,208 | ) | | $ | (1,013 | ) |
| | |
|
|
| |
|
|
| |
|
|
| |
|
|
|
Amounts recognized in financial statements consists of: | | | | | | | | | | | | | | | | |
Prepaid benefit cost/ (Accrued benefit liability) | | $ | 3,612 | | | $ | 1,992 | | | | (1,208 | ) | | | (1,013 | ) |
Intangible asset prior service cost | | | 222 | | | | 251 | | | | — | | | | — | |
| | |
|
|
| |
|
|
| |
|
|
| |
|
|
|
Accumulated other comprehensive income (loss) | | | 209 | | | | 178 | | | | — | | | | — | |
| | |
|
|
| |
|
|
| |
|
|
| |
|
|
|
Net amount recognized | | $ | 4,043 | | | $ | 2,421 | | | $ | (1,208 | ) | | $ | (1,013 | ) |
| | |
|
|
| |
|
|
| |
|
|
| |
|
|
|
The Bank’s Supplemental Employee Retirement Plan (the “SERP”) was the only pension plan with an accumulated benefit obligation in excess of plan assets. The SERP’s accumulated benefit obligation was $1,788,000 as of December 31, 2004 and $1,665,000 as of December 31, 2003. There are no plan assets in the SERP due to the nature of the SERP. The Corporation’s plan for postretirement benefits other than pensions also has no plan assets.
The assumptions used in the measurement of the Corporation’s benefit obligation are shown on the following table:
| | | | | | | | | | | | |
| | | Pension Benefits
| | | Postretirement
Benefits
| |
| | | 2004
| | | 2003
| | | 2004
| | | 2003
| |
Weighted-average assumptions as of end of year | | | | | | | | | | | | |
Discount rate | | 6.00 | % | | 6.25 | % | | 6.00 | % | | 6.25 | % |
Expected return on plan assets | | 8.75 | % | | 8.75 | % | | N/A | | | N/A | |
Rate of compensation increase | | 4.00 | % | | 5.00 | % | | 4.00 | % | | 4.00 | % |
The assumption for calculating the expected rate of return on plan assets are based on an estimated range of returns, utilizing the results of the 25th and 75th percentile, which are presented as a guideline within which the investment return assumption may be selected. The range was constructed using a number of actuarial assumptions to determine the range of investment results. From this calculation the 25th and 75th percentile returns were derived. Based on the asset allocation ranges set in the Corporation’s Pension Investment Policy, the 25th percentile returns are approximately 6.61% and the 75th percentile returns 10.06%. The arithmetic average return is 9.01%. Based on this data, a rate of 8.75% was selected.
| | | | | | |
| | | 2004
| | | 2003
| |
Assumed health care cost trend rates at the end of year | | | | | | |
Health care cost trend rate assumed for next year | | 11 | % | | 7.5 | % |
Rate to which the cost trend rate is assumed to decline (the ultimate trend rate) | | 6 | % | | 5 | % |
Year that the rate reaches the ultimate trend rate | | 2010 | | | 2008 | |
The following table provides the components of net periodic cost (income) for the plans for years ended December 31, 2004, 2003 and 2002:
| | | | | | | | | | | | | | | | | | | | | |
| | | Pension Benefits
| | | Postretirement
Benefits
|
| | | 2004
| | | 2003
| | | 2002
| | | 2004
| | 2003
| | 2002
|
Service cost | | $ | 1,134 | | | $ | 923 | | | $ | 808 | | | $ | 21 | | $ | 17 | | $ | 28 |
Interest cost | | | 1,573 | | | | 1,455 | | | | 1,355 | | | | 188 | | | 151 | | | 171 |
Expected return on plan assets | | | (1,937 | ) | | | (1,493 | ) | | | (1,807 | ) | | | — | | | — | | | — |
Amortization of prior service cost | | | 130 | | | | 181 | | | | 181 | | | | — | | | — | | | — |
Amortization of transition obligation (asset) | | | — | | | | — | | | | — | | | | 26 | | | 26 | | | 26 |
Amortization of net actuarial (gain) loss | | | 285 | | | | 285 | | | | 12 | | | | 185 | | | 107 | | | 144 |
| | |
|
|
| |
|
|
| |
|
|
| |
|
| |
|
| |
|
|
Net periodic (benefit) cost | | $ | 1,185 | | | $ | 1,351 | | | | 549 | | | $ | 420 | | $ | 301 | | | 369 |
| | |
|
|
| |
|
|
| |
|
|
| |
|
| |
|
| |
|
|
Plan Assets
| | | | | | | | |
| | | Pension Benefits
| |
| | | Target Allocation
year ending
| | Percentage
of plan
assets at
December 31
| |
| | | Dec. 31, 2004
| | 2004
| | | 2003
| |
Asset Category | | | | | | | | |
Equity Securities* | | 50% - 65% | | 60 | % | | 60 | % |
Debt Securities | | 30% - 45% | | 29 | % | | 29 | % |
Real Estate | | 0% | | 0 | % | | 0 | % |
Other | | 1% - 5% | | 11 | % | | 11 | % |
| | | | |
|
| |
|
|
Total | | | | 100 | % | | 100 | % |
| | | | |
|
| |
|
|
| * | INCLUDES Bryn Mawr Bank Corporation common stock in the amount of $587,220 (2%) and $643,566 (3%) at December 31, 2004 and 2003, respectively. |
There are no plan assets in the Corporation’s plan for postretirement benefits other than pensions.
The investment strategy of the Plan is to maintain the investment ranges listed above. The target ranges are to be periodically reviewed based on the prevailing market conditions. Any modification to the current investment strategy must be ratified by the Pension Committee of the Corporation’s board of directors. The Plan will retain approximately 2.5% of Bryn Mawr Bank Corporation common stock.
Measurement Date
The measurement date used to determine pension and other postretirement benefit measures for the pension plan and other postretirement benefits plan was December 31st for all respective years presented.
37
Expected contribution to be Paid in the Next Fiscal Year
Based on the status of the Corporation’s defined benefit pension plan at December 31, 2004 no minimum funding requirement is anticipated for 2005. The expected contribution for the SERP is $128,834 for 2005.
Health care cost trend rate if changed by 1%
| | | | | | | |
| | | 1-Percentage
Point
Increase
| | 1-Percentage
Point
Decrease
| |
Effect on total of service and interest cost components | | $ | 15,322 | | $ | (13,645 | ) |
Effect on accumulated postretirement benefit obligation | | | 159,893 | | | (275,266 | ) |
The Medical Prescription Drug Improvement and Modernization Act of 2003 was signed into Law December 8, 2003. In accordance with FASB Staff Position FAS 106-1, the Corporation has made a one time election to defer recognition of the effect of the law in the accounting for its Plan under FAS 106 and in providing disclosure related to the Plan until authoritative guidance on the accounting for the federal prescription subsidy is issued. Any measure of the Accumulated Postretirement Benefit Obligation or Net Periodic Postretirement Benefit Cost in this report does not reflect the effect of the Act on the Plan. Authoritative guidance is pending and, when issued, could require the company to change previously reported information.
13. Stock Option Plan:
At December 31, 1988, the Corporation established a stock option and stock appreciation rights plan (the “Stock Option Plan”), which is described below. The Corporation applies APB Opinion 25 and related interpretations in accounting for the Stock Option Plan. Accordingly, no compensation cost has been recognized for the Stock Option Plan. Had compensation for the Corporation’s Stock Option Plan been determined based on the fair value at the grant date for awards in 2004, 2003 and 2002, consistent with the optional provisions of Statement of Financial Accounting Standards No. 123R, “Accounting for Stock Based Compensation,” the Corporation’s net income and earnings per share would have been reduced to the pro forma amounts indicated below:
| | | | | | | | | |
| | | 2004
| | 2003
| | 2002
|
Net income - as reported | | $ | 9,345 | | $ | 9,356 | | $ | 10,207 |
Net Income pro forma | | $ | 9,251 | | $ | 9,277 | | $ | 10,049 |
Basic earnings per share - as reported | | $ | 1.09 | | $ | 1.08 | | $ | 1.17 |
Basic earnings per share - proforma | | $ | 1.07 | | $ | 1.07 | | $ | 1.15 |
The fair value of each option granted is estimated on the date of the grant using the Black-Scholes option pricing model with the following weighted-average assumptions used for grants in 2004, 2003 and 2002: dividend yield of 1.76 percent, expected volatility of 21 percent, expected life of six years and risk-free interest rates of 3.9, 3.5 and 5.1 percent, respectively.
The Plan had, prior to 1994, up to 216,000 authorized and unissued or Treasury shares of the Corporation’s common stock reserved for issuance under the Plan. During 1994, the shareholders’ approved an additional 217,720 shares for issuance under the Plan. The option to purchase shares of the Corporation’s common stock was issued to key officers. During 1995, the shareholder’s approved the issuance of 80,000 shares, 20,000 to be granted to outside directors, for 4 years after each Annual Meeting. The option price was set at the last sale price for the stock on the 3rd business day following the Corporation’s Annual Meeting. Options totaling 76,000 shares of Corporation stock were issued under the outside directors’ plan. During 1998, 2001 and 2004, the shareholders approved the issuance of up to 217,606, 192,663 and 431,143 respective shares available for issuance to both employees and directors. The price will be determined by the Corporation’s Compensation Committee of the Board of Directors at the time the option is granted. Options granted may either be “incentive stock options” within the meaning of the Internal Revenue Service code, or non-qualified options. The stock options are exercisable over a period determined by the Board of Directors; however, the option period will not commence earlier than one year or be longer than ten years from the date of the grant. The Plan provides that the option price at the date of grant will not be less than the fair market value of the Corporation’s common stock. The following is a summary of transactions under the Plan:
| | | | | | | | | | | | |
| | | Shares
Under
Option
| | | Available
for
Option
| | | Price per Share
| | Weighted
Average
Exercise
Price
|
Balance at December 31, 2001 | | 828,300 | | | 258,478 | | | $ | 3.69 - $15.15 | | $ | — |
Options granted | | 134,500 | | | (134,500 | ) | | $ | 16.25 - $18.32 | | $ | 17.76 |
Options exercised | | (422,866 | ) | | — | | | $ | 3.69 - $13.22 | | $ | 7.47 |
Options cancelled | | (28,700 | ) | | 28,700 | | | $ | 12.25 - $15.15 | | $ | 14.94 |
| | |
|
| |
|
| |
|
| |
|
|
Balance at December 31, 2002 | | 511,234 | | | 152,678 | | | $ | 4.00 - $18.32 | | $ | — |
Options granted | | 142,500 | | | (142,500 | ) | | $ | 17.85 - $21.68 | | $ | 18.02 |
Options exercised | | (53,016 | ) | | — | | | $ | 4.00 - $18.32 | | $ | 11.72 |
Options cancelled | | (6,334 | ) | | 6,334 | | | $ | 15.15 - $18.32 | | $ | 17.06 |
| | |
|
| |
|
| |
|
| |
|
|
Balance at December 31, 2003 | | 594,384 | | | 16,512 | | | $ | 4.34 - $21.68 | | $ | 14.66 |
Options authorized | | — | | | 431,143 | | | | — | | | — |
Options granted | | 138,750 | | | (138,750 | ) | | $ | 20.47 - $22.68 | | $ | 20.51 |
Options exercised | | (37,350 | ) | | — | | | $ | 10.50 - $18.46 | | $ | 13.11 |
Options cancelled | | (43,000 | ) | | 43,000 | | | $ | 14.49 - $20.47 | | $ | 17.80 |
| | |
|
| |
|
| |
|
| |
|
|
Balance at December 31, 2004 | | 652,784 | | | 351,905 | | | $ | 4.34 - $22.68 | | $ | 15.80 |
38
Information pertaining to options outstanding at December 31, 2004 is as follows:
Price range of shares under option at December 31, 2004:
| | | | | | | | | | | | | | |
| | | Shares
Under
Option
| | Price
per
Share
| | Remaining
Contractual
Life
| | Weighted
Average
Exercise
Price
| | Number
Exercisable
| | Weighted
Average
Exercise
Price
|
| | | 20,000 | | $ 4.34 -$ 6.25 | | 0.85 | | $ | 5.49 | | 20,000 | | $ | 5.49 |
| | | 160,000 | | $ 8.45 -$ 12.45 | | 4.53 | | $ | 11.45 | | 160,000 | | $ | 11.45 |
| | | 236,368 | | $13.22 -$ 17.85 | | 6.65 | | $ | 15.79 | | 167,035 | | $ | 15.04 |
| | | 236,416 | | $18.32 -$ 22.68 | | 8.59 | | $ | 19.63 | | 65,444 | | $ | 18.39 |
| | |
| |
| |
| |
|
| |
| |
|
|
Balance at December 31, 2004 | | 652,784 | | $ 4.34 -$ 22.68 | | 6.62 | | $ | 15.80 | | 412,479 | | $ | 13.71 |
The weighted-average fair value of options granted during 2004, 2003 and 2002 were $4.61, $3.98 and $3.88, respectively. The number of exercisable shares at December 31, 2004, 2003 and 2002 were 401,145, 336,551 and 303,444, respectively, with respective weighted average exercise prices of $13.58, $7.09 and $5.80.
Stock appreciation rights may be granted in tandem with non-qualified stock options. No stock appreciation rights have been granted under the Plan.
The options had a $.01 per share dilutive effect on earnings per share for the years ended December 31, 2004, 2003 and 2002, respectively.
14. Related Party Transactions:
In the ordinary course of business, the Bank granted loans to principal officers, directors and their affiliates. Loan activity during 2004 and 2003 was as follows:
Following is a summary of these transactions:
| | | | | | | | |
| (in thousands) | | 2004
| | | 2003
| |
Balance, beginning of year | | $ | 5,150 | | | $ | 5,026 | |
Additions | | | 2,009 | | | | 633 | |
Amounts collected | | | (904 | ) | | | (509 | ) |
| | |
|
|
| |
|
|
|
Balance, end of year | | $ | 6,255 | | | $ | 5,150 | |
| | |
|
|
| |
|
|
|
Related party deposits amounted to $1,968,000 and $1,116,000 at December 31, 2004 and 2003, respectively.
15. Financial Instruments with Off-Balance Sheet Risk and Concentration of Credit Risk:
The Corporation is a party to financial instruments with off-balance sheet risk in the normal course of business to meet the financing needs of its customers. These financial instruments include commitments to extend credit and standby letters of credit. Those instruments involve, to varying degrees, elements of credit risk in excess of the amount recognized in the consolidated statements of financial condition. The contractual amounts of those instruments reflect the extent of involvement the Corporation has in particular classes of financial instruments.
The Corporation’s exposure to credit loss in the event of nonperformance by the counterparty to the financial instrument of commitments to extend credit and standby letters of credit is represented by the contractual amount of those instruments. The Corporation uses the same credit policies in making commitments and conditional obligations as it does for on-balance sheet financial instruments.
Commitments to extend credit are agreements to lend to a customer as long as there is no violation of any condition established in the agreement. Commitments generally have fixed expiration dates or other termination clauses and may require payment of a fee. Some of the commitments are expected to expire without being drawn upon, and the total commitment amounts do not necessarily represent future cash requirements. Total commitments to extend credit at December 31, 2004 are $269,036,000. The Corporation evaluates each customer’s creditworthiness on a case-by-case basis. The amount of collateral obtained, if deemed necessary by the Corporation upon extension of credit, is based on management’s credit evaluation of the counterparty. Collateral varies but may include accounts receivable, marketable securities, inventory, property, plant and equipment, residential real estate, and income-producing commercial properties.
Standby letters of credit are conditional commitments issued by the Bank to a customer for a third party. Such standby letters of credits are issued to support private borrowing arrangements. The credit risk involved in issuing standby letters of credit is similar to that involved in extending loan facilities to customers. The collateral varies, but may include accounts receivable, marketable securities, inventory, property, plant and equipment, and residential real estate for those commitments for which collateral is deemed necessary. The Corporation’s obligation under standby letters of credit as of December 31, 2004 amounted to $8,803,000. There were no outstanding bankers acceptances as of December 31, 2004.
As of December 31, 2004, the Corporation had no loans sold with recourse outstanding.
The Corporation grants construction, commercial, residential mortgage, and consumer loans to customers primarily in Southeastern Pennsylvania. Although the Corporation has a diversified loan portfolio, its debtors’ ability to honor their contracts is substantially dependent upon the general economic conditions of the region.
16. Risks And Uncertainties:
The earnings of the Corporation depend on the earnings of the Bank. The Bank’s earnings are dependent upon both the level of net interest income and non-interest revenue streams, primarily fees for trust services that are earned annually. Accordingly, the earnings of the Corporation are subject to risks and uncertainties surrounding both its exposure to changes in the interest rate environment and movements in financial markets.
39
Most of the Bank’s lending activity is with customers located in Southeastern Pennsylvania. Lending is spread between commercial, consumer and real estate related loans, including construction lending. While these loan concentrations represent a potential concentration of credit risk, the Bank’s credit loss experience compares favorably to the Bank’s peer group credit loss experience.
The financial statements of the Corporation are prepared in conformity with generally accepted accounting principles that require management to make estimates and assumptions that affect the reported amounts of assets and liabilities, as well as disclosures of contingent assets and liabilities at the date of the financial statements and the reported amounts of revenues and expenses during the reported period. Actual results could differ from those estimates.
Significant estimates are made by management in determining the allowance for loan losses and the carrying value of other real estate owned. Consideration is given to a variety of factors in establishing these estimates, including current economic conditions, the results of the internal loan review process, delinquency statistics, borrowers perceived financial and managerial strengths and the adequacy of supporting collateral, if collateral dependent, or the present value of future cash flows. Since the allowance for loan losses and the carrying value of other real estate owned are dependent, to a great extent, on general and other economic conditions beyond the Bank’s control, it is at least reasonably possible that the estimates of the allowance for loan losses and the carrying value of other real estate owned could differ materially from currently reported values in the near term.
As a part of its mortgage loan servicing business, the Bank records the value of mortgage servicing rights (“MSRs”) as an asset at the time the respective residential mortgage loan is sold with the servicing retained by the Bank. Quarterly an independent firm is retained to (1) determine if any impairment in the MSR portfolio has occurred as of the current quarter end and (2) determine the amount of amortization of MSRs to be utilized in the upcoming quarter. Certain assumptions are made in determining the loan prepayment speeds for the respective residential mortgage loans that will determine the amount of amortization for the subsequent quarter. Should movements of related interest rates differ from those projected, the actual prepayment speeds and related amortization of MSRs could differ materially from those projected by the independent valuation.
17. Goodwill:
Joseph W. Roskos & Co. was acquired as of January 1, 1999. The transaction was accomplished on April 1, 1999 under the purchase method of accounting. Goodwill arising from this transaction was recorded on the balance sheet and was being amortized on a straight line basis over a 20 year period. Beginning in 2002, under Statement of Financial Accounting Standard No. 142 - Goodwill and Other Intangible Assets (“SFAS No 142”), all components of Goodwill are no longer to be amortized, but rather tested annually for any potential impairment. During the fourth quarter of 2002, the balance of goodwill was tested for impairment. Based on a discounted cash flow analysis, reflecting lower projected revenue streams for Joseph W. Roskos & Co. in future periods, it was determined that goodwill had impairment in the amount of $400,000. Therefore, the balance of goodwill was written down by $400,000 during the fourth quarter of 2002 to $2,405,000. As of June 30, 2003, the business of Joseph W. Roskos & Co. and substantially all of its assets were sold and the balance of $1,005,000 in goodwill was written off as a part of the sale transaction. As of December 31, 2004 and 2003, there was no goodwill recorded on the books of the Corporation.
18. Minimum Regulatory Capital Requirements:
Both the Corporation and the Bank are subject to various regulatory capital requirements, administered by the federal banking agencies. Failure to meet minimum capital requirements can initiate certain mandatory and possibly additional discretionary actions by regulators that, if taken, could have a direct material effect on the Corporation’s and the Bank’s financial statements. Under capital adequacy guidelines and the regulatory framework for prompt corrective action, the Corporation and the Bank must meet specific capital guidelines that involve quantitative measures of their assets, liabilities and certain off-balance-sheet items as calculated under regulatory accounting practices. The capital amounts and classifications are also subject to qualitative judgments by the regulators about components, risk weightings and other factors. Prompt corrective action provisions are not applicable to bank holding companies.
As set forth in the following table, quantitative measures have been established to ensure capital adequacy ratios required of both the Corporation and Bank, specifically to define the minimum respective capital ratios as follows: total capital to total assets (the leverage ratio) of 4%; Tier I capital to risk weighted assets of 4% and Tier II capital to risk weighted assets of 8%. Both the Corporation’s and the Bank’s Tier II capital ratios are calculated by adding back a portion of the loan loss reserve to the Tier I capital. Management believes, as of December 31, 2004 and 2003 that the Corporation and the Bank have met all capital adequacy requirements to which they are subject. Federal banking regulators have defined specific capital categories, based on an institution’s capital ratios. The categories range from a best of “well capitalized” to a worst of “critically under capitalized”. To be considered “well capitalized”, an institution must have a total (Tier II) capital ratio of 10% or better. Both the Corporation and the Bank have been classified as “well capitalized” for both periods ending December 31, 2004 and 2003.
40
The Corporation’s and the Bank’s actual capital amounts and ratios as of December 31, 2004 and 2003 are presented in the following table:
| | | | | | | | | | | | | | | |
| | | Actual
| | | Minimum
Capital
Requirement
| | | Minimum
to be Well
Capitalized
|
| | | Amount
| | Ratio
| | | Amount
| | Ratio
| | | Amount
|
December 31, 2004 | | | | | | | | | | | | | | | |
Total (Tier II) Capital to Risk Weighted Assets: | | | | | | | | | | | | | | | |
Consolidated | | $ | 78,312 | | 12.33 | % | | | | | 8.0 | % | | | N/A |
The Bank | | | 69,886 | | 11.09 | % | | $ | 50,417 | | 8.0 | % | | $ | 63,021 |
Tier I Capital to Risk Weighted Assets: | | | | | | | | | | | | | | | |
Consolidated | | | 71,378 | | 11.24 | % | | | | | 4.0 | % | | | N/A |
The Bank | | | 62,952 | | 9.99 | % | | | 25,209 | | 4.0 | % | | | 37,813 |
Total Capital to Total Assets (Leverage Ratio): | | | | | | | | | | | | | | | |
Consolidated | | | 71,238 | | 10.43 | % | | | | | 4.0 | % | | | N/A |
The Bank | | | 62,815 | | 9.26 | % | | | 27,122 | | 4.0 | % | | | 33,903 |
| | | | | |
December 31, 2003 | | | | | | | | | | | | | | | |
| | | | | |
Total (Tier II) Capital to Risk Weighted Assets: | | | | | | | | | | | | | | | |
Consolidated | | $ | 74,186 | | 13.01 | % | | | | | 8.0 | % | | | N/A |
The Bank | | | 63,776 | | 11.30 | % | | $ | 45,138 | | 8.0 | % | | $ | 56,423 |
Tier I Capital to Risk Weighted Assets: | | | | | | | | | | | | | | | |
Consolidated | | | 67,508 | | 11.84 | % | | | | | 4.0 | % | | | N/A |
The Bank | | | 57,098 | | 10.12 | % | | | 22,569 | | 4.0 | % | | | 33,854 |
Total Capital to Total Assets (Leverage Ratio): | | | | | | | | | | | | | | | |
Consolidated | | | 67,382 | | 11.14 | % | | | | | 4.0 | % | | | N/A |
The Bank | | | 56,972 | | 9.51 | % | | | 23,954 | | 4.0 | % | | | 29,973 |
19. Selected Quarterly Financial Data (Unaudited):
| | | | | | | | | | | | | | |
| | | Quarters ending 2004
|
| (In thousands, except per share data) | | 3/31
| | | 6/30
| | | 9/30
| | 12/31
|
Interest income | | $ | 7,452 | | | $ | 7,632 | | | $ | 7,969 | | $ | 8,328 |
Interest expense | | | 1,083 | | | | 1,083 | | | | 1,155 | | | 1,232 |
Net interest income | | | 6,369 | | | | 6,549 | | | | 6,814 | | | 7,096 |
Provision for loan losses | | | 187 | | | | 188 | | | | 187 | | | 338 |
Income before income taxes | | | 4,635 | | | | 3,239 | | | | 3,159 | | | 3,064 |
Net income | | $ | 3,020 | | | $ | 2,129 | | | $ | 2,109 | | $ | 2,087 |
Basic earnings per common share | | $ | 0.35 | | | $ | 0.25 | | | $ | 0.25 | | $ | 0.24 |
Diluted earnings per common share | | $ | 0.34 | | | $ | 0.24 | | | $ | 0.24 | | $ | 0.24 |
| |
| | | Quarters ending 2003
|
| (In thousands, except per share data) | | 3/31
| | | 6/30
| | | 9/30
| | 12/31
|
Interest income | | $ | 7,277 | | | $ | 7,264 | | | $ | 7,415 | | $ | 7,305 |
Interest expense | | | 1,096 | | | | 1,099 | | | | 1,066 | | | 1,069 |
Net interest income | | | 6,181 | | | | 6,165 | | | | 6,349 | | | 6,236 |
Provision for loan losses | | | 250 | | | | 250 | | | | 167 | | | 83 |
Income before income taxes and discontinued operations | | | 4,414 | | | | 4,191 | | | | 4,427 | | | 4,288 |
Income from continuing operations | | | 2,861 | | | | 2,737 | | | | 2,933 | | | 2,741 |
(Loss) income from discontinued operations | | | (192 | ) | | | (1,928 | ) | | | 150 | | | 54 |
Net income | | $ | 2,669 | | | $ | 809 | | | $ | 3,083 | | $ | 2,795 |
Basic earnings per common share | | | | | | | | | | | | | | |
Income from continuing operations | | $ | 0.33 | | | $ | 0.31 | | | $ | 0.34 | | $ | 0.32 |
(Loss) income from discontinued operations | | $ | (0.02 | ) | | $ | (0.22 | ) | | $ | 0.02 | | $ | 0.00 |
| | |
|
|
| |
|
|
| |
|
| |
|
|
Total earnings per common share | | $ | 0.31 | | | $ | 0.09 | | | $ | 0.36 | | $ | 0.32 |
| | | | |
Diluted earnings per common share: | | | | | | | | | | | | | | |
Income from continuing operations | | $ | 0.32 | | | $ | 0.31 | | | $ | 0.33 | | $ | 0.31 |
(Loss) income from discontinued operations | | $ | (0.02 | ) | | $ | (0.22 | ) | | $ | 0.02 | | $ | 0.00 |
| | |
|
|
| |
|
|
| |
|
| |
|
|
Total earnings per common share | | $ | 0.30 | | | $ | 0.09 | | | $ | 0.35 | | $ | 0.31 |
20. Condensed Financial Statements:
The condensed financial statements of the Corporation (parent company only) as of December 31, 2004 and 2003, and for each of the three years in the period ended December 31, 2004, are as follows:
Condensed Balance Sheets
| | | | | | | | |
| (in thousands) | | 2004
| | | 2003
| |
Assets: | | | | | | | | |
Cash | | $ | 1,174 | | | $ | 3,076 | |
Investments in subsidiaries, at equity in net assets | | | 66,665 | | | | 60,773 | |
Premises and equipment, net | | | 3,467 | | | | 3,565 | |
Assets from discontinued operations | | | — | | | | — | |
Other assets | | | 543 | | | | 614 | |
| | |
|
|
| |
|
|
|
Total assets | | $ | 71,849 | | | $ | 68,028 | |
| | |
|
|
| |
|
|
|
Liabilities and shareholders’ equity: | | | | | | | | |
Mortgages payable | | | — | | | | — | |
Other liabilities | | | 611 | | | | 646 | |
| | |
|
|
| |
|
|
|
Total liabilities | | | 611 | | | | 646 | |
| | |
|
|
| |
|
|
|
Common stock, par value $1, authorized 25,000,000 shares as of December 31, 2004 and 2003, respectively, issued 11,172,582 shares and 11,135,232 shares as of December 31, 2004 and 2003, respectively and outstanding 8,597,958 shares and 8,670,974 shares as of December 31, 2004 and 2003, respectively | | | 11,172 | | | | 11,135 | |
Paid-in capital in excess of par value | | | 7,112 | | | | 6,487 | |
Accumulated other comprehensive income, net of deferred income taxes | | | (288) | | | | (126) | |
Retained earnings | | | 75,179 | | | | 69,280 | |
Less common stock in treasury, at cost - 2,574,624 shares and 2,464,258 shares as of December 31, 2004 and 2003 | | | (21,937 | ) | | | (19,394 | ) |
Total shareholders’ equity | | | 71,238 | | | | 67,382 | |
| | |
|
|
| |
|
|
|
Total liabilities and shareholders’ equity | | $ | 71,849 | | | $ | 68,028 | |
| | |
|
|
| |
|
|
|
| | | | | | | | | | | |
| Condensed Statements of Income | | | | | | | | | | | |
| | | |
| (in thousands) | | 2004
| | 2003
| | | 2002
| |
Dividends from The Bryn Mawr Trust Company | | $ | 3,446 | | $ | 3,465 | | | $ | 4,816 | |
Interest and other income | | | 236 | | | 236 | | | | 236 | |
| | |
|
| |
|
|
| |
|
|
|
Total operating income | | | 3,682 | | | 3,701 | | | | 5,052 | |
Expenses | | | 472 | | | 459 | | | | 591 | |
| | |
|
| |
|
|
| |
|
|
|
Income before equity in undistributed income of subsidiaries | | | 3,210 | | | 3,242 | | | | 4,461 | |
Equity in undistributed income of subsidiaries | | | 6,055 | | | 7,954 | | | | 6,060 | |
Income before income taxes and discontinued operations | | | 9,265 | | | 11,196 | | | | 10,521 | |
Federal income tax benefit | | | 80 | | | 76 | | | | 121 | |
| | |
|
| |
|
|
| |
|
|
|
Income from continuing operations | | | 9,345 | | | 11,272 | | | | 10,642 | |
(Loss) income from discontinued operations | | | 0 | | | (1,916 | ) | | | (435 | ) |
| | |
|
| |
|
|
| |
|
|
|
Net income | | $ | 9,345 | | $ | 9,356 | | | $ | 10,207 | |
| | |
|
| |
|
|
| |
|
|
|
41
Condensed Statements of Cash Flows
| | | | | | | | | | | | |
| (in thousands) | | 2004
| | | 2003
| | | 2002
| |
Operating activities: | | | | | | | | | | | | |
Income from continuing operations | | $ | 9,345 | | | $ | 11,272 | | | $ | 10,641 | |
Adjustments to reconcile net income to net cash provided by operating activities: | | | | | | | | | | | | |
Equity in undistributed income (losses) of subsidiaries | | | (6,054 | ) | | | (7,954 | ) | | | (6,060 | ) |
Depreciation expense | | | 98 | | | | 98 | | | | 99 | |
Other | | | (19 | ) | | | (221 | ) | | | 1,916 | |
| | |
|
|
| |
|
|
| |
|
|
|
Net cash provided by operating activities | | | 3,370 | | | | 3,195 | | | | 6,596 | |
Investing Activities: | | | | | | | | | | | | |
Investment in Subsidiaries | | | 162 | | | | 1,313 | | | | 2,494 | |
| | |
|
|
| |
|
|
| |
|
|
|
Net cash provided by investing activities | | | 162 | | | | 1,313 | | | | 2,494 | |
Financing activities: | | | | | | | | | | | | |
Dividends paid | | | (3,446 | ) | | | (3,465 | ) | | | (3,317 | ) |
Repayment of mortgage debt | | | 0 | | | | (513 | ) | | | (46 | ) |
Repurchase of treasury stock | | | (2,585 | ) | | | (1,787 | ) | | | (6,183 | ) |
Proceeds from issuance of stock | | | 597 | | | | 838 | | | | 3,228 | |
| | |
|
|
| |
|
|
| |
|
|
|
Net cash used by financing activities | | | (5,434 | ) | | | (4,927 | ) | | | (6,318 | ) |
| | |
|
|
| |
|
|
| |
|
|
|
Net cash (used) provided by continuing operations | | | (1,902 | ) | | | (419 | ) | | | 2,772 | |
Net cash provided by discontinued operations | | | 0 | | | | 489 | | | | 0 | |
| | |
|
|
| |
|
|
| |
|
|
|
Change in cash and cash equivalents | | | (1,902 | ) | | | 70 | | | | 2,772 | |
Cash and cash equivalents at beginning of year | | | 3,076 | | | | 3,006 | | | | 234 | |
| | |
|
|
| |
|
|
| |
|
|
|
Cash and cash equivalents at end of year | | $ | 1,174 | | | $ | 3,076 | | | $ | 3,006 | |
| | |
|
|
| |
|
|
| |
|
|
|
These statements should be read in conjunction with the other notes related to the consolidated financial statements.
As a bank and trust company subject to the Pennsylvania Banking Code (the “Banking Code”) of 1965 as amended, the Bank is subject to legal limitations as to the amount of dividends that can be paid to its shareholder, the Corporation. The Banking Code restricts the payment of dividends by the Bank to the amount of its retained earnings. As of December 31, 2004, the Bank’s retained earnings amounted to $56,514,000. Therefore, as of December 31, 2004, dividends available for payment to the Corporation are limited to $56,514,000. Since the primary source of dividend funding for the Corporation’s dividend payments to its shareholders is the Bank’s dividends, the Corporation is effectively limited as to the amount of dividends that it may pay to an amount equal to the limits placed on the Bank, as discussed above.
42
21. Segment Information:
The Corporation’s principal operating segments are structured around the financial services provided its customers. The Banking segment gathers deposits and makes funds available for loans to its customers. The Banks Wealth Management segment provides both corporate and individual investment management and trust products and services. The Bank’s Mortgage Banking segment originates and sells residential mortgage loans to the secondary mortgage market.
Segment information for the years ended December 31, 2004, 2003, and 2002, including income from continuing operations, is as follows:
| | | | | | | | | | | | | | | | | | | | | | | | | | | | | | | | | | | | | | | | | | | | | | | | | | | | | | | | | | | | |
| | | 2004
| | | 2003
| | | 2002
| |
| (in thousands) | | Banking
| | | Wealth Management
| | | Mortgage Banking
| | | All Other
| | | Consolidated
| | | Banking
| | | Wealth Management
| | | Mortgage Banking
| | | All Other
| | | Consolidated
| | | Banking
| | | Wealth Management
| | | Mortgage Banking
| | | All Other
| | | Consolidated
| |
Net interest income | | $ | 26,487 | | | $ | — | | | $ | 255 | | | $ | 86 | | | $ | 26,828 | | | $ | 24,707 | | | $ | — | | | $ | 160 | | | $ | 64 | | | $ | 24,931 | | | $ | 24,697 | | | $ | — | | | $ | 200 | | | $ | 31 | | | $ | 24,928 | |
Less loan loss provision | | | 900 | | | | — | | | | — | | | | — | | | | 900 | | | | 750 | | | | — | | | | — | | | | — | | | | 750 | | | | 1,000 | | | | — | | | | — | | | | — | | | | 1,000 | |
Net interest income after loan loss provision | | | 25,587 | | | | — | | | | 255 | | | | 86 | | | | 25,928 | | | | 23,957 | | | | — | | | | 160 | | | | 64 | | | | 24,181 | | | | 23,697 | | | | — | | | | 200 | | | | 31 | | | | 23,928 | |
Other income: | | | | | | | | | | | | | | | | | | | | | | | | | | | | | | | | | | | | | | | | | | | | | | | | | | | | | | | | | | | | |
Fees for investment management and trust services | | | — | | | | 10,087 | | | | — | | | | — | | | | 10,087 | | | | — | | | | 9,484 | | | | — | | | | — | | | | 9,484 | | | | — | | | | 8,620 | | | | — | | | | — | | | | 8,620 | |
Service charges on deposit accounts | | | 1,827 | | | | — | | | | — | | | | — | | | | 1,827 | | | | 1,896 | | | | — | | | | — | | | | — | | | | 1,896 | | | | 1,822 | | | | — | | | | — | | | | — | | | | 1,822 | |
Other fees and service charges | | | 209 | | | | — | | | | 1,670 | | | | — | | | | 1,879 | | | | 199 | | | | — | | | | 2,221 | | | | — | | | | 2,420 | | | | 235 | | | | — | | | | 1,512 | | | | — | | | | 1,747 | |
Net gain on sale of loans | | | 34 | | | | — | | | | 2,886 | | | | — | | | | 2,920 | | | | 13 | | | | — | | | | 10,637 | | | | — | | | | 10,650 | | | | 6 | | | | — | | | | 9,647 | | | | — | | | | 9,653 | |
Net gain on sale of mortgage servicing rights | | | 1,145 | | | | — | | | | — | | | | — | | | | 1,145 | | | | — | | | | — | | | | — | | | | — | | | | | | | | — | | | | — | | | | — | | | | — | | | | — | |
Other operating income | | | 1,547 | | | | | | | | 112 | | | | 667 | | | | 2,326 | | | | 1,496 | | | | | | | | 454 | | | | 637 | | | | 2,587 | | | | 1,567 | | | | 3 | | | | 351 | | | | 618 | | | | 2,539 | |
| | |
|
|
| |
|
|
| |
|
|
| |
|
|
| |
|
|
| |
|
|
| |
|
|
| |
|
|
| |
|
|
| |
|
|
| |
|
|
| |
|
|
| |
|
|
| |
|
|
| |
|
|
|
Total other income | | | 4,762 | | | | 10,087 | | | | 4,668 | | | | 667 | | | | 20,184 | | | | 3,604 | | | | 9,484 | | | | 13,312 | | | | 637 | | | | 27,037 | | | | 3,630 | | | | 8,623 | | | | 11,510 | | | | 618 | | | | 24,381 | |
Other expenses: | | | | | | | | | | | | | | | | | | | | | | | | | | | | | | | | | | | | | | | | | | | | | | | | | | | | | | | | | | | | |
Salaries-regular | | | 8,789 | | | | 3,674 | | | | 904 | | | | 200 | | | | 13,567 | | | | 8,274 | | | | 3,665 | | | | 1,343 | | | | 314 | | | | 13,596 | | | | 7,874 | | | | 3,464 | | | | 1,088 | | | | 281 | | | | 12,707 | |
Salaries-other | | | 942 | | | | 322 | | | | 171 | | | | 11 | | | | 1,446 | | | | 479 | | | | 113 | | | | 833 | | | | 13 | | | | 1,438 | | | | 1,985 | | | | 291 | | | | 692 | | | | 10 | | | | 2,978 | |
Fringe benefits | | | 3,260 | | | | 820 | | | | 165 | | | | 52 | | | | 4,297 | | | | 3,267 | | | | 839 | | | | 195 | | | | 52 | | | | 4,353 | | | | 2,451 | | | | 706 | | | | 88 | | | | 50 | | | | 3,295 | |
Occupancy | | | 3,246 | | | | 572 | | | | 249 | | | | 131 | | | | 4,198 | | | | 2,994 | | | | 617 | | | | 258 | | | | 216 | | | | 4,085 | | | | 3,086 | | | | 580 | | | | 172 | | | | 316 | | | | 4,154 | |
Other operating expenses | | | 5,343 | | | | 1,046 | | | | 1,678 | | | | 440 | | | | 8,507 | | | | 4,182 | | | | 1,002 | | | | 4,855 | | | | 386 | | | | 10,425 | | | | 4,778 | | | | 891 | | | | 2,859 | | | | 462 | | | | 8,990 | |
| | |
|
|
| |
|
|
| |
|
|
| |
|
|
| |
|
|
| |
|
|
| |
|
|
| |
|
|
| |
|
|
| |
|
|
| |
|
|
| |
|
|
| |
|
|
| |
|
|
| |
|
|
|
Total other expenses | | | 21,580 | | | | 6,434 | | | | 3,167 | | | | 834 | | | | 32,015 | | | | 19,196 | | | | 6,236 | | | | 7,484 | | | | 981 | | | | 33,897 | | | | 20,174 | | | | 5,932 | | | | 4,899 | | | | 1,119 | | | | 32,124 | |
| | |
|
|
| |
|
|
| |
|
|
| |
|
|
| |
|
|
| |
|
|
| |
|
|
| |
|
|
| |
|
|
| |
|
|
| |
|
|
| |
|
|
| |
|
|
| |
|
|
| |
|
|
|
Segment profit (loss) | | | 8,769 | | | | 3,653 | | | | 1,756 | | | | (81 | ) | | | 14,097 | | | | 8,365 | | | | 3,248 | | | | 5,988 | | | | (280 | ) | | | 17,321 | | | | 7,153 | | | | 2,691 | | | | 6,811 | | | | (470 | ) | | | 16,185 | |
Intersegment (revenues) expenses | | | 166 | | | | 181 | | | | — | | | | (347 | ) | | | — | | | | 111 | | | | 181 | | | | — | | | | (292 | ) | | | — | | | | (15 | ) | | | 181 | | | | — | | | | (166 | ) | | | — | |
| | |
|
|
| |
|
|
| |
|
|
| |
|
|
| |
|
|
| |
|
|
| |
|
|
| |
|
|
| |
|
|
| |
|
|
| |
|
|
| |
|
|
| |
|
|
| |
|
|
| |
|
|
|
Segment profit after eliminations | | $ | 8,935 | | | $ | 3,834 | | | $ | 1,756 | | | $ | (428 | ) | | $ | 14,097 | | | $ | 8,476 | | | $ | 3,429 | | | $ | 5,988 | | | $ | (572 | ) | | $ | 17,321 | | | $ | 7,138 | | | $ | 2,872 | | | $ | 6,811 | | | $ | (636 | ) | | $ | 16,185 | |
| | |
|
|
| |
|
|
| |
|
|
| |
|
|
| |
|
|
| |
|
|
| |
|
|
| |
|
|
| |
|
|
| |
|
|
| |
|
|
| |
|
|
| |
|
|
| |
|
|
| |
|
|
|
% of segment profit (loss) | | | 63 | % | | | 27 | % | | | 13 | % | | | (3 | )% | | | 100 | % | | | 49 | % | | | 20 | % | | | 34 | % | | | (3 | )% | | | 100 | % | | | 44 | % | | | 18 | % | | | 42 | % | | | (4 | )% | | | 100 | % |
Total assets at December 31 | | $ | 588,750 | | | $ | 865 | | | $ | 88,446 | | | $ | 4,885 | | | $ | 682,946 | | | $ | 528,654 | | | $ | 967 | | | $ | 69,636 | | | $ | 5,591 | | | $ | 604,848 | | | $ | 485,717 | | | $ | 1,117 | | | $ | 86,288 | | | $ | 4,305 | | | $ | 577,427 | |
Capital expenditures | | $ | 1,874 | | | $ | 32 | | | $ | 42 | | | $ | 6 | | | $ | 1,954 | | | $ | 2,848 | | | $ | 22 | | | $ | 52 | | | $ | 3 | | | $ | 2,925 | | | $ | 770 | | | $ | 58 | | | $ | 134 | | | $ | 19 | | | $ | 981 | |
Depreciation and amortization | | $ | 1,050 | | | | $142 | | | | $80 | | | | $104 | | | | $1,376 | | | | $971 | | | | $187 | | | | $73 | | | | $105 | | | | $1,336 | | | | $1,046 | | | | $176 | | | | $31 | | | | $108 | | | | $1,361 | |
BMT Mortgage Company, a division of the Bank and Bryn Mawr Settlement Services, Inc. have been aggregated in Mortgage Banking.
Bryn Mawr Bank Corporation, Insurance Counsellors of Bryn Mawr, Inc., and Bryn Mawr Finance Inc. have all been aggregated in All Others.
| * | Reclassified for comparative purposes. |
43
[This page was intentionally left blank.]