Exhibit 13.1
Commission File No. 0-15261
SECURITIES AND EXCHANGE COMMISSION
Washington, DC 20549
FORM 10-K
ANNUAL REPORT PURSUANT TO SECTION 13 OR 15(d) OF
THE SECURITIES AND EXCHANGE ACT OF 1934
For the Year Ended December 31, 2007
BRYN MAWR BANK CORPORATION


| | |
• Total Loans and Leases up 17.9% • Non-Interest Income increased 18.6% over 2006 • Total Assets increased 21.2% | |  |
| |
| |
DEAR FELLOW SHAREHOLDERS
Despite one of the most challenging banking environments in decades, Bryn Mawr Bank Corporation and our principal subsidiary, The Bryn Mawr Trust Company, had yet another excellent year in 2007. Our diluted earnings-per-share increased 8.2% over the previous year and our Return-on-Equity of 15.8% and Return-on-Assets of 1.59% put us among the top performing financial institutions in the nation.
Investing for the future, the Corporation undertook six major initiatives during the last part of 2006 and during 2007. These initiatives were all dilutive to earnings in 2007, but should all be accretive to earnings in 2008. Let me re-cap these enterprises and summarize their progress this past year.
Our new equipment leasing company, BMT Leasing, has been a resounding success. The company was profitable well ahead of schedule and, as of the date of this letter, lease balances are in excess of $50 million. We are looking for this unit to be a major contributor to earnings in 2008.
Our West Chester Loan Production Office was the result of hiring two highly-seasoned lenders from another bank. We are pleased with our results thus far and look forward to the opening of our regional banking office, to include a commercial loan department and trust office, in West Chester later this year.
The new Ardmore Branch opened up in January 2007 and has performed ahead of our most optimistic projections. Our strategy of building large, full-service, and well-located banking offices has worked well for the Corporation.
In May of 2007, we formed a separate Private Banking Group to handle our most affluent clients. This unit combines our deposit, credit, and wealth services and has been adding new clients much faster than anticipated.
During the entire past year, we spent a great deal of energy, time, and money re-tooling our Wealth Division. Matt Waschull was brought in from Wilmington Trust, where he was one of their top executives, to head up this Division. Our financial planning abilities were greatly enhanced through the addition of a very senior planner hired from Vanguard. In addition, we introduced a new Separately-Managed-Account investment product with a strategic partner, Federated Investors. Our goal for the Wealth Division is to grow our assets under management and administration in this business line to $5 billion, from the current $2.2 billion, within five years.
This past spring we hired five experienced mortgage professionals, who formed BMT Mortgage Group, to serve the Chester County and state of Delaware regions. This
2
2007 ANNUAL REPORT
“Despite what most predict will be another tough year for the banking industry, Bryn Mawr Bank Corporation is poised for another successful year. We appreciate the encouragement and loyalty that you, as shareholders, have given us. I can assure you that both management and the directors are working hard to earn your support.”
—Ted PetersChairman and Chief Executive Officer
complements our other two existing mortgage companies— BMT Mortgage Company and BMT Mortgage Services which handle different markets.
While we are excited about these new enterprises, the Corporation is not standing still. We have three major initiatives planned for 2008.
As mentioned earlier, we will be building a large regional banking office in West Chester. This will solidify our presence in Chester County and will be the anchor of future expansion in that area. Our anticipated opening is in the fourth quarter of this year.
Our Separately-Managed-Account program will continue to evolve in 2008 with the addition of multiple investment styles. We will work with Federated Investors on this project, as well as other outside investment managers. A more robust investment selection should make this program even more attractive to potential clients.
We are applying for trust powers in the State of Delaware and anticipate opening an office in Wilmington later this summer. Delaware’s trust statutes allow the Bank to offer various trust services—such as directed trusts and generation skipping trusts —which are not as attractive when offered in Pennsylvania.
Despite what most predict will be another tough year for the banking industry, Bryn Mawr Bank Corporation is poised for another successful year. We appreciate the encouragement and loyalty that you, as shareholders, have given us. I can assure you that both management and the directors are working hard to earn your support.
As always, please contact me directly at 610-581-4800 or tpeters@bmtc.com if I can help you in any way.
|
| Sincerely, |
|
 |
| Ted Peters |
| Chairman and Chief Executive Officer |
3
2007 ANNUAL REPORT
CONSOLIDATED FINANCIAL HIGHLIGHTS
dollars in thousands, except per share data
| | | | | | | | | | | | | | | |
| | | 2007 | | | 2006 | | | CHANGE | |
FOR THE YEAR | | | | | | | | | | | | |
Net interest income | | $ | 34,242 | | | $ | 33,299 | | | $ | 943 | | | 2.8 | % |
Net interest income after loan and lease loss provision | | | 33,351 | | | | 32,467 | | | | 884 | | | 2.7 | |
Non-interest income | | | 21,781 | | | | 18,361 | | | | 3,420 | | | 18.6 | |
Non-interest expenses | | | 34,959 | | | | 31,423 | | | | 3,536 | | | 11.3 | |
Income taxes | | | 6,573 | | | | 6,689 | | | | (116 | ) | | (1.7 | ) |
Net income | | | 13,600 | | | | 12,716 | | | | 884 | | | 7.0 | |
AT YEAR - END | | | | | | | | | | | | | | | |
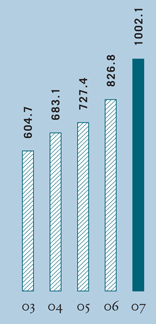
Total assets | | $ | 1,002,096 | | | $ | 826,817 | | | $ | 175,279 | | | 21.2 | % |
Total portfolio loans and leases | | | 802,925 | | | | 681,291 | | | | 121,634 | | | 17.9 | |
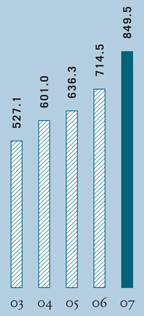
Total deposits | | | 849,528 | | | | 714,489 | | | | 135,039 | | | 18.9 | |
Shareholders’ equity | | | 90,351 | | | | 82,092 | | | | 8,259 | | | 10.1 | |
Assets under management and administration—Wealth Division | | | 2,191,753 | | | | 2,102,468 | | | | 89,292 | | | 4.2 | |
PER COMMON SHARE | | | | | | | | | | | | | | | |
Basic earnings | | $ | 1.59 | | | $ | 1.48 | | | $ | 0.11 | | | 7.4 | % |
Diluted earnings | | | 1.58 | | | | 1.46 | | | | 0.12 | | | 8.2 | |
Dividends declared | | | 0.50 | | | | 0.46 | | | | 0.04 | | | 8.7 | |
Book value | | | 10.60 | | | | 9.59 | | | | 1.01 | | | 10.5 | |
Closing price | | | 22.93 | | | | 23.64 | | | | (0.71 | ) | | (3.0 | ) |
SELECTED RATIOS | | | | | | | | | | | | | | | |
Return on average assets | | | 1.59 | % | | | 1.72 | % | | | | | | | |
Return on average shareholders’ equity | | | 15.87 | | | | 15.71 | | | | | | | | |
Tax equivalent net interest margin | | | 4.37 | | | | 4.90 | | | | | | | | |
Efficiency ratio | | | 62.40 | | | | 60.83 | | | | | | | | |
Our vision is to be the preeminent community banking and wealth management organization in the Philadelphia area.
4
2007 ANNUAL REPORT
| | | | |
TOTAL ASSETS dollars in millions | | PORTFOLIO LOANS AND LEASES dollars in millions | | TOTAL DEPOSITS dollars in millions |
| | |
 | |  | |  |
| | |
NET INCOME dollars in millions | | DILUTED EARNINGS PER SHARE dollars | | ASSETS UNDER MANAGEMENT AND ADMINISTRATION — WEALTH DIVISION dollars in billions |
| | |
 | |  | |  |
5
2007 ANNUAL REPORT

p | PICTURED FROM LEFT TO RIGHT SEATED: Michelle L. Wilson, Vice President & Portfolio Manager; Lisa A. Mossie, Assistant Treasurer & Portfolio Manager; Joseph G. Keefer, Executive Vice President; Martin F. Gallagher, Jr., Senior Vice President/Senior Relationship Manager; Marilee N. Connor, Vice President & Portfolio Manager; David W. Glarner, Senior Vice President;STANDING:Peter J. D’Angelo, Senior Vice President; Joseph A. Puccino, Group Vice President; Gary R. Faggioli, Vice President; Alirezqa Zoghi Zarandi, Assistant Vice President & Portfolio Manager; Robert Latshaw, Vice President; Anthony Murphy, Portfolio Manager; James J. Egan, Senior Vice President/Senior Relationship Manager; George M. Teplica, Senior Vice President/Senior Relationship Manager |
OUR MISSION
| • | | To operate the Corporation and its subsidiaries in a sound and ethical manner. |
| • | | To provide our shareholders with a return on their investment, superior to comparative bank stock indices. |
| • | | To provide the highest quality products and the finest service to our clients. |
| • | | To be an active and contributing member of the communities we serve. |
| • | | To provide a working environment for our employees that is supportive, challenging, positive and fair. |
6
2007 ANNUAL REPORT

p | PICTURED CLOCKWISE FROM TOP LEFT: Myron H. Headen, Senior Vice President; Mary Cay O’Keefe, Vice President/Assistant Secretary; Margie Pham, Assistant Vice President/Assistant Secretary; Susan S. Shute, Vice President |
| | |
OUR VALUE PROPOSITION • At Bryn Mawr Trust we have only the highest quality banking and investment services. Our staff consists of well-trained professionals who understand that friendly and prompt service is of the utmost importance to our clients. • All clients have access to senior management, including the President. • Bryn Mawr Trust has been an independent local bank and trust company for over a century. We are truly community bankers, dedicated to making the Philadelphia area a better place for residents and businesses. | |  |
7
2007 ANNUAL REPORT
OUR CORE STRATEGIES
| • | | Open a Chester County regional office to include Wealth and Commercial Lending staff. |
| • | | Concentrate on our four competencies—Wealth and Private Banking, Business Banking, “High Touch” Retail Banking, and Mortgage Banking. |
| • | | Increase loan and deposits 8 – 12% per year. Maximize net interest margin. |
| • | | Obsession with client service. Constant emphasis and monitoring by all levels of management. |
| • | | Build an aggressive sales culture. Expand and enhance the Share-the-Client program. Continue to develop incentive compensation programs that emphasize new business development. |
| • | | Maintain a close control on expenses. |
q | PICTURED FROM LEFT TO RIGHT: Gale R. Flandreau, Esquire, Senior Vice President; Matthew G. Waschull, Executive Vice President; Karen A. Fahrner, Esquire, Senior Vice President; Ellen T. Jordan, Vice President |

8
2007 ANNUAL REPORT
YEAR IN REVIEW
Bryn Mawr Trust experienced solid performance in 2007 despite a very challenging banking environment. We are pleased to share with you some highlights of our 2007 strategies and tactics.
TEAMWORK
The success we achieved was, in large part, a result of having a dedicated team of professionals working together for a common goal. Our goal, quite simply, is to be the preeminent community bank and wealth management organization in the Philadelphia area. Our management team, at every level of the organization, consistently emphasizes the importance of providing quality service to our clients along with the finest products in the market. Our sales culture continues to produce positive results. We have developed incentive programs that encourage change and reward exceptional performance. With our experienced management team, supported by a dedicated board of directors, we have created an environment where creativity is encouraged, performance is rewarded, and shareholders, clients and employees benefit.
INVESTING IN PRODUCTS, SERVICES AND FACILITIES
Extensive interior and exterior renovations were begun at our Wayne Branch in the fourth quarter and this project is expected to be completed in the second quarter of 2008. When renovations are completed, this branch will be a more attractive and inviting environment for our clients. Benefits of this project include improved vehicle traffic flow, additional parking and an overall improvement in our ability to serve our clients more efficiently and effectively. We had hoped to open our new West Chester branch in 2007; however, we encountered some unexpected delays. We are moving forward with this facility and anticipate opening late in 2008. Expansion of our branch network is an important strategy and we believe our entry into the West Chester market will provide us access to a large group of potential customers who are in our target demographic market. Our Ardmore Branch, which opened in January 2007, is off to a great start with deposit balances growing well ahead of projections. We are very encouraged with these results and we have high expectations for this branch’s continued growth.
To improve communications with our clients and prospects we have revised our brochures and other point-of-sale materials. The new collateral materials present information about our products and services in a fresh and easy to read format.
One of our goals is to provide customers with the highest quality products and services to meet their financial services needs. We delivered three new products to our customers in 2007 including a non-proprietary separately managed investment account (SMA), e-Z Banking, and e-Z Escrow.
| | |
q PICTURED FROM LEFT TO RIGHT: George Connell, Jr., Senior Vice President, SMA Strategies; F. Peter Brodie, Senior Vice President, Chief Investment Officer; Miguel L. Biamon, Senior Vice President/Director of Fixed Income Management | | q PICTURED FROM LEFT TO RIGHT: Richard Rollins, II, Vice President/Business Development Officer; Mary Beth Birkenmeier, Assistant Vice President; Malcolm Brown, Assistant Treasurer; Walter Smedley, III, Senior Vice President; Mary M. Cunningham, Associate/Administrator; Linda N. Kahley, Vice President and Assistant Secretary |
| |
 | |  |
9
2007 ANNUAL REPORT
| | |
 | |  |
| |
q PICTURED FROM LEFT TO RIGHT: Joseph G. Keefer, Executive Vice President and Chief Lending Officer; J. Duncan Smith, Executive Vice President and Chief Financial Officer | | q PICTURED FROM LEFT TO RIGHT: Robert J. Ricciardi, Executive Vice President/Chief Credit Policy Officer; Francis J. Leto, Board Member |
The introduction of the SMA strategy marked the achievement of our objective to offer this investment option to our clients in 2007. We partnered with Federated Investors, Inc., a prominent investment management firm headquartered in Pittsburgh, PA to deliver this highly valued investment strategy to our wealth clients and prospects. The new SMA strategy was reviewed and approved by our Investment Policy Committee to ensure that clients receive the same quality and asset allocation philosophy inherent in our proprietary solutions. We plan to add other outside managers to our wealth management platform in 2008. To introduce the new SMA strategy, we held a seminar in September, 2007, which was well attended by clients, prospects and referral sources.
Two new business products were added to our product line with the introduction of e-Z Banking and e-Z Escrow. These automated services will allow our business customers to save time and money and operate more efficiently and effectively. Customers can scan and deposit checks into their Bryn Mawr Trust checking account, from their office, with e-Z Banking. It is a safe, secure and convenient way to make deposits, simplify record keeping and improve cash flow.
Any business that handles or administers escrow deposits will benefit from our e-Z Escrow product. We track all client escrow deposits and provide comprehensive monthly statements, eliminating the need for manually tracking and reporting escrow activity.
GIVING BACK TO THE COMMUNITY
At Bryn Mawr Trust we believe it is important to be an active and contributing member of the communities we serve. We support our communities through volunteerism as well as through financial contributions and sponsorships. Last year we contributed generously to a wide variety of educational, cultural and civic organizations that make such a positive impact on the lives of so many members of our community. Through our participation in the Commonwealth of Pennsylvania’s Educational Improvement Tax Credits Program we were able to support scholarship programs at 36 local schools and educational foundations.
WEALTH MANAGEMENT DIVISION CONTINUES TO BUILD MOMENTUM
Financial industry experts, customers and competitors recognize Bryn Mawr Trust as a premier wealth management firm in the Philadelphia area. Our professionals are sought out for their opinions, comments and advice on a variety of wealth management topics. We received a record number of requests from the media during 2007 and our professionals were seen on CNBC, CN8 Money Matters and Bloomberg TV, heard on KYW Radio 1060 and quoted in a variety of publications including:Bloomberg News,Private Asset Management,Smart Money,Associated Press,Investment News,USA Today,Main Line Times andThe Philadelphia Inquirer.
10
2007 ANNUAL REPORT
| | |
 | |  |
| |
p PICTURED FROM LEFT TO RIGHT: June M. Falcone, Senior Vice President; Sara P. Worrell, Vice President | | p PICTURED FROM LEFT TO RIGHT: Alison E. Gers, Executive Vice President, Retail Banking; Stephen P. Novak, Senior Vice President, Retail Banking |
Ellen Jordan, CFP (Certified Financial Planner) joined the Wealth Management Division in June, 2007. She has more than 20 years experience in the financial services industry and will work with our clients to prepare comprehensive financial plans.
We expect to expand our market into the state of Delaware with a limited purpose trust company (LPTC) during 2008. Our projected opening in Wilmington, subject to regulatory approval, is scheduled for this coming July. The LPTC will empower the organization to serve as a corporate fiduciary under Delaware statutes, which are more favorable for individuals and families. This initiative will open up a national market for our product offerings. Detailed planning for this initiative was started during 2007.
TWO NEW GROUPS FORMED
In early May we announced the formation of The Private Banking Group at Bryn Mawr Trust. Their mission is to ensure that all of the many resources throughout the Company are dedicated to the comprehensive financial stewardship of affluent individuals and families. Walter Smedley, III, CFP, ChFC, was appointed as the Managing Director of this new division. He is supported by a particularly skilled and knowledgeable team who average over 25 years of experience in all areas of financial services.
The BMT Mortgage Group was formed to augment the Corporation’s existing mortgage operations. This group of experienced mortgage industry professionals focuses their efforts on developing the Chester County, PA and state of Delaware mortgage markets.
CORPORATE GOVERNANCE
Our excellent reputation is one of our most valuable assets. We have worked very hard to earn your trust, and several years ago adopted comprehensive corporate governance policies and practices. Our goal is to promote the highest standards and ethical conduct for our directors and employees in the management of Bryn Mawr Trust. Francis J. Leto, Lead Director of the Board, and Chairman of the Nominating and Corporate Governance Committee, works closely with our executive management team to keep the corporation up-to-date on corporate governance and compliance issues.
One of our goals is to provide customers with the highest quality products and services to meet their financial services needs.
11
2007 ANNUAL REPORT
CORPORATE INFORMATION
CORPORATE HEADQUARTERS
801 Lancaster Avenue
Bryn Mawr, Pennsylvania 19010
610-525-1700
www.bmtc.com
DIRECTORS
Thomas L. Bennett
Private Investor, Director and Trustee of the
Delaware Investments Family of Funds
Andrea F. Gilbert
President, Bryn Mawr Hospital
Wendell F. Holland
Chairman, Pennsylvania Public Utilities Commission
Scott M. Jenkins
President, S.M. Jenkins & Co.
David E. Lees
Senior Partner, myCIO Wealth Partners, LLC
Francis J. Leto
Attorney-at-law, Brett Senior & Associates; President,
Brandywine Abstract Company, L.P.
Britton H. Murdoch
CEO, City Line Motors;
Managing Director, Strattech Partners
Frederick C. “Ted” Peters II
Chairman, President and Chief Executive Officer,
Bryn Mawr Bank Corporation and The Bryn Mawr
Trust Company
B. Loyall Taylor, Jr.
President, Taylor Gifts, Inc.
MARKET MAKERS
Boenning & Scattergood, Inc.
Citigroup Global Markets, Inc.
Ferris Baker Watts, Inc.
Janney Montgomery LLC
Keefe, Bruyette & Woods, Inc.
Knight Equity Markets,
L.P. Lehman Brothers, Inc.
Maxim Group LLC
Morgan Stanley & Co., Inc.
Ryan Beck & Co., Inc.
Sandler O’Neill & Partners
UBS Securities LLC
INDEPENDENT REGISTERED
PUBLIC ACCOUNTING FIRM
KPMG LLP
1601 Market Street
Philadelphia, Pennsylvania 19103
REGISTRAR & TRANSFER AGENT
Mellon Investor Services LLC
PO Box 3315
South Hackensack, New Jersey 07606
www.mellon-investor.com
PRINCIPAL SUBSIDIARY
The Bryn Mawr Trust Company
A Subsidiary of Bryn Mawr Bank Corporation
EXECUTIVE MANAGEMENT
Frederick C. “Ted” Peters II*
Chairman, President and Chief Executive Officer
Alison E. Gers
Executive Vice President, Retail Banking,
Central Sales, Marketing, Information Systems
& Operations
Joseph G. Keefer
Executive Vice President and Chief Lending Officer
Robert J. Ricciardi*
Executive Vice President, Chief Credit Policy Officer
and Corporate Secretary
J. Duncan Smith, CPA*
Executive Vice President and Chief Financial Officer
Matthew G. Waschull
Executive Vice President, Wealth Management
| *Also | officer of the Corporation |
BRANCH OFFICES
50 West Lancaster Avenue
Ardmore, Pennsylvania 19003
801 Lancaster Avenue
Bryn Mawr, Pennsylvania 19010
237 North Pottstown Pike
Exton, Pennsylvania 19341
18 West Eagle Road
Havertown, Pennsylvania 19083
3601 West Chester Pike
Newtown Square, Pennsylvania 19073
39 West Lancaster Avenue
Paoli, Pennsylvania 19301
330 East Lancaster Avenue
Wayne, Pennsylvania 19087
One Tower Bridge
West Conshohocken, Pennsylvania 19428
WEALTH MANAGEMENT DIVISION
10 South Bryn Mawr Avenue
Bryn Mawr, Pennsylvania 19010
LIFE CARE COMMUNITY OFFICES
Beaumont at Bryn Mawr Retirement Community
Bryn Mawr, Pennsylvania 19010
Bellingham Retirement Living
West Chester, Pennsylvania
Martins Run Life Care Community
Media, Pennsylvania
Rosemont Presbyterian Village
Rosemont, Pennsylvania
The Quadrangle
Haverford, Pennsylvania
Waverly Heights
Gladwyne, Pennsylvania
White Horse Village
Newtown Square, Pennsylvania 19073
OTHER SUBSIDIARIES AND FINANCIAL SERVICES
BMT Leasing, Inc.
A Subsidiary of The Bryn Mawr Trust Company
Bryn Mawr, Pennsylvania
Joseph G. Keefer, Chairman
James A. Zelinskie, Jr., President
BMT Mortgage Company
A Division of The Bryn Mawr Trust Company
Bryn Mawr, Pennsylvania
Myron H. Headen, President
BMT Mortgage Group
A Division of The Bryn Mawr Trust Company
Glen Mills, Pennsylvania
Robert McLaughlin, Co-Managing Partner
Thomas DiBiase, Co-Managing Partner
BMT Mortgage Services, Inc.
A Subsidiary of The Bryn Mawr Trust Company
Bryn Mawr, Pennsylvania
Joseph G. Keefer, Chairman
Myron H. Headen, President
BMT Retirement Services
A Division of The Bryn Mawr Trust Company
Bryn Mawr, Pennsylvania
Gilbert B. Mateer, President
BMT Settlement Services, Inc.
A Subsidiary of The Bryn Mawr Trust Company
Bryn Mawr, Pennsylvania
Joseph G. Keefer, Chairman
Myron H. Headen, President
Insurance Counsellors of Bryn Mawr, Inc.
A Subsidiary of The Bryn Mawr Trust Company
Bryn Mawr, Pennsylvania
Thomas F. Drennan, President
LEGAL COUNSEL
McElroy, Deutsch, Mulvaney & Carpenter, LLP
One Penn Center at Suburban Station
1617 John F. Kennedy Boulevard
Suite 1500 Philadelphia,
Pennsylvania 19103
12
2007 ANNUAL REPORT
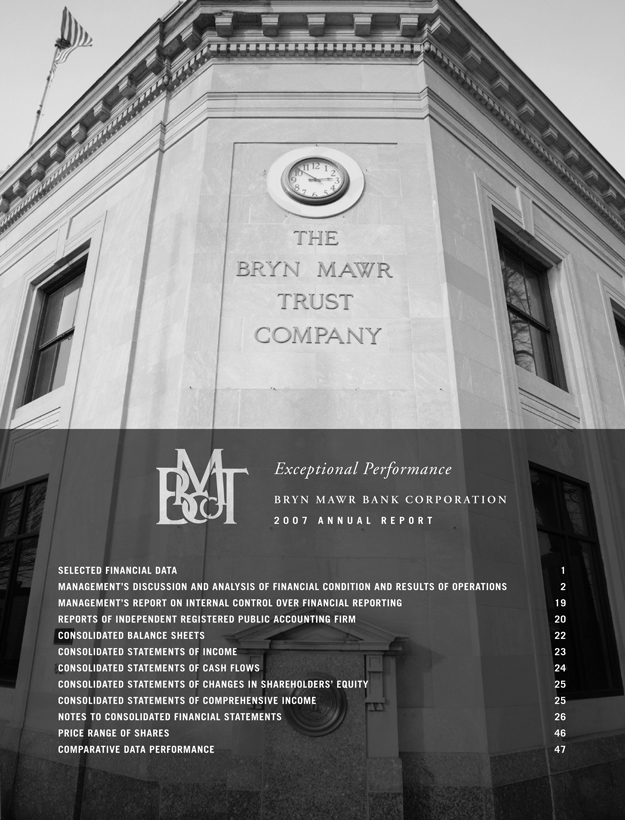
BRYN MAWR BANK CORPORATION
801 LANCASTER AVENUE
BRYN MAWR, PENNSYLVANIA 19010
Exhibit 13.1
Annual Report
Selected Financial Data*
| | | | | | | | | | | | | | | | | | | | |
| For the years ended December 31, | | 2007 | | | 2006 | | | 2005 | | | 2004 | | | 2003 | |
| | | (dollars in thousands, except for share and per share data) | |
Interest income | | $ | 54,218 | | | $ | 45,906 | | | $ | 37,908 | | | $ | 31,347 | | | $ | 29,228 | |
Interest expense | | | 19,976 | | | | 12,607 | | | | 6,600 | | | | 4,553 | | | | 4,330 | |
| | | | | | | | | | | | | | | | | | | | |
Net interest income | | | 34,242 | | | | 33,299 | | | | 31,308 | | | | 26,794 | | | | 24,898 | |
Provision for loan and lease losses | | | 891 | | | | 832 | | | | 762 | | | | 900 | | | | 750 | |
| | | | | | | | | | | | | | | | | | | | |
Net interest income after loan loss provision | | | 33,351 | | | | 32,467 | | | | 30,546 | | | | 25,894 | | | | 24,148 | |
Non-interest income | | | 21,781 | | | | 18,361 | | | | 18,305 | | | | 19,828 | | | | 26,610 | |
Non-interest expense | | | 34,959 | | | | 31,423 | | | | 31,573 | | | | 31,625 | | | | 33,437 | |
| | | | | | | | | | | | | | | | | | | | |
Income before income taxes and discontinued operations | | | 20,173 | | | | 19,405 | | | | 17,278 | | | | 14,097 | | | | 17,321 | |
Applicable income taxes | | | 6,573 | | | | 6,689 | | | | 5,928 | | | | 4,752 | | | | 6,049 | |
| | | | | | | | | | | | | | | | | | | | |
Income from continuing operations | | | 13,600 | | | | 12,716 | | | | 11,350 | | | | 9,345 | | | | 11,272 | |
Loss from discontinued operations | | | — | | | | — | | | | — | | | | — | | | | (1,916 | ) |
| | | | | | | | | | | | | | | | | | | | |
Net Income | | $ | 13,600 | | | $ | 12,716 | | | $ | 11,350 | | | $ | 9,345 | | | $ | 9,356 | |
| | | | | | | | | | | | | | | | | | | | |
Per share data: | | | | | | | | | | | | | | | | | | | | |
Earnings per common share from continuing operations: | | | | | | | | | | | | | | | | | | | | |
Basic | | $ | 1.59 | | | $ | 1.48 | | | $ | 1.33 | | | $ | 1.09 | | | $ | 1.30 | |
Diluted | | $ | 1.58 | | | $ | 1.46 | | | $ | 1.31 | | | $ | 1.07 | | | $ | 1.29 | |
Earnings per common share: | | | | | | | | | | | | | | | | | | | | |
Basic | | $ | 1.59 | | | $ | 1.48 | | | $ | 1.33 | | | $ | 1.09 | | | $ | 1.08 | |
Diluted | | $ | 1.58 | | | $ | 1.46 | | | $ | 1.31 | | | $ | 1.07 | | | $ | 1.07 | |
| | | | | |
Dividends declared | | $ | .50 | | | $ | .46 | | | $ | .42 | | | $ | 0.40 | | | $ | 0.40 | |
| | | | | |
Weighted-average shares outstanding | | | 8,539,904 | | | | 8,578,050 | | | | 8,563,027 | | | | 8,610,171 | | | | 8,657,527 | |
Dilutive potential common shares | | | 93,638 | | | | 113,579 | | | | 101,200 | | | | 110,854 | | | | 103,107 | |
| | | | | | | | | | | | | | | | | | | | |
Adjusted weighted-average shares | | | 8,633,542 | | | | 8,691,629 | | | | 8,664,227 | | | | 8,721,025 | | | | 8,760,634 | |
| | | | | |
Selected financial ratios: | | | | | | | | | | | | | | | | | | | | |
Tax equivalent net interest margin | | | 4.37 | % | | | 4.90 | % | | | 5.05 | % | | | 4.60 | % | | | 4.85 | % |
Net income/average total assets (“ROA”) | | | 1.59 | % | | | 1.72 | % | | | 1.66 | % | | | 1.45 | % | | | 1.98 | % |
Net income/average shareholders’ equity (“ROE”) | | | 15.87 | % | | | 15.71 | % | | | 15.50 | % | | | 13.73 | % | | | 17.85 | % |
Average shareholders’ equity to average total assets | | | 10.04 | % | | | 10.93 | % | | | 10.72 | % | | | 10.59 | % | | | 11.06 | % |
Dividends declared per share to net income per basic common share | | | 31.45 | % | | | 31.08 | % | | | 31.58 | % | | | 36.70 | % | | | 37.04 | % |
| | | | | |
| At December 31, | | 2007 | | | 2006 | | | 2005 | | | 2004 | | | 2003 | |
Total assets | | $ | 1,002,096 | | | $ | 826,817 | | | $ | 727,383 | | | $ | 683,103 | | | $ | 604,660 | |
Earning assets | | | 874,661 | | | | 733,781 | | | | 664,073 | | | | 627,258 | | | | 546,500 | |
Portfolio loans and leases | | | 802,925 | | | | 681,291 | | | | 595,165 | | | | 555,889 | | | | 498,726 | |
Deposits | | | 849,528 | | | | 714,489 | | | | 636,260 | | | | 600,965 | | | | 527,139 | |
Shareholders’ equity | | | 90,351 | | | | 82,092 | | | | 77,222 | | | | 70,947 | | | | 67,034 | |
Ratio of equity to assets | | | 9.02 | % | | | 9.97 | % | | | 10.66 | % | | | 10.43 | % | | | 11.14 | % |
Loans serviced for others | | | 357,363 | | | | 382,141 | | | | 417,649 | | | | 507,421 | | | | 797,326 | |
Assets under management & administration - Wealth Division | | | 2,191,753 | | | | 2,102,468 | | | | 1,951,424 | | | | 1,887,181 | | | | 1,751,875 | |
Book value per share | | $ | 10.60 | | | $ | 9.59 | | | $ | 9.03 | | | $ | 8.25 | | | $ | 7.74 | |
Allowance as a percentage of portfolio loans and leases | | | 1.01 | % | | | 1.19 | % | | | 1.24 | % | | | 1.23 | % | | | 1.34 | % |
Efficiency ratio | | | 62.40 | % | | | 60.83 | % | | | 63.64 | % | | | 67.83 | % | | | 64.92 | % |
| * | Periods prior to 2007 have been adjusted to reflect the correction of an immaterial error- see Note 1 V. Correction of Prior Financial Statements in the Notes to the Consolidated Financial Statements included in this document. |
1
Management’s Discussion and Analysis of Financial Condition and Results of Operations
BRIEF HISTORYOFTHE CORPORATION
The Bryn Mawr Trust Company (the “Bank”) received its Pennsylvania banking charter in 1889 and is a member of the Federal Reserve System. In 1986, Bryn Mawr Bank Corporation (the “Corporation”) was formed and on January 2, 1987, the Bank became a wholly-owned subsidiary of the Corporation. The Bank and Corporation are headquartered in Bryn Mawr, PA, a western suburb of Philadelphia, PA. The Corporation and its subsidiaries offer a full range of personal and business banking services, consumer and commercial loans, equipment leasing, mortgages, insurance and wealth management services, including investment management, trust and estate administration, retirement planning, custody services, and tax planning and preparation from eight full-service branches and seven limited-hour retirement community offices throughout Montgomery, Delaware and Chester counties. The Corporation trades on the NASDAQ Global Market (“NASDAQ”) under the symbol BMTC.
The goal of the Corporation is to become the preeminent community bank and wealth management organization in the Philadelphia area.
The Corporation operates in a highly competitive market area that includes local, national and regional banks as competitors along with savings banks, credit unions, insurance companies, trust companies, registered investment advisors and mutual fund families. The Corporation and its subsidiaries are regulated by many regulatory agencies including the Securities and Exchange Commission (“SEC”), NASDAQ, Federal Deposit Insurance Corporation (“FDIC”), the Federal Reserve and the Pennsylvania Department of Banking.
RESULTSOF OPERATIONS
The following is Management’s discussion and analysis of the significant changes in the results of operations, capital resources and liquidity presented in its accompanying consolidated financial statements for the Corporation. The Corporation’s consolidated financial condition and results of operations consist almost entirely of the Bank’s financial condition and results of operations. Current performance does not guarantee, and may not be indicative of similar performance in the future.
CRITICAL ACCOUNTING POLICIES, JUDGMENTSAND ESTIMATES
The accounting and reporting policies of the Corporation and its subsidiaries conform with accounting principles generally accepted in the United States of America applicable to the financial services industry (Generally Accepted Accounting Principles “GAAP”). All inter-company transactions are eliminated in consolidation and certain reclassifications are made when necessary to conform the previous year’s financial statements to the current year’s presentation. In preparing the consolidated financial statements, Management is required to make estimates and assumptions that affect the reported amount of assets and liabilities as of the dates of the balance sheets and revenues and expenditures for the periods presented. Therefore, actual results could differ from these estimates.
The allowance for loan and lease losses involves a higher degree of judgment and complexity than other significant accounting policies. The allowance for loan and lease losses is calculated with the objective of maintaining a reserve level believed by Management to be sufficient to absorb estimated probable credit losses. Management’s determination of the adequacy of the allowance is based on periodic evaluations of the loan and lease portfolio and other relevant factors. However, this evaluation is inherently subjective as it requires material estimates, including, among others, expected default probabilities, expected loan commitment usage, the amounts and timing of expected future cash flows on impaired loans and leases, value of collateral, estimated losses on consumer loans and residential mortgages and general amounts for historical loss experience. The process also considers economic conditions, international events, and inherent risks in the loan and lease portfolio. All of these factors may be susceptible to significant change. To the extent actual outcomes differ from Management estimates, additional provisions for loan and lease losses may be required that would adversely impact earnings in future periods. See the section of this document titled Asset Quality and Analysis of Credit Risk for additional information.
Other significant accounting policies are presented in Note 1 in the accompanying financial statements. The Corporation’s Summary of Significant Accounting Policies has not substantively changed any aspect of its overall approach in the application of the foregoing policies.
EXECUTIVE OVERVIEW
2007 Compared to 2006
The Corporation reported 2007 diluted earnings per share of $1.58, an increase of $0.12 per share or 8.2% compared to $1.46 per share in 2006. Net income for the year ended December 31, 2007 was $13.6 million, an increase of 7.0% or $884 thousand, compared to $12.7 million last year.
2
The primary factor contributing to the increase in earnings for the year was a $0.10 per share or $866 thousand after-tax gain on the sale of real estate that previously served as the Bank’s Wynnewood branch location. Excluding the real estate gain, year to date 2007 diluted earnings per share of $1.48 were up $.02 or 1.4% from the same period last year and net income of $12.7 million was flat compared to the prior period. Return on average equity (ROE) and return on average assets (ROA) for the year ended December 31, 2007 were 15.87% (14.86% excluding the real estate gain) and 1.59% (1.49% excluding the real estate gain), respectively. ROE was 15.71% and ROA was 1.72% for the same period last year.
Anticipating a one-time gain on the sale of real estate during the first quarter of 2007, the Corporation invested in many new business initiatives in the latter part of 2006 continuing through 2007. These initiatives included the formation of an equipment leasing company, the start-up of a loan production office in West Chester, the opening of a new branch in Ardmore, Pennsylvania, the roll-out of the Private Banking Group, the formation of BMT Mortgage Group to augment the Corporation’s existing mortgage operations, and the retooling of the Wealth Division through investments in additional personnel, product offerings and service enhancements.
During the third quarter of 2007, an experienced financial planner was hired to enhance the Wealth Division’s overall financial planning services and a new separately-managed investment account (“SMA”) product was launched. The Corporation is also developing plans to establish a limited purpose trust company (“LPTC”) in the State of Delaware in 2008, subject to regulatory approval, to serve as a corporate fiduciary under Delaware statutes, which are more favorable for individuals and families. These new initiatives contributed to the $3.5 million or 11.3% increase in non-interest expenses in 2007 compared to 2006.
The Corporation increased portfolio loans and leases in 2007 by 17.9% or $121.6 million compared with year-end 2006 balances by expanding banking relationships with local businesses, not-for-profit entities, quality builders and high credit quality individuals. Additional opportunities exist also in our residential lending unit with desirable borrowers as competitors have partially, and in some cases entirely, withdrawn from the market. This growth in loan and lease volume was able to offset several prime rate decreases and higher funding costs, to increase the Corporation’s tax equivalent net interest income by $921 thousand or 2.7% for the year ended December 31, 2007 compared to the same period last year.
Credit quality on the overall loan and lease portfolio remains strong as total non-performing loans and leases represent 25 basis points or $2.0 million of portfolio loans and leases at December 31, 2007. This compares with 12 basis points or $823 thousand at December 31, 2006.
The provision for loan and lease losses for the year ended December 31, 2007 and 2006 were $891 thousand and $832 thousand, respectively. At December 31, 2007, the allowance for loan and lease losses (“allowance”) of $8.1 million represents 1.01% of portfolio loans and leases compared with 1.19% at December 31, 2006. For additional information, see the section titled Asset Quality and Analysis of Credit Risk in this document.
Funding from wholesale sources, which includes wholesale deposits and wholesale borrowings, at December 31, 2007 of approximately $174.8 million was $139.8 million higher than the $35.0 million at December 31, 2006. The increase in 2007 was primarily used to fund portfolio loan and lease growth of approximately $122.0 million. During 2007, deposits continued to shift from lower yielding savings and NOW accounts into higher yielding money market accounts, but at a much slower pace than the corporation experienced in 2006. The use of wholesale funding at average rates of 5.30% was the primary reason that the Corporation’s net interest margin declined from 4.90% in 2006 to 4.37% in 2007.
Deposit balances at December 31, 2007 and 2006 reflect approximately $70.0 million and $35.0 million, respectively, in demand deposit balances that represent short term in-flows from customer year-end activity. These short term deposit in-flows pushed the Corporation’s total assets over the $1.0 billion level at December 31, 2007.
For the year ended December 31, 2007, non-interest income excluding the $1.3 million (pre-tax) real estate gain on the Wynnewood property, was $20.4 million, an increase of $2.1 million or 11.4% over the $18.4 million in 2006. The primary factor for this increase was year-to-date Wealth Management revenue of $13.5 million which was $1.1 million or 8.7% higher than 2006.
Wealth Management revenues for the year ended December 31, 2007 and December 31, 2006 include $580 thousand and $403 thousand, respectively, of fees that will no longer be earned relating to one institutional client that was acquired by another financial institution in a business combination on November 16, 2007. Wealth assets under Management and Administration relating to this client were approximately $412.4 million at December 31, 2006 and zero at December 31, 2007.
For the year ended December 31, 2007, non-interest expense was $35.0 million, an increase of $3.5 million or 11.3% over the $31.4 million in the same period last year. Personnel and related support costs associated with the new business initiatives were the largest contributor to this increase in non-interest expenses.
3
2006 Compared to 2005
Bryn Mawr Bank Corporation reported net income for the year ended December 31, 2006 of $12.7 million, an increase of 12.0% or $1.4 million, compared to $11.4 million in 2005. Diluted earnings per share for the year ended December 31, 2006, were $1.46, an increase of $0.15 or 11.5%, compared with $1.31 in 2005. ROE and ROA for 2006 were 15.71% and 1.72%, respectively. ROE was 15.50% and ROA was 1.66% for 2005.
The major factor contributing to the increase in earnings for 2006 compared to 2005 was a $2.1 million or 6.6% increase in the Corporation’s tax equivalent net interest income to $33.7 million from $31.6 million in 2005. This increase was principally loan volume driven, despite a decrease in the tax equivalent net interest margin of 15 basis points to 4.90% in 2006 from 5.05% in 2005. Also contributing to the increase in earnings was a nominal decrease in overall non-interest expense of $150 thousand as total non-interest expenses were $31.4 million. Additionally, fees for Wealth Management services increased 7.7% or $883 thousand to $12.4 million in 2006 versus $11.5 million in 2005, partially offsetting declines in residential mortgage-related revenues.
Asset quality was strong as non-performing assets represented 0.10% of total assets at December 31, 2006. While the allowance increased to $8.1 million at December 31, 2006 from $7.4 million at December 31, 2005, the allowance as a percentage of portfolio loans decreased to 1.19% from 1.24% over the same time period. The decrease in the allowance as a percentage of portfolio loans is attributed to strong loan growth in the second and third quarters of 2006 and continued strength in asset quality. Net loan charge-offs were $112 thousand and $287 thousand for the years ended December 31, 2006 and 2005, respectively.
Portfolio loans increased $86.1 million or 14.5% to $681.3 million at December 31, 2006 from $595.2 million at December 31, 2005, reflecting a significant increase in commercial mortgage and construction loan closings in 2006. Also contributing to the growth was the formation of BMT Leasing Inc., which added $7.0 million in balances in 2006. The Corporation opened its business loan production office in downtown West Chester, Pennsylvania in 2006 to help further this growth.
The Corporation’s interest bearing liabilities at December 31, 2006 include approximately $65.0 million in wholesale certificates and short-term borrowings, compared with $5.0 million at December 31, 2005. Deposit balances at December 31, 2006 and 2005 reflect approximately $35.0 million and $25.0 million, respectively, in demand deposit balances that represent short term in-flows from customer year-end activity. Total deposits, including the short term in-flows were $714.5 million and $636.2 million at December 31, 2006 and 2005, respectively. This represents a year over year increase in total deposits of $78.2 million or 12.3%.
During 2006, the Corporation observed a shift in the mix of its other deposits (total deposits less wholesale deposits) as some lower cost interest bearing checking, money market accounts and savings accounts moved into higher yielding certificates of deposit. This shift in the other deposit mix was a national trend as many financial institutions had similar experiences. The utilization of market rate wholesale funding, the shift in deposit mix and the increase in interest rates resulted in overall funding costs rising faster than the yield on interest earning assets.
NON-GAAP MEASURES
Non-GAAP Measures: A non-GAAP financial measure is a numerical measure of a company’s performance, financial position, or cash flows that either exclude or include amounts that are not normally excluded or included in the most directly comparable measure calculated and presented in accordance with generally accepted accounting principles (GAAP). To supplement our financial statements presented in accordance with GAAP, we report certain key financial measurements without the impact of a material real estate transaction.
Our management uses these non-GAAP measures in its analysis of the Corporation’s performance. These non-GAAP measures consist of adjusting net income, non-interest income, diluted earnings per share, ROE, and ROA determined in accordance with GAAP to exclude the effects of the real estate gain in the first quarter of 2007 (i.e. year to date).
Management believes that the inclusion of these non-GAAP financial measures provides useful supplemental information essential to the proper understanding of the operating results of the Corporation’s core business. These measures should be considered in addition to results prepared in accordance with GAAP, and are not substitutes for, or superior to, GAAP results. The non-GAAP measures are provided to enhance investors’ overall understanding of our current financial performance. These non-GAAP measures have been reconciled to the nearest GAAP measure in the accompanying schedule.
| | | | | | | | | | | | | | | | | | | |
| (dollars in thousands | | Year Ended December 31, |
| | Net Income | | Diluted Earnings Per Share |
| except per share data) | | 2007 | | | 2006 | | 2005 | | 2007 | | | 2006 | | 2005 |
As reported (GAAP) | | $ | 13,600 | | | $ | 12,716 | | $ | 11,350 | | $ | 1.58 | | | 1.46 | | $ | 1.31 |
After tax effect of gain on sale of real estate | | | (866 | ) | | | — | | | — | | | (0.10 | ) | | — | | | — |
| | | | | | | | | | | | | | | | | | | |
Adjusted for sale | | $ | 12,734 | | | $ | 12,716 | | $ | 11,350 | | $ | 1.48 | | | 1.46 | | $ | 1.31 |
| | | | | | | | | | | | | | | | | | | |
4
| | | | | | | | | | |
| | | Non-Interest Income |
| | 2007 | | | 2006 | | 2005 |
As reported (GAAP) | | $ | 21,781 | | | $ | 18,361 | | $ | 18,305 |
Gain on sale of real estate | | | (1,333 | ) | | | — | | | — |
| | | | | | | | | | |
Adjusted for sale | | $ | 20,448 | | | $ | 18,361 | | $ | 18,305 |
| | | | | | | | | | |
| | | | | | | | | | | | | | | | | | |
| | | ROE | | | ROA | |
| | 2007 | | | 2006 | | | 2005 | | | 2007 | | | 2006 | | | 2005 | |
As reported (GAAP) | | 15.87 | % | | 15.71 | % | | 15.50 | % | | 1.59 | % | | 1.72 | % | | 1.66 | % |
After tax effect of gain on sale of real estate | | (1.01 | )% | | — | | | | | | (0.10 | )% | | — | | | — | |
| | | | | | | | | | | | | | | | | | |
Adjusted for sale | | 14.86 | % | | 15.71 | % | | 15.5 | % | | 1.49 | % | | 1.72 | % | | 1.66 | % |
| | | | | | | | | | | | | | | | | | |
COMPONENTSOF NET INCOME
Net income is affected by five major elements:Net Interest Income, or the difference between interest income and loan fees earned on loans and investments and interest expense paid on deposits and borrowed funds;Provision For Loan and Lease Losses, or the amount added to the allowance for loan and lease losses to provide for estimated inherent losses on loans and leases;Non-Interest Income which is made up primarily of certain fees, wealth revenue, residential mortgage activities and gains and losses from the sale of securities and other assets;Non-Interest Expense, which consists primarily of salaries, employee benefits and other operating expenses; andIncome Taxes. Each of these major elements will be reviewed in more detail in the following discussion.
NET INTEREST INCOME
Rate/Volume Analyses (Tax Equivalent Basis)
The rate volume analysis in the table below analyzes changes in tax equivalent net interest income for the years 2007 compared to 2006 and 2006 compared to 2005 by its rate and volume components. The change in interest income/expense due to both volume and rate has been allocated to changes in volume.
| | | | | | | | | | | | | | | | | | | | | | |
| (dollars in thousands) | | Year Ended December 31, | |
| | 2007 Compared to 2006 | | 2006 Compared to 2005 | |
| Increase/(decrease) | | Volume | | | Rate | | | Total | | Volume | | | Rate | | Total | |
Interest Income: | | | | | | | | | | | | | | | | | | | | | | |
Interest-bearing deposits with other banks | | $ | 44 | | | $ | 2 | | | $ | 46 | | $ | (57 | ) | | $ | 11 | | $ | (46 | ) |
Federal funds sold | | | 21 | | | | 7 | | | | 28 | | | (108 | ) | | | 44 | | | (64 | ) |
Investment securities available for sale | | | (73 | ) | | | 295 | | | | 222 | | | 391 | | | | 434 | | | 825 | |
Loans and leases | | | 7,184 | | | | 810 | | | | 7,994 | | | 3,415 | | | | 3,968 | | | 7,383 | |
| | | | | | | | | | | | | | | | | | | | | | |
Total interest income | | | 7,176 | | | | 1,114 | | | | 8,290 | | | 3,641 | | | | 4,457 | | | 8,098 | |
| | | | | | | | | | | | | | | | | | | | | | |
Interest expense: | | | | | | | | | | | | | | | | | | | | | | |
Savings, NOW and market rate accounts | | | (155 | ) | | | 475 | | | | 320 | | | (217 | ) | | | 1,323 | | | 1,106 | |
Wholesale deposits | | | 4,531 | | | | (185 | ) | | | 4,346 | | | | | | | | | | | |
Time deposits | | | 569 | | | | 956 | | | | 1,525 | | | 1,545 | | | | 2,371 | | | 3,916 | |
Borrowed Funds | | | 1,238 | | | | (60 | ) | | | 1,178 | | | 594 | | | | 391 | | | 985 | |
| | | | | | | | | | | | | | | | | | | | | | |
Total interest expense | | | 6,183 | | | | 1,186 | | | | 7,369 | | | 1,922 | | | | 4,085 | | | 6,007 | |
| | | | | | | | | | | | | | | | | | | | | | |
Interest differential | | $ | 993 | | | $ | (72 | ) | | $ | 921 | | $ | 1,719 | | | $ | 372 | | $ | 2,091 | |
| | | | | | | | | | | | | | | | | | | | | | |
5
Analyses of Interest Rates and Interest Differential
The table below presents the major asset and liability categories on an average daily basis for the periods presented, along with tax-equivalent interest income and expense and key rates and yields:
| | | | | | | | | | | | | | | | | | | | | | | | | | | | | | |
| (dollars in thousands) | | For the Year Ended December 31, | |
| | 2007 | | | 2006 | | | 2005 | |
| | Average
Balance | | | Interest
Income/
Expense | | Average
Rates
Earned/
Paid | | | Average
Balance | | | Interest
Income/
Expense | | Average
Rates
Earned/
Paid | | | Average
Balance | | | Interest
Income/
Expense | | Average
Rates
Earned/
Paid | |
Assets: | | | | | | | | | | | | | | | | | | | | | | | | | | | | | | |
Interest-bearing deposits with other banks | | $ | 1,506 | | | $ | 76 | | 5.05 | % | | $ | 609 | | | $ | 30 | | 4.93 | % | | $ | 2,398 | | | $ | 76 | | 3.17 | % |
Federal funds sold | | | 3,496 | | | | 174 | | 4.98 | % | | | 3,053 | | | | 146 | | 4.78 | % | | | 6,281 | | | | 210 | | 3.34 | % |
Investment securities available for sale: | | | | | | | | | | | | | | | | | | | | | | | | | | | | | | |
Taxable | | | 39,693 | | | | 2,017 | | 5.08 | % | | | 41,489 | | | | 1,790 | | 4.31 | % | | | 29,400 | | | | 958 | | 3.26 | % |
Tax – Exempt | | | 5,029 | | | | 232 | | 4.61 | % | | | 4,993 | | | | 237 | | 4.75 | % | | | 5,069 | | | | 244 | | 4.81 | % |
| | | | | | | | | | | | | | | | | | | | | | | | | | | | | | |
Total investment securities | | | 44,722 | | | | 2,249 | | 5.03 | % | | | 46,482 | | | | 2,027 | | 4.36 | % | | | 34,469 | | | | 1,202 | | 3.49 | % |
Loans and leases(1) | | | 740,694 | | | | 52,053 | | 7.03 | % | | | 636,286 | | | | 44,059 | | 6.92 | % | | | 582,386 | | | | 36,676 | | 6.30 | % |
| | | | | | | | | | | | | | | | | | | | | | | | | | | | | | |
Total interest earning assets | | | 790,418 | | | | 54,552 | | 6.90 | % | | | 686,430 | | | | 46,262 | | 6.74 | % | | | 625,534 | | | | 38,164 | | 6.10 | % |
Cash and due from banks | | | 22,640 | | | | | | | | | | 25,358 | | | | | | | | | | 29,918 | | | | | | | |
Allowance for loan and lease losses | | | (8,463 | ) | | | | | | | | | (7,828 | ) | | | | | | | | | (7,283 | ) | | | | | | |
Other assets | | | 48,725 | | | | | | | | | | 36,894 | | | | | | | | | | 34,917 | | | | | | | |
| | | | | | | | | | | | | | | | | | | | | | | | | | | | | | |
Total assets | | $ | 853,320 | | | | | | | | | $ | 740,854 | | | | | | | | | $ | 683,086 | | | | | | | |
| | | | | | | | | | | | | | | | | | | | | | | | | | | | | | |
Liabilities: | | | | | | | | | | | | | | | | | | | | | | | | | | | | | | |
Savings, NOW and market rate accounts | | $ | 280,371 | | | $ | 4,169 | | 1.49 | % | | $ | 292,075 | | | $ | 3,850 | | 1.32 | % | | $ | 317,205 | | | $ | 2,744 | | 0.87 | % |
Wholesale deposits | | | 92,329 | | | | 4,925 | | 5.53 | % | | | 10,473 | | | | 579 | | 5.53 | % | | | — | | | | — | | — | % |
Time deposits | | | 187,044 | | | | 8,662 | | 4.63 | % | | | 173,271 | | | | 7,136 | | 4.12 | % | | | 130,667 | | | | 3,799 | | 2.91 | % |
| | | | | | | | | | | | | | | | | | | | | | | | | | | | | | |
Total interest-bearing deposits | | | 559,744 | | | | 17,756 | | 3.17 | % | | | 475,819 | | | | 11,565 | | 2.43 | % | | | 447,872 | | | | 6,543 | | 1.46 | % |
Short term borrowings | | | 42,496 | | | | 2,220 | | 5.22 | % | | | 19,442 | | | | 1,042 | | 5.36 | % | | | 1,700 | | | | 57 | | 3.35 | % |
| | | | | | | | | | | | | | | | | | | | | | | | | | | | | | |
Total interest-bearing liabilities | | | 602,240 | | | | 19,976 | | 3.32 | % | | | 495,261 | | | | 12,607 | | 2.55 | % | | | 449,572 | | | | 6,600 | | 1.47 | % |
Non-interest-bearing deposits | | | 148,773 | | | | | | | | | | 150,042 | | | | | | | | | | 148,495 | | | | | | | |
Other liabilities | | | 16,622 | | | | | | | | | | 14,584 | | | | | | | | | | 11,818 | | | | | | | |
| | | | | | | | | | | | | | | | | | | | | | | | | | | | | | |
Total non-interest-bearing liabilities | | | 165,395 | | | | | | | | | | 164,626 | | | | | | | | | | 160,022 | | | | | | | |
| | | | | | | | | | | | | | | | | | | | | | | | | | | | | | |
Total liabilities | | | 767,635 | | | | | | | | | | 659,887 | | | | | | | | | | 609,885 | | | | | | | |
Shareholder’s equity | | | 85,685 | | | | | | | | | | 80,967 | | | | | | | | | | 73,201 | | | | | | | |
| | | | | | | | | | | | | | | | | | | | | | | | | | | | | | |
Total liabilities and shareholders’ equity | | $ | 853,320 | | | | | | | | | $ | 740,854 | | | | | | | | | $ | 683,086 | | | | | | | |
| | | | | | | | | | | | | | | | | | | | | | | | | | | | | | |
Net interest spread | | | | | | | | | 3.58 | % | | | | | | | | | 4.19 | % | | | | | | | | | 4.63 | % |
Effect of non-interest-bearing sources | | | | | | | | | 0.79 | % | | | | | | | | | 0.71 | % | | | | | | | | | 0.42 | % |
| | | | | | | | | | | | | | | | | | | | | | | | | | | | | | |
Net interest income/margin on earning assets | | | | | | $ | 34,576 | | 4.37 | % | | | | | | $ | 33,655 | | 4.90 | % | | | | | | $ | 31,564 | | 5.05 | % |
| | | | | | | | | | | | | | | | | | | | | | | | | | | | | | |
Tax equivalent adjustment | | | | | | $ | 334 | | 0.04 | % | | | | | | $ | 356 | | 0.05 | % | | | | | | $ | 256 | | 0.04 | % |
| | | | | | | | | | | | | | | | | | | | | | | | | | | | | | |
(1) | Non-accrual loans have been included in average loan balances, but interest on non-accrual loans has not been included for purposes of determining interest income. Average loans and leases include portfolio loans, leases and loans held for sale. |
Net Interest Income 2007 Compared to 2006
Net interest income on a tax equivalent basis for the year ended December 31, 2007 of $34.6 million was 2.7% higher than $33.7 million in 2006. This increase was substantially volume driven as average loan growth of $104.4 million or 16.4% offset was able to offset several prime rate decreases and the impact of funding with higher cost wholesale funds.
Average interest bearing liabilities increased by $107.0 million or 21.6% to $602.2 million during 2007 compared to $495.2 million during 2006. Wholesale deposits and short term borrowings were the primary factors contributing to the increase in average interest bearing liabilities. The change in average other deposit balances in 2007 was a nominal $1.3 million decrease.
Despite the increase in tax equivalent net interest income, the tax equivalent net interest margin on interest earning assets decreased by 53 basis points from 4.90% during 2006 to 4.37% during 2007.
Net Interest Income 2006 Compared to 2005
Net interest income on a tax equivalent basis amounted to $33.7 million for the year ended December 31, 2006, an increase of $2.1 million or 6.6% from the $31.6 million of net interest income earned in 2005. Approximately 82% of the increase in tax equivalent net interest income in 2006 was volume related. During 2006, short term interest rates increased early in the year but stabilized in June 2006. Since the Corporation was asset sensitive, it benefited from rising short term interest rates early in 2006, partially offset by the increasing cost of funding as the deposit market environment became increasingly challenging. To satisfy loan demand, the Corporation utilized more costly time and wholesale deposits together with outside borrowings to a greater extent previously.
Average interest earning assets increased $60.9 million or 9.7% to $686.4 million during 2006 compared to $625.5 million during 2005. The largest portion of this
6
increase in average interest earning assets was attributable to loan growth as average loans increased by $53.9 million or 9.3% to $636.3 million during 2006 compared to 2005. Time deposits, wholesale deposits and short term borrowings were the largest factors contributing to the increase in average interest bearing liabilities.
The tax equivalent net interest margin on interest earning assets decreased 15 basis points from 5.05% during 2005 to 4.90% during 2006.
Net Interest Margin
The Corporation’s tax equivalent net interest margin decreased 54 basis points to 4.11% in the fourth quarter of 2007 from 4.65% in the same period last year. The tax equivalent net interest margin and related components for the past five linked quarters are shown in the table below.
The Corporation anticipates continued pressure on its tax equivalent net interest margin in 2008 as primary funding for incremental loan and lease growth is expected to come from higher cost wholesale funding as growth in other deposit balances is not expected to be significant. The Corporation’s tax equivalent net interest margin was 4.37% in 2007 compared with 4.90% in 2006 and 5.05% in 2005. These results reflect the increased cost of interest bearing liabilities more than offsetting the increased yield on earning assets. However, approximately $140.0 million of the $175.0 million in wholesale funding at December 31, 2007 will mature or re-price in 2008, which will give the Corporation an opportunity to lower funding costs based on current rates.
| | | | | | | | | | | | | | | | | |
| | | Year | | Earning
Asset
Yield | | | Interest
Bearing
Liability
Cost | | | Net
Interest
Spread | | | Effect of
Non-Interest
Bearing
Sources | | | Net
Interest
Margin | |
Net Interest Margin Last Five Quarters | | | | | | | | | | | | | | | | | |
| | | | | | |
4thQuarter | | 2007 | | 6.77 | % | | 3.43 | % | | 3.34 | % | | 0.77 | % | | 4.11 | % |
3rdQuarter | | 2007 | | 6.95 | % | | 3.44 | % | | 3.51 | % | | 0.78 | % | | 4.29 | % |
2ndQuarter | | 2007 | | 6.97 | % | | 3.27 | % | | 3.70 | % | | 0.79 | % | | 4.49 | % |
1stQuarter | | 2007 | | 6.93 | % | | 3.08 | % | | 3.85 | % | | 0.80 | % | | 4.65 | % |
4thQuarter | | 2006 | | 6.85 | % | | 2.99 | % | | 3.86 | % | | 0.79 | % | | 4.65 | % |
| | | | | | |
Net Interest Margin Last Three Years | | | | | | | | | | | | | | | | | |
| | | | | | |
| | 2007 | | 6.90 | % | | 3.32 | % | | 3.58 | % | | 0.79 | % | | 4.37 | % |
| | 2006 | | 6.74 | % | | 2.55 | % | | 4.19 | % | | 0.71 | % | | 4.90 | % |
| | 2005 | | 6.10 | % | | 1.47 | % | | 4.63 | % | | 0.42 | % | | 5.05 | % |
Interest Rate Sensitivity
The Corporation actively manages its interest rate sensitivity position. The objectives of interest rate risk management are to control exposure of net interest income to risks associated with interest rate movements and to achieve sustainable growth in net interest income. Management’s Asset Liability Committee (“ALCO”), using policies and procedures approved by the Corporation’s Board of Directors, is responsible for managing the interest rate sensitivity position. The Corporation manages interest rate sensitivity by changing the mix, pricing and re-pricing characteristics of its assets and liabilities, through the management of its investment portfolio, its offering of loan and selected deposit terms and through wholesale funding and selective use of interest rate floors. Wholesale funding consists of several sources including borrowings from the Federal Home Loan Bank of Pittsburgh (“FHLB”), certificates of deposit from institutional brokers, Certificate of Deposit Account Registry Service (“CDARS”) and Pennsylvania Local Government Investment Trust (“PLGIT”). The Corporation is also evaluating additional wholesale funding sources. The ALCO continues to evaluate various strategies including interest rate swaps and floors to mitigate the impact of future changes in interest rates on its net interest income.
The Corporation uses several tools to manage its interest rate risk including interest rate sensitivity analysis (aka “GAP Analysis”), market value of portfolio equity analysis, interest rate simulations under various rate scenarios and tax equivalent net interest margin reports. The results of these reports are compared to limits established by the Corporation’s ALCO Policies and appropriate adjustments are made if the results are outside of established limits.
The following table demonstrates the annualized result of an interest rate simulation and the estimated effect that a parallel interest rate shift in the yield curve and subjective adjustments in deposit pricing might have on the Corporation’s projected net interest income over the next 12 months.
This simulation assumes that there is no growth in the balance sheet over the next twelve months. The changes to net interest income shown below are in compliance with the Corporation’s policy guidelines. Actual results may differ significantly from the interest rate simulation due to numerous factors including assumptions, the competitive environment, market reactions and customer behavior.
Summary of Interest Rate Simulation
| | | | | | |
| (dollars in thousands) | | December 31, 2007 | |
| | Estimated Change
In Net Interest
Income Over
Next 12 Months | |
Change in Interest Rates | | | | | | |
+200 basis points | | $ | 199 | | .51 | % |
+100 basis points | | $ | 176 | | .45 | % |
-100 basis points | | $ | 183 | | .47 | % |
-200 basis points | | $ | 145 | | .37 | % |
The interest rate simulation above indicates that the Corporation’s balance sheet as of December 31, 2007 is slightly asset sensitive, meaning that an increase in interest rates should increase net interest income and a decline in interest rates will cause a decline in net interest income over the next 12 months when compared to projected net income under a flat or stable rate scenario.
7
The Corporation’s sensitivity to changes in interest rates as measured by the Corporation’s interest rate simulation model decreased from last year (3.41% increase for +200 basis points and 3.60% decrease for -200 basis points). The decrease is a result of direction from its ALCO to add fixed rate commercial loans, residential mortgages and mortgage-backed securities to the asset mix, combined with increased customer preference for fixed rate financing.
Separately, the Corporation purchased a $25.0 million notional, prime rate based, three-year interest rate floor in April 2006 for a total cost of $155 thousand to mitigate the impact on earnings of anticipated declining rates over the next three years. The income related to the interest rate floor of $155 thousand in 2007 and a net expense of $29 thousand in 2006 were included as components of other income and other expense. This position was closed out in January 2008 as rates declined and the value of the contract increased. The Corporation recorded non-interest income of approximately $260 thousand on the close out of this contract in January 2008.
GAP Report
The interest sensitivity or “GAP” report identifies interest rate risk by showing repricing gaps in the bank’s balance sheet. All assets and liabilities are reflected based on behavioral sensitivity, which is usually the earliest of either: repricing, maturity, contractual amortization, prepayments or likely call dates. Non-maturity deposits such as NOW, Savings and money market accounts are spread over various time periods based on the expected sensitivity of these rates considering liquidity and investment preferences for the bank. Non-rate sensitive assets and liabilities are spread over time periods to reflect how the Corporation views the maturity of these funds. The following table presents the Corporation’s GAP Analysis as of December 31, 2007:
| | | | | | | | | | | | | | | | | | | | | | | | |
| (dollars in thousands) | | 0 to 90
Days | | | 90 to 365
Days | | | 1 - 5
Years | | | Over 5
Years | | | Non-Rate
Sensitive | | | Total | |
Assets: | | | | | | | | | | | | | | | | | | | | | | | | |
Interest-bearing deposits with banks | | $ | 1,209 | | | $ | — | | | $ | — | | | $ | — | | | $ | — | | | $ | 1,209 | |
Federal funds sold | | | 17,000 | | | | — | | | | — | | | | — | | | | — | | | | 17,000 | |
Investment securities | | | 5,628 | | | | 12,126 | | | | 20,526 | | | | 10,122 | | | | — | | | | 48,402 | |
Loans(1) | | | 290,194 | | | | 71,804 | | | | 372,503 | | | | 73,549 | | | | — | | | | 808,050 | |
Allowance | | | — | | | | — | | | | — | | | | — | | | | (8,124 | ) | | | (8,124 | ) |
Cash and due from banks | | | — | | | | — | | | | — | | | | — | | | | 76,965 | | | | 76,965 | |
Other assets | | | — | | | | — | | | | 121 | | | | 477 | | | | 57,996 | | | | 58,594 | |
| | | | | | | | | | | | | | | | | | | | | | | | |
Total assets | | $ | 314,031 | | | $ | 83,930 | | | $ | 393,150 | | | $ | 84,148 | | | $ | 126,837 | | | $ | 1,002,096 | |
| | | | | | | | | | | | | | | | | | | | | | | | |
Liabilities and shareholders’ equity: | | | | | | | | | | | | | | | | | | | | | | | | |
Demand, non-interest-bearing | | $ | 43,942 | | | $ | 29,104 | | | $ | 155,223 | | | $ | — | | | $ | — | | | $ | 228,269 | |
Savings, NOW and market rate | | | 48,190 | | | | 41,037 | | | | 154,091 | | | | 44,659 | | | | — | | | | 287,977 | |
Time deposits | | | 122,782 | | | | 71,601 | | | | 8,962 | | | | 117 | | | | — | | | | 203,462 | |
Wholesale deposits | | | 20,900 | | | | 98,920 | | | | 10,000 | | | | — | | | | — | | | | 129,820 | |
Borrowed funds | | | 10,000 | | | | 15,000 | | | | 20,000 | | | | — | | | | — | | | | 45,000 | |
Other liabilities | | | — | | | | — | | | | — | | | | — | | | | 17,217 | | | | 17,217 | |
Shareholders’ equity | | | 3,219 | | | | 9,656 | | | | 51,500 | | | | 25,976 | | | | — | | | | 90,351 | |
| | | | | | | | | | | | | | | | | | | | | | | | |
Total liabilities and shareholders’ equity | | $ | 249,033 | | | $ | 265,318 | | | $ | 399,776 | | | $ | 70,752 | | | $ | 17,217 | | | $ | 1,002,096 | |
| | | | | | | | | | | | | | | | | | | | | | | | |
Interest earning assets | | $ | 314,031 | | | $ | 83,930 | | | $ | 393,029 | | | $ | 83,671 | | | $ | — | | | $ | 874,661 | |
Interest bearing liabilities | | $ | 201,872 | | | $ | 226,558 | | | $ | 193,053 | | | $ | 44,776 | | | $ | — | | | $ | 666,259 | |
| | | | | | | | | | | | | | | | | | | | | | | | |
Difference between interest earning assets and interest bearing liabilities | | $ | 112,159 | | | $ | (142,628 | ) | | $ | 199,976 | | | $ | 38,895 | | | $ | — | | | $ | 208,402 | |
| | | | | | | | | | | | | | | | | | | | | | | | |
Cumulative difference between interest earning assets and interest bearing liabilities | | $ | 112,159 | | | $ | (30,469 | ) | | $ | 169,507 | | | $ | 208,402 | | | $ | — | | | $ | 208,402 | |
| | | | | | | | | | | | | | | | | | | | | | | | |
Cumulative earning assets as a % of cumulative interest bearing liabilities | | | 156 | % | | | 93 | % | | | 127 | % | | | 131 | % | | | | | | | | |
(1) | Loans include portfolio loans and leases and loans held for sale. |
The table above indicates that the Corporation is asset sensitive in the immediate to 90 day time frame and should experience an increase in net interest income in the near term if interest rates rise. The converse is also true.
Maturity of Certificates of Deposit of $100,000 or Greater at December 31, 2007
| | | | | | |
| (dollars in thousands) | | Non-
Wholesale | | Wholesale |
Three months or less | | $ | 85,858 | | $ | 20,000 |
Three to six months | | | 28,393 | | | 73,501 |
Six to twelve months | | | 3,533 | | | 20,000 |
Greater than twelve months | | | 1,788 | | | 10,000 |
| | | | | | |
Total | | $ | 119,572 | | $ | 123,501 |
| | | | | | |
8
PROVISIONFOR LOANAND LEASE LOSSES
General Discussion of the Allowance for Loan and Lease Losses
The Corporation uses the allowance method of accounting for credit losses. The balance in the allowance for loan and lease losses (“allowance”) is determined based on Management’s review and evaluation of the loan and lease portfolio in relation to past loss experience, the size and composition of the portfolio, current economic events and conditions, and other pertinent factors, including Management’s assumptions as to future delinquencies, recoveries and losses.
Increases to the allowance are implemented through a corresponding provision (expense) in the Corporation’s statement of income. Loans and leases deemed uncollectible are charged against the allowance. Recoveries of previously charged-off amounts are credited to the allowance.
While Management considers the allowance to be adequate based on information currently available, future additions to the allowance may be necessary due to changes in economic conditions or Management’s assumptions as to future delinquencies, recoveries and losses and Management’s intent with regard to the disposition of loans. In addition, the Pennsylvania Department of Banking and the Federal Reserve Bank of Philadelphia, as an integral part of their examination process, periodically review the Corporation’s allowance.
The Corporation’s allowance is the accumulation of four components that are calculated based on various independent methodologies. All components of the allowance are estimations. Management discusses these estimates earlier in this document under the heading of “Critical Accounting Policies, Judgments and Estimates”. The four components are as follows:
| | • | | Specific Loan Evaluation Component – Includes the specific evaluation of larger classified loans |
| | • | | Historical Charge-Off Component – Applies a five year historical charge-off rate to pools of non-classified loans |
| | • | | Additional Factors Component – The loan portfolio is broken down into multiple homogenous subclassifications upon which multiple factors (such as delinquency trends, economic conditions, loan terms, and regulatory environment) are evaluated resulting in an allowance amount for each of the subclassifications. The sum of these amounts equals the Additional Factors Component. |
| | • | | Unallocated Component – This amount represents a reserve against all loans for factors not included in the components above. |
Asset Quality and Analysis of Credit Risk
Credit quality on the overall loan and lease portfolio remains strong as total non-performing loans and leases of $2.0 million represents 25 basis points of portfolio loans and leases at December 31, 2007. This compares with 12 basis points or $823 thousand at December 31, 2006 and 11 basis points and $415 thousand at December 31, 2005. December 31, 2007 non-performing loan balances include an accruing $1.3 million loan, which is well secured by a local residential property, is now on a current status.
The provision for loan and lease losses for the year ended December 31, 2007, 2006 and 2005 were $891 thousand, $832 thousand and $762 thousand, respectively. At December 31, 2007, the allowance for loan and lease losses of $8.1 million represents 1.01% of portfolio loans and leases compared with 1.19% at December 31, 2006 and 1.24% at December 31, 2005. The decline in the allowance as a percentage of portfolio loans and leases from the end of 2005 to the end of 2007 reflects the Corporation’s low charge-off history over the two year time period and the continued economic strength of the Corporation’s Delaware Valley, Pennsylvania market area.
Additionally, the allowance for loan and lease losses in 2007 was affected by continued loan growth, the maturing of the lease portfolio and related charge-offs, continuing changes to the mix of assets, and periodic refinements along with changes to estimates of loss in certain asset classes. In the aggregate, these changes resulted in a more volatile quarterly provision for loan and lease losses in 2007. Specifically, the changes in loss estimates for residential mortgages and home equity lines of credit, resulted in a lower provision for loan and lease losses in 2007 than would have resulted under the previous loss estimates of approximately $1.2 million. Correspondingly, the allowance for loan and lease losses at December 31, 2007 is approximately $1.2 million lower than it would have been under the previous loss estimates. The Corporation believes that its revised estimates better reflect the loss inherent in the loan and lease portfolio.
| | • | | Portfolio Loans and Leases excluding Leases– The Corporation’s $757.8 million loan portfolio (total portfolio loans and leases excluding leases) is based in the Corporation’s traditional market areas of Chester, Delaware and Montgomery counties (Pennsylvania) and the greater Philadelphia area which have not experienced the hyper real estate price appreciation and subsequent decline that many areas around the country are experiencing. The Corporation has observed a slow-down in new construction in the local area and some home value reductions, but has not seen any impact on the Corporation’s loan quality ratios relative to the loan portfolio. |
9
| | • | | Concentrations – The Corporation has a material portion of its loans (excluding leases) in real estate related loans. As of December 31, 2007, loans secured by real estate are $638.0 million or 84% of the total loan portfolio of $757.8 million, which includes $530.0 of real estate loans. Loans secured by real estate include approximately $108.0 million of commercial and industrial loans. |
A predominant percentage of the Corporation’s real estate exposure, both commercial and residential, is in the Corporation’s primary trade area which includes portions of Delaware, Chester, Montgomery and Philadelphia counties in Southeastern Pennsylvania. Management is aware of this concentration and mitigates this risk to the extent possible in many ways, including the underwriting and assessment of the borrower’s capacity to repay and equity in the underlying real estate collateral.
| | • | | Construction – Residential site development construction loans declined from $46.5 million at December 31, 2006 to $45.4 million at December 31, 2007. Commercial construction projects were $15.1 million at December 31, 2006 and were reduced to $11.0 million at December 31, 2007. Consumer construction loans at December 31, 2006 were $13.3 million and $10.5 million at December 31, 2007. This decrease is attributable to the completion of existing construction projects and a lower level of new projects by the Corporation’s construction clients. |
| | • | | Non Traditional Loan Products – The Corporation’s portfolio of loans and leases as reflected on the balance sheet include $56.8 million of first lien mortgage positions on one to four family residential loans that are interest only loans. |
At December 31, 2007 the total first lien interest only residential loans of $56.8 million included $47.6 million of adjustable rate loans that convert to principal and interest payments between five and ten years after inception and $9.2 million of fixed rate loans that continue as interest only loans until reaching maturity. At December 31, 2007 the balance sheet also includes $7.4 million one to four family residential loans secured by junior lien positions that are interest only loans. These fixed rate loans will remain as interest only loans until maturity.
| | • | | Leasing – The Corporation’s $45.1 million leasing portfolio is national in scope and consists of over 2,500 equipment financing leases to customers in all 50 states with initial lease terms of 24 to 60 months and yields significantly higher than other loans in the Corporation’s loan and lease portfolio. Approximately 70% of the Corporation’s leases are in 12 states with California being the largest at approximately 15%. |
The Corporation has established an allocation of the overall reserve for leases as shown in the table on page 13 of $789 thousand which equates to 1.75% of lease balances. Additionally, the Corporation charges-off leases that are 120 days past due. Net lease charge-offs in 2007 of $535 thousand (or 1.96% of average leases) reflect the maturation of the lease portfolio and the inherent riskier nature of the leasing business compared to the Corporation’s other loans. The Corporation anticipates charge-offs in the leasing portfolio to average between 1.25% to 1.75% of average lease balances in 2008.
10
Non-Performing Assets and Related Ratios
| | | | | | | | | | | | | | | | | | | | |
| (dollars in thousands) | | 2007 | | | 2006 | | | 2005 | | | 2004 | | | 2003 | |
Balance, January 1 | | | | | | | | | | | | | | | | | | | | |
Non-accrual loans and leases | | $ | 747 | | | $ | 704 | | | $ | 261 | | | $ | 1,353 | | | $ | 371 | |
Loans and leases 90 days or more past due | | | 1,263 | | | | 119 | | | | 129 | | | | 22 | | | | 62 | |
| | | | | | | | | | | | | | | | | | | | |
Total non-performing loans and leases | | | 2,010 | | | | 823 | | | | 390 | | | | 1,375 | | | | 433 | |
Other real estate owned (“OREO”) | | | — | | | | — | | | | 25 | | | | 357 | | | | — | |
| | | | | | | | | | | | | | | | | | | | |
Total non-performing assets | | $ | 2,010 | | | $ | 823 | | | $ | 415 | | | $ | 1,732 | | | $ | 433 | |
| | | | | | | | | | | | | | | | | | | | |
| | | | | |
Allowance for loan and lease losses to non-performing assets | | | 404.1 | % | | | 986.9 | % | | | 1,783.6 | % | | | 399.9 | % | | | 1,540.4 | % |
Allowance for loan and lease losses to non-performing loans | | | 404.1 | % | | | 986.9 | % | | | 1,897.9 | % | | | 503.8 | % | | | 1,540.4 | % |
Non-performing loans to total loans and leases | | | 0.25 | % | | | 0.12 | % | | | 0.07 | % | | | 0.25 | % | | | 0.09 | % |
Allowance for loan losses to total loans and leases | | | 1.01 | % | | | 1.19 | % | | | 1.24 | % | | | 1.25 | % | | | 1.34 | % |
Non-performing assets to total assets | | | 0.20 | % | | | 0.10 | % | | | 0.06 | % | | | 0.25 | % | | | 0.07 | % |
Net loan and lease charge-offs/average loans and leases | | | .12 | % | | | .02 | % | | | .05 | % | | | .12 | % | | | .04 | % |
Period end portfolio loans and leases | | $ | 802,925 | | | $ | 681,291 | | | $ | 595,165 | | | $ | 555,889 | | | $ | 498,726 | |
Average loans and leases (average for year) | | $ | 740,694 | | | $ | 636,286 | | | $ | 582,386 | | | $ | 538,775 | | | $ | 478,397 | |
Allowance for loan and lease losses | | $ | 8,124 | | | $ | 8,122 | | | $ | 7,402 | | | $ | 6,927 | | | $ | 6,670 | |
Summary of Changes in the Allowance for Loan and Lease Losses
| | | | | | | | | | | | | | | | | | | | |
| (dollars in thousands) | | 2007 | | | 2006 | | | 2005 | | | 2004 | | | 2003 | |
Balance, January 1 | | $ | 8,122 | | | $ | 7,402 | | | $ | 6,927 | | | $ | 6,670 | | | $ | 6,114 | |
Charge-offs: | | | | | | | | | | | | | | | | | | | | |
Consumer | | | (396 | ) | | | (31 | ) | | | (158 | ) | | | (94 | ) | | | (102 | ) |
Commercial and industrial | | | (41 | ) | | | — | | | | — | | | | (167 | ) | | | (112 | ) |
Real estate | | | — | | | | (120 | ) | | | (156 | ) | | | (431 | ) | | | (13 | ) |
Leases | | | (599 | ) | | | — | | | | — | | | | — | | | | — | |
| | | | | | | | | | | | | | | | | | | | |
Total charge-offs | | | (1,036 | ) | | | (151 | ) | | | (314 | ) | | | (692 | ) | | | (227 | ) |
Recoveries: | | | | | | | | | | | | | | | | | | | | |
Consumer | | | 22 | | | | 34 | | | | 11 | | | | 47 | | | | 32 | |
Commercial and industrial | | | 46 | | | | 3 | | | | 12 | | | | 2 | | | | — | |
Real estate | | | 15 | | | | 2 | | | | 4 | | | | — | | | | 1 | |
Leases | | | 64 | | | | — | | | | — | | | | — | | | | — | |
| | | | | | | | | | | | | | | | | | | | |
Total Recoveries | | | 147 | | | | 39 | | | | 27 | | | | 49 | | | | 33 | |
| | | | | | | | | | | | | | | | | | | | |
Net (charge-offs) / recoveries | | | (889 | ) | | | (112 | ) | | | (287 | ) | | | (643 | ) | | | (194 | ) |
Provision for loan and lease losses | | | 891 | | | | 832 | | | | 762 | | | | 900 | | | | 750 | |
| | | | | | | | | | | | | | | | | | | | |
Balance, December 31 | | $ | 8,124 | | | $ | 8,122 | | | $ | 7,402 | | | $ | 6,927 | | | $ | 6,670 | |
| | | | | | | | | | | | | | | | | | | | |
Allocation of Allowance for Loan and Lease Losses
The following table sets forth an allocation of the allowance for loan and lease losses by category. The specific allocations in any particular category may be changed in the future to reflect then current conditions. Accordingly, Management considers the entire allowance to be available to absorb losses in any category.
| | | | | | | | | | | | | | | | | | | | | | | | | | | | | | |
| (dollars in thousands) | | December 31, | |
| | 2007 | | | 2006 | | | 2005 | | | 2004 | | | 2003 | |
| | | | %
Loans
to
Total
Loans | | | | | %
Loans
to
Total
Loans | | | | | %
Loans
to
Total
Loans | | | | | %
Loans
to
Total
Loans | | | | | %
Loans
to
Total
Loans | |
Balance at end of period applicable to: | | | | | | | | | | | | | | | | | | | | | | | | | | | | | | |
Commercial and industrial | | $ | 2,636 | | 26.4 | % | | $ | 2,161 | | 25.7 | % | | $ | 2,191 | | 28.5 | % | | $ | 3,575 | | 33.1 | % | | $ | 3,656 | | 35.7 | % |
Real estate – construction | | | 850 | | 8.3 | | | | 950 | | 11.0 | | | | 569 | | 7.6 | | | | 741 | | 6.6 | | | | 558 | | 7.2 | |
Real estate – mortgage | | | 3,727 | | 58.7 | | | | 4,448 | | 60.9 | | | | 4,141 | | 62.3 | | | | 806 | | 58.5 | | | | 1,089 | | 53.4 | |
Consumer | | | 62 | | 1.0 | | | | 77 | | 1.4 | | | | 143 | | 1.6 | | | | 1,174 | | 1.8 | | | | 906 | | 3.7 | |
Leases | | | 789 | | 5.6 | | | | 140 | | 1.0 | | | | — | | — | | | | — | | — | | | | — | | — | |
Unallocated | | | 60 | | — | | | | 346 | | — | | | | 358 | | — | | | | 631 | | — | | | | 461 | | — | |
| | | | | | | | | | | | | | | | | | | | | | | | | | | | | | |
Total | | $ | 8,124 | | 100 | % | | $ | 8,122 | | 100 | % | | $ | 7,402 | | 100.0 | % | | $ | 6,927 | | 100.0 | % | | $ | 6,670 | | 100.0 | % |
| | | | | | | | | | | | | | | | | | | | | | | | | | | | | | |
11
NON-INTEREST INCOME
2007 Compared to 2006
For the year ended December 31, 2007, non-interest income excluding the $1.3 million (pre-tax)real estate gain on the Wynnewood property, was $20.4 million, an increase of $2.1 million or 11.4% over the $18.4 million in 2006. The primary factor for this increase was year-to-date Wealth Management revenue of $13.5 million which was $1.1 million or 8.7% higher than 2006. The increase in Wealth Management fee revenue is partially due to market appreciation, increased brokerage fee revenue, a fall 2007 minimum fee increase and increased assets and related revenue from an institutional client. The balance of the increase in non-interest income was due primarily to income from bank owned life insurance (“BOLI”) acquired in May 2007, stronger mortgage loan sale revenue and a gain on the sale of other real estate owned.
Wealth Management revenues for the years ended December 31, 2007, 2006 and 2005 include $580 thousand, $403 thousand and $221 thousand, respectively, of fees that will no longer be earned relating to one institutional client that was acquired by another financial institution in a business combination on November 16, 2007. Wealth assets under Management and Administration relating to this client at December 31, 2005 and December 31, 2006 were approximately $296.2 million and $412.4 million, respectively, and zero at December 31, 2007.
2006 Compared to 2005
Non-interest income for the twelve months ended December 31, 2006 increased $56 thousand or 0.3% to $18.4 million when compared to 2005. Wealth Management services fee income increased $883 thousand or 7.7% to $12.4 million in 2006 from $11.5 million in 2005, while other non-interest income categories in the aggregate declined $827 thousand over the same time period, primarily due to lower residential mortgage related revenue.
Wealth Management revenue increased in 2006 when compared to 2005 due to strong results from the investment management, retirement services and estate administration components, along with increased assets and related revenue from an institutional client. Increased investment management fees are the result of conversion of certain lower fee custody accounts to higher fee investment management accounts.
NON-INTEREST EXPENSE
2007 Compared to 2006
For the year ended December 31, 2007, non-interest expense was $35.0 million, an increase of $3.5 million or 11.3% over the $31.4 million in the same period in 2006. Personnel and related support costs associated with the new business initiatives, advertising costs, and professional and consulting fees were the primary contributors to this increase in non-interest expenses. Non-interest expenses in 2007 include approximately $350 thousand in personnel, professional and other costs that are not ongoing commitments.
2006 Compared to 2005
Non-interest expense for the year ended December 31, 2006 decreased $150 thousand to $31.4 million when compared to 2005. This decrease is primarily due to reductions in incentive compensation, mortgage servicing right amortization and professional fees, partially offset by increased occupancy costs, employee benefit costs, leasing company startup costs and loan production office staffing additions.
INCOME TAXES
Income taxes for the year ended December 31, 2007 were $6.6 million compared to $6.7 million in 2006 and $5.9 million in 2005. The effective tax rate was 32.58% in 2007, 34.47% in 2006 and 34.31% in 2005. The decrease in the effective tax rate in 2007 was due to an increase in tax free income and other smaller items. The tax rates for 2006 and 2005 were relatively unchanged.
BALANCE SHEET ANALYSIS
Asset Changes
Total assets increased $175.3 million or 21.2% from $826.8 million as of December 31, 2006 to $1.0 billion as of December 31, 2007. The growth in total portfolio loans and leases of $121.6 million and an increase of $33.2 in cash and cash equivalents are the major factors for the increase.
The increase in loan volume during 2007 was concentrated in commercial and industrial loans which increased $38.6 million or 22%, and commercial mortgages which increased $26.1 million or 13.2%, as loan demand remained strong. Leases increased $38.1 million from $7.0 million at December 31, 2006 to $45.1 million December 31, 2007 as 2007 was the first full year of operations for the BMT Leasing.
The growth of $33.2 million in cash and cash equivalents is due to a $35.0 million increase in short term inflows of customer deposits at year end 2007 compared with year end 2006. Total cash and cash equivalents as of December 31, 2007 was $95.2 million or 53.5% higher than the $62.0 million at December 31, 2006.
Liability Changes
Total liabilities increased $167.0 million or 22.4% from $714.5 million as of December 31, 2006 to $911.8 million as of December 31, 2007. The increase in liabilities is primarily due to a $139.8 million increase in wholesale funding and year end customer deposit activity. Funding from wholesale
12
sources at December 31, 2007 included approximately $129.8 million in wholesale certificates of deposit and $45.0 million in Federal Home Loan Bank (“FHLB”) borrowings ($174.8 million in total). This compares with approximately $20.0 million and $15.0 million in wholesale certificates and FHLB borrowings, respectively, at December 31, 2006 ($35.0 million in total). The increase in total wholesale funding of $139.8 million in 2007 was primarily used to fund portfolio loan and lease growth of approximately $122.0 million. Average other deposits (total deposits less wholesale certificates of deposit) for 2007 increased 0.1% or $800 thousand to $616.1 million compared with $615.4 million for 2006 due to the difficult deposit gathering environment. The Corporation has unused FHLB borrowing capacity of $263.0 million at December 31, 2007.
Deposit balances at December 31, 2007 and 2006 reflect approximately $70.0 million and $35.0 million, respectively, in demand deposit balances that represent short term in-flows from customer year-end activity. These short term deposit in-flows temporarily pushed the Corporation’s total assets over the $1.0 billion level at December 31, 2007.
During 2007, deposits continued to shift from lower yielding savings and NOW accounts into higher yielding money market accounts, but at a much slower pace than the Corporation experienced in 2006.
Other deposits defined as total deposits less wholesale deposits have historically experienced modest growth each year as evidenced by the compound annual growth rate of 13.9% over the ten year period ending December 31, 2005. Since that time, other deposit growth has been very slow due to a number of factors which include the intense competition, a more educated consumer, an abundance of information from the Internet, more electronic banking options, wider acceptance of debt and credit transactions, and reduced customer loyalty. If growth of other deposits remains slow, the Corporation intends to fund earning asset growth with higher cost wholesale sources. However, after it evaluates the capacity and cost of continuing to fund asset growth with wholesale sources, the Corporation may decide to reduce or eliminate future asset growth. Such a decision could impact profitability.
Investment Portfolio
A maturity breakout of the investment portfolio by investment type at December 31, 2007 is as follows:
| | | | | | | | | | | | | | | | | | | | |
| (dollars in thousands) | | Maturing
During
2008 | | | Maturing
From
2009
Through
2012 | | | Maturing
From
2013
Through
2017 | | | Maturing
After
2017 | | | Total | |
Obligations of the U.S. Government and agencies: | | | | | | | | | | | | | | | | | | | | |
Book value | | $ | 3,993 | | | $ | 8,029 | | | $ | 10,109 | | | $ | — | | | $ | 22,131 | |
Weighted average yield | | | 4.00 | % | | | 4.63 | % | | | 5.70 | % | | | — | | | | 5.01 | % |
State and political subdivisions: | | | | | | | | | | | | | | | | | | | | |
Book value | | $ | — | | | $ | 3,034 | | | $ | 2,983 | | | $ | 1,675 | | | $ | 7,692 | |
Weighted average yield | | | — | | | | 3.13 | % | | | 3.25 | % | | | 3.88 | % | | | 3.34 | % |
Other investment securities: | | | | | | | | | | | | | | | | | | | | |
Book value | | $ | 450 | | | $ | 945 | | | $ | — | | | $ | 10 | | | $ | 1,405 | |
Weighted average yield | | | 5.01 | % | | | 4.05 | % | | | — | | | | — | | | | 4.32 | % |
| | | | | | | | | | | | | | | | | | | | |
Subtotal book value | | $ | | | | $ | | | | $ | | | | $ | | | | $ | | |
Weighted average yield | | | | | | | | | | | | | | | | | | | | |
Mortgage backed securities1 | | | | | | | | | | | | | | | | | | | | |
Book value | | $ | — | | | $ | — | | | $ | 7,821 | | | $ | 9.353 | | | $ | 17,174 | |
Weighted average yield | | | — | | | | — | | | | 5.20 | % | | | 5.64 | % | | | 5.44 | % |
| | | | | | | | | | | | | | | | | | | | |
Total book value | | $ | 4,443 | | | $ | 12,008 | | | $ | 20,913 | | | $ | 11,038 | | | $ | 48,402 | |
| | | | | | | | | | | | | | | | | | | | |
Weighted average yield | | | 4.10 | % | | | 4.21 | % | | | 5.17 | % | | | 5.36 | % | | | 4.87 | % |
1 | Mortgage backed securities are included in the above table based on their contractual maturity. However, mortgage backed securities, by design, have scheduled monthly principle payments which may accelerate if interest rates decline. |
Loan Portfolio
A breakdown of the loan portfolio by major categories at December 31 for each of the last five years is as follows:
| | | | | | | | | | | | | | | |
| (dollars in thousands) | | December 31, |
| | 2007 | | 2006 | | 2005 | | 2004 | | 2003 |
Consumer | | $ | 7,990 | | $ | 9,156 | | $ | 9,437 | | $ | 10,291 | | $ | 18,580 |
Commercial & Industrial | | | 213,834 | | | 175,278 | | | 170,283 | | | 186,923 | | | 178,382 |
Commercial Mortgage | | | 224,510 | | | 198,407 | | | 162,621 | | | 137,141 | | | 119,811 |
Construction | | | 66,901 | | | 74,798 | | | 45,523 | | | 36,941 | | | 36,235 |
Residential Mortgage | | | 121,313 | | | 103,572 | | | 99,602 | | | 75,081 | | | 59,714 |
Home Equity Lines & Loans | | | 123,293 | | | 113,068 | | | 107,699 | | | 109,512 | | | 86,004 |
Leases | | | 45,084 | | | 7,012 | | | — | | | — | | | — |
| | | | | | | | | | | | | | | |
Total Portfolio Loans | | | 802,925 | | | 681,291 | | | 595,165 | | | 555,889 | | | 498,726 |
| | | | | | | | | | | | | | | |
Loans held for sale | | | 5,125 | | | 3,726 | | | 2,765 | | | 8,708 | | | 3,690 |
| | | | | | | | | | | | | | | |
| | $ | 808,050 | | $ | 685,017 | | $ | 597,930 | | $ | 564,597 | | $ | 502,416 |
| | | | | | | | | | | | | | | |
13
Loan Portfolio Maturity and Interest Rate Sensitivity
The loan maturity distribution and interest rate sensitivity table below excludes loans secured by one to four family residential properties and consumer loans as of December 31, 2007:
| | | | | | | | | | | | |
| (dollars in thousands) | | Maturing
During
2008 | | Maturing
From
2009
Through
2012 | | Maturing
After
2012 | | Total |
Loan Portfolio Maturity: | | | | | | | | | | | | |
Commercial and industrial | | $ | 91,955 | | $ | 82,665 | | $ | 39,214 | | $ | 213,834 |
Construction | | | 37,840 | | | 27,570 | | | 1,491 | | | 66,901 |
Commercial mortgage | | | 1,862 | | | 29,645 | | | 193,003 | | | 224,510 |
Leases | | | 412 | | | 44,038 | | | 634 | | | 45,084 |
| | | | | | | | | | | | |
Total | | $ | 132,069 | | $ | 183,918 | | $ | 234,342 | | $ | 550,329 |
| | | | | | | | | | | | |
Interest sensitivity on the above loans: | | | | | | | | | | | | |
Loans with predetermined rates | | $ | 28,987 | | $ | 135,455 | | $ | 73,484 | | $ | 237,926 |
Loans with adjustable or floating rates | | | 103,082 | | | 48,463 | | | 160,858 | | | 312,403 |
| | | | | | | | | | | | |
Total | | $ | 132,069 | | $ | 183,918 | | $ | 234,342 | | $ | 550,329 |
| | | | | | | | | | | | |
DISCUSSIONOF SEGMENTS
The Corporation has three principal segments (Residential Mortgage, Wealth Management, and Banking) as defined by SFAS No. 131 “Segment Reporting”. These segments are discussed below. Detailed segment information appears in Note 23 in the accompanying Consolidated Financial Statements.
Residential Mortgage Segment Activity
All activity is for the year unless noted otherwise:
| | | | | | | | | | | | |
| (dollars in thousands) | | 2007 | | | 2006 | | | 2005 | |
Residential loans held in portfolio* | | $ | 121,313 | | | $ | 103,752 | | | $ | 99,602 | |
Mortgage originations | | | 127,611 | | | | 127,307 | | | | 193,324 | |
Mortgage loans sold: | | | | | | | | | | | | |
Servicing retained | | | 24,300 | | | | 20,910 | | | | 41,664 | |
Servicing released | | | 64,466 | | | | 46,750 | | | | 78,537 | |
| | | | | | | | | | | | |
Total mortgage loans sold | | $ | 88,766 | | | $ | 67,660 | | | $ | 120,201 | |
| | | | | | | | | | | | |
Percentage of mortgage loans sold: | | | | | | | | | | | | |
Servicing retained % | | | 27.4 | % | | | 30.9 | % | | | 34.7 | % |
Servicing released % | | | 72.6 | % | | | 69.1 | % | | | 65.3 | % |
Loans serviced for others* | | $ | 357,363 | | | $ | 382,141 | | | $ | 417,649 | |
Mortgage servicing rights* | | | 2,820 | | | | 2,883 | | | | 2,982 | |
Gain on sale of loans | | | 1,250 | | | | 954 | | | | 1,622 | |
Loans servicing & late fees | | | 1,115 | | | | 1,126 | | | | 1,303 | |
Amortization of MSRs | | | 348 | | | | 348 | | | | 606 | |
Basis point gain on loans sold | | | 141 | | | | 141 | | | | 135 | |
The Mortgage Banking Segment pre-tax segment profit (“PTSP”) of $555 thousand in 2007 was 30.0% or $233 thousand lower than 2006. This decrease is due to $473 thousand or 30% increase in costs, partially offset by $242 thousand or 10.8% increase in revenues. The increase in costs is due to the July 2007 addition of mortgage origination capacity in the form of the BMT Mortgage Group, which consisted of five mortgage professionals.
Mortgage originations in 2007 of $127.6 million were flat with last year and down 34.0% from 2005. However, the value of mortgages sold (servicing retained and servicing released) in 2007 of $88.8 million was 31.2% higher than those sold in 2006. Accordingly, the gain on sale of loans in 2007 of $1.3 million was 31.0 % higher than the gain on sale of loans in 2006 (as the gain per loan sold of 141 basis points was unchanged from 2006). Origination activity and total mortgages sold in 2005 were significantly higher than 2006 and 2007, as 2005 was the last year of the refinance boom that ran from 2002 through 2005.
Management expects mortgage originations in 2008 to be higher than 2007 due to the reduction in interest rates in January and February 2008, the opportunity for consumers to lock in lower fixed rate mortgages, and the additional capacity of BMT Mortgage Group.
Loans serviced for others have declined during the past few years from $417.6 million to $382.1 million to 357.4 million at the end of 2005, 2006 and 2007, respectively. This decline is primarily the result of mortgage repayments exceeding mortgage loans sold servicing retained. Accordingly, there has been a proportional decline in servicing revenue over the same time period.
Wealth Segment Activity
| | | | | | | | | |
| (in millions) | | 2007 | | 2006 | | 2005 |
Brokerage assets | | $ | 85.3 | | $ | 76.3 | | $ | 91.2 |
Assets under management – other institutions | | | — | | | 412.4 | | | 296.2 |
Wealth assets under management and administration | | | 2,191.8 | | | 2,102.4 | | | 1,951.4 |
| | | | | | | | | |
Total wealth assets under management, administration and brokerage | | $ | 2,277.1 | | $ | 2,591.1 | | $ | 2,338.8 |
| | | | | | | | | |
The Wealth Management Segment reported a 2007 PTSP of $6.7 million, an 11.4% or a $683 thousand increase over 2006. The increase in PTSP is primarily due to a $1.1 million or 8.7% increase in Wealth Management revenue, partially offset by a $397 thousand or 6.0% increase in expenses, primarily personnel related. The increase in Wealth revenue is attributable to market appreciation, increased assets under management and revenue from an institutional client, increased brokerage revenue and a fall 2007 minimum fee increase.
14
In 2006, the Wealth Management Segment reported a 15.8% or $817 thousand increase in PTSP over 2005. This increase was due to a 7.7% or $883 thousand increase in Wealth Management revenue while costs rose only 1.0% or $63 thousand. The increase in Wealth Management fee revenue in 2006 compared to 2005 is related to strong results from the investment management, retirement services and estate administration components, along with increased assets under management and related revenue from an institutional client. Increased investment management fees are the result of conversion of certain lower custody accounts to higher fee investment management accounts. Wealth Management personnel costs in 2006 were only 4.5% or $162 thousand higher than 2005 in part due to the departure of the Wealth Management executive in September 2006, which position was not filled until February 2007.
Wealth Management fee revenue in 2007, 2006 and 2005 includes $580 thousand, $403 thousand and $221 thousand, respectively, of fees that will no longer be earned relating to one institutional client that was acquired by another financial institution in a business combination on November 16, 2007.
Banking Segment Activity
Banking segment data as presented in Note 23 in the accompanying Notes to Consolidated Financial Statements indicates a PTSP of $13.6 million in 2007, $13.0 million in 2006 and $11.4 million in 2005. See Components of Net Income earlier in this documentation for a discussion of the Banking segment.
CAPITAL
Consolidated shareholder’s equity of the Corporation was $90.4 million or 9.02% of total assets as of December 31, 2007 compared to $82.1 million or 9.93% of total assets as of December 31, 2006. The decline of 91 basis points is primarily the result of asset growth. It should be noted that 32 basis points of the 91 basis point decrease can be attributed to the change in year end short-term customer deposit inflows of approximately $35.0 million ($70.0 million in 2007 compared to $35.0 million in 2006). The Corporation’s and Bank’s regulatory capital ratios and the minimum capital requirements to be considered “Well Capitalized” by banking regulators are displayed in Note 20 of the accompanying Notes to Consolidated Financial Statements.
Both the Corporation and the Bank exceed the required capital levels to be considered “Well Capitalized” by their respective regulators at the end of each period presented.
Neither the Corporation nor the Bank are under any agreement with regulatory authorities, nor is Management aware of any current recommendations by the regulatory authorities which, if such recommendations were implemented, would have a material effect on liquidity, capital resources or operations of the Corporation.
The Corporation’s Capital Policy states that 50% of capital generated from net earnings will be retained with balance going towards the dividend (historically – 33% of net earnings) and the repurchase of the Corporation’s common stock. During 2007 and 2006, the Corporation repurchased $2.4 million and $3.4 million in common stock representing 101,403 and 150,000 shares at an average cost of $23.85 and $22.71, respectively.
The Corporation adopted Statement of Financial Accounting Standards No. 158 “Employers’ Accounting for Defined Benefit Pension Plans and Other Postretirement Plans” (“FAS 158”) on December 31, 2006. As a result of its adoption, the Corporation recorded additional pension liabilities of approximately $6.5 million, deferred taxes of approximately $2.3 and a reduction of accumulated other comprehensive income (shareholders’ equity) of approximately $4.2 million effective December 31, 2006.
See Note 1-U in the Notes to Consolidated Financial Statements for additional information.
LIQUIDITY
The Corporation manages its liquidity position on a daily basis as part of the daily settlement function and monthly as part of the asset liability management process. The Corporation’s primary liquidity is maintained by managing its deposits along with the utilization of purchased federal funds, borrowings from the FHLB and utilization of other wholesale funding sources. Secondary sources of liquidity include the sale of investment securities and certain loans in the secondary market.
Other wholesale funding sources include certificates of deposit from brokers, generally available in blocks of $1.0 million or more, CDARS and PLGIT. The Corporation is also evaluating additional wholesale funding sources.
Borrowing availability with the FHLB was approximately $263.0 million, excluding $45.0 million of advances outstanding, as of December 31, 2007. Overnight Fed Funds lines consist of lines from 8 banks totaling $90.0 million. Quarterly, ALCO reviews the Corporation’s liquidity needs and reports its findings to the Risk Management Committee of the Board of Directors.
The Corporation’s investment portfolio of $48.4 million at December 31, 2007 is approximately 4.8% of total assets. The Corporation intends to grow the investment portfolio, funded with a mix of wholesale funds from various sources, up to $100 million or 10% of total assets by the end of 2008. This action will serve to increase liquidity and provide the Corporation the opportunity to utilize the securities to borrow additional funds through the FHLB or through repurchase agreements.
15
The Corporation continually evaluates the capacity and the cost of continuing to fund earning asset growth with wholesale deposits. The Corporation believes that it has sufficient capacity to fund expected 2008 earning asset growth with wholesale sources.
OFF BALANCE SHEET RISK
The following chart presents the off-balance sheet commitments of the Bank as of December 31, 2007, listed by dates of funding or payment:
| | | | | | | | | | | | | | | |
| (dollars in thousands) | | Total | | Within 1
Year | | 2 - 3
Years | | 4 - 5
Years | | After 5
Years |
Unfunded loan commitments | | $ | 312,427 | | $ | 171,664 | | $ | 64,087 | | $ | 17,013 | | $ | 59,663 |
Standby letters of credit | | | 10,541 | | | 6,804 | | | 3,737 | | | — | | | — |
| | | | | | | | | | | | | | | |
Total | | $ | 322,968 | | $ | 178,468 | | $ | 67,824 | | $ | 17,013 | | $ | 59,663 |
| | | | | | | | | | | | | | | |
The Corporation becomes party to financial instruments in the normal course of business to meet the financing needs of its customers. These financial instruments include commitments to extend credit and standby letters of credit and create off-balance sheet risk.
Commitments to extend credit are agreements to lend to a customer as long as there is no violation of any condition established in the loan agreement.
Standby letters of credit are conditional commitments issued by the Bank to a customer for a third party. Such standby letters of credit are issued to support private borrowing arrangements. The credit risk involved in issuing standby letters of credit is similar to that involved in granting loan facilities to customers.
Estimated fair values of the Corporation’s off-balance sheet instruments are based on fees and rates currently charged to enter into similar loan agreements, taking into account the remaining terms of the agreements and the counterparties’ credit standing. Collateral requirements for off-balance sheet items are generally based upon the same standards and policies as booked loans. Since fees and rates charged for off-balance sheet items are at market levels when set, there is no material difference between the stated amount and the estimated fair value of off-balance sheet instruments.
CONTRACTUAL CASH OBLIGATIONSOFTHE CORPORATIONASOF DECEMBER 31, 2007
| | | | | | | | | | | | | | | |
| (dollars in thousands) | | Total | | Within 1
Year | | 2 - 3
Years | | 4 - 5
Years | | After 5
Years |
Deposits without a stated maturity | | $ | 516,246 | | $ | 516,246 | | $ | — | | $ | — | | $ | — |
Wholesale and retail certificates of deposit | | | 333,282 | | | 314,202 | | | 13,688 | | | 5,275 | | | 117 |
Operating leases | | | 21,019 | | | 893 | | | 1,817 | | | 1,782 | | | 16,527 |
Purchase obligations | | | 4,261 | | | 1,888 | | | 2,106 | | | 267 | | | — |
Non-discretionary pension contributions | | | 137 | | | 137 | | | — | | | — | | | — |
| | | | | | | | | | | | | | | |
Total | | $ | 874,945 | | $ | 833,366 | | $ | 17,611 | | $ | 7,324 | | $ | 16,644 |
| | | | | | | | | | | | | | | |
OTHER INFORMATION
Branch Offices
In January of 2007, the Corporation opened a new branch in a prime location in Ardmore, PA. Customer’s accounts were transferred to the Ardmore branch from the Wynnewood branch as the Wynnewood, PA branch was closed. The Wynnewood branch real estate was sold during the first quarter of 2007. The opening of the Corporation’s planned West Chester, PA regional office location has been delayed due to difficulties experienced by the developer and is not expected to happen until late in 2008.
Regulatory Matters and Pending Legislation
Management is not aware of any other current specific recommendations by regulatory authorities or proposed legislation which, if implemented, would have a material adverse effect upon the liquidity, capital resources, or results of operations, however the general cost of compliance with numerous and multiple federal and state laws and regulations does have, and in the future may have, an impact on the Corporation’s results of operations.
In February 2006, Congress passed the Federal Deposit Insurance Reform Act of 2005 (FDIRA-2005”). This legislation will (i) merge the Bank Insurance Fund and the Savings Association Insurance Fund into one fund;
(ii) increase insurance coverage for retirement accounts to $250,000; (iii) adjust the maximum deposit insurance for inflation after March 31, 2010; and (iv) give the FDIC greater flexibility in setting insurance assessments. As part of the FDIRA-2005, the Corporation’s primary operating subsidiary, the Bank, has been granted a one-time credit of approximately $409 thousand for utilization against future FDIC insurance premiums. The FDIC announced that 2007 assessments will range from 5 to 7 basis points for well capitalized institutions with composite regulatory examination ratings of one or two. The Corporation utilized approximately $365 thousand of these credits in 2007 against 2007 premium assessments and has approximately $45 thousand in credits remaining at December 31, 2007 to be utilized in 2008.
16
Effects of Inflation
Inflation has some impact on the Corporation’s operating costs. Unlike many industrial companies, however, substantially all of the Corporation’s assets and liabilities are monetary in nature. As a result, interest rates have a more significant impact on the Corporation’s performance than the general level of inflation. Over short periods of time, interest rates may not necessarily move in the same direction or in the same magnitude as prices of goods and services.
Effect of Government Monetary Policies
The earnings of the Corporation are and will be affected by domestic economic conditions and the monetary and fiscal policies of the United States government and its agencies. An important function of the Federal Reserve Board is to regulate the money supply and interest rates. Among the instruments used to implement those objectives are open market operations in United States government securities and changes in reserve requirements against member bank deposits. These instruments are used in varying combinations to influence overall growth and distribution of bank loans, investments, and deposits, and their use may also affect rates charged on loans or paid for deposits.
The Corporation is a member of the Federal Reserve System and, therefore, the policies and regulations of the Federal Reserve Board have a significant effect on its deposits, loans and investment growth, as well as the rate of interest earned and paid, and are expected to affect the Corporation’s operations in the future. The effect of such policies and regulations upon the future business and earnings of the Corporation cannot be predicted.
QUANTITATIVE AND QUALITATIVE DISCLOSURES ABOUT MARKET RISKS
The quantitative and qualitative disclosures about market risks are included in the Management’s Discussion and Analysis of Financial Condition and Results of Operations, in various sections detailed as follows:
“Net Interest Income” – Rate Volume Analysis, Net Interest Margin, Interest Rate Sensitivity, Summary Interest Rate Simulation, and Gap Report; “Provision for Loan and Lease Losses” – General Discussion of Loans and Lease Losses, Asset Quality and Analysis of Credit Risk, Non Performing Assets and Related Ratios, Allocation of Allowance for Loan and Lease Losses; “Non-interest Income; “Non-interest Expense”; “Income Taxes”; “Balance Sheet Analysis” – Asset Changes, Liability Changes, Investment Portfolio, Loan Portfolio: “Discussion of Segments” – Residential Mortgage Activity, Wealth Segment Activity, Banking Segment Activity; “Capital”; “Liquidity”; “Off Balance Sheet Risk”; “Contractual Cash Obligation of the Corporation as of December 31, 2007.”
SPECIAL CAUTIONARY NOTICE REGARDING FORWARD LOOKING STATEMENTS
Certain of the statements contained in this report and the documents incorporated by reference herein, may constitute forward-looking statements for the purposes of the Securities Act of 1933, as amended and the Securities Exchange Act of 1934, as amended, and may involve known and unknown risks, uncertainties and other factors which may cause actual results, performance or achievements of the Corporation to be materially different from future results, performance or achievements expressed or implied by such forward-looking statements. These forward-looking statements include statements with respect to the Corporation’s financial goals, business plans, business prospects, credit quality, credit risk, reserve adequacy, liquidity, origination and sale of residential mortgage loans, impairment of goodwill, the effect of changes in accounting standards, and market and pricing trends. The words “anticipate,” “believe”, “estimate”, “expect”, “intended,” “plan,” “may”, “seek” and similar expressions are intended to identify such forward-looking statements. The Corporation’s actual results may differ materially from the results anticipated by the forward-looking statement due to a variety of factors, including without limitation:
| | • | | the effect of future economic conditions on the Corporation and its customers, including economic factors which affect consumer confidence in the securities markets, wealth creation, investment and savings patterns, and the Corporation’s interest rate risk exposure and credit risk; |
| | • | | changes in the securities markets with respect to the market values of financial assets and the stability of particular securities markets; |
| | • | | changes in Federal, State and local tax laws, regulations and judicial decisions; |
| | • | | governmental monetary and fiscal policies, as well as legislation and regulatory changes; |
| | • | | changes in accounting requirements or interpretations; |
| | • | | the risks of changes in interest rates on the level and composition of deposits, loan demand, and the value of loan collateral and securities, as well as interest rate risk; |
| | • | | the effects of competition from other commercial banks, thrifts, mortgage companies, finance companies, credit unions, securities brokerage |
17
| | firms, insurance companies, money-market and mutual funds and other institutions operating in the Corporation’s trade market area and elsewhere including institutions operating locally, regionally, nationally and internationally together with such competitors offering banking products and services by mail, telephone, computer and the Internet; |
| | • | | any extraordinary event (such as the September 11, 2001 events, the war on terrorism and the U.S. Government’s response to those events including the war in Iraq); |
| | • | | the Corporation’s success in continuing to generate new business in its existing markets, as well as its success in identifying and penetrating targeted markets and generating a profit in those markets in a reasonable time; |
| | • | | the Corporation’s ability to continue to generate investment results for customers and the ability to continue to develop investment products in a manner that meets customer’s needs; |
| | • | | the Corporation’s success in and timely development of competitive new products and services in a changing environment and the acceptance of such products and services by customers; |
| | • | | the Corporation’s ability to originate, sell and service residential mortgage loans; |
| | • | | the accuracy of assumptions underlying the establishment of reserves for loan losses and estimates in the value of collateral, the market value of mortgage servicing rights and various financial assets and liabilities; |
| | • | | technological changes being more difficult or expensive than anticipated; |
| | • | | the Corporation’s success in managing the risks involved in the foregoing. |
All written or oral forward-looking statements attributed to the corporation are expressly qualified in their entirety by use of the foregoing cautionary statements. All forward-looking statements included in this report are based upon information presently available, and the corporation assumes no obligation to update any forward-looking statement.
18
Management’s Report on Internal Control over Financial Reporting
Corporation Management is responsible for both establishing and maintaining adequate internal controls over financial reporting. As of December 31, 2007, Management conducted an assessment of the effectiveness of the Corporation’s internal controls over financial reporting and concluded that such internal controls are effective and found no material weaknesses. The assessment was accomplished using the criteria set forth by the Committee of Sponsoring Organizations of the Treadway Commission (“COSO”) in Internal Control-Integrated Framework. Management has concluded that, as of December 31, 2007, the Corporation’s internal control over financial reporting is effective, based on the COSO criteria.
Management’s assessment of the effectiveness of the Corporation’s internal control over financial reporting as of December 31, 2007 has been audited by KPMG LLP, (“KPMG”) the Corporation’s independent registered public accounting firm having responsibility for auditing the Corporation’s financial statements. KPMG has expressed an unqualified opinion on the effectiveness of the Corporation’s internal control over financial reporting as of December 31, 2007.
19
Report of Independent Registered Public Accounting Firm
The Board of Directors and Shareholders
Bryn Mawr Bank Corporation:
We have audited the accompanying consolidated balance sheets of Bryn Mawr Bank Corporation and subsidiaries (the Corporation) as of December 31, 2007 and 2006, and the related consolidated statements of income, cash flows, changes in shareholders’ equity, and comprehensive income for each of the years in the three-year period ended December 31, 2007. These consolidated financial statements are the responsibility of the Corporation’s management. Our responsibility is to express an opinion on these consolidated financial statements based on our audits.
We conducted our audits in accordance with the standards of the Public Company Accounting Oversight Board (United States). Those standards require that we plan and perform the audit to obtain reasonable assurance about whether the financial statements are free of material misstatement. An audit includes examining, on a test basis, evidence supporting the amounts and disclosures in the financial statements. An audit also includes assessing the accounting principles used and significant estimates made by management, as well as evaluating the overall financial statement presentation. We believe that our audits provide a reasonable basis for our opinion.
In our opinion, the consolidated financial statements referred to above present fairly, in all material respects, the financial position of the Corporation as of December 31, 2007 and 2006, and the results of their operations and their cash flows for each of the years in the three-year period ended December 31, 2007, in conformity with U.S. generally accepted accounting principles.
We also have audited, in accordance with the standards of the Public Company Accounting Oversight Board (United States), the Corporation’s internal control over financial reporting as of December 31, 2007, based on criteria established in Internal Control—Integrated Frameworkissued by the Committee of Sponsoring Organizations of the Treadway Commission (COSO), and our report dated March 10, 2008 expressed an unqualified opinion on the effectiveness of the Corporation’s internal control over financial reporting.
As discussed in note 1 to the consolidated financial statements, the Corporation adopted Statement of Financial Accounting Standards No. 123R, “Share Based Payment,” effective January 1, 2006, Statement of Financial Accounting Standards No. 158, “Employers’ Accounting for Defined Benefit Pension and Other Postretirement Plans,” effective December 31, 2006, and Staff Accounting Bulletin No. 108, “Considering the Effects of Prior Year Misstatements when Quantifying Misstatements in Current Year Financial Statements,” in 2006.
|
 |
| Philadelphia, Pennsylvania |
| March 10, 2008 |
20
Report of Independent Registered Public Accounting Firm
The Board of Directors and Shareholders
Bryn Mawr Bank Corporation:
We have audited the internal control over financial reporting of Bryn Mawr Bank Corporation and subsidiaries (the Corporation) as of December 31, 2007, based on criteria established inInternal Control - Integrated Framework issued by the Committee of Sponsoring Organizations of the Treadway Commission (COSO). The Corporation’s management is responsible for maintaining effective internal control over financial reporting and for its assessment of the effectiveness of internal control over financial reporting, included in the accompanyingManagement’s Report on Internal Control Over Financial Reporting. Our responsibility is to express an opinion on the Corporation’s internal control over financial reporting based on our audit.
We conducted our audit in accordance with the standards of the Public Company Accounting Oversight Board (United States). Those standards require that we plan and perform the audit to obtain reasonable assurance about whether effective internal control over financial reporting was maintained in all material respects. Our audit included obtaining an understanding of internal control over financial reporting, assessing the risk that a material weakness exists, and testing and evaluating the design and operating effectiveness of internal control based on the assessed risk. Our audit also included performing such other procedures as we considered necessary in the circumstances. We believe that our audit provides a reasonable basis for our opinion.
A company’s internal control over financial reporting is a process designed to provide reasonable assurance regarding the reliability of financial reporting and the preparation of financial statements for external purposes in accordance with generally accepted accounting principles. A company’s internal control over financial reporting includes those policies and procedures that (1) pertain to the maintenance of records that, in reasonable detail, accurately and fairly reflect the transactions and dispositions of the assets of the company; (2) provide reasonable assurance that transactions are recorded as necessary to permit preparation of financial statements in accordance with generally accepted accounting principles, and that receipts and expenditures of the company are being made only in accordance with authorizations of management and directors of the company; and (3) provide reasonable assurance regarding prevention or timely detection of unauthorized acquisition, use, or disposition of the company’s assets that could have a material effect on the financial statements.
Because of its inherent limitations, internal control over financial reporting may not prevent or detect misstatements. Also, projections of any evaluation of effectiveness to future periods are subject to the risk that controls may become inadequate because of changes in conditions, or that the degree of compliance with the policies or procedures may deteriorate.
In our opinion, the Corporation maintained, in all material respects, effective internal control over financial reporting as of December 31, 2007, based on criteria established inInternal Control - Integrated Framework issued by the Committee of Sponsoring Organizations of the Treadway Commission.
We also have audited, in accordance with the standards of the Public Company Accounting Oversight Board (United States), the consolidated balance sheets of the Corporation as of December 31, 2007 and 2006, and the related consolidated statements of income, cash flows, changes in shareholders’ equity, and comprehensive income, for each of the years in the three-year period ended December 31, 2007, and our report dated March 10, 2008 expressed an unqualified opinion on those consolidated financial statements.
|
|
| Philadelphia, Pennsylvania |
| March 10, 2008 |
21
Consolidated Balance Sheets
| | | | | | | | |
| | | As of December 31, | |
| | 2007 | | | 2006 | |
| | (dollars in thousands,
except share and per share data) | |
Assets | | | | | | | | |
Cash and due from banks | | $ | 76,965 | | | $ | 61,473 | |
Interest bearing deposits with banks | | | 1,209 | | | | 532 | |
Federal funds sold | | | 17,000 | | | | — | |
| | | | | | | | |
Total cash and cash equivalents | | | 95,174 | | | | 62,005 | |
Investment securities available for sale, at fair value (amortized cost of $48,236 and $48,632 as of December 31, 2007 and 2006, respectively) | | | 48,402 | | | | 48,232 | |
Loans held for sale | | | 5,125 | | | | 3,726 | |
Portfolio loans and leases | | | 802,925 | | | | 681,291 | |
Less: Allowance for loan and lease losses | | | (8,124 | ) | | | (8,122 | ) |
| | | | | | | | |
Net portfolio loans and leases | | | 794,801 | | | | 673,169 | |
| | | | | | | | |
Premises and equipment, net | | | 16,952 | | | | 16,571 | |
Accrued interest receivable | | | 4,316 | | | | 4,232 | |
Deferred income taxes | | | 2,891 | | | | 2,946 | |
Mortgage servicing rights | | | 2,820 | | | | 2,883 | |
Bank owned life insurance (BOLI) | | | 15,424 | | | | — | |
Other assets | | | 16,191 | | | | 13,053 | |
| | | | | | | | |
Total assets | | $ | 1,002,096 | | | $ | 826,817 | |
| | | | | | | | |
Liabilities | | | | | | | | |
Deposits: | | | | | | | | |
Non-interest-bearing demand | | $ | 228,269 | | | $ | 198,546 | |
Savings, NOW and market rate accounts | | | 287,977 | | | | 295,521 | |
Time deposits | | | 203,462 | | | | 200,446 | |
Wholesale deposits | | | 129,820 | | | | 19,976 | |
| | | | | | | | |
Total deposits | | | 849,528 | | | | 714,489 | |
| | | | | | | | |
Borrowed funds | | | 45,000 | | | | 15,000 | |
Accrued interest payable | | | 6,294 | | | | 4,346 | |
Other liabilities | | | 10,923 | | | | 10,890 | |
| | | | | | | | |
Total liabilities | | | 911,745 | | | | 744,725 | |
| | | | | | | | |
Shareholders’ equity | | | | | | | | |
Common stock, par value $1; authorized 100,000,000 and 25,000,000 shares as of December 31, 2007 and 2006, respectively, and issued 11,434,332 and 11,373,182 shares as of December 31, 2007 and 2006, respectively, and outstanding of 8,526,084 and 8,562,209 shares as of December 31, 2007 and 2006, respectively | | | 11,434 | | | | 11,373 | |
Paid-in capital in excess of par value | | | 11,698 | | | | 10,598 | |
Accumulated other comprehensive loss, net of tax benefit | | | (4,304 | ) | | | (4,450 | ) |
Retained earnings | | | 101,146 | | | | 91,815 | |
Less: Common stock in treasury at cost – 2,908,248, and 2,810,973 shares as of December 31, 2007 and 2006, respectively | | | (29,623 | ) | | | (27,244 | ) |
| | | | | | | | |
Total shareholders’ equity | | | 90,351 | | | | 82,092 | |
| | | | | | | | |
Total liabilities and shareholders’ equity | | $ | 1,002,096 | | | $ | 826,817 | |
| | | | | | | | |
Book value per share | | $ | 10.60 | | | $ | 9.59 | |
| | | | | | | | |
The accompanying notes are an integral part of the consolidated financial statements.
22
Consolidated Statements of Income
| | | | | | | | | |
| | | For the Years Ended December 31, |
| | 2007 | | 2006 | | 2005 |
| | (dollars in thousands, except per share data) |
Interest income: | | | | | | | | | |
Interest and fees on loans | | $ | 48,797 | | $ | 43,683 | | $ | 36,499 |
Interest and fees on leases | | | 2,988 | | | 92 | | | — |
Interest on federal funds sold | | | 174 | | | 146 | | | 210 |
Interest on deposits with other banks | | | 76 | | | 30 | | | 76 |
Interest on investment securities | | | 2,183 | | | 1,955 | | | 1,123 |
| | | | | | | | | |
Total interest income | | | 54,218 | | | 45,906 | | | 37,908 |
| | | | | | | | | |
Interest expense: | | | | | | | | | |
Interest expense on savings, NOW and market rate accounts | | | 4,169 | | | 3,850 | | | 2,744 |
Interest expense on time deposits | | | 8,662 | | | 7,136 | | | 3,799 |
Interest expense on wholesale deposits | | | 4,925 | | | 579 | | | — |
Interest expense on other borrowings | | | 2,220 | | | 1,042 | | | 57 |
| | | | | | | | | |
Total interest expense | | | 19,976 | | | 12,607 | | | 6,600 |
| | | | | | | | | |
Net interest income | | | 34,242 | | | 33,299 | | | 31,308 |
Provision for loan and lease losses | | | 891 | | | 832 | | | 762 |
| | | | | | | | | |
Net interest income after provision for loan and lease losses | | | 33,351 | | | 32,467 | | | 30,546 |
| | | | | | | | | |
Non-interest income: | | | | | | | | | |
Fees for Wealth management services | | | 13,502 | | | 12,422 | | | 11,539 |
Service charges on deposit accounts | | | 1,464 | | | 1,540 | | | 1,593 |
Loan servicing and other fees | | | 1,115 | | | 1,126 | | | 1,303 |
Net gain on sale of loans | | | 1,250 | | | 954 | | | 1,622 |
Net gain on sale of real estate | | | 1,333 | | | — | | | — |
BOLI income | | | 424 | | | — | | | — |
Other operating income | | | 2,693 | | | 2,319 | | | 2,248 |
| | | | | | | | | |
Total non-interest income | | | 21,781 | | | 18,361 | | | 18,305 |
| | | | | | | | | |
Non-interest expenses: | | | | | | | | | |
Salaries and wages | | | 17,116 | | | 15,754 | | | 15,862 |
Employee benefits | | | 4,548 | | | 4,287 | | | 4,075 |
Occupancy and bank premises | | | 2,862 | | | 2,534 | | | 2,272 |
Furniture, fixtures, and equipment | | | 2,078 | | | 1,925 | | | 1,941 |
Advertising | | | 1,026 | | | 898 | | | 960 |
Professional fees | | | 1,585 | | | 1,016 | | | 1,292 |
Amortization of mortgage service rights | | | 348 | | | 348 | | | 606 |
Other operating expense | | | 5,396 | | | 4,661 | | | 4,565 |
| | | | | | | | | |
Total non-interest expenses | | | 34,959 | | | 31,423 | | | 31,573 |
| | | | | | | | | |
Income before income taxes | | | 20,173 | | | 19,405 | | | 17,278 |
Income tax expense | | | 6,573 | | | 6,689 | | | 5,928 |
| | | | | | | | | |
Net income | | $ | 13,600 | | $ | 12,716 | | $ | 11,350 |
| | | | | | | | | |
Basic earnings per common share | | $ | 1.59 | | $ | 1.48 | | $ | 1.33 |
Diluted earnings per common share | | $ | 1.58 | | $ | 1.46 | | $ | 1.31 |
Dividends per share | | $ | 0.50 | | $ | 0.46 | | $ | 0.42 |
Weighted-average basic shares outstanding | | | 8,539,904 | | | 8,578,050 | | | 8,563,027 |
Dilutive potential common shares | | | 93,638 | | | 113,579 | | | 101,200 |
| | | | | | | | | |
Weighted-average dilutive shares | | | 8,633,542 | | | 8,691,629 | | | 8,664,227 |
| | | | | | | | | |
The accompanying notes are an integral part of the consolidated financial statements.
23
Consolidated Statements of Cash Flows
| | | | | | | | | | | | |
| | | For the Years Ended December 31, | |
| | 2007 | | | 2006 | | | 2005 | |
| | (dollars in thousands) | |
Operating activities: | | | | | | | | | | | | |
Net Income | | $ | 13,600 | | | $ | 12,716 | | | $ | 11,350 | |
Adjustments to reconcile net income to net cash provided by operating activities: | | | | | | | | | | | | |
Provision for loan and lease losses | | | 891 | | | | 832 | | | | 762 | |
Provision for depreciation and amortization | | | 1,596 | | | | 1,455 | | | | 1,516 | |
Loans originated for resale | | | (90,164 | ) | | | (68,209 | ) | | | (137,485 | ) |
Proceeds from sale of loans | | | 90,015 | | | | 68,202 | | | | 132,653 | |
Net gain on sale of loans | | | (1,250 | ) | | | (954 | ) | | | (1,622 | ) |
Net gain on sale of real estate | | | (1,333 | ) | | | — | | | | — | |
Provision for deferred income taxes (benefit) | | | 82 | | | | (496 | ) | | | (521 | ) |
Change in income taxes payable/receivable | | | 707 | | | | 1,228 | | | | (354 | ) |
Change in accrued interest receivable | | | (84 | ) | | | (967 | ) | | | (686 | ) |
Change in accrued interest payable | | | 1,948 | | | | 2,203 | | | | (735 | ) |
Change in mortgage servicing rights | | | 63 | | | | 99 | | | | 190 | |
Other, net | | | (4,637 | ) | | | (4,802 | ) | | | 4,431 | |
| | | | | | | | | | | | |
Net cash provided by operating activities | | | 11,434 | | | | 11,307 | | | | 9,499 | |
| | | | | | | | | | | | |
Investing activities: | | | | | | | | | | | | |
Purchases of investment securities | | | (17,133 | ) | | | (28,229 | ) | | | (9,004 | ) |
Proceeds from maturities of investment securities and mortgage-backed securities pay downs | | | 8,775 | | | | 7,181 | | | | 3,500 | |
Proceeds from sales of investment securities available for sale | | | — | | | | — | | | | 1,586 | |
Proceeds from calls of investment securities | | | 8,595 | | | | 5,940 | | | | 4,000 | |
Proceeds from sale of real estate | | | 1,850 | | | | — | | | | — | |
Purchases of bank owned life insurance | | | (15,000 | ) | | | — | | | | — | |
Net repayments of notes receivable | | | — | | | | 954 | | | | 387 | |
Net originations of portfolio loans and leases | | | (122,524 | ) | | | (87,192 | ) | | | (27,553 | ) |
Sale of other real estate owned (“OREO”) | | | 110 | | | | 25 | | | | 377 | |
OREO loss | | | — | | | | — | | | | (20 | ) |
Net change in premises and equipment | | | (2,388 | ) | | | (3,303 | ) | | | (1,859 | ) |
| | | | | | | | | | | | |
Net cash used by investing activities | | | (137,715 | ) | | | (104,624 | ) | | | (28,586 | ) |
| | | | | | | | | | | | |
Financing activities: | | | | | | | | | | | | |
Change in demand, NOW, savings and market rate deposit accounts | | | 22,179 | | | | 13,130 | | | | (9,558 | ) |
Change in time deposits | | | 3,016 | | | | 50,124 | | | | 39,852 | |
Change in wholesale deposits | | | 109,844 | | | | 14,976 | | | | 5,000 | |
Increase in borrowed funds greater than 90 days | | | 45,000 | | | | 15,000 | | | | — | |
Repayment of borrowed funds greater than 90 days | | | (15,000 | ) | | | — | | | | — | |
Dividends paid | | | (4,269 | ) | | | (3,948 | ) | | | (3,599 | ) |
Proceeds from exercise of stock options | | | 918 | | | | 2,511 | | | | 643 | |
Tax benefit from exercise of stock options | | | 182 | | | | 293 | | | | 139 | |
Purchase of treasury stock | | | (2,420 | ) | | | (3,406 | ) | | | (1,990 | ) |
| | | | | | | | | | | | |
Net cash provided by financing activities | | | 159,450 | | | | 88,680 | | | | 30,487 | |
| | | | | | | | | | | | |
Change in cash and cash equivalents | | | 33,169 | | | | (4,637 | ) | | | 11,400 | |
Cash and cash equivalents at beginning of year | | | 62,005 | | | | 66,642 | | | | 55,242 | |
| | | | | | | | | | | | |
Cash and cash equivalents at end of year | | $ | 95,174 | | | $ | 62,005 | | | $ | 66,642 | |
| | | | | | | | | | | | |
Supplemental cash flow information: | | | | | | | | | | | | |
Cash paid during the year for: | | | | | | | | | | | | |
Income taxes | | $ | 6,192 | | | $ | 7,289 | | | $ | 4,646 | |
Interest | | | 18,028 | | | | 10,404 | | | | 7,335 | |
The accompanying notes are an integral part of the consolidated financial statements.
24
Consolidated Statements of Changes in Shareholders’ Equity
| | | | | | | | | | | | | | | | | | | | | | | | | | | |
| | | For the Years Ended December 31,
2007, 2006 and 2005 | |
| | Shares of
Common
Stock Issued | | | Common
Stock | | | Paid-in
Capital | | | Retained
Earnings | | | Accumulated
Other
Comprehensive
Income
(Loss) | | | Treasury
Stock | | | Total
Shareholder’s
Equity | |
| | (dollars in thousands) | |
Balance - December 31, 2004, as previously presented | | 11,172,582 | | | $ | 11,172 | | | $ | 7,112 | | | $ | 75,179 | | | $ | (288 | ) | | $ | (21,937 | ) | | $ | 71,238 | |
Correction of immaterial error | | — | | | | — | | | | — | | | | (291 | ) | | | — | | | | — | | | | (291 | ) |
Net income | | — | | | | — | | | | — | | | | 11,350 | | | | — | | | | — | | | | 11,350 | |
Dividends declared - $0.42 per share | | — | | | | — | | | | — | | | | (3,599 | ) | | | — | | | | — | | | | (3,599 | ) |
Other comprehensive loss, net of tax benefit of $191 | | — | | | | — | | | | — | | | | — | | | | (355 | ) | | | — | | | | (355 | ) |
Tax benefit stock option exercise | | — | | | | — | | | | 139 | | | | — | | | | — | | | | — | | | | 139 | |
Purchase of treasury stock | | — | | | | — | | | | — | | | | — | | | | — | | | | (1,990 | ) | | | (1,990 | ) |
Retirement of treasury stock | | (4,480 | ) | | | (4 | ) | | | (39 | ) | | | — | | | | — | | | | 43 | | | | — | |
Common stock issued | | 53,797 | | | | 54 | | | | 676 | | | | — | | | | — | | | | — | | | | 730 | |
| | | | | | | | | | | | | | | | | | | | | | | | | | | |
Balance - December 31, 2005, as adjusted | | 11,221,899 | | | $ | 11,222 | | | $ | 7,888 | | | $ | 82,639 | | | $ | (643 | ) | | $ | (23,884 | ) | | $ | 77,222 | |
Cumulative effect adjustment to initially apply SAB 108 | | — | | | | — | | | | — | | | | 408 | | | | — | | | | — | | | | 408 | |
Net Income | | — | | | | — | | | | — | | | | 12,716 | | | | — | | | | — | | | | 12,716 | |
Dividends declared - $0.46 per share | | — | | | | — | | | | — | | | | (3,948 | ) | | | | | | | — | | | | (3,948 | ) |
Other comprehensive income, net of tax expense of $227 | | — | | | | — | | | | — | | | | — | | | | 421 | | | | — | | | | 421 | |
Tax benefit stock option exercise | | — | | | | — | | | | 293 | | | | — | | | | — | | | | — | | | | 293 | |
Purchase of treasury stock | | — | | | | — | | | | — | | | | — | | | | — | | | | (3,406 | ) | | | (3,406 | ) |
Retirement of treasury stock | | (4,671 | ) | | | (5 | ) | | | (41 | ) | | | — | | | | — | | | | 46 | | | | — | |
Common stock issued | | 155,954 | | | | 156 | | | | 2,458 | | | | — | | | | — | | | | — | | | | 2,614 | |
Adjustment to initially apply FAS 158, net of tax benefit | | — | | | | — | | | | — | | | | — | | | | (4,228 | ) | | | — | | | | (4,228 | ) |
| | | | | | | | | | | | | | | | | | | | | | | | | | | |
Balance - December 31, 2006, as adjusted | | 11,373,182 | | | $ | 11,373 | | | $ | 10,598 | | | $ | 91,815 | | | $ | (4,450 | ) | | $ | (27,244 | ) | | $ | 82,092 | |
Net Income | | — | | | | — | | | | — | | | | 13,600 | | | | — | | | | — | | | | 13,600 | |
Dividends declared - $0.50 per share | | — | | | | — | | | | — | | | | (4,269 | ) | | | — | | | | — | | | | (4,269 | ) |
Other comprehensive income, net of tax expense of $77 | | — | | | | — | | | | — | | | | — | | | | 146 | | | | — | | | | 146 | |
Tax benefit stock option exercise | | — | | | | — | | | | 182 | | | | — | | | | — | | | | — | | | | 182 | |
Purchase of treasury stock | | — | | | | — | | | | — | | | | — | | | | — | | | | (2,420 | ) | | | (2,420 | ) |
Retirement of treasury stock | | (4,128 | ) | | | (4 | ) | | | (37 | ) | | | — | | | | — | | | | 41 | | | | — | |
Common stock issued | | 65,278 | | | | 65 | | | | 955 | | | | — | | | | — | | | | — | | | | 1,020 | |
Balance - December 31, 2007 | | 11,434,332 | | | $ | 11,434 | | | $ | 11,698 | | | $ | 101,146 | | | $ | (4,304 | ) | | $ | (29,623 | ) | | $ | 90,351 | |
| | | | | | | | | | | | | | | | | | | | | | | | | | | |
Consolidated Statements of Comprehensive Income
| | | | | | | | | | | |
| | | For the Years Ended December 31, | |
| | 2007 | | | 2006 | | 2005 | |
| | (dollars in thousands) | |
Net income | | $ | 13,600 | | | $ | 12,716 | | $ | 11,350 | |
Other comprehensive income: | | | | | | | | | | | |
Unrealized investment gains (losses), net of tax expense (benefit) of $198, $76 and ($141), respectively | | | 370 | | | | 140 | | | (263 | ) |
Change in unfunded pension liability, net of tax expense (benefit) of $(121), $151 and ($50), respectively | | | (224 | ) | | | 281 | | | (92 | ) |
| | | | | | | | | | | |
Comprehensive income | | $ | 13,746 | | | $ | 13,137 | | $ | 10,995 | |
| | | | | | | | | | | |
The accompanying notes are an integral part of the consolidated financial statements.
25
Notes to Consolidated Financial Statements
1. SUMMARYOF SIGNIFICANT ACCOUNTING POLICIES
A. Nature of Business
The Bryn Mawr Trust Company (the “Bank”) received its Pennsylvania banking charter in 1889 and is a member of the Federal Reserve System. In 1986, Bryn Mawr Bank Corporation (the “Corporation”) was formed and on January 2, 1987, the Bank became a wholly-owned subsidiary of the Corporation. The Bank and Corporation are headquartered in Bryn Mawr, PA, a western suburb of Philadelphia, PA. The Corporation and its subsidiaries provide wealth management, community banking, residential mortgage lending, insurance and business banking services to its customers through eight full service branches and seven retirement community offices throughout Montgomery, Delaware and Chester counties. The Corporation trades on the NASDAQ Global Market (“NASD”) under the symbol BMTC.
The Corporation operates in a highly competitive market area that includes local, national and regional banks as competitors along with savings banks, credit unions, insurance companies, trust companies, registered investment advisors and mutual fund families. The Corporation and its subsidiaries are regulated by many regulatory agencies including the Securities and Exchange Commission (“SEC”), NASD, Federal Deposit Insurance Corporation (“FDIC”), the Federal Reserve and the Pennsylvania Department of Banking.
B. Basis of Presentation
The accounting policies of the Corporation conform with accounting principles generally accepted in the United States of America (“GAAP”) and predominate practice within the banking industry. Statements of the Financial Accounting Standards Board are noted in these statements by the abbreviation “FAS”.
The Consolidated Financial Statements include the accounts of the Corporation and its wholly owned subsidiaries. The Corporation’s consolidated financial condition and results of operations consist almost entirely of the Bank’s financial condition and results of operations. All material inter-company transactions and balances have been eliminated.
In preparing the Financial Statements, management is required to make estimates and assumptions that affect the reported amounts of assets and liabilities, the disclosure of contingent assets and liabilities at the date of the balance sheets, and the reported amounts of revenues and expenses during the reporting period. Actual results could differ from these estimates.
C. Cash and Cash Equivalents
Cash and cash equivalents include cash and due from banks, federal funds sold, and interest-bearing deposits with other banks with original maturities of three months or less. Cash balances required to meet regulatory reserve requirements of the Federal Reserve Board amounted to $2.0 million and $2.1 million at December 31, 2007 and 2006, respectively.
D. Investment Securities
Investment securities which are held for indefinite periods of time, which management intends to use as part of its asset/liability strategy, or which may be sold in response to changes in interest rates, changes in prepayment risk, increases in capital requirements, or other similar factors, are classified as available for sale and are carried at fair value. Net unrealized gains and losses for such securities, net of tax, are required to be recognized as a separate component of shareholders’ equity and excluded from determination of net income. Gains or losses on disposition are based on the net proceeds and cost of the securities sold, adjusted for amortization of premiums and accretion of discounts, using the specific identification method.
E. Loans Held for Sale
Mortgage loans originated and intended for sale in the secondary market are carried at the lower of cost or estimated fair value in the aggregate. Net unrealized losses, if any, are recognized through a valuation allowance by charges to income.
F. Portfolio Loans and Leases
The Corporation grants construction, commercial, residential mortgage and consumer loans to customers primarily in Southeastern Pennsylvania and small ticket equipment leasing to customers nationwide. Although the Corporation has a diversified loan and lease portfolio, its debtors’ ability to honor their contracts is substantially dependent upon the real estate and general economic conditions of the region.
Loans and leases that the Corporation has the intent and ability to hold for the foreseeable future or until maturity or pay-off, generally are reported at their outstanding principal balance adjusted for charge-offs, the allowance for loan and lease losses and any deferred fees or costs on originated loans and leases. Interest income is accrued on the unpaid principal balance.
Loan and lease origination fees and loan and lease origination costs are deferred and recognized as an adjustment of the related yield using the interest method.
26
The accrual of interest on loans and leases is generally discontinued at the time the loan is 90 days delinquent unless the credit is well secured and in the process of collection. Loans and leases are placed on non-accrual status or charged-off at an earlier date if collection of principal or interest is considered doubtful. All interest accrued, but not collected for loans that are placed on non-accrual status or charged-off is reversed against interest income. All interest accrued, but not collected on leases that are placed on non-accrual status is not reversed against interest until the lease is charged-off at 120 days. The interest received on these non-accrual loans and leases is applied to reduce the carrying value of loans and leases or, if principal is considered fully collectible, recognized as interest income until qualifying for return to accrual status. Loans and leases are returned to accrual status when all the principal and interest amounts contractually due are brought current and future payments are reasonably assured.
G. Allowance for Loan and Lease Losses
The allowance for loan and lease losses (“allowance”) is established through a provision for loan and lease losses (“provision”) charged as an expense. Loans and leases are charged against the allowance when Management believes that the principal is uncollectible. The allowance is maintained at a level that Management believes is sufficient to absorb estimated probable credit losses.
Management’s determination of the adequacy of the allowance is based on periodic evaluations of the loan and lease portfolio and other relevant factors. However, this evaluation is inherently subjective as it requires significant estimates by Management. Consideration is given to a variety of factors in establishing these estimates including specific terms and conditions of loans and leases, underwriting standards, delinquency statistics, industry concentration, overall exposure to a single customer, adequacy of collateral, the dependence on collateral, and results of internal loan review, including borrowers perceived financial and management strengths, the amounts and timing of the present value of future cash flows, and access to additional funds.
The evaluation process also considers the impact of competition, current and expected economic conditions, national and international events, the regulatory and legislative environment and inherent risks in the loan and lease portfolio. All of these factors may be susceptible to significant change. To the extent actual outcomes differ from Management estimates, an additional provision for loan losses may be required that might adversely affect the Corporation’s results of operations in future periods. In addition, various regulatory agencies, as an integral part of their examination process, periodically review the allowance. Such agencies may require the Corporation to recognize additions to the allowance based on their judgment of information available to them at the time of their examination.
During 2007, the Corporation made refinements along with changes to estimates of loss in certain asset classes. These changes in estimates resulted in a lower pre-tax provision for loan and lease losses in 2007 than would have resulted under the previous loss estimates of approximately $1.2 million which equates to $0.09 per diluted share (after tax).
H. Impaired Loans and Leases
A loan or lease is considered impaired when, based on current information and events, it is probable that the Corporation will be unable to collect the scheduled payments of principal or interest when due according to the contractual terms of the loan agreement. Management’s assessment of impairment is applied to the factors considered in determining impairment. Factors include payment status, collateral value, and the probability of collecting scheduled principal and interest payments when due. Loans and leases that experience insignificant payment delays and payment shortfalls generally are not classified as impaired.
Management determines the significance of payment delays and payment shortfalls on a case-by-case basis, taking into consideration all of the circumstances surrounding the loan and the borrower, including the length of the delay, the reasons for the delay, the borrower’s prior payment record, and the amount of the shortfall in relation to the principal and interest owed.
Impairment is measured on a loan-by-loan basis by either the present value of expected future cash flows discounted at the loan’s effective interest rate, the loan’s obtainable market price, or the fair value of the collateral if the loan is collateral dependent. Residential, consumer and home equity loans are not specifically evaluated for impairment.
I. Other Real Estate Owned
Other real estate owned (“OREO”) consists of assets that the Corporation has acquired through foreclosure, by accepting a deed in lieu of foreclosure, or by taking possession of assets that were used as loan collateral. The Corporation reports OREO as a component of “Other Assets” on the balance sheet at the lower of cost or estimated fair value less cost to sell, adjusted periodically based on current appraisals.
J. Premises and Equipment
Premises and equipment are stated at cost less accumulated depreciation. Depreciation and rent are recorded using the straight-line method over the estimated useful lives of the assets. Leasehold improvements are amortized over the expected lease term or the estimated useful lives, whichever is shorter.
K. Pension and Postretirement Benefit Plans
The Corporation has two defined benefit pension plans and one postretirement benefit plan as discussed in Note 11 – Pension and Postretirement Benefit Plans. Net pension expense consists of service cost, interest cost, return on plan
27
assets, amortization of prior service cost, amortization of transition obligations and amortization of net actuarial gains and losses. The Corporation accrues pension costs as incurred.
The Corporation adopted FAS No. 158 – “Employers’ Accounting for Defined Benefit Plans and Other Post Retirement Plans” (“FAS 158”) on December 31, 2006. As a result of this adoption, the Corporation recorded an additional pension liability resulting in a reduction of accumulated other comprehensive income in 2006.
See Note 24 - Subsequent Event Pension and 401(K) Plans.
L. BOLI
The Bank purchased $15.0 million of BOLI during the second quarter of 2007. The Bank is the owner and beneficiary of the contracts and will use the proceeds from the BOLI contract to help offset the costs of broad based employer benefit expenses.
BOLI is recorded at its cash surrender value on the balance sheet. Income from BOLI is tax exempt and included as a component of other non-interest income.
M. Accounting for Stock-Based Compensation
The Corporation adopted FAS No. 123R – “Share Based Payments – Amendment of FASB No. 123 and APB No. 25” (“FAS 123R”) effective January 1, 2006. FAS 123R establishes accounting for stock-based awards exchanged for employee services. Accordingly, stock based compensation cost is measured at the grant date, based on the fair value of the award and is recognized as an expense over the vesting period. The Corporation previously applied Accounting Principles Board (APB) Opinion No. 25, “Accounting for Stock Issued to Employees,” and related interpretations and provided the required pro forma disclosures of FAS No. 123, “Accounting for Stock-Based Compensation” (FAS 123).
Generally, the approach in FAS 123R to stock-based payment accounting is similar to FAS 123. However, FAS 123R requires all share-based payments, including grants of stock options, be recognized as compensation cost in the statement of income at their fair value. The fair value of stock option grants is determined using the Black-Scholes pricing model. The assumptions necessary for the calculation of the fair value are expected life of options, annual volatility of stock price, risk free interest rate and annual dividend yield. Pro forma disclosure for periods beginning after December 15, 2005 is not an alternative under FAS 123R.
The Corporation elected to adopt FAS 123R using the modified prospective application method in which compensation cost is recognized beginning with the effective date (a) based upon the requirements of FAS 123R for all share-based payments granted after the effective date, and (b) based on the requirements of FAS 123 for all awards granted prior to the effective date of FAS 123R that remain unvested on the effective date.
Stock-based compensation expense for 2007 and 2006 and proforma expense for 2005 are shown in the table below:
| | | | | | | | | | | | | | | | | | | | | | | | | | | | | | | | | | | | |
| (dollars in thousands) | | For the Years Ended December 31, | |
| | 2007 | | | 2006 | | | 2005 | |
| | Without
FAS 123R
Effect | | | FAS 123R
Effects | | | As
Reported | | | Without
FAS 123R
Effect | | | FAS 123R
Effects | | | As
Reported | | | As
Reported | | | FAS 123
Effects | | | Proforma | |
Income before taxes | | $ | 20,248 | | | $ | (75 | ) | | $ | 20,173 | | | $ | 19,464 | | | $ | (59 | ) | | $ | 19,405 | | | $ | 17,278 | | | $ | (2,135 | ) | | $ | 15,143 | |
Income taxes | | | (6,599 | ) | | | 26 | | | | (6,573 | ) | | | (6,710 | ) | | | 21 | | | | (6,689 | ) | | | (5,928 | ) | | | 747 | | | | (5,181 | ) |
| | | | | | | | | | | | | | | | | | | | | | | | | | | | | | | | | | | | |
Net income | | $ | 13,649 | | | $ | (49 | ) | | $ | 13,600 | | | $ | 12,754 | | | $ | (38 | ) | | $ | 12,716 | | | $ | 11,350 | | | $ | (1,388 | ) | | $ | 9,962 | |
| | | | | | | | | | | | | | | | | | | | | | | | | | | | | | | | | | | | |
Basic earnings per share | | $ | 1.60 | | | $ | (.01 | ) | | $ | 1.59 | | | $ | 1.48 | | | $ | .00 | | | $ | 1.48 | | | $ | 1.33 | | | $ | (.16 | ) | | $ | 1.17 | |
| | | | | | | | | | | | | | | | | | | | | | | | | | | | | | | | | | | | |
Diluted earnings per share | | $ | 1.58 | | | $ | .00 | | | $ | 1.58 | | | $ | 1.47 | | | $ | (.01 | ) | | $ | 1.46 | | | $ | 1.31 | | | $ | (.16 | ) | | $ | 1.15 | |
| | | | | | | | | | | | | | | | | | | | | | | | | | | | | | | | | | | | |
See Note 13, Stock Option Plan, and Note 14, Earnings Per Share, in these Consolidated Financial Statements for additional information regarding equity based compensation and earnings per share, respectively.
N. Earnings Per Common Share
Basic earnings per common share excludes dilution and is computed by dividing income available to common shareholders by the weighted-average common shares outstanding during this period. Diluted earnings per common share takes into account the potential dilution that could occur if stock options were exercised and converted into common stock. Proceeds assumed to have been received on such exercise are assumed to be used to purchase shares of the Corporation’s common stock at the average market price during the period, as required by the treasury stock method of accounting. The effects of stock options are excluded from the computation of diluted earnings per share in periods in which the effect would be antidilutive. All weighted average shares, actual shares and per share information in the financial statements have been adjusted retroactively for the effect of stock dividends and splits.
O. Income Taxes
Income taxes are accounted for under the asset and liability method. Deferred tax assets and liabilities are recognized for the future tax consequences attributable to differences between
28
the financial statement carrying amounts of existing assets and liabilities and their respective tax bases and operating loss and tax credit carry forwards. Deferred tax assets and liabilities are measured using enacted tax rates expected to apply to taxable income in the years in which those temporary differences are expected to be recovered or settled. The effect on deferred tax assets and liabilities of a change in tax rates is recognized in income in the period that includes the enactment date.
P. Revenue Recognition
With the exception of non-accrual loans and leases, the Corporation recognizes all sources of income on the accrual basis. Additional information relating to wealth management fee revenue recognition follows:
The Corporation earns wealth management fee revenue from a variety of sources including fees from trust administration and other related fiduciary services, custody, investment management and advisory services, employee benefit account and IRA administration, estate settlement, tax service fees, shareholder service fees and brokerage. The Corporation also earned fees in 2005, 2006 and 2007 for providing investment advisory services to the clients of another financial institution. For many of our revenue sources, amounts are not received in the same accounting period in which they are earned. However, each source of Wealth Management fees is recorded on the accrual method of accounting.
The most significant portion of the Corporation’s Wealth Management fees is derived from trust administration and other related services, custody, investment management and advisory services, and employee benefit account and IRA administration. These fees are generally billed in arrears, based on the market value of assets at the end of the previous billing period. A smaller number of customers are billed in a similar manner, but on a quarterly or annual basis.
The balance of the Corporation’s Wealth Management income includes: shareholder service fees, which are received monthly and quarterly in arrears, but accrued monthly based on the estimated market value of the Corporation’s position in the applicable mutual fund; (2) estate settlement fees and tax service fees, which are recorded when the related service is performed; and (3) brokerage fees on non-depository investment products, which are received one month in arrears based on settled transactions but are accrued in the month when the settlement occurs. Investment advisory fees from the other financial institution relates to a revenue source that ceased in 2007 when the unrelated entity was acquired by another financial institution.
Included in other assets on the statement of condition is a wealth management fee receivable that reflects the impact of fees earned but not yet collected. This receivable is reviewed quarterly for collectibility.
Q. Mortgage Servicing
The Corporation performs various servicing functions on loans owned by others. A fee, usually based on a percentage of the outstanding principal balance of the loan, is received for these services. Gain on sale of loans is based on the specific identification method.
Mortgage servicing rights (MSRs) are recognized as separate assets when rights are retained through the sale of financial assets. Capitalized servicing rights are reported in other assets and are amortized into non-interest income in proportion to, and over the period of, the estimated future net servicing income of the underlying financial assets.
Servicing assets are evaluated quarterly for impairment based upon the fair value of the rights as compared to amortized cost. Impairment is determined by stratifying rights by predominant characteristics, such as interest rate and terms. Fair value is determined based upon discounted cash flows using market-based assumptions. Impairment is recognized on the income statement to the extent the fair value is less than the capitalized amount for the stratum. A valuation allowance is utilized to record temporary impairment in MSRs. Temporary impairment is defined as impairment that is not deemed permanent. Permanent impairment is recorded as a reduction of the MSR and is not reversed.
R. Statement of Cash Flows
The Corporation’s statement of cash flows details operating, investing and financing activities during the reported periods.
S. Interest Rate Floor
The Corporation accounts for derivatives under FASB Statement No. 133 “Accounting for Derivative Instruments on Hedging Activities”, as amended. The Corporation records interest rate floors, which are not used as hedging instruments, at fair value on the balance sheet as part of other assets. Changes in the fair value of the interest rate floor are recorded in current earnings as other operating income or other operating expense, depending on whether the net change in value for the applicable period was a gain or loss.
T. Reclassifications
Certain prior year amounts have been reclassified to conform to the current year presentation.
U. New Accounting Pronouncements
Standards Adopted:
FAS 155
In February 2006, the FASB issued FAS No. 155 – “Accounting for Certain Hybrid Financial Instruments” (“FAS 155”). Among other things, this Statement permits fair value remeasurement for certain hybrid financial instruments and requires that entities evaluate whether beneficial interests contain embedded derivatives or are derivatives in their entirety.
29
This Statement became effective January 1, 2007 and did not have a material impact on the Corporation’s consolidated financial statements.
FAS 156
In March 2006, the FASB issued FAS No. 156, “Accounting for Servicing of Financial Assets” (“FAS 156”). FAS 156 requires an entity to recognize a servicing asset or servicing liability each time it undertakes an obligation to service a financial asset. FAS 156 also requires fair value measurement of a servicing asset or liability upon initial recognition and permits different methods to subsequently measure each class of separately recognized servicing assets and servicing liabilities. This Statement additionally permits under certain circumstances a one-time reclassification of available-for-sale securities to trading securities by entities with recognized servicing rights, without calling into question the treatment of other available-for-sale securities under FAS 115.
This Statement became effective January 1, 2007 and did not have a material impact on the Corporation’s consolidated financial statements.
Standards Not Yet Adopted:
FAS 157
In September 2006, the FASB issued FAS No. 157 – “Fair Value Measurements” (“FAS 157”). FAS 157 establishes a single authoritative definition of fair value, sets out a framework for measuring fair value, and requires additional disclosures about fair-value measurements. The Statement applies only to fair-value measurements that are already required or permitted by other accounting standards.
FAS 157 is effective for fair-value measures already required or permitted by other standards for financial statements issued for fiscal years beginning after November 15, 2007 and interim periods within those fiscal years. The Corporation did not early adopt FAS 157 and has determined this Statement will not have a material impact on the Corporation’s consolidated financial statements upon adoption.
FAS 159
In February 2007 the FASB issued FAS No. 159 – “The Fair Value Option for Financial Assets and Liabilities – Including an Amendment of FASB Statement No. 115” (“FAS 159”). FAS 159 permits entities to measure many financial instruments and certain other items at fair value. The objective is to improve financial reporting by providing entities with the opportunity to mitigate volatility in reported earnings without having to apply complex hedge accounting provisions.
FAS 159 is effective as of the beginning of an entity’s first fiscal year that begins after November 15, 2007. The Corporation did not early adopt FAS 159, and has determined this Statement will not have a material impact on the Corporation’s consolidated financial statements upon adoption.
FAS 160
In December 2007 the FASB issued FAS No. 160 – “Noncontrolling Interest in Consolidated Financial Statements – Including an Amendment of ARB No. 51” (“FAS 160”). FAS 160 improves the relevance, comparability, and transparency of the financial information that a reporting entity provides in its consolidated financial statements by establishing accounting and reporting standards for the noncontrolling interest in a subsidiary and for the denconsolidation of a subsidiary.
FAS 160 is effective as of the beginning of an entity’s first fiscal year that begins on or after December 15, 2008. Early adoption is prohibited. The Corporation has not yet determined whether this statement will have a material impact on the Corporation’s consolidated financial statements upon adoption.
FAS No. 141(revised)
In December 2007, FASB issued FAS No. 141 (revised 2007), “Business Combinations”. FAS No. 141 (revised) retains the fundamental requirement of FAS 141 that the acquisition method of accounting be used for all business combinations. However, FAS No. 141 (revised) does not make significant changes to the accounting for a business combination achieved in stages, the treatment of contingent consideration, transaction and restructuring costs, and other aspects of business combination accounting. FAS No. 141 (revised) will be effective with the fiscal year that begins on January 1, 2009, and will change the Corporation’s accounting treatment for business combinations on a prospective basis.
SAB No. 109
In November 2007, the SEC issued SAB No. 109, “Written Loan Commitments Recorded at Fair Value Through Earnings”. SAB No. 109 supersedes SAB No. 105, “Loan Commitments Accounted for as Derivative Instruments”, and expresses the view that expected net future cash flows related to the servicing of loans should be included in the fair value measurement of all written loan commitments that are accounted for a fair value through earnings. SAB No. 109 retains the views in SAB No. 105 that internally developed intangible assets (such as client relationship intangible assets) should not be included in the fair value measurement of derivative loan commitments. SAB No. 109 became effective on January 1, 2008 and did not have a material effect on the Corporation’s consolidated financial statements upon adoption.
SAB No. 110
In December 2007, the SEC issued SAB No. 110, and extended, under certain circumstances, the availability of a “simplified” method for estimating the expected term of “plain vanilla” share options in accordance with SFAS No. 123 (revised). Since the Corporation does not use the “simplified” method to estimate the expected term of share options, the adoption of SAB No. 110 did not effect the Corporation’s consolidated financial statements.
30
V. Adjustment Related to Prior Financial Statements
In January 2008, the Corporation identified that there was an immaterial under-accrual of payroll related liabilities in each of its prior quarterly and year end statements of condition. These financial statements reflect the correction of this immaterial error as follows: Other assets at December 31, 2006 and 2005 were reported as $12.9 million and $15.1 million, respectively, and were adjusted to $13.1 million and $15.2 million, respectively; Other liabilities at December 31, 2006 and 2005 were reported as $10.4 million and $11.3 million, respectively, and were adjusted to $10.9 million and $11.8 million, respectively; Retained earnings at December 31, 2006 and 2005 were reported as $92.1 million and $82.9 million, respectively, and were adjusted to $91.8 million and $82.6 million, respectively. Shareholder’s equity at December 31, 2006 and 2005 were reported as $82.4 million and $77.5 million, respectively, and were adjusted to $82.1 million and $77.2 million, respectively. The error had no impact on earnings in 2006 or 2005. The Statement of changes in shareholders’ equity shows a decrease of $291 thousand in retained earnings as of December 31, 2004 relating to the correction of this immaterial error.
In 2006, the Corporation determined that two prior misstatements were material under the guidance of Staff Accounting Bulletin No.108 (“SAB 108”) and were recorded in the 2006 Consolidated Financial Statements. Consistent with the adoption in 2006 of SAB 108 and its transition provisions, the Statement of Changes in Shareholders Equity reflects a cumulative effect adjustment of an increase in retained earnings of $408 thousand effective January 1, 2006 related to these errors.
2. INVESTMENT SECURITIES
The amortized cost and estimated fair value of investments, all of which were classified as available for sale, are as follows:
As of December 31, 2007
| | | | | | | | | | | | | |
| (dollars in thousands) | | Amortized
Cost | | Gross
Unrealized
Gains | | Gross
Unrealized
Losses | | | Estimated
Fair
Value |
Obligations of the U.S. Government and agencies | | $ | 22,005 | | $ | 137 | | $ | (11 | ) | | $ | 22,131 |
State & political subdivisions | | | 7,775 | | | 7 | | | (90 | ) | | | 7,692 |
Federal agency mortgage backed securities | | | 17,055 | | | 144 | | | (25 | ) | | | 17,174 |
Other securities | | | 1,401 | | | 9 | | | (5 | ) | | | 1,405 |
| | | | | | | | | | | | | |
Total | | $ | 48,236 | | $ | 297 | | $ | (131 | ) | | $ | 48,402 |
| | | | | | | | | | | | | |
As of December 31, 2006
| | | | | | | | | | | | | |
| (dollars in thousands) | | Amortized
Cost | | Gross
Unrealized
Gains | | Gross
Unrealized
Losses | | | Estimated
Market
Value |
Obligations of the U.S. Government and agencies | | $ | 30,999 | | $ | 27 | | $ | (257 | ) | | $ | 30,769 |
State & political subdivisions | | | 5,189 | | | — | | | (175 | ) | | | 5,014 |
Federal agency mortgage backed securities | | | 11,729 | | | 36 | | | (31 | ) | | | 11,734 |
Other securities | | | 715 | | | 14 | | | (14 | ) | | | 715 |
| | | | | | | | | | | | | |
Total | | $ | 48,632 | | $ | 77 | | $ | (477 | ) | | $ | 48,232 |
| | | | | | | | | | | | | |
The following table shows the amount of securities that were in an unrealized loss position at December 31, 2007:
| | | | | | | | | | | | | | | | | | | | | |
| | | Less than 12 Months | | | 12 Months or Longer | | | Total | |
| (dollars in thousands) | | Fair
Value | | Unrealized
Losses | | | Fair
Value | | Unrealized
Losses | | | Fair
Value | | Unrealized
Losses | |
Obligations of the U.S. Government and Agencies | | $ | — | | $ | — | | | $ | 5,989 | | $ | (11 | ) | | $ | 5,989 | | $ | (11 | ) |
State and political subdivisions | | | 1,675 | | | (5 | ) | | | 3,609 | | | (85 | ) | | | 5,284 | | | (90 | ) |
Federal agency mortgage backed securities | | | 5,029 | | | (25 | ) | | | — | | | — | | | | 5,029 | | | (25 | ) |
Other $ | | | 350 | | | — | | | | 595 | | | (5 | ) | | | 945 | | | (5 | ) |
| | | | | | | | | | | | | | | | | | | | | |
Total temporarily impaired securities | | $ | 7,054 | | $ | (30 | ) | | $ | 10,193 | | $ | (101 | ) | | $ | 17,247 | | $ | (131 | ) |
| | | | | | | | | | | | | | | | | | | | | |
The Corporation has concluded that the unrealized losses presented in the table above are temporary in nature as they are primarily related to market interest rates and are not related to the underlying credit quality of the issuers. None of the investments are believed to be other-than-temporarily impaired. The Corporation has the ability and intent to hold the securities until maturity to recover the entire value. At December 31, 2007 securities having a book value of $16.0 million were pledged as collateral for public funds, trust deposits, and other purposes.
31
The amortized cost and estimated market value of investment securities at December 31, 2007 by contractual maturity are shown below. Expected maturities will differ from contractual maturities because borrowers may have the right to call or prepay obligations with or without call or prepayment penalties.
| | | | | | |
| (dollars in thousands) | | 2007 |
| | Amortized
Cost | | Estimated
Market
Value |
Due in one year or less | | $ | 4,451 | | $ | 4,443 |
Due after one year through five years | | | 12,008 | | | 12,008 |
Due after five years through ten years | | | 13,040 | | | 13,093 |
Due after ten years | | | 1,681 | | | 1,675 |
No stated maturity | | | 1 | | | 9 |
| | | | | | |
Subtotal | | | 31,181 | | | 31,228 |
Mortgage backed securities | | | 17,055 | | | 17,174 |
| | | | | | |
Total | | $ | 48,236 | | $ | 48,402 |
| | | | | | |
There were no sales of debt securities during 2007, 2006 or 2005.
3. LOANSAND LEASES
Loans and leases outstanding at December 31 are detailed by category as follows:
| | | | | | | | |
| (dollars in thousands) | | 2007 | | | 2006 | |
Loans held for sale | | $ | 5,125 | | | $ | 3,726 | |
| | | | | | | | |
Real estate loans: | | | | | | | | |
Commercial mortgage loans | | $ | 224,510 | | | $ | 198,407 | |
Home equity lines and loans | | | 123,293 | | | | 113,068 | |
Residential mortgage loans | | | 121,313 | | | | 103,572 | |
Construction loans | | | 66,901 | | | | 74,798 | |
| | | | | | | | |
Total real estate loans | | | 536,017 | | | | 489,845 | |
Commercial and industrial loans | | | 213,834 | | | | 175,278 | |
Consumer loans | | | 7,990 | | | | 9,156 | |
Leases | | | 45,084 | | | | 7,012 | |
| | | | | | | | |
Total portfolio loans and leases | | | 802,925 | | | | 681,291 | |
| | | | | | | | |
Total loans and leases | | $ | 808,050 | | | $ | 685,017 | |
| | | | | | | | |
Loans with predetermined rates | | $ | 333,662 | | | $ | 266,260 | |
Loans with adjustable or floating rates | | | 474,388 | | | | 418,757 | |
| | | | | | | | |
Total loans and leases | | $ | 808,050 | | | $ | 685,017 | |
| | | | | | | | |
Net deferred loan origination costs and (fees) included in the above loan table | | $ | 185 | | | $ | 146 | |
| | | | | | | | |
Non-accrual loans | | $ | 747 | | | $ | 704 | |
| | | | | | | | |
Loans past due 90 days or more and still accruing | | $ | 1,263 | | | $ | 119 | |
| | | | | | | | |
|
| Leases outstanding at December 31 are detailed by components of the net investment as follows: | |
| |
| (dollars in thousands) | | December 31 | |
| | 2007 | | | 2006 | |
Minimum lease payments receivable | | $ | 54,712 | | | $ | 8,607 | |
Estimated residual value of equipment | | | — | | | | — | |
Unearned lease income | | | (12,642 | ) | | | (2,056 | ) |
Initial direct costs and fees deferred | | | 3,014 | | | | 461 | |
Security deposits | | | — | | | | — | |
| | | | | | | | |
Total | | $ | 45,084 | | | $ | 7,012 | |
| | | | | | | | |
Information regarding impaired loans is as follows:
| | | | | | | | | | | | |
| (dollars in thousands) | | 2007 | | | 2006 | | | 2005 | |
Impaired loans at year end | | $ | 574 | | | $ | 704 | | | $ | 261 | |
| | | | | | | | | | | | |
Average impaired loans for the year | | $ | 504 | | | $ | 801 | | | $ | 825 | |
| | | | | | | | | | | | |
| | | |
| A summary of the changes in the allowance for impaired loans is as follows: | | | | | | | | | | | | |
| | | |
| | | 2007 | | | 2006 | | | 2005 | |
Balance, January 1 | | $ | 101 | | | $ | 66 | | | $ | 5 | |
Charge-offs | | | (37 | ) | | | (120 | ) | | | (156 | ) |
Recoveries | | | 60 | | | | 5 | | | | 17 | |
Provision | | | — | | | | 150 | | | | 200 | |
| | | | | | | | | | | | |
Balance, December 31 | | $ | 124 | | | $ | 101 | | | $ | 66 | |
| | | | | | | | | | | | |
Interest income that would have been recognized under original terms | | $ | 48 | | | $ | 28 | | | $ | 54 | |
| | | | | | | | | | | | |
Interest income actually received | | $ | 23 | | | $ | 13 | | | $ | 27 | |
| | | | | | | | | | | | |
Interest income recognized | | $ | 1 | | | $ | 39 | | | $ | 22 | |
| | | | | | | | | | | | |
Interest income recognized using the cash basis method of income recognition | | $ | 1 | | | $ | 39 | | | $ | 22 | |
| | | | | | | | | | | | |
4. ALLOWANCEFOR LOANAND LEASE LOSSES
The summary of the changes in the allowance for loan and lease losses is as follows:
| | | | | | | | | | | | |
| (dollars in thousands) | | 2007 | | | 2006 | | | 2005 | |
Balance, January 1 | | $ | 8,122 | | | $ | 7,402 | | | $ | 6,927 | |
Charge-offs | | | (1,036 | ) | | | (151 | ) | | | (314 | ) |
Recoveries | | | 147 | | | | 39 | | | | 27 | |
Provision | | | 891 | | | | 832 | | | | 762 | |
| | | | | | | | | | | | |
Balance, December 31 | | $ | 8,124 | | | $ | 8,122 | | | $ | 7,402 | |
| | | | | | | | | | | | |
32
5. PREMISESAND EQUIPMENT
A summary of premises and equipment at December 31 is as follows:
| | | | | | | | |
| (dollars in thousands) | | 2007 | | | 2006 | |
Land | | $ | 2,879 | | | $ | 2,974 | |
Buildings | | | 13,187 | | | | 13,829 | |
Furniture and equipment. | | | 16,430 | | | | 16,303 | |
Leasehold improvements | | | 6,738 | | | | 3,726 | |
Construction in progress | | | 1,309 | | | | 3,023 | |
Less: accumulated depreciation | | | (23,591 | ) | | | (23,284 | ) |
| | | | | | | | |
Total | | $ | 16,952 | | | $ | 16,571 | |
| | | | | | | | |
Depreciation and amortization expense related to the assets detailed in above table for the years ended December 31, 2007 2006 and 2005 amounted to $1.5 million, $1.4 million and $1.4 million, respectively.
Future minimum cash rent commitments under various operating leases as of December 31, 2007 are as follows:
| | | |
| (dollars in thousands) | | |
2008 | | $ | 893 |
2009 | | | 908 |
2010 | | | 909 |
2011 | | | 891 |
2012 | | | 891 |
2013 and thereafter | | $ | 16,527 |
Rent expense on leased premises and equipment for the years ended December 31, 2007, 2006 and 2005 amounted to $963 thousand, $795 thousand and $599 thousand, respectively.
6. MORTGAGE SERVICING
The following summarizes the Corporation’s activity related to MSRs for the years ended December 31, 2007 and 2006:
| | | | | | | | | | | | |
| (dollars in thousands) | | 2007 | | | 2006 | | | 2005 | |
Balance, January 1 | | $ | 2,883 | | | $ | 2,982 | | | $ | 3,172 | |
Additions | | | 285 | | | | 263 | | | | 416 | |
Amortization | | | (313 | ) | | | (348 | ) | | | (606 | ) |
Impairment | | | (35 | ) | | | (14 | ) | | | — | |
| | | | | | | | | | | | |
Balance, December 31 | | $ | 2,820 | | | $ | 2,883 | | | $ | 2,982 | |
| | | | | | | | | | | | |
Fair Value | | $ | 3,881 | | | $ | 4,289 | | | $ | 4,843 | |
| | | | | | | | | | | | |
Loans serviced for others | | $ | 357,363 | | | $ | 382,141 | | | $ | 417,649 | |
| | | | | | | | | | | | |
The following summarizes the Corporation’s activity related to changes in the impairment valuation allowance of MSRs for the years ended December 31, 2007 and 2006:
| | | | | | | | | | | | |
| | | 2007 | | | 2006 | | | 2005 | |
Balance, January 1 | | $ | (14 | ) | | $ | — | | | $ | — | |
Impairment | | | (29 | ) | | | (14 | ) | | | 42 | |
Recovery | | | 8 | | | | — | | | | (42 | ) |
| | | | | | | | | | | | |
Balance, December 31 | | $ | (35 | ) | | $ | (14 | ) | | $ | — | |
| | | | | | | | | | | | |
At December 31, 2007, key economic assumptions and the sensitivity of the current fair value of MSRs to immediate 10 and 20 percent adverse changes in those assumptions are as follows:
| | | | |
Fair value amount of MSRs | | $ | 3,881 | |
Weighted average life (in years) | | | 6.2 | |
Prepayment speeds (constant prepayment rate)* | | | 10.5 | % |
Impact on fair value: | | | | |
10% adverse change | | $ | (164 | ) |
20% adverse change | | $ | (317 | ) |
Discount rate | | | 10 | % |
Impact on fair value: | | | | |
10% adverse change | | $ | (100 | ) |
20% adverse change | | $ | (202 | ) |
| * | Represents the weighted average prepayment rate for the life of the MSR asset. |
For the periods ended December 31, 2007, 2006 and 2005, the fair value of the mortgage servicing rights (“MSRs”) is $3,881,000, $4,289,000 and $4,843,000, respectively. The fair value of the MSRs for these periods was determined using a third-party valuation model that calculates the present value of estimated future servicing income. The model incorporates assumptions that market participants use in estimating future net servicing income, including estimates of prepayment speeds and discount rates. Mortgage loan prepayment speed is the annual rate at which borrowers are forecasted to repay their mortgage loan principle and is based on historical experience. The discount rate is used to determine the present value of future net servicing income –another key assumption in the model-is the required rate of return the market would expect for an asset with similar risk. Both assumptions can, and generally will, change quarterly valuations as market conditions and interest rates change.
These assumptions and sensitivities are hypothetical and should be used with caution. As the figures indicate, changes in fair value based on a 10% variation in assumptions generally cannot be extrapolated because the relationship of the change in assumptions to the change in fair value may not be linear. Also, the effect of a variation in a particular assumption on the fair value of the MSRs is calculated without changing any other assumption. In realty, changes in one factor may result in changes in another, which could magnify or counteract the sensitivities.
33
7. DEPOSITS
Following is a summary of deposits as of December 31,
| | | | | | |
| (dollars in thousands) | | 2007 | | 2006 |
Savings | | $ | 36,181 | | $ | 40,441 |
NOW accounts | | | 137,486 | | | 143,742 |
Market rate accounts | | | 114,310 | | | 111,338 |
Time deposits (less than $100,000) | | | 83,890 | | | 80,110 |
Time deposits, $100,000 or more | | | 119,572 | | | 120,336 |
Wholesale deposits | | | 129,820 | | | 19,976 |
| | | | | | |
Total interest-bearing deposits | | | 621,259 | | | 515,943 |
Non-interest-bearing deposits | | | 228,269 | | | 198,546 |
| | | | | | |
Total deposits | | $ | 849,528 | | $ | 714,489 |
| | | | | | |
The aggregate amount of deposit overdrafts included as loans as of December 31, 2007 and 2006 were $889 thousand and $473 thousand, respectively.
Maturity of time deposits as of December 31, 2007 was as follows:
| | | | | | |
| (dollars in thousands) | | $100,000
or more | | Less than
$100,000 |
Maturing during: | | | | | | |
2008 | | $ | 117,784 | | $ | 76,598 |
2009 | | | 1,553 | | | 5,937 |
2010 | | | 235 | | | 963 |
2011 | | | — | | | 180 |
2012 | | | — | | | 95 |
2013 and thereafter | | | — | | | 117 |
| | | | | | |
Total | | $ | 119,572 | | $ | 83,890 |
| | | | | | |
| | |
| Maturity of wholesale deposits as of December 31, 2007 was as follows: | | | | | | |
| | |
| (dollars in thousands) | | $100,000
or more | | Less than
$100,000 |
Maturing during: | | | | | | |
2008 | | $ | 113,501 | | $ | 6,319 |
2009 | | | — | | | — |
2010 | | | 5,000 | | | — |
2011 | | | 5,000 | | | — |
2012 | | | — | | | — |
2013 and thereafter | | | — | | | — |
| | | | | | |
Total | | $ | 123,501 | | $ | 6,319 |
| | | | | | |
8. BORROWED FUNDS
Borrowings at December 31, 2007 consisted of the following Federal Home Loan Bank of Pittsburgh (“FHLB”) advances:
| | | | | | | |
| (dollars in thousands) | | | | | | |
| | | |
| Borrowing | | Maturity | | Interest Rate | | F/V |
| $ | 15,000 | | 8/18/08 | | 4.93% | | F |
| | 10,000 | | 11/09/09 | | 4.22% | | F |
| | 10,000 | | 10/18/10 | | 4.61% | | V |
| | 10,000 | | 11/09/10 | | 4.30% | | F |
| | | | | | | | |
| $ | 45,000 | | | | | | |
| | | | | | | | |
F = fixed rate and V = variable rate (prime -2.64%)
| | | | | | | | | | | | |
| (dollars in thousands) | | 2007 | | | 2006 | | | 2005 | |
Average balance during the year | | $ | 42,496 | | | $ | 19,442 | | | $ | 1,700 | |
Year end balance | | | 45,000 | | | | 15,000 | | | | — | |
Highest month end balance | | | 77,000 | | | | 46,300 | | | | 12,385 | |
Weighted-average interest rate during the year | | | 5.22 | % | | | 5.36 | % | | | 3.35 | % |
Weighted-average interest rate at year end | | | 4.56 | % | | | 5.41 | % | | | — | |
The Corporation has unused FHLB borrowing capacity of $263.0 million at December 31, 2007. In connection with its FHLB borrowings, the Corporation is required to hold stock in the FHLB. This amount was $2.8 million at December 31, 2007 and is included in other assets in the accompanying Consolidated Balance Sheet. The carrying amount of the FHLB stock approximates its fair value.
9. DISCLOSUREABOUT FAIR VALUEOF FINANCIAL INSTRUMENTS
FAS No. 107 – “Disclosures about Fair Value of Financial Instruments” (“FAS 107”) requires disclosure of the fair value information about financial instruments, whether or not recognized in the balance sheet, for which it is practicable to estimate such value. In cases where quoted market prices are not available, fair values are based on estimates using present value or other market value techniques. Those techniques are significantly affected by the assumptions used, including the discount rate and estimates of future cash flows. In that regard the derived fair value estimates cannot be substantiated by comparison to independent markets and, in many cases, could not be realized in immediate settlement of the instrument. FAS 107 excludes certain financial instruments and all non-financial instruments from its disclosure requirements. Accordingly, the aggregate fair value amounts presented do not represent the underlying value of the Corporation.
The following methods and assumptions were used to estimate the fair value of each class of financial instruments for which it is practicable to estimate that value:
Cash and Cash Equivalents
The carrying amounts reported in the balance sheet for cash and cash equivalents approximate their fair values.
Investment Securities
Estimated fair values for investment securities are based on quoted market price, where available.
Loans and Leases
For variable rate loans that reprice frequently and which have no significant change in credit risk, estimated fair values are based on carrying values. Fair values of certain mortgage loans and consumer loans are estimated using discounted cash flow analyses, using interest rates currently being offered for loans with similar terms to borrowers of similar credit quality. The estimated fair value of nonperforming loans is based on discounted estimated cash flows as determined by the internal
34
loan review of the Bank or the appraised market value of the underlying collateral, as determined by independent third party appraisers.
Other Assets
The carrying amount of accrued interest receivable and other investments approximates fair value.
Deposits
The estimated fair values disclosed for noninterest-bearing demand deposits, NOW accounts, and Market Rate accounts are, by definition, equal to the amounts payable on demand at the reporting date (i.e., their carrying amounts). Fair values for certificates of deposit are estimated using a discounted cash flow calculation that applies interest rates currently being offered on certificates to a schedule of expected monthly maturities on the certificate of deposit. FAS 107 defines the fair value of demand deposits as the amount payable on demand and prohibits adjusting estimated fair value from any value derived from retaining those deposits for an expected future period of time.
Borrowed Funds
The fair value of borrowed funds is established using a discounted cash flow calculation that applies interest rates currently being offered on mid-term and long term borrowings.
Other Liabilities
The carrying amounts of accrued interest payable, accrued taxes payable and other accrued payables approximate fair value.
Off-Balance Sheet Instruments
Estimated fair values of the Corporation’s off-balance sheet instruments (standby letters of credit and loan commitments) are based on fees and rates currently charged to enter into similar loan agreements, taking into account the remaining terms of the agreements and the counterparties’ credit standing. Since fees and rates charged for off-balance sheet items are at market levels when set, there is no material difference between the stated amount and estimated fair values of off-balance sheet instruments.
The carrying amount and estimated fair value of the Corporation’s financial instruments as of December 31 are as follows:
| | | | | | | | | | | | |
| (dollars in thousands) | | 2007 | | 2006 |
| | Carrying
Amount | | Estimated
Fair Value | | Carrying
Amount | | Estimated
Fair Value |
Financial assets: | | | | | | | | | | | | |
Cash and due from banks | | $ | 76,965 | | $ | 76,965 | | $ | 61,473 | | $ | 61,473 |
Interest-bearing deposits with other banks | | | 1,209 | | | 1,209 | | | 532 | | | 532 |
Federal funds sold | | | 17,000 | | | 17,000 | | | — | | | — |
Investment securities | | | 48,402 | | | 48,402 | | | 48,232 | | | 48,232 |
Mortgage servicing rights | | | 2,820 | | | 3,881 | | | 2,883 | | | 4,289 |
Loans held for sale | | | 5,125 | | | 5,114 | | | 3,726 | | | 3,726 |
Other assets | | | 55,774 | | | 55,774 | | | 8,635 | | | 8,635 |
Net loans | | | 794,801 | | | 795,855 | | | 673,169 | | | 669,042 |
| | | | | | | | | | | | |
Total financial assets | | $ | 1,002,096 | | $ | 1,004,200 | | $ | 798,650 | | $ | 795,929 |
| | | | | | | | | | | | |
Financial liabilities: | | | | | | | | | | | | |
Deposits | | $ | 849,528 | | $ | 849,475 | | $ | 714,489 | | $ | 713,616 |
Borrowed funds | | | 45,000 | | | 45,397 | | | 15,000 | | | 15,000 |
Other liabilities | | | 17,217 | | | 17,217 | | | 4,572 | | | 4,572 |
| | | | | | | | | | | | |
Total financial liabilities | | $ | 911,745 | | $ | 912,089 | | $ | 734,061 | | $ | 733,188 |
| | | | | | | | | | | | |
Off-balance sheet instruments | | $ | 322,968 | | $ | 322,968 | | $ | 325,995 | | $ | 325,995 |
| | | | | | | | | | | | |
10. 401(K) PLAN
The Corporation has a qualified defined contribution plan for all eligible employees under which the Corporation contributes $1.00 for each $1.00 that an employee contributes up to a maximum of 3.0% of the employee’s base salary. The Corporation’s expenses for the 401(K) Plan were $410 thousand, $362 thousand and $339 thousand in 2007, 2006 and 2005, respectively.
See Note 24 Subsequent Event Pension and 401(K) Plans.
11. PENSIONAND POSTRETIREMENT BENEFIT PLANS
The Corporation has two defined benefit pension plans, the qualified defined benefit plan (“QDBP”) which covers all employees over age 20 1/2 who meet certain service requirements and the non-qualified defined benefit pension plan (“SERP”) which is restricted to certain officers of the Corporation. The Corporation also has a postretirement benefit plan (“PRBP”) that covers certain retired employees and a group of current employees. The PRBP was closed to new participants in 1994.
The Corporation adopted FAS 158 on December 31, 2006. As a result of its adoption, the Corporation recorded additional pension liabilities of $6.5 million; deferred taxes of $2.3 million and a reduction of accumulated other comprehensive income (shareholder’s equity) of $4.2 million at that date.
Federal Reserve Bank guidance states that the effects of the initial adoption and subsequent application of FAS 158 are excluded from regulatory capital calculations. See Note 20 – Regulatory Capital Requirements for more information.
35
The following table provides information with respect to these plans, including benefit obligations and funded status, net periodic pension costs, plan assets, cash flows, amortization information and other accounting items.
Actuarial Assumptions Used in the Tables Below:
| | | | | | | | | | | | | | | | | | | | | | | | |
| | | QDBP | | | SERP | | | PRBP | |
| | 2007 | | | 2006 | | | 2007 | | | 2006 | | | 2007 | | | 2006 | |
Used to determine benefit obligations as of December 31: | | | | | | | | | | | | | | | | | | | | | | | | |
Discount rate | | | 6.00 | % | | | 5.75 | % | | | 6.00 | % | | | 5.75 | % | | | 6.00 | % | | | 5.75 | % |
Rate of increase for future compensation | | | 4.00 | % | | | 4.00 | % | | | 4.00 | % | | | 4.00 | % | | | 4.00 | % | | | 4.00 | % |
Used to determine periodic benefit cost for the years ended December 31: | | | | | | | | | | | | | | | | | | | | | | | | |
Discount rate | | | 5.75 | % | | | 5.75 | % | | | 5.75 | % | | | 5.75 | % | | | 5.75 | % | | | 5.75 | % |
Rate of increase for future compensation | | | 4.00 | % | | | 4.00 | % | | | 4.00 | % | | | 4.00 | % | | | 4.00 | % | | | 4.00 | % |
Expected long-term rate of return on plan assets | | | 8.50 | % | | | 8.50 | % | | | N/A | | | | N/A | | | | N/A | | | | N/A | |
Assumed health care cost trend rates as of December 31: | | | | | | | | | | | | | | | | | | | | | | | | |
Cost trend rate assumed for next year | | | N/A | | | | N/A | | | | N/A | | | | N/A | | | | 9.00 | % | | | 10.00 | % |
Rate to which the cost trend rate is assumed to decline | | | N/A | | | | N/A | | | | N/A | | | | N/A | | | | 0.00 | % | | | 0.00 | % |
Year that the rate reaches the ultimate trend rate | | | N/A | | | | N/A | | | | N/A | | | | N/A | | | | 2007 | | | | 2006 | |
| | | | | | |
| Changes in Benefit Obligations and Plan Assets: | | | | | | | | | | | | | | | | | | | | | | | | |
| | | |
| (dollars in thousands) | | QDBP | | | SERP | | | PRBP | |
| | 2007 | | | 2006 | | | 2007 | | | 2006 | | | 2007 | | | 2006 | |
Change in benefit obligation | | | | | | | | | | | | | | | | | | | | | | | | |
Benefit obligation at January 1 | | $ | 29,991 | | | $ | 28,748 | | | $ | 1,788 | | | $ | 2,012 | | | $ | 1,881 | | | $ | 2,448 | |
Service cost | | | 1,251 | | | | 1,155 | | | | 60 | | | | 36 | | | | 5 | | | | 12 | |
Interest cost | | | 1,752 | | | | 1,591 | | | | 114 | | | | 99 | | | | 84 | | | | 108 | |
Amendments | | | — | | | | — | | | | — | | | | — | | | | (128 | ) | | | — | |
Settlement | | | — | | | | — | | | | — | | | | — | | | | (235 | ) | | | — | |
Actuarial (gain) loss | | | 106 | | | | (498 | ) | | | 205 | | | | (229 | ) | | | (176 | ) | | | (499 | ) |
Benefits paid | | | (1,071 | ) | | | (1,005 | ) | | | (130 | ) | | | (130 | ) | | | (180 | ) | | | (188 | ) |
| | | | | | | | | | | | | | | | | | | | | | | | |
Benefit obligation at December 31 | | $ | 32,029 | | | $ | 29,991 | | | $ | 2,037 | | | $ | 1,788 | | | $ | 1,251 | | | $ | 1,881 | |
| | | | | | | | | | | | | | | | | | | | | | | | |
Change in plan assets | | | | | | | | | | | | | | | | | | | | | | | | |
Fair value of plan assets at January 1 | | $ | 30,621 | | | $ | 26,726 | | | $ | — | | | $ | — | | | $ | — | | | $ | — | |
Actual return on plan assets | | | 1,606 | | | | 2,800 | | | | — | | | | — | | | | — | | | | — | |
Employer contribution | | | 1,000 | | | | 2,100 | | | | 130 | | | | 130 | | | | 415 | | | | 188 | |
Plan participants’ contribution | | | — | | | | — | | | | — | | | | — | | | | — | | | | — | |
Benefits paid | | | (1,071 | ) | | | (1,005 | ) | | | (130 | ) | | | (130 | ) | | | (180 | ) | | | (188 | ) |
Settlement | | | — | | | | — | | | | — | | | | — | | | | (235 | ) | | | — | |
| | | | | | | | | | | | | | | | | | | | | | | | |
Fair value of plan assets at December 31 | | $ | 32,156 | | | $ | 30,621 | | | $ | — | | | $ | — | | | $ | — | | | $ | — | |
| | | | | | | | | | | | | | | | | | | | | | | | |
Funded status at year end (plan assets less benefit obligation) | | $ | 127 | | | $ | 630 | | | $ | (2,037 | ) | | $ | (1,788 | ) | | $ | (1,251 | ) | | $ | (1,881 | ) |
| | | | | | | | | | | | | | | | | | | | | | | | |
Amounts included in the consolidated balance sheet as other assets (liabilities) & accumulated other comprehensive income including the following: | | | | | | | | | | | | | | | | | | | | | | | | |
Prepaid benefit cost/(accrued liability) | | $ | 6,414 | | | $ | 6,408 | | | $ | (1,622 | ) | | $ | (1,744 | ) | | $ | (914 | ) | | $ | (1,197 | ) |
Accumulated other comprehensive income | | | (6,287 | ) | | | (5,778 | ) | | | (415 | ) | | | (44 | ) | | | (337 | ) | | | (684 | ) |
| | | | | | | | | | | | | | | | | | | | | | | | |
Net amount recognized | | $ | 127 | | | $ | 630 | | | $ | (2,037 | ) | | $ | (1,788 | ) | | $ | (1,251 | ) | | $ | (1,881 | ) |
| | | | | | | | | | | | | | | | | | | | | | | | |
36
The following tables provide the components of net periodic pension costs for the years ended December 31, 2006, 2005 and 2004:
| | | | | | | | | | | | |
QDBP Net Periodic Pension Cost | | | | | | | | | | | | |
| | | |
| (dollars in thousands) | | 2007 | | | 2006 | | | 2005 | |
Service cost | | $ | 1,251 | | | $ | 1,155 | | | $ | 1,123 | |
Interest cost | | | 1,752 | | | | 1,591 | | | | 1,538 | |
Expected return on plan assets | | | (2,547 | ) | | | (2,223 | ) | | | (2,153 | ) |
Amortization of prior service cost | | | 81 | | | | 81 | | | | 81 | |
Amortization of net actuarial (gain) loss | | | 457 | | | | 488 | | | | 350 | |
| | | | | | | | | | | | |
Net periodic pension cost | | $ | 994 | | | $ | 1,092 | | | $ | 939 | |
| | | | | | | | | | | | |
| | | |
SERP Net Periodic Pension Cost | | | | | | | | | | | | |
| | | |
| (dollars in thousands) | | 2007 | | | 2006 | | | 2005 | |
Service cost | | $ | 60 | | | $ | 36 | | | $ | 44 | |
Interest cost | | | 114 | | | | 99 | | | | 112 | |
Amortization of prior service cost | | | 44 | | | | 49 | | | | 49 | |
Amortization of net actuarial (gain) loss | | | 26 | | | | — | | | | 23 | |
| | | | | | | | | | | | |
Net periodic pension cost | | $ | 244 | | | $ | 184 | | | $ | 228 | |
| | | | | | | | | | | | |
| | | |
PRBP Net Periodic Pension Cost | | | | | | | | | | | | |
| | | |
| (dollars in thousands) | | 2007 | | | 2006 | | | 2005 | |
Service cost | | $ | 5 | | | $ | 12 | | | $ | 12 | |
Interest cost | | | 84 | | | | 108 | | | | 143 | |
Settlement | | | 123 | | | | — | | | | — | |
Amortization of transition obligation (asset) | | | 26 | | | | 26 | | | | 25 | |
Amortization of prior service cost | | | (202 | ) | | | (137 | ) | | | (137 | ) |
Amortization of net actuarial (gain) loss | | | 89 | | | | 126 | | | | 203 | |
| | | | | | | | | | | | |
Net periodic pension cost | | $ | 125 | | | $ | 135 | | | $ | 246 | |
| | | | | | | | | | | | |
Adoption of FAS 158
The following tables reflect information relative to the adoption of FAS 158:
| | | | | | | | | | | | |
| (dollars in thousands) | | December 31,
2006
Prior to
Adoption of
FAS 158 | | | FAS 158
Adoption
Adjustment | | | December 31,
2006
After
Adoption
of FAS 158 | |
QDBP prepaid expense | | $ | 6,408 | | | $ | (5,778 | ) | | $ | 630 | |
SERP liability | | | (1,744 | ) | | | (44 | ) | | | (1,788 | ) |
PRBP liability | | | (1,197 | ) | | | (684 | ) | | | (1,881 | ) |
Accumulated other comprehensive income (loss), net of taxes | | | (222 | ) | | | (4,228 | ) | | | (4,450 | ) |
Deferred taxes | | | (1,315 | ) | | | 2,277 | | | | 962 | |
Estimated amounts that will be amortized from accumulated other comprehensive income over the next fiscal year:
| | | | | | | | | |
| (dollars in thousands) | | QDBP | | SERP | | PRBP | |
Expected 2008 amortization of transition obligation | | $ | — | | — | | $ | 26 | |
Expected 2008 amortization of prior service cost | | | 33 | | 44 | | | (202 | ) |
Expected 2008 amortization of net loss (gain) | | | 457 | | 25 | | | (56 | ) |
Plan Assets:
| | | | | | | | | |
| | | Target Asset
Allocation | | | Percentage of
QDBP Plan
Assets at
December 31 | |
| | | 2007 | | | 2006 | |
Asset Category | | | | | | | | | |
Equity Securities* | | 40% - 60 | % | | 65 | % | | 67 | % |
Debt Securities | | 25% - 40 | % | | 34 | % | | 29 | % |
Real Estate | | 5% - 15 | % | | 0 | % | | 0 | % |
Other | | 5% - 15 | % | | 1 | % | | 4 | % |
| | | | | | | | | |
Total | | | | | 100 | % | | 100 | % |
| | | | | | | | | |
| * | Includes Bryn Mawr Bank Corporation common stock in the amount of $721,000 (2%) and $661,000 (2%) at December 31, 2006 and 2005, respectively. |
The expected rate of return on plan assets in the QDBP was selected by Management after consultation with the Corporation’s actuary, and is based in part on long term historical rates of return and various actuarial assumptions. The discount rate was also selected by Management after consultation with the Corporation’s actuary, and is based in part upon the current yield of a basket of long term investment grade securities.
The investment strategy of the QDBP is to maintain the investment ranges listed above. The target ranges are to be periodically reviewed based on the prevailing market conditions. Any modification to the current investment strategy must be ratified by the Executive Committee of the Corporation’s Board of Directors. The QDBP will retain approximately 2.50% of Bryn Mawr Bank Corporation common stock.
Cash Flows
The following benefit payments, which reflect expected future services, are expected to be paid over the next ten years:
| | | | | | | | | |
| (dollars in thousands) | | QDBP | | SERP | | PRBP |
Fiscal year ending | | | | | | | | | |
2008 | | $ | 1,424 | | $ | 137 | | $ | 235 |
2009 | | | 1,480 | | | 141 | | | 230 |
2010 | | | 1,534 | | | 140 | | | 224 |
2011 | | | 1,567 | | | 140 | | | 209 |
2012 | | | 1,737 | | | 146 | | | 200 |
2013-2017 | | $ | 9,673 | | $ | 941 | | $ | 740 |
37
Other Pension and Post Retirement Benefit Information
In 2005, the Corporation capped the maximum payment under the PRBP at 120% of the 2005 benefit. The cost is at or near the cap in 2008. The long term impact of the cap will be to make the cost trend rate assumed for 2008 immaterial.
In 2007, the Corporation amended the PRBP to allow for settlement of obligations to certain current and retired employees. Certain retired participant obligations were settled in 2007 and current employee obligations will be settled in 2008.
Expected Contribution to be Paid in the Next Fiscal Year
Based on the status of the Corporation’s QDBP at December 31, 2007 no minimum funding requirement is anticipated for 2008. The 2008 expected contribution for the SERP is $137 thousand.
See Note 24 - Subsequent Event Pension and 401(K) Plans.
12. INCOME TAXESAND FIN 48
The components of the net deferred tax asset (liabilities) as of December 31 are as follows:
| | | | | | | | |
| (dollars in thousands) | | 2007 | | | 2006 | |
Deferred tax assets: | | | | | | | | |
Loan and lease loss reserve | | $ | 2,845 | | | $ | 2,843 | |
Other reserves | | | 244 | | | | 379 | |
Defined benefit plans | | | 3,351 | | | | 3,205 | |
Unrealized appreciation on investment securities | | | — | | | | 140 | |
| | | | | | | | |
Total deferred tax assets | | | 6,440 | | | | 6,567 | |
| | | | | | | | |
Deferred tax liabilities: | | | | | | | | |
Depreciation | | | 35 | | | | (146 | ) |
Other reserves | | | (2 | ) | | | — | |
Cumulative effect of prior year misstatements | | | (204 | ) | | | (223 | ) |
QDBP | | | (2,245 | ) | | | (2,243 | ) |
Originated mortgage servicing rights | | | (987 | ) | | | (1,009 | ) |
Unrealized depreciation on investment securities | | | (146 | ) | | | — | |
| | | | | | | | |
Total deferred tax liability | | | (3,549 | ) | | | (3,621 | ) |
| | | | | | | | |
Total net deferred tax assets | | $ | 2,891 | | | $ | 2,946 | |
| | | | | | | | |
There was no valuation allowance as of December 31, 2007 and 2006 as management believes that it is more likely than not that the net deferred tax asset will be realized.
The provision for income taxes consists of the following:
| | | | | | | | | | | |
| (dollars in thousands) | | 2007 | | 2006 | | | 2005 | |
Currently payable | | $ | 6,491 | | $ | 7,185 | | | $ | 6,449 | |
Deferred | | | 82 | | | (496 | ) | | | (521 | ) |
| | | | | | | | | | | |
Total | | $ | 6,573 | | $ | 6,689 | | | $ | 5,928 | |
| | | | | | | | | | | |
Applicable income taxes differed from the amount derived by applying the statutory federal tax rate to income as follows:
| | | | | | | | | | | | |
| (dollars in thousands) | | 2007 | | | 2006 | | | 2005 | |
Computed tax expense at statutory federal rate | | $ | 7,060 | | | $ | 6,792 | | | $ | 6,047 | |
Tax-exempt income | | | (412 | ) | | | (266 | ) | | | (187 | ) |
Other, net | | | (75 | ) | | | 163 | | | | 68 | |
| | | | | | | | | | | | |
Total income tax expense | | $ | 6,573 | | | $ | 6,689 | | | $ | 5,928 | |
| | | | | | | | | | | | |
The Corporation adopted the provisions of FASB Interpretation No. 48, “Accounting for Uncertainty in Income Taxes” (“FIN 48”) on January 1, 2007. As required by FIN 48, which clarifies FAS 109, “Accounting for Income Taxes,” the Corporation recognizes the financial statement benefit of a tax position only after determining that the Corporation would more likely than not sustain the position following an examination. For tax positions meeting the more-likely-than-not threshold, the amount recognized in the financial statements is the largest benefit that has a greater than 50 percent likelihood of being realized upon settlement with the relevant tax authority. At the adoption date, the Corporation applied these criteria to all tax positions for which the statute of limitations remained open. There were no adjustments to retained earnings for unrecognized tax benefits as a result of the implementation of FIN 48.
The Corporation is subject to income taxes in the U.S. federal jurisdiction, and in multiple state jurisdictions. The Corporation is no longer subject to U.S. federal income tax examination by tax authorities for the years before 2004. The Corporation’s 2005 tax year is currently under audit by the Internal Revenue Service.
The Corporation’s policy is to record interest and penalties on uncertain tax positions as income tax expense.
No interest or penalties were accrued in 2007.
13. STOCK OPTION PLAN:
The Corporation permits the issuance of stock options, dividend equivalents, performance awards, stock appreciation rights, restricted stock and/or restricted stock units to employees and directors of the Corporation under several plans. The terms and conditions of awards under the plans are determined by the Corporation’s Compensation Committee.
On April 25, 2007 the Shareholders approved the Corporation’s “2007 Long-Term Incentive Plan” (“LTIP”) under which a total of 428,996 shares of the Corporation’s common stock were made available for award grants under the LTIP. In 2007, 128,500 of these grants were issued as non-qualified stock options were issued under the LTIP and vest over a five year period from the date of grant. In addition, 4,000 non-qualified stock options were issued during 2007 under the prior plan and vest over a three year period from the date of grant. 10,189 shares remain available for future distribution under the prior stock option plan. The exercise
38
price for stock options issued under the LTIP is the closing price for the stock on the day preceding the date of the grant. The price for options issued under the prior plan is set at the last sale price for the stock on the day preceding the date of the grant. The Corporation’s practice is to issue option related shares from authorized but unissued shares or treasury.
Grant data is in the tables below.
| | | | | | | | | | | | |
| (dollars in thousands) | | Shares
Under
Option | | | Available
for
Option | | | Price
Per
Share | | Weighted
Average
Exercise
Price |
Balance at December 31, 2004 | | 652,784 | | | 351,905 | | | $ | 4.34 - $22.68 | | $ | 14.66 |
Options granted | | 342,175 | | | (342,175 | ) | | $ | 18.91 - $21.21 | | | 19.97 |
Options exercised | | (49,317 | ) | | — | | | $ | 12.25 - $18.91 | | | 13.09 |
Options expired | | (3,334 | ) | | 3,334 | | | $ | 15.15 - $18.32 | | | 17.50 |
Options forfeited | | (8,000 | ) | | 8,000 | | | $ | 15.15 - $20.47 | | | 19.02 |
| | | | | | | | | | | | |
Balance at December 31, 2005 | | 934,308 | | | 21,064 | | | $ | 6.25 - $22.68 | | $ | 17.44 |
Options granted | | 11,375 | | | (11,375 | ) | | $ | 21.74 - $23.67 | | | 22.89 |
Options exercised | | (151,283 | ) | | — | | | $ | 6.25 - $21.21 | | | 16.59 |
Options expired | | (4,500 | ) | | 4,500 | | | $ | 21.21 - $21.68 | | | 21.31 |
Options forfeited | | — | | | — | | | | — | | | — |
| | | | | | | | | | | | |
Balance at December 31, 2006 | | 789,900 | | | 14,189 | | | $ | 8.45 - $23.67 | | $ | 17.66 |
Options authorized | | — | | | 428,996 | | | | | | | |
Options granted | | 132,500 | | | (132,500 | ) | | $ | 22.00 - $23.77 | | $ | 22.05 |
Options exercised | | (61,150 | ) | | — | | | | — | | $ | 15.03 |
Options expired | | — | | | — | | | | — | | | — |
Options forfeited | | (500 | ) | | 500 | | | $ | 22.00 | | | 22.00 |
| | | | | | | | | | | | |
Balance at December 31, 2007 | | 860,750 | | | 311,185 | | | $ | 10.50 - $23.77 | | | 18.52 |
| | | | | | | | | | | | |
Information pertaining to options outstanding at December 31, 2007 is as follows:
(dollars in thousands)
| | | | | | | | | | | | | |
| Price Range of Shares Under Option at December 31, 2007 |
Shares Under Option | | Price Per Share | | Weighted
Average
Remaining
Contractual
Life | | Weighted Average
Exercise Price | | Number Exercisable | | Weighted
Average
Exercise
Price |
| 38,200 | | $ | 10.50 - $10.75 | | 2.4 | | $ | 10.57 | | 38,200 | | $ | 10.57 |
| 136,150 | | $ | 12.25 - $15.15 | | 2.2 | | $ | 13.28 | | 136,150 | | $ | 13.28 |
| 307,200 | | $ | 16.25 - $18.91 | | 6.2 | | $ | 18.33 | | 307,200 | | $ | 18.33 |
| 379,200 | | $ | 19.11 - $23.77 | | 8.2 | | $ | 21.03 | | 239,616 | | $ | 20.89 |
| | | | | | | | | | | | | | |
| 860,750 | | $ | 10.50 - $23.77 | | 6.1 | | $ | 18.52 | | 721,166 | | $ | 17.83 |
| | | | | | | | | | | | | | |
Shares exercisable and weighted average exercise price at December 31, 2007, 2006 and 2005:
| | | | | | | | | |
| | | 2007 | | 2006 | | 2005 |
Shares exercisable | | | 721,166 | | | 778,525 | | | 900,974 |
Weighted average exercise price | | $ | 17.83 | | $ | 17.58 | | $ | 17.42 |
The fair value of each option granted is estimated on the date of the grant using the Black-Scholes option pricing model with the following weighted-average assumptions used for grants in 2007, 2006 and 2005 as follows:
| | | | | | | | | | | | |
| | | 2007 | | | 2006 | | | 2005 | |
Expected dividend yield | | | 2.36% - 2.02 | % | | | 1.94% - 2.03 | % | | | 2.07 | % |
Expected volatility of Corporations’ stock | | | 20.0 - 23.9 | % | | | 23.6 - 24.6 | % | | | 20.5 | % |
Risk-free interest rate | | | 4.4 - 5.0 | % | | | 5.00 | % | | | 4.50 | % |
Expected life in years | | | 6.9 - 7.0 | | | | 6.0 - 6.8 | | | | 6.0 | |
Weighted average fair value of options granted | | $ | 4.90 - $6.82 | | | $ | 6.45 | | | $ | 4.41 | |
Expected dividend yield is determined based on the company’s annual dividend amount as a percentage of the average stock price at the time of the grant. Expected volatility of the Corporation’s stock is determined based on the historic volatility of the company’s stock price. The risk free interest rate is determined based on a yield curve of the U.S. Treasury rates ranging from one month to ten years and a period commensurate with the expected life of the option.
39
The following table provides information about options outstanding for the twelve months ended December 31, 2007, 2006 and 2005:
| | | | | | | | | | | | | | | | | | | | | | | | | | | |
| | | 2007 | | 2006 | | 2005 |
| | Shares | | | Weighted
Average
Exercise
Price | | Weighted
Average
Grant Date
Fair Value | | Shares | | | Weighted
Average
Exercise
Price | | Weighted
Average
Grant Date
Fair Value | | Shares | | | Weighted
Average
Exercise
Price | | Weighted
Average
Grant Date
Fair Value |
Options outstanding, beginning of period | | 789,900 | | | $ | 17.66 | | $ | 3.81 | | 934,308 | | | $ | 17.44 | | $ | 3.74 | | 652,784 | | | $ | 15.80 | | $ | 3.31 |
Granted | | 132,500 | | | | 22.05 | | | 4.96 | | 11,375 | | | | 22.89 | | | 6.44 | | 342,175 | | | | 19.97 | | | 4.41 |
Forfeited | | (500 | ) | | | 22.00 | | | 4.90 | | — | | | | — | | | — | | (8,000 | ) | | | 19.77 | | | 4.42 |
Expired | | — | | | | — | | | — | | (4,500 | ) | | | 21.31 | | | 4,84 | | (3,334 | ) | | | 17.50 | | | 3.66 |
Exercised | | (61,150 | ) | | | 15.03 | | | 3.11 | | (151,283 | ) | | | 16.59 | | | 3.54 | | (49,317 | ) | | | 13.09 | | | 2.65 |
| | | | | | | | | | | | | | | | | | | | | | | | | | | |
Options outstanding, end of period | | 860,750 | | | $ | 18.52 | | $ | 4.04 | | 789,900 | | | $ | 17.66 | | $ | 3.81 | | 934,308 | | | $ | 17.44 | | $ | 3.73 |
| | | | | | | | | | | | | | | | | | | | | | | | | | | |
The following table provides information about unvested options for the twelve months ended December 31, 2007, 2006 and 2005:
| | | | | | | | | | | | | | | | | | |
| | | 2007 | | 2006 | | 2005 |
| | Shares | | | Weighted
Average
Grant Date
Fair Value | | Shares | | | Weighted
Average
Grant Date
Fair Value | | Shares | | | Weighted
Average
Grant Date
Fair Value |
Unvested options, beginning of period | | 11,375 | | | $ | 6.44 | | 33,334 | | | $ | 3.99 | | 246,753 | | | $ | 4.29 |
Granted | | 132,500 | | | | 4.96 | | 11,375 | | | | 6.44 | | 342,175 | | | | 4.41 |
Vested | | (3,791 | ) | | | 6.44 | | (33,334 | ) | | | 3.98 | | (550,594 | ) | | | 4.39 |
Forfeited | | (500 | ) | | | 4.90 | | — | | | | — | | (5,000 | ) | | | 4.42 |
| | | | | | | | | | | | | | | | | | |
Unvested options, end of period | | 139,584 | | | $ | 5.04 | | 11,375 | | | $ | 6.44 | | 33,334 | | | $ | 3.98 |
| | | | | | | | | | | | | | | | | | |
Proceeds, related tax benefits realized from options exercised and intrinsic value of options exercised were as follows:
| | | | | | | | | |
| (dollars in thousands) | | 2007 | | 2006 | | 2005 |
Proceeds from strike price of value of options exercised | | $ | 918 | | $ | 2,511 | | $ | 643 |
Related tax benefit recognized | | | 182 | | | 293 | | | 139 |
| | | | | | | | | |
Proceeds of options exercised | | $ | 1,100 | | $ | 2,804 | | $ | 782 |
| | | | | | | | | |
Intrinsic value of options exercised | | $ | 520 | | $ | 838 | | $ | 397 |
| | | | | | | | | |
The following table provides information about options outstanding and exercisable options at December 31, 2007, 2006 and 2005:
| | | | | | | | | | | | | | | | | | |
| | | 2007 | | 2006 | | 2005 |
| | Options
Outstanding | | Exercisable
Options | | Options
Outstanding | | Exercisable
Options | | Options
Outstanding | | Exercisable
Options |
Number | | | 860,750 | | | 721,166 | | | 789,900 | | | 778,525 | | | 934,308 | | | 900,974 |
Weighted average exercise price | | $ | 18.52 | | $ | 17.83 | | $ | 17.66 | | $ | 17.58 | | $ | 17.44 | | $ | 17.42 |
Aggregate intrinsic value | | $ | 3,981,430 | | $ | 3,831,493 | | $ | 4,723,408 | | $ | 4,714,695 | | $ | 3,943,449 | | $ | 3,822,955 |
Weighted average contractual term | | | 6.1 | | | 5.4 | | | 6.3 | | | 6.3 | | | 6.9 | | | 6.9 |
The unamortized stock based compensation expense at December 31, 2007 is $649 thousand which will be recognized over the next 56 months.
40
14. EARNINGS PER SHARE
The calculation of basic earnings per share and diluted earnings per share is presented below. All weighted average shares, actual shares and per share information in the financial statements have been adjusted retroactively for the effect of stock dividends and splits. See Note 1 – Summary of Significant Accounting Policies: Earnings Per Common Share for a discussion on the calculation of earnings per share.
Earnings Per Share
| | | | | | | | | |
| (dollars in thousands, except per share data) | | Year Ended December 31, |
| | 2007 | | 2006 | | 2005 |
Numerator - Net income available to common shareholders | | $ | 13,600 | | $ | 12,716 | | $ | 11,350 |
| | | | | | | | | |
Denominator for basic earnings per share - Weighted average shares outstanding | | | 8,539,904 | | | 8,578,050 | | | 8,563,027 |
Effect of dilutive potential common shares | | | 93,638 | | | 113,579 | | | 101,200 |
| | | | | | | | | |
Denominator for diluted earnings per share - Adjusted weighted average shares outstanding | | | 8,633,542 | | | 8,691,629 | | | 8,664,227 |
| | | | | | | | | |
Basic earnings per share | | $ | 1.59 | | $ | 1.48 | | $ | 1.33 |
Diluted earnings per share | | $ | 1.58 | | $ | 1.46 | | $ | 1.31 |
Antidulitive shares excluded from computation of average dilutive earnings per share | | | 58,946 | | | 2,722 | | | 161,300 |
| | | | | | | | | |
15. OTHER OPERATING INCOME
Components of other operating income for the years ended December 31 include:
| | | | | | | | | |
| (dollars in thousands) | | 2007 | | 2006 | | 2005 |
Cash management | | $ | 689 | | $ | 542 | | $ | 476 |
Other | | | 612 | | | 591 | | | 656 |
Insurance commissions | | | 337 | | | 343 | | | 318 |
Safe deposit rental income | | | 328 | | | 330 | | | 339 |
Other investment income | | | 271 | | | 180 | | | — |
Interest rate floor income | | | 155 | | | — | | | — |
Rent | | | 126 | | | 244 | | | 306 |
Gain on sale of OREO | | | 110 | | | 22 | | | — |
Title insurance | | | 65 | | | 67 | | | 153 |
| | | | | | | | | |
Other operating income | | $ | 2,693 | | $ | 2,319 | | $ | 2,248 |
| | | | | | | | | |
16. OTHER OPERATING EXPENSE
Components of other operating expense for the years ended December 31 include:
| | | | | | | | | |
| (dollars in thousands) | | 2007 | | 2006 | | 2005 |
Other | | $ | 1,713 | | $ | 1,392 | | $ | 1,173 |
Temporary help & recruiting | | | 561 | | | 441 | | | 365 |
Loan processing and closing | | | 510 | | | 435 | | | 489 |
Computer processing | | | 504 | | | 450 | | | 463 |
Other taxes | | | 500 | | | 463 | | | 622 |
Travel and entertainment | | | 388 | | | 355 | | | 317 |
Postage | | | 342 | | | 287 | | | 300 |
Director fees | | | 339 | | | 307 | | | 239 |
Telephone | | | 291 | | | 281 | | | 302 |
Stationary & supplies | | | 248 | | | 221 | | | 295 |
Interest rate floor expense | | | — | | | 29 | | | — |
| | | | | | | | | |
Other operating expenses | | $ | 5,396 | | $ | 4,661 | | $ | 4,565 |
| | | | | | | | | |
17. RELATED PARTY TRANSACTIONS
In the ordinary course of business, the Bank granted loans to principal officers, directors and their affiliates. Loan activity during 2007 and 2006 was as follows:
Following is a summary of these transactions:
| | | | | | | | |
| (dollars in thousands) | | 2007 | | | 2006 | |
Balance, January 1 | | $ | 15,711 | | | $ | 19,070 | |
Additions | | | 10 | | | | 2,892 | |
Amounts collected | | | (3,967 | ) | | | (6,251 | ) |
| | | | | | | | |
Balance, December 31 | | $ | 11,754 | | | $ | 15,711 | |
| | | | | | | | |
Related party deposits amounted to $632 thousand and $467 thousand at December 31, 2007 and 2006, respectively.
18. FINANCIAL INSTRUMENTSWITH OFF-BALANCE SHEET RISKAND CONCENTRATIONOF CREDIT RISK
Off-Balance Sheet Risk
The Corporation is a party to financial instruments with off-balance sheet risk in the normal course of business to meet the financing needs of its customers. These financial instruments include commitments to extend credit and standby letters of credit. Those instruments involve, to varying degrees, elements of credit risk in excess of the amount recognized in the consolidated statements of financial condition. The contractual amounts of those instruments reflect the extent of involvement the Corporation has in particular classes of financial instruments.
The Corporation’s exposure to credit loss in the event of nonperformance by the counterparty to the financial instrument of commitments to extend credit and standby letters of credit is represented by the contractual amount of those instruments. The Corporation uses the same credit policies in making commitments and conditional obligations as it does for on-balance sheet financial instruments.
41
Commitments to extend credit are agreements to lend to a customer as long as there is no violation of any condition established in the agreement. Commitments generally have fixed expiration dates or other termination clauses and may require payment of a fee. Some of the commitments are expected to expire without being drawn upon, and the total commitment amounts do not necessarily represent future cash requirements. Total commitments to extend credit at December 31, 2007 were $323.0 million. The Corporation evaluates each customer’s creditworthiness on a case-by-case basis. The amount of collateral obtained, if deemed necessary by the Corporation upon extension of credit, is based on management’s credit evaluation of the counterparty. Collateral varies but may include accounts receivable, marketable securities, inventory, property, plant and equipment, residential real estate, and income-producing commercial properties.
Standby letters of credit are conditional commitments issued by the Bank to a customer for a third party. Such standby letters of credits are issued to support private borrowing arrangements. The credit risk involved in issuing standby letters of credit is similar to that involved in extending loan facilities to customers. The collateral varies, but may include accounts receivable, marketable securities, inventory, property, plant and equipment, and residential real estate for those commitments for which collateral is deemed necessary. The Corporation’s obligation under standby letters of credit as of December 31, 2007 amounted to $10.5 million. There were no outstanding bankers’ acceptances as of December 31, 2007.
Concentrations of Credit Risk
The Corporation has a material portion of its loans in real estate related loans. A predominant percentage of the Corporation’s real estate exposure, both commercial and residential, is in the Corporation’s primary trade area which includes portions of Delaware, Chester, Montgomery and Philadelphia counties in Southeastern Pennsylvania. Management is aware of this concentration and mitigates this risk to the extent possible in many ways, including the underwriting and assessment of borrower’s capacity to repay. See Note 3 – Loans and Leases for additional information.
At December 31, 2007 the total first lien interest only residential loans of $56.8 million included $47.6 million of adjustable rate loans that convert to principal and interest payments between five and ten years after inception and $9.2 million of fixed rate loans that continue as interest only loans until reaching maturity. At December 31, 2007 the balance sheet also includes $7.4 million one to four family residential loans secured by junior lien positions that are interest only loans. These fixed rate loans will remain as interest only loans until maturity.
As of December 31, 2007, the Corporation had no loans sold with recourse outstanding.
19. DIVIDEND RESTRICTIONS
The Bank is subject to the Pennsylvania Banking Code of 1965 (the “Code”), as amended, and is restricted in the amount of dividends that can be paid to its shareholder, the Corporation. The Code restricts the payment of dividends by the Bank to the amount of its retained earnings which was $82.3 million as of December 31, 2007. However, the amount of dividends paid by the Bank cannot reduce capital levels below levels that would cause the Bank to be less than adequately capitalized as detailed in Note 20 – Regulatory Capital Requirements.
20. REGULATORY CAPITAL REQUIREMENTS
Both the Corporation and the Bank are subject to various regulatory capital requirements, administered by the federal banking agencies. Failure to meet minimum capital requirements can initiate certain mandatory and possibly additional discretionary actions by regulators that, if taken, could have a direct material effect on the Corporation’s and the Bank’s financial statements. Under capital adequacy guidelines and the regulatory framework for prompt corrective action, the Corporation and the Bank must meet specific capital guidelines that involve quantitative measures of their assets, liabilities and certain off-balance-sheet items as calculated under regulatory accounting practices. The capital amounts and classifications are also subject to qualitative judgments by the regulators about components, risk weightings and other factors. Prompt corrective action provisions are not applicable to bank holding companies.
As set forth in the following table, quantitative measures have been established to ensure capital adequacy ratios required of both the Corporation and Bank. Both the Corporation’s and the Bank’s Tier II capital ratios are calculated by adding back a portion of the loan loss reserve to the Tier I capital. Management believes, as of December 31, 2007 and 2006, that the Corporation and the Bank have met all capital adequacy requirements to which they are subject. Federal banking regulators have defined specific capital categories, and categories range from a best of “well capitalized “to a worst of “critically under capitalized”. Both the Corporation and the Bank are classified as “well capitalized” as of December 31, 2007 and 2006.
See Note 11 – Pension and Post Retirement Benefit Plans for certain information relating to a reduction in capital and related regulatory capital impact.
42
The Corporation’s and the Bank’s actual capital amounts and ratios as of December 31, 2007 and 2006 are presented in the following table:
| | | | | | | | | | | | | | | | |
| (dollars in thousands) | | Actual | | | Minimum
to be
Adequately
Capitalized | | | Minimum
to be Well
Capitalized | |
| | Amount | | Ratio | | | Amount | | Ratio | | | Amount | | Ratio | |
December 31, 2007 | | | | | | | | | | | | | | | | |
Total (Tier II) Capital to Risk Weighted Assets: | | | | | | | | | | | | | | | | |
Corporation | | $ | 102,896 | | 11.31 | % | | 72,784 | | 8 | % | | 90,980 | | 10 | % |
Bank | | | 97,142 | | 10.72 | % | | 72,473 | | 8 | % | | 90,591 | | 10 | % |
Tier I Capital to Risk Weighted Assets: | | | | | | | | | | | | | | | | |
Corporation | | | 94,655 | | 10.40 | % | | 36,392 | | 4 | % | | 54,588 | | 6 | % |
Bank | | | 88,901 | | 9.81 | % | | 36,236 | | 4 | % | | 54,354 | | 6 | % |
Tier I Capital to Quarterly Average Assets: | | | | | | | | | | | | | | | | |
Corporation | | | 94,665 | | 10.42 | % | | 36,336 | | 4 | % | | 45,420 | | 5 | % |
Bank | | | 88,901 | | 9.83 | % | | 36,193 | | 4 | % | | 45,241 | | 5 | % |
| | | | | | |
December 31, 2006 | | | | | | | | | | | | | | | | |
Total (Tier II) Capital to Risk Weighted Assets: | | | | | | | | | | | | | | | | |
Corporation | | $ | 95,090 | | 12.42 | % | | 61,069 | | 8.0 | % | | 76,336 | | 10.0 | % |
Bank | | | 87,735 | | 11.56 | % | | 60,715 | | 8.0 | % | | 75,894 | | 10.0 | % |
Tier I Capital to Risk Weighted Assets: | | | | | | | | | | | | | | | | |
Corporation | | | 86,541 | | 11.34 | % | | 30,534 | | 4.0 | % | | 45,801 | | 6.0 | % |
Bank | | | 79,607 | | 10.49 | % | | 30,358 | | 4.0 | % | | 45,537 | | 6.0 | % |
Tier I Capital to Quarterly Average Assets: | | | | | | | | | | | | | | | | |
Corporation | | | 86,541 | | 11.01 | % | | 31,453 | | 4.0 | % | | 39,317 | | 5.0 | % |
Bank | | | 79,607 | | 10.16 | % | | 31,334 | | 4.0 | % | | 39,167 | | 5.0 | % |
21. SELECTED QUARTERLY FINANCIAL DATA (UNAUDITED)
| | | | | | | | | | | | |
| (dollars in thousands, except per share data) | | Quarters Ending 2007 |
| | 3/31 | | 6/30 | | 9/30 | | 12/31 |
Interest income | | $ | 12,521 | | $ | 13,250 | | $ | 14,147 | | $ | 14,300 |
Interest expense | | | 4,145 | | | 4,736 | | | 5,448 | | | 5,647 |
Net interest income | | | 8,376 | | | 8,514 | | | 8,699 | | | 8,653 |
Provision for loan and lease losses | | | 250 | | | 240 | | | — | | | 401 |
Income before income taxes | | | 5,837 | | | 4,585 | | | 5,090 | | | 4,661 |
| | | | | | | | | | | | |
Net income. | | $ | 3,976 | | $ | 3,091 | | $ | 3,455 | | $ | 3,078 |
| | | | | | | | | | | | |
Basic earnings per common share | | $ | 0.46 | | $ | 0.36 | | $ | 0.41 | | $ | 0.36 |
Diluted earnings per common share | | $ | 0.46 | | $ | 0.36 | | $ | 0.40 | | $ | 0.36 |
| |
| (dollars in thousands, except per share data) | | Quarters Ending 2006 |
| | 03/31 | | 6/30 | | 9/30 | | 12/31 |
Interest income | | $ | 10,345 | | $ | 11,098 | | $ | 12,017 | | $ | 12,446 |
Interest expense | | | 2,164 | | | 2,795 | | | 3,627 | | | 4,021 |
Net interest income | | | 8,181 | | | 8,303 | | | 8,390 | | | 8,425 |
Provision for loan losses | | | 154 | | | 209 | | | 258 | | | 211 |
Income before income taxes | | | 4,781 | | | 4,767 | | | 4,865 | | | 4,992 |
| | | | | | | | | | | | |
Net income | | $ | 3,136 | | $ | 3,137 | | $ | 3,235 | | $ | 3,208 |
| | | | | | | | | | | | |
Basic earnings per common share | | $ | .37 | | $ | .37 | | $ | .38 | | $ | .37 |
Diluted earnings per common share | | $ | .36 | | $ | .36 | | $ | .37 | | $ | .37 |
| * | Net income for the quarter ended March 31, 2007 includes an $866 thousand after tax gain ($1.3 million pre-tax) relating to the sale of real estate that previously served as the Corporation’s Wynnewood branch location. |
22. CONDENSED FINANCIAL STATEMENTS
The condensed financial statements of the Corporation (parent company only) as of December 31, 2007 and 2006, and for each of the three years in the period ended December 31 are as follows:
Condensed Balance Sheets
| | | | | | | | |
| (dollars in thousands) | | 2007 | | | 2006 | |
Assets: | | | | | | | | |
Cash | | $ | 2,331 | | | $ | 3,416 | |
Investments in subsidiaries, at equity in net assets | | | 84,597 | | | | 75,470 | |
Premises and equipment, net | | | 3,172 | | | | 3,270 | |
Other assets | | | 894 | | | | 975 | |
| | | | | | | | |
Total assets | | $ | 90,994 | | | $ | 83,131 | |
| | | | | | | | |
Liabilities and shareholders’ equity: | | | | | | | | |
Other liabilities | | $ | 643 | | | $ | 1,039 | |
| | | | | | | | |
Total liabilities | | | 643 | | | | 1,039 | |
| | | | | | | | |
Common stock, par value $1, authorized 100,000,000 and 25,000,000 shares as of December 31, 2007 and 2006, respectively, and issued 11,434,332 shares and 11,373,182 shares as of December 31, 2007 and 2006, respectively and outstanding 8,526,084 shares and 8,562,209 shares as of December 31, 2007 and 2006, respectively | | | 11,434 | | | | 11,373 | |
Paid-in capital in excess of par value | | | 11,698 | | | | 10,598 | |
Accumulated other comprehensive income, net of deferred income taxes | | | (4,304 | ) | | | (4,450 | ) |
Retained earnings | | | 101,146 | | | | 91,815 | |
Less common stock in treasury, at cost—2,908,248 shares and 2,810,973 shares as of December 31, 2007 and 2006 | | | (29,623 | ) | | | (27,244 | ) |
| | | | | | | | |
Total shareholders’ equity | | | 90,351 | | | | 82,092 | |
| | | | | | | | |
Total liabilities and shareholders’ equity | | $ | 90,994 | | | $ | 83,131 | |
| | | | | | | | |
Condensed Statements of Income
| | | | | | | | | | | |
| (dollars in thousands) | | 2007 | | | 2006 | | | 2005 |
Dividends from The Bryn Mawr Trust Company | | $ | 4,269 | | | $ | 3,948 | | | $ | 3,599 |
Interest and other income | | | 732 | | | | 701 | | | | 326 |
| | | | | | | | | | | |
Total operating income | | | 5,001 | | | | 4,649 | | | | 3,925 |
Expenses | | | 682 | | | | 527 | | | | 503 |
| | | | | | | | | | | |
Income before equity in undistributed income of subsidiaries | | | 4,319 | | | | 4,122 | | | | 3,422 |
Equity in undistributed income of subsidiaries | | | 9,298 | | | | 8,653 | | | | 7,868 |
| | | | | | | | | | | |
Income before income taxes | | | 13,617 | | | | 12,775 | | | | 11,290 |
Federal income tax (expense) benefit | | | (17 | ) | | | (59 | ) | | | 60 |
| | | | | | | | | | | |
Net income | | $ | 13,600 | | | $ | 12,716 | | | $ | 11,350 |
| | | | | | | | | | | |
43
Condensed Statements of Cash Flows
| | | | | | | | | | | | |
| (dollars in thousands) | | 2007 | | | 2006 | | | 2005 | |
Operating activities: | | | | | | | | | | | | |
Net Income | | $ | 13,600 | | | $ | 12,716 | | | $ | 11,350 | |
Adjustments to reconcile net income to net cash provided by operating activities: | | | | | | | | | | | | |
Equity in undistributed income of subsidiaries | | | (9,298 | ) | | | (8,653 | ) | | | (7,868 | ) |
Depreciation and amortization | | | 98 | | | | 98 | | | | 99 | |
Other, net | | | 83 | | | | (215 | ) | | | 590 | |
| | | | | | | | | | | | |
Net cash provided by operating activities | | | 4,483 | | | | 3,946 | | | | 4,171 | |
| | | | | | | | | | | | |
Investing Activities: | | | | | | | | | | | | |
Investment in Subsidiaries | | | 21 | | | | 885 | | | | 2,597 | |
| | | | | | | | | | | | |
Net cash provided by investing activities | | | 21 | | | | 885 | | | | 2,597 | |
| | | | | | | | | | | | |
Financing activities: | | | | | | | | | | | | |
Dividends paid | | | (4,269 | ) | | | (3,948 | ) | | | (3,599 | ) |
Repurchase of treasury stock | | | (2,420 | ) | | | (3,406 | ) | | | (1,990 | ) |
Proceeds from exercise of stock options | | | 1,100 | | | | 2,804 | | | | 782 | |
| | | | | | | | | | | | |
Net cash used by financing activities | | | (5,589 | ) | | | (4,550 | ) | | | (4,807 | ) |
| | | | | | | | | | | | |
Change in cash and cash equivalents | | | (1,085 | ) | | | 281 | | | | 1,961 | |
Cash and cash equivalents at beginning of year | | | 3,416 | | | | 3,135 | | | | 1,174 | |
| | | | | | | | | | | | |
Cash and cash equivalents at end of year | | $ | 2,331 | | | $ | 3,416 | | | $ | 3,135 | |
| | | | | | | | | | | | |
These statements should be read in conjunction with the Notes to the Consolidated Financial Statements.
23. SEGMENT INFORMATION
FAS No. 131 – “Segment Reporting” (“FAS 131”) identifies operating segments as components of an enterprise which are evaluated regularly by the Corporation’s Chief Executive Officer in deciding how to allocate resources and assess performance. The Corporation has applied the aggregation criterion set forth in FAS 131 to the results of its operations.
The Corporation’s Banking segment consists of commercial and retail banking. The Banking segment is evaluated as a single strategic unit which generates revenues from a variety of products and services. The Banking segment generates interest income from its lending (including leases) and investing activities and is dependent on the gathering of lower cost deposits from its branch network or borrowed funds from other sources for funding its loans, resulting in the generation of net interest income. The Banking segment also derives revenues from other sources including service charges on deposit accounts; cash sweep fees, overdraft fees, BOLI income and interchange revenue associated with its Visa Check Card offering.
The Wealth Management segment has responsibility for the following activities within the Corporation, including trust administration, other related fiduciary services, custody, investment management and advisory services, employee benefits and IRA administration, estate settlement, tax services and brokerage.
Wealth Management revenues include for the years ended December 31, 2007, 2006 and 2005, $580 thousand, $403 thousand and $221 thousand, respectively, of fees that will no longer be earned relating to one institutional client that was acquired by another financial institution in a business combination on November 16, 2007. Wealth assets under Management and Administration at December 31, 2006 and 2005 relating to this client were approximately $296.2 million and $412.4 million, respectively, and zero at December 31, 2007.
The Mortgage Banking segment includes the origination of residential mortgage loans and the sale and servicing of such loans to the secondary mortgage market. This segment also includes the Corporation’s title insurance and joint mortgage origination activity with a real estate brokerage organization.
The “All Other” segment includes activities and expenses that do not fit into the other three segments including general corporate activities such as shareholder relations costs, NASDAQ fees and the annual meeting of shareholders. This segment also includes revenues and expenses from the Corporation’s insurance agency activities and interest income from notes receivable which ceased in 2006
The accounting policies of the Corporation are applied by segment in the following tables. The segments are presented on a pre-tax basis which is the way management evaluates business results.
The Banking, Wealth Management and Mortgage Banking segments consolidate and roll-up through the Bank.
44
Segment information for the years ended December 31, 2007, 2006, and 2005 is as follows:
| | | | | | | | | | | | | | | | | | | | | | | | | | | | | | | | | | | | | | | | | | | | | | | | | | | | | | | | | | | | | | | | |
| | | 2007 | | | | | 2006 | | | | | 2005 | |
(dollars in
thousands) | | Banking | | | Wealth
Management | | | Mortgage
Banking | | | All
Other | | | Consolidated | | | | | Banking | | | Wealth
Management | | | Mortgage
Banking | | | All
Other | | | Consolidated | | | | | Banking | | | Wealth
Management | | | Mortgage
Banking | | | All
Other | | | Consolidated | |
Net interest income | | $ | 34,155 | | | $ | — | | | $ | 79 | | | $ | 8 | | | $ | 34,242 | | | | | $ | 33,108 | | | $ | — | | | $ | 111 | | | $ | 80 | | | $ | 33,299 | | | | | $ | 31,123 | | | $ | — | | | $ | 92 | | | $ | 93 | | | $ | 31,308 | |
Less loan loss provision | | | 891 | | | | — | | | | — | | | | — | | | | 891 | | | | | | 832 | | | | — | | | | — | | | | — | | | | 832 | | | | | | 762 | | | | — | | | | — | | | | — | | | | 762 | |
| | | | | | | | | | | | | | | | | | | | | | | | | | | | | | | | | | | | | | | | | | | | | | | | | | | | | | | | | | | | | | | | |
Net interest income after loan loss provision | | | 33,264 | | | | — | | | | 79 | | | | 8 | | | | 33,351 | | | | | | 32,376 | | | | — | | | | 111 | | | | 80 | | | | 32,467 | | | | | | 30,361 | | | | — | | | | 92 | | | | 93 | | | | 30,546 | |
| | | | | | | | | | | | | | | | | | | | | | | | | | | | | | | | | | | | | | | | | | | | | | | | | | | | | | | | | | | | | | | | |
Other income: | | | | | | | | | | | | | | | | | | | | | | | | | | | | | | | | | | | | | | | | | | | | | | | | | | | | | | | | | | | | | | | | |
Fees for investment management and trust services | | | — | | | | 13,502 | | | | — | | | | — | | | | 13,502 | | | | | | — | | | | 12,422 | | | | — | | | | — | | | | 12,422 | | | | | | — | | | | 11,539 | | | | — | | | | — | | | | 11,539 | |
Service charges on deposit accounts | | | 1,464 | | | | — | | | | — | | | | — | | | | 1,464 | | | | | | 1,540 | | | | — | | | | — | | | | — | | | | 1,540 | | | | | | 1,593 | | | | — | | | | — | | | | — | | | | 1,593 | |
Other fees and service charges | | | 137 | | | | — | | | | 978 | | | | — | | | | 1,115 | | | | | | 46 | | | | — | | | | 1,080 | | | | — | | | | 1,126 | | | | | | 50 | | | | — | | | | 1,253 | | | | — | | | | 1,303 | |
Net gain on sale of loans | | | — | | | | — | | | | 1,250 | | | | — | | | | 1,250 | | | | | | — | | | | — | | | | 954 | | | | — | | | | 954 | | | | | | — | | | | — | | | | 1,622 | | | | — | | | | 1,622 | |
Net gain on sale of real estate | | | 1,333 | | | | — | | | | — | | | | — | | | | 1,333 | | | | | | — | | | | — | | | | — | | | | — | | | | — | | | | | | — | | | | — | | | | — | | | | — | | | | — | |
Other operating income | | | 2,671 | | | | — | | | | 256 | | | | 190 | | | | 3,117 | | | | | | 1,880 | | | | — | | | | 208 | | | | 231 | | | | 2,319 | | | | | | 1,625 | | | | 3 | | | | 340 | | | | 280 | | | | 2,248 | |
| | | | | | | | | | | | | | | | | | | | | | | | | | | | | | | | | | | | | | | | | | | | | | | | | | | | | | | | | | | | | | | | |
Total other income | | | 5,605 | | | | 13,502 | | | | 2,484 | | | | 190 | | | | 21,781 | | | | | | 3,466 | | | | 12,422 | | | | 2,242 | | | | 231 | | | | 18,361 | | | | | | 3,268 | | | | 11,542 | | | | 3,215 | | | | 280 | | | | 18,305 | |
Other expenses: | | | | | | | | | | | | | | | | | | | | | | | | | | | | | | | | | | | | | | | | | | | | | | | | | | | | | | | | | | | | | | | | |
Salaries & wages | | | 11,242 | | | | 4,576 | | | | 1,003 | | | | 295 | | | | 17,116 | | | | | | 10,714 | | | | 4,129 | | | | 657 | | | | 254 | | | | 15,754 | | | | | | 10,885 | | | | 3,979 | | | | 781 | | | | 217 | | | | 15,862 | |
Fringe benefits | | | 3,515 | | | | 843 | | | | 148 | | | | 42 | | | | 4,548 | | | | | | 3,285 | | | | 836 | | | | 120 | | | | 46 | | | | 4,287 | | | | | | 3,041 | | | | 857 | | | | 129 | | | | 47 | | | | 4,075 | |
Occupancy & bank premises | | | 4,380 | | | | 551 | | | | 173 | | | | (164 | ) | | | 4,940 | | | | | | 3,827 | | | | 593 | | | | 168 | | | | (130 | ) | | | 4,458 | | | | | | 3,453 | | | | 641 | | | | 242 | | | | (123 | ) | | | 4,213 | |
Other operating expenses | | | 6,749 | | | | 1,049 | | | | 724 | | | | (167 | ) | | | 8,355 | | | | | | 5,517 | | | | 1,064 | | | | 630 | | | | (287 | ) | | | 6,924 | | | | | | 5,093 | | | | 1,082 | | | | 1,105 | | | | 144 | | | | 7,423 | |
| | | | | | | | | | | | | | | | | | | | | | | | | | | | | | | | | | | | | | | | | | | | | | | | | | | | | | | | | | | | | | | | |
Total other expenses | | | 25,886 | | | | 7,019 | | | | 2,048 | | | | 6 | | | | 34,959 | | | | | | 23,343 | | | | 6,622 | | | | 1,575 | | | | (117 | ) | | | 31,423 | | | | | | 22,472 | | | | 6,559 | | | | 2,257 | | | | 285 | | | | 31,573 | |
| | | | | | | | | | | | | | | | | | | | | | | | | | | | | | | | | | | | | | | | | | | | | | | | | | | | | | | | | | | | | | | | |
Segment profit (loss) | | | 12,983 | | | | 6,483 | | | | 515 | | | | 192 | | | | 20,173 | | | | | | 12,399 | | | | 5,800 | | | | 778 | | | | 428 | | | | 19,405 | | | | | | 11,157 | | | | 4,983 | | | | 1,050 | | | | 88 | | | | 17,278 | |
Intersegment (revenues) expenses | | | 618 | | | | 181 | | | | 40 | | | | (839 | ) | | | — | | | | | | 606 | | | | 181 | | | | 10 | | | | (797 | ) | | | — | | | | | | 201 | | | | 181 | | | | — | | | | (382 | ) | | | — | |
| | | | | | | | | | | | | | | | | | | | | | | | | | | | | | | | | | | | | | | | | | | | | | | | | | | | | | | | | | | | | | | | |
Pre-tax segment profit after eliminations | | $ | 13,601 | | | $ | 6,664 | | | $ | 555 | | | $ | (647 | ) | | $ | 20,173 | | | | | $ | 13,005 | | | $ | 5,981 | | | $ | 788 | | | $ | (369 | ) | | $ | 19,405 | | | | | $ | 11,358 | | | $ | 5,164 | | | $ | 1,050 | | | $ | (294 | ) | | $ | 17,278 | |
| | | | | | | | | | | | | | | | | | | | | | | | | | | | | | | | | | | | | | | | | | | | | | | | | | | | | | | | | | | | | | | | |
% of segment (loss) pre-tax profit (loss) after eliminations | | | 67.4 | % | | | 33.0 | % | | | 2.8 | % | | | (3.2 | )% | | | 100 | % | | | | | 67.0 | % | | | 30.8 | % | | | 4.1 | % | | | (1.9 | %) | | | 100 | % | | | | | 65.7 | % | | | 29.9 | % | | | 6.1 | % | | | (1.7 | )% | | | 100.0 | % |
Other Segment Data
| | | | | | | | | |
| (dollars in thousands) | | 2007 | | 2006 | | 2005 |
Wealth Management Segment: | | | | | | | | | |
Brokerage assets(1) | | $ | 85,338 | | $ | 76,309 | | $ | 91,189 |
Assets Under Management – other financial institution | | | — | | | 412,356 | | | 296,206 |
Assets Under Management and Administration – Wealth Division | | | 2,191,753 | | | 2,102,468 | | | 1,951,424 |
| | | | | | | | | |
Assets Under Management and Administration and Brokerage Assets | | $ | 2,277,091 | | $ | 2,591,133 | | $ | 2,338,819 |
(1) | Brokerage assets represent assets held at a registered broker dealer under a networking agreement. |
| | | | | | | | | |
Mortgage Banking Segment: | | | | | | | | | |
Mortgage Loans Serviced for Others | | $ | 357,363 | | $ | 382,141 | | $ | 417,649 |
Mortgage Servicing Rights | | $ | 2,820 | | $ | 2,883 | | $ | 2,982 |
Segment Assets: Substantially all of the assets of the Corporation and its’ subsidiaries are related to the Banking Segment and are reflected on the Consolidated Balance Sheet in these financial statements. Premises and equipment and other assets related to the Mortgage Banking and Wealth Management Segments are not meaningful and therefore are not presented.
24. SUBSEQUENT EVENT – PENSIONAND 401(K)PLANS
On February 12, 2008 the Corporation amended the QDBP to cease further accruals of benefits effective March 31, 2008 and to the amended 401(K) Plan to provide for a new class of immediately vested discretionary, non-matching employer contributions effective April 1, 2008. Additionally, the Corporation amended the SERP to expand the class of eligible participants to include certain officers of the Bank and to provide that each participant’s accrued benefit shall be reduced by the actuarially equivalent value of the immediately vested discretionary, non-matching employer contribution to the 401(K) Plan made on his or her behalf.
45
Price Range of Shares
BRYN MAWR BANK CORPORATION
(NASDAQ: BMTC)
| | | | | | | | | |
| | | High Bid | | Low Bid | | Dividend
Declared |
2007 HIGH-LOW QUOTATIONS | | | | | | | | | |
First Quarter | | $ | 24.88 | | $ | 22.75 | | $ | 0.12 |
Second Quarter | | | 25.21 | | | 22.00 | | | 0.12 |
Third Quarter | | | 24.98 | | | 21.00 | | | 0.13 |
Fourth Quarter | | | 23.23 | | | 20.50 | | | 0.13 |
| | | |
2006 HIGH-LOW QUOTATIONS | | | | | | | | | |
First Quarter | | $ | 22.05 | | $ | 20.75 | | $ | 0.11 |
Second Quarter | | | 25.26 | | | 20.85 | | | 0.11 |
Third Quarter | | | 22.55 | | | 21.60 | | | 0.12 |
Fourth Quarter | | | 24.37 | | | 21.75 | | | 0.12 |
The approximate number of registered holders of record of common stock as of December 31, 2007 was 301.
The shares are traded on the NASDAQ Global Market System under the symbol BMTC. The price information was obtained from NASDQ, IDC.
46
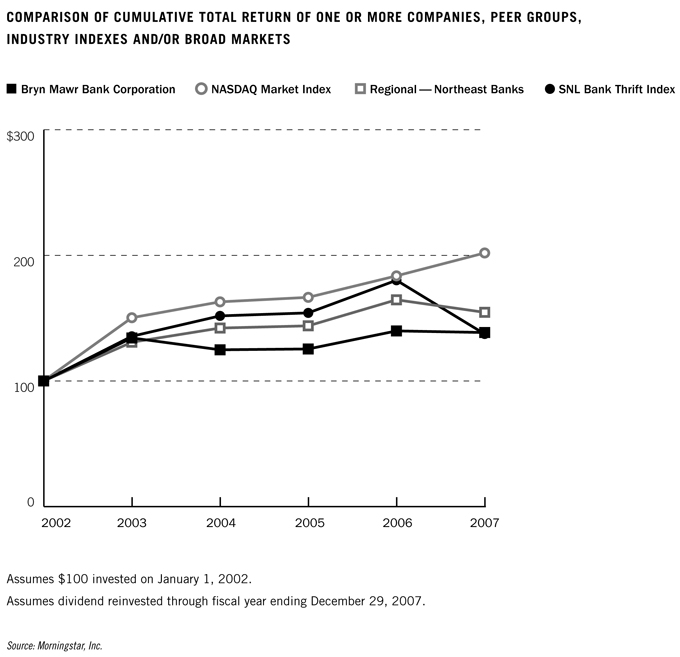
47