Exhibit 13.1


Investing for growth
Recent investments over the last several years have included:
| • | FEBRUARY 2012—Signed agreement to acquire Davidson Trust Company. |
| • | JUNE 2011—Renovated the Havertown office. |
| • | MAY 2011—Acquired the Private Wealth Management Group from Hershey Trust Company. |
| • | DECEMBER 2010—Lau Associates LLC and The Bryn Mawr Trust Company of Delaware move to Greenville, DE. |
| • | JULY 2010—Acquired First Keystone Financial, Inc. |
| • | DECEMBER 2009—Renovated the Paoli office. |
| • | MAY 2009—Established BMT Asset Management. |
| • | JANUARY 2009—Opened the West Chester Regional Banking Center. |
| • | NOVEMBER 2008—Established The Bryn Mawr Trust Company of Delaware in Wilmington, DE. |
| • | JULY 2008—Acquired Lau Associates LLC, Wilmington, DE. |
| • | JUNE 2008—Renovated the Wayne office. |
ANNUAL MEETING The Annual Meeting of Shareholders of Bryn Mawr Bank Corporation will be held at Saint Davids Golf Club, 845 Radnor Street Road, Wayne, PA 19087, on Wednesday, May 2, 2012, at 11:00 a.m.
STOCK LISTING Bryn Mawr Bank Corporation common stock is listed on the NASDAQ Global Select Market under the symbol BMTC.
FORM 10_K A copy of the Corporation’s Form 10-K, including financial statement schedules as filed with the Securities and Exchange Commission, is available on our website, www.bmtc.com, or upon written request to the Corporate Secretary, Bryn Mawr Bank Corporation, 801 Lancaster Avenue, Bryn Mawr, PA 19010.
EQUAL EMPLOYMENT OPPORTUNITY The Corporation continues its commitment to equal opportunity employment and does not discriminate with respect to recruitment, hiring, training, or promotion. It is the policy of the Corporation to comply voluntarily with the practices of Affirmative Action.
This discussion contains forward-looking statements. Please see the section entitled “Special Cautionary Notice Regarding Forward-Looking Statements” in the enclosed Annual Report to Shareholders, and the section entitled “Risk Factors” in the enclosed Form 10-K for discussions of the risks, uncertainties and assumptions associated with these statements.
Pictured on front cover and above: Wealth Management Hershey Division office located at One West Chocolate Avenue, Hershey, PA 17033.
| 2011 ANNUAL REPORT |
Consolidated financial highlights
CONSOLIDATED FINANCIAL HIGHLIGHTS
dollars in thousands, except per share data
| 2011 | 2010 | CHANGE | ||||||||||||||
| FOR THE YEAR | ||||||||||||||||
Net interest income | $ | 62,778 | $ | 52,150 | $ | 10,628 | 20.4 | % | ||||||||
Net interest income after loan and lease loss provision | 56,690 | 42,296 | 14,394 | 34.0 | % | |||||||||||
Non-interest income | 34,150 | 29,375 | 4,775 | 16.3 | % | |||||||||||
Non-interest expenses | 61,526 | 57,985 | 3,541 | 6.1 | % | |||||||||||
Income taxes | 9,601 | 4,512 | 5,089 | 112.8 | % | |||||||||||
Net income | 19,713 | 9,174 | 10,539 | 114.9 | % | |||||||||||
| AT YEAR—END | ||||||||||||||||
Total assets | $ | 1,774,907 | $ | 1,731,768 | $ | 43,139 | 2.5 | % | ||||||||
Total portfolio loans and leases | 1,295,392 | 1,196,717 | 98,675 | 8.2 | % | |||||||||||
Total deposits | 1,382,369 | 1,341,432 | 40,937 | 3.1 | % | |||||||||||
Shareholders’ equity | 185,913 | 161,418 | 24,495 | 15.2 | % | |||||||||||
Tangible common equity | 143,210 | 136,695 | 6,515 | 4.8 | % | |||||||||||
Wealth assets under management, administration, supervision and brokerage | 4,831,631 | 3,412,890 | 1,418,741 | 41.6 | % | |||||||||||
| PER COMMON SHARE | ||||||||||||||||
Basic earnings per common share | $ | 1.55 | $ | 0.85 | $ | 0.70 | 82.4 | % | ||||||||
Diluted earnings per common share | 1.54 | 0.85 | 0.69 | 81.2 | % | |||||||||||
Dividends declared | 0.60 | 0.56 | 0.04 | 7.1 | % | |||||||||||
Book value | 14.09 | 13.24 | 0.85 | 6.4 | % | |||||||||||
Closing price at year-end | 19.49 | 17.45 | 2.04 | 11.7 | % | |||||||||||
| SELECTED RATIOS | ||||||||||||||||
Return on average assets | 1.14 | % | 0.61 | % | ||||||||||||
Return on average shareholders’ equity | 11.08 | % | 6.76 | % | ||||||||||||
Tax equivalent net interest margin | 3.96 | % | 3.79 | % | ||||||||||||
Tangible common equity to tangible assets | 8.27 | % | 8.01 | % | ||||||||||||
1

Letter to shareholders
Dear Fellow Shareholders,
I am pleased to report that the Bryn Mawr Bank Corporation and our principal subsidiary, The Bryn Mawr Trust Company, had yet another excellent year and achieved record earnings in 2011.
Our total return to shareholders this past year, including dividends, was 15.1%, which followed the previous year’s total return of 19.4%. We are proud that our shareholders have benefited from the Bank’s strong results.
Here are some of the highlights:
| • | On May 27, 2011, we completed the acquisition of the Private Wealth Management Group of the Hershey Trust Company. This acquisition added $1.1 billion in wealth assets and over twenty top professionals to our existing Wealth Management Group. |
| • | In February 2012, we signed a definitive agreement to acquire Davidson Trust Company, which is located in Devon, Pennsylvania. Davidson is a nationally-known and respected trust and investment firm which will add approximately $1 billion of wealth assets to our growing Wealth Group. We hope to close this transaction during the second quarter of 2012. |
| • | Lau Associates, our family office subsidiary in Delaware, continued to grow its client base, revenue, and profitability. Headed by its founder, Judy Lau, the company is generally regarded as a premier financial planning, asset management, and intergenerational wealth transfer strategy firm for highly-affluent families on the East Coast. |
| • | As noted, we had record earnings of $19.7 million or $1.54 per diluted share. Our Board of Directors has shown their confidence in the future of the organization by increasing our quarterly dividend to 16 cents, an increase of 6.7%. |
| • | Despite the weak economy, our loan growth in 2011 was 8.2%, one of the larger increases of banks in our market. Our loan quality remains excellent with non-performing loans and leases being only 1.11% of the total portfolio. |
| • | Our Wealth Group saw its assets under management, administration, supervision and brokerage grow to over $4.8 billion during the past year. This increase of 41% was due not only to the Hershey acquisition, but was also the result of robust internal growth. We remain one of the nation’s preeminent wealth services providers. |

Although we were pleased with this past year, our focus is now on 2012 and beyond. Clearly, the economy is still recovering from the recession, and we expect unemployment to remain high and general growth in both our regional market and nationally to remain sluggish. Adding to this is an extremely low interest rate environment that squeezes the net interest margins of banks everywhere.
However, we believe that our focus on relationship-oriented banking and high-quality client service will continue to differentiate us from our competition. I can assure you that the Board of Directors and management are dedicated to enhancing shareholder value.
On a personal note, I’d like to mention that after 25 years of dedicated service, Ben Taylor will be retiring from the Boards of the Corporation and the Bank at this year’s Annual Meeting. He has always been an active and engaged director, chairing numerous Board committees during his tenure. We will miss Ben’s wise observations, as well as his quick wit. Bryn Mawr Trust is a much better bank for having had Ben as part of it for so long.
Should you have any questions or comments, please call me on my direct line 610-581-4800. Thank you for your support.
Sincerely,

Ted Peters
Chairman and Chief Executive Officer
3

“Bryn Mawr Bank Corporation Reports Strong
Second Quarter Earnings With Wealth Management Services
Revenue Up 30.2% From Same Period Last Year.”
— HEADLINE: SECOND QUARTER EARNINGS PRESS RELEASE ISSUED JULY 28, 2011
| 4 | 2011 ANNUAL REPORT |

Andrew G. Keefer, Senior Vice President, Investment Management; Lisa L. Piergallini, Senior Vice President, Senior Trust Officer.
Year in review
Positive momentum began in the first quarter of 2011 with excellent earnings. The strong performance continued and the Corporation ended the year with record-setting annual earnings! A total team effort, with all areas of the Corporation contributing, allowed us to achieve these results.
INVESTING IN OUR FUTURE—TWO ACQUISITIONS
On February 21, 2011, we announced that we had entered into a definitive agreement to acquire the Private Wealth Management Group (“PWMG”) of the Hershey Trust Company. On May 27, 2011, the transaction was completed and we added approximately $1.1 billion in wealth assets under management. This was a very smooth transaction and client retention has been excellent. These clients can now take advantage of the expanded products and services we offer. This acquisition brought us into a new and important market in Central Pennsylvania and we are very optimistic about growth opportunities.
We announced an agreement to acquire Davidson Trust Company, located in Devon, PA, on February 3, 2012. This acquisition, subject to regulatory approval, is expected to close in the second quarter of 2012, and we anticipate it will add approximately $1 billion in wealth assets under management.
OUR CORE BUSINESSES
Our lending group did a terrific job growing the loan portfolio during a very difficult time. Total portfolio loans and leases increased 8.2% during 2011. Growth was primarily in the commercial and residential mortgage categories, as well as the commercial and industrial categories. Some of our recently-hired commercial lenders had a particularly good year bringing new business clients and loans to the Bank. We have maintained a disciplined approach to loan underwriting and risk management.
The Wealth Management Division also had a very busy year, particularly as a result of the acquisition of PWMG. However, they did not allow acquisition activities to get in the way of generating new clients. Strategic new business development initiatives within the Division proved successful in generating large numbers of new client relationships. We have also been actively promoting our wealth management capabilities in a variety of media, including print, radio, outdoor, email and through a series of breakfast seminars. Our Wealth Management professionals are well known for their financial management expertise and they continue to be sought out by major news media for their expert opinions on a variety of financial topics. They have been seen on CNBC’sClosing Bell,Fox Business Network’sCountdown to Closing Bell, NBC 10 News, Bloomberg TV, and have been quoted inThe Wall Street Journal, The New York Times,
5


This page, clockwise from top left: Brian J. Maguire, Senior Vice President, Marketing; June M. Falcone, Senior Vice President, Operations; Stephen P. Novak, Senior Vice President, Retail Banking; Alison E. Gers, Executive Vice President, Retail Banking, Operations, IT and Marketing. Britton H. Murdoch, Lead Board Director; Geoffrey L. Halberstadt, Executive Vice President, Chief Credit Policy Officer and Corporate Secretary. Joseph G. Keefer, Executive Vice President and Chief Lending Officer; George M. Teplica, Senior Vice President, Director of Commercial Banking; James J. Egan, Senior Vice President, Director of Real Estate Finance. Page 7, from left: J. Duncan Smith, Executive Vice President and Chief Financial Officer, Marie D. Connolly, Senior Vice President, Comptrollers; Mame O. Skelly, Senior Vice President, Comptrollers; David M. Takats, Senior Vice President, Comptrollers. Gina V. Thompson, Fiduciary Specialist; Eric D. Thorne, Senior Vice President, Investment Advisor; Francis J . Leto, Executive Vice President, General Counsel, Wealth Management Division; Ellen T. Jordan, Senior Vice President, Financial Planner; Daniel F. Williams, Vice President, Fiduciary Services; Samuel O. McFall, Investment Officer, Investment Analyst.
Strength
Financial Advisor Magazine, Philadelphia Business Journaland Central Penn Business Journal,to name only a few.
The Retail Banking team was very successful growing client relationships, predominately in the new markets we entered as a result of the July 2010 acquisition of First Keystone Bank (“FKB”). We have been very pleased with the retention rates of the former FKB clients. Our staff has done a wonderful job welcoming these clients to the Bryn Mawr Trust family. In all markets, our team maintains a very active year-round schedule of activities to generate new client relationships. Their efforts have been fruitful, as evidenced by our greatly increased number of accounts and household relationships.
INVESTOR NEWS
Two additional investment analysts initiated coverage on Bryn Mawr Bank Corporation in 2011. Sandler O’Neil & Partners and Sterne Agee have joined Boenning & Scattergood, Guggenheim Partners, Keefe, Bruyette & Woods and Stifel Nicolaus to provide coverage on the Corporation.
In June 2011, we were notified that we had been ranked 115th, out of thousands of banks, inThe U.S. Banker’s annual ranking of the top community banks in the United States. The rankings are based on the financial institutions’ performance as compiled by SNL Financial LC.
BauerFinancial, an independent rating agency, awarded us their top 5-Star rating for financial strength, as of September 30, 2011. The 5-Star rating is only awarded to banks with superior performance.
On December 31, 2011,The Wall Street Journal reported that a team of
| 6 | 2011 ANNUAL REPORT |

“Bryn Mawr Bank Corporation Reports Strong Third Quarter With Net Income Of $5.0 Million And Year To Date Net Income
Of $14.5 Million.”
— HEADLINE: THIRD QUARTER EARNINGS PRESS RELEASE ISSUED OCTOBER 27, 2011
banking analysts at Keefe, Bruyette & Woods had recommended Bryn Mawr Bank Corporation as one of three highly-profitable bank stocks to buy in 2012.
On January 30, 2012, we announced a 6.7% increase in our quarterly dividend from the previous quarter. This marked the 76th consecutive quarterly dividend for our shareholders.
COMMUNITY GIVING, ACTIVITIES AND EVENTS
As a community bank, we are committed to supporting the communities we serve. In 2011, we continued our tradition of generously supporting a wide variety of charitable, educational, cultural, and civic organizations.
Through our participation in the Commonwealth of Pennsylvania’s Educational Improvement Tax Credit Program, which includes schools and educational improvement organizations, many worthwhile organizations received grants from Bryn Mawr Trust to support their scholarship programs.
The Pennsylvania Association of Community Bankers honored us this year by awarding us their Regional Community Service Award. We were honored to be recognized for our support of the Linda Kahley Ovarian Cancer Walk, which aids in the battle against ovarian cancer.
We are focused on helping to prevent clients and members of the community from becoming victims of identity theft. To help combat this very serious and growing problem, we held a series of free “shred events” that were open to the public, where personal or sensitive documents could be shredded by a secure document
destruction service. We received very positive feedback from this series of events and intend to continue them in 2012.
Bryn Mawr Trust is committed to making a positive difference in the communities we serve.
INVESTING IN OUR FRANCHISE
June marked the completion of major renovations at our Havertown branch with a ribbon cutting ceremony and a customer reception. The renovations were a dramatic improvement to the facility, and we have had many compliments from both clients and team members. The branch is located at 18 West Eagle Road, Havertown, Pennsylvania 19083. We invite you to visit the branch and say hello to the team.
FUTURE OPPORTUNITIES
We will continue to seek out new and profitable opportunities for growth in the future. New opportunities will be carefully evaluated, just as we have in the past, using a thoughtful, disciplined approach focused on risk management and profitability. Bryn Mawr Trust is fundamentally sound and has the flexibility and agility to respond to the opportunities afforded by our earnings, a strong capital base, stable asset quality, and available liquidity.
While management and the Board of Directors are pleased with our 2011 results, we won’t be content with past accomplishments, and have set our goals for 2012 even higher.
Bryn Mawr Trust
STRONG|STABLE| SECURE
7
Corporate Information
CORPORATE HEADQUARTERS
801 Lancaster Ave., Bryn Mawr, PA 19010 • 610-525-1700 • www.bmtc.com
DIRECTORS
Andrea F. Gilbert, President, Bryn Mawr Hospital
Donald S. Guthrie, Attorney at Law
Wendell F. Holland, Partner, Saul Ewing LLP
Scott M. Jenkins, President, S. M. Jenkins & Co.
Jerry L. Johnson, Principal Partner, Heffler, Radetich & Saitta, LLP
David E. Lees, Senior Partner, myCIO Wealth Partners, LLC
Francis J. Leto, Executive Vice President, General Counsel, Wealth Management Division
Britton H. Murdoch, CEO, City Line Motors; Managing Director, Strattech Partners
Frederick C. “Ted” Peters II, Chairman, President & Chief Executive Officer,
Bryn Mawr Bank Corporation and The Bryn Mawr Trust Company
B. Loyall Taylor, Jr., President, Taylor Gifts, Inc.
MARKET MAKERS
Boenning & Scattergood, Inc.
Credit Suisse Securities USA
Deutsche Bank Securities Inc.
Goldman, Sachs & Co.
Janney Montgomery Scott LLC
Keefe, Bruyette & Woods, Inc.
Morgan Stanley & Co., Inc.
Sandler O’Neill & Partners, LP
Sterne, Agee & Leach, Inc.
Stifel, Nicolaus & Co.
UBS Securities LLC
For a complete list, visit our website at www.bmtc.com
INDEPENDENT REGISTERED PUBLIC ACCOUNTING FIRM
KPMG LLP, 1601 Market Street, Philadelphia, PA 19103
LEGAL COUNSEL
McElroy, Deutsch, Mulvaney & Carpenter, LLP
One Penn Center at Suburban Station
1617 John F. Kennedy Boulevard, Suite 1500, Philadelphia, PA 19103
Stradley Ronon Stevens & Young, LLP
2005 Market Street, Suite 2600, Philadelphia, PA 19103-7098
BRYN MAWR BANK CORPORATION
Frederick C. “Ted” Peters II, Chairman, President &
Chief Executive Officer
Geoffrey L. Halberstadt, Corporate Secretary
J. Duncan Smith, CPA, Treasurer and Assistant Secretary
Francis J. Leto, Vice President, General Counsel
PRINCIPAL SUBSIDIARY
The Bryn Mawr Trust Company
Subsidiary of Bryn Mawr Bank Corporation
EXECUTIVE MANAGEMENT
Frederick C. “Ted” Peters II, Chairman, President & Chief Executive Officer
Alison E. Gers, Executive Vice President, Retail Banking, Central Sales, Marketing, Information Systems & Operations
Geoffrey L. Halberstadt, Executive Vice President, Chief Risk Officer and Corporate Secretary
Joseph G. Keefer, Executive Vice President and Chief Lending Officer
Francis J. Leto, Executive Vice President, General Counsel, Wealth Management Division
J. Duncan Smith, CPA, Executive Vice President and Chief Financial Officer
WEALTH MANAGEMENT DIVISION
10 South Bryn Mawr Avenue, Bryn Mawr, PA 19010
One West Chocolate Avenue, Hershey, PA 17033
LIFE CARE COMMUNITY OFFICES
Beaumont at Bryn Mawr Retirement Community, Bryn Mawr, PA
Bellingham Retirement Living, West Chester, PA
Martins Run Life Care Community, Media, PA
Rosemont Presbyterian Village, Rosemont, PA
The Quadrangle, Haverford, PA
Waverly Heights, Gladwyne, PA
White Horse Village, Newtown Square, PA
OTHER SUBSIDIARIES AND FINANCIAL SERVICES
BMT Leasing, Inc.
Subsidiary of The Bryn Mawr Trust Company, Bryn Mawr, PA
James A. Zelinskie, Jr., President
BMT Mortgage Company
Division of The Bryn Mawr Trust Company, Bryn Mawr, PA
Myron H. Headen, President
BMT Mortgage Services, Inc.
Subsidiary of The Bryn Mawr Trust Company, Bryn Mawr, PA
Myron H. Headen, President
BMT Settlement Services, Inc.
Subsidiary of The Bryn Mawr Trust Company, Bryn Mawr, PA
Myron H. Headen, President
The Bryn Mawr Trust Company of Delaware
Subsidiary of Bryn Mawr Bank Corporation, Greenville, DE Karen A. Fahrner, Esq., President
Insurance Counsellors of Bryn Mawr, Inc.
Subsidiary of The Bryn Mawr Trust Company, Bryn Mawr, PA
Thomas F. Drennan, President
Lau Associates LLC
Subsidiary of Bryn Mawr Bank Corporation, Greenville, DE Judith W. Lau, CFP®, President
REGISTRAR & TRANSFER AGENT
Computershare
PO Box 358015, Pittsburgh, PA 15252-8015 www.bnymellon.com/shareowner/equityaccess
INVESTOR RELATIONS
Aaron F. Strenkoski, Vice President
610-581-4822
| 8 | 2011 ANNUAL REPORT |


Selected Financial Data1
| For the years ended December 31, | 2011 | 2010 | 2009 | 2008 | 2007 | |||||||||||||||
| (dollars in thousands, except for per share data) | ||||||||||||||||||||
Interest income | $ | 74,439 | $ | 64,796 | $ | 56,892 | $ | 57,934 | $ | 54,218 | ||||||||||
Interest expense | 11,661 | 12,646 | 16,099 | 20,796 | 19,976 | |||||||||||||||
|
|
|
|
|
|
|
|
|
| |||||||||||
Net interest income | 62,778 | 52,150 | 40,793 | 37,138 | 34,242 | |||||||||||||||
Provision for loan and lease losses | 6,088 | 9,854 | 6,884 | 5,596 | 891 | |||||||||||||||
|
|
|
|
|
|
|
|
|
| |||||||||||
Net interest income after provision for loan and lease losses | 56,690 | 42,296 | 33,909 | 31,542 | 33,351 | |||||||||||||||
Non interest income | 34,150 | 29,375 | 28,470 | 21,472 | 21,781 | |||||||||||||||
Non-interest expense | 61,526 | 57,985 | 46,542 | 38,676 | 34,959 | |||||||||||||||
|
|
|
|
|
|
|
|
|
| |||||||||||
Income before income taxes | 29,314 | 13,686 | 15,837 | 14,338 | 20,173 | |||||||||||||||
Income taxes | 9,601 | 4,512 | 5,500 | 5,013 | 6,573 | |||||||||||||||
|
|
|
|
|
|
|
|
|
| |||||||||||
Net Income | $ | 19,713 | $ | 9,174 | $ | 10,337 | $ | 9,325 | $ | 13,600 | ||||||||||
|
|
|
|
|
|
|
|
|
| |||||||||||
Per share data: | ||||||||||||||||||||
Earnings per common share: | ||||||||||||||||||||
Basic | $ | 1.55 | $ | 0.85 | $ | 1.18 | $ | 1.09 | $ | 1.59 | ||||||||||
Diluted : | $ | 1.54 | $ | 0.85 | $ | 1.18 | $ | 1.08 | $ | 1.58 | ||||||||||
Dividends declared | $ | 0.60 | $ | 0.56 | $ | 0.56 | $ | 0.54 | $ | 0.50 | ||||||||||
Weighted-average shares outstanding | 12,746,346 | 10,765,657 |
| 8,732,004 |
| 8,566,938 | 8,539,904 | |||||||||||||
Dilutive potential common shares | 82,313 | 12,312 | 16,719 | 34,233 | 93,638 | |||||||||||||||
|
|
|
|
|
|
|
|
|
| |||||||||||
Adjusted weighted-average shares | 12,828,659 | 10,777,969 | 8,748,723 | 8,601,171 | 8,633,542 | |||||||||||||||
Selected financial ratios: | ||||||||||||||||||||
Tax equivalent net interest margin | 3.96 | % | 3.79 | % | 3.70 | % | 3.84 | % | 4.37 | % | ||||||||||
Net income/average total assets(“ROA”) | 1.14 | % | 0.61 | % | 0.88 | % | 0.89 | % | 1.59 | % | ||||||||||
Net income/average shareholders’ equity (“ROE”) | 11.08 | % | 6.76 | % | 10.55 | % | 10.01 | % | 15.87 | % | ||||||||||
Dividends declared per share to net income per basic common share | 38.7 | % | 65.9 | % | 47.5 | % | 49.5 | % | 31.4 | % | ||||||||||
Average equity/averege total assets | 10.27 | % | 9.02 | % | 8.34 | % | 8.89 | % | 10.02 | % | ||||||||||
Non-interest expense / net-interest income and non-interest income | 63.5 | % | 71.1 | % | 67.2 | % | 66.0 | % | 62.4 | % | ||||||||||
Non-interest income / net-interest income and non-interest income | 35.2 | % | 36.0 | % | 41.1 | % | 36.6 | % | 38.9 | % | ||||||||||
| At or for the year ended December 31, | 2011 | 2010 | 2009 | 2008 | 2007 | |||||||||||||||
Total assets | $ | 1,774,907 | $ | 1,731,768 | $ | 1,238,821 | $ | 1,151,346 | $ | 1,002,096 | ||||||||||
Earning assets | 1,626,666 | 1,597,130 | 1,164,617 | 1,061,139 | 874,661 | |||||||||||||||
Portfolio loans and leases | 1,295,392 | 1,196,717 | 885,739 | 899,577 | 802,925 | |||||||||||||||
Deposits | 1,382,369 | 1,341,432 | 937,887 | 869,490 | 849,528 | |||||||||||||||
Shareholders’ equity | 185,913 | 161,418 | 103,936 | 92,413 | 90,351 | |||||||||||||||
Wealth assets under management, administration, supervision and brokerage2 | 4,831,631 | 3,412,890 | 2,871,143 | 2,146,399 | 2,277,091 | |||||||||||||||
Ratio of tangible common equity to tangible assets | 8.27 | % | 8.01 | % | 7.51 | % | 7.13 | % | 9.02 | % | ||||||||||
Tier 1 Capital to Risk Weighted Assets | 11.26 | % | 11.30 | % | 9.41 | % | 8.81 | % | 10.40 | % | ||||||||||
Total Regulatory Capital to Risk Weighted Assets | 13.83 | % | 13.71 | % | 12.53 | % | 11.29 | % | 11.31 | % | ||||||||||
Loans serviced for others | 574,422 | 605,485 | 514,875 | 350,199 | 357,363 | |||||||||||||||
Book value per share | $ | 14.09 | $ | 13.24 | $ | 11.72 | $ | 10.76 | $ | 10.60 | ||||||||||
Tangible book value per share | $ | 10.82 | $ | 11.21 | $ | 10.40 | $ | 9.55 | $ | 10.60 | ||||||||||
Allowance as a percentage of portfolio loans and leases | 0.98 | % | 0.86 | % | 1.18 | % | 1.15 | % | 1.01 | % | ||||||||||
Non-performing loans and leases as a percentage of loans and leases | 1.11 | % | 0.79 | % | 0.78 | % | 0.65 | % | 0.25 | % | ||||||||||
| 1 | The comparability of the Selected Financial Data is impacted by the July 1, 2010 merger of First Keystone Financial, Inc. into Bryn Mawr Bank Corporation. |
| 2 | Excludes assets under management from an institutional client for 2007. |
1
Management’s Discussion and Analysis of Financial Condition and Results of Operations
BRIEF HISTORYOFTHE CORPORATION
The Bryn Mawr Trust Company (the “Bank”) received its Pennsylvania banking charter in 1889 and is a member of the Federal Reserve System. In 1986, Bryn Mawr Bank Corporation (the “Corporation”) was formed and on January 2, 1987, the Bank became a wholly-owned subsidiary of the Corporation. The Bank and Corporation are headquartered in Bryn Mawr, Pennsylvania, a western suburb of Philadelphia. The Corporation and its subsidiaries offer a full range of personal and business banking services, consumer and commercial loans, equipment leasing, mortgages, insurance and wealth management services, including investment management, trust and estate administration, retirement planning, custody services, and tax planning and preparation from 17 full-service branches and seven limited-hour, retirement community offices throughout Montgomery, Delaware and Chester counties of Pennsylvania. The common stock of the Corporation trades on the NASDAQ Stock Market (“NASDAQ”) under the symbol BMTC.
The goal of the Corporation is to become the preeminent community bank and wealth management organization in the Philadelphia area.
The Corporation operates in a highly competitive market area that includes local, national and regional banks as competitors along with savings banks, credit unions, insurance companies, trust companies, registered investment advisors and mutual fund families. The Corporation and its subsidiaries are regulated by many agencies including the Securities and Exchange Commission (“SEC”), NASDAQ, Federal Deposit Insurance Corporation (“FDIC”), the Federal Reserve and the Pennsylvania Department of Banking.
THE PRIVATE WEALTH MANAGEMENT GROUPOF THE HERSHEY TRUST COMPANY
On May 27, 2011, the acquisition of the Private Wealth Management Group (“PWMG”) of the Hershey Trust Company (“HTC”) by the Corporation (the “PWMG Acquisition” or the “Acquisition of PWMG”) was completed. The Acquisition of PWMG initially increased the Corporation’s Wealth Management Division assets under management by $1.1 billion.
FIRST KEYSTONE FINANCIAL, INC.
On July 1, 2010, the merger of First Keystone Financial, Inc. (“FKF”) with and into the Corporation (the “Merger with FKF” or the “FKF Merger”), and the two step merger of FKF’s wholly-owned subsidiary, First Keystone Bank (“FKB”) with and into the Bank, were completed.
The Merger with FKF, a federally chartered thrift institution with assets of approximately $480 million, enabled the Corporation to increase its regional footprint with the addition of eight full service branch locations, primarily in Delaware County, Pennsylvania. The geographic locations of the acquired branches were such that it was not necessary to close any of the former FKF branches. By expanding into these new areas within Delaware County, Pennsylvania, the Corporation will be able to extend its successful sales culture as well as offer its reputable wealth management products and other value-added services to a wider segment of the region’s population.
RESULTSOF OPERATIONS
The following is Management’s discussion and analysis of the significant changes in the results of operations, capital resources and liquidity presented in the accompanying consolidated financial statements. The Corporation’s consolidated financial condition and results of operations are comprised primarily of the Bank’s financial condition and results of operations. Current performance does not guarantee, and may not be indicative of, similar performance in the future. For more information on the factors that could affect performance, see “Special Cautionary Notice Regarding Forward Looking Statements” on page 24 of this Annual Report.
CRITICAL ACCOUNTING POLICIES, JUDGMENTSAND ESTIMATES
The accounting and reporting policies of the Corporation and its subsidiaries conform to U.S. generally accepted accounting principles (“GAAP”). All inter-company transactions are eliminated in consolidation and certain reclassifications are made when necessary in order to conform the previous years’ financial statements to the current year’s presentation. In preparing the consolidated financial statements, Management is required to make estimates and assumptions that affect the reported amount of assets and liabilities as of the dates of the balance sheets and revenues and expenditures for the periods presented. Therefore, actual results could differ from these estimates.
The allowance for loan and lease losses(the “Allowance”) involves a higher degree of judgment and complexity than other significant accounting policies. The allowance for loan and lease losses is calculated with the objective of maintaining a reserve level believed by the Corporation to be sufficient to absorb estimated probable credit losses. The Corporation’s determination of the adequacy of the allowance is based on periodic evaluations of the loan and lease portfolio and other
2
relevant factors. However, this evaluation is inherently subjective as it requires material estimates, including, among others, expected default probabilities, expected loan commitment usage, the amounts and timing of expected future cash flows on impaired loans and leases, value of collateral, estimated losses on consumer loans and residential mortgages and general amounts for historical loss experience. The process also considers economic conditions and inherent risks in the loan and lease portfolio. All of these factors may be susceptible to significant change. To the extent actual outcomes differ from the Corporation’s estimates, additional provision for loan and lease losses (the “Provision”) may be required that would adversely impact earnings in future periods. See the section of this document titled Asset Quality and Analysis of Credit Risk for additional information.
Other significant accounting policies are presented in Note 1 in the accompanying financial statements. The Corporation’s Summary of Significant Accounting Policies has not substantively changed any aspect of its overall approach in the application of the foregoing policies.
OVERVIEWOF GENERAL ECONOMIC, REGULATORYAND GOVERNMENTAL ENVIRONMENT
Throughout 2011 the economy remained anemic but stabilized, and there is continued optimism for recovery in 2012. Unemployment remained elevated throughout the year, however many corporations became more efficient and corporate earnings increased. The unemployment rate finished 2011 at 8.7%, down from 9.6% at the end of 2010, but many Americans believe our elected government officials can do more.
One of the top stories throughout 2011 was the continued distrust each political party had for each other, with the central story being the near shutdown of the U.S. government. As both political parties rushed to put their best foot forward, the U.S. hit its debt ceiling on May 16, 2011. The debt ceiling, a cap set by Congress on the amount of debt the federal government can legally accumulate, was not resolved until July 31, 2011. However, the lack of a true long-term plan and reduced spending by the U.S. government triggered the most volatile week in financial markets around the world since 2008. On August 5, 2011, Standard & Poor’s downgraded the credit rating of the U.S. government for the first time in the country’s history. Interestingly, although stock markets experienced a dramatic downswing, the yield on U.S. Treasury bonds actually fell because investors became more worried about the debt crisis in Europe and fled to the safety and liquidity of U.S. Treasuries.
The Euro zone Debt Crisis, beginning in early 2010, became relevant as government debt levels within the European region reached extremely high levels leaving many questioning whether some nations would be able to refinance their existing debt. Concerns intensified within the U.S. as many large
financial institutions had significant exposure to the European region and the fear of another financial crisis, like the one that occurred in 2008, was once again revived. As of this writing, with the establishment of the European Financial Stability Facility (EFSF), the second bailout package for Greece and further financial capitalization efforts by European leaders, the area remains somewhat stable, but continues to dominate the financial news.
One theme that continued from 2010 into 2011 and could still remain an issue going forward is the drop in real estate values negatively impacting residential home builders and development business nationwide. The U.S. Government did step in and revise the Home Affordable Refinance Program (“HARP”) which was originally created in 2009. The enhancements to the program were focused on helping enable homeowners who were not eligible to refinance, do so under HARP. The degree to which the program was effective is debatable. As refinancings increased, investors in mortgage-backed securities saw increases in prepayment speeds, which negatively impacted their bonds’ profitability and left them searching for other sources to replace the lost income. A low interest rate environment is a doubled-edged sword; a period of low interest rates allows consumers and businesses to refinance homes and other projects, thus freeing up cash and stimulating spending, yet financial institutions and other investors see their profitability decrease.
With 2012 being an election year, it will be difficult for the U.S. to gain much traction on many initiatives as each political party wants to ensure their best chance for election in November. As both parties struggle to agree on some of the most important issues facing all Americans, 2012 is not expected to be a year of dramatic change.
As of December 31, 2011, the Corporation and the Bank are “well capitalized” by regulatory standards and are in a position to acquire new customers from weaker financial institutions. A continued anemic economic recovery could have an adverse effect on the Corporation’s revenues, capital, liquidity and profitability. However, the Corporation is confident that its disciplined strategies to maintain a strong financial position and build the brand name should put it in a good position to weather the current financial climate and take advantage of opportunities as they arise.
Dodd-Frank Wall Street Reform and Consumer Protection Act
The Dodd-Frank Wall Street Reform and Consumer Protection Act (the “Act”) was signed into law on July 21, 2010. The federal statute promotes the financial stability of the U.S. with various measures, such as improving accountability and transparency in the financial system, ending “too big to fail,” and protecting consumers from abusive financial service practices. Included in the final regulations are the Volcker Rule, an amendment that prohibits depository banks from
3
proprietary trading in excess of 3% of their Tier 1 capital in private equity and hedge funds, and the Durbin Amendment, an amendment that gives the Federal Reserve the ability to regulate the interchange fees charged on debit cards, requiring that fees be reasonable as compared to the actual cost.
The Act also created the new Bureau of Consumer Financial Protection within the Federal Reserve Board as a new supervisor for certain financial firms and as a rule maker and enforcer against unfair, deceptive, abusive, other otherwise prohibited practices relating to most consumer financial products or services. The Act amends the Fair Credit Reporting Act to require the provision of credit scores to consumers in connection with denials or less favorable offers of credit and provides for improved financial disclosures, including mortgage disclosures under the Truth in Lending Act and the Real Estate Settlement Procedures Act. Also required within the Act are consumer financial laws and regulations that prevent mortgage-related abuses and ensure responsible, affordable mortgage credit.
This sweeping overhaul of the U.S. financial regulatory system has been a work in progress since it was signed into law, with the Durbin Amendment effective October 1, 2011 and the Volcker Rule still under review as of February 2012.
EXECUTIVEOVERVIEW
2011 Compared to 2010
In general, the differences in the results of operations for the twelve months ended December 31, 2011, as compared to the same period in 2010, are significantly impacted by the July 1, 2010 Merger with FKF and the May 27, 2011 Acquisition of PWMG. The Corporation reported net income of $19.7 million or $1.54 diluted earnings per share for the twelve months ended December 31, 2011, as compared to $9.2 million, or $0.85 diluted earnings per share, for the same period in 2010. Return on average equity (“ROE”) and return on average assets (“ROA”) for the twelve months ended December 31, 2011, were 11.08% and 1.14%, respectively, as compared to 6.76% and 0.61%, respectively, for the same period in 2010. The increase in net income and, in turn, ROE and ROA for the twelve months ended December 31, 2011, as compared to the same period in 2010, was primarily related to a $10.6 million increase in net interest income, a $4.8 million increase in non-interest income and a $3.8 million decrease in allowance for loan and lease losses. These improvements were partially offset by a $3.5 million increase in non-interest expense and a $5.1 million increase in income tax expense for the twelve months ended December 31, 2011, as compared to the same period in 2010
The $10.4 million, or 19.6% increase in the Corporation’s tax-equivalent net interest income for the twelve months ended December 31, 2011, as compared to the same period in 2010, was largely attributed to a $9.6 million, or 14.9%, increase in
interest income for the twelve months ended December 31, 2011, as compared to the same period in 2010 which was primarily the result of a $209.0 million increase in average portfolio loans between the periods. The Corporation’s tax-equivalent net interest margin increased to 3.96% for the twelve months ended December 31, 2011 from 3.79% for the same period in 2010.
Asset quality remained relatively stable as of December 31, 2011. The allowance for loan and lease losses of $12.8 million was 0.98% of portfolio loans and leases, as of December 31, 2011, as compared to $10.3 million, or 0.86% of portfolio loans and leases, at December 31, 2010.
For the twelve months ended December 31, 2011, the provision for loan and lease losses of $6.1 million was a decrease of $3.8 million, or 38.2%, from the $9.9 million for the same period in 2010. This decrease resulted from the $6.4 million, or 63.9%, decline in net loan charge-offs for the twelve months ended December 31, 2011, as compared to the same period in 2010. The decrease in net loan charge-offs was primarily related to the $6.7 million decrease in net charge-offs of commercial and industrial loans between the periods. Increases in non-performing loans, primarily related to two residential construction loan relationships which became non-performing during 2011, required additional Provision, partially offsetting the charge-off declines.
Total portfolio loans and leases of $1.30 billion at December 31, 2011 increased $98.7 million, or 8.2%, as compared to $1.20 billion at December 31, 2010. The loan growth was concentrated in the residential mortgage, commercial mortgage, and commercial and industrial loan segments of the portfolio.
The Corporation’s investment portfolio at December 31, 2011 had a fair market value of $272.3 million, as compared to $317.1 million at December 31, 2010, primarily related to maturities and calls during 2011. The cash inflows that resulted from this planned decrease were utilized for loan originations and repayments of maturing FHLB advances.
Deposits of $1.38 billion, as of December 31, 2011, increased $40.9 million from December 31, 2010. The 3.1% increase was the result of a $65.9 million increase in money market accounts and a $44.1 million increase in non-interest-bearing accounts, partially offset by planned decreases of $28.6 million in wholesale deposits and $36.3 million in time deposits between the respective dates.
Non-interest income for the twelve months ended December 31, 2011 was $34.2 million, an increase of $4.8 million, or 16.3%, as compared to the same period in 2010. Largely contributing to the increase in non-interest income for the twelve months ended December 31, 2011, as compared to the
4
same period in 2010, was a $6.2 million, or 39.8%, increase in fees for Wealth Management services. This increase was primarily attributable to the May 27, 2011 Acquisition of PWMG, which initially added $1.1 billion to the Corporation’s assets under management, administration, supervision and brokerage. Partially offsetting the increase in Wealth Management fees was a $2.2 million decrease in the gain on sale of residential mortgage loans for the twelve months ended December 31, 2011, as compared to the same period in 2010. During 2011, the Corporation experienced a decline in the volume of residential mortgage loan originations, as the refinancing boom of 2010 dropped off and did not continue into 2011. In addition, the Corporation elected to retain a larger portion of the originated residential loans in its portfolio.
Non-interest expense for the twelve months ended December 31, 2011, was $61.5 million, an increase of $3.5 million, or 6.1%, as compared to the same period in 2010. Contributing to this increase were a $4.2 million increase in salaries and benefits expenses, a $1.7 million increase in occupancy-related expenses, a $756 thousand increase in impairment of mortgage servicing rights, a $1.6 million increase in other operating expenses and a $1.0 million increase in intangible asset amortization. These increases were substantially offset by a $5.2 million decrease in due diligence and merger-related expenses.
2010 Compared to 2009
The primary cause of the changes in results of operations for the twelve months ended December 31, 2010, as compared to the same period in 2009 was the July 1, 2010 Merger with FKF.
The Corporation reported net income of $9.2 million or $0.85 diluted earnings per share for the twelve months ended December 31, 2010, as compared to $10.3 million, or $1.18 diluted earnings per share, for the same period in 2009. ROE and ROA for the twelve months ended December 31, 2010, were 6.76% and 0.61%, respectively, as compared to 10.55% and 0.88%, respectively, for the same period in 2009. Net income, ROE and ROA for the twelve months ended December 31, 2010, as compared to the same period in 2009, were reduced, primarily by the due diligence and merger-related expenses of $5.7 million and a $3.0 million increase in the Provision for the twelve months ended December 31, 2010, as compared to the same period in 2009. ROE was also affected by the registered direct stock offering, completed in May, 2010, which increased capital by $24.6 million.
The $11.6 million, or 28.1% increase in the Corporation’s tax-equivalent net interest income for the twelve months ended December 31, 2010, as compared to the same period in 2009, was attributed to a $3.5 million, or 21.4%, decrease in interest expense for the twelve months ended December 31, 2010, as compared to the same period in 2009. This decrease was
primarily the result of a 71 basis point decrease in the rate paid on deposits between the periods. The decrease was partially offset by a 44 basis point decline in interest-earning asset yield for the twelve months ended December 31, 2010, as compared to the same period in 2009. The Corporation’s tax-equivalent net interest margin increased from 3.70% for the twelve months ended December 31, 2009 to 3.79% for the same period in 2010.
Asset quality remained stable as of December 31, 2010. The allowance for loan and lease losses of $10.3 million was 0.86% of portfolio loans and leases, as of December 31, 2010, as compared to $10.4 million, or 1.18% of portfolio loans and leases, at December 31, 2009. The calculation of the Allowance, as a percentage of loans and leases in 2010, includes the acquired FKF loan portfolio which, in accordance with GAAP, was recorded at its fair value without its previously recorded Allowance.
For the twelve months ended December 31, 2010, the Provision increased to $9.9 million, an increase of $3.0 million, or 43.1%, from the $6.9 million for the same period in 2009. This increase is related to $7.7 million in write-downs during the twelve months ended December 31, 2010, of two commercial loan relationships to their expected net realizable values based on updated analyses of the collateral supporting the loans and certain new valuation information. Partially offsetting this increase was a $2.7 million decrease in net charge-offs in the lease portfolio, for the twelve months ended December 31, 2010, as compared to the same period in 2009.
Total portfolio loans and leases of $1.20 billion at December 31, 2010 increased $311.0 million, or 35.1%, as compared to $885.7 million at December 31, 2009. The growth was primarily attributable to the FKF Merger and new business development efforts. Partially offsetting this increase was a decrease in the Bank’s lease portfolio of $12.3 million from $47.7 million as of December 31, 2009 to $35.4 million as of December 31, 2010, as repayments and charge-offs exceeded new production.
The Corporation’s investment portfolio at December 31, 2010 had a fair market value of $317.1 million, as compared to $208.2 million at December 31, 2009. This increase of $108.8 million, or 52.3%, was primarily the result of the FKF Merger and the purchase of short-term securities, to utilize excess cash balances.
Deposits of $1.34 billion at December 31, 2010, increased $403.5 million, or 43.0%, from $937.9 million at December 31, 2009. This growth was largely due to the deposits acquired in the FKF Merger, in addition to continued strong branch activity, and the increase in balances of new accounts opened in previous quarters.
5
Non-interest income for the twelve months ended December 31, 2010 was $29.4 million, an increase of $905 thousand, or 3.2%, as compared to the same period in 2009. Contributing to the increase in non-interest income for the twelve months ended December 31, 2010, as compared to the same period in 2009, was a $239 thousand, or 17.2%, increase in loan servicing and late fees and a $356 thousand, or 18.2%, increase in service charges on deposits. These increases were largely attributable to the addition of the FKF branches during the third quarter of 2010. In addition to the effects of the FKF Merger, fees for Wealth Management services increased $1.3 million, or 9.3%, to $15.5 million for the twelve months ended December 31, 2010, from $14.2 million for the same period in 2009. Partially offsetting the increases in Wealth Management fees and other fee income was a $1.3 million decline in the gain on sale of mortgage loans for the twelve months ended December 31, 2010, as compared to the same period in 2009.
Non-interest expense for the twelve months ended December 31, 2010, was $58.0 million, an increase of $11.4 million, or 24.6%, as compared to the same period in 2009, partially due to the $5.7 million due diligence and merger-related expenses, as well as increased staffing and processing costs related to the addition of FKF’s eight full-service branch locations.
COMPONENTSOF NET INCOME
Net income is affected by five major elements:Net Interest Income, or the difference between interest income and loan fees earned on loans and investments and interest expense paid on deposits and borrowed funds;Provision For Loan and Lease Losses, or the amount added to the allowance for loan and lease losses to provide for estimated inherent losses on loans and leases;Non-Interest Income which is made up primarily of certain fees, wealth management revenue, residential mortgage activities and gains and losses from the sale of loans, securities and other assets;Non-Interest Expense, which consists primarily of salaries, employee benefits and other operating expenses; andIncome Taxes. Each of these major elements will be reviewed in more detail in the following discussion.
NET INTEREST INCOME
Rate/Volume Analyses (Tax-equivalent Basis)*
The rate volume analysis in the table below analyzes dollar changes in the components of interest income and interest expense as they relate to the change in balances (volume) and the change in interest rates (rate) of tax-equivalent net interest income for the years 2011 as compared to 2010 and 2010 as compared to 2009, allocated by rate and volume. The change in interest income / expense due to both volume and rate has been allocated to changes in volume.
| Year Ended December 31, | ||||||||||||||||||||||||
| (dollars in thousands) | 2011 Compared to 2010 | 2010 Compared to 2009 | ||||||||||||||||||||||
| increase/(decrease) | Volume | Rate | Total | Volume | Rate | Total | ||||||||||||||||||
Interest Income: | ||||||||||||||||||||||||
Interest-bearing | $ | (52 | ) | $ | (11 | ) | $ | (63 | ) | $ | 82 | $ | 22 | $ | 104 | |||||||||
Money market funds | (1 | ) | — | (1 | ) | (195 | ) | (1 | ) | (196 | ) | |||||||||||||
Federal funds sold | — | — | — | (1 | ) | — | (1 | ) | ||||||||||||||||
Investment securities | (336 | ) | (207 | ) | (543 | ) | 4,479 | (4,004 | ) | 475 | ||||||||||||||
Loans and leases | 10,244 | (269 | ) | 9,975 | 8,676 | (932 | ) | 7,744 | ||||||||||||||||
|
|
|
|
|
|
|
|
|
|
|
| |||||||||||||
Total interest income | 9,855 | (487 | ) | 9,368 | 13,041 | (4,915 | ) | 8,126 | ||||||||||||||||
|
|
|
|
|
|
|
|
|
|
|
| |||||||||||||
Interest expense: | ||||||||||||||||||||||||
Savings, NOW | 321 | (320 | ) | 1 | 1,413 | (1,550 | ) | (137 | ) | |||||||||||||||
Wholesale non-maturity deposits | 4 | (81 | ) | (77 | ) | 128 | 25 | 153 | ||||||||||||||||
Wholesale time deposits | (134 | ) | (196 | ) | (330 | ) | (1,125 | ) | (308 | ) | (1,433 | ) | ||||||||||||
Time deposits | 195 | (102 | ) | 93 | 288 | (2,740 | ) | (2,452 | ) | |||||||||||||||
Borrowed funds | (672 | ) | — | (672 | ) | 1,534 | (1,118 | ) | 416 | |||||||||||||||
|
|
|
|
|
|
|
|
|
|
|
| |||||||||||||
Total interest expense | (286 | ) | (699 | ) | (985 | ) | 2,238 | (5,691 | ) | (3,453 | ) | |||||||||||||
|
|
|
|
|
|
|
|
|
|
|
| |||||||||||||
Interest differential | $ | 10,141 | $ | 212 | $10,353 | $ | 10,803 | $ | 776 | $ | 11,579 | |||||||||||||
|
|
|
|
|
|
|
|
|
|
|
| |||||||||||||
| * | The tax rate used in the calculation of the tax-equivalent income is 35% |
6
Analysis of Interest Rates and Interest Differential
The table below presents the major asset and liability categories on an average daily basis for the periods presented, along with tax-equivalent interest income and expense and key rates and yields:
| For the Year Ended December 31, | ||||||||||||||||||||||||||||||||||||
| 2011 | 2010 | 2009 | ||||||||||||||||||||||||||||||||||
| (dollars in thousands) | Average Balance | Interest Income/ Expense | Average Rates Earned/ Paid | Average Balance | Interest Income/ Expense | Average Rates Earned/ Paid | Average Balance | Interest Income/ Expense | Average Rates Earned/ Paid | |||||||||||||||||||||||||||
Assets: | ||||||||||||||||||||||||||||||||||||
Interest-bearing deposits with banks | $ | 52,238 | $ | 115 | 0.22 | % | $ | 73,046 | $ | 178 | 0.24 | % | $ | 34,946 | $ | 74 | 0.21 | % | ||||||||||||||||||
Federal funds sold | — | — | — | — | — | — | 548 | 1 | 0.18 | % | ||||||||||||||||||||||||||
Money market funds | 152 | — | 0.05 | % | 475 | 1 | 0.21 | % | 38,662 | 197 | 0.51 | % | ||||||||||||||||||||||||
Investment securities: | ||||||||||||||||||||||||||||||||||||
Taxable | 280,343 | 4,787 | 1.71 | % | 249,714 | 4,555 | 1.82 | % | 129,780 | 4,398 | 3.39 | % | ||||||||||||||||||||||||
Tax –Exempt | 10,239 | 319 | 3.12 | % | 27,173 | 1,094 | 4.03 | % | 17,818 | 776 | 4.36 | % | ||||||||||||||||||||||||
|
|
|
|
|
|
|
|
|
|
|
| |||||||||||||||||||||||||
Total investment securities(3) | 290,582 | 5,106 | 1.76 | % | 276,887 | 5,649 | 2.04 | % | 147,598 | 5,174 | 3.51 | % | ||||||||||||||||||||||||
Loans and leases(1)(2) | 1,250,071 | 69,554 | 5.56 | % | 1,041,109 | 59,579 | 5.72 | % | 892,518 | 51,835 | 5.81 | % | ||||||||||||||||||||||||
|
|
|
|
|
|
|
|
|
|
|
| |||||||||||||||||||||||||
Total interest-earning assets | 1,593,043 | 74,775 | 4.69 | % | 1,391,517 | 65,407 | 4.70 | % | 1,114,272 | 57,281 | 5.14 | % | ||||||||||||||||||||||||
Cash and due from banks | 12,065 | 11,750 | 11,249 | |||||||||||||||||||||||||||||||||
Allowance for loan and lease losses | (11,397 | ) | (10,248 | ) | (10,421 | ) | ||||||||||||||||||||||||||||||
Other assets | 139,411 | 100,351 | 65,395 | |||||||||||||||||||||||||||||||||
|
|
|
|
|
| |||||||||||||||||||||||||||||||
Total assets | $ | 1,733,122 | $ | 1,493,370 | $ | 1,180,495 | ||||||||||||||||||||||||||||||
|
|
|
|
|
| |||||||||||||||||||||||||||||||
Liabilities: | ||||||||||||||||||||||||||||||||||||
Savings, NOW, and market rate accounts | $ | 722,850 | 2,958 | 0.41 | % | $ | 594,756 | 2,957 | 0.50 | % | $ | 408,523 | $ | 3,094 | 0.76 | % | ||||||||||||||||||||
Wholesale non-maturity deposits | 67,793 | 224 | 0.33 | % | 62,875 | 301 | 0.48 | % | 33,988 | 148 | 0.44 | % | ||||||||||||||||||||||||
Wholesale time deposits | 30,429 | 321 | 1.05 | % | 38,379 | 651 | 1.70 | % | 83,277 | 2,084 | 2.50 | % | ||||||||||||||||||||||||
Time deposits | 232,084 | 2,285 | 0.98 | % | 201,947 | 2,192 | 1.09 | % | 190,071 | 4,644 | 2.44 | % | ||||||||||||||||||||||||
|
|
|
|
|
|
|
|
|
|
|
| |||||||||||||||||||||||||
Total interest-bearing deposits | 1,053,156 | 5,788 | 0.55 | % | 897,957 | 6,101 | 0.68 | % | 715,859 | 9,970 | 1.39 | % | ||||||||||||||||||||||||
Subordinated debentures | 22,500 | 1,123 | 4.99 | % | 22,500 | 1,129 | 5.02 | % | 20,260 | 1,108 | 5.47 | % | ||||||||||||||||||||||||
Junior subordinated debentures | 11,580 | 1,049 | 9.06 | % | 6,076 | 494 | 8.13 | % | — | — | — | |||||||||||||||||||||||||
Short-term borrowings | 11,380 | 24 | 0.21 | % | 5,838 | 16 | 0.28 | % | 159 | 1 | 0.61 | % | ||||||||||||||||||||||||
FHLB advances and other borrowings | 145,421 | 3,677 | 2.53 | % | 177,882 | 4,906 | 2.76 | % | 151,228 | 5,020 | 3.32 | % | ||||||||||||||||||||||||
|
|
|
|
|
|
|
|
|
|
|
| |||||||||||||||||||||||||
Total interest-bearing liabilities | 1,244,037 | 11,661 | 0.94 | % | 1,110,253 | 12,646 | 1.14 | % | 887,506 | 16,099 | 1.81 | % | ||||||||||||||||||||||||
Non-interest-bearing deposits | 287,553 | 222,715 | 172,468 | |||||||||||||||||||||||||||||||||
Other liabilities | 23,573 | 24,601 | 22,502 | |||||||||||||||||||||||||||||||||
|
|
|
|
|
| |||||||||||||||||||||||||||||||
Total non-interest-bearing liabilities | 311,126 | 247,316 | 194,970 | |||||||||||||||||||||||||||||||||
|
|
|
|
|
| |||||||||||||||||||||||||||||||
Total liabilities | 1,555,163 | 1,357,569 | 1,082,476 | |||||||||||||||||||||||||||||||||
Shareholders’ equity | 177,959 | 135,801 | 98,019 | |||||||||||||||||||||||||||||||||
|
|
|
|
|
| |||||||||||||||||||||||||||||||
Total liabilities and shareholders’ equity | $ | 1,733,122 | $ | 1,493,370 | $ | 1,180,495 | ||||||||||||||||||||||||||||||
|
|
|
|
|
| |||||||||||||||||||||||||||||||
Net interest spread | 3.75 | % | 3.56 | % | 3.33 | % | ||||||||||||||||||||||||||||||
Effect of non-interest-bearing sources | 0.21 | % | 0.23 | % | 0.37 | % | ||||||||||||||||||||||||||||||
|
|
|
|
|
|
|
|
|
|
|
| |||||||||||||||||||||||||
Net interest income/margin on earning assets | $ | 63,114 | 3.96 | % | $ | 52,761 | 3.79 | % | $ | 41,182 | 3.70 | % | ||||||||||||||||||||||||
|
|
|
|
|
|
|
|
|
|
|
| |||||||||||||||||||||||||
Tax-equivalent adjustment (tax rate 35%) | $ | 336 | 0.02 | % | $ | 611 | 0.04 | % | $ | 389 | 0.04 | % | ||||||||||||||||||||||||
|
|
|
|
|
|
|
|
|
|
|
| |||||||||||||||||||||||||
| (1) | Non-accrual loans have been included in average loan balances, but interest on non-accrual loans has not been included for purposes of determining interest income. |
| (2) | Includes portfolio loans and leases and loans held for sale. |
| (3) | Investment securities include trading and available for sale. |
7
Tax-Equivalent Net Interest Income and Margin 2011 Compared to 2010
The tax-equivalent net interest margin increased 17 basis points to 3.96% for the twelve months ended December 31, 2011, as compared to 3.79%, for the same period in 2010.
Tax-equivalent net interest income for the twelve months ended December 31, 2011, of $63.1 million, was $10.4 million, or 19.6%, higher than the tax-equivalent net interest income of $52.8 million for the same period in 2010. This increase was primarily the result of the $201.5 million increase in average interest-earning assets for the twelve months ended December 31, 2011, as compared to the same period in 2010. The increase in average interest-earning assets was not only related to the assets acquired in the July 1, 2010 Merger with FKF, which were present for all of 2011, as opposed to only six months during 2010; it was also the result of the organic loan growth of $98.7 million which occurred during the twelve months ended December 31, 2011.
Partially offsetting the increase in interest-earning assets was the $133.8 million increase in average interest-bearing liabilities for the twelve months ended December 31, 2011, as compared to the same period in 2010. This increase was largely related to the deposits and other borrowings assumed in the FKF Merger. During the twelve months ended December 31, 2011, the balance of interest-bearing liabilities declined $24.7 million, as FHLB advances and other borrowings decreased by $12.3 million and the Corporation elected to prepay its $12.0 million of 9.7% junior subordinated debentures, which had been acquired in the Merger with FKF. The tax-equivalent average rate paid on interest-bearing liabilities for the twelve months ended December 31, 2011 was 0.94%, a decrease of 20 basis points from 1.14% for the same period in 2010. Largely contributing to this decrease was the 13 basis point decline in tax-equivalent rates paid on interest-bearing deposits, as lower-rate money market deposits and non-interest-bearing deposits replaced the scheduled run-off of higher-rate time and wholesale deposits.
Tax-Equivalent Net Interest Income and Margin 2010 Compared to 2009
The tax-equivalent net interest margin increased 9 basis points to 3.79% for the twelve months ended December 31, 2010, as compared to 3.70%, for the same period in 2009.
The tax-equivalent net interest income for the twelve months ended December 31, 2010, of $52.8 million, was $11.6 million, or 28.1%, higher than the tax-equivalent net interest income of $41.2 million for the same period in 2009. This increase was primarily driven by the effects of larger asset and liability balances resulting from the Merger with FKF as well
as a 71 basis point decrease in weighted average rate paid on deposits from 1.39% for the twelve months ended December 31, 2009 to 0.68% for the same period in 2010.
The tax-equivalent net interest income increased as a result of the $148.6 million, or 16.6%, increase in average loans and leases for the twelve month period ended December 31, 2010, as compared to the same period in 2009, primarily due to loans acquired in the FKF Merger as well as new business development initiatives. The yield on loans declined 9 basis points to 5.72% from 5.81% for the twelve months ended December 31, 2010, as compared to the same period in 2009. In addition, the average balance of investment securities grew by $129.3 million, or 87.6%, to $276.9 for the twelve months ended December 31, 2010 from the same period in 2009, primarily due to investments acquired in the FKF Merger, and, to a lesser extent, the investment of cash resulting from strong deposit inflows as well as cash acquired in the merger. The tax-equivalent yield on investment securities for the twelve months ended December 31, 2010 decreased 147 basis points to 2.04% from 3.51% for the same period in 2009, as more short-term liquid investments were purchased, replacing the higher-yielding investments that were called and the continued decline in interest rates.
Average interest-bearing liabilities increased $222.7 million, or 25.1%, to $1.1 billion during the twelve months ended December 31, 2010, as compared to $887.5 million for the same period in 2009. The rate paid on interest-bearing liabilities dropped 67 basis points to 1.14%, for the twelve months ended December 31, 2010 from 1.81%, for the same period in 2009. This was primarily due to the maturing of higher-rate wholesale deposits, the increase in lower-costing money market and savings account balances and reduced deposit rates.
Tax-Equivalent Net Interest Margin – Quarterly and Annual Comparison
The tax-equivalent net interest margin and related components, for the past five quarters and the past three years are shown in the table below:
| Year | Earning Asset Yield | Interest- Bearing Liability Cost | Net Interest Spread | Effect of Non- Interest- Bearing Sources | Net Interest Margin | |||||||||||||||||||
Tax-equivalent Net Interest Margin Last Five Quarters |
| |||||||||||||||||||||||
| 4th Quarter | 2011 | 4.59 | % | 0.88 | % | 3.71 | % | 0.20 | % | 3.91 | % | |||||||||||||
| 3rd Quarter | 2011 | 4.65 | % | 0.96 | % | 3.69 | % | 0.21 | % | 3.90 | % | |||||||||||||
| 2nd Quarter | 2011 | 4.78 | % | 0.98 | % | 3.80 | % | 0.21 | % | 4.01 | % | |||||||||||||
| 1st Quarter | 2011 | 4.76 | % | 0.93 | % | 3.83 | % | 0.20 | % | 4.03 | % | |||||||||||||
| 4th Quarter | 2010 | 4.56 | % | 1.04 | % | 3.52 | % | 0.21 | % | 3.73 | % | |||||||||||||
Tax-equivalent Net Interest Margin Last Three Years |
| |||||||||||||||||||||||
| 2011 | 4.69 | % | 0.94 | % | 3.75 | % | 0.21 | % | 3.96 | % | ||||||||||||||
| 2010 | 4.70 | % | 1.14 | % | 3.56 | % | 0.23 | % | 3.79 | % | ||||||||||||||
| 2009 | 5.14 | % | 1.81 | % | 3.33 | % | 0.37 | % | 3.70 | % | ||||||||||||||
8
Interest Rate Sensitivity
The Corporation actively manages its interest rate sensitivity position. The objectives of interest rate risk management are to control exposure of net interest income to risks associated with interest rate movements and to achieve sustainable growth in net interest income. The Corporation’s Asset Liability Committee (“ALCO”), using policies and procedures approved by the Corporation’s Board of Directors, is responsible for the management of the Corporation’s interest rate sensitivity position. The Corporation manages interest rate sensitivity by changing the mix, pricing and re-pricing characteristics of its assets and liabilities, through the management of its investment portfolio, its offerings of loan and selected deposit terms and through wholesale funding. Wholesale funding consists of multiple sources including borrowings from the FHLB, the Federal Reserve Bank of Philadelphia’s discount window, certificates of deposit from institutional brokers, Certificate of Deposit Account Registry Service (“CDARS”), Insured Network Deposit (“IND”) Program, Institutional Deposit Corporation (“IDC”) and Pennsylvania Local Government Investment Trust (“PLGIT”).
The Corporation uses several tools to manage its interest rate risk including interest rate sensitivity analysis, or Gap Analysis, market value of portfolio equity analysis, interest rate simulations under various rate scenarios and tax-equivalent net interest margin reports. The results of these reports are compared to limits established by the Corporation’s ALCO policies and appropriate adjustments are made if the results are outside the established limits.
The following table demonstrates the annualized result of an interest rate simulation and the estimated effect that a parallel interest rate shift, or “shock”, in the yield curve and subjective adjustments in deposit pricing, might have on the Corporation’s projected net interest income over the next 12 months.
This simulation assumes that there is no growth in interest-earning assets or interest-bearing liabilities over the next twelve months. The changes to net interest income shown below are in compliance with the Corporation’s policy guidelines.
Summary of Interest Rate Simulation
| $000,000 | $000,000 | |||||||
| December 31, 2011 | ||||||||
| (dollars in thousands) | Estimated Change In Net Interest Income Over Next 12 Months | |||||||
Change in Interest Rates | ||||||||
+300 basis points | $ | 5,855 | 8.76 | % | ||||
+200 basis points | $ | 4,167 | 6.23 | % | ||||
+100 basis points | $ | 1,622 | 2.43 | % | ||||
-100 basis points | $ | (1,278 | ) | (1.91 | )% | |||
The interest rate simulation above demonstrates that the Corporation’s balance sheet as of December 31, 2011 is asset sensitive, indicating that an increase in interest rates will have a positive impact on net interest income over the next 12 months while a decrease in interest rates will negatively impact net interest income. In the above simulation, net interest income will increase if rates increase 100, 200 or 300 basis points. Because the Corporation’s internal prime loan rate is set, as of December 31, 2011, at 3.99%, or 74 basis points above the Wall Street Journal Prime Rate of 3.25%, a 100 basis point increase in interest rates would have a less significant effect than it would had the Corporation not set this prime rate limit. The 100 basis point decrease scenario shows a $1.28 million, or 1.91%, decrease in net interest income over the next twelve months as many of the Corporation’s liabilities bear rates of interest below 1.00% and therefore would not be able to sustain the entire decrease. The four scenarios are directionally consistent with the December 31, 2010 simulation, but reflect a higher interest income increase and percentage change in net interest income due to the current rate environment.
The interest rate simulation is an estimate based on assumptions, which are based on past behavior of customers, along with expectations of future behavior relative to interest rate changes. In today’s uncertain economic environment and the current extended period of very low interest rates, the reliability of the Corporation’s interest rate simulation model is more uncertain than in other periods. Actual customer behavior may be significantly different than expected behavior, which could cause an unexpected outcome and may result in lower net interest income.
Gap Report
The interest sensitivity, or Gap report, identifies interest rate risk by showing repricing gaps in the Corporation’s balance sheet. All assets and liabilities are reflected based on behavioral sensitivity, which is usually the earliest of either: repricing, maturity, contractual amortization, prepayments or likely call dates. Non-maturity deposits, such as NOW, savings and money market accounts are spread over various time periods based on the expected sensitivity of these rates considering liquidity and the investment preferences of the Corporation. Non-rate-sensitive assets and liabilities are spread over time periods to reflect the Corporation’s view of the maturity of these funds.
Non-maturity deposits (demand deposits in particular), are recognized by the Bank’s regulatory agencies to have different sensitivities to interest rate environments. Consequently, it is an accepted practice to spread non-maturity deposits over defined time periods in order to capture that sensitivity. Commercial demand deposits are often in the form of compensating balances, and fluctuate inversely to the level of
9
interest rates; the maturity of these deposits is reported as having a shorter life than typical retail demand deposits. Additionally, the Bank’s regulatory agencies have suggested distribution limits for non-maturity deposits. However, the Corporation has taken a more conservative approach than these limits would suggest by forecasting these deposit types with a shorter maturity. The following table presents the Corporation’s Gap Analysis as of December 31, 2011:
(dollars in millions) | 0 to 90 | 91 to 365 | 1 - 5 | Over | Non- Rate | Total | ||||||||||||||||||
Assets: | ||||||||||||||||||||||||
Interest-bearing deposits with banks | $ | 57.3 | $ | — | $ | — | $ | — | $ | — | $ | 57.3 | ||||||||||||
Money market funds | 0.1 | — | — | — | — | 0.1 | ||||||||||||||||||
Investment securities | 65.4 | 83.6 | 102.5 | 20.8 | — | 272.3 | ||||||||||||||||||
Loans and leases(1) | 475.4 | 181.0 | 518.5 | 122.1 | — | 1,297.0 | ||||||||||||||||||
Allowance | — | — | — | — | (12.8 | ) | (12.8 | ) | ||||||||||||||||
Cash and due from banks | — | — | — | — | 11.8 | 11.8 | ||||||||||||||||||
Other assets | — | — | — | — | 149.2 | 149.2 | ||||||||||||||||||
|
|
|
|
|
|
|
|
|
|
|
| |||||||||||||
Total assets | $ | 598.2 | $ | 264.6 | $ | 621.0 | $ | 142.9 | $ | 148.2 | $ | 1,774.9 | ||||||||||||
|
|
|
|
|
|
|
|
|
|
|
| |||||||||||||
Liabilities and shareholders’ equity: | ||||||||||||||||||||||||
Demand, non-interest-bearing | $ | 62.8 | $ | 41.6 | $ | 222.0 | $ | — | $ | — | $ | 326.4 | ||||||||||||
Savings, NOW and market rate | 135.1 | 118.8 | 410.4 | 93.6 | — | 757.9 | ||||||||||||||||||
Time deposits | 48.9 | 106.1 | 54.3 | — | — | 209.3 | ||||||||||||||||||
Wholesale non-maturity deposits | 65.2 | — | — | — | — | 65.2 | ||||||||||||||||||
Wholesale time deposits | 17.4 | 0.8 | 5.4 | — | — | 23.6 | ||||||||||||||||||
Short-term borrowings | 12.9 | — | — | — | — | 12.9 | ||||||||||||||||||
Other borrowings | 25.3 | 24.5 | 77.0 | 21.0 | — | 147.8 | ||||||||||||||||||
Subordinated debentures | 22.5 | — | — | — | — | 22.5 | ||||||||||||||||||
Other liabilities | — | — | — | — | 23.4 | 23.4 | ||||||||||||||||||
Shareholders’ equity | 6.6 | 19.9 | 106.3 | 53.1 | — | 185.9 | ||||||||||||||||||
|
|
|
|
|
|
|
|
|
|
|
| |||||||||||||
Total liabilities andshareholders’ equity | $ | 396.7 | $ | 311.7 | $ | 875.4 | $ | 167.7 | $ | 23.4 | $ | 1,774.9 | ||||||||||||
|
|
|
|
|
|
|
|
|
|
|
| |||||||||||||
Interest-earning assets | $ | 598.2 | $ | 264.6 | $ | 621.0 | $ | 142.9 | $ | — | $ | 1,626.7 | ||||||||||||
Interest-bearing liabilities | 314.4 | 250.2 | 547.1 | 114.6 | — | 1,226.3 | ||||||||||||||||||
|
|
|
|
|
|
|
|
|
|
|
| |||||||||||||
Difference between interest-earning assets and interest-bearing liabilities | $ | 283.8 | $ | 14.4 | $ | 73.9 | $ | 28.3 | $ | — | $ | 400.4 | ||||||||||||
|
|
|
|
|
|
|
|
|
|
|
| |||||||||||||
Cumulative difference between interest earning assets and interest-bearing liabilities | $ | 283.8 | $ | 298.2 | $ | 372.1 | $ | 400.4 | $ | — | $ | 400.4 | ||||||||||||
|
|
|
|
|
|
|
|
|
|
|
| |||||||||||||
Cumulative earning assets as a % of cumulative interest bearing liabilities | 190 | % | 153 | % | 133 | % | 133 | % | ||||||||||||||||
| (1) | Loans include portfolio loans and leases and loans held for sale. |
The table above indicates that the Corporation is asset sensitive and should experience an increase in net interest income in the near term, if interest rates rise. Accordingly, if rates decline, net interest income should decline. Actual results may differ from expected results for many reasons including market reactions, competitor responses, customer behavior and/or regulatory actions.
10
The following table summarizes the maturities of certificates of deposit of $100,000 or greater at December 31, 2011:
| $000,000 | $000,000 | |||||||
| (dollars in thousands) | Non- Wholesale | Wholesale | ||||||
Three months or less | $ | 26,690 | $ | 16,956 | ||||
Three to six months | 20,332 | 346 | ||||||
Six to twelve months | 21,310 | 238 | ||||||
Greater than twelve months | 15,660 | 5,383 | ||||||
|
|
|
| |||||
Total | $ | 83,992 | $ | 22,923 | ||||
|
|
|
| |||||
Fair Value Adjustments Impacting the Statement of Income
The following table details the actual effect for the twelve month periods ended December 31, 2011 and 2010, and the projected effect for each of the five years ending December 31, 2016, and thereafter, of the accretable and amortizable fair value adjustments attributable to the FKF Merger, on net interest income, net non-interest income and pretax income. The projected accretion and amortization is subject to change in future periods related to, among other things, changes in the Corporation’s estimates of loan cash flows, investment sales and calls, deposit maturities, loan prepayments, and prepayments of FHLB advances.
| Income Statement Effect | For the Twelve Months Ended | For the Twelve Months Ending | ||||||||||||||||||||||||||||||||||
| Dec 31, 2010 | Dec 31, 2011 | Dec 31, 2012 | Dec 31, 2013 | Dec 31, 2014 | Dec 31, 2015 | Dec 31, 2016 | Thereafter | |||||||||||||||||||||||||||||
Interest income/expense: |
| |||||||||||||||||||||||||||||||||||
Loans | Income | $ | 657 | $ | 1,548 | $ | 1,419 | $ | 1,197 | $ | 1,067 | $ | 1,007 | $ | 906 | $ | 2,243 | |||||||||||||||||||
Investment securities | Expense | (554 | ) | (570 | ) | (630 | ) | (315 | ) | — | — | — | — | |||||||||||||||||||||||
Deposits | Income | 564 | 545 | 333 | 224 | 22 | — | — | — | |||||||||||||||||||||||||||
FHLB advances | Income | 1,450 | 552 | 442 | 142 | 125 | 125 | 121 | 130 | |||||||||||||||||||||||||||
Jr. subordinated debentures | Income | 78 | 55 | — | — | — | — | — | — | |||||||||||||||||||||||||||
|
|
|
|
|
|
|
|
|
|
|
|
|
|
|
| |||||||||||||||||||||
Net interest income |
| 2,195 | 2,130 | 1,564 | 1,248 | 1,214 | 1,132 | 1,027 | 2,373 | |||||||||||||||||||||||||||
Non-interest income/expense: | ||||||||||||||||||||||||||||||||||||
Premises and equipment | Expense | 46 | 93 | 93 | 93 | 93 | 93 | 93 | 1,474 | |||||||||||||||||||||||||||
Other liabilities | Income | — | — | (76 | ) | (39 | ) | — | — | — | — | |||||||||||||||||||||||||
|
|
|
|
|
|
|
|
|
|
|
|
|
|
|
| |||||||||||||||||||||
Net non-interest expense |
| 46 | 93 | 17 | 54 | 93 | 93 | 93 | 1,474 | |||||||||||||||||||||||||||
Pretax income effect |
| $ | 2,149 | $ | 2,037 | $ | 1,547 | $ | 1,194 | $ | 1,121 | $ | 1,039 | $ | 934 | $ | 899 | |||||||||||||||||||
|
|
|
|
|
|
|
|
|
|
|
|
|
|
|
| |||||||||||||||||||||
PROVISIONFOR LOANAND LEASE LOSSES
Loans acquired in the FKF Merger
In accordance with GAAP, the loans acquired from FKF were recorded at their fair value with no carryover of the previously associated allowance for loan loss.
In connection with the FKF Merger, certain loans were acquired which exhibited deteriorated credit quality since origination and for which the Bank does not expect to collect all contractual payments. Accounting for thesepurchased credit-impaired loans is done in accordance with ASC 310-30 “Accounting for Certain Loans or Debt Securities Acquired in a Transfer”. The loans were recorded at fair value, reflecting the present value of the amounts expected to be collected. Income recognition on these loans is based on a reasonable expectation about the timing and amount of cash
flows to be collected. Acquired loans deemed impaired and considered collateral dependent, with the timing of the sale of loan collateral indeterminate, remain on non-accrual status and have no accretable yield.
Management evaluates purchased credit-impaired loans individually for further impairment. The balance of the Bank’s loan and lease portfolio is evaluated on either an individual basis or on a collective basis for impairment. Refer to Notes 5-F and 5-H in the Notes to Consolidated Financial Statements for a more information regarding the Bank’s impaired loans and leases.
11
General Discussion of the Allowance for Loan and Lease Losses
The balance of the allowance for loan and lease losses is determined based on the Corporation’s review and evaluation of the loan and lease portfolio in relation to past loss experience, the size and composition of the portfolio, current economic events and conditions, and other pertinent factors, including the Corporation’s assumptions as to future delinquencies, recoveries and losses.
Increases to the Allowance are implemented through a corresponding provision (expense) in the Corporation’s statement of income. Loans and leases deemed uncollectible are charged against the Allowance. Recoveries of previously charged-off amounts are credited to the Allowance.
While the Corporation considers the Allowance to be adequate, based on information currently available, future additions to the Allowance may be necessary due to changes in economic conditions or the Corporation’s assumptions as to future delinquencies, recoveries and losses and the Corporation’s intent with regard to the disposition of loans. In addition, the Pennsylvania Department of Banking and the Federal Reserve Bank of Philadelphia, as an integral part of their examination process, periodically review the Corporation’s Allowance.
The Corporation’s Allowance is the combination of four components that are calculated based on various independent methodologies. All components of the Allowance are based on Management’s estimates. These estimates are summarized earlier in this document under the heading “Critical Accounting Policies, Judgments and Estimates.”
The four components of the Allowance are as follows:
| • | Specific Loan Evaluation Component – Includes the specific evaluation of larger classified loans |
| • | Historical Charge-Off Component – Applies a rolling, twelve quarter, historical charge-off rate to pools of non-classified loans |
| • | Additional Qualitative Factors Component – The loan and lease portfolios are broken down into multiple homogenous sub classifications, upon which multiple factors (such as delinquency trends, economic conditions, loan terms, credit grade, state of origination, industry, regulatory environment and other relevant information) are evaluated, resulting in an Allowance amount for each of the sub classifications. The sum of these amounts comprises the Additional Qualitative Factors Component. |
| • | Unallocated Component – This amount represents a reserve against all loans for factors not included in the components mentioned above. |
As part of the process of allocating the Allowance to the different segments of the loan and lease portfolio, Management considers certain credit quality indicators. For the commercial mortgage, construction and commercial and industrial loan segments, periodic reviews of the individual loans are performed by both in-house employees as well as an external loan review service. The results of these reviews are reflected in the risk grade assigned to each loan. These internally assigned grades are as follows:
| • | Pass – Loans considered to be satisfactory with no indications of deterioration. |
| • | Special mention—Loans classified as special mention have a potential weakness that deserves Management’s close attention. If left uncorrected, these potential weaknesses may result in deterioration of the repayment prospects for the loan or of the institution’s credit position at some future date. |
| • | Substandard—Loans classified as substandard are inadequately protected by the current net worth and payment capacity of the obligor or of the collateral pledged, if any. Substandard loans have a well-defined weakness or weaknesses that jeopardize the liquidation of the debt. They are characterized by the distinct possibility that the institution will sustain some loss if the deficiencies are not corrected. |
| • | Doubtful—Loans classified as doubtful have all the weaknesses inherent in those classified as substandard, with the added characteristic that the weaknesses make collection or liquidation in full, on the basis of currently existing facts, conditions, and values, highly questionable and improbable. Loan balances classified as doubtful have been reduced by partial charge-offs and are carried at their net realizable values. |
Consumer credit exposure, which includes residential mortgages, home equity lines and loans, leases and consumer loans, are assigned a credit risk profile based on payment activity (that is, their delinquency status).
Refer to Note 5-F in the Notes to Consolidated Financial Statements for details regarding credit quality indicators associated with the Bank’s loan and lease portfolio.
12
Portfolio Segmentation—The Corporation’s loan and lease portfolio is divided into specific segments of loans and leases having similar characteristics. These segments are as follows:
| • | Commercial mortgage |
| • | Home equity lines and loans |
| • | Residential mortgage |
| • | Construction |
| • | Commercial and industrial |
| • | Consumer |
| • | Leases |
Refer to Note 5 in the Notes to Consolidated Financial Statements for the details of the Corporation’s loan and lease portfolio, broken down by portfolio segment.
Impairment Measurement—In accordance with guidance provided by ASC 310-10, “Accounting by Creditors for Impairment of a Loan”, Management employs one of three methods to determine and measure impairment:
| • | the Present Value of Future Cash Flow Method; |
| • | the Fair Value of Collateral Method; |
| • | the Observable Market Price of a Loan Method. |
The majority of loans and leases are evaluated for impairment on a collective basis. However, loans and leases for which there is an indication that all contractual payments may not be collectible are evaluated for impairment on an individual basis. Loans that are evaluated on an individual basis include non-performing loans, TDRs and purchased credit-impaired loans.
Non-performing loans, for which the Corporation is unable to predict future cash flows, are evaluated for impairment based on the fair value of their underlying collateral. Performing loans are evaluated based on the present value of their estimated future cash flows.
Troubled Debt Restructurings (“TDRs”)—The Corporation follows guidance provided by ASC 310-40, “Troubled Debt Restructurings by Creditors.” A restructuring of a debt constitutes a TDR if the creditor, for economic or legal reasons related to the debtor’s financial difficulties grants a concession to the debtor that it would not otherwise consider in the normal course of business. A concession may include an extension of repayment terms which would not normally be granted, a reduction of interest rate or the forgiveness of principal and/or accrued interest. If the debtor is experiencing financial difficulty and the creditor has granted a concession, the Corporation will make the necessary disclosures related to the TDR. In certain cases, a modification may be made in an effort to retain a customer who is not experiencing financial difficulty. This type of modification is not considered to be a TDR. Once a loan or
lease has been modified and is considered a TDR, it is reported as an impaired loan or lease. If the loan or lease deemed a TDR has performed for at least six months at the level prescribed by the modification, it is not considered to be non-performing; however, it will generally continue to be reported as impaired. Loans and leases that have performed for at least six months are reported as TDRs in compliance with modified terms.
Refer to Notes 5-G in the Notes to Consolidated Financial Statements for more information regarding the Corporation’s TDRs.
Charge-off Policy—The Corporation’s charge-off policy is that, on a periodic basis, not less often than quarterly, delinquent and non-performing loans that exceed the following limits are considered for charge-off:
| • | Open-ended consumer loans exceeding 180 days past due. |
| • | Closed-ended consumer loans exceeding 120 days past due. |
| • | All commercial/business purpose loans exceeding 180 days past due. |
| • | All leases exceeding 120 days past due. |
Any other loan or lease, for which the Corporation has reason to believe collectibility is unlikely, and for which sufficient collateral does not exist, is also charged off.
Refer to Notes 5-F in the Notes to Consolidated Financial Statements for more information regarding the Corporation’s charge-offs.
Asset Quality and Analysis of Credit Risk
As of December 31, 2011, total non-performing loans and leases of $14.3 million represent 1.11% of portfolio loans and leases, as compared to 0.79%, or $9.5 million, at December 31, 2010. The $4.8 million increase in non-performing loans and leases is primarily related to two residential construction loan relationships that became non-performing during 2011, one of which is a $3.2 million participation loan, whose terms were modified during the fourth quarter of 2011 and is classified as a TDR. In addition, increases of $1.7 million and $613 thousand in non-performing home equity loans and lines and commercial and industrial loans, respectively, were partially offset by an $868 thousand decrease in non-performing commercial mortgage loans. Included in non-performing loans and leases, as of December 31, 2011, were $1.5 million of loans acquired in the FKF Merger which are non-performing.
The Provision for the twelve month periods ended December 31, 2011, 2010 and 2009 was $6.1 million, $9.9 million and $6.9 million, respectively. As of December 31, 2011, the Allowance of $12.8 million represents 0.98% of portfolio loans and leases, as compared to the Allowance, as
13
of December 31, 2009, of $10.3 million, which represented 0.86% of portfolio loans and leases as of that date. The increase in the Allowance, as a percentage of portfolio loans and leases, from December 31, 2010 to December 31, 2011, is reflective of the growth of the Corporation’s loan portfolio, the increase in nonperforming loans and leases, as well as Management’s analysis of qualitative factors affecting the loan portfolio.
As of December 31, 2011, the Corporation had other real estate owned (“OREO”) valued at $549 thousand, as compared to $2.5 million as of December 31, 2010. Included in the balance as of December 31, 2011, was one property valued at $184 thousand that resulted from the foreclosure of a loan acquired in the FKF Merger. All properties are recorded at their fair value less costs to sell.
As of December 31, 2011, the Corporation had $11.5 million of TDR’s, of which $7.2 million are in compliance with the modified terms, and hence, excluded from non-performing loans and leases. As of December 31, 2010, the Corporation had $6.6 million of TDRs, of which $4.7 million were in compliance with the modified terms. Largely contributing to the increase in TDRs was the addition of a $3.2 million residential construction loan participation that had been classified as non-performing since June 30, 2011, and which was modified during the fourth quarter of 2011.
Impaired loans and leases are those for which it is probable that the Corporation will not be able to collect all scheduled principal and interest payments in accordance with the original terms of the loans and leases. Included in impaired loans and leases are non-performing loans and leases and TDRs. Purchased credit-impaired loans are not included in impaired loan and lease totals. As of December 31, 2011, the Corporation had $20.0 million of impaired loans and leases, as compared to impaired loans and leases of $13.4 million as of December 31, 2010. Refer to Notes 5-H in the Notes to Consolidated Financial Statements for more information regarding the Corporation’s impaired loans and leases.
The Corporation continues to be diligent in its credit underwriting process and very proactive with its loan review process, including the services of an independent outside loan review firm, which helps identify developing credit issues. These proactive steps include the procurement of additional collateral (preferably outside the current loan structure) whenever possible and frequent contact with the borrower. Management believes that timely identification of credit issues and appropriate actions early in the process serve to mitigate overall losses.
The list below identifies certain key characteristics of the Corporation’s loan and lease portfolio. Refer to the loan and lease portfolio tables in Note 5 in the Notes to Consolidated Financial Statements for further details.
| • | Portfolio Loans and Leases—The Corporation’s $1.3 billion loan and lease portfolio is |
predominantly based in the Corporation’s traditional market areas of Chester, Delaware and Montgomery counties of Pennsylvania and in the greater Philadelphia area, none of which has experienced the real estate price appreciation and subsequent decline that many other areas of the country have experienced. However, this area is not immune from these tough economic times. The Corporation has observed a slow-down in new construction in the local area and some home value reductions, but this has not had a significant impact on the Corporation’s credit quality relative to the loan portfolio. |
| • | Concentrations—The Corporation has a significant portion of its portfolio loans (excluding leases) in real estate-related loans. As of December 31, 2011, loans secured by real estate were $986.4 million or 76.1% of the total loan portfolio of $1.30 billion. |
A predominant percentage of the Corporation’s real estate exposure, both commercial and residential, is within Pennsylvania. The Corporation is aware of this concentration and mitigates this risk to the extent possible in many ways, including the underwriting and assessment of the borrower’s capacity to repay, equity in the underlying real estate collateral and a review of a borrower’s global cash flows. The Corporation has recourse against a substantial portion of the loans in the real estate portfolio.
| • | Construction—The construction portfolio of $52.8 million accounts for 4.1% of the total loan and lease portfolio at December 31, 2011, an increase of $7.4 million from $45.4 million as of December 31, 2010. |
The Corporation’s construction portfolio, which consists of residential site development loans, commercial construction loans and loans for construction of individual homes, had a delinquency rate, as of December 31, 2011, of 9.18%, as compared to a delinquency rate of 4.25% as of December 31, 2010. The increase was largely related to two residential construction loan relationships that became non-performing during 2011. One of the two relationships was a $3.2 million loan participation which was also classified as a TDR during the fourth quarter of 2011.
| • | Residential Mortgages—Residential mortgage loans were $306.5 million as of December 31, 2011, an increase of $44.5 million from the $262.0 million at December 31, 2010. This increase is primarily attributable to the Corporation’s decision |
14
to retain in its portfolio, rather than sell to Fannie Mae, a larger portion of the residential mortgages originated during the twelve months ended December 31, 2011, than were retained during the same period in 2010. The residential mortgage portfolio had a delinquency rate of 1.38% as of December 31, 2011 as compared to 1.50% as of December 31, 2010. The Corporation believes it is well protected with its collateral position on this portfolio. The residential mortgage segment accounts for 23.7% of the total loan and lease portfolio as of December 31, 2011. |
| • | Commercial Mortgages—The performance in the $419.1 million commercial mortgage portfolio, representing 32.4% of the total loan and lease portfolio as of December 31, 2011 is stable. This segment of the Corporation’s loan and lease portfolio grew $33.5 million, or 8.7%, from December 31, 2010. The delinquency rate in the portfolio as of December 31, 2011 was 0.40% as compared to 0.58% as of December 31, 2010. The borrowers comprising this segment of the portfolio generally have strong, global cash flows which have remained stable in this tough economic environment. The Corporation continues to be able to attract quality borrowers in the commercial real estate space as other banks retreat due to credit issues. |
| • | Commercial and Industrial—The performance in the $267.2 million commercial and industrial portfolio, representing 20.6% of the total loan and lease portfolio at December 31, 2011, remains relatively stable with a delinquency rate of approximately 1.45%. This segment of the total loan and lease portfolio increased $27.9 million, or 11.7%, from December 31, 2010, and consists of loans to privately held institutions, family businesses, non-profit institutions and private banking relationships. While certain of these loans are collateralized by real estate, others are collateralized by non-real estate business assets, including accounts receivable and inventory. |
| • | Home Equity Loans and Lines of Credit—The home equity loans and lines of credit portfolio has decreased $8.9 million or 4.1% from $216.9 million at December 31, 2010 to $207.9 million at December 31, 2011, as borrowers are taking advantage of low interest rates to refinance variable-rate products into fixed rate mortgage loans. The delinquency level in the portfolio is 1.33% at December 31, 2011, as compared to 1.35% as of December 31, 2010. The segment represents 16.1% of the total loan and lease portfolio as of December 31, 2011, and is |
primarily originated through the Corporation’s branch network. |
| • | Consumer loans—The Corporation’s portfolio of consumer loans was $11.4 million as of December 31, 2011, a slight decrease of $771 thousand from the $12.2 million at December 31, 2010. The consumer portfolio had a delinquency rate of 0.32% as of December 31, 2011 as compared to 0.47% as of December 31, 2010. |
| • | Leasing—The lease portfolio balance as of December 31, 2011 of $30.4 million, declined $5.0 million from $35.4 million as of December 31, 2010, as repayments outpaced new originations. As of December 31, 2011, the lease portfolio made up 2.3% of the total loan and lease portfolio as compared to 3.0% as of December 31, 2010. |
The rate of growth within the leasing portfolio has been intentionally reduced by strengthening underwriting standards several years ago. These enhancements have continued to help reduce lease delinquencies from 2.0% at December 31, 2010 to 1.2% at December 31, 2011. In addition, these adjustments improved overall lease portfolio performance as net charge-offs declined each quarter since December 31, 2009. Net lease charge-offs were $487 thousand for the twelve months ended December 31, 2011, as compared to $1.7 million for the same period in 2010.
15
Non-Performing Assets, TDRs and Related Ratios As of or For the Twelve Months Ended December 31,
| 000,0000 | 000,0000 | 000,0000 | 000,0000 | 000,0000 | ||||||||||||||||
| (dollars in thousands) | 2011 | 2010 | 2009 | 2008 | 2007 | |||||||||||||||
Non-accrual loans and leases | $ | 14,315 | $ | 9,497 | $ | 6,246 | $ | 5,303 | $ | 747 | ||||||||||
Loans 90 days or more past due and still accruing | — | 10 | 668 | 504 | 1,263 | |||||||||||||||
|
|
|
|
|
|
|
|
|
| |||||||||||
Total non-performing loans and leases | 14,315 | 9,507 | 6,914 | 5,807 | 2,010 | |||||||||||||||
Other real estate owned | 549 | 2,527 | 1,025 | — | — | |||||||||||||||
|
|
|
|
|
|
|
|
|
| |||||||||||
Total non-performing assets | $ | 14,864 | $ | 12,034 | $ | 7,939 | $ | 5,807 | $ | 2,010 | ||||||||||
|
|
|
|
|
|
|
|
|
| |||||||||||
Troubled debt restructurings included in non-performing assets | $ | 4,300 | 1,879 | 2,274 | — | — | ||||||||||||||
TDRs in compliance with modified terms | 7,166 | 4,693 | 1,622 | — | — | |||||||||||||||
|
|
|
|
|
|
|
|
|
| |||||||||||
Total TDRs | $ | 11,466 | 6,572 | 3,896 | — | — | ||||||||||||||
|
|
|
|
|
|
|
|
|
| |||||||||||
Allowance for loan and lease losses to non-performing loans and leases | 89.1 | % | 108.1 | % | 150.8 | % | 177.9 | % | 404.1 | % | ||||||||||
Non-performing loans and leases to total loans and leases | 1.11 | % | 0.79 | % | 0.78 | % | 0.65 | % | 0.25 | % | ||||||||||
Allowance for loan losses to total portfolio loans and leases | 0.98 | % | 0.86 | % | 1.18 | % | 1.15 | % | 1.01 | % | ||||||||||
Non-performing assets to total assets | 0.84 | % | 0.69 | % | 0.64 | % | 0.50 | % | 0.20 | % | ||||||||||
Net loan and lease charge-offs/average loans and leases | 0.29 | % | 0.96 | % | 0.77 | % | 0.40 | % | 0.12 | % | ||||||||||
Net loan charge-offs/average loans | 0.26 | % | 0.83 | % | 0.29 | % | 0.00 | % | 0.05 | % | ||||||||||
Net lease charge-offs/average leases | 1.49 | % | 4.24 | % | 8.05 | % | 6.24 | % | 1.97 | % | ||||||||||
Period end portfolio loans and leases | $ | 1,295,392 | $ | 1,196,717 | $ | 885,739 | $ | 899,577 | $ | 802,925 | ||||||||||
Average portfolio loans and leases | $ | 1,250,071 | $ | 1,037,158 | $ | 882,956 | $ | 851,752 | $ | 740,694 | ||||||||||
Allowance for loan and lease losses | $ | 12,753 | $ | 10,275 | $ | 10,424 | $ | 10,332 | $ | 8,124 | ||||||||||
| Summary of Changes in the Allowance for Loan and Lease Losses | ||||||||||||||||||||
| (dollars in thousands) | 2011 | 2010 | 2009 | 2008 | 2007 | |||||||||||||||
Balance, January 1 | $ | 10,275 | $ | 10,424 | $ | 10,332 | $ | 8,124 | $ | 8,122 | ||||||||||
Charge-offs: | ||||||||||||||||||||
Consumer | (92 | ) | (456 | ) | (45 | ) | (72 | ) | (396 | ) | ||||||||||
Commercial and industrial | (633 | ) | (7,019 | ) | (1,933 | ) | (4 | ) | (41 | ) | ||||||||||
Real estate | (1,732 | ) | (689 | ) | (53 | ) | — | — | ||||||||||||
Construction | (1,174 | ) | (135 | ) | (382 | ) | — | — | ||||||||||||
Leases | (1,017 | ) | (2,395 | ) | (4,957 | ) | (3,540 | ) | (599 | ) | ||||||||||
|
|
|
|
|
|
|
|
|
| |||||||||||
Total charge-offs | (4,648 | ) | (10,694 | ) | (7,370 | ) | (3,616 | ) | (1,036 | ) | ||||||||||
Recoveries: | ||||||||||||||||||||
Consumer | 11 | 2 | 8 | 28 | 22 | |||||||||||||||
Commercial and industrial | 307 | — | — | — | 46 | |||||||||||||||
Real estate | 190 | 15 | 1 | 24 | 15 | |||||||||||||||
Leases | 530 | 674 | 569 | 176 | 64 | |||||||||||||||
|
|
|
|
|
|
|
|
|
| |||||||||||
Total Recoveries | 1,038 | 691 | 578 | 228 | 147 | |||||||||||||||
|
|
|
|
|
|
|
|
|
| |||||||||||
Net charge-offs | (3,610 | ) | (10,003 | ) | (6,792 | ) | (3,388 | ) | (889 | ) | ||||||||||
Provision for loan and lease losses | 6,088 | 9,854 | 6,884 | 5,596 | 891 | |||||||||||||||
|
|
|
|
|
|
|
|
|
| |||||||||||
Balance, December 31 | $ | 12,753 | $ | 10,275 | $ | 10,424 | $ | 10,332 | $ | 8,124 | ||||||||||
|
|
|
|
|
|
|
|
|
| |||||||||||
16
Allocation of Allowance for Loan and Lease Losses
The following table sets forth an allocation of the allowance for loan and lease losses by portfolio segment. The specific allocations in any particular portfolio segment may be changed in the future to reflect then-current conditions. Accordingly, the Corporation considers the entire allowance to be available to absorb losses in any portfolio segment.
| December 31, | ||||||||||||||||||||||||||||||||||||||||
| 2011 | 2010 | 2009 | 2008 | 2007 | ||||||||||||||||||||||||||||||||||||
| (dollars in thousands) | % Loans to Total Loans | % Loans to Total Loans | % Loans to Total Loans | % Loans to Total Loans | % Loans to Total Loans | |||||||||||||||||||||||||||||||||||
Balance at end of period applicable to: | ||||||||||||||||||||||||||||||||||||||||
Commercial and industrial | $ | 3,816 | 29.9 | % | $ | 3,565 | 20.0 | % | $ | 3,801 | 26.3 | % | $ | 3,093 | 26.3 | % | $ | 2,636 | 26.4 | % | ||||||||||||||||||||
Real estate – construction | 1,384 | 10.9 | 633 | 3.8 | 652 | 4.4 | 1,061 | 6.5 | 850 | 8.3 | ||||||||||||||||||||||||||||||
Real estate – mortgage | 6,464 | 50.7 | 4,940 | 72.2 | 3,952 | 62.5 | 4,154 | 59.7 | 3,727 | 58.7 | ||||||||||||||||||||||||||||||
Consumer | 119 | 0.9 | 115 | 1.0 | 125 | 1.4 | 70 | 0.9 | 62 | 1.0 | ||||||||||||||||||||||||||||||
Leases | 532 | 4.2 | 766 | 3.0 | 1,403 | 5.4 | 1,894 | 6.6 | 789 | 5.6 | ||||||||||||||||||||||||||||||
Unallocated | 438 | 3.4 | 256 | — | 491 | — | 60 | — | 60 | — | ||||||||||||||||||||||||||||||
|
|
|
|
|
|
|
|
|
|
|
|
|
|
|
|
|
|
|
| |||||||||||||||||||||
Total | $ | 12,753 | 100.0 | % | $ | 10,275 | 100.0 | % | $ | 10,424 | 100.0 | % | $ | 10,332 | 100.0 | % | $ | 8,124 | 100.0 | % | ||||||||||||||||||||
|
|
|
|
|
|
|
|
|
|
|
|
|
|
|
|
|
|
|
| |||||||||||||||||||||
——————————————
NON-INTEREST INCOME
2011 Compared to 2010
For the twelve months ended December 31, 2011, non-interest income was $34.2 million, an increase of $4.8 million, or 16.3% from the $29.4 million for the same period in 2010. The primary contributor to this increase was the $6.2 million, or 39.8%, increase in fees for wealth management services from $15.5 million for the twelve months ended December 31, 2010, to $21.7 million for the same period in 2011. Partially offsetting the increase in wealth management fees were decreases of $2.2 million and $689 thousand in the gain on sale of residential mortgage loans and the gain on sale of available for sale securities, respectively, between the two periods.
The increase in wealth management fees is directly related to the May 27, 2011 Acquisition of PWMG, which initially increased the Corporation’s wealth assets under management, administration, supervision and brokerage by $1.1 billion. Wealth assets under management, administration, supervision and brokerage increased $1.4 billion from $3.4 billion as of December 31, 2010 to $4.8 billion as of December 31, 2011.
The decrease in the gain on sale of residential mortgage loans was related to the volume of loan sales. The Corporation experienced a significant decrease in demand for residential mortgage loans following the refinancing boom that occurred in the second half of 2010. For the twelve months ended December 31, 2011, the Corporation sold $81.5 million of residential mortgage loans, as compared to $156.4 million for the same period in 2010.
The decrease in the gain on sale of available for sale investments is related to the types of investments sold. Available for sale investments sold during the twelve months ended December 31, 2010 consisted largely of municipal obligations which yielded larger gains than the mortgage-backed securities and bond mutual funds sold during 2011.
2010 Compared to 2009
For the twelve months ended December 31, 2010, non-interest income was $29.4 million, an increase of $905 thousand or 3.2% from the $28.5 million for the same period in 2009. The primary factors for this increase were the fees for wealth management services of $15.5 million, an increase of $1.3 million, or 9.3% as compared to $14.2 million for the same period in 2009. Gain on the sale of available for sale investment securities of $2.5 million for the twelve months ended December 31, 2010, was an increase of $549 thousand, or 29.6% from the $1.9 million for the same period in 2009. In addition, the $2.3 million of service charges on deposits for the twelve months ended December 31, 2010, which was a $356 thousand, or 18.3%, increase from the $2.0 million for the same period in 2009, also contributed to the increase. Partially offsetting these increases was a decrease in the gain on the sale of residential mortgage loans for the twelve months ended December 31, 2010 of $1.3 million, to $4.7 million, as compared to $6.0 million for the same period in 2009.
The increase in Wealth Management fees is directly related to the $541 million increase in wealth assets under management, administration, supervision and brokerage during 2010 to $3.4 billion, as of December 31, 2010, from $2.9 billion as of December 31, 2009. This increase was due largely to the success of new initiatives within the division and asset appreciation resulting from improvements in the financial markets.
The increase in the gain on sale of investments is the result of the Management’s decision to adjust the investment portfolio mix, while the increase in service charges on deposit accounts is largely due to the addition of the eight full-service branches acquired in the FKF Merger, along with other increased deposit activity. The decrease in the gain on sale of residential mortgage loans for the twelve months
17
ended December 31, 2010, as compared to the same period in 2009 was due to decreased origination activity in 2010 as compared to 2009 related to the rate environment, as well as Management’s decision to retain, in its portfolio, a larger portion of the residential mortgage loans originated during the twelve months ended December 31, 2010, rather than sell them to Fannie Mae, as compared to the same period in 2009. The value of mortgages originated for resale (servicing retained and servicing released) in 2010 of $157.6 million was 42.3% lower than the $273.0 million originated for resale in 2009.
NON-INTEREST EXPENSE
2011 Compared to 2010
Non-interest expense for the twelve months ended December 31, 2011 was $61.5 million, an increase of $3.5 million, or 6.1%, as compared to the same period in 2010. The increase was comprised of increases of $4.2 million and $1.7 million in salaries and employee benefits and occupancy-related expenses, respectively, which were related to the staffing increase and office space additions that resulted from both the FKF Merger and the PWMG Acquisition. In addition, the increase of $1.0 million in intangible asset amortization was directly related to the intangibles acquired from PWMG and FKF. The $1.6 million increase in other operating expense for the twelve months ended December 31, 2011, as compared to the same period in 2010 was related to the expanded branch network resulting from the FKF Merger and the PWMG Acquisition. Refer to in Note 21 in the Notes to Consolidated Financial Statements for further details regarding other operating expenses. These increases were substantially offset by the $5.2 million decrease in due diligence and merger-related expenses between the two periods.
2010 Compared to 2009
Non-interest expense for the twelve months ended December 31, 2010, was $58.0 million, an increase of $11.4 million, or 24.6%, as compared to the same period in 2009, partially due to the $5.7 million due diligence and merger-related expenses. Merger-related expenses consisted primarily of investment banking, legal, employee severance, systems conversion cost and vendor termination fees. In addition, salaries and wages for the twelve months ended December 31, 2010 increased $2.6 million, or 11.5%, as compared to the same period in 2009 due to the addition of FKF’s eight full-service branch locations. Increases in the other expense categories are a direct result of the FKF Merger. These include FDIC expense, occupancy, furniture, fixture and equipment and other operating expenses. FDIC expense increased $317 thousand or, 25.6%, to $1.6 million for the twelve months ended December 31, 2010, as compared to $1.2 million for the same period in 2009. Occupancy expense increased $620 thousand, or 17.0%, to $4.3 million for the twelve months ended December 31, 2010, as compared to $3.6 million for the same period in 2009. Furniture, fixture and equipment expenses increased $371 thousand, or 15.4%, to $2.8 million for the twelve months ended December 31, 2010, as compared to $2.4 million for the same period in
2009. Other operating expenses, which also increased as a result of increased processing costs due to the FKF Merger, are detailed in Note 21 in the Notes to Consolidated Financial Statements.
Secondary Market Sold-Loan Repurchase Demands
In the course of originating residential mortgage loans and selling those loans in the secondary market, the Corporation makes various representations and warranties to the purchasers of the mortgage loans. Each residential mortgage loan originated by the Corporation is evaluated by an automated underwriting application, which verifies the underwriting criteria and certifies the loan’s eligibility for sale to the secondary market. Any exceptions discovered during this process are remedied prior to sale. These representations and warranties also apply to underwriting the real estate appraisal opinion of value for the collateral securing these loans. Under the representations and warranties, failure by the Corporation to comply with the underwriting and appraisal standards could result in the Corporation’s being required to repurchase the mortgage loan or to reimburse the investor for losses incurred (make whole requests) if such failure cannot be cured by the Corporation within the specified period following discovery. For the twelve months ended December 31, 2011, the Corporation received a very limited number of investor repurchase demands and recorded a contingent liability, charged to other non-interest expense, related to those demands. During the twelve months ended December 31, 2010 and 2009, no repurchase demands were received.
INCOME TAXES
Income taxes for the twelve months ended December 31, 2011 were $9.6 million as compared to $4.5 million and $5.5 million for the same periods in 2010 and 2009, respectively. The effective tax rate for the twelve month periods ended December 31, 2011, 2010 and 2009 was 32.8%, 33.0% and 34.7%, respectively. The decrease in the effective tax rate for the twelve months ended December 31, 2011, as compared to the rate for the same period in 2010, was due to an increase in the level of tax-free income from bank owned life insurance, and a change in estimate of the deductibility of due diligence and merger-related expenses. The decrease in the effective tax rate for the twelve months ended December 31, 2010, as compared to the rate for the same period in 2009, was due to an increase in the level of tax-free income from municipal investment securities as well as an increase in tax-free income from bank owned life insurance and the utilization of a capital loss carry-forward.
18
BALANCE SHEET ANALYSIS
Asset Changes
Total assets as of December 31, 2011 increased slightly to $1.77 billion from $1.73 billion as of December 31, 2010. The increase was largely attributable to the $98.7 million increase in portfolio loans and leases and the $18.0 million increase in goodwill and intangibles between the two dates. Partially offsetting these increases were the $44.7 million and $20.3 million decreases in available for sale investment securities and cash and cash equivalents, respectively, between the two dates, as cash reserves along with runoff from the investment portfolio were utilized in loan originations and the repayment of maturing FHLB advances.
Investment Portfolio—The available for sale investment securities portfolio as of December 31, 2011 decreased $44.7 million or 14.1% to $272.3 million from $317.1 million as of December 31, 2010. This decrease in the portfolio was concentrated in the obligations of the U.S. government and agencies, which decreased by $52.1 million, obligations of state and political subdivisions, which decreased $23.9 million, and bond mutual funds, which decreased $22.8 million from December 31, 2010.
The following table details the maturity and weighted average yield (3) of the investment portfolio (2):
(dollars in thousands) | Maturing During 2012 | Maturing From 2013 Through 2016 | Maturing From 2017 Through 2021 | Maturing After 2021 | Total | |||||||||||||||
Obligations of the U.S. | ||||||||||||||||||||
Book value | $ | — | $ | 32,967 | $ | 45,448 | $ | 25,837 | $ | 104,252 | ||||||||||
Weighted average yield | 1.14 | % | 1.30 | % | 2.51 | % | 1.55 | % | ||||||||||||
State and political subdivisions3: | ||||||||||||||||||||
Book value | $ | — | $ | 5,052 | $ | 2,762 | $ | 396 | $ | 8,210 | ||||||||||
Weighted average yield | 1.41 | % | 2.33 | % | 3.20 | % | 1.80 | % | ||||||||||||
Corporate bonds: | ||||||||||||||||||||
Book value | $ | — | $ | 12,616 | $ | — | $ | — | $ | 12,616 | ||||||||||
Weighted average yield | 2.27 | % | 2.27 | % | ||||||||||||||||
Investment certificates of deposit: | ||||||||||||||||||||
Book value | $ | — | $ | 2,411 | $ | — | $ | — | $ | 2,411 | ||||||||||
Weighted average yield | 1.39 | % | 1.39 | % | ||||||||||||||||
Other investment securities: | ||||||||||||||||||||
Book value | $ | 900 | $ | 1,000 | $ | — | $ | — | $ | 1,900 | ||||||||||
Weighted average yield | 2.35 | % | 1.27 | % | 1.78 | % | ||||||||||||||
|
|
|
|
|
|
|
|
|
| |||||||||||
Subtotal book value | $ | 900 | $ | 54,046 | $ | 48,210 | $ | 26,233 | $ | 129,389 | ||||||||||
Weighted average yield | 2.35 | % | 1.44 | % | 1.36 | % | 2.52 | % | 1.64 | % | ||||||||||
Mortgage-related securities(1) | ||||||||||||||||||||
Book value | $ | — | $ | 3,216 | $ | 61,007 | $ | 63,908 | $ | 128,131 | ||||||||||
Weighted average yield | 3.25 | % | 2.33 | % | 1.92 | % | 2.15 | % | ||||||||||||
|
| �� |
|
|
|
|
|
|
| |||||||||||
Total book value | $ | 900 | $ | 57,262 | $ | 109,217 | $ | 90,141 | $ | 257,520 | ||||||||||
|
|
|
|
|
|
|
|
|
| |||||||||||
Weighted average yield | 2.36 | % | 1.54 | % | 1.90 | % | 2.09 | % | 1.89 | % | ||||||||||
| (1) | Mortgage-related securities are included in the above table based on their contractual maturity. However, mortgage-related securities, by design, have scheduled monthly principal payments which are not reflected in this table. |
| (2) | Excluded from the above table is the Corporation’s $12.1 million investment in bond mutual funds, which have no stated maturity or constant stated yield. |
| (3) | Weighted average yields on tax-exempt obligations have not been computed on a tax-equivalent basis. |
Portfolio Loans and Leases—The loan and lease portfolio, as of December 31, 2011 increased $98.7 million, or 8.2%, to $1.295 billion from $1.196 billion as of December 31, 2010. The increase was comprised of increases of $33.5 million, or 8.7%, in commercial mortgages, $44.5 million, or 17.0%, in residential mortgages, $27.9 million, or 11.7%, in commercial and industrial loans, and $7.4 million, or 16.4%, in construction loans, partially offset by decreases of $8.9 million, or 4.1%, in home equity loans and lines of credit and $5.0 million, or 14.1%, in leases. As of December 31, 2011, the lease portfolio was 2.3% of total loans and leases, as compared to 3.0% as of December 31, 2010. Within the leasing portfolio, by continuing to adhere to the higher credit standards and other underwriting changes instituted in 2008, the outstanding balance of leases declined, with repayments continuing to outpace originations.
The table below details the loan portfolio as of the dates indicated:
| December 31, | ||||||||||||||||||||
(dollars in thousands) | 2011 | 2010 | 2009 | 2008 | 2007 | |||||||||||||||
Commercial mortgage | $ | 419,130 | $ | 385,615 | $ | 265,023 | $ | 249,730 | $ | 224,510 | ||||||||||
Home equity lines & loans | 207,917 | 216,853 | 177,863 | 154,576 | 123,293 | |||||||||||||||
Residential mortgage | 306,478 | 261,983 | 110,653 | 132,536 | 121,313 | |||||||||||||||
Construction | 52,844 | 45,403 | 38,444 | 58,446 | 66,901 | |||||||||||||||
Commercial & industrial | 267,204 | 239,266 | 233,288 | 236,469 | 213,834 | |||||||||||||||
Consumer | 11,429 | 12,200 | 12,717 | 8,518 | 7,990 | |||||||||||||||
Leases | 30,390 | 35,397 | 47,751 | 59,302 | 45,084 | |||||||||||||||
|
|
|
|
|
|
|
|
|
| |||||||||||
Total portfolio loans and leases | 1,295,392 | 1,196,717 | 885,739 | 899,577 | 802,925 | |||||||||||||||
|
|
|
|
|
|
|
|
|
| |||||||||||
Loans held for sale | 1,588 | 4,838 | 3,007 | 3,024 | 5,125 | |||||||||||||||
|
|
|
|
|
|
|
|
|
| |||||||||||
| $ | 1,296,980 | $ | 1,201,555 | $ | 888,746 | $ | 902,601 | $ | 808,050 | |||||||||||
|
|
|
|
|
|
|
|
|
| |||||||||||
| 19 |
The following table summarizes the loan maturity distribution and interest rate sensitivity as of December 31, 2011. Excluded from the table are residential mortgage, home equity lines and loans and consumer loans:
| (dollars in thousands) | Maturing During 2012 | Maturing From 2013 Through 2016 | Maturing After 2016 | Total | ||||||||||||
Loan portfolio maturity: | ||||||||||||||||
Commercial and industrial | $ | 112,774 | $ | 110,287 | $ | 44,143 | $ | 267,204 | ||||||||
Construction | 34,892 | 17,557 | 395 | 52,844 | ||||||||||||
Commercial mortgage | 12,492 | 187,551 | 219,087 | 419,130 | ||||||||||||
Leases | 3,464 | 26,891 | 35 | 30,390 | ||||||||||||
|
|
|
|
|
|
|
| |||||||||
Total | $ | 163,622 | $ | 342,286 | $ | 263,660 | $ | 769,568 | ||||||||
|
|
|
|
|
|
|
| |||||||||
Interest sensitivity on the above loans: | ||||||||||||||||
Loans with predetermined rates | $ | 24,697 | $ | 244,400 | $ | 74,822 | $ | 343,919 | ||||||||
Loans with adjustable or floating rates | 138,925 | 97,886 | 188,838 | 425,649 | ||||||||||||
|
|
|
|
|
|
|
| |||||||||
Total | $ | 163,622 | $ | 342,286 | $ | 263,660 | $ | 769,568 | ||||||||
|
|
|
|
|
|
|
| |||||||||
Goodwill and Other Intangible Assets—Increases as of December 31, 2011, as compared to December 31, 2010, in goodwill of $7.0 million, or 39.8%, and other intangible assets of $11.0 million, or $155.0% were related to the May 27, 2011 Acquisition of PWMG, and to a lesser extent, the final $1.9 million earn-out payment to Lau Associates, acquired in 2008. See Note 3 in the Notes to Consolidated Financial Statements for additional details.
FHLB Stock—The Corporation’s investment in stock issued by the FHLB decreased by $2.6 million, from December 31, 2010 to December 31, 2011, as the FHLB resumed the redemption of excess stock from its member banks.
Mortgage Servicing Rights (“MSRs”)—MSRs decreased $884 thousand to $4.0 million as of December 31, 2011, from $4.9 million as of December 31, 2010. This decrease was the result of amortization of MSRs of $749 thousand and the impairment of MSRs of $786 thousand, partially offset by $651 thousand of new MSRs recorded during the twelve months ended December 31, 2011.
The following table details activity related to mortgage servicing rights for the periods indicated:
| Twelve Months Ended December 31, | ||||||||||||
| (dollars in thousands) | 2011 | 2010 | 2009 | |||||||||
Mortgage originations | $ | 168,681 | $ | 221,904 | $ | 291,613 | ||||||
Mortgage loans sold: | ||||||||||||
Servicing retained | $ | 75,232 | $ | 148,418 | $ | 266,759 | ||||||
Servicing released | 6,230 | 8,028 | 6,222 | |||||||||
|
|
|
|
|
| |||||||
Total mortgage loans sold | $ | 81,462 | $ | 156,446 | $ | 272,981 | ||||||
|
|
|
|
|
| |||||||
Percentage of mortgage loans sold: | ||||||||||||
Servicing retained % | 92.4 | % | 94.9 | % | 97.7 | % | ||||||
Servicing released % | 7.6 | % | 5.1 | % | 2.3 | % | ||||||
Loans serviced for others* | $ | 572,422 | $ | 605,485 | $ | 514,875 | ||||||
Mortgage servicing rights* | $ | 4,041 | $ | 4,925 | $ | 4,059 | ||||||
Gain on sale of loans | $ | 2,517 | $ | 4,718 | $ | 6,012 | ||||||
Loans servicing & late fees | $ | 1,824 | $ | 1,626 | $ | 1,387 | ||||||
Amortization of MSRs | $ | 749 | $ | 923 | $ | 853 | ||||||
Impairment/(recovery) of MSRs | $ | 786 | $ | 30 | $ | (137 | ) | |||||
Gain on sale of loans as % of principal | 3.08 | % | 3.02 | % | 2.20 | % | ||||||
| * | Period end balance |
Liability Changes
Total liabilities as of December 31, 2011 increased $18.6 million, to $1.59 billion, from $1.57 billion as of December 31, 2010. The increase was primarily due to increases in deposits, partially offset by decreases in FHLB advances and junior subordinated debentures between the respective dates.
Deposits—Total deposits increased $40.9 million or 3.1% to $1.38 billion as of December 31, 2011 from $1.34 billion as of December 31, 2010. The planned reduction in higher-yielding time deposits during the twelve months ended December 31, 2011 was the result of the Corporation’s strategic pricing of these products, as maturing funds were reinvested in lower-yielding money market accounts.
20
A breakdown of the deposits by major categories at December 31, for each of the last five years is as follows:
| (dollars in thousands) | 2011 | 2010 | 2009 | 2008 | 2007 | |||||||||||||||
Interest-bearing | $ | 233,562 | $ | 234,107 | $ | 151,432 | $ | 135,513 | $ | 137,486 | ||||||||||
Money market | 393,729 | 327,824 | 229,836 | 142,707 | 114,310 | |||||||||||||||
Savings | 130,613 | 134,163 | 101,719 | 54,333 | 36,181 | |||||||||||||||
Wholesale–non | 65,173 | 80,112 | 52,174 | 30,185 | — | |||||||||||||||
Wholesale–time | 23,550 | 37,201 | 36,118 | 120,761 | 129,820 | |||||||||||||||
Time deposits | 209,333 | 245,669 | 153,705 | 211,542 | 203,462 | |||||||||||||||
|
|
|
|
|
|
|
|
|
| |||||||||||
Interest-bearing | $ | 1,055,960 | $ | 1,059,076 | $ | 724,984 | $ | 695,041 | $ | 621,259 | ||||||||||
Non-interest-bearing | 326,409 | 282,356 | 212,903 | 174,449 | 228,269 | |||||||||||||||
|
|
|
|
|
|
|
|
|
| |||||||||||
Total deposits | $ | 1,382,369 | $ | 1,341,432 | $ | 937,887 | $ | 869,490 | $ | 849,528 | ||||||||||
|
|
|
|
|
|
|
|
|
| |||||||||||
Borrowings—Short-term borrowings as of December 31, 2011, which include repurchase agreements and overnight federal funds, increased $2.8 million, or 28.0%, from December 31, 2010. FHLB advances and other borrowings, which include a commercial mortgage loan and a five-year adjustable rate term loan, as of December 31, 2011, decreased $12.3 million, or 7.7%, from December 31, 2010. During 2011, as FHLB advances matured, not all were replaced. Funds generated from investment maturities along with the Corporation’s cash reserves at the FHLB were utilized for loan origination, alleviating the need to increase borrowings from the FHLB. See the Liquidity Section of Management’s Discussion and Analysis on page 22 for further details on the Corporation’s FHLB available borrowing capacity.
Debentures—As of December 31, 2011, the Corporation had $22.5 million of subordinated debentures and no junior subordinated debentures, as compared to $22.5 million of subordinated debentures and $12.0 million of junior subordinated debentures as of December 31, 2010. On December 19, 2011, the Corporation elected to prepay, at a premium rate of 102.91%, its junior subordinated debentures that had been acquired in the FKF Merger. Funding for the prepayment was obtained through an adjustable-rate term loan indexed to LIBOR mentioned above, underBorrowings. Refer to Note 12 in the Notes to Consolidated Financial Statements for further information.
DISCUSSIONOF SEGMENTS
The Corporation has two operating segments: Wealth Management and Banking. These segments are discussed below. Detailed segment information appears in Note 28 in the Notes to Consolidated Financial Statements.
Wealth Management Segment Activity
The Wealth Management Segment reported a pre-tax segment profit (“PTSP”) for the twelve months ended December 31, 2011 of $7.6 million, a $3.0 million, or 66.5%, increase from the same period in 2010. The increase in PTSP was primarily due to a $6.2 million, or 39.8%, increase in fees for Wealth Management services. The increase in
Wealth Management segment revenue for the twelve months ended December 31, 2011 as compared to the same period in 2010 was due, in large part, to the May 27, 2011 Acquisition of PWMG, which initially increased Wealth Management assets under management, administration, supervision and brokerage by $1.1 billion.
The Wealth Management Segment reported a 2010 PTSP of $4.5 million, a $655 thousand, or 16.9%, increase from the same period in 2009. The increase in PTSP was primarily due to a $1.3 million or 9.3% increase in fees for Wealth Management services between the respective periods. The increase in Wealth Management segment revenue for 2010 as compared to 2009 was due largely to the success of new initiatives within the division and asset appreciation resulting from improvements in the financial markets.
The following table shows the Corporation’s Wealth Management assets under management, administration, supervision and brokerage as of the dates indicated:
| As of December 31, | ||||||||||||
| (in millions) | 2011 | 2010 | 2009 | |||||||||
Total wealth assets under management, administration, supervision and brokerage | $ | 4,831.6 | $ | 3,412.9 | $ | 2,871.2 | ||||||
|
|
|
|
|
| |||||||
Banking Segment Activity
Banking segment data as presented in Note 28 in the accompanying Notes to Consolidated Financial Statements indicates a PTSP of $21.8 million in 2011, $9.1 million in 2010 and $12.0 million in 2009. See “Components of Net Income” on page 6 of this document for a discussion of the Banking Segment.
CAPITALAND REGULATORY CAPITAL RATIOS
Consolidated shareholders’ equity of the Corporation was $185.9 million, or 10.5% of total assets, as of December 31, 2011, as compared to $161.4 million, or 9.3% of total assets, as of December 31, 2010.
In June 2009, the Corporation filed a shelf registration statement (the “Shelf Registration Statement”) which allows the Corporation to raise additional capital through offers and sales of registered securities consisting of common stock, warrants to purchase common stock, stock purchase contracts or units consisting of any combination of the foregoing securities. Using the prospectus in the Shelf Registration Statement, together with applicable prospectus supplements, the Corporation may sell, from time to time, in one or more offerings, any amount of such securities in a dollar amount up to $90,000,000, in the aggregate.
On May 27, 2011, in connection with the Acquisition of PWMG, which is discussed in Note 2 in the Notes to Consolidated Financial Statements, the Corporation issued
21
322,101 unregistered shares of common stock, valued at $6.7 million. On September 30, 2011, the Corporation filed with the SEC a registration statement on Form S-3 (File No. 333-177109) to register for resale the 322,101 shares issued as part of the purchase price. The registration became effective November 18, 2011.
In connection with the FKF Merger, the Corporation issued 1,630,053 common shares, valued at $26.5 million, to former shareholders of FKF. These shares were registered on an S-4 registration statement filed by the Corporation in January 2010.
On May 18, 2010, through a registered direct stock offering using securities registered on the Shelf Registration Statement, the Corporation issued 1,548,167 common shares, at a price of $17.00 per share, raising $24.7 million after deducting placement agent’s fees and other offering expenses.
On July 20, 2009, the Corporation filed with the Securities and Exchange Commission a prospectus supplement in order to register 850,000 common shares of its stock, on the Shelf Registration Statement in connection with the Dividend Reinvestment and Stock Purchase Plan (the “Plan”). The Plan allows for the grant of a request for waiver (“RFW”) above the Plan maximum investment of $120 thousand per account per year. An RFW is granted based on a variety of factors, including the Corporation’s current and projected capital needs, prevailing market prices of the Corporation’s common stock and general economic and market conditions.
The Plan is intended to allow both existing shareholders and new investors to easily and conveniently increase their investment in the Corporation without incurring many of the fees and commissions normally associated with brokerage transactions. For the twelve months ended December 31, 2011 and 2010, the Corporation issued 448,377 and 119,175 shares, respectively, and raised $8.3 million and $2.0 million, respectively, through the Plan.
Accumulated other comprehensive loss, as of December 31, 2011 was $11.4 million, an increase of $4.6 million from December 31, 2010. The primary cause of this increase was related to the $5.4 million tax-effected increase in retirement plan obligations during the twelve months ended December 31, 2011. In connection with the annual actuarial review of the Corporation’s qualified defined benefit pension plan (the “Pension Plan”), which was frozen in 2008, the Corporation recorded a $7.2 million increase in its pension obligation. This actuarial loss was related to a decrease in the discount rate used to value the Pension Plan obligation, along with lower-than-expected performance of the Pension Plan’s investments for the twelve months ended December 31, 2011. Partially offsetting this increase in other comprehensive loss, was the increase of $807 thousand tax-
effected unrealized gain on available for sale investment securities during 2011.
In connection with the July 1, 2010 Merger with FKF, the Corporation acquired $12.0 million of junior subordinated debentures (the “Debentures”) which, while recorded as a liability on the Corporation’s balance sheet, were included as both Tier 1 and Tier 2 capital in the calculation of regulatory capital ratios. On December 19, 2011, the Corporation elected to prepay, in full, the Debentures at the scheduled premium rate of 102.91%, thus reducing its Tier 1 and Tier 2 capital balances.
Also affecting regulatory capital ratios is the $19.5 million increase, as of December 31, 2011 as compared to December 31, 2010, in goodwill and other intangible assets recorded in connection with the Acquisition of PWMG, the final earn-out payment to Lau Associates, and the adjustment to goodwill related to the FKF Merger. These items are excluded from capital in the calculation of the regulatory capital ratios. Refer to Note 1-U, Note 2 and Note 3 in the Notes to Consolidated Financial Statements for further information regarding goodwill and other intangible assets related to these transactions.
The Corporation’s and Bank’s regulatory capital ratios and the minimum capital requirements to be considered “Well Capitalized” by banking regulators are displayed in Note 25 of the accompanying Notes to Consolidated Financial Statements. Both the Corporation and the Bank exceed the required capital levels to be considered “Well Capitalized” by their respective regulators at the end of each period presented.
LIQUIDITY
The Corporation has significant sources and availability of liquidity at December 31, 2011 as discussed in this section. The liquidity position is managed on a daily basis as part of the daily settlement function and on a monthly basis as part of the asset liability management process. The Corporation’s primary liquidity is maintained by managing its deposits along with the utilization of purchased federal funds, borrowings from the FHLB and utilization of other wholesale funding sources. Secondary sources of liquidity include the sale of investment securities and certain loans in the secondary market.
Other wholesale funding sources include certificates of deposit from brokers, including CDARS, PLGIT, IND and IDC, generally available in blocks of $1.0 million or more. Funds obtained through these programs totaled $23.6 million as of December 31, 2011.
As of December 31, 2011, the maximum borrowing capacity with the FHLB was $657.7 million, with an unused borrowing availability of $514.7 million. Borrowing availability at the Federal Reserve was $67.5 million, and overnight Fed Funds lines, consisting of lines from six banks,
22
totaled $64.0 million. On a quarterly basis, the Corporation’s Asset Liability Committee reviews the Corporation’s liquidity needs and reports its findings to the Risk Management Committee of the Board of Directors.
As of December 31, 2011 the Corporation held approximately $11.6 million of FHLB stock. On December 23, 2008, the FHLB announced that it would voluntarily suspend the payment of dividends and the repurchase of excess capital stock until further notice. While there were no dividends paid on FHLB stock in 2011, 2010 or 2009, the FHLB resumed repurchases of stock with repurchases during the twelve months ended December 31, 2011 and 2010 of $2.6 million and $749 thousand, respectively. On February 22, 2012, the FHLB announces a quarterly dividend payment of 0.10%, annualized.
On July 6, 2009, the Corporation entered into an agreement with IDC to provide up to $10 million of money market deposits at an agreed upon rate currently at 0.55%. The agreement with IDC was amended at the end of 2010, reducing the amount to $5 million, plus interest. The Corporation had approximately $5.1 million in balances as of December 31, 2011 under this program. The Corporation can request an increase in the agreement amount as it deems necessary.
The Corporation’s investment portfolio of $272.3 million as of December 31, 2011 was approximately 15.3% of total assets. Some of these investments were in short-term, high-quality, liquid investments to earn more than the 25 basis points currently earned on Fed Funds. The Corporation’s policy is to keep the investment portfolio at a minimum of 10% of total assets. The investment portfolio provides the Corporation with the opportunity to utilize the securities to borrow additional funds through the FHLB, Federal Reserve or through other repurchase agreements.
The Corporation continually evaluates the capacity and the cost of continuing to fund earning asset growth with wholesale deposits. The Corporation believes that it has sufficient capacity to fund expected 2012 earning asset growth with wholesale sources, along with deposit growth from its expanded branch system.
In November 2010, the Federal Deposit Insurance Corporation, (“FDIC”) approved Section 343 of the Dodd-Frank Act providing temporary unlimited coverage for non-interest-bearing transaction accounts. This coverage became effective December 31, 2010 and will end on December 31, 2012. Excluded from this coverage are negotiable orders of withdrawal (“NOW”) accounts and interest on lawyer trust accounts (“IOLTA”).
OFF BALANCE SHEET RISK
The Corporation becomes party to financial instruments in the normal course of business to meet the financing needs of its customers. These financial instruments include commitments to extend credit and standby letters of credit and create off-balance sheet risk.
Commitments to extend credit are agreements to lend to a customer as long as there is no violation of any condition established in the loan agreement.
Standby letters of credit are conditional commitments issued by the Bank to a customer for a third party. Such standby letters of credit are issued to support private borrowing arrangements. The credit risk involved in issuing standby letters of credit is similar to that involved in granting loan facilities to customers.
The following chart presents the off-balance sheet commitments of the Corporation as of December 31, 2011, listed by dates of funding or payment:
| (dollars in millions) | Total | Within 1 Year | 2 - 3 Years | 4 - 5 Years | After 5 Years | |||||||||||||||
Unfunded loan commitments | $ | 353.0 | $ | 211.4 | $ | 38.4 | $ | 19.1 | $ | 84.1 | ||||||||||
Standby letters of credit | 20.5 | 19.3 | 1.2 | — | — | |||||||||||||||
|
|
|
|
|
|
|
|
|
| |||||||||||
Total | $ | 373.5 | $ | 230.7 | $ | 39.6 | $ | 19.1 | $ | 84.1 | ||||||||||
|
|
|
|
|
|
|
|
|
| |||||||||||
Estimated fair values of the Corporation’s off-balance sheet instruments are based on fees and rates currently charged to enter into similar loan agreements, taking into account the remaining terms of the agreements and the counterparties’ credit standing. Collateral requirements for off-balance sheet items are generally based upon the same standards and policies as booked loans. Since fees and rates charged for off-balance sheet items are at market levels when set, there is no material difference between the stated amount and the estimated fair value of off-balance sheet instruments.
CONTRACTUAL CASH OBLIGATIONSOFTHE CORPORATIONASOF DECEMBER 31, 2011
| (dollars in millions) | Total | Within 1 Year | 2 - 3 Years | 4 - 5 Years | After 5 Years | |||||||||||||||
Deposits without a stated maturity | $ | 1,149.4 | $ | 1,149.4 | $ | — | $ | — | $ | — | ||||||||||
Wholesale and retail certificates of deposit | 232.9 | 173.4 | 50.2 | 9.3 | — | |||||||||||||||
Subordinated debentures | 22.5 | — | — | — | 22.5 | |||||||||||||||
Short-term borrowings | 12.9 | 12.9 | — | — | — | |||||||||||||||
Other borrowings | 147.8 | 39.3 | 59.8 | 25.4 | 23.3 | |||||||||||||||
Operating leases | 35.0 | 2.2 | 3.9 | 3.5 | 25.4 | |||||||||||||||
Purchase obligations | 11.2 | 2.8 | 4.8 | 2.5 | 1.1 | |||||||||||||||
Non-discretionary pension contributions | 0.3 | 0.3 | — | — | — | |||||||||||||||
|
|
|
|
|
|
|
|
|
| |||||||||||
Total | $ | 1,612.0 | $ | 1,380.3 | $ | 118.7 | $ | 40.7 | $ | 72.3 | ||||||||||
|
|
|
|
|
|
|
|
|
| |||||||||||
23
OTHER INFORMATION
Regulatory Matters and Pending Legislation
The Corporation is not aware of any other current specific recommendations by regulatory authorities or proposed legislation which, if implemented, would have a material adverse effect upon the liquidity, capital resources, or results of operations, however the general cost of compliance with numerous and multiple federal and state laws and regulations does have, and in the future may have, an impact on the Corporation’s results of operations.
Effects of Inflation
Inflation has some impact on the Corporation’s operating costs. Unlike many industrial companies, however, substantially all of the Corporation’s assets and liabilities are monetary in nature. As a result, interest rates have a more significant impact on the Corporation’s performance than the general level of inflation. Over short periods of time, interest rates may not necessarily move in the same direction or in the same magnitude as prices of goods and services.
Effect of Government Monetary Policies
The earnings of the Corporation are and will be affected by domestic economic conditions and the monetary and fiscal policies of the United States government and its agencies. An important function of the Federal Reserve Board is to regulate the money supply and interest rates. Among the instruments used to implement those objectives are open market operations in United States government securities and changes in reserve requirements against member bank deposits. These instruments are used in varying combinations to influence overall growth and distribution of bank loans, investments, and deposits, and their use may also affect rates charged on loans or paid for deposits.
The Corporation is a member of the Federal Reserve System and, therefore, the policies and regulations of the Federal Reserve Board have a significant effect on its deposits, loans and investment growth, as well as the rate of interest earned and paid, and are expected to affect the Corporation’s operations in the future. The effect of such policies and regulations upon the future business and earnings of the Corporation cannot be predicted.
QUANTITATIVE AND QUALITATIVE DISCLOSURES ABOUT MARKET RISKS
The quantitative and qualitative disclosures about market risks are included in the Management’s Discussion and Analysis of Financial Condition and Results of Operations, in various sections detailed as follows:
“Net Interest Income”—Analysis of Interest Rates and Interest Differential, Tax-Equivalent Net Interest Income and Margin 2011 Compared to 2010, and -2010 Compared to 2009, Tax-Equivalent Net Interest Margin – Quarterly and Annual Comparison, Interest Rate Sensitivity, Summary of
Interest Rate Simulation, and Gap Report; “Provision for Loan and Lease Losses” – Loans Acquired in the FKF Merger, General Discussion of Allowance for Loan and Lease Losses, Asset Quality and Analysis of Credit Risk, Non-Performing Assets, TDRs and Related Ratios, Summary of Changes in the Allowance of Loan and Lease Losses, Allocation of Allowance for Loan and Lease Losses; “Non- Interest Income; “Non-Interest Expense”; “Income Taxes”; “Balance Sheet Analysis”; “Discussion of Segments”; “Capital and Regulatory Capital Ratios”; “Liquidity”; “Off Balance Sheet Risk”; “Contractual Cash Obligation of the Corporation as of December 31, 2010”; and “Other Information.”
SPECIAL CAUTIONARY NOTICE REGARDING FORWARD LOOKING STATEMENTS
Certain of the statements contained in this Annual Report, including without limitation the Letter to Shareholders, Year in Review, and Management’s Discussion and Analysis of Financial Condition and Results of Operations (which we refer to in this section as “incorporated documents”), may constitute forward-looking statements for the purposes of the Securities Act of 1933, as amended and the Securities Exchange Act of 1934, as amended, and may involve known and unknown risks, uncertainties and other factors which may cause actual results, performance or achievements of the Bryn Mawr Bank Corporation (the “Corporation”) to be materially different from future results, performance or achievements expressed or implied by such forward-looking statements. These forward-looking statements include statements with respect to the Corporation’s financial goals, business plans, business prospects, credit quality, credit risk, reserve adequacy, liquidity, origination and sale of residential mortgage loans, mortgage servicing rights, the effect of changes in accounting standards, and market and pricing trends loss. The words “may”, “would”, “could”, “will”, “likely”, “expect,” “anticipate,” “intend”, “estimate”, “plan”, “forecast”, “project” and “believe” and similar expressions are intended to identify such forward-looking statements. The Corporation’s actual results may differ materially from the results anticipated by the forward-looking statements due to a variety of factors, including without limitation:
| • | the effect of future economic conditions on the Corporation and its customers, including economic factors which affect consumer confidence in the securities markets, wealth creation, investment and savings patterns, the real estate market, and the Corporation’s interest rate risk exposure and credit risk; |
| • | changes in the securities markets with respect to the market values of financial assets and the stability of particular securities markets; |
| • | governmental monetary and fiscal policies, as well as legislation and regulatory changes; |
24
| • | results of examinations by the Federal Reserve Board, including the possibility that the Federal Reserve Board may, among other things, require us to increase our allowance for loan losses or to write down assets; |
| • | changes in accounting requirements or interpretations; |
| • | changes in existing statutes, regulatory guidance, legislation or judicial decisions that adversely affect our business, including changes in federal income tax or other tax regulations; |
| • | the risks of changes in interest rates on the level and composition of deposits, loan demand, and the value of loan collateral and securities, as well as interest rate risk; |
| • | the effects of competition from other commercial banks, thrifts, mortgage companies, consumer finance companies, credit unions, securities brokerage firms, insurance companies, money-market and mutual funds and other institutions operating in the Corporation’s trade market area and elsewhere including institutions operating locally, regionally, nationally and internationally and such competitors offering banking products and services by mail, telephone, computer and the Internet; |
| • | any extraordinary events (such as the September 11, 2001 events, the war on terrorism and the U.S. Government’s response to those events, including the war in Iraq); |
| • | the Corporation’s need for capital; |
| • | the Corporation’s success in continuing to generate new business in its existing markets, as well as its success in identifying and penetrating targeted markets and generating a profit in those markets in a reasonable time; |
| • | the Corporation’s ability to continue to generate investment results for customers and the ability to continue to develop investment products in a manner that meets customers needs; |
| • | changes in consumer and business spending, borrowing and savings habits and demand for financial services in our investment products in a manner that meets customers’ needs; |
| • | the Corporation’s timely development of competitive new products and services in a changing environment and the acceptance of such products and services by customers; |
| • | the Corporation’s ability to originate, sell and service residential mortgage loans; |
| • | the accuracy of assumptions underlying the establishment of reserves for loan losses and |
estimates in the value of collateral, the market value of mortgage servicing rights and various financial assets and liabilities; |
| • | the Corporation’s ability to retain key members of the senior management team; |
| • | the ability of key third-party providers to perform their obligations to the Corporation and the Bank; |
| • | technological changes being more difficult or expensive than anticipated; |
| • | the Corporation’s success in managing the risks involved in the foregoing. |
All written or oral forward-looking statements attributed to the Corporation are expressly qualified in their entirety by use of the foregoing cautionary statements. All forward-looking statements included in this Annual Report and incorporated documents are based upon the Corporation’s beliefs and assumptions as of the date of this Annual Report. The Corporation assumes no obligation to update any forward-looking statement. In light of these risks, uncertainties and assumptions, the forward-looking statements discussed in this Annual Report or incorporated documents might not occur and you should not put undue reliance on any forward-looking statements. Some of these and other factors are discussed in the section entitled “Risk Factors” in the accompanying Form 10-K.
25
Management’s Report on Internal Control Over Financial Reporting
The Corporation is responsible for the preparation, integrity, and fair presentation of the consolidated financial statements included in this Annual Report. The consolidated financial statements and notes included in this Annual Report have been prepared in conformity with United States generally accepted accounting principles and necessarily include some amounts that are based on Management’s best estimates and judgments.
The Corporation’s Management is responsible for establishing and maintaining effective internal control over financial reporting that is designed to produce reliable financial statements in conformity with United States generally accepted accounting principles. Internal control over financial reporting includes those policies and procedures that pertain to the maintenance of records that in reasonable detail accurately and fairly reflect the transactions and dispositions of the assets of the Corporation; provide reasonable assurance that the transactions are recorded as necessary to permit preparation of financial statements in accordance with generally accepted accounting principles; provide a reasonable assurance that receipts and expenditures of the Corporation are only being made in accordance with authorizations of Management and directors of the Corporation; and provide a reasonable assurance regarding prevention or timely detection of unauthorized acquisition, use, or disposition of the Corporation’s assets that could have a material effect on the financial statements. The system of internal control over financial reporting as it relates to the financial statements is evaluated for effectiveness by Management and tested for reliability through a program of internal audits. Actions are taken to correct potential deficiencies as they are noted.
Any system of internal control, no matter how well designed, has inherent limitations, including the possibility that a control can be circumvented or overridden and misstatements due to error or fraud may occur and not be detected. Also, because of changes in conditions, internal control effectiveness may vary over time. Accordingly, even an effective system of internal control will provide only reasonable assurance with respect to financial statement preparation.
Management assessed the Corporation’s system of internal control over financial reporting as of December 31, 2011, in relation to the criteria for effective control over financial reporting as described in “Internal Control – Integrated Framework,” issued by the Committee of Sponsoring Organizations of the Treadway Commission. Based on this assessment, Management concludes that, as of December 31, 2011, its system of internal control over financial reporting is effective and meets the criteria of the “Internal Control – Integrated Framework.”
The effectiveness of the Corporation’s internal control over financial reporting as of December 31, 2011 has been audited by KPMG LLP, (“KPMG”) the Corporation’s independent registered public accounting firm having responsibility for auditing the Corporation’s financial statements. KPMG has expressed an unqualified opinion on the effectiveness of the Corporation’s internal control over financial reporting as of December 31, 2011.
26
Report of Independent Registered Public Accounting Firm
The Board of Directors and Shareholders
Bryn Mawr Bank Corporation:
We have audited the accompanying consolidated balance sheets of Bryn Mawr Bank Corporation and subsidiaries (the “Corporation”) as of December 31, 2011 and 2010, and the related consolidated statements of income, cash flows, changes in shareholders’ equity and comprehensive income for each of the years in the three-year period ended December 31, 2011. These consolidated financial statements are the responsibility of the Corporation’s management. Our responsibility is to express an opinion on these consolidated financial statements based on our audits.
We conducted our audits in accordance with the standards of the Public Company Accounting Oversight Board (United States). Those standards require that we plan and perform the audit to obtain reasonable assurance about whether the financial statements are free of material misstatement. An audit includes examining, on a test basis, evidence supporting the amounts and disclosures in the financial statements. An audit also includes assessing the accounting principles used and significant estimates made by management, as well as evaluating the overall financial statement presentation. We believe that our audits provide a reasonable basis for our opinion.
In our opinion, the consolidated financial statements referred to above present fairly, in all material respects, the financial position of Bryn Mawr Bank Corporation and subsidiaries as of December 31, 2011 and 2010, and the results of their operations and their cash flows for each of the years in the three-year period ended December 31, 2011, in conformity with U.S. generally accepted accounting principles.
We also have audited, in accordance with the standards of the Public Company Accounting Oversight Board (United States), Bryn Mawr Bank Corporation’s internal control over financial reporting as of December 31, 2011, based on criteria established in Internal Control – Integrated Framework issued by the Committee of Sponsoring Organizations of the Treadway Commission (COSO), and our report dated March 15, 2012 expressed an unqualified opinion on the effectiveness of the Corporation’s internal control over financial reporting.

Philadelphia, Pennsylvania
March 15, 2012
27
Report of Independent Registered Public Accounting Firm
The Board of Directors and Shareholders
Bryn Mawr Bank Corporation:
We have audited Bryn Mawr Bank Corporation’s (the “Corporation”) internal control over financial reporting as of December 31, 2011, based on criteria established in Internal Control – Integrated Framework issued by the Committee of Sponsoring Organizations of the Treadway Commission (COSO). Bryn Mawr Bank Corporation’s management is responsible for maintaining effective internal control over financial reporting and for its assessment of the effectiveness of internal control over financial reporting, included in the accompanying Management’s Report on Internal Control Over Financial Reporting. Our responsibility is to express an opinion on the Corporation’s internal control over financial reporting based on our audit.
We conducted our audit in accordance with the standards of the Public Company Accounting Oversight Board (United States). Those standards require that we plan and perform the audit to obtain reasonable assurance about whether effective internal control over financial reporting was maintained in all material respects. Our audit included obtaining an understanding of internal control over financial reporting, assessing the risk that a material weakness exists, and testing and evaluating the design and operating effectiveness of internal control based on the assessed risk. Our audit also included performing such other procedures as we considered necessary in the circumstances. We believe that our audit provides a reasonable basis for our opinion.
A company’s internal control over financial reporting is a process designed to provide reasonable assurance regarding the reliability of financial reporting and the preparation of financial statements for external purposes in accordance with generally accepted accounting principles. A company’s internal control over financial reporting includes those policies and procedures that (1) pertain to the maintenance of records that, in reasonable detail, accurately and fairly reflect the transactions and dispositions of the assets of the company; (2) provide reasonable assurance that transactions are recorded as necessary to permit preparation of financial statements in accordance with generally accepted accounting principles, and that receipts and expenditures of the company are being made only in accordance with authorizations of management and directors of the company; and (3) provide reasonable assurance regarding prevention or timely detection of unauthorized acquisition, use, or disposition of the company’s assets that could have a material effect on the financial statements.
Because of its inherent limitations, internal control over financial reporting may not prevent or detect misstatements. Also, projections of any evaluation of effectiveness to future periods are subject to the risk that controls may become inadequate because of changes in conditions, or that the degree of compliance with the policies or procedures may deteriorate.
In our opinion, Bryn Mawr Bank Corporation maintained, in all material respects, effective internal control over financial reporting as of December 31, 2011, based on criteria established in Internal Control – Integrated Framework issued by the Committee of Sponsoring Organizations of the Treadway Commission.
We also have audited, in accordance with the standards of the Public Company Accounting Oversight Board (United States), the consolidated balance sheets of Bryn Mawr Bank Corporation and subsidiaries as of December 31, 2011 and 2010, and the related consolidated statements of income, changes in cash flows, changes in shareholders’ equity and comprehensive income for each of the years in the three-year period ended December 31, 2011, and our report dated March 15, 2012 expressed an unqualified opinion on those consolidated financial statements.
Philadelphia, Pennsylvania
March 15, 2012
28
Consolidated Balance Sheets
| December 31, | ||||||||
| 2011 | 2010 | |||||||
| (dollars in thousands) | ||||||||
Assets | ||||||||
Cash and due from banks | $ | 11,771 | $ | 10,961 | ||||
Interest bearing deposits with banks | 57,369 | 78,523 | ||||||
|
|
|
| |||||
Cash and cash equivalents | 69,140 | 89,484 | ||||||
Investment securities available for sale, at fair value (amortized cost of $269,611 and $315,587 as of December 31, 2011 and December 31, 2010 respectively) | 272,317 | 317,052 | ||||||
Loans held for sale | 1,588 | 4,838 | ||||||
Portfolio loans and leases | 1,295,392 | 1,196,717 | ||||||
Less: Allowance for loan and lease losses | (12,753 | ) | (10,275 | ) | ||||
|
|
|
| |||||
Net portfolio loans and leases | 1,282,639 | 1,186,442 | ||||||
Premises and equipment, net | 29,328 | 29,158 | ||||||
Accrued interest receivable | 6,061 | 6,470 | ||||||
Deferred income taxes | 13,662 | 14,551 | ||||||
Mortgage servicing rights | 4,041 | 4,925 | ||||||
Bank owned life insurance | 19,434 | 18,972 | ||||||
FHLB stock | 11,588 | 14,227 | ||||||
Goodwill | 24,689 | 17,659 | ||||||
Intangible assets | 18,014 | 7,064 | ||||||
Other investments | 5,612 | 5,156 | ||||||
Other assets | 16,794 | 15,770 | ||||||
|
|
|
| |||||
Total assets | $ | 1,774,907 | $ | 1,731,768 | ||||
|
|
|
| |||||
Liabilities | ||||||||
Deposits: | ||||||||
Non-interest-bearing | $ | 326,409 | $ | 282,356 | ||||
Interest-bearing | 1,055,960 | 1,059,076 | ||||||
|
|
|
| |||||
Total deposits | 1,382,369 | 1,341,432 | ||||||
|
|
|
| |||||
Short-term borrowings | 12,863 | 10,051 | ||||||
FHLB advances and other borrowings | 147,795 | 160,144 | ||||||
Subordinated debentures | 22,500 | 22,500 | ||||||
Junior subordinated debentures | — | 12,029 | ||||||
Accrued interest payable | 1,592 | 3,293 | ||||||
Other liabilities | 21,875 | 20,901 | ||||||
|
|
|
| |||||
Total liabilities | 1,588,994 | 1,570,350 | ||||||
|
|
|
| |||||
Shareholders’ equity | ||||||||
Common stock, par value $1; authorized 100,000,000 shares; issued 16,103,981 and 15,109,718 shares as of December 31, 2011 and December 31, 2010, respectively, and outstanding of 13,194,439 and 12,195,240 as of December 31, 2011 and December 31, 2010, respectively | 16,104 | 15,110 | ||||||
Paid-in capital in excess of par value | 84,425 | 68,398 | ||||||
Less: Common stock in treasury at cost—2,909,542 and 2,914,478 shares as of December 31, 2011 and December 31, 2010 | (29,833 | ) | (29,881 | ) | ||||
Accumulated other comprehensive loss, net of tax benefit | (11,365 | ) | (6,757 | ) | ||||
Retained earnings | 126,582 | 114,548 | ||||||
|
|
|
| |||||
Total shareholders’ equity | 185,913 | 161,418 | ||||||
|
|
|
| |||||
Total liabilities and shareholders' equity | $ | 1,774,907 | $ | 1,731,768 | ||||
|
|
|
| |||||
The accompanying notes are an integral part of the consolidated financial statements.
29
Consolidated Statements of Income
| Year Ended December 31, | ||||||||||||
| 2011 | 2010 | 2009 | ||||||||||
| (dollars in thousands, except share and per share data) | ||||||||||||
Interest income: | ||||||||||||
Interest and fees on loans and leases | $ | 69,321 | $ | 59,324 | $ | 51,686 | ||||||
Interest on cash and cash equivalents | 115 | 179 | 272 | |||||||||
Interest on investment securities: | ||||||||||||
Taxable | 4,365 | 3,552 | 4,007 | |||||||||
Non-taxable | 226 | 749 | 593 | |||||||||
Dividends | 412 | 992 | 334 | |||||||||
|
|
|
|
|
| |||||||
Total interest income | 74,439 | 64,796 | 56,892 | |||||||||
|
|
|
|
|
| |||||||
Interest expense on: | ||||||||||||
Deposits | 5,787 | 6,101 | 9,970 | |||||||||
Short-term borrowings | 25 | 16 | 1 | |||||||||
FHLB advances and other borrowings | 3,676 | 4,907 | 5,020 | |||||||||
Subordinated debentures | 1,123 | 1,129 | 1,108 | |||||||||
Junior subordinated debentures | 1,050 | 493 | — | |||||||||
|
|
|
|
|
| |||||||
Total interest expense | 11,661 | 12,646 | 16,099 | |||||||||
|
|
|
|
|
| |||||||
Net interest income | 62,778 | 52,150 | 40,793 | |||||||||
Provision for loan and lease losses | 6,088 | 9,854 | 6,884 | |||||||||
|
|
|
|
|
| |||||||
Net interest income after provision for loan and lease losses | 56,690 | 42,296 | 33,909 | |||||||||
Non-interest income: | ||||||||||||
Fees for wealth management services | 21,669 | 15,499 | 14,178 | |||||||||
Service charges on deposits | 2,495 | 2,307 | 1,951 | |||||||||
Loan servicing and other fees | 1,824 | 1,626 | 1,387 | |||||||||
Net gain on sale of residential mortgage loans | 2,517 | 4,718 | 6,012 | |||||||||
Net gain on sale of available for sale securities | 1,783 | 2,472 | 1,923 | |||||||||
Net gain on sale of trading securities | — | — | 255 | |||||||||
Net (loss) gain on sale of other real estate owned (“OREO”) | (97 | ) | (114 | ) | 6 | |||||||
BOLI income | 462 | 266 | — | |||||||||
Other operating income | 3,497 | 2,601 | 2,758 | |||||||||
|
|
|
|
|
| |||||||
Total non-interest income | 34,150 | 29,375 | 28,470 | |||||||||
Non-interest expenses: | ||||||||||||
Salaries and wages | 28,084 | 24,829 | 22,275 | |||||||||
Employee benefits | 6,889 | 5,984 | 5,578 | |||||||||
Occupancy and bank premises | 5,176 | 4,257 | 3,637 | |||||||||
Furniture, fixtures, and equipment | 3,509 | 2,778 | 2,407 | |||||||||
Advertising | 1,166 | 1,142 | 1,084 | |||||||||
Amortization of mortgage servicing rights | 749 | 923 | 853 | |||||||||
Net impairment (recovery) of mortgage servicing rights | 786 | 30 | (137 | ) | ||||||||
Amortization of intangible assets | 1,490 | 484 | 308 | |||||||||
FDIC insurance | 1,186 | 1,551 | 1,234 | |||||||||
FDIC special assessment | — | — | 540 | |||||||||
Impairment of OREO | 251 | 381 | — | |||||||||
Due diligence and merger-related expenses | 537 | 5,714 | 616 | |||||||||
Professional fees | 2,311 | 2,140 | 2,008 | |||||||||
Other operating expenses | 9,392 | 7,772 | 6,139 | |||||||||
|
|
|
|
|
| |||||||
Total non-interest expenses | 61,526 | 57,985 | 46,542 | |||||||||
Income before income taxes | 29,314 | 13,686 | 15,837 | |||||||||
Income tax expense | 9,601 | 4,512 | 5,500 | |||||||||
|
|
|
|
|
| |||||||
Net income | $ | 19,713 | $ | 9,174 | $ | 10,337 | ||||||
|
|
|
|
|
| |||||||
Basic earnings per common share | $ | 1.55 | $ | 0.85 | $ | 1.18 | ||||||
Diluted earnings per common share | $ | 1.54 | $ | 0.85 | $ | 1.18 | ||||||
Dividends declared per share | $ | 0.60 | $ | 0.56 | $ | 0.56 | ||||||
Weighted-average basic shares outstanding | 12,746,346 | 10,765,657 | 8,732,004 | |||||||||
Dilutive potential shares | 82,313 | 12,312 | 16,719 | |||||||||
|
|
|
|
|
| |||||||
Adjusted weighted-average diluted shares | 12,828,659 | 10,777,969 | 8,748,723 | |||||||||
|
|
|
|
|
| |||||||
The accompanying notes are an integral part of the consolidated financial statements.
30
Consolidated Statements of Cash Flows
| (dollars in thousands) | Year Ended December 31, | |||||||||||
| 2011 | 2010 | 2009 | ||||||||||
Operating activities: | ||||||||||||
Net Income | $ | 19,713 | $ | 9,174 | $ | 10,337 | ||||||
Adjustments to reconcile net income to net cash provided by operating activities: | ||||||||||||
Provision for loan and lease losses | 6,088 | 9,854 | 6,884 | |||||||||
Provision for depreciation and amortization | 5,688 | 3,877 | 3,106 | |||||||||
Net gain on sale of available for sale securities | (1,783 | ) | (2,472 | ) | (1,923 | ) | ||||||
Gain on trading securities | — | — | (255 | ) | ||||||||
Net gain on sale of residential mortgages | (2,517 | ) | (4,718 | ) | (6,012 | ) | ||||||
Stock based compensation cost | 876 | 539 | 386 | |||||||||
Amortization and net impairment of mortgage servicing rights | 1,535 | 953 | 716 | |||||||||
Net accretion of fair value adjustments | (2,037 | ) | (2,149 | ) | — | |||||||
Amortization of intangible assets | 1,490 | 484 | 308 | |||||||||
Impairment of other real estate owned (“OREO”) | 251 | 381 | — | |||||||||
Loss (gain) on sale of OREO | 97 | 114 | (6 | ) | ||||||||
Net increase in cash surrender value of bank owned life insurance (“BOLI”) | (462 | ) | (266 | ) | — | |||||||
Other, net | 3,473 | 3,776 | (840 | ) | ||||||||
Loans originated for resale | (78,212 | ) | (157,607 | ) | (272,964 | ) | ||||||
Proceeds from loans sold | 83,328 | 159,784 | 276,423 | |||||||||
Purchase of trading securities | — | — | (5,076 | ) | ||||||||
Proceeds from sale of trading securities | — | — | 5,331 | |||||||||
Contribution to pension | (10,000 | ) | — | — | ||||||||
Provision for deferred income taxes (benefit) | 3,370 | 395 | (57 | ) | ||||||||
Change in income taxes payable/receivable | (3,270 | ) | 687 | 892 | ||||||||
Change in accrued interest receivable | 409 | (445 | ) | (256 | ) | |||||||
Change in accrued interest payable | (1,701 | ) | (544 | ) | (2,382 | ) | ||||||
|
|
|
|
|
| |||||||
Net cash provided by operating activities | 26,336 | 21,817 | 14,612 | |||||||||
|
|
|
|
|
| |||||||
Investing activities: | ||||||||||||
Purchases of investment securities | (216,857 | ) | (335,992 | ) | (203,016 | ) | ||||||
Proceeds from maturity of investment securities and paydowns of mortgage-related securities | 36,532 | 18,836 | 31,152 | |||||||||
Proceeds from sale of investment securities available for sale | 89,661 | 88,017 | 62,905 | |||||||||
Proceeds from calls of investment securities | 137,410 | 212,600 | 18,390 | |||||||||
Net change in other investments | (562 | ) | 71 | (190 | ) | |||||||
Proceeds from BOLI repayment | — | — | 15,585 | |||||||||
Net portfolio loan and lease (originations) repayments | (101,900 | ) | (49,585 | ) | 5,106 | |||||||
Purchases of premises and equipment | (2,612 | ) | (2,084 | ) | (2,090 | ) | ||||||
Acquisition of First Keystone Financial, Inc., net of cash acquired | — | 46,240 | — | |||||||||
Acquisition of Lau Associates, net of cash acquired | (1,617 | ) | (1,477 | ) | (195 | ) | ||||||
Acquisition of PWMG, net of cash acquired | (11,750 | ) | ||||||||||
Increase in OREO | — | (44 | ) | (147 | ) | |||||||
Proceeds from sale of OREO | 2,793 | 1,371 | 1,068 | |||||||||
|
|
|
|
|
| |||||||
Net cash used by investing activities | (68,902 | ) | (22,047 | ) | (71,432 | ) | ||||||
|
|
|
|
|
| |||||||
Financing activities: | ||||||||||||
Change in deposits | 41,482 | 83,341 | 68,397 | |||||||||
Change in short-term borrowings | 2,812 | (3,036 | ) | — | ||||||||
Dividends paid | (7,679 | ) | (5,916 | ) | (4,892 | ) | ||||||
Change in FHLB advances and other borrowings | (11,797 | ) | (91,028 | ) | (10,113 | ) | ||||||
Increase in subordinated debentures | — | — | 7,500 | |||||||||
Decrease in junior subordinated debentures | (12,028 | ) | — | — | ||||||||
Purchase of treasury stock | — | — | (42 | ) | ||||||||
Tax benefit from exercise of stock options | 141 | 60 | 66 | |||||||||
Proceeds from issuance of common stock | 8,325 | 26,688 | 3,660 | |||||||||
Proceeds from exercise of stock options | 966 | 288 | 514 | |||||||||
|
|
|
|
|
| |||||||
Net cash provided by financing activities | 22,222 | 10,397 | 67,152 | |||||||||
|
|
|
|
|
| |||||||
Change in cash and cash equivalents | (20,344 | ) | 10,167 | 10,332 | ||||||||
Cash and cash equivalents at beginning of year | 89,484 | 79,317 | 68,985 | |||||||||
|
|
|
|
|
| |||||||
Cash and cash equivalents at end of year | $ | 69,140 | $ | 89,484 | $ | 79,317 | ||||||
|
|
|
|
|
| |||||||
Supplemental cash flow information: | ||||||||||||
Cash paid during the year for: | ||||||||||||
Income taxes | $ | 9,213 | $ | 3,627 | $ | 4,650 | ||||||
Interest | 13,362 | 11,340 | 18,481 | |||||||||
Supplemental cash flow information: | ||||||||||||
Available for sale securities purchased, not settled | $ | — | $ | — | $ | 7,996 | ||||||
Change in other comprehensive income | (7,090 | ) | 240 | 1,664 | ||||||||
Change in deferred tax due to change in comprehensive income | 2,482 | 84 | 582 | |||||||||
Transfer of loans to other real estate owned | 1,163 | 3,124 | 1,940 | |||||||||
Acquisition of noncash assets and liabilities: | ||||||||||||
Assets acquired | 20,339 | 438,989 | — | |||||||||
Liabilities assumed | — | 458,736 | — | |||||||||
The accompanying notes are an integral part of the consolidated financial statements.
31
Consolidated Statements of Changes in Shareholders’ Equity
(dollars in thousands, except share information)
| For the Years Ended December 31, 2011, 2010 and 2009 | ||||||||||||||||||||||||||||
| Shares of Common Stock Issued | Common Stock | Paid-in Capital | Retained Earnings | Accumulated Other Comprehensive Loss | Treasury Stock | Total Shareholders’ Equity | ||||||||||||||||||||||
Balance December 31, 2008 | 11,513,782 | $ | 11,514 | $ | 12,983 | $ | 105,845 | $ | (7,995 | ) | $ | (29,934 | ) | $ | 92,413 | |||||||||||||
Net income | — | — | — | 10,337 | — | — | 10,337 | |||||||||||||||||||||
Dividends declared, $0.56 per share | — | — | — | (4,892 | ) | — | — | (4,892 | ) | |||||||||||||||||||
Other comprehensive income, net of tax expense of $582 | — | — | — | — | 1,082 | — | 1,082 | |||||||||||||||||||||
Stock based compensation | — | — | 798 | — | — | — | 798 | |||||||||||||||||||||
Tax benefit from gains on stock option exercise | — | — | 66 | — | — | — | 66 | |||||||||||||||||||||
Purchase of treasury stock | — | — | — | — | — | (42 | ) | (42 | ) | |||||||||||||||||||
Retirement of treasury stock | (4,522 | ) | (4 | ) | (40 | ) | — | — | 44 | — | ||||||||||||||||||
Common stock issued: | ||||||||||||||||||||||||||||
Dividend Reinvestment and Stock Purchase Plan | 81,641 | 82 | 1,106 | — | — | — | 1,188 | |||||||||||||||||||||
Share-based awards and options exercises | 45,122 | 44 | 557 | — | — | — | 601 | |||||||||||||||||||||
Private placement | 150,061 | 150 | 2,235 | — | — | — | 2,385 | |||||||||||||||||||||
|
|
|
|
|
|
|
|
|
|
|
|
|
| |||||||||||||||
Balance December 31, 2009 | 11,786,084 | $ | 11,786 | $ | 17,705 | $ | 111,290 | $ | (6,913 | ) | $ | (29,932 | ) | $ | 103,936 | |||||||||||||
Net income | — | — | — | 9,174 | — | — | 9,174 | |||||||||||||||||||||
Dividends declared, $0.56 per share | — | — | — | (5,916 | ) | — | — | (5,916 | ) | |||||||||||||||||||
Other comprehensive income, net of tax expense of $84 | — | — | — | — | 156 | — | 156 | |||||||||||||||||||||
Stock based compensation | — | — | 539 | — | — | — | 539 | |||||||||||||||||||||
Tax benefit from gains on stock option exercise | — | — | 60 | — | — | — | 60 | |||||||||||||||||||||
Retirement of treasury stock | (5,186 | ) | (5 | ) | (46 | ) | — | — | 51 | — | ||||||||||||||||||
Common stock issued: | ||||||||||||||||||||||||||||
Dividend Reinvestment and Stock Purchase Plan | 119,175 | 119 | 1,918 | — | — | — | 2,037 | |||||||||||||||||||||
Share-based awards and options exercises | 31,425 | 32 | 354 | — | — | — | 386 | |||||||||||||||||||||
Acquisitions | 1,630,053 | 1,630 | 24,846 | — | — | — | 26,476 | |||||||||||||||||||||
Registered direct common stock offering | 1,548,167 | 1,548 | 23,022 | — | — | — | 24,570 | |||||||||||||||||||||
|
|
|
|
|
|
|
|
|
|
|
|
|
| |||||||||||||||
Balance December 31, 2010 | 15,109,718 | $ | 15,110 | $ | 68,398 | $ | 114,548 | $ | (6,757 | ) | $ | (29,881 | ) | $ | 161,418 | |||||||||||||
Net income | — | — | — | 19,713 | — | — | 19,713 | |||||||||||||||||||||
Dividends declared, $0.60 per share | — | — | — | (7,679 | ) | — | — | (7,679 | ) | |||||||||||||||||||
Other comprehensive loss, net of tax benefit of $2,482 | — | — | — | — | (4,608 | ) | — | (4,608 | ) | |||||||||||||||||||
Stock based compensation | — | — | 876 | — | — | — | 876 | |||||||||||||||||||||
Tax benefit from gains on stock option exercise | — | — | 141 | — | — | — | 141 | |||||||||||||||||||||
Retirement of treasury stock | (4,936 | ) | (5 | ) | (43 | ) | — | — | 48 | — | ||||||||||||||||||
Common stock issued: | ||||||||||||||||||||||||||||
Dividend Reinvestment and Stock Purchase Plan | 448,377 | 448 | 7,877 | — | — | — | 8,325 | |||||||||||||||||||||
Share-based awards and options exercises | 228,893 | 229 | 837 | — | — | — | 1,066 | |||||||||||||||||||||
Acquisitions | 321,929 | 322 | 6,339 | — | — | — | 6,661 | |||||||||||||||||||||
|
|
|
|
|
|
|
|
|
|
|
|
|
| |||||||||||||||
Balance December 31, 2011 | 16,103,981 | $ | 16,104 | $ | 84,425 | $ | 126,582 | $ | (11,365 | ) | $ | (29,833 | ) | $ | 185,913 | |||||||||||||
|
|
|
|
|
|
|
|
|
|
|
|
|
| |||||||||||||||
The accompanying notes are an integral part of the consolidated financial statements.
32
Consolidated Statements of Comprehensive Income
| Year Ended December 31, | ||||||||||||
| (dollars in thousands) | 2011 | 2010 | 2009 | |||||||||
Net income | $ | 19,713 | $ | 9,174 | $ | 10,337 | ||||||
Other comprehensive income (loss): | ||||||||||||
Net unrealized gains arising during the period, net of tax expense of $1,058, $840 and $834, respectively | 1,966 | 1,561 | 1,550 | |||||||||
Less: reclassification adjustment for net gains on sales realized in net income, net of tax expense of $624, 865 and 673, respectively | (1,159 | ) | (1,607 | ) | (1,250 | ) | ||||||
|
|
|
|
|
| |||||||
Unrealized investment gains (losses), net of tax expense (benefit) of $434, $(25) and $161, respectively | 807 | (46 | ) | 300 | ||||||||
Change in unfunded pension liability, net of tax (benefit) expense of $(2,916), $109 and $421, respectively | (5,415 | ) | 202 | 782 | ||||||||
|
|
|
|
|
| |||||||
Total comprehensive income | $ | 15,105 | $ | 9,330 | $ | 11,419 | ||||||
|
|
|
|
|
| |||||||
The accompanying notes are an integral part of the consolidated financial statements.
33
Notes to Consolidated Financial Statements
1. SUMMARYOF SIGNIFICANT ACCOUNTING POLICIES
A. Nature of Business
The Bryn Mawr Trust Company (the “Bank���) received its Pennsylvania banking charter in 1889 and is a member of the Federal Reserve System. In 1986, Bryn Mawr Bank Corporation (the “Corporation”) was formed and on January 2, 1987, the Bank became a wholly-owned subsidiary of the Corporation. The Bank and Corporation are headquartered in Bryn Mawr, Pennsylvania, a western suburb of Philadelphia. The Corporation and its subsidiaries provide wealth management, community banking, residential mortgage lending, insurance and business banking services to its customers through 17 full service branches and seven retirement community offices throughout Montgomery, Delaware and Chester counties. In 2008, the Corporation opened the Bryn Mawr Trust Company of Delaware in Greenville, Delaware, to further its long-term growth strategy, and diversify its asset base and client accounts. The common stock of the Corporation trades on the NASDAQ Stock Market (“NASDAQ”) under the symbol BMTC.
On May 27, 2011, the acquisition of the Private Wealth Management Group (“PWMG”) of the Hershey Trust Company (“HTC”) by the Corporation (the “PWMG Acquisition” or the “Acquisition of PWMG”) was completed. The Acquisition of PWMG initially increased the Corporation’s Wealth Management Division assets under management by $1.1 billion. In addition, the acquisition enabled the Wealth Management Division to extend into central Pennsylvania by continuing to operate the former PWMG offices located in Hershey, Pennsylvania.
On July 1, 2010, the merger of First Keystone Financial, Inc. (“FKF”) with and into the Corporation (the “Merger with FKF” or the “FKF Merger”), and the two step merger of FKF’s wholly-owned subsidiary, First Keystone Bank (“FKB”) with and into the Bank, were completed. The acquisition of FKF, a federally chartered thrift institution with assets of approximately $480 million, enabled the Corporation to increase its regional footprint with the addition of eight full service branch locations, primarily in Delaware County, Pennsylvania.
The Corporation operates in a highly competitive market area that includes local, national and regional banks as competitors along with savings banks, credit unions, insurance companies, trust companies, registered investment advisors and mutual fund families. The Corporation and its subsidiaries are regulated by many regulatory agencies including the Securities and Exchange Commission (“SEC”), Federal Deposit Insurance Corporation (“FDIC”), the Federal Reserve and the Pennsylvania Department of Banking.
B. Basis of Presentation
The accounting policies of the Corporation conform to U.S. generally accepted accounting principles (“GAAP”) and predominant practices within the banking industry.
The Consolidated Financial Statements include the accounts of the Corporation and its wholly owned subsidiaries. The Corporation’s consolidated financial condition and results of operations consist almost entirely of the Bank’s financial condition and results of operations. All material inter-company transactions and balances have been eliminated.
In preparing the Financial Statements, the Corporation is required to make estimates and assumptions that affect the reported amounts of assets and liabilities, the disclosure of contingent assets and liabilities at the dates of the balance sheets, and the reported amounts of revenues and expenses during the reporting period. Actual results could differ from these estimates.
Although our current estimates contemplate current conditions and how we expect them to change in the future, it is reasonably possible that in 2012, actual conditions could be worse than anticipated in those estimates, which could materially affect our results of operations and financial condition. Amounts subject to significant estimates are items such as the allowance for loan and lease losses and lending related commitments, goodwill and intangible assets, pension and post-retirement obligations, the fair value of financial instruments and other-than-temporary impairments. Among other effects, such changes could result in future impairments of investment securities, goodwill and intangible assets and establishment of allowances for loan losses and lending related commitments as well as increased pension and post-retirement expense.
C. Cash and Cash Equivalents
Cash and cash equivalents include cash and due from banks, interest –bearing deposits, federal funds sold and money market funds with other banks with original maturities of three months or less. Cash balances required to meet regulatory reserve requirements of the Federal Reserve Board amounted to $5.2 million and $4.6 million at December 31, 2011 and December 31, 2010, respectively.
D. Investment Securities – Available for Sale
Investment securities which are held for indefinite periods of time, which the Corporation intends to use as part of its asset/liability strategy, or which may be sold in response to changes in interest rates, changes in prepayment risk, increases in capital requirements, or other similar factors, are classified as available for sale and are carried at fair value. Net unrealized gains and losses for such securities, net of tax, are required to be
| 34 |
recognized as a separate component of shareholders’ equity and excluded from determination of net income. Gains or losses on disposition are based on the net proceeds and cost of the securities sold, adjusted for amortization of premiums and accretion of discounts, using the specific identification method.
Prior to April 1, 2009, declines in the fair value of available-for-sale securities below their cost that were deemed to be other than temporary were reflected in earnings as realized losses. In estimating other-than-temporary impairment losses, the Corporation considers (1) the length of time and the extent to which the fair value has been less than cost, (2) the financial condition and near-term prospects of the issuer and (3) the intent and ability of the Corporation to retain its investment in the issuer for a period of time sufficient to allow for any anticipated recovery in fair value.
Beginning in April 1, 2009, the Corporation implemented ASC 370-10-65-1 “Recognition and Presentation of Other-Than-Temporary Impairments” that amended the accounting for recognizing other-than-temporary impairment for debt securities and expanded disclosure requirements for other-than-temporarily impaired debt and equity securities. Under the new guidance, companies are required to record other-than-temporary impairment charges through earnings if they have the intent to sell, or will more likely than not be required to sell, an impaired debt security before a recovery of its amortized cost basis. In addition, companies are required to record other-than-temporary impairment charges through earnings for the amount of credit losses, regardless of the intent or requirement to sell. Credit loss is measured as the difference between the present value of an impaired debt security’s cash flows and its amortized cost basis. Non-credit-related write-downs to fair value must be recorded as decreases to accumulated other comprehensive income as long as the Corporation has no intent or it is more likely than not that the Corporation would not be required to sell an impaired security before a recovery of amortized cost basis. Since the Corporation did not have any other-than-temporary impairment for 2011 or 2010, the adoption of this guidance has had no impact.
E. Loans Held for Sale
Mortgage loans originated and intended for sale in the secondary market are carried at the lower of cost or estimated fair value in the aggregate. Net unrealized temporary losses, if any, are recognized through a valuation allowance by charges to income.
F. Portfolio Loans and Leases
The Corporation grants construction, commercial, residential mortgage and consumer loans to customers primarily in southeastern Pennsylvania and small-ticket equipment leasing to customers nationwide. Although the Corporation has a diversified loan and lease portfolio, its debtors’ ability to honor their contracts is substantially dependent upon the real estate and general economic conditions of the region.
Loans and leases that the Corporation has the intention and ability to hold for the foreseeable future or until maturity or pay-off, generally are reported at their outstanding principal balance adjusted for charge-offs, the allowance for loan and lease losses and any deferred fees or costs on originated loans and leases. Interest income is accrued on the unpaid principal balance.
Loan and lease origination fees and loan and lease origination costs are deferred and recognized as an adjustment of the related yield using the interest method.
The accrual of interest on loans and leases is generally discontinued at the time the loan is 90 days delinquent unless the credit is well secured and in the process of collection. Loans and leases are placed on non-accrual status or charged-off at an earlier date if collection of principal or interest is considered doubtful. All interest accrued, but not collected for loans that are placed on non-accrual status or charged-off, is reversed against interest income. All interest accrued, but not collected on leases that are placed on non-accrual status is not reversed against interest until the lease is charged-off at 120 days delinquent. The interest received on these non-accrual loans and leases is applied to reduce the carrying value of loans and leases. Loans and leases are returned to accrual status when all the principal and interest amounts contractually due are brought current, remain current for at least six months and future payments are reasonably assured.
In connection with the FKF Merger, the Corporation acquired $274.5 million of loans from FKF. Loans acquired in the merger were recorded at their fair value. The difference between the recorded fair value and the principal value is accreted to interest income over the contractual lives of the loans in accordance with ASC 310-20 (formerly SFAS 91). Certain acquired loans which were deemed to be credit impaired at acquisition are accounted for in accordance with ASC 310-30, as discussed below, in subsectionI of this footnote.
G. Allowance for Loan and Lease Losses
The allowance for loan and lease losses (“Allowance”) is established through a provision for loan and lease losses (“Provision”) charged as an expense. Loans and leases are charged against the allowance when the Corporation believes that the principal is uncollectible. The allowance is maintained at a level that the Corporation believes is sufficient to absorb estimated potential credit losses.
The Corporation’s determination of the adequacy of the allowance is based on periodic evaluations of the loan and lease portfolio and other relevant factors. However, this evaluation is inherently subjective as it requires significant estimates by the Corporation. Consideration is given to a variety of factors in establishing these estimates including specific terms and conditions of loans and leases, underwriting standards, delinquency statistics, historical charge-off history by portfolio segment, industry concentration, overall exposure to a single customer, adequacy of collateral, the dependence on collateral, and results of internal loan review, including a borrower’s perceived financial and management strengths, the amounts and timing of the present value of future cash flows, and access to additional funds.
As part of the process of allocating the allowance to the different segments of the loan and lease portfolio, the Corporation considers certain credit quality indicators. For the commercial mortgage, construction and commercial and industrial loan segments, periodic reviews of the individual loans are performed by both in-house staff as well as external
| 35 |
third-party loan review specialists. The result of these reviews is reflected in the risk grade assigned to each loan. In addition, the remaining segments of the loan and lease portfolio, which include residential mortgage, home equity lines and loans, consumer loans, and leases, are allocated portions of the allowance based on their performance status.
The evaluation process also considers the impact of competition, current and expected economic conditions, national and international events, the regulatory and legislative environment and inherent risks in the loan and lease portfolio. All of these factors may be susceptible to significant change. To the extent actual outcomes differ from the Corporation’s estimates, an additional provision for loan and lease losses may be required that might adversely affect the Corporation’s results of operations in future periods. In addition, various regulatory agencies, as an integral part of their examination processes, periodically review the allowance. Such agencies may require the Corporation to record additions to the allowance based on their judgment of information available to them at the time of their examination.
H. Other Investments and Federal Home Loan Bank Stock
Other investments include Community Reinvestment Act (“CRA”) investments, and equity stocks without a readily determinable fair market value. The Corporation’s investments in equity stocks include those issued by the Federal Home Loan Bank of Pittsburgh (“FHLB”), the Federal Reserve Bank and Atlantic Central Bankers Bank. The Corporation is required to hold FHLB stock as a condition of its borrowing funds from the FHLB. As of December 31, 2011, the carrying value of the Corporation’s FHLB stock was $11.6 million. Ownership of FHLB stock is restricted and there is no market for these securities. In 2008, the FHLB reported significant losses due to numerous factors, including other-than-temporary impairment charges on its portfolio of private-label mortgage-backed securities. The FHLB announced a capital restoration plan in February of 2009 which restricted it from repurchasing or redeeming capital stock or paying dividends. In 2010, the FHLB resumed redemption and repurchase of its stock, repurchasing $749 thousand and $2.6 million from the Corporation in the twelve months ended December 31, 2010 and 2011, respectively. On February 22, 2012, the FHLB announced a quarterly dividend of 0.10% annualized. For further information on the FHLB stock, see Note 10 – “Short-Term and Other Borrowings”.
I. Impaired Loans and Leases
A loan or lease is considered impaired when, based on current information and events, it is probable that the Corporation will be unable to collect the contractually scheduled payments of principal or interest. When assessing impairment, the Corporation considers various factors, which include payment status, realizable value of collateral and the probability of collecting scheduled principal and interest payments when due. Loans and leases that experience insignificant payment delays and payment shortfalls generally are not classified as impaired.
The Corporation determines the significance of payment delays and payment shortfalls on a case-by-case basis, taking into consideration all of the circumstances surrounding the loan and the borrower, including the length of the delay, the reasons for the delay, the borrower’s prior payment record, and the amount of the shortfall in relation to the principal and interest owed.
Impairment is measured by either the present value of expected future cash flows discounted at the loan’s contractual effective interest rate, the loan’s obtainable market price, or the fair value of the collateral if the loan is collateral dependent.
In connection with the FKF Merger, certain loans were acquired which exhibited deteriorated credit quality since origination and for which the Bank does not expect to collect all contractual payments. Accounting for these purchased credit-impaired loans is done in accordance with ASC 310-30. The loans were recorded at fair value, reflecting the present value of the amounts expected to be collected. Income recognition on these loans is based on a reasonable expectation about the timing and amount of cash flows to be collected. Acquired loans deemed impaired and considered collateral dependent, with the timing of the sale of loan collateral indeterminate, remain on non-accrual status and have no accretable yield.
J. Troubled Debt Restructurings (“TDR”s)
A TDR occurs when a creditor, for economic or legal reasons related to a borrower’s financial difficulties, modifies the original terms of the loan or lease or grants a concession to the borrower that it would not otherwise have granted. A concession may include an extension of repayment terms, a reduction in the interest rate or the forgiveness of principal and/or accrued interest. If the debtor is experiencing financial difficulty and the creditor has granted a concession, the Corporation will make the necessary disclosures related to the TDR. In certain cases, a modification may be made in an effort to retain a customer who is not experiencing financial difficulty. This type of modification is not considered to be a TDR.
K. Other Real Estate Owned (“OREO”)
OREO consists of assets that the Corporation has acquired through foreclosure, by accepting a deed in lieu of foreclosure, or by taking possession of assets that were used as loan collateral. The Corporation reports OREO on the balance sheet within other assets, at the lower of cost or estimated fair value less cost to sell, adjusted periodically based on current appraisals. Costs relating to the development or improvement of assets, as well as the costs required to obtain legal title to the property are capitalized, while costs related to holding the property are charged to expense as incurred.
L. Premises and Equipment
Premises and equipment are stated at cost less accumulated depreciation. Depreciation and predetermined rent are recorded using the straight-line method over the estimated useful lives of the assets. Leasehold improvements are amortized over the expected lease term or the estimated useful lives, whichever is shorter.
M. Pension and Postretirement Benefit Plans
The Corporation has three defined benefit pension plans, one postretirement benefit plan and a 401(K) plan as discussed in Note 15 – “401(K) Plan and in Note 16 – Pension and Postretirement Benefit Plans”. Net pension expense consists of service cost, interest cost, return on plan assets, amortization of prior service cost, amortization of transition obligations and amortization of net actuarial gains and losses. The Corporation accrues pension costs as incurred.
| 36 |
N. Bank Owned Life Insurance (“BOLI”)
In connection with the FKF Merger, the Corporation acquired $18.7 million of BOLI.
BOLI is recorded at its cash surrender value on the balance sheet. Income from BOLI is tax-exempt and included as a component of other non-interest income.
O. Accounting for Stock-Based Compensation
Stock-based compensation cost is measured at the grant date, based on the fair value of the award and is recognized as an expense over the vesting period.
All share-based payments, including grants of stock options, restricted stock awards and performance-based stock awards, are recognized as compensation expense in the statement of income at their fair value. The fair value of stock option grants is determined using the Black-Scholes pricing model which considers the expected life of the options, the volatility of stock price, risk-free interest rate and annual dividend yield. The fair value of the restricted stock awards is based on their market value on the grant date, while the fair value of the performance-based stock awards is based on their grant-date market value in addition to the likelihood of attaining certain pre-determined performance goals utilizing the Monte Carlo Simulation model.
Stock-based compensation expense for 2011, 2010 and 2009 were $876 thousand, $539 thousand and $386 thousand, respectively.
P. Earnings Per Common Share
Basic earnings per common share excludes dilution and is computed by dividing income available to common shareholders by the weighted-average common shares outstanding during the period. Diluted earnings per common share takes into account the potential dilution that could occur if stock options were exercised and converted into common shares and restricted stock awards were vested. Proceeds assumed to have been received on options exercises are assumed to be used to purchase shares of the Corporation’s common stock at the average market price during the period, as required by the treasury stock method of accounting. The effects of stock options are excluded from the computation of diluted earnings per share in periods in which the effect would be antidilutive. All weighted average shares, actual shares and per share information in the financial statements have been adjusted retroactively for the effect of stock dividends and splits.
Q. Income Taxes
Income taxes are accounted for under the asset and liability method. Deferred tax assets and liabilities are recognized for the future tax consequences attributable to differences between the financial statement carrying amounts of existing assets and liabilities and their respective tax bases and operating loss and tax credit carry-forwards. Deferred tax assets and liabilities are measured using enacted tax rates expected to apply to taxable income in the years in which those temporary differences are expected to be recovered or settled. The effect on deferred tax assets and liabilities of a change in tax rates is recognized in income in the period that includes the enactment date.
The Corporation recognizes the financial statement benefit of a tax position only after determining that the Corporation would more-likely-than-not sustain the position following an examination. For tax positions meeting the more-likely-than-not threshold, the amount recognized in the financial statements is the largest benefit that has a greater than 50 percent likelihood of being realized upon settlement with the relevant tax authority. The Corporation applied these criteria to tax positions for which the statute of limitations remained open.
R. Revenue Recognition
With the exception of non-accrual loans and leases, the Corporation recognizes all sources of income on the accrual method. Additional information relating to wealth management fee revenue recognition follows:
The Corporation earns Wealth Management fee revenue from a variety of sources including fees from trust administration and other related fiduciary services, custody, investment management and advisory services, employee benefit account and IRA administration, estate settlement, tax service fees, shareholder service fees and brokerage. These fees are generally based on asset values and fluctuate with the market. Some of the revenues are not directly tied to asset value but are based on a flat fee for services provided. For many of our revenue sources, amounts are not received in the same accounting period in which they are earned. However, each source of Wealth Management fees is recorded on the accrual method of accounting.
The most significant portion of the Corporation’s Wealth Management fees is derived from trust administration and other related services, custody, investment management and advisory services, and employee benefit account and IRA administration. These fees are generally billed in arrears, based on the market value of assets at the end of the previous billing period. A smaller number of customers are billed in a similar manner, but on a quarterly or annual basis and some revenues are not based on market values.
The balance of the Corporation’s Wealth Management fees includes estate settlement fees and tax service fees, which are recorded when the related service is performed and asset management and brokerage fees on non-depository investment products, which are received one month in arrears, based on settled transactions. but are accrued in the month the settlement occurs.
Included in other assets on the balance sheet is a receivable for Wealth Management fees that have been earned but not yet collected. This receivable is reviewed quarterly for collectability.
| 37 |
S. Mortgage Servicing
The Corporation performs various servicing functions on loans owned by others. A fee, usually based on a percentage of the outstanding principal balance of the loan, is received for these services. Gain on sale of loans is based on the specific identification method.
Mortgage servicing rights (“MSR”s) are recognized as separate assets when rights are retained through the sale of financial assets. Capitalized servicing rights are amortized into non-interest expense in proportion to, and over the period of, the estimated future net servicing life of the underlying financial assets.
Servicing assets are evaluated quarterly for impairment based upon the fair value of the rights as compared to amortized cost. Impairment is determined by stratifying rights by predominant characteristics, such as interest rate and terms. Fair value is determined based upon discounted cash flows using market-based assumptions. Impairment is recognized on the income statement to the extent the fair value is less than the capitalized amount for the stratum. A valuation allowance is utilized to record temporary impairment in MSRs. Temporary impairment is defined as impairment that is not deemed permanent. Permanent impairment is recorded as a reduction of the MSR and is not reversed.
T. Statement of Cash Flows
The Corporation’s statement of cash flows details operating, investing and financing activities during the reported periods.
U. Goodwill and Intangible Assets
The Corporation accounts for goodwill and other intangible assets in accordance with ASC 350, “Intangibles – Goodwill and Other.” The goodwill and intangible assets as of December 31, 2011, other than MSR’s in Note 1-S above, are related to the acquisitions of Lau Associates and PWMG, which are components of the Wealth Management Segment and FKF, a component of the Banking Segment. The amount of goodwill initially recorded reflects the value assigned to the assets at the time of investment. Goodwill impairment tests are performed at least annually, or when events occur or circumstances change that would more likely than not reduce the fair value of the acquisition or investment.
The Corporation’s impairment testing methodology is consistent with the methodology prescribed in ASC 350. Other intangible assets include the core deposit intangible, which was acquired in the FKF Merger, customer relationships and non-competition agreements acquired in connection with the PWMG Acquisition and the Lau Associates acquisition and a trade name acquired in the Lau Associates acquisition. The core deposit intangible is amortized over a ten year period utilizing a declining balance method. The customer relationships and non-competition agreement intangibles are amortized over the estimated useful lives of the assets which range from 10 to 20 years. The trade name intangible has an indefinite life and is evaluated for impairment annually.
V. Reclassifications
Certain prior year amounts have been reclassified to conform to the current year presentation.
W. Recent Accounting Pronouncements
FASB ASC 820
Accounting Standards Update No. 2010-6 “Improving Disclosures about Fair Value Measurements” (“ASU 2010-06”) was issued in January 2010 to update ASC 820 “Fair Value measurements and Disclosures”. ASU 2010-06 requires new disclosures (1) for significant transfers in and out of Level 1 and Level 2 including a description of the reason for the transfers and (2) in the reconciliation of Level 3 presenting sales, issuances and settlements gross rather than one net number. ASU 2010-06 also requires clarification of existing disclosures requiring (1) measurement disclosures for each “class” of assets and liabilities (a class being a subset of assets and liabilities within one line item in the statement of financial position) using judgment in determining the appropriate classes and (2) disclosures about inputs and valuation techniques used to measure fair value for both recurring and nonrecurring fair value measurements for Level 2 and Level 3. The new disclosures and clarifications of existing disclosures were effective for interim and reporting periods beginning after December 15, 2009, except for the disclosures about purchases, sales, issuances and settlements in the roll forward of activity Level 3 which are effective for fiscal years beginning after December 15, 2010 and for interim periods within those fiscal years. The Corporation made the required disclosures in this Annual Report filed on Form 10-K.
FASB ASU No. 2010-20
Accounting Standards Update No. 2010-20 “Disclosures about Credit Quality of Financial Receivables and the Allowance for Credit Losses” (“ASU 2010-20”) was issued July 2010. The ASU requires disclosure related to period-end information (i.e. credit quality information and the ending financing receivable balance segregated by impairment method) in all interim and annual reporting periods ending on or after December 15, 2010. Disclosures of activity that occur during a reporting period are required in interim or annual periods beginning on or after December 15, 2010. The Corporation adopted ASU 2010-20 and has provided disclosures required by ASU 2010-20 in this Annual Report filed on Form 10-K.
FASB ASU No. 2011-02
Accounting Standards Update No. 2011-02, “A Creditor’s Determination of Whether a Restructuring is a Troubled Debt Restructuring” was issued in April 2011. The amendments in this ASU are effective for the first interim or annual period beginning on or after June 15, 2011, and are applied retrospectively to the beginning of the annual period of adoption. The Corporation has adopted the methodologies prescribed by this ASU.
FASB ASU No. 2011-03
On April 29, 2011, the FASB issued ASU No. 2011-03, “Reconsideration of Effective Control for Repurchase Agreements (Topic 860)”, which removes the collateral maintenance provision that is currently required when determining whether a transfer of a financial instrument is accounted for as a sale or a secured borrowing. The Corporation will adopt ASU No. 2011-03 in its consolidated financial statements in the first quarter of 2012. The Corporation is currently evaluating the impact of this standard on its financial condition, results of operations, and disclosures.
| 38 |
FASB ASU No. 2011-04
On May 12, 2011, the FASB issued ASU No. 2011-04, “Amendments to Achieve Common Fair Value Measurement and Disclosure Requirements in U.S. GAAP and IFRS (Topic 820)”, which is a joint effort between the FASB and IASB to converge fair value measurement and disclosure guidance. The ASU permits measuring financial assets and liabilities on a net credit risk basis, if certain criteria are met. The ASU also increases disclosure surrounding company-determined market price (Level 3) financial instruments and also requires the fair value hierarchy disclosure of financial assets and liabilities that are not recognized at fair value in the statement of financial position, but are included in disclosures at fair value. The Corporation will adopt ASU No. 2011-04 in its consolidated financial statements in the first quarter of 2012. The Corporation is currently evaluating the impact of this standard on its financial condition, results of operations, and disclosures.
FASB ASU No. 2011-05
On June 16, 2011, the FASB issued ASU No. 2011-05, “Presentation of Comprehensive Income (Topic 220)”, which requires companies to report total net income, each component of comprehensive income, and total comprehensive income on the face of the income statement, or as two consecutive statements. The Corporation has adopted ASU No. 2011-05 in its consolidated financial statements.
FASB ASU No. 2011-08
On September 15, 2011, the FASB issued ASU 2011-08, “Intangibles-Goodwill and Other– Testing Goodwill for Impairment. The amendments in this Update will allow an entity to first assess qualitative factors to determine whether it is necessary to perform the two-step quantitative goodwill impairment test. Under these amendments, an entity would not be required to calculate the fair value of a reporting unit unless the entity determines, based on a qualitative assessment, that it is more likely than not that its fair value is less than its carrying amount. The amendments include a number of events and circumstances for an entity to consider in conducting the qualitative assessment. The provisions of ASU 2011-08 will be effective for years beginning after December 15, 2011 for both public and nonpublic entities, although earlier adoption is allowed. The Corporation does not expect that adoption of this standard will have a significant impact on the Company’s consolidated financial statements.
2. BUSINESS COMBINATIONS
Private Wealth Management Group of the Hershey Trust Company
On May 27, 2011, the Acquisition of PWMG by the Corporation was completed. The consideration paid by the Corporation was $18.4 million, of which $8.1 million cash and 322,101 unregistered shares of the BMBC common stock, valued at $6.7 million, were paid at closing, and $3.6 million cash was placed in escrow to be paid in three equal installments on the 6-, 12- and 18-month anniversaries of February 17, 2011, the date preceding the date of the definitive stock purchase agreement, subject to certain post-closing contingencies relating to the assets under management. The first two payments of $1.2 million each were issued on August 31, 2011 and March 2, 2012.
The Acquisition of PWMG initially increased the Corporation’s Wealth Management Division assets under management by $1.1 billion.
The acquisition was accounted for using the acquisition method of accounting and, accordingly, assets acquired, liabilities assumed and consideration paid were recorded at their estimated fair values as of the acquisition date. The excess of consideration paid over the fair value of net assets acquired was recorded as goodwill in the amount of $5.7 million, which will not be amortizable for book purposes, however will be deductible for tax purposes. The Corporation allocated the total balance of goodwill to its Wealth Management segment. The Corporation also recorded an $8.6 million intangible asset for customer relationships, which will be amortized over a 15 year period using an accelerated method and a $3.8 million intangible asset for restrictive covenant agreements, which will be amortized over a five-and-a-half year period using a straight-line method.
The fair values of the intangible assets listed below are estimates and are subject to adjustment; however, while they are not expected to be materially different than those shown. Any adjustments to the estimates will be reflected, retroactively, as of the date of the acquisition.
In connection with the Acquisition of PWMG, the consideration paid and the fair value of identifiable assets acquired and liabilities assumed as of the date of the acquisition are summarized in the following table:
| (dollars in thousands) | ||||
| Consideration paid: | ||||
Common shares issued (322,101 shares) | $ | 6,661 | ||
Cash paid | 9,350 | |||
Cash held in escrow as of December 31, 2011 | 2,400 | |||
|
| |||
Value of consideration | 18,411 | |||
| Assets acquired: | ||||
Intangible asset—customer relationships | 8,610 | |||
Intangible asset—non-compete agreements | 3,830 | |||
Premises and equipment | 250 | |||
|
| |||
Total assets | 12,690 | |||
| Liabilities assumed: | — | |||
| Net assets acquired | 12,690 | |||
|
| |||
| Goodwill resulting from the Acquisition of PWMG | $ | 5,721 | ||
|
| |||
First Keystone Financial, Inc.
On July 1, 2010, the Merger with FKF, and the two step merger of FKF’s wholly-owned subsidiary, FKB with and into the Bank, were completed. In accordance with the terms of the Agreement and Plan of Merger, dated November 3, 2009, by and between the Corporation and FKF, shareholders of FKF received 0.6973 shares of the Corporation’s common stock plus $2.06 per share cash consideration for each share of FKF common stock they owned as of the effective date of the merger. The 85% stock and 15% cash transaction was valued at $31.3 million, based on FKF’s June 30, 2010, closing share price of $13.35 as listed on the NASDAQ stock market. The aggregate consideration paid to FKF shareholders consisted of approximately 1.6 million shares of the Corporation’s common stock, valued at approximately $26.4 million, and approximately $4.8 million in cash. FKF employee stock options, valued at approximately $102 thousand, which were fully vested and converted to options to purchase the Corporation’s common stock upon the closing of the merger, were also included in the total consideration paid. The results of the combined entity’s operations are included in the Corporation’s Consolidated Statements of Income for the period beginning July 1, 2010, the date of the merger.
| 39 |
The Merger with FKF, a federally chartered thrift institution with assets of approximately $480 million, enabled the Corporation to increase its regional footprint with the addition of eight full service branch locations, primarily in Delaware County, Pennsylvania. The geographic locations of the acquired branches were such that it was not necessary to close any of the former FKF branches. By expanding into these new areas within Delaware County, the Corporation will be able to extend its successful sales culture as well as offer its reputable wealth management products and other value-added services to a wider segment of the region’s population. In addition, a large majority of the FKF employees were retained, which will allow the Corporation to maintain the valuable customer relationships that FKF was able to build over the past century.
The FKF Merger was accounted for using the acquisition method of accounting and, accordingly, assets acquired, liabilities assumed and consideration paid were recorded at their estimated fair values as of the acquisition date. The excess of consideration paid over the fair value of net assets acquired was recorded as goodwill in the amount of $9.1 million, which will not be amortizable for book purposes and is not deductible for tax purposes. The Corporation allocated the total balance of goodwill recorded in connection with the merger to its Banking segment. The Corporation also recorded $2.1 million in core deposit intangibles which will be amortized over ten years using a declining balance method.
In connection with the FKF Merger, the consideration paid, and the fair value of identifiable assets acquired and liabilities assumed as of the date of acquisition are summarized in the following table:
| (dollars in thousands) | ||||
| Consideration paid: | ||||
Common shares issued (1,630,053 shares) | $ | 26,391 | ||
Cash paid to FKF shareholders | 4,819 | |||
Fair value of FKF employee stock options | 102 | |||
|
| |||
Value of consideration | 31,312 | |||
| Assets acquired: | ||||
Cash and due from banks | 51,059 | |||
Investment securities | 100,888 | |||
Loans | 274,533 | |||
Premises and equipment | 7,856 | |||
Deferred federal income taxes | 9,408 | |||
Bank owned life insurance | 18,711 | |||
Federal Home Loan Bank (“FHLB”) stock | 7,060 | |||
Core deposit intangible | 2,127 | |||
Other assets | 8,613 | |||
|
| |||
Total assets | 480,255 | |||
| Liabilities assumed: | ||||
Deposits | 320,768 | |||
FHLB advances | 105,734 | |||
Junior subordinated debentures | 12,103 | |||
Repurchase agreements | 13,087 | |||
Other liabilities | 6,992 | |||
|
| |||
Total liabilities | 458,684 | |||
| Net assets acquired | 21,571 | |||
|
| |||
| Goodwill resulting fromMerger with FKF | $ | 9,741 | ||
|
| |||
The following table details the effect on goodwill of the changes in estimates of the fair values of the assets acquired and liabilities assumed from the amounts originally reported on the Form 10-K for the year ended December 31, 2010:
| $00000 | ||||
Goodwill resulting from the Merger with FKF reported on Form 10-K for the year ended December 31, 2010 | $ | 9,741 | ||
Effect of adjustments to: | ||||
Deferred tax asset | (110 | ) | ||
Other assets | (509 | ) | ||
|
| |||
Adjusted goodwill resulting from the Merger with FKF as of December 31, 2011 | $ | 9,122 |
| |
|
|
As of December 31, 2011, the Corporation finalized its fair value estimates related to the merger.
In many cases, the fair values of assets acquired and liabilities assumed were determined by estimating the cash flows expected to result from those assets and liabilities and discounting them at appropriate market rates. The most significant category of assets for which this procedure was used was that of acquired loans. The excess of expected cash flows above the fair value of the majority of loans will be accreted to interest income over the remaining lives of the loans in accordance with Financial Accounting Standards Board (“FASB”) Accounting Standards Codification (“ASC”) 310-20 (formerly SFAS 91).
Certain loans, for which specific credit-related deterioration, since origination, was identified, are recorded at fair value, reflecting the present value of the amounts expected to be collected. Income recognition on these loans is based on a reasonable expectation about the timing and amount of cash flows to be collected. Acquired loans deemed impaired and considered collateral dependent, with the timing of the sale of loan collateral indeterminate, remain on non-accrual status and have no accretable yield. The Corporation uses the cash basis method of interest income recognition for these impaired loans. The following table details the loans that are accounted for in accordance with FASB ASC 310-30 (formerly SOP 03-3) as of July 1, 2010:
Contractually required principal and interest at acquisition | $ | 41,170 |
| |
Contractual cash flows not expected to be collected | 14,856 | |||
|
| |||
Expected cash flows at acquisition | 26,314 | |||
Interest component of expected cash flows (accretable discount) | 7,024 | |||
|
| |||
Fair value of acquired loans accounted for under FASB ASC 310-30 | $ | 19,290 | ||
|
|
In accordance with GAAP, there was no carryover of the allowance for loan losses that had been previously recorded by FKF.
In connection with the FKF Merger, the Corporation acquired an investment portfolio with a fair value of $100.9 million. The fair value of the investment portfolio was determined by taking into account market prices obtained from independent valuation sources.
40
In connection with the FKF Merger, the Corporation recorded a deferred income tax asset of $9.5 million related to FKF’s net operating loss carry-forward, as well as other tax attributes of the acquired company, along with the effects of fair value adjustments resulting from applying the acquisition method of accounting.
The fair value of savings and transaction deposit accounts acquired from FKF was assumed to approximate their carrying value as these accounts have no stated maturity and are payable on demand. Certificates of deposit accounts were valued by comparing the contractual cost of the portfolio to an identical portfolio bearing current market rates. The portfolio was segregated into pools based on remaining maturity. For each pool, the projected cash flows from maturing certificates were then calculated based on contractual rates and prevailing market rates. The valuation adjustment for each pool is equal to the present value of the difference of these two cash flows,
discounted at the assumed market rate for a certificate with a corresponding maturity. This valuation adjustment will be accreted to reduce interest expense over the remaining maturities of the respective pools.
Due to the overnight nature of the repurchase agreements acquired from FKF, their carrying value was used to approximate their fair value as of the acquisition date, and hence, no adjustment to fair value was recorded.
The fair value of the FHLB advances took into account the prepayment penalties that would have been assessed as of July 1, 2010, by the FHLB for their redemption. This fair value adjustment to the face value of the borrowings will be accreted to reduce interest expense over the remaining lives of the respective borrowings.
The fair value of the junior subordinated debentures was determined taking into account the price to call the instruments. The premium to call the debentures decreases annually until August 2017, at which time they may be called at par. The fair value adjustment will be accreted to reduce interest expense over the periods ending in August 2017.
The following table presents unaudited pro forma information as if the Merger with FKF had occurred on both January 1, 2010 and January 1, 2009. This pro forma information gives effect to certain adjustments, including purchase accounting fair value adjustments, amortization of core deposit and other intangibles and related income tax effects.
The pro forma information does not necessarily reflect the results of operations that would have occurred had the Merger with FKF occurred at the beginning of 2010 or 2009.
| Pro forma Twelve Months Ended December 31, | ||||||||
| (dollars in thousands) | 2010 | 2009 | ||||||
Net interest income | $ | 58,568 | $ | 55,735 | ||||
Allowance for loan loss | (11,754 | ) | (9,884 | ) | ||||
Non-interest income | 28,202 | 30,302 | ||||||
Non-interest expense | 66,054 | 65,642 | ||||||
|
|
|
| |||||
Net income | $ | 8,962 | $ | 10,511 | ||||
|
|
|
| |||||
41
3. GOODWILL &OTHERINTANGIBLEASSETS
The Corporation’s goodwill and intangible assets related to the acquisitions of Lau in July, 2008, FKF in July, 2010 and PWMG in May, 2011, for the years ending December 31, 2011 and 2010 are as follows:
| (dollars in thousands) | Beginning Balance 1/1/11 | Additions/ Adjustments | Amortization | Ending Balance 12/31/11 | Amortization Period | |||||||||||||||
| Goodwill—Lau | $ | 7,918 | $ | 1,928 | $ | — | $ | 9,846 | Indefinite | |||||||||||
| Goodwill—FKF | 9,741 | (619 | ) | — | 9,122 | Indefinite | ||||||||||||||
| Goodwill—PWMG | — | 5,721 | — | 5,721 | Indefinite | |||||||||||||||
|
|
|
|
|
|
|
| |||||||||||||
Total | $ | 17,659 | $ | 7,030 | $ | — | $ | 24,689 | ||||||||||||
| Core deposit intangible | 1,951 | — | (323 | ) | 1,628 | 10 Years | ||||||||||||||
| Customer relationships | 4,473 | 8,610 | (707 | ) | 12,376 | 20 Years | ||||||||||||||
| Non compete agreement | 400 | 3,830 | (460 | ) | 3,770 | 10 Years | ||||||||||||||
| Brand (trade name) | 240 | — | — | 240 | Indefinite | |||||||||||||||
|
|
|
|
|
|
|
| |||||||||||||
Total | $ | 7,064 | $ | 12,440 | $ | (1,490 | ) | $ | 18,014 | |||||||||||
|
|
|
|
|
|
|
| |||||||||||||
| Grand Total | $ | 24,723 | $ | 19,470 | $ | (1,490 | ) | $ | 42,703 | |||||||||||
|
|
|
|
|
|
|
| |||||||||||||
| (dollars in thousands) | Beginning Balance 1/1/10 | Additions/ Adjustments | Amortization | Ending Balance 12/31/10 | Amortization Period | |||||||||||||||
| Goodwill—Lau | $ | 6,301 | $ | 1,617 | $ | — | $ | 7,918 | Indefinite | |||||||||||
| Goodwill – FKF | — | 9,741 | — | 9,741 | Indefinite | |||||||||||||||
|
|
|
|
|
|
|
| |||||||||||||
Total | $ | 6,301 | $ | 11,358 | $ | — | $ | 17,659 | ||||||||||||
| Core deposit intangible | — | 2,127 | (176 | ) | 1,951 | 10 Years | ||||||||||||||
| Customer relationships | 4,728 | — | (255 | ) | 4,473 | 20 Years | ||||||||||||||
| Non compete agreement | 453 | — | (53 | ) | 400 | 10 Years | ||||||||||||||
| Brand (trade name) | 240 | — | — | 240 | Indefinite | |||||||||||||||
|
|
|
|
|
|
|
| |||||||||||||
Total | $ | 5,421 | $ | 2,127 | $ | (484 | ) | $ | 7,064 | |||||||||||
|
|
|
|
|
|
|
| |||||||||||||
Grand Total | $ | 11,722 | $ | 13,485 | $ | (484 | ) | $ | 24,723 | |||||||||||
|
|
|
|
|
|
|
| |||||||||||||
Under the terms of the Lau Associates acquisition, the Corporation recorded the final earn-out payment of $1.9 million, which will be payable during the first quarter of 2012.
4. INVESTMENT SECURITIES
The amortized cost and estimated fair value of investments, all of which were classified as available for sale, are as follows:
As of December 31, 2011
| (dollars in thousands) | Amortized Cost | Gross Unrealized Gains | Gross Unrealized (Losses) | Estimated Fair Value | ||||||||||||
| Obligations of the U.S. government and agencies | $ | 104,252 | $ | 397 | $ | (79 | ) | $ | 104,570 | |||||||
| Obligations of state and political subdivisions | 8,210 | 158 | (2 | ) | 8,366 | |||||||||||
| Mortgage-backed securities | 95,713 | 2,160 | (39 | ) | 97,834 | |||||||||||
| Collateralized mortgage obligations | 32,418 | 251 | (46 | ) | 32,623 | |||||||||||
| Corporate bonds | 12,616 | 194 | (92 | ) | 12,718 | |||||||||||
| Investment certificates of deposit | 2,411 | 10 | (1 | ) | 2,420 | |||||||||||
| Other debt securities | 1,900 | — | (18 | ) | 1,882 | |||||||||||
|
|
|
|
|
|
|
| |||||||||
Total fixed income investments | $ | 257,520 | $ | 3,170 | $ | (277 | ) | $ | 260,413 | |||||||
| Bond—mutual funds | 12,091 | 9 | (196 | ) | 11,904 | |||||||||||
|
|
|
|
|
|
|
| |||||||||
Total non-maturity investments | $ | 12,091 | $ | 9 | $ | (196 | ) | $ | 11,904 | |||||||
|
|
|
|
|
|
|
| |||||||||
Total | $ | 269,611 | $ | 3,179 | $ | (473 | ) | $ | 272,317 | |||||||
|
|
|
|
|
|
|
| |||||||||
As of December 31, 2010
| (dollars in thousands) | Amortized Cost | Gross Unrealized Gains | Gross Unrealized (Losses) | Estimated Fair Value | ||||||||||||
| U.S. treasury obligations | $ | 5,011 | $ | 134 | $ | — | $ | 5,145 | ||||||||
| Obligations of the U.S. Government and agencies | 156,301 | 704 | (367 | ) | 156,638 | |||||||||||
| Obligations of state and political subdivisions | 32,013 | 358 | (99 | ) | 32,272 | |||||||||||
| Mortgage-backed securities | 72,907 | 866 | (246 | ) | 73,527 | |||||||||||
| Collateralized mortgage obligations | 2,068 | 30 | — | 2,098 | ||||||||||||
| Corporate bonds | 10,803 | — | (159 | ) | 10,644 | |||||||||||
| Other debt securities | 1,750 | — | — | 1,750 | ||||||||||||
|
|
|
|
|
|
|
| |||||||||
Total fixed income investments | $ | 280,853 | $ | 2,092 | $ | (871 | ) | $ | 282,074 | |||||||
| Bond—mutual funds | $ | 34,491 | $ | 241 | $ | (10 | ) | $ | 34,722 | |||||||
| Equity securities | 243 | 13 | — | 256 | ||||||||||||
|
|
|
|
|
|
|
| |||||||||
Total non-maturity investments | $ | 34,734 | $ | 254 | $ | (10 | ) | $ | 34,978 | |||||||
|
|
|
|
|
|
|
| |||||||||
Total | $ | 315,587 | $ | 2,346 | $ | (881 | ) | $ | 317,052 | |||||||
|
|
|
|
|
|
|
| |||||||||
42
The following table shows the amount of securities that were in an unrealized loss position at December 31, 2011:
| (dollars in thousands) | Less than 12 Months | 12 Months or Longer | Total | |||||||||||||||||||||
| Fair Value | Unrea- lized (Losses) | Fair Value | Unrea- lized (Losses) | Fair Value | Unrea- lized Losses | |||||||||||||||||||
Obligations of the U.S. government and agencies | $ | 23,457 | $ | (79 | ) | $ | — | $ | — | $ | 23,457 | $ | (79 | ) | ||||||||||
Obligations of state and political subdivisions | 620 | (2 | ) | — | — | 620 | (2 | ) | ||||||||||||||||
Mortgage-backed securities | 7,696 | (22 | ) | 4,886 | (17 | ) | 12,582 | (39 | ) | |||||||||||||||
Collateralized mortgage obligations | 7,440 | (46 | ) | — | — | 7,440 | (46 | ) | ||||||||||||||||
Corporate bonds | 2,912 | (92 | ) | — | — | 2,912 | (92 | ) | ||||||||||||||||
Investment certificates of deposit | 442 | (1 | ) | — | — | 442 | (1 | ) | ||||||||||||||||
Other debt securities | 982 | (18 | ) | — | — | 982 | (18 | ) | ||||||||||||||||
|
|
|
|
|
|
|
|
|
|
|
| |||||||||||||
Total fixed income investments | $ | 43,549 | $ | (260 | ) | $ | 4,886 | $ | (17 | ) | $ | 48,435 | $ | (277 | ) | |||||||||
Bond—mutual funds | $ | 11,260 | $ | (196 | ) | $ | — | $ | — | $ | 11,260 | $ | (196 | ) | ||||||||||
|
|
|
|
|
|
|
|
|
|
|
| |||||||||||||
Total | $ | 54,809 | $ | (456 | ) | $ | 4,886 | $ | (17 | ) | $ | 59,695 | $ | (473 | ) | |||||||||
|
|
|
|
|
|
|
|
|
|
|
| |||||||||||||
The following table shows the amount of securities that were in an unrealized loss position at December 31, 2010:
| (dollars in thousands) | Less than 12 Months | 12 Months or Longer | Total | |||||||||||||||||||||
| Fair Value | Unrea- lized (Losses) | Fair Value | Unrea- lized (Losses) | Fair Value | Unrea- lized Losses | |||||||||||||||||||
Obligations of the U.S. Government and agencies | $ | 46,027 | $ | (367 | ) | $ | — | $ | — | $ | 46,027 | $ | (367 | ) | ||||||||||
Obligations of state and political subdivisions | 10,158 | (99 | ) | — | — | 10,158 | (99 | ) | ||||||||||||||||
Mortgage-backed securities | 32,765 | (246 | ) | — | — | 32,765 | (246 | ) | ||||||||||||||||
Corporate bonds | 10,645 | (159 | ) | — | — | 10,645 | (159 | ) | ||||||||||||||||
|
|
|
|
|
|
|
|
|
|
|
| |||||||||||||
Total fixed income investments | $ | 99,595 | $ | (871 | ) | $ | — | $ | — | $ | 99,595 | $ | (871 | ) | ||||||||||
Bond—mutual funds | $ | 603 | $ | (10 | ) | $ | — | $ | — | $ | 603 | $ | (10 | ) | ||||||||||
|
|
|
|
|
|
|
|
|
|
|
| |||||||||||||
Total | $ | 100,198 | $ | (881 | ) | $ | — | $ | — | $ | 100,198 | $ | (881 | ) | ||||||||||
|
|
|
|
|
|
|
|
|
|
|
| |||||||||||||
Management evaluates the Corporation’s investment securities that are in an unrealized loss position in order to determine if the decline in market value is other than temporary. The investment portfolio includes debt securities issued by U.S. government agencies, U.S. government-sponsored agencies, state and local municipalities and other issuers. All fixed income investment securities in the Corporation’s investment portfolio are rated as investment-grade or higher. Factors considered in the evaluation include the current economic climate, the length of time and the extent to which the fair value has been below cost, interest rates and the bond rating of each security. The unrealized losses presented in the tables above are temporary in nature and are primarily related to market interest rates rather than the underlying credit quality of the issuers. Management does not believe that these unrealized losses are
other-than-temporary. The Corporation does not have the intent to sell these securities prior to their maturity or the recovery of their cost bases and believes that it is more likely than not, that it will not have to sell these securities prior to their maturity or the recovery of their cost bases.
At December 31, 2011, securities having fair value of $135.3 million were specifically pledged as collateral for public funds, trust deposits, the FRB discount window program, FHLB borrowings and other purposes. The FHLB has a blanket lien on non-pledged, mortgage-related loans and securities as part of the Corporation’s borrowing agreement with the FHLB.
The amortized cost and estimated fair value of investment and mortgage-related securities as of December 31, 2011 and 2010, by contractual maturity, are shown below. Expected maturities will differ from contractual maturities because borrowers may have the right to call or prepay obligations with or without call or prepayment penalties.
| December 31, 2011 | ||||||||
| (dollars in thousands) | Amortized Cost | Estimated Market Value | ||||||
Investment securities*: | ||||||||
Due in one year or less | $ | 900 | $ | 900 | ||||
Due after one year through five years | 54,046 | 54,349 | ||||||
Due after five years through ten years | 48,210 | 48,354 | ||||||
Due after ten years | 26,233 | 26,353 | ||||||
|
|
|
| |||||
Subtotal | 129,389 | 129,956 | ||||||
Mortgage-related securities | $ | 128,131 | $ | 130,457 | ||||
|
|
|
| |||||
Total | $ | 257,520 | $ | 260,413 | ||||
|
|
|
| |||||
| * | Included in the investment portfolio, but not in the table above, are $11.9 million of bond mutual funds which have no stated maturity or constant stated coupon rate. |
| December 31, 2010 | ||||||||
| (dollars in thousands) | Amortized Cost | Estimated Market Value | ||||||
Investment securities*: | ||||||||
Due in one year or less | $ | 6,223 | $ | 6,231 | ||||
Due after one year through five years | 104,499 | 104,803 | ||||||
Due after five years through ten years | 79,060 | 79,288 | ||||||
Due after ten years | 16,096 | 16,127 | ||||||
|
|
|
| |||||
Subtotal | 205,878 | 206,449 | ||||||
Mortgage-related securities | $ | 74,975 | $ | 75,625 | ||||
|
|
|
| |||||
Total | $ | 280,853 | $ | 282,074 | ||||
|
|
|
| |||||
| * | Included in the investment portfolio, but not in the table above, are $34.5 million of bond mutual funds which have no stated maturity or constant stated coupon rate, as well as the Corporation’s $243 thousand investment in an equity security |
Proceeds from the sale of available for sale investment securities totaled $89.7 million, $88.0 million and $62.9 million for the twelve months ended December 31, 2011, 2010 and 2009, respectively. Gain on sale of available for sale investment securities for the twelve months ended December 31, 2011, 2010 and 2009 totaled $1.8 million, $2.5 million and $1.9 million, respectively.
| 43 |
5. LOANS AND LEASES
A. Loans and leases outstanding are detailed by portfolio segment as follows:
| December 31, | ||||||||
| (dollars in thousands) | 2011 | 2010 | ||||||
Loans held for sale | $ | 1,588 | $ | 4,838 | ||||
|
|
|
| |||||
Real estate loans: | ||||||||
Commercial mortgage | $ | 419,130 | 385,615 | |||||
Home equity lines and loans | 207,917 | 216,853 | ||||||
Residential mortgage | 306,478 | 261,983 | ||||||
Construction | 52,844 | 45,403 | ||||||
|
|
|
| |||||
Total real estate loans | 986,369 | 909,854 | ||||||
Commercial and industrial | 267,204 | 239,266 | ||||||
Consumer | 11,429 | 12,200 | ||||||
Leases | 30,390 | 35,397 | ||||||
|
|
|
| |||||
Total portfolio loans and leases | 1,295,392 | 1,196,717 | ||||||
|
|
|
| |||||
Total loans and leases | $ | 1,296,980 | $ | 1,201,555 | ||||
|
|
|
| |||||
Loans with predetermined rates | $ | 608,490 | $ | 544,784 | ||||
Loans with adjustable or floating rates | 688,490 | 656,771 | ||||||
|
|
|
| |||||
Total loans and leases | $ | 1,296,980 | $ | 1,201,555 | ||||
|
|
|
| |||||
Net deferred loan origination costs included in the above loan table | $ | 563 | $ | 378 | ||||
|
|
|
| |||||
B. Leases outstanding at December 31 are detailed by components of the net investment as follows:
| December 31, | ||||||||
| (dollars in thousands) | 2011 | 2010 | ||||||
Minimum lease payments receivable | $ | 34,143 | $ | 39,711 | ||||
Unearned lease income | (5,080 | ) | (5,808 | ) | ||||
Initial direct costs and deferred fees | 1,327 | 1,494 | ||||||
|
|
|
| |||||
Total | $ | 30,390 | $ | 35,397 | ||||
|
|
|
| |||||
C. Non-Performing Loans and Leases*
| December 31, | ||||||||
| (dollars in thousands) | 2011 | 2010 | ||||||
Non-accrual loans and leases: | ||||||||
Commercial mortgage | $ | 1,043 | $ | 1,911 | ||||
Home equity lines and loans | 2,678 | 987 | ||||||
Residential mortgage | 3,228 | 4,411 | ||||||
Construction | 4,901 | 202 | ||||||
Commercial and industrial | 2,305 | 1,692 | ||||||
Consumer | 5 | 15 | ||||||
Leases | 155 | 279 | ||||||
|
|
|
| |||||
Total | 14,315 | 9,497 | ||||||
|
|
|
| |||||
Loans and leases 90 days or more past due and still accruing: | ||||||||
Home equity lines and loans | — | — | ||||||
Commercial and industrial | — | — | ||||||
Consumer | — | 10 | ||||||
|
|
|
| |||||
Total | — | 10 | ||||||
|
|
|
| |||||
Total non-performing loans and leases | $ | 14,315 | $ | 9,507 | ||||
|
|
|
| |||||
| * | Purchased credit-impaired loans, which have been recorded at their fair values at the FKF Merger date and which are performing as expected are excluded from this table with the exception of $1.5 million and $785 thousand as of |
December 31, 2011 and 2010, respectively, of purchased credit-impaired loans which became non-performing subsequent to the merger.
D. Purchased Credit-Impaired Loans
The outstanding principal balance and related carrying amount of credit-impaired loans, for which the Corporation applies ASC 310-30 to account for the interest earned, as of the dates indicated, is as follows:
| December 31, | ||||||||
| (dollars in thousands) | 2011 | 2010 | ||||||
Outstanding principal balance | $ | 22,749 | $ | 27,489 | ||||
Carrying amount(1) | 13,993 | 17,837 | ||||||
| (1) | Includes $678 thousand and $1.1 million of purchased credit-impaired loans as of December 31, 2011 and 2010, respectively, for which the Corporation could not estimate the timing or amount of expected cash flows to be collected at the FKF Merger date, and for which no accretable yield is recognized. Additionally, the table above includes $1.5 million and $785 thousand as of December 31, 2011 and 2010, respectively, of purchased credit-impaired loans that subsequently became non-performing, which are disclosed in Note 5C, above, and which also have no accretable yield. |
The following table presents changes in the accretable discount on purchased credit-impaired loans, for which the Corporation applies ASC 310-30, for the twelve months ended December 31, 2011:
| (dollars in thousands) | Accretable Discount | |||
Balance, December 31, 2010 | $ | 6,333 | ||
Accretion | (1,299 | ) | ||
Reclassification from nonaccretable difference | 3,944 | |||
Net additions/subtractions due to loan term modifications | 868 | |||
Disposals | (309 | ) | ||
|
| |||
Balance, December 31, 2011 | $ | 9,537 | ||
|
| |||
44
E. Age Analysis of Past Due Loans and Leases
The following tables present an aging of the Corporation’s loan and lease portfolio as of December 31, 2011 and 2010:
| (dollars in thousands) | 60 – 89 | |||||||||||||||||||||||||||||||
| 30 –59 Days Past Due | Days Past Due | Over 89 Days Past Due | Total Past Due | Current | Total Loans and Leases | Over 89 Days and Accruing | Delinquency %* | |||||||||||||||||||||||||
As of December 31, 2011 | ||||||||||||||||||||||||||||||||
Commercial mortgage | $ | 193 | $ | 171 | $ | 1,311 | $ | 1,675 | $ | 417,455 | $ | 419,130 | $ | — | 0.40 | % | ||||||||||||||||
Home equity lines and loans | 330 | 199 | 2,235 | 2,764 | 205,153 | 207,917 | — | 1.33 | % | |||||||||||||||||||||||
Residential mortgage | 1,455 | 907 | 1,856 | 4,218 | 302,260 | 306,478 | — | 1.38 | % | |||||||||||||||||||||||
Construction | — | — | 4,853 | 4,853 | 47,991 | 52,844 | — | 9.18 | % | |||||||||||||||||||||||
Commercial and industrial | 279 | 1,513 | 2,089 | 3,881 | 263,323 | 267,204 | — | 1.45 | % | |||||||||||||||||||||||
Consumer | 33 | — | 4 | 37 | 11,392 | 11,429 | — | 0.32 | % | |||||||||||||||||||||||
Leases | 156 | 75 | 145 | 376 | 30,014 | 30,390 | — | 1.24 | % | |||||||||||||||||||||||
|
|
|
|
|
|
|
|
|
|
|
|
|
| |||||||||||||||||||
| $ | 2,446 | $ | 2,865 | $ | 12,493 | $ | 17,804 | $ | 1,277,588 | $ | 1,295,392 | $ | — | 1.37 | % | |||||||||||||||||
|
|
|
|
|
|
|
|
|
|
|
|
|
| |||||||||||||||||||
| * | Delinquency equals [“Total past due” plus “Over 89 and accruing”] /[Total loans and leases] |
| (dollars in thousands) | 30 –59 Days Past Due | 60 – 89 Days Past Due | Over 89 Days Past Due | Total Past Due | Current | Total Loans and Leases | Over 89 Days and Accruing | Delinquency %* | ||||||||||||||||||||||||
As of December 31, 2010 | ||||||||||||||||||||||||||||||||
Commercial mortgage | $ | 377 | $ | — | $ | 1,854 | $ | 2,231 | $ | 383,384 | $ | 385,615 | $ | — | 0.58 | % | ||||||||||||||||
Home equity lines and loans | 958 | 981 | 988 | 2,927 | 213,926 | 216,853 | — | 1.35 | % | |||||||||||||||||||||||
Residential mortgage | 958 | 1,089 | 1,885 | 3,932 | 258,051 | 261,983 | — | 1.50 | % | |||||||||||||||||||||||
Construction | 1,730 | 201 | — | 1,931 | 43,472 | 45,403 | — | 4.25 | % | |||||||||||||||||||||||
Commercial and industrial | 1,467 | 68 | 1,344 | 2,879 | 236,387 | 239,266 | — | 1.20 | % | |||||||||||||||||||||||
Consumer | 21 | 3 | 23 | 47 | 12,153 | 12,200 | 10 | 0.47 | % | |||||||||||||||||||||||
Leases | 244 | 257 | 203 | 704 | 34,693 | 35,397 | — | 1.99 | % | |||||||||||||||||||||||
|
|
|
|
|
|
|
|
|
|
|
|
|
| |||||||||||||||||||
| $ | 5,755 | $ | 2,599 | $ | 6,297 | $ | 14,651 | $ | 1,182,066 | $ | 1,196,717 | $ | 10 | 1.23 | % | |||||||||||||||||
|
|
|
|
|
|
|
|
|
|
|
|
|
| |||||||||||||||||||
| * | Delinquency equals [“Total past due” plus “Over 89 and accruing”] /[Total loans and leases] |
F. Allowance for Loan and Lease Losses (the “Allowance”)
The following table details the roll-forward of the Corporation’s allowance for loan and lease losses for the twelve month periods ended December 31, 2011, 2010, 2009:
| (dollars in thousands) | For the Twelve Months Ended December 31, | |||||||||||
| 2011 | 2010 | 2009 | ||||||||||
Balance, beginning of period | $ | 10,275 | $ | 10,424 | $ | 10,332 | ||||||
Charge-offs | (4,648 | ) | (10,694 | ) | (7,370 | ) | ||||||
Recoveries | 1,038 | 691 | 578 | |||||||||
Provision for loan and lease losses | 6,088 | 9,854 | 6,884 | |||||||||
|
|
|
|
|
| |||||||
Balance, end of period | $ | 12,753 | $ | 10,275 | $ | 10,424 | ||||||
|
|
|
|
|
| |||||||
The following table details the roll-forward of the Corporation’s allowance for loan and lease losses, by portfolio segment, for the twelve months ended December 31, 2011:
| (dollars in thousands) | Commercial Mortgage | Home Equity Lines and Loans | Residential Mortgage | Construction | Commercial and Industrial | Consumer | Leases | Unallocated | Total | |||||||||||||||||||||||||||
Balance, December 31, 2010 | $ | 2,534 | $ | 1,563 | $ | 843 | $ | 633 | $ | 3,565 | $ | 115 | $ | 766 | $ | 256 | $ | 10,275 | ||||||||||||||||||
Charge-offs | (827 | ) | (514 | ) | (391 | ) | (1,174 | ) | (633 | ) | (92 | ) | (1,017 | ) | — | (4,648 | ) | |||||||||||||||||||
Recoveries | — | 190 | — | — | 307 | 11 | 530 | — | 1,038 | |||||||||||||||||||||||||||
Provision for loan and lease losses | 1,458 | 468 | 1,140 | 1,925 | 577 | 85 | 253 | 182 | 6,088 | |||||||||||||||||||||||||||
|
|
|
|
|
|
|
|
|
|
|
|
|
|
|
|
|
| |||||||||||||||||||
Balance, December 31, 2011 | $ | 3,165 | $ | 1,707 | $ | 1,592 | $ | 1,384 | $ | 3,816 | $ | 119 | $ | 532 | $ | 438 | $ | 12,753 | ||||||||||||||||||
|
|
|
|
|
|
|
|
|
|
|
|
|
|
|
|
|
| |||||||||||||||||||
45
The following table details the allocation of the allowance for loan and lease losses by portfolio segment based on the methodology used to evaluate the loans and leases for impairment as of December 31, 2011 and 2010:
| (dollars in thousands) | Commercial Mortgage | Home Equity Lines and Loans | Residential Mortgage | Construction | Commercial and Industrial | Consumer | Leases | Unallocated | Total | |||||||||||||||||||||||||||
As of December 31, 2011 | ||||||||||||||||||||||||||||||||||||
Allowance on loans and leases: | ||||||||||||||||||||||||||||||||||||
Individually evaluated for impairment | $ | — | $ | 75 | $ | 358 | $ | 640 | $ | 248 | $ | — | $ | — | $ | — | $ | 1,321 | ||||||||||||||||||
Collectively evaluated for impairment | 3,153 | 1,632 | 1,234 | 741 | 3,568 | 119 | 532 | 438 | 11,417 | |||||||||||||||||||||||||||
Purchased credit-impaired* | 12 | — | — | 3 | — | — | — | — | 15 | |||||||||||||||||||||||||||
|
|
|
|
|
|
|
|
|
|
|
|
|
|
|
|
|
| |||||||||||||||||||
Total | $ | 3,165 | $ | 1,707 | $ | 1,592 | $ | 1,384 | $ | 3,816 | $ | 119 | $ | 532 | $ | 438 | $ | 12,753 | ||||||||||||||||||
|
|
|
|
|
|
|
|
|
|
|
|
|
|
|
|
|
| |||||||||||||||||||
As of December 31, 2010 | — | |||||||||||||||||||||||||||||||||||
Allowance on loans and leases: | ||||||||||||||||||||||||||||||||||||
Individually evaluated for impairment | $ | 152 | $ | 390 | $ | 56 | $ | 160 | $ | 83 | $ | — | $ | — | $ | — | $ | 841 | ||||||||||||||||||
Collectively evaluated for impairment | 2,382 | 1,173 | 787 | 473 | 3,482 | 115 | 766 | 256 | 9,434 | |||||||||||||||||||||||||||
Purchased credit-impaired* | — | — | — | — | — | — | — | — | — | |||||||||||||||||||||||||||
|
|
|
|
|
|
|
|
|
|
|
|
|
|
|
|
|
| |||||||||||||||||||
Total | $ | 2,534 | $ | 1,563 | $ | 843 | $ | 633 | $ | 3,565 | $ | 115 | $ | 766 | $ | 256 | $ | 10,275 | ||||||||||||||||||
|
|
|
|
|
|
|
|
|
|
|
|
|
|
|
|
|
| |||||||||||||||||||
The following table details the carrying value for loans and leases by portfolio segment based on the methodology used to evaluate the loans and leases for impairment as of December 31, 2011 and 2010:
| (dollars in thousands) | Commercial Mortgage | Home Equity Lines and Loans | Residential Mortgage | Construction | Commercial and Industrial | Consumer | Leases | Total | ||||||||||||||||||||||||
As of December 31, 2011 | ||||||||||||||||||||||||||||||||
Balance of loans and leases: | ||||||||||||||||||||||||||||||||
Individually evaluated for impairment | $ | — | $ | 2,714 | $ | 8,146 | $ | 6,062 | $ | 2,393 | $ | 5 | $ | — | $ | 19,320 | ||||||||||||||||
Collectively evaluated for impairment | 407,095 | 205,172 | 298,018 | 45,696 | 264,286 | 11,424 | 30,390 | 1,262,081 | ||||||||||||||||||||||||
Purchased credit-impaired* | 12,035 | 31 | 314 | 1,086 | 525 | — | — | 13,991 | ||||||||||||||||||||||||
|
|
|
|
|
|
|
|
|
|
|
|
|
|
|
| |||||||||||||||||
Total | $ | 419,130 | $ | 207,917 | $ | 306,478 | $ | 52,844 | $ | 267,204 | $ | 11,429 | $ | 30,390 | $ | 1,295,392 | ||||||||||||||||
|
|
|
|
|
|
|
|
|
|
|
|
|
|
|
| |||||||||||||||||
As of December 31, 2010 | ||||||||||||||||||||||||||||||||
Balance of loans and leases: | ||||||||||||||||||||||||||||||||
Individually evaluated for impairment | $ | 2,615 | $ | 749 | $ | 2,480 | $ | 1,875 | $ | 896 | $ | — | $ | — | $ | 8,615 | ||||||||||||||||
Collectively evaluated for impairment | 371,692 | 215,991 | 259,165 | 38,179 | 237,643 | 12,198 | 35,397 | 1,170,265 | ||||||||||||||||||||||||
Purchased credit-impaired* | 11,308 | 113 | 338 | 5,349 | 727 | 2 | — | 17,837 | ||||||||||||||||||||||||
|
|
|
|
|
|
|
|
|
|
|
|
|
|
|
| |||||||||||||||||
Total | $ | 385,615 | $ | 216,853 | $ | 261,983 | $ | 45,403 | $ | 239,266 | $ | 12,200 | $ | 35,397 | $ | 1,196,717 | ||||||||||||||||
|
|
|
|
|
|
|
|
|
|
|
|
|
|
|
| |||||||||||||||||
| * | Purchased credit-impaired loans are evaluated for impairment on an individual basis |
As part of the process of allocating the allowance to the different segments of the loan and lease portfolio, Management considers certain credit quality indicators. For the commercial mortgage, construction and commercial and industrial loan segments, periodic reviews, at least quarterly, of the individual loans are performed by both in-house staff as well as external loan reviewers. The result of these reviews is reflected in the risk grade assigned to each loan. These internally assigned grades are as follows:
| • | Pass – Loans considered to be satisfactory with no indications of deterioration. |
| • | Special mention—Loans classified as special mention have a potential weakness that deserves management’s close attention. If left uncorrected, these potential weaknesses may result in deterioration of the repayment prospects for the loan or of the institution’s credit position at some future date. |
| • | Substandard—Loans classified as substandard are inadequately protected by the current net worth and payment capacity of the obligor or of the collateral pledged, if any. Substandard loans have a well-defined weakness or weaknesses that jeopardize the liquidation of the debt. They are characterized by the distinct possibility that the institution will sustain some loss if the deficiencies are not corrected. |
| • | Doubtful—Loans classified as doubtful have all the weaknesses inherent in those classified as substandard, with the added characteristic that the weaknesses make collection or liquidation in full, on the basis of currently existing facts, conditions, and values, highly questionable and improbable. |
In addition, the remaining segments of the loan and lease portfolio, which include residential mortgage, home equity lines and loans, consumer, and leases, are allocated portions of the allowance based on their performance status.
The following tables detail the carrying value of loans and leases by portfolio segment based on the credit quality indicators used to allocate the allowance for loan and lease losses as of December 31, 2011 and 2010:
46
Credit Risk Profile by Internally Assigned Grade
| (dollars in thousands) | Commercial Mortgage | Construction | Commercial and Industrial | Total | ||||||||||||||||||||||||||||
| As of December 31, | 2011 | 2010 | 2011 | 2010 | 2011 | 2010 | 2011 | 2010 | ||||||||||||||||||||||||
Pass | $ | 414,250 | $ | 373,098 | $ | 38,367 | $ | 36,230 | $ | 260,050 | $ | 232,717 | $ | 712,667 | $ | 642,045 | ||||||||||||||||
Special Mention | 1,932 | 9,141 | 3,704 | 6,486 | 1,459 | 4,969 | 7,095 | 20,596 | ||||||||||||||||||||||||
Substandard | 2,948 | 1,680 | 10,521 | 2,687 | 5,523 | 735 | 18,992 | 5,102 | ||||||||||||||||||||||||
Doubtful1 | — | 1,696 | 252 | — | 172 | 845 | 424 | 2,541 | ||||||||||||||||||||||||
|
|
|
|
|
|
|
|
|
|
|
|
|
|
|
| |||||||||||||||||
Total | $ | 419,130 | $ | 385,615 | $ | 52,844 | $ | 45,403 | $ | 267,204 | $ | 239,266 | $ | 739,178 | $ | 670,284 | ||||||||||||||||
|
|
|
|
|
|
|
|
|
|
|
|
|
|
|
| |||||||||||||||||
| 1 | Loans balances classified as “Doubtful” have been reduced by partial charge-offs, and are carried at their net realizable value. |
Credit Risk Profile Based on Payment Activity
| (dollars in thousands) | Residential Mortgage | Home Equity Lines and Loans | Consumer | Leases | Total | |||||||||||||||||||||||||||||||||||
| As of December 31, | 2011 | 2010 | 2011 | 2010 | 2011 | 2010 | 2011 | 2010 | 2011 | 2010 | ||||||||||||||||||||||||||||||
Performing | $ | 303,250 | $ | 257,572 | $ | 205,239 | $ | 215,866 | $ | 11,424 | $ | 12,175 | $ | 30,235 | $ | 35,118 | $ | 550,148 | $ | 520,731 | ||||||||||||||||||||
Non-performing | 3,228 | 4,411 | 2,678 | 987 | 5 | 25 | 155 | 279 | 6,066 | 5,702 | ||||||||||||||||||||||||||||||
|
|
|
|
|
|
|
|
|
|
|
|
|
|
|
|
|
|
|
| |||||||||||||||||||||
Total | $ | 306,478 | $ | 261,983 | $ | 207,917 | $ | 216,853 | $ | 11,429 | $ | 12,200 | $ | 30,390 | $ | 35,397 | $ | 556,214 | $ | 526,433 | ||||||||||||||||||||
|
|
|
|
|
|
|
|
|
|
|
|
|
|
|
|
|
|
|
| |||||||||||||||||||||
G. Troubled Debt Restructurings (“TDRs”):
The restructuring of a loan is considered a “troubled debt restructuring” if both of the following conditions are met: (i) the borrower is experiencing financial difficulties, and (ii) the creditor has granted a concession. The most common concessions granted include one or more modifications to the terms of the debt, such as (a) a reduction in the interest rate for the remaining life of the debt, (b) an extension of the maturity date at an interest rate lower than the current market rate for new debt with similar risk, (c) a temporary period of interest-only payments, (d) a reduction in the contractual payment amount for either a short period or remaining term of the loan, or (e) for leases, a reduced lease payment. A less common concession granted is the forgiveness of a portion of the principal.
The determination of whether a borrower is experiencing financial difficulties takes into account not only the current financial condition of the borrower, but also the potential financial condition of the borrower, were a concession not granted. Similarly, the determination of whether a concession has been granted is very subjective in nature. For example, simply extending the term of a loan at its original interest rate or even at a higher interest rate could be interpreted as a concession unless the borrower could readily obtain similar credit terms from a different lender.
The Corporation has adopted the provisions of Accounting Standards Update (“ASU”) No. 2011-02, “Receivables (Topic 310)—A Creditor’s Determination of Whether a Restructuring Is a Troubled Debt Restructuring.” As such, the Corporation reassessed all loan and lease modifications occurring since January 1, 2011 for identification as troubled debt restructurings. The reassessment of all loan and lease modifications since January 1, 2011 did not uncover any previously undisclosed TDRs.
The following table presents the balance of TDRs as of the indicated dates:
| (dollars in thousands) | December 31, 2011 | December 31, 2010 | ||||||
TDRs included in nonperforming loans and leases | $ | 4,300 | $ | 1,879 | ||||
TDRs in compliance with modified terms | 7,166 | 4,693 | ||||||
|
|
|
| |||||
Total TDRs | $ | 11,466 | $ | 6,572 | ||||
|
|
|
| |||||
The following table presents information regarding loan and lease modifications categorized as Troubled Debt Restructurings for the twelve months ended December 31, 2011:
| (dollars in thousands) | Number of Contracts | Pre-Modification Outstanding Recorded Investment | Post-Modification Outstanding Recorded Investment | |||||||||
Residential | 2 | $ | 674 | $ | 674 | |||||||
Commercial and industrial | 3 | 478 | 478 | |||||||||
Construction | 2 | 4,430 | 4,430 | |||||||||
Leases | 11 | 157 | 157 | |||||||||
|
|
|
|
|
| |||||||
Total | 18 | $ | 5,739 | $ | 5,739 | |||||||
|
|
|
|
|
| |||||||
47
The following table presents information regarding the types of loan and lease modifications made for the twelve months ended December 31, 2011:
| Number of Contracts | ||||||||||||||||||||
| Interest Rate Change | Loan Term Extension | Interest Rate Change and Term Extension | Interest Rate Change with Interest-Only Period | Contractual Payment Reduction (Leases only) | ||||||||||||||||
Residential | — | — | 1 | 1 | ||||||||||||||||
Commercial and industrial | — | — | 2 | 1 | — | |||||||||||||||
Construction | — | 2 | — | — | — | |||||||||||||||
Leases | — | — | — | — | 11 | |||||||||||||||
|
|
|
|
|
|
|
|
|
| |||||||||||
Total | — | 2 | 3 | 2 | 11 | |||||||||||||||
|
|
|
|
|
|
|
|
|
| |||||||||||
During the twelve months ended December 31, 2011, there were no defaults of loans or leases that had been previously modified to Troubled Debt Restructurings.
48
H. Impaired Loans
The following tables detail the recorded investment and principal balance of impaired loans by portfolio segment, their related allowance for loan and lease losses and interest income recognized for the twelve months ended December 31, 2011 and 2010 (purchased credit-impaired loans are not included in the tables):
(dollars in thousands) As of or for the twelve months ended December 31, 2011 | Recorded Investment** | Principal Balance | Related Allowance | Average Principal Balance | Interest income recognized | Cash-Basis Interest Income Recognized | ||||||||||||||||||
Impaired loans with related allowance: | ||||||||||||||||||||||||
Home equity lines and loans | $ | 448 | $ | 456 | $ | 75 | $ | 456 | $ | 1 | $ | — | ||||||||||||
Residential mortgage | 2,654 | 2,682 | 358 | 2,696 | 130 | — | ||||||||||||||||||
Construction | 4,853 | 6,054 | 640 | 6,478 | 73 | — | ||||||||||||||||||
Commercial and industrial | 1,568 | 2,160 | 248 | 2,199 | 32 | — | ||||||||||||||||||
|
|
|
|
|
|
|
|
|
|
|
| |||||||||||||
Total | 9,523 | 11,352 | 1,321 | 11,829 | 236 | — | ||||||||||||||||||
Impaired loans* without related allowance: | — | |||||||||||||||||||||||
Home equity lines and loans | 2,266 | 2,310 | — | 2,316 | 46 | — | ||||||||||||||||||
Residential mortgage | 5,492 | 5,863 | — | 5,865 | 191 | — | ||||||||||||||||||
Construction | 1,209 | 1,213 | — | 1,326 | 56 | — | ||||||||||||||||||
Commercial and industrial | 825 | 855 | — | 1,031 | 20 | — | ||||||||||||||||||
Consumer loans | 5 | 5 | — | 6 | 1 | — | ||||||||||||||||||
|
|
|
|
|
|
|
|
|
|
|
| |||||||||||||
Total | 9,797 | 10,246 | — | 10,544 | 314 | — | ||||||||||||||||||
|
|
|
|
|
|
|
|
|
|
|
| |||||||||||||
Grand total | $ | 19,320 | $ | 21,598 | $ | 1,321 | $ | 22,373 | $ | 550 | $ | — | ||||||||||||
|
|
|
|
|
|
|
|
|
|
|
| |||||||||||||
| * | The table above does not include the recorded investment of $680 thousand of impaired leases without a related allowance for loan and lease losses. |
| ** | Recorded investment equals principal balance less partial charge-offs and interest payments on non-performing loans that have been applied to principal. |
(dollars in thousands) As of or for the twelve months ended December 31, 2010 | Recorded Investment** | Principal Balance | Related Allowance | Average Principal Balance | Interest income recognized | Cash-Basis Interest Income Recognized | ||||||||||||||||||
Impaired loans with related allowance: | ||||||||||||||||||||||||
Commercial mortgage | $ | 1,696 | $ | 2,285 | $ | 110 | $ | 2,287 | $ | 116 | $ | — | ||||||||||||
Home equity lines and loans | 749 | 1,099 | 390 | 1,078 | 22 | — | ||||||||||||||||||
Residential mortgage | 2,480 | 2,480 | 56 | 2,480 | — | — | ||||||||||||||||||
Commercial and industrial | 1,514 | 4,294 | 123 | 4,318 | 83 | — | ||||||||||||||||||
|
|
|
|
|
|
|
|
|
|
|
| |||||||||||||
Total | 6,439 | 10,158 | 679 | 10,163 | 221 | — | ||||||||||||||||||
Impaired loans* without related allowance: | — | |||||||||||||||||||||||
Commercial mortgage | 158 | 158 | — | 160 | 1 | — | ||||||||||||||||||
Home equity lines and loans | 273 | 279 | — | 280 | 8 | — | ||||||||||||||||||
Residential mortgage | 4,841 | 5,170 | — | 5,109 | 194 | — | ||||||||||||||||||
Commercial and industrial | 323 | 500 | — | 501 | 11 | — | ||||||||||||||||||
Consumer loans | 25 | 26 | — | 26 | 1 | — | ||||||||||||||||||
|
|
|
|
|
|
|
|
|
|
|
| |||||||||||||
Total | 5,620 | 6,133 | — | 6,076 | 215 | — | ||||||||||||||||||
|
|
|
|
|
|
|
|
|
|
|
| |||||||||||||
Grand total | $ | 12,059 | $ | 16,291 | $ | 679 | $ | 16,239 | $ | 436 | $ | — | ||||||||||||
|
|
|
|
|
|
|
|
|
|
|
| |||||||||||||
| * | The table above does not include the recorded investment of $1.3 million of impaired leases without a related allowance for loan and lease losses. |
| ** | Recorded investment equals principal balance less partial charge-offs and interest payments on non-performing loans that have been applied to principal. |
49
6. OTHER REAL ESTATE OWNED
Other real estate owned (“OREO”) consists of properties acquired as a result of deed in-lieu-of foreclosure and foreclosures. Properties or other assets are classified as OREO and are reported at the lower of carrying value or fair value, less estimated costs to sell. Costs relating to the development or improvement of assets are capitalized, and costs relating to holding the property are charged to expense. The Corporation had $549 thousand in OREO assets at December 31, 2011.
The summary of the change in other real estate owned, which is included as a component of other assets on the Corporation’s Consolidated Balance Sheets, is as follows:
| December 31, | ||||||||
| (dollars in thousands) | 2011 | 2010 | ||||||
Balance January 1 | $ | 2,527 | $ | 1,025 | ||||
Additions | 1,163 | 3,124 | ||||||
Capitalized cost | — | 244 | ||||||
Impairment of OREO | (251 | ) | (381 | ) | ||||
Sales | (2,890 | ) | (1,485 | ) | ||||
|
|
|
| |||||
Balance December 31 | $ | 549 | $ | 2,527 | ||||
|
|
|
| |||||
7. PREMISESAND EQUIPMENT
A. A summary of premises and equipment is as follows:
| December 31, | ||||||||
| (dollars in thousands) | 2011 | 2010 | ||||||
Land | $ | 5,369 | $ | 5,369 | ||||
Buildings | 22,973 | 21,478 | ||||||
Furniture and equipment | 21,129 | 20,001 | ||||||
Leasehold improvements | 11,575 | 10,883 | ||||||
Construction in progress | 25 | 531 | ||||||
Less: accumulated depreciation | (31,743 | ) | (29,104 | ) | ||||
|
|
|
| |||||
Total | $ | 29,328 | $ | 29,158 | ||||
|
|
|
| |||||
Depreciation and amortization expense related to the assets detailed in the above table for the years ended December 31, 2011, 2010, and 2009 amounted to $2.8 million, $2.3 million, and $1.9 million, respectively.
B. Future minimum cash rent commitments under various operating leases as of December 31, 2011 are as follows:
| (dollars in thousands) | ||||
2012 | $ | 2,161 | ||
2013 | 2,042 | |||
2014 | 1,814 | |||
2015 | 1,818 | |||
2016 | 1,723 | |||
2017 and thereafter | 25,421 | |||
Rent expense on leased premises and equipment for the years ended December 31, 2011, 2010 and 2009 amounted to $2.2 million, $1.6 million, and $1.3 million, respectively.
8. MORTGAGE SERVICING RIGHTS (“MSR”s)
A. The following summarizes the Corporation’s activity related to MSRs for the years ended December 31:
| (dollars in thousands) | 2011 | 2010 | 2009 | |||||||||
Balance, January 1 | $ | 4,925 | $ | 4,059 | $ | 2,205 | ||||||
Additions | 651 | 1,819 | 2,570 | |||||||||
Amortization | (749 | ) | (923 | ) | (853 | ) | ||||||
(Impairment) recovery | (786 | ) | (30 | ) | 137 | |||||||
|
|
|
|
|
| |||||||
Balance, December 31 | $ | 4,041 | $ | 4,925 | $ | 4,059 | ||||||
|
|
|
|
|
| |||||||
Fair value | $ | 4,041 | $ | 5,815 | $ | 4,807 | ||||||
|
|
|
|
|
| |||||||
Loans serviced for others | $ | 574,422 | $ | 605,485 | $ | 514,875 | ||||||
|
|
|
|
|
| |||||||
| 50 |
B. The following summarizes the Corporation’s activity related to changes in the impairment valuation allowance of MSRs for the years ended December 31:
| (dollars in thousands) | 2011 | 2010 | 2009 | |||||||||
Balance, January 1 | $ | (596 | ) | $ | (566 | ) | $ | (703 | ) | |||
Impairment | (800 | ) | (390 | ) | (205 | ) | ||||||
Recovery | 14 | 360 | 342 | |||||||||
|
|
|
|
|
| |||||||
Balance, December 31 | $ | (1,382 | ) | $ | (596 | ) | $ | (566 | ) | |||
|
|
|
|
|
| |||||||
C. Other MSR Information – At December 31, 2011, key economic assumptions and the sensitivity of the current fair value of MSRs to immediate 10 and 20 percent adverse changes in those assumptions are as follows:
| (dollars in thousands) | ||||
Fair value amount of MSRs | $ | 4,041 | ||
Weighted average life (in years) | 4.0 | |||
Prepayment speeds (constant prepayment rate)* | 18.8 | % | ||
Impact on fair value: | ||||
10% adverse change | $ | (242 | ) | |
20% adverse change | $ | (461 | ) | |
Discount rate | 10.25 | % | ||
Impact on fair value: | ||||
10% adverse change | $ | (118 | ) | |
20% adverse change | $ | (228 | ) | |
| * | Represents the weighted average prepayment rate for the life of the MSR asset. |
At December 31, 2011, 2010 and 2009, the fair value of the mortgage MSRs is $4.0 million, $5.8 million, and $4.8 million, respectively. The fair value of the MSRs for these dates was determined using a third-party valuation model that calculates the present value of estimated future servicing income. The model incorporates assumptions that market participants use in estimating future net servicing income, including estimates of prepayment speeds and discount rates. Mortgage loan prepayment speed is the annual rate at which borrowers are forecasted to repay their mortgage loan principal and is based on historical experience. The discount rate is used to determine the present value of future net servicing income. Another key assumption in the model is the required rate of return the market would expect for an asset with similar risk. Both assumptions can, and generally will, change quarterly valuations as market conditions and interest rates change.
These assumptions and sensitivities are hypothetical and should be used with caution. As the figures indicate, changes in fair value based on a 10% variation in assumptions generally cannot be extrapolated because the relationship of the change in assumptions to the change in fair value may not be linear. Also, the effect of a variation in a particular assumption on the fair value of the MSRs is calculated without changing any other assumption. In reality, changes in one factor may result in changes in another, which could magnify or counteract the sensitivities.
9. DEPOSITS
A. The following table details the components of deposits:
| As of December 31, | ||||||||
| (dollars in thousands) | 2011 | 2010 | ||||||
Savings | $ | 130,613 | $ | 134,163 | ||||
NOW accounts* | 233,562 | 234,107 | ||||||
Market rate accounts* | 458,902 | 407,936 | ||||||
Time deposits, less than $100 | 125,341 | 144,410 | ||||||
Time deposits, $100 or more | 83,992 | 101,259 | ||||||
Wholesale time deposits | 23,550 | 37,201 | ||||||
|
|
|
| |||||
Total interest-bearing deposits | 1,055,960 | 1,059,076 | ||||||
Non-interest-bearing deposits | 326,409 | 282,356 | ||||||
|
|
|
| |||||
Total deposits | $ | 1,382,369 | $ | 1,341,432 | ||||
|
|
|
| |||||
| * | Includes other wholesale deposits. |
The aggregate amount of deposit overdrafts included as loans as of December 31, 2011 and 2010 were $505 thousand and $740 thousand, respectively.
B. The following tables detail the maturities of time deposits:
| As of December 31, 2011 | ||||||||
| (dollars in thousands) | $100 or more | Less than $100 | ||||||
Maturing during: | ||||||||
2012 | $ | 68,332 | $ | 86,479 | ||||
2013 | 9,999 | 26,907 | ||||||
2014 | 2,545 | 5,752 | ||||||
2015 | 1,403 | 3,296 | ||||||
2016 | 1,713 | 2,894 | ||||||
2017 and thereafter | — | 13 | ||||||
|
|
|
| |||||
Total | $ | 83,992 | $ | 125,341 | ||||
|
|
|
| |||||
C. The following tables detail the maturities of wholesale time deposits:
| As of December 31, 2011 | ||||||||
| (dollars in thousands) | $100 or more | Less than $100 | ||||||
Maturing during: | ||||||||
2012 | $ | 17,540 | $ | 627 | ||||
2013 | — | — | ||||||
2014 | | 5,383 | | — | ||||
2015 | | — | | — | ||||
2016 | — | — | ||||||
2017 and thereafter | — | — | ||||||
|
|
|
| |||||
Total | $ | 22,923 | $ | 627 | ||||
|
|
|
| |||||
| 51 |
10. SHORT-TERMAND OTHER BORROWINGS
A. Short-term borrowings –As of December 31, 2011 and 2010, the Corporation had $12.9 million and $10.1 million of short-term (original maturity of one year or less) borrowings, respectively, which consisted solely of funds obtained from overnight repurchase agreements with commercial customers.
A summary of short-term borrowings is as follows:
| (dollars in thousands) | 2011 | 2010 | ||||||
Overnight fed funds | $ | — | $ | — | ||||
Repurchase agreements | 12,863 | 10,051 | ||||||
|
|
|
| |||||
Total short-term borrowings | $ | 12,863 | 10,051 | |||||
|
|
|
| |||||
The following table sets forth information concerning short-term borrowings:
| (dollars in thousands) | 2011 | 2010 | ||||||
Balance at year-end | $ | 12,863 | $ | 10,051 | ||||
Maximum amount outstanding at any month-end | 23,326 | 12,127 | ||||||
Average balance outstanding during the year | 11,380 | 5,839 | ||||||
Weighted-average interest rate: | ||||||||
As of year-end | 0.15 | % | 0.25 | % | ||||
Paid during the year | 0.21 | % | 0.28 | % | ||||
Average balances outstanding during the year represent daily average balances and average interest rates represent interest expense divided by the related average balance.
B. FHLB Advances and Other Borrowings:
As of December 31, 2011 and 2010, the Corporation had $147.8 million and $160.1 million, respectively, of other borrowings, consisting mainly of advances from FHLB as well as a $1.9 million commercial mortgage on its Wealth Management Division’s offices located in Bryn Mawr, PA and an $11.8 million term loan originated to fund the extinguishment of the Corporation’s Junior Subordinated Debentures detailed in Note 12, below. Both of the aforementioned loans are from correspondent banks.
The following table presents the remaining periods until maturity of the FHLB advances and other borrowings:
| As of December 31, | ||||||||
| (dollars in thousands) | 2011 | 2010 | ||||||
Within one year | $ | 39,276 | $ | 63,680 | ||||
Over one year through five years | 85,238 | 72,980 | ||||||
Over five years through ten years | 22,253 | 22,345 | ||||||
Over ten years | 1,028 | 1,139 | ||||||
|
|
|
| |||||
Total | $ | 147,795 | $ | 160,144 | ||||
|
|
|
| |||||
The following table presents rate and maturity information on FHLB advances and other borrowings:
| Maturity Range* | Weighted Average Rate | Interest Rate | Balance at December 31, | |||||||||||||||||||||||||
Description | From | To | From | To | 2011 | 2010 | ||||||||||||||||||||||
Fixed amortizing | 08/03/12 | 12/29/15 | 3.59 | % | 3.19 | % | 3.95 | % | $ | 10,535 | $ | 19,028 | ||||||||||||||||
Adjustable amortizing** | 12/31/16 | 01/29/29 | 3.25 | % | 2.88 | % | 5.50 | % | 13,692 | 2,000 | ||||||||||||||||||
Bullet maturity | 03/05/12 | 05/19/16 | 2.64 | % | 1.19 | % | 4.12 | % | 75,500 | 65,500 | ||||||||||||||||||
Convertible-fixed | 12/11/12 | 08/20/18 | 2.01 | % | 1.24 | % | 2.62 | % | 48,068 | 73,616 | ||||||||||||||||||
|
|
|
| |||||||||||||||||||||||||
Total | $ | 147,795 | $ | 160,144 | ||||||||||||||||||||||||
|
|
|
| |||||||||||||||||||||||||
| * | Maturity range refers to December 31, 2011 balances |
| ** | Loans from correspondent banks other than FHLB |
Included in the table above as of December 31, 2011 and 2010 are $48.1 million and $73.6 million, respectively, of FHLB advances whereby the FHLB has the option, at predetermined times, to convert the fixed interest rate to an adjustable interest rate indexed to the London Interbank Offered Rate (“LIBOR”). The Corporation has the option to prepay these advances, without penalty, if the FHLB elects to convert the interest rate to an adjustable rate. As of December 31, 2011, substantially all the FHLB advances with this convertible feature are subject to conversion in fiscal 2012. These advances are included in the periods in which they mature, rather than the period in which they are subject to conversion.
C. Other FHLB Information – The Corporation had a maximum borrowing capacity (“MBC”) with the FHLB of
approximately $657.7 million as of December 31, 2011 of which the unused capacity was $514.7 million at December 31, 2011. In addition there were $64.0 million in overnight federal funds line and $67.5 million of Federal Reserve Discount Window capacity. In connection with its FHLB borrowings, the Corporation is required to hold the capital stock of the FHLB. The amount of capital stock held was $11.6 million at December 31, 2011, and $14.2 million at December 31, 2010. The carrying amount of the FHLB stock approximates its redemption value. On December 23, 2008, the FHLB announced that it would voluntarily suspend the payment of dividends and the repurchase of excess capital stock until further notice. There were no dividends paid on FHLB stock in 2011 or 2010, however, capital stock redemptions resumed in 2010. Capital stock repurchases during the twelve months ended December 31, 2011 and December 31, 2010 totaled $2.6 million and $749 thousand, respectively.
| 52 |
The level of required investment in FHLB stock is based on the balance of outstanding loans the Corporation has from the FHLB. Although FHLB stock is a financial instrument that represents an equity interest in the FHLB, it does not have a readily determinable fair value. FHLB stock is generally viewed as a long-term investment. Accordingly, when evaluating FHLB stock for impairment, its value should be determined based on the ultimate recoverability of the par value rather than by recognizing temporary declines in value. The Corporation regularly reviews financial statements filed by the FHLB. The most recent financial information available as of February 22, 2012 indicates an increase in the FHLB’s net income as well as its capital ratios. In addition, credit-related other-than-temporary impairments have declined for the year ended December 31, 2011, as compared to the same period in 2010. Management believes that these indicators, as well as the fact that the FHLB has resumed redemption of its capital stock and has declared a dividend payable in 2012, support the Corporation’s assessment that its investment in FHLB capital stock is not other-than-temporarily impaired.
11. SUBORDINATED DEBENTURES
The Corporation issued an aggregate of $15 million in subordinated debentures in July and August 2008. This subordinated debenture has a floating interest rate, which resets quarterly at 90 day LIBOR plus 3.75%, has a maturity of 10 years, and can be prepaid at the end of 5 years with no prepayment penalty. At December 31, 2011, the rate was 4.30% and will next reset on March 15, 2012. Interest is payable quarterly and principal is due September 15, 2018.
In April 2009, the Corporation raised an additional $7.5 million in subordinated debentures. These subordinated debentures bear an interest rate at a rate per annum equal to the 90 day LIBOR rate plus 5.75% and is adjusted quarterly. Interest is payable quarterly and principal is due on June 15, 2019. The rate of interest is capped at 10.0% per annum during the first 5 years of the term. At December 31, 2011, rate was 6.30% and will next reset on March 15, 2012.
Subordinated debentures qualify as Tier II regulatory capital for the first five years from the date of issuance and thereafter are discounted as the subordinated debentures approach maturity, with one fifth of the original amount excluded from Tier II capital each year during the last five years before maturity. When the remaining maturity is less than one year, the subordinated debentures are excluded from Tier II capital. Unamortized subordinated debenture issuance costs were $258 thousand and $296 thousand at December 31, 2011 and 2010, respectively. These costs are amortized over the term of the debt, as an adjustment to the yield.
12. JUNIOR SUBORDINATED DEBENTURES
In connection with the FKF Merger, the Corporation acquired FKF Capital Trust I (the “Trust”), a trust formed under Delaware law that became an unconsolidated subsidiary of the Corporation. On August 21, 1997, the Trust had issued $16.2 million of preferred securities (the “Preferred Securities”) at an interest rate of 9.7%, with a scheduled maturity of August 15, 2027. Simultaneously, the proceeds from the issue, along with $502 thousand of cash were invested in junior subordinated debentures (the “Debentures”) that were assumed by the Corporation. On November 15, 2001 and June 25, 2008, FKF purchased $3.5 million and $1.5 million, respectively, of the Preferred Securities.
On December 19, 2011, the Corporation elected to prepay, in full, the Debentures. Simultaneously, the Trust called the Preferred Securities. Funding for the prepayment was obtained through an adjustable-rate term loan indexed to LIBOR.
13. DISCLOSUREABOUT FAIR VALUEOF FINANCIAL INSTRUMENTS
FASB ASC 825, “Disclosures about Fair Value of Financial Instruments” requires disclosure of the fair value information about financial instruments, whether or not recognized in the balance sheet, for which it is practicable to estimate such value. In cases where quoted market prices are not available, fair values are based on estimates using present value or other market value techniques. Those techniques are significantly affected by the assumptions used, including the discount rate and estimates of future cash flows. In that regard, the derived fair value estimates cannot be substantiated by comparison to independent markets and, in many cases, could not be realized in immediate settlement of the instrument. The aggregate fair value amounts presented below do not represent the underlying value of the Corporation.
The following methods and assumptions were used to estimate the fair value of each class of financial instruments for which it is practicable to estimate that value:
Cash and Cash Equivalents
The carrying amounts reported in the balance sheet for cash and cash equivalents approximate their fair values.
Investment Securities Available for Sale
Estimated fair values for investment securities are generally valued by an independent third party based on market data utilizing pricing models that vary by asset and incorporate available trade, bid and other market information. Management reviews, annually, the process utilized by its independent third-party valuation experts. On a quarterly basis, Management tests the validity of the prices provided by the third party by selecting a representative sample of the portfolio and obtaining actual trade results, or if actual trade results are not available, competitive broker pricing. See Note 4 of the Notes to Consolidated Financial Statements for more information.
Loans Held for Sale
The fair value of loans held for sale is based on pricing obtained from secondary markets.
| 53 |
Net Portfolio Loans and Leases
For variable rate loans that reprice frequently and which have no significant change in credit risk, estimated fair values are based on carrying values. Fair values of certain mortgage loans and consumer loans are estimated using discounted cash flow analyses, using interest rates currently being offered for loans with similar terms to borrowers of similar credit quality and is indicative of an entry price. The estimated fair value of nonperforming loans is based on discounted estimated cash flows as determined by the internal loan review of the Bank or the appraised market value of the underlying collateral, as determined by independent third party appraisers. This technique does not reflect an exit price as contemplated in Note 4 of the Notes to Consolidated Financial Statements.
Mortgage Servicing Rights
The fair value of the MSRs for these periods was determined using a third-party valuation model that calculates the present value of estimated future servicing income. The model incorporates assumptions that market participants use in estimating future net servicing income, including estimates of prepayment speeds and discount rates.
Other Assets
The carrying amount of accrued interest receivable, income taxes receivable and other investments approximates fair value.
Deposits
The estimated fair values disclosed for noninterest-bearing demand deposits, savings, NOW accounts, and Market Rate accounts are, by definition, equal to the amounts payable on demand at the reporting date (i.e., their carrying amounts). Fair values for certificates of deposit are estimated using a discounted cash flow calculation that applies interest rates currently being offered on certificates to a schedule of expected monthly maturities on the certificate of deposit. FASB Codification 825 defines the fair value of demand deposits as the amount payable on demand as of the reporting date and prohibits adjusting estimated fair value from any value derived from retaining those deposits for an expected future period of time.
Short-term borrowings
The carrying amount of short-term borrowings, which include overnight repurchase agreements approximate their fair value.
FHLB Advances and Other Borrowings
The fair value of FHLB advances and other borrowings, which include a $1.9 million commercial mortgage loan and an $11.8 million term loan, is established using a discounted cash flow calculation that applies interest rates currently being offered on mid-term and long term borrowings.
Subordinated Debentures
The fair value of subordinated debentures is established using a discounted cash flow calculation that applies interest rates currently being offered on comparable borrowings.
Junior Subordinated Debentures
The carrying amounts reported in the balance sheet for junior subordinated debentures approximate their fair values, and are based in part on the call price of the instruments.
Other Liabilities
The carrying amounts of accrued interest payable and other accrued payables approximate fair value.
Off-Balance Sheet Instruments
Estimated fair values of the Corporation’s commitments to extend credit, standby letters of credit and financial guarantees are not included in the table below as their carrying values generally approximate their fair values. These instruments generate fees that approximate those currently charged to originate similar commitments.
The carrying amount and estimated fair value of the Corporation’s financial instruments are as follows:
| As of December 31, | ||||||||||||||||
| 2011 | 2010 | |||||||||||||||
| (dollars in thousands) | Carrying Amount | Estimated Fair Value | Carrying Amount | Estimated Fair Value | ||||||||||||
| Financial assets: | ||||||||||||||||
| Cash and cash equivalents | 69,140 | 69,140 | 89,484 | 89,484 | ||||||||||||
| Investment securities AFS | 272,317 | 272,317 | 317,052 | 317,052 | ||||||||||||
| Loans held for sale | 1,588 | 1,667 | 4,838 | 4,874 | ||||||||||||
| Net portfolio loans and leases | 1,282,639 | 1,311,058 | 1,186,442 | 1,204,056 | ||||||||||||
| Mortgage servicing rights | 4,041 | 4,041 | 4,925 | 5,815 | ||||||||||||
| Other assets | 23,261 | 23,261 | 25,853 | 25,853 | ||||||||||||
|
|
|
|
|
|
|
| |||||||||
| Total financial assets | $ | 1,652,986 | $ | 1,681,485 | $ | 1,628,594 | $ | 1,647,134 | ||||||||
|
|
|
|
|
|
|
| |||||||||
| Financial liabilities: | ||||||||||||||||
| Deposits | $ | 1,382,369 | $ | 1,382,865 | $ | 1,341,432 | $ | 1,342,294 | ||||||||
| Short-term borrowings | 12,863 | 12,863 | 10,051 | 10,051 | ||||||||||||
| FHLB advances and other borrowings | 147,795 | 151,767 | 160,144 | 163,693 | ||||||||||||
| Subordinated debentures | 22,500 | 21,511 | 22,500 | 22,732 | ||||||||||||
| Jr. subordinated debentures | — | — | 12,029 | 12,029 | ||||||||||||
Other liabilities | 23,467 | 23,467 | 24,174 | 24,174 | ||||||||||||
|
|
|
|
|
|
|
| |||||||||
Total financial liabilities | $ | 1,588,994 | $ | 1,592,473 | $ | 1,570,330 | $ | 1,574,973 | ||||||||
|
|
|
|
|
|
|
| |||||||||
14. FAIR VALUE MEASUREMENT
FASB ASC 820, “Fair Value Measurement” establishes a fair value hierarchy based on the nature of data inputs for fair value determinations, under which the Corporation is required to value each asset using assumptions that market participants would utilize to value that asset. When the Corporation uses its own assumptions it is required to disclose additional information about the assumptions used and the effect of the measurement on earnings or the net change in assets for the period.
54
The value of the Corporation’s available for sale investment securities, which include obligations of the U.S. government and its agencies, mortgage-backed securities issued by U.S. government- and U.S. government sponsored agencies, obligations of state and political subdivisions, corporate bonds, other debt securities, as well as bond mutual funds are determined by an independent third party. The Corporation performs tests to assess the validity of these third-party values. The third party’s evaluations are based on market data. They utilize evaluated pricing models that vary by asset and incorporate available trade, bid and other market information. For securities that do not trade on a daily basis, their pricing models apply available information such as benchmarking and matrix pricing. The market inputs normally sought in the evaluation of securities include benchmark yields, reported trades, broker/dealer quotes (only obtained from market makers or broker/dealers recognized as market participants), issuer spreads, two-sided markets, benchmark securities, bid, offers and reference data. For certain securities, additional inputs may be used or some market inputs may not be applicable. Inputs are prioritized differently on any given day based on market conditions.
U.S. Government agencies are evaluated and priced using multi-dimensional relational models and option adjusted spreads. State and municipal securities are evaluated on a series of matrices including reported trades and material event notices. Mortgage-backed securities are evaluated using matrix correlation to treasury or floating index benchmarks, prepayment speeds, monthly payment information and other benchmarks. Other available-for-sale investments are evaluated using a broker-quote based application, including quotes from issuers.
The value of the investment portfolio is determined using three broad levels of inputs:
Level 1 – Quoted prices in active markets for identical securities.
Level 2 – Quoted prices for similar instruments in active markets; quoted prices for identical or similar instruments in markets that are not active and model derived valuations whose inputs are observable or whose significant value drivers are observable.
Level 3 – Instruments whose significant value drivers are unobservable.
These levels are not necessarily an indication of the risks or liquidity associated with these investments. The following tables summarize the assets at December 31, 2011 and 2010 that are recognized on the Corporation’s balance sheet using fair value measurement determined based on the differing levels of input.
Fair value of assets measured on a recurring basis for the year ended December 31, 2011:
| (dollars in millions) | Total | Level 1 | Level 2 | Level 3 | ||||||||||||
Investments: | ||||||||||||||||
Obligations of U.S. government & agencies | $ | 104.6 | $ | — | $ | 104.6 | $ | — | ||||||||
Obligations of state & political subdivisions | 8.4 | — | 8.4 | — | ||||||||||||
Mortgage-backed securities | 97.8 | — | 97.8 | — | ||||||||||||
Collateralized mortgage obligations | 32.6 | — | 32.6 | — | ||||||||||||
Corporate bonds | 12.7 | — | 12.7 | — | ||||||||||||
Bond – mutual funds | 11.9 | 11.9 | — | — | ||||||||||||
Investment certificate of deposit | 2.4 | — | 2.4 | — | ||||||||||||
Other debt securities | 1.9 | — | 1.9 | — | ||||||||||||
|
|
|
|
|
|
|
| |||||||||
Total assets measured on a recurring basis at fair value | $ | 272.3 | $ | 11.9 | $ | 260.4 | $ | — | ||||||||
|
|
|
|
|
|
|
| |||||||||
Fair value of assets measured on a non-recurring basis at December 31, 2011:
| (dollars in millions) | Total | Level 1 | Level 2 | Level 3 | ||||||||||||
Mortgage servicing rights | $ | 4.0 | $ | — | $ | 4.0 | $ | — | ||||||||
Impaired loans and leases | 18.7 | — | 18.7 | — | ||||||||||||
OREO and other repossessed property | 0.5 | — | 0.5 | — | ||||||||||||
|
|
|
|
|
|
|
| |||||||||
Total assets measured at fair value on a non-recurring basis | $ | 23.2 | $ | — | $ | 23.2 | $ | — | ||||||||
|
|
|
|
|
|
|
| |||||||||
Fair value of assets measured on a recurring basis for the year ended December 31, 2010:
| (dollars in millions) | Total | Level 1 | Level 2 | Level 3 | ||||||||||||
Investments: | ||||||||||||||||
Obligations of U.S. government & agencies | $ | 156.6 | $ | — | $ | 156.6 | $ | — | ||||||||
U.S. Treasury obligations | 5.1 | 5.1 | — | — | ||||||||||||
State & political subdivisions | 32.3 | — | 32.3 | — | ||||||||||||
Mortgage backed securities | 73.5 | — | 73.5 | — | ||||||||||||
Collateralized mortgage obligations | 2.1 | — | 2.1 | — | ||||||||||||
Corporate bonds | 10.6 | — | 10.6 | — | ||||||||||||
Other equity investments | 0.3 | 0.3 | — | — | ||||||||||||
Bond – mutual funds | 34.7 | 34.7 | — | — | ||||||||||||
Other debt securities | 1.8 | — | 1.8 | — | ||||||||||||
|
|
|
|
|
|
|
| |||||||||
Total assets measured on a recurring basis at fair value | $ | 317.0 | $ | 40.1 | $ | 276.9 | $ | — | ||||||||
|
|
|
|
|
|
|
| |||||||||
Fair value of assets measured on a non-recurring basis at December 31, 2010:
| (dollars in millions) | Total | Level 1 | Level 2 | Level 3 | ||||||||||||
Mortgage servicing rights | $ | 0.7 | $ | — | $ | 0.7 | $ | — | ||||||||
Impaired loans and leases | 12.7 | — | 12.7 | — | ||||||||||||
OREO and other repossessed property | 2.5 | — | 2.5 | — | ||||||||||||
|
|
|
|
|
|
|
| |||||||||
Total assets measured at fair value on a non-recurring basis | $ | 15.9 | $ | — | $ | 15.9 | $ | — | ||||||||
|
|
|
|
|
|
|
| |||||||||
As of December 31, 2011 and 2010, the Corporation did not have any assets whose fair value was determined using level 3 inputs; hence, no roll-forward of the level 3 assets is presented here. In addition, no transfer of assets between levels has occurred during the twelve months ended December 31, 2011 or 2010.
55
15. 401(K) PLAN
The Corporation has a qualified defined contribution plan for all eligible employees under which the Corporation contributes $1.00 for each $1.00 that an employee contributes up to a maximum of 3.0% of the employee’s base salary. The Corporation’s expenses for the 401(K) Plan were $618 thousand, $570 thousand and $503 thousand in 2011, 2010 and 2009, respectively.
Effective April 1, 2008, an amendment was made to the 401(K) Plan to provide for a new class of immediately vested discretionary, non-matching employer contribution. The Corporation’s expense for the non-matching discretionary contribution was $652 thousand, $769 thousand and $589 thousand, for the twelve month periods ending December 31, 2011, 2010 and 2009, respectively.
16. PENSIONAND POSTRETIREMENT BENEFIT PLANS
A. General Overview – The Corporation has three defined benefit pension plans, the qualified defined benefit plan (“QDBP”) which covers all employees over age 20 1/2 who meet certain service requirements and two non-qualified defined benefit pension plans (“SERP”) which are restricted to certain officers of the Corporation.
On February 12, 2008, the Corporation amended the QDBP to cease further accruals of benefits effective March 31, 2008, and amended the 401(K) Plan to provide non-matching employer contributions mentioned previously.
The original SERP was restricted and frozen to certain officers of the Corporation and provided each participant the equivalent pension benefit on any compensation which exceeded the IRS limits and bonus deferrals made by eligible individuals.
Additionally, effective April 1, 2008, the Corporation added a new SERP which includes certain officers of the Corporation. This new SERP provides that each participant shall receive a pension benefit equal to what the QDBP would have provided at retirement, reduced by the actuarially equivalent value of the immediately vested discretionary, non-matching employer contribution to the 401(K) Plan made on his or her behalf and their respective QDBP benefit.
The Corporation also has a postretirement benefit plan (“PRBP”) that covers certain retired employees and a group of current employees. The PRBP was closed to new participants in 1994. In 2007, the Corporation amended the PRBP to allow for settlement of obligations to certain current and retired employees. Certain retired participant obligations were settled in 2007 and current employee obligations were settled in 2008.
56
The following table provides information with respect to our QDBP, SERP, and PRBP, including benefit obligations and funded status, net periodic pension costs, plan assets, cash flows, amortization information and other accounting items.
B. Actuarial Assumptions used to determine benefit obligations for the years ended December 31:
| QDBP | SERP* | PRBP | ||||||||||||||||||||||
| 2011 | 2010 | 2011 | 2010 | 2011 | 2010 | |||||||||||||||||||
Discount rate | 4.20 | % | 5.30 | % | 4.20 | % | 5.30 | % | 4.20 | % | 5.30 | % | ||||||||||||
Rate of increase for future compensation | N/A | N/A | 3.50 | % | 3.50 | % | N/A | N/A | ||||||||||||||||
Expected long-term rate of return on plan assets | 7.50 | % | 7.50 | % | N/A | N/A | N/A | N/A | ||||||||||||||||
C. Changes in Benefit Obligations and Plan Assets:
| QDBP | SERP* | PRBP | ||||||||||||||||||||||
| (dollars in thousands) | 2011 | 2010 | 2011 | 2010 | 2011 | 2010 | ||||||||||||||||||
Change in benefit obligations | ||||||||||||||||||||||||
Benefit obligation at January 1 | $ | 32,574 | $ | 30,540 | $ | 4,326 | $ | 4,339 | $ | 998 | $ | 930 | ||||||||||||
Service cost | — | — | 230 | 185 | — | — | ||||||||||||||||||
Interest cost | 1,708 | 1,722 | 248 | 224 | 48 | 58 | ||||||||||||||||||
Plan participants contribution | — | — | — | — | 21 | 13 | ||||||||||||||||||
Actuarial (gain) loss | 5,458 | 1,852 | 1,204 | (278 | ) | 9 | 164 | |||||||||||||||||
Benefits paid | (1,684 | ) | (1,540 | ) | (146 | ) | (144 | ) | (163 | ) | (167 | ) | ||||||||||||
|
|
|
|
|
|
|
|
|
|
|
| |||||||||||||
Benefit obligation at December 31 | $ | 38,056 | $ | 32,574 | $ | 5,862 | $ | 4,326 | $ | 913 | $ | 998 | ||||||||||||
|
|
|
|
|
|
|
|
|
|
|
| |||||||||||||
Change in plan assets | ||||||||||||||||||||||||
Fair value of plan assets at January 1 | $ | 30,395 | $ | 28,745 | $ | — | $ | — | $ | — | $ | — | ||||||||||||
Actual return (loss) on plan assets | (416 | ) | 3,190 | — | — | — | — | |||||||||||||||||
Employer contribution | 10,000 | — | 146 | 144 | 142 | 154 | ||||||||||||||||||
Plan participants’ contribution | — | — | — | — | 21 | 13 | ||||||||||||||||||
Benefits paid | (1,684 | ) | (1,540 | ) | (146 | ) | (144 | ) | (163 | ) | (167 | ) | ||||||||||||
|
|
|
|
|
|
|
|
|
|
|
| |||||||||||||
Fair value of plan assets at December 31 | $ | 38,295 | $ | 30,395 | $ | — | $ | — | $ | — | $ | — | ||||||||||||
|
|
|
|
|
|
|
|
|
|
|
| |||||||||||||
Funded status at year end (plan assets less benefit obligations) | $ | 239 | $ | (2,179 | ) | $ | (5,862 | ) | $ | (4,326 | ) | $ | (913 | ) | $ | (998 | ) | |||||||
|
|
|
|
|
|
|
|
|
|
|
| |||||||||||||
Amounts included in the consolidated balance sheet as other assets (liabilities) and accumulated other comprehensive income including the following: | ||||||||||||||||||||||||
Prepaid benefit cost/(accrued liability) | $ | 17,131 | $ | 7,524 | $ | (3,162 | ) | $ | (2,698 | ) | $ | (265 | ) | $ | (312 | ) | ||||||||
Net actuarial loss | (16,892 | ) | (9,703 | ) | (1,763 | ) | (608 | ) | (622 | ) | (689 | ) | ||||||||||||
Prior service cost | — | — | (937 | ) | (1,020 | ) | — | 55 | ||||||||||||||||
Unrecognized net initial obligation | — | — | — | — | (26 | ) | (52 | ) | ||||||||||||||||
|
|
|
|
|
|
|
|
|
|
|
| |||||||||||||
Net amount recognized | $ | 239 | $ | (2,179 | ) | $ | (5,862 | ) | $ | (4,326 | ) | $ | (913 | ) | $ | (998 | ) | |||||||
|
|
|
|
|
|
|
|
|
|
|
| |||||||||||||
| * | Includes SERP I and SERP II which are combined for disclosure purposes. |
57
D. The following tables provide the components of net periodic pension costs for the years ended December 31:
QDBP Net Periodic Pension Cost
| (dollars in thousands) | 2011 | 2010 | 2009 | |||||||||
Service cost | $ | — | $ | — | $ | — | ||||||
Interest cost | 1,708 | 1,722 | 1,738 | |||||||||
Expected return on plan assets | (2,214 | ) | (2,099 | ) | (1,905 | ) | ||||||
Amortization of prior service cost | — | — | — | |||||||||
Amortization of net actuarial loss | 899 | 768 | 945 | |||||||||
Curtailment | — | — | — | |||||||||
|
|
|
|
|
| |||||||
Net periodic pension cost | $ | 393 | $ | 391 | $ | 778 | ||||||
|
|
|
|
|
| |||||||
SERP Net Periodic Pension Cost
| (dollars in thousands) | 2011 | 2010 | 2009 | |||||||||
Service cost | $ | 230 | $ | 185 | $ | 194 | ||||||
Interest cost | 248 | 224 | 215 | |||||||||
Amortization of prior service cost | 82 | 87 | 120 | |||||||||
Amortization of net actuarial loss | 49 | 26 | 26 | |||||||||
|
|
|
|
|
| |||||||
Net periodic pension cost | $ | 609 | $ | 522 | $ | 555 | ||||||
|
|
|
|
|
| |||||||
PRBP Net Periodic Pension Cost
| (dollars in thousands) | 2011 | 2010 | 2009 | |||||||||
Service cost | $ | — | $ | — | $ | — | ||||||
Interest cost | 48 | 58 | 59 | |||||||||
Settlement | — | — | — | |||||||||
Amortization of transition obligation | 26 | 26 | 26 | |||||||||
Amortization of prior service cost | (55 | ) | (138 | ) | (138 | ) | ||||||
Amortization of net actuarial loss | 77 | 86 | 77 | |||||||||
|
|
|
|
|
| |||||||
Net periodic pension cost | $ | 96 | $ | 32 | $ | 24 | ||||||
|
|
|
|
|
| |||||||
E. Plan Assets:
| Asset Allocation Range | Percentage of QDBP Plan Assets at December 31 | |||||||||||
| 2011 | 2010 | |||||||||||
Asset Category | ||||||||||||
Equity securities* | 50% —65% | 45 | % | 63 | % | |||||||
Debt securities | 30% —45% | 29 | % | 37 | % | |||||||
Cash reserves** | 1% —5% | 26 | % | — | ||||||||
|
|
|
| |||||||||
Total | 100 | % | 100 | % | ||||||||
|
|
|
| |||||||||
| * | Includes Bryn Mawr Bank Corporation common stock in the amount of $614 thousand or 1.6% and $550 thousand or 1.8% at December 31, 2011 and 2010, respectively. |
| ** | Cash reserves and other categories are out of policy range due to a $10 million cash contribution made at the end of 2011 that had not been fully invested as of December 31, 2011 |
The expected rate of return on plan assets in the QDBP was selected by the Corporation after consultation with its actuary, and is based in part on long term historical rates of return and various actuarial assumptions. The discount rate was also selected by the Corporation after consultation with its actuary, and is based in part upon the current yield of a portfolio of long term investment grade securities.
The investment strategy of the QDBP is to maintain the investment ranges listed above. The target ranges are to be periodically reviewed based on the prevailing market conditions. Any modification to the current investment strategy must be ratified by the Executive Committee of the Corporation’s Board of Directors. The QDBP is allowed to retain approximately 2.5% of Bryn Mawr Bank Corporation common stock.
The Corporation’s overall investment strategy is to achieve a mix of approximately 60% investments for long-term growth and 40% for production of current income. The target allocations for the plan are 60% equity securities comprised of a number of mutual funds managed with differing objectives and styles. The plan also holds shares of the Corporation’s common stock. Fixed income obligations include corporate obligations, U.S. Treasury and Agency securities, along with fixed income mutual funds.
The following table summarizes the assets of the Pension Plan at December 31, 2011 determined by using three broad levels of inputs. See Note 14 for description of levels.
The fair value of the pension assets measured on a recurring basis as of December 31, 2011:
| (dollars in thousands) | Total | Level 1 | Level 2 | Level 3 | ||||||||||||
Cash and cash equivalents | $ | 10,047 | $ | 10,047 | $ | — | $ | — | ||||||||
Obligations of U.S. Treasury | 517 | — | 517 | — | ||||||||||||
Obligations of U.S. Government and agencies | 722 | — | 722 | — | ||||||||||||
Common stocks | 614 | 614 | — | — | ||||||||||||
Equity – mutual funds | 16,653 | 16,653 | — | — | ||||||||||||
Bond – mutual funds | 9,742 | 9,742 | — | — | ||||||||||||
|
|
|
|
|
|
|
| |||||||||
Total assets measured on a recurring basis at fair value | $ | 38,295 | $ | 37,056 | $ | 1,239 | $ | — | ||||||||
|
|
|
|
|
|
|
| |||||||||
The fair value of the pension assets measured on a recurring basis as of December 31, 2010:
| (dollars in thousands) | Total | Level 1 | Level 2 | Level 3 | ||||||||||||
Cash | $ | 11 | $ | 11 | $ | — | $ | — | ||||||||
Obligations of U.S. Treasury | 530 | — | 530 | — | ||||||||||||
Obligations of U.S. Government and agencies | 1,743 | — | 1,743 | — | ||||||||||||
Corporate bonds | 352 | — | 352 | — | ||||||||||||
Common stocks | 550 | 550 | — | — | ||||||||||||
Equity – mutual funds | 19,103 | 19,103 | — | — | ||||||||||||
Bond – mutual funds | 7,919 | 7,919 | — | — | ||||||||||||
Money market – mutual funds | 187 | 187 | — | — | ||||||||||||
|
|
|
|
|
|
|
| |||||||||
Total assets measured on a recurring basis at fair value | $ | 30,395 | $ | 27,770 | $ | 2,625 | $ | — | ||||||||
|
|
|
|
|
|
|
| |||||||||
58
F. Cash Flows
The following benefit payments, which reflect expected future services, are expected to be paid over the next ten years:
| (dollars in thousands) | QDBP | SERP | PRBP | |||||||||
Fiscal year ending | ||||||||||||
2012 | $ | 1,752 | $ | 146 | $ | 141 | ||||||
2013 | 1,813 | 146 | 128 | |||||||||
2014 | 1,820 | 150 | 116 | |||||||||
2015 | 1,947 | 214 | 105 | |||||||||
2016 | 1,970 | 216 | 94 | |||||||||
2017-2021 | $ | 10,280 | $ | 1,055 | $ | 326 | ||||||
G. Other Pension and Post Retirement Benefit Information
In 2005, the Corporation placed a cap on the future annual benefit payable through the PRBP. This cap is equal to 120% of the 2005 annual benefit.
H. Expected Contribution to be Paid in the Next Fiscal Year
Based on the status of the Corporation’s QDBP at December 31, 2011, no minimum funding requirement is anticipated for 2012. The 2012 expected contribution for the SERP is $146 thousand.
17. INCOME TAXES
A. Components of Net Deferred Tax Asset:
| December 31, | ||||||||
| (dollars in thousands) | 2011 | 2010 | ||||||
Deferred tax assets: | ||||||||
Loan and lease loss reserve | $ | 5,817 | $ | 5,194 | ||||
Other reserves | 977 | 2,467 | ||||||
Net operating loss carry-forward | 2,568 | 2,707 | ||||||
Alternative minimum tax credits | 568 | 568 | ||||||
Amortizing fair value adjustments, FKF Merger | 3,848 | 3,539 | ||||||
Defined benefit plans | 8,284 | 5,259 | ||||||
|
|
|
| |||||
Total deferred tax asset | 22,062 | 19,734 | ||||||
|
|
|
| |||||
Deferred tax liabilities: | ||||||||
Other reserves | (26 | ) | (258 | ) | ||||
QDBP | (5,996 | ) | (2,634 | ) | ||||
Originated MSRs | (1,414 | ) | (1,724 | ) | ||||
Unrealized appreciation on investment securities | (964 | ) | (567 | ) | ||||
|
|
|
| |||||
Total deferred tax liability | (8,400 | ) | (5,183 | ) | ||||
|
|
|
| |||||
Total net deferred tax asset | $ | 13,662 | $ | 14,551 | ||||
|
|
|
| |||||
Not included in the table above are deferred tax assets related to state tax net operating losses related to our leasing subsidiary of approximately $175 thousand as of December 31, 2011, for which we have recorded a full valuation allowance. Also, as of December 31, 2011, the Corporation has a $530 thousand capital loss carry-forward, for which it has recorded a 100% valuation allowance, due to the Corporation’s limited access to instruments that would produce an offsetting capital gain.
B. The provision for income taxes consists of the following:
| (dollars in thousands) | 2011 | 2010 | 2009 | |||||||||
Currently payable | $ | 6,231 | $ | 4,790 | $ | 5,443 | ||||||
Deferred | 3,370 | (278 | ) | 57 | ||||||||
|
|
|
|
|
| |||||||
Total | $ | 9,601 | $ | 4,512 | $ | 5,500 | ||||||
|
|
|
|
|
| |||||||
C. Applicable income taxes differed from the amount derived by applying the statutory federal tax rate to income as follows:
| (dollars in thousands) | 2011 | Tax Rate | 2010 | Tax Rate | 2009 | Tax Rate | ||||||||||||||||||
Computed tax expense at statutory federal rate | $ | 10,260 | 35.0 | % | $ | 4,790 | 35.0 | % | $ | 5,543 | 35.0 | % | ||||||||||||
Tax-exempt income | (395 | ) | (0.8 | )% | (444 | ) | (3.2 | )% | (300 | ) | (1.9 | )% | ||||||||||||
Other, net | (264 | ) | (1.4 | )% | 166 | 1.2 | % | 257 | 1.6 | % | ||||||||||||||
|
|
|
|
|
|
|
|
|
|
|
| |||||||||||||
Total income tax expense | $ | 9,601 | 32.8 | % | $ | 4,512 | 33.0 | % | $ | 5,500 | 34.7 | % | ||||||||||||
|
|
|
|
|
|
|
|
|
|
|
| |||||||||||||
D. Other Income Tax Information
In accordance with the provisions of ASC 740, “Accounting for Uncertainty in Income Taxes”, the Corporation recognizes the financial statement benefit of a tax position only after determining that the Corporation would more likely than not sustain the position following an examination. For tax positions meeting the more-likely-than-not threshold, the amount recognized in the financial statements is the largest benefit that has a greater than 50 percent likelihood of being realized upon settlement with the relevant tax authority. The Corporation applied these criteria to tax positions for which the statute of limitations remained open.
There were no reserves for uncertain tax positions recorded during the twelve months ended December 31, 2011, 2010 or 2009
The Corporation is subject to income taxes in the U.S. federal jurisdiction, and in multiple state jurisdictions. The Corporation is no longer subject to U.S. federal income tax examination by tax authorities for the years before 2008.
The Corporation’s policy is to record interest and penalties on uncertain tax positions as income tax expense. No interest or penalties were accrued in 2011.
As of December 31, 2011, the Corporation has net operating loss carry-forwards for federal income tax purposes of $7.3 million which are available to offset future federal taxable income through 2030. In addition, the Corporation has alternative minimum tax credits of $568 thousand, which are available to reduce future federal regular income taxes over an indefinite period.
As a result of the July 1, 2010 Merger with FKF, the Corporation succeeded to certain tax bad debt reserves that existed at FKF as of June 30, 2010. As of December 31, 2011, the Corporation had unrecognized deferred income taxes of $2.5 million with respect to these reserves. These reserves could be recognized as taxable income and create a current and/or deferred tax liability at the income tax rates then in effect if one of the following conditions occurs: (1) the Corporation’s retained earnings represented by this reserve are used for distributions, in liquidation, or for any other purpose other than to absorb losses from bad debts; (2) the Corporation fails to qualify as a bank, as provided by the Internal Revenue Code; or (3) there is a change in federal tax law.
| 59 |
18. STOCK –BASED COMPENSATION
A. General Information
The Corporation permits the issuance of stock options, dividend equivalents, performance awards, stock appreciation rights, restricted stock and/or restricted stock units to employees and directors of the Corporation under several plans. The terms and conditions of awards under the plans are determined by the Corporation’s Compensation Committee.
Prior to April 25, 2007, all shares authorized for grant as stock-based compensation were limited to grants of stock options. On April 25, 2007, the Shareholders approved the Corporation’s “2007 Long-Term Incentive Plan” (the “2007 LTIP”) under which a total of 428,996 shares of the Corporation’s common stock were made available for award grants. On April 28, 2010, the Shareholders approved the Corporation’s “2010 Long Term Incentive Plan” (“2010 LTIP”) under which a total of 445,002 shares of the Corporation’s common stock were made available for award grants.
The equity awards granted under the 2007 and 2010 LTIPs were authorized to be in the form of, among others, options to purchase the Corporation’s common stock, restricted stock awards (“RSA”s) and performance stock awards (“PSA”s).
The fair value of the RSAs is based on the closing price on the day preceding the date of the grant.
The PSAs vest based on the Corporation’s total shareholder return relative to the performance of the community bank index for the respective period. The amount of PSAs earned will not exceed 100% of the PSAs awarded. The fair value of the PSAs is calculated using the Monte Carlo Simulation method.
In connection with the Merger, 21,133 fully vested options which had been granted to former FKF employees were assumed by the Corporation.
The following table summarizes the remaining shares authorized to be granted for options, RSAs and PSAs:
| Shares Authorized for: | ||||||||
| Options Only | Options, RSAs or PSAs | |||||||
Balance, December 31, 2008 | 10,189 | 180,482 | ||||||
Options granted – five year vesting | (10,189 | ) | (158,993 | ) | ||||
Options forfeited | — | 17,500 | ||||||
|
|
|
| |||||
Balance, December 31, 2009 | — | 38,989 | ||||||
Shares authorized – 2010 LTIP | — | 445,002 | ||||||
Options authorized – FKF Merger | 21,133 | — | ||||||
Options granted – fully vested | (21,133 | ) | — | |||||
RSAs granted – four year cliff-vesting | — | (11,920 | ) | |||||
PSAs granted – three year cliff-vesting | — | (60,767 | ) | |||||
PSAs forfeited | — | 500 | ||||||
Unexercised options expired | — | 14,080 | ||||||
Balance, December 31, 2010 | — | 425,884 | ||||||
RSAs granted – four year cliff-vesting | — | (60,238 | ) | |||||
PSAs granted – four year cliff-vesting | — | (17,085 | ) | |||||
PSAs granted – three year cliff-vesting | — | (9,000 | ) | |||||
Unexercised options expired | — | 19,330 | ||||||
Unexercised options cancelled | — | 19,464 | ||||||
|
|
|
| |||||
Balance, December 31, 2011 | — | 378,355 | ||||||
|
|
|
| |||||
B. Fair Value of Options Granted
The fair value of each option granted is estimated on the date of the grant using the Black-Scholes option pricing model with the following weighted-average assumptions used for grants issued during:
| 2011 | 2010 | 2009 | ||||||||||
Expected dividend yield | — | 3.24 | % | 3.1 | % | |||||||
Expected volatility of Corporation’s stock | — | 45.7 | % | 29.4 | % | |||||||
Risk-free interest rate | — | 1.5 | % | 3.2 | % | |||||||
Expected life in years | — | 6.0 | 7.0 | |||||||||
Weighted average fair value of options granted | — | $ | 5.42 | $ | 4.42 | |||||||
The expected dividend yield is based on the company’s annual dividend amount as a percentage of the average stock price at the time of the grant. Expected life is equal to the mid-point of the average time to vest and the contractual term. Expected volatility of the Corporation’s stock is based on the historic volatility of the Corporation’s stock price. The risk-free interest rate is based on the zero-coupon U.S. Treasury interest rate ranging from one month to ten years and a period commensurate with the expected life of the option.
| 60 |
C. Other Stock Option Information – The following table provides information about options outstanding:
| For the Twelve Months Ended December 31, | ||||||||||||||||||||||||||||||||||||
| 2011 | 2010 | 2009 | ||||||||||||||||||||||||||||||||||
| Shares | Weighted Average Exercise Price | Weighted Average Grant Date Fair Value | Shares | Weighted Average Exercise Price | Weighted Average Grant Date Fair Value | Shares | Weighted Average Exercise Price | Weighted Average Grant Date Fair Value | ||||||||||||||||||||||||||||
Options outstanding, beginning of period | 993,710 | $ | 19.82 | $ | 4.44 | 1,012,896 | $ | 19.75 | $ | 4.41 | 901,814 | $ | 19.70 | $ | 4.31 | |||||||||||||||||||||
Granted | — | — | — | 21,133 | $ | 13.35 | $ | 5.42 | 169,182 | $ | 18.27 | $ | 4.42 | |||||||||||||||||||||||
Forfeited | (16,320 | ) | $ | 20.94 | $ | 4.79 | (14,080 | ) | $ | 21.53 | $ | 4.87 | — | — | — | |||||||||||||||||||||
Expired | (32,330 | ) | $ | 21.87 | $ | 5.04 | — | — | — | (17,500 | ) | $ | 19.50 | $ | 4.25 | |||||||||||||||||||||
Exercised | (68,590 | ) | $ | 14.08 | $ | 2.79 | (26,239 | ) | $ | 10.97 | $ | 3.14 | (40,600 | ) | $ | 12.68 | $ | 2.45 | ||||||||||||||||||
|
|
|
|
|
| |||||||||||||||||||||||||||||||
Options outstanding, end of period | 876,470 | $ | 20.17 | $ | 4.49 | 993,710 | $ | 19.82 | $ | 4.45 | 1,012,896 | $ | 19.75 | $ | 4.41 | |||||||||||||||||||||
|
|
|
|
|
| |||||||||||||||||||||||||||||||
The following table provides information related to options as of December 31, 2011:
| Options Outstanding | Options Exercisable | |||||||||||||||||||
Range of Exercise Prices | Options Outstanding | Remaining Contractual Life | Number Exercisable At 12/31/10 | Remaining Contractual Life | Weighted Average Exercise Price | |||||||||||||||
$10.36 - $10.75 | 5,330 | 6.89 yrs | 5,330 | 6.89 yrs | $ | 10.36 | ||||||||||||||
$15.16 - $17.00 | 26,000 | 0.29 yrs | 26,000 | 0.29 yrs | $ | 16.25 | ||||||||||||||
$17.01 - $18.91 | 398,982 | 4.22 yrs | 307,223 | 3.30 yrs | $ | 18.50 | ||||||||||||||
$18.92 - $20.00 | 7,219 | 1.75 yrs | 7,219 | 1.75 yrs | $ | 19.47 | ||||||||||||||
$20.01 - $21.00 | 85,000 | 2.31 yrs | 85,000 | 2.31 yrs | $ | 20.47 | ||||||||||||||
$21.01 - $22.00 | 229,925 | 4.60 yrs | 208,375 | 4.51 yrs | $ | 21.55 | ||||||||||||||
$22.01 - $24.27 | 124,014 | 6.17 yrs | 78,808 | 6.07 yrs | $ | 24.11 | ||||||||||||||
|
|
|
| |||||||||||||||||
| 876,470 | 4.29 yrs | 717,955 | 3.74 yrs | $ | 20.10 | |||||||||||||||
|
|
|
| |||||||||||||||||
The following table provides information about unvested options:
| For the Twelve Months Ended December 31, | ||||||||||||||||||||||||
| 2011 | 2010 | 2009 | ||||||||||||||||||||||
| Shares | Weighted Average Grant Date Fair Value | Shares | Weighted Average Grant Date Fair Value | Shares | Weighted Average Grant Date Fair Value | |||||||||||||||||||
Unvested options, beginning of period | 249,574 | $ | 4.76 | 350,076 | $ | 4.78 | 237,172 | $ | 5.15 | |||||||||||||||
Granted | — | — | 21,133 | $ | 5.42 | 169,182 | $ | 4.42 | ||||||||||||||||
Vested | (74,739 | ) | $ | 4.82 | (107,405 | ) | $ | 4.96 | (56,278 | ) | $ | 5.22 | ||||||||||||
Forfeited | (16,320 | ) | $ | 4.79 | (14,230 | ) | $ | 4.87 | — | — | ||||||||||||||
|
|
|
|
|
| |||||||||||||||||||
Unvested options, end of period | 158,515 | $ | 4.73 | 249,574 | $ | 4.76 | 350,076 | $ | 4.78 | |||||||||||||||
|
|
|
|
|
| |||||||||||||||||||
Proceeds, related tax benefits realized from options exercised and intrinsic value of options exercised were as follows:
| For the Twelve Months Ended December 31, | ||||||||||||
| (dollars in thousands) | 2011 | 2010 | 2009 | |||||||||
Proceeds from strike price of value of options exercised | $ | 966 | $ | 288 | $ | 514 | ||||||
Related tax benefit recognized | 141 | 60 | 66 | |||||||||
|
|
|
|
|
| |||||||
Proceeds of options exercised | $ | 1,107 | $ | 348 | $ | 580 | ||||||
Intrinsic value of options exercised | $ | 444 | $ | 460 | $ | 690 | ||||||
|
|
|
|
|
| |||||||
The following table provides information about options outstanding and exercisable options:
| As of December 31, | ||||||||||||||||||||||||
| 2011 | 2010 | 2009 | ||||||||||||||||||||||
| Options Outstanding | Exercisable Options | Options Outstanding | Exercisable Options | Options Outstanding | Exercisable Options | |||||||||||||||||||
Number | 876,470 | 717,955 | 993,710 | 744,136 | 1,013,396 | 663,320 | ||||||||||||||||||
Weighted average exercise price | $ | 20.17 | $ | 20.10 | $ | 19.82 | $ | 19.52 | $ | 19.75 | $ | 19.15 | ||||||||||||
Aggregate intrinsic value | $ | 549,495 | $ | 437,549 | $ | 260,320 | $ | 260,320 | $ | 167,536 | $ | 167,536 | ||||||||||||
Weighted average contractual term | 4.3 yrs | 3.7 yrs | 5.0 yrs | 4.0 yrs | 6.1 yrs | 4.6 yrs | ||||||||||||||||||
61
The unamortized stock based compensation expense on stock options at December 31, 2011 was $467 thousand which will be recognized over the next 25 months.
D. Restricted Stock Awards and Performance Stock Awards
The Corporation has granted restricted stock awards and Performance Stock Awards under the 2007 LTIP and 2010 LTIP Plans.
The compensation expense for the RSAs is measured based on the market price of the stock on the day prior to the grant date and is recognized on a straight line basis over the vesting period, accelerated for retirement eligibility. Stock restrictions are subject to alternate vesting for death and disability and retirement.
During 2011, the Corporation recognized $131 thousand of expense related to the Corporation’s RSAs. As of December 31, 2011, there was $526 thousand of unrecognized compensation cost related to RSAs. This cost will be recognized over a weighted average period of 3.3 years.
The following table details the RSAs for the twelve month periods ended December 31, 2011, 2010 and 2009:
| Twelve Months Ended December 31, 2011 | Twelve Months Ended December 31, 2010 | Twelve Months Ended December 31,2009 | ||||||||||||||||||||||
| Number of Shares | Weighted Average Grant Date Fair Value | Number of Shares | Weighted Average Grant Date Fair Value | Number of Shares | Weighted Average Grant Date Fair Value | |||||||||||||||||||
Beginning | 11,920 | $ | 16.78 | — | — | — | — | |||||||||||||||||
Granted | 26,085 | $ | 18.50 | 11,920 | $ | 16.78 | ||||||||||||||||||
Vested | (2,980 | ) | $ | 16.78 | — | — | — | — | ||||||||||||||||
Forfeited | — | — | — | — | — | — | ||||||||||||||||||
|
|
|
|
|
|
|
|
|
|
|
| |||||||||||||
Ending | 35,025 | $ | 18.06 | 11,920 | $ | 16.78 | — | — | ||||||||||||||||
|
|
|
|
|
|
|
|
|
|
|
| |||||||||||||
The compensation expense for PSAs is measured based on the grant date fair value as calculated using the Monte Carlo Simulation. The Simulation used various assumptions that include expected volatility of 52.42%, a risk free rate of return of 0.32% and a correlation co-efficient of 0.6531%
The Corporation recognized $382 thousand of expense related to the PSAs in 2011. As of December 31, 2011 there was $689 thousand of unrecognized compensation cost related to PSAs. This cost will be recognized over a weighted average period of 2.2 years.
The following table details the PSAs for the twelve month periods ending December 31, 2011, 2010 and 2009:
| Twelve Months Ended December 31, 2011 | Twelve Months Ended December 31, 2010 | Twelve Months Ended December 31,2009 | ||||||||||||||||||||||
| Number of Shares | Weighted Average Grant Date Fair Value | Number of Shares | Weighted Average Grant Date Fair Value | Number of Shares | Weighted Average Grant Date Fair Value | |||||||||||||||||||
Beginning | 60,267 | $ | 9.64 | — | — | — | — | |||||||||||||||||
Granted | 60,238 | $ | 10.07 | 60,767 | $ | 9.64 | — | — | ||||||||||||||||
Vested | — | — | — | — | ||||||||||||||||||||
Forfeited | (3,144 | ) | $ | 9.64 | (500 | ) | $ | 9.64 | — | — | ||||||||||||||
|
|
|
|
|
|
|
|
|
|
|
| |||||||||||||
Ending | 117,361 | $ | 9.86 | 60,267 | $ | 9.64 | — | — | ||||||||||||||||
|
|
|
|
|
|
|
|
|
|
|
| |||||||||||||
19. Earnings Per Share
The calculation of basic earnings per share and diluted earnings per share is presented below:
(dollars in thousands, except per share data) | Year Ended December 31, | |||||||||||
| 2011 | 2010 | 2009 | ||||||||||
Numerator—Net income available to common shareholders | $ | 19,713 | $ | 9,174 | $ | 10,337 | ||||||
|
|
|
|
|
| |||||||
Denominator for basic earnings per share – Weighted average shares outstanding | 12,746,346 | 10,765,657 | 8,732,004 | |||||||||
Effect of dilutive potential common shares | 82,313 | 12,312 | 16,719 | |||||||||
|
|
|
|
|
| |||||||
Denominator for diluted earnings per share – Adjusted weighted average shares outstanding | 12,828,659 | 10,777,969 | 8,748,723 | |||||||||
|
|
|
|
|
| |||||||
Basic earnings per share | $ | 1.55 | $ | 0.85 | $ | 1.18 | ||||||
Diluted earnings per share | $ | 1.54 | $ | 0.85 | $ | 1.18 | ||||||
Antidulitive shares excluded from computation of average dilutive earnings per share | 941,005 | 941,079 | 806,396 | |||||||||
|
|
|
|
|
| |||||||
All weighted average shares, actual shares and per share information in the financial statements have been adjusted retroactively for the effect of stock dividends and splits. See Note 1-P – “Summary of Significant Accounting Policies: Earnings Per Common Share” for a discussion on the calculation of earnings per share.
| 62 |
20. OTHER OPERATING INCOME
Components of other operating income for the indicated years ended December 31 include:
| (dollars in thousands) | 2011 | 2010 | 2009 | |||||||||
Merchant interchange fees | $ | 559 | $ | 360 | $ | 248 | ||||||
Commissions and fees | 468 | 396 | 372 | |||||||||
Safe deposit box rentals | 407 | 365 | 334 | |||||||||
Insurance commissions | 403 | 386 | 394 | |||||||||
Other investment income | 244 | 195 | 133 | |||||||||
Title insurance income | 119 | 207 | 355 | |||||||||
Rent income | 116 | 167 | 222 | |||||||||
Miscellaneous other income | 1,181 | 525 | 700 | |||||||||
|
|
|
|
|
| |||||||
Other operating income | $ | 3,497 | $ | 2,601 | $ | 2,758 | ||||||
|
|
|
|
|
| |||||||
21. OTHER OPERATING EXPENSE
Components of other operating expense for the indicated years ended December 31 include:
| (dollars in thousands) | 2011 | 2010 | 2009 | |||||||||
Information technology | $ | 1,518 | $ | 1,376 | $ | 846 | ||||||
Loan processing | 1,114 | 1,040 | 1,049 | |||||||||
Other taxes | 973 | 728 | 650 | |||||||||
Temporary help and recruiting | 712 | 570 | 379 | |||||||||
Telephone | 514 | 455 | 371 | |||||||||
Travel and entertainment | 507 | 410 | 360 | |||||||||
Stationary and supplies | 496 | 400 | 323 | |||||||||
Postage | 415 | 370 | 351 | |||||||||
Director fees | 359 | 331 | 311 | |||||||||
Portfolio maintenance | 313 | 242 | 200 | |||||||||
Dues and subscriptions | 287 | 244 | 218 | |||||||||
Contributions | 279 | 259 | 252 | |||||||||
Insurance | 277 | 253 | 248 | |||||||||
Miscellaneous other expense | 1,628 | 1,094 | 581 | |||||||||
|
|
|
|
|
| |||||||
Other operating expense | $ | 9,392 | $ | 7,772 | $ | 6,139 | ||||||
|
|
|
|
|
| |||||||
22. RELATED PARTY TRANSACTIONS
In the ordinary course of business, the Bank granted loans to principal officers, directors and their affiliates. Loan activity during 2011 and 2010 was as follows:
Following is a summary of these transactions:
| (dollars in thousands) | 2011 | 2010 | ||||||
Balance, January 1 | $ | 6,117 | $ | 4,472 | ||||
Additions | — | 2,232 | ||||||
Amounts collected | (113 | ) | (587 | ) | ||||
|
|
|
| |||||
Balance, December 31 | $ | 6,004 | $ | 6,117 | ||||
|
|
|
| |||||
Related party deposits amounted to $961 thousand and $917 thousand at December 31, 2011 and 2010, respectively.
23. FINANCIAL INSTRUMENTSWITH OFF-BALANCE SHEET RISK, CONTINGENCIESAND CONCENTRATIONOF CREDIT RISK
Off-Balance Sheet Risk
The Corporation is a party to financial instruments with off-balance sheet risk in the normal course of business to meet the financing needs of its customers. These financial instruments include commitments to extend credit and standby letters of credit. Those instruments involve, to varying degrees, elements of credit risk in excess of the amount recognized in the consolidated statements of financial condition. The contractual amounts of those instruments reflect the extent of involvement the Corporation has in particular classes of financial instruments.
The Corporation’s exposure to credit loss in the event of nonperformance by the counterparty to the financial instrument of commitments to extend credit and standby letters of credit is represented by the contractual amount of those instruments. The Corporation uses the same credit policies in making commitments and conditional obligations as it does for on-balance sheet financial instruments.
Commitments to extend credit, which include unused lines of credit and unfunded commitments to originate loans, are agreements to lend to a customer as long as there is no violation of any condition established in the agreement. Commitments generally have fixed expiration dates or other termination clauses and may require payment of a fee. Some of the commitments are expected to expire without being drawn upon, and the total commitment amounts do not necessarily represent future cash requirements. Total commitments to extend credit at December 31, 2011 were $353.0 million. The Corporation evaluates each customer’s creditworthiness on a case-by-case basis. The amount of collateral obtained, if deemed necessary by the Corporation upon extension of credit, is based on a credit evaluation of the counterparty. Collateral varies but may include accounts receivable, marketable securities, inventory, property, plant and equipment, residential real estate, and income-producing commercial properties.
Standby letters of credit are conditional commitments issued by the Bank to a customer for a third party. Such standby letters of credits are issued to support private borrowing arrangements. The credit risk involved in issuing standby letters of credit is similar to that involved in extending loan facilities to customers. The collateral varies, but may include accounts receivable, marketable securities, inventory, property, plant and equipment, and residential real estate for those commitments for which collateral is deemed necessary. The Corporation’s obligation under standby letters of credit as of December 31, 2011 amounted to $20.5 million. There were no outstanding bankers’ acceptances as of December 31, 2011.
| 63 |
Contingencies
Legal Matters
In the ordinary course of business, the Corporation is subject to litigation, claims, and assessments that involve claims for monetary relief. Some of these are covered by insurance. Based upon information presently available to the Corporation and its counsel, it is the Corporation’s opinion that any legal and financial responsibility arising from such claims will not have a material, adverse effect on its results of operations, financial condition or capital.
Indemnifications
In general, the Corporation does not sell loans with recourse, except to the extent that it arises from standard loan-sale contract provisions. These provisions cover violations of representations and warranties and, under certain circumstances, first payment default by borrowers. These indemnifications may include the repurchase of loans by the Corporation, and are considered customary provisions in the secondary market for conforming mortgage loan sales. For the twelve months ended December 31, 2011, 2010 and 2009, the Corporation recorded an immaterial amount of loan repurchases resulting from these provisions.
Concentrations of Credit Risk
The Corporation has a material portion of its loans in real estate related loans. A predominant percentage of the Corporation’s real estate exposure, both commercial and residential, is in the Corporation’s primary trade area which includes portions of Delaware, Chester, Montgomery and Philadelphia counties in Southeastern Pennsylvania. The Corporation is aware of this concentration and attempts to mitigate this risk to the extent possible in many ways, including the underwriting and assessment of borrower’s capacity to repay. See Note 5 – “Loans and Leases” for additional information.
As of December 31, 2011, the Corporation had no loans sold with recourse outstanding.
24. DIVIDEND RESTRICTIONS
The Bank is subject to the Pennsylvania Banking Code of 1965 (the “Code”), as amended, and is restricted in the amount of dividends that can be paid to its sole shareholder, the Corporation. The Code restricts the payment of dividends by the Bank to the amount of its net income during the current calendar year and the retained net income of the prior two calendar years, unless the dividend has been approved by the Board of Governors of the Federal Reserve System. The total retained net income for the years ended December 31, 2010 and 2011 was $14.8 million. Accordingly, the dividend payable by the Bank to the Corporation is limited to $14.8 million plus net income earned in 2012. However, the amount of dividends paid by the Bank may not reduce capital levels below levels that would cause the Bank to be considered less than adequately capitalized as detailed in Note 25 – “Regulatory Capital Requirements”.
25. REGULATORY CAPITAL REQUIREMENTS
A. General Regulatory Capital Information
Both the Corporation and the Bank are subject to various regulatory capital requirements, administered by the federal banking agencies. Failure to meet minimum capital requirements can initiate certain mandatory and possibly additional discretionary actions by regulators that, if taken, could have a direct material effect on the Corporation’s and the Bank’s financial statements. Under capital adequacy guidelines and the regulatory framework for prompt corrective action, the Corporation and the Bank must meet specific capital guidelines that involve quantitative measures of their assets, liabilities and certain off-balance-sheet items as calculated under regulatory accounting practices. The capital amounts and classifications are also subject to qualitative judgments by the regulators about components, risk weightings and other factors. Prompt corrective action provisions are not applicable to bank holding companies.
B. S-3 Shelf Registration Statement and Offerings Thereunder
In June 2009, the Corporation filed a shelf registration statement (the “Shelf Registration Statement”) which allows the Corporation to raise additional capital through offers and sales of registered securities consisting of common stock, warrants to purchase common stock, stock purchase contracts or units consisting of any combination of the foregoing securities. Using the prospectus in the Shelf Registration Statement, together with applicable prospectus supplements, the Corporation may sell, from time to time, in one or more offerings, any amount of such securities in a dollar amount up to $90,000,000, in the aggregate.
In addition to the shares issued through the Plan above, on May 18, 2010, through a registered direct stock offering, the Corporation issued 1,548,167 common shares, at a price of $17.00 per share, raising $24.6 million after deducting placement agent’s fees and other offering expenses of $1.7 million.
On July 20, 2009, the Corporation filed with the Securities and Exchange Commission a prospectus supplement in order to register 850,000 common shares of its stock, under the Shelf Registration Statement in connection with a Dividend Reinvestment and Stock Purchase Plan (the “Plan”). The Plan allows for the grant of a request for waiver (“RFW”) above the Plan maximum investment of $120 thousand per account per year. An RFW is granted based on a variety of factors, including the Corporation’s current and projected capital needs, prevailing market prices of the Corporation’s common stock and general economic and market conditions.
The Plan is intended to allow both existing shareholders and new investors to easily and conveniently increase their investment in the Corporation without incurring many of the fees and commissions normally associated with brokerage transactions. For the twelve months ended December 31, 2011 and 2010, the Corporation issued 448,377 and 119,175 shares, respectively, and raised $8.3 million and $2.0 million, respectively, through the Plan.
| 64 |
C. Private Transactions in Securities
In April 2009, the Bank raised $7.5 million in subordinated debt which qualified as Tier II capital. This subordinated debt bears interest at a rate per annum equal to the ninety day LIBOR rate plus 5.75% and is adjusted quarterly. Interest is payable quarterly and principal is due on June 15, 2019. The rate of interest is capped at 10.0% per annum during the first five years of the term.
In April 2009, in accordance with and reliance on the exemption provided by Section 4(2) of the Securities Act of 1933, as amended (the “Securities Act”), the Corporation also sold 150,061 shares of its common stock, par value $1.00 per share (“Shares”), in a private placement of securities to a purchaser which qualifies as an accredited investor under Rule 501(a) of Regulation D under the Securities Act. The purchase price per Share was equal to the average closing price of shares of the Corporation’s common stock on NASDAQ for the thirty trading days ending on April 16, 2009, which equaled $16.66 per Share. The aggregate purchase price for the Shares sold was $2.5 million. The Corporation did not pay any underwriting discounts or commissions and did not pay any brokerage fees in connection with the sale of the Shares. The Shares sold constituted, at the time, 1.7% of the outstanding shares of the Corporation’s common stock, as determined immediately after the closing of the sale.
D. Shares Issued in Mergers and Acquisitions
In connection with the Acquisition of PWMG, the Corporation issued 322,101 common shares, valued at $6.7 million, to former shareholders of PWMG. These shares were registered on an S-3 registration statement filed by the Corporation in September 2011.
In connection with the Merger with FKF, the Corporation issued 1,630,053 common shares, valued at $26.5 million, to former shareholders of FKF. These shares were registered on an S-4 registration statement filed by the Corporation in January 2010.
E. Regulatory Capital Ratios
As set forth in the following table, quantitative measures have been established to ensure capital adequacy ratios required of both the Corporation and the Bank. Both the Corporation’s and the Bank’s Tier II capital ratios are calculated by adding back a portion of the loan loss reserve to the Tier I capital. The Corporation believes that as of December 31, 2011 and 2010, the Corporation and the Bank had met all capital adequacy requirements to which they were subject. Federal banking regulators have defined specific capital categories, and categories range from a best of “well capitalized” to a worst of “critically under capitalized.” Both the Corporation and the Bank were classified as “well capitalized” as of December 31, 2011 and 2010.
See Note 16 – “Pension and Postretirement Benefit Plans” for certain information relating to accumulated other comprehensive income.
The Corporation’s and the Bank’s actual capital amounts and ratios as of December 31, 2011 and 2010 are presented in the following table:
| Actual | Minimum to be Well Capitalized | |||||||||||||||
| (dollars in thousands) | Amount | Ratio | Amount | Ratio | ||||||||||||
December 31, 2011 | ||||||||||||||||
Total (Tier II) Capital to Risk Weighted Assets: | ||||||||||||||||
Corporation | $ | 189,447 | 13.83 | % | $ | 136,948 | 10 | % | ||||||||
Bank | 196,090 | 14.37 | % | 136,481 | 10 | % | ||||||||||
Tier I Capital to Risk Weighted Assets: | ||||||||||||||||
Corporation | 154,171 | 11.26 | % | 82,169 | 6 | % | ||||||||||
Bank | 160,814 | 11.78 | % | 81,899 | 6 | % | ||||||||||
Tier I Capital to Quarterly Average Assets: | ||||||||||||||||
Corporation | 154,171 | 8.97 | % | 85,955 | 5 | % | ||||||||||
Bank | 160,814 | 9.37 | % | 85,854 | 5 | % | ||||||||||
December 31, 2010 | ||||||||||||||||
Total (Tier II) Capital to Risk Weighted Assets: | ||||||||||||||||
Corporation | $ | 186,657 | 13.71 | % | $ | 136,142 | 10 | % | ||||||||
Bank | 182,587 | 13.47 | % | 135,556 | 10 | % | ||||||||||
Tier I Capital to Risk Weighted Assets: | ||||||||||||||||
Corporation | 153,806 | 11.30 | % | 81,685 | 6 | % | ||||||||||
Bank | 149,742 | 11.05 | % | 81,334 | 6 | % | ||||||||||
Tier I Capital to Quarterly Average Assets: | ||||||||||||||||
Corporation | 153,806 | 8.85 | % | 86,926 | 5 | % | ||||||||||
Bank | 149,742 | 8.62 | % | 86,828 | 5 | % | ||||||||||
65
26.SELECTED QUARTERLY FINANCIAL DATA1 (UNAUDITED)
| Quarters Ended 2011 | ||||||||||||||||
| (dollars in thousands, except per share data) | 3/31 | 6/30 | 9/30 | 12/31 | ||||||||||||
Interest income | $ | 18,226 | $ | 18,851 | $ | 18,672 | $ | 18,690 | ||||||||
Interest expense | 2,819 | 3,052 | 3,018 | 2,772 | ||||||||||||
|
|
|
|
|
|
|
| |||||||||
Net interest income | 15,407 | 15,799 | 15,654 | 15,918 | ||||||||||||
Provision for loan and lease losses | 1,285 | 1,919 | 1,828 | 1,056 | ||||||||||||
Other income | 7,210 | 8,165 | 9,276 | 9,499 | ||||||||||||
Other expense | 14,197 | 14,869 | 15,985 | 16,475 | ||||||||||||
|
|
|
|
|
|
|
| |||||||||
Income before income taxes | 7,135 | 7,176 | 7,117 | 7,886 | ||||||||||||
Tax expense | 2,419 | 2,371 | 2,095 | 2,716 | ||||||||||||
|
|
|
|
|
|
|
| |||||||||
Net income. | $ | 4,716 | $ | 4,805 | $ | 5,022 | $ | 5,170 | ||||||||
|
|
|
|
|
|
|
| |||||||||
Basic earnings per common share | $ | 0.38 | $ | 0.38 | $ | 0.39 | $ | 0.40 | ||||||||
Diluted earnings per common share | $ | 0.38 | $ | 0.38 | $ | 0.39 | $ | 0.40 | ||||||||
Dividend declared | $ | 0.15 | $ | 0.15 | $ | 0.15 | $ | 0.15 | ||||||||
| Quarters Ended 2010 | ||||||||||||||||
| (dollars in thousands, except per share data) | 3/31 | 6/30 | 9/30 | 12/31 | ||||||||||||
Interest income | $ | 13,894 | $ | 13,824 | $ | 18,473 | $ | 18,605 | ||||||||
Interest expense | 2,777 | 2,773 | 3,691 | 3,405 | ||||||||||||
|
|
|
|
|
|
|
| |||||||||
Net interest income | 11,117 | $ | 11,051 | $ | 14,782 | $ | 15,200 | |||||||||
Provision for loan and lease losses | 3,113 | 994 | 4,236 | 1,511 | ||||||||||||
Other income | 7,159 | 5,890 | 7,053 | 9,273 | ||||||||||||
Other expense | 11,753 | 12,103 | 19,372 | 14,764 | ||||||||||||
|
|
|
|
|
|
|
| |||||||||
Income (loss) before income taxes | 3,410 | 3,844 | (1,766 | ) | 8,198 | |||||||||||
Tax expense (benefit) | 1,187 | 1,438 | (746 | ) | 2,633 | |||||||||||
|
|
|
|
|
|
|
| |||||||||
Net income (loss) | $ | 2,223 | $ | 2,406 | $ | (1,020 | ) | $ | 5,565 | |||||||
|
|
|
|
|
|
|
| |||||||||
Basic earnings per common share | $ | 0.25 | $ | 0.25 | $ | (0.08 | ) | $ | 0.46 | |||||||
Diluted earnings per common share | $ | 0.25 | $ | 0.25 | $ | (0.08 | ) | $ | 0.46 | |||||||
Dividend declared | $ | 0.14 | $ | 0.14 | $ | 0.14 | $ | 0.14 | ||||||||
| 1 | Earnings per share is computed independently for each period shown. As a result, the sum of the quarters may not equal the total earnings per share for the year. |
27. PARENT COMPANY-ONLY FINANCIAL STATEMENTS
The condensed financial statements of the Corporation (parent company only) are presented below. These statements should be read in conjunction with the Notes to the Consolidated Financial Statements.
A. Condensed Balance Sheets
| (dollars in thousands) | 2011 | 2010 | ||||||
Assets: | ||||||||
Cash | $ | 4,402 | $ | 4,208 | ||||
Investment securities | — | 256 | ||||||
Investments in subsidiaries, at equity in net assets | 192,954 | 169,296 | ||||||
Premises and equipment, net | 2,779 | 2,877 | ||||||
Goodwill | 245 | 457 | ||||||
Other assets | 2,084 | 1,910 | ||||||
|
|
|
| |||||
Total assets | $ | 202,464 | $ | 179,004 | ||||
|
|
|
| |||||
Liabilities and shareholders’ equity: | ||||||||
Borrowings | $ | 13,691 | $ | 2,001 | ||||
Jr. subordinated debentures | — | 12,029 | ||||||
Accrued interest payable | — | 1,239 | ||||||
Accrued taxes payable | — | 41 | ||||||
Other liabilities | 2,860 | 2,276 | ||||||
|
|
|
| |||||
Total liabilities | $ | 16,551 | $ | 17,586 | ||||
|
|
|
| |||||
Common stock, par value $1, authorized 100,000,000 shares issued 16,103,981 shares and 15,109,718 shares as of December 31, 2011 and 2010, respectively, and outstanding 13,194,439 shares and 12,195,240 shares as of December 31, 2011 and 2010, respectively | $ | 16,104 | $ | 15,110 | ||||
Paid-in capital in excess of par value | 84,425 | 68,398 | ||||||
Less common stock in treasury, at cost—2,909,542 shares and 2,914,478 shares as of December 31, 2011 and 2010, respectively | (29,833 | ) | (29,881 | ) | ||||
Accumulated other comprehensive loss, net of deferred income taxes benefit | (11,365 | ) | (6,757 | ) | ||||
Retained earnings | 126,582 | 114,548 | ||||||
|
|
|
| |||||
Total shareholders’ equity | $ | 185,913 | $ | 161,418 | ||||
|
|
|
| |||||
Total liabilities and shareholders’ equity | $ | 202,464 | $ | 179,004 | ||||
|
|
|
| |||||
B. Condensed Statements of Income
| Twelve Months Ended December 31, | ||||||||||||
| (dollars in thousands) | 2011 | 2010 | 2009 | |||||||||
Dividends from subsidiaries | $ | 9,650 | $ | 4,900 | $ | 1,204 | ||||||
Interest and other income | 2,644 | 1,569 | 1,012 | |||||||||
|
|
|
|
|
| |||||||
Total operating income | 12,294 | 6,469 | 2,216 | |||||||||
Expenses | 2,636 | 1,711 | 918 | |||||||||
|
|
|
|
|
| |||||||
Income before equity in undistributed income of subsidiaries | 9,658 | 4,758 | 1,298 | |||||||||
Equity in undistributed income of subsidiaries | 10,058 | 4,368 | 9,071 | |||||||||
|
|
|
|
|
| |||||||
Income before income taxes | 19,716 | 9,126 | 10,369 | |||||||||
Income tax expense (benefit) | 3 | (48 | ) | 32 | ||||||||
|
|
|
|
|
| |||||||
Net income | $ | 19,713 | $ | 9,174 | $ | 10,337 | ||||||
|
|
|
|
|
| |||||||
66
C. Condensed Statements of Cash Flows
| Twelve Months Ended December 31, | ||||||||||||
| (dollars in thousands) | 2011 | 2010 | 2009 | |||||||||
Operating activities: | ||||||||||||
Net Income | $ | 19,713 | $ | 9,174 | $ | 10,337 | ||||||
Adjustments to reconcile net income to net cash provided by operating activities: | ||||||||||||
Equity in undistributed income of subsidiaries | (10,058 | ) | (4,368 | ) | (9,071 | ) | ||||||
Depreciation and amortization | 105 | 102 | 98 | |||||||||
Net gain on sale of available for sale securities | (38 | ) | (50 | ) | — | |||||||
Stock-based compensation cost | 876 | 539 | 386 | |||||||||
Net accretion of fair value adjustments | (55 | ) | (78 | ) | — | |||||||
Other, net | 110 | 31 | (159 | ) | ||||||||
|
|
|
|
|
| |||||||
Net cash provided by operating activities | 10,653 | 5,350 | 1,591 | |||||||||
|
|
|
|
|
| |||||||
Investing Activities: | ||||||||||||
Proceeds from sale of available for sale securities | 282 | 450 | — | |||||||||
Acquisitions, net of cash acquired | (13,367 | ) | (4,565 | ) | — | |||||||
Sale of subsidiary | 18,411 | — | — | |||||||||
Investment in subsidiaries | (17,200 | ) | (21,761 | ) | 660 | |||||||
|
|
|
|
|
| |||||||
Net cash used by investing activities | (11,874 | ) | (25,876 | ) | 660 | |||||||
|
|
|
|
|
| |||||||
Financing activities: | ||||||||||||
Dividends paid | (7,679 | ) | (5,916 | ) | (4,892 | ) | ||||||
Change in other borrowings | 11,690 | (62 | ) | 2,062 | ||||||||
Decrease in junior subordinated debt | (12,028 | ) | — | — | ||||||||
Repurchase of treasury stock | — | — | (42 | ) | ||||||||
Proceeds from issuance of common stock | 8,325 | 26,688 | 3,660 | |||||||||
Tax benefit on exercise of stock option | 141 | 60 | 66 | |||||||||
Proceeds from exercise of stock options | 966 | 288 | 514 | |||||||||
|
|
|
|
|
| |||||||
Net cash provided by financing activities | 1,415 | 21,058 | 1,368 | |||||||||
|
|
|
|
|
| |||||||
Change in cash and cash equivalents | 194 | 532 | 3,619 | |||||||||
Cash and cash equivalents at beginning of year | 4,208 | 3,676 | 57 | |||||||||
|
|
|
|
|
| |||||||
Cash and cash equivalents at end of year | $ | 4,402 | $ | 4,208 | $ | 3,676 | ||||||
|
|
|
|
|
| |||||||
28. SEGMENT INFORMATION
FASB Codification 280 – “Segment Reporting” identifies operating segments as components of an enterprise which are evaluated regularly by the Corporation’s Chief Operating Decision Maker, our Chief Executive Officer, in deciding how to allocate resources and assess performance. The Corporation has applied the aggregation criterion set forth in this codification to the results of its operations.
The Corporation’s Banking segment consists of commercial and retail banking. The Banking segment is evaluated as a single strategic unit which generates revenues from a variety of products and services. The Banking segment generates interest income from its lending (including leases) and investing activities and is dependent on the gathering of lower cost deposits from its branch network or borrowed funds from other sources for funding its loans, resulting in the generation of net interest income. The Banking segment also derives revenues from other sources including gains on the sale in available for sale investment securities, gains on the sale of residential mortgage loans, service charges on deposit accounts, cash sweep fees, overdraft fees, BOLI income and interchange revenue associated with its Visa Check Card offering.
The Wealth Management segment has responsibility for a number of activities within the Corporation, including trust administration, other related fiduciary services, custody, investment management and advisory services, employee benefits and IRA administration, estate settlement, tax services and brokerage. Bryn Mawr Trust of Delaware and Lau Associates are included in the Wealth Management Segment of the Corporation since they have similar economic characteristics, products and services to those of the Wealth Management division of the Corporation.
The accounting policies of the Corporation are applied by segment in the following tables. The segments are presented on a pre-tax basis which is the way the Corporation evaluates business results.
The following table details the Corporation’s segments.
67
Segment information for the years ended or as of December 31:
| 2011 | 2010 | 2009 | ||||||||||||||||||||||||||||||||||
| (dollars in thousands) | Banking | Wealth Management | Consolidated | Banking | Wealth Management | Consolidated | Banking | Wealth Management | Consolidated | |||||||||||||||||||||||||||
Net interest income | $ | 62,771 | $ | 7 | $ | 62,778 | $ | 52,141 | $ | 9 | $ | 52,150 | $ | 40,781 | $ | 12 | $ | 40,793 | ||||||||||||||||||
Less: loan loss provision | 6,088 | — | 6,088 | 9,854 | — | 9,854 | 6,884 | — | 6,884 | |||||||||||||||||||||||||||
|
|
|
|
|
|
|
|
|
|
|
|
|
|
|
|
|
| |||||||||||||||||||
Net interest income after loan loss provision | 56,683 | 7 | 56,690 | 42,287 | 9 | 42,296 | 33,897 | 12 | 33,909 | |||||||||||||||||||||||||||
|
|
|
|
|
|
|
|
|
|
|
|
|
|
|
|
|
| |||||||||||||||||||
Other income: | ||||||||||||||||||||||||||||||||||||
Fees for wealth management services | — | 21,669 | 21,669 | — | 15,499 | 15,499 | — | 14,178 | 14,178 | |||||||||||||||||||||||||||
Service charges on deposit accounts | 2,495 | — | 2,495 | 2,307 | — | 2,307 | 1,951 | — | 1,951 | |||||||||||||||||||||||||||
Loan servicing and other fees | 1,824 | — | 1,824 | 1,626 | — | 1,626 | 1,387 | — | 1,387 | |||||||||||||||||||||||||||
Net gain on sale of loans | 2,517 | — | 2,517 | 4,718 | — | 4,718 | 6,012 | — | 6,012 | |||||||||||||||||||||||||||
Net gain on sale of available for sale securities | 1,783 | — | 1,783 | 2,472 | — | 2,472 | 1,923 | — | 1,923 | |||||||||||||||||||||||||||
Net gain on sale of trading securities | — | — | — | — | — | — | 255 | — | 255 | |||||||||||||||||||||||||||
Net gain (loss) on sale of other real estate owned | (97 | ) | — | (97 | ) | (114 | ) | — | (114 | ) | 6 | — | 6 | |||||||||||||||||||||||
BOLI income | 462 | — | 462 | 266 | — | 266 | — | — | — | |||||||||||||||||||||||||||
Other operating income | 3,481 | 16 | 3,497 | 2,636 | (25 | ) | 2,601 | 2,703 | 55 | 2,758 | ||||||||||||||||||||||||||
|
|
|
|
|
|
|
|
|
|
|
|
|
|
|
|
|
| |||||||||||||||||||
Total other income | 12,465 | 21,685 | 34,150 | 13,901 | 15,474 | 29,375 | 14,237 | 14,233 | 28,470 | |||||||||||||||||||||||||||
Other expenses: | ||||||||||||||||||||||||||||||||||||
Salaries & wages | 20,016 | 8,068 | 28,084 | 17,804 | 7,025 | 24,829 | 15,578 | 6,697 | 22,275 | |||||||||||||||||||||||||||
Employee benefits | 4,837 | 2,052 | 6,889 | 4,424 | 1,560 | 5,984 | 4,124 | 1,454 | 5,578 | |||||||||||||||||||||||||||
Occupancy & equipment | 7,658 | 1,027 | 8,685 | 6,283 | 752 | 7,035 | 5,196 | 848 | 6,044 | |||||||||||||||||||||||||||
Amortization of intangible assets | 324 | 1,166 | 1,490 | 176 | 308 | 484 | — | 308 | 308 | |||||||||||||||||||||||||||
Professional fees | 2,156 | 155 | 2,311 | 1,975 | 165 | 2,140 | 1,791 | 217 | 2,008 | |||||||||||||||||||||||||||
Other operating expenses | 12,064 | 2,003 | 14,067 | 16,286 | 1,227 | 17,513 | 9,307 | 1,022 | 10,329 | |||||||||||||||||||||||||||
|
|
|
|
|
|
|
|
|
|
|
|
|
|
|
|
|
| |||||||||||||||||||
Total other expenses | 47,055 | 14,471 | 61,526 | 46,948 | 11,037 | 57,985 | 35,996 | 10,546 | 46,542 | |||||||||||||||||||||||||||
|
|
|
|
|
|
|
|
|
|
|
|
|
|
|
|
|
| |||||||||||||||||||
Segment profit | 22,093 | 7,221 | 29,314 | 9,241 | 4,445 | 13,686 | 12,138 | 3,699 | 15,837 | |||||||||||||||||||||||||||
Intersegment (revenues) expenses* | (337 | ) | 337 | — | (96 | ) | 96 | — | (187 | ) | 187 | — | ||||||||||||||||||||||||
|
|
|
|
|
|
|
|
|
|
|
|
|
|
|
|
|
| |||||||||||||||||||
Pre-tax segment profit after eliminations | $ | 21,756 | $ | 7,558 | $ | 29,314 | $ | 9,145 | $ | 4,541 | $ | 13,686 | $ | 11,951 | $ | 3,886 | $ | 15,837 | ||||||||||||||||||
|
|
|
|
|
|
|
|
|
|
|
|
|
|
|
|
|
| |||||||||||||||||||
% of segment pre-tax profit after eliminations | 74.2 | % | 25.8 | % | 100 | % | 66.8 | % | 33.2 | % | 100 | % | 75.5 | % | 24.5 | % | 100.0 | % | ||||||||||||||||||
|
|
|
|
|
|
|
|
|
|
|
|
|
|
|
|
|
| |||||||||||||||||||
Segment assets(dollars in millions) | $ | 1,740.4 | $ | 34.5 | $ | 1,774.9 | $ | 1,716.9 | $ | 14.9 | $ | 1,731.8 | $ | 1,225.9 | $ | 12.9 | $ | 1,238.8 | ||||||||||||||||||
|
|
|
|
|
|
|
|
|
|
|
|
|
|
|
|
|
| |||||||||||||||||||
Assets under management, administration, supervision and brokerage(dollars in millions) | $ | 4,831.6 | $ | 3,412.9 | $ | 2,871.2 | ||||||||||||||||||||||||||||||
| * | Intersegment revenues consist of rental payments, insurance commissions and management fees. |
29. SUBSEQUENT EVENTS
On February 3, 2012, the Corporation entered into a definitive stock purchase agreement (the “Agreement”) to acquire Davidson Trust Company (“DTC”) from Boston Private Financial Holdings, Inc. and members of DTC’s management group for a total purchase price of up to $10.5 million, of which $7.35 million is to be paid at closing in cash and up to $3.15 million is to be paid in cash installments on the 6-, 12- and 18-month anniversaries of the date of closing, subject to certain post-closing contingencies relating to DTC’s assets under management.
The acquisition of DTC is expected to close in the second quarter of 2012, subject to certain conditions and regulatory approvals.
For more information related to the Agreement, refer to the Corporation’s filing with the SEC on Form 8-K, dated February 7, 2012. |
68
PRICE RANGE OF SHARES
| 2011 | 2010 | |||||||||||||||||||||||
| High-Low Quotations | High-Low Quotations | |||||||||||||||||||||||
Quarter | High Bid | Low Bid | Dividend Declared | High Bid | Low Bid | Dividend Declared | ||||||||||||||||||
1st | $ | 21.45 | $ | 16.85 | $ | 0.15 | $ | 18.94 | $ | 14.00 | $ | 0.14 | ||||||||||||
2nd | $ | 21.24 | $ | 19.11 | $ | 0.15 | $ | 19.74 | $ | 15.00 | $ | 0.14 | ||||||||||||
3rd | $ | 21.06 | $ | 16.02 | $ | 0.15 | $ | 18.64 | $ | 16.00 | $ | 0.14 | ||||||||||||
4th | $ | 19.76 | $ | 15.19 | $ | 0.15 | $ | 17.80 | $ | 15.13 | $ | 0.14 | ||||||||||||
The approximate number of holders of record of common stock as of December 31, 2011 was 584.
The shares are traded on the NASDAQ Global Market System under the symbol BMTC. The price information was obtained from NASDQ, IDC.
Bryn Mawr Bank Corporation
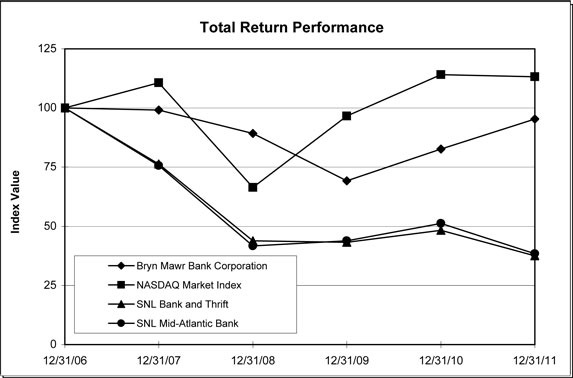
| Period Ending | ||||||||||||||||||||||||
Index | 12/31/06 | 12/31/07 | 12/31/08 | 12/31/09 | 12/31/10 | 12/31/11 | ||||||||||||||||||
Bryn Mawr Bank Corporation | 100.00 | 99.09 | 89.25 | 69.20 | 82.70 | 95.28 | ||||||||||||||||||
NASDAQ Market Index | 100.00 | 110.66 | 66.42 | 96.54 | 114.06 | 113.16 | ||||||||||||||||||
SNL Bank and Thrift | 100.00 | 76.26 | 43.85 | 43.27 | 48.30 | 37.56 | ||||||||||||||||||
SNL Mid-Atlantic Bank | 100.00 | 75.62 | 41.66 | 43.85 | 51.16 | 38.43 | ||||||||||||||||||
Source : SNL Financial LC, Charlottesville, VA
© 2012
www.snl.com